20
Advanced Analytics Report 2015 Sponsored by
| Date post: | 07-Aug-2015 |
| Category: |
Technology |
| Upload: | advanced-business-solutions |
| View: | 56 times |
| Download: | 1 times |

Advanced Analytics Report 2015
Sponsored by
2 © Source Information Services Ltd 2015
Advanced Analytics Report 2015
ContentsMethodology 3
Survey 3Interviewees 3
Introduction 4How people think about analytics 5
The gulf between what we think we know, and what we actually know 5Where do people think analytics has the biggest impact? 6
How is analytics being used in organisations today? 8What capabilities are already in place? 8
What are the benefits of using analytics? 10What can operations, finance and HR functions gain from analytics? 12
Operations 12Inform entire supply chains with enhanced information 12Demystify risk management 12Gather structured and unstructured data 12
Finance 13Reposition the relationship with the rest of the business 13Focus on getting your structured data right 13Look for particular skills 13
HR 14Analyse the employee lifecycle 14Link it to business outcomes 14Gather readily available data 14
Why aren’t organisations doing more? 15Why aren’t organisations doing more with what they’ve already implemented? 15Barriers to the implementation of analytics within organisations 16
What can organisations do to overcome these barriers? 18Get a grip on data management 18Keep data – even if you don’t see the point now 18Establish a proof of concept 18Make it a business-wide investment 19Get access to the right skills 19Focus on timely information, rather than 100% accurate information 19
Conclusion 19

3© Source Information Services Ltd 2015
Advanced Analytics Report 2015
MethodologySurvey of executives in mid- and small-sized organisationsWe ran an online survey in December 2014 and collected 297 responses, capturing the size of respondents’ organisations, their function and their level of responsibility.
Size of respondents’ organisations
Figure 1
Figure 2
Figure 3
Respondent function
Respondent level of responsibility
Top management team or board
HR
Less than £10 million
£10-£20 million
MarketingOperations
General management
Employee
£50-£100 million
Senior manager (but not top team)
Other
Manager
£20-£50 million
IT
Finance
18%
9%
40%
15%
12%
9%
32%
16%
7%6%
18%
20%
22%
32%
13%
£100 million+
31%
IntervieweesWe interviewed four experts about how organisations can get the most from analytics.
Name Job title FirmBen Hubbard Director Hay Group
Emile Naus Partner and Technical Director LCP Consulting
Mark Royal Senior Principal Hay Group
Simon Atherton Director Baker Tilly

4 © Source Information Services Ltd 2015
Advanced Analytics Report 2015
IntroductionA few years ago everyone suddenly started claiming to be digital. “Look at our app!” they’d exclaim, as if that was all the proof that was needed of their conversion to digital. It was all about having something customer facing that was online or on mobile, and for a time the digital thinking didn’t go much further than that. But those who did realise the full potential of digitisation are now reaping the rewards. Today, many forward-thinking companies are using digital to transform their business models, slashing costs and raising productivity along the way. It may seem obvious now, but it did take time before the idea of ‘digital on the inside’ really took hold.
Analytics is on the same journey. Our research shows that people think of analytics primarily as a tool for strategy and marketing departments, when in fact, like digitisation, analytics presents transformative opportunities for nearly every business function.
Accordingly, there’s little point in our preaching to the converted about the benefits of analytics to strategists and marketers, so the focus of this report is on the opportunities that exist in business functions that often get ignored when it comes to analytics: HR, Finance, and Operations. We’ll explore what people understand about analytics, how companies are using it today, what’s stopping them from doing more, and what exactly the opportunities are in the first place.
It’s probably helpful to start by asking the obvious question: what is analytics? Analytics is defined as the scientific process of transforming data into insight for making better decisions. That, however, may still sound opaque, and it’s certainly easy to confuse with business intelligence tools. What’s different about analytics is that, while business intelligence seeks out information through asking questions and reporting back, analytics looks at historical data to spot trends, provide explanation and model what might happen in the future. Analytics can look at structured data (such as financial metrics, customer satisfaction ratings, and response time to issues) and unstructured data (such as mentions on social media, instant messaging, and video data), and the sources can be internal or external.
When companies harness the power of this data to gain insight and drive decisions, analytics can be used in ways that businesses may not have thought possible. To illustrate this, we’ve selected an example for each area that this report focuses on:
HR: Companies like Credit Suisse and Walmart are using readily available data about their employees to spot early signs that they are thinking about leaving. Using data such as tenure, age, communication patterns, performance reviews, and even personality tests, HR teams are able to predict which employees might be thinking of moving on, and take pre-emptive action to dissuade them.1
Operations: Toyota’s operations took six months to recover from the unexpected devastation wrought by the tsunami, earthquake and nuclear disaster that hit in Japan in 2011; they lost the production of 160,000 vehicles during that fiscal year. Since then, Toyota has implemented analytics to reduce its supply chain vulnerability to two weeks or less, by identifying specific areas to improve flexibility and resilience.2 For example, Toyota used analytics and visualization tools to map its supply chain and identify which of its suppliers were in its most “at risk” category because they were either the sole source of materials, or were highly susceptible to earthquakes. Based on this insight, Toyota enhanced the flexibility of its supply chain by asking this group of priority, at-risk suppliers to redistribute their production capacities to multiple locations to hedge against future disruptions.
Finance: Retailers around the globe are battling fraudsters’ increasingly sophisticated attempts to steal from them. It’s estimated that fraud or error caused losses of $119bn for retailers in 2011 alone. One thief managed to defraud retailers for three years before he was caught, by placing counterfeit bar codes on high-end toys. He bought the
1 Wall Street Journal, http://www.wsj.com/articles/the-algorithm-that-tells-the-boss-who-might-quit-1426287935
2 Deloitte University Press, From risk to resilience: using analytics and visualization to reduce supply chain vulnerability, http://d2mtr37y39tpbu.cloudfront.net/wp-content/uploads/2014/01/DR14_From_Risk_to_Resilience.pdf
5© Source Information Services Ltd 2015
Advanced Analytics Report 2015
goods at an artificially low price, only to go on and sell the items again online for nearly full price. That was back in 2006 – these days, retailers can use the data provided by analytics tools to spot and put a stop to enterprises like this much more quickly.3
So if that’s the cutting edge, where are most mid-sized businesses today?
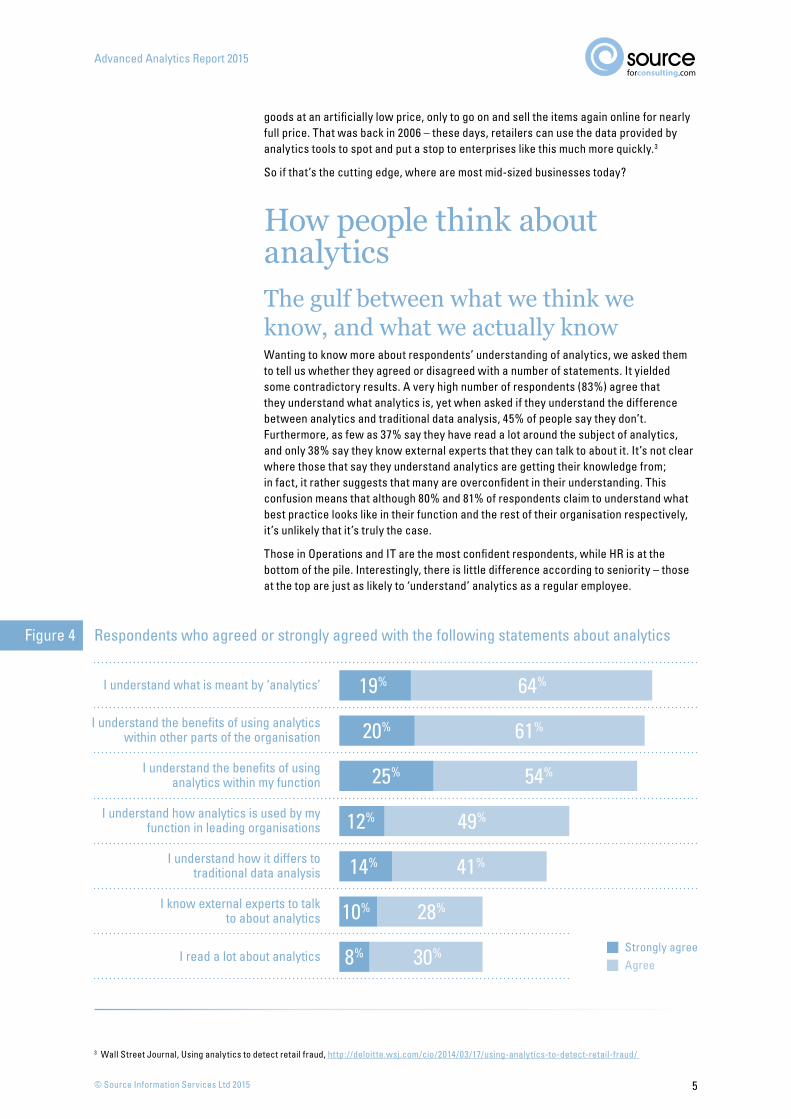
How people think about analyticsThe gulf between what we think we know, and what we actually knowWanting to know more about respondents’ understanding of analytics, we asked them to tell us whether they agreed or disagreed with a number of statements. It yielded some contradictory results. A very high number of respondents (83%) agree that they understand what analytics is, yet when asked if they understand the difference between analytics and traditional data analysis, 45% of people say they don’t. Furthermore, as few as 37% say they have read a lot around the subject of analytics, and only 38% say they know external experts that they can talk to about it. It’s not clear where those that say they understand analytics are getting their knowledge from; in fact, it rather suggests that many are overconfident in their understanding. This confusion means that although 80% and 81% of respondents claim to understand what best practice looks like in their function and the rest of their organisation respectively, it’s unlikely that it’s truly the case.
Those in Operations and IT are the most confident respondents, while HR is at the bottom of the pile. Interestingly, there is little difference according to seniority – those at the top are just as likely to ‘understand’ analytics as a regular employee.
3 Wall Street Journal, Using analytics to detect retail fraud, http://deloitte.wsj.com/cio/2014/03/17/using-analytics-to-detect-retail-fraud/
Respondents who agreed or strongly agreed with the following statements about analytics
I understand what is meant by ‘analytics’
I understand the benefits of using analytics within other parts of the organisation
I understand the benefits of using analytics within my function
I understand how analytics is used by my function in leading organisations
I understand how it differs to traditional data analysis
I know external experts to talk to about analytics
I read a lot about analytics
Figure 4
19% 64%
61%
54%
49%
41%
28%
30%
20%
25%
12%
14%
10%
8% Strongly agreeAgree

6 © Source Information Services Ltd 2015
Advanced Analytics Report 2015
Figure 5
Where do people think analytics has the biggest impact?Strategic decision making emerges as the clear front-runner when respondents are asked where they think analytics has the greatest impact. Behind it are a group of functions including marketing, finance, operations, and customer-facing areas, all of which are similarly rated in terms of the impact of analytics. They’re followed by HR, resoundingly deemed to have the least benefit from analytics.
Of course, opinions vary by function. Perhaps unsurprisingly, respondents in marketing rank the impact on strategic decision making and marketing more highly than other respondents, and gave fairly low scores for all other departments. Every department, though, rated HR as the function likely to feel the least impact of analytics, except respondents in HR and payroll functions themselves. So this lack of consensus about what analytics is useful for could be a barrier to reaping the benefits in some organisations in itself.
There is, however, agreement that analytics is useful to businesses of all sizes. While the larger organisations score most highly, 70% of respondents think that analytics is relevant to mid-sized organisations, and 56% to small organisations.
Respondents who think they understand analytics by function (Operations, Finance and HR highlighted)
Operations General management
IT FinanceMarketing HR/Payroll
91% 79%89% 78%85% 70%

7© Source Information Services Ltd 2015
Advanced Analytics Report 2015
Figure 7
Figure 6 How our respondents ranked the relevance of analytics to each function, 6 = highest impact, 1 = lowest impact
The proportion of respondents who answered “yes, definitely” to the question: to what extent do you think that analytics is relevant to the following types of company?
Average of Strategic decision-making 4.9
Average of Marketing 3.8
Average of Finance 3.5
Average of Operations 3.4
Average of Customer-facing functions 3.3
Average of HR 2.0
Multinational corporations
Large organisations (>£500m revenue)
Mid-sized organisations
Small organisations (<£50m revenue)
87%
86%
70%
55%
8 © Source Information Services Ltd 2015
Advanced Analytics Report 2015
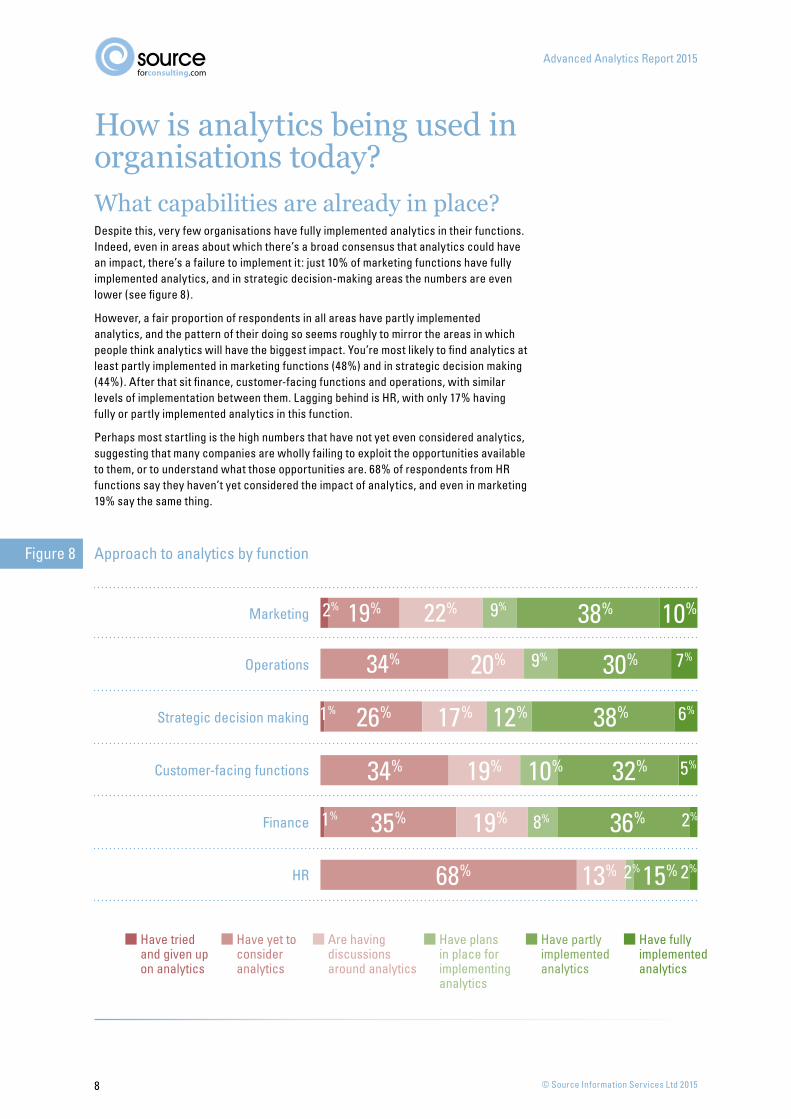
How is analytics being used in organisations today?What capabilities are already in place?Despite this, very few organisations have fully implemented analytics in their functions. Indeed, even in areas about which there’s a broad consensus that analytics could have an impact, there’s a failure to implement it: just 10% of marketing functions have fully implemented analytics, and in strategic decision-making areas the numbers are even lower (see figure 8).
However, a fair proportion of respondents in all areas have partly implemented analytics, and the pattern of their doing so seems roughly to mirror the areas in which people think analytics will have the biggest impact. You’re most likely to find analytics at least partly implemented in marketing functions (48%) and in strategic decision making (44%). After that sit finance, customer-facing functions and operations, with similar levels of implementation between them. Lagging behind is HR, with only 17% having fully or partly implemented analytics in this function.
Perhaps most startling is the high numbers that have not yet even considered analytics, suggesting that many companies are wholly failing to exploit the opportunities available to them, or to understand what those opportunities are. 68% of respondents from HR functions say they haven’t yet considered the impact of analytics, and even in marketing 19% say the same thing.
Figure 8 Approach to analytics by function
26%
19%
2% 9%
34%
22%19%
15%13%68%
1%
1%
10%
9% 7%
2%
6%12%17%
36%8%
30%
38%
20%
2%2%
35%
34% 32%19% 10%
38%
Have tried and given up on analytics
Have yet to consider analytics
Are having discussions around analytics
Have plans in place for implementing analytics
Have partly implemented analytics
Have fully implemented analytics
Finance
Operations
Marketing
HR
Strategic decision making
Customer-facing functions 5%

9© Source Information Services Ltd 2015
Advanced Analytics Report 2015
It’s also telling that when you ask people about the extent to which they’ve implemented analytics, most admit to using quite rudimentary software: 41% said they “mainly use spreadsheets” across their organisation, compared with just 8% who said they use predictive forecasting and/or optimisation methods. And in case there was any doubt, as Figure 10 shows, most people appear to think that they should be doing more.
Figure 9
Figure 10
The extent to which respondents’ organisations have implemented analytics
Respondents views about whether they should be doing more or less with analytics in each function
We use predictive forecasting and/or optimisation methods
Strategic decision-making
Marketing
We use spreadsheet models, statistical modelling and/or simulation software
Operations
HR
We mainly use spreadsheets
Customer-facing functions
Finance
8%
83%
80%
41%
15%
18%
49%
16%
26%
51%
13%
21%
51%
2%
1%
36%
3%
1%
8%
2%
15%
80%
73%
41%
87%
78%
Across the organisation
Should be doing more
In some parts of the organisation
Doing the right amount
Hardly or not at all
Should be doing less

10 © Source Information Services Ltd 2015
Advanced Analytics Report 2015
What are the benefits of using analytics?Ask people why they think organisations should invest in analytics and many things emerge as significant reasons. Top of the tree, as Figure 11 shows, is the ability to enhance decision-making (chosen by 86% of respondents as a significant reason) which holds with it an implicit assertion that decisions based on data are better than decisions based on instinct. That’s backed up by the ability to predict future trends, which was chosen by 64% as a significant reason.
But analytics isn’t only seen as being helpful when it comes to working out what’s going to happen in the future or make decisions in the present. Respondents also saw it as helping when it comes to explain why something happened in the past. 69% chose this as a significant reason for investing in analytics.
Figure 11 Respondents’ views on why organisations should invest in analytics
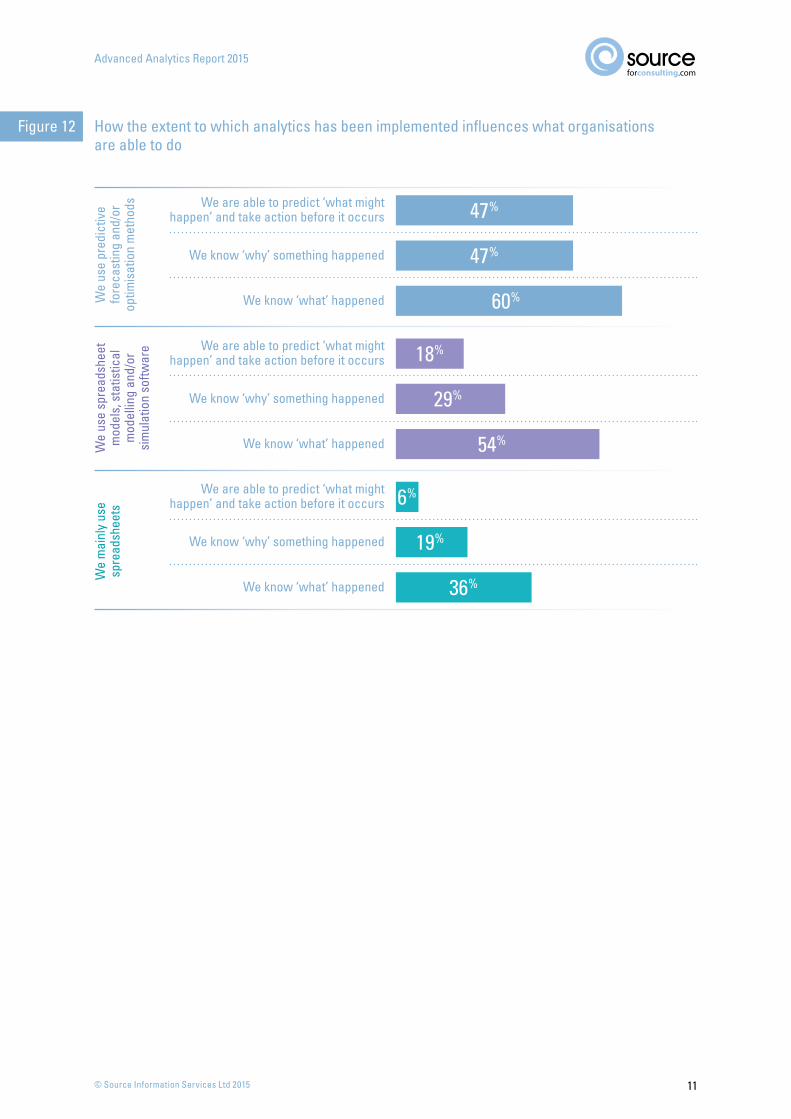
Indeed, there appears to be a clear correlation between some of these capabilities and the extent to which an organisation has implemented an analytics solution, as Figure 12 shows: the more sophisticated the implementation, the greater the number of people who talk affirmatively about their capabilities as an organisation.
To enhance decision-making ability
To improve understanding of why things have happened
To improve operational efficiency
To be able to predict future trends
To realise financial benefits
To have access to information more quickly
To reduce time spent on producing reports
Because other organisations are investing
86% 13%
29%
30%
35%
34%
38%
45%
33%
69%
69%
64%
62%
58%
45%
8%
Significant reason Somewhat of a reason
11© Source Information Services Ltd 2015
Advanced Analytics Report 2015
Figure 12 How the extent to which analytics has been implemented influences what organisations are able to do
We are able to predict ‘what might happen’ and take action before it occurs
We are able to predict ‘what might happen’ and take action before it occurs
We are able to predict ‘what might happen’ and take action before it occurs
We know ‘why’ something happened
We know ‘why’ something happened
We know ‘why’ something happened
We know ‘what’ happened
We know ‘what’ happened
We know ‘what’ happened
We
use
pred
ictiv
e fo
reca
stin
g an
d/or
op
timis
atio
n m
etho
ds
We
use
spre
adsh
eet
mod
els,
sta
tistic
al
mod
ellin
g an
d/or
si
mul
atio
n so
ftwar
e
We
mai
nly
use
spre
adsh
eets
47%
18%
6%
47%
29%
19%
60%
54%
36%
12 © Source Information Services Ltd 2015
Advanced Analytics Report 2015
If that’s the overall picture, then what does good look like when using analytics in HR, finance and operations departments? We spoke to four experts to gain an understanding of the possibilities and the potential benefits, and distilled the conversations into key areas of focus.
OperationsInform entire supply chains with enhanced informationThere are huge benefits to be had in using analytics to improve supply chains, particularly around logistics and inventory management. “It helps companies manage investment in their inventories, and to balance the need to minimise inventory and maximise customer service,” says Emile Naus from LCP Consulting. There are conflicting ideas about inventory management, but analytics finds a middle way. There’s one school of thought that it’s better to have a small, but centralised inventory to minimise costs to the business; great for the business’s costs, but not so great for the customer ordering from several hundred miles away who wants that product now. The other argument is to keep stock in lots of places to meet the customer need, but thus hold a large inventory. Analytics sweeps away the need to pick between the two; by understanding trends and predicting demand, businesses can manage their inventories intelligently and lower the risk of holding unwanted stock.
Demystify risk managementAs human beings we tend to be bad at estimating risk, particularly around areas of high impact and high visibility. “Most people will tend to put a huge emphasis on those things, but those risks very rarely actually occur – people don’t focus on the right things,” says Naus.
Do you really understand what could go wrong? To do so, businesses need to look back at their suppliers, and the suppliers to those suppliers, to understand where a product comes from. “If a component of a product comes from a part of the world where there is disruption, then you need to hold more inventory,” says Naus. “You need to understand your supply chain three or four steps back to understand how much stock you really need to hold.” A memorable example of the consequences of getting this wrong is the tragic collapse of the Rana Plaza factory in Bangladesh, killing over 1,000 people. Retailers suddenly found themselves in the spotlight; their supply chains and the safety of their sub-contractors subject to the scrutiny of the world’s media. “Using proper data and analytics helps to create focus on the right things,” says Naus. By understanding trends and modelling the potential impact of events on future requirements, businesses can run a much tighter – and safer – ship.
Gather structured and unstructured dataBoth structured and unstructured data are valuable when using analytics for operational purposes, but the reality is that most organisations need to get a grip on their internal, quantitative data more urgently than monitoring mentions on Twitter. “Many organisations need to get the basics right first, before investing huge sums in new techniques and technology,” says Naus.
That’s not to write off unstructured data. Inputs from social media can help to predict demand, and therefore manage inventory requirements. For example, if you know there is an event on somewhere, you can make sure stores have the stock they need or extra staff to cope with demand.
What can operations, finance and HR functions gain from analytics?

13© Source Information Services Ltd 2015
Advanced Analytics Report 2015
FinanceReposition the relationship with the rest of the business“A lot of organisations that we speak to rely heavily on spreadsheets and ad hoc reporting,” explains Simon Atherton from Baker Tilly. “People think, ‘I can extract what I need into Excel, use some lookups and pull together what that person needs.’” That may be true, but it’s likely to be a time-consuming process producing analysis that is restricted by the limitations of the tools used. Imagine how much time would be saved if the right analytics tools were deployed to not only pull together the information, but also provide a level of insight that isn’t possible with traditional tools.
The painful reality is that many finance departments are seen as a hindrance rather than a help. “I worked on an organisational alignment project, and we asked the users of the finance department if they felt finance was a catalyst, a department that drives things forwards and provides the analysis needed by the rest of the business,” says Atherton. “Most of the responses were between ‘strongly disagree’ and neutral, which is not where you want your finance function to be.”
Analytics enables finance departments to work more closely with the rest of the business, by giving them the tools to deliver insight to the rest of the organisation. The key is to work with the rest of the business to understand the information requirements, and to deploy analytics solutions that can deliver reports when the business needs them. “You need to understand what the business wants – and to do that you need to ask them, not just deliver what you think they want,” says Atherton. “Otherwise it’s another set of data which gets put in the bin or never opened.”
Focus on getting your structured data rightFinance data is largely structured, so it’s important to have any analytics solution integrated with existing ERP systems. Of course, there needs to be confidence in the underlying data, so ensuring a tight data management regime and reconciliation between different systems is in place is vital to leveraging the benefits of analytics.
Look for particular skillsFinding the right talent to make financial analytics work can be challenging, but it’s vital to ensure that analytics isn’t used as just another reporting tool. Gaining the true value, the actionable insights, for finance departments requires two skill sets: the accountants who understand the detail of the financial information, and the ability to see the implications in a wider business context. “You’ve got to find those accountants who have that commercial nous and are comfortable outside of the numbers,” says Atherton. “They need to be able to act as a bridge between finance and operations; they will be the ones who use analytics to the best advantage.”

14 © Source Information Services Ltd 2015
Advanced Analytics Report 2015
HR Analyse the employee lifecycleFor many businesses, human capital is the greatest investment they make. Analytics can help to maximise that investment throughout the employee lifecycle, as Ben Hubbard from Hay Group explains: “It starts with how your business is perceived by prospective employees. It means aligning your employer brand with the talent you want to attract and retain. With competition for talent as fierce as ever, analytics can help human resources build an evidence based system for securing, motivating and developing the best people.” Data collected right from on boarding, through to pulse checks and employee engagement surveys can be used to help understand the employee journey. “Many organisations are reactive in the way they deal with talent management. Using people analytics to develop a more predictive approach to attraction, selection and retention can create real competitive advantage. It can provide management with an early warning system for risk around top talent or people in pivotal roles.” Analytics can also be used to understand the impact of change, or if an investment in training is having any effect. “Using employee surveys more strategically and creatively is a simple way to start exploring these kinds of analytics. Many companies are now slicing and dicing results in different ways to get to the hidden truths that are not obvious at first glance. This might include looking back at the results for voluntary leavers to pin-point reasons for departure or zooming into the engagement of groups of people that have received development investments” says Hubbard. Statistical analysis can help to understand how change will affect different groups at an organisational, team, and even individual level. “By linking data sets, companies can better understand the relationships, and even cause and effect between management practices and employee behaviour. For example, companies can identify which types of work environments most predict absenteeism or safety issues.”
Link it to business outcomes“HR departments can sometimes struggle to articulate the links between HR and broader business outcomes. Analytics can build bridges by connecting HR priorities with business performance information,” says Mark Royal from Hay Group. By finding relationships and presenting links in information in accessible ways, analytics creates tools that sharpen the focus on what really matters. “Smart companies know their employees and they know their customers – if you can go one step further and understand the empirical links between quality of management, employee engagement and customer experiences you start to build a real competitive edge,” says Ben Hubbard.
Gather readily available dataBusinesses needn’t become big brother to monitor their employees’ morale and engagement; valuable insight can be gained from combining readily available, unobtrusive data about their employees to gain insight into what’s going on. Everything from demographic information, to where they live, seniority, and how the last pay review went, when combined can predict behaviours with a high level of accuracy. Armed with that knowledge, managers can tailor their engagement with employees that are at risk of leaving, boosting not only the morale of individuals, but productivity more generally.

15© Source Information Services Ltd 2015
Advanced Analytics Report 2015
Why aren’t organisations doing more?There are two sides to this question: why aren’t organisations doing more with the analytics solutions they’ve already put in place, and what’s stopping organisations implementing analytics more generally in their organisations?
Why aren’t organisations doing more with what they’ve already implemented? Our survey shows that many organisations have some elements of analytics implemented, but there is still a near unanimous belief among those that have some form of analytics that they can do more with what they’ve got (see figure 13). What’s stopping them? It seems a significant amount: every issue we asked about recorded scores of over 60% of people saying it ‘happens a lot’ or ‘happens sometimes’ (see figure 14).
The most common reason which occurs frequently, according to respondents, is that the benefits aren’t visible enough. It may be linked to the fragmented nature of what we’ve seen in our survey results – of those departments that have implemented analytics, most say it’s a partial implementation, and results suggest that it’s rarely implemented across entire organisations. With analytics isolated in particular functions, it’s unlikely to have a highly visible and meaningful impact for others in the organisation.
Senior buy in is an issue, too, though it’s notable that it’s the buy-in itself, rather than a willingness to commit time to developing analytics, which causes most concern. There also appears to be an issue with educating people about analytics, which may explain why some people think there are unrealistic expectations about what analytics can deliver.
Figure 13 Do you think you could get more value out of the analytics technology, processes and people already in place? (Respondents in organisations that have implemented analytics)
5%
95%
Yes
No

16 © Source Information Services Ltd 2015
Advanced Analytics Report 2015
Barriers to the implementation of analytics within organisationsOf course for some organisations it’s not simply a question of how to make more of what they’ve already got where analytics is concerned, it’s about the adoption of analytics in the first place. And what seems to get in the way more than anything else, in this respect, is there being no clear owner or champion for analytics within an organisation. 35% said this creates a barrier to a large extent, and a further 47% said it does so to some extent. It’s something which is backed up by the data in Figure 16, which shows that in two-thirds of organisations there are no analytics experts. But time (or perhaps priorities) and knowledge (about what’s possible) play a big part here, too.
What isn’t so much of a concern, relatively speaking, is the absence of the lifeblood of analytics: data. Just 10% said they thought a lack of data is responsible to a large extent for creating a barrier to the uptake of analytics. Indeed, people were more likely to be concerned about a lack of confidence in, or understanding of, their data, than they were to say that there wasn’t enough data in the first place.
Figure 14 Which of the following factors are preventing your organisation from getting more value out of the analytics technology, processes and people already in place?
Benefits not visible enough
Key executives not bought into analytics
Outputs analytics not meaningful enough
Unrealistic expectations about what analytics can do
Analytics not adequately explained to the rest of the organisation
Senior team not willing to spend enough time to develop analytics
29% 36%
54%
42%
40%
59%
60%
24%
24%
23%
19%
9%
Happens a lot Happens sometimes

17© Source Information Services Ltd 2015
Advanced Analytics Report 2015
Figure 15
Figure 16Experts are embedded in a number of areas
On a contract / consultancy basis only
Experts used in a small number of areas
No analytics experts
To what extent do the following factors create barriers to implementing an analytics solution in your organisation?
Employment of analytics experts in respondents’ organisations
No clear owner or champion for analytics
Don’t know enough about the data we have already
Inability to step back from day-to-day operations
Lack of confidence in current data
Lack of awareness about what is possible
Perceived benefits aren’t significant enough
Insufficient in house skills to implement and manage analytics
Culture does not support analytics and objective decision making
Concerns about IT spend required to support approach
Fears over privacy
Senior decisions makers do not fully understand or appreciate the
benefits of analytics
Don’t have enough data to warrant an analytics solutions
35%
20%
47%
45%
52%
45%
56%
50%
55%
37%
56%
20%
37%
30%
29%
18%
28%
17%
26%
15%
26%
10%
24%
10%
A large extent To some extent
66%
11%
20%4%

18 © Source Information Services Ltd 2015
Advanced Analytics Report 2015
What can organisations do to overcome these barriers?Get a grip on data managementBefore investing in analytics, it’s vital to get a firm grip on what data is there, what format it’s in, and who owns it. Organisations need to have solid data management foundations to build upon if they are to capture the value from analytics. “The whole big data thing is really highlighting the importance of data management,” says Emile Naus from LCP Consulting. “Companies want to implement analytics, but find that the basic data isn’t there, or, if it is there, it’s not in the right format and can’t be used.” Before making a huge investment in new techniques and technology, the basics need to be right first.
Keep data – even if you don’t see the point now“Holding data is relatively cheap, so even if you don’t have a business case for it, hold the data,” says Emile Naus. “People throw away data because they don’t understand the value of it – it’s a shocking thing in 2015.” Even if it’s unclear what your organisation will do with it, it’s likely the data will become a part of a bigger solution at some point in the future. “I’m working with a retailer at the moment that is unable to give us product level historical data going through their tills. They’re just not capturing it,” says Emile. They’re probably kicking themselves now.
Understand the return on investment upfront and articulate the benefits“Most organisations feel it’s a large investment for not very much return,” says Simon Atherton from Baker Tilly, “So it’s vital that companies don’t jump into a big investment without understanding exactly how it will realise the return.” It sounds simple, but many companies rush into analytics, buying a flashy system without fully understanding what it is they’re going to do with it. Or, the benefits are never fully thrashed out in the first place, so nothing gets bought. “Articulating and quantifying the benefits is key. If executives don’t understand the value, they won’t make the decision to invest,” says Emile Naus. Any investment in analytics needs a clear strategy, as Ben Hubbard from Hay Group explains: “You’re not going to be Google overnight, so keep it simple, relevant, and action orientated. And, most importantly, make sure you’re engaging leaders with the results.”
Establish a proof of conceptWhat better way to convince management of the power of analytics than by demonstrating it? “Talk to your leaders about the current business KPIs in focus. Which data sets are readily available and reliable? Are there some basic linkages with existing data you can use to develop and test hypotheses of interest?”says Ben Hubbard. He stresses the importance of deriving actions from the insight gained: “Think about how you will apply your findings. What will you do if you find a compelling link between management quality and sales? It’s important to start with the end in mind, thinking about how the information will be used.” Examples such as these can be socialised to convince others that analytics isn’t just an academic exercise, it drives actions.

19© Source Information Services Ltd 2015
Advanced Analytics Report 2015
Make it a business-wide investmentWhen talking about the use of analytics in, say, operations departments, the conversation very quickly strays into finance, marketing and other parts of the business. It’s the same for any area, and underlines that no function operates in isolation. “The monetary investment in analytics is likely to be similar whether you are investing in one area of the business or many,” says Emile Naus. “If it’s going to be roughly the same investment either way, businesses will gain huge benefits from expanding the scope of analytics.” His advice is the same regardless of company size: “It’s a question of understanding the benefits of having that data, rather than of company size,” he says.
Get access to the right skills66% of respondents say that their organisation doesn’t employ any analytics experts, and 53% say there isn’t really anyone driving it forward either (figures 17 and 18); access to the right skills is clearly an issue.
The skills required are highly sought after and hard to come by. Businesses everywhere are vying for those who are really numerate and are comfortable with the detail, but can also understand the relevance to wider business issues – essentially, those who can answer the ‘so what?’ question when analysing vast data sets. “People with those skills do exist, but they’re hard to come by,” says Emile Naus. “It’s easier for big business to attract and employ these people, but it’s harder for mid-sized and smaller organisations.” Organisations should look at their existing capabilities and decide whether they can gain the skills needed, or if they need to look externally to fill the skills gap.
Focus on timely information, rather than 100% accurate informationA key thing to remember is that in many instances, the timeliness of insight is crucial to realising the benefits of analytics. “Just look at the algorithms Amazon uses to target products at customers. They’re not perfect, but they’re very good, and the key thing is: it’s instant,” says Emile Naus. “They’ve struck a balance where they will get it right more often than not.” It’s the same for any function in a business – perfect information six months late will lose much of the intended impact. “A number of techniques will tell you too late what the right answer is,” says Emile. “The thing to do is get an answer that may not be perfect, but you get it now. You need to be able to form the analytics quick enough to do something with it.”
ConclusionAs we move to an increasingly digital world, mid-sized businesses need to think seriously about their long term investment in analytics. Our research shows that many organisations don’t feel they have the time or resources for analytics today, but it will soon become a burning platform. While it may feel that there are numerous, substantial barriers to gaining the value from analytics, there are simple steps companies can take to overcoming them. Emile Naus concludes: “Organisations will end up losing out badly if they don’t invest in analytics. There’ll be a group of companies that are winners, and then a group that are losers, and losing won’t mean lower profits -- it’ll mean going out of business.”
18 King William Street • London • EC4N 7BPTel: +44 (0)20 3700 5461
PO Box 340505 • Dubai • United Arab Emirates
Tel: +971 (0)52 989 5224
Email: [email protected]
www.sourceforconsulting.com
© Source Information Services Ltd 2015
Source Information Services Ltd and its agents have used their best efforts in collecting the information published in this report. Source Information Services Ltd does not assume, and hereby disclaims any liability for any loss or damage caused by errors or omissions in this report, whether such errors or omissions result from negligence, accident or other causes.
Notice: This document is protected by copyright law. It is illegal to copy any of the contents of this document without permission.
About SourceSource Information Services Limited (Source) is a leading provider of information about the market for management consulting. Set up in 2007 with offices in London and Dubai, Source serves both consulting firms and their clients with expert analysis, research and reporting. We draw not only on our extensive in-house experience, but also on the breadth of our relationships with both suppliers and buyers. All of our work is underpinned by our core values of intelligence, integrity, efficiency and transparency.
Source was founded by Fiona Czerniawska and Joy Burnford. Fiona is one of the world's leading experts on the consulting industry. She has written numerous books on the industry including: The Intelligent Client and The Economist books, Business Consulting: A Guide to How it Works and How to Make it Work and Buying Professional Services.
For further information please visit www.sourceforconsulting.com
About Advanced Business SolutionsAdvanced Business Solutions (Advanced) provides leading integrated business applications and services that enable public, private and third sector organisations to retain control, improve visibility and gain efficiencies whilst continually improving corporate performance. Advanced prides itself on getting close to its customers by understanding their businesses and responding to their evolving needs. Advanced’s software systems comprise core accounting/financial management, procurement, human resource and payroll systems, supply chain management and specialist vertical and generic CRM integrated with a range of collaborative, document management and business intelligence solutions to extend the value and effectiveness of the finance, human resource and payroll departments. These can be delivered as a managed or bureau service. Customers are from both the public and private sectors and include Companies House, Newcastle City Council, WH Smith, Royal Bank of Scotland, Aer Lingus, National Express Group, DFS, RSPB and Great Ormond Street Hospital for Children NHS Trust. Advanced Business Solutions is a division of Advanced Computer Software Group plc, a leading supplier of software and IT services to the health, care and business services sectors.
For further information, please visit www.advancedcomputersoftware.com


