Australia’s Equity Home Bias and Real Exchange Rate Volatility Anil V Mishra 1 School of Accounting, Economics and Finance University of Southern Queensland Australia Abstract This paper examines the impact of real exchange rate volatility on Australia’s equity home bias by employing, International Monetary Fund’s high quality dataset (2001 to 2006) on cross border equity investment. The paper finds some interesting trends in Australia’s equity home bias. The paper uses different control measures and also conducts generalised method of moments robustness tests, to examine the role of real exchange rate volatility in Australia’s equity home bias. The paper finds that real exchange rate volatility is a potential driver of Australia’s equity home bias. JEL Classifications: G11, G15, G18 Keywords: coordinated portfolio investment survey; float home bias; real exchange rate volatility; generalised method of moments. 1 Corresponding author: Anil Mishra; School of Accounting, Economics and Finance, University of Southern Queensland, Australia; Tel. No: +61-04037 64431; E-mail address: [email protected]1
Transcript
Australia’s Equity Home Bias and Real Exchange Rate Volatility
Anil V Mishra1
School of Accounting, Economics and Finance University of Southern Queensland
Australia
Abstract
This paper examines the impact of real exchange rate volatility on Australia’s equity home bias by employing, International Monetary Fund’s high quality dataset (2001 to 2006) on cross border equity investment. The paper finds some interesting trends in Australia’s equity home bias. The paper uses different control measures and also conducts generalised method of moments robustness tests, to examine the role of real exchange rate volatility in Australia’s equity home bias. The paper finds that real exchange rate volatility is a potential driver of Australia’s equity home bias. JEL Classifications: G11, G15, G18 Keywords: coordinated portfolio investment survey; float home bias; real exchange rate volatility; generalised method of moments.
1 Corresponding author: Anil Mishra; School of Accounting, Economics and Finance, University of Southern Queensland, Australia; Tel. No: +61-04037 64431; E-mail address: [email protected]
1
Australia’s Equity Home Bias and Real Exchange Rate Volatility 1 Introduction Cooper and Kaplanis (1994) state that the domestic ownership share of the world’s eight major stock markets: US (98 %), Japan (86.7 %), UK (78.5 %), Germany (75.4 %), France (64.4 %), Italy (91.0%), Spain (94.2%) and Sweden (100.0%). The share of domestic equities in the world market portfolio for these eight stock markets is: US (36.4 %), Japan (43.7 %), UK (10.3 %), Germany (3.2 %), France (2.6 %), Italy (1.9 %), Spain (1.1 %) and Sweden (0.8 %). This is contrary to the traditional international capital asset pricing model (ICAPM) which predicts that an investor should hold equities from a country as per that country’s share of world market capitalisation (Sharpe (1964) and Lintner (1965)). This phenomenon is termed as “home bias”. Mishra (2008) state that in the year 2005, United States actual share in Australia’s equity portfolio is 11.076 %, whereas the ICAPM benchmark percentage is 32.836 %. The empirical investigation into the home bias puzzle is important for several reasons. First, one of the major problems in the research on home bias has been the relatively poor quality of data on cross-border holdings. In previous studies (Cooper & Kaplanis 1994; Tesar & Werner 1995; Bekaert & Harvey 2000), the cross-border holdings were estimated using accumulated capital flows and valuation adjustments. Warnock and Cleaver (2003) show that capital flows data are ill suited to estimate bilateral holdings because capital flows data track the flow of money between countries and the foreign country identified in flows data is that of transactor or intermediary, not the issuer of security. Capital flows data will produce incorrect estimate when intermediary and issuer countries differ. In 1993, the IMF Committee on Balance of Payments decided to promote an idea for an internationally coordinated benchmark survey of long term portfolio investment holdings so that the countries undertaking the benchmark survey of holdings would be in a position to obtain a reasonable estimate of the outstanding balances, at market price, of the level of portfolio investment held by their residents, rather than merely summing the balance of payments flows. The reasonable estimate thus obtained, would reduce, to some extent, the imbalance at the global level. In 1997, the IMF conducted the first coordinated portfolio investment survey (CPIS) in which 29 countries participated; the next survey was conducted in 2001 in which 68 countries participated; and at the end of 2002 (68), 2003 (70), 2004 (74) and 2005 (74) countries participated. CPIS reports (in US currency) data on foreign portfolio asset holdings (divided into equity, long term debt, and short term debt) by the residence of the issuer. This paper contributes to the existing literature by employing the International Monetary Fund’s (IMF’s) Coordinated Portfolio Investment Survey (CPIS) dataset on bilateral equity holdings for the years 2001 to 2006. Second, the existing literature on home bias focuses on the role of information asymmetries, transaction costs, the role of institutions, the role of non-tradable to hedge idiosyncratic risk, and behavioural finance. The literature on the role of exchange rate volatility as a potential source of home bias is sparse. There is only one systematic study by Fidora et al. (2007) which focuses on the role of exchange rate volatility as a driver of portfolio home bias and also explains differences in home bias across financial assets (i.e. equity and bond). They employ CPIS data as annual averages over the period 1997, 2001 to 2003 for 40 investor countries including all major industrialized and emerging economies and up to 120 host countries. There is no study which focuses on the role of exchange rate volatility for single source country.
2
The current paper contributes to the literature on exchange rate volatility and home bias by employing a Markowitz type international capital asset pricing model which incorporates real exchange rate volatility as stochastic deviations from purchasing power parity (PPP) to investigate the role of exchange rate volatility on Australia’s equity home bias over the years 2001 to 2006. Real exchange rate volatility induces a bias towards domestic financial assets because it puts additional risk on holding foreign securities from a domestic currency investors’ perspective, unless foreign local currency real returns and the real exchange rate are sufficiently negatively correlated. The empirical estimator includes source and host country-fixed effects, as these are able to control for nearly all country - specific determinants of home bias. The paper also conducts robustness tests: generalised method of moments by employing instrumental variables that are standard in the financial economics literature. Third, global financial integration is increasing. The uncertainty and risk that may arise due to exchange rate volatility may explain an important part of the pattern of global financial integration, which may also have an economic policy implication. This paper provides answers to the following: What is the effect of real exchange rate volatility on Australia’s equity home bias, in the presence of various control measures and robustness tests? Results indicate that real exchange rate volatility is a key determinant of float equity home bias, in the presence of various gravity type control measures and generalised method of moments, robustness tests. The results have some implications for economic policy. Real exchange rate volatility is an important factor that should be included in home bias and international financial integration models. Exchange rate volatility introduces a macroeconomic policy dimension into international financial integration and plays an important role along with information costs, transaction costs and governance. Real exchange rate volatility should be taken into account in the formulation of financial integration, home bias, macroeconomic and monetary stability policy models. This paper is structured as follows: Section 2 provides a literature review of the home bias puzzle. Section 3 illustrates stylised facts of Australia’s equity home bias. Section 4 discusses the theoretical framework, empirical specification and instrumental variables. Section 5 describes the sources of global equity home bias, including real exchange rate volatility, familiarity and diversification. Section 6 describes the empirical results and, finally, section 7 provides a conclusion. 2 Literature Review The literature on home bias revolves around different motives of investors, including explicit barriers to international investment, hedging motives, information asymmetries and behavioural biases. Uppal (1992), Lewis (1999) and Karoyli and Stulz (2003) provide excellent reviews of the home bias literature. Black (1974) outlines models of capital market equilibrium when there are explicit barriers to international investment in the form of a tax on net value of holdings of assets in one country by residents of another country. Stulz (1981a) develops a simple model in which it is costly for domestic investors to hold foreign assets. Cooper and Kaplanis (1986) derive efficient portfolios in a world where there are barriers to cross border investment, which depend both on the domicile of the investor and his country of investment.
3
Solnik (1974) presents an equilibrium model of the international capital market with the hypothesis that security price behaviour is consistent with a single world market concept. Adler and Dumas (1983) state that should there be zero inflation, investors can hedge foreign exchange risks through money market positions, therefore, in principle, foreign exchange risks do not affect equity portfolios. Stulz (1981b) constructs an intertemporal model of international asset pricing which incorporates differences in consumption opportunity sets across countries. He states that the real expected excess return on a risky asset is proportional to the covariance of the return of that asset with changes in the world real consumption rate. Pesenti and Wincoop (2002) investigate the extent to which nontradables (consumption and leisure) can affect the portfolio allocation decision in integrated capital markets. They find that hedging against nontradables shocks can account for only a small portfolio bias towards domestic assets. Their results suggest that in the near future they can expect to observe sizable additional international diversification. Baxter and Jermann (1997) state that despite the growing integration of international financial markets, investors do not diversify internationally to any significant extent. They find that the growth rates of labour and capital income are not highly correlated within four OECD countries (Japan, Germany, UK and US); however the returns to human capital and physical capital are very highly correlated within these countries. Hedging human capital risk involves a substantial short position in domestic marketable assets. A diversified world portfolio will involve a negative position in domestic marketable assets. Investors have different expectations about stock returns, volatilities and covariance. Gehrig (1993) develops a noisy rational expectations model where, even in equilibrium, investors remain incompletely informed. He shows that the domestic bias arises when investors are on average better informed about domestic stocks. Hasan and Simaan (2000) develop a model that incorporates both the foregone gains from diversification and the informational constraints of international investing. They examine 11 international markets’ returns over the last 25 years, from the perspective of German, Japanese and US investors. They show that home bias is consistent with rational mean variance portfolio choice. They prove that the nature of estimation risk in international markets can be responsible for this phenomenon. They show that when the cross market variability in the estimation errors of international markets’ means far exceeds the cross market variability in the means themselves, domestic dedication dominates international diversification. Jeske (2001) raises the awareness of a number of empirical and theoretical issues concerning home bias in equity holdings. He states that US has the lowest home bias among all industrialized nations, contrary to people’s belief that home bias in US is more severe than in other countries. Campbell and Kraussl (2007) empirically investigate the international equity allocation for the downside risk investor using nine international markets’ returns over the last 34 years and their results hold for both daily and monthly data and also from an international perspective. They state that due to greater downside risk, investors may think globally, but instead act locally. Their model’s results provide an alternative view of the home bias puzzle. Baele et al. (2007) investigates to what extent ongoing integration has eroded the equity home bias. To measure home bias, they compare observed foreign asset holdings of 25 markets with optimal weights obtained from five benchmark models. They find that for many countries, home bias decreases sharply at the end of the 1990s, a development they link to time varying globalization and regional integration.
4
Several research papers use survey data for behavioural explanation of the home bias. Suh (2005) studies the home bias pattern in international portfolio recommended by global financial institutions. He finds that the institutions tilt recommendations towards their home markets; they change home market weights more frequently relative to other market weights or relative to institutions from other countries; and they change weights of geographically distant markets less often than other weights. He states that home bias can arise from unobservable factors such as information asymmetry and investor optimism. Strong and Xu (2003) use survey data of fund managers’ views on prospects for international equity markets to shed light on why investment portfolios are significantly biased towards domestic equities. They find that fund managers from the US, the UK, continental Europe and Japan show a significant relative optimism towards their home equity market. Their evidence lends support to behavioural explanations of the bias. Several research papers have considered the effect of indirect barriers, such as information asymmetries, on equity investment and home bias. Merton (1987) develops a model where investors hold stocks that they know. In this model, investors believe that the risk of stocks they do not know is extremely high. Accordingly, the investors may overweight domestic stocks. French and Poterba (1991) use a simple model of investor preferences and behaviour to show that investors in each nation expect returns in their domestic equity market to be several hundred basis points higher than returns in other markets. The lack of diversification appears to be the result of investor choices, rather than institutional constraints. Tesar and Werner (1995) states that first, there is a strong evidence of a home bias in national investment portfolios despite the potential gains from international diversification. Second, the composition of the portfolio of foreign securities seems to reflect factors other than diversification of risk. Third, the high volume of cross border capital flows and the high turnover rate on foreign equity investments relative to turnover on domestic equity markets suggests that variable transactions costs are an unlikely explanation for home bias. Coval and Moskowitz (1999) state that portfolios of domestic stocks exhibit a preference of investing close to home. U.S. investment managers exhibit a strong preference for locally headquartered firms, particularly small, highly levered firms that produce nontraded goods. These results suggest that asymmetric information between local and nonlocal investors may drive preference for geographically close investments. Coval and Moskowitz (2001) state that fund managers earn substantial abnormal returns in nearby investments. Their results suggest that investors trade local securities at an informational advantage. Huberman (2001) states that shareholders of a Regional Bell Operating Company (RBOC) tend to live in the area which it serves, and an RBOC’s customers tend to hold its shares rather than other RBOCs’ equity. The geographical bias of the RBOC investors is closely related to the general tendency of households’ portfolios to be concentrated, of employees’ tendency to own their employers’ stocks in their retirement accounts, and to the home country bias in the international arena. People invest in the familiar while often ignoring the principles of portfolio theory. Using data on the investments a large number of individual investors made through a discount broker from 1991 to 1996, Ivkovic and Weisbenner (2005) find that households exhibit a strong preference for local investments. They state that the average household generates an additional annualized return of 3.2% from its local holdings relative to its nonlocal holdings, suggesting that local investors can exploit local knowledge. Portes et al. (2001) use a gravity model to explain international transactions in financial assets and find that information asymmetries are responsible
5
for the strong negative relationship between asset trade (corporate equities, corporate bonds, and government bonds) and distance. Amadi (2004) states that there has been a distinct reduction in equity home bias in recent years. He examines if any of the prominent theoretical explanations or recent developments such as free trade and globalization, the advent of internet, and the rise of emerging markets and mutual fund investment have affected the increase in foreign diversification. He states that the rise of the internet and mutual fund investment has affected changes in foreign diversification, supporting information asymmetries explanation. Li et al. (2004) employ CPIS dataset to investigate the determinants of international portfolio holdings in a wide range of countries. They find that by explicit introducing information and transaction costs into their consumption based asset pricing model, the heterogeneity of cross border holdings and home bias puzzle can be explained. Portes and Rey (2005) explore a new panel data set on bilateral cross-border equity flows between 14 countries, for a period from 1989 to 1996. Gross transaction flows depend on market size in source and destination country as well as trading costs, in which both information and the transaction technology play a role. They find that the geography of information is the main determinant of the pattern of international transactions, while there is weak support for diversification motive, in their data, once they control for the information friction. Chan et al. (2005) examine how mutual funds from 26 developed and developing countries allocate their investment between domestic and foreign equity markets and what factors determine their asset allocation worldwide. They find robust evidence that these funds, in aggregate, allocate a disproportionately larger fraction of investment to domestic stocks. They state that the stock market development and familiarity variables have significant, but asymmetric, effects on the domestic bias and foreign bias and that economic development, capital controls, and withholding tax variables have significant effects only on the foreign bias.
A number of papers investigate bias in equity investments related specifically to individual countries. For Australia, Mishra (2008) explores the determinants of Australia’s equity home bias by employing CPIS dataset (2001 to 2005) on cross border equity investment. The paper finds that the share of the number of firms listed in the domestic market and the share of internet users in the total population of the host country has a significant impact on equity home bias. Trade linkages are found to have a mixed impact on equity home bias. The paper also finds that the country’s market share of the world market capitalisation and transaction costs do not impact Australia’s equity home bias. Mishra (2007) examines the bilateral, source and host factors driving portfolio equity investment across a set of countries using CPIS data. He states that the bilateral equity investment is strongly correlated with the underlying patterns of trade in goods and services. The information asymmetries and cultural-institutional proximity are important for bilateral equity investment. Mishra and Daly (2006) analyse the geography of Australia’s international portfolio investment using CPIS dataset. For United States, Salehizadeh (2003) use daily data covering the period of January 31, 1995 to May 31, 2001 to examine whether U.S. multinationals are the reason for the home bias puzzle. They subject a portfolio based on dollar returns of 47 U.S. multinationals, as well as a base portfolio represented by the broad S&P 500 index to correlation tests vis-a-vis non-U.S. stock indices. They find that U.S. multinational companies are not the reason for the continued existence of the home bias puzzle. Ahearne et al. (2004) test the home bias puzzle by employing high quality data on US holdings of foreign equities and quantitative measures of barriers to international investment. They find that the effects of direct barriers to international
6
investment, when statistically significant, are not economically meaningful. The portion of a country’s market that has a public US listing is a major determinant of a country’s weight in US investors’ portfolios. Cai and Warnock (2004) analyse foreigners’ and domestic institutional investors’ positions in US equities. They find a common preference for large firms and firms that are diversified internationally. Using an international factor model, they show that exposure to foreign equity markets is greater for domestic firms that are more diversified internationally, suggesting that some of the home grown foreign exposure translates into international benefits. They state that after accounting for home grown foreign exposure, the share of foreign equities in investors’ portfolios nearly doubles, reducing the observed home bias. For Chile, Holland and Warnock (2003) state that high growth, liquid Chilean firms have greater relative weights in US equity portfolios, but the most important determinant of a firm’s portfolio weight is whether it is listed on a US exchange. Firms appear to be able to access international capital at the time of the cross listing, but this access may be short lived. For Japan, Hiraki et al (2005) examine how foreign and domestic portfolio investors, both classified into money managers, invest in Japanese firms over the sample period of 1985-1998. They state that the investment behaviour of money managers is more consistent with the agency familiarity explanation than the information based explanation regardless of their nationalities. Kang and Stulz (1997) find that foreign investors tend to underweight smaller and highly leveraged firms. Foreigners invest in large firms with large export sales and firms with which they are familiar. For Sweden, Dahlquist and Robertsson (2001) characterize foreign ownership using dataset of ownership and attributes of Swedish firms. They find that foreign investors prefer large firms, firms that pay low dividends and firms with large cash positions on their balance sheets. They find an institutional investor bias rather than a foreign investor bias. Karlsson, A. and Norden, L. (2007) investigate differences in home bias on an individual levl by studying portfolios formed as a part of the new defined contribution pension plan in Sweden. They find that the likelihood of home bias is caused by both rational and irrational factors. They relate home bias to investors’ desire to hedge against inflation, sophistication and overconfidence. Using data from Finland, Grinblatt and Keloharju (2000) find that foreign investors tend to be momentum investors, buying past winning stocks and selling past losers. Domestic investors, particularly households, tend to be contrarians. Grinblatt and Keloharju (2001) state that investors are more likely to hold, buy, and sell the stocks of Finnish firms that are located close to the investor, that communicate in the investor’s native tongue, and that have chief executives of the same cultural background. Liljeblom and Loflund (2005) investigate the determinants of foreign portfolio investment flows into the Finnish stock market. Using company specific data on the degree of foreign ownership, they report that foreign investment flows are significantly related to investment barriers as proxied by dividend yield, liquidity, firm size and risk related variables. For Korea, Choe et al. (2001) use trade data from Korea from December 1996 to November 1998 and find evidence that domestic individual investors have a short-lived private information advantage for individual stocks over foreign investors, but almost no evidence that domestic institutional investors have such an advantage. Kim and Wei (2002) use a unique data set to study the trading behavior of foreign portfolio investors in Korea before and during the currency crisis. They state that investors in different categories have different trading patterns. For example, foreign investors outside Korea are more likely to engage in positive feedback trading strategies and are more likely to engage in herding than the branches/subsidiaries of foreign institutions in Korea or foreign individuals living in Korea. This difference in
7
trading behavior is possibly related to the difference in their information. For Germany, Hau (2001) states that traders located outside Germany in non-German speaking cities show lower proprietary trading profit. He finds evidence for an information advantage due to corporate headquarters proximity for high frequency (intraday) trading. Lin and Shiu (2003) investigate foreign ownership in the Taiwan stock market from 1996 to 2000. Foreign investors appear to favour large firms and low book to market stocks. Foreign investors strongly prefer firms with high export ratios with which they are more familiar on account of their higher foreign sales. Foreign investors hold more shares of high beta stocks than of low beta stocks for small firms. Large firms have lower investment barriers than small firms. Dvorak (2005) use transaction data from the Jakarta stock exchange and find that domestic investors have information advantage over foreign investors. Foreign investors systematically buy at higher and sell at lower intra day prices. Foreign investors tend to sell prior to large positive returns. The permanent impact of foreign purchases is smaller than that of domestic purchases.
There are some papers on corporate governance and home bias. Dahlquist et al. (2003) state that there is a close relation between corporate governance and the portfolios held by investors. They construct an estimate of the world portfolio of shares available to investors who are not controlling shareholders (the world float portfolio). The world float portfolio differs sharply from the world market portfolio. In regressions explaining the portfolio weights of U.S. investors, the world float portfolio has a positive significant coefficient but the world market portfolio has no additional explanatory power. They also analyse Swedish firm level data on foreign ownership and confirm the importance of the float portfolio as a determinant of these holdings. Gelos and Wei (2005) examine whether country transparency affects international portfolio investment. They construct new measures of transparency and use a unique microdata set on portfolio holdings of emerging market funds around the world. They distinguish between government and corporate transparency. They state that funds systematically invest less in less transparent countries and funds have a greater propensity to exit nontransparent countries during crises. Kho et al. (2006) find that the home bias of US investors decreased the most towards countries in which the ownership by corporate insiders is low, and countries in which ownership by corporate insiders fell. Using firm-level data for Korea, they find that portfolio equity investment by foreign investors in Korean firms is inversely related to insider ownership and that the firms that attract the most foreign portfolio equity investment are large firms with dispersed ownership. The literature on the role of real exchange rate volatility as a potential driver of home bias is sparse. Cooper and Kaplanis (1994) develop an indirect test of the impact of domestic inflation risk in the absence of purchasing power parity. Their test is based on an examination of the correlation between domestic equity returns and inflation, rather than an analysis of the impact of real exchange rate volatility on home bias. There is only one paper by Fidora et al. (2007) that investigates the role of exchange rate volatility on home bias and also explains differences in home bias across financial assets, i.e. equity and bond for 40 investor countries including all major industrialized and emerging market economies and upto 120 host countries. They employ CPIS data as annual averages over the period 1997, 2001 to 2003. They state that real exchange rate volatility induces a bias towards domestic financial assets as well as a stronger bias for assets with low local currency volatility.
8
3. Australia’s Float adjusted Home Bias Measure: Stylised Facts This paper employs Australia’s free float home bias measure from Mishra (2008):
ijFFHB , = ∗−jFF
jiFF
II
,
,1 (1)
where is the float adjusted measure of home bias, is the float adjusted
measure of country equity holdings in country ijFFHB ,
jiFFI ,
si′ j and is float adjusted world market portfolio of country
∗jFFI ,
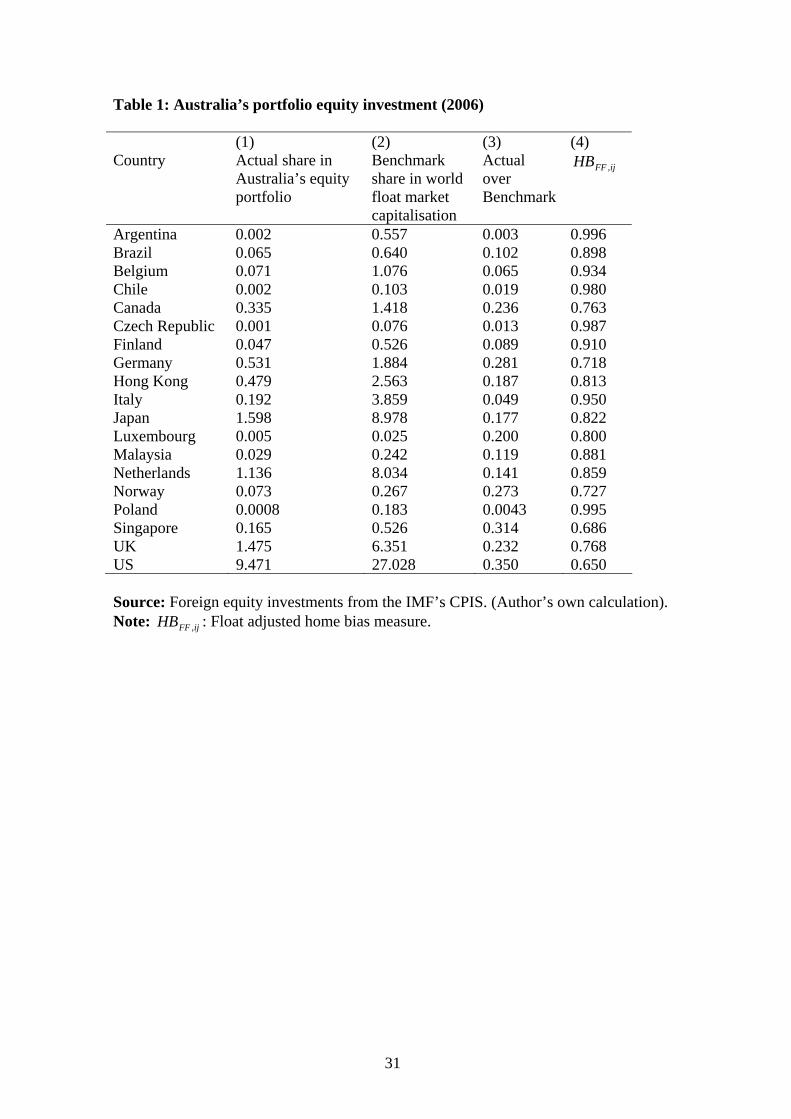
j . [INSERT TABLE 1]
Table 1 presents Australia’s float adjusted home bias measure as of December 2006. Column (1) of the table presents Australian investors’ actual portfolio share as of December 2006. The actual portfolio share is the foreign equity holdings of Australia in other countries relative to Australia’s total holdings of foreign and domestic equities. Column (1) indicates that Australia’s actual percent portfolio share is the highest in US (9.47) followed by Japan (1.59), UK (1.47), Netherlands (1.13) and then, the remaining countries of the world. Column (2) of the table presents the theoretical portfolio shares, i.e., share of country’s float market capitalisation in the world float market capitalisation. It shows the share of Australia’s equity holdings by country under the assumption that investors choose portfolios based on the standard portfolio theory. Column (3) compares the actual share of domestic equities held by Australians in other countries with the benchmark share in the world portfolio as per ICAPM model. This comparison gives an indication of the degree to which Australian investors’ underweight different foreign countries. Column (3) clearly indicates that there is a significant amount of variation in values across countries and Australian holdings are less than those predicted by ICAPM. The ratio is 0.35 for United States, indicating that Australian investors’ holding of stocks from United States at end-2006 was 35 percent of what traditional portfolio theory would have predicted. The degree of underweighting is more severe against countries like Argentina (0.003), where Australian investor holds 0.3 percent of the shares predicted by traditional ICAPM levels. Column (4) indicates the measure of home bias as per equation (9). Australian investors allocate 9.47 % of their portfolio in US, whereas 27.02 % of the world market capitalisation are abroad; they have only exploited international diversification to 35 % and thus have home bias of 65 %. A greater value of home bias measure corresponds to a lower weight in Australia relative to world portfolios and, thus, a higher degree of bias.
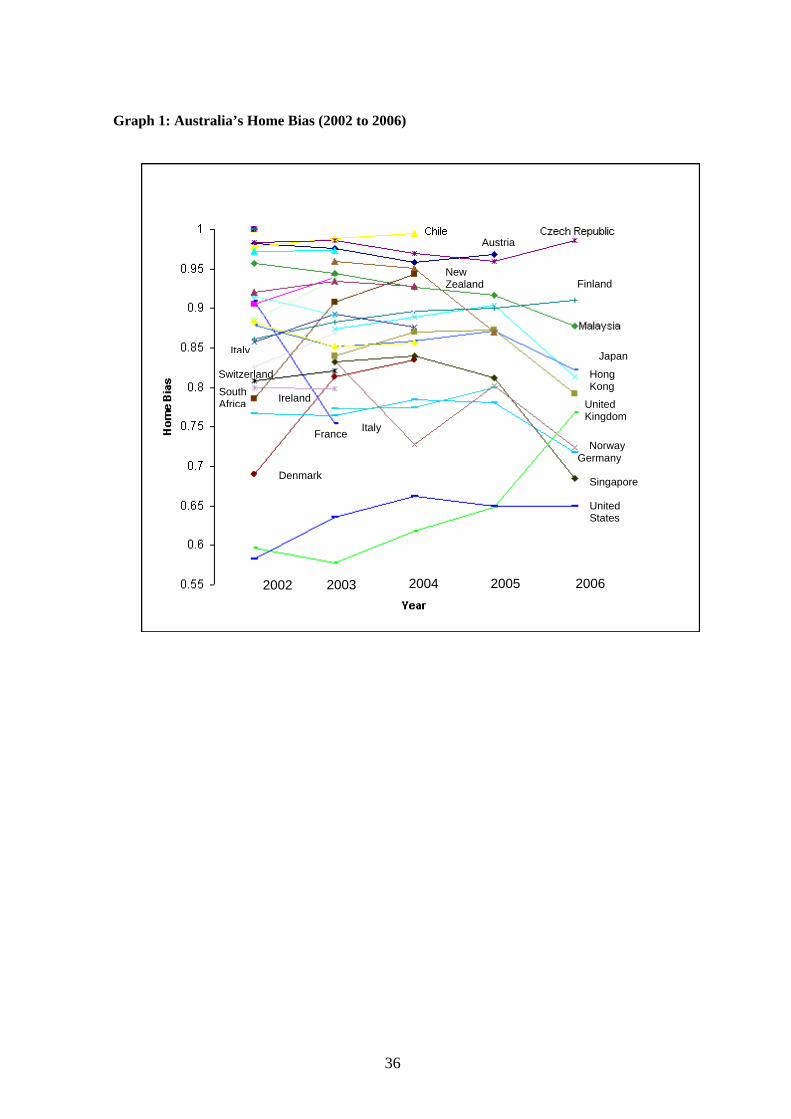
[INSERT GRAPH 1] Graph 1 illustrates Australia’s equity home bias over the period from 2002 to 2006. Graph 1 shows some interesting trends in Australia’s equity home bias. Australia’s equity home bias rises from 0.58 (2002) to 0.66 (2004) and then decreases to 0.64 (2006), in case of United States. Australia’s equity home bias rises from 0.59 (2002) to 0.76 (2006), for United Kingdom. In case of New Zealand, Australia’s equity home bias decreases from 0.95 (2003) to 0.87 (2005). For Germany, equity home bias increases from 0.76 (2002) to 0.78 (2004) and then decreases to 0.71 (2006). Australia’s home bias decreases from 0.87 (2002) to 0.85 (2004) and then rises to 0.87 (2005) and falls to 0.82 (2006). For Finland, Australia’s home bias increases from 0.86 (2002) to 0.91 (2006).
9
4. Theoretical Framework, Empirical Specification and Instrumental Variables 4.1 Theoretical Framework This paper employs a Markowitz type international capital asset pricing model which incorporates real exchange rate volatility as stochastic deviations from purchasing power parity (PPP), in accordance with Fidora et al. (2007). Real exchange rate volatility induces a bias towards domestic financial assets because it puts additional risk on holding foreign securities from a domestic currency investors’ perspective, unless foreign local currency real returns and the real exchange rate are sufficiently negatively correlated. The nominal (local currency) rate of return and real (local currency) rate of return Dl
Dr of a domestic asset are given by the following equations: DDD il εμ ++= (2)
DDD ilr −= Dεμ += (3) where, μ is constant and is an error term with Dε ( ) 0=DE ε and Var ( ) 2σε =D
η+−=Δ FD iieln (4) where, is variation of the domestic currency, is the domestic inflation rate, is the foreign inflation rate,
elnΔ Di Fiη is an error term with ( ) 0=ηE and Var ( ) 2
ηση =
The nominal (foreign currency) rate of return and real (local currency) rate of return
FlFr of a foreign asset are given by the following equations:
FFF il εμ ++= (5)
ηεμ ++=−Δ+= FDFF ielr ln (6) Equation (6) suggests that real return of foreign securities expressed in domestic currency depends on the shock to the return of the foreign security and on a shock measuring the deviation of the exchange rate from relative purchasing power parity, η . Any deviation of the exchange rate from purchasing power parity drives a wedge between real returns on domestic and foreign investment. The global capital market consists of two countries, each of which offers equity. Following equations (3) and (6):
R= (7) ( )( )⎟
⎟⎠
⎞⎜⎜⎝
⎛F
D
rErE
This paper assumes that variances of nominal returns are identical and all errors are uncorrelated. The variance-covariance matrix of domestic currency real returns is given by:
Σ = (8) ( )
( ) )⎟⎟⎠
⎞⎜⎜⎝
⎛
+=
=22
2
00
ησσ
σF
D
rVarrVar
This paper follows Adler and Dumas (1983) and Cooper and Kaplanis (1994) and assumes a standard Markowitz mean-variance investor who maximizes a quadratic utility function,
10
( ) ( ''
2max RVarREU )λ
−= (9)
where, ( )'RE is the expected real return on a portfolio of risky assets, ( )'RVar is the variance of returns and λ is the coefficient of risk aversion. The investor chooses the optimal portfolio weights for all individual assets in the portfolio, with respect to a vector of expected real returns
w( )RE of the individual
assets, variance-covariance matrix Σ of real returns and a unity investment restriction. The resulting optimization problem is given by the following Lagrangian,
( ) ( 12
max ''' −−Σ−= IwwwREwL μ )λ (10)
Derivation of equation (18) with respect to yields the optimal portfolio weights: w
( ) ( )⎟⎟⎠
⎞⎜⎜⎝
⎛Σ
−Σ−
Σ= −
−−
III
REIREw 1'
1'1 λλ
(11)
( )
222
222
1'
1'
11
η
η
σσσ
σσμ
σμλ
λ
++
+++−
=Σ
−Σ= −
−
IREIA (12)
where A is portfolio constant. Substituting (7), (8) and (12) in (11) yields portfolio weights of domestic equity and foreign equity as follows:
( )⎟⎟⎟⎟
⎠
⎞
⎜⎜⎜⎜
⎝
⎛
+−
=
−=
=
22
2
ησσλμ
λσμ
Aw
Aww
F
D
(13)
The world market portfolio is defined as: *w
⎟⎟⎠
⎞⎜⎜⎝
⎛
+=
+==
DFFDF
FFDDD
wWwWwwWwWw
w*
** (14)
where, is the domestic fraction of world portfolio wealth, . DW DF WW −= 1Substituting equation (13) into equation (14) yields the following expression of equity home bias,
( )( ) 22
2
*
*
11
η
η
σσσ
D
D
F
FF
WW
wwwHB
−+
−=
−= (15)
The above model gives rise to the following postulate which will be tested empirically: Home bias increases in real exchange rate volatility, which measures the degree to which relative purchasing power parity is violated. If the change in the real exchange rate volatility equals the inflation differential, i.e. relative purchasing power parity holds, home bias is zero. Conversely, as real exchange rate volatility increases to infinity, home bias converges to unity, which implies absence of foreign investment. 4.2 Empirical Specification The primary goal is to investigate the effect of real exchange rate volatility on cross-country differences in bilateral home bias. The preferred estimator includes source and
11
host country-fixed effects, as these are able to control for nearly all country specific determinants of home bias. The following model also includes different potential sources of home bias other than real exchange rate volatility. These sources of home bias are based on the literature of gravity models including distance, trade, language, legal origin, foreign listing, transaction cost, covariance and other proxies for information asymmetries. The objective is to test whether real exchange rate volatility continues to be a significant determinant of home bias even after controlling for these alternative hypotheses. This paper also empirically tests the following model and conducts generalised method of moments robustness tests by employing instrumental variables that are standard in financial economics literature.
( ) ( ) ( ) ( ) ( ) ( )( ) ( ) ( ) ( ) ( ) ij
ijFF
TAXTRANDISTRDFL
LOLANSIZECOVISLVOLHB
εααααα
ααααααα
+++++
+++++++=
1110987
6543210, (16)
where : Float adjusted measure of home bias, VOL: standard deviation of monthly change of the difference of bilateral nominal exchange rate and bilateral inflation differential, 1995 to 2006, dummy which is equal to the number of island countries, COV : covariance of monthly returns between source country and host country, 1995 to 2006, : share of a country’s stock market in world market capitalisation, dummy which is equal to 1 if host and source country share common language, otherwise it is zero, dummy which is equal to 1 if host and source country share common legal origin, otherwise it is zero, : share of the number of foreign firms listed in total number of firms listed in domestic market,
average of imports and exports normalised by the destination country’s GDP, logarithm of the distance between countries, TRAN : Transaction cost associated
with share trading in destination country, : corporate tax rate of destination country,
ijFFHB ,
:ISL
SIZE:LAN
:LOFL
:TRD:DIS
TAXijε : random error term.
4.3 Instrumental Variables This paper uses CPIS data on cross border equity holdings to calculate float equity home bias. The CPIS’s equity investment data is based on the concept of capital stock. Endogeneity should be less of a problem for capital stocks than flows. However, in order to address possible endogeneity problems, measurement errors and omitted variable bias, this paper adopts generalised method of moments techniques, by employing instrumental variables that are standard in the financial economics literature. This paper employs lag of real exchange rate volatility as an instrument. This paper considers the index of religion and ethnicity from Alesina et al. (2003) as an instrument, in accordance with Mishra and Daly (2007). In accordance with Li et al. (2004), this paper employs logarithm of the gross domestic product of host country
as instrument to return variables. The paper also uses the index of landlocked from Rose (2005) as an instrument and product of natural logarithm of
population of Australia and host country
(GDP))(LCK
( )POP as an instrument. This paper also employs data on the quality of domestic institutions from Kaufmann et al. (2007) as instrumental variables because quality of institutions is largely exogenous to bilateral capital stocks.
12
5. Sources of Home Bias Some of the possible sources of home bias in the Australian investor’s equity holdings may be due to exchange rate volatility, familiarity and investors’ diversification motives. These sources of home bias are discussed below. 5.1 Exchange rate volatility ( ) VOLReal exchange rate volatility induces a bias towards domestic financial assets because it puts additional risk on holding foreign securities from a domestic currency investors’ perspective, unless foreign local currency real returns and the real exchange rate are sufficiently negatively correlated. This paper takes the standard deviation of monthly real exchange rate changes over the period 1995 to 2006 as measure of exchange rate volatility. The data on exchange rates and consumer price index is from Data Stream. 5.2 Familiarity Familiarity plays an important role in investors’ equity investment decisions (Mishra (2007; 2008), Mishra and Daly (2006), Portes and Rey (2005), Coval and Moskowitz (1999; 2001), Portes et al. (2001), Grinblatt and Keloharju (2000, 2001) and Huberman (2001)). The following section discusses the familiarity control measures of home bias: foreign listing, trade, distance, transaction cost, language, legal origin, etc. (i) Size ( )SIZESIZE is country’s market share of the world market capitalisation. This variable tests the assumption of the traditional theory of ICAPM that investors should diversify according to their country’s share of world market capitalisation. If an investor’s domestic market’s share of world market capitalisation increases, then the investor would decrease the foreign investments. This measure is in accordance with Ahearne et al (2004) and Amadi (2004). The stock market data is from Standard and Poors (2007). (ii) Trade ( ) TRDTRD is the average of imports and exports normalised by the destination country’s GDP. This measure is in accordance with Mishra (2008), Ahearne et al. (2004) and Amadi (2004). Investors may be inclined to hold securities of close trading partners for various reasons including hedging, familiarity with host country’s products or spillovers of information. Investors are better able to attain accounting and regulatory information on foreign markets through trade in goods. Mishra (2008) states that trade linkages are found to have a mixed impact on Australia’s equity home bias. This variable is expected to have a negative impact on the measure of home bias. The data on imports and exports is from IMF’s Direction of Trade Statistics and GDP data is from World Bank’s World Development Indicators. (iii) Distance ( ) DISDIS is the logarithm of the distance between capital city of source country and host country in kilometres. Geographical distance is a barrier to interaction among economic agents and cultural exchange. Countries which are relatively close geographically can also be expected to share cultural similarities, which tend to lower information costs. Li et al. (2004) estimate that if the distance between two countries doubles, the cross border equity holdings are reduced by 68%. This variable is expected to have a negative impact on foreign equity holdings. The data on distance is from http://www.indo.com/distance/.
(iv) Language ( )LANLAN is the common language dummy variable which is equal to one if source and host country share a common language; otherwise its value is zero. Investors prefer to invest in foreign countries that share a common language with their home country. Common language may better enable investors to read company financial reports and financial press analysis. This may enhance investors’ familiarity with destination countries financial system and thus reduce investors’ information costs. Data on language is from the World Factbook 2006 (www.cia.gov/cia/publications/factbook/), which reports the official, major and unofficial languages from all over the world. This variable is expected to have a negative impact on the measure of home bias. (v) Legal Origin ( ) LOCommon origin to the legal system uses a dummy variable for similarity in institutions. This paper assigns a dummy value of 1 if the source and host country have the same legal origin, otherwise it is zero. Laws in different countries are typically not written from scratch, but rather transplanted from a few legal families or traditions. In general, commercial laws come from two broad traditions: common law, which is English in origin, and civil law, which derives from Roman law. The modern commercial laws originate from the three major families French, German and Scandinavian, in the civil law tradition. The three major law tradition families that have global impact are English common law and the French and German civil law. In case of individual countries, the resulting laws reflect both the influence of their families and country specific law characteristics. This variable is expected to have a negative impact on Australia’s equity home bias. The data on legal origin is from La Porta et al. (1998). (vi) Transaction Costs ( )TRANHome bias can arise due to high transaction costs associated with trading foreign equities. The transaction cost data is derived from Elkins-McSherry Co. (www.elkins-mcsherry.com). Elkins-McSherry Co. receives trade data on all global trades by institutional traders and computes measures of trading costs. The data consists of average trading costs as a percentage of trade value for active managers in a universe of 42 countries. The data are quarterly, from the last quarter of 1995 through to the fourth quarter of 2006, for 150 global institutions. The transaction cost comprises of three cost components, viz. commissions, fees and market impact costs. This paper takes into account the total cost comprising all three cost components for the end quarter of years 2001 to 2006. Investors would underweight high transaction cost countries in their portfolios and, accordingly, this variable is expected to have a positive impact on the measure of home bias. (vii) Foreign Listing ( )FLFL is the share of the number of foreign firms listed in total number of firms listed in domestic market. This measure is in accordance with Mishra (2008) and Amadi (2004). When host countries firms list equity on source country’s stock exchanges or issue public debt in source country’s markets, barriers to source country’s investors are reduced. The listed securities have increased investor recognition; lower transaction costs and better settlement in source country. The listed firms are able to adopt the source country’s accounting standards, disclosure requirements and regulatory environment. Accordingly, the listed firms are able to produce higher quality financial information, which reduces information costs. This reduction in the information costs
makes the firm more attractive to source country’s investors. Local investors can readily access foreign equity of the listed foreign firms in their domestic markets. Baker et al. (2002) state that international firms that list their shares on the New York Stock Exchange or the London Stock Exchange experience a significant increase in visibility, as proxied by analyst coverage and print media attention. The increase in analyst following is also associated with a decrease in the cost of equity capital after the listing event. Sarkissian and Schill (2004) examine the market preferences of firms listing their stock abroad. They find that geographic, economic, cultural, and industrial proximity plays a dominant role in the selection of overseas listing stock exchange and cross listing activity is more common across markets for which diversification gains are relatively low. Ahearne et al. (2004) state that to publicly issue debt or list equity on US exchanges, a foreign firm must reconcile its accounts with US generally-accepted accounting principles (GAAP), meet the security exchange’s stringent disclosure requirements, and subject itself to the associated regulatory burden. This allows investors to gather high quality financial information on companies at lower costs. The foreign countries whose firms do not alleviate information costs by opting into the US regulatory environment are more severely underweighted in US equity portfolios. Mishra (2008) finds that the share of the number of firms listed in the domestic market has a significant impact on Australia’s equity home bias. This variable is expected to have a negative impact on Australia’s equity home bias. The data on the number of foreign firms and total number of firms in domestic markets is from International Federation of Stock Exchanges. 5.3 Islands ( ) ISLThis paper also employs familiarity control measure: islands ( )ISL from Rose (2005).
is the number of island nations in the source and host country pair (0, 1 or 2). ISL 5.4 Tax ( )TAXThis paper employs a control measure of corporate tax from KPMG’s corporate tax survey. KPMG has published annual analysis of corporate tax rates at a global level, since 1993. KPMG reported corporate tax rates from 23 countries in the year 1993. In 2006, KPMG has reported corporate tax rates from 86 countries. 5.5 Diversification - Covariance ( )COV COV is the covariance between returns of source and host country. This measure is in accordance with Mishra (2008). The covariance is a proxy for the diversification between two countries. The financial economics literature suggests that the greater the co-movements between financial assets of two countries, the lower the benefit of diversification. There is no rationale for an investor to invest in foreign assets in countries when their returns are strongly positively correlated with domestic financial assets, as this does not allow the investor to diversify his risk. When the correlation between source country and host country is small, source country investors enjoy a larger diversification gain from investing in the host country; they have a greater desire to increase their equity holdings in the host country. Therefore, the degree of Australia’s equity home bias for host country will be smaller. The covariance of returns between Australia and host country is computed using return data from DataStream’s Morgan Stanley Capital International (MSCI). The return data is
15
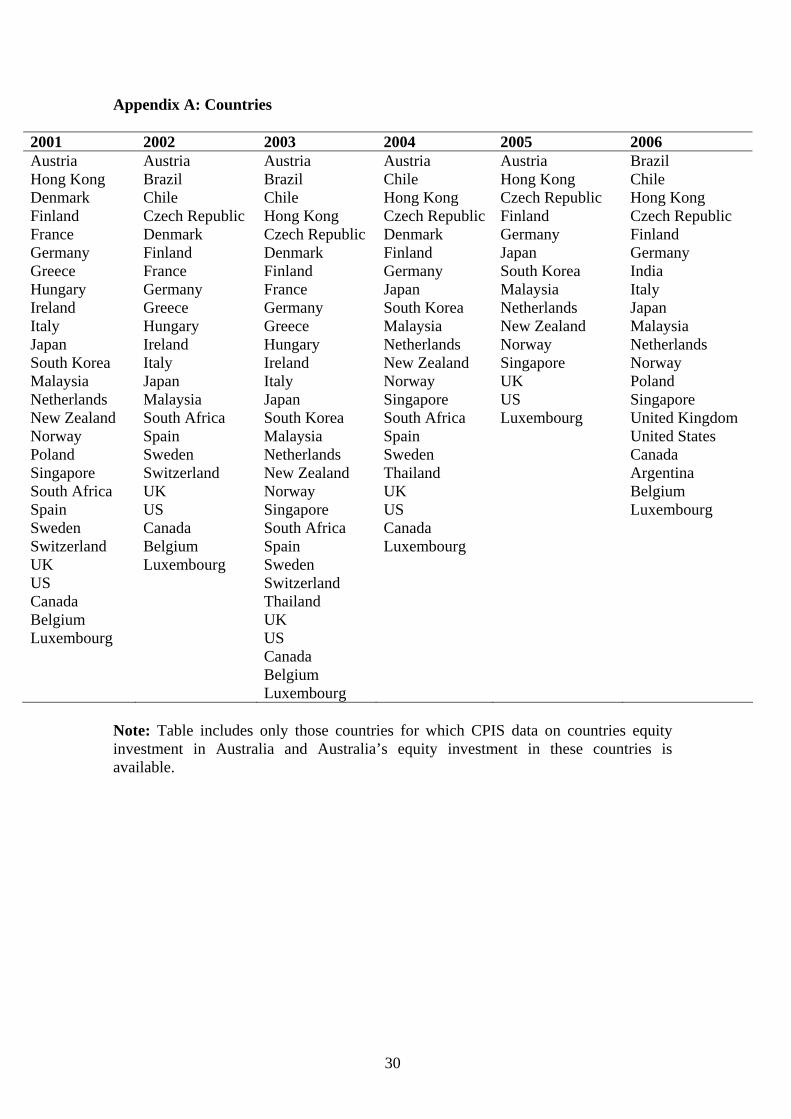
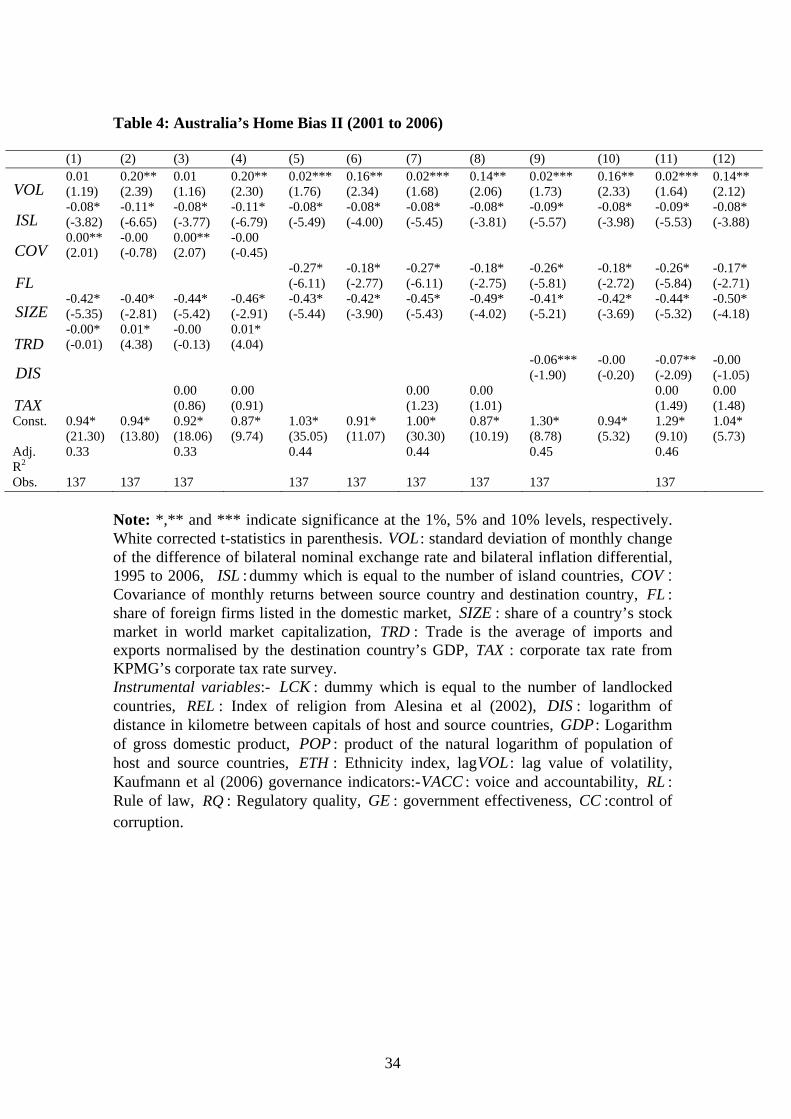
calculated from MSCI monthly stock market indices for months ranging from January 1995 to December 2006. 6. Empirical Results The empirical results are based on panel regression and generalised method of moments robustness tests using instrumental variables that are standard in the financial economics literature for the years 2001 to 2006. Appendix A lists the countries.
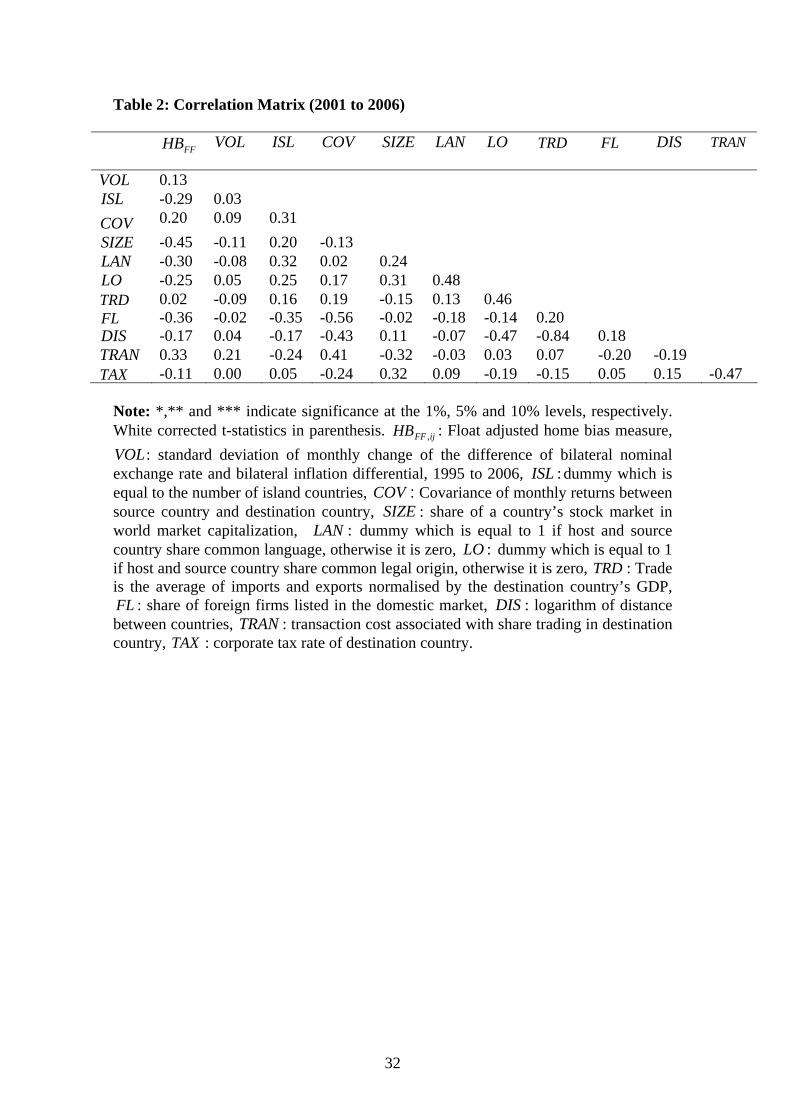
[TABLE 2] Table 2 presents the correlation matrix for the variables used in the paper. The measure of home bias is negatively related to the share of a country’s stock market in world market capitalisation, language dummy, legal origin dummy, share of the number of foreign firms listed in the Australian stock market, distance, island dummy, tax and positively related to real exchange rate volatility, covariance, transaction cost and trade. The covariance variable is highly correlated (-0.56) with share of foreign firms listed in the domestic market variable
(COV )( )FL . The distance variable ( is highly
correlated (-0.84) trade variable . )DIS
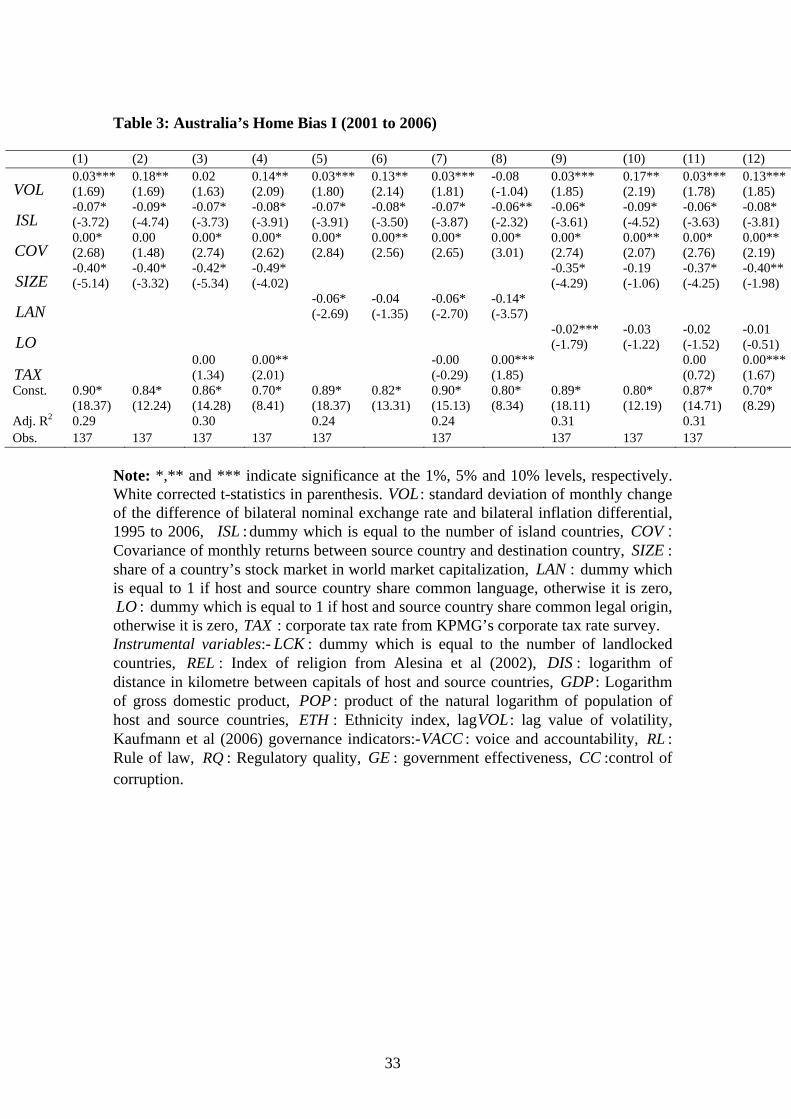
( )TRD[TABLE 3]
Table 3 indicates the panel regression results and generalised method of moments regression test results of Australia’s home bias measure by regressing home bias variable against the independent variables, i.e., real exchange rate volatility, island dummy, covariance, size, language, legal origin and tax in various specifications. In column (1), real exchange rate volatility variable ( )VOL is significant at 10 percent. The size variable enters significantly at the 1 percent level with a negative sign. Home bias decreases in the relative value of a country’s portfolio. Large global players can afford a relatively large home weight without necessarily showing a home bias. Covariance variable ( is positive and significant at 1 percent. Covariance variable is used to test the diversification motive. If transactions occur because of diversification motive, the covariance variable should be significant because the greater the co-movement between financial assets of two countries, the lower the benefit of diversification. Covariance variable, though statistically significant, is economically insignificant suggesting low diversification motives of investors. The island dummy is negative and significant at 1 percent. The overall adjusted R2 is 0.29.
(SZ )
)
)
COV
Column (2) presents generalized method of moments regression results to check the robustness of results in column (1). Real exchange rate volatility ( enters significantly at 5 percent with positive sign. The coefficient of real exchange rate volatility increases from 0.03 (using the non-instrumented variable) to 0.18 (using instrumented variable). Size variable
VOL
( )SZ is negative and significant, implying that home bias decreases as the relative weight of a country’s portfolio increases in the world market portfolio. Covariance variable ( )COV is both economically and statistically insignificant, suggesting low diversification motives of investors. The island dummy is negative and significant at 1 percent. Column (3) presents regression results by employing tax variable ( )TAX along with real exchange rate volatility ( , size )VOL ( )SZ , covariance ( )COV and island dummy
independent variables. Real exchange rate volatility (ISL) ( )VOL is positive but
16
insignificant. Tax variable ( is positive and insignificant. This is contrary to the view that destination countries that adopt low tax rates tend to attract more inward investment from the source country, Australia. The size variable
)TAX
( )SZ is significant at the 1 percent level with a negative sign, suggesting that home bias decreases as the relative weight of a country’s portfolio increases in the world market portfolio. The covariance variable is positive and statistically significant at the 1 percent level. However, covariance variable is economically insignificant. This is in accordance with Mishra (2008) who states that Australian investors are found to exhibit low diversification motives. The island variable
(COV )
( )ISL is negative and significant at the 1 percent level. Column (4) presents generalized method of moments regression results to check the robustness of results in column (3). Real exchange rate volatility is positive and significant at 5 percent level. The coefficient of real exchange rate volatility increases from 0.02 (using the non-instrumented variable) to 0.14 (using instrumented variable). Tax variable is statistically significant at 10 percent level; however, it is economically insignificant. This reinforces the view that corporate tax rate does not have a significant impact on Australia’s equity home bias. The size variable ( is negative and significant at the 1 percent level with the coefficient increasing from
(TAX )
)SZ
-0.42 (column 3) to -0.49 (column 4). The covariance variable ( )COV retains the same sign and significance level as in column (3). The island variable ( )ISL is negative and significant at the 1 percent level. In column (5), real exchange rate volatility variable ( )VOL is significant at 10 percent. The language ( dummy is negative and significant at 1 percent which implies that investors prefer investing in common language countries. Common language enables Australian investors to better understand the cultural, financial and regulatory environment of the host country, thus influencing Australian investors’ equity investment decisions. Covariance variable
)LAN
( )COV is positive and significant at 1 percent. Covariance variable, though statistically significant, is economically insignificant suggesting low diversification motives of investors. The island dummy is negative and significant at 1 percent. The overall adjusted R2 is 0.24. Column (6) presents generalized method of moments regression results to check the robustness of results of column (3). Real exchange rate volatility ( enters significantly at 5 percent with positive sign. The coefficient of real exchange rate volatility increases from 0.03 (using the non-instrumented variable) to 0.13 (using instrumented variable). The language
)VOL
( )LAN dummy becomes insignificant. The covariance variable variable looses significance from 1 percent to 5 percent. Further, the covariance variable
(COV )( )COV is statistically insignificant, suggesting low
diversification motives of investors. The island dummy is negative and significant at 1 percent. Column (7) presents regression results by employing tax variable ( )TAX along with real exchange rate volatility ( , language dummy )VOL ( )LAN , covariance and island dummy independent variables. Real exchange rate volatility ( is
(COV )) )(ISL VOL
17
positive and significant at 10 percent level. Tax variable ( )TAX is negative and insignificant. This is contrary to the view that the greater the corporate tax rate in destination countries, the higher the equity home bias in the source country, Australia. The language dummy , covariance variable (LAN ) ( )COV and island dummy have the same sign, significance level and coefficient as those in column (5).
( )ISL
Column (8) presents generalized method of moments regression results to check the robustness of results of column (7). The real exchange rate volatility variable ( ) is negative and insignificant. Tax variable
VOL( )TAX is positive and statistically significant
at 10 percent; however, it is economically insignificant. This reinforces the view that corporate tax rate in destination countries does not impact Australia’s equity investment. The covariance variable ( )COV retains the same sign, significance and coefficient as in column (7). The language variable ( )LAN is negative and statistically significant at the 1 percent level. The coefficient of language ( )LAN increases from -0.06 (column 7) to -0.14 (column 8). The island dummy ( )ISL is negative and statistically at 5 percent level. In column (9), real exchange rate volatility variable ( )VOL is significant at 10 percent. The legal origin variable is negative and significant at 10 percent, which implies that Australian investors are better able to understand the legal and regulatory environment of the host countries which have the same legal origin as their own and accordingly prefer to invest in those countries. The size variable ( enters significantly at the 1 percent level with a negative sign. Covariance variable ( ) is positive and significant at 1 percent. Covariance variable is statistically significant; however it is economically insignificant suggesting low diversification motives of investors. The island dummy is negative and significant at 1 percent. The overall adjusted R2 is 0.31.
(LO)
)
)
SZCOV
Column (10) presents generalized method of moments regression results to check the robustness of results in column (5). Real exchange rate volatility ( enters significantly at 5 percent with positive sign. The coefficient of real exchange rate volatility increases from 0.03 (using the non-instrumented variable) to 0.17 (using instrumented variable). The legal origin variable
VOL
( )LO is negative and insignificant. Size variable ( is negative and insignificant. Covariance variable is statistically significant at 10 percent; however it is economically insignificant. The island dummy is negative and significant at 1 percent.
)SZ ( )COV
Column (11) presents regression results by employing tax variable ( )TAX along with real exchange rate volatility , legal origin dummy (VOL) ( )LO , covariance , size and island dummy ( independent variables. Real exchange rate volatility
is positive and significant at 10 percent level. Tax variable
( )COV(SZ ) ))
ISL(VOL ( )TAX is negative and insignificant. This reinforces the view that corporate tax rate in destination countries does not impact Australia’s equity investment. The size variable ( is negative and statistically significant at the 1 percent level. The covariance variable
is statistically significant at 1 percent; however, it is economically
)
)
SZ
(COV
18
insignificant. The legal origin dummy ( )LO is economically and statistically insignificant. The island dummy ( )ISL is negative and statistically significant at the 1 percent level. Column (12) presents generalized method of moments regression results to check the robustness of results of column (11). The real exchange rate volatility variable is positive and significant at 10 percent level. The coefficient of real exchange rate volatility increases from 0.03 (column 11) to 0.13 (column 12). Tax variable
is positive and statistically significant at 10 percent; however, it is economically insignificant. This again reinforces the view that corporate tax rate in host countries does not impact Australia’s equity investment. The size variable is negative and statistically significant at the 5 percent level. The covariance variable
is statistically significant at 10 percent level; however, it is economically insignificant. The legal origin dummy
( )VOL
(VOL))
)
)
(TAX
(SZ
(COV( )LO is economically and statistically
insignificant. The island dummy ( )ISL is negative and statistically significant at the 1 percent level. Overall, results of Table 3 suggest that real exchange rate volatility has a significant effect on Australia’s equity home bias. The point estimates and significance of real exchange rate volatility for generalised method of moments robustness tests increase as compared to using non-instrumented variables, reinforcing that real exchange rate volatility has a significant effect on Australia’s equity home bias.
[TABLE 4] Table 4 indicates the panel regression results and generalised method of moments regression test results of Australia’s home bias measure by regressing home bias variable against the independent variables, i.e., real exchange rate volatility, island dummy, covariance, size, foreign listing, trade and distance. In column (1), real exchange rate volatility variable ( )VOL is positive but insignificant. The trade variable ( )TRD is negative and significant at 1 percent. However, is economically insignificant. Mishra and Daly (2006) state that the major determinants of Australia’s geographical allocation of portfolio investment indicates a broad correspondence between stock market capitalisation of destination countries and the allocation of Australian financial investments but with some deviations from that baseline, where the deviations are correlated with Australian trade patterns. The size variable enters significantly at the 1 percent level with a negative sign. Covariance variable ( is positive and significant at 5 percent. Covariance variable is used to test the diversification motive. Covariance variable, though statistically significant, is economically insignificant suggesting low diversification motives of investors. The island dummy
TRD
(SZ ))COV
( )ISL is negative and significant at 1 percent. The overall adjusted R2 is 0.33. Column (2) presents generalized method of moments regression results to check the robustness of results in column (1). Real exchange rate volatility ( enters significantly at 5 percent with a positive sign. The coefficient of real exchange rate volatility increases from 0.01 (using the non-instrumented variable) to 0.20 (using
)VOL
19
instrumented variable). The trade variable ( )TRD changes sign from negative (column 1) to positive (column 2). Size variable ( )SZ is negative and significant at 1 percent. Covariance variable ( is both economically and statistically insignificant, suggesting low diversification motives of investors. The island dummy is negative and significant at 1 percent.
)COV
Column (3) presents regression results by employing tax variable ( )TAX along with real exchange rate volatility ( , island dummy )VOL ( )ISL , covariance ( , size
and trade independent variables. Real exchange rate volatility ( ) is positive and insignificant. Tax variable
)) )
COV(SZ (TRD VOL
( )TAX is positive and insignificant implying that corporate tax rate in destination countries does not impact Australia’s equity investment. The trade variable ( )TRD is negative and insignificant. This is in accordance with Mishra (2008) who states that trade linkages are found to have a mixed impact on Australia’s equity home bias. The covariance variable , though statistically significant at the 5 percent level, is economically insignificant, suggesting low diversification motives of Australian investors. The size variable enters significantly at the 1 percent level with a negative sign implying that home bias decreases in the relative value of a country’s portfolio. The island dummy retains the same sign and significance level as in column (1).
( )COV
( )SZ
Column (4) presents generalized method of moments regression results to check the robustness of results of column (3). Real exchange rate volatility ( )VOL is positive and significant at the 5 percent level. The coefficient increases from 0.01 (column 3) to 0.20 (column 4). Tax variable ( )TAX is positive and insignificant reinforcing that corporate tax rate in destination countries has no major influence in Australia’s equity investment. The trade variable ( )TRD changes sign from negative (column 3) to positive (column 4). The trade variable also becomes significant at 1 percent level in column (4). The coefficient of trade variable is low (0.01) reinforcing Mishra (2008) finding that trade linkages are found to have a mixed impact on Australia’s equity home bias. The covariance variable ( )COV is negative and insignificant supporting Mishra (2008) who states that Australian investors have low diversification motives. The size variable enters significantly at the 1 percent level with a negative sign. The size variable
(SZ )( )SZ coefficient increases from -0.44 (column 3) to -0.46 (column
4). This reinforces that home bias decreases as the relative weight of a country’s portfolio increases in the world market portfolio. The island dummy is negative and significant at the 1 percent level.
(ISL)
In column (5), real exchange rate volatility variable ( )VOL is positive but significant at 10 percent. The foreign listing variable ( )FL is negative and significant at 1 percent. Australian investors prefer the host country’s firms which alleviate information asymmetries by publicly listing in the Australian stock exchange. The size variable
enters significantly at the 1 percent level with a negative sign. The island dummy is negative and significant at 1 percent. The overall adjusted R2 is 0.44.
(SZ ))(ISL
20
Column (6) presents generalized method of moments regression results to check the robustness of results in column (3). Real exchange rate volatility ( enters significantly at 5 percent with a positive sign. The coefficient of real exchange rate volatility increases from 0.02 (using the non-instrumented variable) to 0.16 (using instrumented variable). The foreign listing variable
)VOL
( )FL is negative and significant at 1 percent. Size variable is negative and significant at 1 percent. The island dummy is negative and significant at 1 percent.
(SZ )
Column (7) presents regression results by employing tax variable ( )TAX along with real exchange rate volatility , island dummy (VOL) ( )ISL , foreign listing ( and size
independent variables. Real exchange rate volatility )
)FL
(SZ ( )VOL is positive and significant at the 10 percent level. Tax variable ( )TAX is positive and insignificant implying that corporate tax rate in destination countries does not have a major impact on Australia’s equity investment. The foreign listing variable ( )FL has the same sign and significance level as in column (5) reinforcing that Australian investors prefer the host country’s firms which alleviate information asymmetries by publicly listing in the Australian stock exchange. The size variable ( )SZ enters significantly at the 1 percent level with a negative sign. The island dummy is negative and significant at 1 percent. Column (8) presents generalized method of moments regression results to check the robustness of results in column (7). Real exchange rate volatility ( enters significantly at 5 percent with a positive sign. The coefficient of real exchange rate volatility increases from 0.02 (using the non-instrumented variable) to 0.14 (using instrumented variable). The tax variable
)VOL
( )TAX has the same coefficient and significance level as in column (7). The foreign listing variable ( )FL is negative and significant at 1 percent. The size variable ( )SZ is negative and significant at 1 percent. The coefficient of size variable ( increases from -0.45 to -0.49. The island dummy is negative and significant at 1 percent.
)SZ
In column (9), real exchange rate volatility variable ( )VOL is positive and significant at 10 percent. The distance variable ( )DIS is negative and significant at 10 percent. The size variable enters significantly at the 1 percent level with a negative sign. The foreign listing variable is negative and significant at 1 percent. The island dummy is negative and significant at 1 percent. The overall adjusted R2 is 0.45.
(SZ ))
)
)
(FL(ISL
Column (10) presents generalized method of moments regression results to check the robustness of results in column (5). Real exchange rate volatility ( enters significantly at 5 percent with a positive sign. The coefficient of real exchange rate volatility increases from 0.02 (using the non-instrumented variable) to 0.16 (using instrumented variable). The distance variable
VOL
( )DIS is negative and insignificant. Australia’s equity investment share is: US (49.22%), UK (7.64%), Netherlands (6.03%), Germany (2.83%), Canada (1.77%) and Italy (1.02%). Australia’s distance in kilometres from these countries is: US (15945), UK (16984), Netherlands (16631), Germany (16072), Canada (15809) and Italy (16211). Australia’s investment share in Asia Pacific countries is: New Zealand (0.65%), Japan (0.08%), China (0.39%), Hong
21
Kong (2.55%), India (0.86%), Indonesia (0.12%), Malaysia (0.15%), Singapore (0.88%). Australia’s distance in kilometres from these countries is: New Zealand (2322), Japan (7925), China (8987), Hong Kong (7276), India (10365), Indonesia (5399), Malaysia (6524) and Singapore (6225). Australia’s disproportionate investment in some distant countries rather than its investment in nearby countries may be due to the lack of development of many financial markets in Asia including China (Mishra and Daly (2006)). The foreign listing variable ( )FL is negative and significant at 1 percent. Size variable ( is negative and significant at 1 percent. The island dummy is negative and significant at 1 percent.
)SZ
Column (11) presents regression results by employing tax variable ( )TAX along with real exchange rate volatility , island dummy (VOL) ( )ISL , foreign listing ( , size
and distance )
)FL
(SZ ( )DIS independent variables. Real exchange rate volatility , island dummy and foreign listing
( )VOL(ISL) ( )FL have the same coefficient, sign and
significance level as in column (9). The tax variable ( )TAX is positive and insignificant. Size variable is negative and significant at 1 percent. The distance variable is negative and significant at 10 percent. The island dummy is negative and significant at 1 percent.
(SZ ))
)
(DIS
Column (12) presents generalized method of moments regression results to check the robustness of results in column (11). Real exchange rate volatility enters significantly at 5 percent with a positive sign. The coefficient of real exchange rate volatility increases from 0.02 (using the non-instrumented variable) to 0.14 (using instrumented variable). The tax variable
(VOL
( )TAX is positive and insignificant implying that corporate tax rate in destination countries does not impact Australia’s equity investment. The foreign listing variable ( )FL and size variable ( )SZ are negative and significant at 1 percent. The distance variable ( )DIS becomes insignificant reinforcing Mishra and Daly’s (2006) finding that Australia disproportionately invests in some distant countries rather than in nearby countries. The island dummy is negative and significant at 1 percent. Overall, results of Table 4 suggest that real exchange rate volatility is a potential driver of Australia’s equity home bias in presence of various control variables: foreign listing, size, trade, distance, covariance and island dummy. The point estimates and significance of exchange rate volatility increase in generalised method of moments robustness tests as compared to using non-instrumented variable, reinforcing that real exchange rate volatility is a potential driver of Australia’s equity home bias.
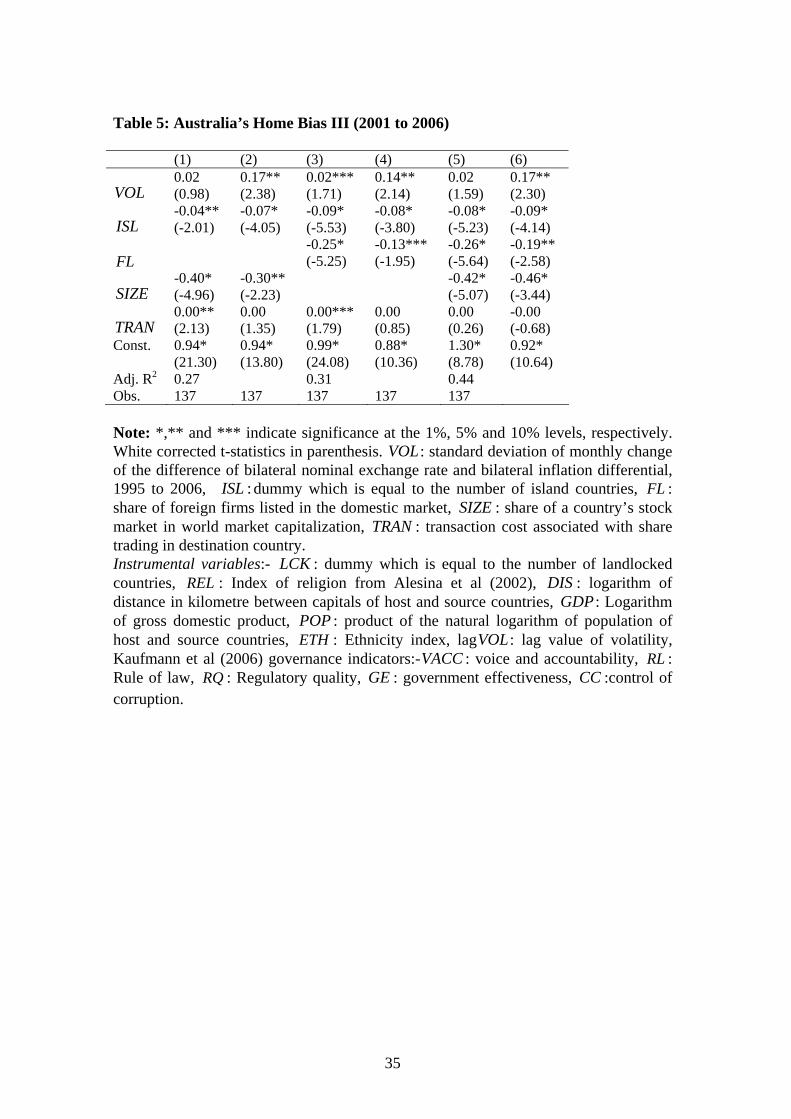
[TABLE 5] In column (1), real exchange rate volatility variable ( )VOL is positive but insignificant. The transaction cost variable ( )TRAN is positive and significant at 5 percent. However, is economically insignificant. Mishra (2008) states that transaction costs do not impact Australia’s equity home bias. The size variable enters significantly at the 1 percent level with a negative sign. The island dummy is negative and significant at 1 percent. The overall adjusted R2 is 0.27.
TRAN(SZ )
( )ISL
22
Column (2) presents generalized method of moments regression results to check the robustness of results in column (1). Real exchange rate volatility ( enters significantly at 5 percent with a positive sign. The coefficient of real exchange rate volatility increases from 0.02 (using the non-instrumented variable) to 0.17 (using instrumented variable). The transaction cost variable
)VOL
( )TRAN is positive; but insignificant. Size variable is negative and significant at 5 percent. The island dummy is negative and significant at 1 percent.
(SZ )
In column (3), real exchange rate volatility variable ( )VOL is positive and significant at 10 percent. The foreign listing ( )FL is negative and significant at 1 percent, implying that the greater the share of foreign firms listed in the domestic market, the greater the visibility of foreign firms by local investors and the greater the access of foreign equities by local investors. The transaction cost variable ( )TRAN is positive and significant at 10 percent. However, TRAN is economically insignificant. The size variable enters significantly at the 1 percent level with a negative sign. The island dummy is negative and significant at 1 percent. The overall adjusted R2 is 0.31.
(SZ ))
)
(ISL Column (4) presents generalized method of moments regression results to check the robustness of results in column (3). Real exchange rate volatility ( enters significantly at 5 percent with a positive sign. The coefficient of real exchange rate volatility increases from 0.02 (using the non-instrumented variable) to 0.14 (using instrumented variable). The foreign listing
VOL
( )FL is negative and significant at 10 percent. The transaction cost variable ( )TRAN is positive; but insignificant. The island dummy is negative and significant at 1 percent. In column (5), real exchange rate volatility variable ( )VOL is positive but insignificant. The foreign listing ( )FL is negative and significant at 1 percent. The transaction cost variable is positive but insignificant. The size variable ( enters significantly at the 1 percent level with a negative sign. The island dummy is negative and significant at 1 percent. The overall adjusted R2 is 0.44.
(TRAN ) )
)
SZ( )ISL
Column (6) presents generalized method of moments regression results to check the robustness of results in column (5). Real exchange rate volatility ( enters significantly at 5 percent with a positive sign. The coefficient of real exchange rate volatility increases from 0.02 (using the non-instrumented variable) to 0.17 (using instrumented variable). The foreign listing
VOL
( )FL is negative and significant at 1 percent. The transaction cost variable ( )TRAN changes sign from positive (column 5) to negative (column 6) and is insignificant. The size variable ( )SZ enters significantly at the 1 percent level with a negative sign. The island dummy ( )ISL is negative and significant at 1 percent. Overall, results of Table 5 suggest that real exchange rate volatility has a significant effect on equity home bias, in presence of various control variables: foreign listing, size, transaction cost and island dummy. The point estimates and significance of exchange rate volatility increase as compared to using non-instrumented variable,
23
suggesting that real exchange rate volatility plays a critical role in Australia’s equity home bias. 7. Conclusion The existing literature on home bias mainly focuses on different motives of investors, including explicit barriers to international investment, hedging motives, information asymmetries, behavioural biases and corporate governance. The literature related to the role of exchange rate volatility as a potential source of equity home bias is sparse. There is only one systematic study by Fidora et al. (2007) that focuses on the role of real exchange rate volatility as a driver of portfolio home bias and explains the differences in home bias across equity and bond. There is no study which focuses on the role of exchange rate volatility for single source country. The current paper contributes to the literature on exchange rate volatility and home bias by investigating the effect of real exchange rate volatility on Australia’s equity home bias by employing IMF’s high quality CPIS dataset, over the years 2001 to 2006. This paper employs a Markowitz type mean variance portfolio model and empirically tests the hypothesis that home bias increases in real exchange rate volatility, which measures the degree to which relative purchasing power parity is violated. If the change in the real exchange rate volatility equals the inflation differential, i.e. relative purchasing power parity holds, home bias is zero. Conversely, as real exchange rate volatility increases to infinity, home bias converges to unity, which implies an absence of foreign investment. The paper explores the role of exchange rate volatility as a driver of global equity home bias, for source and host country fixed effects, in the presence of gravity type control variables related to familiarity and diversification. On the empirical front, the paper conducts robustness tests (generalised method of moments) by employing instrumental variables that are standard in the financial economics literature. Results indicate that real exchange rate volatility is a potential driver of Australia’s equity home bias. The results have implications for economic policy. Exchange rate volatility introduces a macroeconomic policy dimension into international financial integration and plays an important role along with information costs, transaction costs and governance. Real exchange rate volatility should be taken into account in formulating financial integration, home bias, macroeconomic and monetary stability policy models.
24
References Adler, M., Dumas, B., 1983. International portfolio choice and corporation finance: A synthesis. Journal of Finance. 38, 925.984. Alesina A., A. Devleeschauwer, W. Easterly, S. Kurlat and R. Wacziarg, 2003, Fractionalization, Journal of Economic Growth, 8:155-194. Amadi, A., 2004. Equity Home Bias: A Disappearing Phenomenon? Job market paper. University of California, Davis, USA. Ahearne, A.G., Griever, W.L., Warnock, F.E., 2004. Information costs and home bias: an analysis of US holdings of foreign equities. Journal of International Economics. 62, 313.336. Baker, H.K, Nofsinger, J.R., Weaver, D.G., 2002. International cross-listing and visibility. Journal of Financial and Quantitative Analysis. 37(3), 495.521. Baxter, M., Jermann, U.J., 1997. The international diversification puzzle is worse than you think. American Economic Review. 87, 170.180. Baele, L., Pungulescu, C., Horst, J.T., 2007. Model uncertainty, financial market integration and the home bias puzzle. Journal of International Money and Finance. 26, 606.630. Bekaert, G., Harvey, C., 2000. Foreign speculators and emerging equity markets. Journal of Finance. 55, 565.613. Black, F., 1974. International capital market equilibrium with investment barriers. Journal of Financial Economics. 1, 337.352. Cai, F., Warnock, F.E., 2004. International diversification at home and abroad. Board of Governors International Finance Discussion Paper No. 793. Campbell, R.A., Kraussl, R., 2007. Revisiting the home bias puzzle: Downside equity risk. Journal of International Money and Finance. 26, 1239.1260. Chan, K., Covrig, V., Ng, L., 2005. What determines the Domestic Bias and Foreign Bias? Evidence from Mutual Fund Equity Allocations World wide. Journal of Finance. LX 3 (June), 1495.1534. Choe, H., Kho, B., Stulz, R.M., 2001. Do domestic investors have more valuable information about individual stocks than foreign investors?, NBER Working Paper 8073. NBER, Cambridge, MA. Cooper, I., Kaplanis, E., 1986. Costs to crossborder investment and international equity market equilibrium, in: Edwards, J., Franks, J., Mayer, C., Schaefer, S. (Eds.), Recent Developments in Corporate Finance. Cambridge University Press, Cambridge, pp. 209.240.
25
Cooper, I., Kaplanis, E., 1994. What explains the home bias in portfolio investment? Review of Financial Studies. 7, 45.60. Coval, J., Moskowitz, T., 1999. Home Bias at Home: Local Equity Preference in Domestic Portfolios. Journal of Finance. 54, 2045.2073. Coval, J., Moskowitz, T., 2001. The Geography of Investment: Informed Trading and Asset Prices. Journal of Political Economy. 109, 811.841. Dahlquist, M., Robertsson, G., 2001. Direct foreign ownership, institutional investors, and firm characteristics. Journal of Financial Economics. 59, 413.440. Dahlquist, M., Pinkowitz, L., Stulz, R., Williamson, R., 2003. Corporate Governance and Home Bias. Journal of Financial and Quantitative Analysis. 38(1), 135.157. Dvorak, T., 2005. Do domestic investors have an information advantage? Evidence from Indonesia. Journal of Finance. 60(2), 817.839. Fidora, M., Fratzscher, M., Thimann, C., 2007. Home bias in global bond and equity markets: the role of real exchange rate volatility. Journal of International Money and Finance. 26, 631.655. French, K., Poterba, J., 1991. Investor diversification and international equity markets, American Economic Review, Papers and Proceedings of the Hundred and Third Annual Meeting of the American Economic Association. 2, 222.226. Gehrig, T., 1993. An Information Based Explanation of the Domestic Bias in International Equity Investment. Scandinavian Journal of Economics. 95(1), 97.109. Gelos, R.G., Wei, S.-J., 2005. Transparency and international portfolio holdings. Journal of Finance. 60(6), 2987.3020. Grinblatt, M., Keloharju, M., 2000. The investment behaviour and performance of various investor types: a study of Finland’s unique data set. Journal of Financial Economics. 55, 43.67. Grinblatt, M., Keloharju, M., 2001. How distance, language and culture influence stockholdings and trades. Journal of Finance. 56, 1053.1073. Hasan, I., Simaan, Y., 2000. A Rational Explanation for home country bias. Journal of International Money and Finance. 19, 331.361. Hau, H., 2001. Location matters. Journal of Finance. 56, 1959.1983. Hiraki, T., Ito, A. Kuroki, F., 2003. Investor Familiarity and Home Bias: Japanese Evidence. 10: 281.300. Holland, S.B., Warnock, F.E., 2003. Firm-level access to international capital markets: evidence from Chilean equities. 4, 39.51.
26
Huberman, G., 2001. Familiarity Breeds Investment. Review of Financial Studies. 14 (3), 659.680. International Monetary Fund, 2006. Direction of Trade Statistics, IMF Washington, DC. International Monetary Fund, 2006. Portfolio Investment: Coordinated Portfolio Investment Survey (CPIS): Metadata, IMF, Washington, DC. Ivkovic, Z., Weisbenner, S., 2005. Local does as local is: information content of the geography of individual investors’ common stock investments. The Journal of Finance. LX(1), 267.306. Jeske, K., 2001. Equity home bias: Can information cost explain the puzzle? Federal Reserve Bank of Alanta Economic Review. Third Quarter, 86(3), 31.42. Kang, J.K., Stulz, R., 1997. Why is There Home Bias? An Analysis of Foreign Equity Ownership in Japan. Journal of Financial Economics. 46(1), 3.28. Karlsson, A., Norden, L., 2007. Home sweet home: Home bias and international diversification among individual investors. Journal of Banking and Finance. 31, 317.333. Karolyi, G.A., Stulz, R.M., 2003. Are financial assets priced locally or globally? in: Constantinidies, G.M., Harris, M., Stulz, R. (Eds.), The Handbook of the Economic Finance. North Holland, New York, NY, pp. 975.1020. Kaufmann D., A. Kraay, and P. Zoido-Lobaton, 2007, Governance Matters VI: Governance Indicators for 1996-2006, World Bank Policy Research Working Paper Series No. 4280. Kho, B.C., Stulz, R.M., Warnock, F.E., 2006. Financial Globalization, Governance and the Evolution of the Home Bias. NBER Working Paper 12389. Kim, W., Shang-Jin, W., 2002. Foreign Portfolio Investors Before and During a Crisis. Journal of International Economics. 56, 77.96. Lewis, K., 1999. Trying to explain home bias in equities and consumption. Journal of Economics Literature. 37(2), 571.608. La Porta, R., Lopez-de-Silanes, F., Sheifer, A., Vishny, R., 1998. Law and Finance. Journal of Political Economy. 106(6), 1113.1155. Liljeblom, E. and A. Loflund, 2005. Determinants of international portfolio investment flows to a small market: Empirical evidence. Journal of Multinational Financial Management. 15, 211-233. Lintner, J., 1965. The valuation of risky assets and the selection of risky investment in stock portfolio and capital budgets. Review of Economics and Statistics. 47, 103.124.
27
Li, S., Hamid, F., Isabel, K.Y., 2004. The Determinants of International Portfolio Holdings and Home Bias. IMF Working Paper No. WP/04/34. Lin, C.H. and S, Cheng-Yi, 2003. Fopreign ownership ion the Taiwan stock market – an empirical analysis. Journal of Multinational Financial Management. 13, 19-41. Merton, R., 1987. A simple model of capital market equilibrium with incomplete information. Journal of Finance, 42, 483.510. Mishra, A.V., 2008. Australia’s equity home bias. Australian Economic Papers. 47(1). 53.73. Mishra, A.V., 2007. International Investment Patterns: Evidence Using A New Dataset, Research In International Business And Finance. 21(2), 342.360. Mishra, A., Daly, K., 2006. Where Do Australians Invest? Australian Economic Review. 39(1), 47.59. Pesenti, P., Van Wincoop, E., 2002. Can nontradables generate substantial home bias? Journal of Money, Credit and Banking. 34, 26.50. Portes, R., Rey, H., 2005. The Determinants of Cross-Border Equity Flows. Journal of International Economics. 65(2) (March), 269.296. Portes R., H. Rey and Y. Oh., 2001. Information and Capital Flows: The Determinants of Transactions in Financial Assets, European Economic Review, 45 (May): 783.96. Rose, A.K., 2005. Which international institutions promote trade? Review of International Economics. 13(4), 682.698. Salehizadeh, M., 2003. U.S. multinationals and the home bias puzzle: an empirical analysis. Global Finance Journal. 14, 303.318. Sarkissian, S., Schill, M.J., 2004. The Overseas Listing Decision: New Evidence of Proximity Preference. The Review of Financial Studies. 17 (3), 769.809. Sharpe, W., 1964. Capital asset prices: A theory of market equilibrium under the condition of risk. Journal of Finance. 19, 425-442. Solnik, B., 1974. An equilibrium model of the international capital market. Journal of Economic Theory. 8, 500.524. Strong, N.C., Xu, X., 2003. Understanding the equity home bias: evidence from survey data. Review of Economics and Statistics. 85, 307.312. Stulz, R., 1981a. On the effects of barriers to international investment. Journal of Finance. 36, 923.934. Stulz, R., 1981b. A model of international asset pricing. Journal of Financial Economics. 9, 383.406.
28
Suh, J., 2005. Home bias among institutional investors: a study of the Economist Quarterly Portfolio Poll. Journal of the Japanese and International Economies. 19, 72.95. Tesar, L., Werner, I.M., 1995. Home bias and high turnover. Journal of International Money and Finance. 14, 467.493. Uppal, R., 1992. The economic determinants of the home country bias in investors’ portfolios: a survey. Journal of International Financial Management and Accounting 4:3, 171.189. Warnock, F., Cleaver, C., 2003. Financial centres and the geography of capital flows. International Finance. 6(1), 27.59.
29
Appendix A: Countries
2001 2002 2003 2004 2005 2006 Austria Hong Kong Denmark Finland France Germany Greece Hungary Ireland Italy Japan South Korea Malaysia Netherlands New Zealand Norway Poland Singapore South Africa Spain Sweden Switzerland UK US Canada Belgium Luxembourg
Austria Brazil Chile Czech Republic Denmark Finland France Germany Greece Hungary Ireland Italy Japan Malaysia South Africa Spain Sweden Switzerland UK US Canada Belgium Luxembourg
Austria Brazil Chile Hong Kong Czech Republic Denmark Finland France Germany Greece Hungary Ireland Italy Japan South Korea Malaysia Netherlands New Zealand Norway Singapore South Africa Spain Sweden Switzerland Thailand UK US Canada Belgium Luxembourg
Austria Chile Hong Kong Czech Republic Denmark Finland Germany Japan South Korea Malaysia Netherlands New Zealand Norway Singapore South Africa Spain Sweden Thailand UK US Canada Luxembourg
Austria Hong Kong Czech Republic Finland Germany Japan South Korea Malaysia Netherlands New Zealand Norway Singapore UK US Luxembourg
Brazil Chile Hong Kong Czech Republic Finland Germany India Italy Japan Malaysia Netherlands Norway Poland Singapore United Kingdom United States Canada Argentina Belgium Luxembourg
Note: Table includes only those countries for which CPIS data on countries equity investment in Australia and Australia’s equity investment in these countries is available.
30
Table 1: Australia’s portfolio equity investment (2006) Country
(1) Actual share in Australia’s equity portfolio
(2) Benchmark share in world float market capitalisation
(3) Actual over Benchmark
(4) ijFFHB ,
Argentina 0.002 0.557 0.003 0.996 Brazil 0.065 0.640 0.102 0.898 Belgium 0.071 1.076 0.065 0.934 Chile 0.002 0.103 0.019 0.980 Canada 0.335 1.418 0.236 0.763 Czech Republic 0.001 0.076 0.013 0.987 Finland 0.047 0.526 0.089 0.910 Germany 0.531 1.884 0.281 0.718 Hong Kong 0.479 2.563 0.187 0.813 Italy 0.192 3.859 0.049 0.950 Japan 1.598 8.978 0.177 0.822 Luxembourg 0.005 0.025 0.200 0.800 Malaysia 0.029 0.242 0.119 0.881 Netherlands 1.136 8.034 0.141 0.859 Norway 0.073 0.267 0.273 0.727 Poland 0.0008 0.183 0.0043 0.995 Singapore 0.165 0.526 0.314 0.686 UK 1.475 6.351 0.232 0.768 US 9.471 27.028 0.350 0.650 Source: Foreign equity investments from the IMF’s CPIS. (Author’s own calculation). Note: : Float adjusted home bias measure. ijFFHB ,
Note: *,** and *** indicate significance at the 1%, 5% and 10% levels, respectively. White corrected t-statistics in parenthesis. : Float adjusted home bias measure,
: standard deviation of monthly change of the difference of bilateral nominal exchange rate and bilateral inflation differential, 1995 to 2006, dummy which is equal to the number of island countries, COV : Covariance of monthly returns between source country and destination country, : share of a country’s stock market in world market capitalization, dummy which is equal to 1 if host and source country share common language, otherwise it is zero, dummy which is equal to 1 if host and source country share common legal origin, otherwise it is zero, TRD : Trade is the average of imports and exports normalised by the destination country’s GDP,
: share of foreign firms listed in the domestic market, : logarithm of distance between countries, TRAN : transaction cost associated with share trading in destination country, TAX : corporate tax rate of destination country.
Note: *,** and *** indicate significance at the 1%, 5% and 10% levels, respectively. White corrected t-statistics in parenthesis. VOL: standard deviation of monthly change of the difference of bilateral nominal exchange rate and bilateral inflation differential, 1995 to 2006, dummy which is equal to the number of island countries, : Covariance of monthly returns between source country and destination country, : share of a country’s stock market in world market capitalization, dummy which is equal to 1 if host and source country share common language, otherwise it is zero,
dummy which is equal to 1 if host and source country share common legal origin, otherwise it is zero, TAX : corporate tax rate from KPMG’s corporate tax rate survey.
:ISL COVSIZE
:LAN
:LO
Instrumental variables:- : dummy which is equal to the number of landlocked countries,
LCKREL : Index of religion from Alesina et al (2002), : logarithm of
distance in kilometre between capitals of host and source countries, : Logarithm of gross domestic product, : product of the natural logarithm of population of host and source countries,
DISGDP
POPETH : Ethnicity index, lagVOL: lag value of volatility,
Kaufmann et al (2006) governance indicators:-VACC : voice and accountability, RL : Rule of law, : Regulatory quality, GE : government effectiveness, CC :control of corruption.
Note: *,** and *** indicate significance at the 1%, 5% and 10% levels, respectively. White corrected t-statistics in parenthesis. VOL: standard deviation of monthly change of the difference of bilateral nominal exchange rate and bilateral inflation differential, 1995 to 2006, dummy which is equal to the number of island countries, : Covariance of monthly returns between source country and destination country, : share of foreign firms listed in the domestic market, : share of a country’s stock market in world market capitalization, TRD : Trade is the average of imports and exports normalised by the destination country’s GDP, TAX : corporate tax rate from KPMG’s corporate tax rate survey.
:ISL COVFL
SIZE
Instrumental variables:- : dummy which is equal to the number of landlocked countries,
LCKREL : Index of religion from Alesina et al (2002), : logarithm of
distance in kilometre between capitals of host and source countries, : Logarithm of gross domestic product, : product of the natural logarithm of population of host and source countries,
DISGDP
POPETH : Ethnicity index, lagVOL: lag value of volatility,
Kaufmann et al (2006) governance indicators:-VACC : voice and accountability, RL : Rule of law, : Regulatory quality, GE : government effectiveness, CC :control of corruption.
RQ
34
Table 5: Australia’s Home Bias III (2001 to 2006) (1) (2) (3) (4) (5) (6)
VOL 0.02 (0.98)
0.17** (2.38)
0.02*** (1.71)
0.14** (2.14)
0.02 (1.59)
0.17** (2.30)
ISL -0.04** (-2.01)
-0.07* (-4.05)
-0.09* (-5.53)
-0.08* (-3.80)
-0.08* (-5.23)
-0.09* (-4.14)
FL -0.25*
(-5.25) -0.13*** (-1.95)
-0.26* (-5.64)
-0.19** (-2.58)
SIZE -0.40* (-4.96)
-0.30** (-2.23)
-0.42* (-5.07)
-0.46* (-3.44)
TRAN 0.00** (2.13)
0.00 (1.35)
0.00*** (1.79)
0.00 (0.85)
0.00 (0.26)
-0.00 (-0.68)
Const. 0.94* (21.30)
0.94* (13.80)
0.99* (24.08)
0.88* (10.36)
1.30* (8.78)
0.92* (10.64)
Adj. R2 0.27 0.31 0.44 Obs. 137 137 137 137 137
Note: *,** and *** indicate significance at the 1%, 5% and 10% levels, respectively. White corrected t-statistics in parenthesis. VOL: standard deviation of monthly change of the difference of bilateral nominal exchange rate and bilateral inflation differential, 1995 to 2006, dummy which is equal to the number of island countries, : share of foreign firms listed in the domestic market, : share of a country’s stock market in world market capitalization, TRAN : transaction cost associated with share trading in destination country.
:ISL FLSIZE
Instrumental variables:- : dummy which is equal to the number of landlocked countries,
LCKREL : Index of religion from Alesina et al (2002), : logarithm of
distance in kilometre between capitals of host and source countries, : Logarithm of gross domestic product, : product of the natural logarithm of population of host and source countries,
DISGDP
POPETH : Ethnicity index, lagVOL: lag value of volatility,
Kaufmann et al (2006) governance indicators:-VACC : voice and accountability, RL : Rule of law, : Regulatory quality, GE : government effectiveness, CC :control of corruption.