ANL-7469 Reactor Technology ARGONNE NATIONAL LABORATORY 9700 South Cass Avenue Argonne, Illinois 60439 SURVEY AND STATUS REPORT ON APPLICATION OF ACOUSTIC-BOILING-DETECTION TECHNIQUES TO LIQUID-METAL-COOLED REACTORS by T. T. Anderson, T. P. Mulcahey Engineering and Technology Division and C.Hsu Reactor Analysis and Safety Division -IEGAI NOTICE This report was prepared as an account of work sponsored by the United States Government. Neither the United States nor the United States Atomic Energy Commission, nor any of their employees, nor any of their contractor), subcontractors, or theit employees, nukes any warranty, express or implied, or assumes any legal liability or responsibility for the accuracy, com- pleteness or usefulness of any information, apparatus, product or process disclosed, or represents that its use would not infringe privately owned rights. April 1970 OF TH.S ..OWfMBNT IS UNLIMITED
Transcript
ANL-7469Reactor Technology
ARGONNE NATIONAL LABORATORY9700 South Cass AvenueArgonne, Illinois 60439
SURVEY AND STATUS REPORT ON APPLICATION OFACOUSTIC-BOILING-DETECTION TECHNIQUES
TO LIQUID-METAL-COOLED REACTORS
by
T. T. Anderson, T. P. MulcaheyEngineering and Technology Division
and
C.HsuReactor Analysis and Safety Division
- I E G A I N O T I C EThis report was prepared as an account of worksponsored by the United States Government. Neitherthe United States nor the United States Atomic EnergyCommission, nor any of their employees, nor any oftheir contractor), subcontractors, or theit employees,nukes any warranty, express or implied, or assumes anylegal liability or responsibility for the accuracy, com-pleteness or usefulness of any information, apparatus,product or process disclosed, or represents that its usewould not infringe privately owned rights.
April 1970
OF T H . S ..OWfMBNT IS UNLIMITED
h
ir1 • i
TABLE OF CONTENTS
NOMENCLATURE iv
ABSTRACT 1
I. INTRODUCTION 1
II. PHENOMENA ASSOCIATED WITH ACOUSTIC DETECTION OF BOILING 1
A. SUMMARY OF BOILING-DETECTION EFFORT 1B. BUBBLE DYNAMICS AND BOILING SOUND SPECTRA 2C. GEOMETRY AND BOILING SOUND SPECTRA 3D. SOUND INTENSITY FROM BOILING 4E. ASSOCIATED PROBLEMS 5F. APPLICATIONS OF BOILING DETECTION TO NUCLEAR REACTORS 5
III. ACOUSTIC-BOILING-DETECTION TECHNIQUES 6
A. DETECTION 61. Use of Hydrophones 62. Use of Accekrometers 83. Other Techniques 8
B. HIGH-TEMPERATURE PIEZOELECTRIC BOILING DETECTOR . ; 8C. CALIBRATION OF THE ACOUSTIC BOILING DETECTOR 9
IV. CONCLUSIONS 10
REFERENCES 10
LIST OF FIGURES
1. Comparison of Boiling-water Sound Spectra in Large and Small Geometries , 3
2. Influence of Geometry on Boiling Sound Spectra 4
3. Sound Spectra from Boiling Sodium 4
4. Boiling-water Sound Spectrum in a Glass Carboy 5
5. Sound Intensity versus Heat Flux and Wall-fluid Temperature Difference for Boiling Water 5
6. Sound Intensity versus Heat Flux and Wall-fluid Temperature Difference for Boiling Methanol 5
7. Boiling-water Sound Spectra in the Oak Ridge Research Reactor 6
8. Boiling-water Sound Spectra in Support of the STR Program 6
9. Boiling-NaK Sound Spectra in the DFR 4-in. Loop 6
LIST OF TABLES
I. Acoustic Impedances of Structural Materials and Coolants 3
II. Comparison of Sound-detection Techniques 7
III. Properties of Piezoelectric Materials Useful above 200°C 9
iii
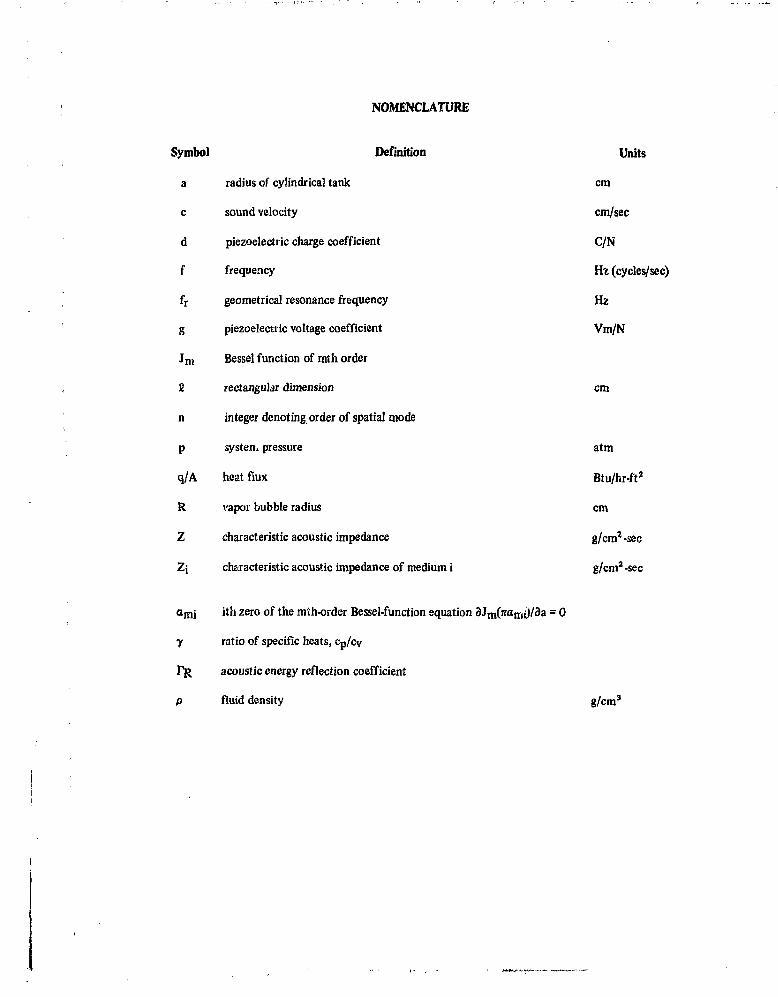
NOMENCLATURE
Symbol Definition Units
a radius of cylindrical tank
c sound velocity
d piezoelectric charge coefficient
f frequency
fr geometrical resonance frequency
g piezoelectric voltage coefficient
J m Bessel function of mth order
fi rectangular dimension
n integer denoting order of spatial mode
p system pressure
q/A heat flux
R vapor bubble radius
Z characteristic acoustic impedance
Zj characteristic acoustic impedance of medium i
ith zero of the mih-order Bessel-function equation dJmOrami)/da = 0
ratio of specific heats, cp/cy
acoustic energy reflection coefficient
fluid density g/cm3
cm
cm/sec
C/N
Hi (cycles/sec)
Hz
Vm/N
cm
atm
Btu/hr-ft2
cm
g/cm2-sec
g/cm2-sec
SURVEY AND STATUS REPORT ON APPLICATION OFACOUSTIC-BOILING-DETECTION TECHNIQUES
TO LIQUID-METAL-COOLED REACTORS
by
T. T. Anderson, T. P. Mulcahey,and C. Hsu
ABSTRACT
Boiling in the core of Liquid Metal Fast Breeder Reactors can be detected by either oftwo principal methods, acoustic or neutron monitoring. This report summarizes literaturethrough June 1967 concerning acoustic methods. In the acoustic monitoring method forboiling detection, either acoustic waveguides or high-temperature acoustic sensors arerecommended.
I. INTRODUCTION
Sodium boiling in future Liquid Metal Fast BreederReactor (LMFBR) cores may be hazardous for two prin-cipal reasons. The first is the present limitations on coreand structural materials. For example, the effect ofsodium-vapor blank;ting on heat-transfer characteristics issuch that material temperatures may exceed their yieldpoints and incur severe damage to the core. The secondreason, although not applicable to all core configurationsunder study in the LMFBR program, is that the presence ofvoids in the coolant will result in a positive reactivity, witha resultant increase in power. This increase in power willaggravate the situation by forming more vapor, thus givingrise to a positive-feedback effect. For these reasons, allLMFBR's need a safety device that will initiate an alarmand/or corrective action at the first trace of coolant boilingduring operation. If uncorrected, vapor generation wouldcause partial or complete core destruction.
There is a third reason for having a boiling detector onan LMFBR. For example, should an incident occur inwhich a reactor scram has been initiated but not yet carriedout, the changing flow, power, and heat-transfer conditionsmay result in some uncertainty as to possible damage to thecore. A boiling detector may provide some indication of apotential fuel meltdown.
There are various techniques for detecting boiling in anuclear reactor. Of these, the two most promising are:(1) the acoustic detection technique, in which the sonic andultrasonic noises generated in the core are monitored; and(2) the neutron-flux detection technique in which boiling-induced fluctuations in the neutron-flux spectrum aremonitored. This status report covers the development andperfection of the acoustic technique.
II. PHENOMENA ASSOCIATED WITH ACOUSTIC DETECTION OF BOILING
A. SUMMARY OF BOILING-DETECTION EFFORT
Since 5965, <, number of unclassified reports have beenpublished on acoustic boiling detection as applied tothermal- and fist-reactor systems. By far, the majorityoriginated in the United Kingdom, reflecting the effortdevoted to the detection of sodium boiling in theirPrototype Fast Reactor (PFR), which is under con-struction. On the other hand, reports from two instal-lations [1,2] in the United States indicate that pump noisewould completely obscure any boiling noise for theparticular conditions in water-cooled reactors. The British,too, are concerned about pump noise, as reflected in areport on sodium-pump cavitation [3] . If the problem o f
pump noise is not too severe, Saxe [4] indicates that theacoustic technique may be more sensitive than neutronmethods, which involve spatial averages and time inte-gration of the void reactivity [S].
The various advantages and problems associated withacoustic boiling detection can be obtained directly from theliterature. However, several factors common to mostexperiments may influence the results and bias the conclu-sions. The first factor is the qualitative nature of reportingsound intensities. Most investigators express sound spectrain terms of intensities relative either to a voltage levei at thereceiver or to a quiescent noise level. In only one case [6]was the sound intensity of boiling expressed relative to a
mechanical energy or pressure level. Absolute sound inten-sities are useful for design criteria, for sound-measuringsystems, and for comparison of results by different investi-gators. But in all fairness to the experimenters, when anaccelerometer or contact microphone is placed on a vesselwall or on an acoustic waveguide, the equivalent sound-pressure amplitude can be determined oniy by a ratherinvolved calibration process, using secondary sound-standard transmitters and receivers for that geometry.
The second factor is that most of the spectra reportedare limited to 20 kHz or less by the electronic equipment,by the transducer system, or by both. Higher-frequencycomponents obtained with broad-response detectors maybe a factor of 10 or 100 (20 or 40 UB) below thelow-frequency components, but are much less susceptibleto mechanical noise (other than bearing chatter or gasleaks) and hence may be of more use than the lower-frequency components.
The third factor is the difficulty in comparing the resultsof different investigations cited. Most investigators vary oneor two parameters of many, using different measurementtechniques; therefore the general conclusions obtained fromone experiment may have only limited application to theothers.
In the following survey of the literature, various investi-gations are reported simultaneously and, whenever possible,the differing conditions and their results are comparedusing similar units on reduced-size plots. The units werechosen to make the plots meaningful to both heat-transferspecialists and sound specialists. For example, for soundintensity versus heat flux, the sound intensity is plotted indecibels (dB), where -20 dB is a factor of 10 in pressure orvoltage below the reference level of 0 dB (or unity gainfactor), and -40 dB is a factor of 100 below the referencelevel. For spectra, unless absolute mechanical units werefurnished for sound pressure, the decibel scales have beenreplotted, using zero decibels (0 dB) for the peak ampli-tudes. Heat flux per unit area of heater surface is expressedin conventional units of Btu/hr-ft2; this quantity can beconverted to W/cm2 by multiplying by 3.14 X 10~4.
B. BUBBLE DYNAMICS AND SOILINGSOUND SPECTRA
The earliest investigations of bubble dynamics were byRayleigh [7] and Minnaert [S]. Rayleigh considered thecollapse of a captation bubble and estimated both thecollapse time and the extremely high shock pressuregenerated at the bubble interface. He presented a simplifiedversion of the analysis by Besant by equating the kineticenergy of the collapsing bubble to the work necessary tocollapse it.
Osborne [9] of the U.S. Navy Underwater SoundLaboratory, New London, reported that his measurementsin water agreed with Rayleigh's prediction of collapse time,but that the bubble "rebounded" several times with aperiod approximately double the collapse time. In addition,there were high-frequency components. This would corre-spond roughly to a frequency of bubble appearance timesbubble radius of
fR = 5(p atm/p g/cm 3) I / 2 kRz-mm.
Hence for a bubble radius of 1 mm in water at atmosphericpressure, the rebound frequency would be 5 kHz (kilo-cycles per second).
Minnaert [8] treated a somewhat different problem: thevolume oscillation of a gas bubble in. water. He equatedkinetic energy to the potential energy of adiabatic volumechange and obtained the expression
fR = T L
where p is the system pressure, p is the density of theliquid, and y is the ratio of specific heats. Substitution ofvalues of subcooled water at 1 atm yields fR =3.28 kHz-mm.
More recent investigators have considered the growthrate of bubbles in superheated liquid [10-12]. We will notdiscuss these papers here, but, in general, they evidence theprogress in a closely related area. Bree [13] at Risley hasperformed an analysis of bubble oscillations, taking intoaccount the conduction of heat across the boundary of thebubble. His predictions are plotted as power-spectral-density curves, which for vrater have maxima given approxi-mately by fR = 2.5 kHz-mm. For sodium, the plots showthe influence of conductivity in that medium, where themaxima are given by fR = 0.3 kHz-mm. Apparently,subsequent investigators in the U.K. have not compared histheoretical predictions with their measurements.
The best comparisons to the above predictions of bubbleresonances would be measurements in which effects ofgeometry are minimized. For example, boiling soundspectra in large bodies of water would be acceptable. Thethree references indicated in Fig. 1 give experimentalresults, all for boiling in rivers or a reservoir and for boilingin containers. There is a broad maximum for each infinitemedium. The figure from Osbcrne [14] shows u peak at5 kHz; he reports bubble radii ranging from 0.02 to0.5 mm. Walton's [15] curve peaks at 1,8 kite, whereasthat of MacLeod [16] shows a broad maximum from 0.9 to3 kHz. Hence there is agreement within a factor of two .;,
I N a»
I"8-a
resonances within a finite container. The wall-liquid andgas-liquid interfaces reflect sound waves and sustain afrequency component whose haif-waveiength is an integermultiple of a rectangular length. The fraction of the soundreflected from a boundary can be determined by a"characteristic acoustic impedance," which is simply theproduct of density p and sound velocity c; or algebraicallystated,
MLTON(OCT.IK3)
mt
100 200FREQUENCY, Hz
500 IK 2K 5K 10K 20K
BOILING IN A
i i l l
/
BOIUNGINATANK _44 X 24 X 15.5 cm
I 1 I
MACLEOD (1966)
FREQUENCY, HZ100 200 500 IK 2K 5K 10K 20K 50K
15
PAPER CUPOPEN WATER
*HEATFLUX,10*BTU/hrft2
I I i i i
OSBORNE(1947)
Fig. 1. Comparison of Boiling-water Sound Spectiain Large and Small Geometries
From the development by Babikov [19], the fraction ofsound energy reflected back into mediu»i 1 after strikingmedium 2 is given by
Table I lists the acoustic impedances for various mate-rials found in water- and sodii»;n-cooled reactors [20,21].The table indicates that structural members will reflect 90%or more of the incident energy back into the coolant.
The frequency of a resonance can be obtained asfollows: For a rectangular container of dimensionsS, X 8j X £3 at the rigid wall, the sound pressure wouldhave a maximum value and the sound velocity would bezero. For these boundary conditions, Beranek [22] givesresonance frequencies in terms of integers n,, n2, and n3 as
where c is the velocity of sound within the container. For along container, only one dimension is dominant to producethe familiar equation for the closed organ pipe,
between these references, and also general agreementbetween experiment and the three predictions.
Another area of investigation in underwater acoustics isthe problem of cavitation noise. Similarities to boilingnoise, especially at high subcociing, can be seen in thepapers by Harrison [17] and Mellen [18]. Actually, cavi-tation is a type of boiling characterized by a sudden changein pressure energy, rather than by a change in thermalenergy.
C GEOMETR Y AND BOILING SOUND SPECTRA
One difficulty in predicting when boiling noise is beinggenerated, as compared to any other source of noise (saythe random white noise), is the excitation of acoustic
en
MacLeod [16] has experimentally verified these tank reso-nances, as shown in Figs. 2b and ?,c. The organ-piperesonance should occur in a subassernbly with walls, asdemonstrated by Walton [15] and plotted in Fig. 2a. Thusgeometrical resonances can play an important part in
TABLE I. Acoustic Impedances if StructuralMaterials and Coolants
MaterialVelocity of Sound (c),
10 s cm/secChurusCeristit; Acoustic
Impedance, I06g/cm2-sec
SodiumNickelSteelWater (20'C)
2.4204.785S.790l.S
0.31314.954.560.15
100 200FREQUENCY, Hi
IK 2K
10t 200
(I) MlTWHOCT.Htt)
FREQUENCY. Hi500 IK 2S !0K 201!
-SO | _
-30
•40
1 1 I
54w-^/
™ 4 2 * / i
_ RECTANGULAR TANK //HO X t l X HEIGHT (ca) tf
jPf\rsJ.If \
f
i 1
1
V ^ —
1
100 200
W MACLEOD (HM)
FREQUENCY, H iSOD IK 2K SK 10K 20K
I I ImiTEHOISE,23.Sei«~
_ RECTANGULAR TANK
•10
5-20
(C) MACLEOD(1*4)
Fig. 2. Influence of Geometry on Boiling Sound Spectra
determining magnitudes and frequencies of any detectedboiling spectrum. Walton demonstrates that in the audiorange to 20 kHz, the spectrum of white noise (i.e., purelyrandom fluctuations over the complete frequency range) ismodified by geometry to be indistinguishable from theoriginal boiling noise. This result shows there can be adefinite limitation of acoustic boiling detection, withrespect to obtaining a sufficient signal-to-noise ratio.Similar results are shown (Fig. 3) by Randall and Logan fora boiling sodium loop [23].
To complete the discussion on geometrical resonances,we should include the resonance-frequency formula [24]for a right circular cylinder of radius a and length K, whichis the more common configuration for a liquid-filled reactortank. For the rigid wall, in terms of zeros of the derivativeof Bessel functions, dJm(irarnj)/da = 0, the resonancefrequency is
The lowest zeros are a , 0
a 0 l = 1.2197.0.5861, 020 = 0.9722, and
Thus far, we have shown that acoustic boiling sound is abroad-band noise, with most of the sound occurring in theaudible range of frequencies. Resonance peaks of thespectrum for infinite media apparently are related tobubble size, whereas the acoustic spectral peaks for finitemedia are definitely determined by geometrical resonances.
D. SOUND INTENSITY FROM BOILING
In this section, the heat-transfer process will be ex-amined in relation to sound production in an attempt tolink thermal-energy considerations to the previous mechan-ical considerations.
Sound production from boiling could be a useful tool tothe heat-transfer specialist in determining the transitionfrom nucleate 10 film boiling; two investigations have beenmade involving this technique.
Schwartz and Siler [25] measured sounds emitted bythe boiling of water from the outside surface of an0.093-in.-diam, electrically heated tube. The tube wasimmersed in a water-filled glass carboy of about a 1-ftdiameter. Most of the spectrum (Fig. 4) lies below l'kHz,which is somewhat low compared to U.K. investigators orOsborne (Fig. 1); their results show increasing sound levelwith heat flux. A double point of heat flux or sound versuswall temperature occurs. Thus the sound curve (Fig. 5) hasthe same form as the familiar Nikuradse heat-transfer curve.
Data by James [26] and by Osborne and Holland [6] ,when plotted to a similar scale, refute the increasing soundlevel in the film-boiling region. The information by Jamesmentions only a vertical pin in water and gives nodimensions or temperatures. Osborne and Holland plotabsolute sound-pressure level, but give heat flux in terms of
i n 200FREQUENCY, Hz
500 IK 2K SK 10X 20K
5 -a-20
i,•«
1 1
1 1
A 'A
A A\A / '
i i80U,ING SIGNAL
V BACXGfiOUNO —
RANDALL A « LOGAH (MARCH 1, I N I )
Fig. 3. Sound Spectra from Boiling Sodium
a » m m m iK 2K * m m
SCfflUMTZ AM) SIIER (NOV. 13(5)
Fig. 4. Boiling-water Sound Spectrum in a Glass Carboy
Fit. 5. Sound Intensity versus Heat Flux and Wall-fluidTemperature Difference for Boiling Water
heater power for their tests of small horizontal wires inriver water av 5°C. However, for 3/4-in. through 3-in.lengths and 22AWG through 30AWG wire sizes, thevarious curves of sound intensity versus power nearlycoincide when plotted against heat flux. The curve shown(Fig. 5) is for a l-l/2-in.-long, 28 AWG wire. Osborne [14Jshows the double-valued nature of nucleate and film boilingthrough resistance curves of the "cold" or "red-hot" wire.Westwater, Lowery, andPramuk [27] demonstrate that forboiling methanol (Fig. 6) the sound spectrum is a single-valued function of the wall-to-fluid temperature difference,,which is contrary to the results reported for water. Only inthe nucleate-boiling region do all four references agree.Hence it appears reasonable to conclude that for nucleate-boiling heat transfer, the sound level of the boiling increaseswith heat flux.
E. ASSOCIATED PROBLEMS
An associated problem of acoustic boiling noise is thecoupling of mechanical resonance of the boiling hydro-dynamics to a resonance in thermal transport and heattransfer. Some studies, including those of combustioninstability and pulsating flow [28], have proposed mechan-ical models of the phenomena. The conditions are similar tosome of those reported rather early by Goldman [29] andlater by Firstenberg [30].
F. APPLICATIONS OF BOILING DETECTION TONUCLEAR REACTORS
Two applications of acoustic boiling detection to water-cooled reactors were unsuccessful; pump noise masked theboiling signal. According to Colomb and Binford [1] , pumpnoise at their hydrophone exceeded by 10 dB the boilingsignal from the Oak Ridge Research Reactor (Fig. 7).Hogan and Boyd [2] , in a Bettis-KAPL collaboration,performed tests and came to the same conclusion, but didnot publish data in support of their findings. Both groupshave since relied upon ion chambers for detectingboiling [31]. However, in early work by Boyd andCummerow [32], feasibility of measuring boiling soundwas demonstrated in a water loop, as shown in Fig. 8.
0 40 80 129 ISO
HEAT FLUX, 0/K 103BTU/lsl ft*
w N U C L E W E I TBAHaTIOH I FILM BOtLIHG . „
1
SOUND-kOUTPUT
SOUND OUTPUT >.
^BOIUNG HEAT FLUX
1 1 ^ 1 °"
- U C S .
- «
060 80 100 120 140 160 180
^ T * » ' . ! . - FLUID' F
Fig. 6. Sound Intensity versus Heat Flux and Wall-fluid Temperature Difference for Boiling Methane!
100 200FREQUENCY, Hz
500 IK 2K SK 10K 20K
§-303
-50
1 1
I /— NEITHER FLOW, i
NOR BOILING \
1 1
1
1 /1
1 1 1k REACTOR COOLANT ~
^ K -T " i i
COLOHB AND BINFORD (1962)
Fig. 7. Boiling-water Sound Spectra in the Oak RidgeResearch Reactor
100
•10 —
200 500FREQUENCY, Hz
IK 2K 10K 20K
i
:
— ^
i
7,/ 18°C»ATERTF.HP\.f MOWTOHTR v^. X
\—~^{ I s
1
\ :
BOYfl AND CUMMEROl'i (1935)
Fig. 8. Boiling-water Sound Spectra in Support of theSTR Program
Waveguides have been successfully used by Ledwidge,Parnell, and Adam [33,34] for boiling detection in theDounreay Fast Reactor (DFR). They report as much as30-dB separation of the signal and background noise
(Fig. 9). Keep in mind, however, that the NaK-cooledreactor uses electromagnetic pumps, which are muchquieter than mechanical pumps. With the advent of largefast reactors using centrifugal pumps (including PFR),combined acoustical flow noise of the pump-coolantinteraction may be detrimental to the capability foracoustically detecting boiling.
100 200 500
1 1 -— SOILING SIGNAL'
~ BWSXGROUNO ^
1 1
FREQUENCY, Hi
IK^ ^ f
S ^
- ,
1 1
SK I K j i
—
—
! 1
200
LEOflDGE, PARNEI.L, AND ADAM (SEPT. IMS)
FREQUENCY, H i500 IK
ADHD AHD LEOIIDGE EXP. NO. 2 (AUG. DM)
Fig. 9. Boiling-NaK Sound Spectra in the D F R 4-in. Loop
HI. ACOUSTIC-BOILING-DETECTION TECHNIQUES
A. DETECTION
Boiling in a liquid can be detected acoustically indifferent ways, since bubble formation and motion in theliquid generate sound waves, and the sound waves, in turn,cau&. disturbances in the liquid. In principle, a sound wavepassing through a point in the liquid will cause variations inpressure, velocity and liquid density. Pressure variations canbe measured by deflection or compression of a solid bodyimmersed in the liquid; velocity variations by the measure-ment of the changes in the heat-transfer coefficient of anelectrically heated film on a probe; and density variationsby measuring the bending of light beams in opticallytransparent liquids. These variations can be directly relatedto the characteristics of the sound waves and, in turn, toboiling in the liquid. Similarly, a sound wave impinging on asolid induces vibration of the solid; this vibration can bemeasured by the resulting displacement, velocity, or accel-eration of the surface. The measurements also can berelated to boiling in the liquid.
These methods rely upon the sound waves internallygenerated by the boiling. However, externally introducedsound waves also can be used to detect the presence ofboiling, since the gas bubble changes the sound-transmissionproperties of the liquid. In this instance, the intensity ofthe sound waves measured after they travel through themedium is compared to that of the input sound waves.
Two of the above methods are directly applicable toacoustic detection of boiling in liquid-metal cooled nuclearreactors: (1) detection of pressure variations in the liquid,and (2) detection of vibrations of solids.
1. Use of Hydrophones
Sound-wave-induced pressure variations are detectedthrough the use of a pressure transducer. A specific type ofpressure transducer, termed a hydrophone in underwateracoustics [21], is used in the general liquid-boilingdetection work for the following reasons:
(1) A hydrophone has an acoustic impedance equal tothat of the liquid; thus maximum sound energy can betransferred from the liquid to the transducer. This enablesone to use the maximum sensitivity of the transducer.
(2) A hydrophone could have a frequency bandwidthranging from a few kHz up to 15 MHz. This enables thetransducer to detect the boiling sound waves that extend to60 kHz.
Table II summarizes the work on application ofhydrophone transducers to acoustic boiling detec-tion. More recent work on a boiling detector forthe ATR reactor has been presented in a prelimi-nary report by Clayton and Morrison [35]. In thisapplication, they are using the lead zirconate-titanatecomposition PZT 5a, with a Curie temperature of365°C, in a hydrophone transducer of their owndesign.
TABLE II. Comparison of Soun d-detection Techniques
Source Technique Frequency Response Electronics and Comments
Cfeborne and Holland |6)
Wettwater, Lowery ind Pramtik [27)
Schwartz and Silerl 251
Hefanand Boyd | 2 |
Walton | IS)
MacLeod 61
Ledwidge, Parnell, and Adam (33)
Adam and Ledwidge (34|
Colomb *nd Binford 111
Boyd and Cummerow |32)
Hydrophone(crystal)
Crystalmicrophoneoutside heater
"Hydrophone"microphone inthe balloon
Accelerometer,hydrophone withsilicon rubbersheath
Hydrophone; flat to40 kHz
25-7500 Hz
20 Hz to 20 kHzon analyzer
Hydrophone;unknownresponse
(1) Heterodyne analyzer, 8-50 kHz.
(2) Sound analyzer, 200 Hz to 10 kHz.
(3) High-pass filter and Ballantinemeter.
Sound-level meter.
Tape recording.
(1) Band-pass analyzer, 0.5-200 kHz.
(2) Tape recorder, 30 Hz to 20 kHz.
(3) Heterodyne listening unit near20 kHz (could not detect boilingnoise).
No description of experimental equipment
Lead zirconate asbarium titanatecrystal in uhydrophone-typetransducer
(1) Tape recording of signalsdefinitely showed boiling easilydetected.
(2) Analyzed spectrum vv« verynoisy, perhaps due parti; to methodof analysis as wcM as to spasmodicsignals.
(1) On-line spectrum.
(2) Tape recording.
( l ' | Hewlett-Packard wave analyzer
Pressuretransducer;temperaturelimited to 60'C
50 Hz to 50 kHz
(most likely 20 Kz to 20 kHz).
(2) Very narrow spectrum observed.
(3) Pump noise much in excess ofboiling noise.
(1) Wave analyzer, 20 Hz to 20 kHz.
(2) Boiling near saturation temperatureat atmospheric pressure.
(3) Spectra erratic.
2. Use of Accelerometers
Sound-wave-induced vibrations in solids are used to de-- tect boiling by inserting a rod into the liquid and measuring
.vibration at the end, or by mounting a sensor onto theliquid-filled tank. To detect sound through solid yibration,an accelerometer is commonly used. Commercially availableaccelerometers [36,37] can produce signal levels of 4 mV/gwith a mounted resonant frequency of 125 kHz, or390mV/g with a mounted resonant frequency of 16 kHz.
To properly assess the frequency response of an acceler-ometer, one should note that the unit consists of amass-and-spring system with very low damping. This mass-spring coupling causes the response voltage to be directlyproportional to acceleration up to about one-third of themass-spring resonance frequency. Above one-third of theresonance frequency, the response voltage climbs to a peakat resonance, and then drops off quickly at higherfrequencies.
Of interest is the 27-kHz resonance accelerometer usedby Adam and Ledwidge [34]. They reported, as ofAugust 1966, placing an order for accelerometers with125-kHz mounted resonances. In the U.K., the problems ofhigh-temperature in-core detectors and lead wires have beencircumvented through the use of acoustic waveguidescoupled to a transducer. These have been described brieflyin the previous references; Redwood [38] has published acomprehensive treatise on the mathematical analysis anddesign of waveguides.
3. Other Techniques
During the investigation of hydrophones for acousticboiling detection in a nuclear reactor, several other methodsof performing the same task were encountered. Thesemethods are summarized and compared in the followingparagraphs.
The measurement of void fraction in a boiling loop byusing attenuation of sound has been proposed J39].Although this techniqus may pose extremely difficultproblems in a reactor, analysis of the attenuation of soundwaves due to the presence of bubbles may prove of somevalue in calculating change in noise leve! from a boilingsource. Since minute bubbles can reflect, refract, andattenuate sound, considerable attention has been focu^don this technique in underwater acoustics [21,40].
As an extension of the concept of injecting sound intothe liquid to detect voids, an ultrasonic generator could beused to determine the boiling threshold in a liquid. This isthe basis of work performed by DePrisco etal. [41], with a
further application reported by Kartluke, Wichner, andHoffman [42]. The technique could be used to detecttendency to boil at one point in a reactor coolant system,but it would not detect tendency to boil elsewhere in thesystem.
Since sound waves produce variations in velocity, it isconceivable to make a detector that responds to rapid,small variations of velocity. In aerodynamics, for instance, avery sensitive flow-measuring device, called a hot-wireanemometer, has been used for this purpose [43]. AtArgonne, a demonstration test was made to determine ifboiling noise in water was detectable [44]. The resultsapply to boiling from a l-l/2-in.-long, 30 AWG Nichromewire in 20°C water. When immersed in a 50-cm-diam,50-cm-deep cylindrical container, both a 100-kHz responsehydrophone and the anemometer indicated boiling spectrawith similar sound resonances, which agreed with calculatedresonance frequencies of 5, 10, and 15 kHz. For theanemometer, the signal-to-noise level ratio was only 3-to-l(10 dB) for a source-to-detector distance of 20 cm. Theanemometer was able to detect 100-kHz signals, demon-strating that frequency response can be exceptionally highfor this technique. Use of anemometers in LMFBR's isdoubtful, however, since, for the necessary acoustic sensi-tivity, the measuring element would be extremely fragile.
B. HIGH-TEMPERATURE PIEZOELECTRICBOILING DETECTOR
The method of acoustical measurement for acousticboiling detection could be based on a high-temperaturepiezoelectric hydrophone, which, unlike other types ofhydrophones, when immersed in liquid sodium will stillretain a broad frequency response and fairly highsensitivity.
Table III lists piezoelectric materials applicable for hightemperatutes. The first line gives the Curie temperature(i.e., the temperature at which piezoelectric effects disap-pear). Note that only two materials, tourmaline and lithiumniobate, are useful near 1000°F. The third line refers tocrystallographic orientation of force and charge, and allcoefficients listed below that line refer to the crystalorientation. The relative dielectric constant indicates howmuch charge capacity can be stored within a given size ofcrystal; the coupling coefficient gives a measure of thecrystal efficiency in converting one form of energy toanother (i.e., mechanical to electrical for a pickup). Thepiezoelectric charge coefficient gives the charge incoulombs per newton force applied to the crystal. Lastly,the piezoelectric voltage coefficient denotes the electricalfield (V/m) per unit stress (N/m2). The property definitionsare described more completely in Goldman [45] andFrederick [46].
TABLE III. Properties of Piezoelectric Materials Useful above 2G0'C
The choice of a piezoelectric material depends to a largeextent on the application as well as on the environment.However, several conclusions can be made on the basis ofmaterial properties. Table III shows that lead zirconate-titanate excels in nearly all areas but temperature. Then; abates and tantalates have moderate sensitivity; quartzand tourmaline have low sensitivity. For initial develop-ment of a high-temperature, high-sensitivity transducer,lithium niobate would be a logical material to use in view ofits high Curie point and moderate sensitivity.
Background material on piezoelectricity and relatedferroelectricity is available from many sources. As a basicreference, see the definitive treatises by Cady [47] andMason [48]. For specific materials, see: (!) ferroelectricbehavior of lithium tantalate by Matthias andRemeika [49]; (2) ferroelectricity of lithium niobate byNassau and Levenstein [SO]; and (3) the application tomechanical stress at radio frequencies for laser modulationby Spencer, Lenzo, and Nassau [55]- Further work alongthese lines was reported by Lenzo et al. [52].
Applications relevant ta boiling-detector requirementswere reported by Fraser and Warner [53]. They used aplate of lithium niobate crystal as a shear transducermounted on a test specimen, and measurements were takento 1050°C in an oxygen atmosphere. This material, ifincorporated into an acoustic transducer, may enablemonitoring within an LMFBR core environment.
In general, the design of any transducer requires a sourceof information on the various constants. This information isavailable for lithium niobate and lithium tantalate from thework by Warner, Onoe, and Coquin [54]; their results areincluded in Table HI.
When ferroelectrics are irradiated in a nuclear reactor,anomalous voltage pulses can occur, as reported byLefkowitz et al. [55]. Of the 80 samples exposed, 80%evidenced minor sensitivity, 5-10% major sensitivity, andthe remainder no sensitivity to radiation. Lefkowitz et al,recommended that the applications be restricted to fusesand capacitor dielectrics. However, since organic constit-uents can cause some of those ionizing effects, inorganicconstructions shouid be used in future irradiation tests.
C. CALIBRATION OF THE ACOUSTICBOILING DETECTOR
Since the measurements will extend over a broadfrequency range, the detector must be calibrated bothstatically and dynamically. Static calibration provides aprecise, absolute measurement of the low-frequency pres-sure sensitivity. To perform the calibration, a static pressureis released suddenly to produce a step change in detectorsignal. The ratio of detector output signal to pressure is thesensitivity of the detector at zero frequency. This cali-bration procedure, called the closed-tank pressure-calibration technique [56], requires a pressure vessel, ahydrostatic pump, a pressure gauge, and a quick-openingvalve.
Dynamic calibrations are necessary to determine thefrequency response of the detector to sound waves. Soundcalibrations are usually performed by the reciprocity-calibration technique [57,58]. Here, the hydrophone undertest is compared against a reversible standard hydrophone(which can either transmit or receive sound) and against asound projector. The liquid-filled container may be a longtube, a large acoustically baffled tank, or a deep pond.
IV. CONCLUSIONS
Operation and safety of future LMFBR's would beenhanced by adding to the instrumentation and controlsystems new devices for detecting boiling sodium -vithin thecore region. Acoustic methods can oe fast and sensitive todetect boiling sodium by monitoring the mechanical energyproduced by the growth and collapse of vapor bubbles. Anacoustic-boiling-detection system is operational on theDounreay Fast Reactor in Great Britain; however, acousticboiling detection on US. water-cooled reactors has beenhampered by excessive background noise. Studies arerecommended to determine the amount of sodium boilingthat can be detected successfully in the presence ofprototype-reactor flow and pump noise.
Acwstic emissions from boiling in water systemscontain characteristic frequency spectra corresponding tobubblf-volume resonances, to container resonances, and tosmall-amplitude high-frequency components. The acousticsof boiling has a random-noise appearance, whose amplitudeincreases as the amount of boiling increases.
Technology exists for detecting boiling in a reactor byacoustic waveguides, which consist of rods or tubesextending from the core region out through vessel penetra-tions to a room-temperature environment. Thus, conven-tional vibration sensors can be attached to the upper endsof the waveguides. With the recent availability of a new,high-temperature man-made material, '.ithium niobate,acoustic sensors can be developed for immersion in reactorsodium, thus advancing still further the measurementcapability of in-reactor instruments.
Based on these considerations, acoustic boiling detectionis feasible in future LMFBR's, provided that boiling can bedetected acoustically at a threshold far enough belowconditions of irreversible overheating. Quantitative studiesare still lacking on these decisive parameters for successfulapplication of acoustic detection to boiling of sodiumwithin an LMFBR core.
REFERENCES
1. A. L. Colomb and F. T. Binford, The Detection ofBoiling in a Water-Cooled Nuclear Reactor, ORNL-TM-274(Aug. 17,1962).
2. J.M.Hogan and L. R. Boyd, Joint Bettis-KAPLNucleate Boiling Detection Experiment, WAPD-168(Feb 1957).
3. L. F. Bowles and D. Taylor, The Sodium Pumps forthePFR, Nucl. Eng. 12. 361-366 (May 1967).
4. R. F. Saxe, Detection of Boiling in Water-ModeratedNuclear Reactors, Nuclear Safety 7, No. 4, 452-456(Summer 1966).
5. V. Rajagopal and J. M. Gallagher, Jr., "Some Applica-tions of Dynamic (Noise) Measurements in Pressurized-Water-Reactor Nuclear Power Plants," Proi:. Int. Symp.Neutron Noise, Waves, and Pulse Propagation, Uni-versity of Florida, Gainesville, Feb. 14-16,1966,CONF-66206, p. 487.
6. M. F. M. Osborne and F. H. Holland, The AcousticalConcomitants of Cavitation and Boiling, Produced by aHot Wire (I), I. Acoust. Soc. Amer. 19, 13-20(Jan 1947).
7. Lord Rayleigh, On the Pressure Developed in a LiquidDuring the Collapse of a Spherical Cavity, Phil. Mag.J</,Ser.6,94-98(1917).
8. M. Minnaert, On Musical Air-Bubbles and the Soundsof Running Water, Phil. Mag. XVI, Ser. 7, 235-248(1933).
9. M. F. M. Osborne, The Shock Produced by a CollapsingCavity in Water, Trans. Amer. Soc. Mech. Eng. 69,No. 3,253-266 (April 1947).
10. M. S. Plesset, The Dynamics of Cavitation Bubbles,J. Appl. Mech. 16, No. 3, 277-282 (Sept 1949).
11. M. S. Plesstt and S. A. Zwick, The Growth of VaporBubbles in Superheated Liquids, J. Appl. Phys. 25,No. 4,493-500 (April 1954).
12. H. K. Forster and N.Zuber, Growth of a Vapor Bub-ble in a Superheated Liquid, J. Appl. Phys. 25, No. 4,474-478 (April 1954).
13. J. Bree, Theoretical Investigation into the Generationof Acoustic Noise by Nucleate Boiling, TRG Report549 (May 8,1963).
10
14. M. F. M. Osborne, The Acoustical Concomitants ofGayitation and Boiling, Produced by a Hot Wire (II),J. Acoust. Soc. Amer. 19,21-29 (Jan 1947).
15. A. J.WaHon, Sonic Metltods for P.F.R. Channel Block-age Detection, TRG Report 665 (Oct. 29,1963).
16. I. D. MacLeod, Some Measurements of the AcousticSpectrum Produced by Sub-cooled Nucleate Boiling,TRG Report 1205(1966).
' 7. M. Harrison, An Experimental Study of Single BubbleCavitation Noise, J. Acoust. Soc. Amer. 24, No. 6,776-782 (Nov 1952).
18. R. H. Mellen, Ultrasonic Spectrum of Cavitation Noisein Water, J. Acoust. Soc. Amer. 26, No. 3, 356-360(May 1954).
19. 0 . i. Babikov, Ultrasonics and Its Industrial Applica-tions, Consultants Bureau, New York, N.Y., 1960.
20. S. Ying and C. C. Scott, Concepts for General-PurposeUnder-Sodium Scanning Systems, APDA-179 (Nov. 8,1965).
21. V. M. Albers, Underwater Acoustics Handbook II,Pennsylvania State University Press, University Park,Pa. (1965).
22. L, L. Beranek, Acoustics, McGraw-Hill Book Co., Inc.,New York, N.Y. (1954), pp. 286-291.
23. R. L. Randall and D. Logan, "Application of Noise-analysis Techniques to Hydraulic Measurements inLiquid-metal Systems," Proceedings of the Symposiumon Liquid Metal Instrumentation and Control, IdahoFalls, Idaho, March 1-2, 1967, ANL-7380 (CONF-670314), pp. 183-188.
24. P.M.Morse, Vibration and Sound, 2nd ed., McGraw-Hill Book Co., Inc., New York, N.Y., 194P.
25. F.L.Schwartz and L.G.Siler, Correlation of SoundGeneration and Heat Transfer in Boiling, ASME Trans.,J. Heat Transfer '87, Ser. C , 436-438 (Nov. 14, !965).
26. L.C.James, Experiments on Noise as an Aid toReactor and Plant Operation, Nucl. Eng. 10, No. 104,18-22 (Jan 1965).
27. J. W. Westwater, A.J . Lowery, and F. S. Pramuk,Sound of Boiling, Science 122 (3164), 332-333(1955).
28. P. D. Richardson, Effects of Sound and Vibrations onHeat Transfer, Appl. Mech. Rev. 20, No. 3, 201-217(March 1967).
29. K. Goldmann, Boiling Songs, NDA 10-68 (May 14,1953).
31. L. R. Boyd, Nucleate Boiling Detection System DesignDescription, KAPL-M-SSD-46 (Feb. 19,1957).
32. L. R. Boyd anv R. L. Cummerow, Sound Produced byNucleate Boiling, KAPL-M-LRB-1 (June 14,1955).
33. T. J. Ledwidge, K. E. Parnell, and E. R. Adam, In-PileSimulation of Nucleate Boiling Conditions in D.F.R.,TRG Memo-3068 (Sept 1965).
34. E. R. Adam and T. J. Ledwidge, Boiling Noise Investi-gation in the 4 in. Loop D.E.R.E., Experiment No. 2,TRG Memo-3481 (Aug 1966).
35. J. R. Clayton and R. G. Morrison, Acoustical Detectionof Nucleate Boiling, Abstract No. 5, Symp. Nonde-structive Testing in the Nuclear Field, Oak RidgeNational Laboratory (April 11-13,1967).
36. B & K Instruments, Inc., Copenhagen, Denmark,Instructions and Applications: Accelerometer SetsType 4316 (Nov 1966).
38. M. R. Redwood, Mechanical Waveguides, PergamonPress, New York, N.Y. (1960).
39. Heat Transfer and Stability Studies in Boiling WaterReactor, Special Technical Report No. 2: Study ofPossible Application of Acoustical Methods for Deter-mining Void Fraction in Boiling Water Reactors,EURAEC-366(Febl962).
40. G. T. Trammel, Sound Waves in Water ContainingVapor Bubbles, J.Appl. Phys. 33, No. 5, 1662-1670(May 1962).
41. C. F. DePrisco et at., Ultrasonic Instrumentation inNuclear Applications: I. Ultrasonic Detection of Incipi-ent Boiling and Cavitation, NYO-10010 (March 1962).
11
42. H. Kartluke, R. P. Wichner, and H. W. Hoffman, AnAcoustic Instrument for Measuring Subccoling in Boil-ing Systems, ORNL-P-1678 (Sept 196S).
43. C.G. Rasmussen, The Air Jet Hot-Wire Microphone,DISA Information, No. 2 (July 1965); available fromZitzewitz Engineering Associates, Inc., P.O. Box 17,Wyckoff.NJ., 07481.
44. Equipment loaned by Courtesy of P.. L. Humphrey andR, B. Suhoke, Zitzewitz Electronic Laboratories, Inc.(1967).
45. R.Goldman, Ultrasonic Technology, ReinholdPublish-ing Corp., New York, N.Y. (1962).
46. J. R. Frederick, Ultrasonic Engineering, John Wiley andSons, Inc., New York, N.Y. (1965).
47. W. G. Cady, Piezoelectricity, Dover Publications, !nc,New York, N.Y. (1964).
48. W. P. Mason, Crystal Physics of Interaction Processes,Academic Press, Inc., New York, N.Y. (1966).
50. K. Nassau and H. J. Levensfein, Ferroelectric Behaviorof Lithium Niobate, Appl. Phys. Letters 7. No. 3,69-70 (Aug. 1,1965).
51. E.G. Spencer, P. V, Lenzo, and K.Nassau, ElasticWave Propagation in Lithium Niobate, Appl. Phys.Letters 7, No. 3,67-69 (Aug. 1,1965).
52. P. V. Lenzo, E. H. Turner, E.G.Spencer, andA. A. Ballman, Electrooptic Coefficients and Elastic-Wave Propagation in Single-Domain Ferroelectric Lithi-um Tantalate, Appl. Phys. Letters 8, No. 4, 81-82(Feb. 15,1966).
53. D. B. Fraser and A. W. Warner, Lithium Niobate: AHigh Temperature Piezoelectric Transducer Material, I.Appl. Phys. 37, No. 10,3853-3854 (Sept 1966).
54. A. W. Warner, M.Onoe, and G.A.Coquin, Determi-nation of Elastic and Piezoelectric Constanta forCrystals in Class (3m), J. Acoust. Soc. Amer. 42, No. 6,1223-1231 (Dec 1967).
55. I. Lefkowita et al, Ferroelectrics: Their ElectricalBehavior During and Subsequent to Ionizing Radiation,NP-15707 (Rl 779) Frankfort Arsenal, Philadelphia, Pa.(Novl965).
56. V. M. Albers (ed.), Underwater Acoustics, PlenumPress, New York, N.Y., Lecture 6 (1963).
57. P. Ebaugh and R. E. Mueser, The Practical Applicationof the Reciprocity Theorem in the Calibration ofUnderwater Sound Transducers, J. Acoust. Soc. Amer.19, 695-700 (July 1947).
58. L.G.Beatty, R.J . Bobber, and D.L.Phillips, SonarTransducer Calibration in a High-Pressure Tube, J.Acoust. Soc. Amer. 39, No. 1,48-54 (Jan 1966).