61
ANNEX 14 Feasibility Study and GHG Mitigation & CDM Potential
ANNEX 14
Feasibility Study and GHG Mitigation & CDM Potential

EC Grant Contract No. 242-677 Final Narrative Report (3 Jan 2011 – 2 July 2013) Annex 14 Page 1
“Smart/Intelligent Grid Development and Deployment in Thailand (Smart Thai)” January 2013
EuropeAid/129506/L/ACT/TH Thailand-EC Cooperation Facility – Phase II (TEC II)
GRANT CONTRACT - EXTERNAL ACTIONS OF THE EUROPEAN UNION -
DCI-ASIE/2010/242-677
Smart/Intelligent Grid Development and Deployment in Thailand (Smart Thai)
FEASIBILITY STUDY AND GHG MITIGATION & CDM POTENTIAL
Beneficiary/Applicant: World Alliance for Thai Decentralised Energy
(WADE THAI), Thailand
Partner : World Alliance for Decentralised Energy (WADE), UK
Associate: Full Advantage Co., Ltd. (FA), Thailand

EC Grant Contract No. 242-677 Final Narrative Report (3 Jan 2011 – 2 July 2013) Annex 14 Page 2
“Smart/Intelligent Grid Development and Deployment in Thailand (Smart Thai)” January 2013
TABLE OF CONTENTS 1. INTRODUCTION ................................................................................................................ 7
1.1 BACKGROUND OF SMART GRID TECHNOLOGY ................................................ 8 1.1.1 DEFINITION AND COVERAGE OF SMART GRID TECHNOLOGY .............. 8 1.1.2 POWER GRID’S EVOLUTION INTO SMART GRID ......................................... 8 1.1.3 TECHNOLOGICAL INNOVATIONS THAT ENABLED SMART GRID .......... 9
1.2 BACKGROUND ON SMART GRID DEPLOYMENT IN THAILAND ................... 12 1.2.1 SMART GRID DEPLOYMENT INITIATIVE IN THAILAND: PEA SMART GRID ROADMAP ........................................................................................................... 12 1.2.2 PATTAYA CITY: GENERAL INFORMATION ................................................. 15
2. TECHNICAL OVERVIEW AND ANALYSIS ................................................................. 18 2.1 ADVANCED METERING INFRASTRUCTURE (SMART METERS) .................... 18
2.1.1 SMART METER STANDARD FEATURES AND FUNCTIONALITIES ......... 21 2.1.2 TECHNICAL ANALYSIS OF SMART METER: METER ACCURACY .......... 23 2.1.3 TECHNICAL ANALYSIS OF SMART METER: APPLICABLE FEATURES AND FUNCTIONALITIES............................................................................................. 24 2.1.4 CONCLUSION: ON SMART METER................................................................. 24
2.2 IEC 61850 STANDARD IMPLEMENTATION.......................................................... 25 2.2.1 SUBSTATION AUTOMATION (SA) AND IEC 61850 (See Figure 11) ............ 25 2.2.2 SUBSTATION INTEGRATION AND AUTOMATION: TECHNICAL ISSUES.......................................................................................................................................... 26 2.2.3 TECHNICAL ANALYSIS ON IEC 61850 STANDARD .................................... 28 2.2.4 CONCLUSION: ON IEC 61850 STANDARD ..................................................... 29
2.3 DISTRIBUTION FEEDER AUTOMATION (FEEDER REMOTE TERMINAL UNIT) ................................................................................................................................... 29
2.3.1 INTRODUCTION ON FEEDER AUTOMATION .............................................. 29 2.3.2 TECHNICAL ANALYSIS ON FEEDER RTU: DISTRIBUTED APPROACH.. 31 2.3.3 TECHNICAL ANALYSIS ON FEEDER RTU: CENTRALISED APPROACH 31 2.3.4 CONCLUSION: ON FEEDER RTU ..................................................................... 33
3. FINANCIAL ANALYSIS .................................................................................................. 35 3.1 INVESTMENT ............................................................................................................. 35 3.2 REVENUES .................................................................................................................. 35 3.3 EXPENSES ................................................................................................................... 36 3.4 RESULTS ..................................................................................................................... 36 3.5 SCENARIO ANALYSIS .............................................................................................. 36 3.6 CONCLUSION: ON FINANCIAL ANALYSIS.......................................................... 37
4. ENVIRONMENTAL ANALYSIS: GHG MITIGATION & CDM POTENTIAL ............. 38 4.1 BACKGROUND .......................................................................................................... 38 4.2 INTRODUCTION ........................................................................................................ 38 4.3 DETERMINATION OF EMISSION REDUCTION IN SMART GRID SYSTEMS .. 38
4.3.1 ESTIMATED EMISSION REDUCTION .............................................................. 40 4.4 CARBON EMISSIONS TRADING/MARKETS......................................................... 42
4.4.1 CLEAN DEVELOPMENT MECHANISM (CDM) ............................................. 43 4.4.2 VERIFIED CARBON STANDARDS (VCS) ....................................................... 47 4.4.3 GOLD STANDARD .............................................................................................. 48 4.4.4 THAILAND VOLUNTARY EMISSION REDUCTION (T-VER) ....................... 49
EC Grant Contract No. 242-677 Final Narrative Report (3 Jan 2011 – 2 July 2013) Annex 14 Page 3
“Smart/Intelligent Grid Development and Deployment in Thailand (Smart Thai)” January 2013
4.4.5 NAMAs FOR THAILAND ................................................................................... 50 4.4.6 JAPAN’S BILATERAL OFFSET CREDITING MECHANISM (BOCM) .......... 50
4.5 CONCLUSIONS AND RECOMMENDATIONS ON GHG MITIGATION & CDM POTENTIAL........................................................................................................................ 51
5. RISK ASSESSMENT ......................................................................................................... 53 5.1 FUTURE PROOFING .................................................................................................. 53 5.2 NEED FOR NEW SMART GRID PERSONNEL AND CAPACITY BUILDING FOR THE EXISTING PERSONNEL .......................................................................................... 53
6. RECOMMENDATIONS .................................................................................................... 57
EC Grant Contract No. 242-677 Final Narrative Report (3 Jan 2011 – 2 July 2013) Annex 14 Page 4
“Smart/Intelligent Grid Development and Deployment in Thailand (Smart Thai)” January 2013
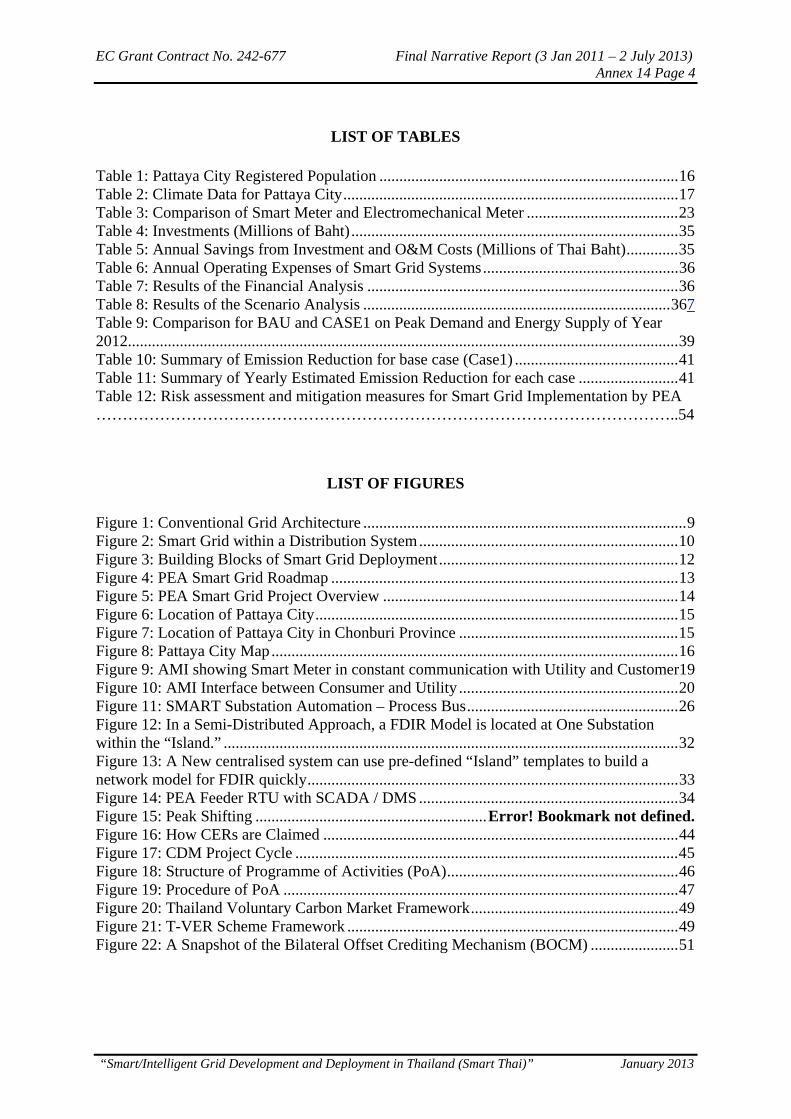
LIST OF TABLES Table 1: Pattaya City Registered Population ........................................................................... 16 Table 2: Climate Data for Pattaya City .................................................................................... 17 Table 3: Comparison of Smart Meter and Electromechanical Meter ...................................... 23 Table 4: Investments (Millions of Baht) .................................................................................. 35 Table 5: Annual Savings from Investment and O&M Costs (Millions of Thai Baht) ............. 35 Table 6: Annual Operating Expenses of Smart Grid Systems ................................................. 36 Table 7: Results of the Financial Analysis .............................................................................. 36 Table 8: Results of the Scenario Analysis ............................................................................. 367 Table 9: Comparison for BAU and CASE1 on Peak Demand and Energy Supply of Year 2012.......................................................................................................................................... 39 Table 10: Summary of Emission Reduction for base case (Case1) ......................................... 41 Table 11: Summary of Yearly Estimated Emission Reduction for each case ......................... 41 Table 12: Risk assessment and mitigation measures for Smart Grid Implementation by PEA ………………………………………………………………………………………………..54
LIST OF FIGURES Figure 1: Conventional Grid Architecture ................................................................................. 9 Figure 2: Smart Grid within a Distribution System ................................................................. 10 Figure 3: Building Blocks of Smart Grid Deployment ............................................................ 12 Figure 4: PEA Smart Grid Roadmap ....................................................................................... 13 Figure 5: PEA Smart Grid Project Overview .......................................................................... 14 Figure 6: Location of Pattaya City ........................................................................................... 15 Figure 7: Location of Pattaya City in Chonburi Province ....................................................... 15 Figure 8: Pattaya City Map ...................................................................................................... 16 Figure 9: AMI showing Smart Meter in constant communication with Utility and Customer19 Figure 10: AMI Interface between Consumer and Utility ....................................................... 20 Figure 11: SMART Substation Automation – Process Bus ..................................................... 26 Figure 12: In a Semi-Distributed Approach, a FDIR Model is located at One Substation within the “Island.” .................................................................................................................. 32 Figure 13: A New centralised system can use pre-defined “Island” templates to build a network model for FDIR quickly ............................................................................................. 33 Figure 14: PEA Feeder RTU with SCADA / DMS ................................................................. 34 Figure 15: Peak Shifting .......................................................... Error! Bookmark not defined. Figure 16: How CERs are Claimed ......................................................................................... 44 Figure 17: CDM Project Cycle ................................................................................................ 45 Figure 18: Structure of Programme of Activities (PoA) .......................................................... 46 Figure 19: Procedure of PoA ................................................................................................... 47 Figure 20: Thailand Voluntary Carbon Market Framework .................................................... 49 Figure 21: T-VER Scheme Framework ................................................................................... 49 Figure 22: A Snapshot of the Bilateral Offset Crediting Mechanism (BOCM) ...................... 51
EC Grant Contract No. 242-677 Final Narrative Report (3 Jan 2011 – 2 July 2013) Annex 14 Page 5
“Smart/Intelligent Grid Development and Deployment in Thailand (Smart Thai)” January 2013
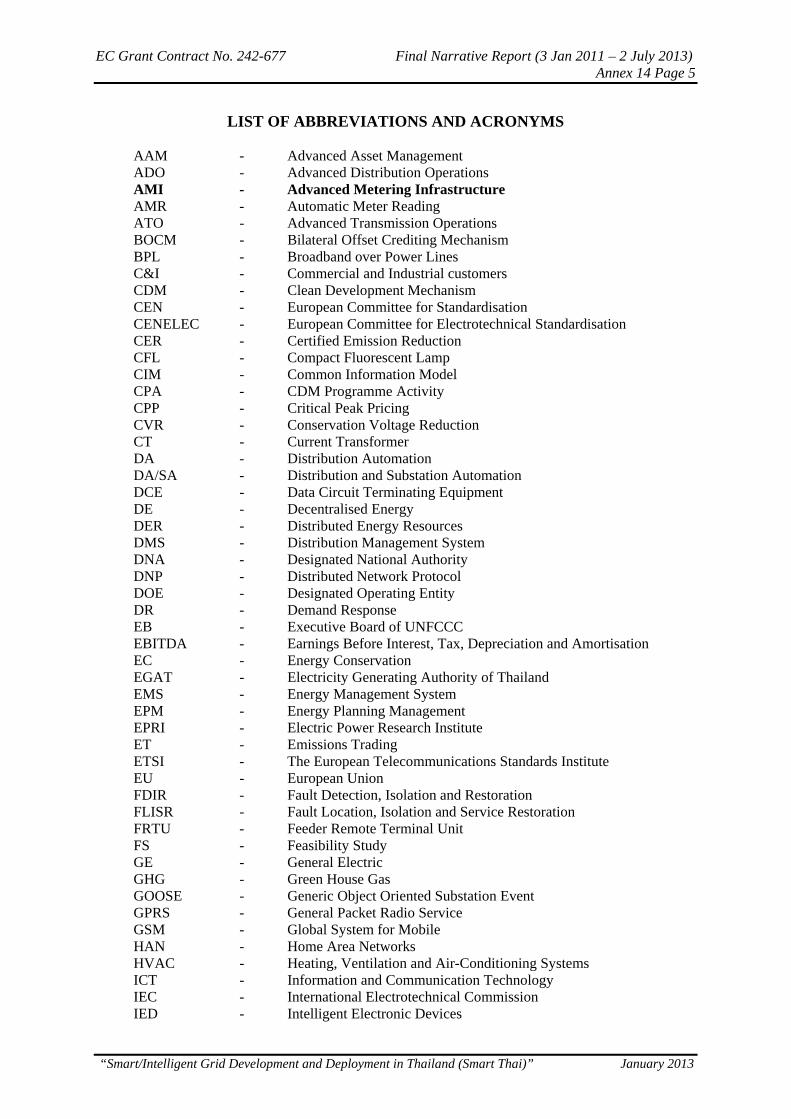
LIST OF ABBREVIATIONS AND ACRONYMS
AAM - Advanced Asset Management ADO - Advanced Distribution Operations AMI - Advanced Metering Infrastructure AMR - Automatic Meter Reading ATO - Advanced Transmission Operations BOCM - Bilateral Offset Crediting Mechanism BPL - Broadband over Power Lines C&I - Commercial and Industrial customers CDM - Clean Development Mechanism CEN - European Committee for Standardisation CENELEC - European Committee for Electrotechnical Standardisation CER - Certified Emission Reduction CFL - Compact Fluorescent Lamp CIM - Common Information Model CPA - CDM Programme Activity CPP - Critical Peak Pricing CVR - Conservation Voltage Reduction CT - Current Transformer DA - Distribution Automation DA/SA - Distribution and Substation Automation DCE - Data Circuit Terminating Equipment DE - Decentralised Energy DER - Distributed Energy Resources DMS - Distribution Management System DNA - Designated National Authority DNP - Distributed Network Protocol DOE - Designated Operating Entity DR - Demand Response EB - Executive Board of UNFCCC EBITDA - Earnings Before Interest, Tax, Depreciation and Amortisation EC - Energy Conservation EGAT - Electricity Generating Authority of Thailand EMS - Energy Management System EPM - Energy Planning Management EPRI - Electric Power Research Institute ET - Emissions Trading ETSI - The European Telecommunications Standards Institute EU - European Union FDIR - Fault Detection, Isolation and Restoration FLISR - Fault Location, Isolation and Service Restoration FRTU - Feeder Remote Terminal Unit FS - Feasibility Study GE - General Electric GHG - Green House Gas GOOSE - Generic Object Oriented Substation Event GPRS - General Packet Radio Service GSM - Global System for Mobile HAN - Home Area Networks HVAC - Heating, Ventilation and Air-Conditioning Systems ICT - Information and Communication Technology IEC - International Electrotechnical Commission IED - Intelligent Electronic Devices
EC Grant Contract No. 242-677 Final Narrative Report (3 Jan 2011 – 2 July 2013) Annex 14 Page 6
“Smart/Intelligent Grid Development and Deployment in Thailand (Smart Thai)” January 2013
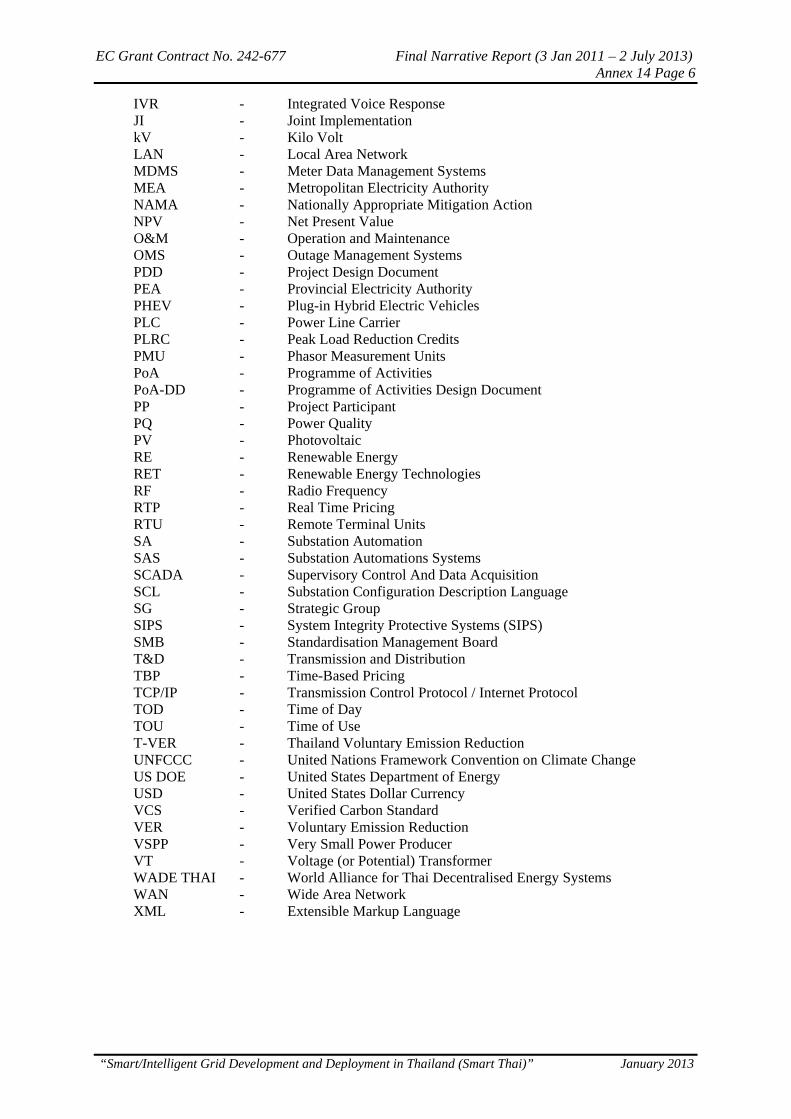
IVR - Integrated Voice Response JI - Joint Implementation kV - Kilo Volt LAN - Local Area Network MDMS - Meter Data Management Systems MEA - Metropolitan Electricity Authority NAMA - Nationally Appropriate Mitigation Action NPV - Net Present Value O&M - Operation and Maintenance OMS - Outage Management Systems PDD - Project Design Document PEA - Provincial Electricity Authority PHEV - Plug-in Hybrid Electric Vehicles PLC - Power Line Carrier PLRC - Peak Load Reduction Credits PMU - Phasor Measurement Units PoA - Programme of Activities PoA-DD - Programme of Activities Design Document PP - Project Participant PQ - Power Quality PV - Photovoltaic RE - Renewable Energy RET - Renewable Energy Technologies RF - Radio Frequency RTP - Real Time Pricing RTU - Remote Terminal Units SA - Substation Automation SAS - Substation Automations Systems SCADA - Supervisory Control And Data Acquisition SCL - Substation Configuration Description Language SG - Strategic Group SIPS - System Integrity Protective Systems (SIPS) SMB - Standardisation Management Board T&D - Transmission and Distribution TBP - Time-Based Pricing TCP/IP - Transmission Control Protocol / Internet Protocol TOD - Time of Day TOU - Time of Use T-VER - Thailand Voluntary Emission Reduction UNFCCC - United Nations Framework Convention on Climate Change US DOE - United States Department of Energy USD - United States Dollar Currency VCS - Verified Carbon Standard VER - Voluntary Emission Reduction VSPP - Very Small Power Producer VT - Voltage (or Potential) Transformer WADE THAI - World Alliance for Thai Decentralised Energy Systems WAN - Wide Area Network XML - Extensible Markup Language

EC Grant Contract No. 242-677 Final Narrative Report (3 Jan 2011 – 2 July 2013) Annex 14 Page 7
“Smart/Intelligent Grid Development and Deployment in Thailand (Smart Thai)” January 2013
FEASIBILITY STUDY
1. INTRODUCTION
In 2010, WADE THAI received funding from the European Commission for the project on “Smart/Intelligent Grid Development and Deployment in Thailand (Smart Thai)” to develop policy options, action plans, and stakeholder participation to increase the availability and deployment of the Smart/Intelligent Grid in Thailand. This project aims to assist in capacity building and promotion of best practices happening in the European Union in the area of environment, climate change and energy security. The project intends to implement one of the mandates of WADE THAI1, which is to promote energy efficiency in the generation, transmission and distribution network of Thailand. The Overall Objective of the project is to "improve the sustainable economic and social development of Thailand through the efficient delivery of sustainable, economic and secure electricity using Smart/Intelligent Grid systems based on EU models and technologies". This action aims to achieve the Specific Objective, i.e. to "transform the generation, transmission and distribution network of Thailand through the enhancement of the capacity of Thai private and public sector organisations in introducing and promoting Smart/Intelligent Grid systems thereby contributing to the national development goals of Thailand in the area of environment, climate change and energy security". The performance of a "Technical and economic feasibility study for implementing Smart/Intelligent Grid systems on a pilot basis" is one of the key deliverables of the project. The pilot project that is the subject of this FS is located in Pattaya City, which is identified and included by the Provincial Electricity Authority (PEA) in their PEA Smart Grid Road Map. While PEA identified three (3) other sites as pilot areas, Pattaya City is their first priority.
1 WADE THAI is a short name for the “World Alliance for Thai Decentralised Energy Systems”, a non-profit organisation registered in Thailand as an output of the EU-funded project on “Enhancing institutional capacities for the market development of decentralised energy (DE) systems in Thailand”.
EC Grant Contract No. 242-677 Final Narrative Report (3 Jan 2011 – 2 July 2013) Annex 14 Page 8
“Smart/Intelligent Grid Development and Deployment in Thailand (Smart Thai)” January 2013
1.1 BACKGROUND OF SMART GRID TECHNOLOGY
1.1.1 DEFINITION AND COVERAGE OF SMART GRID TECHNOLOGY
“Smart Grid” is used as a promotional term, rather than a technical definition. It is also a new and evolving technologies. For these reasons there is no commonly accepted definition for what “smart” is. There are many smart grid definitions, some functional, some technological and some benefits-oriented. According to the European Smart Grids Task Force Expert Group 12, a Smart Grid is defined as an electricity network that can cost-efficiently integrate the behaviour and actions of all users connected to it – generators, consumers and those that do both – in order to ensure an economically efficient, sustainable power system with low losses and high levels of quality and security of supply and safety. A smart grid will also provide a framework for innovative services.
The Strategic Group 3 (SG3) on Smart Grid, set up by the International Electrotechnical Commission (IEC) Standardisation Management Board (SMB) defines Smart Grid simply as the concept of modernising the electric grid. Smart Grid is integrating the electrical and information technologies in between any point of generation and any point of consumption. The US Department of Energy website refers to Smart Grid as a class of technology people are using to bring utility electricity delivery systems into the 21st century, using computer-based remote control and automation. These systems are made possible by two-way communication technology and computer processing. A common element to most definitions is the application of digital processing and communications to the power grid, making data flow and information management central to Smart Grid. Various capabilities result from the deeply integrated use of digital technology with power grids. Integration of the new grid information flows into utility processes and systems is one of the key issues in the design of smart grids. Electric utilities now find themselves making three classes of transformations: (1) improvement of infrastructure; (2) addition of the digital layer, which is the essence of Smart Grid and (3) business process transformation, necessary to capitalise on the investments in smart technology. Much of the work that has been going on in electric grid modernisation, especially substation and distribution automation, is now included in the general concept of Smart Grid, but additional capabilities are evolving as well.
1.1.2 POWER GRID’S EVOLUTION INTO SMART GRID
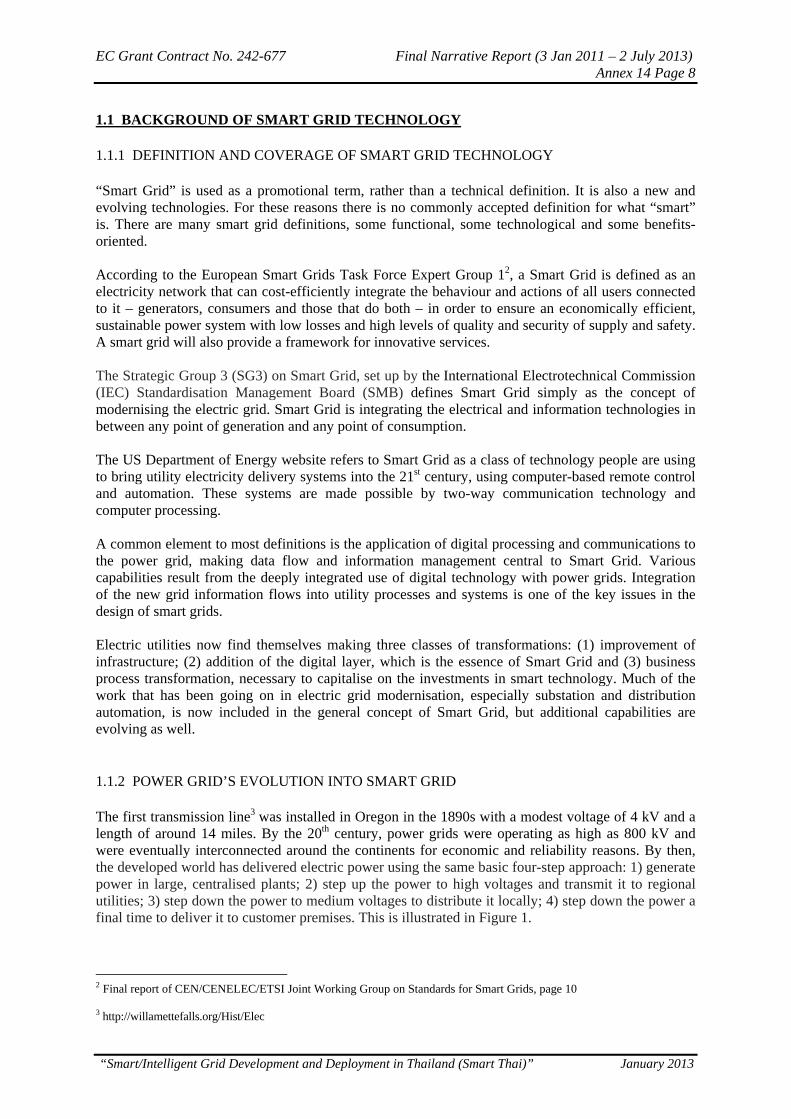
The first transmission line3 was installed in Oregon in the 1890s with a modest voltage of 4 kV and a length of around 14 miles. By the 20th century, power grids were operating as high as 800 kV and were eventually interconnected around the continents for economic and reliability reasons. By then, the developed world has delivered electric power using the same basic four-step approach: 1) generate power in large, centralised plants; 2) step up the power to high voltages and transmit it to regional utilities; 3) step down the power to medium voltages to distribute it locally; 4) step down the power a final time to deliver it to customer premises. This is illustrated in Figure 1.
2 Final report of CEN/CENELEC/ETSI Joint Working Group on Standards for Smart Grids, page 10 3 http://willamettefalls.org/Hist/Elec

EC Grant Contract No. 242-677 Final Narrative Report (3 Jan 2011 – 2 July 2013) Annex 14 Page 9
“Smart/Intelligent Grid Development and Deployment in Thailand (Smart Thai)” January 2013
Figure 1: Conventional Grid Architecture4
Grid development was heavily influenced by the location of their source of power. Most conventional power plants are site specific and are built close to the fuel source such as coalmines, oil wells or rivers dams deep in the mountain areas. Large power plant locations are determined by the availability of cooling water and are built close to rivers. Fossil fuel-fired power stations were initially very polluting and were located as far as economically possible from population centres once electricity distribution networks permitted it. By the 1960’s, the main job of modern power grid was to connect the bulk sources of power to load centers located in cities and other areas, which can be hundreds or thousands of kilometers away. In the beginning, metering of electricity consumption used fixed-tariff arrangements although dual-tariff (with TOD or time-of-day) arrangements, where nighttime power was charged at a lower rate than daytime power, were common by late 20th century. Through the 1970s to the 1990s, power supply could no longer cope up with load growth especially at peak times, resulting in poor power quality including blackouts and load curtailment. At this time, regulators were imposing higher reliability standards with penalties on erring electric utilities. Late in the 20th century, load curves were well established and showed relatively low load factors. This means that peaking plants (commonly, diesel and gas turbines used due to their fast start-up response) would only run for short periods each day. The relatively low utilisation of these peaking generators, together with the necessary redundancy in the electricity grid, resulted in high costs to the electricity companies, which were passed on in the form of increased tariffs.
1.1.3 TECHNOLOGICAL INNOVATIONS THAT ENABLED SMART GRID
Generation and Transmission Sector Innovations
Since the beginning of the 21st century, there is a growing concern over climate change and environmental harm caused by existing conventional power plant and the depletion of fossil based fuel. There is also a growing concern that the aging power grid cannot keep up with the required capacity of the growing demand as well as increasing reliability expectation. Maintenance and upgrade is also getting more expensive. Terrorist attack against strategic point of the centralised grid architecture paralysing countries and even continents is also becoming a national and global security issue. The accident of Japan’s Fukushima Nuclear Power Plant resulted in the global phasing out of existing nuclear plants and to the cancellation of earlier plans. It led to a desire for massive deployment of Renewable Energy Technologies (RET) to be fully integrated to the power grid.
4 Source: The Electricity Economy, New Opportunities from the Transformation of the Electric Power Sector, August 2008, Global Environment Fund (GEF) and Global Smart Energy (GSE), page 24
EC Grant Contract No. 242-677 Final Narrative Report (3 Jan 2011 – 2 July 2013) Annex 14 Page 10
“Smart/Intelligent Grid Development and Deployment in Thailand (Smart Thai)” January 2013
Distribution and Consumer Sector Innovations
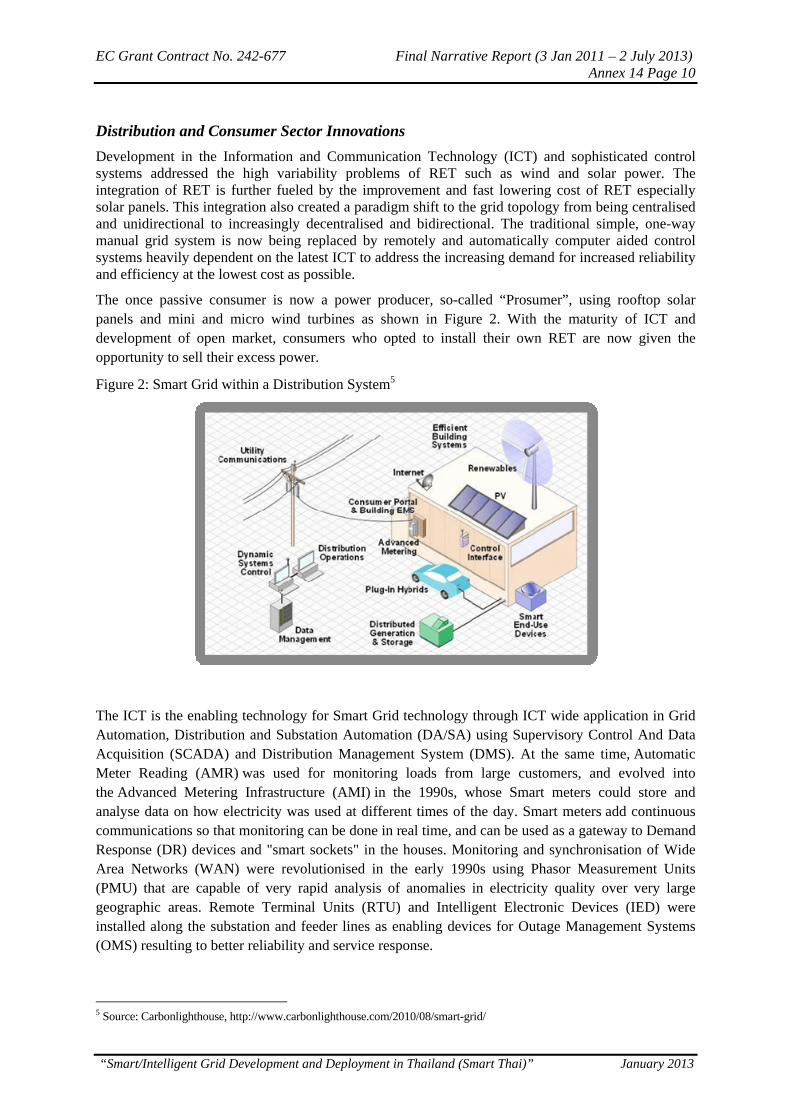
Development in the Information and Communication Technology (ICT) and sophisticated control systems addressed the high variability problems of RET such as wind and solar power. The integration of RET is further fueled by the improvement and fast lowering cost of RET especially solar panels. This integration also created a paradigm shift to the grid topology from being centralised and unidirectional to increasingly decentralised and bidirectional. The traditional simple, one-way manual grid system is now being replaced by remotely and automatically computer aided control systems heavily dependent on the latest ICT to address the increasing demand for increased reliability and efficiency at the lowest cost as possible.
The once passive consumer is now a power producer, so-called “Prosumer”, using rooftop solar panels and mini and micro wind turbines as shown in Figure 2. With the maturity of ICT and development of open market, consumers who opted to install their own RET are now given the opportunity to sell their excess power.
Figure 2: Smart Grid within a Distribution System5
The ICT is the enabling technology for Smart Grid technology through ICT wide application in Grid Automation, Distribution and Substation Automation (DA/SA) using Supervisory Control And Data Acquisition (SCADA) and Distribution Management System (DMS). At the same time, Automatic Meter Reading (AMR) was used for monitoring loads from large customers, and evolved into the Advanced Metering Infrastructure (AMI) in the 1990s, whose Smart meters could store and analyse data on how electricity was used at different times of the day. Smart meters add continuous communications so that monitoring can be done in real time, and can be used as a gateway to Demand Response (DR) devices and "smart sockets" in the houses. Monitoring and synchronisation of Wide Area Networks (WAN) were revolutionised in the early 1990s using Phasor Measurement Units (PMU) that are capable of very rapid analysis of anomalies in electricity quality over very large geographic areas. Remote Terminal Units (RTU) and Intelligent Electronic Devices (IED) were installed along the substation and feeder lines as enabling devices for Outage Management Systems (OMS) resulting to better reliability and service response.
5 Source: Carbonlighthouse, http://www.carbonlighthouse.com/2010/08/smart-grid/

EC Grant Contract No. 242-677 Final Narrative Report (3 Jan 2011 – 2 July 2013) Annex 14 Page 11
“Smart/Intelligent Grid Development and Deployment in Thailand (Smart Thai)” January 2013
The Distribution sector is at the forefront of the paradigm shift towards Smart Grid. The simple job of providing electrical service connection to customers within their franchise using flat rates are now being replaced with providing customers with the choice of retailers or preferred generators for purchasing their power and with the option of using power at a time most advantageous and beneficial to them using sophisticated ICT enabled Home Area Networks (HAN). Demand response also means that demand can respond to supply fluctuations in real time to prevent any power disturbance in the power grid. The traditional consumers are now the modern “prosumers” with several RET installed in their homes such as rooftop solar panels coupled with microwind turbines. The conventional unidirectional energy meter is now replaced with bidirectional net meter with TOU (Time of Use) register that allows “prosumers” to sell their excess energy during peak hours to the local distribution utility or grid operator.
Metering Innovations
Before the advent of smart meters, conventional meters were called energy meters because they only register energy consumption. They were made of electro-mechanical instruments that served as the utility cash registers. These conventional type of meters simply recorded the total energy consumed over a period of time and were read monthly. For substation metering and in some large industrial and commercial customers, additional demand and reactive energy functionality were also incorporated. With the development of computer and digital technology, Power Quality (PQ) meters were developed to record voltage sag and swell, harmonics, and TOU recording. Later, Automatic Meter Reading (AMR) technology was deployed which was the predecessor of the smart meter and the Advanced Metering Infrastructure (AMI). The technology automatically collects consumption, diagnostic, and status data from meters and transfers the data to a central database for billing, troubleshooting and analysing. This technology mainly saves utility providers the expense of traveling to each physical location to read a meter. Another advantage is that billing can be based on near real-time consumption rather than on estimates based on past or predicted consumption. This timely information coupled with analysis can help both utility providers and customers better control the use and production of electric energy consumption. AMR technologies include handheld, mobile and network technologies based on telephony platforms (wired and wireless), Radio Frequency (RF), or power line transmission6. In contrast, AMI also known as “Smart meter” is an electrical meter that records consumption of electric energy in intervals of an hour or less and sends information back to the utility for monitoring and billing purposes. Smart meters enable two-way communication between the meter and the central system. Unlike home energy monitors, smart meters can gather data for remote reporting. Such an AMI differs from the traditional AMR in that it enables two-way communications with the meter and allows for a customer option. Such devices can be shut down during times of peak demand7.
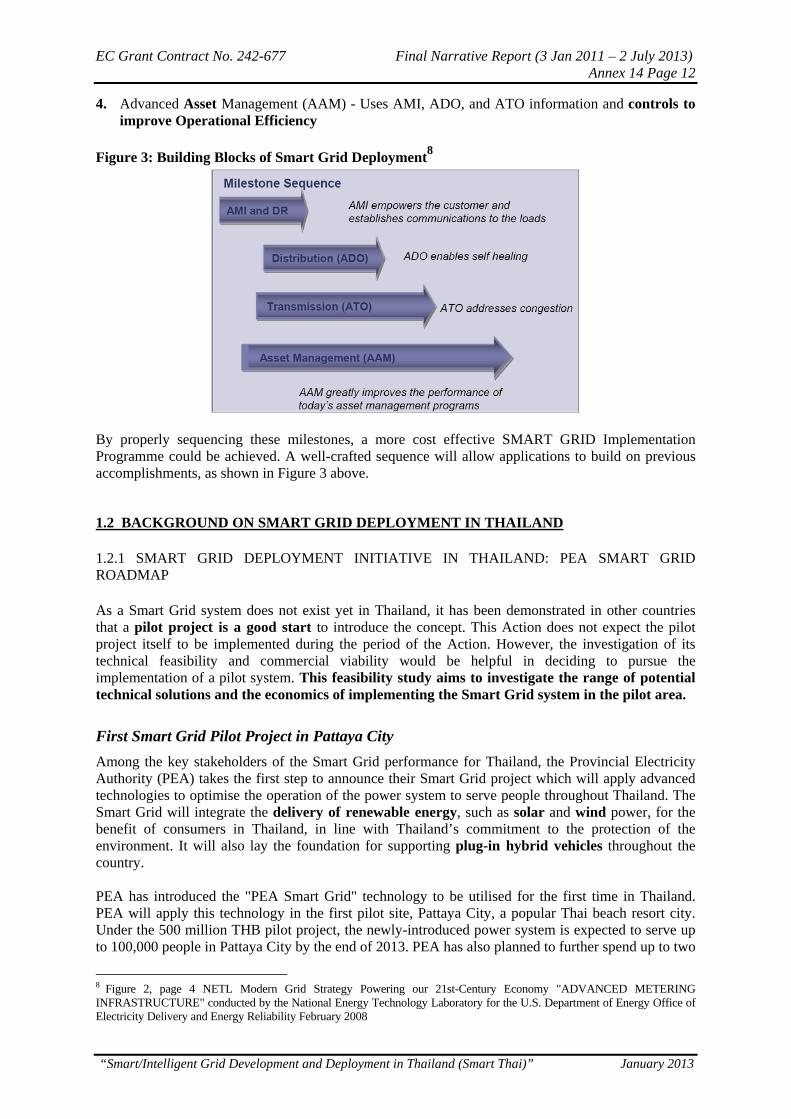
Building Blocks of Smart Grid Implementation
There are four major milestones on the road to a Smart Grid: 1. Advanced Metering Infrastructure (AMI) - Establishes communications with the consumer and
provides time stamped system information 2. Advanced Distribution Operations (ADO) - Uses AMI communications to collect distribution
information and uses AMI information to improve operations through Distribution Automation, Substation Automation and Distribution Management System
3. Advanced Transmission Operations (ATO) - Uses ADO information to improve operations and manage transmission congestion and voltage and uses AMI to give consumers access to markets
6 http://en.wikipedia.org/wiki/Automatic_meter_reading 7 http://en.wikipedia.org/wiki/Smart_meter
EC Grant Contract No. 242-677 Final Narrative Report (3 Jan 2011 – 2 July 2013) Annex 14 Page 12
“Smart/Intelligent Grid Development and Deployment in Thailand (Smart Thai)” January 2013
4. Advanced Asset Management (AAM) - Uses AMI, ADO, and ATO information and controls to improve Operational Efficiency
Figure 3: Building Blocks of Smart Grid Deployment8
By properly sequencing these milestones, a more cost effective SMART GRID Implementation Programme could be achieved. A well-crafted sequence will allow applications to build on previous accomplishments, as shown in Figure 3 above.
1.2 BACKGROUND ON SMART GRID DEPLOYMENT IN THAILAND
1.2.1 SMART GRID DEPLOYMENT INITIATIVE IN THAILAND: PEA SMART GRID ROADMAP
As a Smart Grid system does not exist yet in Thailand, it has been demonstrated in other countries that a pilot project is a good start to introduce the concept. This Action does not expect the pilot project itself to be implemented during the period of the Action. However, the investigation of its technical feasibility and commercial viability would be helpful in deciding to pursue the implementation of a pilot system. This feasibility study aims to investigate the range of potential technical solutions and the economics of implementing the Smart Grid system in the pilot area.
First Smart Grid Pilot Project in Pattaya City
Among the key stakeholders of the Smart Grid performance for Thailand, the Provincial Electricity Authority (PEA) takes the first step to announce their Smart Grid project which will apply advanced technologies to optimise the operation of the power system to serve people throughout Thailand. The Smart Grid will integrate the delivery of renewable energy, such as solar and wind power, for the benefit of consumers in Thailand, in line with Thailand’s commitment to the protection of the environment. It will also lay the foundation for supporting plug-in hybrid vehicles throughout the country. PEA has introduced the "PEA Smart Grid" technology to be utilised for the first time in Thailand. PEA will apply this technology in the first pilot site, Pattaya City, a popular Thai beach resort city. Under the 500 million THB pilot project, the newly-introduced power system is expected to serve up to 100,000 people in Pattaya City by the end of 2013. PEA has also planned to further spend up to two
8 Figure 2, page 4 NETL Modern Grid Strategy Powering our 21st-Century Economy "ADVANCED METERING INFRASTRUCTURE" conducted by the National Energy Technology Laboratory for the U.S. Department of Energy Office of Electricity Delivery and Energy Reliability February 2008
EC Grant Contract No. 242-677 Final Narrative Report (3 Jan 2011 – 2 July 2013) Annex 14 Page 13
“Smart/Intelligent Grid Development and Deployment in Thailand (Smart Thai)” January 2013
billion baht to expand the Smart Grid technology to some 400,000 people living in Thailand's northern Chiang Mai Province, southern Phuket Province and northeastern NakhonRatchasima Province in the foreseeable future9. Based of this development, this feasibility study under the Smart Thai project selected Pattaya City, Chonburi province as the study site in order to be in line with, and provide beneficial inputs to the PEA Smart Grid's first pilot project.
Initial PEA Smart Grid Definition10
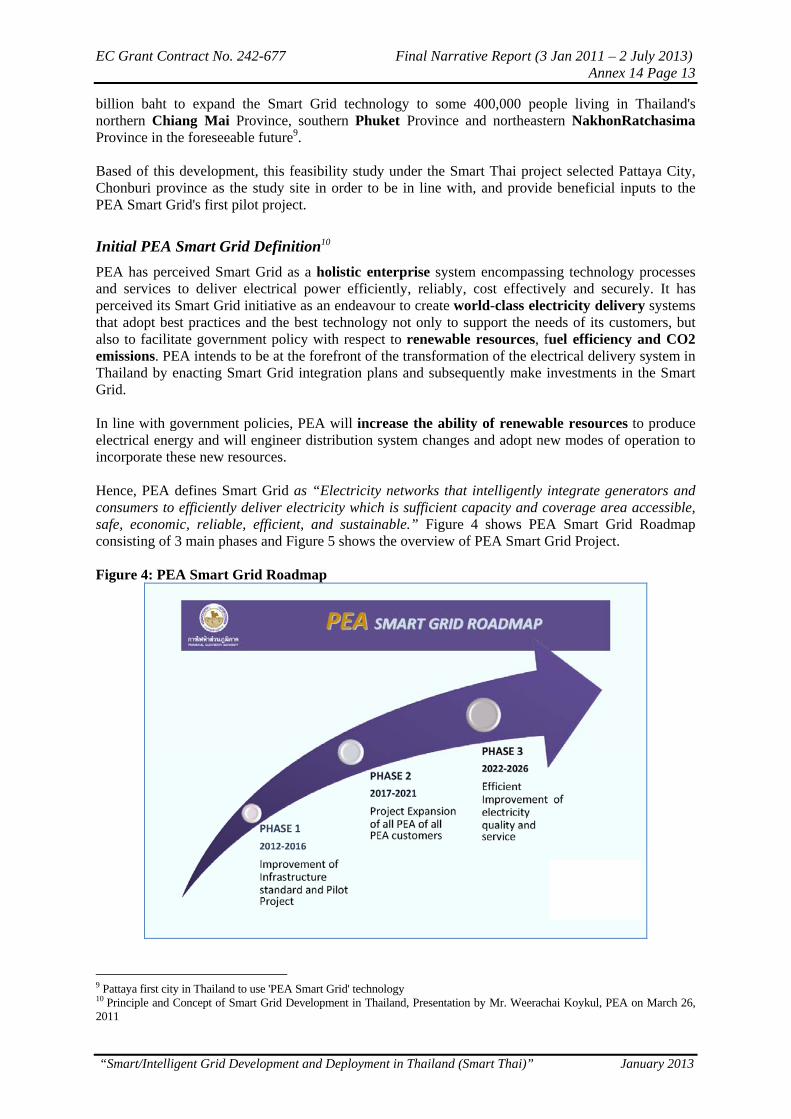
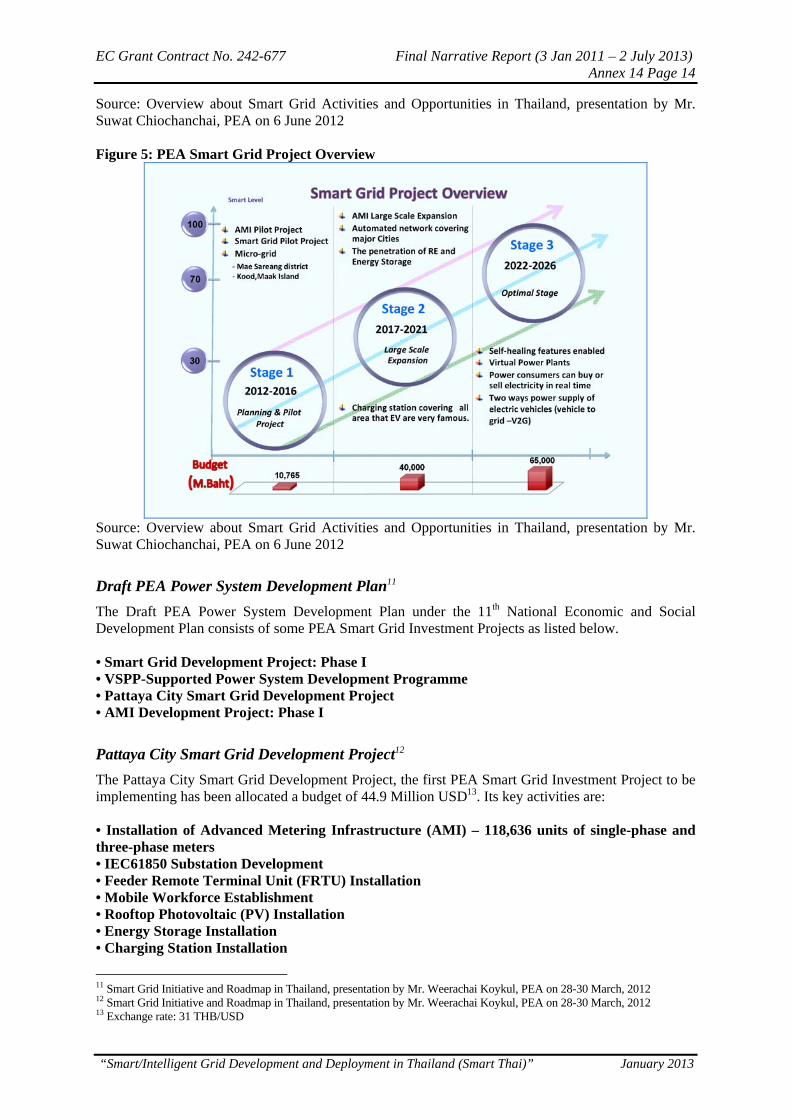
PEA has perceived Smart Grid as a holistic enterprise system encompassing technology processes and services to deliver electrical power efficiently, reliably, cost effectively and securely. It has perceived its Smart Grid initiative as an endeavour to create world-class electricity delivery systems that adopt best practices and the best technology not only to support the needs of its customers, but also to facilitate government policy with respect to renewable resources, fuel efficiency and CO2 emissions. PEA intends to be at the forefront of the transformation of the electrical delivery system in Thailand by enacting Smart Grid integration plans and subsequently make investments in the Smart Grid. In line with government policies, PEA will increase the ability of renewable resources to produce electrical energy and will engineer distribution system changes and adopt new modes of operation to incorporate these new resources. Hence, PEA defines Smart Grid as “Electricity networks that intelligently integrate generators and consumers to efficiently deliver electricity which is sufficient capacity and coverage area accessible, safe, economic, reliable, efficient, and sustainable.” Figure 4 shows PEA Smart Grid Roadmap consisting of 3 main phases and Figure 5 shows the overview of PEA Smart Grid Project. Figure 4: PEA Smart Grid Roadmap
9 Pattaya first city in Thailand to use 'PEA Smart Grid' technology 10 Principle and Concept of Smart Grid Development in Thailand, Presentation by Mr. Weerachai Koykul, PEA on March 26, 2011
EC Grant Contract No. 242-677 Final Narrative Report (3 Jan 2011 – 2 July 2013) Annex 14 Page 14
“Smart/Intelligent Grid Development and Deployment in Thailand (Smart Thai)” January 2013
Source: Overview about Smart Grid Activities and Opportunities in Thailand, presentation by Mr. Suwat Chiochanchai, PEA on 6 June 2012 Figure 5: PEA Smart Grid Project Overview
Source: Overview about Smart Grid Activities and Opportunities in Thailand, presentation by Mr. Suwat Chiochanchai, PEA on 6 June 2012
Draft PEA Power System Development Plan11
The Draft PEA Power System Development Plan under the 11th National Economic and Social Development Plan consists of some PEA Smart Grid Investment Projects as listed below. • Smart Grid Development Project: Phase I • VSPP-Supported Power System Development Programme • Pattaya City Smart Grid Development Project • AMI Development Project: Phase I
Pattaya City Smart Grid Development Project12
The Pattaya City Smart Grid Development Project, the first PEA Smart Grid Investment Project to be implementing has been allocated a budget of 44.9 Million USD13. Its key activities are: • Installation of Advanced Metering Infrastructure (AMI) – 118,636 units of single-phase and three-phase meters • IEC61850 Substation Development • Feeder Remote Terminal Unit (FRTU) Installation • Mobile Workforce Establishment • Rooftop Photovoltaic (PV) Installation • Energy Storage Installation • Charging Station Installation
11 Smart Grid Initiative and Roadmap in Thailand, presentation by Mr. Weerachai Koykul, PEA on 28-30 March, 2012 12 Smart Grid Initiative and Roadmap in Thailand, presentation by Mr. Weerachai Koykul, PEA on 28-30 March, 2012 13 Exchange rate: 31 THB/USD
EC Grant Contract No. 242-677 Final Narrative Report (3 Jan 2011 – 2 July 2013) Annex 14 Page 15
“Smart/Intelligent Grid Development and Deployment in Thailand (Smart Thai)” January 2013
• Home Automation
1.2.2 PATTAYA CITY: GENERAL INFORMATION
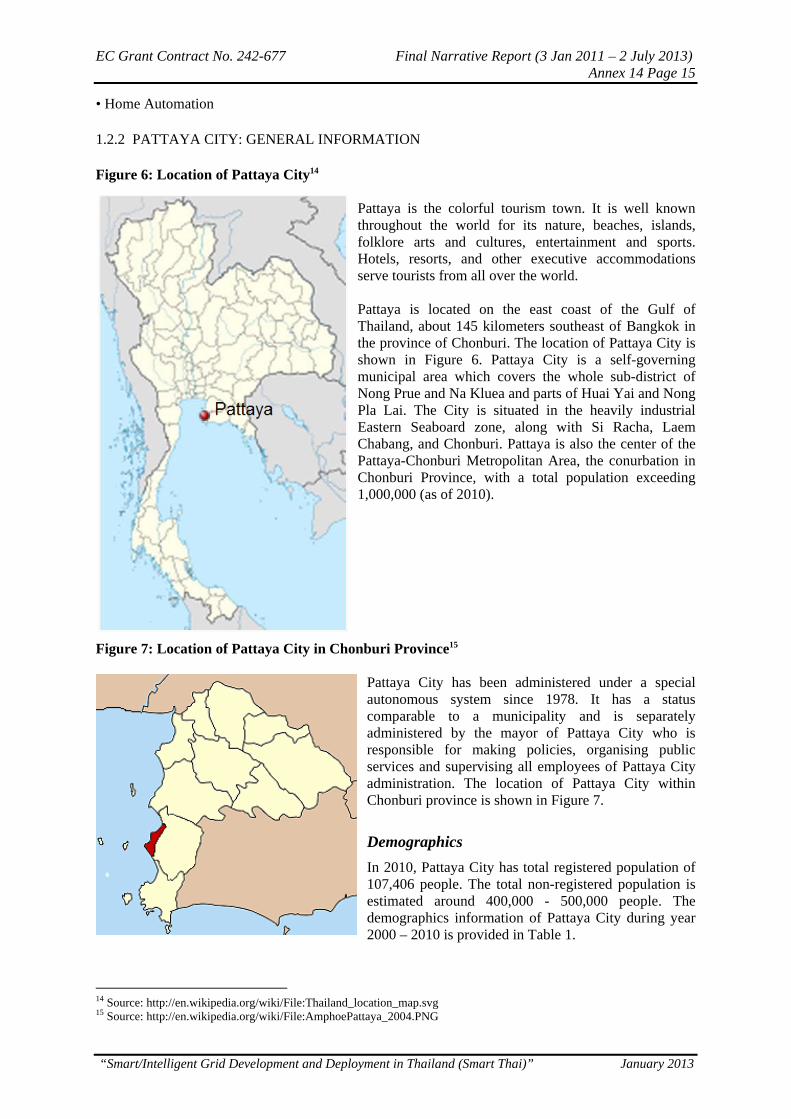
Figure 6: Location of Pattaya City14
Pattaya is the colorful tourism town. It is well known throughout the world for its nature, beaches, islands, folklore arts and cultures, entertainment and sports. Hotels, resorts, and other executive accommodations serve tourists from all over the world. Pattaya is located on the east coast of the Gulf of Thailand, about 145 kilometers southeast of Bangkok in the province of Chonburi. The location of Pattaya City is shown in Figure 6. Pattaya City is a self-governing municipal area which covers the whole sub-district of Nong Prue and Na Kluea and parts of Huai Yai and Nong Pla Lai. The City is situated in the heavily industrial Eastern Seaboard zone, along with Si Racha, Laem Chabang, and Chonburi. Pattaya is also the center of the Pattaya-Chonburi Metropolitan Area, the conurbation in Chonburi Province, with a total population exceeding 1,000,000 (as of 2010).
Figure 7: Location of Pattaya City in Chonburi Province15
Pattaya City has been administered under a special autonomous system since 1978. It has a status comparable to a municipality and is separately administered by the mayor of Pattaya City who is responsible for making policies, organising public services and supervising all employees of Pattaya City administration. The location of Pattaya City within Chonburi province is shown in Figure 7.
Demographics
In 2010, Pattaya City has total registered population of 107,406 people. The total non-registered population is estimated around 400,000 - 500,000 people. The demographics information of Pattaya City during year 2000 – 2010 is provided in Table 1.
14 Source: http://en.wikipedia.org/wiki/File:Thailand_location_map.svg 15 Source: http://en.wikipedia.org/wiki/File:AmphoePattaya_2004.PNG
EC Grant Contract No. 242-677 Final Narrative Report (3 Jan 2011 – 2 July 2013) Annex 14 Page 16
“Smart/Intelligent Grid Development and Deployment in Thailand (Smart Thai)” January 2013
Table 1: Pattaya City Registered Population16 Year
Total Population Male Female
2010 107,406 50,075 57,331 2009 106,214 49,589 56,625 2008 104,797 49,241 55,556 2007 102,612 48,438 54,174 2006 98,992 46,828 52,164 2005 96,654 45,799 50,855 2004 91,855 43,812 48,043 2003 92,878 44,716 48,162 2002 89,413 43,123 46,290 2001 85,533 41,606 43,927 2000 82,133 40,127 42,006
Physical Geography
The total area of Pattaya City is 208.10 square kilometers (130,062.50 rais). It includes: – Land area (including Koh Larn) of 53.44 square kilometers (33,400 Rais) – Water area of 154.66 square kilometers (96,662.50 Rais) – Koh Larn consists of 4.07 square kilometers (2,543.75 Rais)
The city of Pattaya is a special municipal area which covers 4 sub-districts in Chonburi province as listed below.
1. Na Kluea sub-district, village no.1, 2, 3, 4, 5, 6 and 7 (Koh Larn) 2. Nong Prue sub-district, village no.5, 6, 9, 10, 11, 12 and 13 3. Huai Yai sub-district, village no.4 4. Nong Pla Lai sub-district, village no.6, 7 and 8
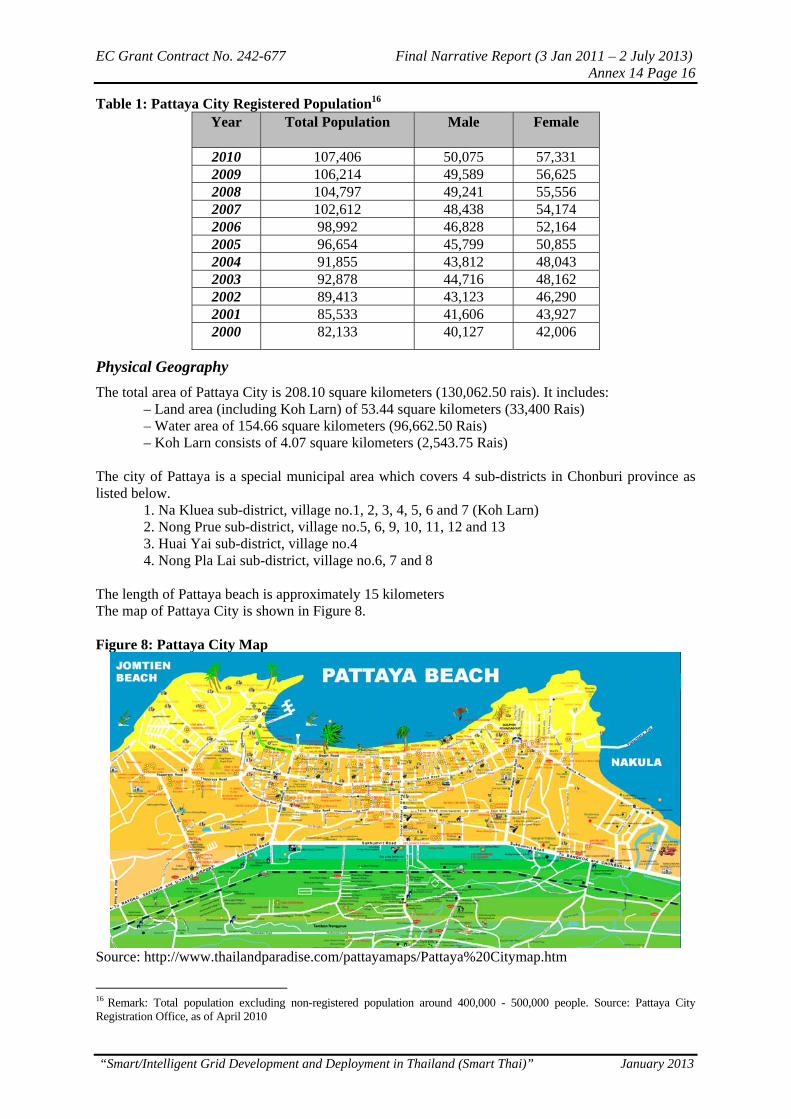
The length of Pattaya beach is approximately 15 kilometers The map of Pattaya City is shown in Figure 8. Figure 8: Pattaya City Map
Source: http://www.thailandparadise.com/pattayamaps/Pattaya%20Citymap.htm
16 Remark: Total population excluding non-registered population around 400,000 - 500,000 people. Source: Pattaya City Registration Office, as of April 2010
EC Grant Contract No. 242-677 Final Narrative Report (3 Jan 2011 – 2 July 2013) Annex 14 Page 17
“Smart/Intelligent Grid Development and Deployment in Thailand (Smart Thai)” January 2013
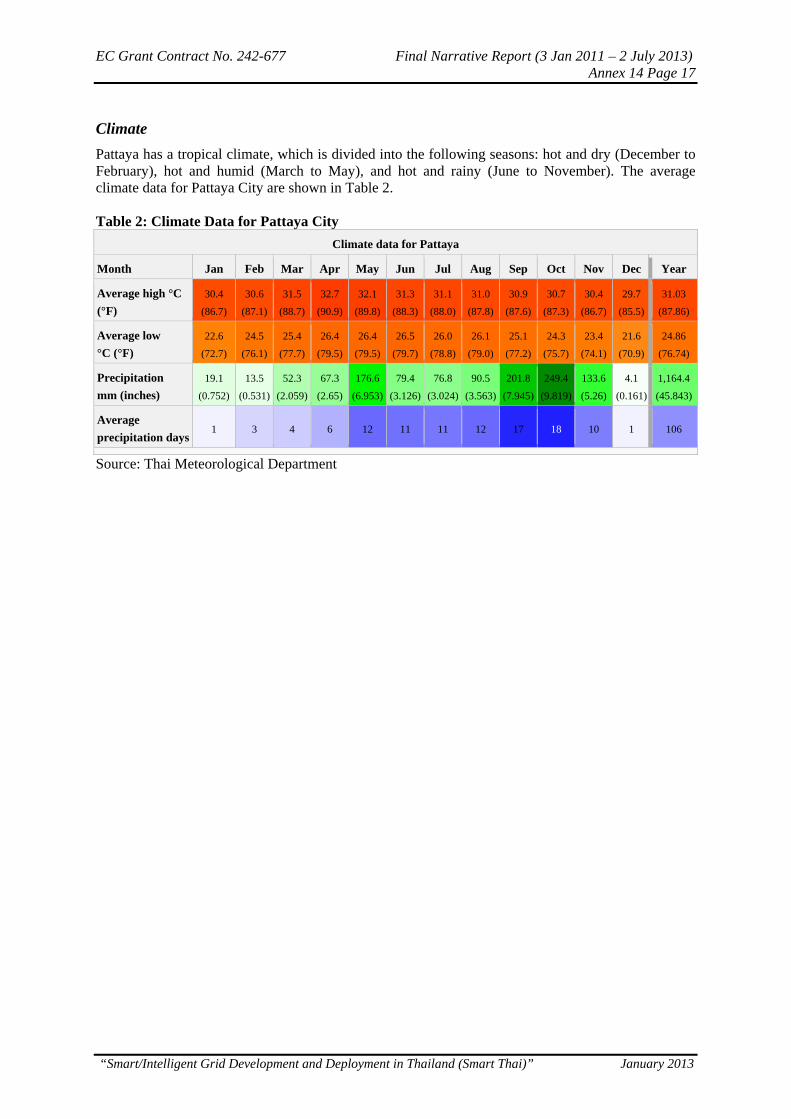
Climate
Pattaya has a tropical climate, which is divided into the following seasons: hot and dry (December to February), hot and humid (March to May), and hot and rainy (June to November). The average climate data for Pattaya City are shown in Table 2. Table 2: Climate Data for Pattaya City
Climate data for Pattaya
Month Jan Feb Mar Apr May Jun Jul Aug Sep Oct Nov Dec Year
Average high °C
(°F)
30.4
(86.7)
30.6
(87.1)
31.5
(88.7)
32.7
(90.9)
32.1
(89.8)
31.3
(88.3)
31.1
(88.0)
31.0
(87.8)
30.9
(87.6)
30.7
(87.3)
30.4
(86.7)
29.7
(85.5)
31.03
(87.86)
Average low
°C (°F)
22.6
(72.7)
24.5
(76.1)
25.4
(77.7)
26.4
(79.5)
26.4
(79.5)
26.5
(79.7)
26.0
(78.8)
26.1
(79.0)
25.1
(77.2)
24.3
(75.7)
23.4
(74.1)
21.6
(70.9)
24.86
(76.74)
Precipitation
mm (inches)
19.1
(0.752)
13.5
(0.531)
52.3
(2.059)
67.3
(2.65)
176.6
(6.953)
79.4
(3.126)
76.8
(3.024)
90.5
(3.563)
201.8
(7.945)
249.4
(9.819)
133.6
(5.26)
4.1
(0.161)
1,164.4
(45.843)
Average
precipitation days 1 3 4 6 12 11 11 12 17 18 10 1 106
Source: Thai Meteorological Department

EC Grant Contract No. 242-677 Final Narrative Report (3 Jan 2011 – 2 July 2013) Annex 14 Page 18
“Smart/Intelligent Grid Development and Deployment in Thailand (Smart Thai)” January 2013
2. TECHNICAL OVERVIEW AND ANALYSIS
One of the objectives of the feasibility study (FS) is to determine the technical feasibility of the Smart Grid system to be implemented on a pilot site. It aims at investigating the range of potential technical solutions and the economics of implementing the Smart Grid system in the pilot area. The assessment of the feasibility study is based on the output of the computer simulation model for Smart Grid system developed under the Smart Thai project. The test site of the computer simulation model and the study site used in conducting the technical and economic feasibility was selected in accordance with the PEA Smart Grid Roadmap. The fact that Smart Grid is very broad, the need for some limitation of the scope of the FS becomes apparent. The technical review is therefore based on the PEA proposed pilot project in Pattaya City. This Smart Grid technical review will consider three Smart Grid technology components that will be directly implemented by PEA through the upgrading of their distribution system and metering infrastructure. These are: a) Advanced Metering Infrastructure (AMI) focusing on Smart Meter; b) Substation Automation (SA) focusing on IEC 61850 Standards implementation; and c) Distribution Management System (DMS) focusing on Fault Detection, Isolation and Restoration (FDIR) using Remote Terminal Unit (RTU). The review will investigate the range of potential technical solutions, benefits, and challenges behind these activities.
2.1 ADVANCED METERING INFRASTRUCTURE (SMART METERS)
Deploying an Advanced Metering Infrastructure (AMI) is a fundamental step to grid modernisation. AMI provides the framework for meeting one of the Smart Grid’s principal characteristics, i.e. the consumer participation or Demand Response (DR). AMI is not a single technology implementation, but rather a complex infrastructure that must be integrated into existing and new utility processes and applications. Three features constitute the AMI system: “smart” meters, a two-way communications network and the information technology systems to support their interaction. AMI uses internal communications systems to convey real-time energy use and load information to both the utility and to the customer as shown in Figures 9 and 10.
EC Grant Contract No. 242-677 Final Narrative Report (3 Jan 2011 – 2 July 2013) Annex 14 Page 19
“Smart/Intelligent Grid Development and Deployment in Thailand (Smart Thai)” January 2013
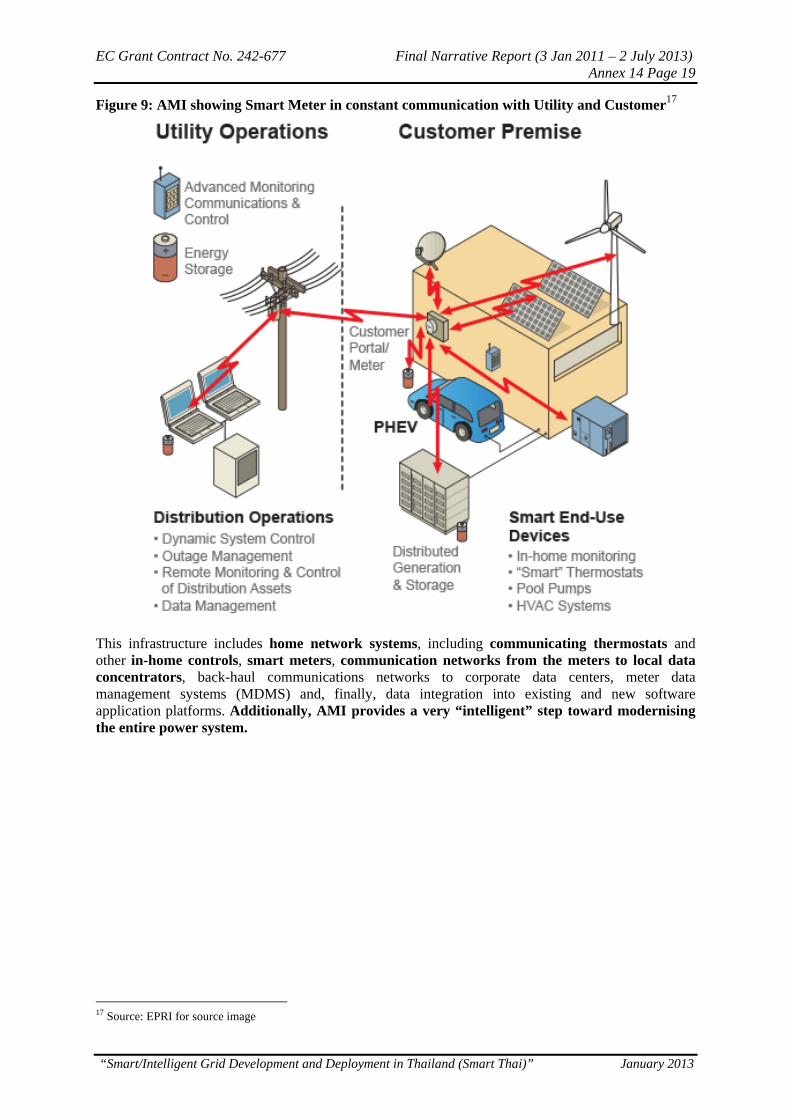
Figure 9: AMI showing Smart Meter in constant communication with Utility and Customer17
This infrastructure includes home network systems, including communicating thermostats and other in-home controls, smart meters, communication networks from the meters to local data concentrators, back-haul communications networks to corporate data centers, meter data management systems (MDMS) and, finally, data integration into existing and new software application platforms. Additionally, AMI provides a very “intelligent” step toward modernising the entire power system.
17 Source: EPRI for source image
EC Grant Contract No. 242-677 Final Narrative Report (3 Jan 2011 – 2 July 2013) Annex 14 Page 20
“Smart/Intelligent Grid Development and Deployment in Thailand (Smart Thai)” January 2013
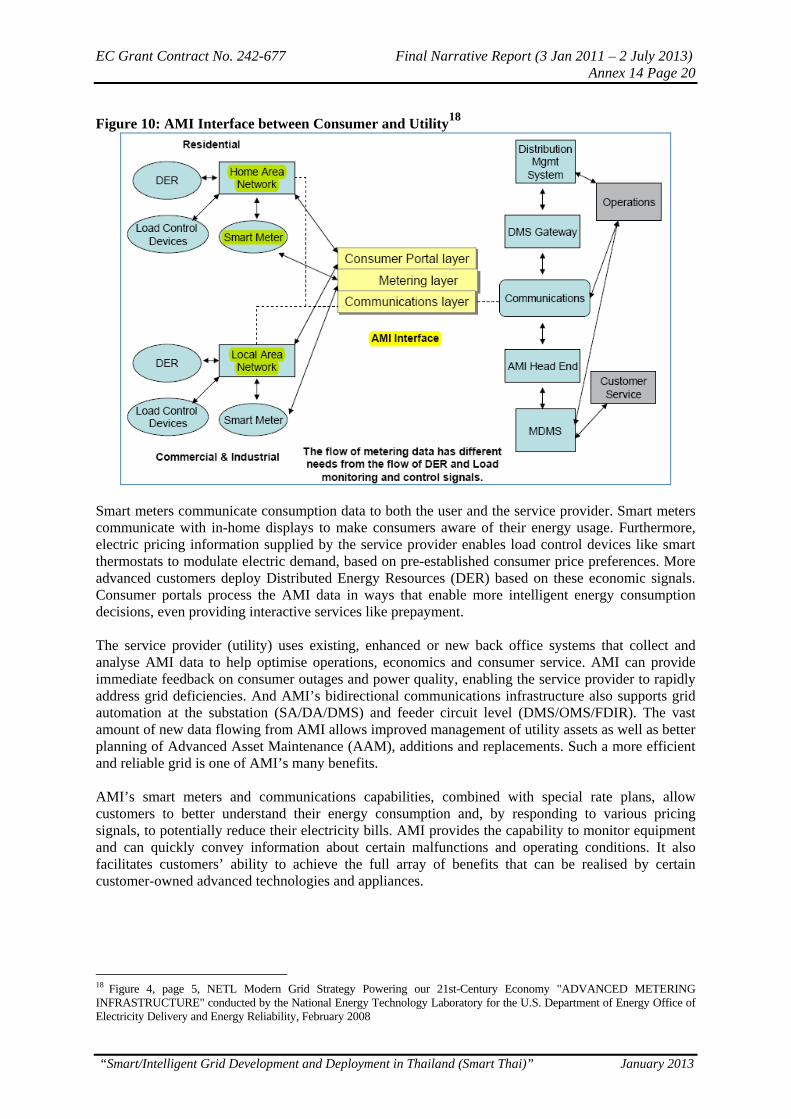
Figure 10: AMI Interface between Consumer and Utility18
Smart meters communicate consumption data to both the user and the service provider. Smart meters communicate with in-home displays to make consumers aware of their energy usage. Furthermore, electric pricing information supplied by the service provider enables load control devices like smart thermostats to modulate electric demand, based on pre-established consumer price preferences. More advanced customers deploy Distributed Energy Resources (DER) based on these economic signals. Consumer portals process the AMI data in ways that enable more intelligent energy consumption decisions, even providing interactive services like prepayment. The service provider (utility) uses existing, enhanced or new back office systems that collect and analyse AMI data to help optimise operations, economics and consumer service. AMI can provide immediate feedback on consumer outages and power quality, enabling the service provider to rapidly address grid deficiencies. And AMI’s bidirectional communications infrastructure also supports grid automation at the substation (SA/DA/DMS) and feeder circuit level (DMS/OMS/FDIR). The vast amount of new data flowing from AMI allows improved management of utility assets as well as better planning of Advanced Asset Maintenance (AAM), additions and replacements. Such a more efficient and reliable grid is one of AMI’s many benefits. AMI’s smart meters and communications capabilities, combined with special rate plans, allow customers to better understand their energy consumption and, by responding to various pricing signals, to potentially reduce their electricity bills. AMI provides the capability to monitor equipment and can quickly convey information about certain malfunctions and operating conditions. It also facilitates customers’ ability to achieve the full array of benefits that can be realised by certain customer-owned advanced technologies and appliances.
18 Figure 4, page 5, NETL Modern Grid Strategy Powering our 21st-Century Economy "ADVANCED METERING INFRASTRUCTURE" conducted by the National Energy Technology Laboratory for the U.S. Department of Energy Office of Electricity Delivery and Energy Reliability, February 2008
EC Grant Contract No. 242-677 Final Narrative Report (3 Jan 2011 – 2 July 2013) Annex 14 Page 21
“Smart/Intelligent Grid Development and Deployment in Thailand (Smart Thai)” January 2013
2.1.1 SMART METER STANDARD FEATURES AND FUNCTIONALITIES
Of special interest is the Smart Meter, which is the heart of AMI, since this will be the focus of PEA’s deployment in their Smart Grid Pilot Project in Pattaya City. Smart meters are solid-state programmable devices that perform many functions. Local and global standard19 of features and functionalities are being implemented which incorporate most or all of the following:
• Time-Based Pricing (TBP)
A smart meter is capable of recording consumption that incorporates Time of Day (TOD) and Time of Use (TOU) pricing mechanism to provide option for consumer to limit use of power during peak period (high price) and maximise use during off-peak (low price). More advance features on more advanced electricity market structure will include Critical Peak Pricing (CPP), Real-Time Pricing (RTP) also called dynamic pricing and Peak Load Reduction Credits (PLRC). Combined with a well-designed tariff scheme, this feature enables DR that will reduce peak load considerably.
• Consumption data storage for consumer and utility
A smart meter can record both Active (Watt-hour) and Reactive (VAR-hour) Energy. This enables regulators in implementing power factor incentive schemes and encourages user to implement a power factor programme that improves the overall system efficiency and reduces electricity cost. It can transmit and communicate information on the load and energy consumed in minutes (or seconds) to both utility and consumer. This feature enables and enhances TBP. It automatically resumes operational functionality after loss of power and retains all information held in its data storage prior to such power failure. This feature maintains data integrity and accuracy.
• Net metering
A smart meter is capable of recording exported and imported power (bi-directional flow) of consumers with embedded generator or integrated renewable energy supply like solar panels. Combined with other features, this transforms the passive consumer into an active “prosumer”. Aggregated prosumers can act in a similar way to a power plant by selling their self-generated power.
• Loss of power (and restoration) notification
A smart meter can detect, record and transmit loss and restoration of power notice to both utility and consumer. This feature enables Outage Management System (OMS) and improves the system reliability through real-time outage information. OMS reduces the impact of outages by reducing the time and resources used to deal with them, through automated call-taking, prediction and the integration of AMI and Integrated Voice Response (IVR). In simpler terms, it predicts the location of a failed fuse or breaker, prioritises restoration efforts, provides information on the extent of outages, calculates restoration times and manages repair crews. Some experts believed that the US could have recovered from Hurricane Sandy much better had they invested in this smart grid upgrade.
• Remote turn-on / turn-off operations (Load Switch)
A smart meter can be remotely turned on and turned off. This feature enables, among others, demand response mechanisms on voluntary load shedding during emergency and contingency plans. This enables Aggregated Energy Management services like the one provided by EnerNOC20 which manly provides demand response services that maintain real-time balance between electricity supply and demand. This energy management services provide solutions for energy conservation and efficiency.
19 Smart Metering Implementation Programme / Smart Metering Technical Equipment” prepared by Department of Energy and Climate Change. Draft provided to Parliament’s libraries dated September 2012. UK 20 http://en.wikipedia.org/wiki/EnerNOC#Notable_work

EC Grant Contract No. 242-677 Final Narrative Report (3 Jan 2011 – 2 July 2013) Annex 14 Page 22
“Smart/Intelligent Grid Development and Deployment in Thailand (Smart Thai)” January 2013
A smart meter can determine when power supply usage exceeds predetermined value such as contracted load, record and count the number of such occurrences, and send alert notice. Depending upon the existing contract, supply can be disabled. This protects the user from equipment overload. This provides distribution utility better Energy Planning Management (EPM) and improves operation.
• Energy prepayment
A smart meter can provide prepaid service options which allow users to better manage their energy consumption and optimise their budget allocation without the usual problem of accumulated unpaid bills. Utility in return can provide “pay-as-you-go” special rates since utility gains from advance payment for future consumption and simplified billing and collection operation. Utilities will also be insured of receiving payment from all customers, regardless of income levels.
• Power quality monitoring and control
A smart meter can detect, record and communicate notices on abnormal power quality beyond acceptable standards. Power quality monitored includes over and under voltages. Recent development in smart meter application includes Conservation Voltage Reduction (CVR) or Volt/VAR optimisation during peak periods that does not affect the performance of the equipment and appliances. This feature achieves not only the peak-shaving potential or the reduction of the peak load requirement of the grid but also lessens consumer energy consumption without sacrifice or involvement on his part.
• Tamper and energy theft detection
A smart meter has security features that can detect any attempt of unauthorised physical access through its secure perimeter casing. It can provide evidence of such an attempt through the use of tamper evident coatings or seals. When reasonably practical, it can generate entry in its Security log and can send an alert notice via its available interface and disable the supply. It has also security features that can detect and prevent, on all of its interfaces, unauthorised access that could compromise the confidentiality and/or data integrity of personal data, security credentials, firmware and other data essential for ensuring its integrity. Any such detection can generate entry in its Security log and can send an alert notice via its available interface. These features will deter power theft and drastically reduce non-technical system loss and consequently improve overall system efficiency.
• Communications with other intelligent devices in the home
A smart meter can establish open standard bi-directional communication links via each of its interfaces including consumer devices and microgeneration meters (e.g. rooftop solar panels and micro wind turbines) over the HAN interface and WAN interface. This feature enables real-time demand response and as a consequence more dynamic pricing schemes. It includes security features that authenticates the source, verifies the recipient and the command and validates its content and format. WAN interface can be in the form of any of the following technology depending on its availability as well as practical and technical considerations: • Power Line Carrier (PLC) • Broadband over Power Lines (BPL) • Copper or optical fiber • Wireless (Radio frequency), either centralised or a distributed mesh
EC Grant Contract No. 242-677 Final Narrative Report (3 Jan 2011 – 2 July 2013) Annex 14 Page 23
“Smart/Intelligent Grid Development and Deployment in Thailand (Smart Thai)” January 2013
• Internet • Public networks (landline, cellular, paging) • Combinations of the above
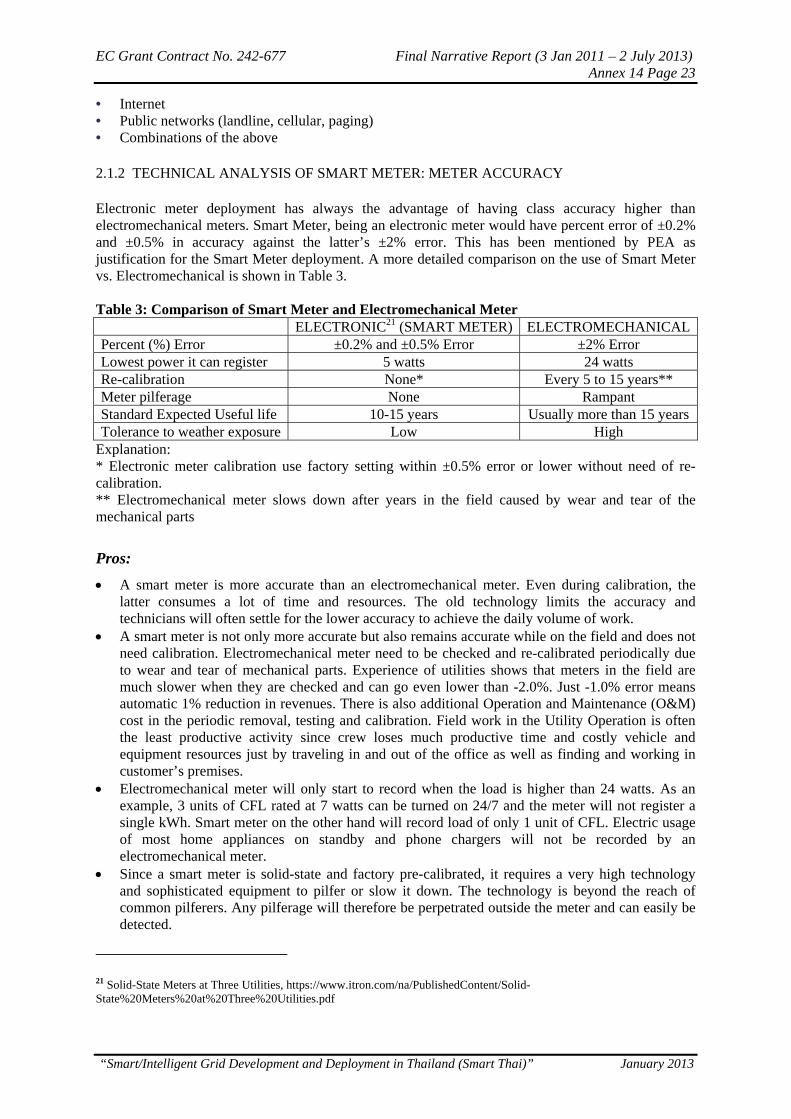
2.1.2 TECHNICAL ANALYSIS OF SMART METER: METER ACCURACY
Electronic meter deployment has always the advantage of having class accuracy higher than electromechanical meters. Smart Meter, being an electronic meter would have percent error of ±0.2% and ±0.5% in accuracy against the latter’s ±2% error. This has been mentioned by PEA as justification for the Smart Meter deployment. A more detailed comparison on the use of Smart Meter vs. Electromechanical is shown in Table 3. Table 3: Comparison of Smart Meter and Electromechanical Meter ELECTRONIC21 (SMART METER) ELECTROMECHANICALPercent (%) Error ±0.2% and ±0.5% Error ±2% Error Lowest power it can register 5 watts 24 watts Re-calibration None* Every 5 to 15 years** Meter pilferage None Rampant Standard Expected Useful life 10-15 years Usually more than 15 years Tolerance to weather exposure Low High
Explanation: * Electronic meter calibration use factory setting within ±0.5% error or lower without need of re-calibration. ** Electromechanical meter slows down after years in the field caused by wear and tear of the mechanical parts
Pros:
A smart meter is more accurate than an electromechanical meter. Even during calibration, the latter consumes a lot of time and resources. The old technology limits the accuracy and technicians will often settle for the lower accuracy to achieve the daily volume of work.
A smart meter is not only more accurate but also remains accurate while on the field and does not need calibration. Electromechanical meter need to be checked and re-calibrated periodically due to wear and tear of mechanical parts. Experience of utilities shows that meters in the field are much slower when they are checked and can go even lower than -2.0%. Just -1.0% error means automatic 1% reduction in revenues. There is also additional Operation and Maintenance (O&M) cost in the periodic removal, testing and calibration. Field work in the Utility Operation is often the least productive activity since crew loses much productive time and costly vehicle and equipment resources just by traveling in and out of the office as well as finding and working in customer’s premises.
Electromechanical meter will only start to record when the load is higher than 24 watts. As an example, 3 units of CFL rated at 7 watts can be turned on 24/7 and the meter will not register a single kWh. Smart meter on the other hand will record load of only 1 unit of CFL. Electric usage of most home appliances on standby and phone chargers will not be recorded by an electromechanical meter.
Since a smart meter is solid-state and factory pre-calibrated, it requires a very high technology and sophisticated equipment to pilfer or slow it down. The technology is beyond the reach of common pilferers. Any pilferage will therefore be perpetrated outside the meter and can easily be detected.
21 Solid-State Meters at Three Utilities, https://www.itron.com/na/PublishedContent/Solid-State%20Meters%20at%20Three%20Utilities.pdf
EC Grant Contract No. 242-677 Final Narrative Report (3 Jan 2011 – 2 July 2013) Annex 14 Page 24
“Smart/Intelligent Grid Development and Deployment in Thailand (Smart Thai)” January 2013
Cons:
While a smart meter has an expected useful life of 15 years, an electromechanical meter is sturdy and will last more than 15 years. As an example, GE I-70 S22, which was manufactured in the 1970s is still a standard meter for most homes around the world. However, there are plenty of meter manufacturers in Asia that will not be that durable and will only be accurate for about 25 years. A smart meter can however easily compensate its shorter life with a better accuracy and other features it provides.
An electromechanical meter as already mentioned, is more durable, even when exposed to the weather. This can be mitigated by providing meter casing and by installing smart meter in secure area.
2.1.3 TECHNICAL ANALYSIS OF SMART METER: APPLICABLE FEATURES AND FUNCTIONALITIES
PEA mentioned that they are implementing two types of meters largely based on the type of customers, namely: (1) Residential and (2) Commercial and Industrial. During the pilot project, PEA will utilise limited smart meter features such as measurement of Active energy, Demand and TOU. In order for PEA to avail the whole range of benefits from Smart Grid implementation, it is important to specify that the smart meter deployed is upgradable. PEA can employ various types of meters and features depending on size and type of customer as well as preferences and programme participations. Customer profiling should also consider the following: Application of Net Metering features to customers with rooftop solar PV, micro wind turbines,
etc. Application of Power Quality features to customers with very low power factor Application of prepayment features to willing customers Participants to Smart Grid programmes such as CVR, extended TOU, prepayment, OMS, DR,
etc. Customer profiling can be done using information available in the utility database although some may need actual field survey. DR using complete AMI feature and DA may take some time.
2.1.4 CONCLUSIONS ON SMART METER
The installation of more than 100,000 smart meters in the pilot area; i.e., Pattaya area will immediately benefit PEA by the increase in accuracy and being less vulnerable from internal meter pilferage which is difficult to check. It is also normal at the start of smart meter deployment that not all benefits from the other features and functionalities can be realised. However, smart meter enables PEA to have more options in terms of improving its operation and quality of service, increasing its reliability and also its profitability. It also enables its customers to avail of DR programs, which will not only reduce customer electric bill but also benefit PEA.
22 GE model number uses the year it is manufactured. There are still GE I-30 meters working perfectly even after some 80 years
EC Grant Contract No. 242-677 Final Narrative Report (3 Jan 2011 – 2 July 2013) Annex 14 Page 25
“Smart/Intelligent Grid Development and Deployment in Thailand (Smart Thai)” January 2013
2.2 IEC 61850 STANDARD IMPLEMENTATION
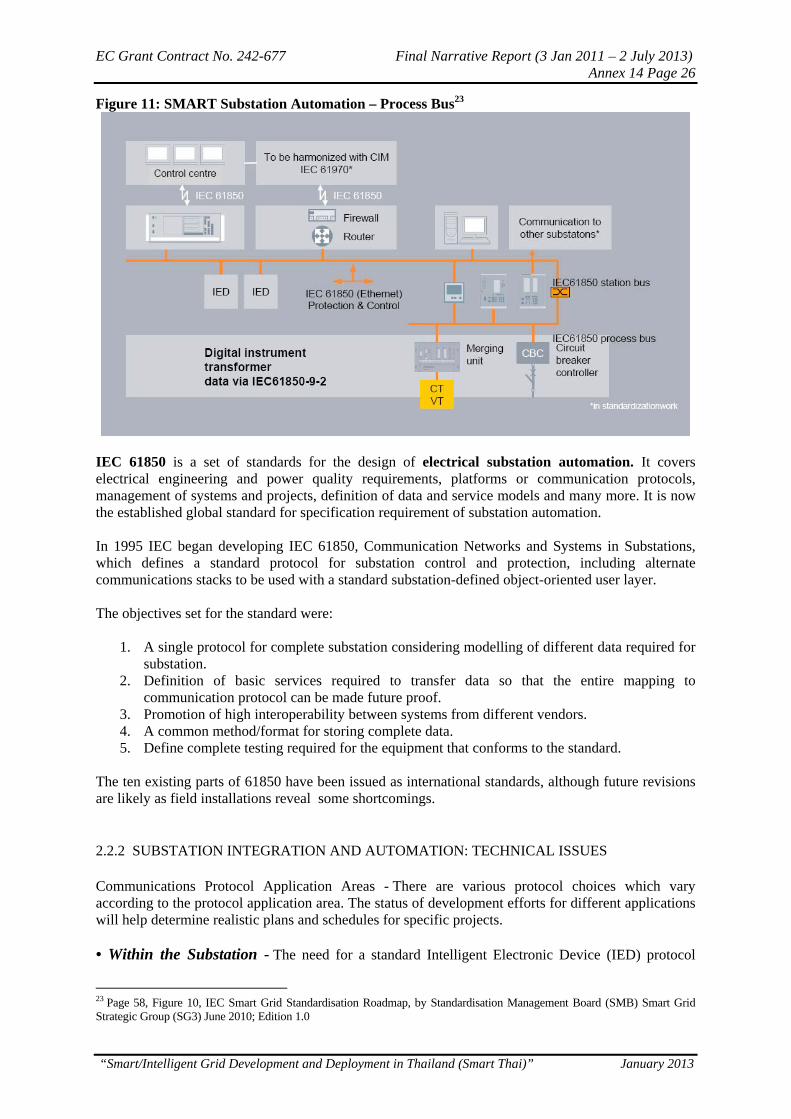
2.2.1 SUBSTATION AUTOMATION (SA) AND IEC 61850 (See Figure 11)
Legacy or traditional substation automation protocols and architectures typically provided basic functionality for power system automation and were designed to accommodate the technical limitations of the Information and Communications Technology (ICT) available for implementation. There has recently been a vast improvement in ICT that has dramatically changed what is now feasible for power system automation in the substation. Technologies such as switched Ethernet, TCP/IP, high-speed WAN, and high-performance low-cost computers are providing capabilities that could barely be imagined when most early substation automation protocols were designed. The possibility to build Substation Automations Systems (SAS) rests on the strong technological development of large-scale integrated circuits, leading to the present availability of advanced, fast, and powerful microprocessors. The result has been an evolution of substation secondary equipment, from electro-mechanical devices to digital devices. This in turn has provided the possibility of implementing Substation Automation (SA) using several Intelligent Electronic Devices (IEDs) to perform the required functions (protection, local and remote monitoring and control, etc.). SA is quite a mature application, which has been performed for many years. Its core functions are: • Protection • Local control and supervision • Remote control and supervision • Equipment supervision • Metering • Measuring • Online diagnosis The integration of substation automation functions into the Smart Grid architecture is accelerating its implementation to new distribution substations. Substation automation equipment, including communications, protective relays, Supervisory Control And Data Acquisition (SCADA) devices, and related sensors is now a significant and mature market and IEC 61850 is the enabling factor in the speedy transformation of substation automation design as shown in Figure 11.
EC Grant Contract No. 242-677 Final Narrative Report (3 Jan 2011 – 2 July 2013) Annex 14 Page 26
“Smart/Intelligent Grid Development and Deployment in Thailand (Smart Thai)” January 2013
Figure 11: SMART Substation Automation – Process Bus23
IEC 61850 is a set of standards for the design of electrical substation automation. It covers electrical engineering and power quality requirements, platforms or communication protocols, management of systems and projects, definition of data and service models and many more. It is now the established global standard for specification requirement of substation automation. In 1995 IEC began developing IEC 61850, Communication Networks and Systems in Substations, which defines a standard protocol for substation control and protection, including alternate communications stacks to be used with a standard substation-defined object-oriented user layer. The objectives set for the standard were:
1. A single protocol for complete substation considering modelling of different data required for substation.
2. Definition of basic services required to transfer data so that the entire mapping to communication protocol can be made future proof.
3. Promotion of high interoperability between systems from different vendors. 4. A common method/format for storing complete data. 5. Define complete testing required for the equipment that conforms to the standard.
The ten existing parts of 61850 have been issued as international standards, although future revisions are likely as field installations reveal some shortcomings.
2.2.2 SUBSTATION INTEGRATION AND AUTOMATION: TECHNICAL ISSUES
Communications Protocol Application Areas - There are various protocol choices which vary according to the protocol application area. The status of development efforts for different applications will help determine realistic plans and schedules for specific projects. • Within the Substation - The need for a standard Intelligent Electronic Device (IED) protocol
23 Page 58, Figure 10, IEC Smart Grid Standardisation Roadmap, by Standardisation Management Board (SMB) Smart Grid Strategic Group (SG3) June 2010; Edition 1.0
EC Grant Contract No. 242-677 Final Narrative Report (3 Jan 2011 – 2 July 2013) Annex 14 Page 27
“Smart/Intelligent Grid Development and Deployment in Thailand (Smart Thai)” January 2013
dates back to the late 1980s. IED suppliers acknowledge that their expertise is in the IED itself – not in two-way communications capability, the communications protocol, or added IED functionality from a remote user. Though the industry made some effort to add communications capability to the IEDs, each IED supplier was concerned that any increased functionality would compromise performance and drive the IED cost so high that no utility would buy it. Therefore, the industry vowed to keep costs competitive and performance high as standardisation was incorporated into the IED. • Substation-to-Utility Enterprise - This is the area of traditional SCADA communication protocols. The Data Acquisition, Processing and Control Systems Subcommittee of the Institute of Electrical and Electronics Engineers Power & Energy Society (IEEE PES) Substations Committee began developing a recommended practice in the early 1980s in an attempt to standardise master/remote communications practices. At that time, each SCADA system supplier had developed a proprietary protocol based on technology available at the time. These proprietary protocols exhibited varied message structures, terminal-to-Data Circuit terminating Equipment (DCE) and DCE-to-channel interfaces, and error detection and recovery schemes. • Communications Interfaces - There are interfaces to substation IEDs to acquire data, determine the operating status of each IED, support all communication protocols used by the IEDs, and support standard protocols being developed. There may be an interface to the Energy Management System (EMS) that allows system operators to monitor and control each substation and the EMS to receive data from the substation integration and automation system at different times. There may be an interface to the distribution management system with the same capabilities as the EMS interface. • Protocol and IEC 61850- A communication protocol allows communication between two devices. The devices must have the same protocol (and version) implemented. There are two capabilities a utility considers for an IED. The primary capability of an IED is its standalone capabilities, such as protecting the power system for a relay IED. The secondary capability of an IED is its integration capabilities, such as its physical interface (e.g., RS-232, RS-485, Ethernet) and its communication protocol (e.g. DNP3, Modbus, IEC 61850 MMS). This is where IEC 61850 Standard protocol for substation control and protection and communication plays a crucial part in any Smart Grid deployment. • Utility Communication Architecture - The use of international protocol standards is now recognised throughout the electric utility industry as a key to successful integration of the various parts of the electric utility enterprise. One area addresses substation integration and automation protocol standardisation efforts. • IEC 61850 Standardisation - Since its publication in 2004, the IEC 61850 communication standard has became more and more relevant in the field of substation automation. It provides an effective response to the needs of the open, deregulated energy market, which requires both reliable networks and extremely flexible technology – flexible enough to adapt to the substation challenges of the next twenty years. IEC 61850 has not only taken over the drive of the communication technology of the office networking sector, but it has also adopted the best possible protocols and configurations for high functionality and reliable data transmission. Industrial Ethernet, which has been hardened for substation purposes and provides a speed of 100 Mbit/s, offers enough bandwidth to ensure reliable information exchange between IEDs, as well as reliable communication from an IED to a substation controller. The definition of an effective process bus offers a standardised way to digitally connect conventional as well as intelligent CTs and VTs to relays. More than just a protocol, IEC 61850 also provides benefits in the areas of engineering and maintenance, especially with respect to combining devices from different vendors.
EC Grant Contract No. 242-677 Final Narrative Report (3 Jan 2011 – 2 July 2013) Annex 14 Page 28
“Smart/Intelligent Grid Development and Deployment in Thailand (Smart Thai)” January 2013
Key features of IEC 6185024
As in an actual project, the standard includes parts describing the requirements needed in substation communication, as well as parts describing the specification itself. The specification is structured as follows: An object-oriented and application-specific data model focused on substation automation. This model includes features representing nearly all existing equipment and functions in a
substation – circuit breakers, protection functions, current and voltage transformers, waveform recordings, and many more.
Communication services providing multiple methods for information exchange. These services cover reporting and logging of events, control of switches and functions and polling of data model information.
Peer-to-peer communication for fast data exchange between the feeder level devices (protection devices and bay controller) is supported with Generic Object Oriented Substation Event (GOOSE).
Support of sampled value exchange. File transfer for disturbance recordings. Communication services to connect primary equipment such as instrument transducers to relays. Decoupling of data model and communication services from specific communication
technologies. This technology independence guarantees long-term stability for the data model and opens up the
possibility to switch over to feature communication technologies. Today, the standard uses Industrial Ethernet with the following significant features:
- 100 Mbit/s bandwidth - Non-blocking switching technology - Priority tagging for important messages - Time synchronisation
A common formal description code, which allows a standardised representation of a system’s data model and its links to communication services.
This code, called SCL (Substation Configuration Description Language), covers all communication aspects according to IEC 61850. Based on Extensible Markup Language (XML), this code is an ideal electronic interchange format for configuration data.
A standardised conformance test which ensures interoperability between devices. Devices must pass multiple test cases: positive tests for correctly responding to stimulation
telegrammes, plus several negative tests for ignoring incorrect information. IEC 61850 offers a complete set of specifications covering all communication issues inside a
substation.
2.2.3 TECHNICAL ANALYSIS ON IEC 61850 STANDARD
Choosing the Right Protocol – Vendor specific and dependent interfaces vs. IEC 61850 Standard Compliant interfaces Before the establishment of IEC 61850, substation controls use proprietary, vendor dependent software and hardware interfaces. Without IEC 61850, power utility protection, control and automation would have different vendor specific solutions using regional and preferred utility standards. This resulted to incompatibility and non-interoperability of equipment. Additional interfaces cost a lot of money, result in relatively poor performance, errors, conflicts, glitches and additional expenses on regular software updates or hardware upgrades.
24 IEC Smart Grid Standardisation Roadmap, by Standardisation Management Board (SMB) Smart Grid Strategic Group (SG3) June 2010; Edition 1.0
EC Grant Contract No. 242-677 Final Narrative Report (3 Jan 2011 – 2 July 2013) Annex 14 Page 29
“Smart/Intelligent Grid Development and Deployment in Thailand (Smart Thai)” January 2013
There are several factors to consider when choosing the right protocol for the application. First, determine the most concerning system area such as the protocol from a SCADA master station to the SCADA RTUs, a protocol from substation IEDs to an RTU or a PLC, or a LAN in the substation. Second, the timing of the installation shall be determined, e.g., 6 months, 18 to 24 months, or 3 to 5 years. In some application areas, technology is changing so fast that the timing of installation can have a great impact on the protocol choice. Using IEC 61850 compliant gadgets and equipment will provide smooth operation and interoperability for at least the next 20 years or more.
2.2.4 CONCLUSION ON IEC 61850 STANDARD
PEA will greatly benefit from the use of IEC 61850-compliant substation equipment. It is not only the complete SA that could be properly implemented but, there will also be assurance that interoperability to new equipment or gadget will not be a problem for a near future.
2.3 DISTRIBUTION FEEDER AUTOMATION (FEEDER REMOTE TERMINAL UNIT)
2.3.1 INTRODUCTION ON FEEDER AUTOMATION
When AMI and smart meter deployments begin, the next major focus area for Smart Grid projects is Distribution Automation (DA) and Distribution Management System (DMS). In particular, the automated isolation and restoration of distribution feeder faults is one application that can have significant impact on improving system reliability and quality of service. The value of new intelligent power meters and home area networks is largely dependent on a reliable and efficient distribution system that delivers quality power to the consumer. Fault management plays a greater role in the operation of distribution systems. It is imperative to localise faults in the distribution network (feeders) as precisely as possible in order to be able to restore power as quickly as possible to those sections of the network which have been de-energised although they are not faulty. For this purpose, there are applications and equipment designed for distribution system operation which narrows down the fault location as much as possible by analysing the fault messages and proposes ways of isolating the operational equipment which is suspected of being faulty. After that equipment has been isolated, switching proposals are then formulated whereby voltage can be restored to the fault-free but de-energised sections of the system without causing overload situations. Installing Feeder RTUs at strategic location along the distribution network enables such a process.
FEEDER Remote Terminal Unit (RTU)
An RTU (sometimes referred to as a Remote Telemetry Unit or Remote Terminal Unit) is a stand-alone data acquisition and control unit, generally microprocessor based, that monitors and controls equipment at a remote location. Its primary task is to control and acquire data from process equipment at a remote location and to transfer this data back to a central station. It generally has the facility of having its configuration and control programs dynamically downloaded from some central station. Although, traditionally, the RTU communicates back to some central station, it is also possible to communicate on a peer-to-peer basis with other RTUs. The RTU can also act as a relay station (sometimes referred to as a store and forward station) to another RTU that may not be accessible from the central station25.
25 Gordon R. Clarke, Deon Reynders, Edwin Wright, Practical modern SCADA protocols: DNP3, 60870.5 and related systems Newnes, 2004 ISBN 0-7506-5799-5 pages 19-21
EC Grant Contract No. 242-677 Final Narrative Report (3 Jan 2011 – 2 July 2013) Annex 14 Page 30
“Smart/Intelligent Grid Development and Deployment in Thailand (Smart Thai)” January 2013
An RTU monitors the field digital and analog parameters and transmits data to the Central Monitoring Station. An RTU can be interfaced with the Central Station with different communication media (usually serial (RS232, RS485, RS422) or Ethernet). RTU can support standard protocols (Modbus, IEC 60870-5-101/103/104, DNP3, IEC 60870-6-ICCP, IEC 61850, etc.) to interface any third party software26.
Modern RTUs are usually capable of executing simple programmes autonomously without involving the host computers of the Distribution Control System (DCS) or SCADA system to simplify deployment, and to provide redundancy for safety reasons. The flexible and modular designed RTU provide a complete solution with many integrated functions. The scalability of the system allows perfect adaptation for station reinforcement, retrofit and upgrades. The open architecture of the RTU supports adaptation to different applications. Future functional and quantitative extensions are easy to realise at any time through hardware or software upgrade for various applications on Distribution and Feeder Automation.
“Self-healing” feeder networks are typically implemented using two approaches: scripted (rules-based) or model driven. The model-driven approach is often referred to by various acronyms, including FDIR (Fault Detection, Isolation and Restoration) and FLISR (Fault Location, Isolation and Service Restoration). This automated detection of feeder faults and reconfiguration to restore power to un-faulted sections is a Distribution Automation application that has now been around for many years. It can be argued that FDIR is a true Smart Grid application that was somewhat ahead of its time.
Increased Focus on Reliability & Performance
Since the late 1990s, utility performance regulations (reward/ penalty structures) and increasing penetration of distributed energy resources and microgrids have increased pressure on utilities to respond efficiently to distribution faults and quickly restore power to as many customers as possible. The automated fault handling performed by FDIR provides many benefits to the utility and the customer. These benefits include:
Shorter outage durations Fewer sustained outages Improved performance indices Enhanced operational efficiencies Improved service quality
All restoration technologies share the same core objectives; that is, to:
Accurately detect and locate feeder faults Isolate the faulted portion(s) of the feeder Restore power as quickly as possible (upstream and/or downstream of the faulted section).
FDIR is traditionally deployed as an advanced system-level application running on the Distribution Management System (DMS) in the control center. In recent years, some other methods of applying feeder restoration technology have entered the marketplace. There are still essentially two basic types of self-healing feeder architectures in use, i.e. distributed or centralised.
The distributed approach moves the automation intelligence out into the devices located along the feeders using scripted logic and peer-to-peer communication, while the centralised approach utilises a control-center based algorithm and requires direct communication between the control center and the devices in the field.
26 Remote Terminal Unit, Wikipedia
EC Grant Contract No. 242-677 Final Narrative Report (3 Jan 2011 – 2 July 2013) Annex 14 Page 31
“Smart/Intelligent Grid Development and Deployment in Thailand (Smart Thai)” January 2013
2.3.2 TECHNICAL ANALYSIS ON FEEDER RTU: DISTRIBUTED APPROACH
With the distributed approach, controller devices at the switch/ breaker location contain the automation logic needed to restore a selected portion of the network. These devices communicate among themselves in a peer-to-peer fashion to determine where the fault has occurred and to determine the appropriate switching actions necessary for restoration.
Since the intelligence needed for restoration is localised and distributed among the controllers, this approach uses preprogrammed, or scripted, solutions based on a known baseline topology for that section of the network. Since no real-time network model is utilised, the system can have difficulty handling multiple faults and must usually be deactivated if the network is in an abnormal state (e.g. if any temporary switching has been performed).
The controllers in a distributed system are generally vendor specific and often must interface with another automated control or feeder RTU at the switch, or may double as the switch control themselves. In either case, basic controller requirements for FDIR include the ability to detect feeder fault currents, detect voltage loss upstream of the switch, and store historical load data at the switch, which is then used to make downstream restoration switching decisions.
Some of the pros and cons of the decentralised approach are:
Pros: Faster performance; quicker deployment; suitable for small “islands” of automation
Cons: Requires more field maintenance/programming; specialised equipment needed; lack of real-time network model limits flexibility; unnecessary switch operations performed by opening up all switches before isolating the fault
2.3.3 TECHNICAL ANALYSIS ON FEEDER RTU: CENTRALISED APPROACH
The centralised architecture is a model-driven solution and typically involves running FDIR as a subsystem of the distribution management system at the control center. Since the restoration intelligence is resident within the DMS, no specialised controllers are required at the substation or switch. This allows the utility to leverage automated controls that may already be in place. If these switch or recloser controls are capable of fault current detection, then no additional hardware may be required at all. If the fault detection capability is not provided by the switch control, then there are a number of low-cost RTU options available that can provide the needed telemetry.
Unlike the pre-programmed logic used in the distributed scheme, centralised FDIR utilises a real-time load flow model of the network, meaning restoration actions can take place even if abnormal network conditions exist. It handles multiple fault scenarios effectively. It makes possible more complex switching scenarios and load-transfer decisions such as a secondary load transfer to create additional capacity on the alternate feeder.
Using the model and the telemetered data, the FDIR application develops a switching sequence to restore as many de–energised feeder sections as possible using a minimum number of switching actions within the allowed overload and voltage drop limits of the impacted feeders and power sources. Another advantage of the centralised scheme is that FDIR can be configured to operate in a semi-automatic or automatic mode. In semi-automatic mode, the application creates the necessary restoration-switching plan, but does not perform the actions until approved by the operator.
Some of the pros and cons of the centralised approach include:
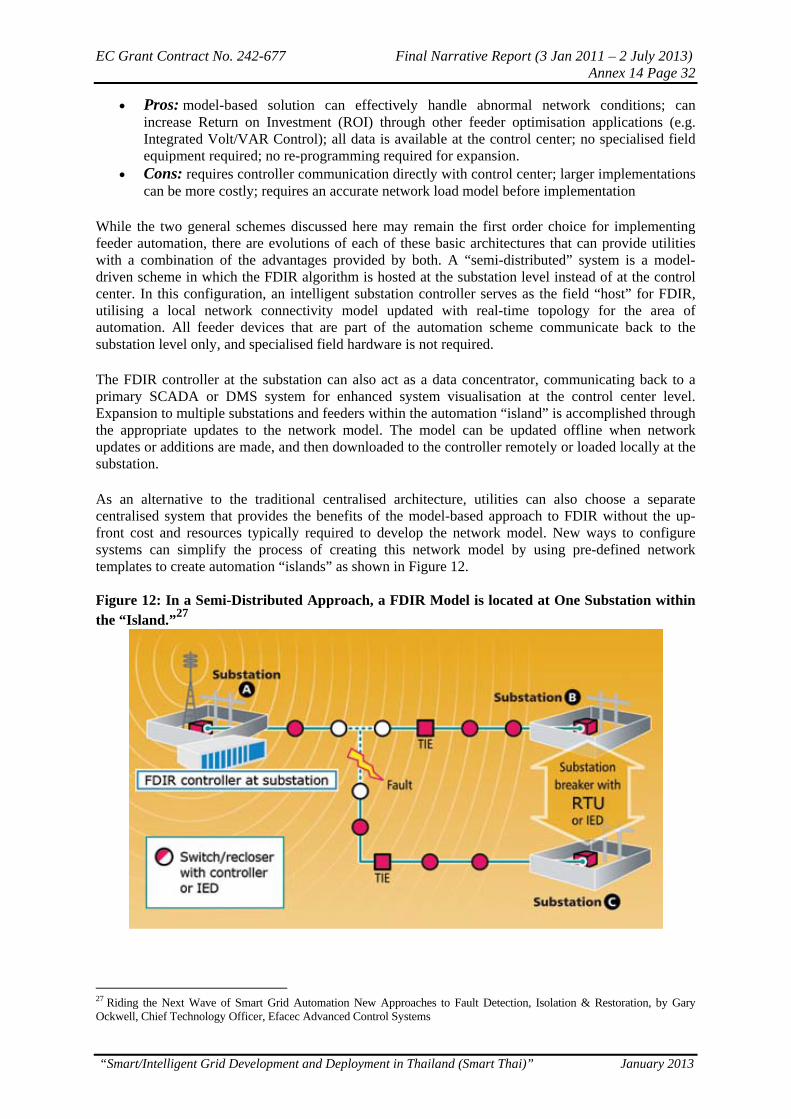
EC Grant Contract No. 242-677 Final Narrative Report (3 Jan 2011 – 2 July 2013) Annex 14 Page 32
“Smart/Intelligent Grid Development and Deployment in Thailand (Smart Thai)” January 2013
Pros: model-based solution can effectively handle abnormal network conditions; can increase Return on Investment (ROI) through other feeder optimisation applications (e.g. Integrated Volt/VAR Control); all data is available at the control center; no specialised field equipment required; no re-programming required for expansion.
Cons: requires controller communication directly with control center; larger implementations can be more costly; requires an accurate network load model before implementation
While the two general schemes discussed here may remain the first order choice for implementing feeder automation, there are evolutions of each of these basic architectures that can provide utilities with a combination of the advantages provided by both. A “semi-distributed” system is a model-driven scheme in which the FDIR algorithm is hosted at the substation level instead of at the control center. In this configuration, an intelligent substation controller serves as the field “host” for FDIR, utilising a local network connectivity model updated with real-time topology for the area of automation. All feeder devices that are part of the automation scheme communicate back to the substation level only, and specialised field hardware is not required.
The FDIR controller at the substation can also act as a data concentrator, communicating back to a primary SCADA or DMS system for enhanced system visualisation at the control center level. Expansion to multiple substations and feeders within the automation “island” is accomplished through the appropriate updates to the network model. The model can be updated offline when network updates or additions are made, and then downloaded to the controller remotely or loaded locally at the substation.
As an alternative to the traditional centralised architecture, utilities can also choose a separate centralised system that provides the benefits of the model-based approach to FDIR without the up-front cost and resources typically required to develop the network model. New ways to configure systems can simplify the process of creating this network model by using pre-defined network templates to create automation “islands” as shown in Figure 12. Figure 12: In a Semi-Distributed Approach, a FDIR Model is located at One Substation within the “Island.”27
27 Riding the Next Wave of Smart Grid Automation New Approaches to Fault Detection, Isolation & Restoration, by Gary Ockwell, Chief Technology Officer, Efacec Advanced Control Systems
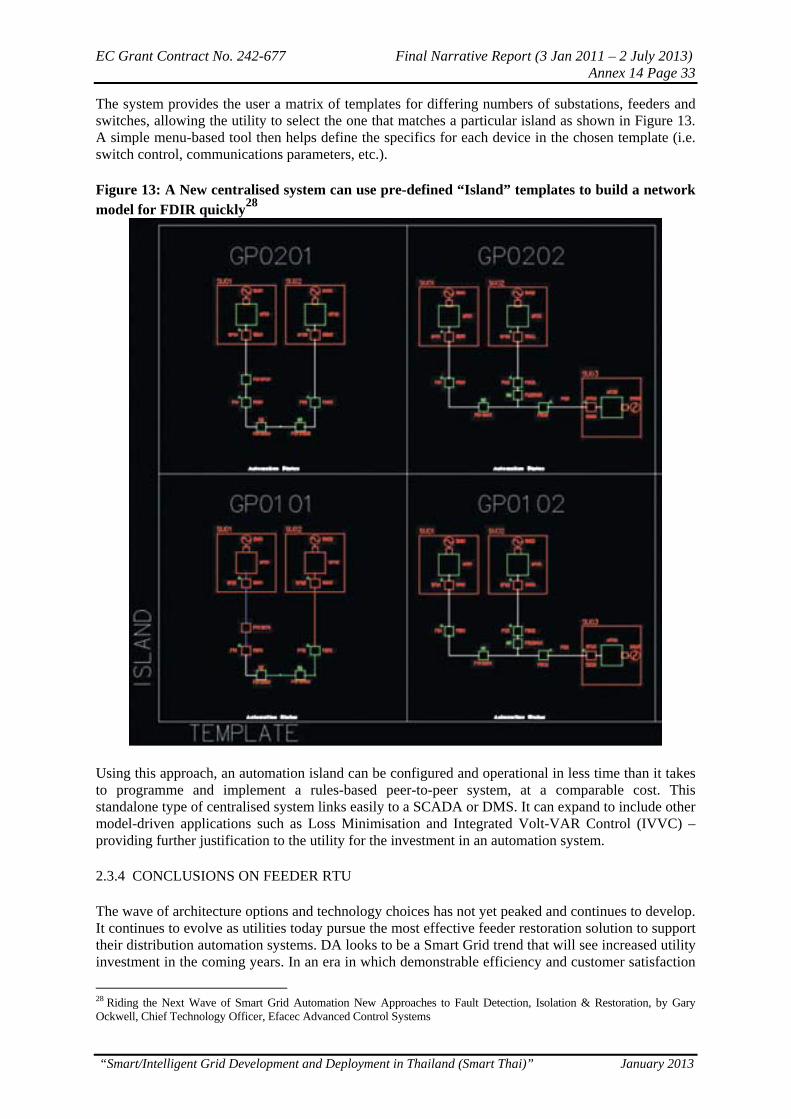
EC Grant Contract No. 242-677 Final Narrative Report (3 Jan 2011 – 2 July 2013) Annex 14 Page 33
“Smart/Intelligent Grid Development and Deployment in Thailand (Smart Thai)” January 2013
The system provides the user a matrix of templates for differing numbers of substations, feeders and switches, allowing the utility to select the one that matches a particular island as shown in Figure 13. A simple menu-based tool then helps define the specifics for each device in the chosen template (i.e. switch control, communications parameters, etc.).
Figure 13: A New centralised system can use pre-defined “Island” templates to build a network model for FDIR quickly28
Using this approach, an automation island can be configured and operational in less time than it takes to programme and implement a rules-based peer-to-peer system, at a comparable cost. This standalone type of centralised system links easily to a SCADA or DMS. It can expand to include other model-driven applications such as Loss Minimisation and Integrated Volt-VAR Control (IVVC) – providing further justification to the utility for the investment in an automation system.
2.3.4 CONCLUSIONS ON FEEDER RTU
The wave of architecture options and technology choices has not yet peaked and continues to develop. It continues to evolve as utilities today pursue the most effective feeder restoration solution to support their distribution automation systems. DA looks to be a Smart Grid trend that will see increased utility investment in the coming years. In an era in which demonstrable efficiency and customer satisfaction
28 Riding the Next Wave of Smart Grid Automation New Approaches to Fault Detection, Isolation & Restoration, by Gary Ockwell, Chief Technology Officer, Efacec Advanced Control Systems
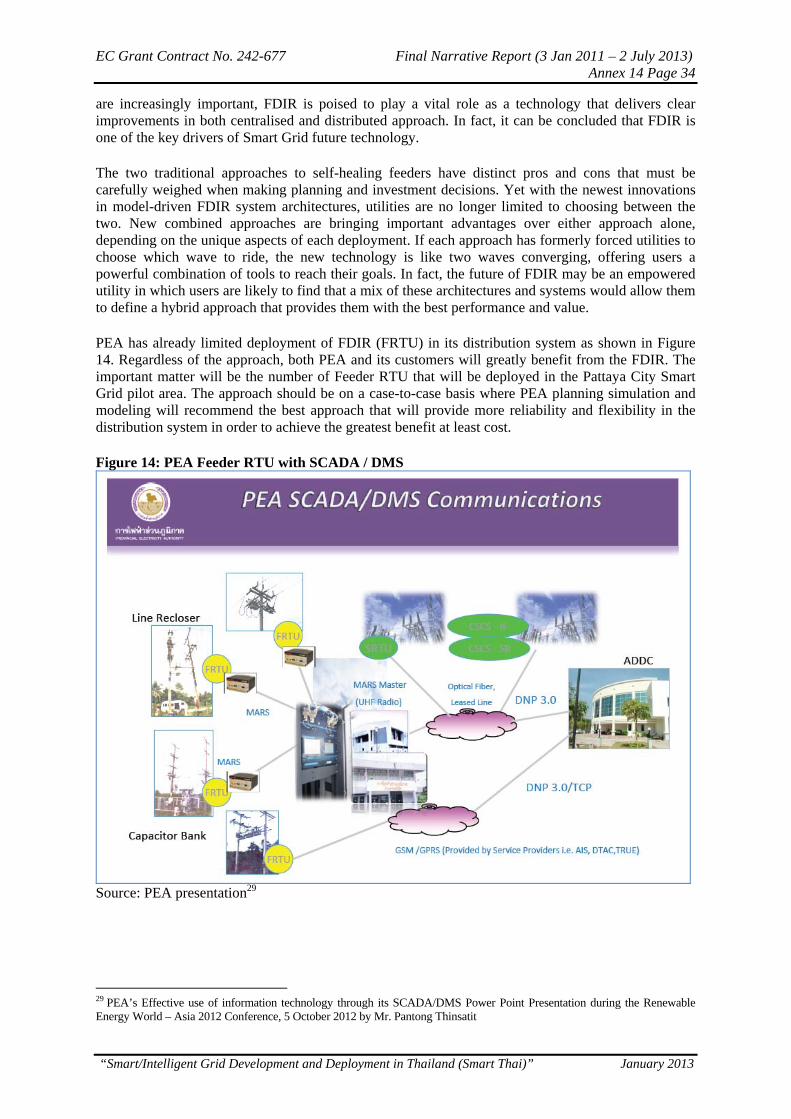
EC Grant Contract No. 242-677 Final Narrative Report (3 Jan 2011 – 2 July 2013) Annex 14 Page 34
“Smart/Intelligent Grid Development and Deployment in Thailand (Smart Thai)” January 2013
are increasingly important, FDIR is poised to play a vital role as a technology that delivers clear improvements in both centralised and distributed approach. In fact, it can be concluded that FDIR is one of the key drivers of Smart Grid future technology.
The two traditional approaches to self-healing feeders have distinct pros and cons that must be carefully weighed when making planning and investment decisions. Yet with the newest innovations in model-driven FDIR system architectures, utilities are no longer limited to choosing between the two. New combined approaches are bringing important advantages over either approach alone, depending on the unique aspects of each deployment. If each approach has formerly forced utilities to choose which wave to ride, the new technology is like two waves converging, offering users a powerful combination of tools to reach their goals. In fact, the future of FDIR may be an empowered utility in which users are likely to find that a mix of these architectures and systems would allow them to define a hybrid approach that provides them with the best performance and value.
PEA has already limited deployment of FDIR (FRTU) in its distribution system as shown in Figure 14. Regardless of the approach, both PEA and its customers will greatly benefit from the FDIR. The important matter will be the number of Feeder RTU that will be deployed in the Pattaya City Smart Grid pilot area. The approach should be on a case-to-case basis where PEA planning simulation and modeling will recommend the best approach that will provide more reliability and flexibility in the distribution system in order to achieve the greatest benefit at least cost.
Figure 14: PEA Feeder RTU with SCADA / DMS
Source: PEA presentation29
29 PEA’s Effective use of information technology through its SCADA/DMS Power Point Presentation during the Renewable Energy World – Asia 2012 Conference, 5 October 2012 by Mr. Pantong Thinsatit
EC Grant Contract No. 242-677 Final Narrative Report (3 Jan 2011 – 2 July 2013) Annex 14 Page 35
“Smart/Intelligent Grid Development and Deployment in Thailand (Smart Thai)” January 2013
3. FINANCIAL ANALYSIS
To determine the financial profitability of the proposed pilot project, a financial analysis is conducted. The financial analysis examines the investments made against the operating revenues and costs generated by the project. To achieve this, a computer financial model was developed to detail the annual financial performance over its entire project life. The financial model was integrated into the simulation model. In the financial analysis, it is assumed that the investment in Smart Grid systems will be made one year before implementation as reflected in the cash flow. Revenues from the smart systems would come from two sources: (1) savings in investment such as capacity investment, transmission and distribution; and (2) savings on operations and maintenance and fuel consumption such as generation O&M costs, generation fuel costs, and feeder O&M costs. The profitability indicators used in the analysis are the pre-tax IRR and Net Present Value (NPV). The base case of the analysis is 5% reduction of the peak load. Scenario analyses were also included such as 10% reduction of the peak load and 15% reduction of the peak load. These scenarios are based on the potential of demand response in peak reduction based on various studies30. The lifetime of the project is 19 years and divided into three investment parts. The first part is from 2012 to 2017, second part is from 2018 to 2023 and the last part is from 2024 to 2030.
3.1 INVESTMENT
The total project investment for the 2012-2017 period is estimated at 1,112.14 million baht. It includes investment in smart system and smart meters. It is assumed that these systems and meters will be replaced over the next periods at the same costs. Details of the investment are in Table 4. Table 4: Investments (Millions of Baht) 2012-2017 2018-2023 2024-2030
Smart System Investment
895.00 895.00 895.00
Smart Meter Investment
217.14 217.14 217.14
Total Investment 1,112.14 1,112.14 1,112.14
Source: Simulation Model
3.2 REVENUES
The business as usual is based on the Power Development Plan of Thailand (PDP). Implementing smart grid systems and meters will result in the saving from investments and O&M costs including fuel consumption. Investments in capacity, transmission and distribution, and feeder will be reduced when Smart Grid systems and meters are in place. Details of the revenue savings are in Table 5. Table 5: Annual Savings from Investment and O&M Costs (Millions of Thai Baht) 2012 - 2017 2018 – 2023 2024 – 2030 Capacity Investment Savings
3.68 1.03 11.41
T&D Investment 3.83 1.27 16.67
30
The various studies are in the Computer Simulation Modelling Report (Annex 15) chapter 3.
EC Grant Contract No. 242-677 Final Narrative Report (3 Jan 2011 – 2 July 2013) Annex 14 Page 36
“Smart/Intelligent Grid Development and Deployment in Thailand (Smart Thai)” January 2013
Savings Feeder Investment Savings
2.04 (0.95) (0.58)
Sub-Total 9.55 1.35 27.5 Generation O&M Cost Savings
1.74 2.01 0.83
Generation Fuel Cost Savings
401.87 1,228.16 1,290.42
Feeder O&M Cost Savings
0.00 0.00 0.00
Sub-Total 403.61 1,230.17 1,291.25 Total 413.16 1,231.51 1,318.75 Source: Simulation Model
3.3 EXPENSES
Implementing the Smart Grid systems and meters will incur additional expenses to the grid. The additional expenses foreseen are shown in Table 6. It was estimated that the operating expenses of the Smart Grid system through its lifetime is 33.53 million Thai baht yearly. Table 6: Annual Operating Expenses of Smart Grid Systems
2012 - 2017 2018 – 2023 2024 – 2030 Smart Systems O&M Cost 26.85 26.85 26.85 Smart Meter O&M Costs 6.68 6.68 6.68 Total 33.53 33.53 33.53
Source: Simulation Model
3.4 RESULTS
The results of the financial analysis are given in Table 7. Table 7: Results of the Financial Analysis
Units Value
Base Case @ 5% Peak Reduction
Nominal Pre-Tax Project IRR % 42.79%
Net Present Value Pre-Tax (NPV) @ 15% Discount Rate mTHB 2,856 The first profitability parameter analysed is the Pre-tax Project IRR. The Project IRR is computed from the “cash flow from operations” or also known as “Earnings Before Interest, Tax, Depreciation and Amortisation (EBITDA)”. This is the expected annual rate of return on the total investment in the project without the effect of the financing and tax structures since there is still no indications where the financing would come from. The results of the financial modelling exercises reveal that the Pre-tax Project IRR is 42.79% with a Net Present Value of 2,856 million Thai Baht at 15% discount rate31.
3.5 SCENARIO ANALYSIS
Scenario analyses were conducted whereby the peak reduction was increased to 10% and 15%. Results of the scenario analysis are presented in Table 8.
31 Projected benchmark for power plants in 2012-13 based on IPP Bidding by the Ayudhya Securities Public Company Limited, November 2007

EC Grant Contract No. 242-677 Final Narrative Report (3 Jan 2011 – 2 July 2013) Annex 14 Page 37
“Smart/Intelligent Grid Development and Deployment in Thailand (Smart Thai)” January 2013
Table 8: Results of the Scenario Analysis
Units 10% Peak Reduction
15% Peak Reduction
Nominal Pre-Tax Project IRR % 48.63% 52.39%Net Present Value Pre-Tax (NPV) @15% Discount Rate mTHB 3,560 3,900
3.6 CONCLUSION ON FINANCIAL ANALYSIS
The resulting financial analysis using certain assumptions and available data indicated that the project is considered to be financially viable, yielding very high Pre-tax Project IRRs. The Pre-tax Project IRR yields more than 40% for the base case scenario.

EC Grant Contract No. 242-677 Final Narrative Report (3 Jan 2011 – 2 July 2013) Annex 14 Page 38
“Smart/Intelligent Grid Development and Deployment in Thailand (Smart Thai)” January 2013
4. ENVIRONMENTAL ANALYSIS: GHG MITIGATION & CDM POTENTIAL
4.1 BACKGROUND
As a there are no Smart Grid systems in Thailand yet, this study on Clean Development Mechanism (CDM) potential and Greenhouse Gases (GHG) mitigation will utilise the output of Smart Grid simulation model developed under the Smart Thai project. The result of computer simulation model for Pattaya City as the pilot site selected for the assessment will be used to calculate for carbon emissions and GHG mitigation for the implementation of Smart Grid system in Thailand. Since Smart Grid system could potentially reduce carbon and GHG emissions, this study will investigate the baseline situation and methodologies involved in order to determine the quantitative potential for GHG emissions of the different penetration scenarios in the country, as well as the potential benefits from CDM or other applicable carbon trading platforms.
4.2 INTRODUCTION
The rise in the average temperature of earth’s atmosphere constitutes the global warming. The earth’s mean surface temperature has increased by about 0.8 C (1.4 F) since early 20th century with about two-thirds of the increase occurring since 1980. Warming of the earth’s climate is clear and scientists are more than 90% certain that it is caused by increasing concentrations of greenhouse gases (GHG) produced by human activities such as burning of fossil fuels and deforestation32. The current climate science advises that the atmospheric Carbon Dioxide (CO2) concentrations should peak below 450 ppm in order to secure a high probability of keeping global temperature increase below 2 C. This requires global emissions to peak in the next decade and decline to roughly 80% below 1990 levels by the year 205033. Such dramatic emissions reductions require a sharp move away from fossil fuel, significant improvements in energy efficiency and substantial re-organisation of our current economic system. This transition can only be achieved by far-reaching national and international climate policies. Carbon offsetting is an increasingly popular means of taking action. By paying someone else to reduce GHG emissions elsewhere, the purchaser of a carbon offset aims to compensate for – or “offset” – their own emissions. Individuals seek to offset their travel emissions and companies claim “climate neutrality” by buying large quantities of carbon offsets to “neutralise” their carbon footprint or that of their products.
4.3 DETERMINATION OF EMISSION REDUCTION IN SMART GRID SYSTEMS
To assess the emission reduction from Smart Grid systems, the generating capacity required to serve the demand should be determined first. In the demand load curve, the peak could potentially be decreased due to the application of the smart systems, therefore power plants serving during peak periods (e.g. diesel plants) could reduce their operating time. These peak operating plants, such as diesel engine power plants, normally have higher emissions. By shifting the peak demand, the intermediate plant, which normally runs with less polluting fuel, is carrying those shifted load. The amount of emission is then reduced (See Figure 15 for illustration).
32 America's Climate Choices. Washington, D.C.: The National Academies Press. 2011. p. 15. ISBN 978-0-309-14585-5. "The average temperature of the Earth’s surface increased by about 1.4 °F (0.8 °C) over the past 100 years, with about 1.0 °F (0.6 °C) of this warming occurring over just the past three decades" 33 Baer and Mastrandrea, 2006
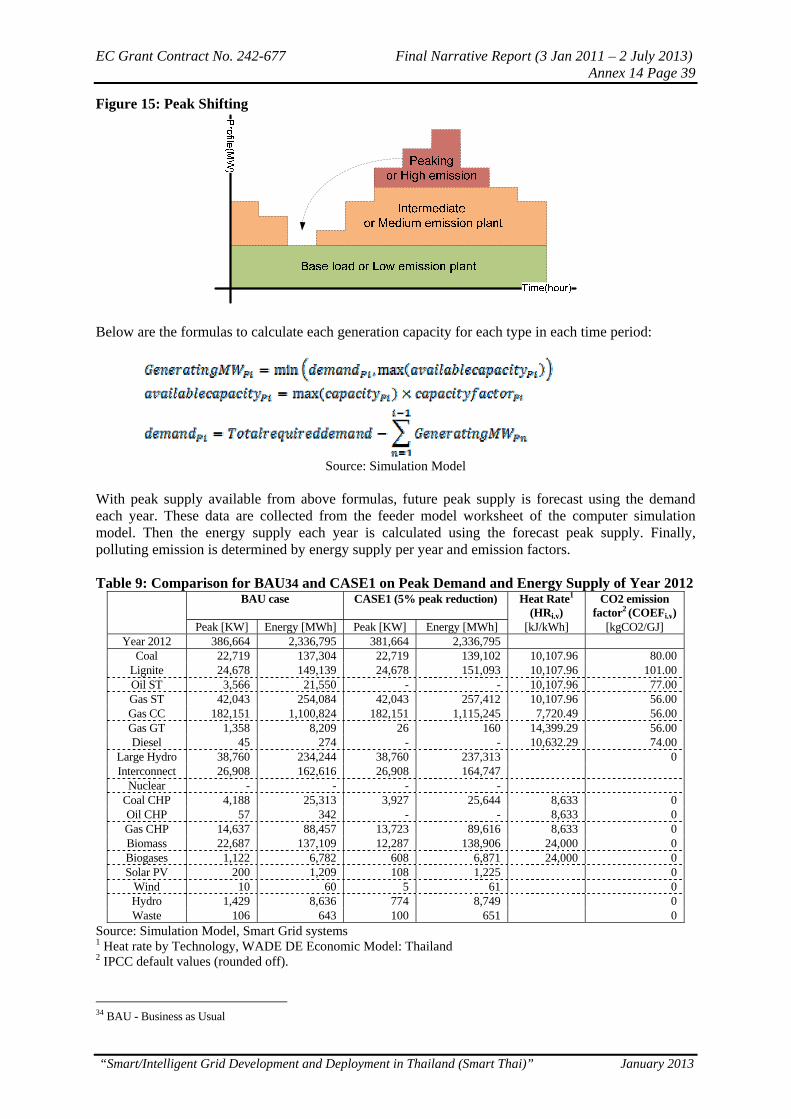
EC Grant Contract No. 242-677 Final Narrative Report (3 Jan 2011 – 2 July 2013) Annex 14 Page 39
“Smart/Intelligent Grid Development and Deployment in Thailand (Smart Thai)” January 2013
Figure 15: Peak Shifting
Below are the formulas to calculate each generation capacity for each type in each time period:
Source: Simulation Model
With peak supply available from above formulas, future peak supply is forecast using the demand each year. These data are collected from the feeder model worksheet of the computer simulation model. Then the energy supply each year is calculated using the forecast peak supply. Finally, polluting emission is determined by energy supply per year and emission factors. Table 9: Comparison for BAU34 and CASE1 on Peak Demand and Energy Supply of Year 2012
BAU case CASE1 (5% peak reduction) Heat Rate1 (HRi,y)
CO2 emission factor2 (COEFi,y)
Peak [KW] Energy [MWh] Peak [KW] Energy [MWh] [kJ/kWh] [kgCO2/GJ] Year 2012 386,664 2,336,795 381,664 2,336,795
Coal 22,719 137,304 22,719 139,102 10,107.96 80.00 Lignite 24,678 149,139 24,678 151,093 10,107.96 101.00 Oil ST 3,566 21,550 - - 10,107.96 77.00 Gas ST 42,043 254,084 42,043 257,412 10,107.96 56.00 Gas CC 182,151 1,100,824 182,151 1,115,245 7,720.49 56.00 Gas GT 1,358 8,209 26 160 14,399.29 56.00 Diesel 45 274 - - 10,632.29 74.00
Large Hydro 38,760 234,244 38,760 237,313 0 Interconnect 26,908 162,616 26,908 164,747
Nuclear - - - - Coal CHP 4,188 25,313 3,927 25,644 8,633 0 Oil CHP 57 342 - - 8,633 0 Gas CHP 14,637 88,457 13,723 89,616 8,633 0 Biomass 22,687 137,109 12,287 138,906 24,000 0 Biogases 1,122 6,782 608 6,871 24,000 0 Solar PV 200 1,209 108 1,225 0
Wind 10 60 5 61 0 Hydro 1,429 8,636 774 8,749 0 Waste 106 643 100 651 0
Source: Simulation Model, Smart Grid systems 1 Heat rate by Technology, WADE DE Economic Model: Thailand 2 IPCC default values (rounded off).
34 BAU - Business as Usual
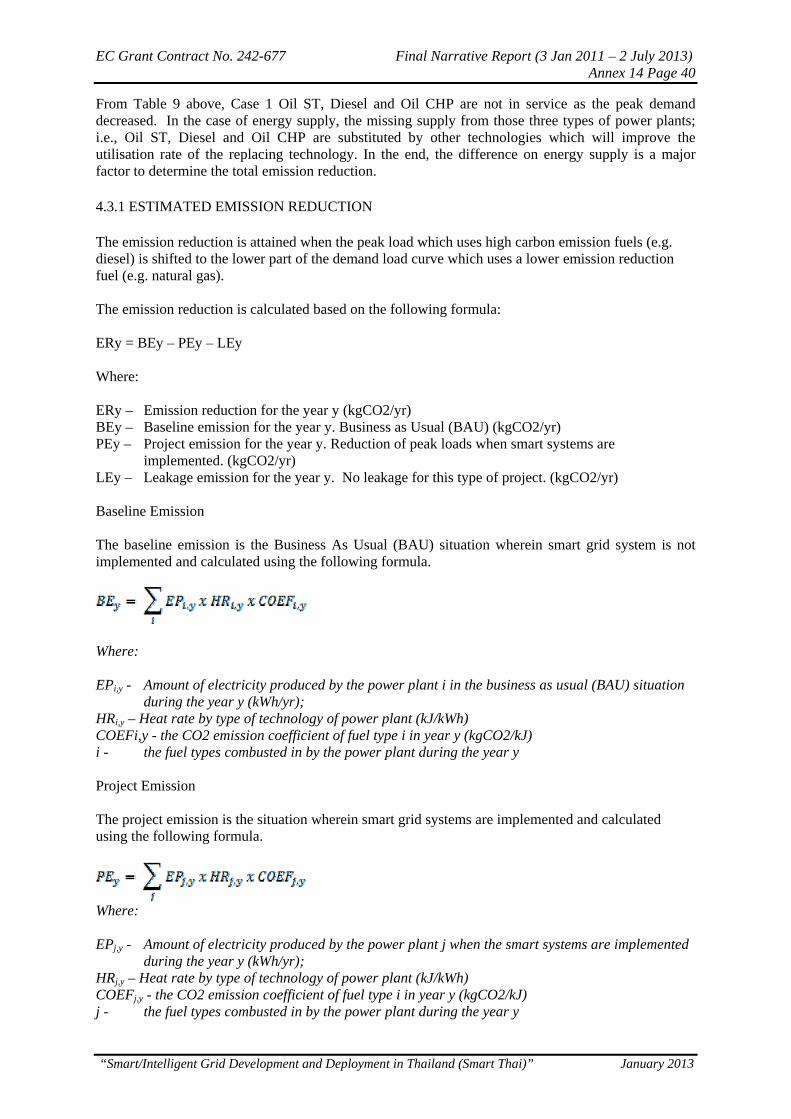
EC Grant Contract No. 242-677 Final Narrative Report (3 Jan 2011 – 2 July 2013) Annex 14 Page 40
“Smart/Intelligent Grid Development and Deployment in Thailand (Smart Thai)” January 2013
From Table 9 above, Case 1 Oil ST, Diesel and Oil CHP are not in service as the peak demand decreased. In the case of energy supply, the missing supply from those three types of power plants; i.e., Oil ST, Diesel and Oil CHP are substituted by other technologies which will improve the utilisation rate of the replacing technology. In the end, the difference on energy supply is a major factor to determine the total emission reduction.
4.3.1 ESTIMATED EMISSION REDUCTION
The emission reduction is attained when the peak load which uses high carbon emission fuels (e.g. diesel) is shifted to the lower part of the demand load curve which uses a lower emission reduction fuel (e.g. natural gas). The emission reduction is calculated based on the following formula: ERy = BEy – PEy – LEy Where: ERy – Emission reduction for the year y (kgCO2/yr) BEy – Baseline emission for the year y. Business as Usual (BAU) (kgCO2/yr) PEy – Project emission for the year y. Reduction of peak loads when smart systems are
implemented. (kgCO2/yr) LEy – Leakage emission for the year y. No leakage for this type of project. (kgCO2/yr) Baseline Emission The baseline emission is the Business As Usual (BAU) situation wherein smart grid system is not implemented and calculated using the following formula.
Where: EPi,y - Amount of electricity produced by the power plant i in the business as usual (BAU) situation
during the year y (kWh/yr); HRi,y – Heat rate by type of technology of power plant (kJ/kWh) COEFi,y - the CO2 emission coefficient of fuel type i in year y (kgCO2/kJ) i - the fuel types combusted in by the power plant during the year y Project Emission The project emission is the situation wherein smart grid systems are implemented and calculated using the following formula.
Where: EPj,y - Amount of electricity produced by the power plant j when the smart systems are implemented
during the year y (kWh/yr); HRj,y – Heat rate by type of technology of power plant (kJ/kWh) COEFj,y - the CO2 emission coefficient of fuel type i in year y (kgCO2/kJ) j - the fuel types combusted in by the power plant during the year y
EC Grant Contract No. 242-677 Final Narrative Report (3 Jan 2011 – 2 July 2013) Annex 14 Page 41
“Smart/Intelligent Grid Development and Deployment in Thailand (Smart Thai)” January 2013
Leakage Emission
Leakage emission is the net change of anthropogenic emissions by sources of GHG which occurs outside the project boundary, and which is measurable and attributable to the CDM project activity, as applicable. There are no known emissions outside the project boundary, which is measurable and attributed to the Smart Grid system project; therefore, there are no leakage emissions for this project.
Emission Reduction
Based on the principle described above and on the data in Table 9, the yearly estimated emission reduction (see detailed calculations in the simulation model) when the Smart Grid system is applied to the selected pilot site in Pattaya City is presented in Table 10. Table 10: Summary of Emission Reduction for base case (Case1)
Baseline (BAU)Project Emission
(Case 1) Emission Reduction Year tCO2 tCO2 tCO2 2012 967,901.69 954,725.09 13,176.60 2013 967,901.69 954,725.09 13,176.60 2014 967,901.69 954,725.09 13,176.60 2015 967,901.69 954,725.09 13,176.60 2016 967,901.69 954,725.09 13,176.60 2017 967,901.69 954,725.09 13,176.60 2018 1,071,099.41 1,053,285.76 17,813.65 2019 1,071,099.41 1,053,285.76 17,813.65 2020 1,071,099.41 1,053,285.76 17,813.65 2021 1,071,099.41 1,053,285.76 17,813.65 2022 1,071,099.41 1,053,285.76 17,813.65 2023 1,071,099.41 1,053,285.76 17,813.65 2024 1,199,654.95 1,182,971.48 16,683.48 2025 1,199,654.95 1,182,971.48 16,683.48 2026 1,199,654.95 1,182,971.48 16,683.48 2027 1,199,654.95 1,182,971.48 16,683.48 2028 1,199,654.95 1,182,971.48 16,683.48 2029 1,199,654.95 1,182,971.48 16,683.48 2030 1,199,654.95 1,182,971.48 16,683.48 Total 20,631,591.28 20,328,865.40 302,725.88
The summary for other scenarios is presented in Table 11. The base case is Case 1, wherein only 5% of the peak is reduced and distributed to the lower part of the demand load curve. Case 2 is 10% peak reduction. Case 3 is 15% peak reduction. The peak reductions were distributed to the lower part of the demand load curve. Table 11: Summary of Yearly Estimated Emission Reduction for each case
Case 1 (5% Reduction)
Case 2 (10% Reduction)
Case 3 (15% Reduction)
Year tCO2 tCO2 tCO2
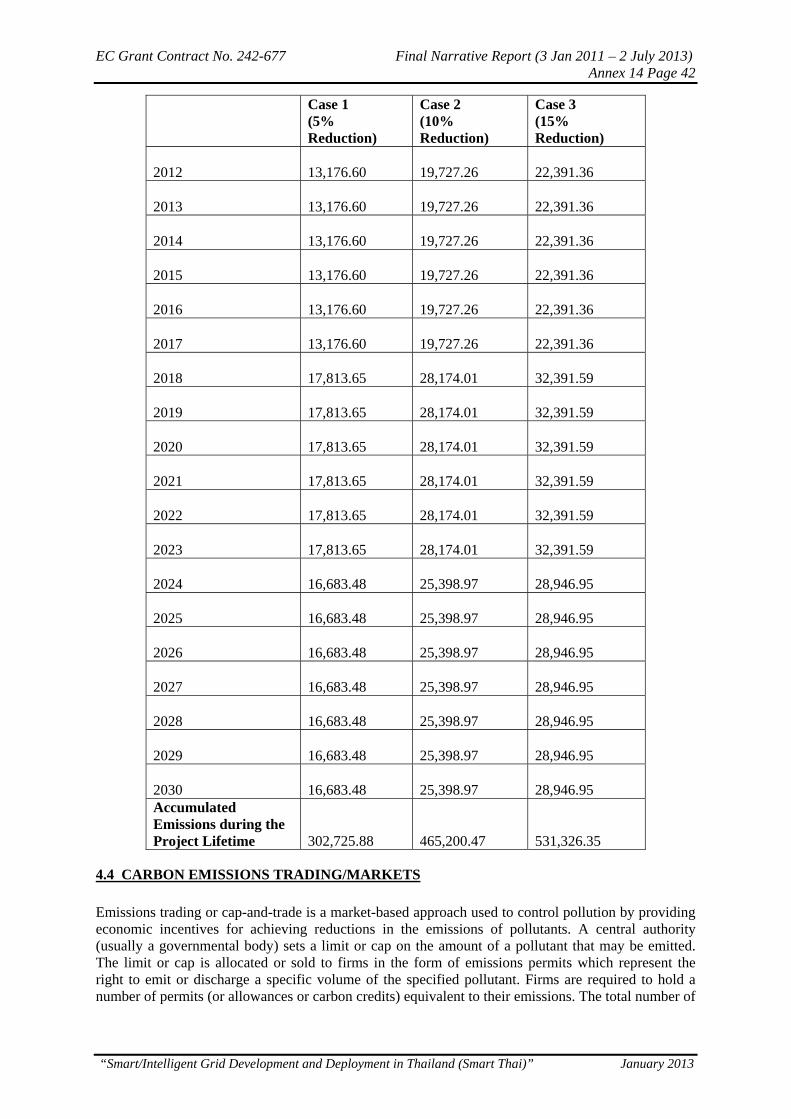
EC Grant Contract No. 242-677 Final Narrative Report (3 Jan 2011 – 2 July 2013) Annex 14 Page 42
“Smart/Intelligent Grid Development and Deployment in Thailand (Smart Thai)” January 2013
Case 1 (5% Reduction)
Case 2 (10% Reduction)
Case 3 (15% Reduction)
2012 13,176.60
19,727.26
22,391.36
2013 13,176.60
19,727.26
22,391.36
2014 13,176.60
19,727.26
22,391.36
2015 13,176.60
19,727.26
22,391.36
2016 13,176.60
19,727.26
22,391.36
2017 13,176.60
19,727.26
22,391.36
2018 17,813.65
28,174.01
32,391.59
2019 17,813.65
28,174.01
32,391.59
2020 17,813.65
28,174.01
32,391.59
2021 17,813.65
28,174.01
32,391.59
2022 17,813.65
28,174.01
32,391.59
2023 17,813.65
28,174.01
32,391.59
2024 16,683.48
25,398.97
28,946.95
2025 16,683.48
25,398.97
28,946.95
2026 16,683.48
25,398.97
28,946.95
2027 16,683.48
25,398.97
28,946.95
2028 16,683.48
25,398.97
28,946.95
2029 16,683.48
25,398.97
28,946.95
2030 16,683.48
25,398.97
28,946.95
Accumulated Emissions during the Project Lifetime
302,725.88
465,200.47
531,326.35
4.4 CARBON EMISSIONS TRADING/MARKETS
Emissions trading or cap-and-trade is a market-based approach used to control pollution by providing economic incentives for achieving reductions in the emissions of pollutants. A central authority (usually a governmental body) sets a limit or cap on the amount of a pollutant that may be emitted. The limit or cap is allocated or sold to firms in the form of emissions permits which represent the right to emit or discharge a specific volume of the specified pollutant. Firms are required to hold a number of permits (or allowances or carbon credits) equivalent to their emissions. The total number of
EC Grant Contract No. 242-677 Final Narrative Report (3 Jan 2011 – 2 July 2013) Annex 14 Page 43
“Smart/Intelligent Grid Development and Deployment in Thailand (Smart Thai)” January 2013
permits cannot exceed the cap, limiting total emissions to that level. Firms that need to increase their volume of emissions must buy permits from those who require fewer permits35. The transfer of permits is referred to as a trade. In effect, the buyer is paying a charge for polluting, while the seller is being rewarded for having reduced emissions. Thus, in theory, those who can reduce emissions most cheaply will do so, achieving the pollution reduction at the lowest cost to society36. There are many carbon emissions trading/markets or offset programmes but for this report, only those that are applicable to the project are presented. These are the Clean Development Mechanism (CDM), Verified Carbon Standard (VCS), Gold Standard and Thailand Voluntary Emission Reduction (T-VER). Another CO2 mitigation scheme is the Nationally Appropriate Mitigation Actions (NAMAs) and the Japan’s Bilateral Offset Crediting Mechanism (BOCM) of which this project could be a potential candidate.
4.4.1 CLEAN DEVELOPMENT MECHANISM (CDM)
General Background on CDM
Concerns over depletion of natural resources and degradation of global environment caused by an increase in concentration of Greenhouse Gases (GHG) have brought governments, businesses and individuals together in an unprecedented manner to tackle the problems and provide solutions to the issue. One of the most significant actions made in such gatherings was the signing of the Kyoto Protocol which allows certain governments to make quantitative and time-bound commitments to lower these anthropogenic emissions of greenhouse gases in the atmosphere. These commitments could be done through domestic actions in their respective countries or through flexibility mechanisms involving other countries, particularly developing ones that do not have the same obligations. One of these flexibility mechanisms that could involve a developing country like Thailand is the Clean Development Mechanism (CDM). CDM acts as a means of technology transfer from developed to developing countries. This mechanism could lead to sustainable development of the host countries like Thailand as well as reduce its greenhouse gas emissions globally.
The Kyoto Protocol
The Kyoto Protocol is an international environmental treaty under the United Nations Framework Convention on Climate Change (UNFCCC), intended to achieve "stabilisation of greenhouse gas concentrations in the atmosphere at a level that would prevent dangerous anthropogenic interference with the climate system." The Kyoto Protocol was adopted at the 3rd session of the Conference of the Parties (COP-3) to the UNFCCC held in Kyoto, Japan in December 1997. Simply called “Climate Protocol”, it is an international agreement that shares the concerns and principles set out in the climate convention. Signed by 84 industrialised countries, also referred to as Annex 1 countries, it defines the quantified greenhouse gas (GHG) emissions reduction targets for these signatory countries.37 The Kyoto Protocol establishes legally binding commitments for the reduction of four greenhouse gases (carbon dioxide, methane, nitrous oxide, sulphur hexafluoride), and two groups of gases (hydrofluorocarbons and perfluorocarbons) produced by industrialised nations, as well as general commitments for all member countries. As of January 2009, 183 parties had ratified the protocol, which was initially adopted for use in December 1997 in Kyoto, Japan and which entered into force in February 2005. Under the Kyoto Protocol, industrialised countries agreed to reduce their collective
35 Stavins, Robert N. (November 2001). "Experience with Market-Based Environmental Policy Instruments". Discussion Paper 01-58 (Washington, D.C.: Resources for the Future). Retrieved 2010-05-20. "Market-based instruments are regulations that encourage behavior through market signals rather than through explicit directives regarding pollution control levels or methods" 36 Montgomery, W.D (December 1972). "Markets in Licenses and Efficient Pollution Control Programs". Journal of Economic Theory 5: 395–418. 37 http://unfccc.int/cop3/fccc/climate/annex1.htm
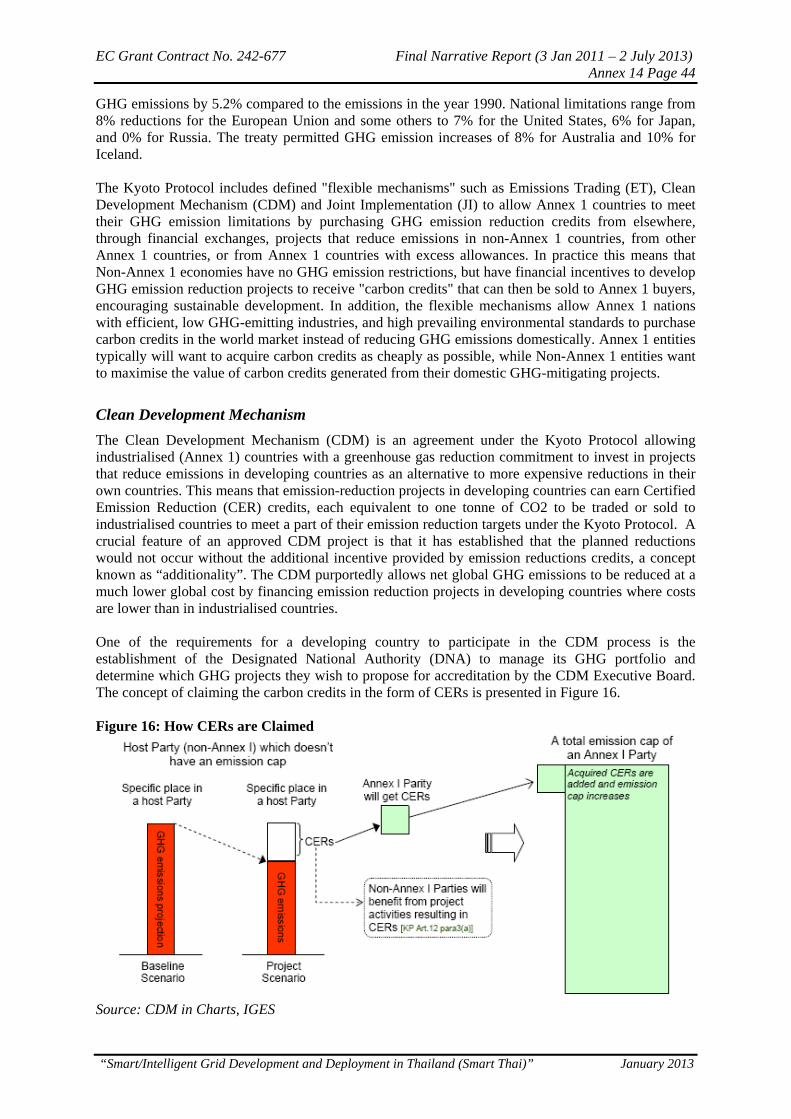
EC Grant Contract No. 242-677 Final Narrative Report (3 Jan 2011 – 2 July 2013) Annex 14 Page 44
“Smart/Intelligent Grid Development and Deployment in Thailand (Smart Thai)” January 2013
GHG emissions by 5.2% compared to the emissions in the year 1990. National limitations range from 8% reductions for the European Union and some others to 7% for the United States, 6% for Japan, and 0% for Russia. The treaty permitted GHG emission increases of 8% for Australia and 10% for Iceland. The Kyoto Protocol includes defined "flexible mechanisms" such as Emissions Trading (ET), Clean Development Mechanism (CDM) and Joint Implementation (JI) to allow Annex 1 countries to meet their GHG emission limitations by purchasing GHG emission reduction credits from elsewhere, through financial exchanges, projects that reduce emissions in non-Annex 1 countries, from other Annex 1 countries, or from Annex 1 countries with excess allowances. In practice this means that Non-Annex 1 economies have no GHG emission restrictions, but have financial incentives to develop GHG emission reduction projects to receive "carbon credits" that can then be sold to Annex 1 buyers, encouraging sustainable development. In addition, the flexible mechanisms allow Annex 1 nations with efficient, low GHG-emitting industries, and high prevailing environmental standards to purchase carbon credits in the world market instead of reducing GHG emissions domestically. Annex 1 entities typically will want to acquire carbon credits as cheaply as possible, while Non-Annex 1 entities want to maximise the value of carbon credits generated from their domestic GHG-mitigating projects.
Clean Development Mechanism
The Clean Development Mechanism (CDM) is an agreement under the Kyoto Protocol allowing industrialised (Annex 1) countries with a greenhouse gas reduction commitment to invest in projects that reduce emissions in developing countries as an alternative to more expensive reductions in their own countries. This means that emission-reduction projects in developing countries can earn Certified Emission Reduction (CER) credits, each equivalent to one tonne of CO2 to be traded or sold to industrialised countries to meet a part of their emission reduction targets under the Kyoto Protocol. A crucial feature of an approved CDM project is that it has established that the planned reductions would not occur without the additional incentive provided by emission reductions credits, a concept known as “additionality”. The CDM purportedly allows net global GHG emissions to be reduced at a much lower global cost by financing emission reduction projects in developing countries where costs are lower than in industrialised countries. One of the requirements for a developing country to participate in the CDM process is the establishment of the Designated National Authority (DNA) to manage its GHG portfolio and determine which GHG projects they wish to propose for accreditation by the CDM Executive Board. The concept of claiming the carbon credits in the form of CERs is presented in Figure 16. Figure 16: How CERs are Claimed
Source: CDM in Charts, IGES
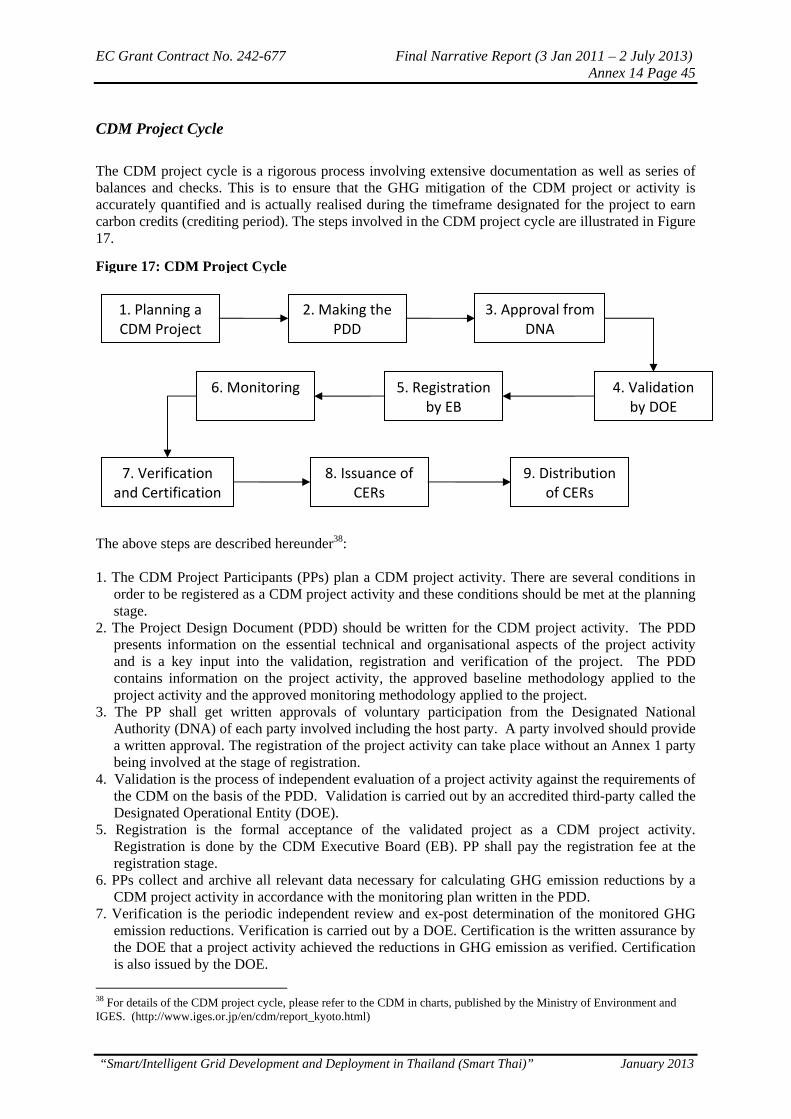
EC Grant Contract No. 242-677 Final Narrative Report (3 Jan 2011 – 2 July 2013) Annex 14 Page 45
“Smart/Intelligent Grid Development and Deployment in Thailand (Smart Thai)” January 2013
CDM Project Cycle
The CDM project cycle is a rigorous process involving extensive documentation as well as series of balances and checks. This is to ensure that the GHG mitigation of the CDM project or activity is accurately quantified and is actually realised during the timeframe designated for the project to earn carbon credits (crediting period). The steps involved in the CDM project cycle are illustrated in Figure 17.
The above steps are described hereunder38: 1. The CDM Project Participants (PPs) plan a CDM project activity. There are several conditions in
order to be registered as a CDM project activity and these conditions should be met at the planning stage.
2. The Project Design Document (PDD) should be written for the CDM project activity. The PDD presents information on the essential technical and organisational aspects of the project activity and is a key input into the validation, registration and verification of the project. The PDD contains information on the project activity, the approved baseline methodology applied to the project activity and the approved monitoring methodology applied to the project.
3. The PP shall get written approvals of voluntary participation from the Designated National Authority (DNA) of each party involved including the host party. A party involved should provide a written approval. The registration of the project activity can take place without an Annex 1 party being involved at the stage of registration.
4. Validation is the process of independent evaluation of a project activity against the requirements of the CDM on the basis of the PDD. Validation is carried out by an accredited third-party called the Designated Operational Entity (DOE).
5. Registration is the formal acceptance of the validated project as a CDM project activity. Registration is done by the CDM Executive Board (EB). PP shall pay the registration fee at the registration stage.
6. PPs collect and archive all relevant data necessary for calculating GHG emission reductions by a CDM project activity in accordance with the monitoring plan written in the PDD.
7. Verification is the periodic independent review and ex-post determination of the monitored GHG emission reductions. Verification is carried out by a DOE. Certification is the written assurance by the DOE that a project activity achieved the reductions in GHG emission as verified. Certification is also issued by the DOE.
38 For details of the CDM project cycle, please refer to the CDM in charts, published by the Ministry of Environment and IGES. (http://www.iges.or.jp/en/cdm/report_kyoto.html)
1. Planning a CDM Project
2. Making the PDD
3. Approval from DNA
6. Monitoring 5. Registration by EB
4. Validation by DOE
7. Verification and Certification
8. Issuance of CERs
9. Distribution of CERs
Figure 17: CDM Project Cycle
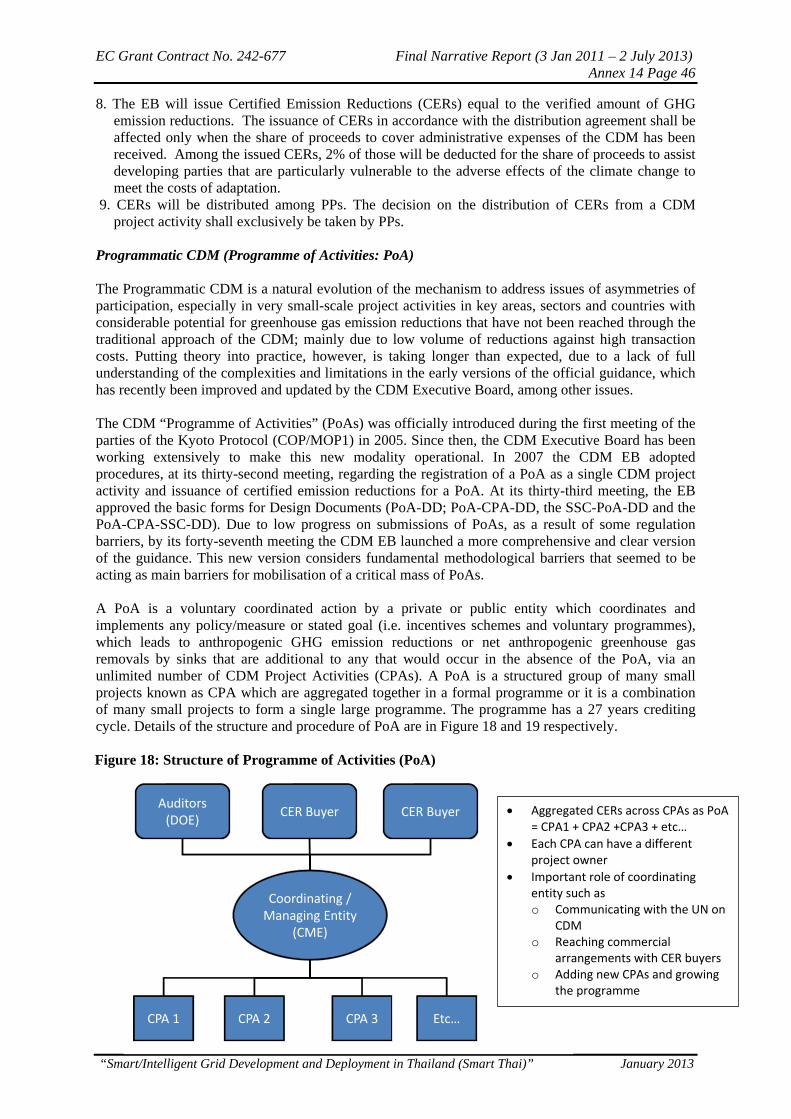
EC Grant Contract No. 242-677 Final Narrative Report (3 Jan 2011 – 2 July 2013) Annex 14 Page 46
“Smart/Intelligent Grid Development and Deployment in Thailand (Smart Thai)” January 2013
8. The EB will issue Certified Emission Reductions (CERs) equal to the verified amount of GHG emission reductions. The issuance of CERs in accordance with the distribution agreement shall be affected only when the share of proceeds to cover administrative expenses of the CDM has been received. Among the issued CERs, 2% of those will be deducted for the share of proceeds to assist developing parties that are particularly vulnerable to the adverse effects of the climate change to meet the costs of adaptation.
9. CERs will be distributed among PPs. The decision on the distribution of CERs from a CDM project activity shall exclusively be taken by PPs.
Programmatic CDM (Programme of Activities: PoA) The Programmatic CDM is a natural evolution of the mechanism to address issues of asymmetries of participation, especially in very small-scale project activities in key areas, sectors and countries with considerable potential for greenhouse gas emission reductions that have not been reached through the traditional approach of the CDM; mainly due to low volume of reductions against high transaction costs. Putting theory into practice, however, is taking longer than expected, due to a lack of full understanding of the complexities and limitations in the early versions of the official guidance, which has recently been improved and updated by the CDM Executive Board, among other issues. The CDM “Programme of Activities” (PoAs) was officially introduced during the first meeting of the parties of the Kyoto Protocol (COP/MOP1) in 2005. Since then, the CDM Executive Board has been working extensively to make this new modality operational. In 2007 the CDM EB adopted procedures, at its thirty-second meeting, regarding the registration of a PoA as a single CDM project activity and issuance of certified emission reductions for a PoA. At its thirty-third meeting, the EB approved the basic forms for Design Documents (PoA-DD; PoA-CPA-DD, the SSC-PoA-DD and the PoA-CPA-SSC-DD). Due to low progress on submissions of PoAs, as a result of some regulation barriers, by its forty-seventh meeting the CDM EB launched a more comprehensive and clear version of the guidance. This new version considers fundamental methodological barriers that seemed to be acting as main barriers for mobilisation of a critical mass of PoAs. A PoA is a voluntary coordinated action by a private or public entity which coordinates and implements any policy/measure or stated goal (i.e. incentives schemes and voluntary programmes), which leads to anthropogenic GHG emission reductions or net anthropogenic greenhouse gas removals by sinks that are additional to any that would occur in the absence of the PoA, via an unlimited number of CDM Project Activities (CPAs). A PoA is a structured group of many small projects known as CPA which are aggregated together in a formal programme or it is a combination of many small projects to form a single large programme. The programme has a 27 years crediting cycle. Details of the structure and procedure of PoA are in Figure 18 and 19 respectively.
Auditors (DOE)
CER Buyer CER Buyer
Coordinating / Managing Entity
(CME)
CPA 1 CPA 2 CPA 3 Etc…
Aggregated CERs across CPAs as PoA = CPA1 + CPA2 +CPA3 + etc…
Each CPA can have a different project owner
Important role of coordinating entity such as o Communicating with the UN on
CDM o Reaching commercial
arrangements with CER buyers o Adding new CPAs and growing
the programme
Figure 18: Structure of Programme of Activities (PoA)
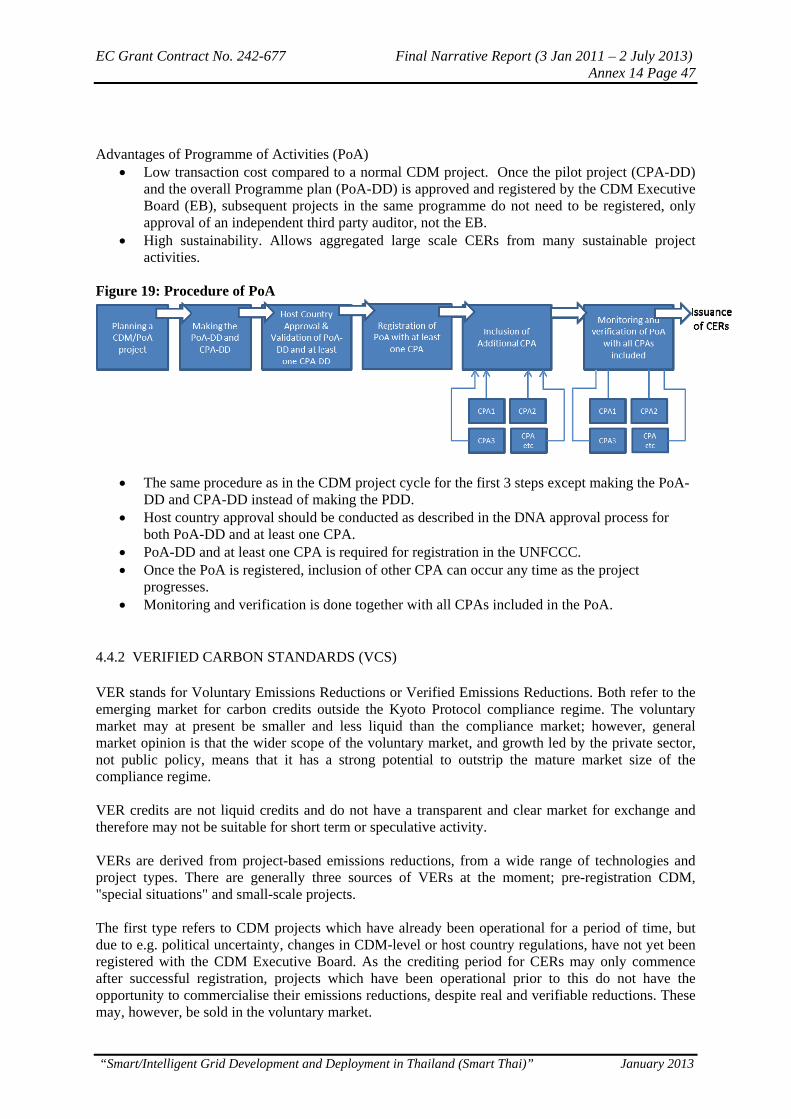
EC Grant Contract No. 242-677 Final Narrative Report (3 Jan 2011 – 2 July 2013) Annex 14 Page 47
“Smart/Intelligent Grid Development and Deployment in Thailand (Smart Thai)” January 2013
Advantages of Programme of Activities (PoA)
Low transaction cost compared to a normal CDM project. Once the pilot project (CPA-DD) and the overall Programme plan (PoA-DD) is approved and registered by the CDM Executive Board (EB), subsequent projects in the same programme do not need to be registered, only approval of an independent third party auditor, not the EB.
High sustainability. Allows aggregated large scale CERs from many sustainable project activities.
Figure 19: Procedure of PoA
The same procedure as in the CDM project cycle for the first 3 steps except making the PoA-DD and CPA-DD instead of making the PDD.
Host country approval should be conducted as described in the DNA approval process for both PoA-DD and at least one CPA.
PoA-DD and at least one CPA is required for registration in the UNFCCC. Once the PoA is registered, inclusion of other CPA can occur any time as the project
progresses. Monitoring and verification is done together with all CPAs included in the PoA.
4.4.2 VERIFIED CARBON STANDARDS (VCS)
VER stands for Voluntary Emissions Reductions or Verified Emissions Reductions. Both refer to the emerging market for carbon credits outside the Kyoto Protocol compliance regime. The voluntary market may at present be smaller and less liquid than the compliance market; however, general market opinion is that the wider scope of the voluntary market, and growth led by the private sector, not public policy, means that it has a strong potential to outstrip the mature market size of the compliance regime. VER credits are not liquid credits and do not have a transparent and clear market for exchange and therefore may not be suitable for short term or speculative activity. VERs are derived from project-based emissions reductions, from a wide range of technologies and project types. There are generally three sources of VERs at the moment; pre-registration CDM, "special situations" and small-scale projects. The first type refers to CDM projects which have already been operational for a period of time, but due to e.g. political uncertainty, changes in CDM-level or host country regulations, have not yet been registered with the CDM Executive Board. As the crediting period for CERs may only commence after successful registration, projects which have been operational prior to this do not have the opportunity to commercialise their emissions reductions, despite real and verifiable reductions. These may, however, be sold in the voluntary market.

EC Grant Contract No. 242-677 Final Narrative Report (3 Jan 2011 – 2 July 2013) Annex 14 Page 48
“Smart/Intelligent Grid Development and Deployment in Thailand (Smart Thai)” January 2013
The second type, "special situations", refers to technologies or methodologies for emissions reductions which have not yet been approved in the compliance regime, typically in the sectors of land use change and forestry, carbon capture storage, transport including biofuels. Lastly, there are a variety of small-scale, community-driven projects which simply have insufficient resources to satisfy the strict requirements and specialised consultancy services required for the CDM project cycle. These projects thus opt for the lower cost option of VERs. Since the prices of CER in the market have fallen significantly, project owners and buyers opted to the VER scheme to reduce the transaction costs as well as the constraints of the CDM process. The Verified Carbon Standards or VCS is the most widely used greenhouse gas programme in the global voluntary carbon market. Unlike for CDM, the buyers of the carbon credit have no obligation to purchase the carbon credits. Buyers are companies that are willing to off-set their own operations, companies that buy on behalf of their customers (e.g. airlines & travel agents, automobile & petroleum companies), event organisers (e.g. 2006 world cup) and individuals who are concerned for the environment and are willing to off-set their daily carbon emissions. VCS uses the same principle as CDM. One of the major differences is that it does not have to be registered in the UNFCCC, therefore no registration cost will incur. Only the verifier or the validator will approve the project, unlike CDM wherein the UNFCCC has the final approval. Therefore, moreover, the interpretation of the validator regarding the rules and guidelines will not be refuted anymore. VCS does not require approval from the host party and like Thailand, each estimated CER costs 10 THB. For the project to be registered in the VCS, the same methodology will be used as described above in the CDM.
4.4.3 GOLD STANDARD
The Gold Standard is the world's only independent standard for creating high-quality emission reductions projects in the Clean Development Mechanism (CDM), Joint Implementation (JI) and Voluntary Carbon Market. It was designed to ensure that carbon credits are not only real and verifiable but that they make measurable contributions to sustainable development worldwide. Its objective is to add branding, a label to existing and new Carbon Credits generated by projects which can then be bought and traded by countries that have a binding legal commitment according to the Kyoto Protocol. To be eligible for Gold Standard Certification, a project must:
1. Be an approved Renewable Energy Supply or End-use Energy Efficiency Improvement project type
2. Be reducing one of the three eligible Green House Gases: Carbon Dioxide (CO2), Methane (CH4) and Nitrous Oxide (N2O)
3. Not employ Official Development Assistance (ODA) under the condition that the credits coming out of the project are transferred to the donor country.
4. Not be applying for other certifications, to ensure there is no double counting of Credits 5. Demonstrates its "additionality" by using the United Nations Framework Convention on
Climate Change's (UNFCCC) Large Scale Additionality Tool; and shows that the project is not a 'business-as-usual' scenario
6. Make a net-positive contribution to the economic, environmental and social welfare of the local population that hosts it
If the projects in the CDM and VCS scheme meet the criteria described above, then it is eligible for Gold Standard and the value of the carbon credits is normally higher. Smart Grid system project is mainly focus on the demand side of the electricity chain therefore it is not eligible for Gold Standard. As stated in the eligibility, only end-use energy efficiency improvement projects are eligible.
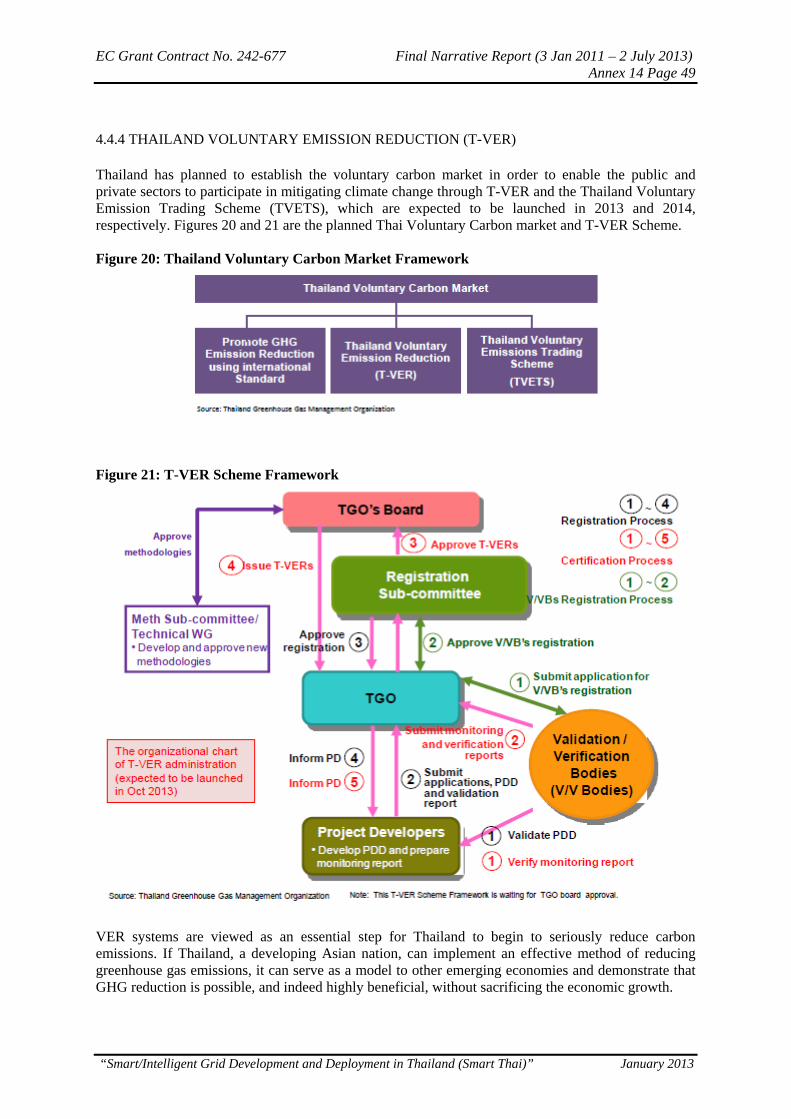
EC Grant Contract No. 242-677 Final Narrative Report (3 Jan 2011 – 2 July 2013) Annex 14 Page 49
“Smart/Intelligent Grid Development and Deployment in Thailand (Smart Thai)” January 2013
4.4.4 THAILAND VOLUNTARY EMISSION REDUCTION (T-VER)
Thailand has planned to establish the voluntary carbon market in order to enable the public and private sectors to participate in mitigating climate change through T-VER and the Thailand Voluntary Emission Trading Scheme (TVETS), which are expected to be launched in 2013 and 2014, respectively. Figures 20 and 21 are the planned Thai Voluntary Carbon market and T-VER Scheme. Figure 20: Thailand Voluntary Carbon Market Framework
Figure 21: T-VER Scheme Framework
VER systems are viewed as an essential step for Thailand to begin to seriously reduce carbon emissions. If Thailand, a developing Asian nation, can implement an effective method of reducing greenhouse gas emissions, it can serve as a model to other emerging economies and demonstrate that GHG reduction is possible, and indeed highly beneficial, without sacrificing the economic growth.

EC Grant Contract No. 242-677 Final Narrative Report (3 Jan 2011 – 2 July 2013) Annex 14 Page 50
“Smart/Intelligent Grid Development and Deployment in Thailand (Smart Thai)” January 2013
This scheme is still in a planning stage. More information will be available from the Thailand Greenhouse Gas Management Organisation (TGO). As the information becomes available, the smart grid project will be assessed if it is eligible for the T-VER scheme.
4.4.5 NAMAs FOR THAILAND39
During the Conference of Parties (COP15) and the Conference of the Member Parties to the Kyoto Protocol (CMP5) in Copenhagen in December 2009, developed countries tried to attract developing countries in the GHG mitigation by setting up a framework called Nationally Appropriate Mitigation Actions (NAMAs). There are three strategies in NAMAs. These are (1) Domestic NAMAs (2) Internationally Supported NAMAs and (3) Crediting Mechanism for NAMAs. The first strategy is domestic NAMAs. Domestic NAMAs consider the financial needs within the country. Estimation of the investments to be able to get support for the future GHG mitigation development is needed for each country. The estimate will help in choosing the most suitable economic plan in the GHG mitigation policies. Governments will set up policies and targets for the investments. The second strategy is the Internationally Supported NAMAs. In this system, developed countries helped the developing countries in investment and technological capacity building while the developing countries do not have to commit into the GHG mitigation. The Copenhagen Accord has set up a Green Fund for financial support in the GHG mitigation. The last strategy is the “Crediting NAMAs”. This is the selling and buying of carbon credits. This could happen by selling the emission reduction in the international carbon market. The crediting mechanism for NAMAs needs three processes called MRV (Measurable, Reportable and Verifiable) but as of this time, there is still no standard or procedure on how to conduct the MRV.
4.4.6 JAPAN’S BILATERAL OFFSET CREDITING MECHANISM (BOCM)40
The Bilateral Offset Crediting Mechanism (BOCM) is similar to CDM in that the funding country (Japan) invests in emission reduction projects in developing countries and gain offset credits. The key difference is in the simplified procedure which stays mostly at the bilateral level whereas in CDM, it is administered by the international body (UNFCCC). International oversight under the BOCM is minimised to the function of providing guidance for emission monitoring, reporting and verification (MRV) and accounting rules only. Another difference with CDM is that no low carbon technology is excluded. In CDM, not all low-carbon technologies (e.g. nuclear power) are accepted under CDM. Even Carbon Capture and Storage (CCS) was recently permitted while no CDM project using CCS technology has been approved. Similarly, BOCM intends to cover a wider range of sectors and activities from transport, waste management, energy efficiency, renewable energy and also REDD+ projects. The BOCM is expected to utilise existing methodologies that have been developed under CDM where possible. A snapshot of the Bilateral Offset Crediting Mechanism (BOCM) is in Figure 22.
39 Source of this write up is based from CO2 Mitigation in Thailand’s Nationally Appropriate Mitigation Actions (NAMAs): Policy Analyses of Power Generation, by N. Sritong, A. Pattanapongchai, P. Winyuchakrit, P.Peerapong and B. Limmeechokchai 40 Adapted from Climate Brief by Hanh Le and Anais Delbosc, January 2012 issue
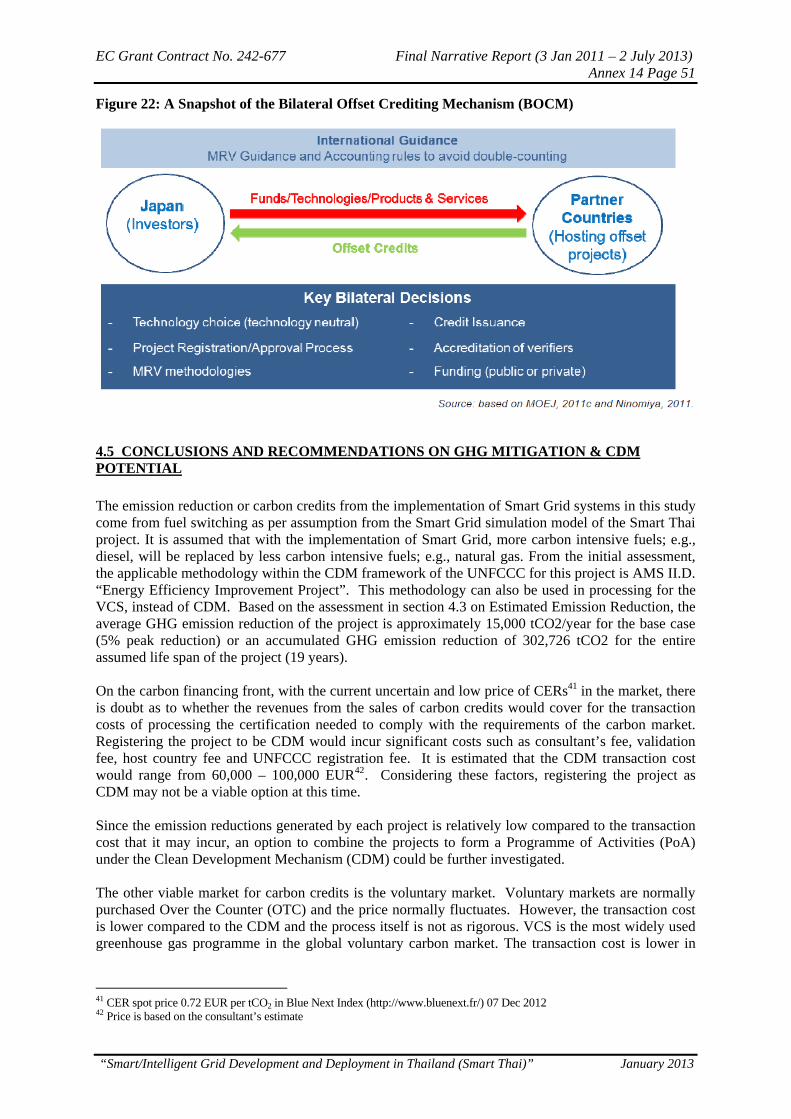
EC Grant Contract No. 242-677 Final Narrative Report (3 Jan 2011 – 2 July 2013) Annex 14 Page 51
“Smart/Intelligent Grid Development and Deployment in Thailand (Smart Thai)” January 2013
Figure 22: A Snapshot of the Bilateral Offset Crediting Mechanism (BOCM)
4.5 CONCLUSIONS AND RECOMMENDATIONS ON GHG MITIGATION & CDM POTENTIAL
The emission reduction or carbon credits from the implementation of Smart Grid systems in this study come from fuel switching as per assumption from the Smart Grid simulation model of the Smart Thai project. It is assumed that with the implementation of Smart Grid, more carbon intensive fuels; e.g., diesel, will be replaced by less carbon intensive fuels; e.g., natural gas. From the initial assessment, the applicable methodology within the CDM framework of the UNFCCC for this project is AMS II.D. “Energy Efficiency Improvement Project”. This methodology can also be used in processing for the VCS, instead of CDM. Based on the assessment in section 4.3 on Estimated Emission Reduction, the average GHG emission reduction of the project is approximately 15,000 tCO2/year for the base case (5% peak reduction) or an accumulated GHG emission reduction of 302,726 tCO2 for the entire assumed life span of the project (19 years). On the carbon financing front, with the current uncertain and low price of CERs41 in the market, there is doubt as to whether the revenues from the sales of carbon credits would cover for the transaction costs of processing the certification needed to comply with the requirements of the carbon market. Registering the project to be CDM would incur significant costs such as consultant’s fee, validation fee, host country fee and UNFCCC registration fee. It is estimated that the CDM transaction cost would range from 60,000 – 100,000 EUR42. Considering these factors, registering the project as CDM may not be a viable option at this time. Since the emission reductions generated by each project is relatively low compared to the transaction cost that it may incur, an option to combine the projects to form a Programme of Activities (PoA) under the Clean Development Mechanism (CDM) could be further investigated. The other viable market for carbon credits is the voluntary market. Voluntary markets are normally purchased Over the Counter (OTC) and the price normally fluctuates. However, the transaction cost is lower compared to the CDM and the process itself is not as rigorous. VCS is the most widely used greenhouse gas programme in the global voluntary carbon market. The transaction cost is lower in
41 CER spot price 0.72 EUR per tCO2 in Blue Next Index (http://www.bluenext.fr/) 07 Dec 2012 42 Price is based on the consultant’s estimate

EC Grant Contract No. 242-677 Final Narrative Report (3 Jan 2011 – 2 July 2013) Annex 14 Page 52
“Smart/Intelligent Grid Development and Deployment in Thailand (Smart Thai)” January 2013
VCS compared to CDM, and is estimated at 30,000 – 70,000 EUR43. Considering this cost and the price and volume of VER, it still does not seem to be a viable option at this time. T-VER is still in the planning stage. The project might use the carbon credits as part of its corporate social responsibility (CSR) to offset the utility’s emissions but more details on the mechanism of T-VER are still not available at this time. It is the same situation with the NAMAs for Thailand. In the case of BOCM, it is arguably expected to deliver projects much faster and easier than CDM, which would reduce transaction costs and entice more private sector investment. It is also considered to better accommodate the specific and strategic needs of parties than in CDM. That being said, this mechanism could be an option for this project.
43 Price is based on the consultant’s estimate

EC Grant Contract No. 242-677 Final Narrative Report (3 Jan 2011 – 2 July 2013) Annex 14 Page 53
“Smart/Intelligent Grid Development and Deployment in Thailand (Smart Thai)” January 2013
5. RISK ASSESSMENT
5.1 FUTURE PROOFING
The fact that Smart Grid is a new technology, which is still evolving and is expected to continue to evolve for some time, the most obvious risk is “future proofing”. Questions are raised on the proper timing and right technology. What happens as the technologies mature? Will something better come along down the road? Will these technologies become stranded costs? Are there smart grid solutions that have not been identified yet? These are all valid questions and concerns. In fact, it is anticipated that these solutions will continue to mature and evolve, and other solution opportunities will emerge in the future. The risk comes in balancing PEA’s need to stay ahead of the game and in the potential problem of jumping on the smart grid bandwagon too soon. Fortunately, Smart Grid solutions have progressed dramatically in the past several years. Smart Grid Technology providers recognise the revenue opportunities with Smart Grid technologies and products, and competition has created stronger solutions that support different state, utility, and consumer needs. Technology providers also recognise that the landscape continues to change, so their products reflect the ability to be upgraded and provide interoperability between other Smart Grid technologies and competitor products. Government and societal interest in better energy efficiency and grid reliability also helps drive standards development, innovation, and investment in Smart Grid technology. A major help in future proofing the system is the use of clearly defined internationally accepted standards to support all the aspects of the Smart Grid. Also an integrated communications system provides flexibility to deploy Smart Grid technologies in steps and allow key additions later once they are mature. IEC 61850 standard compliance assures interoperability and flexibility. Upgradable smart meters will also provide the same flexibility on a case-by-case and customer need basis. All of these risk mitigation efforts and the actual need for Smart Grid solutions in PEA outweigh the argument for waiting. Better electric reliability and efficiency are very real catalysts for supporting the growth of the Thai economy.
5.2 NEED FOR NEW SMART GRID PERSONNEL AND CAPACITY BUILDING FOR THE EXISTING PERSONNEL
The amount of change required at PEA as a result of implementing the Smart Grid solutions should not be underestimated. There is a paradigm shift from mid-20th century to modern Smart Grid operation. In the future, Utilities like PEA will further benefit through innovation, intelligent and efficient management of new power related services, dispatchable resources and market participation. Tariff will no longer be primarily based on the cost of asset but on the optimal use of those assets, hence the existing organisational structure and functions will no longer work. PEA will have the advantage of upgrading its personnel pool thanks to the size of its customer base and resources. Injecting new talented Smart Grid specialists and building capacity of existing personnel will be challenging and should be given high priority. This will be critical to PEA’s success.
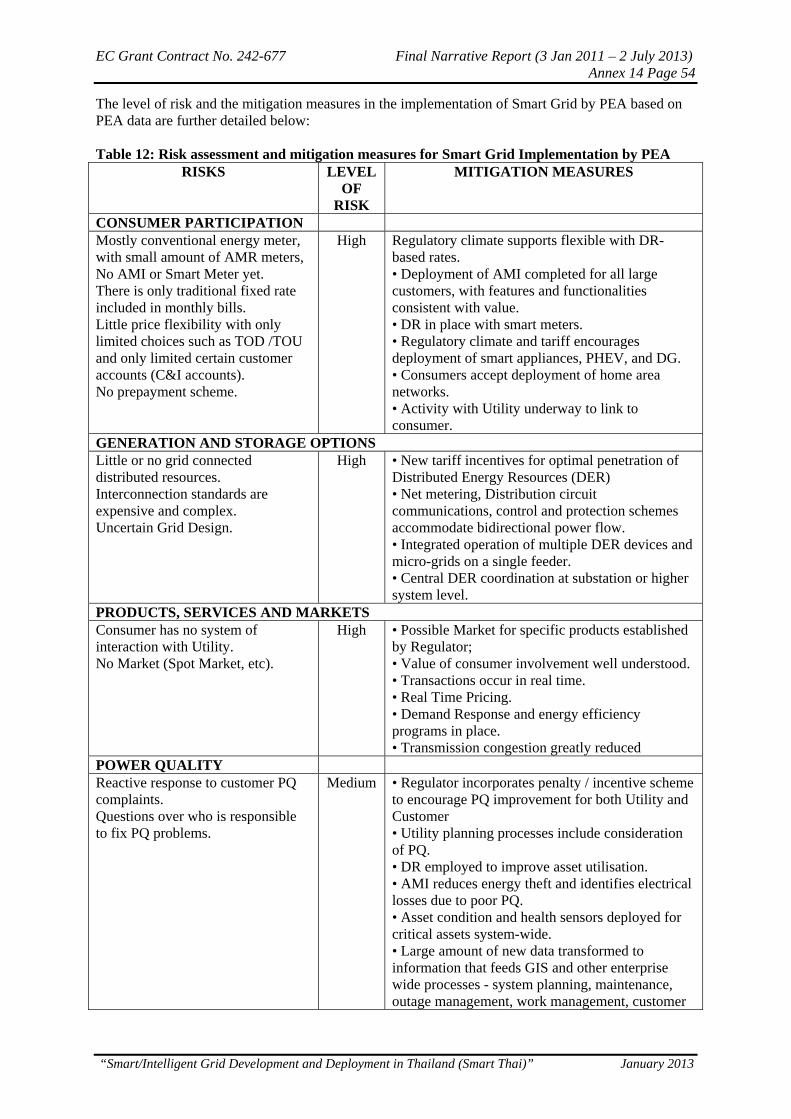
EC Grant Contract No. 242-677 Final Narrative Report (3 Jan 2011 – 2 July 2013) Annex 14 Page 54
“Smart/Intelligent Grid Development and Deployment in Thailand (Smart Thai)” January 2013
The level of risk and the mitigation measures in the implementation of Smart Grid by PEA based on PEA data are further detailed below: Table 12: Risk assessment and mitigation measures for Smart Grid Implementation by PEA
RISKS LEVEL OF
RISK
MITIGATION MEASURES
CONSUMER PARTICIPATION Mostly conventional energy meter, with small amount of AMR meters, No AMI or Smart Meter yet. There is only traditional fixed rate included in monthly bills. Little price flexibility with only limited choices such as TOD /TOU and only limited certain customer accounts (C&I accounts). No prepayment scheme.
High Regulatory climate supports flexible with DR-based rates. • Deployment of AMI completed for all large customers, with features and functionalities consistent with value. • DR in place with smart meters. • Regulatory climate and tariff encourages deployment of smart appliances, PHEV, and DG. • Consumers accept deployment of home area networks. • Activity with Utility underway to link to consumer.
GENERATION AND STORAGE OPTIONSLittle or no grid connected distributed resources. Interconnection standards are expensive and complex. Uncertain Grid Design.
High • New tariff incentives for optimal penetration of Distributed Energy Resources (DER) • Net metering, Distribution circuit communications, control and protection schemes accommodate bidirectional power flow. • Integrated operation of multiple DER devices and micro-grids on a single feeder. • Central DER coordination at substation or higher system level.
PRODUCTS, SERVICES AND MARKETS Consumer has no system of interaction with Utility. No Market (Spot Market, etc).
High • Possible Market for specific products established by Regulator; • Value of consumer involvement well understood. • Transactions occur in real time. • Real Time Pricing. • Demand Response and energy efficiency programs in place. • Transmission congestion greatly reduced
POWER QUALITY Reactive response to customer PQ complaints. Questions over who is responsible to fix PQ problems.
Medium • Regulator incorporates penalty / incentive scheme to encourage PQ improvement for both Utility and Customer • Utility planning processes include consideration of PQ. • DR employed to improve asset utilisation. • AMI reduces energy theft and identifies electrical losses due to poor PQ. • Asset condition and health sensors deployed for critical assets system-wide. • Large amount of new data transformed to information that feeds GIS and other enterprise wide processes - system planning, maintenance, outage management, work management, customer
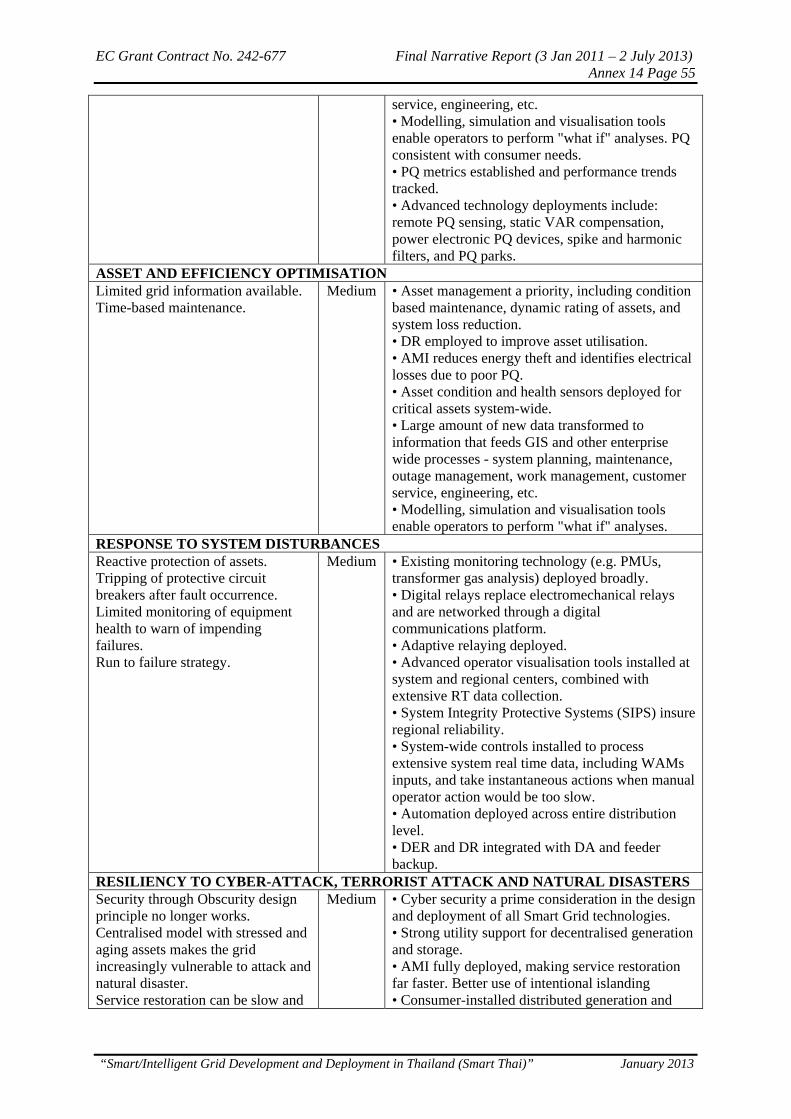
EC Grant Contract No. 242-677 Final Narrative Report (3 Jan 2011 – 2 July 2013) Annex 14 Page 55
“Smart/Intelligent Grid Development and Deployment in Thailand (Smart Thai)” January 2013
service, engineering, etc. • Modelling, simulation and visualisation tools enable operators to perform "what if" analyses. PQ consistent with consumer needs. • PQ metrics established and performance trends tracked. • Advanced technology deployments include: remote PQ sensing, static VAR compensation, power electronic PQ devices, spike and harmonic filters, and PQ parks.
ASSET AND EFFICIENCY OPTIMISATION Limited grid information available. Time-based maintenance.
Medium • Asset management a priority, including condition based maintenance, dynamic rating of assets, and system loss reduction. • DR employed to improve asset utilisation. • AMI reduces energy theft and identifies electrical losses due to poor PQ. • Asset condition and health sensors deployed for critical assets system-wide. • Large amount of new data transformed to information that feeds GIS and other enterprise wide processes - system planning, maintenance, outage management, work management, customer service, engineering, etc. • Modelling, simulation and visualisation tools enable operators to perform "what if" analyses.
RESPONSE TO SYSTEM DISTURBANCESReactive protection of assets. Tripping of protective circuit breakers after fault occurrence. Limited monitoring of equipment health to warn of impending failures. Run to failure strategy.
Medium • Existing monitoring technology (e.g. PMUs, transformer gas analysis) deployed broadly. • Digital relays replace electromechanical relays and are networked through a digital communications platform. • Adaptive relaying deployed. • Advanced operator visualisation tools installed at system and regional centers, combined with extensive RT data collection. • System Integrity Protective Systems (SIPS) insure regional reliability. • System-wide controls installed to process extensive system real time data, including WAMs inputs, and take instantaneous actions when manual operator action would be too slow. • Automation deployed across entire distribution level. • DER and DR integrated with DA and feeder backup.
RESILIENCY TO CYBER-ATTACK, TERRORIST ATTACK AND NATURAL DISASTERSSecurity through Obscurity design principle no longer works. Centralised model with stressed and aging assets makes the grid increasingly vulnerable to attack and natural disaster. Service restoration can be slow and
Medium • Cyber security a prime consideration in the design and deployment of all Smart Grid technologies. • Strong utility support for decentralised generation and storage. • AMI fully deployed, making service restoration far faster. Better use of intentional islanding • Consumer-installed distributed generation and

EC Grant Contract No. 242-677 Final Narrative Report (3 Jan 2011 – 2 July 2013) Annex 14 Page 56
“Smart/Intelligent Grid Development and Deployment in Thailand (Smart Thai)” January 2013
based on customer call-in.
storage technologies. • Self-healing technologies widely deployed • Smart meter features Loss of Power notification for vital and strategic customers
EC Grant Contract No. 242-677 Final Narrative Report (3 Jan 2011 – 2 July 2013) Annex 14 Page 57
“Smart/Intelligent Grid Development and Deployment in Thailand (Smart Thai)” January 2013
6. RECOMMENDATIONS
Based on the technical and financial analysis, the country, as a whole, will greatly benefit from the deployment of the three Smart Grid components in the Smart Grid Pilot Project of PEA in Pattaya City. In order for PEA to avail of the whole range of benefits from Smart Grid implementation, it is important that the smart meters that would be deployed are upgradable. Additional customer profiling studies should also be conducted using information available in utility database although some may need actual field surveys. Based on the features of the smart meter provided to different customer types, PEA could implement several programmes based on the “smart” gadgets and equipment available. PEA should conduct an asset compliance assessment in order to prepare the whole distribution system in the pilot project towards migration to IEC 61850 Standard. The more FDIR switches are deployed along the feeder circuits, the lesser customers will be affected during outages. The choice of whether to use the distributed, centralised or combination approach could be taken on a case-by-case basis where PEA planning simulation and modeling would recommend the best approach that would provide more reliability and flexibility in the distribution system in order to achieve the greatest benefit at the least cost. PEA’s OMS could benefit more with the synergy of the three technologies. Outage notices and alerts from smart meters will adequately inform PEA Computer-based Substation Control System (CSCS) and will also properly guide FDIR to the location of the fault. With IEC 61850 Standard, all gadgets in PEA distribution system will work seamlessly. It is definitely difficult to keep up on a continuous basis with all the technology developments in all areas. In the choice of suppliers, one has to rely from the information of the service and equipment providers. For every Smart Grid equipment acquisition, one has to evaluate not only the supplier’s present products but also its future product development plans and its current research and development efforts.


