560
FaHCSIA Annual Report Annual Report 08 09

FaHCS
IA1034
3.09
09
FaHCSIA A
nnual Report
www.fahcsia.gov.auDepartment of Families, Housing, Community Services and Indigenous AffairsTelephone: 1300 653 227
Annual Report
08 09
Improving the lives of Australians

© Commonwealth of Australia 2009
ISSN: 1836-0297ISBN: 978-1-921647-02-4
ABN: 36 342 015 855 FaHCSIA
This work is copyright. Apart from any use as permitted under the Copyright Act 1968, no part may be reproduced by any process without prior written permission from the Commonwealth. Requests and inquiries concerning reproduction and rights should be addressed to the Commonwealth Copyright Administration, Attorney General’s Department, Robert Garran Offices, National Circuit, Barton ACT 2600 or posted at http://www.ag.gov.au/cca.
In many areas of Indigenous Australia it is considered offensive to publish photographs of Indigenous Australians who have recently died. Readers are warned that the publication may inadvertently contain such images.
Contact officerBranch ManagerBudget Development BranchDepartment of Families, Housing, Community Services and Indigenous AffairsPO Box 7576Canberra Business Centre ACT 2610
Telephone: 1300 653 227 (for the cost of a local call, mobile phones charged at mobile rates)Email: [email protected]: www.fahcsia.gov.au
AcknowledgmentsAnnual Report Team: Mark Cawley, Amy Panter, Rebecca Kain, Vangel Stefanoski, Janet McCann, Terry McDonald, Megan Smith, Ross Dennis, Larissa Black and Caroline GrassiaEditorial Consultants: Wilton Hanford HanoverDesign Consultants: ZOO CommunicationsPrinting: Canprint Communications Pty Ltd
The Age Pension—1909 to 2009This year is the centenary of the Age Pension. The Government has marked this important milestone in several ways. A permanent Age Pension centenary commemoration, set in the Parliamentary Triangle, was unveiled by the Hon. Jenny Macklin, MP, Minister for Families, Housing, Community Services and Indigenous Affairs, on 6 July 2009. The Royal Australian Mint has minted a dollar coin for general circulation, and certificates, signed by the Prime Minister and Minister Macklin, are to be awarded by federal Members of Parliament to Australian seniors who have contributed to their local community.
The Age Pension was first paid to Australia’s eligible seniors on 1 July 1909. At the end of its first year, around 65,500 people were receiving the Age Pension, with eligibility restricted according to character, race, age, residency and means. A century later, Australia has approximately two million age pensioners and the race provisions no longer apply—they had been fully removed by 1966, with the ‘good character’ provisions removed in 1974.
The value of the single Age Pension at its inception was a maximum of £26 a year. One hundred years later, following the major pension reform announced by the Government in the 2009–10 Budget, the real value of the single maximum Age Pension is equivalent to around five times the original rate.
In 1909 eligible people were given a certificate, signed by a magistrate, entitling them to receive the payment—originally administered by the Treasury. These payments were made in cash at the local post office.
Today, the Department of Families, Housing, Community Services and Indigenous Affairs has policy responsibility for the Age Pension, while Centrelink administers and applies Age Pension entitlement rules and makes payments directly into most recipients’ nominated bank accounts.
The last century has seen the Age Pension continually evolve as successive governments have responded to emerging social, demographic, economic and political trends. Yet the fundamental design of the Age Pension remains unchanged, providing the main source of financial support for most of Australia’s seniors.
Cas
e st
udy
Cover photo: features an image of the Age Pension centenary commemoration.
The text pages of this report are printed on Envi Carbon Neutral Paper.
Envi Coated is an Australian made, PEFC Certified paper which is made from elemental chlorine free pulp derived from sustainably managed forests and non-controversial sources. It is certified carbon neutral and Australian Paper is ISO 14001 certified which utilises renewable energy sources.
FaHCSIA usesGreenhouse Friendly™Envi Carbon Neutral Paper
Envi Carbon Neutral Paper is an Australian Governmentcertified Greenhouse Friendly™ Product.
IFaHCSIA Annual Report 2008–2009
The Hon. Jenny Macklin, MPMinister for Families, Housing, Community Services and Indigenous AffairsParliament HouseCANBERRA ACT 2600
Dear Minister
I am pleased to present to you the Annual Report for 2008–09 of the Department of Families, Housing, Community Services and Indigenous Affairs for your presentation to the Parliament in accordance with section 63(1) of the Public Service Act 1999.
This report has been prepared pursuant to the Requirements for Annual Reports approved by the Joint Committee of Public Accounts and Audit as required by section 63(2) of the Public Service Act 1999.
The report also meets my reporting requirements under the Child Support Scheme, the social security law and the family assistance law.
Yours faithfully
Dr Jeff Harmer
cc. The Hon. Tanya Plibersek, MP Minister for Housing and Minister for the Status of Women
The Hon. Bill Shorten, MP Parliamentary Secretary for Disabilities and Children’s Services
Parliamentary Secretary for Victorian Bushfire Reconstruction
Senator the Hon. Ursula Stephens Parliamentary Secretary for Social Inclusion and the Voluntary Sector
THE SECRETARYPO Box 7576Canberra Business Centre ACT 2610Telephone 1300 653 227Facsimile (02) 6244 7983E‑mail [email protected]

II FaHCSIA Annual Report 2008–2009
How to use this reportThis report provides details of the operations and performance of the Department of Families, Housing, Community Services and Indigenous Affairs (FaHCSIA) for the financial year ending 30 June 2009.
The report is presented in a number of parts.
Part 1—Executive summary—includes the Secretary’s message; our financial performance; an overview of the portfolio; details of our operating environment; our achievements against our key objectives; and our plan for the future.
Part 2—Performance reporting—reports on the Department’s achievements and performance against our outcomes and outputs.
Part 3—Corporate governance and accountability—provides details of our governance arrangements and how we enable and value our people, and information about our operational profile, our stakeholder relationships, how we respond to external scrutiny and how we ensure that the right payments are paid to the appropriate people.
Part 4—Appendices 1–12—reports additional information on a range of important issues, including:
Agency resource statements and resources for outcomes ◗
Staffing overview ◗
Commonwealth Disability Strategy performance report ◗
Advertising and market research ◗
Consultancy contract details ◗
Grant programs ◗
Freedom of information ◗
Legislation ◗
Age Pension supplementary information ◗
Family Tax Benefit reconciliation data ◗
Statement of material error 2007–08 ◗
Aboriginals Benefit Account Annual Report 2008–09. ◗

IIIFaHCSIA Annual Report 2008–2009
Part 5—Financial management—provides detailed information on the Department’s financial performance, including financial statements showing the financial position and cash flows during the year for FaHCSIA, the Aboriginals Benefit Account and the Aboriginal and Torres Strait Islander Land Account. It also includes the Australian National Audit Office’s independent audit of these statements.
To help you find specific information, the report also includes:
a table of contents (see page iv) ◗
a list of abbreviations (see page 523) ◗
a glossary (see page 525) ◗
a compliance index (see page 532) ◗
an index (see page 536) and a case studies index (see page 546). ◗
A full copy of this report is also available on our website at: www.fahcsia.gov.au

IV FaHCSIA Annual Report 2008–2009 Contents
ContentsLetter of transmittal i
How to use this report ii
Part 1 Executive summary 1
Chapter 1 FaHCSIA overview 2
FaHCSIA at a glance 2
Financial performance overview 3
Secretary’s message 4
Chapter 2 The portfolio 10
Ministers and portfolio responsibilities 10
Agencies and statutory bodies of the portfolio 10
Chapter 3 Our operating environment 15
Introduction 15
The global financial crisis 15
Indigenous Australians 16
Seniors 17
Disability and carers 18
Mental health 19
Children 19
Families 20
Women 22
Housing 23
Communities 24
Social justice and equity impact in the Australian community 25
Chapter 4 Our strategic framework 26
FaHCSIA’s Strategic Framework 2008–10 26
Achieving our objectives 28
Where we are heading 42
Part 2 Performance reporting 45
Chapter 5 Performance against outcomes 46
FaHCSIA’s ongoing commitment to performance reporting 46
Outcome and output structure 47
VContents FaHCSIA Annual Report 2008–2009
Cont
ents
Chapter 6 Outcome 1 51
Outcome 1 at a glance—Greater self‑reliance and economic, social and community engagement for Indigenous Australians 51
Outcome 1 performance report 54
Results for key performance indicators 71
Output Group 1.1 Whole‑of‑government coordination of policy development and service delivery for Indigenous Australians 71
Output Group 1.2 Services for Indigenous Australians 72
Output Group 1.3 Registration, regulation and capacity building of Indigenous corporations 85
Chapter 7 Outcome 2 90
Outcome 2 at a glance—Seniors, people with disabilities, carers, youth and women are supported, recognised and encouraged to participate in the community 90
Outcome 2 performance report 92
Results for key performance indicators 121
Output Group 2.0 Items applicable across Outcome 2 121
Output Group 2.1 Support for the aged 123
Output Group 2.2 Support for people with disability 129
Output Group 2.3 Support for carers 136
Output Group 2.4 Addressing youth homelessness 139
Output Group 2.5 Support for women 141
Chapter 8 Outcome 3 145
Outcome 3 at a glance—Families and children have choices and opportunities 145
Outcome 3 performance report 147
Results for key performance indicators 160
Output Group 3.1 Support for families 160
Output Group 3.2 Child support 167
Chapter 9 Outcome 4 170
Outcome 4 at a glance—Strong and resilient communities 170
Outcome 4 performance report 172
Results for key performance indicators 194
Output Group 4.1 Housing support 194
Output Group 4.2 Supporting financial management 198
Output Group 4.3 Community recovery 200
Output Group 4.4 Community partnerships and delivery 202

VI FaHCSIA Annual Report 2008–2009 Contents
Part 3 Corporate governance and accountability 206
Chapter 10 Our governance arrangements 207
Our governance arrangements at a glance 207
Our executive 207
Our organisational structure 214
Boards and committees 216
Chapter 11 Our people 227
Our people at a glance 227
Who we are 228
Supporting our people 231
Workplace health and safety 243
Chapter 12 Our stakeholders 246
Our stakeholders at a glance 246
Ministerial and parliamentary services 247
Working with other government agencies 249
Working with the community sector 249
Our Service Charter 252
Complaints Management System 252
Chapter 13 Our enabling strategies 253
Our enabling strategies at a glance 253
Planning for the future 254
Program framework 256
Environmental management 260
Building an evidence base 263
Protective security 264
Information management and technology 265
Chapter 14 Our accountability 269
Our accountability at a glance 269
External scrutiny 270
Fraud control 282
Internal audit 284
Social Security Appeals Tribunal 285
Act of grace payments 285
Right payments to the right people 285

VIIContents FaHCSIA Annual Report 2008–2009
Cont
ents
Part 4 Appendices 290
Chapter 15 Appendices 291
Appendix 1: Agency resource statement and resources for outcomes 291
Appendix 2: Staffing overview 303
Appendix 3: Commonwealth Disability Strategy performance report 308
Appendix 4: Advertising and market research 312
Appendix 5: Consultancy contract details 317
Appendix 6: Grant programs 339
Appendix 7: Freedom of Information 342
Appendix 8: Legislation 347
Appendix 9: Age Pension supplementary information 350
Appendix 10: Family Tax Benefit reconciliation data 357
Appendix 11: Statement of material error 2007–08 363
Appendix 12: Aboriginals Benefit Account Annual Report 2008–09 364
Part 5 Financial management 377
Chapter 16 Financial management 378
Introduction 378
Changes affecting FaHCSIA’s 30 June 2009 financial statements 378
FaHCSIA operating result 379
Balance sheet 380
Chapter 17 Financial statements 385
Aboriginals Benefit Account 469
Aboriginal and Torres Strait Islander Land Account 502
Abbreviations 523
Glossary 525
Compliance index 532
Index 536
Case studies index 546

VIII FaHCSIA Annual Report 2008–2009 Contents

2 Chapter 1 FaHCSIA overview
10 Chapter 2 The portfolio
15 Chapter 3 Our operating environment
26 Chapter 4 Our strategic framework 1Executive summary

2 FaHCSIA Annual Report 2008–2009 Part1 Executive summary Chapter 1
FaHCSIA at a glance
Our purposeImproving the lives of Australians by creating opportunities for economic and social participation by individuals, families and communities.
What we doFaHCSIA is the Australian Government’s main source of advice on social policy. In 2008–09 we managed 23 per cent of federal budget outlays.
FaHCSIA manages a diverse range of programs and services designed to support and improve the lives of many of the most vulnerable Australians. How we work within our operating environment is detailed on pages 15–25.
Our outcomesOutcome 1: Greater self‑reliance and economic, social and community engagement for Indigenous Australians
Outcome 2: Seniors, people with disabilities, carers, youth and women are supported, recognised and encouraged to participate in the community
Outcome 3: Families and children have choices and opportunities
Outcome 4: Strong and resilient communities
Our key objectivesClose the gap between Indigenous and non‑Indigenous Australians
Build a modern social and income support system
Provide better support and services for those in need
Deliver family policy that best fosters the development, wellbeing and safety of children
Reduce homelessness and make housing more affordable
Promote women’s safety, economic security and participation
FaHCSIA’s performance in achieving our key objectives for 2008–09 is detailed on pages 28–44.
FaHCSIA overview1

3Chapter 1 Part1 Executive summary FaHCSIA Annual Report 2008–2009
Exec
utiv
e su
mm
ary
Part 1
Financial performance overview
Operating resultsFaHCSIA had an operating deficit of $4.4 million in 2008–09 ($9.8 million deficit in 2007–08) from total income of $1,700.9 million. This deficit is the result of an increase in employee provisions, due to a reduction in the discount factor used in the calculation of employee provisions. The decrease in the discount factor is a result of the current economic conditions.
FaHCSIA administered programs totalling $75,737 million in 2008–09 on behalf of the Government ($55,746 million in 2007–08).
Table 1.1 Actual administered expenses, 2007–08 and 2008–09
2007–08 $m
2008–09 $m
Personal benefits 51,768 72,383
Grants 3,697 2,720
Other expenses 281 510
Payments to CAC bodies – 124
Total administered expenses 55,746 75,737
The increase in direct personal benefits is related to the Australian Government’s Economic Security Strategy and increased customer numbers in 2008–09. Grants expenses include only FaHCSIA related payments and these have decreased as a result of the new Federal Financial Relations Framework arrangements agreed by the Council of Australian Governments. The Treasury is accountable for the payment of grants to states and territories under National Partnership Agreements from 1 January 2009. FaHCSIA’s 2008–09 financial statements include only National Partnership Agreements payments made during the period 1 July to 31 December 2008.
There were new arrangements for payments to Commonwealth Authorities and Companies Act (CAC Act) bodies from 1 July 2008. All appropriations for CAC Act bodies within the portfolio are now paid to FaHCSIA for on payment to them.

4 FaHCSIA Annual Report 2008–2009 Part1 Executive summary Chapter 1
Over the past year the Department has successfully advanced some key change agendas for the Australian Government. These have included the finalisation of the Pension Review and subsequent Secure and Sustainable Pension Reform package; the announcement of the Paid Parental Leave scheme, in the 2009–10 Budget; implementing the Government’s commitment to closing the gap on Indigenous disadvantage; developing and implementing the Council of Australian Governments reforms; and taking large steps in furthering the agenda to reduce homelessness and make housing more affordable.
While pursuing this ambitious agenda, the Department also played a key role in responding to the disasters that occurred during the year, including the Queensland floods and the Victorian bushfires, as well as supporting Australians affected by the global financial crisis. I would like to acknowledge those who have been affected by these events. In particular, I would like to pay my respects to those who lost their lives during the Victorian bushfires, and to express my condolences to their loved ones.
The Pension ReviewThis year is the centenary of the Age Pension, which was first paid on 1 July 1909. Coinciding with the centenary was the Pension Review, which generated a great deal of community interest during the year, culminating in a major package of initiatives in the 2009–10 Budget. After nine months of research, analysis and consultation, the final report was used to inform the Government’s Secure and Sustainable Pension Reform package, announced in the 2009–10 Budget.
The package provides greater financial security to Australia’s 3.3 million age, carer, disability, war widows and widowers, and service pensioners.
Secretary’s message

5Chapter 1 Part1 Executive summary FaHCSIA Annual Report 2008–2009
Exec
utiv
e su
mm
ary
Part 1
I am proud of the quality of the report and wish to thank the Pension Review Taskforce for their hard work and expertise, and the more than 2,000 individuals and organisations who contributed through the consultation process.
Responding to disasters2008–09 has been a very difficult year for many Australians and a challenging one for this Department. On 7 February 2009, the worst bushfires in Australia’s history occurred in Victoria, resulting in the loss of 173 lives. Storms and flooding occurred in parts of Queensland and New South Wales, and a terrorist attack took place in Mumbai, India, where many Australians were visiting or living.
In response to these disasters, FaHCSIA implemented a range of the Australian Government’s immediate assistance measures, including the Disaster Recovery Payment, Funeral/Memorial Assistance, the Income Recovery Subsidy, and other measures including additional emergency relief.
The global financial crisisThe impact of the global financial crisis on the Australian economy has posed unique challenges to FaHCSIA’s response capacity. The crisis has had an impact on the financial resilience and wellbeing of many individuals, families and communities. In December 2008, under the Government’s Economic Security Strategy, the Department made a lump‑sum payment through Centrelink to seniors, people with disability and carers of $1,400 for singles and $1,050 for each eligible member of a couple.
We delivered payments to support eligible low and middle‑income households, families, and people in housing stress as part of a second stimulus package announced by the Government in February 2009.
As part of the Nation Building – Economic Stimulus Plan the Government has committed $5.64 billion1 over three and a half years to the new Social Housing Initiative.
The Social Housing Initiative represents a commitment by the Australian Government and state and territory governments to significantly increase the supply of social housing throughout Australia and provide much needed accommodation to many disadvantaged Australians, particularly those who are homeless or at risk of becoming homeless.
1 This figure, which is used throughout this report, reflects new funding and targets approved for the Social Housing Initiative in August 2009.
6 FaHCSIA Annual Report 2008–2009 Part1 Executive summary Chapter 1
With the assistance of the not‑for‑profit housing sector the initiative will see up to 19,200 new public and community housing dwellings built.
A further 10,000 dwellings that would have otherwise been lost to the social housing stock will be retained as a result of repairs and maintenance work funded by the Commonwealth.
We will continue to monitor the impacts of the global financial crisis to assist government.
The Council of Australian GovernmentsDuring 2008–09, a landmark year in the finalisation and progressive implementation of the Council of Australian Governments (COAG) reform agenda, the Department has worked to ensure the successful and seamless implementation of this agenda. Under the new Federal Financial Relations Framework, we have contributed to the management of six national partnership agreements (on social housing, Nation Building and Jobs Plan [Social Housing Initiative], Homelessness, Remote Indigenous Housing, Remote Service Delivery and concessions for pensioners and Seniors Card holders) and three national agreements (on affordable housing, disability and Indigenous reform).
The Department also led the development of the National Framework for Protecting Australia’s Children 2009–2010. COAG endorsed Protecting children is Everyone’s Business: National Framework for Protecting Australia’s Children 2009–2010, in April 2009. The Australian Government will continue to work in partnership with the state and territory governments and the non‑government sector to implement and deliver the National Framework, and report on progress.
Reducing red tapeIn an endeavour to improve effectiveness and better target programs, FaHCSIA undertook a comprehensive review of a number of its community programs during the year. As a result, we were able to consolidate 20 community programs into four—Community Investment, Financial Management, Family Support and Women. These new programs allow streamlining of administered arrangements, and better targeting of services to direct resources to clients and better respond to changing circumstances.
We have reformed our grant‑related administrative practices by introducing a suite of simpler and more user‑friendly funding agreements.
Now we have common terms and conditions for all our programs. This will reduce the administrative burden for a large number of our service providers while continuing to ensure funds are used effectively.

7Chapter 1 Part1 Executive summary FaHCSIA Annual Report 2008–2009
Exec
utiv
e su
mm
ary
Part 1
Ongoing policy direction and future challengesFaHCSIA’s Strategic Framework 2008–10 sets out six key objectives through which the Department achieves its purpose—improving the lives of Australians by creating opportunities for economic and social participation by individuals, families and communities.
Each year, the Department identifies a number of priorities and actions under these objectives that reflect Government priorities. These priorities are supported by project and business plans across the Department. As I look through the list of priorities for 2008–09, I’m pleased to say that FaHCSIA has delivered on the Government’s priorities, and is now strongly positioned to meet emerging challenges and priorities for 2009–10.
In the year ahead, challenges for FaHCSIA will include the continuing need to respond to the global financial crisis, implementation of the COAG reform agenda—including the National Framework for Protecting Australia’s Children and the Plan to Reduce Violence against Women and their Children—and implementation of the Government’s key reforms—including the Secure and Sustainable Pension Reform package, the Paid Parental Leave scheme and the National Disability Strategy. FaHCSIA will continue to lead the development of a national compact with the not‑for‑profit sector. A draft compact will be developed by December 2009.
The Department will continue to lead the Australian Government’s response to assist the Victorian bushfire recovery and reconstruction effort and respond to other disasters as they occur. Supporting the Government’s reform agenda requires a strong evidence base. To this end, FaHCSIA’s Research and Evaluation Plan and the Indigenous Affairs Whole‑of‑Government Research and Evaluation plan provide strategic direction for our research, evaluation and data activities—key components in helping us to develop sound evidence‑based policy.
Supporting the Minister and the Government in their agenda to close the gap between Indigenous and non‑Indigenous Australians, particularly for those living in remote Australia, continues to be one of the Department’s highest priorities.
There are particular challenges for the Department in ensuring effective and timely delivery of the COAG reforms, particularly in respect of remote Indigenous housing and reforms in the priority communities under the Remote Service Delivery National Partnership. Welfare payment reform and moving the Northern Territory Emergency Response into a sustainable development phase—in which income management and other key measures conform with the Racial Discrimination Act 1975—are further challenges in the year ahead.

8 FaHCSIA Annual Report 2008–2009 Part1 Executive summary Chapter 1
Changes to ministerial arrangementsDuring the year, the Department welcomed Senator the Hon. Ursula Stephens to the portfolio as Parliamentary Secretary for Social Inclusion and the Voluntary Sector. In this role, Senator Stephens will be working closely with those in the non‑government sector.
The Hon. Bill Shorten, MP assumed the additional responsibility of Parliamentary Secretary for Victorian Bushfire Reconstruction.
Changes to our ExecutiveThe year has also seen changes in the Department’s Deputy Secretary roles. Geoff Leeper, who had been with the Department for almost two and a half years, moved to take up the position of Deputy Secretary of the Australian Climate Change Regulatory Authority. I would like to take the opportunity to thank Geoff for his dedicated and outstanding contribution to the Department.
FaHCSIA also welcomed two new Deputy Secretaries during 2008–09—Bruce Hunter and Serena Wilson. Bruce and Serena have extensive experience in the Australian Public Service and we are looking forward to their contribution in taking the Department forward in challenging times.
ThanksI would like to take this opportunity to thank all staff for their tireless and professional work, and their dedication in the face of significant challenges. Without you we would not have successfully served our Ministers and Parliamentary Secretaries, or contributed to a more positive social landscape for all Australians.
Jeff Harmer

9Chapter 1 Part1 Executive summary FaHCSIA Annual Report 2008–2009
Exec
utiv
e su
mm
ary
Part 1
Cas
e st
udy
The Pension ReviewFollowing the report by the Senate Community Affairs Committee Inquiry into the cost of living pressures on older Australians, in May 2008 the Hon. Jenny Macklin, MP, Minister for Families, Housing, Community Services and Indigenous Affairs, requested that the Secretary of the Department, Dr Jeff Harmer, undertake a review of the pension system. The review investigated the appropriate levels of income support and allowances; the frequency of payments; and the structure and payment of concessions or other entitlements of seniors, carers and people with disability.
An extensive public consultation process received more than 1,800 written submissions from individuals and organisations. To inform this process and address the terms of reference for the review, the Pension Review Background Paper was released in August 2008.
The review held public forums in all capital cities as well as Newcastle, Rockhampton and Wangaratta. Focus groups held in Perth, Melbourne, Sydney, Armidale and Devonport discussed the issues identified in public forums in more depth.
Public consultation also involved the establishment of a Reference Group whose members were drawn from key seniors, carers and disability groups, as well as academia. It included members from organisations such as the Council on the Ageing, National Seniors Australia, Carers Australia, the Association of Superannuation Funds of Australia, the Australian Council of Trade Unions and the Australian Council of Social Services.
As well as the public consultations, the Pension Review undertook a program of research and analysis.
Completed in February 2009, the Pension Review’s report assisted the Government to structure the Secure and Sustainable Pension Reform package announced as part of the 2009–10 Budget. The report will also inform the broader inquiry into Australia’s Future Tax System.

10 FaHCSIA Annual Report 2008–2009 Part1 Executive summary Chapter 2 The portfolio
This section provides an overview of FaHCSIA’s portfolio, including the Ministers responsible for the portfolio and its agencies, the structure of the portfolio and information about each of the portfolio agencies and their roles.
Ministers and portfolio responsibilitiesThe Ministers and Parliamentary Secretaries responsible for the portfolio and its agencies are:
the Hon. Jenny Macklin, MP, ◗
Minister for Families, Housing, Community Services and Indigenous Affairs
the Hon. Tanya Plibersek, MP, ◗
Minister for Housing and Minister for the Status of Women
the Hon. Bill Shorten, MP, ◗
Parliamentary Secretary for Disabilities and Children’s Services Parliamentary Secretary for Victorian Bushfire Reconstruction
Senator the Hon. Ursula Stephens, ◗
Parliamentary Secretary for Social Inclusion and the Voluntary Sector.
Agencies and statutory bodies of the portfolio
Department of Families, Housing, Community Services and Indigenous AffairsThe Department of Families, Housing, Community Services and Indigenous Affairs (FaHCSIA) is a key source of advice to the Australian Government on social policy and works in partnership with other government and non‑government organisations to manage
The portfolio2

11Chapter 2 The portfolio Part1 Executive summary FaHCSIA Annual Report 2008–2009
Exec
utiv
e su
mm
ary
Part 1
a diverse range of programs and services designed to support and improve the lives of Australians.
FaHCSIA has whole‑of‑government responsibilities in relation to Indigenous affairs and women.
The Department operates under the Financial Management and Accountability Act 1997 (FMA Act). Figure 1.1 on page 14 shows the Portfolio Ministers, the Department and the portfolio agencies, including agency heads and outcomes.
Equal Opportunity for Women in the Workplace AgencyThe Equal Opportunity for Women in the Workplace Agency is a statutory authority that administers the Equal Opportunity for Women in the Workplace Act 1999 and operates under the FMA Act. This agency’s principal functions are to promote employment for women on the basis of merit, promote equal opportunity, eliminate discrimination and foster workplace consultation between employers and employees on these issues. The agency contributes to portfolio goals by working with business to develop work practices that improve women’s workforce participation in an environment free from discrimination.
Aboriginal Hostels LimitedAboriginal Hostels Limited is an Australian Government company subject to the Corporations Act 2001 and the Commonwealth Authorities and Companies Act 1997 (CAC Act). The company provides temporary accommodation to Aboriginal and Torres Strait Islander people through a national network of 138 hostels. It contributes to the portfolio’s goals by helping Aboriginal and Torres Strait Islander people to improve their standard of living and achieve health, aged care, educational and employment‑related goals.
Indigenous Business AustraliaIndigenous Business Australia (IBA) is a statutory authority established under the Aboriginal and Torres Strait Islander Act 2005 and is subject to the CAC Act. IBA creates opportunities for Aboriginal and Torres Strait Islander people and communities to build assets and wealth.
IBA contributes to the portfolio goals by contributing to Indigenous economic development. To achieve this, IBA assists the Government in working with the private sector and local Indigenous people to encourage and foster Indigenous economic independence.

12 FaHCSIA Annual Report 2008–2009 Part1 Executive summary Chapter 2 The portfolio
Indigenous Land CorporationThe Indigenous Land Corporation (ILC) is a statutory authority established under the Aboriginal and Torres Strait Islander Act 2005 and is subject to the CAC Act. The ILC assists Aboriginal and Torres Strait Islander people to acquire and manage Indigenous‑held land so as to provide economic, environmental, social and cultural benefits. The ILC contributes to the goals of the portfolio by assisting in the delivery of sustainable benefits from land acquisition and by providing land management assistance.
Torres Strait Regional AuthorityThe Torres Strait Regional Authority (TSRA) is a statutory authority established under the Aboriginal and Torres Strait Islander Act 2005 and is subject to the CAC Act. TSRA formulates, implements and monitors the effectiveness of programs for Aboriginal and Torres Strait Islander people living in the Torres Strait and advises the Minister for Families, Housing, Community Services and Indigenous Affairs about Aboriginal and Torres Strait Islander affairs.
TSRA contributes to the goals of the portfolio by working to empower Aboriginal and Torres Strait Islander people living in the Torres Strait to determine their own affairs based on the ailan kastom (island custom) of the Torres Strait, which provides a source of unity and strength.
Northern Territory land councilsThe Northern Land Council, the Central Land Council, the Anindilyakwa Land Council and the Tiwi Land Council are the four Northern Territory land councils established under the Aboriginal Land Rights (Northern Territory) Act 1976 (ALRA). The land councils are subject to the CAC Act. Each is an independent statutory body and was established to represent Aboriginal interests in a range of processes under the Act.
Social Security Appeals TribunalThe Social Security Appeals Tribunal is a statutory body under the Social Security (Administration) Act 1999 and operates under the FMA Act. The tribunal conducts merit reviews of administrative decisions made under a number of enactments, in particular social security law, family assistance law and child support law.
The tribunal has the power to review decisions independently of Centrelink and the Child Support Agency. It provides a review mechanism that is just, efficient, effective and informal, and contributes to the portfolio by ensuring that administrative decisions of FaHCSIA are consistent with the legislation.

13Chapter 2 The portfolio Part1 Executive summary FaHCSIA Annual Report 2008–2009
Exec
utiv
e su
mm
ary
Part 1
Wreck Bay Aboriginal Community CouncilThe Wreck Bay Aboriginal Community Council is an independent statutory body established by the Aboriginal Land Grant (Jervis Bay Territory) Act 1986 and is subject to the CAC Act. The council holds title to land and provides services to the Aboriginal community of Jervis Bay.
Statutory office holdersAboriginal Land CommissionerThe Aboriginal Land Commissioner is an independent statutory office holder under the ALRA and operates under the FMA Act. The principal function of the Commissioner is to consider applications for claims to traditional land and to make findings to the Minister for Families, Housing, Community Services and Indigenous Affairs for the granting of land.
Executive Director of Township LeasingThe position of Executive Director, Township Leasing is a statutory office established under the ALRA to enter into, on behalf of the Commonwealth, leases of Aboriginal‑held land in the Northern Territory, and to administer subleases and other rights and interests derived from such leases.
A central function of the Executive Director is to enter into leases over townships on Aboriginal land in the Northern Territory in accordance with section 19A of the ALRA, following approval from traditional owners.
Registrar of Indigenous CorporationsThe Registrar of Indigenous Corporations is an independent statutory office holder who administers the Corporations (Aboriginal and Torres Strait Islander) Act 2006 and operates under the FMA Act. The Office of the Registrar of Indigenous Corporations provides Aboriginal and Torres Strait Islander communities, groups and organisations with a means of registration.

14 FaHCSIA Annual Report 2008–2009 Part1 Executive summary Chapter 2 The portfolio
Figure 1.1 Families, Housing, Community Services and Indigenous Affairs portfolio structure and outcomes as at 30 June 2009*
Minister for Families, Housing, Community Services and Indigenous AffairsThe Hon. Jenny Macklin, MP
Minister for Housing and Minister for the Status of WomenThe Hon. Tanya Plibersek, MP
Parliamentary Secretary for Disabilities and Children’s Services and Parliamentary Secretary for Victorian Bushfire Reconstruction
The Hon. Bill Shorten, MP
Parliamentary Secretary for Social Inclusion and the Voluntary SectorSenator the Hon. Ursula Stephens
Department of Families, Housing, Community Services and Indigenous AffairsSecretary: Dr Jeff Harmer
Outcome 1: Greater self‑reliance and economic, social and community engagement for Indigenous Australians
Outcome 2: Seniors, people with disabilities, carers, youth and women are supported, recognised and encouraged to participate in the community
Outcome 3: Families and children have choices and opportunities
Outcome 4: Strong and resilient communities
Aboriginal Hostels Limited
General Manager: Mr Keith Clarke
Outcome: Improved access to education, employment, health and other services for Aboriginal and Torres Strait Islander people
travelling or relocating through the operation of temporary hostel accommodation services
Indigenous Land Corporation
Chair: Ms Shirley McPherson
Outcome: Enhanced socio‑economic development, maintenance of cultural identity and protection of the environment by Indigenous Australians
through land acquisition and management
Equal Opportunity for Women in the Workplace Agency
Acting Director: Ms Mairi Steele
Outcome: Increased influence over Australian employers to achieve equality for women in the workplace through regulation and education on eliminating discrimination and promoting merit
based opportunity
Social Security Appeals Tribunal
Executive Director: Mr Les Blacklow
Outcome: Conduct merit reviews of administrative decisions made under a number of enactments,
in particular social security law, family assistance law, and child support law
Northern Territory land councilsNorthern Land CouncilCentral Land Council
Anindilyakwa Land CouncilTiwi Land Council
Outcome: Represent Aboriginal interests in various processes under the Aboriginal Land
Rights (Northern Territory) Act 1976
Indigenous Business Australia
General Manager: Mr Ron Morony
Outcome: Improved wealth acquisition to support the economic independence of Aboriginal and
Torres Strait Islander peoples through commercial enterprise, asset acquisition, construction and
access to concessional home and business loans
Wreck Bay Aboriginal Community Council
Outcome: Established by the Aboriginal Land Grant (Jervis Bay Territory) Act 1986 to hold title to land and provide council services to the Aboriginal
Community of Jervis Bay
Torres Strait Regional Authority
Chair: Mr John (Toshie) Kris
Outcome: Progress towards closing the gap for Aboriginal and Torres Strait Islander peoples
living in the Torres Strait region through development planning, coordination, sustainable
resource management, and preservation and promotion of Indigenous culture
* Only Ministers, the portfolio Department and agencies of the portfolio are represented in this figure.

15Chapter 3 Our operating environment Part1 Executive summary FaHCSIA Annual Report 2008–2009
Exec
utiv
e su
mm
ary
Part 1
IntroductionFaHCSIA operates in a complex environment affected by a range of factors, including changing social and economic trends, family formation and stability, and population growth. The interactions of these factors, particularly in the current global financial climate, have created challenging circumstances for many individuals, families and communities.
Policy development and reform continues to be set against a backdrop of projected changes in Australia’s demographic structure. The recognition that Australia, along with most of the developed world, is facing an ageing population greatly influences the strategic context of current and future policy direction.
This demographic change will have significant implications for income support, health and aged care services and general economic growth. The need to ensure that adequacy is balanced with long‑term sustainability in payments to individuals will continue to strongly influence FaHCSIA’s business.
A major change in our operating environment occurred in January this year when the Council of Australian Governments (COAG) reform agenda was implemented. Under this reform, funding previously paid to states and territories by FaHCSIA is now appropriated to the Treasury. A new financial framework has resulted in a significant rationalisation of Specific Purpose Payments for the delivery of core government services.
Under the new arrangements, FaHCSIA now has policy responsibility for three national agreements and six national partnership agreements, which involve significant reforms in the areas of housing, disabilities, and closing the gap on Indigenous disadvantage.
The global financial crisisThis year saw a significant shift in economic conditions, which had a broad impact across the Australian economy. Projected increases in unemployment, reductions in Commonwealth revenue, and the impact on individual wellbeing will require continued
Our operating environment3
16 FaHCSIA Annual Report 2008–2009 Part1 Executive summary Chapter 3 Our operating environment
monitoring to ensure that policy responses remain sustainable while providing the necessary support to individuals and families.
The Department has actively responded to the impact of the global financial crisis by providing financial support and helping to build resilience and capacity in individuals, families and communities affected by the economic downturn.
In October 2008, the Government announced the Economic Security Strategy to offer immediate support for many Australians in response to the crisis. In December 2008, the Department paid seniors, people with disability and carers a lump‑sum Economic Security Strategy payment of $1,400 for singles and $1,050 for each eligible member of a couple. Families received $1,000 for each eligible dependent child.
In February 2009, the Government announced a second package in response to the global recession—the $42 billion Nation Building—Economic Stimulus Plan. The Department played a key role through the delivery of a range of one‑off payments through Centrelink, supporting eligible low‑ and middle‑income households with school age children, single income families, single workers and students.
To complement the economic stimulus payments, the Government announced $80.4 million extra funding for emergency relief and financial counselling, doubling funding from 1 March 2009 to 30 June 2011.
The Social Housing Initiative will significantly increase the supply of social housing throughout Australia and provide much‑needed accommodation to many disadvantaged Australians, particularly those who are homeless or at risk of becoming homeless. As a requirement for receiving funding through the initiative, states and territories have also agreed to a number of reform directions in the social housing sector, which will provide increased opportunities for persons who are homeless or at risk of homelessness to gain secure long‑term accommodation.
Maintaining a strong evidence base on the impact of economic conditions on Australian individuals, families and communities will assist FaHCSIA in responding to changing needs and in continuing to further the social inclusion agenda.
Indigenous AustraliansIndigenous people remain among the most disadvantaged Australians. While some important steps have been taken to address Indigenous disadvantage, the Productivity Commission’s 2009 report, Overcoming Indigenous Disadvantage, found that there are still significant gaps in the key areas of life expectancy, infant and child mortality, early childhood education, literacy and numeracy skills, school completion rates, and employment outcomes. For example, the gap between Indigenous and non‑Indigenous
17Chapter 3 Our operating environment Part1 Executive summary FaHCSIA Annual Report 2008–2009
Exec
utiv
e su
mm
ary
Part 1
life expectancy at birth was 11.5 years for males and 9.7 years for females, Indigenous child mortality rates for the 1–4 years and 0–4 years age groups are at between two and four times the non‑Indigenous rates, and the gap between Indigenous students’ learning outcomes and those of all students increased as remoteness increased. Closing the gap between Indigenous and non‑Indigenous Australians will require a strong collaborative commitment from governments, Indigenous Australians, business and the wider community.
It is encouraging to note areas where the gaps are narrowing. For example, there has been a reduction in infant mortality and in the proportion of young Indigenous people neither at school nor employed. There have also been improvements in access to clean water and functional sewerage and electricity services in some Indigenous communities.
Disadvantage is not limited to Indigenous Australians living in remote areas. Since 1971 the proportion of the Indigenous population living in places with 1,000 or more people has grown from 44 per cent to 76 per cent in 2006. In 2006 three quarters of all Indigenous Australians lived either in Australia’s major cities or regional areas. Of these, it is estimated that 45 per cent of Indigenous people aged 18 years and younger live in the suburbs and towns in the lower 20 per cent of Census collection districts.1 Within the same suburb or large regional town, Indigenous Australians generally experience poorer outcomes in terms of employment, education, income and housing.
Through COAG, governments have acknowledged that there needs to be a much stronger effort in urban and regional areas to ensure that Indigenous Australians benefit from investments in schooling, housing, skills development, health care and other services. Future action with COAG will focus on improved coordination of service delivery, and collaborating with the business and community sectors to further advance reform in addressing Indigenous disadvantage. Engagement with key business and community sector groups has already begun. Together with reforms to the Community Development Employment Projects program and Indigenous Employment Program announced in December 2008, this joint effort will pave the way for improved educational, vocational training and employment outcomes for Indigenous Australians.
SeniorsFaHCSIA’s primary assistance to senior Australians is through the Age Pension, which is the single largest outlay by the Department. Currently, three out of four Australians over the age of 65 are on the Age Pension, and 60 per cent of these are on a maximum rate of pension. The growth in private retirement savings from the Superannuation Guarantee will gradually shift the balance so that there will be more Australians on part pension than on full pension.
1 Ranked by the ABS’ SEIFA Index.

18 FaHCSIA Annual Report 2008–2009 Part1 Executive summary Chapter 3 Our operating environment
The global economic downturn had an adverse impact on the private retirement income and assets of many pensioners and retirees, and resulted in the unplanned loss of income for some. The Government has made adjustments to the Age Pension system in response, including more frequent updates of the value of shares and investments used in pension assets test assessments, a reduction in income test deeming rates, and the suspension of minimum drawdown requirements for account‑based superannuation pensions. As a result, many seniors received increases in the pension and others became newly eligible.
In addition to these adjustments, the Economic Security Strategy measures announced in October 2008 included a down payment on pension reform of $4.9 billion to Australia’s four million pensioners, seniors, carers and veterans, providing them with immediate financial help as they awaited the outcomes of the Pension Review.
This year, Australia marked the centenary of the Age Pension. This celebration coincided with the Pension Review, which undertook a comprehensive review of the pension system. The review concluded that the basic structure of Australia’s system, with its focus on poverty alleviation, indexation to community living standards and prices and means testing to target payments to those most in need, is sound.
Alongside the Pension Review reforms, the Department has established a number of new international social security agreements with Greece, Japan, Finland and Korea, and a supplementary agreement with Germany. These agreements help people who are travelling or resident in other countries to access their pension payments, and play an important role in strengthening Australia’s bilateral relations.
Disability and carersAs the population ages, increases in the proportion of people with disability are anticipated to have a large impact on the demand for disability services. In 2006 the National Centre for Social and Economic Modelling projected that by 2031 the number of people requiring care is estimated to increase considerably, with older Australians with disability over 65 years of age projected to increase from 350,000 to 882,000 (150 per cent), and those over 85 years of age projected to increase from 80,000 to 260,000 (more than 200 per cent). The number of younger people with disability (under 65 years) is projected to increase by 25 per cent.
By contrast, over the same periods, the number of carers is projected to increase by only 74 per cent, from 208,000 to 363,000. Innovation in the design and delivery of services and policy responses to support the needs of people with disability and their carers will be important issues to consider in the future. Carers play an important role in our society, both for the people that they care for and the contribution they make to the community. Unfortunately, carers are at significant risk of social and economic isolation and often face more financial pressure than non‑carers, as well as lower physical and psychological wellbeing and problems accessing services and support.

19Chapter 3 Our operating environment Part1 Executive summary FaHCSIA Annual Report 2008–2009
Exec
utiv
e su
mm
ary
Part 1
Again, as the population ages and the projected increase in people with disability occurs, the demand for informal carers will also increase, as will the risks they face in committing to a role as carers. The Government recognises the role of carers and supports them through payments to individuals and funding of community organisations that offer support services. The Government’s Secure and Sustainable Pension Reform package included a significant boost to pensioners receiving Disability Support Pension and Carer Payment. Carer Payment (child) has also been expanded, with changes coming into effect from 1 July 2009. The Government introduced a new Carer Supplement in the 2009–10 Budget, in recognition of the significant financial pressures carers face. It replaces ad hoc bonuses with an annual payment of $600 to recipients of Carer Allowance for each person being cared for.
Mental healthMental illness can impair a person’s development, education and career and diminish their quality of life. Nearly one in five, or more than three million, Australians are affected by a mental illness in any one year. Severe mental illnesses are less prevalent and affect around two and a half per cent of the population at any one time.
The annual cost of mental illness in Australia is estimated at $20 billion, including the cost of lost productivity and labour force participation. The COAG National Action Plan on Mental Health 2006–11 emphasises the need for coordination and collaboration between government, private and non‑government providers to address this issue through building a more connected system of health care and community supports for people affected by mental illness. The action plan continues to set the framework within which FaHCSIA is designing and progressing its mental health policies and programs.
Prevention and early intervention can contribute to a reduction in the incidence of severe mental illness through enabling the community and family members to recognise the early signs or onset of mental illness and to recommend or provide appropriate interventions. Giving education, training and support to family members and carers of those with mental illness helps to build more resilient families and communities, and makes possible more effective support and participation for those with mental illness.
ChildrenAustralian and international evidence confirms that the early years of a child’s life are critical to future development. It is at this time that a child’s brain is rapidly developing and the foundations for learning, behaviour and health over the life course are set.
A number of early childhood risk factors can have an impact on childhood outcomes. These include poor attachment or poor social skills; parenting styles; family factors and

20 FaHCSIA Annual Report 2008–2009 Part1 Executive summary Chapter 3 Our operating environment
life events; and community factors such as socio‑economic disadvantage and availability of support services. FaHCSIA has a number of programs aligned to the Australian Government’s social inclusion priorities, which seek to enhance protective factors to offset the impact of these risk factors.
A child‑centred approach to family policy aims to ensure that programs promote the best interests of children and help to protect them from poor life outcomes. Through a variety of payments, programs and policies, FaHCSIA seeks to support families and enable them to better manage life’s transitions and contribute to building stronger, more resilient communities by maintaining healthy family relationships.
Over the past decade there has been a significant increase in the number of reported incidents of child abuse and neglect. Indigenous children remain significantly over‑represented in this group. Governments have adopted an early intervention and child‑centred approach to ensure policy and programs improve the safety and wellbeing of all Australian children. Recognising that ‘protecting children is everyone’s business’, COAG endorsed the National Framework for Protecting Australia’s Children in April 2009. The framework outlines strategies to address key challenges in children’s policy over the next 12 years.
FamiliesStrong families are vital to the happiness and wellbeing of their members and communities, as well as the economic and social wellbeing, strength and vitality of Australian society. Major demographic, social, and economic changes, coupled with changes in social attitudes, have led to an increase in diversity of family types over the last 30 years. These environmental shifts formed the impetus for two reforms for families this year.
Assisting families to find a better balance between their work and caring responsibilities is an important element in the Australian Government’s support for families. The new Paid Parental Leave scheme will have a number of significant benefits to families. Parents will be able to stay at home longer to provide full‑time care during the vital early months of social, cognitive and physical development, giving babies the best start in life. The scheme will also advance broad social objectives such as increased gender equity and balance between paid work and family by encouraging women to maintain their connection with the workforce and their careers. It is an essential element in preparing Australia for the challenges of an ageing population.
On 16 February 2009, Minister Macklin announced the establishment of the Family Support Program. This program will work with and support families and nurture children to enable them to better manage life’s transitions and contribute to building stronger, more resilient communities. It is a national program that brings together a number of existing family,

21Chapter 3 Our operating environment Part1 Executive summary FaHCSIA Annual Report 2008–2009
Exec
utiv
e su
mm
ary
Part 1
Cas
e st
udy
The Paid Parental Leave schemeIn February 2008, the Government asked the Productivity Commission to undertake a public inquiry into paid maternity, paternity and parental leave.
The inquiry invited public submissions and initially received 253 submissions, including one from FaHCSIA in June 2008. Further submissions were invited after the release of the draft report in September 2008 and public consultations were held around the country.
Throughout the inquiry, FaHCSIA worked collaboratively with the Productivity Commission, providing advice on interactions of a Paid Parental Leave scheme with the current system of family payments. The final report of the inquiry was provided to Government on 2 March 2009 and publicly released on 12 May 2009, along with the Government’s plan to implement most of its recommendations.
In response to the final report, the Government introduced a Paid Parental Leave scheme as part of the 2009–10 Budget, to commence from 1 January 2011. The scheme aims to enhance child and maternal health and development, facilitate workforce participation by offsetting the disincentives to paid work generated by social welfare and taxation arrangements and promote gender equity and family work–life balance.

22 FaHCSIA Annual Report 2008–2009 Part1 Executive summary Chapter 3 Our operating environment
parenting and children’s services with a common interest. It has three core streams of services and a strong collaborative approach, with better alignment and linking of services.
The increase in the diversity of family types has required the design of government policy, programs and services to be widened to consider the varying needs of these families. Recent legislative changes have removed differential treatment between same‑sex and different‑sex couples and their children in areas such as social security, family assistance, child support, tax, superannuation, health and aged care. These changes reflect the evolving nature of family policy.
WomenFaHCSIA seeks to improve the economic and social outcomes of women through the promotion of gender equality and increasing their safety and economic security. Women’s and men’s roles have undergone significant change over the past few decades, and it is important that this is reflected in policy to ensure that Australian women are equally recognised and rewarded for their contribution to the economy and society. Women’s and men’s roles in supporting and raising a family have also changed and it is important that government policy reflects contemporary aspirations of men and women to be both carers and earners in their families.
While gender equality has significantly advanced over recent decades, women still lag on a number of significant statistics. On average, women who work full‑time earn 17 per cent less than men. It is estimated that an average 25‑year‑old woman starting work today will earn $900,000 less than a 25‑year‑old man over her working life and will have significantly less in retirement savings. This is mainly attributable to the reduction in women’s workforce participation during peak child‑bearing years. Women are also more likely to work in part‑time or casual positions, and undertake caring responsibilities, further compounding the lifetime earnings gap.
Unfortunately, violence against women continues to be a challenge for the Australian community. One in three Australian women will report being a victim of physical violence, and almost one in five will report being a victim of sexual violence in their lifetime. In addition to the psychological and physical suffering of victims, it is estimated that violence against women costs the nation approximately $13.6 billon every year.
In March 2009, the National Council to Reduce Violence against Women and their Children handed its report, Time for Action: The National Council’s Plan to Reduce Violence against Women and their Children, 2009–2021, to the Government. The plan includes recommendations to tackle the unacceptable levels of sexual assault and domestic and family violence in Australia and provides clear directions for the future.

23Chapter 3 Our operating environment Part1 Executive summary FaHCSIA Annual Report 2008–2009
Exec
utiv
e su
mm
ary
Part 1
HousingAccess to affordable housing options, particularly for those most in need, remains a key social and economic challenge for Australia. In its first State of Supply Report, the National Housing Supply Council identified a number of current influences on supply and demand. These included the impact of the present global financial crisis, the excess of demand over supply, both present and projected, and how high housing costs affect lower‑income home buyers and tenants.
Over the year, Australia has seen a significant reduction in the official cash rate, which has translated into the lowest variable home loan rates for 40 years. However, a shortage in housing supply continues to drive both home purchase and rental costs to levels that are very hard to reach for many Australians. Continuing to work on supply‑side issues at Commonwealth, state and territory levels and through collaboration with business will remain a priority.
Across Australia, around 105,000 people are homeless on any given night. Increasingly, those experiencing homelessness include children, families and older people. The experience of homelessness is usually linked to other issues including long‑term unemployment, mental illness, substance abuse, and family and relationship breakdown and violence. The shortage of affordable housing also increases the incidence of homelessness and may become more prevalent as unemployment rates increase as a result of economic conditions.
The National Affordable Housing Agreement sets out a number of measures that seek to address housing affordability and combat the issue of homelessness including social housing, assistance to people in the private rental market, specialist services for people who are homeless or at risk of homelessness and strategies to improve affordability of home ownership.
As part of the Nation Building—Economic Stimulus Plan the Government committed $5.64 billion over three and a half years, from 2008–09 to 2011–12, to the new Social Housing Initiative. This sum includes $400 million over two years for repairs and maintenance to existing public housing dwellings.
The Social Housing Initiative represents a commitment by the Australian Government and state and territory governments to significantly increase the supply of social housing throughout Australia and provide much‑needed accommodation to many disadvantaged Australians, particularly those who are homeless or at risk of becoming homeless. With the assistance of the not‑for‑profit housing sector, the initiative is expected to deliver up to 19,200 new social housing dwellings and refurbish 60,000 existing public and community housing dwellings.

24 FaHCSIA Annual Report 2008–2009 Part1 Executive summary Chapter 3 Our operating environment
CommunitiesIn the community support and recovery area, 2008–09 has been a very significant year for FaHCSIA, which played a key role in providing assistance to Australians affected by disaster.
FaHCSIA implemented the Australian Government Disaster Recovery Payment and a range of other immediate assistance measures, including Funeral/Memorial Assistance, the Income Recovery Subsidy, and additional emergency relief in response to the Victorian bushfires and other disasters throughout the year.
The global financial crisis has led to an increased demand for services provided by the community sector, particularly from people who have not traditionally sought such help. Demand for emergency relief and financial counselling increased significantly. In April 2009, Minister Macklin announced the Financial Management Program to help Australians deal with immediate crises and build financial capability and resilience.
The National Information Centre on Retirement Investments Inc. (NICRI) is a free and confidential service that helps provide independent information on topics including saving and investing for retirement, reverse mortgage and equity release issues. In 2008–09 NICRI received additional funding under FaHCSIA’s Financial Management Program to put in place a reverse mortgages pilot project following a significant increase in enquiries from the public. NICRI provided information products and advice on reverse mortgages for people who were not able to build significant superannuation investments during their working life. This project has been funded for a further two years to provide people with quality information during this period of economic downturn.
The increased pressure on the not‑for‑profit sector as a result of the economic downturn means that it needs to build strong partnerships with government. As part of the Government’s social inclusion agenda, FaHCSIA is leading the development of a national compact with the community sector, demonstrating the Government’s commitment to a more effective relationship. In 2008 the Government consulted widely with the sector about the concept of a national compact. This consultation led to the formation of a National Compact Joint Task Force with representatives from the third sector, local government, the Australian Council of Trade Unions and Australian Government officials. The task force is providing advice on the wording of the compact, and the development of a consultation strategy and implementation plan including monitoring and reporting. This advice will inform a wider consultation leading to the development of a draft compact by December 2009.

25Chapter 3 Our operating environment Part1 Executive summary FaHCSIA Annual Report 2008–2009
Exec
utiv
e su
mm
ary
Part 1
Social justice and equity impact in the Australian communityFaHCSIA seeks to make a significant difference to the social and economic capacity of Australians through our policy advising role, various payments to individuals, and the funding and provision of services and programs, both directly and in partnership with state and territory governments.
The Australian Government’s social inclusion agenda seeks to reduce disadvantage, increase social, civil and economic participation, and to give people a greater voice in the decisions that affect them.
This agenda is closely aligned with FaHCSIA’s activities, which seek to address disadvantage, protect the vulnerable, encourage people to participate in their communities and deliver greater equity. Through these activities FaHCSIA furthers social justice and equity in the Australian community.
Many volunteers support the not‑for‑profit organisations that provide vital services to the most disadvantaged in Australia. FaHCSIA is developing a national volunteering strategy, which recognises that volunteering creates social cohesion, engenders a sense of belonging, and encourages active citizenship. The strategy will be launched in 2011 to coincide with the 10‑year anniversary of the International Year of Volunteers.
FaHCSIA’s second Reconciliation Action Plan, 2008–09, builds on the achievements of the first, reflecting the Government’s agenda and setting our path for building reconciliation at an organisational level. Key initiatives of the second plan include:
comprehensive cultural appreciation training for all staff ◗
a whole‑of‑government publication and radio program for Indigenous communities ◗
an event for Aboriginal and Islander Children’s Day ◗
the development of a new Aboriginal and Torres Strait Islander Workforce Strategy ◗
improving Indigenous people’s access to mainstream programs. ◗

26 FaHCSIA Annual Report 2008–2009 Part1 Executive summary Chapter 4 Our strategic framework
FaHCSIA’s Strategic Framework 2008–10The first part of our Strategic Framework 2008–10 consists of our purpose and key objectives (see page 2). The following elements of the framework explain the way that FaHCSIA will approach and achieve the Department’s objectives.
Our valuesAs public servants, we uphold the Australian Public Service (APS) Values, which include impartiality, accountability and responsiveness to government. As a Department, we choose to complement these with a small set of guiding principles that are meaningful to our staff:
Respect—we respect our clients, stakeholders and each other.
Collaboration—we value collaboration with each other and all external stakeholders.
Professionalism—we provide a professional and responsive service to government and we conduct ourselves with integrity.
Results—we will measure the impact of our work on our clients and use evidence to inform and improve our programs.
Innovation—we value innovation, creativity and continuous improvement.
LeadershipThe following leadership capabilities and behaviours emphasise what leaders in FaHCSIA must focus on. They are assessed in our individual performance management system.
FaHCSIA leaders at all levels will:
set the direction ◗
provide clear and consistent guidance ◗
achieve results ◗
set the example ◗
value and develop staff. ◗
4 Our strategic framework

27Chapter 4 Our strategic framework Part1 Executive summary FaHCSIA Annual Report 2008–2009
Exec
utiv
e su
mm
ary
Part 1
Our corporate and governance prioritiesThese describe the key enabling activities that FaHCSIA staff should contribute to and support in our day‑to‑day work. They are all equally important and address areas we must focus on if we are to achieve our key objectives.
The Department’s business plans also reflect these corporate and governance priorities.
Our business is based on the evidenceWe invest in research and evaluation to produce evidence that informs policies and programs.
We provide robust, evidence‑based policy advice and program implementation based on the evidence.
We are effective and inclusiveFaHCSIA is recognised as a valued and respected source of social policy advice.
Our staff work collaboratively across the Department, all levels of government and with external stakeholders, including the not‑for‑profit sector.
We value our peopleOur staff are properly recognised and rewarded.
We build a strong performance culture focused on developing staff capacity, including leadership and capability development.
We develop succession plans for key positions.
We respect and encourage diversity in our working environment.
We encourage a healthy work–life balance and provide flexible and supportive working arrangements.
We manage effectively and with integrityOur business units use allocated resources efficiently, effectively and ethically to achieve the best outcomes for government.
Our financial and information management practices meet legislative and best practice requirements.
We manage our strategic risks.
28 FaHCSIA Annual Report 2008–2009 Part1 Executive summary Chapter 4 Our strategic framework
We set the direction and plan for the futureAll areas of the Department have appropriate business plans, which are developed as part of the annual budget planning process and are actively managed and kept up to date.
Business plans provide a clear connection between activities and departmental outcomes, our key objectives and our corporate and governance priorities.
We deliver our plans by consistently applying our core business practices.
Our core business practicesThese are the critical elements of work that we must do well to achieve our purpose and key objectives. They provide the tools for all FaHCSIA staff to ensure that we approach common activities and tasks in a consistent way.
Policy development and advice—an evidence‑based process to develop future social policy needs or respond to current problems and issues.
Program design and implementation—the development of practical solutions to deliver the Government’s planned policy outcomes.
Managing stakeholder engagement—building and maintaining effective relationships with stakeholders.
Issues management—the systematic and strategic approach to anticipating, analysing and responding to important and emerging issues.
Governance and resource management—people, policies and processes that provide the framework which guides managers and staff to make the best decisions.
Whole-of-government participation and leadership—ensuring our work contributes effectively to whole of government initiatives and that FaHCSIA is a valued contributor to APS‑wide endeavours.
Achieving our objectivesIn FaHCSIA’s 2008–09 Portfolio Budget Statements, we outlined the strategic direction that we would take to deliver on the Government’s commitments and achieve our purpose. In our Strategic Framework 2008–10 we established this further by setting ourselves specific priorities in 2008–09 for achieving our key objectives.
This section describes our progress against our key objectives and priorities for these objectives in 2008–09, along with other significant work towards achieving our outcomes.
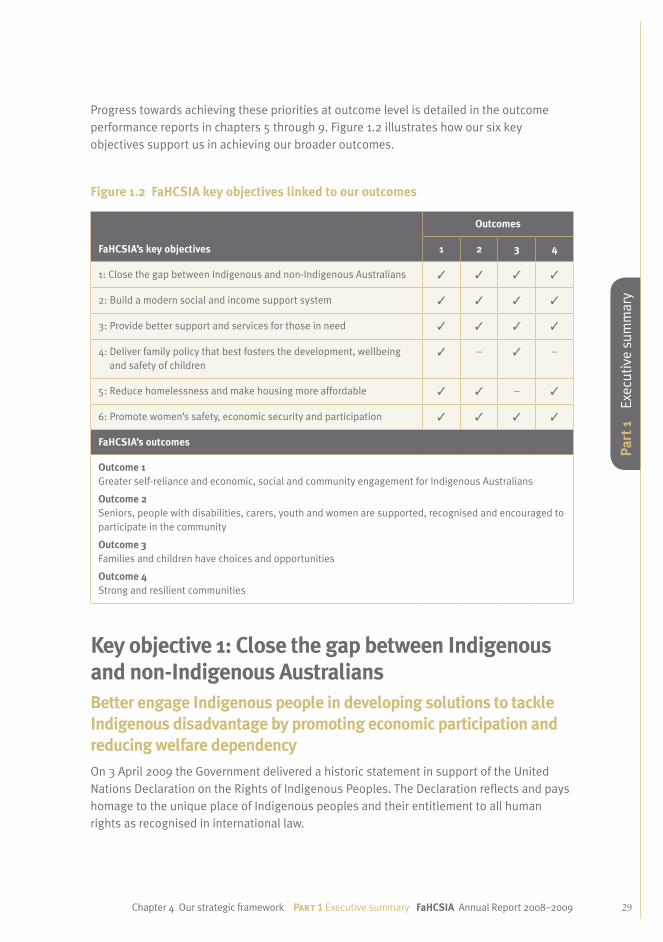
29Chapter 4 Our strategic framework Part1 Executive summary FaHCSIA Annual Report 2008–2009
Exec
utiv
e su
mm
ary
Part 1
Progress towards achieving these priorities at outcome level is detailed in the outcome performance reports in chapters 5 through 9. Figure 1.2 illustrates how our six key objectives support us in achieving our broader outcomes.
Figure 1.2 FaHCSIA key objectives linked to our outcomes
FaHCSIA’s key objectives
Outcomes
1 2 3 4
1: Close the gap between Indigenous and non‑Indigenous Australians ✓ ✓ ✓ ✓
2: Build a modern social and income support system ✓ ✓ ✓ ✓
3: Provide better support and services for those in need ✓ ✓ ✓ ✓
4: Deliver family policy that best fosters the development, wellbeing and safety of children
✓ – ✓ –
5: Reduce homelessness and make housing more affordable ✓ ✓ – ✓
6: Promote women’s safety, economic security and participation ✓ ✓ ✓ ✓
FaHCSIA’s outcomes
Outcome 1Greater self‑reliance and economic, social and community engagement for Indigenous Australians
Outcome 2Seniors, people with disabilities, carers, youth and women are supported, recognised and encouraged to participate in the community
Outcome 3Families and children have choices and opportunities
Outcome 4Strong and resilient communities
Key objective 1: Close the gap between Indigenous and non-Indigenous AustraliansBetter engage Indigenous people in developing solutions to tackle Indigenous disadvantage by promoting economic participation and reducing welfare dependencyOn 3 April 2009 the Government delivered a historic statement in support of the United Nations Declaration on the Rights of Indigenous Peoples. The Declaration reflects and pays homage to the unique place of Indigenous peoples and their entitlement to all human rights as recognised in international law.

30 FaHCSIA Annual Report 2008–2009 Part1 Executive summary Chapter 4 Our strategic framework
The Government is also progressing its commitment to establish a National Indigenous Representative Body to give Aboriginal and Torres Strait Islander people a voice in national affairs. The Department conducted an initial consultation phase on the form of the body from July to December 2008. More than 2,000 Indigenous people put forward their ideas and views through around 80 regional and local consultation meetings as well as in written submissions.
In response to feedback from communities, in December 2008 Minister Macklin agreed to an extended consultation process, led by the Aboriginal and Torres Strait Islander Social Justice Commissioner, Mr Tom Calma, and a steering committee of Indigenous people. A national workshop attended by approximately 100 Indigenous leaders was held in Adelaide between 11 and 13 March 2009. The steering committee has released a report on the outcomes of the workshop, which is available on both the Australian Human Rights Commission and FaHCSIA websites.
In December 2008, the Australian Government announced reforms to the CDEP program and the Indigenous Employment Program. From 1 July 2009 the reformed CDEP program will operate only in communities where there are limited economic opportunities. The reformed Indigenous Employment Program will focus on support to meet the specific needs of employers and Indigenous jobseekers. These reforms are a key element in making progress on COAG’s aim of halving the employment gap between Indigenous and non‑Indigenous Australians within a decade.
As part of the CDEP reforms, from 2009–10 the Community Support Service will operate in a range of urban and regional locations to assist Indigenous community members and their families by providing links to a range of mainstream and Indigenous services. The new service builds on the successful elements of the former CDEP program.
The Department has also been active in promoting engagement between Indigenous Australians and the resources industry. This includes the development of a renewed memorandum of understanding with the Minerals Council of Australia, which will provide access to employment and business development opportunities to Indigenous people and communities in mining regions.
Contribute to whole-of-government implementation of a comprehensive plan to close the gap between Indigenous and non-Indigenous Australians and make communities safe for children and vulnerable peopleTo close the gap, the Government has set ambitious targets through COAG in the areas of life expectancy, child mortality, early childhood education, reading, writing and numeracy, Year 12 attainment, and employment. Our activities under the Closing the Gap agenda and the COAG reforms have been FaHCSIA’s key focus for Indigenous Australians during the year.

31Chapter 4 Our strategic framework Part1 Executive summary FaHCSIA Annual Report 2008–2009
Exec
utiv
e su
mm
ary
Part 1
The Department played a key role in developing the National Indigenous Reform Agreement announced by COAG at its meeting on 29 November 2008. The agreement incorporates $4.6 billion in combined additional funding from the Australian Government and the states and territories to improve housing in remote areas; health; early childhood development; remote services; and employment. The National Indigenous Reform Agreement also incorporates Indigenous‑specific outcomes that were agreed by COAG in universal agreements and partnerships covering health care, schooling, housing and homelessness, disability, and skills and workforce development.
The National Indigenous Reform Agreement also incorporates the National Partnership Agreement for Remote Indigenous Service Delivery. This agreement, between the Commonwealth and the Northern Territory, New South Wales, Western Australia, South Australia and Queensland Governments, aims to significantly improve the way governments work together and with local people in priority remote Indigenous communities.
The Commonwealth’s accountability in meeting its commitments under this national partnership has been strengthened by the appointment of a Coordinator‑General for Remote Indigenous Services established within the portfolio and reporting to the Minister for Families, Housing, Community Services and Indigenous Affairs. Parliament passed the legislation establishing the new office in June 2009. The Coordinator‑General has a mandate to work across agencies to cut through bureaucratic blockages and red tape, ensuring that new COAG investments are implemented in the targeted communities in line with commitments. The Coordinator‑General will also monitor Commonwealth agencies to ensure that services are being developed and delivered consistently with the methodology for services delivery in the priority communities as agreed by COAG.
Through COAG, the Australian Government has embarked on a reform program with the states and territories to build, repair and upgrade houses in remote Indigenous communities through the new National Partnership Agreement on Remote Indigenous Housing. This national partnership, with the unprecedented level of funding of $5.5 billion, provides a 10‑year strategy to reduce overcrowding, homelessness and poor housing conditions, along with providing increased training and employment opportunities for remote Indigenous Australians.
Oversee an independent and transparent review of the effectiveness and future directions of the Northern Territory Emergency ResponseIn 2008, the Government commissioned an independent review to assess the overall progress of the Northern Territory Emergency Response (NTER), and to consider any required changes. The NTER Review Board provided its report to the Government on 13 October 2008. The Government provided an interim response 10 days later, accepting the three overarching recommendations:
that the Australian and Northern Territory Governments recognise as a matter of urgent ◗
national significance the continuing need to address the unacceptably high levels of

32 FaHCSIA Annual Report 2008–2009 Part1 Executive summary Chapter 4 Our strategic framework
Cas
e st
udy
Fixing Houses for Better Health at Nyirripi, Northern TerritoryFixing Houses for Better Health is a targeted program of small‑scale repairs and maintenance conducted in Indigenous housing in rural and remote Australia. Local community members are hired and trained to fix health hardware items such as taps, toilets, drains, showers, hot water systems and electrical fittings as they survey houses. Urgent items that cannot be fixed immediately are repaired or replaced within a day or two by tradespeople and less urgent items are repaired over the next two to six months.
Projects under the program provide an opportunity for local Indigenous people to gain new skills and develop an understanding of the importance of maintaining healthy housing.
Projects have now been conducted in more than 2,000 houses, with Indigenous people making up 78 per cent of staff. At a recent project in Nyirripi in the Northern Territory, 10 community members were employed to work in 48 community houses. These workers were involved in the survey process and also performed hands‑on carpentry work in the houses.
The workers commented that: ‘We haven’t done work like this before and it is a good opportunity for us to do new things and learn about housing’ and ‘Some of us want to keep going fixing and stuff’.

33Chapter 4 Our strategic framework Part1 Executive summary FaHCSIA Annual Report 2008–2009
Exec
utiv
e su
mm
ary
Part 1
disadvantage and social dislocation experienced by remote communities and town camps in the Northern Territory
that governments reset their relationship with Indigenous people based on genuine ◗
consultation, engagement and partnership
that government actions respect Australian human rights obligations and conform with ◗
the Racial Discrimination Act 1975.
In the 2009–10 Budget, the Government committed $807.4 million to continue efforts to close the gap in the Northern Territory, focusing in particular on the safety and wellbeing of women and children, including funding to build five new permanent police stations.
A full response to the NTER Review Board report, accepting the majority of the remaining recommendations, was made jointly with the Northern Territory Government on 21 May 2009. At the same time, a discussion paper on the future of the NTER was released to aid consultation with community members about the future of NTER measures. The Department has played an active part in facilitating these consultations.
Key objective 2: Build a modern social and income support systemContribute to the review of the Australian tax systemThe inquiry into Australia’s Future Tax System was announced by the Government on 13 May 2008 and is being led by a Review Panel chaired by the Secretary of the Treasury, Dr Ken Henry, AC. The Review Panel also includes FaHCSIA’s Secretary, Dr Jeff Harmer.
The Review Panel is examining the current tax system and will make recommendations to the Government to position Australia to deal with the demographic, social, economic and environmental challenges of the 21st century. The review encompasses Australian Government and state taxes and interactions with the transfer system. The review is being conducted in several stages, with the Review Panel to deliver its final report to the Treasurer in December 2009.
FaHCSIA is supporting Dr Harmer in his role as a member of the Review Panel by providing policy analysis and advice, research and modelling on the social support system and the interaction of income support payments with the tax system.
Undertake a review of pensionsIn February 2009, Dr Harmer delivered the Pension Review report to Government. The Pension Review investigated measures to strengthen the financial security of seniors, carers and people with disability, by considering the appropriate levels of income support and allowances, the frequency of payments, and the structure and payment of concessions or other entitlements.

34 FaHCSIA Annual Report 2008–2009 Part1 Executive summary Chapter 4 Our strategic framework
The Government’s $14.2 billion Secure and Sustainable Pension Reform package announced in the 2009–10 Budget will provide greater financial security to Australia’s 3.3 million age, carer, disability, war widow and widower, and service pensioners. These initiatives include increased assistance targeted to singles, but with couples also benefiting; a new, simplified and flexible fortnightly Pension Supplement for both single and couple pensioners; changes to the income test; and a more generous treatment of earned income through the Work Bonus for pensioners over Age Pension age.
The Pension Review recommended that the qualifying age of the Age Pension should be progressively increased to 67 years of age. This change responds to improvements in life expectancy and was announced in the 2009–10 Budget. It will be phased in from 2017.
Ensure the family payment system is properly targeted and encourages workforce participationDuring 2008–09 FaHCSIA implemented measures aimed at improving the targeting of Family Tax Benefit and the Baby Bonus. Further reforms to family payments to make them more sustainable in the long term were announced as part of the 2009–10 Budget. These measures made changes to the indexation of some payment rates and the higher income thresholds.
The introduction of a national Paid Parental Leave scheme announced as part of the 2009–10 Budget will provide greater financial support to families and encourage women to maintain their connection with the workforce and their careers.
Improve the effectiveness of the programs we fund and better target them to those in needFaHCSIA has been reforming its grant‑related administrative practices to achieve a balance between the requirements placed on service providers and ensuring funds are used effectively to support those most in need.
The Common Business Model for Grants Management adopted by FaHCSIA in April 2009 focuses on achieving improvements in program impact; program efficiency and accountability; service provider experience; and understanding of accountabilities.
A new suite of streamlined funding agreements has been developed under the model to achieve significant red tape reductions for a large number of our service providers. This includes the development of a single set of standard plain English terms and conditions to apply across all programs.

35Chapter 4 Our strategic framework Part1 Executive summary FaHCSIA Annual Report 2008–2009
Exec
utiv
e su
mm
ary
Part 1
Key objective 3: Provide better support and services for those in needDeliver financial support to seniors, people with disability and carers, to help with the cost of living pressuresThe global economic downturn has had a significant impact on many pensioners who rely on private income and assets. Against this backdrop, the deeming rates for the pension income test were reduced in November 2008, January 2009 and March 2009 to reflect the lower returns available to pensioners from financial investments. More frequent revaluations of pensioner financial investments occurred, so that pension payments were more quickly increased for declines in investment values. The Department will continue to monitor events in financial markets and the wider economy for their impact on self‑funded retirees and part pensioners.
During 2008–09 FaHCSIA began implementation of the Government’s Broadband for Seniors program. This program will assist seniors to remain connected to family and friends through the establishment of free internet kiosks in community centres and clubs used by seniors, where computers, internet connections and training are being provided at no cost. The implementation of the National Partnership Agreement on Reciprocal Public Transport Concessions also began in 2008–09. The Australian Government committed $50 million over four years to this agreement, which allows Seniors Card holders to access concessions when travelling interstate.
The Department undertook work in 2008–09 towards improving current assessment arrangements for Disability Support Pension (DSP).
Drivers for the work included:
issues raised by the Commonwealth Ombudsman in his report ◗ Assessment of Claims for Disability Support Pension from People with Acute or Terminal Illness of 5 March 2009
the Ombudsman’s earlier report ◗ Implementation of Job Capacity Assessments for the purposes of Welfare to Work initiatives of 17 June 2008.
Fundamental program improvements will be brought about by the more flexible approaches to DSP assessment announced in the 2009–10 Budget measure Disability Support Pension—Better and Fairer Assessments. Among other improvements, the measure will streamline DSP assessments for seriously ill people from 1 July 2010. People who are clearly eligible for DSP, for example due to a catastrophic injury, congenital disability or cancer, will be assessed more quickly. People who do not fall within this category will also receive more comprehensive assessments to fully assess their eligibility for DSP.
This measure will also address low participation rates of DSP recipients through the provision of advice about the services and assistance available to help them maintain

36 FaHCSIA Annual Report 2008–2009 Part1 Executive summary Chapter 4 Our strategic framework
employment to the 40,000 recipients who take up work each year. From 1 July 2010, 16,000 new DSP entrants will participate in a pilot to encourage their re‑engagement with the workforce. These initiatives form part of the National Mental Health and Disability Employment Strategy.
Over the year, the Department delivered approximately $12.7 million in funding through the National Disability Advocacy Program. The 2009–10 Budget also announced a nationally consistent Australian Disability Parking Scheme and a National Companion Card Scheme to allow eligible people with disability to attend sporting and cultural events without incurring the cost of a second ticket for their attendant carer. Measures making Special Disability Trusts more attractive to families and trust beneficiaries were also introduced.
The Department is delivering support and services for children with autism spectrum disorders and their families through the Helping Children with Autism package. The Australian Government has committed $190 million for the four years to June 2012 to support parents, families, carers and children from diverse cultural, linguistic and Indigenous backgrounds and those living in rural and remote areas.
The Department supports carers through the delivery of the Young Carers Respite and Information Services Program; Respite Support for Carers of Young People with a Severe or Profound Disability Program; and the MyTime Support Groups.
Carers were also supported with the lump‑sum Economic Security Strategy payment. Those who were also entitled to Carer Allowance in October 2008 received an additional $1,000 for each eligible person in their care.
The Department has implemented the new $600 Carer Supplement as part of the Secure and Sustainable Pension Reform package announced in the 2009–10 Budget. The Carer Supplement is a permanent increase in assistance paid to carers and replaces the previous one off bonuses, to ensure ongoing and certain assistance for carers. The first payments of Carer Supplement were made in June 2009. Future payments of Carer Supplement will be paid on 1 July each year, starting from 1 July 2010.
In May 2009, the House of Representatives Standing Committee on Family, Community, Housing and Youth released its report: Who Cares…?: Report on the inquiry into better support for carers. The Department is now examining the recommendations made in the report and will assist the Government to respond in the future.
Develop a National Disability StrategyOne of FaHCSIA’s key outcomes is to improve the capacity and opportunity for people with disability to participate both economically and socially. This year, the Department played a key support role in the ratification of the United Nations Convention on the Rights of Persons with Disabilities, the development of the National Disability Agreement, and the

37Chapter 4 Our strategic framework Part1 Executive summary FaHCSIA Annual Report 2008–2009
Exec
utiv
e su
mm
ary
Part 1
National Mental Health and Disability Employment Strategy. Over the year the Department has made an outstanding contribution in progressing the Government’s agenda in this area.
FaHCSIA continued its work with the National People with Disabilities and Carer Council toward the development of a National Disability Strategy. There was an overwhelming response to the nation‑wide consultations on the National Disability Strategy, with more than 2,500 people attending capital city forums and focus groups in regional and remote areas and more than 750 written submissions received. The National Disability Strategy is expected to be completed in 2010.
Negotiate a new National Disability AgreementIn 2008–09 FaHCSIA undertook a range of activities to assist people with disability, including the negotiation of the new National Disability Agreement between the Commonwealth and state and territory governments.
The National Disability Agreement, agreed at COAG in November 2008, will enhance services for people with disability and their families and carers. It reflects a strong commitment from both levels of government to provide more opportunities for people with disability to participate in and enjoy Australia’s economic and social life.
The new agreement is designed specifically to assist people with disability to live as independently as possible, by helping them to establish stable and sustainable living arrangements, increasing their choices, and improving their health and wellbeing. At the same time, the agreement focuses on supporting families and carers in their caring roles. Importantly, the agreement of the disability service system, will create an effective, efficient and equitable system with a focus on early intervention; timely, person‑centred approaches; and lifelong planning.
The agreement will underpin many of our activities that support people with disability.
Deliver support to parents of children with profound disabilityIn March 2009, Minister Macklin introduced the Social Security Legislation Amendment (Improved Support for Carers) Bill 2009 into Parliament. The provisions of this Bill will improve access to financial support for carers of children with severe disability or a severe medical condition.
The changes, which come into effect from 1 July 2009, will enable 19,000 additional carers of a child or children to qualify for Carer Payment (child) and provide more sensitive arrangements for carers of children in hospital and those with a terminal illness.

38 FaHCSIA Annual Report 2008–2009 Part1 Executive summary Chapter 4 Our strategic framework
Increase the level of social support and community-based care for people with a mental illness, their families and carersIn 2008–09 the Government progressed its National Mental Health and Disability Employment Strategy through the release of an initial discussion paper and a paper resulting from the consultations outlining the strategy direction. The strategy will address the barriers that people with disability and/or mental illness face, which make it harder for them to gain and keep work. FaHCSIA is working closely with the Department of Education, Employment and Workplace Relations to develop the strategy.
FaHCSIA’s community mental health initiatives, through the COAG National Action Plan on Mental Health, include implementing round two of the Mental Health Respite Program; round three of the Personal Helpers and Mentors Program, including three remote service delivery models; and continuing to deliver the Mental Health Community Based Program.
Key objective 4: Deliver family policy that best fosters the development, wellbeing and safety of childrenIn the 2009–10 Budget the Government announced the introduction of a Paid Parental Leave scheme, an historic reform to benefit families and children. The Department played an important role in the development of the scheme, which will provide greater financial support to families; increase workforce participation; promote early childhood development; and provide the primary carer with 18 weeks of payment, paid at the adult federal minimum wage.
In the past, Australia has been one of only two countries belonging to the Organisation for Economic Co‑operation and Development (OECD) without a comprehensive Paid Parental Leave scheme. As of January 2011 this will no longer be the case.
This is one of the many programs assisting Australia with the challenges of an ageing population. The scheme is designed to be affordable and to minimise impacts on employers, particularly small businesses.
In December 2008, the Prime Minister and Minister Macklin released the inaugural Families in Australia report. The report fulfils the Australian Government’s commitment to produce an annual report that outlines the state of Australian families.
Lead the development of a National Framework for Protecting Australia’s ChildrenIn April 2009, COAG endorsed the first National Framework for Protecting Australia’s Children 2009–2020. The development of the national framework is a significant step

39Chapter 4 Our strategic framework Part1 Executive summary FaHCSIA Annual Report 2008–2009
Exec
utiv
e su
mm
ary
Part 1
forward for Australia in providing a long‑term collaborative approach to child protection issues across all government jurisdictions and non‑government organisations.
The national framework is an ambitious, long‑term national approach to ensuring child safety and wellbeing. FaHCSIA will play an instrumental role in implementing measures and monitoring Australia’s progress in this very important area.
Under the national framework, Commonwealth, state and territory governments are working together to build a better approach to joining up service delivery to support earlier identification of children at risk of abuse and neglect and their families and intervention on behalf of the children.
Ensure family support serves the best interests of families with childrenIn February 2009, Minister Macklin established the Family Support Program. The program brings together a number of existing family, parenting and children’s services that have a common client group. The program will work with and support families and nurture children to enable them to better manage life transitions and will contribute to building stronger and more resilient communities.
In July 2008, the Child Support Scheme and parts of the family assistance package were changed to better balance the interests of both parents and be more focused on the needs and costs of children. The major change to the scheme was the introduction of a new child support formula, which includes changes to the way child support agreements work, and the way child support and family assistance work when parents share care arrangements.
Key objective 5: Reduce homelessness and make housing more affordableReducing homelessness and making housing more affordable remains a key challenge for the Government. The Department has been instrumental in delivering a number of key outcomes in this area including the release of the White Paper, The Road Home: A National Approach to Reducing Homelessness, and the implementation of two new programs to increase housing supply, the Housing Affordability Fund and the National Rental Affordability Scheme.
Housing affordability and homelessness were prominent issues impacting on the work of the Department over the year. Increasing the supply of affordable housing and addressing Australia’s significant shortage of social housing are crucial to achieving access to affordable and safe housing for all Australians. FaHCSIA has achieved a number of milestones in 2008–09 that make significant contributions to increasing access to affordable and safe housing.

40 FaHCSIA Annual Report 2008–2009 Part1 Executive summary Chapter 4 Our strategic framework
In March 2009, the National Housing Supply Council released its first State of Supply Report. The report assesses current and future demand for housing across Australia and will enable governments to better target supply to meet demand so as to improve housing affordability for all Australians.
Develop a comprehensive action plan to meet the Government’s target to reduce homelessnessFaHCSIA worked hard to implement the Government’s agenda to tackle homelessness, in partnership with other Commonwealth agencies, state and territory governments and key stakeholders. In December 2008 the White Paper on homelessness, The Road Home, was released by the Prime Minister and Minister Plibersek, outlining the strategic agenda for homelessness to 2020. A number of elements of the strategic agenda outlined in the White Paper will be implemented through the COAG National Partnership Agreement on Homelessness.
Negotiate a National Affordable Housing Agreement to achieve affordable housing for low and middle-income earnersOn 1 January 2009, COAG’s National Affordable Housing Agreement initiated a whole‑of‑government approach to tackling the problem of housing affordability and homelessness. The agreement provides $6.2 billion of housing assistance to low‑and middle‑income Australians in the first five years. Taken together, the two national partnership agreements on social and remote Indigenous housing and the Social Housing Initiative within the Nation Building—Economic Stimulus Plan are a strong response to the need to provide a greater stock of affordable and safe social housing.
Establish a Housing Affordability Fund and a National Rental Affordability SchemeFaHCSIA progressed the Government’s affordable housing agenda through the Housing Affordability Fund and the National Rental Affordability Scheme. The first round of funding has been completed for both. The scheme, which is in its second round, will help build 50,000 new affordable rental homes over four years in key areas across Australia.
Key objective 6: Promote women’s safety, economic security and participationThe Department assisted the Minister for the Status of Women, in Australia’s move to become a party to the Optional Protocol to the United Nations Convention on the Elimination of All Forms of Discrimination against Women. In June 2009, Minister Plibersek announced a review of effectiveness and efficiency of the Equal Opportunity for Women in the Workplace Agency and its underlying legislation.

41Chapter 4 Our strategic framework Part1 Executive summary FaHCSIA Annual Report 2008–2009
Exec
utiv
e su
mm
ary
Part 1
Lead the development of a national women’s agenda and a National Plan to Reduce Violence against WomenIn April 2009, the Australian Government released the report, Time for Action: The National Council’s Plan to Reduce Violence against Women, 2009–2021. The report identifies six key outcome areas and proposes strategies to help Australian women live free of violence, within respectful relationships and in safe communities. It contains 20 priority recommendations; the Government has committed to responding to 18 of these immediately. In addition, the Australian Government has referred Time for Action to COAG and will work with state and territory governments to develop a national plan for release in 2010.
Strengthen consultative arrangements with rural womenFollowing the National Rural Women’s Summit hosted by the Government in June 2008, a whole‑of‑government response to the summit’s recommendations has been published on the internet and sent to participants.
An important part of the Government’s response is the establishment of a National Rural Women’s Network. The network will operate in partnership with existing rural women’s organisations and will strengthen the capacity of rural women to participate in policy debate affecting their communities.
The establishment of the Rural Women’s Network is being undertaken within the context of the new model National Women’s Alliances (formerly secretariats), which come into effect in 2010.
A significant achievement towards our outcomesCommunity support and recoveryDuring 2008–09 FaHCSIA played an important policy role in the provision of Australian Government assistance to Australians affected by disaster events.
Over the past year Minister Macklin, in consultation with the Prime Minister, has activated the Australian Government Disaster Relief Payment as a result of both natural and non‑natural disasters: the terrorist attacks in Mumbai, India; severe flooding in north and south‑east Queensland, and the North Coast and Northern Rivers regions of New South Wales; and the Victorian bushfires. In each of these instances, FaHCSIA participated in whole‑of‑government responses.
In the case of the Victorian bushfires, FaHCSIA played a key role in supporting Minister Macklin, as the lead Minister responding to the bushfires, and the Hon. Bill Shorten, MP, who was appointed as the Parliamentary Secretary for Victorian Bushfire Reconstruction.

42 FaHCSIA Annual Report 2008–2009 Part1 Executive summary Chapter 4 Our strategic framework
Throughout the year, vulnerable individuals and families were supported to build financial capability and resilience. The range of assistance provided included income management support, emergency relief payments, financial counselling, information and education. Key target groups for assistance included people with low incomes, those affected by the global financial crisis and those accessing income management support.
FaHCSIA provided grants and assistance to community organisations to help them respond to identified community issues, build service delivery partnerships, support volunteers and build sector capacity.
As part of the social inclusion agenda, FaHCSIA is leading the development of a national compact with the community sector, demonstrating the Government’s commitment to a better relationship. A national compact will provide a framework for the sector and government to work together to ensure that collaborative, effective solutions can meet the policy challenges facing the Australian community.
Where we are heading Each year, the Department nominates a number of priorities under our key objectives, which reflect our Ministers’ higher‑level priorities and the Department’s outcomes, and which are supported by business plans across the Department.
We have developed priorities for 2009–10, which are incorporated into our key objectives and set out below.
Key objectives and supporting priority activities for 2009–10Close the gap between Indigenous and non-Indigenous AustraliansIn 2009–10 we will:
Invest in, and undertake fundamental reforms to, improving delivery and accountability ◗
of government services to Indigenous Australians, including better access for Indigenous people to mainstream services, particularly in urban and regional locations.
Redesign the Northern Territory Emergency Response to conform with the ◗ Racial Discrimination Act 1975.
Implement the Indigenous Remote Service Delivery National Partnership and actively ◗
support the new position of Coordinator‑General for Remote Indigenous Services.
Implement the Remote Indigenous Housing National Partnership Agreement and ◗
provide whole‑of‑government leadership in Indigenous housing policy development and service delivery.

43Chapter 4 Our strategic framework Part1 Executive summary FaHCSIA Annual Report 2008–2009
Exec
utiv
e su
mm
ary
Part 1
Reset the relationship with Indigenous people through engagement and partnerships ◗
including establishment of a National Indigenous Representative Body and a Healing Foundation.
Build a modern social and income support systemIn 2009–10 we will:
Implement the Government’s Secure and Sustainable Pensions Reforms to deliver ◗
a stronger and fairer pension system and provide security and sustainability into the future.
Contribute analysis and advice to the Henry Review of Australia’s Future Tax System ◗
which enhances the wellbeing of children and improves incentives and support for labour force participation.
Provide better support and services for those in needIn 2009–10 we will:
Develop the National Disability Strategy with state and territory governments and take ◗
account of input from key advisory bodies and stakeholders.
Implement the National Disability Agreement including reform priorities and improved ◗
data and performance measures.
Deliver the National Compact to work towards an improved relationship between the ◗
third sector (not‑for‑profit sector) and government and help to deliver responsive and integrated services that meet community needs.
Improve the capacity of vulnerable people and communities to participate economically ◗
and socially and to manage life transitions.
Develop a national volunteering strategy. ◗
Deliver family policy that best fosters the development, wellbeing and safety of childrenIn 2009–10 we will:
Work closely with the states and territories and the non‑government sector to actively ◗
support implementation of the National Framework for Protecting Australia’s Children.
Develop the Paid Parental Leave scheme and undertake consultations with employer and ◗
community groups in preparation for the scheme’s implementation in 2011.
Deliver financial support to contribute to the wellbeing of low‑ and middle‑income ◗
families with children.
Contribute to improvements in child development, safety and family functioning ◗
by better integrating the suite of services provided to families through the Family Support Program.

44 FaHCSIA Annual Report 2008–2009 Part1 Executive summary Chapter 4 Our strategic framework
Reduce homelessness and make housing more affordableIn 2009–10 we will:
Work with the states and territories in implementing the Nation Building – Economic ◗
Stimulus Plan.
Commence construction of 2,300 new social housing dwellings and complete repairs on ◗
up to 60,000 dwellings by 30 June 2010.
Deliver housing and rent assistance to achieve affordable housing for low‑ and ◗
middle‑income earners.
Support initiatives to meet the Government’s target to reduce homelessness. ◗
Promote women’s safety, economic security and participation In 2009–10 we will:
Deliver whole‑of‑government leadership in policy development on gender equality and ◗
support Australia’s international leadership role.
Work closely with the states and territories through COAG to develop a National Plan to ◗
Reduce Violence against Women.
Implement initiatives to improve women’s participation in leadership positions. ◗
Review Equal Opportunity for Women in the Workplace legislation and the effectiveness ◗
of the Equal Opportunity for Women Agency.
46 Chapter 5 Performance against outcomes
51 Chapter 6 Outcome 1
90 Chapter 7 Outcome 2
145 Chapter 8 Outcome 3
170 Chapter 9 Outcome 4
Performance reporting
2

46 FaHCSIA Annual Report 2008–2009 Part2 Performance reporting Chapter 5 Performance against outcomes
FaHCSIA’s ongoing commitment to performance reportingThe Department’s commitment to reporting excellence has again been recognised, with the 2007–08 FaHCSIA Annual Report receiving a Silver Award in the Australasian Reporting Awards, an improvement on the Bronze Award received the previous year. FaHCSIA continues to focus on improving its performance reporting and key performance information.
This year, FaHCSIA aims to:
provide logically structured and more accessible reporting to our stakeholders and ◗
the public
show our performance against each of our outcomes and outputs ◗
illustrate the impact of our work on the community. ◗
Changes include:
an early outline of our purpose, outcomes, objectives and structure ◗
a high‑level statement from the Secretary ◗
‘At a glance’ chapter summaries in Parts 2 and 3 ◗
structural improvement of Part 3. ◗
FaHCSIA has continued to show the direct reporting relationship between the estimated results set out in our 2008–09 Portfolio Budget Statements with the actual results achieved, for greater transparency. We have also outlined future performance reporting intentions to indicate how our performance reporting is being shaped for the next 12 months and beyond. See ‘Implementation of Operation Sunlight’, page 70.
The Department has developed new performance information for each program for use from 1 July 2009, consistent with the requirements of Operation Sunlight. A stronger emphasis will be placed on reporting against program objectives rather than simply
5 Performance against outcomes

47
Perf
orm
ance
repo
rtin
gPa
rt 2
Chapter 5 Performance against outcomes Part2 Performance reporting FaHCSIA Annual Report 2008–2009
reporting the level of activity for a program. The Department also intends to report on trends in program performance where possible, dependent on available information. This reporting structure has been set up in the 2009–10 FaHCSIA Portfolio Budget Statements and will be reported against in the 2009–10 FaHCSIA Annual Report.
Outcome and output structureFigure 2.1 shows the structure of the Department’s four outcomes and their contributing output groups for the 2008–09 reporting period.
Figure 2.1 Outcomes and outputs structure, 2008–09
Outcome 3Families and children have choices and opportunities
Services and assistance that: help children have the best possible
start in life; promote healthy family relationships; help families adapt to changing economic and social
circumstances; and assist families with the costs of children
Output Group 3.1Support for families
Output Group 3.2Child support
Outcome 4Strong and resilient
communities
Services and assistance that: help homeless people and low‑income households to gain affordable and
appropriate housing; promote community partnerships; and encourage participation in the
local community by individuals, families, business and government
Output Group 4.1Housing support
Output Group 4.2Supporting financial management
Output Group 4.3Community recovery
Output Group 4.4Community partnerships and delivery
Outcome 2Seniors, people with disabilities, carers,
youth and women are supported, recognised and
encouraged to participate in the community
Services and assistance that help people to: participate actively in
community and economic life; access a responsive and sustainable safety net; and develop their capabilities
Output Group 2.0Items applicable across Outcome 2
Output Group 2.1Support for the aged
Output Group 2.2Support for people with disability
Output Group 2.3Support for carers
Output Group 2.4Addressing youth homelessness
Output Group 2.5Support for women
Outcome 1Greater self‑reliance and
economic, social and community engagement for
Indigenous Australians
Services and assistance that promote greater self‑reliance
and engagement for Indigenous families and communities
through: shared responsibility; practical support; and innovative
whole‑of‑government policy
Output Group 1.1The whole‑of‑government
coordination of policy development and service delivery for Indigenous Australians
Output Group 1.2Services for Indigenous Australians
Output Group 1.3Registration, regulation and capacity building of Indigenous corporations

48 FaHCSIA Annual Report 2008–2009 Part2 Performance reporting Chapter 5 Performance against outcomes
Groups contributing to outcomesTable 2.1 illustrates how key business areas (groups) contribute to the Department’s outcomes.
Table 2.1 Groups contributing to FaHCSIA outcomes
PurposeImproving the lives of Australians by creating opportunities for economic and social participation by
individuals, families and communities.
Group
Outcomes
1 2 3 4
Office of Indigenous Policy Coordination Group ✓ – – –
Women and Children Policy Group ✓ ✓ ✓ ✓
Community Engagement and Development Group ✓ ✓ – ✓
Tax Transfer Taskforce – ✓ – –
Disability and Carers Group – ✓ – –
Families Group ✓ – ✓ –
Indigenous Leadership and Engagement Group ✓ – – –
Social Housing Initiative – – – ✓
Housing Group – ✓ – ✓
Social Policy ✓ ✓ – –
Indigenous Remote Service Delivery Group ✓ – – –
Office of the Registrar of Indigenous Corporations ✓ – – –
Operational support groupsThe following operational support groups contribute to the Department’s outcomes by providing support to the above policy and program areas.
Corporate Support Group
Legal and Compliance Group
Program Performance Group
Social Policy Group
Business and Financial Services Group
Information Management and Technology Group

49
Perf
orm
ance
repo
rtin
gPa
rt 2
Chapter 5 Performance against outcomes Part2 Performance reporting FaHCSIA Annual Report 2008–2009
Transition to an outcome and program structureBeginning in 2009–10, all General Government Sector entities will be reporting on a program basis. Table 2.2 shows the Department’s outcome transition from the current set of four to the revised set of seven in 2009–10. The new structure will facilitate program‑level reporting and enhance our ability to assess the achievement of outcomes.
Table 2.2 Outcome structure transition
Outcome 1: Greater self‑reliance and economic, social and community engagement for Indigenous Australians
Outcome 2: Seniors, people with disabilities, carers, youth and women are supported, recognised and encouraged to participate in the community
Output Group 1.1: Whole‑of‑government coordination of policy development and service delivery for Indigenous Australians
Output Group 1.2: Services for Indigenous Australians
Output Group 1.3: Registration, regulation and capacity building of Indigenous corporations
Output Group 2.0: Items applicable across Outcome 2
Output Group 2.1: Support for the aged
Output Group 2.2: Support for people with disability
Output Group 2.3: Support for carers
Output Group 2.4: Addressing youth homelessness
Output Group 2.5: Support for women
Ending year 2008–09
Outcome 7: Indigenous
Outcome 3: Community Capability and the Vulnerable
Outcome 4: Seniors
Outcome 5: Disability and Carers
Commencing year 2009–10
Program 7.1: Economic Development and Participation
Program 7.2: Indigenous Housing and Infrastructure
Program 7.3: Native Title and Land Rights
Program 7.4: Indigenous Capability and Development
Program 7.5: Closing the Gap in the Northern Territory
Program 3.1: Financial Management
Program 3.2: Community Investment
Program 3.3: Income Support for Vulnerable People
Program 3.4: Support for People in Special Circumstances
Program 3.5: Supplementary Payments and Support for Income Support Recipients
Program 4.1: Income Support for Seniors
Program 4.2: Allowances, Concessions and Services for Seniors
Program 5.1: Targeted Community Care
Program 5.2: Disability Support Pension
Program 5.3: Income Support for Carers
Program 5.4: Services and Support for People with Disability
Program 5.5: Support for Carers
Outcome 6: Women
Program 6.1: Gender Equality for Women

50 FaHCSIA Annual Report 2008–2009 Part2 Performance reporting Chapter 5 Performance against outcomes
Table 2.2 Outcome structure transition continued
Outcome 3: Families and children have choices and opportunities
Outcome 4: Strong and resilient communities
Output Group 3.1: Support for families
Output Group 3.2: Child support
Output Group 4.1: Housing support
Output Group 4.2: Supporting financial management
Output Group 4.3: Community recovery
Output Group 4.4: Community partnerships and delivery
Outcome 1: Families
Outcome 2: Housing
Program 1.1: Family Support
Program 1.2: Family Tax Benefit
Program 1.3: Parental Payments and Care Incentives
Program 2.1: Affordable Housing
Program 2.2: Housing Assistance and Homelessness Prevention
Ending year 2008–09 Commencing year 2009–10

51Chapter 6 Outcome 1 Part2 Performance reporting FaHCSIA Annual Report 2008–2009
Perf
orm
ance
repo
rtin
gPa
rt 2
Outcome 1 at a glanceGreater self‑reliance and economic, social and community engagement for Indigenous Australians
Services and assistance that promote greater self‑reliance and engagement for Indigenous families and communities through shared responsibility, practical support, and innovative whole‑of‑government policy.
Contribution of outputs to Outcome 1Outcome 1 has three contributing output groups:
Outcome 1Greater self‑reliance and economic, social and community engagement
for Indigenous Australians
Output Group 1.2Services for Indigenous Australians
Output Group 1.1The whole‑of‑government
coordination of policy development and
service delivery for Indigenous Australians
Output Group 1.3Registration,
regulation and capacity building
of Indigenous corporations
Outcome 16

52 FaHCSIA Annual Report 2008–2009 Part2 Performance reporting Chapter 6 Outcome 1
Key areas of focus in 2008–09Key areas of focus for the Department during 2008–09 included contributing towards the historic reform in Indigenous affairs agreed by the Council of Australian Governments (COAG) in October and November 2008; putting in place the processes and mechanisms to give effect to the Government’s commitment to a new engagement with Indigenous Australians; and assisting the Government to develop its response to the review of the Northern Territory Emergency Response (NTER).
Closing the gap in Indigenous disadvantageClosing the gap between Indigenous and non‑Indigenous Australians is one of the Government’s highest reform priorities. Over the year the Department played a significant role, including through our work in the COAG Working Group on Indigenous Reform, in supporting historically high levels of new investment by governments to tackle Indigenous disadvantage in the priority areas of early childhood development, housing in remote communities, chronic disease prevention and care, economic participation and remote service delivery.
Closing the Gap in the Northern TerritoryThe Department assisted the Government in preparing its response to the NTER Review Board’s report. This included working across the Australian Government to develop the Closing the Gap in the Northern Territory package announced in the 2009–10 Budget and developing a national partnership agreement with the Northern Territory Government. The Department also assisted the Government in producing a discussion paper on the future directions for the NTER and facilitating consultations with Indigenous people.
Resetting the relationshipThe Department is also assisting the Australian Government to fulfil its commitment to resetting the relationship with Indigenous Australians by ensuring opportunities for their greater participation and engagement in decisions that directly affect them.
The Government is resetting the relationship with Indigenous Australians through initiatives directed at overcoming disadvantage while respecting Indigenous culture and acknowledging the unique position of Indigenous peoples within Australia. Setting the tone for this new partnership approach, the Prime Minister offered the National Apology to Australia’s Indigenous Peoples on 13 February 2008. The Government has supported the United Nations Declaration on the Rights of Indigenous Peoples, and is establishing an Aboriginal and Torres Strait Islander Healing Foundation.
There has also been a renewed focus on engaging and involving Indigenous people in policy development and service delivery, such as the reforms to the Community Development Employment Projects program. Closer to the ground, the Government

53
Perf
orm
ance
repo
rtin
gPa
rt 2
Chapter 6 Outcome 1 Part2 Performance reporting FaHCSIA Annual Report 2008–2009
has adopted a range of mechanisms to improve the quality of engagement with local Indigenous people. For example, the Department has employed Indigenous Engagement Officers in the Northern Territory to work side by side with Government Business Managers.
Giving Indigenous Australians a voice in national affairsIn 2008–09, the Government supported wide consultations with Indigenous people on the form of a National Indigenous Representative Body that will be established to ensure they have a national voice in policy that impacts on them. In addition, the Department assisted the Social Justice Commissioner and an Indigenous Steering Committee in undertaking further consultation leading to a preferred model.
Foundation for healingOn the first anniversary of the Apology to Australia’s Indigenous Peoples, the Government announced the establishment of a healing foundation to stop the cycle of trauma and grief felt by Indigenous communities. FaHCSIA is providing support to the development of the Aboriginal and Torres Strait Islander Healing Foundation. The foundation will provide healing services to help those affected, with a strong focus on the unique needs of the Stolen Generations.
Governance and leadershipEffective Indigenous governance and leadership are critical to closing the gap. FaHCSIA provides support to the Registrar of Indigenous Corporations to improve the regulation of Aboriginal and Torres Strait Islander corporations. By ensuring transparency and accountability in Indigenous organisations, better corporate governance has contributed to more efficient and accessible services for Indigenous communities. This in turn has supported improved outcomes for Indigenous people and greater economic participation.
The development of strong leadership skills is also essential in overcoming Indigenous disadvantage. The Department’s Indigenous Leadership Program has recently been redesigned to assist increasing numbers of Indigenous people across Australia to reach their potential as role models within their families, communities and organisations.

54 FaHCSIA Annual Report 2008–2009 Part2 Performance reporting Chapter 6 Outcome 1
Outcome 1 performance reportThis section outlines the specific achievements that contributed towards achieving the Government’s Indigenous goals, as well as the challenges we experienced along the way. It also reports on the Department’s performance against the measures and strategies set out in our 2008–09 Portfolio Budget Statements and related Budget documents.
Achievements contributing to Outcome 1 in 2008–09Closing the gap in Indigenous disadvantage: Council of Australian Governments reformsThe Department contributes to Outcome 1 through its whole‑of‑government leadership and coordination of Indigenous affairs policy. During 2008–09, the Department made a significant contribution to the COAG Indigenous reform agenda by supporting the COAG Working Group on Indigenous Reform. The working group was established in December 2007 and is chaired by the Minister for Families, Housing, Community Services and Indigenous Affairs.
In addition, five Indigenous‑specific National Partnerships with a total investment of $4.6 billion cover Indigenous early childhood development, Indigenous economic participation, Indigenous health, remote Indigenous housing and Remote Service Delivery.
These agreements are linked to the overarching National Indigenous Reform Agreement between the Australian Government and the states and territories. Together with the other national agreements and partnerships, these will make a significant contribution to improving outcomes for Indigenous people across Australia.
Acknowledging the significant gaps in the evidence base, COAG established a National Indigenous Clearing House to collect and disseminate information. This is an important step towards building a solid evidence base that facilitates sharing of best practice approaches. Additional resources have also been committed to fill the gaps in data.
FaHCSIA contributed to development of an Integrated Strategy for Closing the Gap in Indigenous Disadvantage and worked towards an Urban and Regional Service Delivery Strategy for Indigenous Australians. As part of amendments to the National Indigenous Reform Agreement, the Working Group on Indigenous Reform worked on developing strategies and identifying areas for improvement in data collection to support measurement of progress towards the COAG targets.
National Partnership Agreement on Remote Indigenous HousingFaHCSIA will continue to work with jurisdictions to improve the living standards of Indigenous Australians through implementation of the National Partnership Agreement

55
Perf
orm
ance
repo
rtin
gPa
rt 2
Chapter 6 Outcome 1 Part2 Performance reporting FaHCSIA Annual Report 2008–2009
on Remote Indigenous Housing and provision of Commonwealth programs. Specific activities include:
conducting a municipal and essential services audit to assess the level of outstanding ◗
need and to clarify funding and service responsibility
providing support for remote Indigenous Australians through programs such as the ◗
Indigenous Mothers’ Accommodation Fund and the Indigenous Boarding Hostels Partnerships initiative
working with jurisdictions to implement land tenure requirements agreed under the ◗
National Partnership on Remote Indigenous Housing.
Northern Territory Emergency ResponseThe Northern Territory Emergency Response (NTER) was initiated following the release of the Little Children are Sacred report by the Northern Territory Government in June 2007. The objective of the Australian Government’s actions has been to create a better future for Indigenous people in the Northern Territory and to protect children and make communities safer through major investment in law and order as well as additional investment in health, education and child welfare. The NTER is a whole‑of‑government initiative and involves a range of Australian Government and Northern Territory agencies. FaHCSIA coordinates the NTER in its capacity as the lead Australian Government agency for Indigenous affairs.
In June 2008, the Government appointed a three‑person board to conduct an independent and transparent assessment of the NTER measures. FaHCSIA staff provided significant logistical and secretariat support for the Review Board during its investigations.
The Review Board provided its report to the Government in October 2008. The Government made an interim response shortly after, supporting three overarching recommendations. It provided its full response, jointly with the Northern Territory Government, on 21 May 2009 following the Federal Budget announcement to commit $807.4 million until 30 June 2012 for a range of measures commenced in June 2007. The Department’s role included coordinating the advice to government and funding proposals from across the Australian Government that formed the basis of the response, and the budget measures.
As part of its response to the Review Board’s report, the Government has committed to introduce legislation into the Parliament in late 2009 to remove the provisions in the current NTER Acts that exclude the operation of the Racial Discrimination Act 1975. The Department assisted in the development of a discussion paper, titled Future Directions for the Northern Territory Emergency Response, released in May 2009 to aid consultations between Indigenous people and departmental staff, including the network of Government Business Managers and Indigenous Engagement Officers, who have been active in facilitating consultations with Indigenous people.

56
Cas
e st
udy
FaHCSIA Annual Report 2008–2009 Part2 Performance reporting Chapter 6 Outcome 1
Northern Territory Emergency Response—ensuring access to food and other essentialsIncome management implementation and stores licensing under the Northern Territory Emergency Response (NTER) have delivered a much‑needed focus on remote community stores. Several communities are now benefiting from upgrades and improved operations of their stores.
Jilkminggan has a population of around 300 people. On 9 December 2008, the Jilkminggan community celebrated the reopening of their community store. This was the result of a collaborative effort between the local Dungalan Aboriginal Association, the Government Business Manager and FaHCSIA, and Outback Stores.
The store was refurbished and while this was under way, FaHCSIA funded a bus that operated twice a day to take community members to shop in Mataranka.
Full‑time store staff member Lorraine Doctor says, ‘I thought: the shelves are full! Lots of the good foods to make people healthy. It’s really good now—people like it because for the first time they’ve got all the good foods, all the good things.’

57
Perf
orm
ance
repo
rtin
gPa
rt 2
Chapter 6 Outcome 1 Part2 Performance reporting FaHCSIA Annual Report 2008–2009
Indigenous engagementThe Government recognises the need to improve interaction with Indigenous people so that relationships are trusting, collaborative and sustainable. The Department is developing strategies to embed this new way of working with Indigenous people rather than imposing ‘top‑down’ solutions which have been used in the past and have proven to be ineffective.
This involves developing programs and policies that provide flexible, tailored, local approaches to engagement, and encourage Aboriginal and Torres Strait Islander peoples to work as partners to achieve agreed objectives.
At a community level, the 2008–09 Community Engagement Budget measure has increased the capacity of Indigenous people in the Northern Territory to engage with government by improving access to Indigenous interpreters (such as in the Warlpiri and West Arnhem regions). Indigenous Engagement Officers are also improving local understanding of, and participation in, government activity in at least 21 Northern Territory‑prescribed communities. The 2009–10 Budget provides funding for an additional 15 Indigenous Engagement Officer positions as well as funding for a range of leadership and capacity‑building workshops for Northern Territory communities.
Aboriginal and Torres Strait Islander Healing FoundationThe strong emotional impact of the Apology felt by many Indigenous Australians indicated a continuing need to heal past trauma. On the first anniversary of the Apology, the Government announced the establishment of an Aboriginal and Torres Strait Islander Healing Foundation to help stop the cycle of trauma and grief felt by Indigenous people. The foundation will provide healing services to help those affected, with a strong focus on the unique needs of the Stolen Generations.
The foundation aims to provide practical and innovative healing services, along with further training and research to assist those affected. The Minister for Families, Housing, Community Services and Indigenous Affairs convened a Healing Foundation Development Team, which will work with Aboriginal and Torres Strait Islander people to ensure broad support for the foundation. FaHCSIA is providing secretariat support to the Development Team, which commenced a consultative program in May 2009. As part of the 2009–10 Budget, the Australian Government is providing $26.6 million over four years to carry out this vital work.
Repatriation of ancestral remainsReturning Indigenous ancestral human remains back to their own country can help the healing process for families and communities. The Department assists Indigenous communities to bring back the remains of their ancestors that have been held overseas.
Major achievements in international repatriation during 2008–09 included the first agreement with Oxford University in the United Kingdom for the return of remains to

58 FaHCSIA Annual Report 2008–2009 Part2 Performance reporting Chapter 6 Outcome 1
Indigenous communities. In addition, there was a major return to country of 76 remains from the Smithsonian Institution in Washington.
National Indigenous Representative BodyThe Government is committed to giving Aboriginal and Torres Strait Islander people a voice in their own affairs at a national level. A vital component to delivering on this commitment has been the significant progress made towards establishing a National Indigenous Representative Body.
FaHCSIA conducted an initial phase of community consultation between July and December 2008 on the possible role, responsibilities and structure of this body. Ninety consultation meetings were held and a formal submission process, attracted 106 submissions. Approximately 2,000 Aboriginal and Torres Strait Islander people were directly consulted during this phase. In addition, a community guide covering key issues about the body was developed and circulated through Indigenous print media, the Department’s Indigenous Coordination Centre network, and was mailed out to approximately 2,300 Indigenous organisations.
In December 2008, the Government commissioned a second phase of consultation led by Mr Tom Calma, the Aboriginal and Torres Strait Islander Social Justice Commissioner. Consultations commenced in 2009 and included a national workshop of 100 Aboriginal and Torres Strait Islander leaders, held in March 2009. Further consultation activities, including focus group meetings, a second public submission process and an online survey were conducted, culminating in a report to government on a preferred model for the representative body.
Indigenous leadershipThe Indigenous Leadership Program continued to help develop leadership potential in Indigenous women and men from across Australia, assisting a record 1,033 participants this year. The flexibility of the program provided access to a wider audience in line with the Government’s goal of targeting remote communities. The program also engaged other sectors to take action in closing the gap by entering into partnerships with communities, sporting organisations and government organisations.
Implementing reform of the Community Development Employment Projects programOn 19 December 2008, the Government announced significant reforms to the Community Development Employment Projects (CDEP) program. From 1 July 2009, the program ceased in non‑remote locations with established economies and will continue on a reformed basis in remote locations with emerging and limited economies. The reformed program has a greater focus on providing work‑readiness services and community development

59
Cas
e st
udy
Chapter 6 Outcome 1 Part2 Performance reporting FaHCSIA Annual Report 2008–2009
Perf
orm
ance
repo
rtin
gPa
rt 2
Indigenous Leadership Program—women’s leadershipThe Indigenous Leadership Program provides residential workshops to develop the individual leadership skills and capacity of Indigenous Australians. The program encourages attendees to apply their learnings from the workshops to develop and carry out leadership activities in their communities.
Cassandra Grant from Silkstone, Queensland and Ivy Hill from Goodna, Queensland attended the Women’s Leadership Program, and upon returning to their communities, held a workshop that gave young Aboriginal and Torres Strait Islander women the opportunity to support each other in personal skills development and to foster new friendships.
The workshop helped to build the self‑esteem and confidence of participants by offering fun and culturally‑appropriate activities that were sensitive to their needs. It gave participants an awareness of health support services and networks. The workshop strengthened individuals’ capabilities by providing activities that encouraged participants to practice vision and goal‑setting and giving information about potential education and employment opportunities.
Photo above: Cassandra Grant (left) and Ivy Hill (right)

60 FaHCSIA Annual Report 2008–2009 Part2 Performance reporting Chapter 6 Outcome 1
opportunities that assist Indigenous people to access long‑term sustainable jobs in mainstream labour markets.
The Department offered assistance to providers of the former program affected by the reforms to make the transition to other opportunities.
The Department and providers worked with affected CDEP participants to ensure they were informed of changes and, as appropriate, transitioned to jobs, training and development opportunities and employment services provided by Job Services Australia.
As part of the National Partnership Agreement on Indigenous Economic Participation, governments agreed to create up to 2,000 sustainable jobs in government service delivery previously supported by CDEP activities. To support the transition, during the second half of 2008–09 the Department carried out a survey of CDEP activities supporting government services.
Strengthening corporate governanceThe Department has been instrumental in implementing the Corporations (Aboriginal and Torres Strait Islander) Act 2006, which took effect on 1 July 2007. The Act, administered by the Registrar of Indigenous Corporations, introduces the most significant improvements in many years for the registration and regulation of Aboriginal and Torres Strait Islander corporations, while still reflecting cultural needs. Aboriginal and Torres Strait Islander corporations had until 30 June 2009 to transition their rule books to the new Act. By 30 June 2009, the Registrar of Indigenous Corporations had helped transition 99.6 per cent of Aboriginal and Torres Strait Islander corporations.
The Act also captures more relevant information from corporations which forms part of the public register maintained by the Registrar. Reporting compliance has increased from 52 per cent to 72 per cent in the last two years, with most achieved in 2009. Increased compliance has substantially improved the accuracy and reliability of the public register. For the first time the Registrar out‑posted staff around the country to provide face‑to‑face assistance to help corporations update their records. This was the key to increased compliance.
In 2009, the Registrar developed a new corporate governance training program, Building Strong Stores, in partnership with the Northern Territory Government and the Community Stores Unit of FaHCSIA. The program was developed to improve the governance capacity of FaHCSIA‑licensed stores in the Northern Territory. Indigenous leaders from stores in and around Alice Springs, Tennant Creek, Katherine and Darwin attended the workshops.
The Registrar also conducted 82 formal examinations of Indigenous corporations to assess their governance and financial position and offer support in resolving problematic situations.

61
Cas
e st
udy
Chapter 6 Outcome 1 Part2 Performance reporting FaHCSIA Annual Report 2008–2009
Perf
orm
ance
repo
rtin
gPa
rt 2
Building Stronger Communities on APY LandsAcross the Anangu Pitjantjatjara Yankunytjatjara (APY) Lands, community councils recognised that reform was needed in order to tackle a range of community governance issues. FaHCSIA is providing support for the implementation of a comprehensive reform strategy through the Office of the Registrar of Indigenous Corporations.
To develop and deliver the strategy, Executive Coordinator for APY Lands, Adrienne Gillam, initiated discussions with the Registrar, the South Australian Government, APY Executive and community councils. With a family representative model as its basis, the resulting project focuses on community‑designed structures reflective of cultural identity, social cohesion and Anangu decision making. Initial work on the project began at Indulkana, Mimili and Pukatja in November 2008.
Though in its early stages, the project has achieved significant outcomes. The Indulkana community has been so successful at representing the entire community that the visiting magistrate does not expect to return for the foreseeable future given the improved governance and law and order now evident there.
A new Mimili Council has been formed using the same family representative model. Mimili is enjoying improved functionality of its store, municipal services, rural transaction centre and arts facilities, and is working under its new code of conduct.
The community of Pukatja is also participating in the project. It has identified its representative family groups and is proceeding to elections in November 2009.
These and other achievements under the community governance reform strategy will play a central role in supporting the implementation of the Remote Service Delivery National Partnership Agreement on the APY Lands.

62
Cas
e st
udy
FaHCSIA Annual Report 2008–2009 Part2 Performance reporting Chapter 6 Outcome 1
Building Strong StoresIn 2009, the Office of the Registrar of Indigenous Corporations, in partnership with the Northern Territory Government and the Community Stores Unit of FaHCSIA, developed a new corporate training program—Building Strong Stores. The training program was developed to improve the governance capacity of FaHCSIA‑licensed stores in the Northern Territory.
The program addresses various aspects of running a community store, such as business strategies, the roles and responsibilities of store directors and managers, financial management, decision making and licensing requirements. The objectives of the program are to help participants understand the principles of good corporate governance and key aspects of running a successful community store.
The training material caters for a variety of audiences using plain English, diagrams, visual aids and participatory learning methods. The training materials and exercises within the program accommodate widely varying literacy levels. Trainers encourage participants to draw on their own experiences to stimulate group participation and learning.
Four Building Strong Stores programs were delivered in Alice Springs, Tennant Creek, Katherine and Darwin in 2008–09 and 74 Indigenous leaders from the stores attended the workshops. The Office of the Registrar of Indigenous Corporations will continue to deliver training in 2009–10 and will expand the program’s reach beyond the Northern Territory.
Photo above: Carmel Batson and Marie Brennan with Certificate of Completion of the Building Strong Stores program.

63
Perf
orm
ance
repo
rtin
gPa
rt 2
Chapter 6 Outcome 1 Part2 Performance reporting FaHCSIA Annual Report 2008–2009
Challenges in 2008–09This section describes some of the challenges the Department met when delivering Outcome 1 initiatives and how we worked to overcome them.
Indigenous housingIn November 2008 COAG endorsed a National Partnership on Remote Indigenous Housing, providing significant funding to the states and the Northern Territory to build and upgrade housing for Indigenous people in remote Australia over the coming decade. In the Northern Territory the National Partnership subsumed pre‑existing arrangements under a memorandum of understanding signed in 2007 to deliver significant numbers of new and refurbished housing in Aboriginal communities and town camps in the Northern Territory.
While joint governance arrangements have been established in each jurisdiction to oversee the housing rollout, the key challenges are to ensure that at the jurisdictional level sufficient resources and focus are employed to meet agreed targets and timelines and that the Australian Government has sufficient information to ensure that delivery is on track to meet these targets.
Northern Territory Emergency Response Safe PlacesThe opening of safe places under the Family Support Package—Safe Places was delayed due to a range of factors, including contractual difficulties, the air quality experienced within containers, local weather conditions and cultural activities taking place. The Department worked collaboratively with the Northern Territory Government and Indigenous communities to address these issues. Nineteen out of 22 Safe Places were opened in 2008–09, comprising eight Men’s Cooling Off Places and 11 Women’s Safe Houses.
National Indigenous Representative BodyThe establishment of a new National Indigenous Representative Body in a relatively short timeframe has presented a number of challenges. Effective consultation is important within and across Indigenous communities, and with Indigenous people living in urban, rural and regional areas.
The logistics of arranging workshops across remote, regional and metropolitan regions were complex. Issues associated with geographic isolation, language and cultural sensitivities were also challenging. Ensuring accurate recording and collation of discussions and views of Aboriginal and Torres Strait Islander people was essential, as was the need to provide clarity about issues in the final reporting of those consultations.
The Department worked hard to ensure all of these factors were taken into account, with the learnings and insights gained from the first consultation phase informing the second phase.
64 FaHCSIA Annual Report 2008–2009 Part2 Performance reporting Chapter 6 Outcome 1
The short timeframes also provided challenges for Indigenous people. Communities asked for more time to explore the range of issues. As a result the Minister extended the consultation process and asked the Aboriginal and Torres Strait Islander Social Justice Commissioner, Mr Tom Calma, to take a lead role and to establish an independent steering committee to assist him. This ensured everyone could have an opportunity to consider the options and provide their views.
Registrar of Indigenous CorporationsA priority for the Registrar of Indigenous Corporations in 2009 was to increase reporting compliance of Aboriginal and Torres Strait Islander corporations to best practice levels of 90 per cent. This presented a significant challenge as new reporting requirements were introduced under the Corporations (Aboriginal and Torres Strait Islander) Act 2006. To help achieve compliance out‑posted staff visited identified areas to help corporations complete their reports. As a result compliance was raised from 55 per cent in 2007–08 to 72 per cent in 2008–09. The Registrar will be working to achieve 90 per cent reporting compliance in 2009–10.
The Registrar’s compliance work also identified a large number of corporations that were no longer operating or no longer required by their members. They will be deregistered in 2009–10.
Staff accommodationProviding accommodation for Department staff in very remote communities continued to be a challenge in 2008–09. This year demountable accommodation was placed in 23 communities. Staff reports of fumes within demountables were confirmed. The Department tested all demountables and initiated remedial measures to make them safe for staff. At 30 June 2009, staff had been allowed to reoccupy 18 demountables.
2008–09 Budget measuresClosing the Gap—closing the evidence gapIn April 2007, the Council of Australian Governments agreed to build the evidence base for closing the gap on Indigenous disadvantage through two new measures:
the extension of the 2008 National Aboriginal and Torres Strait Islander Social Survey ◗
(NATSISS) to address priority data gaps
the establishment of a national clearing house on best practice and success factors for ◗
closing the gap on Indigenous disadvantage.
The Australian Government committed $1.7 million to these projects in the 2008–09 Budget, which is being matched by the states and territories. In the 2009–10 Budget the Government committed a further $1.5 million under the Closing the Gap—Clearing House

65
Perf
orm
ance
repo
rtin
gPa
rt 2
Chapter 6 Outcome 1 Part2 Performance reporting FaHCSIA Annual Report 2008–2009
measure. The clearing house will provide public online access to a repository of rigorously assessed and catalogued research, summaries and issues papers. This will provide policy makers and program managers with an evidence base for achieving the Closing the Gap targets and related Indigenous reforms.
The extension of the NATSISS is being completed by the Australian Bureau of Statistics. The NATSISS provides information about the Aboriginal and Torres Strait Islander populations of Australia aged 15 years and over and covers a wide range of social concerns. The 2008 survey has increased the average length of each household interview and includes information about children under 15 years of age and data about maternal health and social capital to allow comparison at the national level with data already available for the non‑Indigenous population. The final enumeration of the survey was completed in March 2009 and the main results are due for release in October 2009.
Closing the Gap—Indigenous Mothers’ Accommodation FundThe Australian Government committed $10 million over three years to the Indigenous Mothers’ Accommodation Fund for new and expanded accommodation facilities for Indigenous women who need to travel from their communities to access medical and related services.
The fund will provide accommodation that is appropriate to the needs of Indigenous women, locating facilities in close proximity to child and maternal health services, and ensuring that facilities can support newborn babies and, where possible, other children staying with their mothers.
The first site in Cairns will provide 24 beds and construction is expected to be completed by the end of 2010.
Closing the Gap—Northern Territory—community engagementThe 2008–09 NTER Community Engagement Budget measure committed $3.8 million to better involve Northern Territory communities in the Government’s decision‑making processes, and to build the capacity of Indigenous people through targeted investment.
Under this measure, local people are being employed as Indigenous Engagement Officers and are now providing feedback between communities and government—promoting their community’s role in defining needs; setting goals and formulating policies and plans; and working with community groups to bring about greater community input into government decision making.
This measure included funding of $0.9 million to the Northern Territory Government to fund the Northern Territory Aboriginal Interpreter Service to enable increased use of trained Indigenous interpreters in the Northern Territory.

66 FaHCSIA Annual Report 2008–2009 Part2 Performance reporting Chapter 6 Outcome 1
Closing the Gap—Northern Territory—continuation of early childhood programsThis is the continuation of four existing early childhood services providing alcohol and drug support, school readiness, literacy and numeracy, family health, family support, nutrition education, behaviour management and parenting services, as well as pregnancy and birth programs for young parents.
Closing the Gap—Northern Territory—Government Business ManagersAt 30 June 2009, there were 57 Government Business Managers across the Northern Territory servicing 73 communities, and 14 other smaller town camps near major regional centres. Government Business Managers are the local face of the NTER. They live in and work with communities, coordinating government programs and services and ensuring that local issues and concerns inform government action.
Closing the Gap—Northern Territory—promoting law and orderThis measure provides a continuation of alcohol reduction strategies and assistance to the Northern Territory police for a range of infrastructure and services in support of the Australian Federal Police deployment.
Closing the Gap—Northern Territory—accommodation for government personnel in remote communitiesThis initiative provides improved temporary accommodation facilities for Government Business Managers to facilitate their work in remote Northern Territory communities. Demountable accommodation facilities were installed in 23 communities.
Closing the Gap—Northern Territory—playgroupsThis measure provides for the continuation of five existing facilitated playgroups, and funding for an additional three playgroups for children from birth to five years and their parents and caregivers. Facilitated playgroups strengthen the parenting skills of very disadvantaged Indigenous families.
Closing the Gap—Northern Territory—income managementIn 2008–09, the Department continued to work on the implementation of income management as part of the Northern Territory Emergency Response.
Income management directs 50 per cent of government income support and family payments to agreed priority expenses such as food, rent, clothing, health care and utilities. Income management is intended to ensure that payments meant to benefit children are used for the benefit of children.

67
Cas
e st
udy
Chapter 6 Outcome 1 Part2 Performance reporting FaHCSIA Annual Report 2008–2009
Perf
orm
ance
repo
rtin
gPa
rt 2
BasicsCard—faster, easier, betterMerchants in the Northern Territory have benefited from improvements since FaHCSIA, Centrelink and the Department of Human Services jointly introduced the BasicsCard in September 2008 in an effort to establish a more user‑friendly system for customers on income management.
The BasicsCard is a pin‑protected EFTPOS card that has made it easier for customers to spend their income‑managed funds at stores for priority items.
The BasicsCard has made income management much easier for stores to manage than the old system, which required funds to be transferred to merchants on behalf of income‑managed customers, and the use of store cards which were not as secure as the BasicsCard. A wider variety of stores, including furniture and electrical stores can now take part in using the BasicsCard, eliminating the red tape previously associated with overseeing income‑managed funds.

68 FaHCSIA Annual Report 2008–2009 Part2 Performance reporting Chapter 6 Outcome 1
The BasicsCard was introduced in September 2008 to allow income‑managed customers greater flexibility in how they spend their income‑managed funds.
Closing the Gap—Northern Territory—leadership and coordinationThe Community Capability Fund provides streamlined access to flexible funding to address immediate needs identified through a multi‑level community‑based approach to improve the safety of families and children in Indigenous communities in the Northern Territory.
The fund can provide support that cannot be met by other programs for projects such as minor infrastructure enhancements or upgrades to community facilities. It can fund projects that result in immediate benefit and improvements in the living environment and health of the community. The fund can also be used for projects that encourage community participation as a training tool to complement other program activities.
Designed to adapt to diverse conditions, the Community Capability Fund was developed on the basis that there are no ‘one size fits all’ solutions for Indigenous communities in the Northern Territory.
Closing the Gap—Northern Territory—Youth Alcohol DiversionThe Youth Alcohol Diversion measure is aimed at young people aged 12–18 years who engage in, or are at risk of, alcohol and other substance abuse in the Northern Territory Emergency Response designated communities. The programs and infrastructure are designed to offer a range of safe and healthy activities as an alternative to drinking and substance abuse. In addition, the activities will encourage and support attendance at school and re‑engagement with education, transition from school to further education and/or work, and the expansion of the capacity of Indigenous youth services in the Northern Territory.
Closing the Gap—Northern Territory—further welfare and employment reformThis measure will enhance employment opportunities (including through the provision of around 30 Community Employment Brokers) and continue to provide employment services for Indigenous people who previously received Remote Area Exemptions relating to activity testing for income support.
This measure also includes funding for Community Development Employment Projects in the Northern Territory as part of the Government’s commitment to review and reform the program.
This measure also applies to Outcome 2.

69
Cas
e st
udy
Chapter 6 Outcome 1 Part2 Performance reporting FaHCSIA Annual Report 2008–2009
Perf
orm
ance
repo
rtin
gPa
rt 2
Yajilarra—to dreamOn 4 March 2009, the Minister for the Status of Women, the Hon. Tanya Plibersek, MP, launched the documentary Yajilarra at the 53rd session of the United Nations Commission on the Status of Women, held in New York.
Yajilarra, partly funded by FaHCSIA’s Office for Women, documents the efforts of a group of Indigenous women from the Fitzroy Valley in Western Australia in their fight against alcohol abuse in their community. The women of the Marninwarntikura Women’s Resource Centre successfully lobbied for the banning of full‑strength take‑away alcohol. Since the introduction of these alcohol restrictions, the Fitzroy Valley community has experienced a reduction in the incidence of alcohol‑related domestic violence, and a substantial reduction in the number of people seeking emergency health assistance due to alcohol‑related injuries.
Recognising the importance of this story of positive change, FaHCSIA funded two women from the Fitzroy Valley to attend the UN Commission on the Status of Women and share their experience at the premiere of the film. More than 200 people attended the event. Yajilarra’s powerful message of strength, resilience and community leadership resonated strongly with the international audience.
Yajilarra was later screened at the UN Permanent Forum on Indigenous Issues and at a special viewing for Members of Parliament at Parliament House. It is currently being distributed throughout Australia as an important example of women’s leadership bringing about community change.
Photo above: At the United Nations General Assembly at the 53rd session of the Commission on the Status of Women in New York, (Left-right) Minister for the Status of Women, the Hon. Tanya Plibersek, MP, Emily Carter (Marninwarntikura Women’s Resource Centre), June Oscar (Marninwarntikura Women’s Resource Centre) and Elizabeth Broderick -Sex Discrimination Commissioner.

70 FaHCSIA Annual Report 2008–2009 Part2 Performance reporting Chapter 6 Outcome 1
Closing the Gap—Northern Territory—family support packageThe Australian Government provided $9.8 million in 2008–09 for this measure to support families in the Northern Territory through:
the establishment or expansion of 22 Safe Places in 15 remote communities plus Darwin ◗
and Alice Springs
the establishment of a Mobile Child Protection Team of up to 10 workers ◗
the recruitment of Remote Aboriginal Family and Community Workers to be based in ◗
13 remote communities.
This measure also applies to Outcome 3.
2008–09 Portfolio Additional EstimatesClosing the Gap—Indigenous early childhood development—Children and Family CentresIn response to community needs, 36 integrated Children and Family Centres will provide a mix of services, including child care, early learning and parent and family support services. The operations of the centres will be underpinned by integration of their management, governance and service systems. Community engagement is integral to the measure’s success.
Removal of asbestos-containing materials in Indigenous communities in the Northern TerritoryFunding of $17.2 million has been committed to a program for removal of asbestos‑containing materials identified as being in poor or damaged condition in the 73 NTER prescribed communities.
In 2008–09, the Department established this program and worked with the Northern Territory Government to gain its commitment on aspects of the removal project and the future management of asbestos‑containing material in these communities.
The majority of removal work will take place in 2009–10.
Implementation of Operation SunlightFaHCSIA received funding at Additional Estimates to implement Operation Sunlight, the Government’s reform agenda to improve the openness and transparency of public sector budgetary and financial management, and to promote good governance practices.
FaHCSIA worked closely with the Department of Finance and Deregulation (Finance) to develop a new budgetary framework comprising outcomes, programs and program

71
Perf
orm
ance
repo
rtin
gPa
rt 2
Chapter 6 Outcome 1 Part2 Performance reporting FaHCSIA Annual Report 2008–2009
components, with reporting focused mainly at the program level and concentrating on whether each program has achieved its objective. We also redeveloped our performance framework, replacing nearly all of the 2008–09 key performance indicators, and introducing deliverables below the indicator level in accordance with Finance’s requirements. All FaHCSIA’s 2009–10 programs align with our seven new outcomes, and all program components with the programs to which they belong.
Further change is expected. While redeveloping our key performance indicators, we identified some gaps in performance information. These gaps will be addressed to improve the quality of performance management and reporting in 2010–11.
This measure also applies to Outcomes 2, 3 and 4.
Results for key performance indicatorsThis section outlines, by output group, how the Department performed against the key performance indicators set out in the 2008–09 Portfolio Budget Statements and related Budget documents. Where relevant, achievement against key performance indicators is summarised in tables that provide estimated and actual results for targets set out in the FaHCSIA 2008–09 Portfolio Budget Statements.
Contributions to Outcome 1
Output Group 1.1Whole‑of‑government coordination of policy development and service delivery for Indigenous AustraliansOutput Group 1.1 contributes to Outcome 1 by providing whole‑of‑government leadership, coordination and collaboration on policy development and service delivery for Indigenous Australians.
Key areas of the Department’s responsibility under this outcome include our contributions to the management and coordination of the COAG Working Group on Indigenous Reform and the Executive Coordination Forum for Indigenous Affairs and coordination of the Single Indigenous Budget process.

72 FaHCSIA Annual Report 2008–2009 Part2 Performance reporting Chapter 6 Outcome 1
Output Group 1.2Services for Indigenous AustraliansOutput Group 1.2 contributes to Outcome 1 by providing services to Indigenous Australians that offer practical support and promote greater self‑reliance and shared responsibility.
By partnering with government, communities, non‑government organisations and the private sector, FaHCSIA develops and implements agreements with communities that meet local needs. We provide services and assistance to help build functional and resilient Indigenous individuals, families and communities and develop Indigenous leadership. This includes providing sustainable housing, services and support to address the needs of vulnerable communities and to protect individuals and families against violence and substance abuse.
Funding is also provided for research to support and develop evidence‑based policy, the improvement of land tenure arrangements, and the repatriation of Indigenous remains.
Components of Output Group 1.2Aboriginal and Torres Strait Islander Land Account ◗
Aboriginals Benefit Account ◗
Community Development Employment Projects ◗
Australian Remote Indigenous Accommodation program ◗
Improving Policing in Very Remote Areas ◗
Indigenous Boarding Hostels Partnerships ◗
Indigenous Communities Strategic Investment ◗
Indigenous Leadership ◗
Native Title and Land Rights ◗
Northern Territory Emergency Response ◗
Payments to universities and other organisations for special studies and research ◗
Public Awareness ◗
Ranger Payment ◗
Repatriation ◗

73
Perf
orm
ance
repo
rtin
gPa
rt 2
Chapter 6 Outcome 1 Part2 Performance reporting FaHCSIA Annual Report 2008–2009
Aboriginal and Torres Strait Islander Land AccountThe Aboriginal and Torres Strait Islander Land Account is a Special Account (for the purposes of the FMA Act) established for making payments to the Indigenous Land Corporation.
The Department administers the Land Account in accordance with the Aboriginal and Torres Strait Islander Act 2005.
The Land Account is a self‑sustaining capital fund. It provides a secure and ongoing source of funds to the Indigenous Land Corporation to provide economic, environmental, social and cultural benefits for Aboriginal and Torres Strait Islander people by assisting in the acquisition and management of an Indigenous land base.
Aboriginals Benefit AccountThe Aboriginals Benefit Account is a Special Account (for the purposes of the FMA Act) established for the receipt of statutory royalty equivalent moneys generated from mining on Aboriginal land in the Northern Territory, and the distribution of these moneys.
The Department administers the account in accordance with the Aboriginal Land Rights (Northern Territory) Act 1976.
The funds are used to meet the operational costs of the Land Councils in the Northern Territory. Thirty per cent of royalty equivalent receipts are paid for the benefit of traditional Aboriginal owners of areas affected by mining. Under subsection 64(4) of the ALRA, the Minister for Families, Housing, Community Services and Indigenous Affairs can direct that amounts be paid for, or applied to or for, the benefit of Aboriginals living in the Northern Territory.
Community Development Employment ProjectsThe Community Development Employment Projects (CDEP) program provides participation opportunities for Indigenous people through activities that develop skills and improve employability of participants in order to assist them to move into employment outside the program.

74 FaHCSIA Annual Report 2008–2009 Part2 Performance reporting Chapter 6 Outcome 1
Percentage of CDEP participants that move into non-CDEP employment
Estimate 12% The variance is –2.4%.
The result is a slight variance from the target and is likely to be related to reduced employment opportunities.
Actual 9.6%
Percentage of Indigenous participants
Estimate 99% No variance.
This result is consistent with the 2007–08 result and confirms non‑Indigenous participation in this program is negligible.
Actual 99%
Australian Remote Indigenous Accommodation programThe Australian Remote Indigenous Accommodation (ARIA) program replaced the Community Housing and Infrastructure Program (CHIP) from 1 July 2008. The ARIA program provided funding for the Indigenous Housing and Infrastructure Memorandum of Understanding between the Commonwealth and the Northern Territory Government. The program also funded the extension of the Indigenous Housing and Infrastructure Agreements with the states and the Australian Capital Territory for the period 1 July 2008 to 1 December 2008. This allowed funding to jurisdictions to continue while negotiations on reforming the delivery of housing were completed.
On 29 November 2008, the Council of Australian Governments (COAG) agreed to reforms of the financial arrangements and roles and responsibilities between governments for the provision of housing across Australia.
Under the new arrangements, the National Partnership Agreement for Remote Indigenous Housing, a 10‑year strategy of reform for remote Indigenous housing, was agreed between the Commonwealth, state and Northern Territory governments with total funding of $5.5 billion over the agreement’s 10‑year period. The agreement aims to address severe overcrowding, homelessness and the severe housing shortage in remote communities. Following the implementation of appropriate land tenure arrangements, it will enable:
up to 9,000 housing outcomes (construction and upgrades) ◗
improved tenancy management ◗
an ongoing repairs and maintenance program ◗
the provision of employment‑related accommodation. ◗
The National Partnership Agreement for Remote Indigenous Housing is part of the National Affordable Housing Agreement, also agreed through COAG.

75
Perf
orm
ance
repo
rtin
gPa
rt 2
Chapter 6 Outcome 1 Part2 Performance reporting FaHCSIA Annual Report 2008–2009
Figures in the table below represent CHIP/ARIA and Aboriginal Rental Housing Program funding. Data may be incomplete due to new funding and reporting arrangements as agreed at COAG.
Number of new houses constructed
Estimate Approximately 350 The variance is +19.
Figures include house purchases and completed constructions.Actual 369
Number of houses upgraded
Estimate Approximately 1,200 The variance is +169.
Figures reflect completed upgrades.Actual 1,369
Number of repair and maintenance episodes
Estimate Approximately 2,000 The variance is +3,096.
Figures reflect completed work, noting that not all jurisdictions are able to report against this measure.
Actual 5,096
Number of beds provided by the Indigenous Mothers’ Accommodation Fund to be managed by a proven service provider
Estimate 12 No variance.
A contract has been signed with Mookai Rosie to provide 24 beds in Cairns replacing the current 12‑bed facility. Construction is to be completed by the end of 2010, which is the capital target for this project.
Actual 12 additional beds by the end of 2010
Improving Policing in Very Remote AreasImproving policing in remote communities was part of the July 2006 COAG Package on Violence and Child Abuse in Indigenous Communities. Funding was provided to state and territory governments for the construction of new police facilities in remote communities ($40 million over four years) and for two sniffer dog teams ($1.9 million over four years).
Planning or construction has begun on a number of new police facilities across Western Australia, South Australia, the Northern Territory and Queensland. Two sniffer dog teams are operational, one based in Darwin and the second based at the Substance Abuse Intelligence Desk in Alice Springs.

76 FaHCSIA Annual Report 2008–2009 Part2 Performance reporting Chapter 6 Outcome 1
Number of remote communities with police facilities under construction or completed
Estimate 13 No variance.
Actual 13
Number of sniffer dog teams operational
Estimate 2 No variance.
Actual 2
Indigenous Boarding Hostels PartnershipsThis initiative provides capital funding to build or expand accommodation for Indigenous students who need to travel from their remote home communities to access quality secondary education. Commitment from at least one partner organisation, including but not limited to public or private education providers, is required in order for a proposed facility to be considered for funding.
Number of sites identified for provision of new facilities
Estimate 1 No variance.
Actual 1
Number of sites identified for expansion of existing facilities
Estimate 1 No variance.
Actual 1
Percentage of projects meeting milestones agreed with FaHCSIA
Estimate 100% No variance.
Actual 100%
Number of beds to be managed by a proven service provider
Estimate 50 The variance is +110.
The variance reflects the 40‑bed expansion of the existing Wiltja facility in South Australia and a new 120‑bed facility in Weipa, Queensland. The Wiltja facility will be completed and ready for use for school year 2010. The Weipa hostel is expected to be completed for school year 2011.
Actual 160

77
Perf
orm
ance
repo
rtin
gPa
rt 2
Chapter 6 Outcome 1 Part2 Performance reporting FaHCSIA Annual Report 2008–2009
Indigenous Communities Strategic InvestmentIndigenous Communities Strategic Investment (ICSI) builds sustainable improvements for Indigenous people through a range of flexible funding and strategic initiatives in Indigenous communities that build on a clear commitment between the community, government and other partners.
Percentage of ICSI projects that meet the agreed objectives
Estimate 90% The variance is +8.42%.
The actual result is similar to the estimate.Actual 98.42%
Percentage of ICSI projects that incorporate a partnership with Indigenous communities
Estimate 90% The variance is +8.11%.
The actual result is similar to the estimate.Actual 98.11%
Percentage of ICSI projects that include a partnership agreement, where the recipient has delivered all agreed milestones within the ICSI guidelines
Estimate 90% The variance is –26.28%.
The variance is due to a high number of projects commencing part way through the year whose milestones have not yet been fully measured. In addition, not all projects incorporating a partnership were the subject of a formal shared responsibility agreement or regional partnership agreement.
Actual 63.72%
Indigenous LeadershipThis initiative develops the individual capacity of Indigenous Australians through leadership development. The initiative comprises two components: Indigenous leadership development and the Indigenous Women’s Program.
Indigenous leadership development uses innovative and collaborative approaches to strengthen and develop the leadership capacity of Indigenous women, men and youth.
The Indigenous Women’s Program aims to enhance Indigenous women’s leadership, representation, safety, wellbeing and economic status through the provision of specific grants.
The Government has also invested in research into effective mechanisms for developing Indigenous leadership capacity as well as community engagement and its impact on communities.

78 FaHCSIA Annual Report 2008–2009 Part2 Performance reporting Chapter 6 Outcome 1
Percentage of national course participants demonstrating increased leadership knowledge and skills by undertaking a practical leadership component
Estimate 60% The variance is +8%.
The variance reflects continual improvement in program delivery as well as an increase in the number of program participants. This comes from the level of perceived satisfaction with the program by the participant group, who have promoted the program to their broader networks.
Actual 68%
Percentage of national course participants who are satisfied that the leadership course was appropriate for their needs and background
Estimate 80% The variance is +4%.
The program continues to meet its stated satisfaction target.Actual 84%
Number of Indigenous people attending a leadership course
Estimate 800 The variance is +233.
The variance is due to a combination of changing to a registration rather than a submission process for the national program and increased requests for workshops to support Regional Partnership Agreements and targeted workshops.
Actual 1,033
Number of funding agreements with Indigenous women’s organisations and leadership auspice organisations
Estimate 80 The variance is +19.
The variance is due to large number of activities (70 of the 99) receiving grants less than $50,000.
Actual 99

79
Perf
orm
ance
repo
rtin
gPa
rt 2
Chapter 6 Outcome 1 Part2 Performance reporting FaHCSIA Annual Report 2008–2009
Native Title and Land RightsThis administered item supports Aboriginal and Torres Strait Islander people to exercise their legal rights in relation to land and sea ownership and usage under the Native Title Act 1993. The program provides access to professional services for native title clients through Native Title Representative Bodies and other native title service providers.
Number of Native Title claims concluded
Estimate No target set.
Varies from year to year and is not under FaHCSIA’s control
This measure is demand driven and not estimable.
Actual 30
Percentage of Native Title Representative Bodies’ operational plans assessed as meeting quality standards
Estimate 80% The variance is +20%.
Direct input of operational plans, with associated controls, has led to a significant improvement in quality and therefore resulted in more plans meeting quality standards.
Actual 100%
Number of Native Title claims progressed during the year
Estimate No target set. Varies from year to year and is not under FaHCSIA’s control
This measure is demand driven and not estimable.
This figure is not expected to vary significantly from year to year in the short term because determined and struck‑out claims are replaced by claims from the Native Title Representative Body priority schedule.
Actual 354

80 FaHCSIA Annual Report 2008–2009 Part2 Performance reporting Chapter 6 Outcome 1
Northern Territory Emergency ResponseThe Northern Territory Emergency Response (NTER) is a whole‑of‑government initiative aimed at closing the gap on Indigenous disadvantage in the Northern Territory. FaHCSIA is responsible for the coordination of measures across government as the lead agency for the response.
Income management and community stores
Estimate Income management is operating effectively in all communities with licensed stores
Stores report increased sales of food
Access to a range of quality food within communities increased—measured through surveys
On 30 June 2009, there were 86 licensed stores across 61 communities in the Northern Territory. Support has been, and will continue to be, provided to store operators to ensure that they are appropriately managing people’s Income Management allocations.
Customer shopping habits have changed significantly in most stores, with 68.2% of store operators reporting an increase in the amount of healthy food purchased. This includes items such as fruit and vegetables, as well as dairy foods and meat.
Many stores reported an increase in turnover (63.6%) with a consequent capacity to stock a wider range of goods, including fresh fruit and vegetables.
Actual 86 stores licensed to participate in Income Management
68.2% of store operators report increased sales of healthy foods
63.6% of store operators report increase in store turnover
Promoting law and order: More police in remote communities
Estimate Retention of additional police
The Australian Federal Police (AFP) has committed up to 66 positions on a rotational basis. The number of police deployed fluctuates due to operational arrangements. As of 30 June 2009, 63 AFP members were deployed. AFP members have been deployed commensurate with remote stations being opened. The majority of members have been deployed directly in NTER communities.
The Northern Territory Government has also deployed an additional 18 police officers into NTER communities as part of the emergency response.
Actual 63

81
Perf
orm
ance
repo
rtin
gPa
rt 2
Chapter 6 Outcome 1 Part2 Performance reporting FaHCSIA Annual Report 2008–2009
Family support package
Estimate 2 mobile child protection teams operational
Safe Houses operational in 18 communities
The variance is –1.
The original estimate was in error and should have read as one mobile child protection team since funding was only provided for one team.
The number of operational Safe Houses is the same as the estimate.
Actual 1 mobile child protection team operational
18 Safe Houses operational
Youth alcohol diversion
Estimate Increased number of continuing youth alcohol diversion activities
Forty‑four projects were funded in the northern region of the Northern Territory (approximately $2.3 million), including the continuation of the Youth Development Network in the Victoria/Daly and West Arnhem Shires (provision of 33 locally driven initiatives in 13 Indigenous communities coordinated by the Australian Red Cross).
Fourteen large‑scale diversion and infrastructure projects were funded in Central Australia in the Northern Territory (approximately $6.5 million), including school holiday and after‑school programs, sporting initiatives, music education, refurbishment of office facilities, and local employment and training initiatives for Aboriginal people.
Actual 58
Housing and land reform: Land compensation
Estimate Process for evaluating compensation applications established
The determination of rent has commenced.
Negotiations on compensation will begin after the determination and payment of rent.
Actual Ongoing
Housing and land reform: Five-year lease program
Estimate Increased number of prescribed communities with registered leases in place
The Commonwealth interest in all 64 five‑year leased communities has been noted on the Register of Administrative Interests in lieu of registration.
Leadership and coordination: NTER Taskforce (including the Operations Centre)
Estimate Timely and effective implementation of NTER measures controlled by the Operations Centre
The NTER Operations Centre continued to implement those NTER measures for which it retained responsibility from 1 July 2008 to 30 June 2009, namely the Licensing of Community Stores; the rollout and continuation of income management in prescribed communities; monitoring and reporting on the implementation of NTER measures across government; and media and communication tasks related to the NTER.
Actual Not applicable

82 FaHCSIA Annual Report 2008–2009 Part2 Performance reporting Chapter 6 Outcome 1
Government Business Managers
Estimate Stable numbers of Government Business Managers established and servicing all prescribed communities
Across the Northern Territory at 30 June 2009, there were 57 Government Business Managers servicing 73 communities and 14 other smaller town camps near major regional centres.
Actual 57
Accommodation for government personnel in remote communities
Estimate Additional temporary accommodation upgraded in at least 13 communities
The variance is +10.
Additional government staff accommodation requirements were identified and the scope of works was expanded to include 23 temporary accommodation upgrades in total.
Actual Additional temporary accommodation provided to 23 communities
Community engagement
Estimate Number of interpreting sessions delivered by trained interpreters
Appropriate training materials developed as required
Number of Indigenous Engagement Officers (IEOs) employed: 20 IEOs
Variances for ‘number of interpreting sessions’ and ‘appropriate training materials’ have not been provided as an estimate was not set in the 2008–09 Portfolio Budget Statements.
The variance is +1 IEO.
A total of 21 IEOs were employed as at 1 June 2009. The increase was due to a greater interest in the role than anticipated and an availability of funds.
Actual 9,364 interpreting sessions were delivered by trained interpreters
5 training modules were developed
21 IEOs were employed
Report on the implementation and impact to date of the NTER based on the independent one-year review of the NTER to be completed by the end of 2008
Estimate Review publicly released by the end of 2008
The report of the Review Board was released on 13 October 2008.
Actual Review released in October 2008
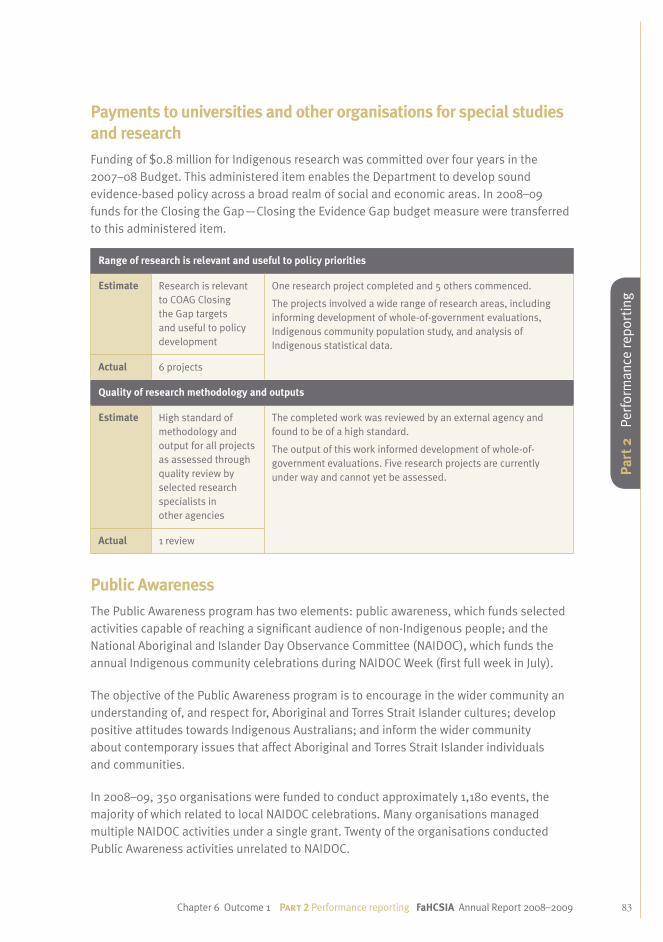
83
Perf
orm
ance
repo
rtin
gPa
rt 2
Chapter 6 Outcome 1 Part2 Performance reporting FaHCSIA Annual Report 2008–2009
Payments to universities and other organisations for special studies and researchFunding of $0.8 million for Indigenous research was committed over four years in the 2007–08 Budget. This administered item enables the Department to develop sound evidence‑based policy across a broad realm of social and economic areas. In 2008–09 funds for the Closing the Gap—Closing the Evidence Gap budget measure were transferred to this administered item.
Range of research is relevant and useful to policy priorities
Estimate Research is relevant to COAG Closing the Gap targets and useful to policy development
One research project completed and 5 others commenced.
The projects involved a wide range of research areas, including informing development of whole‑of‑government evaluations, Indigenous community population study, and analysis of Indigenous statistical data.
Actual 6 projects
Quality of research methodology and outputs
Estimate High standard of methodology and output for all projects as assessed through quality review by selected research specialists in other agencies
The completed work was reviewed by an external agency and found to be of a high standard.
The output of this work informed development of whole‑of‑government evaluations. Five research projects are currently under way and cannot yet be assessed.
Actual 1 review
Public AwarenessThe Public Awareness program has two elements: public awareness, which funds selected activities capable of reaching a significant audience of non‑Indigenous people; and the National Aboriginal and Islander Day Observance Committee (NAIDOC), which funds the annual Indigenous community celebrations during NAIDOC Week (first full week in July).
The objective of the Public Awareness program is to encourage in the wider community an understanding of, and respect for, Aboriginal and Torres Strait Islander cultures; develop positive attitudes towards Indigenous Australians; and inform the wider community about contemporary issues that affect Aboriginal and Torres Strait Islander individuals and communities.
In 2008–09, 350 organisations were funded to conduct approximately 1,180 events, the majority of which related to local NAIDOC celebrations. Many organisations managed multiple NAIDOC activities under a single grant. Twenty of the organisations conducted Public Awareness activities unrelated to NAIDOC.

84 FaHCSIA Annual Report 2008–2009 Part2 Performance reporting Chapter 6 Outcome 1
Review of Public Awareness program to be undertaken prior to 30 June 2009
Estimate Results of review The final report of the review was received on 30 June 2009 and will be considered early in 2009–10.
Actual Results of review
Ranger PaymentThe Ranger Agreement, completed under the former section 44 of the Aboriginal Land Rights (Northern Territory) Act 1976, was made between the Government and the Northern Land Council in November 1978 to provide for various payments in respect of mining on the Ranger Project Area, which is on Aboriginal land. Under this agreement, the Government agreed to pay $0.2 million annually to the Northern Land Council as a form of rental.
RepatriationThe International Repatriation Program funds activities related to the return of Indigenous ancestral remains held in overseas institutions to their communities of origin.
This includes:
consulting with the communities to which the person’s remains belong ◗
providing support for negotiations with, and provenancing work on remains originating ◗
in, overseas institutions
organising packaging and transportation of remains from overseas ◗
funding overseas travel for community representatives in special circumstances ◗
funding communities of origin to receive and organise ceremonies for their ◗
repatriated remains
consulting about and providing care for those remains from overseas that cannot be ◗
returned to country.
A total of 101 remains were returned from overseas during 2008–09. Of these, six remains were returned to country in South Australia from the United Kingdom during the year. A further 19 remains, the originating communities of which are not known or need to be confirmed, were returned from the United Kingdom and the United States to the National Museum of Australia and the Museum of Victoria for ongoing research to identify their communities of origin. Nine of the 19 remains were from private collections.
The 2008–09 returns also included a major repatriation from the Smithsonian Institution in Washington of the remains of 76 individuals. These remains have been successfully returned to two communities in Arnhem Land in the Northern Territory.
During the year, five new agreements were reached with institutions in the United Kingdom and Germany.

85
Perf
orm
ance
repo
rtin
gPa
rt 2
Chapter 6 Outcome 1 Part2 Performance reporting FaHCSIA Annual Report 2008–2009
Percentage of repatriation services delivered within quality standards
Estimate 80% The variance is +20%.
Performance is assessed through feedback from communities where remains were returned to country.
Actual 100%
Number of agreements reached with institutions to repatriate remains
Estimate 5 No variance.
In 2008–09 agreements were reached with 3 institutions and 1 private collection in the United Kingdom, and 1 institution in Germany.
Actual 5
Output Group 1.3Registration, regulation and capacity building of Indigenous corporationsOutput Group 1.3 contributes to Outcome 1 by supporting and regulating the corporations that are registered under the Corporations (Aboriginal and Torres Strait Islander) Act 2006 (CATSI Act).
Under Output Group 1.3, the Office of the Registrar of Indigenous Corporations supports the delivery of registration, regulation and related services for Indigenous people in accordance with the Act.
The Registrar works to increase the number of corporations registered under the Act by making it a more conducive registration vehicle for Indigenous corporations and peoples, and achieving a greater regulatory impact through an increased examination program. The examination program checks that larger corporations (particularly those that receive large investment through government sources) have sound governance and operational practices in place. It also resolves issues at problematic corporations, increases compliance with the CATSI Act and contributes to improved corporate governance standards and practices.
Partnerships with state and territory governments and key stakeholders, combined with more training programs, will provide increased access to corporate governance support and provide stronger service delivery.
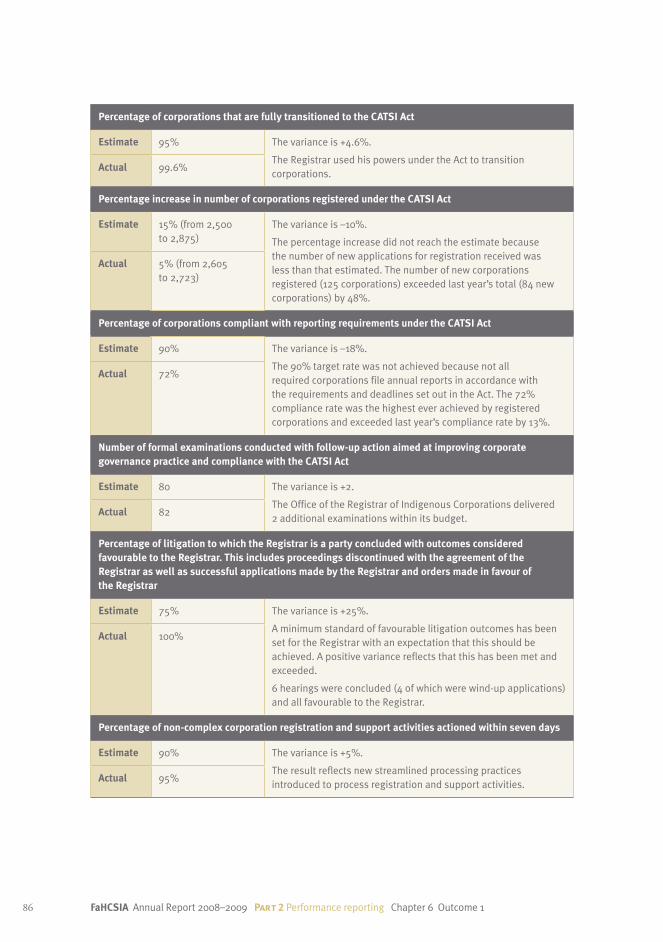
86 FaHCSIA Annual Report 2008–2009 Part2 Performance reporting Chapter 6 Outcome 1
Percentage of corporations that are fully transitioned to the CATSI Act
Estimate 95% The variance is +4.6%.
The Registrar used his powers under the Act to transition corporations.
Actual 99.6%
Percentage increase in number of corporations registered under the CATSI Act
Estimate 15% (from 2,500 to 2,875)
The variance is –10%.
The percentage increase did not reach the estimate because the number of new applications for registration received was less than that estimated. The number of new corporations registered (125 corporations) exceeded last year’s total (84 new corporations) by 48%.
Actual 5% (from 2,605 to 2,723)
Percentage of corporations compliant with reporting requirements under the CATSI Act
Estimate 90% The variance is –18%.
The 90% target rate was not achieved because not all required corporations file annual reports in accordance with the requirements and deadlines set out in the Act. The 72% compliance rate was the highest ever achieved by registered corporations and exceeded last year’s compliance rate by 13%.
Actual 72%
Number of formal examinations conducted with follow-up action aimed at improving corporate governance practice and compliance with the CATSI Act
Estimate 80 The variance is +2.
The Office of the Registrar of Indigenous Corporations delivered 2 additional examinations within its budget.
Actual 82
Percentage of litigation to which the Registrar is a party concluded with outcomes considered favourable to the Registrar. This includes proceedings discontinued with the agreement of the Registrar as well as successful applications made by the Registrar and orders made in favour of the Registrar
Estimate 75% The variance is +25%.
A minimum standard of favourable litigation outcomes has been set for the Registrar with an expectation that this should be achieved. A positive variance reflects that this has been met and exceeded.
6 hearings were concluded (4 of which were wind‑up applications) and all favourable to the Registrar.
Actual 100%
Percentage of non-complex corporation registration and support activities actioned within seven days
Estimate 90% The variance is +5%.
The result reflects new streamlined processing practices introduced to process registration and support activities.
Actual 95%

87
Perf
orm
ance
repo
rtin
gPa
rt 2
Chapter 6 Outcome 1 Part2 Performance reporting FaHCSIA Annual Report 2008–2009
Percentage of complex corporation registration and support activities actioned within 30 days
Estimate 90% The variance is +2%.
The result reflects new practices introduced to handle complex registration and support activities.
Actual 92%
Number of external training days delivered by the Registrar’s office
Estimate 200 The variance is +7.5.
Training was delivered through the (non‑accredited) introduction to corporate governance workshop and the Certificate IV in Business (Governance), the nationally recognised training package. These were delivered in key areas including Central Australia, Cairns, Torres Strait and the Pilbara.
Training was delivered to individual corporations to provide information on the Act and to assist them to transition to the new requirements.
Other training included incorporation assistance, corporate governance, post administration, and rule book design and redesign.
Actual 207.5
Number of external training days delivered by state government partners and external providers
Estimate 150 The variance is +1.
In 2008–09 the Office of the Registrar of Indigenous Corporations partnered with the Victorian, Western Australian, South Australian and Northern Territory governments to deliver on partner training days.
Training was delivered through the nationally accredited Diploma of Business (Governance) and the Certificate IV in Business (Governance) and non‑accredited training through the introduction to corporate governance workshop, the Building Strong Corporations program and a new program developed specifically for stores, Building Strong Stores.
Actual 151
Percentage of client satisfaction with support and governance training
Estimate 90% The variance is +3.1%.
This result reflects the high calibre of materials and presenters.Actual 93.1%
Table 2.3 Number of examinations initiated, administrations appointed and deregistrations completed, 2004–05 to 2008–09
Regulatory actions 2004–05 2005–06 2006–07 2007–08 2008–09
Examinations initiated 61 49 50 60 82
New administrations appointed 7 14 7 3 8
Deregistrations completed 269 180 87 32 4
Reinstatements 0 12 2 0 2

88 FaHCSIA Annual Report 2008–2009 Part2 Performance reporting Chapter 6 Outcome 1
Figure 2.2 Registered and new corporations by year, 1990–91 to 2008–09
Note: The number of registered corporations is the total number of corporations registered less the total number deregistered.
* 542 corporations registered at 30 June 2009 have been identified for deregistration action during 2009–10.
Figure 2.3 Number of corporations by income and assets reported at 30 June 2009
0
500
1,000
1,500
2,000
2,500
3,000
Number of new registrations finalised
Number of registered corporations
1991–921990–91
Num
ber o
f cor
pora
tion
s
Number of registered corporations Number of new registrations finalised
2008
–09*
2007
–08
2006
–07
2005
–06
2004
–05
2003
–04
2002
–03
2001
–02
2000
–01
1999
–00
1998
–99
1997
–98
1996
–97
1995
–96
1994
–95
1993
–94
1992
–93
1991
–92
1990
–91
0
100
200
300
400
500
600
Assets > 500K
Assets 100–500K
Assets 50–100K
Assets 25–50K
Assets < 25K
>500k100–500k< 100k
Num
ber o
f cor
pora
tion
s
Assets 50–100kAssets 25–50kAssets <25k
Assets 100–500k Assets >500k
Income

89
Perf
orm
ance
repo
rtin
gPa
rt 2
Chapter 6 Outcome 1 Part2 Performance reporting FaHCSIA Annual Report 2008–2009
Table 2.4 Number of corporations by income and assets reported at 30 June 2009
Less than 25k assets
25–50k assets
50–100k assets
100–500k assets
More than 500k
assets Total
Less than 100k income 547 25 27 40 44 683
100–500k income 10 8 24 91 51 184
More than 500k income 4 0 1 54 241 300
Total 561 33 52 185 336 1,167

90 FaHCSIA Annual Report 2008–2009 Part2 Performance reporting Chapter 7 Outcome 2
Outcome 2 at a glanceSeniors, people with disabilities, carers, youth and women are supported, recognised and encouraged to participate in the community
Services and assistance that help people to participate actively in community and economic life; access a responsible and sustainable safety net; and develop their capabilities.
Contribution of outputs to Outcome 2Outcome 2 has six contributing output groups:
Key areas of focus in 2008–09In 2008–09, FaHCSIA provided direct financial support to individuals in response to the global financial crisis and worked closely with the states and territories and the community sector to improve services and support for seniors, people with disability and their carers, youth and women.
Outcome 2Seniors, people with disabilities, carers, youth and women are supported,
recognised and encouraged to participate in the community
Output Group 2.1
Support for the aged
Output Group 2.4
Addressing youth
homelessness
Output Group 2.3
Support for carers
Output Group 2.5
Support for women
Output Group 2.0
Items applicable
across Outcome 2
Output Group 2.2
Support for people with
disability
Outcome 27

91
Perf
orm
ance
repo
rtin
gPa
rt 2
Chapter 7 Outcome 2 Part2 Performance reporting FaHCSIA Annual Report 2008–2009
Pension ReviewIn the lead‑up to the centenary of the Age Pension, the Department undertook a wide‑ranging review of the Age Pension that today is paid to approximately two million people. Over a period of nine months of consultations, research and analysis, the Pension Review explored contemporary issues facing pensioners and areas in which the pension can be reformed and strengthened to better support Australia’s seniors. The findings of the review directly contributed to the Government’s $14.2 billion Secure and Sustainable Pension Reform package announced in the 2009–10 Budget to provide greater financial security to Australia’s 3.3 million age, carer, disability, war widow and widower, and service pensioners.
The Department is also supporting the Secretary, Dr Jeff Harmer, in his role as a member of the panel for the review of Australia’s Future Tax System.
Supporting people with disability and their carersTo help people with disability and their carers, FaHCSIA negotiated a new National Disability Agreement and supported the National People with Disabilities and Carer Council to undertake extensive consultation on the development of a National Disability Strategy. The National Disability Agreement will reform and increase the services provided to people with disability, their families and their carers, while the National Disability Strategy will provide the framework for whole‑of‑life and whole‑of‑government policy.
To provide further financial support in response to the economic downturn, the Government also approved additional funding for emergency relief and financial counselling. See page 171 for further details.
In the 2008–09 Budget, the Government committed $293.6 million over five years to ensure significant improvements to assistance for families with children with disability or medical conditions. This included $273.6 million for changes to the eligibility and assessment processes for Carer Payment (child). During 2008–09, the Department undertook extensive research, development and legislative activities to ensure delivery of a new assessment process and fairer eligibility criteria for Carer Payment (child). From 1 July 2009, carers of children aged under 16 years with severe disability or severe medical conditions will be able to receive increased financial support from improved access to Carer Payment (child) through a more equitable assessment process and more streamlined administrative processes.
Financial support during the global financial crisisThe global economic downturn has had a significant adverse impact on many Australians currently supported by FaHCSIA’s services. As part of the Government’s initial response, the Department contributed to the development of a lump‑sum payment to seniors, people with disability and carers. Then, under the Government’s $42 billion Nation Building – Economic Stimulus Plan, FaHCSIA played a key role in delivering a range of payments

92 FaHCSIA Annual Report 2008–2009 Part2 Performance reporting
to support low and middle‑income households, families, single workers, students, drought‑affected farmers, people in housing stress and Indigenous Australians.
Building opportunities for womenFaHCSIA supported the National Council to Reduce Violence against Women and their Children, which undertook extensive consultation across Australia to inform the National Plan to Reduce Violence against Women and their Children. The National Council released its report, Time for Action, in March 2009. The report provides a framework for social change and outcomes for assisting women and their children to live free from violence, within respectful relationships and in safe communities. The Government announced $42 million in initiatives to support achievement of these outcomes.
FaHCSIA has taken an active role in supporting women’s participation in decision making on important policy issues. The Department worked to ensure Indigenous women’s contributions to policy by supporting their involvement in the National Aboriginal and Torres Strait Islander Women’s Gathering. We have also consulted widely with women’s organisations to ensure the full diversity of Australian women’s needs and issues will be represented in future policy development.
Outcome 2 performance reportThis section outlines the specific achievements that contributed towards achieving FaHCSIA’s goals for Outcome 2, as well as the challenges we experienced along the way. It also reports on the Department’s performance against the measures and strategies set out in our 2008–09 Portfolio Budget Statements and related Budget documents.
Achievements contributing to Outcome 2 in 2008–09Support for seniorsFaHCSIA supports senior Australians by providing income support and concessions targeted to those in need and providing incentives and information to assist them to manage their savings and investments.
Our key achievements for supporting seniors in 2008–09 are outlined below.
Pension Review
Dr Jeff Harmer submitted the report of his findings from the Pension Review on 27 February 2009 to the Minister for Families, Housing, Community Services and Indigenous Affairs, the Hon. Jenny Macklin, MP, and the Secretary to the Treasury, Dr Ken Henry. The report was the culmination of nine months of research, analysis and consultation, which explored issues facing pensioners including financial security and wellbeing, and identified priority areas for pension reform.

93
Cas
e st
udy
Chapter 7 Outcome 2 Part2 Performance reporting FaHCSIA Annual Report 2008–2009
Perf
orm
ance
repo
rtin
gPa
rt 2
Economic Security Strategy campaignsOn 14 October 2008, the Australian Government announced a $10.4 billion Economic Security Strategy (ESS) to strengthen the Australian economy in the face of the global financial crisis.
As part of this strategy, the Government delivered $8.8 billion in lump‑sum payments to families, pensioners and carers, providing them with immediate financial help.
The First Home Owners Boost was another key measure and included a $1.5 billion investment to help first home buyers to purchase a home.
FaHCSIA was tasked with developing and implementing two information campaigns to support the ESS. The ESS Payments campaign reached approximately six million people from mid‑December 2008. The aims of the campaign were to raise awareness of lump‑sum payments and provide details on eligibility and payment timetables. Strategies included radio and press advertisements, online marketing, a brochure, a letter and website content.
The First Home Owners Boost campaign was delivered through radio, newspaper and internet advertising. The campaign also featured a comprehensive public relations program in which stakeholders and intermediaries (such as financial institutions, real estate providers and the housing sector) were provided with
booklets, posters, editorial material for newsletters and online presence.
Information on both campaigns was primarily available through the FaHCSIA website, and advertised at www.australia.gov.au.
The campaigns were the first for the Department to be developed in accordance with the new Australian Government Guidelines on Campaign Advertising, which involved certification by the Secretary and review by the Auditor‑General.
The First Home Owners Boost campaign utilised a range of media including press advertisements.

94 FaHCSIA Annual Report 2008–2009 Part2 Performance reporting Chapter 7 Outcome 2
Global financial crisis
The global financial crisis significantly reduced the private income and assets of many seniors. The Centrelink Financial Information Service provided information to seniors on how they might adjust their financial arrangements in response to the impact of the global financial crisis.
The Age Pension system responded as intended to provide additional assistance to seniors where needed. Many seniors received an increased rate of the Age Pension, while others became eligible for the Age Pension for the first time.
The FaHCSIA portfolio made adjustments to the pension system to assist seniors, including those receiving a part‑rate Age Pension. These adjustments included special and regular updates of the values of shares and managed investments used in pension assessments, and reductions in the social security income test deeming rates to reflect lower returns on financial investments. The deeming rates were reduced in November 2008, January 2009 and March 2009; they were halved over this period. The Government also suspended the minimum drawdown requirements for account‑based superannuation pensions from January 2009. This relief, through the operation of the income test, resulted in some additional people receiving Age Pension payments.
The Government’s Economic Security Strategy included lump‑sum payments for seniors, carers and people with disability to provide support in the face of the global financial crisis. Around 3.7 million seniors, carers and people with disability received payments of $1,400 for singles or $2,100 for couples combined.
Concession cards
Commencing on 1 July 2008, the Government introduced a maximum portability period of 13 weeks for concession cards issued under the Social Security Act 1991. This allowed concession card holders to retain their concession cards during temporary absences from Australia of up to 13 weeks, instead of having them cancelled on departure and having to reclaim and have them reissued upon return to Australia.
The Government introduced a review and compliance regime for the Commonwealth Seniors Health Card (CSHC) that will include data matching with the Australian Taxation Office and risk profile–based reviews to ensure only customers who are eligible retain the card.
FaHCSIA implemented the national partnership agreement on reciprocal public transport concessions, which allows State Seniors Card holders to access public transport concessions when they travel interstate. The Government provided $50 million over four years to implement this measure.

95
Perf
orm
ance
repo
rtin
gPa
rt 2
Chapter 7 Outcome 2 Part2 Performance reporting FaHCSIA Annual Report 2008–2009
Supporting people with disabilityFaHCSIA provides support to people with disability and their families and carers and promotes their social inclusion by providing income support such as the Disability Support Pension, employment services, respite care and other services such as captioning information services, postal concessions for the blind, and advocacy. We also work closely with state and territory governments, which deliver specialist disability services including accommodation, community support and respite services under the new National Disability Agreement.
Our key achievements in supporting people with disability in 2008–09 are outlined below.
National Disability Agreement
At the Council of Australian Governments (COAG) November 2008 meeting to discuss the new financial framework and specific purpose payment reforms, COAG agreed on a new National Disability Agreement to replace the third Commonwealth State/Territory Disability Agreement. The National Disability Agreement commenced on 1 January 2009.
Under the new agreement, the Commonwealth will provide more than $5 billion in funding over five years to the states for specialist disability services. In 2013 the Australian Government’s contribution will exceed $1.2 billion, compared to $620 million in 2007.
The reform of the disability services system will create an effective, efficient and equitable system with a focus on early intervention; timely, person‑centred approaches; and lifelong planning.
The new agreement outlines eight reform priority areas, including better measurement of unmet need and increased access for Indigenous Australians. By helping people with disability establish stable and sustainable living arrangements, increase choices and improve health and wellbeing, the agreement will assist them to live as independently as possible.
National Disability Strategy
Working towards improving support and removing barriers for people with disability, the Government established the National People with Disabilities and Carer Council to provide advice on the development of a National Disability Strategy. The council’s work also builds on the Government’s ratification of the UN Convention on the Rights of Persons with Disabilities in July 2008. The council undertook an extensive consultation process, supported by the Department, to guide and inform their work, ensuring that the strategy reflected the needs of people with disability and their families and carers. Focusing on caring needs, education, training, accessibility, employment, income and social inclusion, the strategy will set the direction of future disability policy.

96
Cas
e st
udy
FaHCSIA Annual Report 2008–2009 Part2 Performance reporting Chapter 7 Outcome 2
Consultations on the development of the National Disability StrategyOn 17 October 2008, the Hon. Jenny Macklin, MP, Minister for Families, Housing, Community Services and Indigenous Affairs, and the Parliamentary Secretary for Disabilities and Children’s Services, the Hon. Bill Shorten, MP, launched a discussion paper on the development of the National Disability Strategy. The paper invited people to have their say by participating in a series of public consultations across Australia.
The aim of the public consultations was to identify and explore the barriers faced by people with disability, and their families, friends and carers, in their daily lives and to explore ideas about how these barriers could be broken down. There was a strong response, with more than 2,500 people attending capital city forums and focus groups in regional and remote areas and more than 750 written submissions received.
FaHCSIA organised each capital city consultation, which was chaired by Dr Rhonda Galbally AO, Chairperson of the National People with Disabilities and Carer Council. Dr Galbally said she felt privileged to attend the consultations and hear people’s stories first‑hand.
‘I would like to personally thank each and every person who took the time to write a submission or who attended consultations across the country. Their readiness to reveal personal details was both remarkable and encouraging. It was clear to me that people were willing to do so only in the hope that they would finally see change.’
Photo above: Minister for Families, Housing, Community Services and Indigenous Affairs, the Hon. Jenny Macklin, MP, and Parliamentary Secretary for Disabilities and Children’s Services, the Hon. Bill Shorten, MP, at the launch of the National Disability Strategy Consultation Report, with Dr Rhonda Galbally AO, Chairperson of the National People with Disabilities and Carer Council.

97
Perf
orm
ance
repo
rtin
gPa
rt 2
Chapter 7 Outcome 2 Part2 Performance reporting FaHCSIA Annual Report 2008–2009
Disability Support PensionThe Disability Support Pension was increased in the 2009–10 Budget under the Secure and Sustainable Pension Reform package. The Government has also improved assessment processes to ensure the eligibility rules appropriately recognise the capacity of people with disability to engage in the workforce.
Disability employment assistanceProviding job opportunities for people with disability is integral to ensuring that they are accorded the same rights as other Australians when it comes to finding employment. The Department implemented initiatives aimed at improving the viability of Australian Disability Enterprises, which included a one‑off marketing payment and additional financial assistance during the current period of reduced economic activity.
We also implemented an additional 278 supported employment places for people with disability in locations where demand was high. Providing these new employment places will enable people with disability to engage in a wide variety of work tasks under the same working conditions as those in the general workforce.
Special Disability TrustsSpecial Disability Trusts assist families wishing to make private financial provision for the future care and accommodation needs of a family member with severe disability. The slow take‑up of these trusts prompted the Senate Standing Committee on Community Affairs to inquire into the barriers preventing their use.
FaHCSIA developed the Government response to the inquiry as well as the Government response to the Senate Community Affairs Committee Report, Building trust: Supporting families through Disability Trusts, tabled by the Government on 14 May 2009.
As an important step in addressing the barriers to the uptake of Special Disability Trusts, the Government agreed to the following measures:
starting from the 2008–09 financial year, unexpended income of a Special Disability ◗
Trust will be taxed at the beneficiary’s personal income tax rates, rather than the highest marginal tax rate
from 1 July 2009 the Government will extend the capital gains tax main residence ◗
exemption to include a residence that is owned by a Special Disability Trust and used by the relevant beneficiary as their main residence
the Special Disability Trust guidelines on care and accommodation needs will be revised, ◗
within current legislative provisions, to expand the list of examples of reasonable care and accommodation needs.

98 FaHCSIA Annual Report 2008–2009 Part2 Performance reporting Chapter 7 Outcome 2
The Government has also committed to consider further those recommendations with significant legislative and budgetary implications, such as broadening the eligibility requirements to make it easier for people to establish Special Disability Trusts.
Additional disability placesThe Australian State and Territory Disability Ministers agreed in May 2008 to deliver $1.9 billion in funding for more than 24,800 additional disability places, including around 2,300 in‑home support services; 2,400 supported accommodation places; 10,100 individual support packages; and 10,000 much‑needed respite places across Australia. Implementation of the funding addressing the designated areas continued through the 2008–09 Budget year.
Funding of $51 million over three years ending in 2009–10 was transferred to state and territory governments to develop additional respite capacity for older carers. The implementation of this work is continuing through the National Disability Agreement in 2009.
Autism spectrum disordersFaHCSIA is committed to providing improved support for children with autism spectrum disorders and their families and carers.
Our key achievements for supporting children with autism spectrum disorders in 2008–09 are outlined below.
Helping Children with Autism packageTo help address the need for support and services for children with autism spectrum disorders, the Government (through FaHCSIA, the Department of Health and Ageing, and the Department of Education, Employment and Workplace Relations) is delivering the $190 million Helping Children with Autism package. This is the first national initiative to help families deal with this challenging disorder and is a major breakthrough in support for these children and their families and carers.
Since July 2008, implementing the package has involved developing a pathway for families and carers of children with autism spectrum disorders involving five sub‑strategies: an early intervention service provider panel, an autism advisor program, a national workshops program, an autism spectrum disorders website, and playgroups.
The Department consulted extensively with the autism sector and with state and territory governments about the rollout of the package to ensure better outcomes for children with autism spectrum disorders and their families. We have put in place 50 PlayConnect playgroups, 32 autism advisors, an autism addition to the Raising Children website, and Early Days workshops in each state and territory.

99
Cas
e st
udy
Chapter 7 Outcome 2 Part2 Performance reporting FaHCSIA Annual Report 2008–2009
Perf
orm
ance
repo
rtin
gPa
rt 2
Australian Disability EnterprisesAustralian Disability Enterprises are commercial businesses that provide employment opportunities for approximately 20,000 people with moderate to severe disability. There are currently 351 outlets operating across Australia. FaHCSIA provides funding to assist with their extra operating costs, such as employing support workers to assist their employees with disability.
Previously called Business Services, FaHCSIA renamed the sector Australian Disability Enterprises in November 2008, to better reflect the core values and nature of these businesses. This rebranding coincided with the release of the revised Commonwealth Procurement Guidelines, which include an exemption for purchases from an Australian Disability Enterprise, as long as value for money is obtained.
FaHCSIA also commissioned a new Australian Disability Enterprises website to enable businesses and governments to quickly and easily access information about products and services and obtain up‑to‑date contact details.
The website resource, www.australiandisabilityenterprises.com.au, was launched by the Parliamentary Secretary for Disabilities and Children’s Services, the Hon. Bill Shorten, MP, at a CEO networking breakfast held at the Melbourne Museum in April 2009. The event was attended by over 90 CEOs, Australian Disability Enterprise managers and employees, providing a fantastic opportunity for business leaders to learn about Australian Disability Enterprises first hand. Mr Ken Ryan, Qantas Regional Manager (Southern Australia), provided the keynote address, reinforcing the company’s commitment to using Australian Disability Enterprises and encouraging other businesses to do the same.
FaHCSIA continues to support Australian Disability Enterprises, promoting the message that engaging them is more than just good business.
Photo above: (left to right) Mr Glenn Hodgkin, General Manager of Ozanam Enterprises; Mr Cameron McKay, Employee of Ozanam Enterprises; the Hon. Bill Shorten, MP, Parliamentary Secretary for Disabilities and Children’s Services; and Mr Ken Ryan, Qantas Regional Manager (Southern Australia).

100 FaHCSIA Annual Report 2008–2009 Part2 Performance reporting Chapter 7 Outcome 2
Autism Specific Early Learning and Care Centres
In addition to the Helping Children with Autism package, the Government is establishing six Autism Specific Early Learning and Care Centres. These centres will provide early learning programs and specific support to children with autism spectrum disorders or autism‑like symptoms in a long day care setting. The first of the six centres commenced operation in late June 2009 and another five will commence during 2009–10.
Mental healthFaHCSIA continues to implement community mental health initiatives to assist people with mental illness and their families and carers to manage the impact of mental illness. The initiatives provide increased opportunities for recovery by helping people with mental illness overcome social isolation and increase their connections to the community with the support of personal helpers and mentors and through brokered and flexible respite services.
Our key achievements in 2008–09 for supporting people with a mental illness are outlined below.
Support services
Significant progress was made in 2008–09 in coordinating mental health policies across Australian Government portfolios and with state and territory governments. This cooperation is aimed at moving towards greater coordination and integration of state clinical providers and community support programs for people with severe and enduring mental illness.
Forty‑four mental health community‑based service providers across all states and territories continue to deliver services aimed at building on family strengths and improving resilience and family functioning, particularly for Indigenous families and those from culturally and linguistically diverse backgrounds.
The mental health and intellectual disability respite services have continued to expand, with an additional 16 new services funded to support carers. An Australian Government initiative forming part of the Council of Australian Governments’ National Action Plan on Mental Health, provides flexible respite options for carers of people with mental illness and psychiatric disability or intellectual disability.
Personal Helpers and Mentors Program
The Personal Helpers and Mentors Program provides increased opportunities for recovery for people who have a severe functional limitation resulting from a severe mental illness. To enhance this program, a further 79 program sites were implemented nationally during 2008–09 to increase social support for people with mental illness. This included support for engagement with their community, families and carers.

101
Cas
e st
udy
Chapter 7 Outcome 2 Part2 Performance reporting FaHCSIA Annual Report 2008–2009
Perf
orm
ance
repo
rtin
gPa
rt 2
Helping Children with Autism package—Autism Advisor ProgramTo help address the need for support and services for children with autism spectrum disorders, the Government is delivering its $190 million Helping Children with Autism package. One of the initiatives in this package is the Autism Advisor Program.
Since October 2008, autism advisors across Australia have been assisting families and carers of children diagnosed with an autism spectrum disorder by providing information about the most appropriate early intervention services. These advisors are the link between the clinical diagnosis and access to early intervention programs and support services. They also assist eligible families to access funding for early intervention services and grants to support families from outer regional and remote areas.
One story of a family that has benefited from the Autism Advisor Program involves a mother who came for a consultation after being given the program phone number by another mother at her son’s early education centre. Despite her son being diagnosed with ‘classic autism’ in 2006, the mother had limited knowledge of autism spectrum disorders and did not know what services were available. Her child is non‑verbal and has a number of challenging behaviours. Until that point, she had only accessed generic (that is, not autism‑specific) disability services.
This mother was amazed to hear about the services available that might be appropriate for her son. The mother identified placement at an early educational program for children with autism spectrum disorders as her preference, but the child would have to wait at least six months. Other options for intervention were explored to find a service that could provide assistance as soon as possible. Appropriate services were contacted by the advisor, who explained the intake procedure and helped the mother complete the necessary paperwork.
After the child’s needs were prioritised, the early intervention service contacted the family within two weeks to offer weekly therapy. After six weeks of therapy, the mother reported that her son had made noticeable improvement, such as verbally greeting members of his family for the first time.

102
Cas
e st
udy
FaHCSIA Annual Report 2008–2009 Part2 Performance reporting Chapter 7 Outcome 2
Personal Helpers and Mentors ProgramAnne* is an Indigenous woman who has had a severe mental illness since a young age. She lives in a rural community with limited resources and referral opportunities.
Anne has regularly been admitted to acute care hospitals to manage her illness.
Anne was on a Community Treatment Order**. Despite this, she was unable to take her medication regularly and receive fortnightly injections as she did not have enough money to pay for the medication. Anne also had difficulty getting transport to the chemist, to the local clinic to receive her injections and to larger centres for further medical treatment.
Anne was referred to the Personal Helpers and Mentors Program (PHaMs) through the mental health team at the local hospital. FaHCSIA organised for a Centrepay deduction from Anne’s pension to be paid directly to the chemist to cover the cost of her medication.
Each month, the PHaMs staff take Anne into town to collect her medication from the pharmacy, and on a fortnightly basis to the clinic to have her injections. They have also organised appointments with doctors, psychiatrists, mental health workers and other medical specialists and arranged transport with other family members as required.
Since becoming a PHaMs client, Anne’s health has greatly improved and she has not been admitted to hospital. Anne says she enjoys the social contact with the staff.
* Name and other personal details have been changed to protect privacy. ** A legal order setting out terms under which a person must accept medication and therapy implemented by a mental health facility.

103
Perf
orm
ance
repo
rtin
gPa
rt 2
Chapter 7 Outcome 2 Part2 Performance reporting FaHCSIA Annual Report 2008–2009
FaHCSIA also developed a remote service model under the program that recognises and promotes spiritual, cultural, mental health and physical health for Indigenous Australians living with mental illness in remote communities. The model is initially being implemented in Yuendumu, Northern Territory; West Kimberley/Broome, Western Australia; and Anangu Pitjantjatjara Yankunytjatjara Lands, South Australia.
Support for carersFaHCSIA provides assistance to carers that recognises and supports the important role and contribution of carers in our community. Support includes funding respite and information services for young carers; providing payments to people who provide daily care at home to a person with disability or severe medical condition, or who are frail aged; and providing income support to people whose caring responsibilities prevent them from substantial workforce participation.
Our key achievements for supporting carers in 2008–09 are outlined below.
Carer Supplement
Carers face significant financial pressure in addition to the sacrifices they make in order to care for some of the most vulnerable people in our community. In recognition of this, the Government introduced the new $600 Carer Supplement in the 2009–10 Budget as part of the Secure and Sustainable Pension Reform package. This supplement replaces ad hoc bonuses with a legislated annual supplement, providing carers with better financial security.
Carer Supplement in focusIntroduced in the 2009–10 Budget, the Carer Supplement is an annual payment of $600 to recipients of Carer Allowance for each person being cared for. It is a permanent increase in assistance paid to carers and replaces the previous one‑off bonuses, to ensure ongoing and certain assistance for carers.
An additional $600 Carer Supplement is also paid to recipients of Carer Payment, recipients of both Wife Pension and Carer Allowance, recipients of Department of Veterans’ Affairs Partner Service Pension, Carer Allowance, and recipients of Department of Veterans’ Affairs Carer Service Pension.
Carer Payment (child)
FaHCSIA undertook extensive research, development and legislative drafting activities to ensure delivery from 1 July 2009 of a new assessment process, and fairer eligibility criteria for carers of children with a severe disability or severe medical condition under the age of 16 years in need of access to Carer Payment. The success of this project will better support people whose caring responsibilities prevent them from undertaking substantial workforce participation.

104 FaHCSIA Annual Report 2008–2009 Part2 Performance reporting Chapter 7 Outcome 2
Young Carers Forum
The Department supported the Young Carers Forum: Bring It! 2008, which was held in November 2008 at Parliament House. The two‑day forum provided young carers, key stakeholders, academics and government representatives with an opportunity to contribute to the development of young carers policy. Recommendations from the forum will be taken into consideration in framing the Government’s response to the House of Representatives inquiry into better support for carers.
MyTime
An additional 60 MyTime peer support groups were rolled out for parents of young children with disability, bringing the total number of groups to 204. The intensity of their caring role puts parents and carers of young children with disability at significant risk of being isolated and socially disconnected from family and friends. MyTime plays an important role in addressing these issues by providing peer support groups that allow parents and carers to socialise and obtain information on community support services.
Support for womenFaHCSIA supports women by increasing their opportunities to live free of discrimination and violence and to participate fully in the economic, social and cultural life of Australian society.
Our key achievements in 2008–09 for supporting women are outlined below.
National Council to Reduce Violence against Women
FaHCSIA supported an 11‑member National Council to Reduce Violence against Women, chaired by Ms Libby Lloyd AM. The council was established to provide advice to the Government about reducing violence against women and their children. The council conducted significant research to assess the existing evidence, the operation of legal systems and the economic costs of violence against women. It also consulted with more than 2,000 Australians from all sectors of the community.
The National Council produced its report, Time for Action, which was presented to the Australian Government in April 2009. At the handover of the council’s report, the Prime Minister, the Hon. Kevin Rudd, MP, announced the Government’s immediate response of $42 million to address the issues raised by the report. This included funding of $12.5 million for a new national domestic violence and sexual assault telephone and online crisis service. A further $26 million was provided for primary prevention activities, including a respectful relationships program and social marketing. Funding of $3 million was allocated to conduct research on perpetrator treatment and the harmonisation of federal and state and territory laws. An additional $400,000 was provided for the Violence Against Women Advisory Group to advise on the development of the National Plan to Reduce Violence against Women.

105
Cas
e st
udy
Chapter 7 Outcome 2 Part2 Performance reporting FaHCSIA Annual Report 2008–2009
Perf
orm
ance
repo
rtin
gPa
rt 2
National Plan to Reduce Violence against WomenIn May 2008, the Minister for the Status of Women, the Hon. Tanya Plibersek, MP, established the National Council to Reduce Violence against Women, under the leadership of Ms Libby Lloyd AM. The aim of establishing the council was to achieve key elements of the Government’s 2007 federal election commitment to improve women’s safety.
The council’s task was to provide the Government with advice on the development of an evidence‑based plan of action to reduce the incidence and impact of domestic and family violence and sexual assault on women and their children.
The council’s work included a national conversation with over 2,000 Australians, whose stories of success and failure helped to shape the council’s report. Participants in the consultation included survivors of violence; perpetrators of violence; educators; service providers; people living in rural and remote areas; members of Indigenous and culturally and linguistically diverse communities; women with disability; members of the judiciary; representatives of the state and territory governments; and members of the public.
The council formally presented its report, Time for Action: The National Council’s Plan for Australia to Reduce Violence against Women, 2009–2021, and accompanying documents to the Prime Minister on 29 April 2009. The report identifies six core areas for improvement, supported by 25 strategies and 117 actions, of which 20 are identified as high‑priority actions for governments and the community to help Australian women live free of violence, within respectful relationships and in safe communities.
As an immediate response to the 20 high‑priority actions recommended by the council, the Prime Minister announced an initial investment of $42 million over four years to implement measures designed to improve the safety of women and their children. The Australian Government also committed to refer the council’s report to the Council of Australian Governments to achieve a comprehensive response, articulated through an endorsed National Plan to Reduce Violence against Women, by early 2010.
Photo above: The Prime Minister, the Hon. Kevin Rudd, MP, and Minister for Housing and Minister for the Status of Women, the Hon. Tanya Plibersek, MP, greet Canberra school students at the launch of the National Plan to Reduce Violence against Women.

106 FaHCSIA Annual Report 2008–2009 Part2 Performance reporting Chapter 7 Outcome 2
National Standards for the Primary Prevention of Sexual Assault through Education
FaHCSIA provided funding for the development of the National Standards for the Primary Prevention of Sexual Assault through Education, which were commissioned by the National Association of Services Against Sexual Violence and launched by the Minister for the Status of Women, the Hon. Tanya Plibersek, MP, in May 2009. The standards are designed to enhance the field of sexual assault prevention education and to build primary prevention capacity. They are being tested in the community and will set a benchmark for best practice preventive education for future programs.
White Ribbon Foundation—ambassador programs
The Department expanded the successful ambassador programs, which are run by the White Ribbon Foundation in rural and regional Australia to promote cultural change among young people, particularly young men, to reduce violence against women. The program provides positive role models for men by appointing prominent men from many fields as ambassadors who can use their leadership skills and networks to raise awareness of this important issue.
The White Ribbon Foundation has recruited more than 700 ambassadors to promote the work of the foundation and encourage attitude and behavioural change. Ambassadors include many well‑known and respected Australian men from the sporting, political and business arenas, including the Prime Minister, the Hon. Kevin Rudd, MP, and the Parliamentary Secretary, the Hon. Bill Shorten, MP.
People trafficking
Victims of people trafficking often face exploitation through slavery, forced labour including sex work, and servitude. Deceived about the nature of the work they will do, victims are threatened with violence and subject to economic leverage such as debt bondage. They are also commonly denied basic human rights, such as personal liberty.
In addressing these issues, FaHCSIA implemented policy changes, announced by the Government on 17 June 2009, to Australia’s anti‑people trafficking strategy to provide improved support for victims. These changes have simplified the visa framework and expanded the Support for Victims of People Trafficking Program, enabling a wider range of trafficking victims to access support services.
United Nations Commission on the Status of Women
The Department supported the Australian delegation to the 53rd session of the United Nations Commission on the Status of Women in March 2009. Minister Plibersek led the delegation in the first week, delivering Australia’s country statement and presenting on a panel with the UN Secretary‑General Ban Ki‑moon to commemorate International Women’s Day. Australia is pursuing three key priority areas for advancing gender equality: improving

107
Cas
e st
udy
Chapter 7 Outcome 2 Part2 Performance reporting FaHCSIA Annual Report 2008–2009
Perf
orm
ance
repo
rtin
gPa
rt 2
Caseworkers in the Australian Red Cross Support for Victims of People Trafficking ProgramThe Support for Victims of People Trafficking Program is a component of Australia’s anti‑people trafficking strategy. The program is administered by the Office for Women in partnership with the Attorney‑General’s Department, the Australian Federal Police, the Commonwealth Director of Public Prosecutions and the Department of Immigration and Citizenship. The Australian Red Cross is contracted by the Office for Women to provide support services as part of this program to clients who have been identified as victims of people trafficking. Victims of people trafficking are a particularly vulnerable group who generally have high needs, often suffering significant post‑traumatic stress and with limited English language skills and low levels of education.
Clients have an individual caseworker who assists them with a range of support while they are in the program, including one‑on‑one support. A caseworker may work with up to seven clients at any one time and must be available to help clients with any problems as they arise. Caseworkers help clients to find safe and secure short‑ or long‑term accommodation, arrange and accompany clients to doctors’ appointments, attend Centrelink with clients to organise special benefits if they are not working, and help clients to set up a home and purchase household goods. Some clients also need help with everyday things, like how to catch public transport.
In any one day caseworkers may help clients find training courses, including learning English, that will assist them to find employment in Australia; organise for interpreters to attend appointments so that clients receive necessary information; and provide support and referral on legal matters, like migration issues. If a caseworker is unable to find an appropriate solution to an issue, they refer and accompany clients to more specialised services. Caseworkers also assist clients who are transitioning out of the program.

108 FaHCSIA Annual Report 2008–2009 Part2 Performance reporting Chapter 7 Outcome 2
women’s economic outcomes and financial independence, ensuring women’s voices are heard at all levels of decision making, and reducing violence against women.
National Women’s Alliances
FaHCSIA supported the National Women’s Alliances (known as National Women’s Secretariats until November 2008) to engage strongly with the Government on key women’s issues. These included the Pension Review and the wider inquiry into Australia’s Future Tax System and the development of the Paid Parental Leave scheme.
Women’s Interdepartmental Committee
The Department established the Women’s Interdepartmental Committee in March 2009. The committee promotes the skills and tools necessary to ensure government policies and programs within and across portfolios reflect the different needs of men and women. The committee also works to improve the capacity of the Australian public service to provide advice that is gender sensitive.
Sports Leadership Grants
FaHCSIA collaborated with the Australian Sports Commission to deliver the 2009–10 Sports Leadership Grants for Women Program. These grants provide developmental opportunities for women to reach their potential by supporting women to pursue accredited training and development across all areas of sport. A total of 132 projects shared $500,000 in funding, an increase of $100,000 on last year’s funding round.
Addressing youth homelessnessReconnect has been closely aligned with the goals of the Government’s White Paper on homelessness (discussed under Outcome 4) to better support young people who are homeless or at risk of becoming homeless. Addressing youth homelessness contributes to Outcome 2 by assisting young people who are homeless, or at risk of homelessness, through funding early intervention services under the Reconnect program. This program prevents homelessness and reduces its impact, particularly on families with young people, by providing early intervention support to young people aged 12 to 18 years who are homeless or at risk of homelessness and their families.
Reconnect provides support to the whole family to help break the cycle of homelessness, which can begin at an early age. The program operates across Australia and provides support to a broad range of young people, including Indigenous people and people from culturally and linguistically diverse backgrounds. Services offered by Reconnect include counselling, group work, family mediation and practical support to both the young person and their family.

109
Cas
e st
udy
Chapter 7 Outcome 2 Part2 Performance reporting FaHCSIA Annual Report 2008–2009
Perf
orm
ance
repo
rtin
gPa
rt 2
Women’s Leadership and Development Program GrantsThe Muslim Women’s National Network of Australia supported Muslim women’s full participation in Australian society through a series of workshops held across the country in 2008–09 to build governance, strategic planning and advocacy skills among Muslim women and the organisations representing their needs.
The Self‑Esteem, Identity, Leadership and Community project addressed the issues that are relevant to Australian Muslim women today: language difficulties, financial issues, access to information, self‑development, self‑esteem, women’s rights, communication and conflict resolution.
Participants found the workshops not only provided them with the information they need to represent themselves and their communities, but also gave them the confidence to be leaders and decision makers.
‘The workshop made me aware of my strengths as a community leader but more importantly it made me aware of the gaps in my skills and I am now looking towards improving my skills because of my attendance at the workshop’, said one woman.
‘I am sure this workshop will set precedents to help Muslim women be more represented in the community’, said another participant.
The workshops were funded under FaHCSIA’s 2007–08 Women’s Leadership and Development Program Grants, which were awarded to activities that aimed to promote women’s social inclusion, build women’s capacity to take on greater leadership responsibilities, and enhance advocacy and service delivery by national women’s non‑government organisations.

110 FaHCSIA Annual Report 2008–2009 Part2 Performance reporting Chapter 7 Outcome 2
Support for Australia’s international relationships and agreementsFaHCSIA works with other countries to build and maintain bilateral ties as well as to develop and implement social security agreements. Australia’s social security agreements with a range of countries help to ensure the integrity of Australian social security payments overseas.
FaHCSIA’s key international achievements in 2008–09 are outlined below.
New agreements
FaHCSIA implemented new agreements with Greece and Korea (1 October 2008), Japan (1 January 2009) and Finland (1 July 2009). These agreements are bilateral treaties that close gaps in social security coverage for people who migrate between countries. This is achieved by overcoming barriers to pension payment in domestic legislation such as requirements on citizenship, the minimum contributions record, the past residence record and current country of residence.
Strategic multilateral relationships
The Department built and maintained strategic multilateral relationships with key partners in the Six Countries social policy forums. This included effectively coordinating the Australian delegation’s preparation for the Windsor Conference that was held in the United Kingdom in April 2009.
Challenges in 2008–09This section describes some of the challenges the Department met when delivering Outcome 2 initiatives and how we worked to overcome them.
Challenges to supporting seniorsThe global financial crisis significantly reduced the private income and assets of many seniors. The Age Pension system responded as intended to provide additional assistance to seniors where it was needed. Many seniors received an increased rate of the Age Pension while others became eligible for the Age Pension for the first time.
The FaHCSIA portfolio made adjustments to the pension system to assist seniors, including those receiving a part‑rate Age Pension. These adjustments included special and regular updates of the values of shares and managed investments used in pension assessments, and reductions in the social security income test deeming rates to reflect lower returns on financial investments. The deeming rates were reduced in November 2008, January 2009 and March 2009. The deeming rates were halved over this period. The Government also suspended the minimum drawdown requirements for account based superannuation pensions from January 2009. This relief, through the operation of the income test, resulted in some additional people receiving Age Pension payments.

111
Perf
orm
ance
repo
rtin
gPa
rt 2
Chapter 7 Outcome 2 Part2 Performance reporting FaHCSIA Annual Report 2008–2009
The Centrelink Financial Information Service provided information to seniors on how they might adjust their financial arrangements in response to the impact of the global financial crisis.
Challenges to supporting people with disabilityOn 17 July 2008 Australia ratified the United Nations Convention on the Rights of Persons with Disabilities. The Australian Federation of Disability Organisations noted that ‘to be effective, disability policy direction must start with the needs of people with disability, and no‑one knows these better than people with disability themselves. That’s why it’s so important that the Government has signalled its commitment to put into practice the disability sector’s core demand: Nothing About Us, Without Us!’. However, ratifying the Convention in itself is not enough to make a difference. The Department is taking forward the objectives of the Convention to ensure all areas of the Department and the Government are mindful of the Convention when developing policy advice and implementing programs.
A key action for giving effect to the Convention will be the development of the National Disability Strategy. In September 2008 the Hon. Jenny Macklin, MP, and the Hon. Bill Shorten, MP, announced the establishment of the National People with Disabilities and Carer Council to provide advice on the development and implementation of the Strategy. The 28‑member Council is chaired by Dr Rhonda Galbally, AO, and includes Council members who represent a diverse range of backgrounds and experience. The Council includes people with disability and their families, carers, industry and union representatives and academics. Several members have extensive experience in advocating for the needs of people with intellectual disability as well as those with high support needs.
The Council undertook consultations in each capital city. Focus groups were also held in regional and remote areas targeting specific groups, including Indigenous people, people from diverse cultural backgrounds and women. There was a strong response with more than 2,500 people attending these public forums and more than 750 written submissions received. These consultations will contribute to the development of the National Disability Strategy.
Challenges in the development of Autism Specific Early Learning and Care CentresThe development of the Autism Specific Early Learning and Care Centres has been a complex initiative, both in the design and implementation of the capital construction and in operational components. The service delivery model brings together three best practice domains: early intervention for children with autism spectrum disorders, child care for children with special needs and early childhood education. The Department has worked closely with selected providers and other specialists to identify emerging opportunities and issues and develop joint solutions. The first of the six centres commenced operation in late June 2009 with the other five due to commence in 2009–10.
112 FaHCSIA Annual Report 2008–2009 Part2 Performance reporting Chapter 7 Outcome 2
Challenges to supporting carersIt is important that the Department understand the experience of carers in order to develop informed and evidence‑based policies that support the contribution of carers. The House of Representatives Standing Committee on Family, Community, Housing and Youth inquiry into better support for carers helped the Department to gain a better understanding of the issues affecting carers. The inquiry received more than 1,300 written submissions from carers and organisations sharing their challenges and experiences of caring for a person with disability or severe medical condition or who is frail aged. The inquiry reported on 25 May 2009. The Department is assisting the Government by leading the development of the Government response to the inquiry.
The reform of Carer Payment (child) required complex policy changes to be accurately and concisely translated into legislation. Significant effort was put into research to support the new legislation and policy framework. The Department worked closely with Centrelink to ensure the reform could be implemented on time.
The development of the new carer assessment questionnaire was informed by advice from an expert panel of health professionals. A mail‑out of a pilot questionnaire was conducted to ensure advice was received in time.
Challenges to supporting womenDeveloping a nationally led cross‑jurisdictional response to combating violence against women in the shadow of a global financial crisis requires innovation and commitment in equal measures. Ensuring that all governments work together on this important issue requires a high level of commitment. In 2008–09 the Government referred the National Plan to Reduce Violence against Women to the Council of Australian Governments (COAG) in order to give it the high‑level attention it needs.
Ensuring that women are appropriately represented across all sectors, and that their views and experiences are understood and considered in the development of Government policy, remains an ongoing challenge. In 2008–09 the Minister for the Status of Women asked the Office for Women to develop a model that refocuses the way government engages with women’s organisations and ensures that it hears a wide range of women’s perspectives. The Office for Women consulted widely with Australian women’s organisations to ensure participation of those women who are not usually engaged with government, so that future models of engagement represent the diversity of women’s needs and issues.
Challenges in reducing youth homelessnessThe Department’s primary response to youth homelessness is the Reconnect program. From 1 July 2009, the Newly Arrived Youth Support Services will be integrated into the existing arrangements for Reconnect providers. The challenge in 2008–09 was to prepare for a smooth transition. The Department developed streamlined processes and worked closely with providers to ensure they understood what the new arrangements meant

113
Perf
orm
ance
repo
rtin
gPa
rt 2
Chapter 7 Outcome 2 Part2 Performance reporting FaHCSIA Annual Report 2008–2009
and how the changes would impact on their services. At the same time the Department developed improved performance systems for the program.
2008–09 Budget measuresResponsible Economic Management—Employment Entry Payment—Abolish from 1 July 2008This measure abolished the Employment Entry Payment from 1 July 2008 to remove duplication with the assistance provided by the Working Credit. The measure delivers on the Government’s commitment to responsible economic management and will provide net savings of $60.8 million over five years.
Responsible Economic Management—Concession Cards—retention while overseasTo make it easier for people who travel overseas, portability of concession cards was introduced from 1 July 2008. This ended the requirement to cancel cards when a person departs Australia for up to 13 weeks.
Helping seniors make ends meet—Broadband for SeniorsThe Broadband for Seniors measure provides free computer access, free broadband internet access and free computer training and/or regular computer workshops through community organisations to help build the confidence of senior Australians in using new technology. The initiative responds to the needs of senior Australians wishing to be trained in the use of the internet and to help them stay connected to family and friends.
Business Services Wage Assessment Tool—continuationAs part of the 2008–09 Budget, the Government provided $25.7 million over four years to provide the disability employment sector with continued access to the Business Services Wage Assessment Tool. The tool assesses worker productivity and competency to assist in determining a fair wage for people with disability in supported employment. The free wage assessments are conducted by qualified Commonwealth Rehabilitation Services Australia staff.
Carer BonusIn 2008–09, the Government provided around $428.1 million for one‑off lump‑sum carer bonus payments to support carers in recognition of their important role and the contribution they make in our community.
A payment of $1,000 was made to carers who received Carer Payment or the Department of Veterans’ Affairs Carer Service Pension. Carer Allowance recipients who received

114 FaHCSIA Annual Report 2008–2009 Part2 Performance reporting Chapter 7 Outcome 2
a Wife Pension or the Department of Veterans’ Affairs Partner Service Pension also received $1,000.
Carer Allowance recipients were paid $600 for each eligible care receiver. Carer Bonus payments are not subject to income tax, nor are they treated as income for social security purposes.
Responsible Economic Management—Partner Service Pension—cease payment to married partners who are separated but not divorcedThis measure involved the cancellation of the Partner Service Pension of a partner 12 months after the date of their separation from the veteran, or from the date that the veteran or partner commences a new marriage or de facto relationship, if that occurs first. As a result, some people would be expected to instead receive FaHCSIA income support payments.
Responsible Economic Management—Fraud and Compliance—Commonwealth Seniors Health Card compliance reviewsThis measure introduces a review and compliance regime for the Commonwealth Seniors Health Card that will include data matching with the Australian Taxation Office, and risk‑profile‑based reviews, to ensure only customers who continue to be eligible retain the card.
Education Revolution—Early Childhood—additional child care placesIn the 2008–09 Budget, $114.5 million was invested over four years to June 2012. Funding was for the establishment of Early Learning and Care Centres in 38 priority locations, including the six autism specific centres.
Of this, $96.8 million was appropriated to the Department of Education, Employment and Workplace Relations for child care‑related funding (such as the Child Care Benefit and Child Care Tax Rebate) and the construction and fit‑out of the 38 centres.
Funding of $16.4 million was appropriated to FaHCSIA to be put towards salary and wage expenses directly attributable to employment of six specialist staff and five trained child care workers for each of the autism specific centres over the four‑year period. This amount also includes funding for establishment, communications and clinical evaluation for the centres.
As at 30 June 2009 the service providers of the Adelaide, south‑western Sydney and Melbourne autism specific centres have been announced. Selection of service providers for the Perth, Brisbane and north‑west Tasmanian centres is still under way.

115
Perf
orm
ance
repo
rtin
gPa
rt 2
Chapter 7 Outcome 2 Part2 Performance reporting FaHCSIA Annual Report 2008–2009
Carers—improved supportUnder this measure, from 1 July 2009, carers of children aged under 16 years with disability or a severe medical condition will be able to receive increased financial support from improved access to Carer Payment (child), through a more equitable assessment process and more streamlined administrative processes.
Responsible Economic Management—Fraud and compliance—assessments to verify income or assetsThe Government increased the number of assessments of people receiving payments through Centrelink, where data matching with the Australian Taxation Office suggests the need for such a review. The reviews will seek to identify people who have failed to declare, or may have under‑declared, income or assets to Centrelink. This measure will reduce overpayments and will lead to the recovery of amounts already incorrectly paid.
National Disability StrategyA National Disability Strategy was one of the key recommendations of the 2007 Senate inquiry into the Commonwealth State Territory Disability Agreement. The aim of the strategy is to provide direction and focus at a national level for the development of disability legislation, policy and standards that deliver a whole‑of‑government, whole‑of‑life approach to disability planning.
A National Disability Strategy Reference Group has been established to draw together the collective knowledge and experience of the Australian and state and territory governments on a range of initiatives to advance the participation and social inclusion of people with disability. The Reference Group will also be involved in the development of a monitoring and reporting process across all levels of government.
The National Disability Strategy will be an important mechanism to ensure that the principles underpinning the UN Convention on the Rights of Persons with Disabilities are incorporated into policies and programs affecting people with disability, their families and their carers. The strategy will be released in 2010.
National reciprocal transport concessionsBefore January 2009, Seniors Card holders could generally only access public transport concessions in their home state. The Government has provided $50 million over four years to achieve national reciprocal public transport concessions for Seniors Card holders. The measure was implemented in most states and territories from January 2009, and all state and territory governments had signed the agreement by June 2009.
Seniors Cards are issued by state and territory governments to residents who are generally aged over 60 and no longer working full‑time. Eligibility for the Seniors Card varies slightly between jurisdictions.

116 FaHCSIA Annual Report 2008–2009 Part2 Performance reporting Chapter 7 Outcome 2
Funding for this measure is one element of the National Partnership on Certain Concessions for Pensioners and Seniors Card Holders—for which funding is allocated through the Commonwealth Treasury portfolio.
Social Security Agreement with FinlandIn September 2008, Australia and Finland signed a new Social Security Agreement that came into effect from 1 July 2009. The agreement provides improved access to pensions for people who spend part of their adult lives in both Australia and Finland. It allows people who now live in either country to claim pension entitlements from Australia and Finland. The agreement also facilitates business between Australia and Finland by removing the requirement for compulsory contributions to be paid into both countries’ superannuation or pension systems for temporarily seconded workers.
Social Security Agreement with PolandNegotiations for a social security agreement between Australia and Poland have been finalised and the agreement is expected to be signed in 2009–10.
Responsible Economic Management—Pilot program addressing undeclared business income and assets—cessationThe Government did not proceed with the pilot program measure announced in the 2006–07 Budget. The pilot program sought to test the feasibility of matching Centrelink data with goods and services tax and business activity statement data from the Australian Taxation Office, to address payment risks associated with undeclared business income and assets. The measure has been terminated early as the pilot program results showed that the data matching was not cost effective.
Respite brokerage for older carersA total of $2 million was made available in 2008–09 to fund respite brokerage costs (purchase of service provision for eligible clients) for older carers of children with disability. This funding covered an interim period up to August 2008 prior to finalising the transfer of responsibility to state and territory governments.
Helping seniors make ends meet—Seniors BonusA one‑off, lump sum, non‑taxable bonus of $500 was paid to eligible seniors. The payment was made before the end of June 2008 at a cost of $1.4 billion.
Temporary Protection visa—abolitionThis measure, proposed by the Department of Immigration and Citizenship and approved in the 2008–09 Budget, abolished Temporary Protection Visa arrangements and resolved the status of existing Temporary Protection Visa and Temporary Humanitarian Visa holders. Under the new arrangements asylum seekers will be eligible to apply for a permanent

117
Perf
orm
ance
repo
rtin
gPa
rt 2
Chapter 7 Outcome 2 Part2 Performance reporting FaHCSIA Annual Report 2008–2009
protection visa, and if successful they will have immediate access to all relevant payments and benefits.
Responsible Economic Management—Commonwealth Seniors Health Card—adjusted taxable income testThe Government decided not to proceed with this measure, which involved expanding the Commonwealth Seniors Health Card adjusted taxable income test to include gross income from superannuation income streams with a taxed source, including withdrawals, and income that has been salary sacrificed to superannuation. An additional measure was announced in the 2009–10 Budget to include reportable superannuation contributions, including income that is salary sacrificed to superannuation, in the adjusted taxable income test for the card.
Closing the Gap—Northern Territory—further welfare and employment reformThis measure also applies to Outcome 1. See page 68 for details on this measure.
Migration Program—37,500 place increase for 2008–09An additional 37,500 places, comprising 31,000 in the Skill Stream and 6,500 in the Family Stream, have been made available in the Department of Immigration and Citizenship’s 2008–09 non‑humanitarian program on an ongoing basis. These migrants are subject to a waiting period, and will generally be precluded from accessing any income support for a period of two years for most payments, and 10 years in the case of the Age Pension and the Disability Support Pension. The additional places will have an impact on social security outlays, as these migrants can receive family assistance payments immediately on arrival to Australia to assist with work and family responsibilities.
This measure also applies to Outcome 3.
Centrelink call centre supplementation—continuationThis measure is reported in Centrelink’s Annual Report under Call Centre Performance.
This measure also applies to Outcome 3.
Humanitarian migration program—additional 500 places for Iraqis in 2008–09The Department of Immigration and Citizenship announced an additional 500 offshore refugee visa places in the 2008–09 humanitarian program for the resettlement of Iraqi refugees. The places identified are for Iraqis currently living in Jordan and Syria who are unable to return to Iraq due to the current conflict. Permanent refugees entering Australia

118 FaHCSIA Annual Report 2008–2009 Part2 Performance reporting Chapter 7 Outcome 2
under the migration program are entitled to immediate access to all social security and family assistance payments.
This measure also applies to Outcome 3.
Humanitarian migration program—additional 750 Special Humanitarian Program places from 2009–10The Department of Immigration and Citizenship announced an additional 750 offshore refugee visa places in the 2008–09 humanitarian program for the resettlement of Iraqi refugees to take effect from 2009–10. The places identified are for Iraqis currently living in Jordan and Syria who are unable to return to Iraq due to the current conflict. Permanent refugees entering Australia under the migration program are entitled to immediate access to all social security and family assistance payments.
This measure also applies to Outcome 3.
Visa places for Iraqi locally engaged employeesThe Department of Immigration and Citizenship announced 600 additional permanent refugee places in the 2007–08 migration program for Iraqi locally engaged employees. These places were offered to people in conflict situations who were at risk due to their involvement with the Australian Government overseas. Permanent refugees entering Australia under the migration program are entitled to immediate access to all social security and family assistance payments.
This measure also applies to Outcome 3.
Means-testing of government support—expanded definitions of income to include net losses from investmentsThis measure expanded the definition of income used to determine eligibility for some government support programs to include net financial investment losses, and net rental property losses where appropriate, with effect from 1 July 2009.
This measure also applies to Outcome 3.
Means-testing of government support—expanded definitions of income to include certain ‘salary sacrificed’ contributions to superannuationThis measure expanded the definition of income used to determine eligibility for some government support programs to include certain ‘salary sacrificed’ contributions to superannuation, with effect from 1 July 2009.
This measure also applies to Outcome 3.
119
Perf
orm
ance
repo
rtin
gPa
rt 2
Chapter 7 Outcome 2 Part2 Performance reporting FaHCSIA Annual Report 2008–2009
Removal of differential treatment of same-sex couples and their children—law reformDepartmental funding was received to develop and implement the removal of differential treatment of same‑sex couples and their children, in conjunction with Centrelink.
This measure also applies to Outcomes 3 and 4.
Supporting Local CommunitiesThe Supporting Local Communities measure assisted community organisations to provide homelessness and other services to their local communities. This includes community organisations in Lismore in New South Wales, and Gumdale in Queensland.
This measure also applies to Outcome 4.
2008–09 Portfolio Additional EstimatesPartner Service Pension—age related arrangements for married partners of veterans who are separated but not divorcedThis is an adjustment to the Veterans’ Affairs 2008–09 Budget measure to restrict access to Service Pension for partners who are separated from, but still legally married to, a veteran. The adjustment excluded partners over Age Pension age from the measure, and therefore none of this group will instead receive FaHCSIA income support payments.
Partner Service Pension—further arrangements for married partners of veterans who are separated but not divorcedThis is a further adjustment to the Veterans’ Affairs 2008–09 Budget measure to restrict access to Service Pension for partners who are separated from, but still legally married to, a veteran. The adjustment reduced the number of former Veterans’ Affairs payment recipients who claimed FaHCSIA Carer Payment and Disability Support Pension as a result of the measure.
Implementation of Operation SunlightThis measure also applies to Outcomes 1, 3 and 4. See pages 70–71 for details on this measure.

120 FaHCSIA Annual Report 2008–2009 Part2 Performance reporting Chapter 7 Outcome 2
2008–09 Portfolio Supplementary Estimates StatementsEconomic Security Strategy—lump sum payment to pensioners, seniors and carersThe Economic Security Strategy announced in October 2008 included lump‑sum payments for pensioners, seniors, carers and people with disability to provide immediate financial support in the lead up to comprehensive reform of the pension system.
A lump‑sum payment of $1,400 (single) and $2,100 (couples combined) was paid in December 2008. Self‑funded retirees with a Commonwealth Seniors Health Card and Department of Veterans’ Affairs Gold Card holders who were eligible for the Seniors Concession Allowance also received the payment.
People receiving Carer Allowance received an additional $1,000 for each eligible person in their care.
The payment was made to more than four million people at a cost of $4.9 billion.
Economic Security Strategy—public information campaignIn 2008–09, funds were provided to FaHCSIA to develop a public information campaign to support the Economic Security Strategy (ESS) measures. The campaign was designed to inform audiences of the impact of these measures on their entitlements, rights and obligations.
FaHCSIA put in place two campaigns. The ESS Payments campaign provided messages about the ESS payments made during December 2008, and the First Home Owners Boost campaign provided messages about the eligibility requirements.
Evaluation research of the ESS Payments campaign indicated that the campaign improved awareness of individual details of the payments by between 10 and 50 per cent.
In the 2009–10 Budget, the Government announced the extension to the First Home Owners Boost to 31 December 2009.
This measure also applies to Outcomes 3 and 4.

121
Perf
orm
ance
repo
rtin
gPa
rt 2
Chapter 7 Outcome 2 Part2 Performance reporting FaHCSIA Annual Report 2008–2009
2008–09 Portfolio Supplementary Additional Estimates StatementsNation Building and Jobs Plan—Training and Learning Bonus and Education Entry Payment SupplementA Training and Learning Bonus of $950 for each eligible student was paid to families eligible for Family Tax Benefit Part A on 3 February 2009, for each eligible child aged 19 to 24 in full‑time study.
This measure also applies to Outcome 3.
Nation Building and Jobs Plan—Back to School Bonus—One-off Lump Sum Payment of $950 per FTB-A Eligible ChildFamilies eligible for Family Tax Benefit Part A on 3 February 2009 received a Back to School Bonus of $950 per child aged 4 to 18 years inclusive. The bonus was also payable to recipients of Disability Support Pension or Carer Payment aged 18 years or under.
This measure also applies to Outcome 3.
Results for key performance indicatorsThis section outlines, by output group, how the Department performed against the key performance indicators set out in the 2008–09 Portfolio Budget Statements and related Budget documents. Where relevant, achievement against key performance indicators is summarised in tables that provide estimated and actual results for targets set out in the FaHCSIA 2008–09 Portfolio Budget Statements.
Contributions to Outcome 2
Output Group 2.0Items applicable across Outcome 2Output Group 2.0 contributes to Outcome 2 by providing income support payments and act of grace payments under special circumstances to those in need.
Components of Output Group 2.0Bereavement Allowance ◗
Payments under s. 33 of the FMA Act ◗
Special Benefit ◗

122 FaHCSIA Annual Report 2008–2009 Part2 Performance reporting Chapter 7 Outcome 2
Bereavement AllowanceBereavement Allowance is paid for up to 14 weeks to a recently widowed person following the death of their partner. It is subject to the pension income and assets test. It is also paid under international social security agreements.
Total number of customers paid Bereavement Allowance
Estimate 550 The variance is +34.
Bereavement Allowance is an income support payment available for up to 14 weeks following the death of a partner. Bereavement Allowance must be applied for. The variance is attributable to greater awareness of the payment.
Actual 584
Payments under s. 33 of the FMA ActPayments under section 33 of the FMA Act are act of grace payments made in special circumstances at the discretion of the Minister for Finance and Deregulation.
Special BenefitSpecial Benefit is an income support payment for people who are not eligible for any other type of payment and have no other means of support. The benefit is income and asset tested.
Average amount of earnings of Special Benefit customers per fortnight
Estimate $250 The variance is +$38.
The variance is primarily attributed to recipients receiving a higher rate of earnings than estimated.
Actual $288
Average duration on Special Benefit
Estimate 128 weeks The variance is –5 weeks.
The average duration is slightly lower primarily due to Temporary Protection Visa holders gaining permanent residency and accessing other income support payments earlier than originally estimated.
Actual 123 weeks
Percentage of Special Benefit customers with earnings
Estimate 1% No variance.
Actual 1%
Percentage of Special Benefit customers on part rate
Estimate 74% The variance is –3%.
The variance is due to a decrease in the estimated number of Special Benefit recipients who undertook part‑time employment, received a foreign pension or received free board and lodgings.
Actual 71%

123
Perf
orm
ance
repo
rtin
gPa
rt 2
Chapter 7 Outcome 2 Part2 Performance reporting FaHCSIA Annual Report 2008–2009
Number of Special Benefit customers assisted
Estimate 6,047 The variance is –238.
The variance is primarily attributable to Temporary Protection Visa holders gaining permanent residency and accessing other income support payments.
Actual 5,809
Control of incorrect payment and fraud—accuracy of administered outlays (total dollars correctly paid) as measured by the Random Sample Survey
Estimate Accuracy of administered outlays is greater than or equal to 95%
The variance is +1.3%. The ‘estimate’ is the agreed benchmark between FaHCSIA and Centrelink. The ‘actual’ figure is the estimated accuracy of administered outlays derived from Random Sample Survey data.
Actual 96.3%
Output Group 2.1Support for the agedOutput Group 2.1 contributes to Outcome 2 by ensuring that senior Australians in need are provided with adequate income support, and by providing allowances and concessions to senior Australians. Information services and incentives assist seniors to make the best use of their savings, investments and income sources to enhance their standard of living.
Components of Output Group 2.1Age Pension ◗
Compensation for extension of fringe benefits to pensioners and older long‑term ◗
allowees and beneficiaries
Reimbursement to Great Southern Rail for Concessional Fares ◗
Seniors Concession Allowance ◗
Telephone Allowance for Commonwealth Seniors Health Card Holders ◗
Utilities Allowance ◗

124 FaHCSIA Annual Report 2008–2009 Part2 Performance reporting Chapter 7 Outcome 2
Age PensionThe Age Pension is an income support payment designed to ensure that seniors have an adequate standard of living. The qualifying age is 65 years for men and 64 for women, increasing to 65 by 2013. The rate of the Age Pension is indexed so that pensioners are compensated for increases in the cost of living. While the Age Pension is means tested, incentives are maintained for the productive use of private savings and investments and for participation.
Prior to 20 September 2009, the maximum basic rate and pension supplement for the Age Pension are indexed twice a year in line with increases in the Consumer Price Index (CPI). If, after CPI adjustment, the maximum single basic rate is less than 25 per cent of Male Total Average Weekly Earnings, it is adjusted up to that benchmark, with proportional flow‑on to the maximum partnered basic rate.
While indexation in line with CPI increases ensures payment rates reflect increases in prices, the Male Total Average Weekly Earnings benchmark ensures pensioners share in any increases in community living standards as measured by the growth in wages.
From 20 September 2009, enhanced pension indexation arrangements apply, as part of Secure and Sustainable Pension Reforms announced in the 2009–10 Budget.
Additional information about the Age Pension can be found on page 350.
Number of clients assisted
Estimate 2.10 million The variance is +0.02 million.
The actual result is similar to the estimate.Actual 2.12 million
Percentage of estimated aged population who receive Age Pension
Estimate 66% The variance is +2.7%.
The variance can be partially attributed to the global economic downturn and to declining rates of claims for veterans’ pensions.
Actual 68.7%
Maximum payments to recipients—index of real value
Estimate Payments indexed to the CPI
No variance.
Actual Payments indexed to the CPI
Maximum payments to recipients, single pension base—as a percentage of Male Total Average Weekly Earnings
Estimate At least 25% No variance.
Actual At least 25%

125
Perf
orm
ance
repo
rtin
gPa
rt 2
Chapter 7 Outcome 2 Part2 Performance reporting FaHCSIA Annual Report 2008–2009
Percentage of age pensioners receiving less than the full-rate because of the means test
Estimate 42% The variance is –5.7%.
The variance is the net result of a number of factors, including movement of pensioners from part‑rate pension to maximum‑rate pension as a result of effects of the global economic downturn. The social security deeming rates were reduced to reflect lower returns on financial investments, and there were reductions in the value of assessed assets such as shares and managed investments.
Actual 36.3%
Average base-rate pension reduction per part-rate pensioner per year
Estimate $3,070 The variance is +$613.
The variance is the net result of factors such as higher average asset holdings of those commencing Age Pension, movement of part‑rate pensioners with lower asset holdings to full rate, and other economic downturn effects.
Actual $3,683
Average assessable assets for people receiving maximum-rate Age Pension
Estimate $32,100 The variance is +$8,276.
The variance is the net result of factors such as movement of pensioners from part‑rate pension to maximum‑rate pension and other economic downturn effects.
Actual $40,376
Average assessable assets for people receiving less than maximum-rate Age Pension
Estimate $133,800 The variance is +$10,779.
The variance is the net result of factors such as higher average asset holdings among those commencing Age Pension (whether at Age Pension age or as a result of the global economic downturn), other economic downturn effects and increases in means test cut‑out points.
Actual $144,579
Average assessed income per year for people receiving maximum-rate Age Pension
Estimate $970 The variance is –$63.
The actual result is similar to the estimate.Actual $907
Average assessed income per year for people receiving less than maximum-rate Age Pension
Estimate $9,800 The variance is –$187.
The actual result is similar to the estimate.Actual $9,613
Percentage of age pensioners with private earnings
Estimate 3% The variance is +0.2%.
The actual result is similar to the estimate.Actual 3.2%

126 FaHCSIA Annual Report 2008–2009 Part2 Performance reporting Chapter 7 Outcome 2
Average earnings per year of partnered age pensioners in employment
Estimate $9,100 The variance is +$3,912.
The variance is the result of increases in reported earnings from partnered pensioners in employment, partly reflecting higher workforce participation among this group.
Actual $13,012
Average earnings per year of single age pensioners in employment
Estimate $11,500 The variance is –$1,212.
The variance is the result of decreases in reported earnings from single age pensioners in employment.
Actual $10,288
Percentage of income units headed by a person aged 65 years and over with government pension contributing less than 50% of income
Estimate 29% The variance is +5.8%.
The 34.8% figure is drawn from the recently released Household Income and Income Distribution 2007–08 Australian Bureau of Statistics survey. The estimate of 29% was based on the previous (2005–06) survey. The variance reflects an increase over this period in the proportion of seniors’ income from private sources.
Actual 34.8%
Number of age pensioners paid Rent Assistance
Estimate 219,800 The variance is +9,797.
The actual result is similar to the estimate. Actual 229,597
Control of incorrect payment and fraud—accuracy of administered outlays (total dollars correctly paid) as measured by the Random Sample Survey
Estimate Accuracy of administered outlays is greater than or equal to 95%
The ‘estimate’ is the agreed benchmark between FaHCSIA and Centrelink. The ‘actual’ figure is the estimated accuracy of administered outlays derived from Random Sample Survey data.
Actual 98.5%
Compensation for extension of fringe benefits to pensioners and older long-term allowees and beneficiariesIn 1993, eligibility for the Pensioner Concession Card was extended to all part‑rate pensioners and certain older long‑term allowance recipients. In response to concerns from the state and territory governments that an increase in the number of eligible card holders would have an impact on their state concession programs, the Government agreed to provide an annual payment as compensation for the increased costs of core concessions—utilities, municipal and water rates, public transport and motor vehicle registration.
From 1 January 2009, this item became an element in the new National Partnership on Certain Concessions for Pensioners and Seniors Card Holders and funding was allocated through the Treasury portfolio.

127
Perf
orm
ance
repo
rtin
gPa
rt 2
Chapter 7 Outcome 2 Part2 Performance reporting FaHCSIA Annual Report 2008–2009
Certification from state and territory governments that they are complying with the agreement
Estimate 100% No variance.
Actual 100%
Reimbursement to Great Southern Rail for concessional faresGreat Southern Rail (GSR) is under contract to provide concessional fares on its services (the Indian Pacific, the Ghan, and the Overland) to pensioners, certain veterans and holders of Commonwealth Seniors Health Cards.
From June 2009, concessions were also made available to holders of State Seniors Cards under the Government’s election commitment to provide reciprocal public transport concessions for Seniors Card holders.
Number of journeys taken by eligible customers on applicable GSR services during the financial year
Estimate 65,000 The variance is –5,750.
The program is subject to demand variances.Actual 59,250
Table 2.5 Concession cards—Australian Government
Card type Card holder numbers Listed dependants
Health Care Card 1,148,958 992,138
(Low Income) Health Care Card 381,356 21,185
Pensioner Concession Card 3,424,817 1,011,469
Commonwealth Seniors Health Card 279,564 0
Total 5,234,695 2,024,792
The Government’s main purpose in issuing concession cards is to provide access to Pharmaceutical Benefits Scheme prescription items and certain Medicare services at cheaper rates. Other concessions that may be offered to card holders are the responsibility of state, territory or local governments and authorities, and some private organisations.
Concession cards issued by the Australian Government include:
The Pensioner Concession Card for pensioners and certain older long‑term social ◗
security allowees
The Health Care Card generally for social security allowees, families receiving maximum ◗
rate Family Tax Benefit Part A by fortnightly instalment and people with income below a certain level
The Commonwealth Seniors Health Card for eligible self‑funded retirees of ◗
Age Pension age.

128 FaHCSIA Annual Report 2008–2009 Part2 Performance reporting Chapter 7 Outcome 2
Seniors Concession AllowanceSeniors Concession Allowance is a payment for holders of the Commonwealth Seniors Health Card to help with household costs. From 20 March 2009, the annual rate of the allowance increased from $514.00 to $518.80 for cardholders, paid in quarterly instalments.
Percentage of eligible Commonwealth Seniors Health Card holders receiving Seniors Concession Allowance
Estimate 97% The variance is –1%.
There has been a slight increase in the number of cardholders who elect not to receive the payment.
Actual 96%
Telephone Allowance for Commonwealth Seniors Health Card holdersTelephone Allowance assists Commonwealth Seniors Health Card holders with the cost of maintaining a telephone service. The allowance is paid quarterly and is available to cardholders where they or their partner are a telephone subscriber. From 20 September 2008, Telephone Allowance was increased from $88.00 to $92.00 a year. Where cardholders or their partner also have an internet connection, the higher rate of Telephone Allowance increased from $132.00 to $138.40 a year.
Percentage of eligible Commonwealth Seniors Health Card holders receiving Telephone Allowance
Estimate 96% No variance.
Actual 96%
Utilities AllowanceUtilities Allowance is a payment for income support recipients of Age Pension age, of Veteran Pension age, or receiving Mature Age, Widow or Partner Allowance, Wife Pension, Widow B Pension, Disability Support Pension, Carer Payment or Bereavement Allowance. Utilities Allowance provides assistance with regular household utilities bills. From 20 March 2009, the Utilities Allowance increased from $514.00 to $518.80 a year, for singles and couples combined, paid in quarterly instalments.
Number of eligible income support customers paid Utilities Allowance
Estimate 2.93 million The variance is +.07 million.The variance reflects slightly higher than anticipated demand for Utilities Allowance.Actual 3.0 million
129
Perf
orm
ance
repo
rtin
gPa
rt 2
Chapter 7 Outcome 2 Part2 Performance reporting FaHCSIA Annual Report 2008–2009
Output Group 2.2Support for people with disabilityOutput Group 2.2 contributes to Outcome 2 by supporting people with disability to participate in the community. Social support and community‑based care is provided for people with a mental illness or intellectual disability and their families and carers. The provision of services, such as employment assistance, promotes independence and self‑reliance and encourages people with disability to participate in the community.
Components of Output Group 2.2COAG Health Services—Helping Younger People with Disability in Residential Aged Care ◗
Commonwealth State Territory Disability Agreement ◗
Disability Support Pension ◗
Mental health ◗
Services for People with Disability ◗
COAG Health Services—Helping Younger People with Disability in Residential Aged CareAs of 1 January 2009, the remaining funding of $14.184 million for 2008–09 (and funding for subsequent years of the five‑year Younger People with Disability in Residential Aged Care Program) was rolled into the base of the new National Disability Agreement as part of the specific purpose payments reforms.
States and territories will continue to receive funding for the program as previously specified in bilateral agreements. However, payments are made through the Treasury instead of FaHCSIA, in accordance with the recent reforms to specific purpose payments.

130 FaHCSIA Annual Report 2008–2009 Part2 Performance reporting Chapter 7 Outcome 2
Government expenditure in 2008–09 is matched by all jurisdictions
Estimate NSW: $9.3 million
Vic: $6.9 million
Qld: $5.5 million
SA: $2.1 million
WA: $2.8 million
Tas: $1.1 million
NT: $0.3 million
ACT: $0.4 million
According to signed bilateral agreements
NSW—No variance.
Vic—No variance.
Qld—No variance.
SA—No variance.
WA—No variance.
Tas—The variance is –$0.1 million.
The actual result was similar to the estimate.
NT—No variance.
ACT—No variance.
Actual NSW: $9.3 million
Vic: $6.9 million
Qld: $5.5 million
SA: $2.1 million
WA: $2.8 million
Tas: $1.0 million
NT: $0.3 million
ACT: $0.4 million
Commonwealth State Territory Disability AgreementThe third Commonwealth State Territory Disability Agreement, which provided the national framework for the provision of government support services for people with disability, expired on 31 December 2008. The National Disability Agreement commenced on 1 January 2009.
The new agreement affirms the commitment of all governments to work in partnership with stakeholders, including people with disability and their families and carers, to improve outcomes for people with disability and provide the framework for the provision of government support for people with disability.
The agreement sets out areas for reform of the disability services system, which will create an effective, efficient and equitable system with a focus on early intervention; timely, person‑centred approaches; and lifelong planning.
These reforms will mean a system comprising single access points, nationally consistent assessment processes and quality assurance systems, and more consistent access to disability aids and equipment. Service providers will be better able to develop, train and employ care workers and governments will work together to better measure the level of unmet need for disability services.

131
Perf
orm
ance
repo
rtin
gPa
rt 2
Chapter 7 Outcome 2 Part2 Performance reporting FaHCSIA Annual Report 2008–2009
Disability Support PensionThe Disability Support Pension (DSP) is a payment made to people with disability who are unable to work for at least 15 hours per week at or above the relevant minimum wage, or be re‑skilled for such work within the next two years because of their disability. The payment is income and assets tested and paid at the same rate as other social security pensions.
Average (mean) duration on income support by current income support payment (weeks)
Estimate 618 The variance is –9 weeks.
The average duration is slightly lower than the estimate. However, the growth in average duration remains consistent with previous years.
Actual 609
Percentage of DSP customers who declare earnings
Estimate 10% The variance is –0.8%.
The percentage of earners is lower than estimated, but remains consistent with previous earnings trends.
Actual 9.2%
Control of incorrect payment and fraud—accuracy of administered outlays (total dollars correctly paid) as measured by the Random Sample Survey
Estimate Accuracy of administered outlays is greater than or equal to 95%
The ‘estimate’ is the agreed benchmark between FaHCSIA and Centrelink. The ‘actual’ figure is the estimated accuracy of administered outlays derived from Random Sample Survey data.
Actual 97.8%
Average amount of private earnings per fortnight
Estimate $410 (earned income) The variance is –$16.46.
The average amount of private earnings is lower than estimated, but remains consistent with previous earnings trends.
Actual $393.54
Percentage on part rate due to means test
Estimate 20% The variance is –2.5%.
This is a new key performance indicator. The variance suggests that the original estimate may have been overly optimistic.
Actual 17.5%
Number of clients receiving DSP
Estimate 740,000 The variance is +17,118.
The variance is attributable to the weakening of the labour market and increases in the unemployment rate.
Actual 757,118

132 FaHCSIA Annual Report 2008–2009 Part2 Performance reporting Chapter 7 Outcome 2
Mental healthFaHCSIA delivers mental health services through three programs:
Mental Health Respite Program—delivers flexible respite and support for carers ◗
and families
Mental Health Community Based Program—provides community‑based support for ◗
carers and families
Personal Helpers and Mentors Program—provides recovery support for individuals with a ◗
severe functional limitation arising from a severe mental illness.
Appropriation for these programs aims to address well‑recognised service gaps for people with mental illness and their families and carers, in particular:
the need to facilitate better access to mainstream support services for people with ◗
mental illness across all states and territories
the need to improve access to appropriate support services for Indigenous and culturally ◗
and linguistically diverse (CALD) clients
the need to improve assistance to help families and carers sustain their support roles ◗
the need to improve pathways and connections for clients to navigate the service system. ◗
Percentage of clients who report that they are satisfied that the service they received was appropriate to their needs
Estimate 60% Variance is +34%. The variance is because this was the first year data was collected. The actual percentage, which represents client satisfaction for the Mental Health Respite Program, was higher than anticipated. Additional program data will be available in the 2009–10 annual report.
Actual 94%
Percentage of clients assisted from Indigenous/CALD backgrounds
Estimate Indigenous: 5%
CALD: 14%
Indigenous—The variance is +1.4%.
CALD—The variance is –3.4%.
Full year data will be available in September 2009.
All three programs have processes in place to reach out to Indigenous and CALD communities.
Actual Indigenous: 6.4%
CALD: 10.6%

133
Perf
orm
ance
repo
rtin
gPa
rt 2
Chapter 7 Outcome 2 Part2 Performance reporting FaHCSIA Annual Report 2008–2009
Percentage of clients by state/territory
Estimate Comparable to Australian population distribution across states and territories
In 2008–09, there were 30,079 clients Australia‑wide (for PHaMs Mental Health Community Based Program and Mental Health Respite Program). Of these clients, 29.1% were based in NSW, 30.5% in Vic, 18.3% in Qld, 7.3% in SA, 7.3% in WA, 2.8% in Tas, 3.4% in the NT and 1.2% in the ACT.
Full‑year data for 2008–09 will be available in September 2009.Actual Comparable to
Australian population distribution across states and territories
Numbers of families and carers assisted through respite and brokerage services
Estimate 12,000 The variance is +7,081.
Full‑year data for 2008–09 will be available in September 2009.Actual 19,081
Numbers of families and carers assisted through community-based support services
Estimate 7,500 The variance is –201.
Full‑year data for 2008–09 will be available in September 2009.Actual 7,299
Number of people with severe functional limitation arising from severe mental illness assisted through recovery support services
Estimate 3,000 The variance is +699.
Full‑year data for 2008–09 will be available in September 2009.Actual 3,699
Services for people with disabilityThis administered item aims to improve the economic and social participation of people with disability by providing supported employment, improving access to information and assisting with access to services. Programs under this administered item provide a range of services, including advocacy, a booking service for Auslan Interpreting Services, employment assistance, print disability services, postal concessions for the blind, respite and out of school hours care, autism spectrum disorders early intervention services, education and support services for families and carers, autism spectrum disorders playgroups, autism spectrum disorder website, and autism‑specific child care services.
Average hourly wage rate for clients in supported employment
Estimate $2.90 The variance is +66 cents.
The variance reflects improved data collection methods that provide more up‑to‑date information.
Actual $3.56
Average hours worked for clients in supported employment
Estimate 26.8 hours The variance is –1.4 hours.
The variance reflects general labour market conditions.Actual 25.4 hours

134 FaHCSIA Annual Report 2008–2009 Part2 Performance reporting Chapter 7 Outcome 2
Percentage of supported employment clients that participate in employment for 26 weeks
Estimate 88% The variance is 7%.
The variance reflects better targeting of the program therefore a greater number of consumers achieved an employment outcome of 26 weeks or more, than estimated.
Actual 95%
Percentage of individuals, parents and carers who report they were assisted to access choices and options that allow them to better manage their needs
Estimate 75% Data for 2008–09 has not yet been provided by non‑government organisations to the Department. Full‑year data for 2008–09 will be available in the 2009–10 annual report.Actual Data unavailable
Percentage of funded service providers that have appropriate quality systems in place
Estimate 70% No variance for supported employment.
Actual 70%
Percentage of clients from Indigenous/CALD backgrounds
Estimate Indigenous: 1%
CALD: 14%
Indigenous—The variance is 1.2%.
The variance is attributable to increased participation and improved service provider reporting.
CALD—The variance is –9.1%.
This is a new key performance indicator. The variance suggests that the original estimate may have been overly optimistic.
Actual Indigenous: 2.2%
CALD: 4.9%
Number of users of supported employment services per 100 of the eligible population for supported employment services
Estimate 6.8 The variance is –0.3%.
The actual result is similar to the estimate.Actual 6.5
Number of users of supported employment services per 100 of the eligible population in outer regional and remote geographical locations
Estimate 0.75 The variance is –0.05.
The actual result is similar to the estimate.Actual 0.70
Capacity Utilisation Rate in supported employment services
Estimate 90% The variance is +6%.
The variance reflects better than required capacity utilisation by service providers than estimated.
Actual 96%
Resource Utilisation Cost of providing supported employment services per supported employment place
Estimate $9,400 The variance is +$449.
The variance is attributable to the increase in client support needs, as higher support needs attract a higher rate of assistance.
Actual $9,849

135
Perf
orm
ance
repo
rtin
gPa
rt 2
Chapter 7 Outcome 2 Part2 Performance reporting FaHCSIA Annual Report 2008–2009
Cost of providing supported employment services per employment outcome
Estimate $8,900 The variance is +$395.
The variance is attributable to the increase in client support needs, as higher support needs attract a higher rate of assistance.
Actual $9,295
Number of clients receiving support services
Estimate 22,300 The variance is +863.
The variance reflects an increase in consumers assisted, including the impact of 278 new places funded in the sector from 1 September 2008.
Actual 23,163
Number of respite services funded for older carers of children with disability
Estimate 135 No variance.
Actual 135
Percentage of respite for carers of young people with disability satisfied that the services they received were appropriate to their needs
Estimate 75% The variance is +20%.
This is a new key performance indicator. The actual percentage was greater than anticipated.
Actual 95%
Percentage of carers of young people with disability receiving respite services who are from Indigenous or CALD backgrounds
Estimate Indigenous: 1%
CALD: 14%
Indigenous—The variance is +7%.
The variance is because this was the first year data was collected. The actual percentage was greater than anticipated.
CALD—The variance is +2%.
The variance is because this was the first year data was collected. The actual percentage was greater than anticipated.
Actual Indigenous: 8%
CALD: 16%
Number of out-of-school hours care services funded
Estimate 10 The variance is +38.
The original estimate was based on the original number of service providers, which was increased to provide additional services.
Actual 48
Number of children with autism spectrum disorder assisted
Estimate 3,540 The variance is +1,332.
The variance reflects stronger than forecast growth in demand for assistance required for children with an autism spectrum disorder.
Actual 4,872

136 FaHCSIA Annual Report 2008–2009 Part2 Performance reporting Chapter 7 Outcome 2
Output Group 2.3Support for carersOutput Group 2.3 contributes to Outcome 2 by providing income support and allowances and other support to enhance carers’ wellbeing and assist them to balance their caring, work and family responsibilities.
Components of Output Group 2.3Carer Allowance ◗
Carer Allowance (adult) –
Carer Allowance (child) –
Child Disability Assistance Payment –
Carer Payment ◗
Support for carers ◗
Carer AllowanceCarer Allowance is an income supplement available to people who provide daily care and attention in a private home to a person who has a disability or severe medical condition, or who is frail aged. The payment is not taxable or income and assets tested. It can be paid in addition to a social security income support payment and is indexed annually.
Number of clients receiving Carer Allowance
Estimate Adult: 324,100
Child: 115,500
The variance for Carer Allowance (adult) is +10,348 and the variance for Carer Allowance (child) is +4,590.
The variances are attributable to the growth rates being slightly higher than estimated, primarily driven by increased payment awareness and announcements of new carers’ measures throughout the year.
Actual Adult: 334,448
Child: 120,090
Number of clients who received Carer Allowance (adult) and Carer Allowance (child)
Estimate 6,250 The variance is +235.
The variance is attributable to the growth rate being slightly higher than estimated, primarily driven by increased payment awareness and announcements of new carers’ measures throughout the year.
Actual 6,485

137
Perf
orm
ance
repo
rtin
gPa
rt 2
Chapter 7 Outcome 2 Part2 Performance reporting FaHCSIA Annual Report 2008–2009
Number of clients who did not receive Carer Allowance (child) but received a Health Care Card only
Estimate 12,500 The variance is +1,104.
The variance is attributable to the growth rate being slightly higher than estimated, primarily driven by increased payment awareness and announcements of new carers’ measures throughout the year.
Actual 13,604
Number of people cared for by clients receiving Carer Allowance
Estimate Adult—343,550
Child—140,000
The variance for Carer Allowance Adult is +9,838 and the variance for Carer Allowance Child is +4,033.
The variances can be primarily attributed to the overall growth in up‑take of the Carer Allowance and the increasing number of people eligible in respect of more than one care receiver.
Actual Adult—353,388
Child—144,033
Number of children cared for who received a Health Care Card only
Estimate 16,300 The variance is +1,604.
The variance is attributable to the growth rate being slightly higher than estimated, primarily driven by increased payment awareness and announcements of new carers’ measures throughout the year.
Actual 17,904
Child Disability Assistance PaymentThe Child Disability Assistance Payment is a $1,000 annual payment made for a care receiver aged under 16 years who attracts a payment of Carer Allowance for their carer. The payment can be used to assist families in purchasing support, aids, intervention, therapies or respite that they require for their child with disability. Importantly, the payment helps carers to purchase the form of assistance that best suits the needs of the family.
The payment is not subject to income tax, nor does it count as income for social security or family assistance purposes.
Number of children in respect of whom the Child Disability Assistance Payment is made
Estimate 139,249 The variance is +2,890.
The variance is primarily due to the growth rates being slightly higher than estimated (as per the growth observed in Carer Allowance (child)).
Actual 142,139

138 FaHCSIA Annual Report 2008–2009 Part2 Performance reporting Chapter 7 Outcome 2
Carer PaymentCarer Payment is an income support payment for people whose caring responsibilities prevent them from undertaking substantial paid employment. The payment is income and assets tested and paid at the same rate as other social security pensions.
Percentage of clients with private earnings (earned income)
Estimate 15% The variance is –4%.
The variance is attributable to the slight decrease in the proportion of Carer Payment clients of working age.
Actual 11%
Average amount of private earnings per fortnight
Estimate $570 The variance is –$57.
The variance is attributable to the slight decrease in the proportion of Carer Payment clients of working age.
Actual $513
Percentage on part-rate due to means test
Estimate 26% No variance.
Actual 26%
Number of clients receiving Carer Payment
Estimate 151,000 The variance is –4,130.
The estimate was based on the increasing growth patterns of previous years, which resulted in the anticipated growth for 2008–09 being slightly overstated.
Actual 146,870
Number of people cared for by clients receiving Carer Payment
Estimate 151,500 The variance is –4,277.
The estimate was based on the increasing growth patterns of previous years, which resulted in the anticipated growth for 2008–09 being slightly overstated.
Actual 147,223
Control of incorrect payment; and fraud: accuracy of administered outlays (total dollars correctly paid) as measured by the Random Sample Survey
Estimate Accuracy of administered outlays is greater than or equal to 95%
The ‘estimate’ is the agreed benchmark between FaHCSIA and Centrelink. The ‘actual’ figure is the estimated accuracy of administered outlays derived from Random Sample Survey data.
Actual 97.4%

139
Perf
orm
ance
repo
rtin
gPa
rt 2
Chapter 7 Outcome 2 Part2 Performance reporting FaHCSIA Annual Report 2008–2009
Support for carersSupport for Carers provides respite, information, referral and other support programs. MyTime peer support groups provide peer support for carers of children with disability.
In 2008–09, amendments were made to the guidelines for the Young Carers Respite and Information Services Program to provide more flexible and responsive services for young carers. The amendments were in line with recommendations from a program evaluation and were positively received by the sector.
Percentage of clients satisfied that the services they received were appropriate to their needs
Estimate 75% The variance is +13%.
This is a new key performance indicator. The actual percentage was higher than estimated.
Actual 88%
Percentage of clients assisted from Indigenous or CALD background
Estimate Indigenous: 2%
CALD: 14%
Indigenous—The variance is +2%.
This is a new key performance indicator. The actual percentage was higher than estimated.
CALD—The variance is –6%.
This is a new key performance indicator.
Actual Indigenous: 4%
CALD: 8%
Number of respite for young carers clients that will be assisted over the next 12 months
Estimate 750 The variance is +2,410.
The variance is due to improved reporting of the number of young carers assisted.
Actual 3,160
Number of clients that will be assisted by MyTime peer support groups over the next 12 months
Estimate 350 The variance is +2,353.
The estimate only included new parents/carers, whereas the actual figure includes all parents/carers assisted.
Actual 2,703
Number of MyTime peer support groups that will operate over the next 12 months
Estimate 200 The variance is +4.
The number of peer support groups is on target. Actual 204
Output Group 2.4Addressing youth homelessnessOutput Group 2.4 contributes to Outcome 2 by assisting youth who are homeless, or at risk of homelessness, through the provision of early intervention services. Services include counselling, group work, family mediation and practical support to both the young person and their family.

140 FaHCSIA Annual Report 2008–2009 Part2 Performance reporting Chapter 7 Outcome 2
Components of Output Group 2.4
Youth homelessnessThis administered item promotes strengthened resilience of families through improved family functioning and family connection, improved individual capacity and resilience through improved attitudes and behaviours and improved circumstances.
The Reconnect program provides support to the whole family to help break the cycle of homelessness, which can begin at an early age. Services offered by Reconnect include counselling, group work, family mediation and practical support to both the young person and their family.
Percentage of clients reporting improved relationships/contact with family, friends or peers/decreased social isolation
Estimate 70% The variance is –3%.
The variance may be attributed to a small increase in the proportion of clients who did not wish to engage with their family.
Actual 67%
Percentage of clients who reported that their individual goals were met
Estimate 70% The variance is +9%.
The variance is due to increased support for providers in using good practice principles.
Actual 79%
Percentage of young people from priority identified groups—Indigenous/CALD
Estimate Indigenous: 15%
CALD: 10%
Indigenous—The variance is +3%.
CALD—The variance is +4%.
The variances are due to increased support for providers in delivering accessible and culturally appropriate services.
Actual Indigenous: 18%
CALD: 14%
Percentage of funded service providers with an appropriate Action Research Plan to improve services
Estimate 90% The variance is +6%.
The variance is due to improved training and support, which led to more service providers understanding and using action research as part of their daily business.
Actual 96%
Number of young people assisted per year
Estimate 7,000 The variance is +6490.
The actual figure includes 6,344 young people aged 12 to 18 assisted individually and 7,146 assisted in group settings. Performance indicators in future will break down the individual and group participants.
Actual 13,490
Number of families assisted per year
Estimate 5,000 The variance is –1,116.
Services have focused on delivery of services to young people as a priority.
Actual 3,884

141
Perf
orm
ance
repo
rtin
gPa
rt 2
Chapter 7 Outcome 2 Part2 Performance reporting FaHCSIA Annual Report 2008–2009
Output Group 2.5Support for womenOutput Group 2.5 contributes to Outcome 2 by increasing opportunities for women to live free of discrimination and violence and to participate fully in the economic, social and cultural life of Australian society.
FaHCSIA ensures that women are consulted on, and have input into, emerging policy that has a major impact on them. Vulnerable women, such as those at risk of or experiencing domestic violence, are helped through awareness raising, research and prevention. Leadership programs are aimed at increasing the number of women in leadership roles in society.
Components of Output Group 2.5Support for victims of trafficking ◗
Widow B Pension ◗
Wife Pension (Age) ◗
Wife Pension (Disability Support Pension) ◗
Women’s Leadership and Development ◗
Women’s Safety Agenda ◗
Support for victims of traffickingThis administered item provides case management services to suspected trafficking victims who are able and willing to help in criminal investigations or prosecutions. Victims who have participated in the program have been predominately female, and have been trafficked into various industries, including the sex industry. The program has provided assistance to 131 people since its inception in January 2004. Support includes income assistance, access to accommodation, medical treatment, basic legal advice, counselling, training and social support.
Percentage of clients receiving services within quality standards
Estimate 90% No variance.
Actual 90%
Percentage of identified project stakeholders satisfied that the project was appropriate to the needs of the target group
Estimate 90% No variance.
Actual 90%

142 FaHCSIA Annual Report 2008–2009 Part2 Performance reporting Chapter 7 Outcome 2
Number of clients assisted (per year)
Estimate 90 clients The variance is –31.
The variance is because this program is demand driven.Actual 59 clients
Widow B PensionWidow B Pension is paid to widowed, divorced and separated women who were aged 50 years and over on 1 July 1987, and women who were aged 45 years and over on 1 July 1987, who received Sole Parent Pension (or one of its forerunners) on or after that date. The payment was closed to new entrants from 20 March 1997.
Number of people assisted
Estimate 700 The variance is –63.
The actual result is similar to the estimate. Actual 637
Percentage on part-rate due to means test
Estimate 41% The variance is +2%.
The actual result is similar to the estimate. Actual 43%
Wife Pension (Age)The Wife Pension (Age) is a payment for female partners of recipients of the Age Pension who are not eligible in their own right for the Age Pension. The payment was closed to new entrants from 1 July 1995.
Number of people assisted
Estimate 12,000 The variance is –410.
The actual result is similar to the estimate. Actual 11,590
Percentage on part-rate due to means test
Estimate 20% The variance is –3.4%.
The variance is partly attributable to people moving from part‑rate pension to full‑rate pension due to global economic downturn impacts.
Actual 16.6%
Wife Pension (Disability Support Pension)Wife Pension (Disability Support Pension) provides income support for female partners of people receiving Disability Support Pension who are not eligible for pensions in their own right. The payment was closed to new entrants from 1 July 1995. This pension is income and assets tested and paid at the same rate as other social security pensions.

143
Perf
orm
ance
repo
rtin
gPa
rt 2
Chapter 7 Outcome 2 Part2 Performance reporting FaHCSIA Annual Report 2008–2009
Number of people assisted
Estimate 16,805 The variance is –958.
The variance can be attributed to more Wife Pension (Disability Support Pension) recipients transferring to Wife Pension (Age) than anticipated.
Actual 15,847
Percentage on part-rate due to means test
Estimate 17% The variance is +10.5%.
The variance is attributable to a change in the data source used to extract this information.
Actual 27.5%
Women’s Leadership and DevelopmentThe Women’s Leadership and Development Program funds initiatives to build women’s capacity to take on leadership responsibilities; to communicate and consult with a variety of women’s groups and organisations; and to fund research into relevant women’s issues.
Percentage of funded projects that delivered the milestones agreed with FaHCSIA
Estimate 90% The variance is +10%.
The variance is due to improved administrative procedures to track and monitor milestones.
From a total of 53 projects (as at 30 June 2009):
• 16 have been completed (8 grants and 8 sponsorships)
• 17 extensions for completion later in 2009 have been negotiated
• 20 are being implemented during 2009–10.
Actual 100%
Percentage of identified project stakeholders satisfied that the project was appropriate to the needs of the target group
Estimate 90% The variance is +10%.
All 16 projects completed by the required date were positively evaluated by participants.
Actual 100%
Number of women’s leadership and development projects funded
Estimate 33 projects The variance is +20.
The variance is due to a number of applicants seeking smaller grants, which enabled more projects to be funded.
The 53 projects consist of:
• 25 grants allocated in 2007–08 for implementation in 2008–09
• 20 grants allocated in 2008–09 for implementation in 2009–10
• 8 sponsorships allocated and completed in 2008–09.
Actual 53 projects

144 FaHCSIA Annual Report 2008–2009 Part2 Performance reporting Chapter 7 Outcome 2
Women’s Safety AgendaThe Women’s Safety Agenda works to improve the circumstances of women by increasing opportunities to live free of violence and reducing the prevalence of violence against women. The agenda incorporates the Government’s election commitment to a National Plan to Reduce Violence against Women.
Percentage of funded projects that deliver the milestones agreed with FaHCSIA
Estimate 90% No variance.
Actual 90%
Number of women’s safety agenda projects funded
Estimate 12 The variance is +7
The variance is attributable to additional projects being funded, as 6 projects received under $100,000 and 1 project outcome was achieved for $20,000.
Actual 19
Percentage of identified project stakeholders satisfied the project was appropriate to the needs of the target group
Estimate 90% The variance is –5%.
The variance is a result of each project being either externally or internally evaluated as part of the conditions of the funding agreement. Three organisations did not complete an evaluation.
Actual 85%

145Chapter 8 Outcome 3 Part2 Performance reporting FaHCSIA Annual Report 2008–2009
Perf
orm
ance
repo
rtin
gPa
rt 2
Outcome 38Outcome 3 at a glanceFamilies and children have choices and opportunities
Services and assistance that help children to have the best possible start to life; promote healthy family relationships; help families adapt to changing economic and social circumstances and take an active part in the community; and assist families with the costs of children.
Contribution of outputs to Outcome 3Outcome 3 has two contributing output groups:
Key areas of focus in 2008–09FaHCSIA plays a key role in developing and implementing Australian Government policies for supporting and protecting Australian families and children. In 2008–09 this included developing a Paid Parental Leave scheme, providing direct assistance to families in response to the global financial crisis, improving services for families and children, and supporting the National Framework for Protecting Australia’s Children.
Outcome 3Families and children have choices and opportunities
Output Group 3.2Child support
Output Group 3.1Support for families

146 FaHCSIA Annual Report 2008–2009 Part2 Performance reporting Chapter 8 Outcome 3
Financial support for familiesThe Department has taken the lead role in the development of the Paid Parental Leave scheme, bringing Australia in line with other Organisation for Economic Co‑operation and Development (OECD) countries. When fully implemented in January 2011, the program will provide greater financial support to families, improve workforce attachment and promote early childhood development.
Direct assistance to familiesAs part of its response to the global economic slowdown the Government provided families with lump‑sum payments under the Economic Security Strategy. This was further supplemented in February 2009, when many families received additional bonus payments under the National Building – Economic Stimulus Plan.
Throughout 2008–09 FaHCSIA implemented new budget measures making the family payments system simpler, fairer and more sustainable in the long term.
Improving services for families and childrenThe formation of the Family Support Program was announced by Minister Macklin on 16 February 2009. The program brings together existing family, parenting and children’s services—including the Family Relationship Services Program and Communities for Children—to provide more coordinated, responsive and flexible services for families and children, particularly those at risk.
Protecting childrenFaHCSIA worked collaboratively with state and territory governments and the non‑government sector to address child protection issues by leading the development of the National Framework for Protecting Australia’s Children. The framework was endorsed by the Council of Australian Governments in April 2009.
We also worked on the development and implementation of the Child Protection Scheme of Income Management and Voluntary Income Management.
New child support formulaThe Department completed implementation of Stage 3 of the child support reforms. Under this final stage of the reforms, parts of Family Assistance were changed to better balance the interests of both parents and be more focused on the needs and costs of children. Since 1 July 2008 all child support payments have been reassessed against a new child support formula.

147
Perf
orm
ance
repo
rtin
gPa
rt 2
Chapter 8 Outcome 3 Part2 Performance reporting FaHCSIA Annual Report 2008–2009
Outcome 3 performance reportThis section outlines the specific achievements that contributed towards achieving FaHCSIA’s goals for Outcome 3, as well as the challenges we encountered along the way. It also reports on the Department’s performance against the measures set out in our 2008–09 Portfolio Budget Statements and related Budget documents.
Achievements contributing to Outcome 3 in 2008–09Support for familiesThe Department supports and assists families by developing and implementing policies and programs including family payments, parenting support and family relationship services. FaHCSIA works in partnership with state and territory governments and Indigenous communities to develop and implement appropriate services and solutions to address violence in their communities.
FaHCSIA’s key achievements in 2008–09 for supporting families are outlined below.
Paid Parental Leave scheme
The Government‑funded Paid Parental Leave scheme, announced in May 2009, will have a number of significant benefits and is designed to minimise the impact on employers, particularly small businesses. The scheme will have the following key features:
Eligibility will be based on being engaged continuously in the workforce for at least 10 of ◗
the 13 months prior to the expected birth or adoption of the child and having undertaken at least 330 hours of paid work in the 10‑month period (an average of around one day of paid work a week).
An eligible person will receive taxable Paid Parental Leave payments at the level of the ◗
Federal Minimum Wage, currently $543.78 a week, for a maximum period of 18 weeks.
In most cases, the person will receive the payment through their employer. ◗
An income test of $150,000 will apply based on the primary carer’s adjusted taxable ◗
income in the previous financial year.
Paid Parental Leave will cover employees, including casual workers, as well as ◗
contractors and the self‑employed, subject to meeting work test requirements.
National Framework for Protecting Australia’s Children
Over the last 18 months, the Australian Government has led the development of the first National Framework for Protecting Australia’s Children in partnership with state and territory governments and the non‑government sector.

148 FaHCSIA Annual Report 2008–2009 Part2 Performance reporting
On 30 April 2009, the national framework was endorsed by the Council of Australian Government (COAG). The framework represents an unprecedented level of collaboration that has enabled an ambitious, long‑term national approach to ensuring the safety and wellbeing of Australian children.
Support for families through payments
The Government directed bonus payments to families in the two stimulus packages that were implemented by the Department during the year.
Around 2 million families with eligible dependent children received $3.6 billion as part of the Economic Security Strategy announced in October 2008. A lump sum of $1,000 was paid in December 2008 for each dependent child attracting Family Tax Benefit (FTB) Part A, Youth Allowance, ABSTUDY or an education allowance from the Department of Veterans’ Affairs payment on 14 October 2008.
Families were paid another $3.7 billion in bonus payments under the Nation Building – Economic Stimulus Plan announced in February 2009. In March 2009, families eligible for FTB Part A received a $950 Back to School Bonus for each child aged 4 to 18 years. In addition, full‑time dependent students received a Training and Learning Bonus of $950 if their families received FTB Part A for them. Families receiving FTB Part B also received a Single Income Family Bonus of $900.
The Department implemented a number of 2008–09 Budget measures to ensure the family payments system was made simpler and fairer for families. In the 2008–09 Budget, changes were made to improve targeting of the Family Tax Benefit and the Baby Bonus. A $150,000 income limit on primary earner income for FTB Part B was introduced on 1 July 2008. A family income test for the Baby Bonus was introduced on 1 January 2009 to better target the payment. For babies born on or after 1 January 2009, the Baby Bonus is paid fortnightly over 26 weeks rather than as a lump sum to provide more effective support for families caring for newborns, or adopted children up to the age of 16 years.
Since 1 January 2009, the Maternity Immunisation Allowance has been paid in two separate amounts, instead of one lump sum, to provide an incentive for parents to have their children vaccinated before the age of two years and again before starting school. The payment was extended to adopted children who arrive in Australia before turning 16 years of age.
Family Support Program
The formation of the Family Support Program was announced by Minister Macklin on 16 February 2009. Through more coordinated, responsive and flexible service delivery, the program seeks to enable services to better focus on the needs of families and children, particularly those at risk. The Family Support Program brings together nine existing family, parenting and children’s services—including the Family Relationship Services Program

149
Cas
e st
udy
Chapter 8 Outcome 3 Part2 Performance reporting FaHCSIA Annual Report 2008–2009
Perf
orm
ance
repo
rtin
gPa
rt 2
Communities for Children—BroadmeadowsThe Communities for Children program takes a place‑based early intervention and prevention approach to child development and support. The program works with communities to build their capacity to deliver services locally and solve local issues.
Funding is provided for local early childhood initiatives in 45 disadvantaged communities across Australia. Broadmeadows Communities for Children covers six suburbs in the city of Hume. It offers a wide range of activities to help children, parents and families develop a sense of belonging and support in their local communities.
The following quotes are from parents who participated in ‘Bilingual Storytime in the Community’. This is an activity that aims to engage families from culturally and linguistically diverse backgrounds in literacy and language activities, and encourage parents who may not speak English to participate in sharing books and songs with their children.
‘I have learned how to help my son at home. I sing the songs with him and I read stories at home. He learns some words—animals’ names and about animals. He learns about new things that I have not thought to talk to him about.’
‘What happens here I can do at home. I now know that it helps to talk and play with my son.’
Photo above: Bilingual Storytime at Broadmeadows

150 FaHCSIA Annual Report 2008–2009 Part2 Performance reporting Chapter 8 Outcome 3
and Communities for Children—under one umbrella program. The full transition to the new model will take place over the next two years.
The Department released a discussion paper outlining the program principles and operating priorities and held consultations with service providers, states and territories and other interested parties during the first half of 2009.
On 1 July 2009, a machinery of government change came into effect which saw responsibility for all operational aspects of the Family Relationship Services program becoming the responsibility of FaHCSIA. The Attorney‑General’s Department retained responsibility for family law policy.
Family Relationship Services
The Department provided funding through the Family Relationship Services program, to Family Relationship Services Australia to host its inaugural national conference, ‘Collective Wisdom: together we are better’, in November 2008. The conference brought together more than 315 delegates from the family relationship sector and government to network, share knowledge and discuss future challenges and responses.
Family violence projects
In 2008–09, the Department funded 47 projects under the Family Violence Partnership Program. The program works to address Indigenous family violence and child abuse in partnership with state and territory governments.
The Kids Living Safer Lives project won the award for the most exceptional innovative Indigenous project at the 2009 Queensland Domestic and Family Violence Prevention Awards.
Child supportIn collaboration with the Child Support Agency, Centrelink and the Department of Human Services, the Department completed implementation of Stage 3 of the child support reforms. In this final stage of the reforms, the Child Support Scheme and parts of Family Assistance were changed to better balance the interests of both parents and be more focused on the needs and costs of children. Since 1 July 2008 all child support payments have been reassessed against a new child support formula.
Changes were also made to the way child support agreements work and the way child support and family assistance work when parents share care.

151
Cas
e st
udy
Chapter 8 Outcome 3 Part2 Performance reporting FaHCSIA Annual Report 2008–2009
Perf
orm
ance
repo
rtin
gPa
rt 2
Port Augusta Family Relationship CentreThe Port Augusta Family Relationship Centre operates an Indigenous outreach service that assists Indigenous people in the far north and west of South Australia to access Family Relationship Centres and other services. The service model includes one male and one female Aboriginal staff member who support each other in their roles.
The male officer focuses on promotion of the service and the concepts, using his community links and particularly his profile with men and elders throughout the region. This officer has a visiting program across the centre’s outreach sites and the far north region. The female officer has a background in community development and excellent knowledge of Aboriginal culture and is qualified to provide mediation services. The fact that this officer is not from the local families or community helps to ensure acceptance and success of the mediation.
Outcomes of the Port Augusta Indigenous services outreach include:
promoting the role with the Federal Magistrate ◗
establishing links with the Women’s Legal Service ◗
working with the Alice Springs Family Relationship Centre circuit ◗
achieving high‑profile support for NAIDOC celebrations ◗
liaising with the Aboriginal Legal Rights Movement on the safe house being ◗
established in Coober Pedy for transient families
implementing a video‑conferencing system to provide another option for ◗
remote services.
Photo above: Family Relationship Centre and Aboriginal Family Support Service staff.

152 FaHCSIA Annual Report 2008–2009 Part2 Performance reporting Chapter 8 Outcome 3
Challenges in 2008–09This section describes some of the challenges the Department met when delivering Outcome 3 initiatives and how we worked to overcome them.
National Framework for Protecting Australia’s ChildrenIn 2008–09 the Department worked on the development of the National Framework for Protecting Australia’s Children. A key challenge was to ensure the framework accurately reflected the breadth of issues and took into consideration the work already being undertaken to protect Australia’s children. It was critical that the actions outlined in the framework were evidence‑based and had the support of all stakeholders. To ensure this, the Department undertook an extensive consultation process, talking to a wide range of Commonwealth agencies, state and territory governments and organisations in the non‑government sector.
Family violence projectsDeveloping and implementing projects that address Indigenous family violence and child abuse continue to pose logistical challenges. The Department analysed the projects under the Family Violence Partnership Program and Family Violence Regional Activities Program that were most successful in addressing violence and abuse in Indigenous communities. We found that the most effective projects were those that are generated at the local level, engage with the community, are staffed with Indigenous people, involve men and empower women. We are working to ensure these features are included in future projects.
Family Relationship ServicesThe need to reduce the administrative reporting burden on community sector‑funded organisations represents a significant challenge for the Department and for organisations themselves. In 2008–09 FaHCSIA reviewed the reporting obligations specified in the Family Relationship Services funding agreement schedule and significantly reduced the reporting requirements for organisations under any future or extended funding agreements.
Family Support ProgramThe changing family environment presents a challenge for governments across Australia and for the Department. Australian families and children today face a range of complex and interrelated issues that require an integrated and flexible service response. An increasing number of families and children present with multiple and complex needs.
Fragmented services for children, parents and families are confusing and difficult to navigate, do not always respond well to complex issues, and create significant administrative burdens for service providers.

153
Cas
e st
udy
Chapter 8 Outcome 3 Part2 Performance reporting FaHCSIA Annual Report 2008–2009
Perf
orm
ance
repo
rtin
gPa
rt 2
Ngaanyatjarra Pitjantjatjara Yankunytjatjara Cross Border ProjectThe Ngaanyatjarra Pitjantjatjara Yankunytjatjara Cross Border Project (funded through FaHCSIA’s Family Violence Partnership Program) has received peer recognition because of its success in reducing the re‑offending rate among participants.*
Based in Alice Springs, the program operates in Central Australia across the Anangu Pitjantjatjara Yankunytjatjara Lands, and covers 500,000 square kilometres and 24 communities and services a population of 6,500.
The project works in partnership with the South Australian, West Australian and Northern Territory Governments and FaHCSIA to reduce the incidence of physical and psychological harm in Aboriginal communities of Central Australia. It develops and delivers culturally and linguistically appropriate programs to address issues of family violence, anger management and substance misuse.
The Cross Border Family Violence Program has been recognised in National awards such as:
The Probation and Community Corrections Officers’ Association award in 2008. ◗
The awards recognise exceptional achievement among staff and seek to ensure that outstanding performers share best practice ideas with their peers.
The John Augustus Award in the organisational award category for ‘outstanding ◗
achievement in caring for victims’, ‘outstanding contribution in working with offenders’, ‘outstanding contribution to engaging local communities’, ‘outstanding commitment to diversity’, and ‘partnership of the year: best example of joint working across the criminal justice system’.
A special individual award was presented to Mr Lange Powell, former director ◗
of community corrections for the South Australian Department for Correctional Services, who was instrumental in establishing the program.
In 2008–09, the Department funded 32 projects under the Family Violence ◗
Regional Activities Program, which supports community‑driven projects that respond to family violence and promote child safety and wellbeing and safer communities.
* Project participants are Indigenous men charged with family violence offences. They are drawn from courts, police and other service referrals. More than 70 per cent of participants do not re‑offend.

154 FaHCSIA Annual Report 2008–2009 Part2 Performance reporting Chapter 8 Outcome 3
In 2008–09 the Minister announced the establishment of the Family Support Program— a significant initiative designed to overcome these challenges. The program brings together a range of existing services under a single umbrella, providing an opportunity to remove service and policy silos and facilitate greater links across the service system.
2008–09 Budget measuresResponsible Economic Management—Better targeting and delivery of Baby BonusDuring 2008–09, the Department implemented a number of reforms to the Baby Bonus. Since 1 January 2009, the family income test limits eligibility to families with an adjusted taxable income of $75,000 or less in the six‑month period following the birth of a child, or the date a child enters the care of a long‑term carer. Eligibility for the Baby Bonus has been extended to parents who adopt children under 16 years of age (this was previously less than two years of age), regardless of whether the payment was made previously for the child.
Families are now paid their Baby Bonus in 13 fortnightly instalments from the date of claim. This provides families with ongoing support over a six‑month period to help manage the costs of a new child. The claim period was also extended to 52 weeks, to allow families more time to access the payment.
In another measure implemented during 2008–09, indexation of the Baby Bonus to the Consumer Price Index now occurs annually on 1 July, in line with other family payments.
Migration Program—Additional 6000 skilled stream places for 2007–08The Government announced changes to the 2007–08 Migration Program, increasing the skill stream component by 6,000 to a total of 108,000 places. All permanent migrants who come to Australia are subject to a Newly Arrived Residents Waiting Period, or qualifying residence period, which precludes them from accessing most income support payments for a two‑year period after arrival in Australia. Despite this restriction, these migrants can receive family assistance payments immediately on arrival in Australia to assist with work and family responsibilities.
Responsible Economic Management—Better targeting and delivery of Family Tax Benefit—$150,000 income test on primary earner for FTB-BFrom 1 July 2008, a primary earner income test of $150,000 was applied for FTB Part B. This measure provides a more targeted system of family assistance, ensuring that assistance is directed to those families who need it most.

155
Cas
e st
udy
Chapter 8 Outcome 3 Part2 Performance reporting FaHCSIA Annual Report 2008–2009
Perf
orm
ance
repo
rtin
gPa
rt 2
Family Relationship Services for Humanitarian EntrantsFamily Relationship Services for Humanitarian Entrants are free services designed specifically for families who have entered Australia under the Humanitarian Entry Program. FaHCSIA currently provides funding to six service providers to deliver services in four states in a number of high‑need areas that have been determined by the Department of Immigration and Citizenship using settlement data on humanitarian entrant populations.
Service providers like the South Eastern Region Migrant Resource Centre develop and deliver culturally appropriate family relationship services to assist people to work through a range of issues from changed expectations in a new cultural setting through to family violence.
The centre has found that the biggest challenge for the counsellor is to be mindful of the client’s culture and view of the world and be able to discuss realistic choices without devaluing cultural beliefs. Sound knowledge and an holistic approach that includes practical support coupled with counselling is particularly effective when working with refugees. Many face a range of practical challenges and have trouble navigating complex systems independently.
For example, the centre’s Family Counsellor conducted home visits to an Afghani woman and her child who was experiencing family violence. The counsellor helped her to navigate the child protection and family law systems and provided extensive practical support to the family, including increasing the woman’s capacity to manage money, helping her to apply for citizenship and an Australian passport, and linking her with English classes and a women’s only gym. The woman slowly began to widen her scope of trust in people because she was able to build trust with her counsellor. Her increased confidence enabled her to make positive choices for her future.

156 FaHCSIA Annual Report 2008–2009 Part2 Performance reporting Chapter 8 Outcome 3
Responsible Economic Management—Better targeting and delivery of Family Tax Benefit—continuous adjustment to reduce over-payments of Family Tax BenefitSince 1 July 2009, customers who notify the Family Assistance Office of a change in income automatically have their rate of FTB adjusted. This assists parents to avoid overpayments of FTB at reconciliation.
Responsible Economic Management—Better targeting and delivery of Family Tax Benefit—streamlining administrationTo simplify administration and reduce duplication, FTB is no longer paid through the Australian Taxation Office. The option to receive FTB as reduced Pay As You Go (PAYG) deductions ceased being available from 1 July 2008.
Lump‑sum FTB claims, end‑of‑year top‑ups and FTB fortnightly instalments continue to be available through Centrelink and Medicare. Adjusted taxable income will continue to be used for Family Assistance income testing and the FTB reconciliation process. Tax refunds will continue to be available to offset FTB debts (and vice versa). Information will still be exchanged between the Australian Taxation Office and Centrelink to support those processes.
Maternity Immunisation Allowance—eligibility changeSince 1 January 2009, parents and carers have received the Maternity Immunisation Allowance in two separate amounts. The first amount is paid between the ages of 18 months and 24 months for children who meet the immunisation requirements for an 18‑month‑old, or have an approved exemption. The second amount is paid between the ages of 4 and 5 years, for children who meet the immunisation requirements for a 4‑year‑old, or who have an approved exemption.
Also from 1 January 2009, the payment of the allowance was extended to cover children adopted from outside Australia who arrive in Australia before the age of 16 years. This encourages parents to have their children immunised to the appropriate level required in Australia, and so maintain high levels of immunity against common diseases in the community.
Responsible Economic Management—Family Tax Benefit—cease fortnightly payments for recipients who do not lodge tax returnsFrom 1 July 2009, families who fail to lodge tax returns within a certain period may lose access to fortnightly FTB payments until their entitlements are properly reconciled.

157
Perf
orm
ance
repo
rtin
gPa
rt 2
Chapter 8 Outcome 3 Part2 Performance reporting FaHCSIA Annual Report 2008–2009
This measure encourages families to lodge their tax returns or advise they are not required to lodge tax returns, so their payments can be reconciled to ensure they receive the correct amounts and do not lose any top‑up payments and end‑of‑year supplements.
National Framework for Protecting Australia’s ChildrenIn 2008–09 the Department worked on the development of the National Framework for Protecting Australia’s Children to address the increasing rate of notification and substantiation of physical, sexual and emotional abuse and neglect of Australia’s children.
Closing the Gap—Northern Territory—family support packageThis measure also applies to Outcome 1. See page 70 for details on this measure.
Welfare Payments Reform—child protection pilot and school attendance and enrolment pilotIn 2008–09, the Department worked on the development and implementation of the Child Protection Scheme of Income Management (CPSIM) and Voluntary Income Management (VIM). CPSIM and VIM aim to encourage socially responsible behaviour and to enhance the wellbeing of children.
On 24 November 2008, VIM and CPSIM were introduced in the Cannington district of Perth and the Kimberley region of Western Australia.
Under CPSIM, Western Australia’s Department of Child Protection can refer a person to Centrelink for income management where the improper use of existing financial resources wholly or partially contributes to child protection issues.
VIM allows people to volunteer for income management if they feel it would assist them to better meet their financial responsibilities, or contribute to the wellbeing of their children or children in their community.
At 19 June 2009, there were almost 200 CPSIM and VIM customers. Some of the major challenges in implementing CPSIM and VIM have involved developing robust referral models and servicing customers in very remote areas of the Kimberley region.
In 2008–09, the Department assisted the Department of Education, Employment and Workplace Relations in implementing and coordinating the School Enrolment and Attendance Measure.
This measure also applies to Outcome 4.
Migration Program—37,500 place increase for 2008–09This measure also applies to Outcome 2. See page 117 for details on this measure.

158 FaHCSIA Annual Report 2008–2009 Part2 Performance reporting Chapter 8 Outcome 3
Humanitarian migration program—additional 500 places for Iraqis in 2008–09This measure also applies to Outcome 2. See page 117 for details on this measure.
Humanitarian migration program—additional 750 Special Humanitarian Program places from 2009–10This measure also applies to Outcome 2. See page 118 for details on this measure.
Centrelink Call Centre Supplementation—ContinuationThis measure is reported in Centrelink’s annual report under Call Centre Performance.
This measure also applies to Outcome 2.
Means-testing of government support—expanded definitions of income to include net losses from investmentsThis measure also applies to Outcome 2. See page 118 for details on this measure.
Means-testing of government support—expanded definitions of income to include certain ‘salary sacrificed’ contributions to superannuationThis measure also applies to Outcome 2. See page 118 for details on this measure.
Visa places for Iraqi locally engaged employeesThis measure also applies to Outcome 2. See page 118 for details on this measure.
Removal of differential treatment of same-sex couples and their children—law reformThis measure also applies to Outcome 2 and 4. See page 119 for details on this measure.
2008–09 Portfolio Additional EstimatesRetention of the current fringe benefits tax treatment for family assistance customersThe Government decided not to proceed with this component of a measure announced by the previous government in the 2006–07 Budget, which was due to be implemented on 1 July 2008. This component would have changed the way fringe benefits are assessed for the purpose of calculating adjusted taxable income to determine eligibility for personal benefit payments (such as Family Tax Benefit).

159
Perf
orm
ance
repo
rtin
gPa
rt 2
Chapter 8 Outcome 3 Part2 Performance reporting FaHCSIA Annual Report 2008–2009
Implementation of Operation SunlightThe Department is affected by the delivery of this measure, which is led by the Department of Finance and Deregulation. This measure also applies to Outcomes 1, 2 and 4. See pages 70–71 for details on this measure.
2008–09 Portfolio Supplementary Estimates StatementsEconomic Security Strategy—one-off lump sum payment of $1,000 per child to low and middle income familiesFamilies received a payment of $1,000 for each eligible child. Recipients included families eligible to receive Family Tax Benefit Part A on 14 October 2008, and families of dependent children receiving Youth Allowance, Abstudy or an education allowance under the Veterans’ Children Education Scheme or the Military Rehabilitation and Compensation Act 2004 Education and Training Scheme on that date.
Economic Security Strategy—public information campaignThis measure also applies to Outcomes 2 and 4. See page 120 for details on this measure.
2008–09 Portfolio Supplementary Additional Estimates StatementsNation Building and Jobs Plan—Training and Learning Bonus and Education Entry Payment SupplementThis measure also applies to Outcome 2. See page 121 for details on this measure.
Nation Building and Jobs Plan—Back to School Bonus—One-off Lump Sum Payment of $950 per FTB A Eligible ChildThis measure also applies to Outcome 2. See page 121 for details on this measure.
Nation Building and Jobs Plan—Single Income Family Bonus—One-off Lump Sum Payment of $950 per FTB B FamilyFamilies eligible for Family Tax Benefit Part B on 3 February 2009 received a Single Income Family Bonus of $900 per family. The value of the bonus was reduced from an initial amount of $950 to $900 due to a Government amendment. Savings from the amendment were directed to other priorities in the context of the Nation Building and Jobs Plan.

160 FaHCSIA Annual Report 2008–2009 Part2 Performance reporting Chapter 8 Outcome 3
Portfolio Supplementary Additional Estimates Statements No. 2Implementation of National Building and Jobs Plan—Single Income Family BonusDepartmental funding was received to develop and implement the bonus payment, in conjunction with Centrelink.
Implementation of National Building and Jobs Plan—Back to School BonusDepartmental funding was received to develop and implement the bonus payment, in conjunction with Centrelink.
Results for key performance indicatorsThis section outlines, by output group, how the Department performed against the key performance indicators set out in the 2008–09 Portfolio Budget Statements and related Budget documents. Where relevant, achievement against key performance indicators is summarised in tables that provide estimated and actual results for targets set out in the FaHCSIA 2008–09 Portfolio Budget Statements.
Contributions to Outcome 3
Output Group 3.1Support for familiesOutput Group 3.1 contributes to Outcome 3 by promoting healthy family relationships and helping children have the best possible start to life.
Components of Output Group 3.1Baby Bonus ◗
Double Orphan Pension ◗
Family Relationships ◗
Family Violence Partnership –
Northern Territory Emergency Response—supporting families –
Services for Families –
Services for Families with Children –

161
Perf
orm
ance
repo
rtin
gPa
rt 2
Chapter 8 Outcome 3 Part2 Performance reporting FaHCSIA Annual Report 2008–2009
Family Tax Benefit ◗
Family Tax Benefit Part A –
Family Tax Benefit Part B –
Maternity Immunisation Allowance ◗
National Framework for Protecting Australia’s Children ◗
Income Management Child Protection Scheme—WA –
Parenting ◗
Baby BonusThe Baby Bonus recognises the extra costs associated with the birth or adoption of a child, including the loss of income while on unpaid maternity leave. For births or adoptions occurring before 1 January 2009, Baby Bonus was not income tested, and was generally paid as a lump sum of $5,000.
From 1 January 2009, the Baby Bonus has been income tested and paid in 13 fortnightly instalments. The payment has also been extended to parents who adopt a child up to the age of 16 years (previously two years).
Number of children in respect of whom Baby Bonus is paid
Estimate 285,000 The variance is –2,000.
The variance reflects a lower demand for the program than estimated.
Actual 283,000
Number of families granted Baby Bonus
Estimate 281,000 The variance is –3,000.
The variance reflects a lower demand for the program than estimated.
Actual 278,000
Number of adopted children in respect of whom Baby Bonus is paid
Estimate 330 The variance is –80.
The variance reflects a lower demand for the program than estimated.
Actual 250
Double Orphan PensionThe Double Orphan Pension provides non‑means‑tested financial assistance to guardians or approved care organisations to help meet the costs of caring for children who are double orphans. A double orphan is a child whose parents or adoptive parents have died, or who has one parent deceased and whose other parent is not available for their child for reasons such as the parent being in prison for at least 10 years or because their whereabouts are unknown.

162 FaHCSIA Annual Report 2008–2009 Part2 Performance reporting Chapter 8 Outcome 3
Number of children in respect of whom Double Orphan Pension is paid
Estimate 1,900 children The variance is +100.
The actual result was similar to the estimate.Actual 2,000 children
Number of families receiving Double Orphan Pension
Estimate 1,400 families No variance.
Actual 1,400 families
Family RelationshipsThe Government provides funding to support all Australian families to have healthy, resilient relationships through times of family change and stress. Services funded under the Family Relationships appropriation provide support such as counselling, education and skills acquisition, information, referral and assessment appropriate to the needs of individual families. These services incorporate special circumstances programs such as drought counselling. Sub‑programs include the Family Relationships Services program (FRSP), National Illicit Drugs Strategy (NIDS), Family Violence Partnership Program (FVPP), and Family Violence Regional Activities Program (FVRAP).
Percentage of FRSP clients recording improvement in their presenting relationships
Estimate 80% The variance is +18.45%.
The actual result is similar to the 2007–08 result (98%).Actual 98.45%
Percentage of FRSP clients from priority identified groups—Indigenous/CALD/children/men
Estimate Indigenous: 5%
CALD: 20%
Children: 20%
Men: 45%
The variance for registered Indigenous clients was –1.3%. The variance for registered CALD clients was –11.8% lower than target.
The variance for registered children was –10%.
The variance for registered clients attending services for men was +1.8%.
Actual Indigenous: 3.7%
CALD: 8.2%
Children: 10%
Men: 46.8%
Percentage of service providers (FRSP/NIDS) who fully meet accreditation requirements or relevant industry standards for service management and governance
Estimate 90% No variance.
Actual 90%

163
Perf
orm
ance
repo
rtin
gPa
rt 2
Chapter 8 Outcome 3 Part2 Performance reporting FaHCSIA Annual Report 2008–2009
Number of clients assisted per year—early intervention services (FRSP/NIDS)
Estimate 180,000 The variance is –7198.
The figure for EIS (early intervention services) includes client numbers for EIS and 50% of the counselling clients (the others are reported by Attorney‑General’s Department). (Data for 2008–09 as at 30 July 2009.)
The figure for the NIDS program is a full‑year estimate based on the data available for the first 6 months of the financial year. The full‑year data is not yet available due to the different reporting methods of providers.
Actual 157,643 (EIS)
15,159 (NIDS)
Number of Indigenous communities assisted per year through funding for Indigenous Family Violence projects
Estimate 40 No variance.
In 2008–09, 79 projects were funded through the family violence programs in at least 40 Indigenous communities.
Actual 40
Family Tax BenefitFamily Tax Benefit (FTB) is designed to help families with the cost of raising dependent children. FTB consists of two parts—Part A and Part B. Part A is paid for each child and is assessed on the combined income of a family. Part B provides extra help for those families with one main income of $150,000 or less a year (including single parents).
Number of instalment recipients of FTB Part A maximum rate (with and without income support), broken rate, base rate, and below base rate
Estimate Eligible customers will be paid:
FTB Part A maximum rate
– With income support: 414,000 families
– Without income support: 191,000 families
– Broken rate: 502,000 families
– Base rate: 503,000 families
– Below base rate: 94,000 families
The variances are –6,000 for FTB Part A maximum rate with income support, +3,000 for maximum rate without income support, +37,000 for broken rate customers, +16,000 for base rate customers and +19, 000 for below base rate customers.
These variations are consistent with the economic downturn, which resulted in existing customers having lower income estimates and new customers, who were previously ineligible due to higher incomes, coming on to the payment. Economic stimulus measures introduced by the Government also resulted in customers migrating from lump‑sum payments to fortnightly instalments so they could receive their stimulus payments earlier.
Actual Eligible customers will be paid:
FTB Part A maximum rate
– With income support: 408,000 families
– Without income support: 194,000 families
– Broken rate: 539,000 families
– Base rate: 519,000 families
– Below base rate: 113,000 families

164 FaHCSIA Annual Report 2008–2009 Part2 Performance reporting Chapter 8 Outcome 3
FTB Part A with Rent Assistance, Multiple Birth Allowance, and Large Family Supplement
Estimate FTB Part A with RA: 374,000 families
FTB Part A with Multiple Birth Allowance: 950 families
FTB Part A with Large Family Supplement: 366,000 families
The variances are +24,000 FTB Part A Rent Assistance recipients, no variance for FTB Part A Multiple Birth Allowance recipients and +1,000 for Large Family Supplement recipients.
The increase in the number of FTB Part A families with Rent Assistance may be attributable to the economic downturn.
Actual FTB Part A with RA: 398,000 families
FTB Part A with Multiple Birth Allowance: 950 families
FTB Part A with Large Family Supplement: 367,000 families
Number of instalment recipients of FTB Part B maximum rate for sole parents and couples and broken rate for couples
Estimate FTB Part B maximum rate—sole parents: 567,000 families
FTB Part B maximum rate—couples: 313,000 families
FTB Part B broken rate—couples: 416,000 families
The variances are +25,000, +12,000 and +33,000 for FTB Part B sole parents, couples and broken rate recipients respectively.
These variances are consistent with lower customer income estimates due to the economic downturn.
Actual FTB Part B maximum rate—sole parents: 592,000 families
FTB Part B maximum rate—couples: 325,000 families
FTB Part B broken rate—couples: 449,000 families
Number of families entitled to Family Tax Benefit (FTB) who claim and receive their entitlement within the three-year period allowed for their claim
Estimate Approximately 2.2 million families
The variance is –100,000.
An improved methodology enabled a better count of families entitled to payment on reconciliation.
Actual 2.1 million families
Proportion of customers obtaining a debt following reconciliation
Estimate Less than 8% Data is not yet available to report on the outcomes for 2008–09. The actual relates to the 2006–07 entitlement year which is the most recent year for which the three year claim period has elapsed.
Actual 8%
Control of incorrect payment and fraud—accuracy of administered outlays (total dollars correctly paid) as measured by the Random Sample Survey
Estimate Accuracy of administered outlays is greater than or equal to 95%
The estimate is the agreed benchmark between FaHCSIA and Centrelink. The actual figure is the estimated accuracy of administered outlays derived from Random Sample Survey data.
Actual 98.7%

165
Perf
orm
ance
repo
rtin
gPa
rt 2
Chapter 8 Outcome 3 Part2 Performance reporting FaHCSIA Annual Report 2008–2009
Maternity Immunisation AllowanceMaternity Immunisation Allowance (MIA) is a payment designed to ensure that Australian‑born children are fully immunised before commencing school and overseas adopted children under the age of 16 years catch up with the immunisations recommended for all Australian children. From 1 January 2009, MIA has generally been paid in two separate amounts between 18–24 months and 4–5 years, instead of in one lump sum. This is designed to boost immunisation rates as children reach school age.
Number of children in respect of whom Maternity Immunisation Allowance is paid
Estimate 275,000 children No variance.
The total differs from the sum of the components due to rounding.
Actual First instalment: 134,000 children
Second instalment: 140,000 children
Total: 275,000 children
Number of families receiving Maternity Immunisation Allowance
Estimate 268,000 families The variance is +1,000
The actual result is similar to the estimate.
The total differs from the sum of the components due to rounding.
Actual First instalment: 132,000 families
Second instalment: 138,000 families
Total—269,000
National Framework for Protecting Australia’s ChildrenIn 2008–09 the Department worked on the development of the National Framework for Protecting Australia’s Children to address the rate of notifications and substantiations of physical, sexual and emotional abuse and neglect of Australia’s children.
The Government, state and territory governments and community sectors agree shape of framework
Estimate The National Framework for Protecting Australia’s Children is developed and agreed
No variance.
Actual The National Framework for Protecting Australia’s Children was developed, and was agreed by the Council of Australian Governments on 30 April 2009

166 FaHCSIA Annual Report 2008–2009 Part2 Performance reporting Chapter 8 Outcome 3
The Government, state and territory governments and community sectors work together to commence implementation
Estimate Implementation of the National Framework for Protecting Australia’s Children commenced
No variance.
Actual Implementation of the National Framework for Protecting Australia’s Children has commenced
Parenting1
The Parenting program monitors the responsiveness of child and parent support services and their contribution to improving parenting knowledge and skills.
Percentage of clients participating in FaHCSIA-funded child/parent support services that are satisfied that the service they received met their needs
Estimate 80% No variance.
Actual 80%
Percentage of clients participating in FaHCSIA-funded child/parent support services with increased knowledge and skills needed to improve their circumstances
Estimate 70% No variance.
Actual 70%
Number of Indigenous communities directly assisted per year
Estimate 75 The variance is –14.
Actual 612
Percentage of communities that met program-specific goals that communities set when they commenced receiving assistance
Estimate 100% The variance is –11%.
This estimate was based on the Communities for Children Program. Most of the Communities for Children services met all of the communities’ expectations with a small minority of services meeting many but not all of the expectations.
Actual 89%
Percentage of clients satisfied that national resources met their needs
Estimate 70% The variance is +24.6%.
Satisfaction of services exceeded targets. The estimate and actual were based on online surveys for the Raising Children website, which asked about usefulness, understandability, relevance, access and confidence.
Actual 94.6%

167
Perf
orm
ance
repo
rtin
gPa
rt 2
Chapter 8 Outcome 3 Part2 Performance reporting FaHCSIA Annual Report 2008–2009
Percentage of service providers with work plans that link identified needs to evidence-based children and parenting support strategies
Estimate 100% No variance.
The estimate and actual were based on the Communities for Children program.
Actual 100%
Number of service sites funded by FaHCSIA implementing FaHCSIA-funded child/parent support activities
Estimate 8,360 The variance is +44.
The vast majority of these services are community playgroups which are driven by community demand. The slight variance is due to an increase in demand.
Actual 8,404
1. These indicators have been difficult to apply to all parenting programs and a new set of indicators are being applied in the 2009–10 year.
2. The Indigenous Parenting Support Services were not delivered as planned for 2008–09, however these services have been announced in 2009–10.
Output Group 3.2Child supportOutput Group 3.2 contributes to Outcome 3 by helping families adapt to changing economic and social circumstances and take an active part in the community, and by providing services and assistance that help families with the costs of children.
Under this output group, FaHCSIA promotes parental responsibility for the care and financial support of children in separated families. We also undertake research and policy development in relation to child support. Finally, we develop partnerships with and across different levels of government for provision of services that assist in the payment of child support.
Components of Output Group 3.2
Policy Services and Program Management
FaHCSIA oversees and reports to the Government on the impacts of the Child Support Scheme reforms. On 1 July 2008 we introduced a key element of the reforms—a new administrative formula by which child support liabilities are determined. The new formula is based on recent Australian research on the costs of children. It treats both parents’ incomes in the same way, better recognises the costs of contact and shared care, and treats children from first and subsequent families equally.
In 2008–09, the Department’s focus for the child support reforms has been on: managing issues arising from the implementation of the reforms; helping families, parents and other stakeholders understand the reforms; and monitoring and evaluating the reforms.
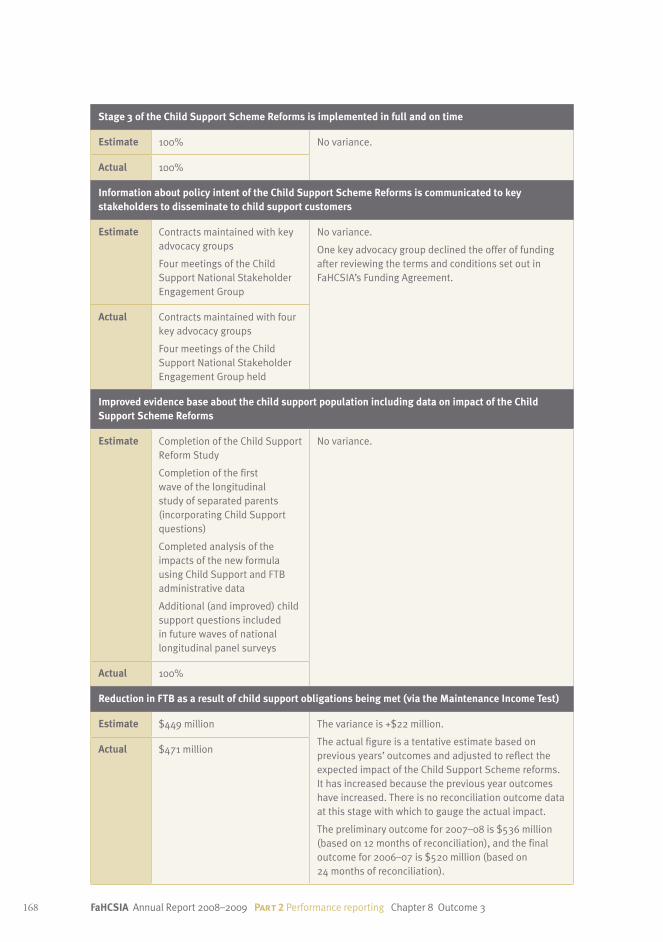
168 FaHCSIA Annual Report 2008–2009 Part2 Performance reporting Chapter 8 Outcome 3
Stage 3 of the Child Support Scheme Reforms is implemented in full and on time
Estimate 100% No variance.
Actual 100%
Information about policy intent of the Child Support Scheme Reforms is communicated to key stakeholders to disseminate to child support customers
Estimate Contracts maintained with key advocacy groups
Four meetings of the Child Support National Stakeholder Engagement Group
No variance.
One key advocacy group declined the offer of funding after reviewing the terms and conditions set out in FaHCSIA’s Funding Agreement.
Actual Contracts maintained with four key advocacy groups
Four meetings of the Child Support National Stakeholder Engagement Group held
Improved evidence base about the child support population including data on impact of the Child Support Scheme Reforms
Estimate Completion of the Child Support Reform Study
Completion of the first wave of the longitudinal study of separated parents (incorporating Child Support questions)
Completed analysis of the impacts of the new formula using Child Support and FTB administrative data
Additional (and improved) child support questions included in future waves of national longitudinal panel surveys
No variance.
Actual 100%
Reduction in FTB as a result of child support obligations being met (via the Maintenance Income Test)
Estimate $449 million The variance is +$22 million.
The actual figure is a tentative estimate based on previous years’ outcomes and adjusted to reflect the expected impact of the Child Support Scheme reforms. It has increased because the previous year outcomes have increased. There is no reconciliation outcome data at this stage with which to gauge the actual impact.
The preliminary outcome for 2007–08 is $536 million (based on 12 months of reconciliation), and the final outcome for 2006–07 is $520 million (based on 24 months of reconciliation).
Actual $471 million

169
Cas
e st
udy
Chapter 8 Outcome 3 Part2 Performance reporting FaHCSIA Annual Report 2008–2009
Perf
orm
ance
repo
rtin
gPa
rt 2
Information sharing to better protect Australia’s childrenFaHCSIA, as the lead agency to the Information Sharing Working Group, has worked with state and territory child protection agencies and Commonealth departments to improve the way information is shared to better protect Australia’s children. An information sharing protocol between the Commonwealth, state and territory child protection agencies was developed during 2008 and implemented on 1 January 2009.
The development of the protocol was prompted by child protection cases which highlighted the potential for improved information sharing about high‑risk families. Improved information sharing can help child protection agencies to locate families where there are concerns about a child’s welfare, particularly when families move within and across states and territories.
Centrelink was the first Commonwealth agency to operate under the protocol and received 1950 requests for information in the first half of 2009. Throughout 2009, the protocol, which is used only where it is appropriate and lawful, will be considered for use with other relevant Commonwealth agencies including Medicare Australia and the Child Support Agency.
The Commonwealth has already received positive feedback from Victoria’s child protection agency, which noted that the protocol has enabled many families to be located, leading to better case outcomes, and has been particularly useful in helping to locate non‑custodial parents when a child has been placed in care.

170 FaHCSIA Annual Report 2008–2009 Part2 Performance reporting Chapter 9 Outcome 4
Outcome 4 at a glanceStrong and resilient communities
Services and assistance that: help homeless people and low‑income households to gain affordable and appropriate housing; promote community partnerships; and encourage participation in the local community by individuals, families, business and government.
Contribution of outputs to Outcome 4Outcome 4 has four contributing output groups:
Key areas of focus in 2008–09The services and assistance provided through Outcome 4 during 2008–09 were pivotal in helping the Department to support individuals and communities affected by the rapid deterioration of global financial conditions and the disasters that occurred in Australia and overseas.
Outcome 4Strong and resilient communities
Output Group 4.2Supporting
financial management
Output Group 4.1Housing support
Output Group 4.3Community
recovery
Output Group 4.4Community
partnerships and delivery
Outcome 49
171
Perf
orm
ance
repo
rtin
gPa
rt 2
Chapter 9 Outcome 4 Part2 Performance reporting FaHCSIA Annual Report 2008–2009
Affordable housingDuring 2008–09 the Department began implementing the Government’s $5.64 billion Social Housing Initiative. We worked closely with state and territory governments, and central agencies, to develop and implement the National Affordable Housing Agreement and its supporting national partnership agreements. The Department contributed research for the National Housing Supply Council’s first annual State of Supply Report, which increased awareness across the sector of the current and future state of housing supply. Under the Housing Affordability Fund, financial incentives were provided to developers and local government to reduce the impact of infrastructure charges on new homes.
Responding to homelessnessFaHCSIA drafted the Government’s White Paper on homelessness, The Road Home: A National Approach to Homelessness, which sets out a plan to reduce homelessness in Australia by 2020. Specific goals are to halve overall homelessness and to provide supported accommodation to all rough sleepers who seek it by 2020. Progress will be monitored through agreed interim goals and targets.
We worked closely with state and territory governments to build the White Paper strategies into the National Partnership Agreement on Homelessness.
Rebuilding communities and supporting individuals affected by disasterDuring 2008–09 FaHCSIA implemented several disaster recovery assistance packages to support Australians adversely affected by disasters occurring in Australia and overseas. These disasters included the Mumbai terrorist attacks, the south‑east Queensland storms, flooding in Queensland and northern New South Wales, and bushfires in Victoria.
Supporting the community sectorThe global financial crisis has led to an increased demand on services provided by the community sector, including from those not traditionally requiring assistance. In light of this, the Government announced additional funding of $80.4 million to extend FaHCSIA’s emergency relief and financial counselling services.
The Department also provided discretionary grants to 7,200 volunteering organisations to assist them with small equipment and fuel costs. During 2008–09, we continued work on developing a national compact with the non‑profit sector, local government and the Australian Council of Trade Unions. This initiative aims to facilitate collaborative and effective policy solutions for problems facing the Australian community.

172 FaHCSIA Annual Report 2008–2009 Part2 Performance reporting Chapter 9 Outcome 4
Outcome 4 performance reportThis section outlines the specific achievements that contributed towards achieving FaHCSIA’s goals for Outcome 4, as well as the challenges we encountered along the way. It also reports on the Department’s performance against the measures set out in our 2008–09 Portfolio Budget Statements and related budget documents.
Achievements contributing to Outcome 4 in 2008–09Housing supportFaHCSIA assists low‑ and moderate‑income households to access affordable housing and provides support services to people who are homeless or at risk of homelessness. In 2008–09 we delivered a number of significant and comprehensive initiatives to improve housing affordability and address homelessness.
FaHCSIA’s key achievements in 2008–09 in supporting housing and homelessness reform are outlined below.
National Affordable Housing Agreement
In 2008–09 the Commonwealth and state and territory governments agreed to nearly $10 billion in funding for the National Affordable Housing Agreement, which commenced on 1 January 2009, and its associated national partnership agreements (including the National Partnership Agreement on Homelessness, the National Partnership Agreement on Remote Indigenous Housing and the National Partnership Agreement on Social Housing).
The agreements demonstrate the Australian Government’s leadership role in helping Australians into secure and affordable housing, which assists them to participate socially and economically. The National Affordable Housing Agreement encompasses housing assistance provided by all governments in Australia, including Commonwealth Rent Assistance, funding for specialist homeless services and other housing affordability programs.
National Partnership Agreement on Homelessness
The National Partnership Agreement on Homelessness was agreed in 2008–09. Under the agreement, Commonwealth and state and territory governments will work together to significantly reduce homelessness by 2013. This will be achieved through a national strategic approach focused on prevention and early intervention, breaking the cycle of homelessness and creating a new outcomes‑focused service model.
The National Partnership Agreement on Homelessness sets out to ensure that:
fewer people will become homeless and that fewer of these will sleep rough ◗
the number of homeless cycles for people will be reduced ◗

173
Perf
orm
ance
repo
rtin
gPa
rt 2
Chapter 9 Outcome 4 Part2 Performance reporting FaHCSIA Annual Report 2008–2009
people at risk of or experiencing homelessness will maintain or improve connections ◗
with their families and communities, maintain or improve their education, training or employment participation and be supported by quality services with improved access to sustainable housing.
Implementation plans for the agreement have been finalised in collaboration with state and territory governments.
National Partnership Agreement on Social Housing
The National Partnership Agreement on Social Housing was agreed in 2008–09. Under the agreement, the Commonwealth, state and territory governments will work together to increase the supply of social housing. In particular, the agreement will provide capital funding to support projects that enhance the ability of people who are homeless or at risk of homelessness, including Indigenous people and pensioners, to secure safe and long‑term housing that meets their needs.
The Department has made significant progress in delivering the objectives and outcomes identified in the agreement. Implementation plans for the agreement were finalised in collaboration with state and territory governments in 2008–09.
National Rental Affordability Scheme
The National Rental Affordability Scheme commenced on 1 July 2008. The scheme aims to increase the supply of affordable, safe rental dwellings by payments to contracted organisations to assist Australians with low and medium incomes to access affordable, safe and sustainable housing. Two application rounds were conducted and 3,799 offers of scheme incentives and 2,250 affordable rental dwellings were made available by 30 June 2009.
The Department also put in place a strategy to help develop the capacity of the not‑for‑profit community housing sector to participate in the scheme.
Housing Affordability Fund
The Housing Affordability Fund provides developers and local government with a financial incentive to reform development and planning systems and to reduce the impact of infrastructure charges on new homes. A total of 33 funding agreements were signed in 2008–09, including nine agreements for the development of electronic development assessment (eDA) systems, which enable development applications to be lodged and assessed electronically.
Funding has been provided for a National eDA Co‑ordination Office in Western Australia, hosted by the WA Department of Planning and Infrastructure, to implement the software that will enable eDA systems to interact and exchange information. Each state and territory is implementing the eDA processes and related information technology infrastructure proposals to speed up handling of development applications.

174
Cas
e st
udy
FaHCSIA Annual Report 2008–2009 Part2 Performance reporting Chapter 9 Outcome 4
National Rental Affordability Scheme—St George Community HousingThe National Rental Affordability Scheme provides National Rental Incentives to commercial investors and community housing providers to increase the supply of affordable rental housing.
The incentive is currently valued at $8,762 for each dwelling and is paid annually for a 10‑year period. To qualify, the home must be rented at least 20 per cent below market value to eligible tenants on low to moderate incomes.
St George Community Housing was offered 100 incentives in December 2009 under the scheme’s first application round. The units are rented for between $191 and $274, providing a weekly saving to tenants of up to $95. Tenants are from a variety of socio‑economic backgrounds, including students, people with disability, and key workers and their families, such as hospitality and childcare workers and apprentices.
St George Community Housing purchased the 100 dwellings directly from developers at wholesale rates, generating considerable savings across the project. The units are located in two different residential developments in Sydney, with half in Leumeah in south‑western Sydney and the remainder in Bankstown. All units are within 150 metres of transport, a major shopping centre, community amenities, employment opportunities and schools.
St George Community Housing intends to hold all the homes as affordable rental housing stock over the long term, even after the incentives expire.
St George Community Housing has stated that these 100 dwellings would not have become available to tenants if it were not for the incentives available under the National Rental Affordability Scheme.

175
Perf
orm
ance
repo
rtin
gPa
rt 2
Chapter 9 Outcome 4 Part2 Performance reporting FaHCSIA Annual Report 2008–2009
White Paper on homelessness
The Department drafted the Government’s White Paper on homelessness, The Road Home: A National Approach to Homelessness, which was released by the Prime Minister, the Hon. Kevin Rudd, MP, and the Minister for Housing, the Hon. Tanya Plibersek, MP, on 21 December 2008. The White Paper sets out a plan to reduce homelessness in Australia by 2020. Specific goals are to halve overall homelessness and to provide supported accommodation to all rough sleepers who seek it by 2020. Progress will be monitored through agreed interim goals and targets.
The Department worked closely with state and territory governments to embed the strategies in the White Paper initiatives into the National Partnership Agreement on Homelessness.
National Housing Supply Council
The National Housing Supply Council released its first annual State of Supply Report, which analyses housing needs and construction levels in Australia up to 20 years into the future, in March 2009. The Department commissioned and undertook research that provided input to the report, drafted the report in accordance with the views of the Council, and provided secretariat support to the Council.
New Guidelines for Release of Surplus Commonwealth Land
The Department was involved in the development of the new Guidelines for Release of Surplus Commonwealth Land announced by Lindsay Tanner, Minister for Finance and Deregulation, and Tanya Plibersek, Minister for Housing and the Status of Women, on 25 February 2009. Under the new guidelines, surplus Commonwealth land suitable for housing will be disposed of to support the construction of new houses, improve community amenity and support the creation of new jobs.
Rent Assistance
FaHCSIA manages the Rent Assistance program, which contributes to improving housing affordability and complements broader income‑support objectives by helping individuals and families with the costs of renting in the private housing market.
During 2008–09, the Department provided a range of Rent Assistance policy advice to Centrelink, which delivered $2.6 billion in Commonwealth Rent Assistance to 1,113,575 families and individuals.

176
Cas
e st
udy
FaHCSIA Annual Report 2008–2009 Part2 Performance reporting Chapter 9 Outcome 4
Homelessness White PaperIn January 2008, the Prime Minister, the Hon. Kevin Rudd, MP, and the Minister for Housing, the Hon. Tanya Plibersek, MP, announced the development of a comprehensive, long‑term plan to tackle homelessness.
Following public consultations in all states and territories, the Prime Minister and the Minister for Housing launched the White Paper, The Road Home: A National Approach to Homelessness, in December 2008.
The White Paper sets out two headline goals, to be achieved by 2020, which will guide our long‑term response to homelessness: halving overall homelessness; and offering supported accommodation to all rough sleepers who seek it.
Representatives of the homelessness sector congratulated the Government for delivering on its election promise. Kevin Crowe, President of the Youth Accommodation Association, commented: ‘The White Paper sets up a strong vision and a long‑term plan to end homelessness in Australia. It is the beginning of a new era where we take steps to address the social inequities in this country.’
Stephen Nash, the Chief Executive Officer of HomeGround, a large Victorian housing and homelessness organisation, said: ‘I would characterise the White Paper and the National Partnership on Homelessness as [providing] the most leadership on this issue in our history. The Rudd Government deserves credit for trying to move away from managing homelessness towards ending it.’
FaHCSIA, in conjunction with each relevant state and territory department, has held information sessions about the White Paper and its implementation in capital cities. The Government continues to engage the homelessness sector and to work with states and territories to reduce homelessness.
Photo above: The Prime Minister, the Hon. Kevin Rudd, MP, and Minister for Housing, the Hon. Tanya Plibersek, MP, speak with a Mission Australia resident at the Homelessness White Paper launch.

177
Perf
orm
ance
repo
rtin
gPa
rt 2
Part2 Performance reporting FaHCSIA Annual Report 2008–2009
Assisting low- and moderate-income households to access appropriate affordable rental housing
The Government has an increased policy focus on the community housing sector as a mechanism for increasing the supply of affordable rental housing. During 2008–09 the Department undertook work to develop strategies to build the capability of the community housing sector to manage this growth.
This includes the funding, business and delivery models needed to develop a mature and high‑functioning not‑for‑profit community housing sector in Australia that improves choice for tenants, delivers quality rental housing at affordable cost for those in lower income brackets and promotes competition in housing delivery.
Funding was also provided to the Community Housing Federation of Australia as the peak body for the community housing sector.
Social Housing Initiative
As part of the Social Housing National Partnership Agreement, COAG agreed to the implementation of a Social Housing Initiative over three and a half years.
The Social Housing Initiative represents a commitment by the Commonwealth Government and state and territory governments to significantly increase the supply of social housing throughout Australia and provide much‑needed accommodation to many disadvantaged Australians, particularly those who are homeless or at risk of becoming homeless. Governments have agreed to specific targets for the construction of new social housing dwellings and the repair and maintenance of existing properties.
The initiative will also support existing agreements that were previously endorsed by COAG in November 2008 to boost the supply of social housing and reduce homelessness. A number of the objectives and reform elements from these existing agreements have been incorporated into the guidelines in the Social Housing Initiative to ensure that all of the Commonwealth’s housing programs are closely aligned.
The guidelines include a number of requirements and criteria that relate to agreements that were reached during the passing of the Appropriation (Nation Building and Jobs) (No. 1) 2008–2009 (No. 2) Bill through Parliament. This includes the specific environmental requirements that dwellings constructed through the initiative will be required to meet.
Through the initiative, the Commonwealth will commit funding of up to $5.64 billion over the next three and a half years. With the assistance of the not‑for‑profit housing sector, up to 19,200 new social housing dwellings will be built and 60,000 existing public and community housing dwellings refurbished.
Funding will generally be allocated to states on a per capita basis, subject to jurisdictions submitting suitable proposals that meet the requirements of the initiative.

178
Cas
e st
udy
FaHCSIA Annual Report 2008–2009 Part2 Performance reporting Chapter 9 Outcome 4
Social Housing Initiative—in focusIn February 2009, the Commonwealth Government announced funding for the Social Housing Initiative under the Nation Building—Economic Stimulus Plan. The Social Housing Initiative is being delivered in partnership with state and territory governments. It will provide a boost to public housing and is designed to assist low‑income Australians who are homeless or struggling to secure housing in the private rental market.
Within three years, 19,200 new social housing dwellings will be built with the ◗
support of the non‑profit sector. The main beneficiaries will be people who are homeless or at risk of homelessness, and those on public housing waiting lists who have high needs, including age and disability pensioners, Indigenous people and women with children escaping domestic violence.
Of the new dwellings constructed through this initiative, 75 per cent are to be ◗
completed by December 2010.
By 30 June 2010, 10,000 existing social housing dwellings that would otherwise be ◗
unfit or would shortly become unfit for occupation will have been upgraded.
There will be an immediate stimulus to the building and construction industry, ◗
supporting jobs in the housing and construction sector. Housing will be located closer to transport, services and employment opportunities, leading to better social and economic participation by social housing tenants.
The Department established the Social Housing Initiative Group in 2008–09. The group has an overarching role in the coordination, development and implementation of the initiative, while the Treasury has primary responsibility for payments to state and territory governments.

179
Cas
e st
udy
Chapter 9 Outcome 4 Part2 Performance reporting FaHCSIA Annual Report 2008–2009
Perf
orm
ance
repo
rtin
gPa
rt 2
Social Housing Initiative—new job opportunity for local development company in South AustraliaAs part of Stage 1 of the Social Housing Initiative, a local development company is building a $5.5 million development with 16 new social housing dwellings on a site in the outer suburbs of Adelaide.
The development consists of 13 three‑bedroom houses and three two‑bedroom houses to be managed by a community provider.
Before the announcement of funding, the construction of these dwellings had been on hold indefinitely due to a lack of finance. The company was also facing the prospect of several retrenchments due to the effects of the global financial crisis.
This project helped the company avoid expected redundancies, employ two new employees and expand its contractor base to support the renewed activity.
The new dwellings will provide accommodation for 16 families who were facing uncertainty about their future accommodation.

180
Cas
e st
udy
FaHCSIA Annual Report 2008–2009 Part2 Performance reporting Chapter 9 Outcome 4
Social Housing Initiative—first dwelling to be upgraded as part of the Economic Stimulus PlanA house in Narrabundah in the Australian Capital Territory (ACT) was the first to be completed as part of the Government’s Nation Building – Economic Stimulus Plan. The property is the first of 243 social housing dwellings in the ACT to be upgraded as a result of the $400 million repair and maintenance component of the plan.
The 52‑year‑old house had been vacant and was in very poor condition. Without the funding provided under the Economic Stimulus Plan, this house would have remained uninhabitable. As a result of the renovations, it is tenanted again and meets the needs of the community.
Work on the house was completed in just 16 days by a local company who employed 19 people to undertake the work. The renovation included a refurbishment of the kitchen and wet areas, internal and external painting, new floor coverings, and other general repairs.
The dwelling will now be occupied by a man who was previously homeless. Having this safe and secure place to live will help him get his life back together. He has access to his two children but hasn’t been able to take advantage of it because he did not have appropriate accommodation. Having this house will provide him with the opportunity to re‑engage with his family.
Photo above: Minister for Housing, the Hon. Tanya Plibersek, MP, and John Hargreaves MLA, Minister for Disability and Housing, ACT Legislative Assembly, at the first property to be upgraded as part of the Government’s Nation Building—Economic Stimulus Plan.

181
Perf
orm
ance
repo
rtin
gPa
rt 2
Chapter 9 Outcome 4 Part2 Performance reporting FaHCSIA Annual Report 2008–2009
The Social Housing Initiative comprises two elements. The first provides funding for new construction while the second provides funding to support the repair of existing social housing dwellings.
Element 1 will consist of two stages. Stage 1 will provide funding for social housing projects that are already in the development pipeline and can be brought forward to commence in 2009 and be completed before 30 June 2010. Stage 2 will provide funding for social housing projects following the completion of a competitive process to be conducted by each jurisdiction to identify suitable projects in the market.
Supporting financial managementFaHCSIA provides support to people who are in financial crisis and assists people in finding ways to reduce problem gambling. In 2008–09 we played a significant role in supporting people affected by the global financial crisis by providing emergency relief and financial counselling services and through the Community Response Taskforce.
FaHCSIA’s key achievements in 2008–09 in supporting financial management are outlined below.
Boost for emergency relief and money management projects
During 2008–09 community organisations reported increased demand for emergency relief from both low‑ and middle‑income families, including people experiencing housing stress and small business owners. In response, the Government invested $130.4 million to double funding for emergency relief and expand innovative money management projects to help low‑income earners. The Department worked closely with service providers to inform policy and program responses and to implement the additional funding.
We also delivered on the Government’s commitment to fund extra financial support services, in response to the global recession. These included:
$11.1 million for over 600 emergency relief agencies to help them meet increased demand ◗
$1.75 million to rapidly train 50 new financial counsellers and workers in emergency relief ◗
funding for the Australian Financial Counselling and Credit Reform Association for its ◗
important work as a peak body for the financial counselling sector
allocating $100,000 for development of web‑based financial management tools by the ◗
Australian Securities and Investments Commission
providing funding to community organisations that delivered financial counselling, ◗
money management education and support to nearly 750,000 people.

182
Cas
e st
udy
FaHCSIA Annual Report 2008–2009 Part2 Performance reporting Chapter 9 Outcome 4
Financial Management ProgramUnder FaHCSIA’s Financial Management Program, emergency relief and financial counselling services provide free confidential support to people in financial difficulty. These community organisations help people across Australia, including income management participants in Western Australia and the Northern Territory.
Jacaranda Community Centre is one of the organisations funded under the program in Western Australia. The centre works closely with Centrelink to ensure that people needing assistance are referred for help. When Centrelink discovered that a single mother with three children, Pam,* was in financial hardship, a meeting was arranged for her with a financial counsellor from the centre.
The financial counsellor helped Pam look at her income, bills and arrangements with finance companies and other issues that were affecting her ability to manage her money. They also helped Pam make an application for a no‑interest loan to get a washing machine so she didn’t have the expense of travelling to a laundromat several times a week.
The financial counsellor talked to Pam about how participating in income management could help her budget her money. This is now helping her to save for maintenance to the family home and to buy clothes so that she and the children don’t have to wear hand‑me‑downs from relatives.
* Name changed to protect privacy.

183
Perf
orm
ance
repo
rtin
gPa
rt 2
Chapter 9 Outcome 4 Part2 Performance reporting FaHCSIA Annual Report 2008–2009
Family Income Management and MoneyBusiness
Under the Financial Management Program, FaHCSIA engaged Cultural and Indigenous Research Centre Australia to conduct an evaluation of Family Income Management and MoneyBusiness. MoneyBusiness is an initiative launched in July 2005 by the ANZ Bank and the Australian Government to assist Indigenous people to develop money management skills and to encourage a stronger savings culture. The evaluation included data analysis, a literature review and measurement of program outcomes. The evaluation was informed by site visits and consultations with service providers and Indigenous community members receiving the services.
Community Response Taskforce
In addition, the Department has supported the work of the Community Response Taskforce announced on 27 January 2009. The Deputy Prime Minister, Julia Gillard, the Minister for Families, Housing, Community Services and Indigenous Affairs, the Hon. Jenny Macklin and the Parliamentary Secretary for Social Inclusion and the Voluntary Sector, Senator Ursula Stephens established the Community Response Taskforce to allow the non‑profit sector to deal directly with the Government about the impact of the global financial crisis on vulnerable Australians.
Community recoveryFaHCSIA contributes to addressing the social and community impacts of disasters and critical incidents. In 2008–09 we played a significant role in this area, including through significant efforts in supporting people affected by the Mumbai terrorist attacks, the storms in Queensland and floods in Queensland and northern New South Wales, and the devastating Victorian bushfires.
FaHCSIA’s key achievements in 2008–09 in addressing the social and community impacts of disasters are outlined below.
Supporting people affected by disasters in Australia and overseas
During 2008–09, the Government provided disaster recovery assistance packages to support 114,000 Australians adversely affected by disasters occurring in Australia and overseas, through the Australian Government Disaster Recovery Payment. These included the Mumbai terrorist attacks in November 2008, the south‑east Queensland storms in November 2008, flooding in north and north‑western Queensland in January and February 2009, the Victorian bushfires in February 2009, and flooding in south‑east Queensland and northern New South Wales in May 2009.
Victorian bushfires response
FaHCSIA delivered a comprehensive assistance package for those adversely affected by the devastating bushfires in Victoria in February 2009. To facilitate and coordinate the delivery of this package, the Prime Minister initially established and chaired the Commonwealth Victorian Bushfires Ministerial Taskforce. He later delegated the role of chair to the

184
Cas
e st
udy
FaHCSIA Annual Report 2008–2009 Part2 Performance reporting Chapter 9 Outcome 4
Assisting Flood Victims in Queensland and New South WalesIn May 2009, south‑east Queensland and the north coast and Northern Rivers regions of New South Wales experienced severe weather, receiving over 400 millimetres of rain in 24 hours, and experiencing strong winds of up to 130 kilometres per hour and large waves that battered the coast. Across both states, 26 local government areas were declared natural disaster zones. Tragically, two lives were lost and many homes and businesses were damaged.
As part of the response to this event, the Australian Government Disaster Recovery Payment (AGDRP), administered by FaHCSIA and delivered by Centrelink, was made available. The payment provided $1,000 per eligible adult and $400 per child of immediate financial assistance to help individuals and families recover from this disaster. As at 30 June 2009, more than 3,500 individuals have received the payment.
One local resident was assisted after arriving at the mobile servicing unit on the point of exhaustion after spending several days removing flood debris and mud from their family’s flooded home. When a Centrelink Social Worker explained that the customer was eligible to receive the AGDRP, the customer became very emotional. The customer had incorrectly assumed that their family was not eligible for assistance because they were not receiving Government assistance and that the AGDRP was means tested. Once the Social Worker explained that the family met the criteria the customer left the mobile servicing unit to share the good news with their family.
The customer later returned to tell the Social Worker that they had used the money to hire a back hoe to remove the mud, which they had previously been removing by hand. The customer thanked the Social Worker on behalf of the family for taking the time to listen during their time of need.

185
Perf
orm
ance
repo
rtin
gPa
rt 2
Chapter 9 Outcome 4 Part2 Performance reporting FaHCSIA Annual Report 2008–2009
Hon. Jenny Macklin, MP. The Minister is supported by the Parliamentary Secretary for Victorian Bushfire Reconstruction, the Hon. Bill Shorten, MP, who was appointed to help with the rebuilding of the lives, homes and communities that were devastated by these tragic fires.
FaHCSIA has provided more than $78 million through the package, which includes the Australian Government Disaster Recovery Payment, Income Recovery Subsidy and Funeral/Memorial Assistance, to those affected by the Victorian bushfires. In addition, FaHCSIA provided an additional $6 million under the Emergency Relief Program, $900,000 for Youth Outreach, and $440,000 in the Family Relationships Program to support additional services in bushfire‑affected areas.
The Government also provided $2 million to the 2009 Victorian Bushfire Appeal Fund, established by the Victorian Premier in partnership with the Commonwealth Government and the Australian Red Cross.
Community partnership and deliveryFaHCSIA supports the development of strong and resilient communities by promoting self‑reliance and encouraging social participation and inclusion in the local community by individuals, families, volunteers, business and government. In 2008–09 FaHCSIA made significant contributions in this area, including through delivery of Volunteer Grants Program funding and the development of a national compact, as detailed below.
FaHCSIA’s key achievements in 2008–09 in supporting the development of strong and resilient communities are outlined below.
Community investment funding
The Government supported more than 800 community organisations through FaHCSIA’s community investment funding. In addition, the Department funded 7,683 projects, which assisted more than 450,000 individuals/families in disadvantaged communities by supporting volunteering, funding case and place‑based support, strengthening ties between business and the community, and helping community organisations function more effectively.
Volunteer Grants Program
Volunteers make an immense contribution to our society by giving up their valuable time to help others. The Australian Government is committed to supporting volunteers in their important work. FaHCSIA provides grants of up to $5,000 each to enable organisations to purchase small equipment items to assist their volunteers and contribute to reimbursing fuel costs incurred by volunteers. In 2008–09 we supported Australian volunteers by providing $21 million in discretionary grants to more than 7,200 volunteering organisations under the program.

186
Cas
e st
udy
FaHCSIA Annual Report 2008–2009 Part2 Performance reporting Chapter 9 Outcome 4
Emergency Relief—supporting service providers to respond to the Victorian BushfiresThrough the Financial Management Program, FaHCSIA provides funding to a range of community and charitable organisations to provide emergency, financial and other assistance to individuals and families in financial crisis.
On Saturday 7 February 2009, Victoria was devastated by bushfires. By the time the bushfires burnt out, 173 people had died and many other people had lost their homes.
In response FaHCSIA’s Emergency Relief Team in the Victorian State Office swung into action. Our team worked tirelessly to bring forward payments to approximately 150 service providers. As a result these payments to the value of $2.6 million were processed by 9 February 2009.
This immediate assistance helped ensure that these agencies had a sufficient balance of funds to provide food, clothing and other replacement items to people affected by the bushfires.
In response to the bushfires and the global financial crisis, Minister Macklin approved an additional allocation of $6 million to the existing 150 Emergency Relief providers and an additional 15 service providers. A special streamlined funding agreement enabled all funding agreements to be sent out to approximately 150 service providers within two days. Most of the subsequent payments were made within a week and the 15 additional services commenced in June 2009.
The response from the community agencies assisted in the bushfire‑affected areas was very positive. Gavin Dufty of the St Vincent De Paul Society Victoria, thought that FaHCSIA’s response had been ‘streets ahead of anyone else’ in promptly preparing paperwork and processing payments.

187
Cas
e st
udy
Chapter 9 Outcome 4 Part2 Performance reporting FaHCSIA Annual Report 2008–2009
Perf
orm
ance
repo
rtin
gPa
rt 2
Victorian bushfires— youth support responseFaHCSIA’s Reconnect program helps young people aged 12 to 18 who are homeless, or at risk of homelessness, to re‑engage with their families, education, training, employment and the community.
The Victorian bushfires on 7 February 2009 required immediate responses from all levels of government and non‑government organisations. Kildonan Child and Family Services helped staff the crisis response centre in Whittlesea and immediately recognised the impact of the tragedy on the area’s young people. The Reconnect team in Kildonan worked with the young people and their families to help them address these issues.
Thirty per cent of the student population at Whittlesea Secondary College had been directly affected by the bushfires. Students who had been traumatised during the fires were beginning to display problem behaviours in the schoolyard. The college approached Kildonan Reconnect for support as they needed skilled assistance to manage these behaviours.
Kildonan Reconnect began to develop a longer‑term response plan to support young people and their families to recover from the trauma of the bushfires. Additional funding was provided to allow the Reconnect team to continue to work with bushfire‑affected families as well as their normal homeless clients.
Liaison with other Reconnect services in bushfire‑affected areas led to similar concerns in relation to the wellbeing of young people. This resulted in the allocation of funding to Reconnect services in all bushfire‑affected areas.

188 FaHCSIA Annual Report 2008–2009 Part2 Performance reporting Chapter 9 Outcome 4
National Compact
During 2008–09 the Department advanced the development of a national compact with the non‑profit sector, which will provide a framework under which effective collaborative solutions can be developed to meet the policy challenges facing the Australian community. In May 2009 the Government established a National Compact Joint Taskforce, which is made up of representatives from not‑for‑profit organisations, local government, the Australian Council of Trade Unions and Commonwealth Government officials.
The National Compact Joint Taskforce is providing advice on the wording of the compact and is developing a consultation strategy and implementation plan including monitoring and reporting. This will inform a wider consultation leading to the development of a draft compact by December 2009.
Harm prevention charities register
The Register of Harm Prevention Charitable Institutions is a Commonwealth tax deductibility scheme for charities whose principal activity is to promote prevention or control of harmful behaviour such as substance abuse or harmful gambling. It was introduced on 1 July 2003 in response to the independent Inquiry into the Definition of Charities and Related Organisations.
The register is maintained by the Secretary of the Department in accordance with directions from the Minister for Families, Housing, Community Services and Indigenous Affairs and the Treasurer or his delegate.
Once entered onto the register, organisations are eligible to apply for endorsement as a deductible gift recipient. This status can assist charities to attract public support, as donations are tax deductible.
In 2008–09, 12 applications were approved by the Minister and the Assistant Treasurer. There are currently 44 institutions listed on the register.
Challenges in 2008–09This section describes some of the challenges the Department met when delivering Outcome 4 initiatives and how we worked to overcome them.
Improving the supply of affordable housing and responding to homelessnessThe global financial crisis affected Australians in many ways, including their capacity to maintain affordable housing. Many more people are struggling with the cost of private rental accommodation. In 2008–09 the Government responded by committing significant amounts of funding to increase the supply of affordable housing, particularly social

189
Cas
e st
udy
Chapter 9 Outcome 4 Part2 Performance reporting FaHCSIA Annual Report 2008–2009
Perf
orm
ance
repo
rtin
gPa
rt 2
Local Answers—the Frankston Community KitchenThe Community Kitchen project has been funded by FaHCSIA since 12 October 2004 under the Stronger Families and Communities Strategy—Local Answers. Funding to the end of June 2009 totalled $416,000, which has supported 16 kitchens. The funding has also been used to develop and produce instructional and promotional material, which has helped to showcase the success of the project at forums and conferences.
The model for the Community Kitchen was initially developed by the Frankston Community Health Service and based on a Canadian model. The kitchens operate in any venue with suitable and safe kitchen facilities, including church halls, school facilities and neighbourhood houses.
In the last four years, the Frankston Community Kitchen has assisted more than 500 people to improve their physical and mental wellbeing by promoting healthy eating and social participation. It offers an alternative approach to promoting healthy eating and the development of personal skills and social support networks within the local community.
A past participant of the Community Kitchen, a then newly arrived migrant, was a keen participant and very helpful to the whole group. He taught the other participants how to make sushi on many occasions. His family has purchased a shop in the local community and is operating a successful business. He wants to employ other members of the Community Kitchen in his business.
Participants commented that they felt the Community Kitchens was a wonderful program with many benefits and that the slogan ‘come for the food, stay for the friendships’ said it all.
Photo above: Participants at the Community Kitchen at Frankston.

190 FaHCSIA Annual Report 2008–2009 Part2 Performance reporting Chapter 9 Outcome 4
housing, through the Nation Building—Economic Stimulus Plan. The Social Housing Initiative also helped the building and construction industry by creating more jobs.
In recent times the experience of homelessness has changed. More families and low‑income earners are coming to homelessness services seeking support and growing numbers of children are homeless or at risk of homelessness. A key challenge for the Department was ensuring sufficient services, and the right services, were available to meet the needs of a changing client group and, just as importantly, to stop the flow of people into homelessness. The global financial crisis compounded this challenge.
Supporting individuals and families in financial hardshipThe impact of the global financial crisis resulted in increased demand for emergency relief and financial counselling. Many organisations reported at least 20 per cent more people seeking their help for more complex issues, and from people who had not traditionally sought help from their services. This placed a significant burden on the community sector’s capacity to meet demand. In particular, there was an increased demand for financial support.
To help organisations respond, the Government provided an extra $11.1 million in 2008–09 to the 623 existing emergency relief providers. This gave providers the capacity to provide more substantial help to families and individuals in financial crisis. In April 2009, the Minister announced a further $1.75 million for training workers in community organisations to better equip them in their roles so they can offer basic budgeting help and more access to financial counselling for people in crisis.
This additional support made it easier for Australians in financial hardship to access financial support and increased their access to financial counsellors and trained volunteers at a time when they needed it most.
Responding to multiple disastersDuring 2008–09 the Department responded to multiple disasters—the Mumbai terrorist attacks, the south‑east and north Queensland storms, the north‑west Queensland floods, the Victorian bushfires and the northern New South Wales floods. The severity of the impact of the disasters was unprecedented.
The Victorian bushfires were the most significant natural disaster in Australia’s history—173 people lost their lives as fire destroyed 2,092 homes, devastated 78 communities and burnt more than 400,000 hectares. The response to the devastation was a landmark moment for Australia, showcasing the courage, generosity and resilience of our people and the professionalism and resourcefulness of all levels of government and the Australian community as they worked with those affected.
In response to the bushfire disaster, the Prime Minister established the Commonwealth Victorian Bushfires (Ministerial) Taskforce, and appointed the Hon. Jenny Macklin, MP,

191
Perf
orm
ance
repo
rtin
gPa
rt 2
Chapter 9 Outcome 4 Part2 Performance reporting FaHCSIA Annual Report 2008–2009
as the chair, with support from the Parliamentary Secretary for Victorian Bushfire Reconstruction, the Hon. Bill Shorten, MP. FaHCSIA, as the lead Commonwealth agency responsible for disaster recovery, quickly convened its Australian Government Disaster Recovery Committee and established a departmental taskforce to support Minister Macklin and Parliamentary Secretary Shorten in their lead roles.
The Department worked tirelessly with other Commonwealth agencies and the Victorian Bushfire Reconstruction and Recovery Authority, and was responsible for the management and coordination of the Commonwealth’s multi‑agency response to the disaster. It oversaw the development of tailored disaster assistance to individuals and affected families at state and Commonwealth level, including FaHCSIA’s assistance packages (the Australian Government Disaster Recovery Payment, the Income Recovery Subsidy and Funeral/Memorial Assistance).
2008–09 Budget measuresPresident Ramos-Horta—non-medical supportEx gratia financial assistance was provided in 2007–08 for the non‑medical costs associated with the medical treatment of the President of East Timor, who was evacuated to Australia on 11 February 2008. This assistance supported the recovery of the President of East Timor, meeting the costs of accommodation, meals and ground transport in Australia for the President and his party.
Home in Queanbeyan Mental Health ServiceThe Home in Queanbeyan Mental Health Service measure provides funding to contribute to Home in Queanbeyan, a charitable organisation that helps people living with chronic mental illness who cannot live independently or are homeless. This funding will be used to establish a facility providing 20 one‑bedroom units to cater for 15 long‑term residents and five respite care residents.
A Place to Call Home$150 million over five years is being provided under the National Partnership Agreement on Homelessness to build or acquire at least 600 homes for people who would otherwise be homeless. These will be supported for the first 12 months, after which the house and tenancy will transfer to the general social housing pool. States and territories are required to match Commonwealth funding for this measure.
Housing Affordability Fund$512 million over five years through the Housing Affordability Fund will increase the supply of housing and reduce the purchase price of new homes, particularly entry‑level or moderately priced homes, through the provision of infrastructure and planning reform.

192 FaHCSIA Annual Report 2008–2009 Part2 Performance reporting Chapter 9 Outcome 4
Financial counselling—enhancing existing programsAn additional $10 million over four years for the Commonwealth Financial Counselling program has increased the capacity of existing services and funded 20 new financial counselling positions in high‑need areas across Australia. The new positions include telephone financial counselling and specialist positions to assist with housing debt.
National Rental Affordability SchemeUnder this scheme $623 million is being provided to deliver 50,000 additional affordable rental properties for low‑ to moderate‑income households by June 2012.
Queensland floods—assistanceQueensland floods assistance was provided through Australian Government Disaster Recovery Payments made to assist people adversely affected by the January and February 2009 floods in the Mackay, Emerald and Whitsunday Island regions of Queensland.
Payments of $1,000 per eligible adult and $400 per eligible child have been made available to people who, as a direct result of the flooding, were seriously injured and required hospitalisation for at least 48 hours or whose principal place of residence was destroyed or damaged.
Volunteer Grants program—expansion to help with fuel costsThe Volunteer Grants program supported the role of volunteers and the not‑for‑profit community sector through assisting volunteers to purchase small equipment and by reimbursing volunteers’ fuel costs incurred while volunteering.
Volunteer Management Program (Voluntary Work Initiative)—continuation of fundingVolunteer Management Program funding assisted volunteer resource centres to continue to provide a range of services to support volunteers, including management and training services, and the provision of advice and information to volunteers.
Welfare Payments Reform—child protection pilot and school attendance and enrolment pilotThis measure also applies to Outcome 3. See page 157, for details on this measure.
Removal of differential treatment of same-sex couples and their children—law reformThis measure also applies to Outcomes 2 and 3. See page 119, for details on this measure.

193
Perf
orm
ance
repo
rtin
gPa
rt 2
Chapter 9 Outcome 4 Part2 Performance reporting FaHCSIA Annual Report 2008–2009
Supporting local communitiesThis measure also applies to Outcome 2. See page 119, for details on this measure.
2008–09 Portfolio Additional EstimatesImplementation of Operation SunlightThis measure also applies to Outcomes 1, 2 and 3. See pages 70–71, for details on this measure.
2008–09 Portfolio Supplementary Estimates StatementsEconomic Security Strategy—public information campaignThis measure also applies to Outcomes 2 and 3. See page 120, for details on this measure.
2008–09 Portfolio Supplementary Additional Estimates StatementsNation Building and Jobs Plan—Investment in Social Housing—reducing homelessness and meeting priority needsIn February 2009, the Commonwealth announced funding for the Social Housing Initiative under the Nation Building—Economic Stimulus Plan. This initiative will provide funding of up to $5.64 billion over three and a half years from 2008–09 to 2011–12 for the construction of new social housing. This includes $400 million over two years for repairs and maintenance to existing public housing dwellings. It is being delivered in partnership with state and territory governments. It will provide a boost to public housing and housing administered by the not‑for‑profit community sector and is designed to assist low‑income Australians who are homeless or are on public housing waiting lists and have high needs.
2008–09 Portfolio Supplementary Additional Estimates Statements No. 2Implementation of Nation Building and Jobs Plan—Investment in Social HousingThe Social Housing Initiative will significantly increase the supply of social housing throughout Australia and provide much‑needed accommodation to many disadvantaged Australians, particularly those who are homeless or at risk of becoming homeless.

194 FaHCSIA Annual Report 2008–2009 Part2 Performance reporting Chapter 9 Outcome 4
As a requirement of receiving funding through the initiative, states and territories have also agreed to a number of important reform directions in the social housing sector, which will improve housing outcomes for low‑income renters and those with special needs. The Commonwealth will work with states and territories to address planning and housing supply issues, examine ways to grow and develop the social housing sector, improve performance monitoring, benchmarking, and accountability of social housing providers, and improve economic and social outcomes for social housing tenants.
Emergency Relief Program—doubling of fundingIn January 2009, in response to the global financial crisis, the Government announced it would double the funding for emergency relief from March 2009 to June 2011 to give agencies more capacity to help families and individuals in financial crisis and head off greater stress, including linking them to other services such as budgeting or financial counselling.
Results for key performance indicatorsThis section outlines, by output group, how the Department performed against the key performance indicators set out in the 2008–09 Portfolio Budget Statements and related Budget documents. Where relevant, achievement against key performance indicators is summarised in tables that provide estimated and actual results for targets set out in the FaHCSIA 2008–09 Portfolio Budget Statements.
Contributions to Outcome 4
Output Group 4.1Housing supportOutput Group 4.1 contributes to Outcome 4 by assisting low‑ and moderate‑income households to access appropriate affordable housing and providing support services to people who are homeless or at risk of homelessness.
Components of Output Group 4.1Commonwealth State Housing Agreement ◗
Homelessness and Housing ◗
National Rental Affordability Scheme—Rent Assistance ◗
Social Housing Subsidy ◗
Supported Accommodation Assistance Program ◗

195
Perf
orm
ance
repo
rtin
gPa
rt 2
Chapter 9 Outcome 4 Part2 Performance reporting FaHCSIA Annual Report 2008–2009
Commonwealth State Housing AgreementThe 2003 Commonwealth State Housing Agreement (CSHA) provided Australian Government grants of around $5.23 billion over five and half years (approximately $951 million each year) from July 2003 to 31 December 2008 to state and territory governments to provide housing assistance. The aim was to assist those people whose housing needs could not be met in the private rental sector to access appropriate and affordable housing.
The CSHA was replaced by a new National Affordable Housing Agreement on 1 January 2009.
Number of dwellings funded through the CSHA
Estimate 340,000 The variance is +54,290.
This is due to the estimate only including public housing. The actual figure includes public housing, community housing, state‑owned and managed Indigenous housing dwellings, and crisis accommodation dwellings funded through the CSHA.
Actual 394,290
Proportion of new applicants accommodated in social housing who are Indigenous
Estimate 13% The variance is +4%.
This is due to the estimate only including public housing. The actual proportion includes community housing and state‑owned and managed Indigenous housing. The result also reflects higher proportions of Indigenous households accommodated than estimated.
Actual 17%
Homelessness and HousingHomelessness and Housing includes measures to reduce homelessness and improve housing affordability. Under this administered item, work includes supporting and developing housing policy, increasing the availability of affordable rental properties and using innovative approaches to reducing homelessness, including demonstration projects to help families and individuals to maintain housing through early intervention, financial counselling and other support.
Number of households assisted to live in affordable housing
Estimate 3,500 The variance is –1,250.
The variance is due to the late passage of National Rental Affordability Scheme (NRAS) legislation and regulations (passed November 2008) and the subsequent late take up of NRAS by applicants.
Actual 2,250

196 FaHCSIA Annual Report 2008–2009 Part2 Performance reporting Chapter 9 Outcome 4
Percentage of households receiving services within the relevant national housing standards
Estimate 80% The variance is +20%.
All applicants must ensure that NRAS‑approved dwellings meet jurisdictional standards.
Actual 100%
Number of new houses
Estimate 3,500 The variance is –1,250.
The variance is due to the late passage of NRAS legislation and regulations (passed November 2008) and the subsequent late take‑up of NRAS by applicants.
Actual 2,250
Number/proportion of households in bottom two income quintiles paying no more than 30% of gross income in housing payments
Estimate 78% Data not available for 2008–09 at time of publication.
Actual See variance explanation
Percentage of tenancies in A Place to Call Home properties reported as stable over 2008–09
Estimate 90% This program is now part of the Homelessness National Partnership Agreement and subject to the reporting requirements of that agreement.Actual Not yet available—
see variance explanation
White Paper on homelessness prepared by FaHCSIA, including a national action plan to halve homelessness between 2008 and 2020
Estimate White Paper publicly released and national action plan launched September 2008
The timing variance is three months.
The delay of the White Paper release was due to the large number of submissions received through the consultation process and the COAG discussions on the National Affordable Housing Agreement.
Actual White Paper publicly released on 21 December 2008
National Rental Affordability Scheme—Rent AssistanceRent Assistance is a non‑taxable income supplement payable to eligible Australian residents who rent accommodation in the private rental market. To be eligible for Rent Assistance, a person must first qualify for an income support payment or receive more than the base rate of Family Tax Benefit A and must pay a minimum amount of rent, called the rent threshold.
Rent Assistance complements broader income support objectives by providing supplementary income (recognising the additional cost of private rental housing) and by improving housing affordability.

197
Perf
orm
ance
repo
rtin
gPa
rt 2
Chapter 9 Outcome 4 Part2 Performance reporting FaHCSIA Annual Report 2008–2009
Number/proportion of households in bottom two income quintiles paying no more than 30% of gross income in housing payments*
Estimate 630,000/64% of recipients
The actual proportion of Commonwealth Rent Assistance customers paying no more than 30% of gross income in housing payments is less than the estimated proportion, mainly as a result of rents having risen by an average of around 7% between June 2008 and June 2009.
Actual 608,814/59% of recipients
Control of incorrect payment and fraud: accuracy of administered outlays (total dollars correctly paid) as measured by the Random Sample Survey
Estimate Accuracy of administered outlays is greater than or equal to 95%
The ‘estimate’ is the agreed benchmark between FaHCSIA and Centrelink. The ‘actual’ figure is the estimated accuracy of administered outlays derived from Random Sample Survey data.
Actual 98.1%**
* Notwithstanding the title of this indicator, given that household level data and income quintile data are not available, the most meaningful way to report against this indicator is to report the proportion of the Commonwealth Rent Assistance income units paying 30% or less of their income in rent.
** Extrapolated from the data in 2005–06 (98.4%) and in 2006–07 (98.1%).
Social Housing SubsidyThe Social Housing Subsidy Program is a long‑term pilot project that subsidises the recurrent costs of financing additional rental accommodation for low‑ and moderate‑income earners. Under the program, one pilot project operates to expand community housing opportunities in New South Wales.
Number of dwellings funded to provide rental accommodation to low-income households
Estimate 253 dwellings No variance.
Actual 253 dwellings
Supported Accommodation Assistance ProgramThe National Affordable Housing Agreement subsumed the Supported Accommodation Assistance Program (SAAP), including the SAAP Innovation and Investment Fund, from 1 January 2009. This program was jointly funded by the Commonwealth and state and territory governments under the SAAP V Agreement (October 2005 to December 2008).
The program provided crisis accommodation and support to people who were homeless or at risk of homelessness. It aimed to help people who were homeless to achieve self‑reliance and independence by resolving crises and re‑establishing family links and the capacity to live independently. As a consequence of the shortening of the SAAP program to December 2008 and the extensive Green and White paper evaluation process, which included an examination of the functioning of the SAAP, the planned SAAP V program evaluation did not proceed.

198 FaHCSIA Annual Report 2008–2009 Part2 Performance reporting Chapter 9 Outcome 4
Funding to agencies that help the homeless is now provided under the National Affordable Housing Agreement with additional funding under the National Partnership Agreement on Homelessness to implement changes in the homelessness sector and mainstream services. From 2008–09 the COAG Reform Council will monitor performance by state and territory governments under the National Affordable Housing Agreement.
Number of clients assisted annually
Estimate 104,000 The variance is +21,600 (data is for 2007–08).
The increase in client numbers in 2007–08 is due to a number of factors, including an increase in the number of SAAP agencies, changes in economic conditions and also an underestimate of the actual number of clients (118,000) helped in 2006–07.
Actual 125,600
Percentage of clients who exited SAAP support to independent housing and did not return within six months
Estimate 45% The indicator was reviewed in the light of the changes to SAAP. Due to the complexity of the data and the time required to gather it as a result of the review, none was commissioned.Actual See variance
information
Number of occasions of support
Estimate 173,000 The variance is +47,300.
The variance is due to an increase in clients and changes in economic conditions. Data is for 2007–08.
Actual 220,300
Output Group 4.2Supporting financial managementUnder Output Group 4.2, FaHCSIA promoted the improved use and management of money by funding community agencies to help people in financial crisis through emergency relief and financial counselling services and by providing money management information and education. Output Group 4.2 also contributes to Outcome 4 by finding ways to reduce the impact of problem gambling.
Additional research was undertaken in 2008–09 to inform policies that will assist to reduce problem gambling.
Components of Output Group 4.2Financial Management ◗

199
Perf
orm
ance
repo
rtin
gPa
rt 2
Chapter 9 Outcome 4 Part2 Performance reporting FaHCSIA Annual Report 2008–2009
Financial ManagementThe Financial Management Program aims to improve the financial self‑reliance and wellbeing of individuals and families. Assistance includes financial counselling, educating people in money management (including in retirement), support for people dealing with a financial crisis and finding ways to minimise problem gambling.
Percentage of Australian Government Financial Counselling clients with increased knowledge and skills related to money management
Estimate 85% The variance is –2%.
Some issues that financial counsellors help resolve (such as issues requiring assistance with legal processes) are not related to poor money management skills.
Actual 83%
Percentage of clients whose issues are resolved
Estimate 90% Emergency Relief
90% Australian Government Financial Counselling
Emergency Relief variance is +3%.
Financial Counselling variance is +3%.
Actual 93% Emergency Relief
93% Australian Government Financial Counselling
Percentage of Emergency Relief services in place—by geographical location (state/territory)
Estimate NSW: 15–20%
Vic: 20–25%
Qld: 25–30%
SA: 10–15%
WA: 5–10%
Tas: 0–5%
NT: 0–5%
ACT: 0–5%
NSW—The variance is +4%.
Vic—The variance is 0%.
Qld—The variance is –4%.
SA—The variance is 0%.
WA—The variance is +4%.
Tas—The variance is 0%.
NT—The variance is 0%.
ACT—The variance is 0%.
Variances in NSW and WA are a consequence of new outlets opening in these states and old outlets in Qld ceasing to be funded.
Actual NSW: 24%
Vic: 20%
Qld: 21%
SA: 12%
WA: 14%
Tas: 3%
NT: 5%
ACT: 1%

200 FaHCSIA Annual Report 2008–2009 Part2 Performance reporting Chapter 9 Outcome 4
Percentage of Australian Government Financial Counselling clients from Indigenous or CALD backgrounds
Estimate 15% Indigenous
20% CALD
For Indigenous clients the actual result is the same as the estimate published in the 2008–09 Portfolio Budget Statements. The variance is:
Indigenous: 0%.
CALD: +2%.
The actual percentage of clients is consistent with ABS 2006 census data which shows that 22.2% of Australians were born overseas.
Actual 15% Indigenous
22% CALD
Number of clients assisted
Estimate 644,000 The variance is +102,810.
Services have reported higher client numbers due to the impact of the global economic downturn.
Actual 746,810
Number of services provided per annum
Estimate 1,030,000 The variance is –53,667.
Fewer than anticipated service episodes may reflect that services needed to spend slightly longer with each person due to greater case complexity.
Actual 976,333
Output Group 4.3Community recoveryOutput Group 4.3 contributes to Outcome 4 by recognising the importance of resilient communities and working with all levels of government, communities, businesses and the not‑for‑profit sector.
FaHCSIA contributes to community recovery from disasters and critical incidents domestically and internationally. In addition to Australian Government Disaster Recovery payments under the established Natural Disaster Relief and Recovery Arrangements, assistance may also be provided where there is a major disaster and when the Minister, in consultation with the Prime Minister, determines it is appropriate. This additional assistance is tailored to the circumstances and may include financial and other assistance to support the individuals and families affected.

201
Perf
orm
ance
repo
rtin
gPa
rt 2
Chapter 9 Outcome 4 Part2 Performance reporting FaHCSIA Annual Report 2008–2009
Components of Output Group 4.3Australian Government Disaster Recovery Payment ◗
Ex gratia payments to victims and family members of the Bali terrorist attacks ◗
Pandemic Influenza Preparedness ◗
Australian Government Disaster Recovery PaymentThe Australian Government Disaster Recovery Payment (AGDRP) provides immediate one‑off financial assistance to individuals adversely affected by a major disaster and contributes to Outcome 4 by empowering individuals to make positive decisions to assist in recovery from disasters and other critical incidents. The payment can be provided for natural and non‑natural disasters that affect Australians either here or abroad. The AGDRP was provided for five events in 2008–09, including the November 2008 Mumbai terrorist attacks, the south‑east Queensland storms, the northern Queensland floods, the February 2009 Victorian bushfires and the May 2009 northern New South Wales and south‑east Queensland floods.
In total, $130.793 million has been provided through the AGDRP to 114,000 individuals in 2008–09.
Payment made in accordance with Ministerial determination
Estimate 100% No variance.
In instances where fraudulent activity was identified, processes were in place to recover the payments as appropriate.
Actual 100%
Proportion of activations where all legislative requirements were met within 24 hours of decision to activate AGDRP
Estimate 100% No variance.
The AGDRP has been provided for five major disasters in 2008–09. For each of these events, assistance has been made available within 24 hours from finalisation of all legislative requirements.
Actual 100%
Ex gratia payments to victims and family members of the Bali terrorist attacksThe Government made a public commitment to support those injured in the 2002 and 2005 Bali bombings to help victims become more independent at home and in the community, including work and education, throughout their lifetime. This included assistance for home, vehicle and workplace modifications to help victims make the transition back to normal living and will available for as long as needed. Where a victim is in need of assistance outside existing programs, provisions are in place to consider the special circumstances of the matter on a case‑by‑case basis.

202 FaHCSIA Annual Report 2008–2009 Part2 Performance reporting Chapter 9 Outcome 4
This assistance contributes to the achievement of Outcome 4 by supporting the short‑ and long‑term recovery needs of victims of the Bali bombings.
Payment made in accordance with agreed assistance package
Estimate 100% No variance.
Actual 100%
Pandemic Influenza PreparednessDeveloping approaches for managing the adverse social and community impacts of a possible influenza pandemic in Australia is a key preparedness priority undertaken by FaHCSIA under the Commonwealth Government Action Plan for Influenza Pandemic.
FaHCSIA is building community resilience to a pandemic (and other disasters) by supporting community organisations to continue providing services during and after a pandemic and by ensuring a number of programs of assistance are available for vulnerable people in a pandemic, should they be needed.
Strategies developed and implemented to enhance community capacity to cope with a pandemic
Estimate All strategies implemented
No variance.
Actual All strategies were implemented
Output Group 4.4Community partnerships and deliveryOutput Group 4.4 contributes to Outcome 4 by promoting community self‑reliance and encouraging social participation and inclusion in the local community by individuals, families, business and government.
Under Output Group 4.4, policies and projects are developed that enhance social integration in Australian communities. Programs and activities are funded to develop the capacity of communities in areas of greatest need to identify and resolve local issues, explore opportunities, and build greater economic self‑reliance, strength and resilience. People are supported and encouraged to participate in their community, including through formal volunteering. Partnerships are fostered between business, community groups and governments to address community issues and encourage philanthropy.

203
Perf
orm
ance
repo
rtin
gPa
rt 2
Chapter 9 Outcome 4 Part2 Performance reporting FaHCSIA Annual Report 2008–2009
Components of Output Group 4.4Community engagement ◗
Innovation and Investment Fund ◗
Reconnecting People Assistance Package ◗
Community engagementThis administered item seeks to improve outcomes for individuals and families in disadvantaged communities by supporting volunteering, funding case and place‑based support, strengthening ties between business and the community and helping community organisations to function more effectively.
Percentage of individuals/families assisted to participate in a civic or community activity
Estimate 95% No variance.
The data was captured through the reporting requirements of each funded project. The majority of projects that are funded encourage community/social participation through encouraging volunteering.
Actual 95%
Percentage of projects (Local Answers and Volunteer Grants Program) by geographical location (state/territory)
Estimate NSW: 25–30%
Vic: 20–25%
Qld: 15–20%
SA: 5–10%
WA: 5–10%
Tas: 0–5%
NT: 0–5%
ACT: 0–5%
NSW—The variance is +1%.
The variance is due to the increased proportion of applications in the state.
Vic—The variance is +5%.
The variance is due to the increased proportion of applications in the state.
Qld—No variance.
SA—No variance.
WA—No variance.
Tas—No variance.
NT—No variance.
ACT—No variance.
The actual result is the same as the estimate published in the 2008–09 FaHCSIA Portfolio Budget Statements in most states except NSW and Vic due to the increased proportion of applications.
Actual NSW: 31%
Vic: 30%
Qld: 18%
SA: 6%
WA: 10%
Tas: 3%
NT: 1%
ACT: 1%

204 FaHCSIA Annual Report 2008–2009 Part2 Performance reporting Chapter 9 Outcome 4
Percentage of individuals/families (Local Answers and Volunteer Grants Program) from Indigenous, CALD backgrounds or with disability
Estimate 5% Indigenous—Local Answers
1.7%—Volunteer Management Program
24.2% CALD—Volunteer Management Program
5.8% people with disability—Volunteer Management Program
The variance is +12.73%.
The variance is due to the success of organisations in targeting Indigenous participants.
The variance is –1.3%.
The data on target groups is reliant on self‑identification and therefore subject to variation.
The variance is –17.4%.
The data on target groups is reliant on self‑identification and therefore subject to variation.
The variance is –4.4%.
The data on target groups is reliant on self‑identification and therefore subject to variation.
Actual 17.73% Indigenous—Local Answers
0.4%—Volunteer Management Program
6.8% CALD—Volunteer Management Program
1.4% people with disability—Volunteer Management Program
Number of individuals/families assisted
Estimate 347,000 The variance is +109,339.
The variance is due to an increase in the number of funded projects, combined with increased volunteering activities and a focus on projects that better target whole‑of‑community activities.
Actual 456,339
Number of funded projects
Estimate 7,350 The variance is +333.
The variance is due to a greater number of projects being funded than anticipated.
Actual 7,683
Innovation and Investment FundThe Innovation and Investment Fund is an initiative under the Supported Accommodation Assistance Program (SAAP) V Agreement. The fund, which is a collaborative venture between the Government and state and territory governments, aims to progress and strengthen the strategic priorities of the SAAP V Agreement through the funding of innovative and best practice service delivery models.
Reconnecting People Assistance PackageThe Reconnecting People Assistance Package (RPAP) is available to eligible individuals who have been adversely affected as a direct result of their inappropriate immigration detention within Australia. The package helps individuals re‑establish their lives and reconnect with their families and communities.

205
Perf
orm
ance
repo
rtin
gPa
rt 2
Chapter 9 Outcome 4 Part2 Performance reporting FaHCSIA Annual Report 2008–2009
Those eligible under the package may be offered a single service, or a combination of services, based on their circumstances. Assistance can include case management support from a Centrelink social worker, reasonable out‑of‑pocket medical expenses, personal financial assistance, and assistance with travel to their preferred residential location.
Number of calls to RPAP hotline answered and resolved
Estimate 100% No variance.
All calls were usually resolved during the initial contact.Actual 100%
Eligible individuals assisted
Estimate 100% No variance.
Actual 100%

207 Chapter 10 Our governance arrangements
227 Chapter 11 Our people
246 Chapter 12 Our stakeholders
253 Chapter 13 Our enabling strategies
269 Chapter 14 Our accountability 3Corporate governance and accountability

207Chapter 10 Our governance arrangements Part3 Corporate governance FaHCSIA Annual Report 2008–2009
Corp
orat
e go
vern
ance
and
acc
ount
abili
tyPa
rt 3
Our governance arrangements at a glanceCorporate governance provides the system by which FaHCSIA directs and controls our operations and the structure through which departmental objectives are set and enacted. FaHCSIA’s governance structure comprises the Secretary and the Executive Management Group, supported by boards and committees that provide advice relating to our administration and overall operation.
FaHCSIA also has in place a strategic framework that guides our direction, sets out the leadership and personal values that we uphold and outlines the core business practices and governance processes that will help FaHCSIA to achieve real outcomes for Australian communities, families and individuals.
Our executive
Dr Jeff Harmer, SecretaryJeff Harmer was appointed as Secretary of the Department in October 2004 and reappointed in October 2008. He was previously Secretary of the Department of Education, Science and Training (2003–04), and before that, Managing Director of the Health Insurance Commission, now Medicare Australia (1998–2003). Jeff has held a range of high‑level policy advising positions in the Australian Government.
In February 2009, the Secretary completed a major review into the adequacy of the Age Pension. He is a member of a panel chaired by Dr Ken Henry to review the Australian Tax and Transfer System.
As Secretary, Jeff is responsible for the administration and the corporate and strategic directions of the Department and the portfolio. He provides senior policy counsel on major and sensitive policy issues to the portfolio ministers and parliamentary secretaries. He also represents the Department in a variety of government, industry and business sector forums.
Our governance arrangements10

208 FaHCSIA Annual Report 2008–2009 Part3 Corporate governance Chapter 10 Our governance arrangements
Through these, Jeff develops and maintains high‑level relationships with the Department’s key stakeholders. He sits on the boards of the Australian Research Alliance for Children and Youth and the Melbourne Institute Advisory Board. He is also a Fellow of the Australian Institute of Management and the Institute of Public Administration Australia.
Glenys Beauchamp, Deputy SecretaryGlenys Beauchamp was appointed Deputy Secretary of the Department in January 2006. In addition to assisting the Secretary with the directions and outcomes for the Department, she has responsibility for outcomes covering families, including implementation of the Government’s Paid Parental Leave scheme, child support reforms and welfare payments reform; women; early childhood; mental health; and a range of community‑based programs.
Glenys came to FaHCSIA at the end of 2002 from the ACT Government and since that time has had oversight of a number of functions in the Department. She is a member of the Australian Institute of Family Studies Advisory Board and a member of the Australian Statistics Advisory Committee.
‘2008–09 presented the portfolio, like most others, with meeting additional challenges to address the impacts of the most difficult global economic conditions of recent times. ‘The Department assisted government with the implementation of a short‑term stimulus package in late 2008 through cash payments to pensioners, carers, veterans and families and its medium‑term infrastructure package, including a large investment in social housing.
‘Significant structural changes were announced by the Government in key social policy areas such as reform of the age pension system, the introduction of Australia’s first national Paid Parental Leave scheme, additional investment into areas like homelessness and social housing and an apology to Indigenous Australians.
‘The Department is supporting the delivery of these substantial reforms but has made significant progress in streamlining the administration of community grants, rationalising the number of community‑based programs and commenced consultation in the development of the Government’s compact with the not‑for‑profit sector.
‘The development and implementation of major reforms and initiatives has been an ongoing feature for the Department in 2008–09, and again has had a positive influence on our reputation in the way we have developed and delivered for the Government. I would like to offer a big thanks from the executive to all staff in the professional way these challenges have been met in difficult times.’

209
Corp
orat
e go
vern
ance
and
acc
ount
abili
tyPa
rt 3
Chapter 10 Our governance arrangements Part3 Corporate governance FaHCSIA Annual Report 2008–2009
Geoff Leeper, Deputy SecretaryGeoff Leeper was Deputy Secretary in the Department of Families, Housing, Community Services and Indigenous Affairs from 2007 to 2009. He was previously Deputy Secretary in the Department of Human Services (2005–07) and Deputy Chief Executive Officer in Medicare Australia (2001–05).
While at FaHCSIA, Geoff assisted the Secretary in managing the Department, with special focus on the Housing, Legal and Compliance, and Indigenous Remote Services Delivery groups and the Office of Indigenous Policy Coordination. He was also the Chair of the Risk Assessment and Audit Committee and was the Commonwealth Director on the Board of the Australian Housing and Urban Research Institute.
Geoff has had a long and distinguished career in social policy, including in the Department of Social Security, Centrelink, the former Department of Family and Community Services, the Health Insurance Commission and the Department of Human Services, and has a great depth of experience in policy, program administration and corporate affairs.
Geoff joined the Department of Climate Change as Deputy Secretary in June 2009.
Robyn McKay, Acting Deputy SecretaryRobyn McKay joined the then Department of Family and Community Services in early 1999 as Group Manager, Families and Children. From 2002 to 2005, she was Minister‑Counsellor, Social Policy, at the Australian Delegation to the OECD in Paris. She led the Social Policy Group in FaHCSIA in 2006 before taking up her role as Acting Deputy Secretary in October 2006.
Robyn has had a long career in social policy spanning employment programs; industrial relations and wages policy; higher education policy and program administration; health, families and income support policy and programs; and commercialisation and privatisation policy. Before joining FaHCSIA she worked in senior executive positions in the departments of Employment, Education and Training (1989–95) and Finance and Administration (1995–98), where she led the Accrual Budgeting Project.
Robyn’s role has been to assist the Secretary in managing the Department, with particular responsibility for strategic policy, the Age Pension, social security relationships and compliance, research, and international engagement, as well as the Office of the Registrar of Indigenous Corporations, the Pension Review Taskforce, and supporting the Secretary in his role on the Henry Tax System review. She was chair of the Research and Evaluation Committee, the Payments Committee and the Budget Policy Committee, and was the FaHCSIA representative on the Board of the Australian Institute of Health and Welfare.

210 FaHCSIA Annual Report 2008–2009 Part3 Corporate governance Chapter 10 Our governance arrangements
Since the completion of the Pension Review at the end of February, Robyn has been on extended leave, pending retirement later in 2009.
‘The last year has been one of major change, with a strengthened focus on cross‑cutting policy development, reflected in considerable review activity. The Pension Review was a significant achievement of 2008. It highlighted the importance of FaHCSIA’s analytical capacity, strong research base and investment in longitudinal data to make major contributions to work on social inclusion and income support, and the pride our people take in robust analysis and working across organisational boundaries.’
Bernie Yates, Deputy SecretaryBernie Yates has been Deputy Secretary in the Department since January 2006, following the integration of the Office of Indigenous Policy Coordination into FaHCSIA. Bernie assists the Secretary with managing whole‑of‑government policy development in Indigenous affairs, the Department’s program management framework and oversees our network of over 30 offices across urban, regional and remote Australia.
‘This year has seen major advances in the Closing the Gap strategy developed by the Council of Australian Governments (COAG), with major investments through national agreements and partnerships to progress achievement of the ambitious targets in Indigenous early childhood, education, health and employment and to address critical housing requirements. Attention is now being given to implementation of these commitments and ensuring much‑improved outcomes for disadvantaged Indigenous people in urban, regional and remote Australia. A new remote strategy forms a key part of this work, including governments at all levels working in partnership with Indigenous people in identified locations, overseen by a new statutory position of Coordinator‑General for Remote Indigenous Services.
‘As part of the ongoing steps to reset the relationship with Indigenous people, the Government supported the United Nations Declaration on the Rights of Indigenous Peoples and has strengthened consultation and engagement across a range of key initiatives, including development of the new National Indigenous Representative Body and a Healing Foundation.
‘Following an independent review of the Northern Territory Emergency Response, which reported in October 2008, extensive work has been undertaken, including extensive consultations with Indigenous people in the Northern Territory to guide revision of measures to achieve compliance with the Racial Discrimination Act 1975.
‘The Department has also given greater attention to reducing red tape and streamlining requirements for funding of community organisations, working with representatives of service providers to ensure that, as far as possible, funding can be applied to

211
Corp
orat
e go
vern
ance
and
acc
ount
abili
tyPa
rt 3
Chapter 10 Our governance arrangements Part3 Corporate governance FaHCSIA Annual Report 2008–2009
better services while ensuring due accountability for outcomes. This is seeing some breakthroughs in how the Department is conducting its program business, working also with other agencies involved in Indigenous program delivery to do likewise.’
Serena Wilson, Deputy SecretarySerena Wilson was appointed as Deputy Secretary of the Department in March 2009. Before joining FaHCSIA, Serena was in the Department of the Prime Minister and Cabinet, where she led the Social Policy Division. Serena’s career has spanned many areas of social policy across a range of Commonwealth departments, including Employment and Workplace Relations, Family and Community Services, Social Security, Health and Community Services, and Housing and Construction. In the 11 years she
spent in the Family and Community Services and Social Services portfolios, Serena led work on welfare reform, income support for people of working age, fraud and compliance policy, carer policy, and strategic analysis and research.
Serena assists the Secretary in managing the Department with particular responsibilities for strategic policy and budget strategy, the Age Pension, social security relationships and compliance, research and international engagement, the Tax‑Transfer Taskforce and the Disability and Carers Group. She is chair of the Department’s Research and Evaluation Committee and Payments Committee and jointly chairs the Budget Policy Committee with Bruce Hunter. Serena is the FaHCSIA representative on the Board of the Australian Institute of Health and Welfare.
‘2008–09 has been a year of great achievement for FaHCSIA. It is particularly significant that far‑reaching reform of the pension system is being undertaken in the centenary year of the Age Pension. The Pension Review was well supported by evidence drawn from key FaHCSIA datasets, including the Household Income and Labour Dynamics in Australia (HILDA) survey, now in its ninth wave. 2008–09 has seen two further milestones in the development of our social policy evidence base: completion of the first wave of data collection for Footprints in Time—the Longitudinal Study of Indigenous children—and the release of Life at Three, supported by the third wave of data from the longitudinal study of Australian children. Continued development of these datasets will position FaHCSIA well in the future to advise on policy reforms across our seven outcomes.’

212 FaHCSIA Annual Report 2008–2009 Part3 Corporate governance Chapter 10 Our governance arrangements
Bruce Hunter, Deputy Secretary, Chief Operating Officer and Chief Financial Officer
Bruce Hunter took up his role as FaHCSIA’s Deputy Secretary, Chief Operating Officer and Chief Financial Officer on 10 June 2008. In this role Bruce assists the Secretary in managing the Department, and has responsibility for the Business and Financial Services, Corporate Support, and Information Management and Technology groups. While Bruce is a member of the Executive Management and Senior Management groups, he also is the chair of seven key departmental committees including the
Remuneration, People, and Information and Communications Technology committees.
Bruce has many years of experience in the public and private sector and joined FaHCSIA in November 2006 as Group Manager, Business and Financial Services. Before joining FaHCSIA, Bruce was Executive Director Corporate at the Family Court of Australia, where he was responsible for providing strategic leadership and management of the finance, property, human resources, security, contract management and secretariat functions at a national level for the court.
‘I am proud of the achievements of the corporate/enabling areas in supporting the Department to meet a range of significant challenges in 2008–09, such as the COAG reforms, the Pension Review, the Paid Parental Leave scheme, and the Northern Territory Emergency Response. These same enabling areas also responded very efficiently and positioned the Department well for the changing operating environment associated with Operation Sunlight, the Gershon Review, and coordinated procurement.
‘In 2009–10 I will continue to look at ways to better integrate our corporate, finance and IT areas to support the Minister and the Department and ensure FaHCSIA is well positioned to meet future challenges.’

213
Corp
orat
e go
vern
ance
and
acc
ount
abili
tyPa
rt 3
Chapter 10 Our governance arrangements Part3 Corporate governance FaHCSIA Annual Report 2008–2009
2009 FaHCSIA Senior Executive Service Future Directions Forum.

214 FaHCSIA Annual Report 2008–2009 Part3 Corporate governance Chapter 10 Our governance arrangements
Our organisational structureFigure 3.1 Organisational structure as at 30 June 2009
SecretaryDr Jeff Harmer
Deputy SecretaryGlenys Beauchamp
Deputy SecretarySerena Wilson
Families
Barry Sandison
Family Payments
Peter Southwell
a/g
Family Relationship
Services
Sonia Cornelly a/g
Family Policy & Research
Lee Emerson
Child Support Policy
Allyson Essex
Children & Parenting Support
Ty Emerson
Paid Parental Leave
Mark Warburton
Children’s Policy
Fiona Smart
Safety Taskforce
Janet Stodulka a/g
Executive Director Office
for Women
Julia Burns
Group Manager
Children & Family Safety
Cate McKenzie
Office for Women
Sally Moyle
Strategic Projects
Helen Hambling
Community Engagement
& Development
Evan Lewis
Mental Health
Carol Brain
Autism Spectrum Disorder
Vicki Brown
Disaster Preparedness
& Recovery
Beryl Janz
Welfare Payments
Reform
Gavin Matthews
Community Investment
Jill Farrelly
Money Management
Liz Stehr
Social Policy
Sean Innis
Corporate Support
Robert Knapp
Deputy SecretaryChief Operating Officer/CFO
Bruce Hunter
Social Security
Policy
Ben Wallace
Ministerial, Parliamentary & Secretariat
Support
Susan Black
Seniors & Means Test
Alanna Foster
People
Lynette MacLean
Strategic Policy
Bryan Palmer
Long Term Strategies
Unit
Christine Williams
Property Environment & Protective
Security
Dave Agnew
Research and Analysis
Carol Ey
Communications & Media
Andrew Lander
International
Michalina Stawyskyj
Tax-Transfer Taskforce
Nick Hartland a/g
Information Management & Technology
Tony Kwan
Tax-Transfer Review
Andrew Whitecross
a/g
ICT Infrastructure
Projects
Kylie Williams a/g
ICT Applications Development
Max Devereux
ICT Infrastructure
Services
Scott Glare
Information Management
Ingrid Blount
Disability & Carers
Frances Davies
Business & Financial
Services
Steve Jennaway
a/g
Disability & Carers Policy
Helen Bedford
Disability & Carers Programs
Christine Bruce
Disability & Carers
Payments
Nicole Pearson
Procurement & Risk
Management
John Shevlin
Financial Accounting
Kurt Munro
Financial Management & Governance
Scott Dilley
Budget Development
Kim Vella a/g
= Statutory Office Holder
= Temporary Arrangement
Women & Children Policy

215
Corp
orat
e go
vern
ance
and
acc
ount
abili
tyPa
rt 3
Chapter 10 Our governance arrangements Part3 Corporate governance FaHCSIA Annual Report 2008–2009
SecretaryDr Jeff Harmer
Office of Indigenous
Policy Coordination
Lynne Curran
Legal & Compliance
Anthony Field
Principal Adviser
Matthew James a/g
Commercial & Indigenous
Law
David Fintan
Indigenous Policy
Alison Smith / Bruce Smith
Public Law
Stuart Long a/g
Performance & Evaluation
Stephen Powrie
a/g
Compliance
Phil Brown
Indigenous Investment
Annette Gath a/g
COAG Implementation:
Indigenous
Lisa Foreman a/g
Audit
Loucas Nicolaou
Housing
Peta Winzar
Social Housing Initiative
Chris Lamont
Office of Housing
Cathy Walters a/g
Social Housing Initiative
TBA
Affordable Housing
Programs
Sue Ham a/g
Homelessness
Kate Gumley
Senior Adviser Housing
Clare Wall a/g
Indigenous Remote Service Delivery
Kari Ahmer a/g
Indigenous Economic
Development & CDEP Policy
Keith Ogborn a/g
Indigenous Housing Delivery
Robert Ryan
CDEP Program
Management
Helen Board
Indigenous Housing
Policy
Megan Lees
Land Reform
Caroline Edwards
Indigenous Leadership & Engagement
Kerrie Tim
Reconciliation & Repatriation
Mandy Doherty
Leadership Delivery
Karen Pickering
a/g
Indigenous Engagement
TBA
National Representative
Body
Geoff Richardson
Program Performance
Donna Moody
Portfolio Governance & Program
Support
Mark Garrity
Program Frameworks
Deborah Winkler
Indigenous Programs
Greg Roche
Network Management
Jan Lawless
APY Lands
Adrienne Gillam
Registrar of Indigenous
Corporations
Anthony Beven
Strategic Project
(Office of Coordinator-
General)Di Hawgood
a/g
NTER Operations
CentreMike Zissler
(Commander)Brian Aarons
(Chief of Staff )
Deputy SecretaryBernie Yates
Deputy SecretaryAmanda Cattermole a/g
Township Leasing
Pat Watson
State & Territory ManagersNSW/ACT
Susan Finnigan
James McCormack (Dubbo)
VIC Gwenda Prince
TAS Wendi Key
QLD Anne‑Marie Roberts a/g
Mike Fordham (Cairns)
SA Robyn Fleming
WA Roger Barson
Richard Aspinall (Broome)
David Pedlar (Kumunurra)
NT Brian Stacey
Barry Johson (Deputy State Manager)
Mark Coffey (Regional Director)
Joe Martin‑Jard (Regional Director)

216 FaHCSIA Annual Report 2008–2009 Part3 Corporate governance Chapter 10 Our governance arrangements
Boards and committeesWithin FaHCSIA, a number of internal committees have been established to provide advice and support to the Secretary and the Executive Management Group on the administration and overall operation of the Department (see Figure 3.2). Generally, internal committees are made up of FaHCSIA employees, although some internal committees may also have one or more independent members who are not FaHCSIA employees.
The following section provides further information on FaHCSIA’s internal committees, comprising membership details, roles and responsibilities, and reporting requirements.
Figure 3.2 FaHCSIA governance structure as at 30 June 2009
Secretary*
Senior Management Group Executive Management Group
Information and Communications
Technology Committee
Research and Evaluation Committee
Commonwealth–State Relations
Committee
People Committee
Payments Committee
Remuneration Committee
Program Management
Committee
Budget Policy Committee
Closing the Gap Committee
Financial Statements
Sub‑Committee
Compliance and Integrity Committee
Project Investment
Board
Risk Assessment and Audit
Committee
* Dr Jeff Harmer, Secretary, FaHCSIA, is Chair of the Executive Management Group, the Senior Management Group and the Closing the Gap Committee.

217
Corp
orat
e go
vern
ance
and
acc
ount
abili
tyPa
rt 3
Chapter 10 Our governance arrangements Part3 Corporate governance FaHCSIA Annual Report 2008–2009
Committees reporting to the SecretaryExecutive Management GroupThe Executive Management Group is the senior committee in FaHCSIA and provides advice to the Secretary on overall direction, priorities, management and performance (see Table 3.1). In addition, the group manages the Department’s financial performance by allocating resources, monitoring performance and risk and ensuring the Department meets its regulatory requirements.
The group also provides a forum for cross‑group issues to be managed, and guides, coordinates and champions key organisational reform processes.
The Executive Management Group is chaired by the Secretary, Dr Jeff Harmer. Membership consists of the deputy secretaries and the Group Manager, Corporate Support.
Executive Management Group, left to right: Amanda Cattermole (a/g Deputy Secretary), Robert Knapp, Jeff Harmer, Serena Wilson, Bernie Yates, Glenys Beauchamp.

218 FaHCSIA Annual Report 2008–2009 Part3 Corporate governance Chapter 10 Our governance arrangements
Table 3.1 FaHCSIA Executive Management Group as at 30 June 2009
SecretaryDr Jeff Harmer
Deputy SecretariesGlenys Beauchamp
Amanda Cattermole*Bruce Hunter**Serena WilsonBernie Yates
Group Manager, Corporate SupportRobert Knapp
* As at 30 June 2009, Amanda Cattermole was acting in this role.** As at 30 June 2009, Bruce Hunter was also the Department’s Chief Operating Officer and Chief Financial Officer.
Senior Management Group
Senior Management Group, row 1, left to right: Donna Moody, Glenys Beauchamp, Jeff Harmer, Serena Wilson, Bernie Yates, Tony Kwan, Anthony Bevenrow 2, left to right: Frances Davies, Peta Winzar, Kerrie Tim, Nick Hartlandrow 3, left to right: Cate McKenzie, Anthony Field, Amanda Cattermole, Helen Hambling, Barry Sandison row 4, left to right: Evan Lewis, Steve Jennaway, Chris Lamont, Julia Burns, Robert Knapp.

219
Corp
orat
e go
vern
ance
and
acc
ount
abili
tyPa
rt 3
Chapter 10 Our governance arrangements Part3 Corporate governance FaHCSIA Annual Report 2008–2009
The Senior Management Group meets weekly to undertake strategic discussions on policy themes and issues, key organisational risks, performance and evaluation and other high level matters. The group is FaHCSIA’s primary forum for senior executive consultation with group managers from across the Department.
The group is chaired by the Secretary. Membership consists of deputy secretaries, group managers, and the Registrar of Indigenous Corporations (see Table 3.2).
Table 3.2 FaHCSIA Senior Management Group as at 30 June 2009
* As at 30 June 2009, these officers were acting in these roles.** As at 30 June 2009, Bruce Hunter was also the Department’s Chief Operating Officer and Chief Financial Officer.*** Registrar of Indigenous Corporations.
Risk Assessment and Audit CommitteeThe Risk Assessment and Audit Committee is a mandatory committee, established by the Secretary pursuant to the Financial Management and Accountability Act 1997.
The role of the committee is to provide independent assurance and assistance to the Secretary and the Executive Management Group on the design and operation of FaHCSIA’s risk, control and compliance framework, and external accountability and responsibilities.
The committee has the authority to request any information it requires from any employee of FaHCSIA, and to discuss any matter with the Chief Internal Auditor, the contracted internal audit service provider, the Australian National Audit Office and the Office of Evaluation and Audit. The committee is also authorised to take independent, professional advice as it considers necessary.
SecretaryDr Jeff Harmer
Deputy Secretaries
Glenys Beauchamp
Amanda Cattermole*
Bruce Hunter**
Serena Wilson Bernie Yates
FaHCSIA Group Managers
Peta WinzarKari Ahmer*
Steve Jennaway*
Evan LewisCate McKenzieDonna Moody
Barry SandisonKerrie Tim
Nick Hartland*Sean Innis
Robert KnappTony Kwan
Chris Lamont
Anthony Beven***Julia Burns
Lynne CurranFrances DaviesAnthony Field

220 FaHCSIA Annual Report 2008–2009 Part3 Corporate governance Chapter 10 Our governance arrangements
The committee has a Financial Statements Sub‑Committee, which oversees the preparation of FaHCSIA’s financial statements. The Financial Statements Sub‑Committee reports and provides assurance to the committee on all matters regarding the preparation of the Department’s annual financial statements. The Chair of the Financial Statements Sub‑Committee provides a report at each committee meeting.
In addition, the Chief Financial Officer also regularly reports and provides assurance to both this committee and the Executive Management Group on the Department’s financial policy and financial control framework. The committee has two independent external members.
The committee meets six times each year, with one meeting devoted to the examination of the annual financial statements. Following each meeting, the committee reports the key outcomes to the Executive Management Group through its Chair, Deputy Secretary Bernie Yates. Its membership includes two independent members; the Group Manager, Corporate Support; the Group Manager, Families; and the Branch Manager, Social Security Policy.
Remuneration CommitteeThe Remuneration Committee advises the Secretary on the development and implementation of the Department’s remuneration policy, including the Collective Agreement and individual remuneration policy. It also considers and determines individual remuneration proposals that fall outside the scope of the Secretary’s endorsed remuneration policy.
The FaHCSIA Remuneration Committee is chaired by the Chief Operating Officer and Chief Financial Officer, Bruce Hunter. Membership includes all deputy secretaries and the Group Manager, Corporate Support.
Committees reporting to the Executive Management GroupBudget Policy CommitteeThe Budget Policy Committee manages the Department’s budget policy agenda and contribution to the Federal Budget process. The committee advises the Secretary and is jointly chaired by deputy secretaries Serena Wilson and Bruce Hunter. Membership includes all deputy secretaries, three group managers and the Budget Development Branch Manager.
The committee’s role is to:
identify key areas of focus ◗
determine departmental priority for Budget initiatives in collaboration with the Minister ◗

221
Corp
orat
e go
vern
ance
and
acc
ount
abili
tyPa
rt 3
Chapter 10 Our governance arrangements Part3 Corporate governance FaHCSIA Annual Report 2008–2009
ensure that the synergies between the various proposals that form the Budget strategy ◗
are identified and optimised
assess risks to the Department’s Budget policy agenda and develop ◗
mitigating strategies.
People CommitteeThe People Committee ensures that human resource strategies are aligned with the Department’s strategic directions and business priorities. Chief Operating Officer and Chief Financial Officer, Bruce Hunter, chairs the committee. Its members are the Group Manager, Corporate Support; the Executive Director of the Office for Women; the branch managers of the People, Mental Health, Land Reform and Financial Accounting branches; the State Manager New South Wales; and the Manager of Dubbo Indigenous Coordination Centre.
The committee’s role is to:
oversee, support and monitor the implementation of the Department’s strategic human ◗
resource framework
provide strategic advice to the Executive Management Group on integrating FaHCSIA’s ◗
people planning and development with our strategic directions and business priorities
provide strategic leadership to foster a workforce that operates in line with the APS ◗
Values and Code of Conduct and our departmental values and leadership capabilities
provide leadership to foster an innovative, safe, flexible, responsive, capable, ethical and ◗
accountable workforce
engage the Executive Management Group in strategic dialogue about current and ◗
emerging people issues, provide timely and informed advice against the backdrop of wider workplace reforms and business needs.
Payments CommitteeThe Payments Committee is the key departmental forum for discussion and development of coordinated advice to the Executive Management Group and the Secretary in relation to the management of income support payments (pensions and allowances) and family assistance payments.
The committee is chaired by Deputy Secretary Serena Wilson. Its membership includes the group managers of the Social Policy, Families, Disability and Carers, Housing, Mental Health, Autism and Community Support, Pension Review, Social Security Policy groups, and the Branch Manager, Budget Development Branch.

222 FaHCSIA Annual Report 2008–2009 Part3 Corporate governance Chapter 10 Our governance arrangements
The committee’s role is to:
provide an enabling role to support the FaHCSIA executive in managing social security ◗
payments with a cross‑payment perspective
support existing assurances to the Risk Assessment and Audit Committee and the ◗
Secretary on payment performance and integrity for the Budget and the annual report
provide a platform for information sharing on new policy proposals and testing their ◗
implications across payments
support the implementation of high‑priority and sensitive initiatives and processes ◗
provide a coordination role to support FaHCSIA’s interaction with policy departments ◗
(for example, the Departments of Education, Employment and Workplace Relations and Human Services) on social security matters and with Centrelink at Business Partnership Agreement committees and quarterly business discussions
provide a forum to establish common approaches to address particular customer ◗
groups’ needs
commission work on the development of an overarching performance framework ◗
for payments including identification of common key performance indicators and benchmarks.
In carrying out its role, the committee undertakes a whole‑of‑FaHCSIA approach and focuses on three streams of work: policy, performance management and service delivery, and evidence and data management.
Project Investment BoardThe Project Investment Board provides the executive with advice and recommendations on capital budgeting and investment across the portfolio.
The board is chaired by the Group Manager, Business and Financial Services, and membership comprises the Chief Information Officer and the Group Manager, Corporate Support. Its members are supported by their respective branch managers.
The board’s key objectives are to:
ensure the Department invests in strategically important opportunities ◗
provide the executive with options on balancing demands on capital ◗
set the direction for future investments by annually reviewing 5–10‑year capital and asset ◗
replacement plans
recommend major capital projects to the executive ◗
advise project committees and groups on the strategic directions for the following ◗
financial year.

223
Corp
orat
e go
vern
ance
and
acc
ount
abili
tyPa
rt 3
Chapter 10 Our governance arrangements Part3 Corporate governance FaHCSIA Annual Report 2008–2009
Indigenous Policy ForumThe Indigenous Policy Forum was discontinued in January 2009 and replaced by the Closing the Gap Committee (see below).
Closing the Gap CommitteeDuring 2008–09, a new committee was established to ensure the Department delivers on its responsibilities in relation to the Government’s Closing the Gap agenda. It is chaired by the Secretary, Dr Jeff Harmer, and membership includes all FaHCSIA deputy secretaries and group managers and the Queensland State Manager.
The committee’s role is to:
provide strategic oversight of policy development in Indigenous affairs ◗
monitor the implementation of COAG policies and strategies relevant to ◗
FaHCSIA business.
The committee aims to ensure that FaHCSIA provides well‑coordinated, seamless policy development and advice to the Ministers.
Compliance and Integrity CommitteeThe Compliance and Integrity Committee further strengthens the focus of FaHCSIA on accountability, good governance and ethical practices both within FaHCSIA itself, and in relation to the entities with which FaHCSIA deals, particularly entities that receive, and so are accountable for, public money. The committee is chaired by Deputy Secretary, Bernie Yates, and its membership consists of Deputy Secretary, Serena Wilson (Deputy Chair), group managers of the Program Performance and Corporate Support groups and the State Manager, New South Wales.
The committee’s role is to:
contribute to the overall accountability framework, including (in liaison with the Risk ◗
Assessment and Audit Committee) the Fraud Control Plan and fraud awareness
directly oversee the conduct of all investigation and compliance activities within ◗
FaHCSIA, ensuring that these activities conform with applicable laws, prescribed practices and mandated procedures, as well as with the strategic objectives of FaHCSIA, and are conducted effectively and in a proper and timely manner
stimulate appropriate and prompt reporting ◗
directly oversee any remedial action required as a consequence of investigation or ◗
compliance activities.

224 FaHCSIA Annual Report 2008–2009 Part3 Corporate governance Chapter 10 Our governance arrangements
The committee’s scrutiny of individual cases provides assurance that any decision made or recommended by individual compliance officers or investigators, and those supervising their activities, is truly accountable and will withstand scrutiny.
Information and Communications Technology CommitteeThe Information and Communications Technology Committee provides leadership and long‑term focus on information and communications technology (ICT) infrastructure and projects within FaHCSIA. It is the major departmental decision‑making body for long‑term infrastructure planning, ICT project planning and project funding within the broad directions set by the Executive Management Group.
Bruce Hunter chairs the committee, whose members in 2008–09 were Deputy Secretary Geoff Leeper, the Chief Information Officer, group managers from the Business and Financial Services and Program Performance groups, and the Registrar of Indigenous Corporations.
The committee’s role is to provide strategic advice to the Executive Management Group on matters relating to ICT. It develops the ICT investment strategy and considers and recommends ICT funding to the Executive Management Group. This involves:
determining relative ICT priorities from a business perspective ◗
ensuring that project benefits are defined and realised ◗
monitoring and advising the Executive Management Group on investment risks ◗
approving, rejecting or deferring ICT proposals. ◗
This committee also oversees ICT project steering committees as determined from time to time.
Program Management CommitteeThe Program Management Committee provides strategic advice on the priorities of FaHCSIA’s grant programs and on the risks and opportunities arising from program management activities.
The committee is co‑chaired by deputy secretaries Bernie Yates and Glenys Beauchamp. Membership consists of group managers responsible for program administration, a state office representative and branch managers from the Program Performance Group.
The committee also provides direction on program management policies, common business processes and the strengthening of program management capability, and provides direction to the Program Branch Managers Forum. In addition, a Funding Management System Steering Committee provides information to the committee on system‑related business development opportunities and directions.

225
Corp
orat
e go
vern
ance
and
acc
ount
abili
tyPa
rt 3
Chapter 10 Our governance arrangements Part3 Corporate governance FaHCSIA Annual Report 2008–2009
Research and Evaluation CommitteeThe Research and Evaluation Committee’s role is to facilitate the development of evidence‑based policy by providing strategic advice in relation to FaHCSIA’s research, evaluation and data management activities.
The purpose of the committee is to support the Executive Management Group in its governance responsibilities relating to research, evaluation and data management to ensure that:
the research and evaluation program is focused on the Government’s policy agenda and ◗
aligned to FaHCSIA’s strategic themes
high‑quality research standards are established and maintained ◗
potential risks related to the research and evaluation program are identified and ◗
managed appropriately
research and evaluation activities comply with relevant legislation, regulations and codes ◗
of conduct
data management activities align with business needs and priorities. ◗
The committee is chaired by Deputy Secretary, Serena Wilson. Its membership comprises the group managers of the Social Policy, Office of Indigenous Policy Coordination, Housing, Families and Disability and Carers groups and the branch managers of the Research and Analysis, Office of Women and Information Management branches. The branch managers of Strategic Policy Branch and the Long Term Strategies Unit are advisors to the committee.
The committee has overall responsibility for research and evaluation in FaHCSIA which must be approved by the committee.
Commonwealth–State Relations CommitteeThe Commonwealth–State Relations Committee is a new committee. Its inaugural meeting was held on 16 April 2009.
The committee provides the key departmental forum for discussion and development of coordinated advice to the Executive Management Group and the Secretary on the management of Commonwealth–state business.
The committee is chaired by a deputy secretary. Its members are the managers of the following groups: Women and Children Policy, Disability and Carers, Office of Indigenous Policy Coordination, Housing, Community Engagement and Development, Program Performance, and Social Policy, and two State Managers.

226 FaHCSIA Annual Report 2008–2009 Part3 Corporate governance Chapter 10 Our governance arrangements
The terms of reference for the committee are to:
oversee, support and monitor the implementation of the Department’s whole‑of‑ ◗
Commonwealth–state business
oversee FaHCSIA‑wide processes and responsibilities under the new COAG Framework ◗
for Federal Financial Relations
ensure FaHCSIA works effectively with ministerial councils and working groups to ◗
progress desired policy outcomes
ensure processes are in place to enable FaHCSIA to provide accurate and timely ◗
information to assist the policy development process
advise the Executive Management Group on current and emerging Commonwealth–state ◗
issues.

227Chapter 11 Our people Part3 Corporate governance FaHCSIA Annual Report 2008–2009
Corp
orat
e go
vern
ance
and
acc
ount
abili
tyPa
rt 3
Our people at a glanceTo achieve our purpose of improving the lives of Australians, FaHCSIA relies on the skills and commitment of our staff. We are proud of the diversity in the Department. We know that our people—with their diverse abilities, skills, languages, cultures and backgrounds—are our greatest resource.
FaHCSIA values, recognises and rewards our people. We have a strong performance culture focused on developing staff capability, including leadership and skills development. Our staff respect and encourage diversity in their working environment.
FaHCSIA networkMore than 25 per cent of FaHCSIA staff are based outside Canberra in our national network, comprising seven capital city offices, four regional offices and 30 Indigenous Coordination Centres. Some staff are based in remote Indigenous communities, including Government Business Managers and Indigenous engagement officers.
FaHCSIA People Strategy 2009–10This year we developed the FaHCSIA People Strategy 2009–10: Great People, Great Future, which aims to ensure that FaHCSIA remains a great place to work with a strong performance culture. The implementation of the strategy will enable the Department to continue to attract people to the organisation and to develop, support and retain them. It will also ensure that our existing staff are supported to achieve their full potential.
Staff surveyIn February 2009 we initiated a comprehensive staff survey system, which will run until 2011. Surveying our staff provides valuable insights into staff views on working in FaHCSIA and supports the design of organisational and local workforce strategies.
Our people11

228 FaHCSIA Annual Report 2008–2009 Part3 Corporate governance
Leadership and capability developmentFaHCSIA continues to invest in leadership and capability development through a suite of training programs. This year we developed a new Executive Level 2 Effective Management Skills one‑day program, which began in March 2009.
FaHCSIA diversity planFaHCSIA is currently developing a new diversity plan. Focus groups with staff have been held across FaHCSIA. The final plan will support a workforce that values and embraces the diversity of our people.
In 2008–09 the Department introduced cultural appreciation and mentoring programs that aim to develop a greater knowledge and appreciation of Aboriginal and Torres Strait Islander culture and provide a mentoring resource for Aboriginal and Torres Strait Islander staff.
We have also implemented a program for staff who are interested in mentoring staff members with disability.
Who we areFaHCSIA is a dynamic and diverse department. Our workforce consists of staff in a Canberra‑based National Office and a network of staff in states and territories.
We have around 3,300 staff throughout Australia, of whom approximately 66 per cent are female and 34 per cent are male.
FaHCSIA’s staff work in 63 branches and our Network across Australia, developing social policy, researching and analysing important and emerging issues, and developing and delivering programs and services. See pages 214–215 for a chart showing our organisational structure.
Our NetworkApproximately 820 staff are in the FaHCSIA national network, operating from capital city offices, regional offices or Indigenous Coordination Centres. Additional staff are based in remote Indigenous communities mainly in the Northern Territory as Government Business Managers and Indigenous engagement officers.
The Network is the operational arm of FaHCSIA. Network staff deliver critical support to portfolio Ministers and the Department by contributing to the design of government programs, providing environmental scanning, identifying areas of need and reporting

229
Cas
e st
udy
Chapter 11 Our people Part3 Corporate governance FaHCSIA Annual Report 2008–2009
Corp
orat
e go
vern
ance
and
acc
ount
abili
tyPa
rt 3
Charities talk about FaHCSIA staff donations making a differenceFaHCSIA launched the Workplace Giving Program in June 2007, and since then many communities have benefited from the generosity of staff contributions. Workplace giving enables staff to make small, effective and regular donations through payroll deductions.
FaHCSIA staff donations have made a big difference to supporting the programs that give vital support to communities, as the following two stories illustrate.
This year, thanks to FaHCSIA’s workplace giving donations, the Smith Family has been able to expand its Learning for Life program, which supports more than 27,000 students, providing them with access to personal development activities such as financial and digital literacy courses, homework clubs and mentors, as well as a host of life‑changing learning opportunities.
The MARANGE Orphanage, supported by the ZOPOM Foundation, not only provides a home for abandoned orphans, but is also the principal employer/institution in the region. The institution employs more than 80 people, including abused and abandoned women, who work directly in the orphanage, and locals who run agricultural activities, including growing vegetables and grain and cultivating an orchard.

230 FaHCSIA Annual Report 2008–2009 Part3 Corporate governance Chapter 11 Our people
on the implementation of programs. They implement many government programs and maintain effective relationships with key partners and stakeholders.
During 2008–09, the Network played a key role in negotiations and consultations with stakeholders in COAG national partnership discussions; managing the Community Development Employment Projects reform, land reform and income management; and supporting government responses to natural disasters, including the Victorian bushfires and floods in Queensland. The network had some 4,000 funding contracts under management, ranging from contracts worth several million dollars to very small community‑based grants, and representing administered funding in excess of $1.1 billion.
Indigenous Coordination CentresThe Network includes 30 Indigenous Coordination Centres across Australia which engage with Indigenous people and act as the coordination point for many of the Government’s programs assisting Indigenous peoples. The centres are multi‑agency units, combining coordination, planning and service functions and housing staff from several departments responsible for various Indigenous programs.
The centres oversee the local delivery of many of the Australian Government’s programs assisting Indigenous people. They also broker innovative and flexible whole‑of‑government solutions to the needs of Indigenous people using both specific and general funding.
Government Business ManagersFaHCSIA has more than 50 Government Business Managers in the Northern Territory working closely with the Indigenous Coordination Centres. They are responsible for leadership, strategic oversight, management and coordination of Australian Government services provided in Indigenous communities and several town camp regions. They work with relevant agencies to maximise benefits to the community.
Indigenous Engagement OfficersThroughout 2008–09 the Department employed and trained 21 Indigenous Engagement Officers (IEOs) to work within selected Northern Territory communities. All IEOs are members of the community in which they work, or are accepted by the community. Their role is to provide feedback about the measures of the Northern Territory Emergency Response between their community and government; promote the community’s role in defining needs, setting goals and formulating policies and plans; and work with community groups to bring about greater community input into Government decision‑making. IEOs have received training in personal leadership, as well as specialised training in community engagement tools, technique and theory to ensure they are best‑placed to represent the needs of their communities.

231
Corp
orat
e go
vern
ance
and
acc
ount
abili
tyPa
rt 3
Chapter 11 Our people Part3 Corporate governance FaHCSIA Annual Report 2008–2009
Supporting our peopleFaHCSIA has a set of strategies to support and develop staff, including a staff survey, a people strategy, leadership and capability development, networks and services to support diversity, Indigenous staff and staff with disability, workforce planning and an occupational health and safety strategic plan.
Our staff surveyIn February 2009, FaHCSIA initiated an integrated approach to staff surveying to increase organisational awareness of staff views about working in FaHCSIA. Staff surveys provide an effective evidence base to support the achievement of the outcomes of our people strategy and deliver effective corporate and enabling services to the Department.
The staff survey system will run until 2011 and includes annual staff surveying, six‑monthly pulse surveying of staff engagement, and entry and exit surveying. The results of the staff surveys will be reported on a six‑monthly basis in May and November each year in order to support the design of organisational and local workforce strategies and to monitor their effectiveness.
The first survey was conducted between 16 and 27 February 2009 and there was a very high participation rate—86 per cent of staff responded. The survey showed that staff have a positive view of the FaHCSIA work environment, with around three‑quarters of staff satisfied overall with FaHCSIA and their jobs.
Figure 3.3 shows the results for the survey questions on staff satisfaction with their current job and with FaHCSIA as an employer.
Figure 3.3 Overall satisfaction with current job and with FaHCSIA as an employer
0% 10% 20% 30% 40% 50% 60% 70% 80% 90% 100%
Very dissatisfied
Dissatisfied
Neither satisfied nor dissatisfied
Satisfied
Very satisfiedq58.
Considering everything, how would you rate
your overall satisfaction with FaHCSIA as an
employer? (n=2515)
q25. Considering everything,
how satisfied are you with your current job?
(n=2554)
Very satisfied Neither satisfied nor dissatisfiedSatisfied Dissatisfied Very dissatisfied

232 FaHCSIA Annual Report 2008–2009 Part3 Corporate governance Chapter 11 Our people
Staff rated many key aspects of the FaHCSIA workplace favourably, including team performance and relationships, performance of supervisors, utilisation of their skills, clarity of their goals and the performance of leaders.
Many of FaHCSIA’s staff survey results were well above average when compared to similar large Australian Public Service (APS) agencies. These included staff recognition, appropriateness of workloads, team relationships and performance, career development, internal communications and Executive Management Group performance.
While opportunities for career development were above average when compared to other APS agencies, the survey highlighted that there was still some room for improvement within FaHCSIA. The survey also highlighted other areas for improvement, such as recruitment and selection and sharing of information between areas.
The top 12 drivers of overall staff satisfaction, engagement and organisational commitment were found to be (in order of the importance of their impact):
intrinsic rewards from current job ◗
career progression ◗
job–skills match ◗
work–life balance ◗
diversity and equity ◗
autonomy and empowerment ◗
Executive Management Group performance ◗
goal clarity ◗
recognition and feeling valued ◗
record keeping ◗
IT and information systems ◗
team performance and relationships. ◗
Future directions: our people strategyThe FaHCSIA People Strategy 2009–2010: Great People, Great Future has been developed to support the Department’s strategic framework.
We developed the strategy to achieve two key outcomes: to create a great place to work and to generate a strong performance culture. The strategy provides clear guidance on how each member of staff can contribute to achieving those outcomes.

233
Corp
orat
e go
vern
ance
and
acc
ount
abili
tyPa
rt 3
Chapter 11 Our people Part3 Corporate governance FaHCSIA Annual Report 2008–2009
Implementation of the strategy will enable FaHCSIA to continue to attract people to the organisation and to develop, support and retain them. It will also ensure that our existing staff are supported to achieve their full potential.
Leadership capabilityFaHCSIA has a strong commitment to enhancing leadership capability among our staff. All Senior Executive Service (SES), Executive Level 2 (EL 2) and Executive Level 1 (EL 1) staff, including staff from regional and remote areas, are encouraged to attend the FaHCSIA Leadership Program.
The Leadership Program is delivered through:
skills‑based workshops for EL and SES staff (43 participants in 2008–09) ◗
a two‑day residential program for EL staff and branch managers, focusing on a current ◗
strategic theme (94 participants in 2008–09)
external leadership development opportunities provided by the Australian and ◗
New Zealand School of Government and the Australian Public Service Commission.
In 2008–09, in recognition of the challenges staff face in managing workloads in an increasingly complex environment, the Department developed a one‑day Effective Management Skills Program. The program is aimed at EL 2 staff and provides participants with practical tools and templates to apply in the workplace, as well as helping to build confidence in their management skills. It covers topics such as management in the FaHCSIA context, role clarity, developing and engaging staff and managing change. This program began in March 2009.
Capability developmentFaHCSIA has a suite of training programs that address organisational and individual capability needs. These programs are conducted in house and are delivered in national and state office locations. The training programs include Financial Management, Writing to and for the Minister, Project Management, Stakeholder Management, Working with Commercial Contracts, Working with Funding Agreements, Understanding your Accountabilities, and Policy Development and Advice.
A key focus for capability development in the Department during 2008–09 was supporting the development of APS 5, APS 6 and EL 1 staff. A range of accredited training programs were conducted over a three‑month period, and on successful completion, staff were awarded either a Certificate IV in Government (19 employees gained accreditation), Diploma of Government (37 employees gained accreditation) or Diploma of Government—Contract Management (40 employees gained accreditation).

234
Cas
e st
udy
FaHCSIA Annual Report 2008–2009 Part3 Corporate governance Chapter 11 Our people
The FaHCSIA People Strategy 2009–10The FaHCSIA People Strategy 2009–10: Great People, Great Future provides a responsive workforce strategy to enable the Department to deliver the Government’s agenda through 2009–10 and beyond. It sets out FaHCSIA’s strategy for attracting, retaining and developing staff in order to deliver the outcomes of the Department’s strategic framework.
The varied and complex nature of work in FaHCSIA, along with the dispersion of FaHCSIA employees, requires an outcomes framework within which each person and part of the organisation has a clear role. This framework assists in making FaHCSIA a great place to work with a strong performance culture.
The key objectives of the strategy are:
effective and efficient human ◗
resource services
people resources aligned to ◗
business objectives
an attractive and flexible ◗
employment framework
a healthy and safe work ◗
environment
evidence‑based decision making ◗
ethical and respectful staff ◗
effective leadership ◗
effective performance management ◗
effective capability. ◗
Achievement against the objectives of the strategy will be regularly measured to monitor progress and an evaluation review of the strategy will be conducted in 2010.

235
Corp
orat
e go
vern
ance
and
acc
ount
abili
tyPa
rt 3
Chapter 11 Our people Part3 Corporate governance FaHCSIA Annual Report 2008–2009
Online trainingThe FaHCSIA e‑learning system provides staff with a suite of flexible online learning options to develop their capability needs. The current e‑learning programs include Customer Service, Performance Management, Induction, IT and Protective Security, Disability Awareness, Communication, Occupational Health and Safety, Eliminating Workplace Discrimination and Harassment, and APS Values and Code of Conduct.
E‑learning provides an accessible, consistent and cost‑effective option for delivering training programs to FaHCSIA staff.
Individual performance managementPerformance management in FaHCSIA is an ongoing process of regular, constructive feedback and honest communication between a manager and an employee. The performance management process is supported by an online system.
Our approach to individual performance management is to provide managers and employees with opportunities to identify, discuss, review and plan for performance, and ensure links with business outcomes through clear expectations and capability development. Regular feedback conversations, as part of everyday work practice, are fundamental to building a high‑performing culture.
FaHCSIA collective agreement and individual industrial instrumentsThe development of a new FaHCSIA collective agreement started in June 2008 after a majority of staff expressed a preference for a union collective agreement to replace the existing collective agreement.
After extensive management consultation with staff and negotiation with the Community and Public Sector Union and the Media, Entertainment and Arts Alliance, a proposed new agreement went to a staff ballot and 93 per cent of staff who voted supported it.
The Workplace Authority approved the FaHCSIA Collective Agreement 2009–11 on 7 January 2009 and it commenced on 14 January 2009.
SES employees can negotiate individual remuneration and conditions, which are authorised by determinations made under section 24(1) of the Public Service Act 1999. Non‑SES employees can negotiate individual remuneration and conditions to supplement FaHCSIA collective agreement provisions under the agreement’s flexible remuneration and conditions clause.
For further information on the collective agreement and individual industrial instruments, see Appendix 2 of this report (page 307).

236
Cas
e st
udy
FaHCSIA Annual Report 2008–2009 Part3 Corporate governance Chapter 11 Our people
Staff in Focus — Anura SamaraFaHCSIA staff member Anura Samara is both a Section Manager in the Department’s Budget Development Branch and also dons his hat as a volunteer fire‑fighter with the ACT Rural Fire Service (RFS).
After joining the service in 2001, Anura has fought fires around the Australian Capital Territory, including the January 2003 fires, as well as taking part in deployments to fires in New South Wales. In February 2009, Anura was a member of the first ACT contingent of fire‑fighters that was sent to Victoria following their bushfires.
In addition to fire‑fighting, the ACT RFS provides opportunities to educate the community about fire preparedness and risks, take up ongoing skills development, train new recruits and to exercise leadership. Anura has also passed his passion for fire‑fighting to his 17‑year‑old son, who is a new recruit.
FaHCSIA recognises the important part that volunteers play in the community and supports them in their efforts. This support includes providing for both paid and unpaid leave for staff to participate in a variety of volunteering activities.
‘Volunteer fire‑fighting has allowed me to develop skills in leadership, team work, planning and resource management. The reward is being able to help the community’, says Anura.
For further information on how to become a volunteer for ACT RFS, visit www.rfs.act.gov.au.
Volunteer fire-fighter and FaHCSIA staff member Anura Samara in action

237
Corp
orat
e go
vern
ance
and
acc
ount
abili
tyPa
rt 3
Chapter 11 Our people Part3 Corporate governance FaHCSIA Annual Report 2008–2009
Staff recognitionStaff recognition is guided by our Reward and Appreciate our People Strategy. The strategy provides for formal and informal recognition and highlights the importance of awards at the local level.
As well as participating in external, government‑wide award schemes, we also have our own Secretary’s Awards to recognise contributions and achievements. At the local level, awards can be presented to members of work teams and project teams.
Informal recognition is provided on the job, between a manager and their staff, through individual performance feedback. This is a critical level of recognition and one that is promoted through FaHCSIA’s corporate culture.
DiversityFaHCSIA is committed to inclusive workforce strategies that support diversity in the workplace. We provide opportunities for staff to participate in various networks or interest groups including the Aboriginal and Torres Strait Islander Staff Network, the Carers Network and the FaHCSIA Leadership disAbility Group. The Department continues to coordinate the APS Diversity Network, which meets quarterly to share diversity best practice across the public service.
FaHCSIA Diversity PlanThe FaHCSIA Diversity Plan—Making it real is our plan of action for creating and supporting a workplace that values and embraces the diversity of our people. It builds on the diversity commitment made in FaHCSIA’s Values and Leadership Model. It is a plan for creating opportunities and developing shared values and ways of behaving. A new plan is currently being developed. Focus groups were held across FaHCSIA to ensure that all staff had the opportunity to provide their ideas for inclusion to the new plan.
Commitments to Indigenous staffFaHCSIA has significant responsibility for Indigenous affairs and recognises the richness of Aboriginal and Torres Strait Islander cultures and the unique skills and knowledge that Aboriginal and Torres Strait Islander staff bring to our workplace.
FaHCSIA has a higher proportion of Aboriginal and Torres Strait Islander staff than other APS agencies—9.7 per cent of FaHCSIA staff identify as being Aboriginal or Torres Strait Islander compared to the APS average of 2.1 per cent (based on the 2007–08 State of the Service report). This is mainly due to the Department’s portfolio responsibility for Indigenous affairs and our active recruitment and retention strategy and support network for Aboriginal and Torres Strait Islander staff. The FaHCSIA Aboriginal and Torres Strait Islander Recruitment and Retention Strategy positions the Department as an employer

238
Cas
e st
udy
FaHCSIA Annual Report 2008–2009 Part3 Corporate governance Chapter 11 Our people
FaHCSIA’s Reconciliation Action Plan 2008–09FaHCSIA’s Reconciliation Action Plan reflects the importance we attach to making real progress in closing the gap for Indigenous Australians. We see our plan as a means of building positive relationships between Indigenous and non‑Indigenous people.
A significant focus of our plan has been to ensure that our policies and programs are accessible to Aboriginal and Torres Strait Islander peoples. We recognise that to achieve this, Indigenous and non‑Indigenous staff must work together to share knowledge and expertise and use it to effectively consult and engage with Indigenous communities.
We are proud of the progress we have made in implementing our 2008–09 plan, with 14 out of 15 actions achieved.
Photo above: The 2009–2011 FaHCSIA Reconciliation Action Plan working group. Pictured (left to right): Robyn Forester, Peter Bass, Jennifer Pitcher and Jim Ramsay. Not pictured: Anne Davies, Judith Davis-Lee, Bridget Dowling, John Gibbs, Sia Gilmore, John Glynn, David Henri, Benny Mills, Trish Mu, Abby Phillis, Lorraine Rogge.

239
Corp
orat
e go
vern
ance
and
acc
ount
abili
tyPa
rt 3
Chapter 11 Our people Part3 Corporate governance FaHCSIA Annual Report 2008–2009
of choice for Aboriginal and Torres Strait Islander people. Through this strategy the Department demonstrates our commitment to Aboriginal and Torres Strait Islander staff by promoting career and development opportunities for them.
In 2008–09 the focus has been on retention of Aboriginal and Torres Strait Islander staff through establishing effective networks where staff can support each other in a culturally safe environment. This year the Department introduced a culturally appropriate mentoring program that provides training to mentors and, following this skills development, enables all Aboriginal and Torres Strait Islander staff to self‑select a mentor from those trained.
We also implemented a Cultural Appreciation Program, which aims to develop a greater knowledge and appreciation of Aboriginal and Torres Strait Islander culture across the Department. This program is delivered by fully trained Aboriginal and Torres Strait Islander FaHCSIA staff, and builds the capacity and capability of staff to ensure that our workforce better understands Aboriginal and Torres Strait Islander issues.
Support for staff with disabilityFaHCSIA has successfully achieved seven of the eight objectives outlined in recommendations made by the Management Advisory Committee (MAC) 6 report, Employment of People with Disability in the APS. One of the examples of our commitment to the report is the establishment of the role of a Senior Level Advocate for Staff with Disability, which is held by a FaHCSIA Deputy Secretary.
FaHCSIA has a higher number of staff with disability than any other APS agency—5.3% of our workforce identifies as a person with a disability compared to the APS average of 3.1% (based on the 2007–08 State of the Service report). This is due to FaHCSIA’s portfolio responsibility for disability issues and the strong networks and support services we provide to staff with disability. FaHCSIA is one of a few APS agencies to have a designated position of Disability Access Coordinator. We also provide centralised funds that can be used by staff with a disability for equipment and technology under the Reasonable Adjustment Policy.
The Department continues to consult regularly with staff on disability issues, including through the FaHCSIA Leadership disAbility Group (FLAG). FLAG membership is open to all interested staff, with or without disability. The group’s objective is to identify and address workplace issues affecting employees with an injury, illness or disability. FLAG aims to:
make a difference on strategic issues and overcome systemic barriers ◗
focus on attracting, recruiting and retaining staff with a disability ◗
work on these issues in positive and constructive ways through the encouragement ◗
of best‑practice approaches to peer support, career boosting, buddying, coaching and mentoring.

240
Cas
e st
udy
FaHCSIA Annual Report 2008–2009 Part3 Corporate governance Chapter 11 Our people
The FaHCSIA Leadership disAbility GroupThe FaHCSIA Leadership disAbility Group (FLAG) was formed to advance the status of employees with disability across the Department. The group has around 15 core members, with and without disability, including staff from some state offices.
FLAG works to build FaHCSIA’s leadership in this area, using the valued knowledge and experience of staff. It also reflects FaHCSIA’s commitment to being an employer of choice for staff with disability.
The establishment of FLAG was announced on 3 December 2008 by Deputy Secretary Geoff Leeper, FaHCSIA’s Senior Level Advocate for Staff with Disability. This announcement was made as part of the Department’s celebration of the UN International Day of People with Disability.
FLAG has held a number of meetings, where the group received in‑principle agreement to issue a department‑wide ‘call to action’. The call focuses on encouraging staff to identify, initiate and share information about steps to promote the inclusion of staff with disability.
In conjunction with the call to action, FLAG released a fact sheet, ‘10 things we can each do TODAY to be more disability aware in FaHCSIA’, which provides employees with ideas for action to improve disability awareness in the workplace. Responses to the call to action will be shared through a new online community to encourage continuing improvement and innovation.
Photo above: Members of the FaHCSIA leadership disAbility group.

241
Corp
orat
e go
vern
ance
and
acc
ount
abili
tyPa
rt 3
Chapter 11 Our people Part3 Corporate governance FaHCSIA Annual Report 2008–2009
FaHCSIA also has a mentoring program for staff who are interested in mentoring staff members with disability. Two training sessions were held in 2008–09, and further sessions are planned for 2009–10.
Workforce planningThe FaHCSIA People Strategy is informed by regular data collection and analysis. Each quarter, the People Branch develops a human resources metrics report that is provided to the Executive Management Group and the People Committee. The report contains numerical and trend data and analysis to support decision making. The information is also used by the human resources advisory team to provide support in operational areas in:
understanding the factors affecting their workforce ◗
quantifying the staff supply and demand factors affecting the delivery of ◗
departmental outcomes
developing staff attraction, retention and development strategies to meet ◗
workforce requirements.
Staff turnover and retentionThe Department’s voluntary separation rate in 2008–09 was 11.72 per cent (14.70 per cent in 2007–08). These figures do not include staff who separated from the Department due to end of contract or redundancy. The InfoHRM (a benchmarking service subscribed to by a number of APS agencies) target benchmark for APS agencies in 2008 was 10.73 per cent and the median was 13.34 per cent. The lower separation rate in 2008–09 was due to a combination of the increased attractiveness of FaHCSIA as an employer and the decrease in employment opportunities in the public and private sectors.
Maximising attendanceIn 2008–09, there were 12.96 days of unscheduled leave per full‑time equivalent (FTE) employee. This included an average of 9.98 days of sick leave, 1.93 days of carers’ leave, 0.62 days of miscellaneous leave and 0.43 days of workers’ compensation leave per FTE employee. The level of unscheduled leave in FaHCSIA is being monitored and addressed through the development and implementation of the FaHCSIA Maximising Staff Attendance Strategy.
The InfoHRM target benchmark for APS agencies in 2008 was 11.57 days per FTE employee and the median was 12.41 days per FTE employee.
Figures 3.5 and 3.6 respectively show four‑year trends in unscheduled absences and unscheduled absences by leave type per FTE FaHCSIA employee.

242 FaHCSIA Annual Report 2008–2009 Part3 Corporate governance Chapter 11 Our people
Figure 3.4 Unscheduled absences per employee (FTE), 2005–06 to 2008–09
Figure 3.5 Unscheduled absences per employee (FTE) by leave type, 2005–06 to 2008–09
0
2
4
6
8
10
12
14
2008–092007–082006–072005–06
Year
Days
0
2
4
6
8
10
Workers' compensation
Miscellaneous
Carers
Sick
2008–092007–082006–072005–06
Year
Days
MiscellaneousCarers Sick Workers' compensation

243
Corp
orat
e go
vern
ance
and
acc
ount
abili
tyPa
rt 3
Chapter 11 Our people Part3 Corporate governance FaHCSIA Annual Report 2008–2009
Workplace health and safetyManaging depression in the workplaceIn 2008–09, FaHCSIA continued to deliver workshops across Australia for managers and staff under the beyondblue National Workplace Program. Workshops on managing depression in the workplace enhanced managers’ knowledge about the impact of these disorders on individuals, the workplace environment and the organisation. Awareness to Action workshops raised awareness of the signs and symptoms of depression. The workshops aim to provide participants with the necessary skills to intervene early and respond appropriately to help a staff member who may be suffering from depression.
Eliminating bullying and harassment in the workplaceFaHCSIA is committed to supporting a workplace culture free from bullying and harassment.
We have a network of harassment contact officers located in the National Office, state offices and Indigenous Coordination Centres. These officers are trained to provide support and information to staff and managers on bullying and harassment issues.
We are using the findings of an internal audit of the promotion, management and assurance of ethical behaviours in FaHCSIA and the results of the 2009 FaHCSIA staff survey to refine and target our strategy to eliminate bullying and harassment. The strategy includes delivering a range of awareness‑raising, educational and training courses to managers and staff. The FaHCSIA People Committee regularly evaluates the ongoing effectiveness of the strategy.
Occupational health and safetyFaHCSIA acknowledges the responsibilities we have as an employer under the Occupational Health and Safety Act 1991 (OHS Act) and the Safety, Rehabilitation and Compensation Act 1988 and we are committed to the health and safety of our employees, contractors and visitors. We recognise the importance of taking a proactive approach to improving the health and safety of our employees.
Health and Safety Management ArrangementsIn December 2007, FaHCSIA implemented the Health and Safety Management Arrangements, which were developed in consultation with staff. In June 2008, the Blunn Report examined the circumstances surrounding the presence of formaldehyde in container accommodation used by Northern Territory Emergency Response government business managers. The report recommended a review of OHS governance arrangements in the Department.

244 FaHCSIA Annual Report 2008–2009 Part3 Corporate governance Chapter 11 Our people
In response to the report’s findings, the Department developed a strategic plan for managing OHS to help support the framework set out in the Health and Safety Management Arrangements. This two‑year strategic plan was launched in December 2008 under the theme Building a Safety Culture. It is aimed at ensuring legislative compliance, providing a supportive workplace for return to work following injury or illness, developing a participatory approach to OHS planning, and developing an integrated OHS risk management system.
The two‑year strategic plan consists of 25 national OHS initiatives under three major elements:
an OHS framework ◗
a health and wellbeing initiative ◗
an injury management protocol. ◗
We have already achieved significant progress against 20 of the 25 national initiatives included in the two‑year plan.
The Health and Safety Management Arrangements have been redrafted to reflect the governance arrangement recommended by the Blunn Report and included in the OHS strategic plan. In June 2009, we initiated consultations with all staff on the new arrangements.
Health and safety initiativesIn 2008–09, FaHCSIA’s activities to ensure the health, safety and welfare at work of our employees, contractors and visitors included:
vaccinating 1,010 staff under the influenza vaccination program, a 35 per cent increase ◗
on 2007–08
conducting over 500 workstation assessments nationally ◗
conducting OHS training nationally for 616 staff ◗
re‑establishing OHS committees under new terms of reference in FaHCSIA state offices ◗
implementing a nationally consistent process for management and rehabilitation for ◗
compensable and non‑compensable injury and illness
completing a refresh of all first‑aid kits. ◗
Health and safety outcomesIn November 2008, Comcare lifted the improvement notice that was applied to the Department in September 2007. The notice required the Department to address issues relating to meeting our obligations under the OHS Act. The notice was lifted following the

245
Corp
orat
e go
vern
ance
and
acc
ount
abili
tyPa
rt 3
Chapter 11 Our people Part3 Corporate governance FaHCSIA Annual Report 2008–2009
implementation of processes to identify, assess and control hazards relating to the work undertaken by the Department.
To meet organisational OHS targets, in 2008 we implemented an initiative to assist in the reduction of the time taken (measured in weeks) from notification of injury or illness to initial rehabilitation intervention. This initiative has resulted in a 41 per cent reduction in the number of weeks from notification of injury or illness to initial rehabilitation intervention, compared to 2007–08.
Statistics of any accidents or dangerous occurrence under section 68During 2008–09, the injury frequency rate was 6.24 injuries per 100 employees. Eight of the reports required the giving of notice to Comcare under section 68 of the OHS Act.
Investigations under Part 4 of the OHS ActComcare undertook two investigations under Part 4 of the OHS Act in 2008–09, and completed one.
Occupational health and safety reportFaHCSIA is required under section 74 of the OHS Act to provide a report on occupational health and safety activities and statistics on all notifiable accidents and dangerous occurrences under section 68 and investigations and notices under sections 29, 46 and 47 (see Table 3.3).
Table 3.3 Notifiable accidents and dangerous occurrences under the OHS Act, 2008–09
Action Number
Deaths that required notice to Comcare under section 68 0
Accidents that required notice to Comcare under section 68 3
Dangerous occurrences that required notice to Comcare under section 68 5
Investigations conducted under Part 4 2
Tests on plant, substance, or thing in the course of investigations considered 0
Directions given to FaHCSIA under section 45 (that the workplace etc. not be disturbed) 0
Notices given to FaHCSIA under section 29 (provisional improvement notice) 0
Notices given to FaHCSIA under section 46 (prohibited notice) 1
Notices given to FaHCSIA under section 47 (improvement notice) 0

246 FaHCSIA Annual Report 2008–2009 Part3 Corporate governance Chapter 12 Our stakeholders
Our stakeholders at a glanceFaHCSIA is committed to achieving the best possible outcomes for all Australians. To do so, we engage with a broad range of stakeholders through consultations and advisory forums, research partnerships, contract management and other avenues.
We are committed to supporting open communication and active engagement with our stakeholders, who include:
our Ministers and Parliamentary Secretaries ◗
other Australian Government departments and agencies ◗
state and territory governments ◗
local government ◗
foreign governments ◗
businesses ◗
the not‑for‑profit community sector ◗
peak representative organisations ◗
service providers ◗
research bodies ◗
individuals, families and communities. ◗
Developing open and strong relationships with our stakeholders is central to being able to achieve departmental outcomes. These relationships open the way to exchanging ideas and perspectives from which effective policies and processes can be developed.
Our approach to engaging with our stakeholders recognises the significant skills, expertise and experience that communities can contribute to the design and delivery of programs and services that seek to improve the lives of Australians.
Our stakeholders12

247
Corp
orat
e go
vern
ance
and
acc
ount
abili
tyPa
rt 3
Chapter 12 Our stakeholders Part3 Corporate governance FaHCSIA Annual Report 2008–2009
Ministerial and parliamentary servicesFaHCSIA delivered services to two portfolio Ministers and two Parliamentary Secretaries in 2008–09: the Hon. Jenny Macklin, MP, Minister for Families, Housing, Community Services and Indigenous Affairs; the Hon. Tanya Plibersek, MP, Minister for Housing and Minister for the Status of Women; the Hon. Bill Shorten, MP, Parliamentary Secretary for Disabilities and Children’s Services and Parliamentary Secretary for Victorian Bushfire Reconstruction; and Senator the Hon. Ursula Stephens, Parliamentary Secretary for Social Inclusion and Parliamentary Secretary for the Voluntary Sector.
Support to Parliament and MinistersMinisterial correspondence increased from 29,786 items in 2007–08 to 32,473 in 2008–09. FaHCSIA and its portfolio agencies prepared a total of 3,287 ministerial minutes and 1,616 requests for briefing from Ministers and Parliamentary Secretaries.
The portfolio received 108 parliamentary questions on notice and 987 Estimates questions on notice. The portfolio prepared 1,713 question time briefs.
Table 3.4 provides information on all ministerial and parliamentary services data that has individual performance indicator reporting requirements to measure trends as set out in the Department’s 2008–09 Portfolio Budget Statements.

248 FaHCSIA Annual Report 2008–2009 Part3 Corporate governance Chapter 12 Our stakeholders
Table 3.4 Ministerial and parliamentary services—number of briefings, submissions, items of ministerial correspondence and parliamentary questions on notice, 2008–09
Ministerial correspondence
processedQuestion time briefs1 Briefings2
Submissions minutes3
Parliamentary questions on
notice
Estimates questions on
notice
Outcome 1: Greater self-reliance and economic, social and community engagement for Indigenous Australians
3,532 438 419 1,204 22 225
Outcome 2: Seniors, people with disabilities, carers, youth and women are supported, recognised and encouraged to participate in the community
12,170 480 615 833 9 252
Outcome 3: Families and children have choices and opportunities
3,619 188 98 413 2 90
Outcome 4: Strong and resilient communities
3,860 465 396 460 15 243
Non-output-specific
9,292 142 88 377 60 177
Total
32,473 1,713 1,616 3,287 108 987
1. These figures include both new question time briefings and those that have been substantially revised.2. Ministerial minutes requested by the Ministers and Parliamentary Secretaries.3. Ministerial minutes initiated by departmental officers for the attention of Ministers.
Ministerial CouncilsThe Department has primary administrative responsibility for supporting ministerial participation in a range of Ministerial Councils and other forums including:
Australian Health Ministers’ Conference ◗
Commonwealth, State, Territories and New Zealand Ministers’ Conference on the ◗
Status of Women
Community and Disability Services Ministers’ Conference ◗
COAG Working Group on Indigenous Reform ◗
Housing Ministers’ Conference ◗
Ministerial Conference on Ageing ◗

249
Corp
orat
e go
vern
ance
and
acc
ount
abili
tyPa
rt 3
Chapter 12 Our stakeholders Part3 Corporate governance FaHCSIA Annual Report 2008–2009
Ministerial Council for Education, Early Childhood Development and Youth Affairs ◗
Ministerial Council on Gambling ◗
Ministerial Council for Tertiary Education and Employment. ◗
Working with other government agenciesThe Department develops and maintains strategic relationships with other government agencies, including Centrelink and the Departments of Human Services and Education, Employment and Workplace Relations.
These relationships support FaHCSIA’s effective participation in cross‑government policy development and improve payment integrity and service delivery.
For the payment side of our business, this collaboration includes:
providing the key contact point between FaHCSIA, the Department of Human Services ◗
and Centrelink
monitoring of the Business Partnership Agreement between FaHCSIA and Centrelink ◗
(see pages 285–286)
management of the Random Sample Survey program and FaHCSIA’s ongoing compliance ◗
measures (see page 287)
undertaking research to identify risks to outlays for those FaHCSIA programs that are ◗
delivered by Centrelink and the development of appropriate cost‑effective measures to address these risks
coordinating FaHCSIA’s involvement with the Social Security Appeals Tribunal. This ◗
includes managing our relationships with the tribunal, providing advice to it and facilitating the appointment of its members.
Working with the community sectorFaHCSIA manages funding relationships with a large number of community sector organisations. The Department has continued to improve the way it manages its grants programs to ensure consistent, efficient and effective administrative processes within and across programs through the new Common Business Model for Grants Management. For more information on this model, see page 258.
The Commonwealth Government has a wide‑ranging agenda to develop the community sector, including a review of the social and economic contribution of the not‑for‑profit sector in Australia and the ongoing work to harmonise regulations and reduce red tape for the sector through COAG.

250 FaHCSIA Annual Report 2008–2009 Part3 Corporate governance Chapter 12 Our stakeholders
Through FaHCSIA, the Government provides in excess of $1.5 billion in essential support to non‑government community services organisations around Australia, enabling the sector to provide much‑needed support and assistance to individuals and families in local communities. This annual report details the outcomes of these programs, which include:
emergency relief that provides immediate assistance to families in distress ◗
family relationship and support services ◗
parenting, youth and early childhood ◗
disability employment assistance and advocacy ◗
addressing homelessness ◗
money management training ◗
mental health and autism ◗
carer respite ◗
targeted programs to meet the needs of Indigenous people. ◗
FaHCSIA’s support for community‑based organisations enables the sector to do essential work, which will at some time assist almost every Australian family.
The delivery of many of these services is changing from silo approaches, where initiatives are delivered in isolation, to approaches that strive to wrap around individuals and families and provide seamless access to support with less red tape.
At the same time, especially in rural and remote Australia, FaHCSIA, in partnership with other agencies and levels of government, is taking an evidence‑based approach to identifying service gaps and developing local solutions in identified locations. This is particularly evident in the COAG work with 29 remote Indigenous communities, where regional operations centres are being established to focus on improved service outcomes, but the approach is also occurring in non‑Indigenous communities with larger populations.
Funding for peak bodiesFaHCSIA provides funding to peak body organisations to contribute to government policy and act as an effective conduit for information flow between the Government and their membership. Table 3.5 illustrates the peak bodies FaHCSIA funds.

251
Corp
orat
e go
vern
ance
and
acc
ount
abili
tyPa
rt 3
Chapter 12 Our stakeholders Part3 Corporate governance FaHCSIA Annual Report 2008–2009
Table 3.5 FaHCSIA support to peak bodies, 2008–09
Peak body Funding ($)*
Australian Council of Social Services 499,694
Australian Federation of Disability Organisations 300,469
Australian Financial Counselling and Credit Reform Association 60,000
Blind Citizens Australia 193,160
Brain Injury Australia 160,966
Community Housing Federation of Australia 241,426
Deaf Australia 193,160
Deafness Forum Australia 193,160
Early Childhood Australia 268,276
Families Australia 268,276
Family Relationship Services Australia 433,925
Homelessness Australia 325,936
Lone Fathers Association 58,984
National Council of Single Mothers and their Children 58,984
National Council on Intellectual Disability 160,966
National Disability Services 268,276
National Ethnic Disability Alliance 160,966
Physical Disability Council of Australia 160,966
Secretariat of National Aboriginal and Islander Child Care 255,828
Volunteering Australia 268,276
Women with Disabilities Australia 160,966
Total 4,692,660
* All amounts are exclusive of GST.

252 FaHCSIA Annual Report 2008–2009 Part3 Corporate governance Chapter 12 Our stakeholders
Our Service CharterThe FaHCSIA Service Charter sets out the standard of service that people who deal with the Department can expect and the ways they can help the Department improve service to customers, such as providing feedback. The charter also helps FaHCSIA staff to develop a better understanding of their roles and responsibilities. Further information on the charter can be found on our website.
Complaints Management SystemA new model for handling complaints in FaHCSIA was introduced in 2008–09. The goals of FaHCSIA’s new Complaints Management System are to:
provide our clients with an accessible process that handles complaints in a timely, ◗
professional and consistent manner
provide information to assist FaHCSIA to improve its customer service and ◗
administrative processes.
Under the new system, there is now a complaints‑handling team in National Office. This team provides a central point of contact for clients wishing to express concerns about the Department or one of our funded service providers.
The new team is responsible for recording all incoming complaints. This ensures that we are able to handle complaints consistently and improves our ability to identify and report on systemic issues.
During 2008–09, 93 complaints were registered on the Complaints Management System. This is an increase from last year’s figure of 26. The increase can be attributed to the more consistent recording of complaints received as well as the improved accessibility that the centralised team offers to complainants.
As at 30 June 2009, 85 of these complaints had been resolved and eight were still being actioned.

253Chapter 13 Our enabling strategies Part3 Corporate governance FaHCSIA Annual Report 2008–2009
Corp
orat
e go
vern
ance
and
acc
ount
abili
tyPa
rt 3
Our enabling strategies at a glanceOur enabling strategies consist of those elements that provide future direction, good governance, a sound evidence base and various internal controls that support information security and quality outcomes. We also have operational strategies that support our commitment to ecologically sustainable practices and improvement.
Planning for the futureFaHCSIA develops business plans at the beginning of the financial year to establish business objectives, align priorities with available resources and prepare for opportunities and challenges that may arise. We have identified a set of five corporate strategic risks. We take these risks into consideration within the business planning process and plans, along with other specific risks.
Our Executive Management Group recently endorsed a Common Business Model for Grants Management, which applies a risk‑based approach to improving program impact, efficiency and accountability.
Environmental managementEnvironmental management and performance in the Department covers such components as contributing to development of the Carbon Pollution Reduction Scheme, incorporating ecologically sustainable development principles in our use of water, energy and transportation and our handling of waste, sustainability reporting, and the development of our Environmental Management System.
ResearchFaHCSIA’s research publication series continued its contribution to the social policy evidence base and provided a record of findings from research and evaluation projects. During 2008–09, six occasional papers, three social policy research papers, one issue of the Australian Social Policy Journal and one statistical paper were published.
Our enabling strategies13

254 FaHCSIA Annual Report 2008–2009 Part3 Corporate governance
Information management and technologyDuring the last 12 months a number of key information and application projects and services were delivered, including:
the migration of applications and infrastructure supporting Indigenous Coordination ◗
Centres from the Department of Education, Employment and Workplace Relations
improvements to the whole‑of‑department electronic document and records ◗
management system
commencement of the Integrated Reporting Solution project, which will consolidate data ◗
into one source for reporting and analysis.
Planning for the future
Business planningBusiness planning is the process that defines our required business outcomes and current priorities at all levels within the Department. Effective business planning is critical to ensuring that we are able to meet the Government’s expectations and achieve the Department’s key objectives (see page 2).
We develop business plans at the beginning of the financial year to establish business objectives, align priorities with available resources and prepare for opportunities and challenges that may arise. We integrate business planning and risk management by including risk plans in business plans. We review plans formally midway through the year and update them throughout the year in response to changes to the business environment and emerging business priorities, issues and risks.
Business planning provides a line of sight from the FaHCSIA Strategic Framework 2008–10 through to individual performance agreements. The business priorities and activities articulated in the strategic framework cascade into group, branch and state office plans. Individual performance agreements entered into by FaHCSIA staff with their respective managers are linked to the priorities of their respective business plans. Further information on performance agreements can be found in Chapter 11.
Business monitoringWe monitor our business by measuring our performance, reporting on the status of our projects and managing risks.

255
Corp
orat
e go
vern
ance
and
acc
ount
abili
tyPa
rt 3
Chapter 13 Our enabling strategies Part3 Corporate governance FaHCSIA Annual Report 2008–2009
Performance frameworkFaHCSIA has implemented a standard performance framework that provides a clear line of sight between monitoring and reporting the performance of individual funded services, overall program performance and the contribution of these programs to the achievement of FaHCSIA outcomes.
Risk‑based decision‑making will drive the way we do business in terms of the agreements we use, and the monitoring of service delivery and quality. For example, the new suite of plain English streamlined funding agreements is an integral reform under the Common Business Model for Grants Management, see page 258.
Risk managementFaHCSIA’s risk management policy, guidelines and tools are based on the Australian and New Zealand Risk Management Standard 4360:2004.
We have invested considerable effort in strengthening our risk management arrangements in recent years. These efforts were formally recognised in November 2008 when FaHCSIA won the Enterprise‑Wide Risk Management category in Comcover’s annual Awards for Excellence in Risk Management.
Strategic risk managementThe executive has identified five strategic risks (covering programs, policy, compliance, workforce and whole‑of‑government) and an Executive Management Group member has been nominated as the owner of each risk. Each owner is supported by groups across the Department with key responsibilities for activities related to each risk.
Reference to the strategic risks is built into the risk plans prepared at every level of the organisation. Offices and business units preparing risk plans are required to specify in their plans the strategic risks to which their identified risks relate.
Broadly, risks in FaHCSIA are managed at each level of the organisation as follows:
strategic risks are identified, treated and monitored at a high level by the executive and ◗
group managers, and operationally throughout the Department
program‑level risks are identified, treated and monitored by branch, section and ◗
state managers
project and other operational risks are identified, treated and monitored by section ◗
managers and their staff.

256 FaHCSIA Annual Report 2008–2009 Part3 Corporate governance Chapter 13 Our enabling strategies
Business continuity planning and managementOur business continuity management aims to ensure that the Department is prepared to deal with any interruptions to our critical service delivery. As part of our commitment to effective risk management, we have developed and maintain robust business continuity plans across all of the Department’s critical business processes and enabling services. These plans support our mission critical activities—the critical services that must continue to be provided to our Ministers, service providers, suppliers, staff and other governments.
In the event of a disaster occurring with potential to significantly disrupt our business, we are well prepared to implement alternative strategies to ensure that our critical business processes continue with minimum interruption.
To ensure our business continuity plans remain valid and effective, we regularly review and test all plans. In addition to this program, half‑day scenario exercises are conducted at least twice a year involving senior executive staff with a designated role on FaHCSIA’s Crisis Response Team. In 2008–09, FaHCSIA conducted scenario exercises in July, August and December 2008.
The Crisis Response Team, chaired by the Deputy Secretary who is also the Chief Operating Officer, has the authority to officially declare a disaster and activate the Department’s business continuity response. The team is comprised of senior executive staff from across all of our critical business areas.
Program frameworkThe Program Performance Group supports and guides FaHCSIA managers in reforming and improving the way we manage programs. The primary goals of these improvements are to:
maximise opportunities for consistency, efficiency and effectiveness in relation to ◗
community services, Indigenous business, whole‑of‑government processes and program delivery
improve how we work within FaHCSIA as one entity ◗
provide better outcomes for service providers. ◗
The Department continued to participate in external cross‑government reviews which had begun in 2007–08. The outcomes of the following reviews have provided the framework for ongoing program improvements:
outcomes review (Operation Sunlight)—to improve the transparency and accountability ◗
of programs and funding; including the redesign of agency Portfolio Budget Statements to provide a more strategic focus and an increased emphasis on agency performance

257
Cas
e st
udy
Chapter 13 Our enabling strategies Part3 Corporate governance FaHCSIA Annual Report 2008–2009
Corp
orat
e go
vern
ance
and
acc
ount
abili
tyPa
rt 3
FaHCSIA a winner in Comcover awardsOn 7 November 2008, FaHCSIA won the Enterprise‑Wide Risk Management category in the 2008 Comcover Awards for Excellence in Risk Management. The awards recognise exceptional and inspiring examples of risk management and demonstrate how essential risk management is to the success of Australian Government agencies.
The award citation noted that FaHCSIA has undertaken a systematic, coordinated and executive‑led review of departmental risk management practices and procedures. FaHCSIA has also developed a number of methods to communicate and raise awareness of its risk management policy and processes both internally and externally. These include a risk management site on the Department’s intranet, with links to tools and guidance, and regular information and training programs for FaHCSIA staff. FaHCSIA also supports the portfolio’s agencies and service providers in managing risk by sharing those tools and guidance, and by providing other risk management resources on the Department’s website.
As well as the award, FaHCSIA earned a discount of 3 per cent on its annual Comcover insurance premium for 2009–10. The discount was in addition to the 8.7 per cent saving earned as a result of our performance in the 2009 Comcover Risk Management Benchmarking Survey.
Photo above: Departmental officers accepting FaHCSIA’s award at the 2008 Comcover Excellence in Risk Management Awards. Left to right: Josephine Phillips, Meg Hargreaves, Richard Woods, John Shevlin, Will Allan, David Slater, Rakesh Patel, Emma O’Keefe.

258 FaHCSIA Annual Report 2008–2009 Part3 Corporate governance Chapter 13 Our enabling strategies
program by program review to align policy priorities of government, improve the quality ◗
of expenditure and achieve efficiencies
discretionary grants review—a strategic review of the management and administration of ◗
discretionary grants to improve efficiency, effectiveness, transparency and accountability.
Common Business Model for Grants ManagementThe Common Business Model for Grants Management, endorsed by the Executive Management Group in April 2009, focuses on achieving improvements in program impact, program efficiency and accountability, service provider experience, and understanding of accountabilities.
The model applies a risk‑based approach, which in practice means applying different approaches to controls such as funding agreements, selection, acquittals, reporting, and monitoring.
Deciding on which agreement to use, and the related schedule arrangements, will be determined by a number of factors, including:
risk analysis ◗
the nature of the funding ◗
the funding amount ◗
the type of provider. ◗
The risk levels and treatments included in funding agreements will allow funding agreement managers to focus on monitoring and stakeholder engagement activities, with effort on those risk areas that have the most impact on program outcomes.
The implementation of the model is supported by key reforms and processes, including:
development of new, streamlined funding agreements that use plain English for FaHCSIA ◗
Indigenous and mainstream programs and other Australian Government agency Indigenous programs administered through the Grants Management System
improved training and support for FaHCSIA staff by implementing the Diploma of ◗
Government (Contract Management) and other program specific training
consultation with service providers on accountability reforms ◗
enhancements to FaHCSIA’s funding management system to support new programs and ◗
improve its use by staff and funded organisations
applying a risk‑based approach to funding agreements, acquittals, monitoring ◗
and reporting
development and implementation of program management tools and guidance to better ◗
assist staff in effective program management
259
Cas
e st
udy
Chapter 13 Our enabling strategies Part3 Corporate governance FaHCSIA Annual Report 2008–2009
Corp
orat
e go
vern
ance
and
acc
ount
abili
tyPa
rt 3
New FaHCSIA funding agreementsFaHCSIA seeks to achieve outcomes for specific target groups and the wider community by providing grants for services, primarily through funding arrangements with the not‑for‑profit sector.
The Hon. Jenny Macklin, MP, Minister for Families, Housing, Community Services and Indigenous Affairs, has reiterated the Government’s commitment to reducing the administrative burden on these service providers.
In line with this commitment and ultimately to improve funding outcomes for all Australians, we have been reforming all our grant‑related administrative practices.
The aim is to achieve a balance between the requirements we place on providers and our responsibility to ensure funds are used effectively.
As a result of consultation with more than 50 funded organisations and other Australian Government agencies, we have implemented a more user‑friendly suite of funding agreements, which will achieve significant reductions in red tape for a large number of our service providers. This includes using plain English for standard terms and conditions, which makes the new agreements around one‑third shorter than previous versions. For the first time, standard terms and conditions will be used across all FaHCSIA Indigenous‑specific programs, as well as by a number of other Commonwealth agencies for these programs.
Many organisations have indicated their support for the new funding arrangements and reporting requirements, endorsing it as a timely and positive initiative.

260 FaHCSIA Annual Report 2008–2009 Part3 Corporate governance Chapter 13 Our enabling strategies
communication with community service providers through the FaHCSIA Community ◗
Grants Update
ongoing development of a provider engagement strategy to provide a consistent ◗
approach to working with service providers with funding arrangements with the Department.
Environmental managementFaHCSIA has a number of mechanisms in place that underpin better environmental management and performance. These cover such components as contributing to the development of the Carbon Pollution Reduction Scheme, incorporating ecologically sustainable development principles in our use of water, energy and transportation and our handling of waste, sustainability reporting, and the development of our Environmental Management System.
How FaHCSIA’s outcomes contribute to ecologically sustainable developmentIn accordance with section 516A of the Environment Protection and Biodiversity Conservation Act 1999, FaHCSIA supports the principles of ecologically sustainable development through responsibility for the implementation of social policies and social support.
FaHCSIA’s Strategic Policy Branch has responsibility for contributing to the development of the Carbon Pollution Reduction Scheme and of climate change and energy efficiency policies, particularly in respect of their impacts on low income households. Strategic Policy will consult with relevant areas of the Department as these policies develop.
During 2008–09, FaHCSIA has remained committed to the principles of ecologically sustainable development as outlined in the Act.
FaHCSIA integrates these principles into our daily operations by using the sustainability reporting (triple bottom line) approach of environmental, economic, and social sustainability.
Some key measures FaHCSIA has undertaken over during 2008–09 include:
continuing with the development of the Greening FaHCSIA Program (formally the ◗
Environmental Strategic Plan)
reviewing and renewing the Aboriginal and Torres Strait Islander Recruitment and ◗
Retention Strategy 2006–09.

261
Corp
orat
e go
vern
ance
and
acc
ount
abili
tyPa
rt 3
Chapter 13 Our enabling strategies Part3 Corporate governance FaHCSIA Annual Report 2008–2009
releasing a report on FaHCSIA’s 2008–09 Reconciliation Action Plan, highlighting the ◗
progress made to date, and the current implementation of the 2009–11 Reconciliation Action Plan. For further information on FaHCSIA’s Reconciliation Action Plan, see page 238.
implementing the Disability Action Plan 2006–09. (For further information on FaHCSIA’s ◗
Disability Action Plan, see page 308.)
Effect of FaHCSIA’s activities on the environmentAs a large government agency with diverse operations being undertaken throughout Australia, the effect of FaHCSIA’s activities on the environment falls into five main categories:
electricity consumption and greenhouse gas pollution ◗
water use ◗
waste generation ◗
paper use ◗
transportation. ◗
Measures FaHCSIA is taking to minimise the impact of its activities on the environmentFaHCSIA is undertaking the following key measures to minimise the impact of its activities on the environment, in an effort to meet the targets set by Government:
when undertaking new building design, refit or refurbishment, or entering into new lease ◗
agreements, FaHCSIA continues to ensure that, where practicable, the premises have the highest possible energy and water efficiencies
where inefficiencies are identified in existing buildings, all possible steps are undertaken ◗
to improve environmental performance
when constructing and commissioning Indigenous Coordination Centres and offices ◗
in regional and remote locations, we use simple and supportable systems to improve energy efficiency
we have ongoing waste reduction strategies at national and state office sites, including ◗
the provision of organic waste facilities in the café at Tuggeranong Office Park
we take environmental sustainability into account when procuring paper, appliances and ◗
pool vehicles
we identify and implement measures to improve energy efficiency, including the ◗
completion of energy audits at a number of our office sites. Measures have also been taken to reduce waste going to landfill, and to reduce water consumption in our office buildings.

262 FaHCSIA Annual Report 2008–2009 Part3 Corporate governance Chapter 13 Our enabling strategies
During the year, staff were encouraged to consider their individual impacts on climate change through the Earth Hour climate change event.
FaHCSIA has adopted two primary mechanisms to review and increase the effectiveness of these measures:
the Sustainability Report ◗
the Environmental Management System. ◗
Sustainability ReportFaHCSIA will publish its seventh Sustainability Report later this year. The 2008–09 Sustainability Report will again only be published on the FaHCSIA website to reduce our carbon footprint.
The report sets social, environmental and economic commitments for FaHCSIA, and details progress made toward these commitments in the previous reporting period. This assists the Department in monitoring our performance and evaluating opportunities for future improvements, and provides transparency about our wider economic, social and environmental impacts.
Environmental Management SystemFaHCSIA is committed to the ongoing development of our Environmental Management System. This year, the Department achieved recertification of the system, and expansion of its scope to include Tuggeranong Office Park as well as Centraplaza and Juliana House to the new ISO 14001 standard.
We continue to work on our Greening FaHCSIA Program, which identifies areas where significant gains in environmental performance can be made cost effectively, as well as long‑term measures where more significant expenditure can deliver significant and measurable improvements. The program also provides information on our Environmental Communication Plan and Greening IT Strategy.
Other priorities for the Environmental Management System are:
improved collection and monitoring of data on energy use, water consumption and waste ◗
management in all national office buildings
assessment of the effectiveness of current green procurement processes for the ◗
purchasing of paper, furniture, information technology, energy and vehicles.
FaHCSIA’s 2007–08 Sustainability Report and previous triple bottom line reports are available on our website, or by emailing [email protected], or by writing to the Branch Manager, Property Environment and Protective Security Branch, PO Box 7576, Canberra Mail Centre, ACT 2610.

263
Corp
orat
e go
vern
ance
and
acc
ount
abili
tyPa
rt 3
Chapter 13 Our enabling strategies Part3 Corporate governance FaHCSIA Annual Report 2008–2009
Building an evidence baseFaHCSIA places a high priority on building a robust evidence base to inform policy and program development. The Department invests in research, evaluation, data and large surveys across its range of responsibilities.
In 2008–09 FaHCSIA increased its focus on sharing findings across the Department to support policy advice and program design, implementation and development.
There has been increased effort during 2008–09 toward developing effective performance indicators and data collection in light of Commonwealth–state reform and the Department of Finance and Deregulation’s Operation Sunlight. Targeted research, evaluation and data investment has supported this work.
Research, evaluation and dataIn 2008–09 FaHCSIA invested in research, evaluation and related data activities across all outcomes. Activities ranged from evaluations focusing on specific program elements through to data holdings to support analysis, and broad research that enabled a better understanding of the social and economic environment.
FaHCSIA’s annual Research and Evaluation Plan was further refined in 2008–09 to more fully capture current and planned activities within the policy environment of our major outcome areas. This and other strategic planning processes were overseen by the Research and Evaluation Committee, a sub‑committee of the Executive Management Group (see page 225).
FaHCSIA continued its research partnerships with research centres at the Australian National University and the University of New South Wales, administered under Social Policy Research Services agreements.
FaHCSIA’s research publication series continued to provide a record of findings from research and evaluation projects. During 2008–09, six occasional papers, three social policy research papers, one issue of the Australian Social Policy journal and one statistical paper were published and FaHCSIA research was published in Australian and international academic journals.
The Household Income and Labour Dynamics in Australia (HILDA) longitudinal survey of Australian households has matured into a highly respected data source, providing information about social connectedness, social capital, disability and housing, and connecting all these elements with income, employment and family dynamics. To date, more than 1,050 users have registered to have access to one or more releases of HILDA.

264 FaHCSIA Annual Report 2008–2009 Part3 Corporate governance Chapter 13 Our enabling strategies
Growing Up in Australia, the Longitudinal Study of Australian Children, continued to address a range of key questions about children’s development and wellbeing in 2008–09. Information was collected on the children’s physical health and social, cognitive and emotional development, as well as their experiences in key environments, such as the family, community, child care and school settings. In June 2009 a brief questionnaire assessing school transition, parental school involvement, life events, technology use, and puberty was mailed to parents. The study continued its involvement in the ABC Life television series, with an agreement to collaborate on the production of a documentary, Life at 5, signed in June 2009.
The Longitudinal Study of Indigenous Children completed collecting Wave 1 data in 2008 and commenced collecting Wave 2 data from the 1,850 children and families in the study in early 2009. The Wave 2 survey has an enhanced focus on preschool and schooling as a number of the study children in the four to five year cohort have commenced formal education. Qualitative information continues to be collected from families, elders and other community members.
Table 3.6 Number of projects assessed by Research and Evaluation Committee (attributable at outcome level only), 2008–09
Outcome Number
Outcome 1* 5
Outcome 2 21
Outcome 3 23
Outcome 4 54
Cross‑branch 6
* Whole‑of‑government Indigenous projects are scrutinised through Office of Indigenous Policy Coordination processes.
Protective securityThe Department produces, collects and holds a considerable amount of security classified information. It is therefore important for the Department to provide a security environment that protects our employees, information, assets and capabilities.
In November 2008, FaHCSIA undertook an internal audit on the framework and underlying processes, practices and procedures that are directly related to the storage, handling and management of sensitive information, and to identify potential gaps and associated risks to FaHCSIA. The audit report made a number of recommendations to strengthen FaHCSIA’s protective security arrangements.

265
Corp
orat
e go
vern
ance
and
acc
ount
abili
tyPa
rt 3
Chapter 13 Our enabling strategies Part3 Corporate governance FaHCSIA Annual Report 2008–2009
The Department has created an Executive Security Working Group to oversee the management of FaHCSIA’s protective, information and IT security functions and to strengthen governance and cross‑branch collaboration in developing and implementing security policy. The working group has assigned lead responsibilities and already addressed many of the audit recommendations.
A National Protective Security Risk Review was completed during the financial year. As a result, work has commenced on rewriting the Department’s Protective Security Plan, along with implementing FaHCSIA’s Departmental Security Instructions.
In 2008–09, FaHCSIA delivered an increased number of security awareness training programs to staff and contractors. These programs addressed a wide range of topics, including information security, physical security, personnel security, and incidents and investigations. Training sessions were delivered to 786 ongoing, non‑ongoing and contracted staff during 2008–09. In addition, an ongoing program of security messages to staff and contractors continued to enhance the organisation’s security awareness.
In 2008–09, FaHCSIA issued, transferred or reviewed 528 national and non‑national security clearances and significantly strengthened contractor access arrangements across the Department.
The Department has implemented a uniform and networked electronic access control system across ACT sites. This has significantly strengthened physical security at these locations. Further planning has commenced with an aim to link access control systems across the wider FaHCSIA Network.
Information management and technologyDuring the last 12 months FaHCSIA’s Information Management and Technology Group delivered a significant number of key information and application projects and services to support the Department, individuals and community organisations.
Migration projectBetween March 2008 and March 2009, a number of systems that support Indigenous business in FaHCSIA and a number of other Commonwealth agencies, including those of the Office of the Registrar of Indigenous Corporations, the Grants Management Program and the Indigenous Coordination Centres, were migrated from the Department of Education, Employment and Workplace Relations. The project was successfully completed without disruption to business and with strong positive feedback from clients. The migration affected 1,451 staff in FaHCSIA and in other agencies supported by the Indigenous systems.

266 FaHCSIA Annual Report 2008–2009 Part3 Corporate governance Chapter 13 Our enabling strategies
Information and records management systemDuring 2008–09 the Department continued to progress a whole‑of‑organisation approach to physical and electronic information and records management that will enable users to seamlessly create, capture, store, find and manage information across all areas of the business.
The improvements included:
FaHCSIA‑wide implementation of the redesigned system, supported by a comprehensive ◗
communication and training strategy. The system has embedded records management principles that will enable FaHCSIA to manage its electronic information in line with relevant legislation and compliance requirements
implementation of an enhanced corporate phone book and active directory to meet ◗
FaHCSIA’s user management and accessibility needs. These enhancements have automated access to the system to ensure security is guaranteed and intuitive to users
implementation of on‑line management of system workspaces and folders. ◗
This initiative has enabled identified users to manage access to relevant information and self‑help in a number of areas within the system.
Integrated Reporting Solution projectA strategic project to review and consolidate program reporting requirements across the Department, the Integrated Reporting Solution project, began in 2008.
This project lays the foundation for the development of a mature business intelligence environment for FaHCSIA. It maps out the consolidation of data into one source for reporting and analysis to provide the evidence to support policy development and decision making. Reporting requirements for FaHCSIA’s data are complex and, in response, FaHCSIA continues to develop an integrated reporting solution to minimise the effort required to compare data from multiple sources. The project aims to provide this as a key outcome by the end of the 2010–11 reporting period.
Over the course of 2008–09, Phase 1 of this project was completed. Phase 1 delivered four Indigenous reports to meet basic Grants Management System user needs, and will result in the decommissioning of a reporting tool which will help to simplify FaHCSIA’s business intelligence technical environment.
Additional phases of the project will commence in 2009–10, and will continue to deliver processes leading to improved sustainability in the management and use of data assets in line with the One FaHCSIA approach to data and information management.
Specific objectives for 2009–10 include the development of integrated reports from the Grants Management System and the FaHCSIA Online Funding Management System. The project will also consider reporting needs for the Australian Remote Indigenous Accommodation system and the National Indigenous Information System.

267
Corp
orat
e go
vern
ance
and
acc
ount
abili
tyPa
rt 3
Chapter 13 Our enabling strategies Part3 Corporate governance FaHCSIA Annual Report 2008–2009
Redevelopment of business systemsDuring 2008–09 FaHCSIA has implemented a number of new systems using Microsoft (MS) SharePoint 2007 and the .Net framework. These new systems have been developed to assist in the efficient delivery of FaHCSIA’s business and address both internal and external processes.
In the past year, FaHCSIA has progressed internal collaboration facilities through the development of SharePoint team sites. These sites provide a single central place to capture and share ideas, information, communication, and documents relevant to a specific target audience. The sites facilitate collaboration within FaHCSIA, particularly where members are not colocated. Team sites can be customised to support a simple business process, and can provide the functionality to develop surveys.
Approximately 50 sites and surveys have been developed within FaHCSIA to support a range of business requirements, including:
a mentors’ network ◗
a secretariat for several committees ◗
a change management process ◗
a network of environmental contacts across all FaHCSIA offices ◗
the Indigenous Staff Network ◗
assistive technology users ◗
parliamentary recordings. ◗
We undertook significant work during the year to upgrade SAP, our financial management and human resource system:
incorporating changes resulting from the transfer of the Community Development ◗
Employment Projects (CDEP) Redevelopment Project to the Department
adding the SAP Budget Allocation Tool to facilitate improved budget development and ◗
allocation activities
upgrading the Project Systems module to improve management and reporting on major ◗
capital and new policy proposals and activities related to the Business As Usual project
migrating the Travel module from a .Net front end to the SAP ESSentials portal. ◗
Community Development Employment projectsResponsibility for the CDEP program was transferred from the former Department of Employment and Workplace Relations to FaHCSIA in December 2007. In December 2008 the Australian Government announced reforms to the CDEP program and policy changes, to take effect from 1 July 2009. FaHCSIA became involved in a major rebuild and migration

268 FaHCSIA Annual Report 2008–2009 Part3 Corporate governance Chapter 13 Our enabling strategies
of the CDEP manager system. This was successfully achieved despite tight timeframes, with the new system released in June 2009. The following changes were implemented in the system:
interfaces with Centrelink, the Department of Education, Employment and Workplace ◗
Relations, Grants Management System and FaHCSIA’s SAP system
a secure website as a central point for CDEP providers to access information about ◗
the program
a training database ◗
a reporting database ◗
the successful migration and archiving of data from the existing CDEP Manager system ◗
the decommissioning of the existing CDEP manager system. ◗
Support for the Northern Territory Emergency Response and Victorian bushfiresThe Information Management and Technology Group continues to provide support for Northern Territory Emergency Response staff in many remote locations. Due to the nature of the sites, the Information and Communication Technology (ICT) solutions required are often complex and support is more difficult than in urban centres.
The group provided timely support to the staff involved in the Victorian bushfires, quickly configuring a SharePoint team site to enable communication and collaboration between emergency workers and volunteers.
Gershon ReviewFaHCSIA responded to the requirements of the Australian Government Independent Review of ICT conducted by Sir Peter Gershon (the Gershon Review) and has engaged with the Department of Finance and Deregulation to progress recommendations arising from the Gershon Review.
During 2008–09 this work involved:
written submissions detailing FaHCSIA’s IT environment, project management and ◗
governance processes
data collection of ICT financial information for 2007–08, including IT business as usual ◗
volume and metrics data
identification of savings initiatives to meet the target for 2009–10 of a 5 per cent ◗
reduction in IT business as usual spending
participation on whole‑of‑government working groups for green IT, data centre strategy, ◗
workforce planning and coordinated procurement.

269Chapter 14 Our accountability Part3 Corporate governance FaHCSIA Annual Report 2008–2009
Corp
orat
e go
vern
ance
and
acc
ount
abili
tyPa
rt 3
Our accountability at a glanceThe Department has a comprehensive suite of mechanisms to meet our accountability obligations. These mechanisms assure stakeholders of our compliance with statutory and other obligations and include a fraud control plan, ensuring the right payments are made to the right people, appearing before parliamentary committees and transparently submitting to external reviews.
External scrutinyIn 2008–09 the Department participated in a number of external scrutiny activities, including appearing before Senate Estimates on three occasions. The portfolio also gave evidence and/or made submissions to a number of parliamentary committee inquiries and participated in external audits. There have been four judicial decisions of major significance to the Department.
Fraud controlFaHCSIA works closely with other Australian Government agencies responsible for fraud prevention and investigation by sharing information and developing knowledge of identified fraud risks, fraud intelligence and trends that have an impact on the Department’s program areas.
Internal auditFaHCSIA has broad risk‑based internal audit coverage. We ensure that we action all audit recommendations appropriately. Audits promote better practice and generate advice on legislative and regulatory compliance as well as operational efficiency and effectiveness.
Our accountability14

270 FaHCSIA Annual Report 2008–2009 Part3 Corporate governance Chapter 14 Our accountability
Payment accuracy and recovery actionsFaHCSIA and Centrelink work closely together to ensure that payments made to programs and individuals are correctly assigned, paid on time and go only to properly identified and eligible parties. With Centrelink, we have developed a control framework that samples customers in order to estimate payment accuracy and emerging trends and addresses fraudulent activity. Follow‑on processes are used to recover outstanding debts or, where necessary, to pursue prosecutions.
External scrutiny
Parliamentary committeesThe portfolio appeared before the Senate Community Affairs Committee (Senate Estimates) on three occasions during 2008–09. The portfolio also gave evidence and/or made submissions to a number of parliamentary committee inquiries. These are set out below.
House of Representatives Standing Committee on Aboriginal and Torres Strait Islander Affairs—Inquiry into Remote Community StoresThe committee is inquiring into the operation of local community stores in remote Aboriginal and Torres Strait Islander communities, with a particular focus on:
food supply, quality, cost and competition issues ◗
the effectiveness of the Outback Stores model, and other private, public and community ◗
store models
the impact of these factors on the health and economic outcomes of communities. ◗
FaHCSIA provided a submission and appeared before the committee on 12 March 2009. The committee is yet to table its report.
House of Representatives Standing Committee on Family, Community, Housing and Youth—Inquiry into Better Support for CarersThe committee released its report on 1 May 2009 into the role and contribution of carers in society and how this should be recognised, the barriers to social and economic participation for carers, and practical measures required to better support carers, including key priorities for action.
On 28 November 2008, FaHCSIA led a presentation to the committee on a joint submission with the Department of Health and Ageing and the Department of Veterans’ Affairs following a presentation to the committee in the previous financial year.

271
Corp
orat
e go
vern
ance
and
acc
ount
abili
tyPa
rt 3
Chapter 14 Our accountability Part3 Corporate governance FaHCSIA Annual Report 2008–2009
The report of the inquiry was tabled on 1 May 2009. Immediate financial relief for carers is a key recommendation of the report, as well as an urgent increase in respite and in‑home assistance for carers, with current demand far exceeding supply. Better coordination of support services is also needed, with the committee recommending a one‑stop‑shop for information on community care services, as well as support systems that are nationally consistent and more streamlined.
House of Representatives Standing Committee on Climate Change, Water, Environment and the Arts—Inquiry into climate change and environmental impacts on coastal communitiesThe committee is inquiring into issues related to climate change and environmental pressures experienced by Australian coastal areas, particularly in the context of coastal population growth.
The Department provided a submission to the inquiry dated 5 August 2008 and officers from Disaster Preparedness and Recovery Branch and the Office of Indigenous Policy Coordination gave evidence at a public hearing on 19 March 2009. The committee is yet to table its report.
Joint Standing Committee on Treaties—Agreement between Australia and the Republic of Finland on Social SecurityThis committee reviews and reports on all treaty actions proposed by the Government before action is taken that binds Australia to the terms of the treaty.
The Department appeared at a public hearing on 10 November 2008 to review the proposed agreement between Australia and the Republic of Finland on social security.
House of Representatives Standing Committee on PetitionsIn July 2008, the Department provided information for a response to a petition referred to the Minister for Housing on funding for housing and accommodation services 2008. Two group managers, two branch managers and two section managers attended a public hearing on 24 September 2008.
The Department also provided evidence at a public hearing on 25 February 2009, at which five branch managers and a section manager were in attendance. The hearing was to examine a petition on the issue of disability and the Age Pension.

272 FaHCSIA Annual Report 2008–2009 Part3 Corporate governance Chapter 14 Our accountability
House of Representatives Standing Committee for Employment and Workplace Relations—Inquiry into pay equity and associated issues relating to increasing female participation in the workforceAt the request of the then Acting Minister for Employment and Workplace Relations, the Hon. Brendan O’Connor, MP, in June 2008, the House of Representatives Standing Committee for Employment and Workplace Relations is conducting an inquiry into pay equity and associated issues related to increasing female participation in the workforce. The Office for Women made a submission to the inquiry in September 2008 and also appeared before the committee to discuss the submission. The committee is expected to report on its findings in late 2009.
Joint Standing Committee on Treaties—Optional Protocol to the Convention on the Elimination of all Forms of Discrimination against Women of 18 December 1979The Attorney‑General’s Department, supported by the Office for Women, conducted an assessment of the likely impact on Australia of the Optional Protocol to the Convention on the Elimination of all Forms of Discrimination against Women and prepared a national interest analysis. A copy of the analysis was provided to the Joint Standing Committee on Treaties, which conducted a public hearing on 15 September 2008. The Office for Women, the Attorney‑General’s Department and the Department of Foreign Affairs and Trade appeared at the hearing. The committee reported to Parliament in favour of acceding. A special meeting of the Executive Council considered this matter on 24 November 2008 and accepted this recommendation. The instruments for accession to the Optional Protocol were formally lodged on 4 December 2008.
Joint Committee of Public Accounts and AuditThe Committee held a public hearing on 12 November 2008 to review the Australian National Audit Office (ANAO) Audit Report No. 42 of 2007–08, Management of Customer Debt—Follow-up Audit.
Two departmental officers provided answers to questions as well as providing information on request from committee members. The Department also provided a written response to questions on notice arising from the hearing. Overall, the committee is satisfied with the progress made in the management of customer debt, but has recommended that Centrelink, the Department of Education, Employment and Workplace Relations and FaHCSIA conduct an analysis to determine a cost‑effective debt waiver, and that this figure be reported to the committee within six months of the tabling of its report. The committee tabled its report on 22 May 2009. The Department also provided a submission to the committee on Report No. 412, Audit reports reviewed during the 41st Parliament.

273
Corp
orat
e go
vern
ance
and
acc
ount
abili
tyPa
rt 3
Chapter 14 Our accountability Part3 Corporate governance FaHCSIA Annual Report 2008–2009
Senate Community Affairs Committee—Inquiry into Social Security and Other Legislation Amendment (Pension Reform and Other 2009 Budget Measures) Bill 2009On 17 June 2009 the Senate, on the recommendation of the Selection of Bills Committee, referred these provisions for inquiry and report by 23 June 2009. The short timeframe imposed by the Senate was to ensure that the Bill passed Parliament in time to enable the pension changes to commence by the indicated dates. The committee examined only a small number of the issues in the Bill—tapering, indexation, pension age, restrictions on who receives the increase and impact on single parents.
Departmental officers appeared at public hearings on 19 June 2009. The committee report was completed on 24 June 2009. The committee recommended that the Bill be passed.
Senate Community Affairs Committee—Inquiry into Social Security Legislation Amendment (Improved Support for Carers) Bill 2009 [provisions]The committee was requested to examine the provisions of the Bill to ensure that they adequately met the needs of carers.
The Department provided a submission to the inquiry. Two departmental officers gave evidence at a public hearing on 28 April 2009 and the Department provided responses to questions on notice arising from the hearing. The final report was completed on 7 May 2009. Overall, the committee welcomed the proposed amendments because they ensure that more carers who are unable to support themselves, because of the demands of caring for children with disability or medical conditions, are receiving financial support.
Senate Community Affairs Committee—the provisions of the Family Assistance and Other Legislation Amendment (2008 Budget and Other Measures) BillProvisions in the Bill enable review of NT income management regime decisions and implements reforms to the Community Development Employment Projects (CDEP) program.
The Department sent six departmental officers to a public hearing on 28 April 2009 and provided responses to questions on notice arising from the hearing.
The report of the inquiry was completed on 7 May 2009. The committee noted that the measures in the Bill were an initial step in the expansion of appeal opportunities in relation to the Northern Territory Emergency Response income management regime, that further reforms of the income management regime to bring it into line with the Racial Discrimination Act 1975 are a matter of urgency and that the Government has committed to this work. The committee also acknowledged that transitional issues in relation to

274 FaHCSIA Annual Report 2008–2009 Part3 Corporate governance Chapter 14 Our accountability
the CDEP program are difficult. The committee shared the concerns regarding potential problems for those CDEP participants who transfer to income support and the associated compliance processes. This will be an area the committee will continue to monitor.
Senate Community Affairs Committee—Inquiry into Petrol Sniffing and Substance Abuse in Central AustraliaRepresentatives from the four partner agencies to the Petrol Sniffing Strategy (FaHCSIA, the Department of Health and Ageing, the Department of Education, Employment and Workplace Relations and the Attorney‑General’s Department) appeared at a public hearing on 12 March 2009 and presented a statement on behalf of the four agencies. A formal joint submission was also provided to the inquiry in August 2008.The report was tabled on 19 March 2009.
The committee inquired into:
the ongoing effectiveness of the eight‑point plan in combating petrol sniffing in ◗
central Australia
the extent of the rollout of Opal fuel ◗
the delivery of youth services in affected areas ◗
the effectiveness and adequacy of resources provided to address petrol sniffing and ◗
substance abuse in central Australia
what more needs to be done to effectively address petrol sniffing. ◗
Senate Community Affairs Committee—Inquiry into Appropriation (Nation Building and Jobs) Bill (No.2) 2008–09 relating to the social housing programThree officers of the Department attended a public hearing on 10 February 2009 and tabled information on the state‑by‑state breakdown of the Social Housing Initiative at that hearing. The inquiry was completed on 10 February 2009.
Senate Community Affairs Committee—Inquiry into Government Expenditure on Indigenous Affairs and Social Services in the Northern TerritoryThe committee was to inquire into the levels of federal and Northern Territory Government expenditure on Indigenous affairs and social services in the Northern Territory, including expenditure on services for families, children and people with disability in the Northern Territory. Two departmental officers presented evidence at a public hearing on 11 November 2008. The inquiry reported on 4 December 2008.

275
Corp
orat
e go
vern
ance
and
acc
ount
abili
tyPa
rt 3
Chapter 14 Our accountability Part3 Corporate governance FaHCSIA Annual Report 2008–2009
Senate Community Affairs Committee—Inquiry into Social Security and Veterans’ Entitlements Legislation Amendment (Schooling Requirements) Bill 2008The principal issues for consideration in this inquiry were the effectiveness of the proposed measures and the impact on children and families. FaHCSIA and Centrelink provided input into a submission by the Department of Education, Employment and Workplace Relations (DEEWR) and an officer attended the public hearing on 3 November 2008. The report was tabled on 13 November 2008.
Senate Community Affairs Committee—Inquiry into National Rental Affordability Scheme Bill 2008 and National Rental Affordability Scheme (Consequential Amendments) Bill 2008Reasons provided for referral of the Bills to the committee and principal issues for consideration are:
whether the Bills are targeted to deliver affordable housing to those in greatest need ◗
whether the Bills are an efficient and effective way to deliver increased ◗
affordable housing
whether the Bills facilitate investment in social housing by not‑for‑profit community ◗
housing organisations, as well as private investors.
A submission was made to the inquiry and officers appeared at a public hearing on 6 November 2008. The report of the inquiry was tabled on 12 November 2008.
Senate Community Affairs Committee—Inquiry into Families, Housing, Community Services and Indigenous Affairs and Other Legislation Amendment (Further 2008 Budget and Other Measures) Bill 2008Referral of the Bill and the issues for consideration by the committee related to amendments to child support legislation in Schedule 3 of the Bill. On 23 October 2008 the committee decided that, in light of the correspondence it has received, it would also accept submissions relating to Schedule 2 of the Bill regarding the partner service pension.
No submission was made by the Department; however, three officers appeared before the committee at a public hearing on 3 November 2008 and the inquiry report was completed on 10 November 2008.

276 FaHCSIA Annual Report 2008–2009 Part3 Corporate governance Chapter 14 Our accountability
Senate Community Affairs Committee—Building trust: Supporting Families through Disability TrustsThe Senate Committee released its report on 16 October 2008, making 14 recommendations in relation to:
why more families of dependants with disability are not making use of the current ◗
provisions to establish Special Disability Trusts
the effectiveness of Part 3.18A of the ◗ Social Security Act 1991
barriers in the relevant legislation to the establishment of Special Disability Trusts ◗
possible amendments to the relevant legislation. ◗
The Government tabled its response to this report in Parliament on 14 May 2009.
The following two tax measures to benefit Special Disability Trusts were announced in the 2009–10 Budget.
The unexpended income of a Special Disability Trust will be taxed at the beneficiary’s ◗
personal income tax rate rather than at the top personal tax rate plus Medicare Levy, with effect from the 2008–09 income year.
The capital gains tax main residence exemption will be extended to include a residence ◗
that is owned by a Special Disability Trust and used by the beneficiary as their main residence, with effect from the 2009–10 income year.
The Government has agreed to consider further those recommendations with significant budgetary and legislative implications. The consideration of these recommendations will take into account work being undertaken within the broader carer and disability policy environment.
The Department has commenced a revision of the guidelines setting out what are, and what are not, reasonable care and accommodation needs for principal beneficiaries of Special Disability Trusts.
Senate Legal and Constitutional Affairs Committee—Inquiry into the Native Title Amendment Bill 2009The Department provided evidence to the committee through a combined submission with Attorney‑General’s Department and attended a public hearing on 16 April 2009. The report was tabled on 13 May 2009.

277
Corp
orat
e go
vern
ance
and
acc
ount
abili
tyPa
rt 3
Chapter 14 Our accountability Part3 Corporate governance FaHCSIA Annual Report 2008–2009
Senate Select Committee on Regional and Remote Indigenous CommunitiesSix officers gave evidence at public hearings on 22 May 2009, 9 June 2009 and 14 November 2008. The Department also provided responses to a series of questions on notice from the committee. The first report on this inquiry was tabled on 30 September 2008.
Senate Community Affairs Committee—Inquiry into the Implementation of the Recommendations of the Lost Innocents and Forgotten Australians ReportsThis inquiry was to consider the implementation of the recommendations in the Community Affairs References Committee’s Lost Innocents and Forgotten Australians reports. The Department provided evidence to the committee through a written submission and attended a public hearing on 8 April 2009.
Following this hearing, the Department provided additional written information. The report was tabled on 25 June 2009 and recommended improving responses in several areas of Commonwealth responsibility.
Senate Community Affairs Committee—Poker Machine Harm Reduction Tax (Administration) Bill 2008; Poker Machine Harm Minimisation Bill 2008; ATMs and Cash Facilities in Licensed Venues Bill 2008The committee considered three Bills that aim to reduce the harm caused by problem gambling through:
a harm minimisation tax on revenue from poker machines ◗
technological solutions in gaming machines and automatic teller machines to reduce ◗
problem gambling
limiting the installation of automatic teller machines and cash facilities in ◗
licensed venues.
FaHCSIA appeared before the committee on 25 September 2008. The committee tabled its report on 10 November 2008 and recommended that the Bills not be passed at that time, acknowledging that findings from the Productivity Commission’s inquiry into Australia’s gambling industries would be available in 2009.

278 FaHCSIA Annual Report 2008–2009 Part3 Corporate governance Chapter 14 Our accountability
Approaches to the OmbudsmanThe Commonwealth Ombudsman received 200 approaches about the Department in 2008–09, an increase from 165 (21.2 per cent) approaches received in 2007–08.
Of the 200 complaints received, 146 were in relation to the Emergency Response or other Indigenous programs in the Northern Territory.
During 2008–09, 164 approaches were finalised. Of these, the Ombudsman investigated 88 and exercised discretion not to investigate 76. Of the 88 approaches investigated by the Ombudsman, there was one finding of administrative deficiency.
Australian National Audit Office activityThe Auditor‑General tabled five audit reports in Parliament relevant to departmental operations. The objectives of the engagements are below.
No. 11: Disability Employment Services (tabled 4 December 2008)This audit assessed how effectively FaHCSIA and the Department of Employment, Education and Workplace Relations undertook their roles and responsibilities for specialist disability employment services under the current (third) Commonwealth State Territory Disability Agreement.
No. 13: Australian Government Agencies’ Management of their Websites (tabled 16 December 2008)This audit assessed how effectively government agencies managed aspects of their websites. The audit involved a survey of 40 agencies and visits to some of those agencies.
No. 14: Audits of the Financial Statements of Australian Government Entities for the Period Ended 30 June 2008 (tabled 17 December 2008)The annual Financial Statements audit has been conducted as an independent external examination of the financial accounting and reporting of public sector entities.
No. 25: Green Procurement and Sustainable Office Management (tabled 11 March 2009)This audit assessed the progress of government agencies in achieving better practice in green office procurement and sustainable office management.

279
Corp
orat
e go
vern
ance
and
acc
ount
abili
tyPa
rt 3
Chapter 14 Our accountability Part3 Corporate governance FaHCSIA Annual Report 2008–2009
No. 30: Support for Victims of People Trafficking (tabled 29 April 2009)This audit assessed the arrangements for overseeing the Australian Government’s Action Plan to Eradicate Trafficking in Persons and to identify whether the plan’s new measures had been administered effectively to deliver the intended results.
No. 42: Interim Phase of the Audit of Financial Statements of General Government Sector Agencies for the Year ending 30 June 2009 (tabled 22 June 2009)The annual Financial Statements audit has been conducted as an independent external examination of the financial accounting and reporting of public sector entities.
Office of Evaluation and Audit activityThe Office of Evaluation and Audit provides objective advice to the Australian Government about the management and performance of its programs for Aboriginal and Torres Strait Islander peoples. It makes recommendations about how Indigenous‑specific programs can be improved and how the Australian Government can deliver better outcomes for Aboriginal and Torres Strait Islander peoples.
During 2008–09, the Director of the Office of Evaluation and Audit tabled four audit reports in Parliament in relation to which FaHCSIA was a key stakeholder. The objectives of the engagements have been outlined below.
Aboriginals Benefit Account (tabled November 2008)This engagement examined the efficiency, effectiveness and economy of the Aboriginals Benefit Account, and its overall management.
Centrecorp Aboriginal Investment Corporation Pty Ltd (tabled March 2009)This engagement examined Centrecorp, Yeperenye Nominees and Central Australian Aboriginal Motor Vehicles (CAAMV) Pty Ltd’s corporate governance arrangements, the sourcing and application of Australian Government funds and benefits that accrue for Aboriginal people in Central Australia.
Indigenous Land Corporation—Follow-up of Aspects of the National Indigenous Development Centre (tabled November 2008)This engagement was a recommendation of the Office of Evaluation and Audit’s 2006–07 audit of the operation of the Indigenous Land Corporation. The audit examined the costs, benefits, risks and long‑term viability of the National Indigenous Development Centre.

280 FaHCSIA Annual Report 2008–2009 Part3 Corporate governance Chapter 14 Our accountability
Northern Land Council—governance component (tabled December 2008)This engagement examined whether the governance and management structures and processes of the Northern Land Council were appropriate, efficient and effective for a statutory authority established under the Aboriginal Land Rights (Northern Territory) Act 1976.
Judicial decisionsThere have been four judicial decisions of major significance to the Department in the 2008–09 financial year.
In Wurridjal & Ors v The Commonwealth of Australia & Anor [2009] HCA 2, the High Court rejected a challenge to the constitutional validity of parts of the Northern Territory National Emergency Response Act 2007 and the Families, Community Services and Indigenous Affairs and Other Legislation Amendment (Northern Territory National Emergency Response and Other Measures) Act 2007. In particular, a majority of the High Court rejected the plaintiffs’ arguments that the grant of five‑year leases of Aboriginal land to the Commonwealth and the modifications to the so‑called ‘permit system’ effected an acquisition of property other than on just terms.
In Northern Territory of Australia v Arnhem Land Aboriginal Land Trust [2008] HCA 29 (‘the Blue Mud Bay case’), the High Court held that fishing licences issued under Northern Territory fishing legislation do not negate the need for the holders of those licences to obtain the further permission of the relevant Land Trust or traditional Aboriginal owners where the holder of the licence wishes to take fish from the inter‑tidal zone, tidal rivers or estuaries within the boundaries of Aboriginal land granted under the Aboriginal Land Rights (Northern Territory) Act 1976.
In Commonwealth v David Leigh as Liquidator of Durahrwa Training & Development Aboriginal Corporation (In Liquidation) [2008] FCA 1513, the Federal Court held that real property purchased with a grant provided by the former Aboriginal and Torres Strait Islander Commission was charged, pursuant to a purposes agreement, to secure repayment of the grant amount and the Commonwealth’s claim for costs and expenses incurred in enforcing repayment was secured upon the property by virtue of item 201 of Schedule 1 to the Aboriginal and Torres Strait Islander Commission Amendment Act 2005 (Amendment Act). The Court also found that the fact that the property was vacant and not being used for any purpose was enough to find a breach of the designated use clause of the purposes agreement, and hence to support the validity of a notice seeking repayment issued under item 199 of Schedule 1 to the Amendment Act.
In Elliot v Secretary, Department of Education, Employment and Workplace Relations [2009] FCAFC 37, beneficiaries under a testamentary life discretionary trust had been assessed

281
Corp
orat
e go
vern
ance
and
acc
ount
abili
tyPa
rt 3
Chapter 14 Our accountability Part3 Corporate governance FaHCSIA Annual Report 2008–2009
as having ‘beneficial interests in the corpus or income of the trust’ under paragraph 1207V(2 (d) of the Social Security Act 1991. The Court found that this was not, in fact, the case, as beneficiaries of a discretionary trust cannot be described as having a ‘beneficial interest’ in respect of the trust. The Department is considering the impact of the decision.
PrivacyFaHCSIA has a strong framework of measures in place to protect the privacy of individuals. This framework includes secrecy legislation, privacy legislation, arrangements with the service delivery agencies and a number of detailed measures, such as confidentiality deeds and declarations with providers and staff.
In addition to the obligations imposed by the Privacy Act 1988, legislation administered by FaHCSIA contains broad secrecy provisions that expressly prohibit the release of customer information, except in limited circumstances. Those provisions include criminal offences that may result in a term of imprisonment.
FaHCSIA’s business partnership agreements with its partner agencies include mechanisms that allow FaHCSIA to monitor and contribute to the protection of customer privacy and enables all parties to cooperate on handling matters related to privacy. (See also ‘Fraud control’ below.)
Office of the Privacy CommissionerFaHCSIA liaises with the Privacy Commissioner on policy development related to privacy issues relating to social security, family assistance, Indigenous affairs and the handling of personal information.
The Office of the Privacy Commissioner may investigate a privacy issue whether or not a complaint has been made and issue a report or determination following that investigation. During 2008–09 the Office of the Privacy Commissioner did not investigate a privacy issue or issue any report or determinations in relation to FaHCSIA.
Commonwealth OmbudsmanThe Commonwealth Ombudsman received one complaint regarding the handling of personal information by FaHCSIA. An internal investigation found that a breach of privacy had occurred and the matter was resolved between the Department and the complainant with the assistance of the Commonwealth Ombudsman.
Privacy compliance and investigationsThe improper use and disclosure of personal information by staff, or the collection of personal information from staff, are matters treated seriously by the Department. FaHCSIA ensures that investigations are carried out in relation to any complaints or allegations of breaches of privacy or confidentiality.

282 FaHCSIA Annual Report 2008–2009 Part3 Corporate governance Chapter 14 Our accountability
Freedom of Information requestsFaHCSIA handles all Freedom of Information (FOI) requests in accordance with the Freedom of Information Act 1982. Supplementary materials, such as the FOI Guidelines, are used to inform the handling of FOI requests where necessary. These guidelines are available at www.pmc.gov.au.
Procedures for gaining access to documentsThe FOI Coordinator in FaHCSIA provides advice on FOI matters to any interested parties and liaises with applicants.
Formal applications for access to documents under FOI must be made by letter or written request. It must be accompanied by a $30 application fee, though this may be waived in certain circumstances. The application should be submitted to the FOI Coordinator in National Office or with a state FOI contact officer from any of FaHCSIA’s state offices. Further details are provided at Appendix 7 on page 342.
Fraud controlFaHCSIA has a fraud control plan in place that complies with the Commonwealth Fraud Control Guidelines 2002.
During the year, the Department addressed its fraud control responsibilities mainly through the Audit and Fraud Branch and the Indigenous Programs Investigation Branch.
The Audit and Fraud Branch provided fraud awareness training and advice on policy, guidelines and procedures to FaHCSIA staff. The branch managed the investigation of fraud allegations against FaHCSIA programs (excluding Indigenous Programs) and allegations of criminal conduct by FaHCSIA employees. The Branch was also responsible for monitoring FaHCSIA’s Fraud Control Plan 2007–2009 and reporting on fraud‑related matters for the Department.
The Indigenous Programs Investigation Branch investigated fraud committed against FaHCSIA’s Indigenous programs and services, and coordinated investigations requiring a whole‑of‑government response.
In April 2009, the two branches merged to form the Compliance Branch. This move gave us the opportunity to consolidate our fraud control and investigation functions.
Due to additional responsibilities in program areas, and in keeping with the Commonwealth Fraud Control Guidelines, FaHCSIA maintained our emphasis on fraud control programs, awareness raising and reporting. In particular, we implemented all recommended action

283
Corp
orat
e go
vern
ance
and
acc
ount
abili
tyPa
rt 3
Chapter 14 Our accountability Part3 Corporate governance FaHCSIA Annual Report 2008–2009
items under our Fraud Control Plan and the addendum to it. The addendum addressed fraud control risks associated with the Northern Territory Emergency Response.
All FaHCSIA investigators have the mandatory qualifications outlined in the Australian Government Investigation Standards and the Commonwealth Fraud Control Guidelines.
FaHCSIA works closely with other Australian Government agencies responsible for fraud prevention and investigation by sharing information and developing knowledge of identified fraud risks, fraud intelligence and trends that have an impact on our program areas.
The Department’s fraud control arrangements are certified below.

284 FaHCSIA Annual Report 2008–2009 Part3 Corporate governance Chapter 14 Our accountability
Internal auditFaHCSIA ensures that there is broad risk‑based internal audit coverage across the Department and that appropriate action is taken on audit recommendations to reduce our overall risk exposure. The audits also promote better practice and generate advice on legislative and regulatory compliance and operational efficiency and effectiveness.
FaHCSIA continued to build its in‑house internal audit function with the assistance and cooperation of the Department’s newly contracted primary internal audit service provider, Oakton, and secondary service providers Deloitte Touche Tohmatsu and PricewaterhouseCoopers. Audits were performed either individually by service providers or as a co‑sourced arrangement with the in‑house capability on matters that included:
Strategic Housing Alliance ◗
FaHCSIA relationship with the community services sector ◗
property management ◗
workforce planning ◗
procurement and contract management ◗
credit card processes ◗
procurement and contract management for the Northern Territory Emergency Response ◗
budget and expenditure allocation for the Northern Territory Emergency Response ◗
management of Disability Support Pension, Carers Allowance and Carers Payment ◗
MaPS.NET business information system ◗
management of expenditure performance ◗
access to sensitive information ◗
Office of the Registrar of Indigenous Corporations business processes ◗
administration of Rent Assistance ◗
regulatory compliance and business processes ◗
management of staff housing ◗
acquittals processes ◗
reforms to the Community Development Employment Projects program ◗
management of grants ◗
contracting of longitudinal studies. ◗

285
Corp
orat
e go
vern
ance
and
acc
ount
abili
tyPa
rt 3
Chapter 14 Our accountability Part3 Corporate governance FaHCSIA Annual Report 2008–2009
Social Security Appeals TribunalThe Social Security Appeals Tribunal is a statutory body under the Social Security (Administration) Act 1999 that conducts merit reviews of administrative decisions made under a number of enactments, in particular the social security law, family assistance law and child support law. The tribunal’s primary objective is to provide a mechanism of review that is fair, just, economical, informal and quick. It submits an annual report to the Minister for Families, Housing, Community Services and Indigenous Affairs, which is presented to the Parliament.
FaHCSIA provides advice to the Minister and works with external stakeholders, including the Department of Education, Employment and Workplace Relations, the Department of Human Services and Centrelink, on matters relating to the tribunal.
Activities include:
facilitating the appointment and resignation processes for members ◗
coordinating cross‑agency involvement on policy‑related issues ◗
providing advice and assistance with the implementation of process improvements. ◗
A memorandum of understanding between FaHCSIA and the tribunal covers the administrative services support FaHCSIA provides to it. FaHCSIA provides financial and personnel management information systems to the tribunal to assist it in performing purchasing, accounts payment, budgeting and staff management functions.
Act of grace paymentsGenerally, act of grace payments are a means of providing compensation to persons who may have been unfairly disadvantaged by the Australian Government, but who have no legal claim against it.
During the 2008–09 financial reporting year, the total amount of act of grace payments was $410,498.94. The total number of act of grace payments during the reporting period was 55.
Right payments to the right peopleFaHCSIA and Centrelink work closely together to ensure that payments to programs and individuals are paid on time and only to the properly identified and eligible parties.
The Business Partnership Agreement 2006–10 governs the business relationship between FaHCSIA and Centrelink. The agreement sets out the performance measures and assurance mechanisms for payments and services delivered by Centrelink on behalf of FaHCSIA.

286 FaHCSIA Annual Report 2008–2009 Part3 Corporate governance Chapter 14 Our accountability
FaHCSIA ensures Centrelink has controls in place to minimise the incidence of incorrect payment and fraud. This in turn leads to a framework that maximises correct payment and the accuracy of program outlays. The success of this approach is measured through a set of performance indicators agreed to by FaHCSIA and Centrelink. For more information on fraud, see pages 282–283.
Control of program and incorrect paymentThe FaHCSIA control framework focuses on prevention and detection of incorrect payment and fraud, and relies on a risk management approach to optimise compliance. FaHCSIA works with Centrelink to:
develop, implement and support systems and procedures to prevent, identify and ◗
investigate incorrect payments and fraud
undertake activities in debt prevention, reviews, analysis, identification, raising and ◗
recovery, as well as investigation and prosecution
monitor, analyse and report on performance ◗
inform of compliance issues, trends, projects and results. ◗
Controls are designed to be cost effective, while minimising customer impacts. Customers are promptly notified of determinations resulting from reviews that affect a rate of payment or result in a debt or action to recover a debt.
Maximising correctness of paymentsThe FaHCSIA control framework includes:
alerting customers to their obligations ◗
verifying relevant facts about customers, including their identity, personal and ◗
financial circumstances
requiring customers to provide their tax file numbers and, where appropriate, their ◗
partner’s tax file numbers as a condition for receipt of payment
requiring pensions and allowances to be paid directly into customers’ accounts to reduce ◗
the occurrence of cheque fraud
reviewing the circumstances of customers considered to be at risk of receiving ◗
incorrect payment
promptly seeking recovery of debts ◗
referring more serious cases of suspected fraud to the Commonwealth Director of ◗
Public Prosecutions.

287
Corp
orat
e go
vern
ance
and
acc
ount
abili
tyPa
rt 3
Chapter 14 Our accountability Part3 Corporate governance FaHCSIA Annual Report 2008–2009
Measuring the accuracy of outlaysThe Random Sample Survey program provides an estimate of the accuracy and inaccuracies of program outlays and intelligence about emerging outlay risks. The surveys also provide useful information that assists the policy development process.
The program also provides assurance information required under the Business Partnership Agreement. Random samples are a point in time analysis of customers’ circumstances.
During 2008–09, on FaHCSIA’s behalf, Centrelink undertook random sample surveys of:
5,000 Age Pension customers ◗
250 Carer Allowance customers ◗
1,500 Carer Payment customers ◗
2,250 Family Tax Benefit customers ◗
500 Special Benefit customers ◗
2,757 Disability Support Pension customers. ◗
The results of these surveys are presented in Table 3.7.
Table 3.7 Payment inaccuracy by payment type, 30 June 2009
Payment type Inaccuracy (95% confidence interval)
Age Pension 1.5% (1.2%–1.8%)
Carer Allowance 1.6% (0.5%–2.7%)
Family Tax Benefit 1.3% (1.2%–1.4%)
Special Benefit 3.7% (1.4%–6%)
Disability Support Pension 2.2% (1.4%–3%)
Carer Payment 2.6% (1.7%–3.5%)
Overall rate of inaccuracy 1.6% (1.4%–1.8%)
Notes:
Inaccuracy is the ratio of gross inaccurate payment (annualised) to annual outlay (amounts being paid) to the same population. Because this rate is estimated using sample data it is subject to sampling error. The effect of the sampling error is reflected in the width of the confidence interval.
The random sample surveys are designed to measure inaccuracies as a result of negligence, circumstance or error. They do not capture payment errors due to deliberate fraud.
Estimates refer to the 12 months to 30 June 2009 except for Carer Allowance, where the reference period is the 12 months to 31 March 2009.
A small sample results in a wide confidence interval.
The confidence interval reflects the small sample and variability in population.

288 FaHCSIA Annual Report 2008–2009 Part3 Corporate governance Chapter 14 Our accountability
Table 3.8 Achievement against performance indicators
Performance indicator Target Actual
Compliance and fraud Savings of $359.19 million In 2008–09, savings from 241,068 reviews was $305.30 million
Profiling reviews Savings of $43.6 million In 2008–09, savings from 359,306 reviews was $38.6 million
Debt raised 70% of the undetermined debt base
Total debt determined as percentage of the undetermined debt base for the financial year was 77.4%
Debt recovered 72% of debts recovered as a portion of the debts raised (in dollar terms)
Total debt recovered was 72.0% of debts recovered as a portion of the debts raised (in dollar terms)
Debt under management 65% of debts under recovery as the percentage of the total debt base
Total value of debts under recovery as a percentage of the debt base for the financial year was 74.0%
Overall outlay accuracy Overall outlay accuracy—95%
98.4%
Debt raising and recoveryCentrelink raised 740,792 FaHCSIA debts valued at $359.3 million. Of these, debts raised for recovery totalled $335.8 million with a further $23.5 million waived at determination.
Recoveries of FaHCSIA and Family Assistance Office debts by cash and withholdings amounted to $241.6 million. These figures include compensation debts.
Total debt determined as a percentage of the undermined debt base for the financial year was 77.4 per cent.
Total value of debts under recovery, as a percentage of the debt base for the financial year, was 74.0 per cent.
The figures exclude Family Tax Benefit reconciliation and tax return non‑lodger debts.

289
Corp
orat
e go
vern
ance
and
acc
ount
abili
tyPa
rt 3
Chapter 14 Our accountability Part3 Corporate governance FaHCSIA Annual Report 2008–2009
CompensationThe compensation provisions in the Social Security Act 1991 are structured to encourage people to use private financial resources, such as compensation payments, before accessing the tax‑payer funded social security system. The provisions also ensure that people who receive compensation for an injury or illness have those payments considered in the calculation of any social security benefits.
Compensation provisions provide for:
compelling people to claim for compensation where compensation may be payable ◗
recovery of past payments of social security from arrears payments of periodic ◗
compensation payments and lump‑sum compensation payments
preclusion periods within which social security payments cannot be paid due to the ◗
receipt of lump‑sum compensation payments
periodic payments, such as weekly workers’ compensation payments, to reduce directly ◗
dollar‑for‑dollar, the rate of social security payments otherwise payable—any excess is treated as income for partners of compensation recipients.
To ensure the community understands the effect of compensation on social security benefits, Centrelink provides information on its website for compensation recipients, compensation authorities, legal, insurance, union and community representatives.
In 2008–09, application of the compensation provisions across all income support payments made under the Social Security Act 1991, administered by FaHCSIA and the Department of Education, Employment and Workplace Relations, achieved estimated savings to outlays of $558.5 million.
ProsecutionsIn 2008–09, 905 cases of alleged social security fraud were referred to the Commonwealth Director of Public Prosecutions, who prosecuted 544 cases, resulting in 489 convictions (a 98.7 percent conviction rate).
Identity fraudOf the 1,908 reviews conducted in 2008–09, 63 cases of identity fraud were identified, resulting in 581 debts with a value of $8.3 million.

291 Appendix 1: Agency resource statement and resources for outcomes
303 Appendix 2: Staffing overview
308 Appendix 3: Commonwealth Disability Strategy performance report
312 Appendix 4: Advertising and market research
317 Appendix 5: Consultancy contract details
339 Appendix 6: Grant programs
342 Appendix 7: Freedom of information
347 Appendix 8: Legislation
350 Appendix 9: Age Pension supplementary information
357 Appendix 10: Family Tax Benefit reconciliation data
363 Appendix 11: Statement of material error 2007–08
364 Appendix 12: Aboriginals Benefit Account Annual Report 2008–09
4Appendices

291Chapter 15 Appendices Part4 Appendices FaHCSIA Annual Report 2008–2009
Appe
ndic
esPa
rt 4
Appendix 1: Agency resource statement and resources for outcomesThe following tables outline financial details of FaHCSIA’s total resources from all origins.
The Agency Resource Statement provides information about the various funding sources that FaHCSIA has drawn upon during 2008–09.
Table 4.1 below has been designed to allow agencies to reconcile the final usage of all resources in cash terms, by declaring the actual available appropriation for 2008–09, and comparing this to the actual payments made.
Tables 4.2–4.5 within this appendix have been developed to provide detailed financial information on total resources by outcome. These tables correspond to our total resources for outcome tables found in the Department’s 2008–09 Portfolio Budget Statements.
15 Appendices

292 FaHCSIA Annual Report 2008–2009 Part4 Appendices Chapter 15 Appendices
Table 4.1 Agency resource statement 2008–09
Actual Available
Appropriations for 2008–09
$’000
Payments Made4
2008–09 $’000
Balance Remaining
(a) (b) (a–b)Ordinary Annual Services1
Departmental appropriationDepartmental appropriation 1,659,988 1,637,548 22,440S.31 Relevant agency receipts3 32,548 32,548Total 1,692,536 1,637,548 54,988
Administered expenses Outcome 1 860,124 743,992 Outcome 2 529,456 486,645 Outcome 3 207,627 173,836 Outcome 4 209,867 193,058 Payments to CAC Act Bodies 124,060 124,060 Total 1,931,134 1,721,591
Total ordinary annual services 3,623,670 3,359,139 Other services2 Administered expenses
Specific payments to States, ACT, NT and local government Outcome 1 389,732 153,381 Outcome 2 1,024,534 541,585 Outcome 3 18,099 9,629 Outcome 4 1,202,218 591,734 Total 2,634,583 1,296,329
Departmental non-operatingEquity injections 18,289 18,289 –Total 18,289 18,289 –
Total other services 2,652,872 1,314,618
Special appropriations Special appropriations limited
by criteria/entitlement Aboriginal Land Rights (Northern Territory) Act 1976 218,880
Social Security (Administration) Act 1999 45,494,850 A New Tax System (Family Assistance) (Administration) Act 1999 23,472,155
Total special appropriations 69,185,885
Special Accounts Opening balance 1,872,084 Appropriation receipts 494,649 Non‑appropriation receipts to Special Accounts 145,538 Payments made 408,337 Closing Balance 2,103,934

293
Appe
ndic
esPa
rt 4
Chapter 15 Appendices Part4 Appendices FaHCSIA Annual Report 2008–2009
Actual Available
Appropriations for 2008–09
$’000
Payments Made4
2008–09 $’000
Balance Remaining
Total Special Accounts 2,512,271 408,337 Total Resourcing and Payments 8,788,813 74,267,979
1 Appropriation Bill (No.1) 2008–09, Appropriation Bill (No.3) 2008–09, Appropriation Bill (No.5) 2008–09, S30 refunds, prior year appropriations and retention and other relevant sources as per note 25 of FaHCSIA’s annual financial statements
2 Appropriation Bill (No.2) 2008–09, and Appropriation Bill (No.4) 2008–09 and other relevant sources as per note 25 of FaHCSIA’s annual financial statements
3 Relevant agency receipts (FMA Act s31)
4 Cash payments
Table 4.2 Outcome resource statement for Outcome 1Outcome 1: Greater self-reliance and economic, social and community engagement for Indigenous Australians
Budget * 2008-09
$’000
ActualExpenses2008-09
$’000Variation
$’000
(a) (b) (b) ‑ (a)
Output Group 1.1:
Departmental Outputs
Ordinary Annual Services (Appropriation Bill No. 1) 67,028 70,785 3,757
Subtotal Departmental Outputs 67,028 70,785 3,757
Subtotal for Output Group 1.1 67,028 70,785 3,757
Output Group 1.2:
Administered Expenses
Ordinary Annual Services (Appropriation Bill No. 1) Australian Remote Indigenous Housing Programme 127,932 122,637 ‑5,295Community Development and Employment Program 430,192 372,331 ‑57,861Indigenous Boarding Hostels Partnerships Initiative (IBHP) 4,722 4,454 ‑268
Indigenous Communities Strategic Investment 31,008 30,755 ‑253
Indigenous Leadership 10,098 10,098 –
Native Title and Land Rights 65,949 68,874 2,925
Northern Territory Emergency Response 111,022 110,528 ‑494
Payments to universities and other organisations for special studies and research 1,288 1,279 ‑9
Public Awareness 2,916 2,916 –
Repatriation 554 554 –
Table 4.1 Agency resource statement 2008–09 continued

294 FaHCSIA Annual Report 2008–2009 Part4 Appendices Chapter 15 Appendices
Budget * 2008-09
$’000
ActualExpenses2008-09
$’000Variation
$’000
Subtotal Bill 1 785,681 724,426 -61,255
Other Services (Appropriation Bill No. 2)
Australian Remote Indigenous Housing SPP 144,334 144,333 ‑1
Improving Policing in Very Remote Areas SPP 9,047 9,047 –
Subtotal Bill 2 153,381 153,380 -1
Special Appropriations
Aboriginal Land Rights (NT) Act 1976 Aboriginal Benefits Account Special Appropriation 226,347 218,515 ‑7,832
Northern Territory Emergency Response ‑ Land Reform 4,439 – ‑4,439
Ranger Agreement 200 200 –
Subtotal Special Appropriations 230,986 218,715 -12,271
Special Accounts
Aboriginal Benefits Account Special Account
Opening balance 200,512 197,022 ‑3,490
Appropriation receipts 226,347 218,515 ‑7,832Non‑Appropriation receipts to Special Accounts 9,659 12,302 2,643
Aboriginal and Torres Strait Islander Land Account
Opening balance 1,635,675 1,635,676 1
Appropriation receipts – – –Non‑Appropriation receipts to Special Accounts 103,412 122,663 19,251
Indigenous Communities Strategic Investment Special Account
Opening balance – – –
Appropriation receipts 16 220 204Non‑Appropriation receipts to Special Accounts 3,263 3,533 270
Income Management Special Account
Opening balance 3,235 3,235 –
Appropriation receipts – 165,519 165,519Non‑Appropriation receipts to Special Accounts 182,194 1,351 ‑180,843
Northern Territory Flexible Funding Pool Special Account
Opening balance 28,735 28,735 –
Appropriation receipts 108,799 105,387 ‑3,412Non‑Appropriation receipts to Special Accounts – 2,840 2,840
Table 4.2 Outcome resource statement for Outcome 1 continued

295
Appe
ndic
esPa
rt 4
Chapter 15 Appendices Part4 Appendices FaHCSIA Annual Report 2008–2009
Budget * 2008-09
$’000
ActualExpenses2008-09
$’000Variation
$’000
Other Services ‑ Services for other Government and Non‑Government Bodies
Opening balance 0 0 0
Appropriation receipts 0 0 0Non‑Appropriation receipts to Special Accounts 1,640 1,771 131
Other Trust Monies –
Opening balance 141 141 –
Appropriation receipts – – –Non‑Appropriation receipts to Special Accounts 0 13 13
Subtotal Special Accounts 2,503,628 2,498,923 -4,705
Departmental Outputs
Ordinary Annual Services (Appropriation Bill No. 1) 221,661 234,085 12,424
Revenues from independent Sources (s31) 25,634 26,894 1,260
Subtotal Departmental Outputs 247,295 260,979 13,684
Subtotal for Output Group 1.2 3,920,971 3,856,423 -64,548
Output Group 1.3:
Departmental Outputs
Ordinary Annual Services (Appropriation Bill No. 1) 8,589 9,070 481
Subtotal Departmental Outputs 8,589 9,070 481
Subtotal for Output Group 1.3 8,589 9,070 481
Total for Outcome 1
Departmental 322,912 340,834 17,922
Administered 3,673,676 3,595,444 ‑78,232
Less: Appropriations credited to Special Accounts 335,162 489,641 154,479
Total 3,661,426 3,446,637 -214,789
Average Staffing Level (number) 1,277
* Full‑year budget, including any subsequent adjustment made to the 2008‑09 Budget.
Table 4.2 Outcome resource statement for Outcome 1 continued

296 FaHCSIA Annual Report 2008–2009 Part4 Appendices Chapter 15 Appendices
Table 4.3 Outcome resource statement for Outcome 2Outcome 2: Seniors, people with disabilities, carers, youth and women are supported, recognised and encouraged to participate in the community
Budget * 2008-09
$’000
ActualExpenses2008-09
$’000Variation
$’000 (a) (b) (b) ‑ (a)Output Group 2.0:
Administered Expenses
Ordinary Annual Services (Appropriation Bill No. 1) Economic Security Strategy ‑ public information campaign 2,726 1,894 ‑ 832 Payments under s33 of FMA Act 170 410 240 Subtotal Bill 1 2,896 2,304 - 592
Special Appropriations Social Security (Administration) Act 1999 Education Entry Payment 25,534 25,534
Bereavement Allowance 2,959 2,885 ‑ 74 Farmers Hardship Bonus 21,400 20,669 ‑ 731 Special Benefit 65,448 65,251 ‑ 197 Training and Learning Bonus 56,872 43,238 ‑ 13,634 Subtotal Special Appropriations 146,679 157,577 10,898
Departmental Outputs Ordinary Annual Services (Appropriation Bill No. 1) 3,351 3,538 187 Revenues from independent Sources (s31) 7,327 7,687 360 Subtotal Departmental Outputs 10,678 11,225 547
Subtotal for Output Group 2.0 160,253 171,106 10,853
Output Group 2.1:
Administered Expenses
Ordinary Annual Services (Appropriation Bill No. 1) Broadband for Seniors 5,000 5,000 ‑ Reimbursement to Great Southern Rail for concessional fares 7,878 6,914 ‑ 964 Subtotal Bill 1 12,878 11,914 - 964
Other Services (Appropriation Bill No. 2) Compensation for Extension of Fringe Benefits to pensioners and older long‑term allowees and beneficiaries 109,869 109,869 ‑ Subtotal Bill 2 109,869 109,869 -
Special Appropriations Social Security (Administration) Act 1999
Age Pension 28,080,203 28,098,263 18,060 Seniors Concession Allowance 466,559 465,352 ‑ 1,207 Telephone Allowance for Commonwealth Seniors Health Card Holders 18,244 18,185 ‑ 59 Utilities Allowance 1,123,673 1,146,530 22,857 Subtotal Special Appropriations 29,688,679 29,728,330 39,651

297
Appe
ndic
esPa
rt 4
Chapter 15 Appendices Part4 Appendices FaHCSIA Annual Report 2008–2009
Budget * 2008-09
$’000
ActualExpenses2008-09
$’000Variation
$’000Departmental Outputs
Ordinary Annual Services (Appropriation Bill No. 1) 332,157 350,774 18,617 Subtotal Departmental Outputs 332,157 350,774 18,617
Subtotal for Output Group 2.1 30,143,583 30,200,887 57,304
Output Group 2.2: Administered Expenses
Ordinary Annual Services (Appropriation Bill No. 1) Mental Health 143,602 143,262 ‑ 340 Services for People with Disability 276,904 275,667 ‑ 1,237 Subtotal Bill 1 420,506 418,929 - 1,577
Other Services (Appropriation Bill No. 2) Commonwealth State Territory Disability Agreement SPP 415,128 415,128 ‑ Subtotal Bill 2 415,128 415,128 -
Special Appropriations Social Security (Administration) Act 1999
Disability Support Pension 10,991,355 10,918,088 ‑ 73,267 Subtotal Special Appropriations 10,991,355 10,918,088 - 73,267
Special Accounts Commonwealth State and Territory Disability Agreement Account
Opening balance 221 221 ‑ Appropriation receipts ‑ 2,700 2,700 Non‑Appropriation receipts to Special Accounts 780 438 ‑ 342
Subtotal Special Accounts 1,001 3,359 2,358 Departmental Outputs
Ordinary Annual Services (Appropriation Bill No. 1) 167,680 177,078 9,398 Subtotal Departmental Outputs 167,680 177,078 9,398
Subtotal for Output Group 2.2 11,995,670 11,932,582 - 63,088
Output Group 2.3: Administered Expenses
Ordinary Annual Services (Appropriation Bill No. 1) Ex‑Gratia Payments to Unsuccessful Applicants of Carer Payment (Child) 3,300 2,452 ‑ 848 Support for Carers 10,476 10,476 ‑ Subtotal Bill 1 13,776 12,928 - 848
Special Appropriations Social Security (Administration) Act 1999
Carer Allowance (Adult) 1,267,266 1,270,309 3,043 Carer Allowance (Child) 532,348 530,703 ‑ 1,645 Carer Payment 1,941,847 1,938,825 ‑ 3,022 Carer Supplement 373,072 408,025 34,953 Child Disability Assistance Payment 142,139 142,786 647 Subtotal Special Appropriations 4,256,672 4,290,648 33,976
Table 4.3 Outcome resource statement for Outcome 2 continued

298 FaHCSIA Annual Report 2008–2009 Part4 Appendices Chapter 15 Appendices
Budget * 2008-09
$’000
ActualExpenses2008-09
$’000Variation
$’000Departmental Outputs
Ordinary Annual Services (Appropriation Bill No. 1) 86,545 91,396 4,851 Subtotal Departmental Outputs 86,545 91,396 4,851
Subtotal for Output Group 2.3 4,356,993 4,394,972 37,979
Output Group 2.4: Administered Expenses
Ordinary Annual Services (Appropriation Bill No. 1) Youth Homelessness 23,646 23,646 ‑ Subtotal Bill 1 23,646 23,646 -
Other Services (Appropriation Bill No. 2) COAG Health Services ‑ Younger People with Disability in Residential Aged Care SPP 16,547 16,547 ‑ Subtotal Bill 2 16,547 16,547 -
Departmental Outputs Ordinary Annual Services (Appropriation Bill No. 1) 6,716 7,092 376 Subtotal Departmental Expenses 6,716 7,092 376
Subtotal for Output Group 2.4 46,909 47,285 376 Output Group 2.5:
Administered Expenses Ordinary Annual Services (Appropriation Bill No. 1)
Support for Victims of Trafficking 755 721 ‑ 34 Women’s Leadership and Development 3,841 3,810 ‑ 31 Women’s Safety Agenda 11,509 11,393 ‑ 116 Subtotal Bill 1 16,105 15,924 - 181
Special Appropriations Social Security (Administration) Act 1999
Widow B Pension 7,998 7,204 ‑ 794 Wife Pension (Age) 157,217 157,611 394 Wife Pension (DSP) 208,965 209,135 170 Subtotal Special Appropriations 374,180 373,950 - 230
Special Accounts Other Services ‑ Services for other Government and Non‑Government Bodies
Opening balance 72 72 ‑ Appropriation receipts ‑ 22 22 Non‑Appropriation receipts to Special Accounts 44 23 ‑ 21
Subtotal Special Accounts 116 117 1 Departmental Outputs
Ordinary Annual Services (Appropriation Bill No. 1) 23,894 25,234 1,340 Subtotal Departmental Outputs 23,894 25,234 1,340
Subtotal for Output Group 2.5 414,295 415,225 930
Total for Outcome 2
Departmental 627,670 662,799 35,129
Table 4.3 Outcome resource statement for Outcome 2 continued

299
Appe
ndic
esPa
rt 4
Chapter 15 Appendices Part4 Appendices FaHCSIA Annual Report 2008–2009
Budget * 2008-09
$’000
ActualExpenses2008-09
$’000Variation
$’000Administered 46,490,033 46,499,258 9,225
Less: Appropriations credited to Special Accounts ‑ 2,722 2,722 Total 47,117,703 47,159,335 41,632
Average Staffing Level (number) 791
* Full‑year budget, including any subsequent adjustment made to the 2008‑09 Budget.
Table 4.4 Outcome resource statement for Outcome 3
Outcome 3: Families and children have choices and opportunities
Budget * 2008-09
$’000
ActualExpenses2008-09
$’000Variation
$’000 (a) (b) (b) ‑ (a)
Output Group 3.1:
Administered Expenses
Ordinary Annual Services (Appropriation Bill No. 1)
Child Protection Pilot ‑ WA 345 181 - 164 Economic Security Strategy ‑ public information campaign
2,394 1,842 ‑ 552
Family Relationships 94,115 93,504 ‑ 611
Parenting 78,566 78,596 30
Subtotal Bill 1 175,420 174,123 ‑ 1,297
Other Services (Appropriation Bill No. 2)
Northern Territory Emergency Response ‑ supporting families SPP
9,500 9,500 ‑
Services for Families LGA 167 ‑ ‑ 167
Services for Families with children SPP 387 ‑ ‑ 387
Subtotal Bill 2 10,054 9,500 - 554 Special Appropriations
A New Tax System (Family Assistance) (Administration) Act 1999
Baby Bonus 1,410,811 1,399,861 ‑ 10,950
Back to School Bonus 2,662,071 2,660,389 ‑ 1,682
Economic Security Strategy 3,945,523 3,943,028 ‑ 2,495
Family Tax Benefit A 12,575,746 12,704,252 128,506
Family Tax Benefit B 4,359,110 4,554,245 195,135
Maternity Immunisation Allowance 50,696 50,411 ‑ 285
Single Income Family Bonus 1,345,237 1,362,277 17,040
Social Security (Administration) Act 1999
Double Orphan Pension 3,226 3,225 ‑ 1
Subtotal Special Appropriations 26,352,420 26,677,688 325,268
Table 4.3 Outcome resource statement for Outcome 2 continued

300 FaHCSIA Annual Report 2008–2009 Part4 Appendices Chapter 15 Appendices
Budget * 2008-09
$’000
ActualExpenses2008-09
$’000Variation
$’000Special Accounts
Social Security ‑ Services for other Government and Non‑Government Bodies
Opening balance 223 223 ‑
Appropriation receipts ‑ ‑ ‑
Non‑Appropriation receipts to Special Accounts
‑ ‑ ‑
Subtotal Special Accounts 223 223 - Departmental Outputs
Ordinary Annual Services (Appropriation Bill No. 1) 517,932 546,964 29,032
Revenues from independent Sources (s31) 6,723 7,054 331
Subtotal Departmental Expenses 524,655 554,018 29,363 Subtotal for Output Group 3.1 27,062,772 27,415,552 352,780
Output Group 3.2:
Departmental Outputs
Ordinary Annual Services (Appropriation Bill No. 1) 12,285 12,973 688
Subtotal Departmental Expenses 12,285 12,973 688 Subtotal for Output Group 3.2 12,285 12,973 688
Total for Outcome 3
Departmental 536,940 566,991 30,051
Administered 26,538,117 26,861,534 323,417
Less: Appropriations credited to Special Accounts ‑ ‑ ‑ Total 27,075,057 27,428,525 353,468
Average Staffing Level (number) 500
* Full‑year budget, including any subsequent adjustment made to the 2008‑09 Budget.
Table 4.5 Outcome resource statement for Outcome 4Outcome 4: Strong and resilient communities
Budget * 2008-09
$’000
ActualExpenses2008-09
$’000Variation
$’000
(a) (b) (b) ‑ (a)
Output 4.1:
Administered Expenses
Ordinary Annual Services (Appropriation Bill No. 1)
Economic Security Strategy ‑ public information campaign 6,430 4,787 ‑ 1,643
Homelessness and Housing 55,254 55,236 ‑ 18
National Rental Affordability Scheme 11,654 1,757 ‑ 9,897
Subtotal Bill 1 73,338 61,780 - 11,558
Table 4.4 Outcome resource statement for Outcome 3 continued

301
Appe
ndic
esPa
rt 4
Chapter 15 Appendices Part4 Appendices FaHCSIA Annual Report 2008–2009
Budget * 2008-09
$’000
ActualExpenses2008-09
$’000Variation
$’000
Other Services (Appropriation Bill No. 2)
A Place to Call Home SPP 2,427 2,427 ‑
Commonwealth State Housing Agreement SPP 492,455 492,455 ‑
Social Housing Subsidy SPP 964 963 ‑ 1
Supported Accommodation Assistance Programme SPP 90,469 90,468 ‑ 1
Subtotal Bill 2 586,315 586,313 - 2
Special Accounts
SAAP Data and Program Evaluation Fund Special Account
Opening balance 2,859 2,859 ‑
Appropriation receipts 10 2,286 2,276 Non‑Appropriation receipts to Special Accounts 2,825 604 ‑ 2,221
Subtotal Special Accounts 5,694 5,749 55
Departmental Outputs
Ordinary Annual Services (Appropriation Bill No. 1) 85,295 90,076 4,781
Revenues from independent Sources (s31) 1,419 1,489 70
Subtotal Departmental Expenses 86,714 91,565 4,851 Subtotal for Output 4.1 752,061 745,407 - 6,654
Output 4.2:
Administered Expenses
Ordinary Annual Services (Appropriation Bill No. 1)
Financial Management 65,253 65,146 ‑ 107
Subtotal Bill 1 65,253 65,146 - 107
Departmental Outputs
Ordinary Annual Services (Appropriation Bill No. 1) 13,421 14,174 753
Subtotal Departmental Expenses 13,421 14,174 753 Subtotal for Output 4.2 78,674 79,320 646
Output 4.3:
Administered Expenses
Ordinary Annual Services (Appropriation Bill No. 1)
Ex‑Gratia Payments ‑ Funeral/Memorial Assistance Queensland Floods 2009 25 11 ‑ 14
Ex‑Gratia Payments ‑ Funeral/Memorial Assistance Victorian Fires 2009 781 879 98
Ex‑Gratia Payments ‑ Income Support North Western Queensland Floods 2009 541 ‑ 541
Ex‑Gratia Payments ‑ Income Support North Queensland Floods 2009 8,815 4,040 ‑ 4,775
Ex‑Gratia Payments ‑ Income Support Victorian Fires 2009 16,728 10,016 ‑ 6,712
Table 4.5 Outcome resource statement for Outcome 4 continued

302 FaHCSIA Annual Report 2008–2009 Part4 Appendices Chapter 15 Appendices
Budget * 2008-09
$’000
ActualExpenses2008-09
$’000Variation
$’000
Ex‑Gratia Payments ‑ Victims and Family Members of the Bali Terrorist Attacks 510 17 ‑ 493
Pandemic Influenza Preparedness 220 220 ‑
Subtotal Bill 1 27,620 15,183 - 12,437
Special Appropriations
Social Security (Administration) Act 1999 Australian Government Disaster Recovery Payment 137,838 130,793 ‑ 7,045
Subtotal Special Appropriations 137,838 130,793 - 7,045
Departmental Outputs
Ordinary Annual Services (Appropriation Bill No. 1) 5,408 5,711 303
Subtotal Departmental Expenses 5,408 5,711 303 Subtotal for Output 4.3 170,866 151,687 - 19,179
Output 4.4:
Administered Expenses
Ordinary Annual Services (Appropriation Bill No. 1)
Community Engagement 62,502 62,502 ‑
Payments under Special Circumstances 5 3 ‑ 2
Reconnecting People Assistance Package 485 414 ‑ 71
Subtotal Bill 1 62,992 62,919 - 73
Other Services (Appropriation Bill No. 2)
Innovation and Investment Fund SPP 5,422 5,423 1
Subtotal Bill 2 5,422 5,423 1
Departmental Outputs
Ordinary Annual Services (Appropriation Bill No. 1) 17,802 18,800 998
Subtotal Departmental Expenses 17,802 18,800 998 Subtotal for Output 4.4 86,216 87,142 926
Total for Outcome 4
Departmental 123,345 130,250 6,905
Administered 964,472 933,306 ‑ 31,166
Less: Appropriations credited to Special Accounts 10 2,286 2,276
Total 1,087,807 1,061,270 - 26,537
Average Staffing Level (number) 367
* Full‑year budget, including any subsequent adjustment made to the 2008‑09 Budget.
Table 4.5 Outcome resource statement for Outcome 4 continued

303
Appe
ndic
esPa
rt 4
Chapter 15 Appendices Part4 Appendices FaHCSIA Annual Report 2008–2009
Appendix 2: Staffing overviewThe following tables provide details of Australian Public Service (APS) employees (ongoing and non‑ongoing) employed under the Public Service Act 1999 in 2008–09. The tables include aggregated information on salary, performance pay and non‑salary benefits to which staff were entitled under the certified or collective agreements and individual industrial instruments of the Department of Families, Housing, Community Services and Indigenous Affairs (FaHCSIA).
The financial and staff resources summary tables that appear against each outcome and output group provide details of staffing years in terms of full‑time equivalent numbers. Due to the impact of part‑time employees and employees on leave without pay during the reporting period, the ‘staffing years’ numbers are lower than the staff numbers in the tables below.
FaHCSIA classification streams
Table 4.6 Staffing overview—explanation of different classification streams
Australian Public Service (APS) Classification FaHCSIA
Senior Executive Service (SES) SES
Executive Officer Level 2 Executive Level 2 (EL 2)
Executive Officer Level 1 Executive Level 1 (EL 1)
APS Level 6 APS Level 6
APS Level 5 APS Level 5
APS Level 4 APS Level 4
APS Level 3 APS Level 3
APS Level 2 APS Level 2
APS Level 1 APS Level 1
EL 2 (Top Salary Point) Senior Public Affairs Officer 2
EL 2 Senior Public Affairs Officer 1
EL 1 Public Affairs Officer 3
APS Level 6 Public Affairs Officer 2
APS Level 4 to APS Level 5 Public Affairs Officer 1
EL 2 (Top Salary Point) Special Counsel/Deputy Branch Manager
EL 2 Principal Legal Officer

304 FaHCSIA Annual Report 2008–2009 Part4 Appendices Chapter 15 Appendices
Table 4.6 Staffing overview—explanation of different classification streams continued
Australian Public Service (APS) Classification FaHCSIA
EL 1 Senior Legal Officer
APS Level 3 to APS Level 6 Legal Officer
Staffing overview
Table 4.7 Staffing overview—FaHCSIA by employment type at 30 June 2009
Total Staff by Gender—FaHCSIA
GenderOngoing Full-time
OngoingPart-time
Non-ongoing Full-time
Non-ongoingPart-time Casual Total
Female 1,741 327 111 21 1 2,201
Male 1,007 36 87 9 0 1,139
Total 2,748 363 198 30 1 3,340
Table 4.8 Staffing overview—staff by classification at 30 June 2009
Total FaHCSIA staff
Classification ACT Qld NSW Vic SA WA NT Tas Total
Cadets/Trainees 6 – – – – – – – 6
APS Level 1 6 – 2 – – – – – 8
APS Level 2 24 5 3 2 2 1 3 – 40
APS Level 3 115 11 3 1 1 4 6 5 146
APS Level 4 197 16 21 7 8 11 18 3 281
APS Level 5 276 20 19 5 12 23 35 4 394
APS Level 6 533 56 51 35 32 47 50 7 811
Legal Officer 13 – – – – – – – 13
Senior Legal Officer 26 – – – – – – – 26
Principal Legal Officer
19 – – – – – – – 19

305
Appe
ndic
esPa
rt 4
Chapter 15 Appendices Part4 Appendices FaHCSIA Annual Report 2008–2009
Table 4.8 Staffing overview—staff by classification at 30 June 2009 continued
Total FaHCSIA staff
Classification ACT Qld NSW Vic SA WA NT Tas Total
Public Affairs Officer Grade 1
7 – – – – – – – 7
Public Affairs Officer Grade 2
16 – 1 – – – – – 17
Public Affairs Officer Grade 3
9 – – – – – – – 9
Senior Public Affairs Officer Grade 1
1 – –– – – – – – 1
Senior Public Affairs Officer Grade 2
4 – – – – – – – 4
EL 1 and Equivalents 783 37 35 10 15 26 66 3 975
EL 2 and Equivalents 351 17 17 4 6 9 54 1 459
Land Commissioner 1 – – – – – – – 1
SES Band 1 70 2 2 1 3 3 7 1 89
SES Band 2 23 1 – – – 1 2 – 27
SES Band 3 6 – – – – – – – 6
Secretary 1 – – – – – – – 1
Total staff 2,487 165 154 65 79 125 241 24 3,340

306 FaHCSIA Annual Report 2008–2009 Part4 Appendices Chapter 15 Appendices
Table 4.9 FaHCSIA salary ranges by classification at 30 June 2009
Classification Pay point—lowest ($) Pay point—highest ($)
SES Band 3 219,000 240,000
SES Band 2 170,000 205,325
SES Band 1 127,000 168,200
FaHCSIA EL 2 90,000 150,000
FaHCSIA EL 1 74,953 112,891
FaHCSIA APS Level 6 62,000 89,659
FaHCSIA APS Level 5 58,947 62,343
FaHCSIA APS Level 4 53,191 60,044
FaHCSIA APS Level 3 47,117 51,165
FaHCSIA APS Level 2 41,472 45,375
FaHCSIA APS Level 1 (adult) 22,545 39,524
Graduate APS 47,117 51,165
Performance pay
Table 4.10 Staffing overview—Performance payments during 2008–09
FaHCSIA
Classification NumberAggregated amount ($) Average ($) Minimum ($) Maximum ($)
SES 3andSES 2*
24 313,355 13,056 5,000 25,000
SES 1 34 355,504 10,456 5,000 30,000
FaHCSIA EL 2 96 759,062 7,907 2,000 19,500
FaHCSIA EL 1 94 570,262 6,067 1,200 16,500
FaHCSIA APS Levels 1–6
53 223,809 4,222 750 8,596
Total 301 2,221,992 7,382 750 30,000
* Figures have been aggregated to protect employee privacy.

307
Appe
ndic
esPa
rt 4
Chapter 15 Appendices Part4 Appendices FaHCSIA Annual Report 2008–2009
Non-salary benefits—FaHCSIA
Table 4.11 Staffing overview—non-salary benefits at 30 June 2009
Non-SES staff—Collective Agreement
Access to employee assistance program
Mobile phone for official and incidental personal use
Airline club lounge membership
Child and elder care information and referral service
Family care rooms, extra family care costs, school holiday family care subsidy
Study assistance
Time off for long business travel
Business class travel for long‑haul flights
Flexible remuneration packaging
Assistance with public transport and parking costs
Influenza vaccination
Promoting good health payment
Voluntary cash out of annual leave
Payment of professional association memberships
Non-SES staff—Australian Workplace Agreements and other individual industrial instruments
All of the above benefits
Home office equipment
Support for professional and personal development
SES staff—Australian Workplace Agreements and other individual industrial agreements
All the above benefits
Executive vehicle allowance
Additional recreation leave
Non-salary benefits—Certified Agreement
Access to child care information and referral and school holiday subsidies
Flextime
Leave purchase provisions
Carers, parental and adoption leave
Studies assistance scheme
Influenza vaccinations
Healthy lifestyle program

308 FaHCSIA Annual Report 2008–2009 Part4 Appendices Chapter 15 Appendices
Appendix 3: Commonwealth Disability Strategy performance reportIn this appendix, FaHCSIA reports on its performance under the Commonwealth Disability Strategy. The strategy was introduced to assist Australian Government agencies meet their obligations under the Disability Discrimination Act 1992. Under the strategy, Commonwealth Government agencies are obliged to remove barriers which prevent people with disability from having access to policies, programs and services.
FaHCSIA’s performance is reported in two categories reflecting the Department’s role as a Policy Adviser and Purchaser.
The Department does not have the role of Regulator or Provider under this strategy. From 1 July 2007, reporting requirements under the Employer Role were transferred from the Commonwealth Disability Strategy to the Australian Public Service Commission’s State of the Service agency survey.
Disability Action PlanA revised version of FaHCSIA’s Disability Action Plan is currently being finalised. The plan will provide strong support for significant initiatives, including the strategic recruitment and retention policy for staff with disability.
The Department’s core business policy of advising and program management includes improving outcomes for people with disability. FaHCSIA continues to improve access to its policies, programs and facilities for people with disability.

309
Appe
ndic
esPa
rt 4
Chapter 15 Appendices Part4 Appendices FaHCSIA Annual Report 2008–2009
Table 4.12 FaHCSIA—Performance report against the Commonwealth Disability Strategy reporting framework: Policy Adviser Role
Performance Requirements of the Policy Adviser Role
Performance indicator Current level of performance
New or revised policies/programs impact on the lives of people with disability prior to decision.
Where possible, the impact of new policy and program proposals on people with disability is completed prior to implementation.
Examples of performance:
The work conducted by the Women’s Safety Section, Safety Taskforce Branch, focuses on reducing violence against women, including domestic and family violence and sexual assault.
Considerable consultation is undertaken with women, including women with disability, as well as other women with special needs, prior to making decisions about developing or revising policy and/or programs.
The primary piece of new policy development undertaken by the Safety Taskforce in 2008–09 was the development of a National Plan to Reduce Violence Against Women.
Extensive consultation of over 2,000 Australians, including women with disability, advised the National Council’s recommendations in their plan Time for Action.
The Disability Policy and Coordination Branch conducted nationwide consultations on the development of the National Disability Strategy. Analysis of the feedback from the consultation process takes into account the impact on people with disability prior to the development of the strategy, which is due to be released in mid‑2010.
The Office of Housing’s National Affordable Housing Agreement and National Partnership Agreement on Social Housing gives consideration to the over‑representation of people with disability in low and moderate income groups, including people who are homeless or at risk of homelessness.

310 FaHCSIA Annual Report 2008–2009 Part4 Appendices Chapter 15 Appendices
Table 4.12 FaHCSIA—Performance report against the Commonwealth Disability Strategy reporting framework: Policy Adviser Role continued
Performance Requirements of the Policy Adviser Role continued
Performance indicator Current level of performance
People with disability are included in consultations about new or revised policy/program proposals.
People with disability and peak disability groups are consulted as part of the Department’s holistic consultation process when policies are implemented or revised.
The role of the council is to provide expert advice to Government on the development and implementation of the National Disability Strategy.
Examples of performance:
The National People with Disabilities and Carer Council was established in September 2008. The council is made up of 28 members and includes people with disability and their families, carers, industry and union representatives and academics. The role of the council is to provide expert advice to the Government on the development and implementation of the National Disability Strategy.
The Women’s Safety Section, Safety Taskforce Branch, engaged intensively with the peak body, Women with Disabilities Australia (WWDA), during the development of the National Plan to Reduce Violence Against Women.
WWDA was also a critical reader in drafting of the plan, with approximately 13% representation on this group.
The Pension Review Taskforce conducted public meetings in each capital city and three regional centres. People with disability attended each of these meetings.
Focus groups were held to further explore issues raised in the public meetings. People with disability participated in these groups.
Public announcements of new, revised or proposed policy/program initiatives are available in accessible formats for people with disability in a timely manner.
The Department has a standard for provision of documents in accessible formats.
Example of performance:
The Disability Policy and Coordination Branch produced a discussion paper on the development of the National Disability Strategy that was released in multiple versions. These included hardcopy—standard and easy english, web—standard and easy english in pdf and html, CD—audio, standard and easy English in pdf and html. Braille versions and 10 community language translations were available on request.

311
Appe
ndic
esPa
rt 4
Chapter 15 Appendices Part4 Appendices FaHCSIA Annual Report 2008–2009
Table 4.13 FaHCSIA—Performance report against the Commonwealth Disability Strategy reporting framework: Purchaser Role
Performance Requirements of the Purchaser Role
Performance indicator Current level of performance
Publicly available information on agreed purchasing specifications is available in accessible formats for people with disability.
All documents are available in accessible formats.
Processes for purchasing goods or services with a direct impact on the lives of people with disability are developed in consultation with people with disability.
The Department’s procurement policy necessitates consultation with all stakeholders and the concerns and interests of people with disability are included as part of this process.
Purchasing specifications and contract requirements for the purchase of goods and services are consistent with the requirements of the Disability Discrimination Act 1992.
The Department’s standard contract form requires all contractors to comply with provisions of the Disability Discrimination Act 1992.
Publicly available performance reporting against the purchase contract specifications requested in accessible formats for people with disability is provided.
All performance reporting is available in accessible formats for people with disability.
Complaints/grievance mechanisms, including access to external mechanisms, in place to address concerns raised about provider’s performance.
Complaints and grievances are managed under the FaHCSIA service charter. External complaints mechanisms are available. All providers operating under a funded service agreement are required to have a complaints and grievance mechanism and access to an external appeal mechanism.

312 FaHCSIA Annual Report 2008–2009 Part4 Appendices Chapter 15 Appendices
Appendix 4: Advertising and market researchTable 4.14 FaHCSIA—expenditure on advertising agencies, 2008–09
Name of organisation Service providedTotal cost ($) GST inclusive
Universal McCann Economic Security Strategy First Home Owners Boost Campaign
8,261,536
Red Agency International Day of People with Disability (IDPwD) National Disability Awards
45,000
Digital Dogma Develop and produce Community Service Announcements for IDPwD and the 2009 National Disability Awards
80,380
Goolarri Media Pty Ltd Production and distribution of 2 x 30 second television and radio messages promoting the benefits of money management services and income management in Kimberley region
61,424
Table 4.15 FaHCSIA—expenditure on direct mail organisations, 2008–09
Name of organisation Service provided Total cost ($)
National Mailing and Marketing
Distribution of publications and products 119,254
Table 4.16 FaHCSIA—expenditure on media advertising agencies, 2008–09
Name of organisation Service providedTotal cost ($) GST inclusive
HMA Blaze New Mother Bag—Keys to Living Together 108,790
HMA Blaze Promoting consultations for developing new Indigenous representative body
52,200
HMA Blaze Applications for the Personal Helpers and Mentors Program 206,965
HMA Blaze Calls for NTER reviews 44,968
HMA Blaze Advertising National Rental Affordability Scheme 82,506
HMA Blaze Helping Children with Autism package early intervention funding for children with an Autism Spectrum Disorder
125, 113

313
Appe
ndic
esPa
rt 4
Chapter 15 Appendices Part4 Appendices FaHCSIA Annual Report 2008–2009
Table 4.16 FaHCSIA—expenditure on media advertising agencies, 2008–09 continued
Name of organisation Service providedTotal cost ($) GST inclusive
HMA Blaze Helping Children with Autism package The National Workshops Program
125,114
HMA Blaze Helping Children with Autism package information about the panel of multidisciplinary service providers to aid early intervention
164,137
HMA Blaze Extension of time for public submissions to National Council to Reduce Violence Against Women and Children—31 July 2008
37,441
HMA Blaze Advertising National Rental Affordability Scheme 82,506
HMA Blaze Notice of intention to advertise for service providers to deliver Autism Specific Child Care Centres
28,142
HMA Blaze National Indigenous Representative Body Consultation Workshops
52,183
HMA Blaze Advertising National Rental Affordability Scheme 81,946
HMA Blaze NTER—Ad production and 20 spots a day Radio Northern Territory Radio only. One ad in English; 8 ads in Indigenous languages
27,880
HMA Blaze Inviting written submissions for developing a new national Indigenous representative body
27,117
HMA Blaze Advertising for Pension Review public consultations 50,775
HMA Blaze Social Security Agreement—Korea 38,000
HMA Blaze Social Security Agreement—Greece 37,007
HMA Blaze Applications open for the establishment and operation of six Autism Specific Early Learning and Care Centres throughout Australia
18,884
HMA Blaze Advertising for Broadband for Seniors 25,595
HMA Blaze Invitation for non‑profit community organisations to apply for funding under the Volunteer Grants Program 2008
53,578
HMA Blaze Call for Expressions of Interest for round one of Housing Affordability Fund
56,552
HMA Blaze Invitation for non‑profit community organisations to apply for funding under the Volunteer Grants Program 2008
84,909
HMA Blaze National Disability Strategy Discussion Paper feedback consultation process
48,463

314 FaHCSIA Annual Report 2008–2009 Part4 Appendices Chapter 15 Appendices
Table 4.16 FaHCSIA—expenditure on media advertising agencies, 2008–09 continued
Name of organisation Service providedTotal cost ($) GST inclusive
HMA Blaze IDPwD advertisement 28,166
HMA Blaze Invitation to apply for funding for Commonwealth Financial Counselling Services and Financial Management Resource Support Units
26,869
HMA Blaze Nominations for national NAIDOC Committee Membership Radio Advertising
14,868
HMA Blaze Australia Japan Social Security Agreement 35,144
HMA Blaze Request for tender—Organisation to operate the Complaints Resolution and Referral Service and the National Disability Abuse and Neglect Hotline
39,647
HMA Blaze National Rental Affordability Scheme Round Two 80,902
HMA Blaze Advertising of a funding round to support community projects. The funding round will seek service providers in regional and urban areas (not remote areas) that are engaged in Indigenous communities, to provide linking and referral services, as well as community meeting places
41,338
HMA Blaze CDEP Reform eSub Funding Round 72,116
HMA Blaze Extension of Indigenous program funding for Victorian organisations due to Victorian bushfires
11,764
HMA Blaze Remote advertising for CDEP providers for the CDEP Reform
25,929
HMA Blaze Remote advertising for CDEP providers for the CDEP Reform
17,524
HMA Blaze CDEP Radio—NT & National 59,708
HMA Blaze Disability Conference Funding 2009–2010 31,008
HMA Blaze National Disability Advocacy Program funding 16,885
HMA Blaze IDPwD Awards ads 22,413
HMA Blaze Grants for National Women’s Non‑Government Organisations
26,484
HMA Blaze Community Support Service—for Indigenous people and their families
50,145
HMA Blaze National Disability Awards extended timeframe 20,000
HMA Blaze Protecting Australia’s Children; Funding Assistance 51,248

315
Appe
ndic
esPa
rt 4
Chapter 15 Appendices Part4 Appendices FaHCSIA Annual Report 2008–2009
Table 4.16 FaHCSIA—expenditure on media advertising agencies, 2008–09 continued
Name of organisation Service providedTotal cost ($) GST inclusive
HMA Blaze Leadership programs and opportunities for Aboriginal and Torres Strait Islander peoples
20,295
HMA Blaze Indigenous Leadership Programs 18,368
HMA Blaze Placement of IDPwD advertisement in October 2008 27,897
HMA Blaze National Disability Parking Scheme—have your say 17,045
HMA Blaze International agreements—Finland 23,728
HMA Blaze Recruitment advertising 443,153
Adcorp Recruitment advertising 15,339
Publications 2010 Graduate recruitment advertising 31,681
SEEK Graduate recruitment advertising 33,006
HMA Blaze Advertising for Footprints In Time 16,420
Table 4.17 FaHCSIA—expenditure on market research, 2008–09
Name of organisation Service providedTotal cost ($) GST inclusive
Taylor Nelson Sofres Australia Pty Ltd
Research for the Keys to Living Together DVD targeted to men
66,000
Orima Research Pty Ltd Research for Economic Security Strategy First Home Owners Boost Communication Campaign
763,634
Orima Research Pty Ltd FaHCSIA Staff Survey 430,206
Taylor Nelson Sofres Australia Pty Ltd
Concept testing for development of two new Keys to Living Together DVDs
22,000
Colmar Brunton Pty Ltd Financial Management Information Research 249,785
CIRCA—Cultural & Indigenous Research Centre Australia
Market testing of Closing the Gap design concepts 64,730
Blue Moon Research Social marketing campaign—preventing violence against women and children
475,200
The Ipsos‑Eureka Social Research Institute
Developmental market research to explore the communication needs of pensioners who may be affected by the changes announced in the 2009–2010 budget
149,204

316 FaHCSIA Annual Report 2008–2009 Part4 Appendices Chapter 15 Appendices
Table 4.17 FaHCSIA—expenditure on market research, 2008–09 continued
Name of organisation Service providedTotal cost ($) GST inclusive
CIRCA—Cultural & Indigenous Research Centre Australia
Youth Diversion Consultancy 75,000
CIRCA—Cultural & Indigenous Research Centre Australia
Evaluation of Family Income Management and business services under the Financial Management Program in Qld, NT and WA
66,000
Colmar Brunton Pty Ltd*
Market research to identify how Emergency Relief and Commonwealth Financial Counselling providers can help in the early identification of problem gamblers and refer to gambling support services
58,543
Allen Consulting Pty Ltd*
Impact of the global financial crisis on corporate community investment
49,200
Allen Consulting Pty Ltd*
Impact of the global financial crisis on non‑profit organisations’ management operations
52,951
Open Mind Research Group
Market testing seniors publications 102,482
Planning and Change Consulting—Centrelink
Pension Review research to explore pension customer views and opinions about the appropriateness and structure of income support payments, concessions and allowances
47,285
Planning and Change Consulting—Centrelink
Pension Review research to explore pension customer views on supplementary payments
11,042
Urbis JHD* Conduct research for the development of a model for the national online and 1800 counselling service
33,698
Orima Research Pty Ltd Homelessness White Paper 25,000
* These consultants are also listed in Appendix 5—Consultancy and contract details.

317
Appe
ndic
esPa
rt 4
Chapter 15 Appendices Part4 Appendices FaHCSIA Annual Report 2008–2009
Appendix 5: Consultancy contract detailsFaHCSIA’s responsibility for both policy matters and the delivery of government services often requires the use of consultant expertise. Consultants are generally engaged when particular specialist expertise is necessary, sufficiently skilled expertise is not immediately available in‑house, or independent advice on an issue is required.
The services provided by consultants include information gathering, research, data analysis, customer surveys, different types of financial activities and the provision of technical expertise.
The engagement of consultants is carried out in the same manner as the Department’s other procurement activities and is consistent with the Commonwealth Procurement Guidelines and the Department’s Chief Executive’s Instructions. The priority is to obtain value for money. Competitive processes are, as far as possible, used for the selection of consultants, and the Chief Executive’s Instructions contain guidelines for the approval of expenditure.
Unless specifically exempt from reporting requirements, the Department must list, on AusTender, all new contracts valued at $10,000 or over. The Department did not have any contracts exempt from this requirement during 2008–09.
Information on Australian Government consultancies and contracts can be found on the AusTender website: www.tenders.gov.au.
Categories of purposeBased on the categories reported on AusTender, the main purposes (by value) for which new consultancies were let in 2008–09 were:
Business administration services (approximately 15 per cent) ◗
Community and social services (approximately 1 per cent) ◗
Education and training services (approximately 0.5 per cent) ◗
Management advisory services (approximately 31 per cent) ◗
Management and business professionals and administrative services ◗
(approximately 51 per cent)
Other (approximately 1.5 per cent) ◗

318 FaHCSIA Annual Report 2008–2009 Part4 Appendices Chapter 15 Appendices
New consultancies of $10,000 or moreTable 4.18 below sets out details of new consultancies let to the value of $10,000 or more during 2008–09.
Table 4.18 FaHCSIA (including SSAT) consultancy services let during 2008–09 of $10,000 or more
Consultant name DescriptionSelection process
Contract price ($)
Justification (1)
99 Consulting Preparation of a draft National Compact between the not‑for‑profit sector and the Australian Government
Direct 13,200.00 D
A.C.E. National Network
Industry Partnerships Project Select 22,000.00 D
Access Economics Pty Ltd
Scoping the feasibility of conducting a major study on the economic value of positive family functioning
Direct 79,233.00 D
Access Economics Pty Ltd
Women in Community Leadership research services
Open 46,431.00 C
ACP Solutions Pty Ltd
General consulting and on‑site visit Direct 13,200.00 A
Acumen Alliance ACT Pty Ltd
Internal Audit Services 2008–09 Open 18,400.00 A
Acumen Alliance ACT Pty Ltd
Internal Audit Services 2008–09—grants management
Open 44,255.00 A
Acumen Alliance ACT Pty Ltd
Community Development Employment Program audit
Open 44,255.00 A
Acumen Alliance ACT Pty Ltd
National Rental Affordability Scheme probity advice
Open 29,900.00 C
Acumen Alliance ACT Pty Ltd
Probity advice for the Request for Tender for an Australia‑wide register of consultants for the Office of the Registrar of Indigenous Corporations
Open 14,850.00 D
Acumen Alliance ACT Pty Ltd
Probity advice for the Request for Tender for an Australia‑wide register of consultants for the Office of the Registrar of Indigenous Corporations
Open 16,500.00 C

319
Appe
ndic
esPa
rt 4
Chapter 15 Appendices Part4 Appendices FaHCSIA Annual Report 2008–2009
Table 4.18 FaHCSIA (including SSAT) consultancy services let during 2008–09 of $10,000 or more continued
Consultant name DescriptionSelection process
Contract price ($)
Justification (1)
AJ Dever Pty Ltd Engagement of counsel for Administrative Appeals Tribunal Freedom of Information case
Open 13,304.00 D
Allen Consulting Group Pty Ltd*
Research project on the Impact of the global financial crisis on corporate‑community investment
Open 49,500.00 D
Allen Consulting Group Pty Ltd*
Research project on the impact of the global finance crisis on non‑profit management operations
Open 53,350.00 D
Allen Consulting Group Pty Ltd
Desktop study on interactive gambling in Australia
Open 88,230.00 D
Anne Markiewicz & Associates Pty Ltd
Review of the Social Policy Research Services Program (2005–2009)
Open 50,700.00 C
APP Corporation Pty Limited
Nation Building – Economic Stimulus Plan—Social Housing Initiative—Housing Advisor
Select 72,000.00 D
ARTD Management and Research Pty Ltd
Evaluation of Helping Children with Autism package
Open 715,000.00 C
ARTD Management and Research Pty Ltd
Developing and testing a methodology for collecting client outcomes data to support the revised Family Relationship Services Program performance framework
Open 49,600.00 A
ARTD Management and Research Pty Ltd
Provision of assistance to agencies represented on the Cross Agency Working Group on Indigenous Funding and Governance Reform (CAWG) to implement the next phase of the CAWG project performance indicator framework
Open 81,250.00 A
ARTD Management and Research Pty Ltd
Update and consolidate FaHCSIA’s Disability Maintenance Instrument Guidelines
Open 33,375.00 D
ARTD Management and Research Pty Ltd
FaHCSIA Program Frameworks and Accountability Reform
Open 119,360.00 A
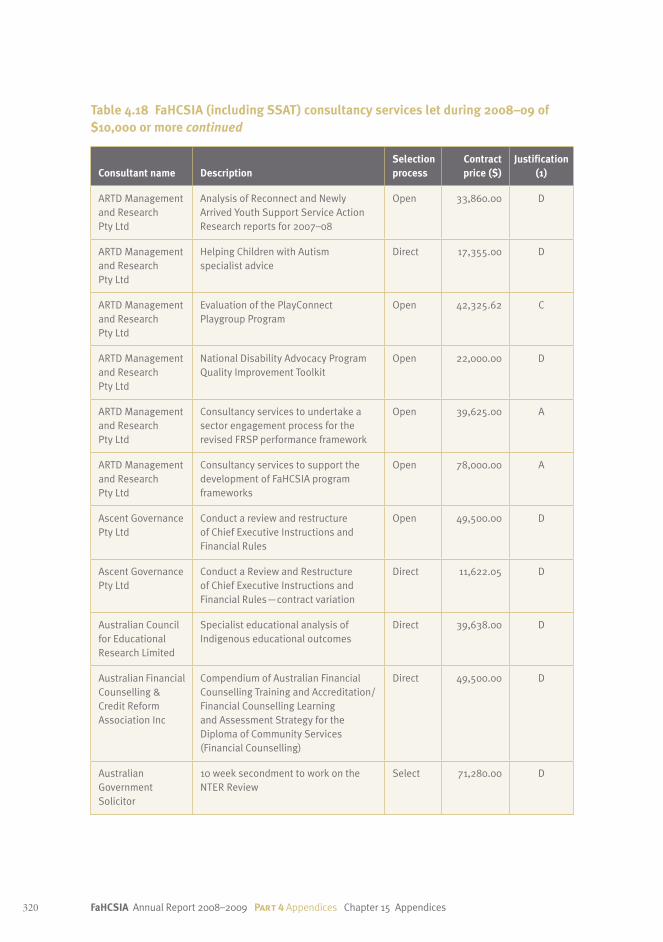
320 FaHCSIA Annual Report 2008–2009 Part4 Appendices Chapter 15 Appendices
Table 4.18 FaHCSIA (including SSAT) consultancy services let during 2008–09 of $10,000 or more continued
Consultant name DescriptionSelection process
Contract price ($)
Justification (1)
ARTD Management and Research Pty Ltd
Analysis of Reconnect and Newly Arrived Youth Support Service Action Research reports for 2007–08
Open 33,860.00 D
ARTD Management and Research Pty Ltd
Helping Children with Autism specialist advice
Direct 17,355.00 D
ARTD Management and Research Pty Ltd
Evaluation of the PlayConnect Playgroup Program
Open 42,325.62 C
ARTD Management and Research Pty Ltd
National Disability Advocacy Program Quality Improvement Toolkit
Open 22,000.00 D
ARTD Management and Research Pty Ltd
Consultancy services to undertake a sector engagement process for the revised FRSP performance framework
Open 39,625.00 A
ARTD Management and Research Pty Ltd
Consultancy services to support the development of FaHCSIA program frameworks
Open 78,000.00 A
Ascent Governance Pty Ltd
Conduct a review and restructure of Chief Executive Instructions and Financial Rules
Open 49,500.00 D
Ascent Governance Pty Ltd
Conduct a Review and Restructure of Chief Executive Instructions and Financial Rules—contract variation
Direct 11,622.05 D
Australian Council for Educational Research Limited
Specialist educational analysis of Indigenous educational outcomes
Direct 39,638.00 D
Australian Financial Counselling & Credit Reform Association Inc
Compendium of Australian Financial Counselling Training and Accreditation/Financial Counselling Learning and Assessment Strategy for the Diploma of Community Services (Financial Counselling)
Direct 49,500.00 D
Australian Government Solicitor
10 week secondment to work on the NTER Review
Select 71,280.00 D

321
Appe
ndic
esPa
rt 4
Chapter 15 Appendices Part4 Appendices FaHCSIA Annual Report 2008–2009
Table 4.18 FaHCSIA (including SSAT) consultancy services let during 2008–09 of $10,000 or more continued
Consultant name DescriptionSelection process
Contract price ($)
Justification (1)
Australian Institute of Family
Development of a survey of adolescents whose parents are participants in the longitudinal study of separated parents
Open 77,000 A, D
Australian National University
Baseline Community Profile for Groote and Bickerton Islands—supplementary demographic component
Open 11,000.00 D
Australian National University
Social policy research Direct 187,000.00 D
Australian National University
Analysis of data extracts of the Child Disability Assessment Tool sampling to identify specific biases or influences
Open 33,000.00 D
Australian National University
Conduct a literature review on measuring social norms and develop a survey instrument
Select 37,539.65 D
Australian National University
Conduct a research project investigating the policy implications of Indigenous mobility
Open 110,500.00 D
Australian National University
Contribute to the design and implementation of a comprehensive evaluation of the Cape York Welfare Reform Trials
Open 35,200.00 D
Australian National University
Consultancy services related to the 2009 Aboriginal Policy Research Conference
Select 12,200.00 D
Australian National University
Provision of research services Open 576,070.00 D
Australian National University
Provision of research services Open 328,453.00 D
Australian National University
Projection of Households for Australia 2006–2016
Open 77,000.00 A
Australian National University
Provision of demographic analysis on the 73 NTER communities and prescribed areas for the NTER Review Board
Direct 60,000.00 D

322 FaHCSIA Annual Report 2008–2009 Part4 Appendices Chapter 15 Appendices
Table 4.18 FaHCSIA (including SSAT) consultancy services let during 2008–09 of $10,000 or more continued
Consultant name DescriptionSelection process
Contract price ($)
Justification (1)
Australian National University
Identifying the Social and Community Impacts of Disasters for Indigenous and Culturally and Linguistically Diverse Populations
Open 82,500.00 D
Australian Catholic University
Project to assist in the development of collaboration models between the Commonwealth‑funded FRSP providers and relevant state services
Open 78,413.77 C
Australian Catholic University
Research into children’s experience of separation and child support
Open 54,931.80 D
Australian Catholic University
Clearing House Evaluation Stage II Open 88,000.00 C
Australian Catholic University
Families’ Experiences of Support Services
Open 165,000.00 D
Australian Council of Social Services
Consultation with the not‑for‑profit sector about a National Compact
Direct 11,000.00 A
Australian Council of Social Services
Initial consultations on the development of a National Compact between the Not‑for‑Profit Sector and the Commonwealth Government
Direct 87,670.00 A
Australian Government Actuary
Conduct a review of the costings and policy issues of the Report on the National Disability Insurance Scheme
Select 21,350.00 D
Australian Government Solicitor
Legal Advice—Registrar’s coercive powers
Open 13,200.00 D
Australian Health & Safety Services
Roof fall arrest system investigation and report
Direct 10,312.50 D
Australian Institute of Aboriginal and Torres Strait Islander Studies
Research into the impact of inconsistent legislation relating to petrol sniffing across states and territories
Open 57,925.00 C
Australian Institute of Family Studies
Report on child safety and well being within an Aboriginal context
Direct 20,680.00 D

323
Appe
ndic
esPa
rt 4
Chapter 15 Appendices Part4 Appendices FaHCSIA Annual Report 2008–2009
Table 4.18 FaHCSIA (including SSAT) consultancy services let during 2008–09 of $10,000 or more continued
Consultant name DescriptionSelection process
Contract price ($)
Justification (1)
Australian Institute of Health & Welfare
Data analysis and report on the characteristics of clients presenting to the SAAP for assistance with problem gambling/financial assistance
Open 54,879.00 D
Australian Institute of Health & Welfare
Evaluation of the Child Protection Scheme of Income Management and Voluntary Income Management programs in Western Australia
Open 66,042.00 C
Australian Institute of Health & Welfare
Development of a framework and methodology for the evaluation of Income Management in NT and the conduct of in‑depth client interviews/surveys
Open 73,552.00 C
Australian Institute of Health & Welfare
Younger people with disability in residential aged care program data collection
Select 111,904.10 A
Australian Institute of Health & Welfare
Clearing House Management Open 2,211,000.00 C
Australian Rural Accounting
Regional Transitional Workshop with Indigenous corporations in Townsville, Queensland
Open 11,395.00 D
Avanade Australia Pty Ltd
Sharepoint development for COAG Remote Service Delivery reporting initiatives
Open 23,100.00 D
Beames & Associates Pty Ltd
Review of FaHCSIA’s Electronic Travel Management System
Direct 14,333.00 A
Beethoven Computer Services Pty Ltd
Resolve hourly consulting services Select 17,325.00 D
Bill Gray Membership of the NTER Review Board Direct 89,950.00 C
Bill Gray Membership of the NTER Review Board Direct 110,250.00 C
Blackink Writing and Consultancy
Analysis of the public submissions to the Green Paper
Select 12,360.00 A
Bob Searle Consultancy to provide overview of inter‑government fiscal arrangements for Indigenous service programs
Direct 37,400.00 C
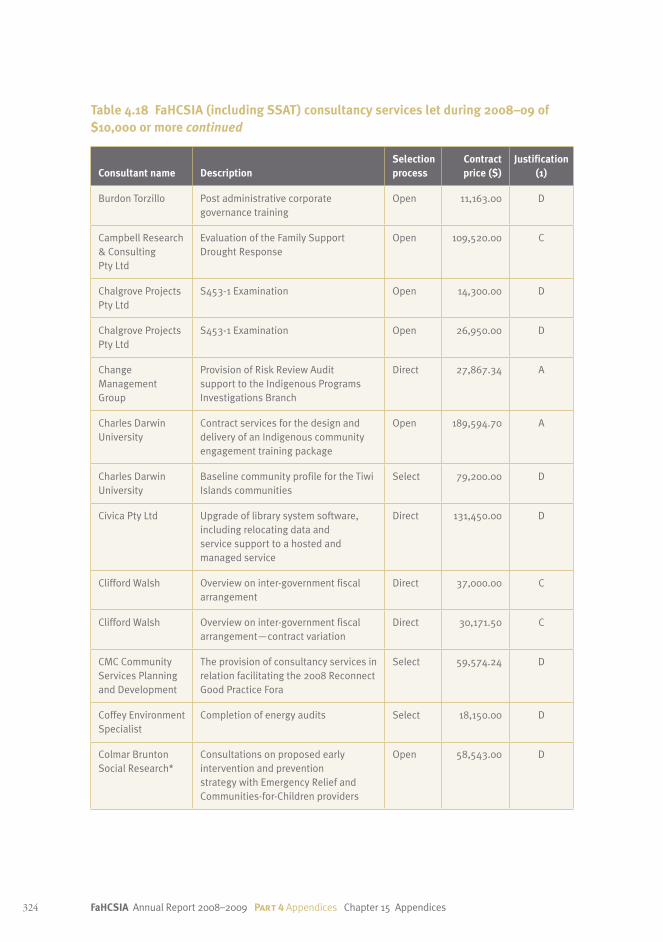
324 FaHCSIA Annual Report 2008–2009 Part4 Appendices Chapter 15 Appendices
Table 4.18 FaHCSIA (including SSAT) consultancy services let during 2008–09 of $10,000 or more continued
Consultant name DescriptionSelection process
Contract price ($)
Justification (1)
Burdon Torzillo Post administrative corporate governance training
Open 11,163.00 D
Campbell Research & Consulting Pty Ltd
Evaluation of the Family Support Drought Response
Open 109,520.00 C
Chalgrove Projects Pty Ltd
S453‑1 Examination Open 14,300.00 D
Chalgrove Projects Pty Ltd
S453‑1 Examination Open 26,950.00 D
Change Management Group
Provision of Risk Review Audit support to the Indigenous Programs Investigations Branch
Direct 27,867.34 A
Charles Darwin University
Contract services for the design and delivery of an Indigenous community engagement training package
Open 189,594.70 A
Charles Darwin University
Baseline community profile for the Tiwi Islands communities
Select 79,200.00 D
Civica Pty Ltd Upgrade of library system software, including relocating data and service support to a hosted and managed service
Direct 131,450.00 D
Clifford Walsh Overview on inter‑government fiscal arrangement
Direct 37,000.00 C
Clifford Walsh Overview on inter‑government fiscal arrangement—contract variation
Direct 30,171.50 C
CMC Community Services Planning and Development
The provision of consultancy services in relation facilitating the 2008 Reconnect Good Practice Fora
Select 59,574.24 D
Coffey Environment Specialist
Completion of energy audits Select 18,150.00 D
Colmar Brunton Social Research*
Consultations on proposed early intervention and prevention strategy with Emergency Relief and Communities‑for‑Children providers
Open 58,543.00 D

325
Appe
ndic
esPa
rt 4
Chapter 15 Appendices Part4 Appendices FaHCSIA Annual Report 2008–2009
Table 4.18 FaHCSIA (including SSAT) consultancy services let during 2008–09 of $10,000 or more continued
Consultant name DescriptionSelection process
Contract price ($)
Justification (1)
Colmar Brunton Social Research
Analyse submissions from the Pension Review and write a report against the terms of reference
Open 321,068.00 C
Colmar Brunton Social Research
Income Management communications research
Open 25,764.75 C
Colmar Brunton Social Research
Analysis of public submissions regarding violence against women and children
Open 66,000.00 C
Colmar Brunton Social Research
Attitudinal research for Australia’s Future Tax System
Open 165,912.00 D
Colmar Brunton Social Research
Facilitate public consultations to inform the Pension Review component of the Inquiry into Australia’s Future Tax System
Open 79,218.00 C
Courage Partners Pty Ltd
Community Mental Health Program evaluation
Open 357,120.00 D
Courage Partners Pty Ltd
Conduct an independent evaluation of Family Relationship Services Australia on behalf of the Family Relationship Services Program
Open 77,000.00 C
Courage Partners Pty Ltd
Professional advice to develop and design a Petrol Sniffing Strategy evaluation framework
Open 17,600.00 C
Create Foundation Consultation with young people for a National Child Protection Framework
Select 16,159.00 D
Cultural & Indigenous Research Centre Australia
Assist in the evaluation of Income Management by undertaking face to face interviews with income managed clients in the Northern Territory
Open 39,820.00 C
Cultural & Indigenous Research Centre Australia
Assist in the evaluation of Income Management by undertaking face to face interviews with clients participating in the Child Protection Scheme of Income Management and Voluntary Income Management in Western Australia
Open 30,910.00 C
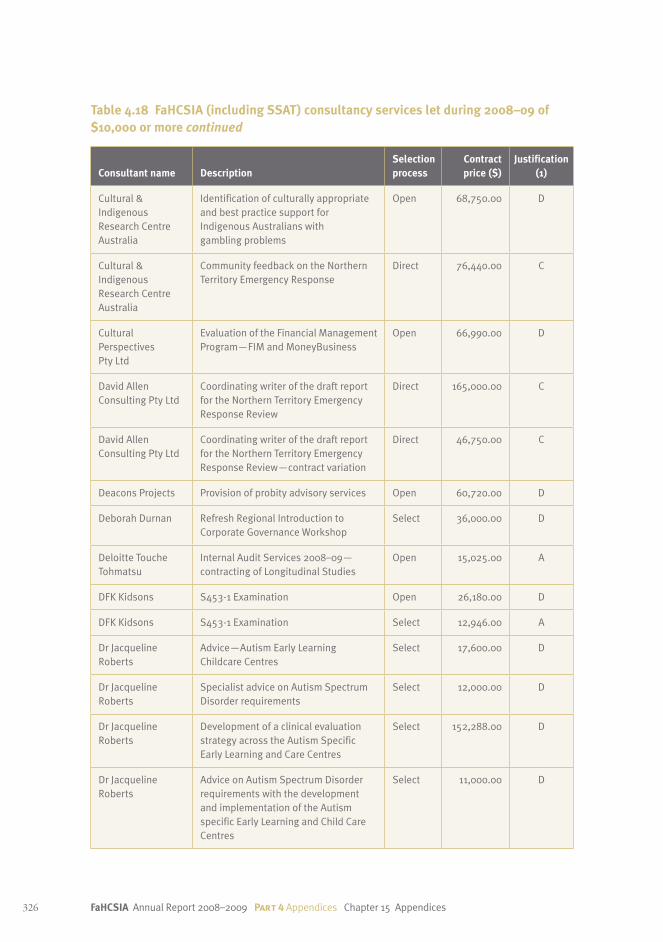
326 FaHCSIA Annual Report 2008–2009 Part4 Appendices Chapter 15 Appendices
Table 4.18 FaHCSIA (including SSAT) consultancy services let during 2008–09 of $10,000 or more continued
Consultant name DescriptionSelection process
Contract price ($)
Justification (1)
Cultural & Indigenous Research Centre Australia
Identification of culturally appropriate and best practice support for Indigenous Australians with gambling problems
Open 68,750.00 D
Cultural & Indigenous Research Centre Australia
Community feedback on the Northern Territory Emergency Response
Direct 76,440.00 C
Cultural Perspectives Pty Ltd
Evaluation of the Financial Management Program—FIM and MoneyBusiness
Open 66,990.00 D
David Allen Consulting Pty Ltd
Coordinating writer of the draft report for the Northern Territory Emergency Response Review
Direct 165,000.00 C
David Allen Consulting Pty Ltd
Coordinating writer of the draft report for the Northern Territory Emergency Response Review—contract variation
Direct 46,750.00 C
Deacons Projects Provision of probity advisory services Open 60,720.00 D
Deborah Durnan Refresh Regional Introduction to Corporate Governance Workshop
Select 36,000.00 D
Deloitte Touche Tohmatsu
Internal Audit Services 2008–09— contracting of Longitudinal Studies
Open 15,025.00 A
DFK Kidsons S453‑1 Examination Open 26,180.00 D
DFK Kidsons S453‑1 Examination Select 12,946.00 A
Dr Jacqueline Roberts
Advice—Autism Early Learning Childcare Centres
Select 17,600.00 D
Dr Jacqueline Roberts
Specialist advice on Autism Spectrum Disorder requirements
Select 12,000.00 D
Dr Jacqueline Roberts
Development of a clinical evaluation strategy across the Autism Specific Early Learning and Care Centres
Select 152,288.00 D
Dr Jacqueline Roberts
Advice on Autism Spectrum Disorder requirements with the development and implementation of the Autism specific Early Learning and Child Care Centres
Select 11,000.00 D

327
Appe
ndic
esPa
rt 4
Chapter 15 Appendices Part4 Appendices FaHCSIA Annual Report 2008–2009
Table 4.18 FaHCSIA (including SSAT) consultancy services let during 2008–09 of $10,000 or more continued
Consultant name DescriptionSelection process
Contract price ($)
Justification (1)
Drake Workwise Pty Ltd
Facilitated change management program
Direct 56,375.00 D
DSI Consulting Pty Ltd
Statistical modelling—contribution on the role of socio‑economic influences on Indigenous health & life expectancy gap
Select 30,000.00 D
Dyson Consulting Group
Provision of technical advice on National Lifelong Care for the Catastrophically Injured
Direct 59,800.00 D
eBlueprint Pty Ltd Portal programming Select 20,000.00 A, D
Echelon Consultancy and Training
Development of remedial works and maintenance budget plan—Tuggeranong Office Park
Direct 18,150.00 D
Enmark Business Advisors Pty Ltd
S453‑1 Examination Open 14,423.42 D
Enmark Business Advisors Pty Ltd
Funds Control—financial and administration services to Kamilaroi Employment Aboriginal Corporation
Open 55,267.30 D
Enmark Business Advisors Pty Ltd
S453‑1 Examination Open 11,606.10 D
Enmark Business Advisors Pty Ltd
S453‑1 Examination Open 15,149.20 D
Enmark Business Advisors Pty Ltd
Funds Control to Coen Regional Aboriginal Corporation
Open 46,050.78 D
Ernst & Young Implementation of 2008 Reforms for Aboriginal Hostels Limited
Open 715,000.00 D
Ernst & Young Consultancy and training services in relation to FaHCSIA’s strategic procurement processes
Direct 15,000.00 D
Esmond Management
Consultancy to develop project based project management plans and tools for the discrete Indigenous communities located in the Central, North and North West Region of Queensland
Select 74,090.00 D
Fellows Medlock & Associates Pty Ltd
Job analysis of SSAT positions Select 30,000.00 A, D, E

328 FaHCSIA Annual Report 2008–2009 Part4 Appendices Chapter 15 Appendices
Table 4.18 FaHCSIA (including SSAT) consultancy services let during 2008–09 of $10,000 or more continued
Consultant name DescriptionSelection process
Contract price ($)
Justification (1)
Firecash Pty Ltd Specialist advice on Autism Spectrum Disorder in relation to the development and implementation of Autism specific Early Learning and Child Care Centres
Select 12,396.00 D
Firecash Pty Ltd Specialist advice on construction aspects of Autism specific Early Learning and Care Centres
Select 25,000.00 D
Forensic Digital Services Pty Ltd
Provide computer forensic support Direct 23,326.99 D
Fyre Consulting Pty Ltd
Provision of assistance and advice on implementation of the new Common Business Model
Select 70,400.00 D
Fyre Consulting Pty Ltd
Development of the Office for Women’s strategy for women on boards
Direct 40,000.00 D
Gemtil Pty Ltd Development and implementation of a stakeholder management strategy for the Nation Building and Jobs Package—Social Housing Initiative
Select 39,600.00 D
Grant Thornton (WA) Pty Ltd
S453‑1 Examination Open 29,700.00 D
Grant Thornton (WA) Pty Ltd
S453‑1 Examination Open 29,700.00 D
Grant Thornton (WA) Pty Ltd
S453‑1 Examination Open 29,700.00 D
Hacketts Chartered Accountants
S453‑1 Examination Open 19,000.00 D
HannahFyre Enterprises
Business process review of the Harm Prevention Charities Register
Direct 11,000.00 C
HannahFyre Enterprises
Development of Indigenous mainstream framework
Select 20,900.00 D
HannahFyre Enterprises
Development of FaHCSIA’s 2007–08 Reconciliation Action Plan
Select 17,050.00 D
Holocentric Pty Ltd Provision of mentoring and coaching services for staff following training in the use of the Holocentric Modeller software
Select 10,000.00 D

329
Appe
ndic
esPa
rt 4
Chapter 15 Appendices Part4 Appendices FaHCSIA Annual Report 2008–2009
Table 4.18 FaHCSIA (including SSAT) consultancy services let during 2008–09 of $10,000 or more continued
Consultant name DescriptionSelection process
Contract price ($)
Justification (1)
Horizons Education & Development
Prepare, deliver and evaluate four blocks of Certificate IV Business (Governance) training
Select 12,587.00 D
Horizons Education & Development
Introduction to Corporate Governance training and evaluation workshop
Open 10,447.00 D
Horizons Education & Development
Introduction to Corporate Governance—Pilbara
Open 11,931.00 D
Horizons Education & Development
Prepare, deliver and evaluate four blocks of Certificate IV Business (Governance) training
Select 53,260.00 D
Hyperware Consulting Pty Ltd
Electronic lodgement project Select 50,000.00 A, D
IBM Australia Ltd Services for the Security Services Gateway Certification Readiness Assessment
Direct 35,478.05 C
Institute for Aboriginal Development
Delivery of Building Strong Stores training in Alice Springs
Select 14,394.82 D
IntentMC Pty Ltd S453‑1 Examination Open 10,650.00 D
IntentMC Pty Ltd S487‑1 Special Administration Select 99,000.00 D
IntentMC Pty Ltd S453‑1 Examination Open 14,700.00 D
Interaction Consulting Group Pty Ltd
Delivery of the 2009 FaHCSIA Graduate Development Workshops
Open 130,513.24 A
Jenny Pearson & Associates Pty Ltd
Social Policy program evaluation—advocacy processes
Open 73,000.00 D
Jenny Pearson & Associates Pty Ltd
Consultancy services on the cost effective future direction of the customer training and support program
Direct 55,161.00 D
Josi Australia Pty Ltd
Research and data collection for Strategic Indigenous Housing and Infrastructure Project
Direct 55,000.00 A
Julia Wolfson Conduct Team Building and Conflict Awareness Workshops
Direct 14,300.00 A

330 FaHCSIA Annual Report 2008–2009 Part4 Appendices Chapter 15 Appendices
Table 4.18 FaHCSIA (including SSAT) consultancy services let during 2008–09 of $10,000 or more continued
Consultant name DescriptionSelection process
Contract price ($)
Justification (1)
Kimberley TAFE Planning phase Certificate IV in Business (Governance) Remote. Skills audit and consultative process of course promotion to seek expressions of interest for potential participants
Open 16,224.00 D
Korda Mentha S487‑1 Special Administration Select 198,000.00 D
Korda Mentha S453‑1 Examination Direct 21,406.00 D
Korda Mentha S453‑1 Examination Select 23,210.00 D
Korda Mentha S453‑1 Examination Open 32,213.50 D
Korda Mentha S453‑1 Examination Open 24,000.00 D
KPMG Australia Financial viability assessments—Personal Helpers and Mentors Program, Round 3 Funding
Open 88,660.00 A
KPMG Australia Financial viability assessment of an Australian Disability Enterprise
Open 35,739.00 C
KPMG Australia Review of the Equal Opportunity for Women in the Workplace Act 1999
Open 314,872.00 D
KPMG Australia Financial viability assessments of short‑list applicants in Mental Health Programs
Open 20,000.00 D
KPMG Australia Financial viability assessments of an Australian Disability Enterprise
Open 35,145.00 D
KPMG Australia Develop a report on initiatives to achieve a viable and sustainable community housing sector
Open 270,497.00 D
KPMG Australia Economic modelling of the National Plan of Action to Reduce Violence against Women and their Children
Open 20,110.00 D
KPMG Australia National Housing Affordability Scheme—assessment of applications
Open 62,000.00 D
KPMG Australia Financial viability assessment of a Disability Employment Assistance organisation
Open 27,645.00 C

331
Appe
ndic
esPa
rt 4
Chapter 15 Appendices Part4 Appendices FaHCSIA Annual Report 2008–2009
Table 4.18 FaHCSIA (including SSAT) consultancy services let during 2008–09 of $10,000 or more continued
Consultant name DescriptionSelection process
Contract price ($)
Justification (1)
KPMG Australia National Disability Strategy—analysis of submissions
Open 120,967.00 D
KPMG Australia National Rental Affordability Scheme Round 1 assessment process—technical expert
Open 103,384.00 D
KPMG Australia National Rental Affordability Scheme Round 1 assessment process—technical expert—contract variation
Direct 70,000.00 D
KPMG Australia Mentoring program and bookkeeping services
Direct 54,450.00 D
KPMG Australia S453‑1 Examination Open 11,000.00 D
KPMG Australia S453‑1 Examination Open 20,721.00 D
Langford Consultancy
S453‑1 Examinations Open 24,636.00 D
Langford Consultancy
S453‑1 Examinations Open 12,135.20 D
Langford Consultancy
S453‑1 Examinations Open 15,483.60 D
Lanier Voice Provision of voice recording system for Child Support Agency appeals
Open 60,000.00 A, D, E
Lee Green & Co Pty Ltd
S453‑1 Examination Open 27,280.00 D
Lindsay J. Roberts S453‑1 Examination Open 22,825.00 D
Lindsay J. Roberts S453‑1 Examinations Open 17,890.00 D
Lindsay J. Roberts S453‑1 Examination Open 15,510.00 D
Lindsay J. Roberts S453‑1 Examination Direct 13,519.00 D
Linkurra Services Pty Ltd
Longitudinal Study of Indigenous Children (LSIC) interviews in the Broome and Derby region of Western Australia
Select 196,738.00 C
Marcia Ella Duncan Membership of the NTER Review Board Direct 134,400.00 C
Marcia Ella Duncan Membership of the NTER Review Board Direct 75,600.00 C

332 FaHCSIA Annual Report 2008–2009 Part4 Appendices Chapter 15 Appendices
Table 4.18 FaHCSIA (including SSAT) consultancy services let during 2008–09 of $10,000 or more continued
Consultant name DescriptionSelection process
Contract price ($)
Justification (1)
Meertens Administration Pty Ltd
S453‑1 Examinations Open 14,200.00 D
Michael Lennon Professional Services
Provision of expert advice on mechanisms to further develop the not‑for‑profit housing sector in Australia
Direct 77,499.40 D
Microsoft Events Information Management Branch—Team Foundation Server Review
Direct 27,502.76 D
Milliken Berson Madden Pty Ltd
Project advice and management services in support of Indigenous Housing and Infrastructure Programs
Open 110,000.00 D
Monash University Gender mainstreamig policy in developed countries
Direct 21,350 E
Morison Consulting Pty Ltd
Consultancy to the FaHCSIA Risk Assessment & Audit Committee
Select 66,000.00 D
MW Group Consulting Pty Ltd
Victorian Community Linkage Project Select 78,540.00 D
Neill Buck & Associates Pty Ltd
Facilitation services for lessons learned workshop
Select 10,000.00 D
Net Balance Management Group Pty Ltd
Independent assurance for the 2007–2008 FaHCSIA Sustainability Report
Select 28,600.00 C
Oakton Services Pty Ltd
Probity advice for the Mental Health Personal Helpers & Mentors Program
Open 50,000.00 C
Oakton Services Pty Ltd
Probity advice for Helping Children with Autism package
Open 10,000.00 D
Oakton Services Pty Ltd
Probity advice for Helping Children with Autism Package
Open 20,000.00 D
Oakton Services Pty Ltd
Probity reviews of processes on the development of the National Rental Affordability Scheme
Open 10,000.00 D
Oakton Services Pty Ltd
Internal audit services 2008–09 Open 92,000.00 A

333
Appe
ndic
esPa
rt 4
Chapter 15 Appendices Part4 Appendices FaHCSIA Annual Report 2008–2009
Table 4.18 FaHCSIA (including SSAT) consultancy services let during 2008–09 of $10,000 or more continued
Consultant name DescriptionSelection process
Contract price ($)
Justification (1)
Oakton Services Pty Ltd
Independent expert to examine the new Centrelink Service Delivery Agreement
Open 19,620.00 C
Oakton Services Pty Ltd
Probity advice for the Social Housing Initiative
Open 11,000.00 D
Objective Corporation Ltd.
Consultancy service for provision of Electronic Data and Records Management Services
Open 20,000.00 A, D, E
Orima Research Pty Ltd
Focus group research to support the evaluation of the Income Management program in the Northern Territory
Open 48,796.00 C
Orima Research Pty Ltd
Undertake focus group research on the Child Protection Scheme in WA
Open 60,049.00 C
Ozelearn On‑line bullying and harassment program delivery
Select 33,000.00 D
Paul Fitzgerald An Employment and Workforce Development Study For Indigenous Remote Housing Property and Tenancy Management Workers
Select 26,400.00 D
Peter Butt Review and rewrite FaHCSIA Funding Agreements and related documents
Select 30,492.00 D
Peter Butt Review and rewrite FaHCSIA Funding Agreements and related documents
Select 33,000.00 D
Peter Yu Membership of the NTER Review Board Direct 330,750.00 C
Phillip Aggs Practice Pty Ltd
S453‑1 Examinations Open 22,920.00 D
Powers & Associates Australia Pty Ltd
Consultancy services on the delivery of CDEP in the three Welfare Reform Communities of Aurukun, Hope Vale and Coen
Open 15,962.00 D
PriceWaterHouse Coopers
Accounting advice in relation to onerous rental contract
Open 12,500.00 D
PriceWaterHouse Coopers
Summary of taxes, tax concessions, deductions and rebates
Direct 22,000.00 D

334 FaHCSIA Annual Report 2008–2009 Part4 Appendices Chapter 15 Appendices
Table 4.18 FaHCSIA (including SSAT) consultancy services let during 2008–09 of $10,000 or more continued
Consultant name DescriptionSelection process
Contract price ($)
Justification (1)
PriceWaterhouse Coopers
Investigation of jurisdictional interest in National Lifelong Care for the Catastrophically Injured
Direct 79,200.00 D
PriceWaterhouse Coopers
Undertake a consultancy to develop a new methodology for the allocation of future Network resources
Open 81,620.00 D
Pro‑Safety Consultants Pty Ltd
Provision of specialist Security Advisory Services
Direct 29,040.00 A
Queensland University of Technology
Academic and administrative support for the Reconnect Action Research Committee
Select 38,500.00 D
Raelene Joyce Webb
Independent investigator—Yirrkala Assets Dispute
Select 45,000.00 C
Reid Campbell Project management services for minor refurbishment of SSAT National Office, Victorian Office and South Australian Office
Select 40,000.00 A, D
RPM Solutions Pty Ltd
Performance testing of FaHCSIA Online Funding Management System (FOFMS) and Child Care Management Systems (CCMS) Enhancement Release 8
Direct 18,480.00 A
RPM Solutions Pty Ltd
Performance testing of the FOFMS/CCMS System
Direct 33,990.00 A
RPR Consulting Pty Ltd
Development of program logic for the White Paper on Homelessness National Action Plan and review of the draft White Paper
Open 55,630.01 D
RPR Consulting Pty Ltd
Evaluation of the out‑posting trials in the Kimberley and Ceduna
Open 29,230.00 C
Rural Solutions Transitional clinics for Western Arrernte Health Services and Utju Health Services
Open 14,470.00 D
Rural Solutions Amalgamation of Carnarvon corporations
Direct 51,128.00 D
SA Centre for Economic Studies
Literature review and consultations about reducing access to specific finances to fund problem gambling
Open 50,873.00 D

335
Appe
ndic
esPa
rt 4
Chapter 15 Appendices Part4 Appendices FaHCSIA Annual Report 2008–2009
Table 4.18 FaHCSIA (including SSAT) consultancy services let during 2008–09 of $10,000 or more continued
Consultant name DescriptionSelection process
Contract price ($)
Justification (1)
SAC Pty Ltd Evaluation of the Centrelink Service Delivery Agreement
Select 33,000.00 D
Scolari Comerford Chartered Accountants
S453‑1 Examinations Open 19,549.20 D
Scotswood Pty Ltd Provision of services to develop and deliver training on the National Disability Advocacy Program
Select 31,500.00 D
Scott & Associates Consulting
Assisting Wodonga TAFE in developing Home Ownership on Indigenous Land (HOIL) training materials
Select 35,700.00 D
Seisma Pty Ltd Provision of IT consulting services to ITAC
Select 30,000.00 A, D, E
Serco Australia Pty Ltd
Website review Select 29,393.00 D
SGS Economics and Planning Pty Ltd
Provision of high‑level advice on housing economics, housing supply, urban development, planning and infrastructure
Direct 70,000.00 D
SGS Economics and Planning Pty Ltd
Consultancy services to undertake a baseline community profile of the Groote and Bickerton Islands communities of Angurugu, Umbakumba, Milyakburra
Select 83,780.00 A
Social Policy Research Centre
Research consultancy on Rent Assistance to retirement village, residential park and caravan park residents
Open 146,000.00 C
Social Policy Research Centre
Review of trends in the incomes and living standards of the older Australians
Open 92,125.00 D
Social Policy Research Centre
Objective and subjective indicators of living standards among older Australians
Open 54,450.00 D
Social Policy Research Centre
Provision of social research services Open 729,329.00 D

336 FaHCSIA Annual Report 2008–2009 Part4 Appendices Chapter 15 Appendices
Table 4.18 FaHCSIA (including SSAT) consultancy services let during 2008–09 of $10,000 or more continued
Consultant name DescriptionSelection process
Contract price ($)
Justification (1)
Stantons International Pty Ltd
Development of a risk framework and key indicators
Open 19,804.20 D
Strategia Advising Pty Ltd
Revision of the Personal Helpers and Mentors Program guidelines
Select 20,625.00 A
Tactics Consulting Pty Ltd
Map key business processes managed by the Regional Property Network Section
Select 13,200.00 D
Tanner James Management Consultants
Provision of project management assistance for the coordination of the Remote Service Delivery Project
Direct 78,111.00 D
Tanner James Management Consultants
Provision of project management assistance for the Racial Discrimination Act 1975 Legislation project
Select 77,440.00 D
Teamic Pty Ltd Consultancy to the Risk Assessment & Audit Committee
Select 35,244.00 D
The Nous Group Analysis of Disability Support Pension earnings and employment
Direct 110,000.00 D
The Nous Group Consultancy services for the Pension Review
Select 170,280.00 D
The Nous Group Design, consultation and delivery of workshops for customer service to the Corporate Support Group
Select 33,550.00 D
Thinkplace Management consultancy services to the Program Support Branch
Direct 20,420.00 A
TNR Financial Services Pty Ltd
S453‑1 Examination Open 10,450.00 D
TNS Social Research
Review and test online survey for the Indigenous Community Profile project
Open 31,817.50 C
Tony Blunn AO Consultancy services—acquisition of NTER staff accommodation containers and the management of certain asbestos‑related issues on prescribed communities
Direct 72,000.00 D

337
Appe
ndic
esPa
rt 4
Chapter 15 Appendices Part4 Appendices FaHCSIA Annual Report 2008–2009
Table 4.18 FaHCSIA (including SSAT) consultancy services let during 2008–09 of $10,000 or more continued
Consultant name DescriptionSelection process
Contract price ($)
Justification (1)
University of Canberra
Research project—The Impact of a Sustained Gender Pay Gap on the Economy
Open 150,316.10 D
University of Canberra
Develop and deliver an FRSP training package
Select 33,292.00 D
University of Canberra
Research on Indigenous corporations entering external administration
Select 19,206.00 D
University of Queensland
‘Women in Community Leadership’ research services
Open 30,720.80 C
University of Queensland
Casemix Scoping Study Open 46,593.00 C
University of Sydney
Development of a National Population Benchmarking Framework
Direct 119,907.08 D
University of Wollongong
Development and testing of a carer questionnaire and treating health professional questionnaire for the Carer Payment (child)
Select 197,065.00 D
Urbis JHD Conduct COAG Initiative Program mid‑term evaluation
Open 56,355.20 D
Urbis JHD Legislation and accreditation scoping study
Open 130,744.00 C
Urbis JHD* National Online and 1800 Counselling Service—Service Delivery Model
Open 134,791.25 C
Urbis JHD Development of land assessment report
Open 30,800.00 D
UXC Getronics Australia Pty Ltd
Cisco router maintenance Select 60,000.00 A, D
Veritas Advisory Pty Ltd
Internal budgeting review—development of business requirements and business case
Direct 15,000.00 A
Vincent Quiggen Pty Ltd
Information toolkit for Indigenous women in business or who want to start a business
Select 23,232.00 D
Vision Australia Expert accessibility review and audit of new www.fahcsia.gov.au website
Direct 13,255.00 D

338 FaHCSIA Annual Report 2008–2009 Part4 Appendices Chapter 15 Appendices
Table 4.18 FaHCSIA (including SSAT) consultancy services let during 2008–09 of $10,000 or more continued
Consultant name DescriptionSelection process
Contract price ($)
Justification (1)
Walker Reid S453‑1 Examinations Open 17,200.00 D
Wallis Consulting Group Pty Ltd
National representative survey of families on the impact of the global financial crisis
Open 98,787.00 C
WalterTurnbull Financial viability assessments—Autism Specific Early Learning and Care Centres
Open 34,452.00 D
WalterTurnbull Financial viability assessments of Community Support applicants
Open 46,200.00 D
WalterTurnbull Consultation and report writing on the NDAP Funding Model
Open 14,000.00 D
WalterTurnbull Validation of the National Disability Advocacy Program Funding Model
Open 50,000.00 D
WalterTurnbull Financial viability assessments Open 14,520.00 D
WalterTurnbull Provision of governance and management assistance to Indigenous Children Program organisations
Select 20,460.00 D
WalterTurnbull Conduct review of the Association of Employees with Disability Legal Centre
Open 19,800.00 D
Westwood Spice Consultancy to design and facilitate Indigenous Remote Service Delivery Group Planning Day
Open 15,000.00 D
Wise Lord and Ferguson
S453‑1 Examination Open 10,450.00 D
Wise Lord and Ferguson
S453‑1 Examination Open 10,450.00 D
Total 19,644,852.72
* These consultants also appear in Appendix 4—Advertising and market research.
(1) Justification for decision to use consultancy:A. skills currently unavailable within FaHCSIAB. requirements for collection of quantitative/qualitative statistical informationC. requirement for independent or impartial research/assessment by an independent organisationD. requirement for specialist/professional expertiseE. consultant is recognised as an expert in the field and uniquely able to provide the required services.

339
Appe
ndic
esPa
rt 4
Chapter 15 Appendices Part4 Appendices FaHCSIA Annual Report 2008–2009
Appendix 6: Grant programsTable 4.19 below, contains details of FaHCSIA Discretionary Grants for the period 1 July 2008 to 31 December 2008.
Information on grants awarded by FaHCSIA since 1 January 2009 is available at www.fahcsia.gov.au.
Table 4.19 FaHCSIA Discretionary Grants programs 2008–09
Program name Program descriptionOutput group
Aboriginals Benefit Account (ABA)—Payments under section 64(4) of the Aboriginal Land Rights (Northern Territory) Act 1976
Funding for projects that provide benefits to Aboriginal people living in the Northern Territory in the areas of economic development, land and sea management, community enhancement, scholarship and sponsorship in education and leadership, and ceremonial and funeral support.
1.2
Australian Remote Indigenous Accommodation (ARIA)
Funding was provided to state and territory governments and Indigenous organisations for the period of 1 July to 31 December 2008. ARIA funded community housing, infrastructure and essential services largely in rural and remote areas to reduce overcrowding in remote Indigenous communities. ARIA also provided some assistance for Indigenous people to directly purchase new homes or to lease‑purchase homes and fund a range of national projects.
1.2
Broadband for Seniors Funding to establish a network of internet kiosks in locations frequented by seniors to address barriers that limit seniors’ capacity to access the information and community resources needed to remain involved in social and community activities.
2.1
Combating Petrol Sniffing Funding to reduce the incidence of substance abuse in declared petrol sniffing strategy zones, funding for prevention, early intervention and treatment issues, and tailored support packages to communities experiencing the impact of substance abuse.
1.2
Community Development Employment Projects (CDEP)
Funding for unemployed Indigenous people to provide participation opportunities through activities that develop their skills and improve their employability in order to achieve economic independence.
1.2

340 FaHCSIA Annual Report 2008–2009 Part4 Appendices Chapter 15 Appendices
Table 4.19 FaHCSIA Discretionary Grants programs 2008–09 continued
Program name Program descriptionOutput group
Community Engagement Funding to support volunteering, developing leadership, mentoring and life skills, strengthening ties between business and the community to improve outcomes for individual, families and to strengthen communities.
4.4
Family Relationships Funding to support Australian families to have healthy, resilient relationships, through times of family change and stress.
3.1
Financial Management Funding to improve the financial self‑reliance and wellbeing of individuals and families.
4.2
Homelessness and Housing Funding to support initiatives aimed at improving responses to the causes and outcomes of homelessness and to improve housing affordability.
4.1
Indigenous Communities Strategic Investment
Funding to support Indigenous communities to implement identified priorities and enable tailored responses to local community needs, particularly where there is a clear commitment to share responsibility between government and community.
1.2
Indigenous Leadership Funding to enhance Indigenous women’s leadership, representation, safety, wellbeing and economic status.
1.2
Mental Health Funding to deliver community based projects to assist families, carers, children and young people affected by mental illness, with a particular focus on Indigenous families and those from culturally and linguistically diverse backgrounds.
2.2
Native Title and Land Rights Funding to assist Indigenous Australians to exercise their legal rights in respect to land, sea and Native Title.
1.2
Northern Territory Emergency Response (NTER)
Funding for a whole‑of‑government response to coordinate welfare reform, employment, law and order, supporting families and housing and land reform in Indigenous communities.
1.2
National Rental Affordability Scheme (NRAS)
Aims to increase the supply of affordable rental dwellings in Australia. Funding for a National Rental Incentive is allocated to providers of new dwellings on the condition that they are rented to low and moderate income households at 20 per cent below market rents.
4.1

341
Appe
ndic
esPa
rt 4
Chapter 15 Appendices Part4 Appendices FaHCSIA Annual Report 2008–2009
Table 4.19 FaHCSIA Discretionary Grants programs 2008–09 continued
Program name Program descriptionOutput group
Parenting Funding to promote and support the positive development and wellbeing of children in the early years, with a focus on vulnerable children. This is achieved through the provision of early intervention, prevention and capacity building initiatives to support and strengthen families.
3.1
Payments to universities and other organisations for special studies and research
Funding for Indigenous research to enable FaHCSIA and the Australian Government to develop sound evidence‑based policy and programs across a broad realm of social and economic areas.
1.2
Public Awareness Funds initiatives that raise public awareness in the wider community of Aboriginal and Torres Strait Islander issues and culture. Includes funding to conduct the annual National Aboriginal and Islander Day Observance Committee (NAIDOC) community celebrations.
1.2
Services for People with Disability
Funding to improve the economic and social participation of people with disability by providing supported employment, improving access to information, and assisting with access to services. Funding also for assisting children with autism.
2.2
Support for Carers Funding to assist carers to continue in their caring role and to prepare for life after caring through respite and information services for young carers and peer support groups for parents of young children with disability.
2.3
Women’s Leadership and Development
Funds initiatives to build women’s capacity to take on greater leadership responsibilities, communication and consultation activities with women’s groups. Also funds research relevant to women and activities that recognise the achievement of women in all sectors of society.
2.5
Women’s Safety Agenda Funding to address violence against women in four broad themes—prevention, health, justice and services. Together they aim to decrease the impacts of domestic violence and sexual assault upon the community.
2.5
Youth Homelessness Funding to improve the level of engagement in family, work, education and the community of young people (including newly arrived young people) who are homeless, or at risk of homelessness, and their families.
2.4

342 FaHCSIA Annual Report 2008–2009 Part4 Appendices Chapter 15 Appendices
Appendix 7: Freedom of InformationFreedom of Information (FOI) requests are administered by FaHCSIA in accordance with the Freedom of Information Act 1982. Supplementary material, such as the FOI Guidelines, published by the Department of the Prime Minister and Cabinet on its website, is used to support the handling of FOI requests where necessary.
Table 4.20 FaHCSIA—Freedom of Information: number of requests 2008–09
Requests carried over from2007–08
Requests received 2008–09
Requests finalised in
2008–09 (including withdrawn)
Requests transferred to other agency
Requests outstanding2008–09
6 32 25 2 11
Procedures for gaining access to documents are outlined in Part 3 of this report. See page 282 for details.
Functional StatementThis Functional Statement is published to meet the requirements of section 8 of the Freedom of Information Act 1982. The statement lists bodies which assist the Department in its policy‑making functions or administration of its schemes and enactments.
FunctionsThe broad functions of the Department are described in the departmental overview of this report. Portfolio legislation is listed in the Administrative Arrangements Order and set out in Appendix 8. The Administrative Arrangements Order is available at www.pmc.gov.au.
Arrangements of outside participation in policy developmentBodies or persons outside the Commonwealth administration may participate in the formulation of policy by the Department or in the administration of its enactments or schemes. These bodies include:
Aboriginals Benefit Account Advisory Committee ◗
Australian Families and Children’s Council ◗
Australian Housing and Urban Research Institute Limited ◗
Carer Adjustment Advisory Panel ◗
Child Support National Stakeholder Engagement Group ◗

343
Appe
ndic
esPa
rt 4
Chapter 15 Appendices Part4 Appendices FaHCSIA Annual Report 2008–2009
Commonwealth Advisory Committee on Homelessness ◗
Commonwealth–State Territories and New Zealand Ministers’ Conference on the Status ◗
of Women
Community and Disability Services Ministers’ Conference ◗
Community and Disability Services Ministers’ Advisory Council ◗
Consultative Forum for Aboriginal and Torres Strait Islander Fund ◗
Disability Investment Group ◗
Disability Standards Review Panel ◗
Emergency Relief State Advisory Committees ◗
Health, Ageing, Community and Disability Services Ministers’ Councils ◗
Housing Ministers’ Advisory Committee ◗
Housing Ministers’ Conference ◗
Ministerial Council for Aboriginal and Torres Strait Islander Affairs ◗
Ministerial Council on Gambling ◗
National Council to Reduce Violence against Women and their Children ◗
National Housing Supply Council ◗
National People with Disabilities and Carer Council ◗
National Policy Commission on Indigenous Housing ◗
Repatriation Reference Committee ◗
Supported Accommodation Assistance Program (SAAP) National Coordination and ◗
Development Committee
Standing Committee of Commonwealth, States, Territories and New Zealand ◗
Women’s Advisers
Standing Committee of Officials for Aboriginal and Torres Strait Islander Affairs ◗

344 FaHCSIA Annual Report 2008–2009 Part4 Appendices Chapter 15 Appendices
Table 4.21 FaHCSIA Freedom of Information contact officers and details
FaHCSIA National Office FOI CoordinatorBox 7576Canberra Business Centre ACT 2610Phone: (02) 6244 7421 or (02) 6244 1449Fax: (02) 6244 7955
New South Wales State Office FOI Contact OfficerGPO Box 9820Sydney NSW 2001Phone: 1300 653 227Fax: (02) 8255 7799
Victorian State Office FOI Contact OfficerGPO Box 9820Melbourne VIC 3001Phone: 1300 653 227Fax: (03) 8626 1220
Queensland State Office FOI Contact OfficerGPO Box 9820Brisbane QLD 4001Phone: 1300 653 227Fax: (07) 3004 4780
South Australian State Office FOI Contact OfficerGPO Box 9820Adelaide SA 5001Phone: 1300 653 227Fax: (08) 8400 2199
Western Australian State Office FOI Contact OfficerGPO Box 9820Perth WA 6848Phone: 1300 653 227Fax: (08) 9229 1566
Tasmanian State Office FOI Contact OfficerGPO Box 9820Hobart TAS 7001Phone: 1300 653 227Fax: (03) 6211 9304
Northern Territory Office FOI Contact OfficerGPO Box 9820Darwin NT 0801Phone: 1300 653 227Fax: (08) 8936 6357

345
Appe
ndic
esPa
rt 4
Chapter 15 Appendices Part4 Appendices FaHCSIA Annual Report 2008–2009
Table 4.22 FaHCSIA Freedom of Information: Categories of documents held by the Department
ministerial, interdepartmental and general correspondence ◗
briefing papers, and submissions prepared for the Minister* ◗
Cabinet documents, Cabinet submissions and associated briefs ◗
documents in relation to questions in Parliament and related replies ◗
documents prepared for the Executive Council ◗
records of speeches, public addresses, discussion papers and other statements made ◗
by the Minister*
media releases by the Minister* or the Department ◗
papers and records relating to internal administration, including working drafts, ◗
statistical records, facsimiles, as well as records relating to human and financial resource management
policy documents ◗
requests for legal advice, including advice given and other related legal documents ◗
documents relating to new and amending legislation, drafting instructions and draft ◗
legislation
documents relating to program administration ◗
papers relating to meetings (agenda, minutes and reports) ◗
research and investigation papers ◗
tender documents ◗
funding agreements, contracts and Deeds of Standing Offers. ◗
* Where the term Minister appears in the list, it includes a reference to the Minister for Families, Housing, Community Services and Indigenous Affairs, the Hon. Jenny Macklin, MP; the Minister for Housing and Minister for the Status of Women, the Hon. Tanya Plibersek, MP; the Parliamentary Secretary for Disabilities and Children’s Services and Parliamentary Secretary for Victorian Bushfire Reconstruction, the Hon. Bill Shorten, MP; and the Parliamentary Secretary for the Voluntary Sector, the Hon. Ursula Stephens.

346 FaHCSIA Annual Report 2008–2009 Part4 Appendices Chapter 15 Appendices
Access to documentsForms and leaflets relating to FaHCSIA payments delivered by Centrelink are freely available from Centrelink or the Family Assistance Office.
The Department holds publicly available documents, which are either provided free of charge upon request or available for purchase. The Department, in accordance with the provisions of section 9 of the Freedom of Information Act 1982, has lodged a statement with the National Archives of Australia, listing the documents that are available from the Department. The statement is available at www.naa.gov.au.
Enquiries and requests to obtain access to publicly available FaHCSIA documents should be directed to 1800 050 009 (free call).

347
Appe
ndic
esPa
rt 4
Chapter 15 Appendices Part4 Appendices FaHCSIA Annual Report 2008–2009
Appendix 8: LegislationAt 30 June 2009, FaHCSIA’s programs were administered under the provisions of the following Acts and parts of Acts for which the Minister for Families, Housing, Community Services and Indigenous Affairs is responsible for under the Administrative Arrangements Order:
A New Tax System (Family Assistance) Act 1999 ◗ , except to the extent administered by the Minister for Education, the Minister for Employment and Workplace Relations or the Minister for Social Inclusion
A New Tax System (Family Assistance) (Administration) Act 1999 ◗ , except to the extent administered by the Minister for Education, the Minister for Employment and Workplace Relations or the Minister for Social Inclusion
Aboriginal Affairs (Arrangements with the States) Act 1973 ◗
Aboriginal and Torres Strait Islander Act 2005 ◗ , except to the extent administered by the Minister for Finance and Deregulation
Aboriginal and Torres Strait Islanders (Queensland Discriminatory Laws) Act 1975 ◗
Aboriginal and Torres Strait Islanders (Queensland Reserves and Communities ◗
Self-management) Act 1978
Aboriginal Land Grant (Jervis Bay Territory) Act 1986 ◗
Aboriginal Land (Lake Condah and Framlingham Forest) Act 1987 ◗
Aboriginal Land Rights (Northern Territory) Act 1976 ◗
Aboriginal Land Rights (Northern Territory) (Amendment) Act 2006 ◗
Child Support (Assessment) Act 1989 ◗ , except to the extent administered by the Minister for Human Services
Child Support Legislation Amendment (Reform of the Child Support Scheme— ◗
Initial Measures) Act 2006, except to the extent administered by the Minister for Human Services
Child Support Legislation Amendment (Reform of the Child Support Scheme— ◗
New Formula and Other Measures) Act 2006, except to the extent administered by the Minister for Human Services, the Minister for Education, the Minister for Employment and Workplace Relations or the Minister for Social Inclusion
Child Support (Registration and Collection) Act 1988 ◗ , except to the extent administered by the Minister for Human Services
Commonwealth and State Housing Agreement Act 1945 ◗
Corporations (Aboriginal and Torres Strait Islander) Act 2006 ◗

348 FaHCSIA Annual Report 2008–2009 Part4 Appendices Chapter 15 Appendices
Corporations (Aboriginal and Torres Strait Islander) Consequential, Transitional and ◗
Other Measures Act 2006
Data-matching Program (Assistance and Tax) Act 1990 ◗
Disability Services Act 1986 ◗ , except to the extent administered by the Minister for Education, the Minister for Employment and Workplace Relations or the Minister for Social Inclusion
Equal Opportunity for Women in the Workplace Act 1999 ◗
Families, Community Services and Indigenous Affairs and Other Legislation (2006 Budget ◗
and Other Measures) Act 2006, except to the extent administered by the Minister for Veterans’ Affairs
Families, Community Services and Indigenous Affairs and Veterans’ Affairs Legislation ◗
Amendment (2006 Budget Measures) Act 2006, except to the extent administered by the Minister for Veterans’ Affairs
Families, Housing, Community Services and Indigenous Affairs Legislation Amendment ◗
(Further 2008 Budget and Other Measures) Act 2008
Family Assistance Legislation Amendment (More Help for Families—One-off Payments) ◗
Act 2004
Household Stimulus Package Act (No. 2) 2009 ◗ , except to the extent administered by the Minister for Education, the Minister for Employment and Workplace Relations, the Minister for Social Inclusion, the Minister for Veterans’ Affairs or the Minister for Agriculture, Fisheries and Forestry
Housing Agreements Acts ◗
Housing Assistance Acts ◗
Marriage Act 1961 ◗ , Part IA
National Rental Affordability Scheme Act 2008 ◗
Native Title Act 1993 ◗ , Divisions 6 and 7 of Part 2 and Part 11
Northern Territory National Emergency Response Act 2007 ◗
Social Security Act 1991 ◗ , except to the extent administered by the Minister for Education, the Minister for Employment and Workplace Relations or the Minister for Social Inclusion
Social Security (Administration) Act 1999 ◗ , except to the extent administered by the Minister for Education, the Minister for Employment and Workplace Relations or the Minister for Social Inclusion
Social Security (International Agreements) Act 1999 ◗
Social Security Legislation Amendment (One-off Payments for Carers) Act 2005 ◗

349
Appe
ndic
esPa
rt 4
Chapter 15 Appendices Part4 Appendices FaHCSIA Annual Report 2008–2009
Social Security and Other Legislation Amendment (Economic Security Strategy) Act ◗
2008, except to the extent administered by the Minister for Education, the Minister for Employment and Workplace Relations, the Minister for Social Inclusion or the Minister for Veterans’ Affairs
Social Security and Veterans’ Entitlements Legislation Amendment (One-off Payments ◗
to Increase Assistance for Older Australians and Carers and Other Measures) Act 2006, except to the extent administered by the Minister for Veterans’ Affairs
Social Security and Veterans’ Affairs Legislation Amendment (One-off Payments and ◗
Other 2007 Budget Measures) Act 2007, except to the extent administered by the Minister for Veterans’ Affairs
Social Security and Veterans’ Entitlements Legislation Amendment (One-off Payments ◗
and Other Budget Measures) Act 2008, except to the extent administered by the Minister for Education, the Minister for Employment and Workplace Relations, the Minister for Social Inclusion or the Minister for Veterans’ Affairs
Social Welfare Commission (Repeal) Act 1976 ◗
Supported Accommodation Assistance Act 1994 ◗
Tax Laws Amendment (Simplified Superannuation) Act 2007 ◗ , item 20 of Schedule 8 insofar as it relates to legislation administered by the Minister for Families, Housing, Community Services and Indigenous Affairs.

350 FaHCSIA Annual Report 2008–2009 Part4 Appendices Chapter 15 Appendices
Appendix 9: Age Pension supplementary informationThe following tables and commentary provide supplementary information about the Age Pension.
Figure 4.1 Take-up of Age Pension, June 1999 – June 2009
There are more women than men receiving the Age Pension (57.2 per cent in June 2009), due to their longer life expectancy and lower qualifying age for the Age Pension. More women than men receive the full rate of the Age Pension—a total of 65.3 per cent of female age pensioners are paid at full rate, compared with 61.7 per cent of males. This reflects that on average women accumulate lower income and assets to provide for retirement.
Some 42.8 per cent of age pensioners are single. Singles tend to be older than partnered pensioners and are more likely to receive the full rate of pension than partnered pensioners (70.9 per cent compared with 58.4 per cent). As at June 2009, 39.3 per cent of age pensioners assisted by Centrelink were born overseas.
55
60
65
70
75
80
85
Age Pension + recipients of Department of Veterans' Affairs Service Pension and Income Support Supplement over Age Pension age
Age Pension (includes Department of Veterans' Affairs Age Pension)
Age Pension + recipients of Department of Veterans' Affairs Service Pension and Income Support Supplement over Age Pension age
Age Pension (includes Department of Veterans' Affairs Age Pension)
20092008200720062005200420032002200120001999
Year
Percen
tage

351
Appe
ndic
esPa
rt 4
Chapter 15 Appendices Part4 Appendices FaHCSIA Annual Report 2008–2009
Figure 4.2 Percentage of age pensioners born overseas, 1999–2009
Number of Age Pensions paid under international social security agreementsIn June 2009, there were 33,615 Age Pensions paid under agreements (excluding New Zealand and the United Kingdom), averaging $4,740 per year per person. An additional 9,851 Age Pensions were paid under the agreement with New Zealand, at an average of $5,087 per year per person. Under the former agreement with the United Kingdom, 151 Age Pensions were paid, averaging $8,406 per year per person.
Table 4.23 Maximum payments to recipients of pension: index of real pension rates, June 2004 to June 2009
2004 2005 2006 2007 2008 2009
Age Pension—single 100.0 100.0 102.1 103.9 105.1 105.6
With Rent Assistance 100.0 100.0 101.7 103.2 104.2 104.7
Age Pension—couple 100.0 100.0 102.1 103.9 105.1 105.6
With Rent Assistance 100.0 100.0 101.8 103.5 104.6 105.0
35
36
37
38
39
40
20092008200720062005200420032002200120001999
Year
Percen
tage

352 FaHCSIA Annual Report 2008–2009 Part4 Appendices Chapter 15 Appendices
Figure 4.3 Maximum payments to recipients of pension: index of real pension rates, June 2004 to June 2009 (for data, please refer to Table 4.23)1,2
1 Index of real value results are identical for Single—pension only and Couple—pension only.
2 While there were pension increases in line with the Consumer Price Index (CPI) from 2004 to 2005, there was no increase in line with Male Total Average Weekly Earnings, and therefore no real increase is represented in the graph.
100
101
102
103
104
105
106
Couple with Rent Assistance
Couple—pension only
Single with Rent Assistance
Single—pension only
200920082007200620052004
Year
Inde
x nu
mbe
r
Couple with Rent AssistanceCouple—pension only
Single with Rent AssistanceSingle—pension only

353
Appe
ndic
esPa
rt 4
Chapter 15 Appendices Part4 Appendices FaHCSIA Annual Report 2008–2009
Figure 4.4 Increases to the single pension rate under actual and alternative scenarios, March 2004 to March 2009
CPI = Consumer Price Index; MTAWE = Male Total Average Weekly Earnings.
Note: From July 2000, to compensate pensioners for the impact of the Goods and Services Tax (GST), the maximum rate of pension increased by 4 per cent (half of which was a payment in advance of the normal March 2001 indexation increase). This increase was known as the Pension Supplement. It increased in line with the CPI and was paid in addition to the base rate of pension that is set to at least 25 per cent of MTAWE.
The value of the GST Pension Supplement is incorporated into the new Pension Supplement from 20 September 2009.
Table 4.24 Income and asset value limits for full pension as at 30 June 2009
Single ($) Couple combined ($)
Income free area (per fortnight) 138 240
Asset value limit for home owners (home not included)
171,750 243,500
Asset value limit for non‑home owners 296,250 368,000
10,000
10,500
11,000
11,500
12,000
12,500
13,000
13,500
14,000
14,500
15,000
CPI
CPI + MTAWE
Actual (CPI + MTAWE + Supplement)
Mar-09Sep-08Mar-08Sep-07Mar-07Sep-06Mar-06Sep-05Mar-05Sep-04Mar-04
Year
Rat
e ($
per
yea
r)
Couple with Rent Assistance
CPICPI + MTAWEActual (CPI + MTAWE + Supplement)

354 FaHCSIA Annual Report 2008–2009 Part4 Appendices Chapter 15 Appendices
Figure 4.5 Proportion of age pensioners receiving a part-rate pension, June 1999 to June 2009
The global financial crisis reduced the private income and assets of many seniors. The Age Pension system responded as intended to provide additional assistance to seniors where it is needed. Figure 4.5 reflects this, showing that in 2008–09 there was a decrease in the proportion of age pensioners receiving a part‑rate pension. This is mainly due to people moving from part‑rate pension to full‑rate pension as a result of reductions in their assessed income and assets. The assessed income of many pensioners decreased as a result of a series of reductions in the social security deeming rates, in response to lower returns on financial investments. Reductions in asset values for managed investments and shares as a result of the global financial crisis also contributed to higher pension payments. The decrease in the proportion of age pensioners receiving a part‑rate pension is contrary to the longer term trend increase.
However, in 2008–09 it continued to be the case that new entrants to the Age Pension had significantly higher average private income and assets than those of the full Age Pension population. This means that the proportion of Age Pension entrants who receive a part‑rate pension is much higher than the proportion of part‑rate pensioners in the entire Age Pension population. In the year to June 2009, 58.8 per cent of Age Pension entrants were granted at part‑rate, while 36.3 per cent of the full Age Pension population received a part‑rate pension.
There is increasing diversity in income and asset holdings of age pensioners. Some pensioners have little private income or assets. They may have spent considerable parts of their working life out of the workforce, and/or much of their working life pre‑dated Superannuation Guarantee arrangements. These factors restrict capacity to accumulate
30
32
34
36
38
40
42
44
20092008200720062005200420032002200120001999
Year
Percen
tage

355
Appe
ndic
esPa
rt 4
Chapter 15 Appendices Part4 Appendices FaHCSIA Annual Report 2008–2009
savings. On the other hand, new entrants have much higher average assessable assets than the average for the full age pensioner population. This in part reflects that new entrants have over their working lives more greatly benefited from superannuation arrangements. Also, in 2008–09, the global financial crisis resulted in many new entrants because their income and assets had dipped in value to below the income test and assets test cut‑out points.
Table 4.25 Average assessed income ($) of age pensioners, 2005–06 to 2008–09
2005–06 2006–07 2007–08 2008–09
Single age pensioners 3,484 3,850 4,504 3,652
Partnered age pensioners 4,166 4,537 5,327 4,369
Ratio of assessed income to total income (including Age Pension):
$26.30 of assessed income to every $100 of total income in 2005–06 ◗
$27.30 of assessed income to every $100 of total income in 2006–07 ◗
$29.70 of assessed income to every $100 of total income in 2007–08 ◗
$24.70 of assessed income to every $100 of total income in 2008–09. ◗
Pension Bonus SchemeThe Pension Bonus Scheme is intended to encourage older Australians to defer the Age Pension and continue working beyond Age Pension age. It provides a one‑off tax‑free lump sum to eligible people and is paid when a person registered in the scheme finally claims and receives the Age Pension.
At June 2009, 12 per cent of people over Age Pension age were working. Of these, 26 per cent received the Age Pension while they worked and another 22 per cent were registered in the Pension Bonus Scheme. As at 30 June 2009, 180,274 people had registered in the scheme since it commenced on 1 July 1998.
Since 20 September 2009, the Pension Bonus Scheme has been closed to new entrants, with registrations limited to those who met the age and residence requirements for the Age Pension before 20 September 2009.
Provision of financial informationFaHCSIA’s seniors’ publications promote independence and self‑reliance to retirees and pre‑retirees and provide information on planning, saving and preparing for retirement, investment options and the effective use of savings for self‑support. We distributed around 26,650 copies of these publications during 2008–09.
356 FaHCSIA Annual Report 2008–2009 Part4 Appendices Chapter 15 Appendices
The Financial Information Service is a free information and education service available to all Australians through Centrelink. The service aims to ensure that people have sufficient information to help them make effective use of their financial resources for self‑support, make informed decisions about retirement issues and have adequate financial preparation for a retirement that allows participation in their community. FaHCSIA works with Centrelink in regard to the Financial Information Service’s scope and themes.
At 30 June 2009, there were some 147 full‑time equivalent Financial Information Service officers throughout Australia. Between July 2008 and June 2009, officers processed approximately 183,000 phone calls and conducted approximately 85,000 face‑to‑face interviews. Over the same period 74,000 people attended seminars. The seminars have a strong focus on encouraging pre‑retirees to plan for retirement. Forty‑four per cent of attendees were under age 55.

357
Appe
ndic
esPa
rt 4
Chapter 15 Appendices Part4 Appendices FaHCSIA Annual Report 2008–2009
Appendix 10: Family Tax Benefit reconciliation dataTable 4.26 below shows reconciliation outcomes for Family Tax Benefit recipients in the relevant entitlement year as at 26 June 2009.
Table 4.26: Reconciliation outcomes
Entitlement Year
2006–07 2007–08
Top‑ups Number of customers 1,812,698 1,722,130
Per cent of total customer number 82% 84%
Total amount $3,629m $3,612m
Average amount $2,002 $2,097
Nil change Number of customers 173,668 167,685
Per cent of total customer number 8% 8%
Overpayments Number of customers 175,417 162,039
Per cent of total customer number 8% 8%
Total amount $236m $216m
Average amount $1,348 $1,330
Total Number of customers 2,206,484 2,051,854

358 FaHCSIA Annual Report 2008–2009 Part4 Appendices Chapter 15 Appendices
Table 4.27 shows the following information for customers who had been reconciled as at 26 June 2009:
number of Family Tax Benefit recipients with outstanding reconciliation debts in each ◗
entitlement year
total amount of outstanding Family Tax Benefit reconciliation debts for each ◗
entitlement year
number of Family Tax Benefit recipients who had part or all of their tax refund withheld to ◗
offset a debt from the same entitlement year.
Table 4.27: Outstanding debts
State 2003–04 2004–05 2005–06 2006–07 2007–08
ACT Number of customers 104 127 241 400 858
Total outstanding debt $193,702 $227,969 $407,292 $620,693 $1,387,742
Customers with tax refund withheld
1,016 1,551 1,277 1,233 1,232
NSW Number of customers 2,098 2,599 5,417 9,845 19,037
Total outstanding debt $4,502,340 $5,691,399 $10,150,289 $15,830,217 $30,340,300
Customers with tax refund withheld
19,369 25,590 23,459 21,958 22,306
NT Number of customers 83 104 221 380 702
Total outstanding debt $161,117 $211,067 $349,028 $600,600 $1,038,037
Customers with tax refund withheld
468 830 744 701 722
Qld Number of customers 1,379 1,808 3,943 7,220 13,897
Total outstanding debt $2,777,042 $3,443,369 $6,932,813 $11,652,444 $22,769,804
Customers with tax refund withheld
11,007 14,423 14,595 15,018 15,732
SA Number of customers 361 435 1,058 2,044 4,467
Total outstanding debt $713,859 $890,203 $1,823,429 $3,087,876 $6,920,339
Customers with tax refund withheld
3,992 5,398 4,985 4,975 5,334

359
Appe
ndic
esPa
rt 4
Chapter 15 Appendices Part4 Appendices FaHCSIA Annual Report 2008–2009
Table 4.27: Outstanding debts continued
State 2003–04 2004–05 2005–06 2006–07 2007–08
Tas Number of customers 130 161 352 649 1296
Total outstanding debt $198,492 $346,148 $567,549 $960,294 $1,876,905
Customers with tax refund withheld
891 1,427 1,416 1,384 1,465
Vic Number of customers 1,420 1,808 3,926 7,088 15,665
Total outstanding debt $2,879,688 $3,707,459 $6,938,631 $11,432,198 $25,824,307
Customers with tax refund withheld
14,284 18,980 17,653 17,685 18,102
WA Number of customers 777 989 2,047 3,964 7,963
Total outstanding debt $1,496,036 $2,045,054 $3,875,714 $6,365,801 $13,581,195
Customers with tax refund withheld
5,827 8,257 7,665 8,446 9,069
N/R* Number of customers 799 754 868 719 587
Total outstanding debt $1,279,502 $1,244,797 $1,339,976 $1,133,050 $955,315
Customers with tax refund withheld
833 1,015 843 638 453
Total Number of customers 7,151 8,785 18,073 32,309 64,472
Total outstanding debt $14,201,778 $17,807,466 $32,384,722 $51,683,174 $104,693,943
Customers with tax refund withheld
57,687 77,471 72,637 72,038 74,415
* The N/R (not recorded) category covers customers with overseas addresses, addresses that are post office boxes (rather than street addresses), and invalid addresses (e.g. for people who are no longer customers).
State is the state in which the customer resided as at end of June 2009, which may differ from when the debt was incurred.

360 FaHCSIA Annual Report 2008–2009 Part4 Appendices Chapter 15 Appendices
Table 4.28 shows the average Adjusted Taxable Income (ATI*), by state** / territory, for all Family Tax Benefit customers and their primary partner, who had been reconciled as at 26 June 2009 and had a debt in the relevant entitlement year.
Table 4.28: Average income by state/territory for customers with a debt
2003–04 2004–05 2005–06 2006–07 2007–08
ACT $82,522 $90,358 $95,031 $100,381 $103,610
NSW $77,989 $84,081 $89,218 $95,674 $97,864
NT $67,835 $76,984 $83,014 $87,994 $90,346
Qld $72,984 $79,579 $86,428 $93,107 $95,519
SA $71,686 $78,888 $83,763 $89,836 $92,528
Tas $67,760 $74,894 $81,032 $86,018 $88,069
Vic $75,811 $82,266 $88,023 $94,450 $96,006
WA $75,382 $83,772 $93,214 $101,693 $104,100
N/R*** $78,964 $86,525 $93,940 $99,929 $109,404
Total $75,539 $82,248 $88,391 $95,056 $97,228
* Customers with zero actual ATI are excluded in the calculation of average actual ATI.
** State is the state in which the customer resided as at end of June 2008, which may differ from when the debt was incurred.
*** The N/R (not recorded) category covers customers with overseas addresses, addresses that are post office boxes (rather than street addresses), and invalid addresses (e.g. for people who are no longer customers).

361
Appe
ndic
esPa
rt 4
Chapter 15 Appendices Part4 Appendices FaHCSIA Annual Report 2008–2009
Table 4.29 shows the average actual ATI* by payment type, of customers and their primary partner who were entitled to Family Tax Benefit Part A (FTB Part A) at any stage in the relevant financial year and who had been reconciled as at 26 June 2009.
Table 4.29: Average incomes by payment type
Average Actual Adjusted
2006–07 2007–08
ATO Lump Sum $72,041 $75,049
Centrelink Lump Sum $58,233 $51,443
Instalments $46,373 $47,064
Fortnightly/lump sum combination $59,814 $53,472
* Customers with zero actual ATI are excluded in the calculation of average actual ATI.
Table 4.30 shows the distribution of actual adjusted taxable income (ATI) for customers and their primary partner who were entitled to FTB Part A or FTB Part B at any stage during the relevant financial year, and who had been reconciled as at 26 June 2009.
Table 4.30: Ranged income
2006–07 2007–08
Actual ATI ($)
Customers entitled to FTB Part A
Customers entitled to FTB Part B
Customers entitled to FTB Part A
Customers entitled to FTB Part B
0 to less than 20,000 460,610 456,010 458,832 455,111
20,000 to less than 40,000 472,394 461,128 388,331 379,708
40,000 to less than 60,000 368,217 302,614 341,447 289,667
60,000 to less than 80,000 355,978 205,766 333,028 202,164
80,000 to less than 100,000 259,876 106,754 272,135 114,143
100,000 to less than 120,000 51,640 46,666 72,692 52,059
120,000 to less than 140,000 4,045 22,551 5,071 25,610
140,000 to less than 160,000 1,052 12,051 1,143 13,555
160,000 to less than 180,000 410 6,866 396 7,499
180,000 to less than 200,000 225 4,301 202 4,671

362 FaHCSIA Annual Report 2008–2009 Part4 Appendices Chapter 15 Appendices
Table 4.30: Ranged income continued
2006–07 2007–08
Actual ATI ($)
Customers entitled to FTB Part A
Customers entitled to FTB Part B
Customers entitled to FTB Part A
Customers entitled to FTB Part B
200,000 to less than 300,000 281 8,408 267 8,769
300,000 to less than 400,000 62 2,231 63 2,162
400,000 to less than 500,000 24 973 21 902
500,000 to less than 600,000 <20 410 <20 432
600,000 to less than 700,000 <20 244 <20 255
700,000 to less than 800,000 <20 161 <20 125
800,000 to less than 900,000 <20 122 <20 115
900,000 to less than 1,000,000 <20 88 <20 66
1,000,000 or more 40 314 39 252
Total 1,974,877 1,637,658 1,873,682 1,557,265
Please note: For the above table, Centrelink and ATO customers who were entitled to lump sum grants and were not subsequently reconciled are not included. Analysis shows this group of customers is too small to significantly alter the income distribution.
For privacy reasons, cells containing fewer than 20 observations have been reported as ‘<20’.
There are many reasons why families with high incomes can legitimately receive FTB Part A. These include:
customers with large families ◗
customers who were entitled to an income support payment for part of the year ◗
customers whose personal circumstances have changed during the year. For example, customers who were partnered for ◗
part of the year, and had their FTB Part A entitlements cancelled for the period when they were partnered and had income above the threshold, but were entitled to FTB Part A for the period when they were not partnered
certain groups of customers who are free of the FTB Part A income test—blind Disability Support Pensioners receive their ◗
income support payments and FTB Part A free of income testing in accordance with existing legislation.

363
Appe
ndic
esPa
rt 4
Chapter 15 Appendices Part4 Appendices FaHCSIA Annual Report 2008–2009
Appendix 11: Statement of material error 2007–08This statement refers to the FaHCSIA 2007–08 Annual Report.
Families (page 23)
The wording of the explanation in the last paragraph reads:
In 2007–08, around 80 per cent of families with children under 16 received Family Tax Benefit and almost 30 per cent also received income support.
The explanation should read:
In 2007–08, around 80 per cent of families with children under 16 received Family Tax Benefit (FTB). Around 30 per cent of FTB families also received income support.

364 FaHCSIA Annual Report 2008–2009 Part4 Appendices Chapter 15 Appendices
Appendix 12: Aboriginals Benefit Account Annual Report 2008–09
IntroductionThe Aboriginals Benefit Account (ABA) is established under Part VI of the Aboriginal Land Rights (Northern Territory) Act 1976 (the ALRA) and is a Special Account for the purposes of the FMA Act.
The ABA is established for the receipt of statutory royalty equivalent monies, the level of which is calculated by reference to the payment of royalties generated from mining on Aboriginal land in the Northern Territory, and for the distribution of these monies. The major functions of the account are outlined in Table 4.32 of this report on page 367.
In 2008–09, the responsible Minister for the account was the Minister for Families, Housing, Community Services and Indigenous Affairs, the Hon. Jenny Macklin, MP.
The ABA is administered by the Department of Families, Housing, Community Services and Indigenous Affairs (FaHCSIA) in accordance with the requirements of the ALRA and the FMA Act.
In relation to FaHCSIA’s 2008–09 Outcome and Output reporting structure, the ABA is part of Outcome 1: Greater self‑reliance and economic, social and community engagement for Indigenous Australians and falls under Output 1.2: Services for Indigenous Australians. In 2008–09, Closing the Gap on Indigenous disadvantage was a major new policy measure under Outcome 1.
As part of the Closing the Gap measure, the targeting of jobs and economic participation has been identified as one of the key strategies for reducing Indigenous disadvantage. With a focus on delivering employment, community and economic development opportunities for Indigenous Territorians, the ABA potentially has a valuable role to play in contributing to the Government’s Closing the Gap objectives for the Northern Territory. Community and economic development is most successfully achieved by working in consultation and partnership, and the ABA Advisory Committee plays an important role in advising the Minister on beneficial payments from the account.
Year in reviewIn the wake of the recent mining boom, the ABA experienced a substantial increase in mining royalty equivalent income in 2008–09, increasing to $218.5 million from $83.3 million in 2007–08. This in turn resulted in a significant increase in payments to incorporated Aboriginal associations, communities and groups (royalty associations) compared to 2007–08 (see Table 4.33 on page 368). These payments are made from the

365
Appe
ndic
esPa
rt 4
Chapter 15 Appendices Part4 Appendices FaHCSIA Annual Report 2008–2009
ABA to the Northern Territory Land Councils for distribution to royalty associations for the benefit of those people who are affected by mining operations on Aboriginal land. Royalty associations receive 30 per cent of the royalty equivalent monies paid into the ABA each year, in accordance with section 64(3) of the ALRA.
Funding highlightsThe high level of royalty equivalent income also enabled the ABA to fund an increased number of beneficial projects under section 64(4) of the ALRA. In 2008–09, the Minister approved funding for 67 beneficial projects and initiatives at a total of $58.4 million, including:
$33.3 million for major economic development ◗
$0.7 million for small business initiatives ◗
$12.4 million for land and sea management initiatives ◗
$8.2 million for community enhancement projects ◗
$1.7 million for scholarship and sponsorship in education and leadership ◗
$2.1 million to land councils to support ceremonial and funeral activities. ◗
Beneficial projects are designed to deliver benefits that ultimately improve the lives of Indigenous people in the Northern Territory through better employment opportunities, education, infrastructure and health. Some key projects during this period include:
$3.58 million over two years to establish one of the largest watermelon farms in ◗
Australia. There will be two bore fields, consisting of four bores each at the farm which when completed, will be leased to private investors, creating ongoing economic and employment opportunities for the traditional owners of the Warrabi Aboriginal Land Trust and nearby community of Ali Curung.
$12.2 million to fund smaller local projects across several remote communities such as ◗
the establishment of local market gardens to produce fresh vegetables, refurbishment of community stores, purchase of community and school buses, and funding for ceremonial and funeral activities in communities.
$4.04 million for the construction of quality accommodation with comfortable sleeping ◗
facilities, recreation spaces and food preparation areas for the Tiwi College. The facility is for use by 72 students and staff, providing accommodation in six family group homes. This was designed to assist in the long‑term attendance of students at the Tiwi College from across both Melville and Bathurst Islands, which form Tiwi Islands.
$1.7 million over four years for the establishment and operation of the Machado Joseph ◗
Disease (MJD) Foundation. The foundation will provide research and health services to sufferers of the disease which is an hereditary neuro‑degenerative condition that has affected Indigenous people for some 40 years.

366 FaHCSIA Annual Report 2008–2009 Part4 Appendices Chapter 15 Appendices
$6.86 million for a purpose built office complex for the Central Land Council (CLC). ◗
The CLC activities had expanded beyond the capacity of the previous accommodation facilities which had staff operating from six different locations in Alice Springs. The new facility, which was officially opened in June 2009, was purpose built to accommodate the core functions of the CLC at the one location, which will provide benefits to numerous Indigenous people within the region.
Information on individual funding initiatives approved in 2008–09 can be found on FaHCSIA’s website at www.fahcsia.gov.au.
OEA performance audit of the ABAIn 2008, the Office of Evaluation and Audit (OEA) completed a performance audit of the ABA, which examined and reported on the efficiency, effectiveness, and economy of the account, and its overall management. The OEA report was publicly released in March 2009.
The performance audit provided relevant and useful recommendations on ways to improve the administration of the ABA. Good progress has been made in implementing the recommendations, which is contributing to improved governance, administration and reporting.
ABA performance 2008–09Reporting frameworkThe reporting framework for 2008–09 (Table 4.31) is aligned with the major functions of the ABA described in Table 4.37. A performance monitoring and reporting framework which will enable improved reporting against a set of high level performance indicators is currently under development.
Table 4.31: ABA activity reporting framework
Administration of the ABA
1 Credits into the ABA
2 Debits out of the ABA
3 ABA—Secretariat
4 Management of the ABA and its investment portfolio

367
Appe
ndic
esPa
rt 4
Chapter 15 Appendices Part4 Appendices FaHCSIA Annual Report 2008–2009
Table 4.32 Major functions of the ABA
Function according to Section of the ALRA Description
Credits into the ABASections 62–63
To receive the equivalent of mining royalty monies derived from mining operations on Aboriginal land in the Northern Territory, and such other income as outlined in section 63 of the ALRA.
Payments to land councilsSection 64(1), in accordance with section 34(1)
To make payments to Aboriginal land councils in the Northern Territory in proportions determined by the Minister to meet their administrative expenditure. The ALRA requires the administrative expenditure of the land councils is to be in accordance with proposed estimates of expenditure approved by the Minister.
Payments to royalty associationsSection 64(3)
To make payments to the above mentioned land councils for distribution to incorporated Aboriginal associations, communities or groups in order to benefit those Aboriginal people who are affected by mining operations. These payments are directly linked to the amount of royalty equivalent monies received in respect of mining in the areas concerned. Royalty associations receive 30 per cent of the royalty equivalents paid into the ABA.
Beneficial paymentsSection 64(4)
For the Minister to make payments for the benefit of Aboriginal people living in the Northern Territory. The ABA Advisory Committee provides advice to the Minister on these payments.
Administration payments Section 64(6)
To make payments to meet the expenses of administering the ABA.
Office of Township Leasing paymentsSection 64(4A)
To make payments for the acquiring and administration of township leases approved under section 19A of the ALRA.
ABA activities 2008–09Credits into the ABASection 63 of the ALRA requires the Commonwealth Government to credit the ABA from time to time, amounts equal to the amounts of any royalties received by the Commonwealth or the Northern Territory in respect of a mining interest in Aboriginal land in the Northern Territory.
Section 62(3) of the ALRA requires interest received from investment of an amount standing to the credit of the ABA to be credited into the ABA. The ABA earns interest from investments of funds that are surplus to immediate needs. Interest earned is receipted directly into the ABA’s official bank account and used to make payments as required. Table 4.33 details interest earned for the year.

368 FaHCSIA Annual Report 2008–2009 Part4 Appendices Chapter 15 Appendices
Resources required for the administration of the ABA account is provided free of charge by FaHCSIA. Resources provided free of charge represent FaHCSIA’s staffing costs associated with the management of the ABA account not reimbursed to the Department by the ABA. Resources provided free of charge are included as revenue in Table 4.33 and expenses in Table 4.39.
Financial statement audit services are also provided free of charge to the Department by the Australian National Audit Office.
Table 4.33: Summary of ABA income for 2008–09
2007–08 $’000
2008–09 $’000
Royalty equivalents 83,257 218,515
Interest 12,253 17,224
Resources received free of charge 1,382 1,712
Total ABA income 96,892 237,451
Royalty equivalent creditsUnder the Northern Territory (Self-Government) Act 1978, all Commonwealth interests in minerals in the Northern Territory, other than a prescribed substance within the meaning of the Atomic Energy Act 1953, are vested in the Northern Territory.
Title to those substances to which the Atomic Energy Act 1953 refers, principally uranium, remains vested in the Commonwealth.
Royalties in respect of uranium and non‑uranium mining on Aboriginal land are paid to the Australian Government Department of Resources, Energy and Tourism (DRET) and to the Royalty Branch of the Northern Territory Treasury respectively.
Following advice from these bodies and any necessary determinations made by the Minister, special appropriations are made from the Consolidated Revenue Fund to enable funds equivalent to the amount of royalties received from mining interests on Aboriginal land be credited to the ABA. Advice is provided weekly by the Northern Territory Treasury and twice yearly from DRET.
Table 4.34 provides a break‑up of uranium and non‑uranium royalty equivalents credited to the ABA for 2007–08 and 2008–09.

369
Appe
ndic
esPa
rt 4
Chapter 15 Appendices Part4 Appendices FaHCSIA Annual Report 2008–2009
Table 4.34: Royalty equivalent receipts
2007–08 $’000
2008–09 $’000
Uranium royalties 14,139 19,306
Non‑uranium royalties 69,118 199,209
Total royalty equivalents 83,257 218,515
Refer: 2008–09 Financial Statements.
ABA royalty equivalent income is subject to profits recorded by individual mines and world market resources prices and as such is volatile. The following chart shows section 63 receipts from royalty equivalents transferred into the ABA during the past six years.
Figure 4.6: Section 63 royalty equivalent receipts transferred to the ABA for the last six years
0
50
100
150
200
250
Age Pension (includes Department of Veterans' Affairs Age Pension)
2008–092007–082006–072005–062004–052003–042002–03
Year
$ m
illio
n

370 FaHCSIA Annual Report 2008–2009 Part4 Appendices Chapter 15 Appendices
Debits out of the ABAABA expenditure 2008–09Table 4.35 provides a summary of total expenditure from the ABA for 2008–09.
Table 4.35: Summary ABA expenditure for 2008–09
Payments from the ABA2008–09($’000)
Beneficial payments to Aboriginal people in the NT—64(4) 26,031
Administration [suppliers—64(6) and employees—64(6)] 1,890
Payments township leases—64(4A) 1,773
Payments to land councils for administrative purposes—64(1) 28,711
Payments to land council for distribution to royalty associations—64(3) 65,554
Total expenditure 123,959
Refer: Income Statement in the 2008–09 Financial Statements.
Payments to land councils for administrative expensesTable 4.36 lists ABA monies paid to the four Northern Territory land councils to meet their administrative costs.
Table 4.36: Section 64(1) payments to land councils 2008–09 (net of mining withholding tax (MWT)—administrative costs
Section 64(1) payments to land councils—administration costs2007–08
$’0002008–09
$’000
Northern Land Council 11,601 13,028
Central Land Council 7,783 11,967
Tiwi Land Council 1,928 1,768
Anindilyakwa Land Council 640 850
Total 21,952 27,613
Refer: Note 4E Payments to land councils for administrative purposes as reported in the Financial Statements.

371
Appe
ndic
esPa
rt 4
Chapter 15 Appendices Part4 Appendices FaHCSIA Annual Report 2008–2009
Payments to royalty associationsUnder section 64(3) of the ALRA, 30 per cent of the royalty equivalent monies must be paid to each land council in the area of which a mining interest is situated or mining operations are being carried on. These monies are distributed to Aboriginal organisations (royalty associations) in those areas affected by mining operations. Payments to royalty associations have increased this year in line with the increase in royalty equivalent income received.
Table 4.37: Section 64(3) payments to land councils for distribution to royalty associations (net of MWT)
Section 64(3) payments to land councils for distribution to royalty associations
2007–08 $’000
2008–09 $’000
Northern Land Council 6,508 9,629
Central Land Council 7,265 7,272
Anindilyakwa Land Council 10,206 46,031
Total 23,979 62,932
Refer: Note 4F Distribution to land councils as reported in the Financial Statements. NB: Tiwi Land Council did not receive any payment as there were no profitable mining operations in any of its areas.
Beneficial paymentsUnder section 64(4) the Minister can make payments to or for the benefit of Aboriginal people living in the Northern Territory. The Minister is advised by the ABA Advisory Committee in relation to these payments.
Table 4.38 lists expenditure under section 64(4) for 2008–09 and 2007–08.
Table 4.38: Section 64(4) expenditure—beneficial payments
2007–08Actual ($’000)
2007–08Accrual ($’000)
2008–09($’000)
Total beneficial payments 20,311 403* 26,031
* Relates to an accounting adjustment in prior years; a number of grants were incorrectly recorded in the Financial Statements as expenses rather than commitments.
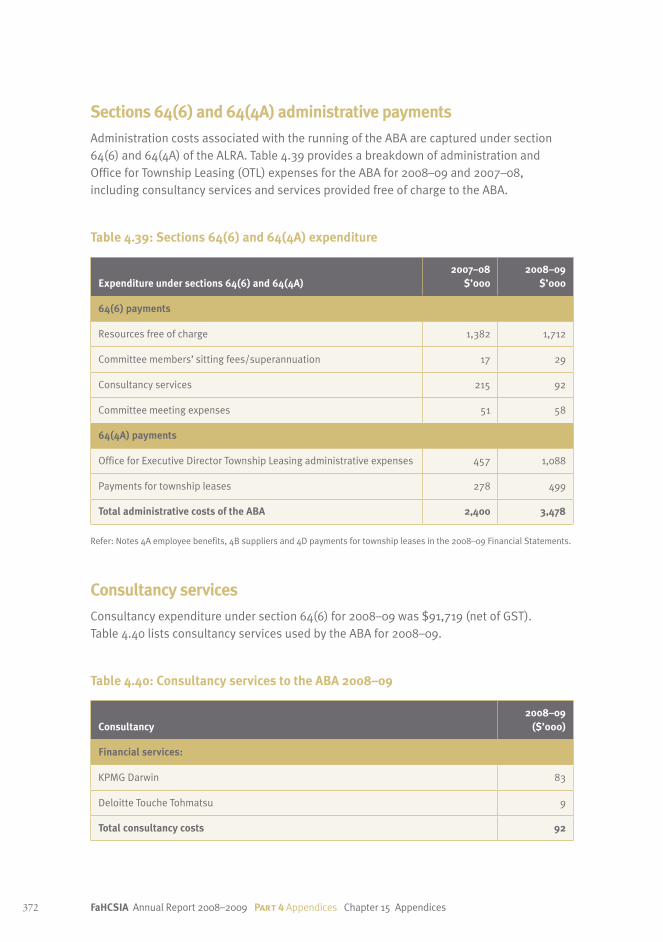
372 FaHCSIA Annual Report 2008–2009 Part4 Appendices Chapter 15 Appendices
Sections 64(6) and 64(4A) administrative paymentsAdministration costs associated with the running of the ABA are captured under section 64(6) and 64(4A) of the ALRA. Table 4.39 provides a breakdown of administration and Office for Township Leasing (OTL) expenses for the ABA for 2008–09 and 2007–08, including consultancy services and services provided free of charge to the ABA.
Table 4.39: Sections 64(6) and 64(4A) expenditure
Expenditure under sections 64(6) and 64(4A)2007–08
$’0002008–09
$’000
64(6) payments
Resources free of charge 1,382 1,712
Committee members’ sitting fees/superannuation 17 29
Consultancy services 215 92
Committee meeting expenses 51 58
64(4A) payments
Office for Executive Director Township Leasing administrative expenses 457 1,088
Payments for township leases 278 499
Total administrative costs of the ABA 2,400 3,478
Refer: Notes 4A employee benefits, 4B suppliers and 4D payments for township leases in the 2008–09 Financial Statements.
Consultancy servicesConsultancy expenditure under section 64(6) for 2008–09 was $91,719 (net of GST). Table 4.40 lists consultancy services used by the ABA for 2008–09.
Table 4.40: Consultancy services to the ABA 2008–09
Consultancy2008–09 ($’000)
Financial services:
KPMG Darwin 83
Deloitte Touche Tohmatsu 9
Total consultancy costs 92
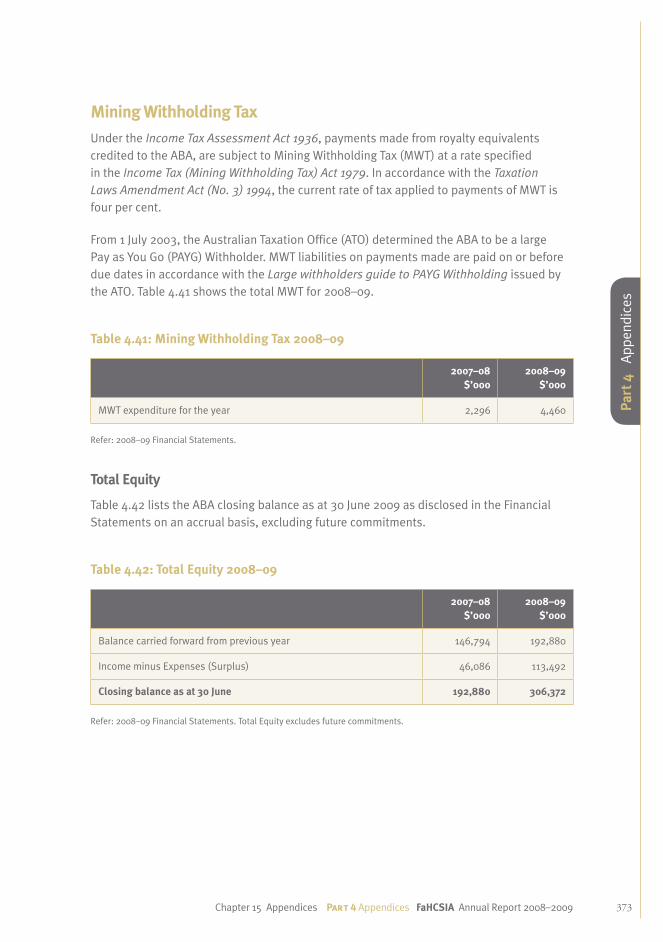
373
Appe
ndic
esPa
rt 4
Chapter 15 Appendices Part4 Appendices FaHCSIA Annual Report 2008–2009
Mining Withholding TaxUnder the Income Tax Assessment Act 1936, payments made from royalty equivalents credited to the ABA, are subject to Mining Withholding Tax (MWT) at a rate specified in the Income Tax (Mining Withholding Tax) Act 1979. In accordance with the Taxation Laws Amendment Act (No. 3) 1994, the current rate of tax applied to payments of MWT is four per cent.
From 1 July 2003, the Australian Taxation Office (ATO) determined the ABA to be a large Pay as You Go (PAYG) Withholder. MWT liabilities on payments made are paid on or before due dates in accordance with the Large withholders guide to PAYG Withholding issued by the ATO. Table 4.41 shows the total MWT for 2008–09.
Table 4.41: Mining Withholding Tax 2008–09
2007–08 $’000
2008–09 $’000
MWT expenditure for the year 2,296 4,460
Refer: 2008–09 Financial Statements.
Total Equity
Table 4.42 lists the ABA closing balance as at 30 June 2009 as disclosed in the Financial Statements on an accrual basis, excluding future commitments.
Table 4.42: Total Equity 2008–09
2007–08 $’000
2008–09 $’000
Balance carried forward from previous year 146,794 192,880
Income minus Expenses (Surplus) 46,086 113,492
Closing balance as at 30 June 192,880 306,372
Refer: 2008–09 Financial Statements. Total Equity excludes future commitments.

374 FaHCSIA Annual Report 2008–2009 Part4 Appendices Chapter 15 Appendices
ABA secretariatAs part of its administrative responsibilities for the ABA, FaHCSIA provides secretariat support to the ABA Advisory Committee. The ABA Advisory Committee is established under subsection 65(1) of the ALRA to advise the Minister in connection with debiting the Account for the purposes of making beneficial payments under section 64(4) of the ALRA.
2008–09 was a busy year for the advisory committee as it dealt with an increased number of applications for funding under the ABA. The committee met three times to consider applications and formulate advice to the Minister in relation to beneficial payments. The outcomes of each meeting held in 2008–09 are listed below.
During this period, FaHCSIA and the ABA Advisory Committee worked together on developing new funding guidelines, application forms and a new ABA Advisory Committee Members Handbook. The handbook is intended to support the governance of the committee by outlining roles and responsibilities and the operations of the committee. The new guidelines and application forms will further support the work of the advisory committee and provide applicants with improved information on applying for funding under the ABA.
Meeting outcomesAugust 2008 meeting (Groote Eylandt)The committee considered 49 applications for funding:
19 applications were supported ◗
17 were deferred to a later meeting ◗
13 were not supported. ◗
December 2008 meeting (Darwin)The committee considered 47 applications for funding:
21 applications were supported ◗
14 were deferred to a later meeting ◗
12 were not supported. ◗
April 2009 meeting (Darwin)The committee considered 43 applications for funding:
20 applications were supported ◗
10 were deferred to a later meeting ◗
13 were not supported. ◗
MembershipThe ABA Advisory Committee has 14 members elected by the four Northern Territory Land Councils, and one Chairperson appointed by the Minister. Land council representatives are

375
Appe
ndic
esPa
rt 4
Chapter 15 Appendices Part4 Appendices FaHCSIA Annual Report 2008–2009
elected from within the land council’s own membership. The membership of the committee in 2008–09 is listed in Table 4.43 below.
At the end of June 2009, Dr Miriam‑Rose Baumann’s period of appointment as Chair expired. During her term, Dr Baumann provided strong and committed leadership to the Committee and has made a valuable contribution to improving opportunities and conditions for Aboriginal people in the Northern Territory in her many areas of public service.
In the second half of 2008–09, an open expression of interest process was held for the position of Chair of the ABA Advisory Committee. The appointment of the new Chair is anticipated at the beginning of 2009–10.
Table 4.43: ABA Advisory Committee members 2008–09
Chairperson
Dr Miriam-Rose BaumannDaly River
Northern Land Council
Mr Samuel Bush-BlanasiKatherine
Ms Margaret DaiyiDarwin/Daly/WagaitMr Bunug Galaminda
West Arnhem
Mr Wali WunungmurraEast Arnhem
Mr Jacob LansenNgukurr
Mr Jeffrey DixonBorroloola/BarklyMr Roy Harrington
Victoria River District
Central Land Council
Mr Lindsay BookieEastern Plenty RegionMs Veronica Lynch
Alice Springs Region
Mr Harry NelsonTanami RegionMs Gina Smith
Tennant Creek Region
Mr Phillip WilyukaSouth West Region
Anindilyakwa Land Council
Mr Tony WurramarrbaGroote Eylandt
Tiwi Land Council
Mr Matthew WonaemirriMilikapiti

376 FaHCSIA Annual Report 2008–2009 Part4 Appendices Chapter 15 Appendices
Management of the ABA and its investment portfolioFaHCSIA is responsible for ensuring that the ABA complies with the Aboriginal Land Rights (Northern Territory) Act 1976 and relevant financial legislation and meets its financial accountability responsibilities to the Government and the Parliament. Section 64B of the ALRA requires FaHCSIA to keep accounts and prepare financial statements in respect of the ABA, as determined by the Minister for Finance. Section 64B also requires the Auditor‑General to report on the financial statements to the Minister for Families, Housing, Community Services and Indigenous Affairs.
Each year FaHCSIA seeks information from relevant mining companies in relation to the estimates and timing of royalties payable in respect of mining on Aboriginal land in the Northern Territory. The information is sought to facilitate the preparation of annual projections of receipts and payments for the ABA and to meet Budget obligations.
Investment portfolioThe ABA investment strategy is focused on cash flow requirements, preservation of the fund and management of risk. Monies which are surplus to immediate requirements are invested under section 39 of the FMA Act.
In order to minimise the risk of any loss, section 39 of the FMA Act restrict the investment of public money to a limited number of specified low‑risk investments like government bonds, state and territory bonds, term deposits and negotiable cash deposits (NCDs) with a bank.
The ABA had the following term deposits and NCDs with Australian banks as at the 30 June 2009.
Table 4.44: ABA Investment portfolio as at 30 June 2009
2007–08$’000
2008–09$’000
Interest bearing deposits 131,540 217,309
Negotiable certificates of deposit 59,217 69,220
Total ABA investment portfolio 190,757 286,529
Refer: Notes 5C Investments as reported in the 2008–09 Financial Statements.

378 Chapter 16 Financial management
385 Chapter 17 Financial statements
Financial management
5

378 FaHCSIA Annual Report 2008–2009 Part5 Financial management Chapter 16 Financial management
16IntroductionThis section provides a summary of the Department’s financial performance for 2008–09. Departmental and administered results are shown in the audited financial statements on pages 385–468 of this report. The resource summary of the price of outputs and administered programs can be found under each outcome in Part 2 of this report.
Strong financial management within FaHCSIA has meant that our total income of $1,700.9 million continues to be effectively managed. This is reflected in the Department’s operating result for 2008–09 of a $4.4 million deficit. This deficit is attributable to the increase in employee provisions due to a reduction in the discount factor used to calculate employee provisions arising from the current economic conditions. Given the size of our operating budget our ability to achieve a small operating deficit reflects strong financial management within FaHCSIA.
The Department continues to address audit recommendations from the Australian National Audit Office (ANAO) in a timely manner. All ANAO findings from the previous year’s audit have been cleared by the ANAO.
Changes affecting FaHCSIA’s 30 June 2009 financial statementsFaHCSIA’s 2008–09 financial statements reflect a number of significant changes to FaHCSIA’s operations as well as a number of whole‑of‑government changes to financial reporting arrangements. These key changes and their impact are detailed below.
Family Tax BenefitFrom 1 July 2009, the Family Tax Benefit (FTB) is only paid and claimed through Centrelink and Medicare and not through the tax system. Thus from 30 June 2009, FaHCSIA now reports the total provision for FTB. Previously the Australian Taxation Office reported part of this provision. These changes in arrangements account for a significant portion of the increase in the FTB provision as at 30 June 2009.
Financial management

379Chapter 16 Financial management Part5 Financial management FaHCSIA Annual Report 2008–2009
Fina
ncia
l man
agem
ent
Part 5
Payments for National Partnership AgreementsUnder the new Federal Financial Framework agreed with COAG, from 1 January 2009 the Treasury is accountable for the payment of grants to states and territories under National Partnership Agreements. Thus the 2008–09 financial statements only include National Partnership Agreements payments made during the period 1 July to 31 December 2008.
Payments to CAC Act bodiesFrom 1 July 2008 any payments for appropriations (for either recurrent operations or capital injections) to CAC Act bodies are now paid to their portfolio department for on‑payment to the CAC Act bodies.
In 2008–09 FaHCSIA received and paid appropriations to:
Torres Strait Islander Regional Authority ◗
Aboriginal Hostels Limited ◗
Indigenous Business Australia. ◗
Departmental—revenue from Government and payments for service deliveryFrom 1 July 2009 Centrelink will receive departmental appropriations directly. Thus in 2009–10 our revenue from Government and payments for service delivery will be significantly reduced. In 2008–09 $1,081m of our total departmental expenses of $1,705.3m were for payments to Centrelink for service delivery.
FaHCSIA operating result
DepartmentalOperating incomeTotal income was $1,700.9 million (2007–08: $1,475.7 million). Operating income consists of:
government appropriations of $1,657.8 million ◗
sale of goods and services income of $33.5 million ◗
other income of $9.6 million. ◗

380 FaHCSIA Annual Report 2008–2009 Part5 Financial management Chapter 16 Financial management
Government appropriations for the delivery of programs and services increased by $216 million in 2008–09. This increase primarily reflects increased appropriations received for Centrelink service delivery.
Operating expensesTotal operating expenses were $1,705.3 million (2007–08: $1,485.4 million). Operating expenses consist of:
employee expenses of $316.1 million (2007–08: $291.8 million) ◗
The increase in employee expenses in 2008–09 is reflective of a movement in staff numbers due to expanded functions performed by FaHCSIA, movement of IT contractor staff to ongoing staff, and an increase in salaries under the new Certified Agreement.
supplier expenses of $253.3 million (2007–08: $216.8 million) ◗
Supplier expenses have increased in part due to the project needs of the Northern Territory Emergency Response, and additionally due to an increase in operating lease rentals for new properties within the FaHCSIA portfolio.
payments to other government agencies for service delivery of $1,100.8 million ◗
(2007–08: $947.8 million)
Payments to other agencies, primarily Centrelink, has increased over 2008–09 due to larger customer numbers resulting from the current economic conditions, and in response to natural disasters.
other expenses (including depreciation) of $35.1 million (2007–08: $28.3 million) ◗
The depreciation and amortisation expense increase reflects the full year effect of asset increases that occurred in 2007–08.
Overall, this increase in operating expenses reflects the increase in size and operations of FaHCSIA in 2008–09.
Balance sheet
DepartmentalTotal assetsTotal assets at 30 June 2009 were $428.6 million (2008: $338.2 million). The majority of the asset base is in land and buildings, infrastructure, plant and equipment and internally developed software. The increase in total assets mainly occurred in debtors and leasehold improvements. Both these increases reflect the growth in operations during the year.

381Chapter 16 Financial management Part5 Financial management FaHCSIA Annual Report 2008–2009
Fina
ncia
l man
agem
ent
Part 5
Total liabilitiesTotal liabilities at 30 June 2009 were $211.6 million (2008: $142.4 million). Employee provisions and other payables comprise a major portion of the liabilities. The increase in employee provisions is partly due to a reduction in the discount factor used in calculating these provisions in 2007–08. The increase in other payables reflects amounts owed to Centrelink as at 30 June 2009.
AdministeredTotal assets at 30 June 2009 were $4,787.5 million (2008: $4372.5 million). The increase over the financial year reflects the growth in the fair value of the investment in Commonwealth entities and the value of financial investments held by the Aboriginals Benefit Account and the Aboriginal and Torres Strait Islander Land Account.
Total liabilities at 30 June 2009 were $7,845.8 million (2008: $4,255.0 million). This increase is driven by an increase in the Family Tax Benefit (FTB) provision as a result of increased customer numbers and FaHCSIA now recognising that portion of the FTB provision previously reported by the ATO. In addition, personal benefits payable has increased, mainly due to:
a new measure for the Baby Bonus which is now paid in 13 equal fortnightly instalments ◗
instead of a one‑off lump sum payment. A payable is now recognised for the first time of $300 million
an allowance made for customers who are yet to claim their entitlements under the ◗
recent stimulus measures announced by the Government.
Assets managementFaHCSIA manages its current and non‑current assets in accordance with guidelines as set out in the Chief Executive’s Instructions and relevant accounting standards.
FaHCSIA has updated its comprehensive asset accounting and management framework during 2008–09 including revision of asset accounting policies and management procedures to ensure they remain in line with accounting standards and industry best practice.
PurchasingThe Department’s purchasing activities are consistent with the FaHCSIA Chief Executive Instructions and internal procurement guidelines, which are in accordance with the Commonwealth Procurement Guidelines December 2008. All activities have ensured the efficient, effective and ethical use of public monies and have delivered value for money. Purchasing decisions have been made in an accountable and transparent manner, complying with Government policies and meeting relevant international obligations.

382 FaHCSIA Annual Report 2008–2009 Part5 Financial management Chapter 16 Financial management
Expenditure on consultancy services contractsDuring 2008–09, 291 new consultancy contracts were agreed upon, involving total actual expenditure of $16.8 million. In addition, 52 ongoing consultancy contracts were active during the year, involving total actual expenditure of $1.6 million.
Summary information on consultancy services for FaHCSIA and the Social Security Appeals Tribunal (SSAT) is set out below in Tables 5.1–5.3.
Table 5.1 New consultancies let in 2008–09, number and financial year expenditure (GST inclusive)
Number let Expenditure in 2008–09 (GST inclusive)
FaHCSIA core 282 $16,514,188
SSAT 9 $282,411
Total 291 $16,796,599
Please note: includes consultancies less than $10,000 in value.
Table 5.2 Ongoing consultanciesa active in 2008–09, number and financial year expenditure (GST inclusive)
Number ongoing Expenditure in 2008–09 (GST inclusive)
FaHCSIA core 48 $1,508,672
SSAT 4 $132,908
Total 52 $1,641,580
Please note: includes consultancies less than $10,000 in value.
a An ongoing consultancy is any consultancy let prior to 1 July 2008 that remained active in the 2008–09 financial year.
Table 5.3 Total expenditure on consultancy contracts (new and ongoing) during the financial years, 2006–07, 2007–08 and 2008–09 (GST inclusive)
2006–07 2007–08 2008–09
$29,603,036 $28,894,703 $18,438,179
Please note: includes expenditure on consultancy contracts let prior to 2006–07, and consultancies less than $10,000 in value. Includes FaHCSIA core and SSAT.

383Chapter 16 Financial management Part5 Financial management FaHCSIA Annual Report 2008–2009
Fina
ncia
l man
agem
ent
Part 5
Legal services expenditureFaHCSIA is required under paragraph 11.1 (ba) of the Legal Services Directions 2005 to report on legal services expenditure each financial year.
Table 5.4 below is a statement of legal services expenditure by the FaHCSIA portfolio for 2008–09. This statement has been published in compliance with paragraph 11.1 (ba) of the Legal Services Directions 2005, incorporating additional reporting requirements where possible.
Table 5.4 Total legal services expenditure (GST inclusive) at 30 June 2009
Internal legal services expenditure
Aboriginal Hostels Limited
$
Indigenous Business Australia
$
Indigenous Land
Corporation$
SSAT$
FaHCSIA$
Portfolio$
Salaries – 128,000 453,335 125,010 6,533,848 7,240,193
Overheads (includes administrative support and accommodation costs)1 – 14,000 108,893 26,438 2,757,743 2,907,074
Total (GST inclusive) Nil 142,000 562,228 151,448 9,291,591 10,147,267
External legal services expenditure
Legal fees 115,336 2,042,453 1,553,070 26,364 3,084,338 6,821,561
Other disbursements on external legal services NIL 374,131 NIL Nil 58,319 432,450
Total (GST inclusive) 115,336 2,416,584 1,553,070 26,364 3,142,657 7,254,011
Combined total
Total legal services expenditure 115,336 2,558,584 2,115,298 177,812 12,434,248 17,401,278

384 FaHCSIA Annual Report 2008–2009 Part5 Financial management Chapter 16 Financial management
Table 5.4 Total legal services expenditure (GST inclusive) at 30 June 2009 continued
Briefs to counsel
Aboriginal Hostels Limited
Indigenous Business Australia
Indigenous Land
Corporation SSAT FaHCSIA Portfolio
Number of male counsel briefed – 1 1 – 3 5
Value of briefs to male counsel – $11,385 $59,789 – $78,358 $149,532
Number of female counsel briefed – – – – 2 2
Value of briefs to female counsel – – – – $22,656 $22,656

385Chapter 17 Financial statements Part5 Financial management FaHCSIA Annual Report 2008–2009
Fina
ncia
l man
agem
ent
Part 5
17The financial statements and notes are required by section 49 of the Financial Management and Accountability Act 1997 and are a General Purpose Financial Report.
The financial statements and notes have been prepared in accordance with:
Finance Minister’s Orders (or FMOs) ◗
Australian Accounting Standards and Interpretations issued by the Australian Accounting ◗
Standards Board (AASB) that apply for the reporting period.
Financial statements
Joining Dr Jeff Harmer and Ian McPhee (Auditor General, ANAO) at the official signing of the financial statements for the 2008–09 Annual Report were some of the ‘behind the scenes’ team (left to right): Loucas Nicolaou, Sasha Dordevic, Kurt Munro, Donna Moody, Ben Jiang, John Bowker, Lasantha Samaranayake, Bernie Yates, Deanne Jones, Ron Wah, Steve Jennaway, Dean Nulty and Puspa Dash.

386 FaHCSIA Annual Report 2008–2009 Part5 Financial management Chapter 17 Financial statements

387Chapter 17 Financial statements Part5 Financial management FaHCSIA Annual Report 2008–2009
Fina
ncia
l man
agem
ent
Part 5

388 FaHCSIA Annual Report 2008–2009 Part5 Financial management Chapter 17 Financial statements

389Chapter 17 Financial statements Part5 Financial management FaHCSIA Annual Report 2008–2009
Fina
ncia
l man
agem
ent
Part 5
DEPARTMENT OF FAMILIES, HOUSING, COMMUNITY SERVICES AND INDIGENOUS
AFFAIRS
INCOME STATEMENT
for the year ended 30 June 2009
30 June
30 June
2009
2008
Notes
$'000
$'000
INCOME
Revenue
Revenue from Government
3A
1,657,750
1,441,827
Sale of goods and rendering of services
3B
33,505
21,348
Other revenue
3C
513
1,530
Total revenue
1,691,768
1,464,705
Gains
Other gains
3D
9,026
10,931
Foreign exchange
3E
31
-
Sale of assets
3F
49
-
Total gains
9,106
10,931
Total Income
1,700,874
1,475,636
EXPENSES
Employee benefits
4A
316,089
291,822
Suppliers
4B
253,288
216,783
Depreciation and amortisation
4C
32,455
24,376
Finance costs
4D
546
117
Write-down and impairment of assets
4E
2,068
3,846
Loss from asset sales
4F
-
480
Foreign exchange losses
4G
-
128
Payments for service delivery
4H
1,100,835
947,847
Total Expenses
1,705,281
1,485,399
Deficit
(4,407)
(9,763)
The above statement should be read in conjunction with the accompanying notes.
-3-

390 FaHCSIA Annual Report 2008–2009 Part5 Financial management Chapter 17 Financial statements
DEPARTMENT OF FAMILIES, HOUSING, COMMUNITY SERVICES AND INDIGENOUS
AFFAIRS
BALANCE SHEET
as at 30 June 2009
30 June
30 June
2009
2008
Notes
$'000
$'000
ASSETS
Financial Assets
Cash and cash equivalents
5A
5,827
5,129
Trade and other receivables
5B
149,483
101,099
Total financial assets
155,310
106,228
Non-Financial Assets
Land and buildings
6A
175,349
145,149
Infrastructure, plant and equipment
6B
20,346
16,079
Intangibles
6D
53,887
47,820
Other non-financial assets
6F
23,743
22,953
Total non-financial assets
273,325
232,001
Total Assets
428,635
338,229
LIABILITIES
Payables
Suppliers
7A
42,576
47,540
Other payables
7B
87,625
18,142
Total payables
130,201
65,682
Interest Bearing Liabilities
Leases
8A
-
174
Total interest bearing liabilities
-
174
Provisions
Employee provisions
9A
78,143
66,729
Other provisions
9B
3,237
9,765
Total provisions
81,380
76,494
Total Liabilities
211,581
142,350
Net Assets
217,054
195,879
EQUITY
Contributed equity
61,292
54,534
Reserves
48,158
36,032
Retained surplus
107,604
105,313
Total Equity
217,054
195,879
Current Assets
179,053
129,181
Non-Current Assets
249,582
209,048
Current Liabilities
190,827
128,587
Non-Current Liabilities
20,754
13,763
The above statement should be read in conjunction with the accompanying notes.
-4-

391Chapter 17 Financial statements Part5 Financial management FaHCSIA Annual Report 2008–2009
Fina
ncia
l man
agem
ent
Part 5
DEP
AR
TMEN
T O
F FA
MIL
IES,
HO
USI
NG
, CO
MM
UN
ITY
SER
VIC
ES A
ND
IND
IGEN
OU
S A
FFA
IRS
STA
TEM
ENT
OF
CH
AN
GES
IN E
QU
ITY
for t
he y
ear e
nded
30
June
200
9
Ret
aine
d Ea
rnin
gs
Ass
et R
eval
uatio
n
Res
erve
s
Con
trib
uted
Equi
ty/C
apita
l
To
tal E
quity
20
09
$'00
0
2008
$'00
0
2009
$'00
0
2008
$'00
0
2009
$'00
0
2008
$'00
0
2009
$'00
0
2008
$'00
0
Ope
ning
bal
ance
Bal
ance
car
ried
forw
ard
from
pre
viou
s per
iod
10
5,31
3
115,
517
36
,032
36
,105
54
,534
19
,725
19
5,87
9
171,
347
Adj
uste
d op
enin
g ba
lanc
e
105,
313
11
5,51
7
36,0
32
36,1
05
54,5
34
19,7
25
195,
879
17
1,34
7
Inco
me
and
expe
nses
Rev
alua
tion
adju
stm
ent
-
-
12
,126
1,
778
-
-
12
,126
1,
778
Adj
ustm
ent t
o as
set r
eval
uatio
n re
serv
e fo
r mak
egoo
d
-
-
-
(1,8
51)
-
-
-
(1
,851
)
Sub-
tota
l inc
ome
and
expe
nses
rec
ogni
sed
dire
ctly
in e
quity
-
-
12
,126
(7
3)
-
-
12,1
26
(73)
Def
icit
for t
he y
ear
(4
,407
)
(9,7
63)
-
-
-
-
(4
,407
)
(9,7
63)
Tota
l inc
ome
and
expe
nses
(4
,407
)
(9,7
63)
12
,126
(7
3)
-
-
7,71
9
(9,8
36)
Tran
sact
ions
with
ow
ners
Dis
trib
utio
ns to
own
ers
Ret
urns
of c
apita
l:
Res
truct
urin
g
-
-
-
-
-
(9,0
77)
-
(9
,077
)
Cont
ribu
tions
by
Own
ers
App
ropr
iatio
ns (e
quity
inje
ctio
ns)
-
-
-
-
6,
758
40
,936
6,
758
40
,936
Res
truct
urin
g
6,69
8
-
-
-
-
2,95
0
6,69
8
2,95
0
Oth
er -
trans
fers
of S
peci
al A
ccou
nts
-
(4
41)
-
-
-
-
-
(4
41)
Sub-
tota
l tra
nsac
tions
with
ow
ners
6,
698
(4
41)
-
-
6,
758
34
,809
13
,456
34
,368
Clo
sing
bala
nce
as a
t 30
June
10
7,60
4
105,
313
48
,158
36
,032
61
,292
54
,534
21
7,05
4
195,
879
The
abov
e st
atem
ent s
houl
d be
read
in c
onju
nctio
n w
ith th
e ac
com
pany
ing
note
s.
-5-

392 FaHCSIA Annual Report 2008–2009 Part5 Financial management Chapter 17 Financial statements
DEPARTMENT OF FAMILIES, HOUSING, COMMUNITY SERVICES AND INDIGENOUS
AFFAIRS
CASH FLOW STATEMENT
for the year ended 30 June 2009
30 June
30 June
2009
2008
Notes
$'000
$'000
OPERATING ACTIVITIES
Cash received
Goods and services
34,763
20,454
Appropriations
1,600,290
1,459,097
Interest
-
112
Net GST received
18,036
36,002
Other cash received
-
144
Total cash received
1,653,089
1,515,809
Cash used
Employees
294,692
288,827
Suppliers
285,314
225,393
Payments for service delivery
1,034,841
951,173
Total cash used
1,614,847
1,465,393
Net cash from operating activities
11
38,242
50,416
INVESTING ACTIVITIES
Cash received
Proceeds from sales of property, plant and equipment
3,194
-
Total cash received
3,194
-
Cash used
Purchase of property, plant and equipment
42,074
72,466
Purchase of intangibles
16,953
8,575
Total cash used
59,027
81,041
Net cash from investing activities
(55,833)
(81,041)
FINANCING ACTIVITIES
Cash received
Contributed equity
18,289
29,781
Total cash received
18,289
29,781
Net cash from financing activities
18,289
29,781
Net increase (decrease) in cash held
698
(844)
Cash and cash equivalents at the beginning of the reporting period
5,129
5,973
Cash and cash equivalents at the end of the reporting period
5A
5,827
5,129
The above statement should be read in conjunction with the accompanying notes.
-6-

393Chapter 17 Financial statements Part5 Financial management FaHCSIA Annual Report 2008–2009
Fina
ncia
l man
agem
ent
Part 5
DEPARTMENT OF FAMILIES, HOUSING, COMMUNITY SERVICES AND INDIGENOUS
AFFAIRS
SCHEDULE OF COMMITMENTS
as at 30 June 2009
30 June
30 June
2009
2008
$'000
$'000
BY TYPE
Commitments receivable
Sublease rental income
(44,403)
-
GST recoverable on commitments
(38,804)
(43,723)
Total commitments receivable
(83,207)
(43,723)
Capital commitments
Infrastructure, plant and equipment
-
497
Other capital commitments
3,543
898
Total capital commitments
3,543
1,395
Other commitments
Operating leases1
327,134
387,024
Project commitments
405
4,827
Research and development
51,671
28,154
Other commitments
90,049
48,375
Total other commitments
469,259
468,380
Net commitments by type
389,595
426,052
BY MATURITY
Commitments receivable
One year or less
(19,619)
(10,263)
From one to five years
(42,978)
(16,888)
Over five years
(20,610)
(16,572)
Total commitments receivable
(83,207)
(43,723)
Capital commitments
One year or less
2,884
1,344
From one to five years
659
51
Over five years
-
-
Total capital commitments
3,543
1,395
Operating lease commitments
One year or less
60,528
53,469
From one to five years
153,443
162,008
Over five years
113,163
171,547
Total operating lease commitments
327,134
387,024
Other commitments
One year or less
96,931
59,673
From one to five years
35,944
20,884
Over five years
9,250
799
Total other commitments
142,125
81,356
Net commitments by maturity
389,595
426,052
NB: Commitments were GST inclusive where relevant.
1
Operating leases included are effectively non-cancellable and comprise:
-7-

394 FaHCSIA Annual Report 2008–2009 Part5 Financial management Chapter 17 Financial statements
DEPARTMENT OF FAMILIES, HOUSING, COMMUNITY SERVICES AND INDIGENOUS
AFFAIRS
SCHEDULE OF COMMITMENTS (continued)
as at 30 June 2009
Nature of lease
General description of leasing arrangement
Leases for office accommodation
FaHCSIA has office accommodation at 46 locations comprising 54
leases of which four are subleases and 2 Commonwealth-owned sites,
Tuggeranong Office Park and Centraplaza are the two significant
locations. In addition FaHCSIA has three separate leases for offsite
storage facilities in Canberra. FaHCSIA's lease payments are subject to
review by a variety of mechanisms; these include predetermined fixed
escalations, a link to CPI movements, or in accordance with a market
review of comparable leases.
Agreements for the provision of motor
vehicles to senior executive officers No contingent rentals exist.
The above schedule should be read in conjunction with the accompanying notes.
-8-

395Chapter 17 Financial statements Part5 Financial management FaHCSIA Annual Report 2008–2009
Fina
ncia
l man
agem
ent
Part 5
DEP
AR
TMEN
T O
F FA
MIL
IES,
HO
USI
NG
, CO
MM
UN
ITY
SER
VIC
ES A
ND
IND
IGEN
OU
S A
FFA
IRS
SCH
EDU
LE O
F C
ON
TIN
GEN
CIE
S
as a
t 30
June
200
9
Con
tinge
nt A
sset
s
Inde
mni
ties
C
laim
s for
dam
ages
/cos
ts
Tot
al
20
09
2008
20
09
2008
20
09
2008
$'00
0
$'00
0
$'00
0
$'00
0
$'00
0
$'00
0
Bal
ance
from
pre
viou
s per
iod
-
-
811
84
811
84
New
-
-
-
811
-
811
Re-
mea
sure
men
t
-
-(4
1)
(30)
(41)
(3
0)
Ass
ets r
ecog
nise
d
-
-(2
22)
(5
4)(2
22)
(5
4)
Expi
red
-
-
-
--
-
Tot
al C
ontin
gent
Ass
ets
-
-
548
81
154
8
811
Con
tinge
nt L
iabi
litie
s
Inde
mni
ties
C
laim
s for
dam
ages
/cos
ts
Tot
al
20
09
2008
20
09
2008
20
09
2008
$'00
0
$'00
0
$'00
0
$'00
0
$'00
0
$'00
0
Bal
ance
from
pre
viou
s per
iod
-
50
019
5
652
195
1,
152
New
-
-
100
19
510
0
195
Re-
mea
sure
men
t
-
(500
)(3
9)
(148
)(3
9)
(648
)
Liab
ilitie
s rec
ogni
sed
-
-
(16)
(5
04)
(16)
(5
04)
Obl
igat
ions
exp
ired
-
-
(65)
-
(65)
-
Tot
al C
ontin
gent
Lia
bilit
ies
-
-
175
19
517
5
195
Net
Con
tinge
nt A
sset
s
-
-37
3
616
373
61
6
Det
ails
of e
ach
clas
s of c
ontin
gent
liab
ilitie
s and
ass
ets,
incl
udin
g th
ose
not i
nclu
ded
abov
e be
caus
e th
ey c
anno
t be
quan
tifie
d or
con
side
red
rem
ote,
are
disc
lose
d in
Not
e 12
:Con
tinge
nt L
iabi
litie
s and
Ass
ets.
The
abov
e sc
hedu
le sh
ould
be
read
in c
onju
nctio
n w
ith th
e ac
com
pany
ing
note
s.
-9-

396 FaHCSIA Annual Report 2008–2009 Part5 Financial management Chapter 17 Financial statements
DEPARTMENT OF FAMILIES, HOUSING, COMMUNITY SERVICES AND INDIGENOUS
AFFAIRS
SCHEDULE OF ADMINISTERED ITEMS
30 June
30 June
2009
2008
Notes
$'000
$'000
Income administered on behalf of Government
for the year ended 30 June 2009
Revenue
Non-taxation revenue
Attorney-General's Department revenue
16A
-
101,067
Recoveries
16B
152,585
158,447
Interest
16C
126,699
124,371
NZ Reciprocal Agreement
16D
46,179
51,969
Special Account revenue
16E
284,832
83,802
Other revenue
16F
14,484
11,864
Total revenues administered on behalf of Government
624,779
531,520
Gains
Write back of impairment allowance for personal benefits
16G
34,953
47,955
Total gains administered on behalf of Government
34,953
47,955
Total income administered on behalf of Government
659,732
579,475
Expenses administered on behalf of Government
for the year ended 30 June 2009
Subsidies
17A
12,850
12,862
Personal benefits - indirect
17B
-
15,402
Personal benefits - direct
17B
72,382,385
51,752,452
Suppliers
17C
116,210
161,504
Grants
17D
2,719,979
3,697,005
Write-down and impairment of assets
17E
146
329
Payments to CAC Act bodies
17F
124,060
-
Other expenses
17G
323,148
88,926
Northern Territory Flexible Funding Pool Special Account
17H
58,235
17,727
Total expenses administered on behalf of Government
75,737,013
55,746,207
This schedule should be read in conjunction with the accompanying notes.
-10-

397Chapter 17 Financial statements Part5 Financial management FaHCSIA Annual Report 2008–2009
Fina
ncia
l man
agem
ent
Part 5
DEPARTMENT OF FAMILIES, HOUSING, COMMUNITY SERVICES AND INDIGENOUS
AFFAIRS
SCHEDULE OF ADMINISTERED ITEMS (continued)
30 June
30 June
2009
2008
Notes
$'000
$'000
Assets administered on behalf of Government
as at 30 June 2009
Financial assets
Cash and cash equivalents
18A
23,857
11,807
Receivables
18B
1,087,990
988,331
Investments in Commonwealth entities
18C
1,638,908
1,503,327
Investments in deposits and government securities
18D
2,021,234
1,861,925
Total financial assets
4,771,989
4,365,390
Non-financial assets
Land and buildings
18E
2,923
-
Other non-financial assets
18F
12,570
7,065
Total non-financial assets
15,493
7,065
Total assets administered on behalf of Government
4,787,482
4,372,455
Liabilities administered on behalf of Government
as at 30 June 2009
Provisions
Personal benefits provision
19A
5,624,237
3,171,763
Total provisions
5,624,237
3,171,763
Payables
Personal benefits
19B
2,183,714
1,040,942
Grants
19C
14,604
5,388
Suppliers
19D
23,201
36,904
Total payables
2,221,519
1,083,234
Total liabilities administered on behalf of Government
7,845,756
4,254,997
This schedule should be read in conjunction with the accompanying notes.
-11-

398 FaHCSIA Annual Report 2008–2009 Part5 Financial management Chapter 17 Financial statements
DEPARTMENT OF FAMILIES, HOUSING, COMMUNITY SERVICES AND INDIGENOUS
AFFAIRS
SCHEDULE OF ADMINISTERED ITEMS (continued)
30 June
30 June
2009
2008
$'000
$'000
Administered Cash Flows
for the year ended 30 June 2009
OPERATING ACTIVITIES
Cash received
Sales of goods and rendering of services
8,200
101,395
Interest
139
755
NZ Reciprocal Agreement
47,626
54,849
Net GST received
178,078
171,473
Other
159,558
221,702
Total cash received
393,601
550,174
Cash used
Grant payments
2,897,752
3,926,040
Subsidies paid
13,710
12,002
Personal benefits
69,012,329
51,404,965
Suppliers
142,280
198,124
Payments from the Northern Territory Flexible Funding Pool Special
Account to or on behalf of Agencies
58,256
17,727
Payments to land councils for administrative purposes
28,701
22,826
Payments to land councils for distribution
65,554
19,533
CAC Act Body Payments
124,060
-
Payments to Indigenous Land Corporation
44,789
-
Total cash used
72,387,431
55,601,217
Net cash flows (used by) operating activities
(71,993,830)
(55,051,043)
INVESTING ACTIVITIES
Cash received
Proceeds from maturity and sales of investments
1,833,847
2,028,632
Interest on investments
134,965
97,346
Total cash received
1,968,812
2,125,978
Cash used
Purchase of investments
2,002,416
2,134,804
CAC Act Body Payments
47,980
-
Total cash used
2,050,396
2,134,804
Net cash flows from (used by) investing activities
(81,584)
(8,826)
Net Increase (Decrease) in Cash Held
(72,075,414)
(55,059,869)
Cash and cash equivalents at the beginning of the reporting period
11,807
11,207
Cash from Official Public Account for:
- Appropriations
72,450,170
55,344,534
- Special accounts
86,976
43,258
72,537,146
55,387,792
Cash to Official Public Account for:
- Appropriations
(319,120)
(255,245)
- Special accounts
(130,562)
(72,078)
(449,682)
(327,323)
Cash and cash equivalents at the end of the reporting period
18A
23,857
11,807
-12-

399Chapter 17 Financial statements Part5 Financial management FaHCSIA Annual Report 2008–2009
Fina
ncia
l man
agem
ent
Part 5
DEPARTMENT OF FAMILIES, HOUSING, COMMUNITY SERVICES AND INDIGENOUS
AFFAIRS
SCHEDULE OF ADMINISTERED ITEMS (continued)
30 June
30 June
2009
2008
$'000
$'000
Administered Commitments
BY TYPE
Commitments receivable
Other
(190,853)
(667,210)
GST recoverable on commitments
(200,550)
(294,948)
Total commitments receivable
(391,403)
(962,158)
Commitments payable
Capital Commitments
Land and buildings
4,727
1,117
Infrastructure, plant and equipment
750
471
Total capital commitments
5,477
1,588
Other commitments
Project Commitments
237,136
1,051,269
Research and development
4,902
6,189
Other commitments
2,339,373
3,321,879
Total other commitments
2,581,411
4,379,337
Net commitments by type
2,195,485
3,418,767
BY MATURITY
Commitments receivable
Other commitments receivable
One year or less
(161,724)
(353,417)
From one to five years
(187,241)
(538,148)
Over five years
(42,438)
(70,593)
Total other commitments receivable
(391,403)
(962,158)
Commitments payable
Capital Commitments
One year or less
5,477
1,540
From one to five years
-
48
Over five years
-
-
Total capital commitments
5,477
1,588
Other commitments
One year or less
1,451,805
2,686,771
From one to five years
1,075,980
1,595,938
Over five years
53,626
96,628
Total other commitments
2,581,411
4,379,337
Net commitments by maturity
2,195,485
3,418,767
NB: All commitments were GST inclusive where relevant.
This schedule should be read in conjunction with the accompanying notes.
-13-

400 FaHCSIA Annual Report 2008–2009 Part5 Financial management Chapter 17 Financial statements
DEPARTMENT OF FAMILIES, HOUSING, COMMUNITY SERVICES AND INDIGENOUS
AFFAIRS
SCHEDULE OF ADMINISTERED ITEMS (continued)
Administered Contingencies
as at 30 June 2009
Administered Contingent Liabilities
Claims for
damages or costs TOTAL
2009
2008
2009
2008
$'000
$'000
$'000
$'000
Balance from previous period
352 993 352 993New
53 352 53 352
Re-measurement
- - - -Liabilities recognised
(276) (993) 276 (993)
Total Administered Contingent Liabilities
129 352 129 352
Unquantifiable and remote contingencies are disclosed in Note 21: Administered Contingent Liabilities and Note
22: Administered Contingent Assets.
There are no contingent assets in the current or previous reporting periods.
This schedule should be read in conjunction with the accompanying notes.
-14-

401Chapter 17 Financial statements Part5 Financial management FaHCSIA Annual Report 2008–2009
Fina
ncia
l man
agem
ent
Part 5
Index to the Notes of the Financial Statements
Note 1:
Summary of Significant Accounting Policies
16Note 2:
Events After the Balance Sheet Date
29
Note 3:
Income
30Note 4:
Expenses
31
Note 5:
Financial Assets
33Note 6:
Non-Financial Assets
34
Note 7:
Payables
38Note 8:
Interest Bearing Liabilities
39
Note 9:
Provisions
40Note 10:
Restructuring
41
Note 11:
Cash Flow Reconciliation
44Note 12:
Contingent Liabilities and Assets
44
Note 13:
Senior Executive Remuneration
45Note 14:
Remuneration of Auditors
45
Note 15:
Financial Instruments
46Note 16:
Income Administered on Behalf of Government
49
Note 17:
Expenses Administered on Behalf of Government
50Note 18:
Assets Administered on Behalf of Government
52
Note 19:
Liabilities Administered on Behalf of Government
54Note 20:
Administered Reconciliation Table
55
Note 21:
Administered Contingent Liabilities
55Note 22:
Administered Contingent Assets
55
Note 23:
Administered Investments
56Note 24:
Administered Financial Instruments
57
Note 25:
Appropriations
61Note 26:
Special Accounts
69
Note 27:
Compensation and Debt Relief
76Note 28:
Reporting of Outcomes
77
-15-

402 FaHCSIA Annual Report 2008–2009 Part5 Financial management Chapter 17 Financial statements
Notes to and forming part of the Financial Statements
Note 1:
Summary of Significant Accounting Policies
1.1
Objectives of Department of Families, Housing, Community Services and Indigenous Affairs
The objective of the Department of Families, Housing, Community Services and Indigenous Affairs (FaHCSIA) is to
provide advice to the Government on all policy issues within the portfolio. FaHCSIA manages the delivery of services
and assistance to families and their children, senior citizens, people with disabilities, women and community groups.
FaHCSIA also provides advice on Indigenous issues and coordinates whole-of-government policy development and
service delivery in indigenous affairs.
FaHCSIA comprises the Department of Families, Housing, Community Services and Indigenous Affairs, the Social
Security Appeals Tribunal, the Aboriginals Benefit Account (ABA) and the Aboriginal and Torres Strait Islander
Land Account (ATSILA).
FaHCSIA is structured to meet four outcomes:
Outcome 1: Greater self-reliance and economic, social and community engagement for Indigenous Australians
Services and assistance that promote greater self reliance and engagement for Indigenous families and communities
through: shared responsibility; practical support; and innovative whole-of-government policy.
Outcome 2: Seniors, people with disabilities, carers, youth and women are supported, recognised and encouraged to
participate in the community
Services and assistance that help people to: participate actively in community and economic life; access a responsive
and sustainable safety net; and develop their capabilities.
Outcome 3: Families and children have choices and opportunities
Services and assistance that: help children have the best possible start to life; promote healthy family relationships;
help families adapt to changing economic and social circumstance; and assist families with the costs of children.
Outcome 4: Strong and resilient communities
Services and assistance that: help homeless people and low income households to gain affordable and appropriate
housing; promote community partnerships; and encourage participation in the local community by individuals,
families, business and government.
FaHCSIA's activities contributing toward these outcomes are classified as either departmental or administered.
Departmental activities involve the use of assets, liabilities, revenues and expenses controlled or incurred by
FaHCSIA in its own right. Administered activities involve the management or oversight by FaHCSIA, on behalf of the
Government, of items controlled or incurred by the Government.
FaHCSIA's activities are identified under three outputs for Outcome 1.
- Output Group 1.1 Whole-of-government coordination of policy development and service delivery for Indigenous
Australians
- Output Group 1.2 Services for Indigenous Australians
- Output Group 1.3 Registration, regulation and capacity building of Indigenous corporations
-16-

403Chapter 17 Financial statements Part5 Financial management FaHCSIA Annual Report 2008–2009
Fina
ncia
l man
agem
ent
Part 5
Notes to and forming part of the Financial Statements
FaHCSIA's activities are identified under six outputs for Outcome 2.
- Output Group 2.0 Items Applicable Across Outcome
- Output Group 2.1 Support for the Aged
- Output Group 2.2 Support for People with Disability
- Output Group 2.3 Support for Carers
- Output Group 2.4 Addressing Youth Homelessness
- Output Group 2.5 Support for Women
FaHCSIA's activities are identified under two outputs for Outcome 3.
- Output Group 3.1 Support for Families
- Output Group 3.2 Child Support
FaHCSIA's activities are identified under four outputs for Outcome 4.
- Output Group 4.1 Housing Support
- Output Group 4.2 Supporting Financial Management
- Output Group 4.3 Community Recovery
- Output Group 4.4 Community Partnership and Delivery
The continued existence of FaHCSIA in its present form, and with its present programs, is dependent on Government
policy and on continuing appropriations by Parliament for FaHCSIA's administration and programs.
1.2
Basis of Preparation of the Financial Statements
The financial statements and notes are required by section 49 of the Financial Management and Accountability Act
1997 and are a General Purpose Financial Report.
The financial statements and notes have been prepared in accordance with:
- Finance Minister's Orders (or FMOs) for reporting periods ending on or after 1 July 2008 which includes
approved exemptions for the ABA and ATSILA under Division 17 approved exemptions; and
- Australian Accounting Standards and Interpretations issued by the Australian Accounting Standards Board
(AASB) that apply for the reporting period.
The financial statements have been prepared on an accrual basis and is in accordance with the historical cost
convention, except for certain assets at fair value. Except where stated, no allowance is made for the effect of
changing prices on the results or the financial position.
The financial statements are presented in Australian dollars and values are rounded to the nearest thousand dollars
unless disclosure of the full amount is specifically required.
Unless alternative treatment is specifically required by an Accounting Standard or the FMOs, assets and liabilities are
recognised in the Balance Sheet when and only when it is probable that future economic benefits will flow to
FaHCSIA or a future sacrifice of economic benefits will be required and the amounts of the assets or liabilities can be
reliably measured. However, assets and liabilities arising under agreements equally proportionately unperformed are
not recognised unless required by an Accounting Standard. Liabilities and assets that are unrecognised are reported in
the Schedule of Commitments and the Schedule of Contingencies.
Unless alternative treatment is specifically required by an Accounting Standard, revenues and expenses are recognised
in the Income Statement when and only when the flow, consumption or loss of economic benefits has occurred and
can be reliably measured.
Administered revenues, expenses, assets, liabilities and cash flows reported in the Schedule of Administered Items and
related notes are accounted for on the same basis and using the same policies as for departmental items, except where
otherwise stated at Note 1.21.
-17-

404 FaHCSIA Annual Report 2008–2009 Part5 Financial management Chapter 17 Financial statements
Notes to and forming part of the Financial Statements
1.3
Significant Accounting Judgments and Estimates
In the process of applying the accounting policies listed in this note, FaHCSIA has made the following judgments that
have the most significant impact on the amounts recorded in the financial statements:
Family Tax Benefit
A full accrual approach was used in calculating the amount of the provision associated with the Family Tax Benefit
(FTB), for the year ending 30 June 2009. This approach estimates the probable flows associated with the transactions
that have occurred, but not yet reported.
The amount recognised as a provision is the best estimate of the consideration required to settle the present obligation
as at the reporting date, taking into account the risks and uncertainties that surround the events and circumstances that
affect the provision as required by (AASB 137 – Provision, Contingent Liabilities and Contingent Assets, para. 8.1).
The assumptions are regularly evaluated and are based on historical experience and other factors, including
expectations of future events, that are believed to be reasonable under the circumstances. The methodology considers
any payments to customers resulting from top up payment decisions, Centrelink lump sum payments and any new
measures. The FTB provision has not been discounted as the vast majority of payments will be made within 12
months.
From 1 July 2009, the Family Tax Benefit will only be paid and claimed through Centrelink and Medicare, and not
through the tax system. FaHCSIA now reports the total provision associated with the FTB.
The full accrual approach was also used in calculating the FTB receivable. The methodology considers the amount
owing to FaHCSIA within three defined categories; non-lodger debt, reconciliation debt, and qualification debt.
The impairment allowance account for the FTB receivable has been calculated by the Australian Government Actuary
in accordance with the overall requirement of AASB 136 - Impairment of Assets.
Pension Bonus Scheme
The Pension Bonus Scheme was established in 1998. It provides for a lump sum payment to those who continue in
employment and defer accessing the age pension until after the minimum entitlement age. Potential recipients are
expected to register for the scheme at the time they would first be able to access the Age Pension. However, in
practice, backdated registrations have been permitted. This allows anyone who has satisfied the work requirements
and goes onto the Age Pension more than a year after they were eligible to claim the pension to receive a bonus
payment.
The estimate of the liability relates to those who are currently registered for the Scheme and have not yet received a
bonus payment or exited for some other reason, together with those whom we would expect, on the basis of past
experience, to have a backdated registration effective prior to 30 June 2009. The future liability for the Pension Bonus
Scheme has been calculated by the Australian Government Actuary. The assumptions are continually evaluated and
are based on historical experience and other factors, including expectations of future events, that are believed to be
reasonable under the circumstances. The Australian Government Actuary has used a discount factor to determine the
present value of this long term provision.
Assets
FaHCSIA's property, plant and equipment is valued at fair value as determined by an independent valuer, in
accordance with AASB 116 - Property, Plant and Equipment. The fair value of land and buildings has been taken to
be the market value of similar properties as determined by an independent valuer. The fair value of leasehold
improvements has been taken to be its depreciated replacement cost. The fair value of plant and equipment has been
taken to be its market selling price or market buying price as appropriate.
No accounting assumptions or estimates have been identified that have a significant risk of causing a material
adjustment to carrying amounts of assets and liabilities within the next accounting period.
-18-

405Chapter 17 Financial statements Part5 Financial management FaHCSIA Annual Report 2008–2009
Fina
ncia
l man
agem
ent
Part 5
Notes to and forming part of the Financial Statements
1.4
Statement of Compliance
Adoption of new Australian Accounting Standard requirements
No accounting standard has been adopted earlier than the application date as stated in the standard.
There have been no new standards, amendements to standards or interpretations that have been issued by the AASB in
the current financial year which have had a material financial impact on FaHCSIA.
Future Australian Accounting Standard requirements
The following new standards, amendments to standards and interpretations have been issued by the AASB that are
effective for future reporting periods. It is estimated that the impact of adopting these pronouncements when effective
will have no material financial impact on future reporting periods.
· AASB 101 (Revised), AASB 2007-8 and AASB 2007-10 Presentation of Financial Statements and
consequential amendments to other Australian Accounting Standards - Introduces a statement of
comprehensive income. Other revisions include impacts on the presentation of items in the statement of
changes in equity, new presentation requirements for restatements or reclassifications of items in the financial
statements and changes to the titles of the financial statements.
1.5
Revenue
Revenues from Government
Amounts appropriated for departmental outputs appropriations for the year (adjusted for any formal additions and
reductions) are recognised as revenue when FaHCSIA gains control of the appropriation, except for certain amounts
which relate to activities that are reciprocal in nature, in which case revenue is recognised only when it has been
earned.
FaHCSIA provides funding to Centrelink for delivery of services through the Centrelink Funding Model (CFM)
agreement. This transaction based model ensures that Centrelink is funded for the work it undertakes on behalf of
FaHCSIA. The model allows for workload increases and decreases associated with the variable provision of services
which are adjusted against the appropriation amount reported by FaHCSIA at the end of the financial year.
Appropriations receivable are recognised at their nominal amounts.
Interest Revenue
Interest revenue is recognised using the effective interest method as set out in AASB 139 Financial Instruments:
Recognition and Measurement.
Other Types of Revenue
Revenue from the sale of goods is recognised when:
- the risks and rewards of ownership have been transferred to the buyer;
- the seller retains no managerial involvement nor effective control over the goods;
- the revenue and costs incurred for the transaction can be reliably measured; and
- it is probable that the economic benefits associated with the transaction will flow to FaHCSIA.
-19-

406 FaHCSIA Annual Report 2008–2009 Part5 Financial management Chapter 17 Financial statements
Notes to and forming part of the Financial Statements
Revenue from rendering of services is recognised by reference to the stage of completion of contracts at the reporting
date. The revenue is recognised when:
- the amount of revenue, stage of completion and transaction costs incurred can be reliably measured; and
- the probable economic benefits with the transaction will flow to FaHCSIA.
The stage of completion of contracts at the reporting date is determined by reference to the proportion that costs
incurred to date relate to the estimated total costs of the transaction.
Receivables for goods and services, which have 30 day terms, are recognised at the nominal amounts due less any
impairment allowance. Collectability of debts is reviewed at balance date. Provisions are made when collectability of
the debt is no longer probable.
1.6
Gains
Other Resources Received Free of Charge
Resources received free of charge are recognised as gains when and only when a fair value can be reliably determined
and the services would have been purchased if they had not been donated. Use of those resources is recognised as an
expense.
Contributions of assets at no cost of acquisition or for nominal consideration are recognised at their fair value when
the asset qualifies for recognition, unless received from another Government department as a consequence of a
restructuring of administrative arrangements (refer to Note 1.7).
Resources received free of charge are recorded as either revenue or gains depending on their nature.
Sale of Assets
Gains from disposal of non-current assets are recognised when control of the asset has passed to the buyer.
1.7
Transactions with the Government as Owner
Equity Injections
Amounts appropriated which are designated as 'equity injections' for a year (less any formal reductions) are
recognised directly in contributed equity in that year.
Restructuring of Administrative Arrangements
Net assets received from or relinquished to another Australian Government agency department or authority under a
restructuring of administrative arrangements are adjusted at their book value directly against contributed equity.
1.8
Employee Benefits
Liabilities for services rendered by employees are recognised at the reporting date to the extent that they have not
been settled.
Liabilities for 'short-term employee benefits' (as defined in AASB 119 Employee Benefits) and termination benefits
due within twelve months of balance date are measured at their nominal amounts.
The nominal amount is calculated with regard to the rates expected to be paid on settlement of the liability. This
includes an allowance being made for pay increases.
All other employee benefit liabilities are measured as the present value of the estimated future cash outflows to be
made in respect of services provided by employees up to the reporting date.
-20-

407Chapter 17 Financial statements Part5 Financial management FaHCSIA Annual Report 2008–2009
Fina
ncia
l man
agem
ent
Part 5
Notes to and forming part of the Financial Statements
Leave
The liability for employee benefits includes provision for annual leave and long service leave. No provision has been
made for sick leave as all sick leave is non-vesting and the average sick leave taken in future years by employees of
FaHCSIA is estimated to be less than the annual entitlement for sick leave.
The leave liabilities are calculated on the basis of employees' remuneration, including FaHCSIA's employer
superannuation contribution rates to the extent that the leave is likely to be taken during service rather than paid out on
termination.
The liability for long service leave has been determined by reference to the work of an actuary. The estimate of the
present value of the liability takes into account attrition rates and pay increases through promotion and inflation.
Separation and Redundancy
Provision is made for separation and redundancy benefit payments. FaHCSIA recognises a provision for termination
when it has developed a detailed formal plan for the terminations and has informed those employees affected that it
will carry out the terminations.
Superannuation
Staff of FaHCSIA are members of the Commonwealth Superannuation Scheme (CSS), the Public Sector
Superannuation Scheme (PSS) or the PSS accumulation plan (PSSap). The CSS and PSS are defined benefit schemes
for the Australian Government. The PSSap is a defined contribution scheme.
The liability for the defined benefits is recognised in the financial statements of the Australian Government and is
settled by the Australian Government in due course. This liability is reported by the Department of Finance and
Deregulation as an administered item.
FaHCSIA makes employer contributions to the employee superannuation scheme at rates determined by an actuary to
be sufficient to meet the cost to the Government of the superannuation entitlements of FaHCSIA's employees.
FaHCSIA accounts for the contributions as if they were contributions to defined contribution plans.
The liability for superannuation recognised as at 30 June 2009 represents outstanding contributions for the final
fortnight of the year.
1.9
Leases
A distinction is made between finance leases and operating leases. Finance leases effectively transfer from the lessor
to the lessee substantially all the risks and benefits incidental to ownership of leased non-current assets. An operating
lease is a lease that is not a finance lease. In operating leases, the lessor effectively retains substantially all such risks
and benefits.
Where a non-current asset is acquired by means of a finance lease, the asset is capitalised at either the fair value of the
lease property or, if lower, the present value of minimum lease payments at the inception of the contract and a liability
is recognised at the same time and for the same amount.
The discount rate used is the interest rate implicit in the lease. Leased assets are amortised over the period of the
lease. Lease payments are allocated between the principal component and the interest expense.
Operating lease payments are expensed on a straight line basis, which is representative of the pattern of benefits
derived from the leased assets.
1.10
Borrowing Costs
All borrowing costs are expensed as incurred.
-21-
408 FaHCSIA Annual Report 2008–2009 Part5 Financial management Chapter 17 Financial statements
Notes to and forming part of the Financial Statements
1.11
Cash
Cash and cash equivalents includes notes and coins held and any deposits in bank accounts with an original maturity
of 3 months or less that are readily convertible to known amounts of cash and subject to insignificant risk of changes
in value.
For an investment to qualify as a cash equivalent, it must be readily convertible to a known amount of cash and be
subject to an insignificant risk of changes in value. Therefore, negotiable certificates of deposits are treated as cash
equivalents.
Cash is recognised at its nominal amount.
1.12
Financial Assets
FaHCSIA classifies its financial assets in the following categories:
- financial assets at fair value through profit or loss;
- held-to-maturity investments;
- 'available-for-sale' financial assets; and
- loans and receivables.
The classification depends on the nature and purpose of the financial assets and is determined at the time of initial
recognition.
Financial assets are recognised and derecognised upon 'trade date'.
Effective Interest Method
The effective interest method is a method of calculating the amortised cost of a financial asset and of allocating
interest income over the relevant period. The effective interest rate is the rate that exactly discounts estimated future
cash receipts through the expected life of the financial asset, or, where appropriate, a shorter period.
Income is recognised on an effective interest rate basis except for financial assets that are recognised at fair value
through profit or loss.
Held-to-Maturity investment
Non-derivative financial assets with fixed or determinable payments and fixed maturity dates that FaHCSIA has the
positive intent and ability to hold to maturity are classified as held-to-maturity investments. Held-to-maturity
investments are recorded at amortised cost using the effective interest method less impairment, with revenue
recognised on an effective yield basis. Investments held by the Aboriginals Benefit Account and the Aboriginal and
Torres Strait Islander Land Account are classified as held-to-maturity investments.
Loans and Receivables
Trade receivables, loans and other receivables that have fixed or determinable payments that are not quoted in an
active market are classified as 'loans and receivables'. They are included in current assets, except for maturities greater
than 12 months after the balance sheet date. These are classified as non current assets. Loans and receivables are
measured at amortised cost using the effective interest method less impairment. Interest is recognised by applying the
effective interest rate.
-22-

409Chapter 17 Financial statements Part5 Financial management FaHCSIA Annual Report 2008–2009
Fina
ncia
l man
agem
ent
Part 5
Notes to and forming part of the Financial Statements
Impairment of Financial Assets
Financial assets are assessed for impairment at each balance date.
- financial assets held at amortised cost - if there is objective evidence that an impairment loss has been
incurred for loans and receivables or held to maturity investments held at amortised cost, the amount of the
loss is measured as the difference between the asset's carrying amount and the present value of estimated
future cash flows discounted at the asset's original effective interest rate. The carrying amount is reduced by
way of an allowance account. The loss is recognised in the Income Statement.
1.13
Financial Liabilities
Financial liabilities are classified as either financial liabilities 'at fair value through profit or loss' or other financial
liabilities.
Financial liabilities were recognised and derecognised upon 'trade date'.
Financial Liabilities at Fair Value Through Profit or Loss
Financial liabilities at fair value through profit or loss are initially measured at fair value. Subsequent fair value
adjustments are recognised in profit or loss. The net gain or loss recognised in profit or loss incorporates any interest
paid on the financial liability.
Other Financial Liabilities
Other financial liabilities, including borrowings, are initially measured at fair value, net of transaction costs.
Other financial liabilities are subsequently measured at amortised cost using the effective interest method, with
interest expense recognised on an effective yield basis.
The effective interest method calculates the amortised cost of a financial liability and allocates interest expense over
the relevant period. The effective interest rate is the rate that exactly discounts estimated future cash payments through
the expected life of the financial liability, or, where appropriate, a shorter period.
Supplier and Other Payables
Supplier and other payables are recognised at amortised cost. Liabilities are recognised to the extent that the goods or
services have been received irrespective of having been invoiced.
1.14
Contingent Liabilities and Contingent Assets
Contingent Liabilities and Contingent Assets are not recognised in the Balance Sheet but are reported in the relevant
schedules and notes. They may arise from uncertainty as to the existence of a liability or asset or represent an asset or
liability in respect of which the amount cannot be reliably measured. Contingent assets are disclosed when settlement
is probable but not virtually certain and contingent liabilities are disclosed when settlement is greater than remote.
1.15
Financial Guarantee Contracts
FaHCSIA does not have any financial guarantee contracts.
-23-

410 FaHCSIA Annual Report 2008–2009 Part5 Financial management Chapter 17 Financial statements
Notes to and forming part of the Financial Statements
1.16
Acquisition of Assets
Assets are recorded at cost on acquisition except as stated below. The cost of acquisition includes the fair value of
assets transferred in exchange and liabilities undertaken. Financial assets are initially measured at their fair value plus
transaction costs where incurred.
Assets acquired at no cost, or for nominal consideration, are initially recognised as assets and revenues at their fair
value at the date of acquisition, unless acquired as a consequence of restructuring administrative arrangements. In the
latter case, assets are initially recognised as contributions by owners at the amounts at which they were recognised in
the transferor department's accounts immediately prior to the restructuring.
1.17
Property, Plant and Equipment
Asset Recognition Threshold
Purchases of property, plant and equipment are recognised initially at cost in the Balance Sheet, except for purchases
costing less than $2,000 which are expensed in the year of acquisition (other than where they form part of a group of
similar items which are significant in total).
The initial cost of an asset includes an estimate of the cost of dismantling and removing the item and restoring the site
on which it is located. This is particularly relevant to ‘makegood’ provisions in property leases taken up by FaHCSIA
where there exists an obligation to restore the property to its original condition. These costs are included in the value
of FaHCSIA’s leasehold improvements with a corresponding provision for the ‘makegood’ recognised.
Revaluations
Fair values for each class of asset are determined as shown below.
Asset class Active and liquid Market
Exists Active and Liquid Market
Does Not Exist
Land
Market selling price
Value in existing use
Buildings
Market selling price
Depreciated replacement cost
or net present value of lease
payments
Leasehold improvements
Market selling price
Depreciated replacement cost
Infrastructure, Plant and Equipment
Market Selling Price
Depreciated replacement cost
Intangibles
N/A
Cost
Following initial recognition at cost, property plant and equipment are carried at fair value less accumulated
depreciation and accumulated impairment losses. Valuations are conducted with sufficient frequency to ensure that
the carrying amounts of assets do not differ materially from the assets’ fair values as at the reporting date. The
regularity of independent valuations depends upon the volatility of movements in market values for the relevant
assets.
Assets are subject to a formal valuation every three years. Formal valuations are carried out by an independent
qualified valuer. A complete valuation was conducted in the 2006-07 financial year by the Australian Valuation
Office. In the interim year, the fair values of assets are reviewed annually. Where necessary, adjustments are made to
valuations to reflect fair value.
Revaluation adjustments are made on a class basis. Any revaluation increment is credited to equity under the heading
of asset revaluation reserve except to the extent that it reverses a previous revaluation decrement of the same asset
class that was previously recognised through surplus and deficit. Revaluation decrements for a class of assets are
recognised directly through surplus and deficit except to the extent that they reverse a previous revaluation increment
for that class.
Any accumulated depreciation as at the revaluation date is eliminated against the gross carrying amount of the asset
and the asset restated to the revalued amount.
-24-

411Chapter 17 Financial statements Part5 Financial management FaHCSIA Annual Report 2008–2009
Fina
ncia
l man
agem
ent
Part 5
Notes to and forming part of the Financial Statements
Depreciation
Depreciable property plant and equipment assets are written-off to their estimated residual values over their estimated
useful lives to FaHCSIA using, in all cases, the straight-line method of depreciation. Leasehold improvements are
depreciated on a straight-line basis over the lesser of the estimated useful life of the improvements or the unexpired
period of the lease.
Depreciation rates (useful lives), residual values and methods are reviewed at each reporting date and necessary
adjustments are recognised in the current, or current and future reporting periods, as appropriate.
Depreciation rates applying to each class of depreciable asset are based on the following useful lives:
2009
2008
Intangibles
2 to 5 year
2 to 5 years
Leasehold improvements
10 years or lease term
10 years or lease term
Plant and equipment
3 to 10 years
3 to 10 years
Buildings
40 to 50 years
40 to 50 years
Impairment
All assets were assessed for impairment at 30 June 2009. Where indications of impairment exist, the asset’s
recoverable amount is estimated and an impairment adjustment made if the asset’s recoverable amount is less than its
carrying amount.
The recoverable amount of an asset is the higher of its fair value less costs to sell and its value in use. Value in use is
the present value of the future cash flows expected to be derived from the asset. Where the future economic benefit of
an asset is not primarily dependent on the asset’s ability to generate future cash flows, and the asset would be replaced
if FaHCSIA were deprived of the asset, its value in use is taken to be its depreciated replacement cost.
1.18
Intangibles
FaHCSIA's intangibles comprise externally acquired software and internally developed software for internal use.
Intangibles are capitalised when their gross values are greater than $50,000 for externally acquired software and
$200,000 for internally developed computer software. These assets are carried at cost less accumulated amortisation
and accumulated impairment losses.
Software is amortised on a straight-line basis over its anticipated useful life. The useful lives of FaHCSIA's software
are 2 to 5 years (2007-08: 2 to 5 years).
All software assets were assessed for indications of impairment as at 30 June 2009.
1.19
Taxation / Competitive Neutrality
FaHCSIA is exempt from all forms of taxation except Fringe Benefits Tax and the Goods and Services Tax (GST).
Revenues, expenses, assets and liabilities are recognised net of GST:
- except where the amount of GST incurred is not recoverable from the Australian Taxation Office; and
- except for some receivables and payables.
-25-

412 FaHCSIA Annual Report 2008–2009 Part5 Financial management Chapter 17 Financial statements
Notes to and forming part of the Financial Statements
1.20
Foreign Currency
Transactions denominated in a foreign currency are converted at the exchange rate at the date of the transaction.
Foreign currency receivables and payables are translated at the exchange rates current as at balance date. Associated
currency gains and losses are not material.
1.21
Reporting of Administered Activities
Administered revenues, expenses, assets, liabilities and cash flows are disclosed in the Schedule of Administered
Items and related Notes.
Except where otherwise stated below, administered items are accounted for on the same basis and using the same
policies as for departmental items, including the application of Australian Accounting Standards.
Administered Cash Transfers to and from Official Public Account
Revenue collected by FaHCSIA for use by the Government rather than FaHCSIA is Administered Revenue.
Collections are transferred to the Official Public Account (OPA) maintained by the Department of Finance and
Deregulation. Conversely, cash is drawn from the OPA to make payments under Parliamentary appropriation on
behalf of the Government. These transfers to and from the OPA are adjustments to the administered cash held by
FaHCSIA on behalf of the Government and reported as such in the Cash Flow Statement in the Schedule of
Administered Items and in the Administered Reconciliation Table in Note 20. The Schedule of Administered Items
largely reflects the Government's transactions, through FaHCSIA, with parties outside the Government.
Revenue
All administered revenues are revenues relating to the core operating activities performed by FaHCSIA on behalf of
the Australian Government.
Payments to CAC Act Agencies
From 1 July 2008, appropriations for Torres Strait Regional Authority, Aboriginal Hostels Limited and Indigenous
Business Australia are now received by FaHCSIA for on payment to these entities.
Taxation
Payments made to the Land Councils from royalty revenue received by the Aboriginals Benefit Account are subject to
Mining Withholding Tax. This is currently at a rate of 4% (2007-08: 4%).
Loans and Receivables
Where loans and receivables are not subject to concessional treatments, they are carried at amortised cost using the
effective interest method. Gains and losses due to impairment, derecognition and amortisation are recognised through
surplus and deficit.
Administered Investments
Administered investments in subsidiaries, joint ventures and associates are not consolidated because their
consolidation is relevant only at the Whole of Government level.
Administered investments are measured at their fair value as at 30 June 2009. Fair value has been taken to be the net
assets and liabilities from the latest management accounts or audited financial statements provided by each entity.
Investments in Financial Assets
Financial assets are held in relation to the Aboriginals Benefit Account, the Aboriginal and Torres Strait Islander Land
Account and FaHCSIA’s operations. The returns from financial assets held in relation to the Aboriginals Benefit
Account and the Aboriginal and Torres Strait Islander Land Account are managed in accordance with their respective
legislative requirements. Investments held at call are valued at their nominal rates, whilst investments 'held-to-
maturity' are measured at amortised cost.
-26-

413Chapter 17 Financial statements Part5 Financial management FaHCSIA Annual Report 2008–2009
Fina
ncia
l man
agem
ent
Part 5
Notes to and forming part of the Financial Statements
Northern Territory Community Assets
On 21 June 2007 the Government announced national emergency measures to protect Aboriginal children in the
Northern Territory. The Northern Territory National Emergency Response Act 2007 allows the compulsory granting
to the Commonwealth of Australia five year leases over the land in 64 prescribed communities. Twenty six community
leases were granted from the date of commencement of the legislation, with the remaining leases granted from 17
February 2008. Under existing lease arrangements, the Commonwealth has control of the land and leasehold
improvements.
The legislation excludes land subject to an earlier lease, and preserves the underlying ownership of the land. Thus
once the grant of leases to the Commonwealth expires, the land and all improvements attached to the land reverts to
the original owners.
There has been no payments under the current lease for the 2008-09 financial year.
Grants and Subsidies
FaHCSIA administers a number of grant and subsidy schemes on behalf of the Government. These include but are not
limited to grants to State, Territory and Local Governments and a range of grants to non-government, not-for-profit
and other recipients for activities associated with community development and supporting individuals.
Grant and subsidy liabilities are recognised to the extent that (i) the services required to be performed by the grantee
have been performed or (ii) the grant eligibility criteria have been satisfied, but payments due have not been made. A
commitment is recorded when the Government enters into an agreement to make these grants but services have not
been performed or criteria satisfied.
New Federal Financial Framework
Under the new Federal Financial Framework agreed with COAG, which came into effect on 1 January 2009, the
Department of Treasury is accountable for the payment of grants under the National Partnership Agreements to the
States and Territories. As a result FaHCSIA has included National Partnership Agreements payments made only
during the period 1 July to 31 December 2008 (refer to Note 17D). FaHCSIA, however, still remains accountable for
the Commonwealth policy associated with these National Partnership Agreements.
Personal Benefits
FaHCSIA administers a number of personal benefits programs on behalf of the Government that provide income
support, family assistance and other entitlements to individuals. These include, but are not limited to:
- Age Pension;
- Family Tax Benefit;
- Disability Support Pension;
- Maternity Payments;
- Family Payments;
- Back to School Bonus;
- Carers Allowance and Payments; and
- Ex-gratia payments to victims of natural and other disasters.
-27-

414 FaHCSIA Annual Report 2008–2009 Part5 Financial management Chapter 17 Financial statements
Notes to and forming part of the Financial Statements
Payments to customers are determined in accordance with provisions under social security law and other legislation.
Payments made under social security law are assessed, determined and paid by Centrelink under delegation from
FaHCSIA.
FaHCSIA receives appropriations for payments made by Centrelink on FaHCSIA's behalf.
The Social Security (Administration) Act 1999 and the A New Tax System (Family Assistance) (Administration) Act
1999 imposes an obligation on customers to disclose to Centrelink information about financial and personal
circumstances that affect entitlement to payment. This is a necessary part of Centrelink's administration, which
acknowledges that, at the time certain information is required, only the customer is in a position to provide that
information.
Unreported changes in circumstances can lead to incorrect payment, even if no deliberate fraud is intended. However,
risks associated with relying on voluntary disclosure by customers are mitigated by a comprehensive portfolio risk
management plan, underpinned by compliance strategies, which have been built up over many years. The compliance
framework has been designed to meet the requirements of social security legislation.
The compliance framework does not rely solely on information provided by customers to determine a customer's
entitlement. A comprehensive risk management strategy minimises the potential for incorrect payment by subjecting
customers to a variety of review processes. If debts are identified, Centrelink seeks to recover them in a lump sum or
by installments. While the risk management strategy is principally directed at minimising debts, the detection of
underpayments will also result in an adjustment to the customer's level of entitlement.
Administered Assets
Administered land and building assets were recognised at fair value on 30 June 2009.
1.22
Basis of Consolidation
The consolidated statements include core operations of FaHCSIA, the Aboriginal and Torres Strait Islander Land
Account and the Aboriginals Benefit Account. These financial statements are prepared for the same reporting period,
using consistent accounting policies.
1.23
Adjustment to prior year balances
The financial statements of the Commonwealth entities disclosed in Note 18C were unaudited at the time of signing
FaHCSIA's 2007-08 financial statements. The opening balances for these Commonwealth entities have therefore been
adjusted by $266.59 million to reflect their audited 30 June 2008 financial statements. This adjustment has also been
reflected in Note 20 and Note 28.
-28-

415Chapter 17 Financial statements Part5 Financial management FaHCSIA Annual Report 2008–2009
Fina
ncia
l man
agem
ent
Part 5
Notes to and forming part of the Financial Statements
Note 2:
Events After the Balance Sheet Date
There were no post balance date events that need to be disclosed in the financial statements.
-29-

416 FaHCSIA Annual Report 2008–2009 Part5 Financial management Chapter 17 Financial statements
Notes to and forming part of the Financial Statements
30 June
30 June
2009
2008
$'000
$'000
Note 3:
Income
Revenue
Note 3A: Revenue from Government
Appropriations:
Departmental outputs
1,657,750
1,441,827
Total revenue from Government
1,657,750
1,441,827
Note 3B: Sale of Goods and Rendering of Services
Rendering of services - related entities
27,452
19,843
Rendering of services - external parties
6,053
1,505
Total sale of goods and rendering of services
33,505
21,348
Note 3C: Other Revenue
Interest
-
112
Lease incentive
-
627
Other
513
791
Total other revenue
513
1,530
Gains
Note 3D: Other gains
Reversal of provision for makegood
6,933
5,495
Resources received free of charge
1,239
1,267
Assets recognised for the first time
208
4,169
Reversal of makegood asset
646
-
Total other gains
9,026
10,931
Note 3E: Foreign Exchange
Non-speculative
31
-
Total foreign exchange gains
31
-
Note 3F: Sale of Assets
Land and buildings:
Proceeds from sale
3,194
-
Carrying value of assets sold
(3,145)
-
Net gain from sale of assets
49
-
-30-

417Chapter 17 Financial statements Part5 Financial management FaHCSIA Annual Report 2008–2009
Fina
ncia
l man
agem
ent
Part 5
Notes to and forming part of the Financial Statements
30 June
30 June
2009
2008
$'000
$'000
Note 4:
Expenses
Note 4A: Employee Benefits
Wages and salaries
233,797
215,554
Superannuation
42,320
37,094
Leave and other entitlements
27,353
27,991
Separation and redundancies
3,330
3,980
Other employee benefits
9,289
7,203
Total employee benefits
316,089
291,822
Note 4B: Suppliers
Provision of goods - external parties
10,503
10,512
Rendering of services - related entities
8,570
11,278
Rendering of services - external parties
183,068
154,414
Operating lease rentals - external parties:
Minimum lease payments
48,690
37,133
Workers compensation premiums
2,457
3,446
Total supplier expenses
253,288
216,783
Note 4C: Depreciation and Amortisation
Depreciation:
Infrastructure, plant and equipment
6,303
5,364
Buildings
856
908
Total depreciation
7,159
6,272
Amortisation:
Leasehold improvements
14,968
12,415
Intangibles:
Computer software
10,328
5,689
Total amortisation
25,296
18,104
Total depreciation and amortisation
32,455
24,376
Note 4D: Finance Costs
Finance leases
546
117
Total finance costs
546
117
Note 4E: Write-Down and Impairment of Assets
Asset write-downs and impairments from:
Impairment on financial instruments
143
706
Impairment of property, plant, equipment and intangibles
1,925
3,140
Total write-down and impairment of assets
2,068
3,846
Note 4F: Losses from Assets Sales
Land and buildings
Proceeds from sale
-
2,165
Carrying value of assets sold
-
(2,645)
Total losses from assets sales
-
480
-31-
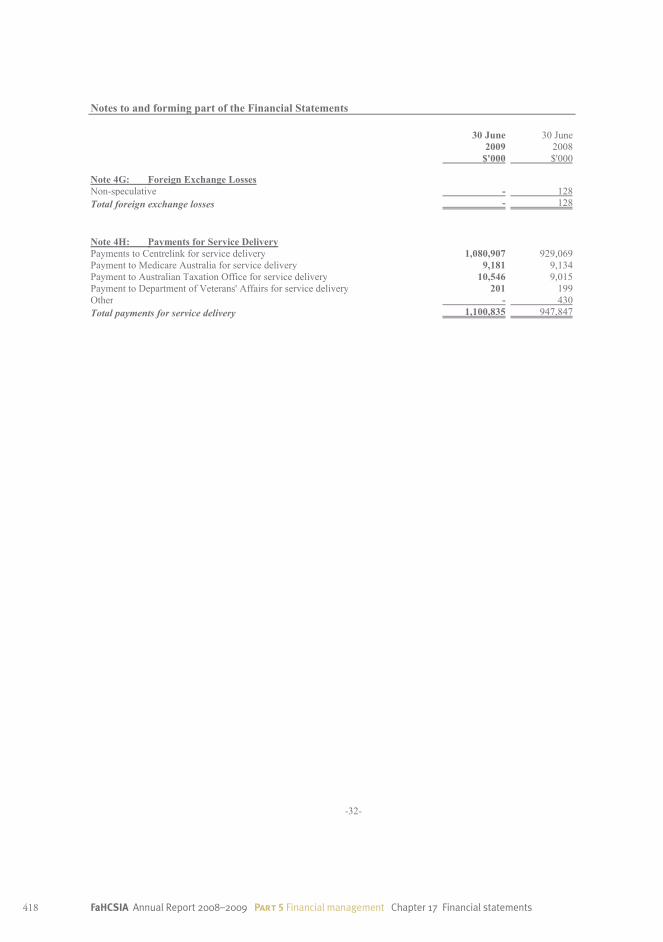
418 FaHCSIA Annual Report 2008–2009 Part5 Financial management Chapter 17 Financial statements
Notes to and forming part of the Financial Statements
30 June
30 June
2009
2008
$'000
$'000
Note 4G: Foreign Exchange Losses
Non-speculative
-
128
Total foreign exchange losses
-
128
Note 4H: Payments for Service Delivery
Payments to Centrelink for service delivery
1,080,907
929,069
Payment to Medicare Australia for service delivery
9,181
9,134
Payment to Australian Taxation Office for service delivery
10,546
9,015
Payment to Department of Veterans' Affairs for service delivery
201
199
Other
-
430
Total payments for service delivery
1,100,835
947,847
-32-

419Chapter 17 Financial statements Part5 Financial management FaHCSIA Annual Report 2008–2009
Fina
ncia
l man
agem
ent
Part 5
Notes to and forming part of the Financial Statements
30 June
30 June
2009
2008
$'000
$'000
Note 5:
Financial Assets
Note 5A: Cash and Cash Equivalents
Cash on hand
5
5
Cash at bank - Departmental
5,822
5,124
Total cash and cash equivalents
5,827
5,129
Note 5B: Trade and Other Receivables
Goods and services - related entities
7,100
4,887
Goods and services - external parties
879
1,363
Total receivables for goods and services
7,979
6,250
Appropriations receivable:
for existing outputs
137,147
79,687
for equity
-
11,531
Total appropriations receivable
137,147
91,218
GST receivable from the Australian Taxation Office
2,184
-
Other:
Other receivables
2,639
4,501
Total other receivables
2,639
4,501
Total trade and other receivables (gross)
149,949
101,969
Less impairment allowance account:
Goods and services
(466)
(870)
Total trade and other receivables (net)
149,483
101,099
Receivables are represented by:
Current
149,483
101,099
Total trade and other receivables (net)
149,483
101,099
Receivables are aged as follows:
Not overdue
142,046
100,408
Overdue by:
Less than 30 days
1,636
376
30 to 60 days
257
47
61 to 90 days
303
33
More than 90 days
5,707
1,105
Total receivables (gross)
149,949
101,969
The impairment allowance account is aged as follows:
Not overdue
-
-
Overdue by:
Less than 30 days
-
-
30 to 60 days
-
-
60 to 90 days
-
-
More than 90 days
(466)
(870)
Total impairment allowance account
(466)
(870)
-33-
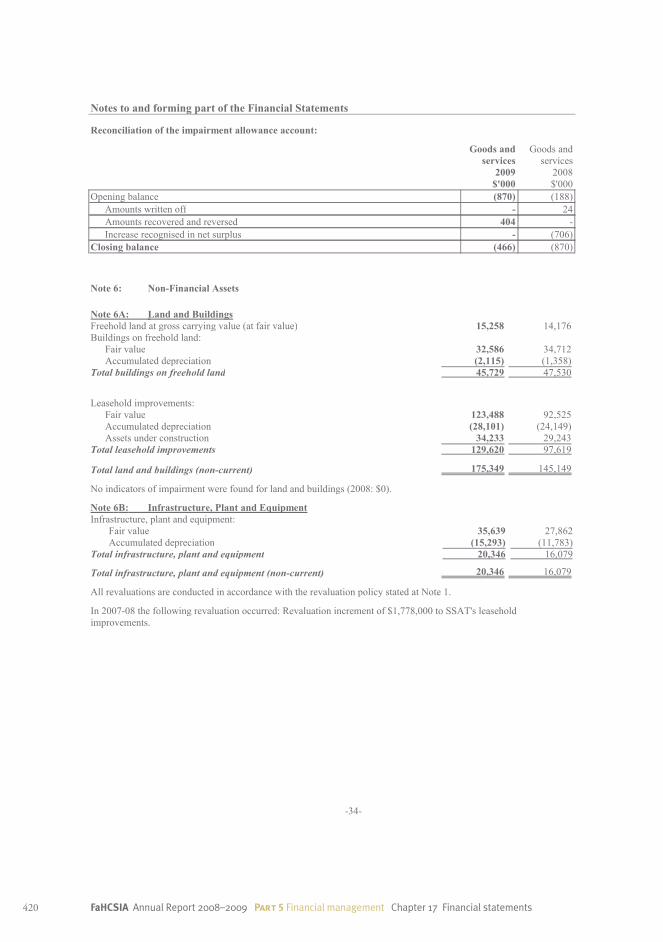
420 FaHCSIA Annual Report 2008–2009 Part5 Financial management Chapter 17 Financial statements
Notes to and forming part of the Financial Statements
Reconciliation of the impairment allowance account:
Goods and
services Goods and
services
2009
2008
$'000
$'000
Opening balance
(870)
(188)
Amounts written off
-
24
Amounts recovered and reversed
404
-
Increase recognised in net surplus
-
(706)
Closing balance
(466)
(870)
Note 6:
Non-Financial Assets
Note 6A: Land and Buildings
Freehold land at gross carrying value (at fair value)
15,258
14,176
Buildings on freehold land:
Fair value
32,586
34,712
Accumulated depreciation
(2,115)
(1,358)
Total buildings on freehold land
45,729
47,530
Leasehold improvements:
Fair value
123,488
92,525
Accumulated depreciation
(28,101)
(24,149)
Assets under construction
34,233
29,243
Total leasehold improvements
129,620
97,619
Total land and buildings (non-current)
175,349
145,149
No indicators of impairment were found for land and buildings (2008: $0).
Note 6B: Infrastructure, Plant and Equipment
Infrastructure, plant and equipment:
Fair value
35,639
27,862
Accumulated depreciation
(15,293)
(11,783)
Total infrastructure, plant and equipment
20,346
16,079
Total infrastructure, plant and equipment (non-current)
20,346
16,079
All revaluations are conducted in accordance with the revaluation policy stated at Note 1.
In 2007-08 the following revaluation occurred: Revaluation increment of $1,778,000 to SSAT's leasehold
improvements.
-34-

421Chapter 17 Financial statements Part5 Financial management FaHCSIA Annual Report 2008–2009
Fina
ncia
l man
agem
ent
Part 5
Notes to and forming part of the Financial Statements
Note 6C: Analysis of Property, Plant and Equipment
TABLE A - Reconciliation of the opening and closing balances of property, plant and equipment (2008 - 09)
Item
Land
Buildings
Total Land
& Buildings Other IP&E
Total
$'000
$'000
$'000
$'000
$'000
As at 1 July 2008
Gross book value
14,176
156,480
170,656
27,862
198,518
Accumulated depreciation/amortisation and
impairment
n/a
(25,507)
(25,507)
(11,783)
(37,290)
Net book value 1 July 2008
14,176
130,973
145,149
16,079
161,228
Additions:
By purchase
-
30,994
30,994
11,128
42,122
By recognition
-
205
205
3
208
From acquisition of entities or operations (including
restructuring)
-
6,698
6,698
-
6,698
Revaluations*
2,207
9,919
12,126
-
12,126
Depreciation/amortisation expense
n/a
(15,824)
(15,824)
(6,303)
(22,127)
Other movements (adjustments)
(175)
-
(175)
-
(175)
Disposals:
Disposals without proceeds
-
(630)
(630)
(561)
(1,191)
Disposals with proceeds
(950)
(2,244)
(3,194)
-
(3,194)
Net book value 30 June 2009
15,258
160,091
175,349
20,346
195,695
Net book value as of 30 June 2009 represented by:
Gross book value
15,258
190,307
205,565
35,639
241,204
Accumulated depreciation/amortisation and
impairment
n/a
(30,216)
(30,216)
(15,293)
(45,509)
15,258
160,091
175,349
20,346
195,695
* Please refer to FaHCSIA's revaluation policy - Note 1.17 Property, Plant and Equipment.
TABLE B - Reconciliation of the opening and closing balances of property, plant and equipment (2007 - 08)
Item
Land
Buildings
Total Land
& Buildings Other IP&E
Total
$'000
$'000
$'000
$'000
$'000
As at 1 July 2007
Gross book value
14,688
95,171
109,859
19,088
128,947
Accumulated depreciation/amortisation and
impairment
n/a
(14,156)
(14,156)
(7,029)
(21,185)
Net book value 1 July 2007
14,688
81,015
95,703
12,059
107,762
Additions:
By purchase
163
64,988
65,151
10,423
75,574
Revaluations and impairments through equity
-
1,778
1,778
-
1,778
Impairments recognised in the operating result
-
-
-
(786)
(786)
Depreciation/amortisation expense
n/a
(13,323)
(13,323)
(5,364)
(18,687)
Disposals:
Disposals without proceeds
(125)
(1,580)
(1,705)
(27)
(1,732)
Other disposals
(550)
(1,905)
(2,455)
(226)
(2,681)
Net book value 30 June 2008
14,176
130,973
145,149
16,079
161,228
Net book value as of 30 June 2008 represented by:
Gross book value
14,176
156,480
170,656
27,862
198,518
Accumulated depreciation/amortisation and
impairment
n/a
(25,507)
(25,507)
(11,783)
(37,290)
14,176
130,973
145,149
16,079
161,228
-35-

422 FaHCSIA Annual Report 2008–2009 Part5 Financial management Chapter 17 Financial statements
Notes to and forming part of the Financial Statements
30 June
30 June
2009
2008
$'000
$'000
Note 6D: Intangibles
Computer software at cost:
Internally developed - in progress
5,066
26,993
5,066
26,993
Internally developed - in use
79,545
47,934
Accumulated amortisation
(32,218)
(27,471)
47,327
20,463
Externally acquired - at cost
1,728
2,641
Accumulated amortisation
(234)
(2,277)
1,494
364
Total intangibles (non-current)
53,887
47,820
No indicators of impairment were found for intangibles.
-36-

423Chapter 17 Financial statements Part5 Financial management FaHCSIA Annual Report 2008–2009
Fina
ncia
l man
agem
ent
Part 5
Notes to and forming part of the Financial Statements
Note 6E: Analysis of Intangibles
TABLE A - Reconciliation of the opening and closing balances of intangibles (2008 - 09)
Item
Computer
software
internally
developed
Computer
software
purchased
Total
$'000
$'000
$'000
As at 1 July 2008
Gross book value
74,927
2,641
77,568
Accumulated depreciation/amortisation
(27,471)
(2,277)
(29,748)
Net book value 1 July 2008
47,456
364
47,820
Additions
By purchase or internally developed
15,594
1,359
16,953
Assets transferred out
-
-
-
Amortisation
(10,099)
(229)
(10,328)
Disposals:
Disposals without proceeds
(558)
-
(558)
Net book value 30 June 2009
52,393
1,494
53,887
Net book value as at 30 June 2009 represented by:
Gross book value
84,611
1,728
86,339
Accumulated amortisation and impairment
(32,218)
(234)
(32,452)
52,393
1,494
53,887
TABLE B - Reconciliation of the opening and closing balances of intangibles (2007 - 08)
Item
Computer
software
internally
developed
Computer
software
purchased
Total
$'000
$'000
$'000
As at 1 July 2007
Gross book value
66,721
2,272
68,993
Accumulated amortisation/impairment
(21,844)
(2,216)
(24,060)
Net book value 1 July 2007
44,877
56
44,933
Additions
By purchase or internally developed
19,857
369
20,226
Assets transferred out
(10,242)
-
(10,242)
Amortisation
(5,628)
(61)
(5,689)
Disposals without proceeds
Other disposals
(1,408)
-
(1,408)
Net book value 30 June 2008
47,456
364
47,820
Net book value as of 30 June represented by:
Gross book value
74,927
2,641
77,568
Accumulated amortisation and impairment
(27,471)
(2,277)
(29,748)
47,456
364
47,820
-37-

424 FaHCSIA Annual Report 2008–2009 Part5 Financial management Chapter 17 Financial statements
Notes to and forming part of the Financial Statements
30 June
30 June
2009
2008
$'000
$'000
Note 6F: Other Non-Financial Assets
Prepayments to Centrelink
20,848
19,745
Other prepayments
2,895
3,208
Total other non-financial assets
23,743
22,953
All other non-financial assets are current assets.
No indicators of impairment were found for other non-financial assets.
Note 7:
Payables
Note 7A: Suppliers
Trade creditors
42,576
47,540
Total supplier payables
42,576
47,540
Supplier payables - related entities are represented by:
Current
8,048
11,820
Non-current
-
-
Supplier payables - external parties are represented by:
Current
34,528
35,720
Non-Current
-
-
Total supplier payables
42,576
47,540
Settlement is usually made net 30 days.
Note 7B: Other Payables
GST payable to the Australian Taxation Office
-
2,922
Salaries and wages
3,766
2,371
Superannuation
639
391
Centrelink payable
69,301
-
Lease incentive
7,553
8,416
Other payables
6,366
4,042
Total other payables
87,625
18,142
Other payables, with the exception of $6.7 million of lease incentives (2008: $7.5 million), are current liabilities.
Note: Comparatives have changed due to Finance Ministers Orders for this reporting period.
-38-
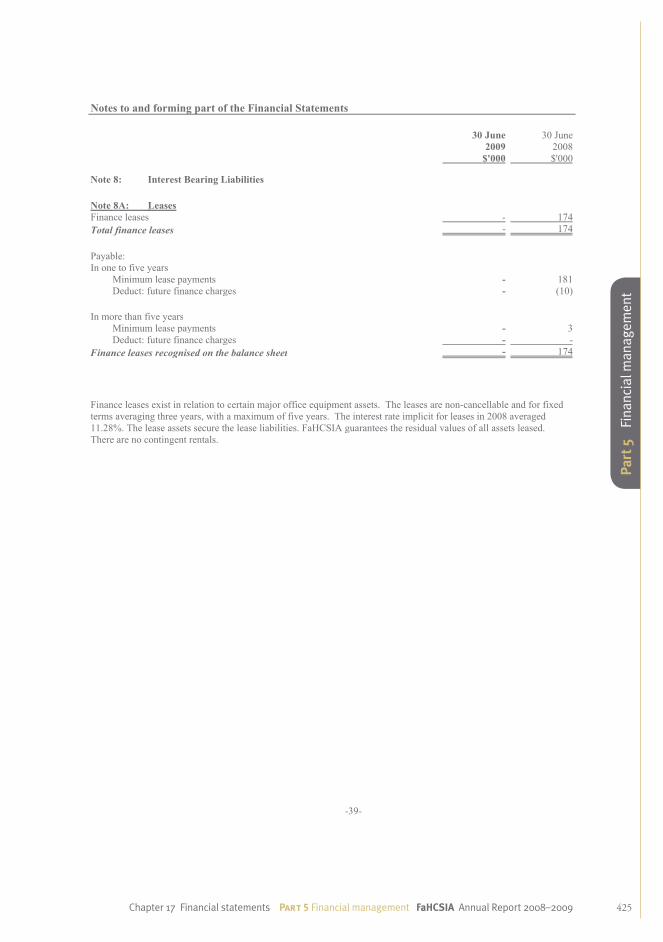
425Chapter 17 Financial statements Part5 Financial management FaHCSIA Annual Report 2008–2009
Fina
ncia
l man
agem
ent
Part 5
Notes to and forming part of the Financial Statements
30 June
30 June
2009
2008
$'000
$'000
Note 8:
Interest Bearing Liabilities
Note 8A: Leases
Finance leases
-
174
Total finance leases
-
174
Payable:
In one to five years
Minimum lease payments
-
181
Deduct: future finance charges
-
(10)
In more than five years
Minimum lease payments
-
3
Deduct: future finance charges
-
-
Finance leases recognised on the balance sheet
-
174
Finance leases exist in relation to certain major office equipment assets. The leases are non-cancellable and for fixed
terms averaging three years, with a maximum of five years. The interest rate implicit for leases in 2008 averaged
11.28%. The lease assets secure the lease liabilities. FaHCSIA guarantees the residual values of all assets leased.
There are no contingent rentals.
-39-

426 FaHCSIA Annual Report 2008–2009 Part5 Financial management Chapter 17 Financial statements
Notes to and forming part of the Financial Statements
30 June
30 June
2009
2008
$'000
$'000
Note 9:
Provisions
Note 9A: Employee Provisions
Leave
78,143
66,729
Total employee provisions
78,143
66,729
Employee provisions are represented by:
Current
66,506
60,151
Non-current
11,637
6,578
Total employee provisions
78,143
66,729
The classification of current employee provisions includes amounts for which there is not an unconditional right to
defer settlement by one year, hence in the case of employee provisions the above classification does not represent the
amount expected to be settled within one year of reporting date. Employee provisions expected to be settled in twelve
months from the reporting date were $25.33 million (2008: $30.70 million), and in excess of one year $52.81 million
(2008: $36.03 million).
Note 9B: Other Provisions
Makegood provisions
3,237
9,765
Total other provisions
3,237
9,765
Other provisions are represented by:
Current
820
2,583
Non-current
2,417
7,182
Total other provisions
3,237
9,765
Make good
provisions
30 June 2009 Total
30 June 2009
$'000
$'000
Carrying amount 1 July 2008
9,765
9,765
Additional provisions made
40
40
Amount used
-
-
Amounts reversed
(6,933)
(6,933)
Unwinding of discount or change in discount rate
365
365
Closing balance 2009
3,237
3,237
Note: Comparatives have changed due to Finance Ministers Orders for this reporting period.
-40-

427Chapter 17 Financial statements Part5 Financial management FaHCSIA Annual Report 2008–2009
Fina
ncia
l man
agem
ent
Part 5
Notes to and forming part of the Financial Statements
30 June
30 June
2009
2008
$'000
$'000
Note 10:
Restructuring
Note 10A: Departmental Restructuring
As a result of administrative arrangements, FaHCSIA assumed responsibility for the following functions:
From the then Department of Employment and Workplace Relations (DEWR):
- Disability Support Pension
- Community Development and Employment Program
As a result of an Australian Government decision on 1 October 2007, FaHCSIA assumed responsibility for the
following assets:
- Demountables previously the responsibility of the Department of Immigration and Citizenship (DIAC),
comprising demountable buildings and equipment with the effective date of 1 September 2008.
In respect of functions assumed, the net book values of assets and liabilities transferred to FaHCSIA for no
consideration and recognised as at 30 June 2009 were:
Total assets recognised from DEWR
-
3,011
Total assets recognised from DIAC
6,698
2,142
Total liabilities recognised from DEWR
-
(2,203)
Net assets assumed
6,698
2,950
As a result of the restructuring of administrative arrangements, FaHCSIA relinquished responsibility for the following
functions which transferred to the Department of Education, Employment and Workplace Relations (DEEWR):
- early childhood and child care functions; and
- the majority of youth programs and policy functions.
FaHCSIA also relinquished responsibility for the following function which transferred to the Department of Prime
Minister and Cabinet (PM&C);
- Family Impact Statements.
In respect of the functions assumed, the net book values of assets and liabilities relinquished by FaHCSIA for no
consideration and recognised as at 30 April 2008 were:
Total assets relinquished to DEEWR
-
(17,157)
Total liabilities relinquished to DEEWR
-
7,990
Total liabilities relinquished to PM&C
-
90
Net assets relinquished from all entities
-
(9,077)
Net increase in net assets during the year
6,698
(6,127)
-41-

428 FaHCSIA Annual Report 2008–2009 Part5 Financial management Chapter 17 Financial statements
Notes to and forming part of the Financial Statements
30 June
30 June
2009
2008
$'000
$'000
Note 10
Restructuring (continued)
Income and expenses for the functions assumed by FaHCSIA were as follows:
Income
Recognised by DEWR
-
(52,123)
Recognised by FaHCSIA
-
(30,933)
Total Income
-
(83,056)
Expenses
Recognised by DEWR
-
52,123
Recognised by FaHCSIA
-
30,303
Total Expenses
-
82,426
-42-

429Chapter 17 Financial statements Part5 Financial management FaHCSIA Annual Report 2008–2009
Fina
ncia
l man
agem
ent
Part 5
Notes to and forming part of the Financial Statements
30 June
30 June
2009
2008
$'000
$'000
Note 10
Restructuring (continued)
Note 10B: Administered Restructuring
As a result of the Administrative Arrangements Order issued on 3 December 2007, FaHCSIA assumed responsibility
for the following programs that were previously the responsibility of the former DEWR:
- Disability Support Pension
- Community Development and Employment Program
In respect of functions assumed, the net book values of administered assets and liabilities transferred to FaHCSIA for
no consideration and recognised as at the date of transfer were:
Total assets recognised
-
136,702
Total liabilities recognised
-
(127,251)
Net assets assumed
-
9,451
As a result of the revised Administrative Arrangements Order issued on 25 January 2008, FaHCSIA relinquished
responsibility for the following programs which transferred to DEEWR:
- Child Care payments and Support for Child Care programs; and
- the majority of Youth Engagement programs.
In respect of functions relinquished, the net book values of assets and liabilities transferred to the Agency for no
consideration and recognised as at the date of transfer were:
Total assets relinquished
-
(31,495)
Total liabilities relinquished
-
499,269
Net assets relinquished
-
467,774
Net increase in net assets during the year
-
477,225
Administered revenues and expenses for the full year for the functions assumed by FaHCSIA are as follows:
Income
Recognised by DEWR
-
(8,917)
Recognised by FaHCSIA
-
(19,432)
Total Income
-
(28,349)
Expenses
Recognised by DEWR
-
4,002,131
Recognised by FaHCSIA
-
5,733,574
Total Expenses
-
9,735,705
-43-

430 FaHCSIA Annual Report 2008–2009 Part5 Financial management Chapter 17 Financial statements
Notes to and forming part of the Financial Statements
30 June
30 June
2009
2008
$'000
$'000
Note 11:
Cash Flow Reconciliation
Reconciliation of cash and cash equivalents as per Balance Sheet to Cash Flow Statement
Report cash and cash equivalent as per:
Cash Flow Statement
5,827
5,129
Balance Sheet
5,827
5,129
Difference
-
-
Reconciliation of operating result to net cash from operating activities:
Operating result
(4,407)
(9,763)
Depreciation/amortisation
32,455
24,376
Net write down of non financial assets
1,925
3,903
Gain on disposal of assets
(49)
(566)
Movement in equity OPA receivable not classified as operating
(11,531)
11,154
Gain on makegood (net of borrowing costs)
(6,933)
(5,495)
Assets recognised for the first time
(208)
(4,169)
Contractor capitalisation not classified as operating
7,579
-
Reversal of makegood asset
(646)
-
(Increase) / decrease in net receivables
(48,384)
17,637
Increase / (decrease) in prepayments
(790)
893
Increase / (decrease) in employee provisions
11,414
5,063
(Increase) / decrease in supplier payables and provisions
57,991
7,765
Increase / (decrease) in interest bearing liabilities
(174)
(382)
Net cash from operating activities
38,242
50,416
Note 12:
Contingent Liabilities and Assets
Quantifiable Contingencies
The Schedule of Contingencies reports contingent liabilities in respect of claims for damages/costs of $0.175 million
(2008: $0.195 million). The amount represents an estimate of FaHCSIA’s liability based on precedent cases.
FaHCSIA is defending the claims.
The Schedule also reports contingent assets in respect of claims for damages/costs of $0.548 million (2008: $0.811
million).
Unquantifiable Contingencies
At 30 June 2009, FaHCSIA had no unquantifiable contingencies.
Remote Contingencies
FaHCSIA has no remote contingencies.
-44-

431Chapter 17 Financial statements Part5 Financial management FaHCSIA Annual Report 2008–2009
Fina
ncia
l man
agem
ent
Part 5
Notes to and forming part of the Financial Statements
Note 13:
Senior Executive Remuneration
2009
2008
The number of senior executives who received or were due to receive total
remuneration of $130,000 or more:
$130 000
to
$144 999
8
3
$145 000
to
$159 999
3
11
$160 000
to
$174 999
8
12
$175 000
to
$189 999
22
19
$190 000
to
$204 999
16
15
$205 000
to
$219 999
22
11
$220 000
to
$234 999
8
9
$235 000
to
$249 999
10
6
$250 000
to
$264 999
6
7
$265 000
to
$279 999
7
3
$280 000
to
$294 999
2
-
$295 000
to
$309 999
2
2
$310 000
to
$324 999
-
2
$340 000
to
$354 999
3
-
$370 000
to
$384 999
1
-
$385 000
to
$399 999
-
1
$475 000
to
$489 999
-
1
$625 000
to
$639 999
1
-
Total
119
102
The aggregate amount of total remuneration of senior executives shown above.
$25,730,033
$21,130,613
The aggregate amount of separation and redundancy/termination benefit payments
during the year to executives shown above.
$737,516
-
The number of Senior Executives eligible for inclusion in this note has increased
since last financial year in line with the increased functions performed by the
Department.
Note 14:
Remuneration of Auditors
2009
2008
$
$
Financial statement audit services, with the exception of the audit of the Aboriginal
and Torres Strait Islander Land Account, are provided free of charge to the Agency.
The fair value of audit services provided was:
Audit services for FaHCSIA
1,200,000
1,175,000
Audit services for the Aboriginals Benefit Account
39,000
40,000
Audit services for the Aboriginal and Torres Strait Islander Land Account
23,000
25,000
1,262,000
1,240,000
No other services were provided by the Auditor-General.
-45-

432 FaHCSIA Annual Report 2008–2009 Part5 Financial management Chapter 17 Financial statements
Notes to and forming part of the Financial Statements
30 June
30 June
2009
2008
$'000
$'000
Note 15:
Financial Instruments
Note 15A: Categories of Financial Instruments
Financial Assets
Loans and receivables
Cash and cash equivalents
5,827
5,129
Trade receivables
7,979
6,250
Less: impairment allowance account
(466)
(870)
Other receivables
2,639
4,501
Carrying amount of financial assets
15,979
15,010
Financial Liabilities
At amortised cost:
Finance leases
-
174
Payables - suppliers
42,576
47,540
Other payables
83,220
12,458
Carrying amount of financial liabilities
125,796
60,172
Note 15B: Net Income and Expense from Financial Assets
Loans and receivables
Interest revenue
-
112
Exchange gains
31
-
Net gain from financial assets
31
112
Note 15C: Net Income and Expense from Financial Liabilities
Financial liabilities - at amortised cost
Interest expense
546
117
Exchange loss
-
128
Net gain from financial liabilities
546
245
Note 15D: Fair Value of Financial Instruments
Carrying
amount
Fair Value Carrying
amount
Fair value
2009
2009
2008
2008
$'000
$'000
$'000
$'000
Financial Liabilities
Finance Lease
-
-
174
174
Total
-
-
174
174
-46-

433Chapter 17 Financial statements Part5 Financial management FaHCSIA Annual Report 2008–2009
Fina
ncia
l man
agem
ent
Part 5
Notes to and forming part of the Financial Statements
Note 15E: Credit Risk
FaHCSIA is exposed to minimal credit risk as loans and receivables are cash and trade receivables. The maximum
exposure to credit risk is the risk that arises from potential default of a debtor. This amount is equal to the total
amount of trade receivables (2009: $7.979 million and 2008: $6.250 million). FaHCSIA has assessed the risk of the
default on payment and has allocated $0.466 million in 2009 (2008: $0.870 million) to an impairment allowance
account.
FaHCSIA manages its credit risk by undertaking background and credit checks prior to allowing a debtor relationship.
In addition, FaHCSIA has policies and procedures that guide employees debt recovery techniques that are to be
applied.
FaHCSIA holds no collateral to mitigate against credit risk.
The following table illustrates FaHCSIA's gross exposure to credit risk, excluding any collateral or credit
enhancement
Not Past Due
Nor Impaired
2009
Not past Due
Nor Impaired
2008
$'000
$'000
Loans and receivables
Cash and cash equivalents
5,827
5,129
Trade receivables
76
4,689
Less: impairment allowance account
(466)
(870)
Other receivables
2,639
4,501
Total
8,076
13,449
Credit quality of financial instruments not past due or individually determined as impaired
Not Past Due
Nor Impaired Not Past Due
Nor Impaired Past due or
impaired Past due or
impaired
2009
2008
2009
2008
$'000
$'000
$'000
$'000
Loans and receivables
Trade receivables
76
4,689
7,903
1,561
Total
76
4,689
7,903
1,561
Ageing of financial assets that are past due but not impaired for 2009
0 to 30 days
31 to 60 days
61 to 90 days
90+ days
Total
$'000
$'000
$'000
$'000
$'000
Loans and receivables
Trade receivables
1,636
257
303
5,707
7,903
Total
1,636
257
303
5,707
7,903
Ageing of financial assets that are past due but not impaired for 2008
0 to 30 days
31 to 60 days
61 to 90 days
90+ days
Total
$'000
$'000
$'000
$'000
$'000
Loans and receivables
Trade receivables
376
47
33
1,105
1,561
Total
376
47
33
1,105
1,561
-47-

434 FaHCSIA Annual Report 2008–2009 Part5 Financial management Chapter 17 Financial statements
Notes to and forming part of the Financial Statements
Note 15F: Liquidity Risk
FaHCSIA's financial liabilities are payables, finance leases and other interest bearing liabilities. The exposure to
liquidity risk is based on the notion that FaHCSIA will encounter difficulty in meeting its obligations associated with
financial liabilities. This is highly unlikely due to appropriation funding and mechanisms available to FaHCSIA (e.g.
Advance to the Finance Minister) and internal policies and procedures put in place to ensure there are appropriate
resources to meet its financial obligations.
The following tables illustrates the maturities for financial liabilities:
Maturities for financial liabilities 2009
On demand within 1
year
1 to 2 years
2 to 5 years
> 5 years
Total
2009
2009
2009
2009
2009
2009
$'000
$'000
$'000
$'000
$'000
$'000
Other Liabilities
Trade creditors
-
42,576
-
-
-
42,576
Other payables
-
83,220
-
-
-
83,220
Total
-
125,796
-
-
-
125,796
Maturities for financial liabilities 2008
On demand within 1
year
1 to 2 years
2 to 5 years
> 5 years
Total
2008
2008
2008
2008
2008
2008
$'000
$'000
$'000
$'000
$'000
$'000
Other Liabilities
Finance leases
-
171
-
3
-
174
Trade creditors
-
47,540
-
-
-
47,540
Other payables
-
12,458
-
-
-
12,458
Total
-
60,169
-
3
-
60,172
FaHCSIA is appropriated funding from the Australian Government. FaHCSIA manages its budgeted funds to ensure it
has adequate funds to meet payments as they fall due. In addition, FaHCSIA has policies in place to ensure timely
payments are made in accordance with Government Reporting requirements, FaHCSIA also reports all late payments
to small and medium enterprises to the Office of Small Business on an annual basis.
-48-

435Chapter 17 Financial statements Part5 Financial management FaHCSIA Annual Report 2008–2009
Fina
ncia
l man
agem
ent
Part 5
Notes to and forming part of the Financial Statements
30 June
30 June
2009
2008
$'000
$'000
Note 16:
Income Administered on Behalf of Government
Note 16A: Attorney-General's Department Revenue
Attorney-General's Department revenue
-
101,067
Total Attorney-General's Department revenue
-
101,067
Note 16B: Recoveries
Personal benefits recoveries
152,585
158,447
Total recoveries
152,585
158,447
Note 16C: Interest
Interest on Advance
801
755
Interest on Investments
125,759
123,616
Interest from Trust Account
139
-
Total interest
126,699
124,371
Note 16D: NZ Reciprocal Agreement
NZ Reciprocal Agreement
46,179
51,969
Total NZ Reciprocal Agreement
46,179
51,969
Note 16E: Special Account Revenue
Northern Territory Flexible Funding Pool Special Account
105,599
46,462
Income Management Special Account
166,870
33,896
Other
12,363
3,444
Total special account revenue
284,832
83,802
Note 16F: Other Revenue
Other
11,561
11,864
Assets recognised for the first time
2,923
-
Total other revenue
14,484
11,864
Note 16G: Write Back of Impairment Allowance for Personal Benefits
Write back of impairment allowance for personal benefits
34,953
47,955
Total write back of impairment allowance for personal benefits
34,953
47,955
-49-

436 FaHCSIA Annual Report 2008–2009 Part5 Financial management Chapter 17 Financial statements
Notes to and forming part of the Financial Statements
30 June
30 June
2009
2008
$'000
$'000
Note 17:
Expenses Administered on Behalf of Government
Expenses
Note 17A: Subsidies
Payable to external entities:
External entities
12,850
12,862
Total subsidies
12,850
12,862
Note 17B: Personal Benefits
Indirect:
Indirect
-
15,402
Total personal benefits indirect
-
15,402
Direct:
Age Pension
28,094,975
24,574,327
Family Tax Benefit
17,305,181
14,217,744
Disability Support Pension
10,911,225
5,520,372
Education Entry Payment
25,534
-
Farmers Hardship Payment
20,669
-
Childcare Benefits
-
1,073,847
Carer Allowance - Adult and Child
1,943,762
1,590,643
Carer Payment
1,937,124
1,690,299
Emergency Relief
51,690
33,189
Wife Pension (Disability Support Pension)
209,348
224,483
Child Care Tax Rebate
-
396,177
Australian Government Disaster Recovery Payment
114,567
39,053
Families Payments
3,943,315
-
Back to School Bonus
2,660,389
-
Maternity Payments
1,449,998
1,274,320
Wife Pension (Age)
157,625
165,711
Special Benefit
65,209
63,970
Training and Learning
43,238
-
Single Income Family Bonus
1,362,277
-
Career Supplement
408,025
-
Utilities Allowance
1,146,843
613,639
Senior Concession Allowance
465,027
235,238
Ex Gratia Payments
33,434
9,269
Other
32,930
30,171
Total personal benefits
72,382,385
51,752,452
Note 17C: Suppliers
Supply of goods and services - external parties
115,273
155,338
Supply of goods and services - related entities
937
6,166
Total suppliers
116,210
161,504
Note 17D: Grants
Public sector:
State and Territory Governments
1,394,646
2,374,614
Local Governments
80,022
73,953
Australian Government Entities (related entities)
22,694
24,318
Private sector:
External entities
46,507
23,607
Non-profit organisations
1,176,110
1,200,513
Total grants
2,719,979
3,697,005
-50-

437Chapter 17 Financial statements Part5 Financial management FaHCSIA Annual Report 2008–2009
Fina
ncia
l man
agem
ent
Part 5
Notes to and forming part of the Financial Statements
30 June
30 June
2009
2008
$'000
$'000
Note 17:
Expenses Administered on Behalf of Government (continued)
Note 17E: Write-Down and Impairment of Assets
Financial assets
Receivables (impairment allowance)
130
173
Other
16
156
Total write-down and impairment of assets
146
329
Note 17F: Payments to CAC Act Bodies
Payments to Torres Strait Regional Authority
51,904
-
Payments to Aboriginal Hostels Limited
34,281
-
Payments to Indigenous Business Australia
37,875
-
Total payments to CAC Act Bodies
124,060
-
Note 17G: Other Expenses
Royalty equivalent payments
90,545
45,930
Income Management Special Account expense
167,903
30,661
Special Accounts expense
8,037
3,136
Mining Withholding Tax
3,720
1,873
Other
8,154
7,326
Payments to Indigenous Land Corporation
44,789
-
Total other expenses
323,148
88,926
Note 17H: Northern Territory Flexible Funding Pool Special Account
Payments from the Northern Territory Flexible Funding Pool Special Account to or
on behalf of agencies
58,235
17,727
Total Northern Territory Flexible Funding Pool Special Account
58,235
17,727
-51-

438 FaHCSIA Annual Report 2008–2009 Part5 Financial management Chapter 17 Financial statements
Notes to and forming part of the Financial Statements
30 June
30 June
2009
2008
$'000
$'000
Note 18:
Assets Administered on Behalf of Government
Financial Assets
Note 18A: Cash and Cash Equivalents
Administered bank account - Department of Families, Housing, Community Services
and Indigenous Affairs
3,903
5,869
Aboriginals Benefit Account
19,633
5,772
Aboriginal and Torres Strait Islander Land Account
321
166
Total cash and cash equivalents
23,857
11,807
Note 18B: Receivables
Personal benefits - direct
1,417,295
1,337,724
Other loans
17,911
14,791
Other
67,537
85,564
Total receivables (gross)
1,502,743
1,438,079
Less: Impairment allowance account:
Personal benefits - direct
(414,591)
(449,544)
Other receivables
(162)
(204)
Total impairment allowance account
(414,753)
(449,748)
Total receivables (net)
1,087,990
988,331
Receivables were aged as follows:
Not overdue
944,203
740,735
Overdue by:
Less than 30 days
8,357
23,073
30 to 60 days
6,862
9,456
60 to 90 days
5,991
9,920
More than 90 days
537,330
654,895
Total receivables (gross)
1,502,743
1,438,079
The impairment allowance account is aged as follows:
Not overdue
(392,959)
(409,467)
Overdue by:
Less than 30 days
(128)
(607)
30 to 60 days
(105)
(289)
60 to 90 days
(92)
(303)
More than 90 days
(21,469)
(39,082)
Total impairment allowance account
(414,753)
(449,748)
Reconciliation of the impairment allowance account:
Other
Receivables Other
Receivables
2009
2008
$'000
$'000
Opening balance
449,748
464,485
Decrease recognised in net surplus
(34,995)
(14,737)
Closing balance
414,753
449,748
-52-
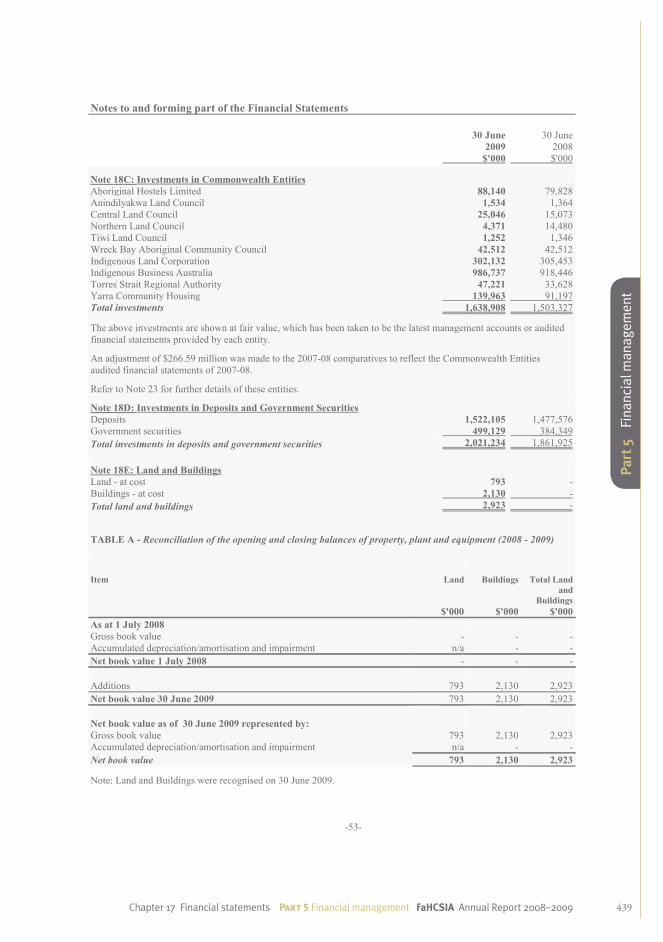
439Chapter 17 Financial statements Part5 Financial management FaHCSIA Annual Report 2008–2009
Fina
ncia
l man
agem
ent
Part 5
Notes to and forming part of the Financial Statements
30 June
30 June
2009
2008
$'000
$'000
Note 18C: Investments in Commonwealth Entities
Aboriginal Hostels Limited
88,140
79,828
Anindilyakwa Land Council
1,534
1,364
Central Land Council
25,046
15,073
Northern Land Council
4,371
14,480
Tiwi Land Council
1,252
1,346
Wreck Bay Aboriginal Community Council
42,512
42,512
Indigenous Land Corporation
302,132
305,453
Indigenous Business Australia
986,737
918,446
Torres Strait Regional Authority
47,221
33,628
Yarra Community Housing
139,963
91,197
Total investments
1,638,908
1,503,327
The above investments are shown at fair value, which has been taken to be the latest management accounts or audited
financial statements provided by each entity.
An adjustment of $266.59 million was made to the 2007-08 comparatives to reflect the Commonwealth Entities
audited financial statements of 2007-08.
Refer to Note 23 for further details of these entities.
Note 18D: Investments in Deposits and Government Securities
Deposits
1,522,105
1,477,576
Government securities
499,129
384,349
Total investments in deposits and government securities
2,021,234
1,861,925
Note 18E: Land and Buildings
Land - at cost
793
-
Buildings - at cost
2,130
-
Total land and buildings
2,923
-
TABLE A - Reconciliation of the opening and closing balances of property, plant and equipment (2008 - 2009)
Item
Land
Buildings
Total Land
and
Buildings
$'000
$'000
$'000
As at 1 July 2008
Gross book value
-
-
-
Accumulated depreciation/amortisation and impairment
n/a
-
-
Net book value 1 July 2008
-
-
-
Additions
793
2,130
2,923
Net book value 30 June 2009
793
2,130
2,923
Net book value as of 30 June 2009 represented by:
Gross book value
793
2,130
2,923
Accumulated depreciation/amortisation and impairment
n/a
-
-
Net book value
793
2,130
2,923
Note: Land and Buildings were recognised on 30 June 2009.
-53-

440 FaHCSIA Annual Report 2008–2009 Part5 Financial management Chapter 17 Financial statements
Notes to and forming part of the Financial Statements
30 June
30 June
2009
2008
$'000
$'000
Note 18F: Other Non-Financial Assets
Prepayments
8,724
5,204
Prepayments - grants
2,775
-
Income management vouchers
1,071
1,861
Total other non-financial assets
12,570
7,065
Note 19:
Liabilities Administered on Behalf of Government
Provisions
Note 19A: Personal Benefits Provision
Family Tax Benefit
5,067,237
2,732,763
Pension Bonus Scheme
557,000
439,000
Total personal benefits provision
5,624,237
3,171,763
Payables
Note 19B: Personal Benefits
Personal benefits - current
2,183,714
1,040,942
Total personal benefits
2,183,714
1,040,942
Note 19C: Grants
Public sector:
State and Territory Governments
7,632
1,049
Local Government
1,595
-
Private sector:
Non-profit organisations
1,591
1,993
Other
3,786
2,346
Total grants
14,604
5,388
All grants are to entities that are not part of the Australian Government. Settlement is usually made according to the
terms and conditions of each grant. This is usually within 30 days of performance or eligibility.
Note 19D: Suppliers
Payables to land councils
8,543
8,298
Creditors
14,658
28,606
Total suppliers
23,201
36,904
Settlement is usually made net 30 days.
-54-

441Chapter 17 Financial statements Part5 Financial management FaHCSIA Annual Report 2008–2009
Fina
ncia
l man
agem
ent
Part 5
Notes to and forming part of the Financial Statements
30 June
30 June
2009
2008
$'000
$'000
Note 20:
Administered Reconciliation Table
Opening administered assets less administered liabilities as at 1 July
117,458
(1,013,080)
Adjustment for change in accounting policies
-
-
Adjustments for errors
-
-
Adjusted opening administered assets less administered liabilities
117,458
(1,013,080)
Plus:
Administered income
659,733
579,475
Less:
Administered expenses (non CAC)
(75,612,953)
(55,746,207)
Payments to CAC Act bodies
(124,060)
-
Administered transfers to/from Australian Government:
Appropriation transfers from OPA:
Annual appropriations for administered expenses (non CAC)
3,227,201
4,020,245
Annual appropriations for payment to CAC Act bodies
124,060
-
Special appropriations (unlimited)
69,185,885
51,367,547
Transfers to OPA
(449,682)
(327,323)
Restructuring
-
477,225
Transfer of Australian Institute of Family Studies investment
-
(1,751)
Transfer of Indigenous Business Australia
-
721,213
Equity injection for CAC Act bodies
47,980
-
Centrelink Receipts
(298,083)
(272,180)
Other non-cash items recognised by FaHCSIA
(31,663)
(11,897)
Administered revaluations taken to reserves
90,601
266,360
Other gains
5,249
57,831
Closing administered assets less administered liabilities as at 30 June
(3,058,274)
117,458
Note 21:
Administered Contingent Liabilities
Quantifiable Administered Contingencies
There are a number of Act of Grace Payment requests currently being considered by the Finance Minister under s.33 of
the FMA Act. The outcomes of these requests are estimated to be $0.129 million (2007-08: $0.352 million).
Unquantifiable Administered Contingencies
There are currently a number of cases before both the Administrative Appeals Tribunal (AAT) and the Social Security
Appeals Tribunal (SSAT), for which the outcomes are not yet known or able to be quantified. These cases relate to
appeals regarding income support payments and other payments under the social security legislation.
Remote Administered Contingencies
There are no known remote administered contingencies at 30 June 2009 (2008: $0).
Note 22:
Administered Contingent Assets
Quantifiable Administered Contingencies
There are no contingent assets in respect of damages/costs at 30 June 2009 (2008: $0).
Remote Administered Contingencies
There are no known remote administered contingencies at 30 June 2009 (2008: $0).
-55-

442 FaHCSIA Annual Report 2008–2009 Part5 Financial management Chapter 17 Financial statements
Notes to and forming part of the Financial Statements
Note 23:
Administered Investments
The principal activities of each of FaHCSIA's Administered Investments are as follows:
The Commonwealth has 100% of the equity interest in Aboriginal Hostels Limited (AHL). The principal activity of
AHL is to provide temporary accommodation to Aboriginal and Torres Strait Islander people through a national
network of hostels.
The Commonwealth has 100% of the equity interest in each of the following Aboriginal Land Councils:
- Anindilyakwa Land Council
- Central Land Council
- Northern Land Council
- Tiwi Land Council
- Wreck Bay Community Council
The principal activity of these Land Councils is to represent the Aboriginal peoples living in the area of the Land
Council in the management of Aboriginal land in the area, and in relation to legislation concerning that land; consult
and protect the interests of traditional owners and take measures to assist in the protection of sacred sites in the area of
the Land Council.
The Commonwealth has 100% of the equity interest in the Indigenous Land Corporation. The principal activity of the
Indigenous Land Corporation is to provide economic, environmental, social and cultural benefits for Aboriginal
persons and Torres Strait Islanders by assisting in the acquisition and management of an Indigenous Land base.
The Commonwealth has 100% of the equity interest in Indigenous Business Australia. The principle activity of
Indigenous Business Australia is to engage in commercial activities and promote and encourage Aboriginal and Torres
Strait Islander self-management and economic self-sufficiency.
The Commonwealth has 100% of the equity interest in the Torres Strait Regional Authority. The principal activity of
the Torres Strait Regional Authority is to stimulate the economic advancement of Aboriginal and Torres Strait Islander
peoples by investing in sound commercial ventures and encouraging and supporting Indigenous participation.
The Commonwealth has an interest in a property occupied by Yarra Community Housing located in Melbourne. The
principal activity of the entity is for the provision of community housing facilities. The Commonwealth owns 31% of
the unimproved market value of the land. The equity in this property is secured by a deed of agreement between the
Commonwealth and Yarra Community Housing Ltd, with the Commonwealth having a controlling interest over the use
of the property.
-56-

443Chapter 17 Financial statements Part5 Financial management FaHCSIA Annual Report 2008–2009
Fina
ncia
l man
agem
ent
Part 5
Notes to and forming part of the Financial Statements
30 June
30 June
2009
2008
$'000
$'000
Note 24:
Administered Financial Instruments
Note 24A: Categories of Financial Instruments
Financial Assets
Held-to-maturity:
Bank Term Deposits
1,378,867
368,104
Territory Insurance Office and Banking
22,000
22,000
Interest Receivable (Amortised Cost)
7,529
2,608
Bank issued transferable certificates of deposits
113,709
766,773
Capital indexed bonds
499,129
384,349
Nominal bonds
-
318,091
2,021,234
1,861,925
Loans and receivables
Cash and cash equivalents
23,857
11,807
Trade receivables
16,261
16,229
Other receivables
18,987
20,063
Less: Impairment allowance account
(162)
(204)
Advances and loans
17,911
14,792
Interest receivable
53
1
76,907
62,688
Carrying amount of financial assets
2,098,141
1,924,613
Financial Liabilities
Other Liabilities
Trade creditors
23,201
36,862
Grants payable
14,604
5,389
Carrying amount of financial liabilities
37,805
42,251
Note 24B: Net Income and Expense from Financial Assets
Held-to-maturity
Interest revenue
119,745
119,526
Net gain held-to-maturity
119,745
119,526
Loans and receivables
Interest revenue
6,153
4,090
Net gain loans and receivables
6,153
4,090
Net gain from financial assets
125,898
123,616
The above net gain is from financial assets not at fair value from profit and loss.
-57-

444 FaHCSIA Annual Report 2008–2009 Part5 Financial management Chapter 17 Financial statements
Notes to and forming part of the Financial Statements
Note 24C: Fair Value of Financial Instruments
Carrying
amount
Fair value Carrying
amount
Fair value
2009
2009
2008
2008
$'000
$'000
$'000
$'000
Financial Assets
Bank Term Deposits
1,378,867
1,378,867
368,104
368,104
Territory Insurance Office and Banking
22,000
22,000
22,000
22,000
Interest Receivable (Amortised Cost)
7,529
7,529
2,608
2,608
Bank issued transferable certificates of deposits
113,709
113,709
766,773
766,773
Capital indexed bonds
499,129
492,205
384,349
364,718
Nominal bonds
-
-
318,091
309,028
Cash and cash equivalents
23,857
23,857
11,807
11,807
Trade receivables
16,261
16,261
16,229
16,229
Other receivables
18,987
18,987
20,063
20,063
Less: Impairment allowance account
(162)
(162)
(204)
(204)
Advances and loans
17,911
17,911
14,792
14,792
Interest Receivable
53
53
1
1
Total
2,098,141
2,091,217
1,924,613
1,895,919
Financial Liabilities
Trade creditors
23,201
23,201
36,862
36,862
Grants payable
14,604
14,604
5,389
5,389
Total
37,805
37,805
42,251
42,251
Valuation Method used for determining the fair value of financial instruments
The following table identifies those assets and liabilities (those at fair value through profit and loss or available for
sale) carried at fair value (above) whether fair value was obtained by reference to market prices or by a valuation
technique that employs observable market transactions, or one that uses non-observable market inputs to determine a
fair value.
Valuation technique
utilising
Market values
Market inputs Non-market
inputs
Total
$'000
$'000
$'000
$'000
Financial assets at fair value
Bank Term Deposits
-
-
1,378,867
1,378,867
Territory Insurance Office and Banking
-
-
22,000
22,000
Interest Receivable (Amortised Cost)
-
-
7,529
7,529
Bank issued transferable certificates of deposits
-
-
113,709
113,709
Capital indexed bonds
492,205
-
-
492,205
Financial assets at fair value
492,205
-
1,522,105
2,014,310
Financial liabilities at fair value
Trade creditors
-
-
23,201
23,201
Grants payable
-
-
14,604
14,604
Financial liabilities at fair value
-
-
37,805
37,805
-58-

445Chapter 17 Financial statements Part5 Financial management FaHCSIA Annual Report 2008–2009
Fina
ncia
l man
agem
ent
Part 5
Notes to and forming part of the Financial Statements
Note 24D: Credit Risk
FaHCSIA is exposed to credit risk through cash and receivables (recognised as loans and receivables) and
Investments (recognised as held to maturity). The maximum exposure to credit risk is the risk that arises from
potential default of a debtor or financial institution. This amount is equal to the total amount of cash, receivables and
investments. Aboriginal and Torres Strait Islander Land Account and Aboriginals Benefit Account have assessed the
risk of potential default and have determined that no impairment is required to be recognised.
The following table illustrates FaHCSIA's gross exposure to credit risk, excluding any collateral or credit
enhancement
2009
2008
$'000
$'000
Financial assets
Bank term Deposits
1,378,867
368,104
Territory Insurance Office and Banking
22,000
22,000
Interest Receivable (Amortised Cost)
7,529
2,608
Bank issued transferable certificates of deposits
113,709
766,773
Capital indexed bonds
499,129
384,349
Nominal bonds
-
318,091
Cash and cash equivalents
23,857
11,807
Trade receivables
16,261
16,229
Other receivables
18,987
20,063
Less: Impairment allowance account
(162)
(204)
Advances and loans
17,911
14,792
Interest Receivable
53
1
Financial liabilities
Trade Creditors
(23,201)
(36,862)
Grants payable
(14,604)
(5,389)
Total
2,060,336
1,882,362
Credit quality of financial instruments not past due or individually determined as impaired
Not Past Due
Nor Impaired Not Past Due
Nor Impaired Past due or
impaired Past due or
impaired
2009
2008
2009
2008
$'000
$'000
$'000
$'000
Trade receivables
16,167
13,691
94
2,538
Other receivables
1,009
1,177
18,026
18,886
Less: Impairment allowance account
-
(3)
(162)
(201)
Advances and loans
17,911
14,792
-
-
Total
35,087
29,657
17,958
21,223
Ageing of financial assets that are past due but not impaired for 2009
0 to 30 days
31 to 60 days
61 to 90 days
90+ days
Total
$'000
$'000
$'000
$'000
$'000
Trade receivables
16,167
-
94
16,261
Total
16,167
-
-
94
16,261
-59-

446 FaHCSIA Annual Report 2008–2009 Part5 Financial management Chapter 17 Financial statements
Notes to and forming part of the Financial Statements
Ageing of financial assets that are past due but not impaired for 2008
0 to 30 days
31 to 60 days
61 to 90 days
90+ days
Total
$'000
$'000
$'000
$'000
$'000
Trade receivables
2,467
-
-
71
2,538
Total
2,467
-
-
71
2,538
Note 24E: Liquidity risk
FaHCSIA's administered financial liabilities are creditors and grants payable. The exposure to liquidity risk is based
on the notion that FaHCSIA will encounter difficulty in meeting its obligations associated with administered financial
liabilities. This is highly unlikely due to appropriation funding and mechanisms available to FaHCSIA and internal
policies and procedures put in place to ensure there are appropriate resources to meet its financial obligations. The
Aboriginal and Torres Strait Islander Land Account has a significant capital base available to meet its obligations and
has no financial liabilities at 30 June 2009. The Aboriginals Benefit Account investment policy ensures sufficient cash
is available to meet payments as they fall due.
Note 24F: Market Risk
FaHCSIA holds both basic financial instruments and held to maturity investments that do not expose the agency to
certain market risks. FaHCSIA is not exposed to 'Currency risk', 'Other price risk' or 'Interest Rate Risk'.
-60-

447Chapter 17 Financial statements Part5 Financial management FaHCSIA Annual Report 2008–2009
Fina
ncia
l man
agem
ent
Part 5
Not
es to
and
form
ing
part
of t
he F
inan
cial
Sta
tem
ents
N
ote
25:
A
ppro
pria
tions
Tab
le A
:
Acq
uitt
al o
f Aut
hori
ty to
Dra
w C
ash
from
the
Con
solid
ated
Rev
enue
Fun
d fo
r O
rdin
ary
Ann
ual S
ervi
ces A
ppro
pria
tions
A
dmin
ister
ed E
xpen
ses
D
epar
tmen
tal
T
otal
Part
icul
ars
O
utco
me
1
Out
com
e 2
O
utco
me
3
Out
com
e 4
Pa
ymen
ts to
CA
C A
ct
bodi
es
Out
puts
20
09
2008
20
09
2008
20
09
2008
20
09
2008
20
09
2008
20
09
2008
20
09
2008
$'00
0
$'00
0
$'00
0
$'00
0
$'00
0
$'00
0
$'00
0
$'00
0
$'00
0
$'00
0
$'00
0
$'00
0
$'00
0
$'00
0
Bal
ance
bro
ught
forw
ard
from
pre
viou
s per
iod
(App
ropr
iatio
n
Acts
)
73,3
23
73,8
57
40,6
28
27,2
31
57,3
26
60,2
24
32,4
31
44,8
99
-
-
84,8
16
115,
812
28
8,52
4
322,
023
Adj
ustm
ent t
o op
enin
g ba
lanc
e
-
(3,5
42)
-
-
-
69
-
-
-
-
-
(6
,100
)
-
(9,5
73)
Adj
uste
d ba
lanc
e br
ough
t for
war
d fro
m p
revi
ous p
erio
d
(App
ropr
iatio
n Ac
ts)
73,3
23
70,3
15
40,6
28
27,2
31
57,3
26
60,2
93
32,4
31
44,8
99
-
-
84,8
16
109,
712
28
8,52
4
312,
450
Appr
opri
atio
ns A
ct:
Appr
opri
atio
n Ac
t (N
o. 1
)200
8 - 2
009
as p
asse
d
771,
422
41
7,21
5
514,
289
41
4,84
3
165,
110
44
6,00
8
178,
632
11
0,57
2
124,
060
-
1,
513,
691
1,
249,
127
3,
267,
204
2,
637,
765
Appr
opri
atio
n Ac
t (N
o. 1
) Eco
nom
ic S
ecur
ity S
trat
egy
2008
-09
as p
asse
d
-
-
2,72
6
-
2,39
4
-
6,43
0
-
-
-
16,5
66
-
28,1
16
-
Appr
opri
atio
n N
TER
Act (
No.
1)2
007
- 200
8as
pas
sed
-
91
,298
-
-
-
-
-
-
-
-
-
12
1,02
0
-
212,
318
Appr
opri
atio
n Ac
t (N
o. 3
) 200
8-09
as p
asse
d
68,7
46
26,9
89
-
41,2
24
7,91
6
3,20
0
1,16
0
35,7
64
-
-
22,1
12
56,1
84
99,9
34
163,
361
Appr
opri
atio
n Ac
t (N
o. 5
) 200
8-09
as p
asse
d
-
-
-
-
-
-
11,0
91
-
-
-
17,3
95
-
28,4
86
-
Dep
artm
enta
l app
ropr
iatio
ns re
duce
d (A
ppro
pria
tion
Act
sect
ion
10)
-
(2
5,76
5)
-
(25,
765)
Adm
inist
ered
app
ropr
iatio
ns re
duce
d (n
on C
AC
)
(App
ropr
iatio
n Ac
t sec
tion
11)
1
(57,
293)
(6
9,66
7)
(28,
362)
(1
5,78
3)
(8,1
80)
(8
,960
)
(30,
517)
(4
2,97
1)
(124
,352
)
(137
,381
)
Adv
ance
to th
e Fi
nanc
e M
inist
er (A
ppro
pria
tion
Act s
ectio
n
14)
-
-
-
-
-
-
10
,539
-
-
-
-
-
10
,539
-
Flex
ible
fund
ing
pool
rece
ipts
(App
ropr
iatio
n Ac
t sec
tion
15)
-
-
-
-
-
-
-
-
-
-
FMA
Act:
Ref
unds
cre
dite
d (F
MA
Acts
ectio
n 30
)
3,92
6
40,8
10
175
8,
047
15
6
936
10
1
1,65
9
-
-
5,40
8
4,49
2
9,76
6
55,9
44
App
ropr
iatio
ns to
take
acc
ount
of r
ecov
erab
le G
ST (F
MA
Acts
ectio
n 30
A)
82
,346
70
,310
47
,372
42
,168
28
,941
45
,245
16
,144
13
,752
-
-
23
,446
29
,444
19
8,24
9
200,
919
Rel
evan
t age
ncy
rece
ipts
(FM
A Ac
t s31
)
-
-
-
-
Rel
evan
t age
ncy
rece
ipts
(FM
A Ac
ts31
)
-
4,06
4
-
-
-
101,
071
-
-
-
-
32
,548
22
,821
32
,548
12
7,95
6
Adj
ustm
ent o
f app
ropr
iatio
ns o
n ch
ange
of e
ntity
func
tion
(FM
A Ac
ts32
)
-
324,
896
-
(7
)
(17,
095)
(1
41,9
82)
-
-
-
-
-
40
,878
(1
7,09
5)
223,
785
Red
uctio
ns -
due
to w
ork
load
agr
eem
ent
-
-
-
-
-
-
-
-
-
-
-
(1
,956
)
-
(1,9
56)
Tota
lapp
ropr
iatio
n av
aila
ble
for p
aym
ents
94
2,47
0
976,
230
57
6,82
8
517,
723
23
6,56
8
505,
811
22
6,01
1
163,
675
12
4,06
0
-
1,71
5,98
2
1,60
5,95
7
3,82
1,91
9
3,76
9,39
6
Cas
h pa
ymen
ts m
ade
durin
g th
e ye
ar (G
ST in
clus
ive)
74
2,38
3
902,
907
53
1,29
5
477,
095
20
2,77
7
448,
485
20
9,20
2
130,
744
12
4,06
0
-
1,63
9,34
2
1,52
1,14
1
3,44
9,05
9
3,48
0,37
2
App
ropr
iatio
ns c
redi
ted
to S
peci
al A
ccou
nts (
excl
udin
g G
ST)
83
,955
-
2,
722
-
-
-
-
50
0
-
-
21,6
52
-
108,
329
50
0
Bal
ance
of A
utho
rity
to D
raw
Cas
h fro
m th
e C
onso
lidat
ed
Rev
enue
Fun
d fo
r Ord
inar
y A
nnua
l Ser
vice
s App
ropr
iatio
ns a
nd a
s
repr
esen
ted
by:
11
6,13
2
73,3
23
42,8
11
40,6
28
33,7
91
57,3
26
16,8
09
32,4
31
-
-
54,9
88
84,8
16
264,
531
28
8,52
4
Cas
h at
ban
k an
d on
han
d
-
-
-
-
-
-
-
-
-
-
5,82
7
5,12
9
5,82
7
5,12
9
Dep
artm
enta
l app
ropr
iatio
ns re
ceiv
able
49
,161
79
,687
49
,161
79
,687
Und
raw
n, u
nlap
sed
adm
inist
ered
app
ropr
iatio
ns
116,
132
73
,323
42
,811
40
,628
33
,791
57
,326
16
,809
32
,431
-
-
-
-
20
9,54
3
203,
708
Adj
ustm
ents
unde
r s10
1.13
of t
he F
inan
ce M
inist
er's
Ord
ers n
ot
refle
cted
abo
ve
-
-
-
-
-
-
-
-
-
-
-
-
-
-
Tota
l as a
t 30
June
11
6,13
2
73,3
23
42,8
11
40,6
28
33,7
91
57,3
26
16,8
09
32,4
31
-
-
54,9
88
84,8
16
264,
531
28
8,52
4
-61-

448 FaHCSIA Annual Report 2008–2009 Part5 Financial management Chapter 17 Financial statements
Not
es to
and
form
ing
part
of t
he F
inan
cial
Sta
tem
ents
Not
e 25
:
App
ropr
iatio
ns (c
ontin
ued)
A
dmin
ister
ed E
xpen
ses
D
epar
tmen
tal
T
otal
Part
icul
ars
O
utco
me
1
Out
com
e 2
O
utco
me
3
Out
com
e 4
Pa
ymen
ts to
CA
C A
ct
bodi
es
Out
puts
20
09
2008
20
09
2008
20
09
2008
20
09
2008
20
09
2008
20
09
2008
20
09
2008
$
$
$
$
$
$
$
$
$
$
$
$
$
$
Redu
ctio
n in
adm
inist
ered
item
s2
Tota
ladm
inist
ered
item
s app
ropr
iate
d 20
08-0
9
840,
168,
000
-
51
7,01
5,00
0
-
175,
420,
000
-
20
7,85
2,46
3
-
1,74
0,45
5,46
3
-
Less
: adm
inist
ered
item
s req
uire
d by
the
agen
cy p
er
Appr
opri
atio
n Ac
tse
ctio
n 11
3
(i)
Appr
opri
atio
n Ac
t (N
o. 1
) 200
8-20
09
699,
108,
053
-
48
3,38
9,13
8
-
164,
788,
855
-
18
9,16
0,45
2
-
1,53
6,44
6,49
8
-
(ii)A
ppro
pria
tion
Act (
No.
1) E
cono
mic
Sec
urity
Stra
tegy
200
8-09
-
-
1,
846,
423
-
1,
841,
601
-
4,
714,
935
-
8,
402,
959
-
(iii)
App
ropr
iatio
n Ac
t (N
o. 3
) 200
8-20
09
28,0
21,8
76
-
-
-
7,49
2,32
4
-
60,0
00
-
35,5
74,2
00
-
(iv)
App
ropr
iatio
n Ac
t (N
o. 5
) 200
8-20
09
-
-
-
-
-
-
11,0
91,0
00
-
11,0
91,0
00
-
(iv)
Oth
er a
nnua
l app
ropr
iatio
n ac
ts
-
-
-
-
-
-
-
-
-
-
Tota
ladm
inist
ered
item
s req
uire
d by
the
agen
cy
727,
129,
929
-
48
5,23
5,56
1
-
174,
122,
780
-
20
5,02
6,38
7
-
1,59
1,51
4,65
7
-
Tota
l red
uctio
n in
adm
inist
ered
item
s - e
ffect
ive
2009
-201
0
113,
038,
071
-
31
,779
,439
-
1,
297,
220
-
2,
826,
076
-
14
8,94
0,80
6
-
1In
200
8-20
09 (a
nd th
e co
mpa
rativ
e fig
ure
for 2
007-
2008
), th
is re
pres
ents
the
amou
nt c
alcu
late
d un
der t
he re
leva
nt A
ppro
pria
tion
Acts
sect
ion
8 de
term
inat
ion,
dur
ing
the
year
, in
resp
ect o
f the
pre
viou
s yea
r's a
dmin
istra
ted
item
s.
2Th
is is
the
first
year
of a
dmin
ister
ed it
ems b
eing
redu
ced
unde
r sec
tion
11. N
umbe
rs in
this
sect
ion
of th
e ta
ble
are
not r
ound
ed.
3A
dmin
ister
ed it
ems f
or 2
008-
2009
wer
e re
duce
d to
thes
e am
ount
s whe
n th
ese
finan
cial
stat
emen
ts w
ere
tabl
ed in
the
Parli
amen
t as p
art o
f FaH
CSI
A's
2008
-200
9 an
nual
repo
rt. T
his r
educ
tion
is ef
fect
ive
in 2
009-
2010
and
the
amou
nts i
n th
e To
tal R
educ
tion
row
will
be
refle
cted
in th
eto
p se
ctio
n of
Tab
le A
in th
e 20
09-2
010
finan
cial
stat
emen
ts in
the
row
'Adm
inist
ered
app
ropr
iatio
ns re
duce
d (n
on C
AC
).
-62-

449Chapter 17 Financial statements Part5 Financial management FaHCSIA Annual Report 2008–2009
Fina
ncia
l man
agem
ent
Part 5
Not
es to
and
form
ing
part
of t
he F
inan
cial
Sta
tem
ents
Not
e 25
:
App
ropr
iatio
ns (c
ontin
ued)
Tab
le B
:
Acq
uitt
al o
f Aut
hori
ty to
Dra
w C
ash
from
the
Con
solid
ated
Rev
enue
Fun
d fo
r O
ther
than
Ord
inar
y A
nnua
l Ser
vice
s App
ropr
iatio
ns
Part
icul
ars
O
pera
ting
N
on-o
pera
ting
To
tal
O
utco
me
1
Out
com
e 2
O
utco
me
3
Out
com
e 4
SP
Ps
SPPs
SP
Ps
SPPs
Pa
ymen
t to
CAC
Act
bodi
es
Equi
ty
Prev
ious
yea
rs' o
utpu
ts
20
09
2008
20
09
2008
20
09
2008
20
09
2008
20
09
2008
20
09
2008
20
09
2008
20
0920
08
$'
000
$'
000
$'
000
$'
000
$'
000
$'
000
$'
000
$'
000
$'
000
$'
000
$'
000
$'
000
$'
000
$'
000
$'
000
$'00
0
Bal
ance
bro
ught
forw
ard
from
pre
viou
s per
iod
(App
ropr
iatio
n Ac
ts)
4,09
5
-
1,15
8
273
3,
243
27
,350
88
8
888
-
-
11
,531
1,
903
-
-
20
,915
30,4
14
Adj
ustm
ent t
o op
enin
g ba
lanc
e
-
48
-
-
-
(55)
-
-
-
-
-
-
-
-
-
(7)
Adj
uste
d ba
lanc
e ca
rried
forw
ard
from
pre
viou
s per
iod
(App
ropr
iatio
n Ac
ts)
4,09
5
48
1,15
8
273
3,
243
27
,295
88
8
888
-
-
11
,531
1,
903
-
-
20
,915
30,4
07
Appr
opri
atio
n Ac
t:
Appr
opria
tion
Act (
No.
2) 2
008
- 200
9
389,
684
15
,234
1,
009,
391
85
8,73
8
17,9
70
57,5
36
1,20
1,39
9
1,15
8,37
9
47,9
80
-
6,75
8
4,05
6
-
-
2,67
3,18
22,
093,
943
Appr
opria
tion
NTE
R Ac
t (N
o.2)
200
7 - 2
008
-
-
-
-
-
14
,459
-
-
-
-
-
34
,333
-
-
-
48,7
92
Appr
opria
tion
Act (
No.
4) 2
008
- 200
9
-
-
15,1
01
33,0
36
-
-
-
-
-
-
-
2,54
7
-
-
15,1
0135
,583
Appr
opria
tion
Act (
No.
6) 2
008
- 200
9
-
-
-
66,6
47
-
-
-
-
-
-
-
-
-
-
-66
,647
Adm
inist
ered
app
ropr
iatio
ns re
duce
d (n
on C
AC
)
(App
ropr
iatio
n Ac
ts12
, s13
) 1
(4,0
47)
-
(1
,116
)
(273
)
(3,1
14)
(2
5,48
7)
(69)
(7
0)
(8,3
46)
(25,
830)
Dep
artm
enta
l app
ropr
iatio
ns re
duce
d (A
ppro
pria
tion
Act s
ectio
n 13
)
-
-
-
-
--
Adv
ance
to th
e Fi
nanc
e M
inist
er (A
ppro
pria
tion
Act
sect
ion
15)
-
-
-
-
-
-
-
-
-
-
-
-
-
-
-
-
FMA
Act:
Rep
aym
ents
to th
e C
omm
onw
ealth
(FM
A Ac
t sec
tion
30A
)
-
59
-
-
-
304
-
1,
500
-
-
-
-
-
-
-
1,86
3
App
ropr
iatio
ns to
take
acc
ount
of r
ecov
erab
le G
ST
(FM
A Ac
t s30
A)
-
-
-
-
-
-
-
-
-
-
-
-
-
-
-
-
Adj
ustm
ent o
f app
ropr
iatio
ns o
n ch
ange
of a
genc
y
func
tion
(FM
A Ac
ts32
)
-
-
-
-
-
(16,
168)
-
-
-
-
-
(1
,527
)
-
-
-(1
7,69
5)
Tota
l app
ropr
iatio
ns a
vaila
ble
for
paym
ents
38
9,73
2
15,3
41
1,02
4,53
4
958,
421
18
,099
57
,939
1,
202,
218
1,
160,
697
47
,980
-
18
,289
41
,312
-
-
2,
700,
852
2,23
3,71
0
Cas
h pa
ymen
ts m
ade
durin
g th
e ye
ar (G
ST in
clus
ive)
15
3,38
1
11,2
46
541,
585
95
7,26
3
9,62
9
54,6
96
589,
448
1,
157,
523
47
,980
-
18
,289
29
,781
-
-
1,
360,
312
2,21
0,50
9
App
ropr
iatio
ns c
redi
ted
to sp
ecia
l acc
ount
s (G
ST
excl
usiv
e)
-
-
-
-
-
-
2,28
6
2,28
6
-
-
-
-
-
-
2,28
62,
286
Bal
ance
of a
utho
rity
to d
raw
cas
h fro
m th
e co
nsol
idat
ed
reve
nue
fund
for o
ther
than
ord
inar
y an
nual
serv
ices
appr
opria
tions
and
as r
epre
sent
ed b
y:
236,
351
4,
095
48
2,94
9
1,15
8
8,47
0
3,24
3
610,
484
88
8
-
-
-
11,5
31
-
-
1,33
8,25
420
,915
Repr
esen
ted
by:
Cas
h at
ban
k an
d on
han
d
-
-
-
-
-
-
-
-
-
-
-
-
-
-
--
App
ropr
iatio
n re
ceiv
able
-
-
-
-
-
-
-
-
-
-
-
-
87
,986
-
87
,986
-
Und
raw
n, u
nlap
sed
adm
inist
ered
app
ropr
iatio
ns
236,
351
4,
095
48
2,94
9
1,15
8
8,47
0
3,24
3
610,
484
88
8
-
-
-
11,5
31
-
-
1,33
8,25
420
,915
Adj
ustm
ents
unde
r s10
1.13
of t
he F
inan
ce M
inist
er's
Ord
ers n
ot re
flect
ed a
bove
-
-
-
-
-
-
-
-
-
-
-
-
(8
7,98
6)
-
(87,
986)
-
Tota
l as a
t 30
June
23
6,35
1
4,09
5
482,
949
1,
158
8,
470
3,
243
61
0,48
4
888
-
-
-
11
,531
-
-
1,
338,
254
20,9
15
-63-

450 FaHCSIA Annual Report 2008–2009 Part5 Financial management Chapter 17 Financial statements
Not
es to
and
form
ing
part
of t
he F
inan
cial
Sta
tem
ents
Not
e 25
:
App
ropr
iatio
ns (c
ontin
ued)
Not
e 25
B:
A
cqui
ttal
of A
utho
rity
to D
raw
Cas
h fr
omth
e C
onso
lidat
ed R
even
ue F
und
for
Oth
er th
an O
rdin
ary
Ann
ual S
ervi
ces A
ppro
pria
tions
(con
tinue
d)
Part
icul
ars
O
pera
ting
N
on-o
pera
ting
T
otal
O
utco
me
1
Out
com
e 2
O
utco
me
3
Out
com
e 4
SP
Ps
SPPs
SP
Ps
SPPs
Pa
ymen
t to
CAC
Act
bodi
es
Equi
ty
Prev
ious
yea
rs'
outp
uts
20
09
2008
20
09
2008
20
09
2008
20
09
2008
20
0920
08
2009
2008
2009
2008
20
0920
08
$
$
$
$
$
$
$
$
$$
$
$$
$
$$
Redu
ctio
n in
adm
inis
tere
d ite
ms 2
Tota
l adm
inist
ered
item
s app
ropr
iate
d
389,
684,
000
-
1,
024,
492,
000
-
17
,970
,000
-
1,
201,
399,
000
-
2,
633,
545,
000
-Le
ss a
dmin
ister
ed it
ems r
equi
red
by th
e
agen
cy p
er A
ppro
pria
tion
Act:
sect
ion
12 3
(i)
Appr
opria
tion
Act (
No.
2) 2
008-
2009
15
3,38
0,38
4
-
541,
542,
997
-
9,
500,
000
-
59
1,73
5,23
4
-
1,29
6,15
8,61
5-
(ii)
App
ropr
iatio
n Ac
t (N
o. 4
) 200
8-
2009
-
-
-
-
-
-
-
-
-
-(ii
i) A
ppro
pria
tion
Act (
No.
6) 2
008-
2009
-
-
-
-
-
-
-
-
-
-(iv
) O
ther
ann
ual a
ppro
pria
tion
acts
-
-
-
-
-
-
-
-
-
-To
tal a
dmin
iste
red
item
s req
uire
d by
the
agen
cy
153,
380,
384
-
54
1,54
2,99
7
-
9,50
0,00
0
-
591,
735,
234
-
1,
296,
158,
615
-To
tal r
educ
tion
in a
dmin
ister
ed it
ems -
effe
ctiv
e 20
09-2
010
23
6,30
3,61
6
-
482,
949,
003
-
8,
470,
000
-
60
9,66
3,76
6
-
1,33
7,38
6,38
5-
1In
200
8-09
(and
the
com
para
tive
figur
e 20
07-0
8), t
his r
epre
sent
s the
am
ount
cal
cula
ted
unde
r the
rele
vant
App
ropr
iatio
n Ac
ts se
ctio
n 7
and
8 de
term
inat
ion,
dur
ing
the
year
, in
resp
ect o
f the
pre
viou
s yea
r's a
dmin
ister
ed it
ems.
2Th
is is
the
first
year
of a
dmin
ister
ed it
ems b
eing
redu
ced
unde
r sec
tion
12. N
umbe
rs in
this
sect
ion
of th
e ta
ble
are
not r
ound
ed.
3A
dmin
ister
ed it
ems f
or 2
008-
2009
wer
e re
duce
d to
thes
e am
ount
s whe
n th
ese
finan
cial
stat
emen
ts w
ere
tabl
ed in
the
Parli
amen
t as p
art o
f FaH
CSI
A's
2008
-200
9 an
nual
repo
rt. T
his r
educ
tion
is ef
fect
ive
in 2
009-
2010
and
the
amou
nts i
n th
e To
tal R
educ
tion
row
will
be
refle
cted
in th
e to
pse
ctio
n of
Tab
le B
in th
e 20
09-2
010
finan
cial
stat
emen
ts in
the
row
'Adm
inist
ered
app
ropr
iatio
ns re
duce
d (n
on C
AC
)'
-64-

451Chapter 17 Financial statements Part5 Financial management FaHCSIA Annual Report 2008–2009
Fina
ncia
l man
agem
ent
Part 5
Notes to and forming part of the Financial Statements
Note 25:
Appropriations (continued)
Table C: Acquittal of Authority to Draw Cash from the Consolidated Revenue Fund - Special
Appropriations (Unlimited Amount)
Legislation: Social Security (Administration) Act 1999 s242 2009
2008
Outcome 1
$'000
$'000
Purpose:to enable the payment of income support payments.
All transactions under this Act are recognised as administered items.
Cash payment made during the year
-
1,706
Appropriations credited to Special Accounts
-
-
Repayment to the Commonwealth (FMA section 30)
-
-
Total charges appropriation
-
1,706
Estimated actual
-
2,746
Legislation: Social Security (Administration) Act 1999 s242 2009
2008
Outcome 2
$'000
$'000
Purpose: to enable the payment of income support payments.
All transactions under this Act are recognised as administered items.
Cash payment made during the year
45,346,697
34,525,788
Appropriations credited to Special Accounts
-
-
Repayment to the Commonwealth (FMA section 30)
-
-
Total charged to appropriation
45,346,697
34,525,788
Estimated actual
45,457,565
34,771,177
Legislation: Social Security (Administration) Act 1999 s242 2009
2008
Outcome 3
$'000
$'000
Purpose: to enable the payment of income support payments.
All transactions under this Act are recognised as administered items.
Cash payment made during the year
3,214
3,027
Appropriations credited to Special Accounts
-
-
Repayments to the Commonwealth (FMA section 30)
-
-
Total charged to appropriations
3,214
3,027
Estimated actual
3,226
3,013
-65-

452 FaHCSIA Annual Report 2008–2009 Part5 Financial management Chapter 17 Financial statements
Notes to and forming part of the Financial Statements
Note 25:
Appropriations (continued)
Note 25C: Acquittal of Authority to Draw Cash from the Consolidated Revenue Fund - Special
Appropriations (Unlimited Amount) (continued)
Legislation: Social Security (Administration) Act 1999 s242 2009
2008
Outcome 4
$'000
$'000
Purpose: to enable the payment of income support payments.
All transactions under this Act are recognised as administered items.
Cash payment made during the year
136,145
39,180
Appropriations credited to Special Accounts
-
-
Repayments to the Commonwealth (FMA section 30)
-
-
Total charged to appropriations
136,145
39,180
Estimated actual
137,838
47,299
FaHCSIA is responsible for the administration of payments made under section 242 of the Social Security
(Administration) Act 1999, however, Centrelink has made payments under drawing rights on behalf of FaHCSIA.
Legislation: A New Tax System (Family Assistance) (Administration) Act 1999
s233
2009
2008
Outcome 3
$'000
$'000
Purpose: to enable the payment of income support payments.
All transactions under this Act are recognised as administered items.
Cash payment made during the year
23,472,155
16,712,970
Appropriations credited to Special Accounts
-
-
Repayments to the Commonwealth (FMA section 30)
-
-
Total charged to appropriations
23,472,155
16,712,970
Estimated actual
26,349,194
16,856,991
Aboriginal Land Rights (Northern Territory) Act 1976 - maintenance of
Aboriginal Benefits Account s63
2009
2008
Outcome 1
$'000
$'000
Purpose: to enable payments to Aboriginal Land Councils from the equivalent of mining royalties derived from mining
operations on Aboriginal land in the Northern Territory.
All transactions under this Act are recognised as administered items.
Cash payment made during the year
218,680
82,750
Appropriations credited to Special Accounts
-
-
Repayments to the Commonwealth (FMA section 30)
-
-
Total charged to appropriations
218,680
82,750
Estimated actual
226,347
80,576
-66-

453Chapter 17 Financial statements Part5 Financial management FaHCSIA Annual Report 2008–2009
Fina
ncia
l man
agem
ent
Part 5
Notes to and forming part of the Financial Statements
Note 25:
Appropriations (continued)
Note 25C: Acquittal of Authority to Draw Cash from the Consolidated Revenue Fund - Special
Appropriations (Unlimited Amount) (continued)
Legislation: Aboriginal Land Rights (Northern Territory) Act 1976 Ranger
Agreement s17
2009
2008
Outcome 1
$'000
$'000
Purpose: an Act providing for the granting of Traditional Aboriginal Land in the Northern Territory for the benefits of
Aboriginals, and for the Ranger Agreement, completed under section 44 of the Aboriginal Land Rights (Northern
Territory) Act 1976. The Ranger Agreement was made between the Commonwealth and the Northern Land Council in
November 1978 to provide for various payments in respect of mining on the Ranger Project Area, which is on
Aboriginal Land.
All transactions under this Act are recognised as administered items.
Cash payment made during the year
200
200
Appropriations credited to Special Accounts
-
-
Repayments to the Commonwealth (FMA section 30)
-
-
Total charged to appropriations
200
200
Estimated actual
200
200
Legislation: Social Security (Administration) Act 1999 s123ZN part 3B 2009
2008
Outcome 3
$'000
$'000
Purpose: to enable the payment of income management regime.
All transactions under this Act are recognised as administered items.
Cash payment made during the year
8,794
-
Appropriations credited to Special Accounts
-
1,925
Repayments to the Commonwealth (FMA section 30)
-
-
Total charged to appropriation
8,794
1,925
Estimated actual
-
4,000
Northern Territory National Emergency Response Act 2007 s63(2) 2009
2008
Outcome 1
$'000
$'000
Purpose: compensation for Part 4 acquisition, state legislation payments, rental payments and passing on sub-lease or
other payments to owners.
Cash payment made during the year
-
-
Appropriations credited to Special Accounts
-
-
Refunds credited (net) (FMA Act Section 30)
-
-
Total charged to appropriations
-
-
Estimated actual
4,439
-
Totals for unlimited special appropriations
Payments made
69,185,885
51,367,547
Estimated actual
72,178,809
51,766,002
-67-

454 FaHCSIA Annual Report 2008–2009 Part5 Financial management Chapter 17 Financial statements
Notes to and forming part of the Financial Statements
Note 25:
Appropriations (continued)
Note 25D: Disclosure by agency in relation to Special Appropriations
Other Administered - Attorney - General's
Appropriation Act (No. 1) 2008-2009
Attorney - General's Department
Total
Departmental
Administered
2009
2008
2009
2008
$'000
$'000
$'000
$'000
Total receipts
-
-
141,216
-
Total payments
-
-
(141,216)
-
Balance of receipts and payments for
departmental, and for administered, for each
responsible agency
-
-
-
-
Note 25E: Acquittal of Authority to Draw Cash from the Consolidated Revenue Fund - Special
Appropriations (Section 39 of the FMA Act 1997)
Investment of Public Money: Special Appropriations under section 39 of the FMA
Act 1997 2009
2008
$'000
$'000
Aboriginal and Torres Strait Islander Land Account (Administered)
Amount invested carried from previous period
1,635,510
1,553,216
Prior year investments redeemed in current year
(1,358,489)
(856,196)
Investments made during the year
1,791,416
1,978,211
Redemption of current year investments
(355,208)
(1,039,721)
Amount invested carried to the next period (sum of the above)
1,713,229
1,635,510
Budget estimate
-
-
Note 25F: Acquittal of Authority to Draw Cash from the Consolidated Revenue Fund - Special
Appropriations (Section 39 of the FMA Act 1997)
Investment of Public Money: Special Appropriations under section 39 of the FMA
Act 1997 2009
2008
$'000
$'000
Aboriginals Benefit Account
Amount invested carried from previous period
191,250
170,861
Movements in Deposits At Call account
3,900
(3,490)
Prior year investments redeemed in current year
(93,950)
(51,641)
Investments made during the year
211,000
156,593
Redemption of current year investments
(26,200)
(81,073)
Amount invested carried to the next period (sum of the above)
286,000
191,250
Budget estimate
-
-
-68-

455Chapter 17 Financial statements Part5 Financial management FaHCSIA Annual Report 2008–2009
Fina
ncia
l man
agem
ent
Part 5
Notes to and forming part of the Financial Statements
Note 26:
Special Accounts
Indigenous Communities Strategic Investment Special Account (Administered)
2009
2008
$'000
$'000
Legal Authority:Financial Management and Accountability Act 1997; section 20
Appropriation: Financial Management and Accountability Act 1997; section 20
Purpose: administering the Indigenous Communities Strategic Investment program
This account is non-interest bearing
Balance carried from previous year
-
-
Appropriation for reporting period
220
-
GST credits (FMA Act s30A)
180
-
Other receipts
3,353
-
Total credits
3,753
-
Payments made to suppliers
(3,753)
-
Total debits
(3,753)
-
Balance carried to next period (excluding investment balances) and represented
by:
-
-
Cash transferred to the Official Public Account
-
-
Total balance carried to the next period
-
-
Other Trust Monies (Administered)
2009
2008
$'000
$'000
Legal Authority: Financial Management and Accountability Act 1997; section 20
Appropriation: Financial Management and Accountability Act 1997; section 20
Purpose: for the receipt of reconciled monies from clients.
This account is non-interest bearing
Balance carried from previous period
141
158
GST credits (FMA Act s30A)
13
-
Other receipts
-
142
Total credits
154
300
Payments made to suppliers
(154)
(159)
Total debits
(154)
(159)
Balance carried to next period (excluding investment balances) and represented
by:
-
141
Cash transferred to the Official Public Account
-
141
Total balance carried to the next period
-
141
Social Security - Services for Other Government and Non-Government Bodies
(Administered)
2009
2008
$'000
$'000
Legal Authority: Financial Management and Accountability Act 1997; Section 20
Appropriation: Financial Management and Accountability Determination 2006; section 30
Purpose: for services relating to specific Government and Non-Government bodies.
This account is non-interest bearing
Balance carried from previous period
223
348
Total credits
223
348
Payments made
-
(125)
Total debits
-
(125)
Balance carried to next period (excluding investment balances) and represented
by:
223
223
Cash - transferred to the Official Public Account
223
223
Total balance carried to the next period
223
223
-69-

456 FaHCSIA Annual Report 2008–2009 Part5 Financial management Chapter 17 Financial statements
Notes to and forming part of the Financial Statements
Note 26
Special Accounts (continued)
Other Services - Services for Other Government and Non-Government Bodies
(Administered)
2009
2008
$'000
$'000
Legal Authority: Financial Management and Accountability Act 1997; section 20
Appropriation:Financial Management and Accountability Act 1997; section 20
Purpose: for expenditure in connection with services performed on behalf of other Governments and bodies that are
not FMA agencies.
This account is non-interest bearing
Balance carried from previous period
72
77
Appropriation for reporting period
22
-
GST credits (FMA Act s30A)
132
2
Other receipts
1,662
44
Total credits
1,888
123
Payments made to suppliers
(1,522)
-
Payments made - other
-
(51)
Total debits
(1,522)
(51)
Balance carried to next period (excluding investment balances) and represented
by:
366
72
Cash transferred to the Official Public Account
366
72
Total balance carried to the next period
366
72
Income Management Special Account (Administered)
2009
2008
$'000
$'000
Legal Authority:Social Security (Administration) Act 1999; Section 123VA
Appropriation: Financial Management and Accountability Determination 2006 section 21
Purpose: individual Centrelink entitlements are held and Centrelink makes payments on behalf of the individual.
This account is non-interest bearing
Balance carried from previous period
3,235
-
Contributions
165,519
33,677
Other receipts (returned payments from third party organisation)
1,351
219
Total credits
170,105
33,896
Payments made
(167,903)
(30,661)
Total debits
(167,903)
(30,661)
Balance carried to next period (excluding investment balances) and represented
by:
2,202
3,235
Cash - held by FaHCSIA
2,202
3,235
Total balance carried to the next period
2,202
3,235
-70-

457Chapter 17 Financial statements Part5 Financial management FaHCSIA Annual Report 2008–2009
Fina
ncia
l man
agem
ent
Part 5
Notes to and forming part of the Financial Statements
Note 26
Special Accounts (continued)
Supported Accommodation Assistance Program Data & Program Evaluation
Fund Special Account (Administered)
2009
2008
$'000
$'000
Legal Authority: Financial Management and Accountability Act 1997; section 20
Appropriation:Financial Management and Accountability Determination 2006; section 30
Purpose: the receipt of monies for the National Data Collection, national evaluations, national committees and
research projects under FaHCSIA's Supported Accommodation Assistance Program.
This account is non-interest bearing
Balance carried from previous period
2,859
1,643
Adjustment to opening balance
-
139
Appropriation for reporting period
2,286
2,786
GST credits (FMA Act s30A)
235
205
Other receipts
369
468
Total credits
5,749
5,241
Payments made to suppliers
(2,586)
(2,382)
Total Debits
(2,586)
(2,382)
Balance carried to next period (excluding investment balances) and represented
by:
3,163
2,859
Cash - transferred to the Official Public Account
3,163
2,859
Total balance carried to the next period
3,163
2,859
National Youth Affairs Research Scheme Special Account (Administered)
2009
2008
$'000
$'000
Legal Authority: Section 20 of the Financial Management and Accountability Act 1997
Appropriation: Financial Management and Accountability Determination 2006 section 45
Purpose: for the receipt of monies from State Governments to meet expenditure in respect of the National Youth
Affairs Research Scheme.
This account is non-interest bearing
Balance carried from previous period
658
Receipts from other governments
-
168
GST Credits (FMA Act section 30A)
-
13
Total credits
-
839
Payments made - other
-
(149)
Payments made to suppliers
-
-
Total Debits
-
(149)
Balance carried to next period (excluding investment balances) and represented
by:
-
690
Cash - transferred to the Official Public Account
-
690
Restructuring
-
(690)
Total balance carried to the next period
-
-
The National Youth Affairs Research Scheme Special Account (Administered) was transferred to the Department of
Education, Employment and Workplace Relations as part of the January 2008 Administrative Arrangements Orders
(AAO).
-71-

458 FaHCSIA Annual Report 2008–2009 Part5 Financial management Chapter 17 Financial statements
Notes to and forming part of the Financial Statements
Note 26
Special Accounts (continued)
Aboriginals Benefit Account - Special Account (Administered)
2009
2008
$'000
$'000
Legal Authority: Aboriginal land Rights (Northern Territory) Act 1976; s62, s63, s64 and s65
Appropriation: Financial Management and Accountability Act 1997: s21
Purpose: for the receipt and disbursement of the equivalent of mining royalty monies derived.
This account is interest bearing
Balance carried from previous period
5,772
7,849
Appropriation for reporting period
218,515
82,744
Realised investments
120,150
132,714
Interest receipts
12,302
15,057
Other receipts
-
-
Total credits
356,739
238,364
Payments made - employee
(29)
(17)
Payments made - suppliers
(206)
(610)
Payments made - grants
(26,151)
(20,311)
Payments made - township lease payments
(5,465)
(5,000)
Payments made - land councils
(94,255)
(50,061)
Investments debited from the special account (FMA Act s39)
(211,000)
(156,593)
Total Debits
(337,106)
(232,592)
Balance carried to next period (excluding investment balances) and represented
by:
19,633
5,772
Cash - held by FaHCSIA
19,633
5,772
Total balance carried to the next period
19,633
5,772
Aboriginals Benefit Account
Investment of Public Money:
Special Appropriations under section 39 of the FMA Act
2009
2008
$'000
$'000
Opening Balance
191,250
170,861
Movements in deposits at call account
3,900
(3,490)
Investments made - from special account
211,000
156,593
Investments realised
(120,150)
(132,714)
Closing Balance
286,000
191,250
-72-

459Chapter 17 Financial statements Part5 Financial management FaHCSIA Annual Report 2008–2009
Fina
ncia
l man
agem
ent
Part 5
Notes to and forming part of the Financial Statements
Note 26
Special Accounts (continued)
Aboriginal and Torres Strait Islander Land Account (Administered)
2009
2008
$'000
$'000
Legal Authority: Section 192W of the Aboriginal and Torres Strait Islander Act 2005
Appropriation: Financial Management and Accountability Act 1997; s21
Purpose: to provide a secure stream of income to the Indigenous Land Corporation in perpetuity to provide economic,
environmental, social and cultural benefits for Aboriginal people and Torres Strait Islanders by assisting in the
acquisition and management of an Indigenous land base.
This account is interest bearing
Balance carried from previous period
166
313
Realised Investments
1,713,697
1,895,918
Interest receipts
122,663
82,146
Total credits
1,836,526
1,978,377
Payments made to the Indigenous Land Corporation
(44,789)
-
Investments debited from the special account (FMA Act s39)
(1,791,416)
(1,978,211)
Payments made to suppliers
-
-
Total Debits
(1,836,205)
(1,978,211)
Balance carried to next period (excluding investment balances) and represented
by:
321
166
Cash - held by FaHCSIA
321
166
Total balance carried to the next period
321
166
Aboriginal and Torres Strait Islander Land Account
Investment of Public Money:
Special Appropriations under section 39 of the FMA Act
2009
2008
$'000's
$'000's
Opening Balance
1,635,510
1,553,217
Investments made
1,791,416
1,978,211
Investments realised
(1,713,697)
(1,895,918)
Closing Balance
1,713,229
1,635,510
Aboriginal Advancement Trust Account (Administered)
2009
2008
$'000's
$'000's
Legal Authority: Aboriginal Land (Lake Condah and Framlingham Forest) Act 1987; section 38
Appropriation:Financial Management and Accountability Act 1997; section 21
Purpose: furthering the social and economic advancement of Aboriginal people living in Victoria.
This account is non-interest bearing
Balance carried from previous period
-
619
Total credits
-
619
Payments made
-
(619)
Total Debits
-
(619)
Balance carried to next period (excluding investment balances) and represented
by:
-
-
Cash - held by FaHCSIA
-
-
Total balance carried to the next period
-
-
-73-

460 FaHCSIA Annual Report 2008–2009 Part5 Financial management Chapter 17 Financial statements
Notes to and forming part of the Financial Statements
Note 26
Special Accounts (continued)
Comcare Trust Account (Administered)
2009
2008
$'000's
$'000's
Legal Authority: Safety Rehabilitation and Compensation Act 1988
Purpose: distributing compensation payments.
This account is non-interest bearing
Balance carried from previous period
-
426
Total credits
-
426
Payments made
-
(426)
Total debits
-
(426)
Balance carried to next period (excluding investment balances) and represented
by:
-
-
Cash - held by FaHCSIA
-
-
Total balance carried to the next period
-
-
Commonwealth, State, Territory Disability Agreement Special Account
(Administered)
2009
2008
$'000
$'000
Legal Authority: Financial Management and Accountability Act 1997; section 20
Appropriation: Financial Management and Accountability Determination 2006; section 30
Purpose: for expenditure on projects which relate to the Commonwealth, State, Territory Disability Agreement.
This account is non-interest bearing
Balance carried from previous period
221
531
Appropriation for reporting period
2,700
-
GST Credits (FMA Act s30A)
58
33
Other Receipts
380
19
Total credits
3,359
583
Payments made to suppliers
(640)
(362)
Total debits
(640)
(362)
Balance carried to next period (excluding investment balances) and represented
by:
2,719
221
Cash - transferred to the OPA
2,719
221
Total balance carried to the next period
2,719
221
-74-

461Chapter 17 Financial statements Part5 Financial management FaHCSIA Annual Report 2008–2009
Fina
ncia
l man
agem
ent
Part 5
Notes to and forming part of the Financial Statements
Note 26
Special Accounts (continued)
Northern Territory Flexible Funding Pool Special Account (Administered)
2009
2008
$'000
$'000
Legal Authority: Financial Management and Accountability Determination 2007/21 - Northern Territory Flexible
Funding Pool Special Account Establishment 2007
Appropriation: Financial Management and Accountability Act 1997; section 20
Purpose: flexible funding pool to resource employment creation initiatives, undertaken by Commonwealth agencies
and non-Commonwealth entities in relation to the Northern Territory Emergency response.
This account is non-interest bearing
Balance carried from previous period
28,735
-
Appropriation for reporting period
105,387
46,462
GST credits (FMA Act s30A)
2,628
830
Other receipts
212
-
Total credits
136,962
47,292
Payments made
(60,884)
(18,557)
Total debits
(60,884)
(18,557)
Balance carried to next period (excluding investment balances) and represented
by:
76,078
28,735
Cash - transferred to the Official Public Account
76,078
28,735
Total balance carried to the next period
76,078
28,735
Agency Amount paid
on behalf of
agency 2009
Amount paid
to agency 2009
Amount paid
on behalf of
agency 2008
Amount paid to
agency 2008
$'000
$'000
$'000
$'000
Attorney-General's Department
-
3,209
1,474
-
Department of Education, Employment and
Workplace Relations
-
9,534
4,241
522
Department of the Environment, Water, Heritage
and the Arts
-
17,053
3,344
777
Department of Health and Ageing, Northern
Territory
-
10,863
3,476
700
Families, Housing, Community Services and
Indigenous Affairs
-
5,185
1,959
546
Northern Territory Government
-
6,766
688
-
Indigenous Land Corporation
-
5,646
-
-
Total
-
58,256
15,182
2,545
The amounts in the above table are exclusive of GST. From 1 July 2008 all payments were made directly to agencies
and not to service providers on behalf of other agencies.
-75-

462 FaHCSIA Annual Report 2008–2009 Part5 Financial management Chapter 17 Financial statements
Notes to and forming part of the Financial Statements
Note 27:
Compensation and Debt Relief
2009
$ 2008
$
Administered
55 'Act of Grace' expenses were incurred during the reporting period
(2008: 71 payments).
410,292
368,671
17 of the above expenses amounting to $113,287 were paid on a periodic basis
(2007-08: 17 payments amounting to $125,226). The estimated amount outstanding
in relation to payments being made on a periodic basis as at 30 June 2009 was
$307,014 ($369,231 at 30 June 2008).
No waivers of amounts owing to the Commonwealth were made pursuant to
subsection 34(1) of the Financial Management and Accountability Act 1997 (2008:
No waivers)
-
-
484,811 waivers of amounts owing to the Commonwealth were made pursuant to
s1237 of the Social Security Act (2008: 398,173 waivers).
41,859,206
28,302,555
8,887 ex-gratia payments were provided for during the reporting period
(2008: 6,747 payments). Ex-gratia programmes provide financial assistance to
victims of national and international disasters.
15,376,304
9,331,962
No payments were made under the 'Defective Administration Scheme' during the
reporting period (2008: No payments).
-
-
Departmental
No payments were made under the 'Defective Administration Scheme' during the
reporting period (2008: No payments made).
-
-
No payments were made under s73 of the Public Service Act 1999 during the
reporting period. (2008: 1 payment).
-
9,033
FaHCSIA make act of grace payments on behalf of other agencies including
DEEWR, and DAFF. These payments are included in the information disclosed
above.
-76-

463Chapter 17 Financial statements Part5 Financial management FaHCSIA Annual Report 2008–2009
Fina
ncia
l man
agem
ent
Part 5
Not
es to
and
form
ing
part
of t
he F
inan
cial
Sta
tem
ents
Not
e 28
:
Rep
ortin
g of
Out
com
es
Not
e 28
A:
N
et C
ost o
f Out
com
e D
eliv
ery
O
utco
me
1
Out
com
e 2
O
utco
me
3
Out
com
e 4
Pa
ymen
ts to
CA
C
Act
bod
ies
T
otal
20
09
2008
20
09
2008
20
09
2008
20
09
2008
20
09
2008
20
09
2008
$'00
0
$'00
0
$'00
0
$'00
0
$'00
0
$'00
0
$'00
0
$'00
0
$'00
0
$'00
0
$'00
0
$'00
0
Expe
nses
Adm
inis
tere
d
1,10
5,76
5
915,
478
46
,495
,779
36
,097
,245
27
,083
,854
17
,418
,164
92
7,55
5
1,31
5,32
0
124,
060
-
75
,737
,013
55
,746
,207
Dep
artm
enta
l
322,
942
36
0,03
8
673,
896
49
6,49
4
575,
989
51
4,85
8
132,
454
11
4,00
9
-
-
1,70
5,28
1
1,48
5,39
9
Tota
l exp
ense
s
1,42
8,70
7
1,27
5,51
6
47,1
69,6
75
36,5
93,7
39
27,6
59,8
43
17,9
33,0
22
1,06
0,00
9
1,42
9,32
9
124,
060
-
77
,442
,294
57
,231
,606
Cos
ts r
ecov
ered
from
pro
visi
on o
f goo
ds a
nd se
rvic
es to
the
non-
gove
rnm
ent s
ecto
r
Adm
inis
tere
d
-
-
-
-
-
-
-
-
-
-
-
-
Dep
artm
enta
l
1,10
6
365
2,
307
50
3
1,97
2
521
66
8
116
-
-
6,
053
1,
505
Tota
l cos
ts re
cove
red
-
-
-
-
-
-
-
-
-
-
-
-
Tota
l cos
ts re
cove
red
1,
106
36
5
2,30
7
503
1,
972
52
1
668
11
6
-
-
6,05
3
1,50
5
Oth
er e
xter
nal i
ncom
e
Oth
er
219,
637
22
2,21
3
131,
883
54
,940
30
6,64
3
298,
544
1,
570
3,
778
-
-
65
9,73
3
579,
475
Adm
inis
tere
d
219,
637
22
2,21
3
131,
883
54
,940
30
6,64
3
298,
544
1,
570
3,
778
-
-
65
9,73
3
579,
475
Inte
rest
on
cash
dep
osits
-
-
-
-
-
-
-
-
-
-
-
-
Rev
enue
from
dis
posa
l of a
sset
s
9
-
19
-
17
-
4
-
-
-
49
-
Oth
er e
xter
nal r
even
ues
1,
788
3,
020
3,
730
4,
165
3,
188
4,
319
86
4
957
-
-
9,
570
12
,461
Dep
artm
enta
l
1,79
7
3,02
0
3,74
9
4,16
5
3,20
5
4,31
9
868
95
7
-
-
9,61
9
12,4
61
Tota
l oth
er e
xter
nal i
ncom
e
221,
434
22
5,23
3
135,
632
59
,105
30
9,84
8
302,
863
2,
438
4,
735
-
-
66
9,35
2
591,
936
Net
cos
t of o
utco
me
1,
206,
167
1,
049,
918
47
,031
,736
36
,534
,131
27
,348
,023
17
,629
,638
1,
056,
903
1,
424,
478
12
4,06
0
-
76,7
66,8
89
56,6
38,1
65
-77-
Not
es to
and
form
ing
part
of t
he F
inan
cial
Sta
tem
ents
Not
e 28
:
Rep
ortin
g of
Out
com
es
Not
e 28
A:
N
et C
ost o
f Out
com
e D
eliv
ery
O
utco
me
1
Out
com
e 2
O
utco
me
3
Out
com
e 4
Pa
ymen
ts to
CA
C
Act
bod
ies
T
otal
20
09
2008
20
09
2008
20
09
2008
20
09
2008
20
09
2008
20
09
2008
$'00
0
$'00
0
$'00
0
$'00
0
$'00
0
$'00
0
$'00
0
$'00
0
$'00
0
$'00
0
$'00
0
$'00
0
Expe
nses
Adm
inis
tere
d
1,10
5,76
5
915,
478
46
,495
,779
36
,097
,245
27
,083
,854
17
,418
,164
92
7,55
5
1,31
5,32
0
124,
060
-
75
,737
,013
55
,746
,207
Dep
artm
enta
l
322,
942
36
0,03
8
673,
896
49
6,49
4
575,
989
51
4,85
8
132,
454
11
4,00
9
-
-
1,70
5,28
1
1,48
5,39
9
Tota
l exp
ense
s
1,42
8,70
7
1,27
5,51
6
47,1
69,6
75
36,5
93,7
39
27,6
59,8
43
17,9
33,0
22
1,06
0,00
9
1,42
9,32
9
124,
060
-
77
,442
,294
57
,231
,606
Cos
ts r
ecov
ered
from
pro
visi
on o
f goo
ds a
nd se
rvic
es to
the
non-
gove
rnm
ent s
ecto
r
Adm
inis
tere
d
-
-
-
-
-
-
-
-
-
-
-
-
Dep
artm
enta
l
1,10
6
365
2,
307
50
3
1,97
2
521
66
8
116
-
-
6,
053
1,
505
Tota
l cos
ts re
cove
red
-
-
-
-
-
-
-
-
-
-
-
-
Tota
l cos
ts re
cove
red
1,
106
36
5
2,30
7
503
1,
972
52
1
668
11
6
-
-
6,05
3
1,50
5
Oth
er e
xter
nal i
ncom
e
Oth
er
219,
637
22
2,21
3
131,
883
54
,940
30
6,64
3
298,
544
1,
570
3,
778
-
-
65
9,73
3
579,
475
Adm
inis
tere
d
219,
637
22
2,21
3
131,
883
54
,940
30
6,64
3
298,
544
1,
570
3,
778
-
-
65
9,73
3
579,
475
Inte
rest
on
cash
dep
osits
-
-
-
-
-
-
-
-
-
-
-
-
Rev
enue
from
dis
posa
l of a
sset
s
9
-
19
-
17
-
4
-
-
-
49
-
Oth
er e
xter
nal r
even
ues
1,
788
3,
020
3,
730
4,
165
3,
188
4,
319
86
4
957
-
-
9,
570
12
,461
Dep
artm
enta
l
1,79
7
3,02
0
3,74
9
4,16
5
3,20
5
4,31
9
868
95
7
-
-
9,61
9
12,4
61
Tota
l oth
er e
xter
nal i
ncom
e
221,
434
22
5,23
3
135,
632
59
,105
30
9,84
8
302,
863
2,
438
4,
735
-
-
66
9,35
2
591,
936
Net
cos
t of o
utco
me
1,
206,
167
1,
049,
918
47
,031
,736
36
,534
,131
27
,348
,023
17
,629
,638
1,
056,
903
1,
424,
478
12
4,06
0
-
76,7
66,8
89
56,6
38,1
65
-77-

464 FaHCSIA Annual Report 2008–2009 Part5 Financial management Chapter 17 Financial statements
Not
es to
and
form
ing
part
of t
he F
inan
cial
Sta
tem
ents
Not
e 28
B:
M
ajor
Cla
sses
of D
epar
tmen
tal I
ncom
e an
d E
xpen
ses b
y O
utpu
t Gro
ups a
nd O
utpu
ts
Out
com
e 1
O
utpu
t Gro
up 1
.1
Out
put G
roup
1.2
O
utpu
t Gro
up 1
.3
Out
com
e 1
Tot
al
20
09
2008
20
09
2008
20
09
2008
20
09
2008
$'00
0
$'00
0
$'00
0
$'00
0
$'00
0
$'00
0
$'00
0
$'00
0
Dep
artm
enta
l exp
ense
s
Empl
oyee
s
13,4
97
34,6
89
44,6
34
34,8
72
1,72
8
1,17
0
59,8
59
70,7
31
Supp
liers
10
,823
25
,769
35
,791
25
,905
1,
387
86
9
48,0
01
52,5
43
Dep
reci
atio
n an
d am
ortis
atio
n
1,38
6
2,89
8
4,58
3
2,91
3
178
97
6,
147
5,
908
Oth
er e
xpen
ses
47
,110
11
3,22
0
155,
789
11
3,81
8
6,03
6
3,81
8
208,
935
23
0,85
6
Tot
al d
epar
tmen
tal e
xpen
ses
72
,816
17
6,57
6
240,
797
17
7,50
8
9,32
9
5,95
4
322,
942
36
0,03
8
Fund
ed b
y:
Dep
artm
enta
l inc
ome
Rev
enue
s fro
m g
over
nmen
t
70,7
86
171,
390
23
4,08
5
172,
294
9,
070
5,
780
31
3,94
1
349,
464
Sale
of g
oods
and
serv
ices
1,
431
2,
538
4,
731
2,
551
18
3
86
6,34
5
5,17
5
Oth
er n
on-ta
x re
venu
e
411
1,
487
1,
358
1,
495
52
50
1,
821
3,
032
Tot
al d
epar
tmen
tal i
ncom
e
72,6
28
175,
415
24
0,17
4
176,
340
9,
305
5,
916
32
2,10
7
357,
671
-78-

465Chapter 17 Financial statements Part5 Financial management FaHCSIA Annual Report 2008–2009
Fina
ncia
l man
agem
ent
Part 5
Not
es to
and
form
ing
part
of t
he F
inan
cial
Sta
tem
ents
Out
com
e 2
O
utpu
t Gro
up 2
.1
Out
put G
roup
2.2
O
utpu
t Gro
up 2
.3
20
09
2008
20
09
2008
20
09
2008
$'00
0
$'00
0
$'00
0
$'00
0
$'00
0
$'00
0
Dep
artm
enta
l exp
ense
s
Empl
oyee
s
67,2
46
57,8
37
33,9
47
21,6
39
17,5
21
11,3
09
Supp
liers
53
,929
42
,965
27
,222
16
,075
14
,050
8,
401
Dep
reci
atio
n an
d am
ortis
atio
n
6,90
5
4,83
1
3,48
6
1,80
7
1,79
9
945
Oth
er e
xpen
ses
23
4,71
6
188,
773
11
8,49
0
70,6
26
61,1
56
36,9
10
Tot
al d
epar
tmen
tal e
xpen
ses
36
2,79
6
294,
406
18
3,14
5
110,
147
94
,526
57
,565
Fund
ed b
y:
Rev
enue
s fro
m g
over
nmen
t
352,
679
28
5,75
9
178,
040
10
6,91
2
91,8
92
55,8
73
Sale
of g
oods
and
serv
ices
7,
128
4,
231
3,
598
1,
583
1,
857
82
7
Oth
er n
on-ta
xatio
n re
venu
es
2,04
6
2,48
0
1,03
3
928
53
3
485
Tot
al d
epar
tmen
tal i
ncom
e
361,
853
29
2,47
0
182,
671
10
9,42
3
94,2
82
57,1
85
Out
com
e 2
(con
tinue
d)
Out
put G
roup
2.4
O
utpu
t Gro
up 2
.5
Out
com
e 2
Tot
al
20
09
2008
20
09
2008
20
09
2008
$'00
0
$'00
0
$'00
0
$'00
0
$'00
0
$'00
0
Dep
artm
enta
l exp
ense
s
Empl
oyee
s
1,36
0
1,88
3
4,84
1
4,87
0
124,
915
97
,538
Supp
liers
1,
090
1,
399
3,
879
3,
618
10
0,17
0
72,4
58
Dep
reci
atio
n an
d am
ortis
atio
n
140
15
7
497
40
7
12,8
27
8,14
7
Oth
er e
xpen
ses
4,
746
6,
146
16
,876
15
,896
43
5,98
4
318,
351
Tot
al d
epar
tmen
tal e
xpen
ses
7,
336
9,
585
26
,093
24
,791
67
3,89
6
496,
494
Fund
ed b
y:
Dep
artm
enta
l inc
ome
Rev
enue
s fro
m g
over
nmen
t
7,13
1
9,30
4
25,3
72
24,0
64
655,
114
48
1,91
2
Sale
of g
oods
and
serv
ices
14
4
138
51
4
356
13
,241
7,
135
Oth
er n
on-ta
xatio
n re
venu
es
41
81
147
20
9
3,80
0
4,18
3
Tot
al d
epar
tmen
tal i
ncom
e
7,31
6
9,52
3
26,0
33
24,6
29
672,
155
49
3,23
0
-79-
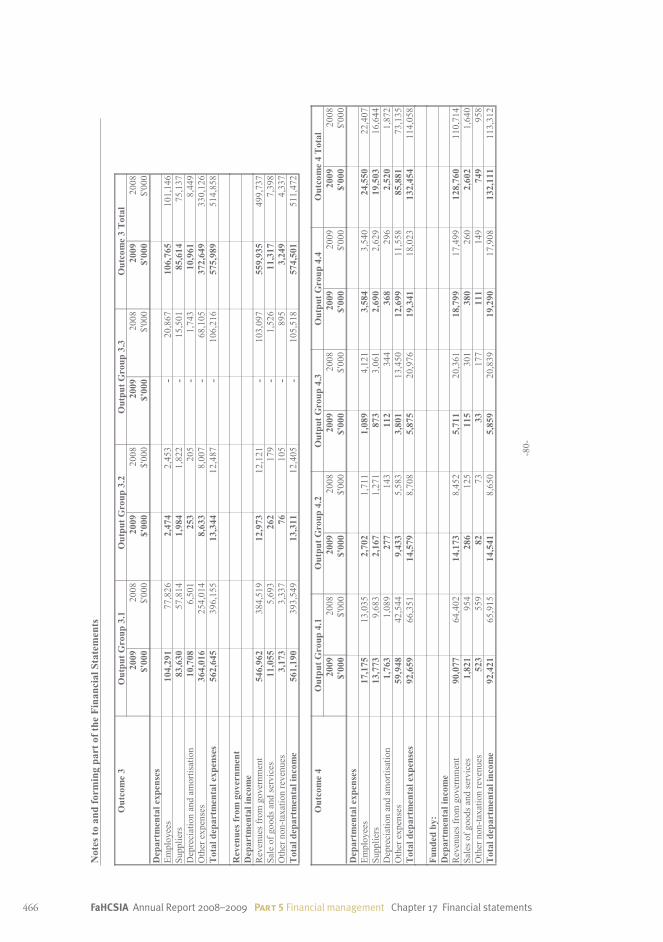
466 FaHCSIA Annual Report 2008–2009 Part5 Financial management Chapter 17 Financial statements
Not
es to
and
form
ing
part
of t
he F
inan
cial
Sta
tem
ents
Out
com
e 3
O
utpu
t Gro
up 3
.1
Out
put G
roup
3.2
O
utpu
t Gro
up 3
.3
Out
com
e 3
Tot
al
20
09
2008
20
09
2008
20
09
2008
20
09
2008
$'00
0
$'00
0
$'00
0
$'00
0
$'00
0
$'00
0
$'00
0
$'00
0
Dep
artm
enta
l exp
ense
s
Empl
oyee
s
104,
291
77
,826
2,
474
2,
453
-
20
,867
10
6,76
5
101,
146
Supp
liers
83
,630
57
,814
1,
984
1,
822
-
15
,501
85
,614
75
,137
Dep
reci
atio
n an
d am
ortis
atio
n
10,7
08
6,50
1
253
20
5
-
1,74
3
10,9
61
8,44
9
Oth
er e
xpen
ses
36
4,01
6
254,
014
8,
633
8,
007
-
68
,105
37
2,64
9
330,
126
Tot
al d
epar
tmen
tal e
xpen
ses
56
2,64
5
396,
155
13
,344
12
,487
-
10
6,21
6
575,
989
51
4,85
8
Rev
enue
s fro
mgo
vern
men
t
Dep
artm
enta
l inc
ome
Rev
enue
s fro
m g
over
nmen
t
546,
962
38
4,51
9
12,9
73
12,1
21
-
103,
097
55
9,93
5
499,
737
Sale
of g
oods
and
serv
ices
11
,055
5,
693
26
2
179
-
1,
526
11
,317
7,
398
Oth
er n
on-ta
xatio
n re
venu
es
3,17
3
3,33
7
76
105
-
89
5
3,24
9
4,33
7
Tot
al d
epar
tmen
tal i
ncom
e
561,
190
39
3,54
9
13,3
11
12,4
05
-
105,
518
57
4,50
1
511,
472
Out
com
e 4
O
utpu
t Gro
up 4
.1
Out
put G
roup
4.2
O
utpu
t Gro
up 4
.3
Out
put G
roup
4.4
O
utco
me
4 T
otal
2009
20
08
2009
20
08
2009
20
08
2009
20
09
2009
20
08
$'
000
$'
000
$'
000
$'
000
$'
000
$'
000
$'
000
$'
000
$'
000
$'
000
Dep
artm
enta
l exp
ense
s
Empl
oyee
s
17,1
75
13,0
35
2,70
2
1,71
1
1,08
9
4,12
1
3,58
4
3,54
0
24,5
50
22,4
07
Supp
liers
13
,773
9,
683
2,
167
1,
271
87
3
3,06
1
2,69
0
2,62
9
19,5
03
16,6
44
Dep
reci
atio
n an
d am
ortis
atio
n
1,76
3
1,08
9
277
14
3
112
34
4
368
29
6
2,52
0
1,87
2
Oth
er e
xpen
ses
59
,948
42
,544
9,
433
5,
583
3,
801
13
,450
12
,699
11
,558
85
,881
73
,135
Tot
al d
epar
tmen
tal e
xpen
ses
92
,659
66
,351
14
,579
8,
708
5,
875
20
,976
19
,341
18
,023
13
2,45
4
114,
058
Fund
ed b
y:
Dep
artm
enta
l inc
ome
Rev
enue
s fro
m g
over
nmen
t
90,0
77
64,4
02
14,1
73
8,45
2
5,71
1
20,3
61
18,7
99
17,4
99
128,
760
11
0,71
4
Sale
s of g
oods
and
serv
ices
1,
821
95
4
286
12
5
115
30
1
380
26
0
2,60
2
1,64
0
Oth
er n
on-ta
xatio
n re
venu
es
523
55
9
82
73
33
177
11
1
149
74
9
958
Tot
al d
epar
tmen
tal i
ncom
e
92,4
21
65,9
15
14,5
41
8,65
0
5,85
9
20,8
39
19,2
90
17,9
08
132,
111
11
3,31
2
-80-

467Chapter 17 Financial statements Part5 Financial management FaHCSIA Annual Report 2008–2009
Fina
ncia
l man
agem
ent
Part 5
Not
es to
and
form
ing
part
of t
he F
inan
cial
Sta
tem
ents
Not
e 28
C:
M
ajor
Cla
sses
of D
epar
tmen
tal A
sset
s and
Lia
bilit
ies b
y O
utco
mes
O
utco
me
1
Out
com
e 2
O
utco
me
3
Out
com
e 4
N
ot a
ttri
bute
d
Tot
al
20
09
2008
20
09
2008
20
09
2008
20
09
2008
20
09
2008
20
09
2008
$'00
0
$'00
0
$'00
0
$'00
0
$'00
0
$'00
0
$'00
0
$'00
0
$'00
0
$'00
0
$'00
0
$'00
0
Dep
artm
enta
l ass
ets
Fina
ncia
l Ass
ets
-
-
-
-
-
-
-
-
-
-
-
-
Cas
h an
d ca
sh e
quiv
alen
ts
-
-
-
-
-
-
-
-
5,82
7
5,12
9
5,82
7
5,12
9
Trad
e an
d ot
her r
ecei
vabl
es
-
-
-
-
-
-
-
-
149,
483
10
1,09
9
149,
483
10
1,09
9
Non
Fin
anci
al A
sset
s
Land
and
Bui
ldin
gs
32,4
53
24,0
73
69,2
75
57,2
67
60,3
12
53,9
36
13,3
09
9,87
3
-
-
175,
349
14
5,14
9
Infr
astru
ctur
e
3,69
8
2,66
7
8,03
6
6,34
4
7,09
4
5,97
5
1,51
8
1,09
3
-
-
20,3
46
16,0
79
Inta
ngib
les
10
,176
7,
931
21
,294
18
,867
18
,242
17
,770
4,
175
3,
252
-
-
53
,887
47
,820
Oth
er n
on-f
inan
cial
ass
ets
1,
253
3,
640
11
,289
8,
661
9,
726
8,
158
1,
475
2,
494
-
-
23
,743
22
,953
Tot
al d
epar
tmen
tal a
sset
s
47,5
80
38,3
11
109,
894
91
,139
95
,374
85
,839
20
,477
16
,712
15
5,31
0
106,
228
42
8,63
5
338,
229
Dep
artm
enta
l lia
bilit
ies
Paya
bles
Supp
liers
7,
434
7,
884
16
,808
18
,756
15
,284
17
,665
3,
050
3,
235
-
-
42
,576
47
,540
Oth
er P
ayab
les
15
,773
4,
534
34
,174
10
,402
30
,669
9,
868
7,
009
1,
867
-
-
87
,625
26
,671
Inte
rest
Bea
ring
Lia
bilit
ies
Leas
es
-
29
-
69
-
65
-
11
-
-
-
174
Prov
isio
ns
Empl
oyee
Pro
visi
ons
14
,066
9,
894
30
,476
22
,698
27
,350
21
,534
6,
251
4,
074
-
-
78
,143
58
,200
Oth
er P
rovi
sion
s
537
1,
619
1,
277
3,
853
1,
203
3,
629
22
0
664
-
-
3,
237
9,
765
Tot
al d
epar
tmen
tal l
iabi
litie
s
37,8
10
23,9
60
82,7
35
55,7
78
74,5
06
52,7
61
16,5
30
9,85
1
-
-
211,
581
14
2,35
0
-81-

468 FaHCSIA Annual Report 2008–2009 Part5 Financial management Chapter 17 Financial statements
Not
es to
and
form
ing
part
of t
he F
inan
cial
Sta
tem
ents
Not
e 28
D:
M
ajor
Cla
sses
of A
dmin
ister
ed In
com
e, E
xpen
ses,
Ass
ets a
nd L
iabi
litie
s by
Out
com
es
O
utco
me
1
Out
com
e 2
O
utco
me
3
Out
com
e 4
Pa
ymen
ts to
CA
C A
ct
bodi
es
Not
attr
ibut
ed
Tota
l
20
09
2008
20
09
2008
20
09
2008
20
09
2008
20
09
2008
20
09
2008
20
09
2008
$'00
0
$'00
0
$'00
0
$'00
0
$'00
0
$'00
0
$'00
0
$'00
0
$'00
0
$'00
0
$'00
0
$'00
0
$'00
0
$'00
0
Adm
inist
ered
exp
ense
s
Gra
nts
82
2,30
9
708,
569
97
9,85
0
1,32
4,91
2
195,
202
43
2,50
9
722,
618
1,
231,
015
-
-
-
-
2,
719,
979
3,
697,
005
Subs
idie
s
-
-
12,8
50
12,8
62
-
-
-
-
-
-
-
-
12,8
50
12,8
62
Pers
onal
ben
efits
-
92
2
45,4
59,9
71
34,7
10,5
41
26,7
24,5
91
16,9
77,1
06
197,
823
79
,285
-
-
-
-
72
,382
,385
51
,767
,854
Supp
liers
11
2,36
0
109,
787
31
,810
40
,753
(3
5,03
5)
8,15
6
7,07
5
2,80
8
-
-
-
-
116,
210
16
1,50
4
Paym
ents
to C
AC
bod
ies
-
-
-
-
-
-
-
-
12
4,06
0
-
-
-
124,
060
-
Oth
er
171,
096
96
,200
11
,298
8,
177
19
9,09
6
393
39
2,
212
-
-
-
-
38
1,52
9
106,
982
Tota
l Adm
inist
ered
exp
ense
s
1,10
5,76
5
915,
478
46
,495
,779
36
,097
,245
27
,083
,854
17
,418
,164
92
7,55
5
1,31
5,32
0
124,
060
-
-
-
75
,737
,013
55
,746
,207
Adm
inist
ered
inco
me
Oth
er
219,
637
22
2,21
3
131,
883
54
,940
30
6,64
3
298,
544
1,
570
3,
778
-
-
-
-
65
9,73
3
579,
475
Tota
l Adm
inist
ered
inco
me
21
9,63
7
222,
213
13
1,88
3
54,9
40
306,
643
29
8,54
4
1,57
0
3,77
8
-
-
-
-
659,
733
57
9,47
5
Adm
inist
ered
ass
ets
Cas
h an
d C
ash
Equi
vale
nts
19
,954
5,
938
-
-
-
-
-
-
-
-
3,
903
5,
869
23
,857
11
,807
Tota
l Rec
eiva
bles
net
37
,984
41
,719
11
5,91
7
260,
501
77
4,12
5
682,
024
15
9,96
4
4,08
6
-
-
-
-
1,08
7,99
0
988,
330
Inve
stm
ents
in C
omm
onw
ealth
entit
ies
1,
638,
908
1,
503,
327
-
-
-
-
-
-
-
-
-
-
1,
638,
908
1,
503,
327
Inve
stm
ents
in D
epos
its a
nd
Gov
ernm
ent S
ecur
ities
2,
021,
234
1,
861,
925
-
-
-
-
-
-
-
-
-
-
2,
021,
234
1,
861,
925
Land
and
Bui
ldin
gs
2,92
3
-
-
-
-
-
-
-
-
-
-
-
2,92
3
-
Oth
er n
on F
inan
cial
Ass
ets
11
,499
4,
794
-
41
0
1,07
1
1,86
1
-
-
-
-
-
-
12,5
70
7,06
5
Tota
l adm
inist
ered
ass
ets
3,
732,
502
3,
417,
703
11
5,91
7
260,
911
77
5,19
6
683,
885
15
9,96
4
4,08
6
-
-
3,90
3
5,86
9
4,78
7,48
2
4,37
2,45
4
Adm
inist
ered
liab
ilitie
s
Pers
onal
Ben
efit
Prov
isio
ns
-
-
557,
000
43
9,00
0
5,06
7,23
7
2,73
2,76
3
-
-
-
-
-
-
5,62
4,23
7
3,17
1,76
3
Pers
onal
Ben
efits
-
-
86
8,89
2
745,
401
1,
313,
657
29
5,50
5
1,16
5
36
-
-
-
-
2,18
3,71
4
1,04
0,94
2
Gra
nts
23
0
3,01
6
1,60
2
860
33
8
197
12
,344
37
-
-
90
1,
278
14
,604
5,
388
Oth
er
14,7
62
29,1
77
5,09
7
3,63
4
919
92
1,
596
5
-
-
82
7
3,99
6
23,2
01
36,9
04
Tota
l Adm
inist
ered
liab
ilitie
s
14,9
92
32,1
93
1,43
2,59
1
1,18
8,89
5
6,38
2,15
1
3,02
8,55
7
15,1
05
78
-
-
917
5,
274
7,
845,
756
4,
254,
997
Not
e: It
ems c
lass
ified
as n
ot a
ttrib
uted
wer
e no
t abl
e to
be
attri
bute
d to
out
com
es g
iven
the
natu
re o
f the
se it
ems.
In a
dditi
on to
pay
men
ts o
f $12
4,06
0m to
CA
C A
ct b
odie
s sho
wn
abov
e, e
quity
inje
ctio
ns o
f $47
,980
m w
ere
mad
e to
thes
e C
AC
Act
bod
ies.
-82-
469Chapter 17 Financial statements Part5 Financial management FaHCSIA Annual Report 2008–2009
Fina
ncia
l man
agem
ent
Part 5
Aboriginals Benefit AccountThe Aboriginals Benefit Account (ABA) was established under Part VI of the Aboriginal Land Rights (Northern Territory) Act 1976 (the ALRA) and is a special account for the purposes of the Financial Management and Accountability Act 1997 (FMA Act). The ABA is established for the receipt of statutory royalty equivalent monies generated from mining on Aboriginal land in the Northern Territory, and the distribution of these monies.
The ABA is administered by the Department in accordance with the requirements of the ALRA and the FMA Act.
Thirty per cent of royalty equivalent receipts are distributed to incorporated Aboriginal associations, communities or groups in order to benefit those Aboriginal people who are affected by mining operations. ABA funds are also used to meet the operational costs of the four Land Councils in the NT, to make payments for the acquisition and administration of township leases as well as payments for the benefit of Aboriginal people living in the Northern Territory made at the Minister’s discretion.

470 FaHCSIA Annual Report 2008–2009 Part5 Financial management Chapter 17 Financial statements

471Chapter 17 Financial statements Part5 Financial management FaHCSIA Annual Report 2008–2009
Fina
ncia
l man
agem
ent
Part 5

472 FaHCSIA Annual Report 2008–2009 Part5 Financial management Chapter 17 Financial statements

473Chapter 17 Financial statements Part5 Financial management FaHCSIA Annual Report 2008–2009
Fina
ncia
l man
agem
ent
Part 5
ABORIGINALS BENEFIT ACCOUNT
INCOME STATEMENT
for the year ended 30 June 2009
30 June
30 June
2009
2008
Notes
$'000
$'000
INCOME
Revenue
Revenue from Government
3A
218,515
83,257
Interest
3B
17,224
12,253
Total revenue
235,739
95,510
Gains
Net gains from realisation of assets
3C
-
-
Resources received free of charge
3D
1,712
1,382
Total gains
1,712
1,382
Total Income
237,451
96,892
EXPENSES
Employee benefits
4A
1,386
1,125
Suppliers
4B
504
540
Grants
4C
26,031
403
Payments for township leases
4D
1,773
935
Payments to land councils for administrative purposes
4E
28,711
22,826
Distribution to land councils
4F
65,554
24,977
Total Expenses
123,959
50,806
Surplus
113,492
46,086
The above statement should be read in conjunction with the accompanying notes.
-3-

474 FaHCSIA Annual Report 2008–2009 Part5 Financial management Chapter 17 Financial statements
ABORIGINALS BENEFIT ACCOUNT
BALANCE SHEET
as at 30 June 2009
30 June
30 June
2009
2008
Notes
$'000
$'000
ASSETS
Financial Assets
Cash and cash equivalents
5A
19,633
5,772
Trade and other receivables
5B
30
39
Investments
5C
286,529
190,757
Total financial assets
306,192
196,568
Non-Financial Assets
Other non-financial assets
6A
8,723
4,732
Total non-financial assets
8,723
4,732
Total Assets
314,915
201,300
LIABILITIES
Payables
Suppliers
7A
364
118
Payables to land councils for administrative purposes
7B
8,179
8,179
Grants
7C
-
123
Total payables
8,543
8,420
Total Liabilities
8,543
8,420
Net Assets
306,372
192,880
EQUITY
Retained surplus
306,372
192,880
Total Equity
306,372
192,880
Current Assets
306,824
197,350
Non-Current Assets
8,091
4,389
Current Liabilities
8,543
8,859
Non-Current Liabilities
-
-
The above statement should be read in conjunction with the accompanying notes.
-4-

475Chapter 17 Financial statements Part5 Financial management FaHCSIA Annual Report 2008–2009
Fina
ncia
l man
agem
ent
Part 5
ABORIGINALS BENEFIT ACCOUNT
STATEMENT OF CHANGES IN EQUITY
as at 30 June 2009
Retained Earnings
Total Equity
2009
$'000 2008
$'000 2009
$'000 2008
$'000
Opening balance
Balance carried forward from previous period
192,880
146,794
192,880
146,794
Surplus for the period
113,492
46,086
113,492
46,086
Total income and expenses
113,492
46,086
113,492
46,086
Closing balance as at 30 June
306,372
192,880
306,372
192,880
The above statement should be read in conjunction with the accompanying notes.
-5-

476 FaHCSIA Annual Report 2008–2009 Part5 Financial management Chapter 17 Financial statements
ABORIGINALS BENEFIT ACCOUNT
CASH FLOW STATEMENT
for the year ended 30 June 2009
30 June
30 June
2009
2008
Notes
$'000
$'000
OPERATING ACTIVITIES
Cash received
Appropriations
218,515
82,744
Total cash received
218,515
82,744
Cash used
Grants
26,151
20,311
Suppliers
206
610
Employees
29
17
Payments for township leases
5,465
5,000
Payments to land councils for administrative purposes
28,701
25,084
Payments to land councils for distribution
65,554
24,977
Total cash used
126,106
75,999
Net cash from operating activities
8
92,409
6,745
INVESTING ACTIVITIES
Cash received
Proceeds from realisation of investments
120,150
132,714
Interest on investments
12,302
15,057
Total cash received
132,452
147,771
Cash used
Purchase of investments
211,000
156,593
Total cash used
211,000
156,593
Net cash (used by) investing activities
(78,548)
(8,822)
Net increase (decrease) in cash held
13,861
(2,077)
Cash and cash equivalents at the beginning of the reporting period
5,772
7,849
Cash and cash equivalents at the end of the reporting period
5A
19,633
5,772
The above statement should be read in conjunction with the accompanying notes.
-6-

477Chapter 17 Financial statements Part5 Financial management FaHCSIA Annual Report 2008–2009
Fina
ncia
l man
agem
ent
Part 5
ABORIGINALS BENEFIT ACCOUNT
SCHEDULE OF COMMITMENTS
as at 30 June 2009
30 June
30 June
2009
2008
$'000
$'000
BY TYPE
Commitments receivable
GST recoverable on commitments
(3,791)
(1,258)
Total commitments receivable
(3,791)
(1,258)
Other commitments
Project commitments
38,448
18,024
Payments to land councils
16,015
15,503
Other commitments
1,000
2,000
ABA Administration
1,512
-
Total other commitments
56,975
35,527
Net commitments by type
53,184
34,269
BY MATURITY
Commitments receivable
One year or less
(3,333)
(1,220)
From one to five years
(458)
(38)
Over five years
-
-
Total commitments receivable
(3,791)
(1,258)
Other commitments
One year or less
51,602
34,115
From one to five years
5,373
1,412
Over five years
-
-
Total other commitments
56,975
35,527
Net commitments by maturity
53,184
34,269
NB: Commitments were GST inclusive where relevant.
Commitments relate to administrative expenses to be paid to Land Councils approved by the Minister; activities
approved by the Minister to be distributed for the benefit of Aboriginals living in the Northern Territory; and
payments for township leases.
The above schedule should be read in conjunction with the accompanying notes.
-7-

478 FaHCSIA Annual Report 2008–2009 Part5 Financial management Chapter 17 Financial statements
ABORIGINALS BENEFIT ACCOUNT
SCHEDULE OF CONTINGENCIES
as at 30 June 2009
Contingent Liabilities Grant Funding
Programs
TOTAL
2009
2008
2009
2008
$'000
$'000
$'000
$'000
Balance from previous period
-
88,714 -
88,714New
-
- -
-
Re-measurement
-
(88,714) -
(88,714)Liabilities recognised
-
- -
-
Obligations expired
-
- -
-Total Contingent Liabilities
-
- -
-
There are no contingent assets.
Details of each class of contingent liabilities, including those not included above are disclosed in Note 9: Contingent
Liabilities and Assets.
The above schedule should be read in conjunction with the accompanying notes.
-8-

479Chapter 17 Financial statements Part5 Financial management FaHCSIA Annual Report 2008–2009
Fina
ncia
l man
agem
ent
Part 5
ABORIGINALS BENEFIT ACCOUNT
NOTES TO AND FORMING PART OF THE FINANCIAL STATEMENTS
for the year ended 30 June 2009
Note 1:
Summary of Significant Accounting Policies
10Note 2:
Events After the Balance Sheet Date
16
Note 3:
Income
17Note 4:
Expenses
18
Note 5:
Financial Assets
21Note 6:
Non-Financial Assets
21
Note 7:
Payables
22Note 8:
Cash Flow Reconciliation
23
Note 9:
Contingent Liabilities and Contingent Assets
24Note 10:
Remuneration of Auditors
24
Note 11:
Investments
25Note 12:
Financial Instruments
26
Note 13:
Compensation and Debt Relief
30Note 14:
Special Accounts
31
-9-

480 FaHCSIA Annual Report 2008–2009 Part5 Financial management Chapter 17 Financial statements
Notes to and forming part of the Financial Statements
Note 1:
Summary of Significant Accounting Policies
1.1
Objectives of Aboriginals Benefit Account
The objective of the Aboriginals Benefit Account (ABA) is to contribute to the recognition and protection of land
rights in the Northern Territory by the effective and efficient administration of those provisions in the Aboriginal
Land Rights (Northern Territory) Act 1976 (the Act) which provides for the operations of the ABA. The ABA is
structured to meet one outcome:
· The ongoing capacity to contribute to the economic, social and cultural empowerment of Aboriginal people in the
Northern Territory so that they may freely exercise their rights equitably with other Australians.
The continued existence of the ABA in its present form and with its present programs is dependant on Government
policy and on continuing appropriations by Parliament for the ABA's administration and programs.
1.2
Basis of Preparation of the Financial Statements
As specified under section 64B of the Act, the Financial Statements and notes are required by section 49 of the
Financial Management and Accountability Act 1997 and are a general purpose financial report.
The ABA’s activities are classified as administered activities carried out by the Department of Families, Housing,
Community Services and Indigenous Affairs (FaHCSIA) on behalf of the Commonwealth and reported in its
administered financial statements, the ABA prepares a separate set of audited financial statements as required by the
Act.
The Minister for Finance and Deregulation has issued the ABA with an exemption from the application of
administered reporting requirements required by the Finance Minister's Orders (FMOs) for reporting periods on or
after 1 July 2008. This has been done on the basis that disclosure of accounts on a purely administered basis would
not satisfy the definition of a general purpose financial report.
The Financial Statements and notes have been prepared in accordance with:
· the exemptions granted as part of the FMOs Part C-17 for reporting periods ending on or after 1 July 2008, to
present its administered activities in departmental format as illustrated in Annexure A; and
· Australian Accounting Standards and Interpretations issued by the Australian Accounting Standards Board
(AASB) that apply for the reporting period.
The Minister for Finance and Deregulation has specifically exempt the ABA from complying with the following
requirements of the FMOs.
(a)
Part G and the administered disclosures in Annexure A;
(b)
Part I to the extent that the ABA has no appropriation transactions and balances other than through its special
account; and
(c)
Section 121 to the extent that the ABA does not have any defined outcomes and outputs.
The Financial Statements have been prepared on an accrual basis and are in accordance with historical cost
convention, except for certain assets at fair value. Except where stated, no allowance is made for the effect of
changing prices on the results or the financial position.
-10-

481Chapter 17 Financial statements Part5 Financial management FaHCSIA Annual Report 2008–2009
Fina
ncia
l man
agem
ent
Part 5
Notes to and forming part of the Financial Statements
The Financial Statements are presented in Australian dollars and values are rounded to the nearest thousand dollars
unless otherwise specified.
Unless an alternative treatment is specifically required by an accounting standard or the FMOs, assets and liabilities
are recognised in the balance sheet when and only when it is probable that future economic benefits will flow to the
ABA or a future sacrifice of economic benefits will be required and the amounts of the assets or liabilities can be
reliably measured. However, assets and liabilities arising under Agreements Equally Proportionately Unperformed
are not recognised unless required by an accounting standard. Liabilities and assets that are unrecognised are reported
in the schedule of commitments and the schedule of contingencies.
Unless alternative treatment is specifically required by an accounting standard, income and expenses are recognised in
the income statement when and only when the flow, consumption or loss of economic benefits has occurred and can
be reliably measured.
1.3
Significant Accounting Judgements and Estimates
No accounting assumptions or estimates have been identified that have a significant risk of causing a material
adjustment to carrying amount of assets and liabilities within the next accounting period.
1.4
Changes in Australian Accounting Standards
Adoption of New Australian Accounting Standard Requirements
No accounting standard has been adopted earlier than the application date as stated in the standard.
There have been no new standards, amendments to standards or interpretations that have been issued by the AASB in
the current financial year which have had a material financial impact on the ABA.
Future Australian Accounting Standard Requirements
A number of new standards, amendments to standards and interpretations have been issued by the AASB that are
effective for future reporting periods. It is estimated that the impact of adopting these pronouncements when effective
will have no material financial impact on future reporting periods.
1.5
Revenue
Revenue from Government
Amounts appropriated are recognised as revenue. Revenue from Government is not typically recognised by
administered entities, however, the determination provided by the Minister for Finance and Deregulation in relation to
the ABA enables disclosure of such amounts as revenue.
Royalties in respect of uranium and non-uranium mining on Aboriginal land are paid to the Australian Government,
Department of Resources, Energy and Tourism and the Northern Territory Treasury, Royalty Branch, respectively.
Following advice from these entities, draw-downs are made from the Official Public Account (OPA) to enable royalty
equivalents to be credited to the ABA, in accordance with section 63 of the Act.
These receipts are credited to the ABA shortly after receipt of advice from the respective entity, which may occur in
the week following the week of payment of the royalties by mining companies to the entity.
Interest revenue
Interest revenue is recognised using the effective interest method as set out in AASB 139 Financial Instruments:
Recognition and Measurement.
-11-

482 FaHCSIA Annual Report 2008–2009 Part5 Financial management Chapter 17 Financial statements
Notes to and forming part of the Financial Statements
1.6
Gains
Resources Received Free of Charge
Resources received free of charge are recognised as gains when, and only when, a fair value can be reliably
determined and the services would have been purchased if they had not been donated. Use of those resources is
recognised as an expense.
Resources received free of charge are recorded as either revenue or gains depending on their nature.
In the course of the administration of the ABA, FaHCSIA receives resources received free of charge in relation to
audit services provided by the Australian National Audit Office (ANAO). These audit resources received free of
charge are recognised in FaHCSIA's departmental financial statements, as it is FaHCSIA's role to manage and ensure
financial accountability and governance for the ABA.
The ABA reports a number of resources received free of charge in relation to FaHCSIA expenses associated with the
ABA secretariat. This secretariat is comprised of FaHCSIA staff and is responsible for the administration of the ABA.
Sale of Assets
Gains from disposal of non-current assets are recognised when control of the asset has passed to the buyer.
Realisation of assets
A gain or loss on realisation is recognised when the market value of the investment is different from that of the
purchase value.
1.7
Superannuation
Staff of FaHCSIA who worked in the ABA secretariat during the 2008-09 financial year are members of the
Commonwealth Superannuation Scheme (CSS), the Public Sector Superannuation Scheme (PSS) or the PSS
accumulation plan (PSSap).
The CSS and PSS are defined benefit schemes for the Australian Government. The PSSap is a defined contribution
scheme.
Even though the ABA recognises the FaHCSIA staff of the ABA secretariat as a resource received free of charge,
FaHCSIA makes the employer contributions to the employee superannuation scheme at rates determined by an actuary
to be sufficient to meet the current cost to the government of the superannuation entitlements of the ABA secretariat
employees. FaHCSIA accounts for the contributions as if they were contributions to defined contribution plans.
-12-

483Chapter 17 Financial statements Part5 Financial management FaHCSIA Annual Report 2008–2009
Fina
ncia
l man
agem
ent
Part 5
Notes to and forming part of the Financial Statements
1.8
Leases
The ABA has expenditure relating to incentive payments for Township Head Leases in the Northern Territory. These
leases are accounted for as operating leases. In an operating lease, the lessor effectively retains substantially all risks
and rewards incidental to ownership of leased non-current assets.
Operating lease payments are expensed on a straight line basis which is representative of the pattern of benefits
derived from the leased assets.
Office of Executive Director of Township Leasing
The Office of Township Leasing (OTL) is headed by the Executive Director, Township Leasing, which is a statutory
appointment under the Act. The Executive Director, Township Leasing is responsible for managing, on behalf of the
Commonwealth, any township leases entered into with Indigenous communities in the Northern Territory as specified
under Section 19A of the Act. The OTL manages the head lease over the specified township and negotiates any sub
leasing to commercial entities, government agencies, community organisations and so forth.
Expenses related to township leases in the Northern Territory are currently paid from the ABA:
· An amount of $5 million has been paid for a 99 year lease for the Nguiu Head Lease on the Tiwi Islands; and
· An amount of $4.5 million has been paid for an 80 year lease for the Groote Head Lease on the Groote Eylandt.
1.9
Cash
Cash and cash equivalents includes notes and coins held and any deposits in bank accounts with an original maturity
of 3 months or less that are readily convertible to known amounts of cash and subject to insignificant risk of changes
in value.
For an investment to qualify as a cash equivalent, it must be readily convertible to a known amount of cash and be
subject to an insignificant risk of changes in value.
Cash is recognised at its nominal amount.
1.10
Financial Assets
The ABA classifies its financial assets as 'held-to-maturity' investments.
Held-to-Maturity Investments
Non-derivative financial assets with fixed or determinable payments and fixed maturity dates that the ABA has the
positive intent and ability to hold to maturity are classified as held-to-maturity investments. Held-to-maturity
investments are recorded at amortised cost using the effective interest method less impairment, with revenue
recognised on an effective yield basis.
Effective Interest Method
The effective interest method is a method of calculating the amortised cost of a financial asset and of allocating
interest income over the relevant period. The effective interest rate is the rate that exactly discounts estimated future
cash receipts through the expected life of the financial asset, or, where appropriate, a shorter period.
Income is recognised on an effective interest rate basis except for financial assets that are recognised 'at fair value
through profit or loss'.
-13-

484 FaHCSIA Annual Report 2008–2009 Part5 Financial management Chapter 17 Financial statements
Notes to and forming part of the Financial Statements
Impairment of Financial Assets
Financial assets are assessed for impairment at each balance date.
Financial assets held at amortised cost - if there is objective evidence that an impairment loss has been incurred for
loans and receivables or held to maturity investments held at amortised cost, the amount of the loss is measured as the
difference between the asset's carrying amount and the present value of estimated future cash flows discounted at the
asset's original effective interest rate. The carrying amount is reduced by way of an allowance account. The loss is
recognised in the Income Statement.
1.11
Financial Liabilities
Financial liabilities are classified as either financial liabilities 'at fair value through profit or loss' or other financial
liabilities.
Financial liabilities are recognised and derecognised upon 'trade date'.
Financial Liabilities at Fair Value Through Profit or Loss
Financial liabilities at fair value through profit or loss are initially measured at fair value. Subsequent fair value
adjustments are recognised in profit or loss. The net gain or loss recognised in profit or loss incorporates any interest
paid on the financial liability.
Other Financial Liabilities
Other financial liabilities, including borrowings, are initially measured at fair value, net of transaction costs.
Other financial liabilities are subsequently measured at amortised cost using the effective interest method, with
interest expense recognised on an effective yield basis.
The effective interest method is a method of calculating the amortised cost of a financial liability and of allocating
interest expense over the relevant period. The effective interest rate is the rate that exactly discounts estimated future
cash payments through the expected life of the financial liability, or, where appropriate, a shorter period.
Supplier and other payables are recognised at amortised cost. Liabilities are recognised to the extent that the goods or
services have been received (and irrespective of having been invoiced).
1.12
Contingent Liabilities and Contingent Assets
Contingent liabilities and contingent assets are not recognised in the balance sheet but are reported in the relevant
schedules and notes. They may arise from uncertainty as to the existence of a liability or asset or represent an asset or
liability in respect of which the amount cannot be reliably measured. Contingent assets are disclosed when settlement
is probable but not virtually certain and contingent liabilities are disclosed when settlement is greater than remote.
The ABA had no contingent liabilities or assets reported this year.
-14-

485Chapter 17 Financial statements Part5 Financial management FaHCSIA Annual Report 2008–2009
Fina
ncia
l man
agem
ent
Part 5
Notes to and forming part of the Financial Statements
1.13
Taxation / Competitive Neutrality
The ABA is exempt from all forms of taxation except Mining Withholding Tax (MWT), Fringe Benefits Tax (FBT)
and the Goods and Services Tax (GST).
Revenues, expenses, assets and liabilities are recognised net of GST:
· except where the amount of GST incurred is not recoverable from the Australian Taxation Office (ATO); and
· except for receivables and payables.
MWT is payable in respect of payments made from royalty equivalents credited to the ABA pursuant to section 63 of
the Act. In accordance with the Taxation Laws Amendment Act (No. 3) 1994, the rate of MWT payable in respect of
the payments made from royalty equivalents credited to the ABA pursuant to section 63 of the Act, is 4% (2007-08:
4%)
GST is payable on purchases made by the ABA under subsection 64(4) and 64(6) of the Act. These amounts are
recoverable from the ATO.
1.14
Grants
The ABA makes payments to or for the benefit of Aboriginals living in the Northern Territory under subsection 64(4)
of the Act. These payments are considered to meet the definition of grants which is defined under the FMOs as
assistance by Government in the form of transfers to an entity in return for past or future compliance with certain
conditions relating to the operating activities of the entity. MWT is payable on grant payments made from royalty
equivalents credited to the ABA pursuant to Section 63 of the Act.
MWT is not payable on grant payments made from other income.
1.15
Payments to Land Councils
The Aboriginal Land Rights (Northern Territory) Amendment Act 2006 received Royal Assent on 5 September 2006.
As a result land councils now obtain funding on a workload basis. Estimates for funding are submitted to the Minister
for Families, Housing, Community Services and Indigenous Affairs for approval and are distributed to land councils
on a quarterly basis during the year.
In accordance with subsection 64(3) and 35(2) of the Act, 30% of the royalty equivalents are paid to the land councils
for distribution to Aboriginal associations, communities or groups, for the benefit of those Aboriginal people who are
affected by mining operations.
-15-

486 FaHCSIA Annual Report 2008–2009 Part5 Financial management Chapter 17 Financial statements
Notes to and forming part of the Financial Statements
Note 2:
Events After the Balance Sheet Date
There are no known events occurring after the reporting date that need to be disclosed in the financial statements.
-16-

487Chapter 17 Financial statements Part5 Financial management FaHCSIA Annual Report 2008–2009
Fina
ncia
l man
agem
ent
Part 5
Notes to and forming part of the Financial Statements
30 June
30 June
2009
2008
$'000
$'000
Note 3:
Income
Revenue
Note 3A: Revenue from Government
Appropriation:
Special Appropriation
218,515
83,257
Total revenue from Government
218,515
83,257
Note 3B: Interest
Interest bearing deposits
11,209
8,546
Negotiable certificates of deposit
5,678
3,337
11 am call account
337
370
Total interest
17,224
12,253
Gains
Note 3C: Net gains from realisation of assets
Investments:
Proceeds from realisation
120,150
132,714
Net book value of assets realised
(120,150)
(132,714)
Net gains from realisation of assets
-
-
Note 3D: Resources received free of charge
Wages and salaries
1,180
963
Superannuation
177
145
Suppliers expenses
173
140
Property operating expenses
166
134
Workers compensation premium
16
-
Total resources received free of charge
1,712
1,382
-17-

488 FaHCSIA Annual Report 2008–2009 Part5 Financial management Chapter 17 Financial statements
Notes to and forming part of the Financial Statements
30 June
30 June
2009
2008
$'000
$'000
Note 4:
Expenses
Note 4A: Employee Benefits
Wages and salaries
1,180
963
Superannuation
177
145
Payments to advisory committee members
29
17
Total employee benefits
1,386
1,125
Note 4B: Suppliers
Provision of goods - external parties
16
4
Rendering of services - related entities
338
274
Rendering of services - external parties
134
262
Workers compensation premiums
16
-
Total supplier expenses
504
540
Note 4C: Grants
Private sector:
Non-profit organisations
26,031
403
Total grants
26,031
403
Note 4D: Payments for township leases
Office of Executive Director for Township Leasing administrative expenses
1,088
457
Payments to township leases
499
278
Mining withholding tax
186
200
Total payments for township leases
1,773
935
Note 4D is a new category for this year. Comparitive figures for 2007-08 have been reclassified from Suppliers and
Grants.
-18-

489Chapter 17 Financial statements Part5 Financial management FaHCSIA Annual Report 2008–2009
Fina
ncia
l man
agem
ent
Part 5
Notes to and forming part of the Financial Statements
30 June
30 June
2009
2008
$'000
$'000
Note 4E: Payments to land councils for administrative purposes
Subsection 64(1) payments:
Northern Land Council
13,028
11,601
Mining withholding tax
521
464
Sub-total Northern Land Council
13,549
12,065
Central Land Council
11,967
7,783
Mining withholding tax
479
308
Sub-total Central Land Council
12,446
8,091
Tiwi Land Council
1,768
1,928
Mining withholding tax
64
77
Sub-total Tiwi Land Council
1,832
2,005
Anindilyakwa Land Council
850
640
Mining withholding tax
34
25
Sub-total Anindilyakwa Land Council
884
665
Total payments to land councils for administrative purposes
28,711
22,826
Mining withholding tax paid to the Australian Taxation Office for subsection 64(1) $1.098m (2008: $0.874m).
-19-

490 FaHCSIA Annual Report 2008–2009 Part5 Financial management Chapter 17 Financial statements
Notes to and forming part of the Financial Statements
30 June
30 June
2009
2008
$'000
$'000
Note 4F: Distribution to land councils
Subsection 64(3) payments:
Northern Land Council
9,629
6,508
Mining withholding tax
401
271
Sub-total Northern Land Council
10,030
6,779
Central Land Council
7,272
7,265
Mining withholding tax
303
302
Sub-total Central Land Council
7,575
7,567
Anindilyakwa Land Council
46,031
10,206
Mining withholding tax
1,918
425
Sub-total Anindilyakwa Land Council
47,949
10,631
Total distribution to land councils
65,554
24,977
Mining withholding tax paid to the Australian Taxation Office for subsection 64(3) $2.622m (2008:$0.998m).
-20-

491Chapter 17 Financial statements Part5 Financial management FaHCSIA Annual Report 2008–2009
Fina
ncia
l man
agem
ent
Part 5
Notes to and forming part of the Financial Statements
30 June
30 June
2009
2008
$'000
$'000
Note 5:
Financial Assets
Note 5A: Cash and Cash Equivalents
Cash on hand or on deposit
12,633
2,672
Deposits at call
7,000
3,100
Total cash and cash equivalents
19,633
5,772
Note 5B: Trade and Other Receivables
GST receivable from the Australian Taxation Office
-
16
Other:
Interest receivable
23
23
Other receivable
7
-
Total trade and other receivables (net)
30
39
Receivables are represented by:
Current
30
39
Total trade and other receivables (net)
30
39
Receivables are aged as follows:
Not overdue
30
39
Overdue by:
Less than 30 days
-
-
30 to 60 days
-
-
61 to 90 days
-
-
More than 90 days
-
-
Total receivables (gross)
30
39
Note 5C: Investments
Interest bearing deposits
217,309
131,540
Negotiable certificates of deposit
69,220
59,217
Total investments
286,529
190,757
All investments are current assets.
Note 6:
Non-Financial Assets
Note 6A: Other Non-Financial Assets
Prepayments - subsection 64(1)
-
10
Prepayments - subsection 64(4A)
8,723
4,722
Total other non-financial assets
8,723
4,732
Prepayments subsection 64(4A) comprises $0.633m as current and $8.090m as non-current asset.
-21-

492 FaHCSIA Annual Report 2008–2009 Part5 Financial management Chapter 17 Financial statements
Notes to and forming part of the Financial Statements
30 June
30 June
2009
2008
$'000
$'000
Note 7:
Payables
Note 7A: Suppliers
Office of Executive Director Township Leasing administrative liabilities
364
55
Suppliers
-
63
Total supplier payables
364
118
Settlement is usually made net 30 days.
Note 7B: Payables to land councils for administrative purposes
Subsection 64(1)
Northern Land Council
7,852
7,852
Mining Withholding Tax
327
327
Sub-total Northern Land Council
8,179
8,179
Total payables to land councils for administrative purposes
8,179
8,179
Mining Withholding Tax due to the Australian Taxation Office for subsection 64(1) $0.327m (2008:$0.327m).
Note 7C: Grants payable
Private sector:
Non-profit organisations
-
123
Total grants payable
-
123
All grants are current liabilities.
Settlement is usually made according to the terms and conditions of each grant. This is usually within 30 days of
performance or eligibility.
-22-

493Chapter 17 Financial statements Part5 Financial management FaHCSIA Annual Report 2008–2009
Fina
ncia
l man
agem
ent
Part 5
Notes to and forming part of the Financial Statements
30 June
30 June
2009
2008
$'000
$'000
Note 8:
Cash Flow Reconciliation
Reconciliation of cash and cash equivalents as per Balance Sheet to Cash Flow Statement
Report cash and cash equivalents as per:
Cash flow statement
19,633
5,772
Balance sheet
19,633
5,772
Difference
-
-
Reconciliation of operating result to net cash from operating activities:
Operating result
113,492
46,086
Adjust for operating result components attributable to investing activities
(17,224)
(12,253)
Increase in net receivables
9
104
No change in current financial year net receivables relating to investing activities
-
(99)
Increase in prepayments
(3,991)
(4,568)
Increase in supplier payables
246
118
Decrease in grant payables
(123)
(19,708)
No change in current financial year under ss64(1) liabilities
-
(2,412)
No change in current financial year for overpayment of royalty equivalent income
-
(513)
No change in current financial year for GST Payables
-
(10)
Net cash from operating activities
92,409
6,745
-23-

494 FaHCSIA Annual Report 2008–2009 Part5 Financial management Chapter 17 Financial statements
Notes to and forming part of the Financial Statements
Note 9:
Contingent Liabilities and Contingent Assets
Quantifiable Contingencies
The Schedule of Contingencies in the Financial Statements reports nil contingent liabilities as at 30 June 2009 (2008:
Nil).
The Schedule of Contingencies in the Financial Statements reports nil contingent assets as at 30 June 2009 (2008:
Nil).
Unquantifiable Contingencies
At 30 June 2009, the ABA had no unquantifiable contingencies (2008: Nil).
Remote Contingencies
The agency has no remote contingencies (2008: Nil).
Note 10:
Remuneration of Auditors
The remuneration to the Auditor-General for auditing the financial statements for the reporting period is $39,000
(2008: $40,000) and has been absorbed by FaHCSIA.
No other services were provided by the Auditor-General.
-24-
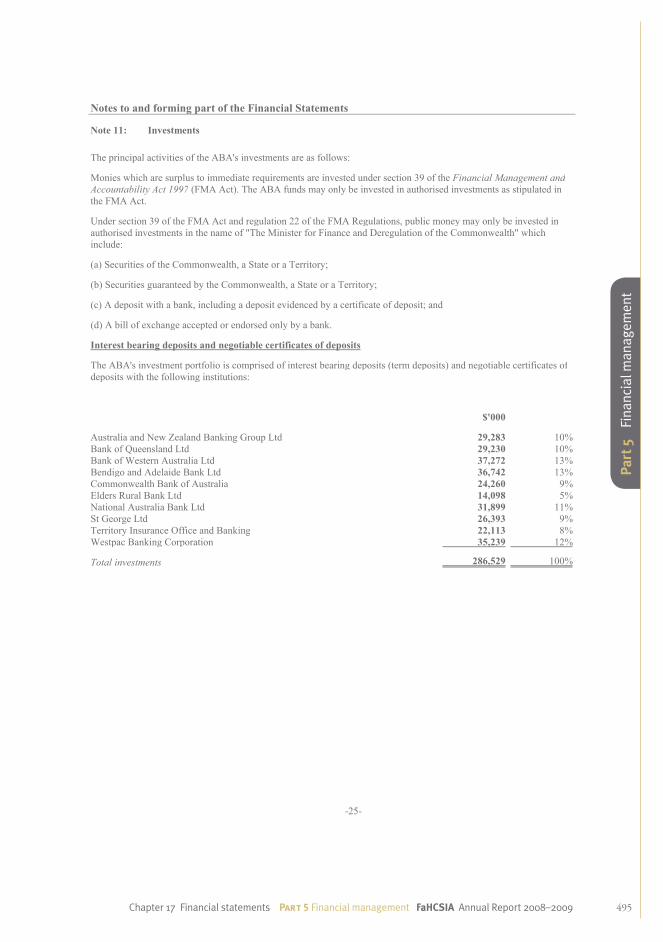
495Chapter 17 Financial statements Part5 Financial management FaHCSIA Annual Report 2008–2009
Fina
ncia
l man
agem
ent
Part 5
Notes to and forming part of the Financial Statements
Note 11:
Investments
The principal activities of the ABA's investments are as follows:
Monies which are surplus to immediate requirements are invested under section 39 of the Financial Management and
Accountability Act 1997 (FMA Act). The ABA funds may only be invested in authorised investments as stipulated in
the FMA Act.
Under section 39 of the FMA Act and regulation 22 of the FMA Regulations, public money may only be invested in
authorised investments in the name of "The Minister for Finance and Deregulation of the Commonwealth" which
include:
(a) Securities of the Commonwealth, a State or a Territory;
(b) Securities guaranteed by the Commonwealth, a State or a Territory;
(c) A deposit with a bank, including a deposit evidenced by a certificate of deposit; and
(d) A bill of exchange accepted or endorsed only by a bank.
Interest bearing deposits and negotiable certificates of deposits
The ABA's investment portfolio is comprised of interest bearing deposits (term deposits) and negotiable certificates of
deposits with the following institutions:
$'000
Australia and New Zealand Banking Group Ltd
29,283
%10
Bank of Queensland Ltd
29,230
%10
Bank of Western Australia Ltd
37,272
%13
Bendigo and Adelaide Bank Ltd
36,742
%13
Commonwealth Bank of Australia
24,260
%9
Elders Rural Bank Ltd
14,098
%5
National Australia Bank Ltd
31,899
%11
St George Ltd
26,393
%9
Territory Insurance Office and Banking
22,113
%8
Westpac Banking Corporation
35,239
%12
Total investments
286,529
%100
-25-

496 FaHCSIA Annual Report 2008–2009 Part5 Financial management Chapter 17 Financial statements
Notes to and forming part of the Financial Statements
30 June
30 June
2009
2008
$'000
$'000
Note 12:
Financial Instruments
Note 12A: Categories of Financial Instruments
Financial Assets
Held-to-maturity:
Interest bearing deposits
217,309
131,540
Negotiable certificates of deposits
69,220
59,217
286,529
190,757
Loans and receivables:
Cash and cash equivalents
19,633
5,772
Interest receivable
23
23
Other receivables
7
-
19,663
5,795
Carrying amount of financial assets
306,192
196,552
Financial Liabilities
At amortised cost:
Supplier payables
364
118
Grants payable - Non-profit organisations
-
123
364
241
Carrying amount of financial liabilities
364
241
-26-

497Chapter 17 Financial statements Part5 Financial management FaHCSIA Annual Report 2008–2009
Fina
ncia
l man
agem
ent
Part 5
Notes to and forming part of the Financial Statements
30 June
30 June
2009
2008
$'000
$'000
Note 12B: Net Income and Expense from Financial Assets
Held-to-maturity
Interest revenue
16,887
11,883
Net gain held-to-maturity
16,887
11,883
Loans and receivables
Interest revenue
337
370
Net gain loans and receivables
337
370
Net gain from financial assets
17,224
12,253
The above net gain is from financial assets not at fair value from profit and loss.
-27-

498 FaHCSIA Annual Report 2008–2009 Part5 Financial management Chapter 17 Financial statements
Notes to and forming part of the Financial Statements
Note 12C: Fair Value of Financial Instruments
Carrying
amount
Fair Value Carrying
amount
Fair value
2009
2009
2008
2008
$'000
$'000
$'000
$'000
Financial Assets
Interest bearing deposits
217,309
217,309
131,540
131,540
Negotiable certificates of deposit
69,220
69,220
59,217
59,217
Cash and cash equivalents
19,633
19,633
5,772
5,772
Interest receivable
23
23
23
23
Other receivables
7
7
-
-
Total
306,192
306,192
196,552
196,552
Financial Liabilities
Supplier payables
364
364
118
118
Grants payable - Non-profit organisations
-
-
123
123
Total
364
364
241
241
Valuation Method used for determining the fair value of financial instruments
The following table identifies for those assets and liabilities (those at fair value through profit and loss or available for
sale) carried at fair value (above) whether fair value was obtained by reference to market prices or by a valuation
technique that employs observable market transactions, or one that uses non-market inputs to determine a fair value.
Valuation technique
utilising
Market values
Market inputs Non-market
inputs
Total
$'000
$'000
$'000
$'000
Financial assets at fair value
Interest bearing deposits
-
-
217,309
217,309
Negotiable certificates of deposit
-
-
69,220
69,220
Total financial assets at fair value
-
-
286,529
286,529
Fair value of financial assets and liabilities approximate carrying values. All financial assets are relatively short term
with minimal risk of material differences between carrying amounts and fair value. This is on the basis that at date of
purchase, investments are recorded at their fair value. All investments are matured within 12 months.
-28-

499Chapter 17 Financial statements Part5 Financial management FaHCSIA Annual Report 2008–2009
Fina
ncia
l man
agem
ent
Part 5
Notes to and forming part of the Financial Statements
Note 12D: Credit Risk
The ABA is exposed to credit risk through cash, cash equivalents and trade receivables (recognised as loans and
receivables) and bank terms and the TIO investment account (recognised as held to maturity). The maximum exposure
to credit risk is the risk that arises from potential default of a debtor or financial institution. This amount is equal to
the total amount of cash, cash equivalents, trade receivables and investments. The ABA has assessed the risk of
potential default and has determined that no allowances or provisions are required to be recognised.
The following table illustrates the ABA's gross exposure to credit risk, excluding any collateral or credit enhancement.
2009
2008
$'000
$'000
Financial assets
Bank term deposits
217,309
131,540
Negotiable certificates of deposit
69,220
59,217
Cash and cash equivalents
19,633
5,772
Interest receivable
23
23
Other receivables
7
-
Financial liabilities
Supplier payables
(364)
(118)
Grants payable - Non-profit organisations
-
(123)
Total
305,828
196,311
No financial instruments are past due or impaired.
-29-

500 FaHCSIA Annual Report 2008–2009 Part5 Financial management Chapter 17 Financial statements
Notes to and forming part of the Financial Statements
Note 12E: Liquidity Risk
The ABA's financial liabilites are supplier payables and other payables. The exposure to liquidity risk is based on the
notion that the ABA will encounter difficulty in meeting its obligations associated with financial liabilities. This is
highly unlikely due to appropriation funding and mechanisms available to the ABA (e.g. retention of interest earnings)
and internal policies and procedures put in place to ensure there are appropriate resources to meet its financial
obligations.
The following tables illustrates the maturities for financial liabilities.
Maturities for financial liabilities 2009
On demand within 1
year
1 to 2 years
2 to 5 years
> 5 years
Total
2009
2009
2009
2009
2009
2009
$'000
$'000
$'000
$'000
$'000
$'000
Other Liabilities
Supplier payables
-
364
-
-
-
364
Grants Payable - Non-profit
organisations
-
-
-
-
-
-
Total
-
364
-
-
-
364
Maturities for financial liabilities 2008
On demand within 1
year
1 to 2 years
1 to 2 years
> 5 years
Total
2008
2008
2008
2008
2008
2008
$'000
$'000
$'000
$'000
$'000
$'000
Other Liabilities
Supplier payables
-
118
-
-
-
118
Grants payable - Non-profit
organisations
-
123
-
-
-
123
Total
-
241
-
-
-
241
The ABA is appropriated funding from the Australian Government. The ABA manages its budgeted funds to ensure it
has adequate funds to meet payments as they fall due. In addition, the ABA has policies in place to ensure timely
payments are made when due and has no past experience of default.
Note 12F: Market risk
The ABA holds both basic financial instruments and held-to-maturity investments that do not expose the ABA to
certain market risks. The ABA is not exposed to 'currency risk', 'other price risk' or 'interest rate risk'.
Note 13: Compensation and Debt Relief
No 'Act of Grace' expenses were incurred during the reporting period (2008: Nil).
No waivers of amounts owing to the Australian Government were made pursuant to subsection 34(1) of the Financial
Management and Accountability Act 1997 (2008: Nil).
No payments were made under section 73 of the Public Service Act 1999 during the reporting period (2008: Nil).
No payments were made under ex-gratia programs during the reporting period (2008: Nil).
No payments were made under the Compensation for Detriment caused by Defective Administration (CDDA) Scheme
during the reporting period (2008: Nil).
-30-
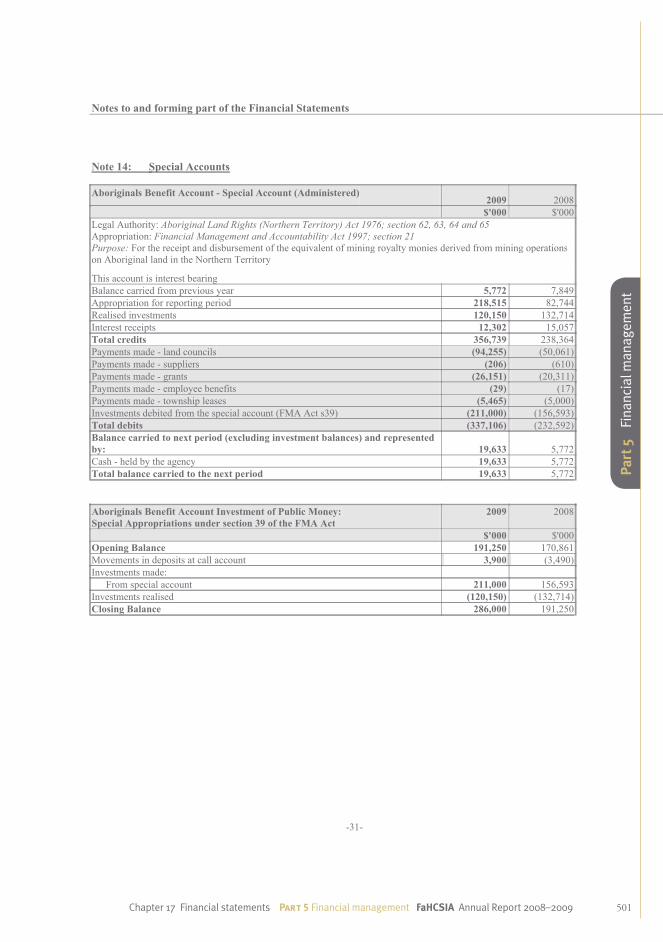
501Chapter 17 Financial statements Part5 Financial management FaHCSIA Annual Report 2008–2009
Fina
ncia
l man
agem
ent
Part 5
Notes to and forming part of the Financial Statements
Note 14: Special Accounts
Aboriginals Benefit Account - Special Account (Administered)
2009
2008
$'000
$'000
Legal Authority: Aboriginal Land Rights (Northern Territory) Act 1976; section 62, 63, 64 and 65
Appropriation: Financial Management and Accountability Act 1997; section 21
Purpose: For the receipt and disbursement of the equivalent of mining royalty monies derived from mining operations
on Aboriginal land in the Northern Territory
This account is interest bearing
Balance carried from previous year
5,772
7,849
Appropriation for reporting period
218,515
82,744
Realised investments
120,150
132,714
Interest receipts
12,302
15,057
Total credits
356,739
238,364
Payments made - land councils
(94,255)
(50,061)
Payments made - suppliers
(206)
(610)
Payments made - grants
(26,151)
(20,311)
Payments made - employee benefits
(29)
(17)
Payments made - township leases
(5,465)
(5,000)
Investments debited from the special account (FMA Act s39)
(211,000)
(156,593)
Total debits
(337,106)
(232,592)
Balance carried to next period (excluding investment balances) and represented
by:
19,633
5,772
Cash - held by the agency
19,633
5,772
Total balance carried to the next period
19,633
5,772
Aboriginals Benefit Account Investment of Public Money:
Special Appropriations under section 39 of the FMA Act 2009
2008
$'000
$'000
Opening Balance
191,250
170,861
Movements in deposits at call account 3,900
(3,490)
Investments made:
From special account
211,000
156,593
Investments realised
(120,150)
(132,714)
Closing Balance
286,000
191,250
-31-

502 FaHCSIA Annual Report 2008–2009 Part5 Financial management Chapter 17 Financial statements
Aboriginal and Torres Strait Islander Land AccountThe Aboriginal and Torres Strait Islander Land Account (Land Account) operates under the Aboriginal and Torres Strait Islander Act 2005 (ATSI Act) and is a special account for the purposes of the Financial Management and Accountability Act 1997 (FMA Act). The Land Account is established for the purpose of making payments to the Indigenous Land Corporation (ILC).
The Land Account is administered by the Department in accordance with the requirements of ATSI Act and the FMA Act.
The Land Account is a self‑sustaining capital fund. It provides a secure and ongoing source of funds to the ILC who assists Aboriginal and Torres Strait Islander people to acquire and manage Indigenous‑held land so as to provide economic, environmental, social and cultural benefits.

503Chapter 17 Financial statements Part5 Financial management FaHCSIA Annual Report 2008–2009
Fina
ncia
l man
agem
ent
Part 5

504 FaHCSIA Annual Report 2008–2009 Part5 Financial management Chapter 17 Financial statements
505Chapter 17 Financial statements Part5 Financial management FaHCSIA Annual Report 2008–2009
Fina
ncia
l man
agem
ent
Part 5

506 FaHCSIA Annual Report 2008–2009 Part5 Financial management Chapter 17 Financial statements
ABORIGINAL AND TORRES STRAIT ISLANDER LAND ACCOUNT
INCOME STATEMENT
for the year ended 30 June 2009
30 June
30 June
2009
2008
Notes
$'000
$'000
INCOME
Revenue
Interest
3A
108,535
110,980
Total revenue
108,535
110,980
Gains
Gain on realisation of investments
3B
-
-
Total gains
-
-
Total Income
108,535
110,980
EXPENSES
Payments to the Indigenous Land Corporation
4A
44,789
-
Total Expenses
44,789
-
Surplus
63,746
110,980
The above statement should be read in conjunction with the accompanying notes.
-3-

507Chapter 17 Financial statements Part5 Financial management FaHCSIA Annual Report 2008–2009
Fina
ncia
l man
agem
ent
Part 5
ABORIGINAL AND TORRES STRAIT ISLANDER LAND ACCOUNT
BALANCE SHEET
as at 30 June 2009
30 June
30 June
2009
2008
Notes
$'000
$'000
ASSETS
Financial Assets
Cash and cash equivalents
5A
321
166
Trade and other receivables
5B
53
1
Investments
5C
1,734,705
1,671,166
Total financial assets
1,735,079
1,671,333
Total Assets
1,735,079
1,671,333
LIABILITIES
Total Liabilities
-
-
Net Assets
1,735,079
1,671,333
EQUITY
Contributed equity
433,932
433,932
Retained surplus
1,301,147
1,237,401
Total Equity
1,735,079
1,671,333
Current Assets
1,285,828
1,395,751
Non-Current Assets
449,251
275,582
The above statement should be read in conjunction with the accompanying notes.
-4-

508 FaHCSIA Annual Report 2008–2009 Part5 Financial management Chapter 17 Financial statements
ABORIGINAL AND TORRES STRAIT ISLANDER LAND ACCOUNT
STATEMENT OF CHANGES IN EQUITY
as at 30 June 2009
Retained Earnings
Contributed Equity
Total Equity
2009
$'000 2008
$'000 2009
$'000 2008
$'000 2009
$'000 2008
$'000
Opening balance
Balance carried forward from previous period
1,237,401
1,126,421
433,932
433,932
1,671,333
1,560,353
Surplus for the period
63,746
110,980
-
-
63,746
110,980
Total income and expenses
63,746
110,980
-
-
63,746
110,980
Closing balance as at 30 June
1,301,147
1,237,401
433,932
433,932
1,735,079
1,671,333
The above statement should be read in conjunction with the accompanying notes.
-5-

509Chapter 17 Financial statements Part5 Financial management FaHCSIA Annual Report 2008–2009
Fina
ncia
l man
agem
ent
Part 5
ABORIGINAL AND TORRES STRAIT ISLANDER LAND ACCOUNT
CASH FLOW STATEMENT
for the year ended 30 June 2009
30 June
30 June
2009
2008
Notes
$'000
$'000
OPERATING ACTIVITIES
Cash received
Total cash received
-
-
Cash used
Payments to the Indigenous Land Corporation
44,789
-
Total cash used
44,789
-
Net cash (used by) operating activities
6
(44,789)
-
INVESTING ACTIVITIES
Cash received
Proceeds from realisation of investments
1,713,697
1,895,918
Interest on investments
122,663
82,146
Total cash received
1,836,360
1,978,064
Cash used
Purchase of investments
1,791,416
1,978,211
Total cash used
1,791,416
1,978,211
Net cash from (used by) investing activities
44,944
(147)
Net increase (decrease) in cash held
155
(147)
Cash and cash equivalents at the beginning of the reporting period
166
313
Cash and cash equivalents at the end of the reporting period
5A
321
166
The above statement should be read in conjunction with the accompanying notes.
-6-

510 FaHCSIA Annual Report 2008–2009 Part5 Financial management Chapter 17 Financial statements
ABORIGINAL AND TORRES STRAIT ISLANDER LAND ACCOUNT
NOTES TO AND FORMING PART OF THE FINANCIAL STATEMENTS
for the year ended 30 June 2009
Note 1:
Summary of Significant Accounting Policies
8Note 2:
Events after Balance Sheet Date
12
Note 3:
Income
13Note 4:
Expenses
13
Note 5:
Financial Assets
14Note 6:
Cash Flow Reconciliation
15
Note 7:
Investments
15Note 8:
Remuneration of Auditors
15
Note 9:
Financial Instruments
16Note 10:
Compensation and Debt Relief
18
Note 11:
Special Accounts
19
-7-

511Chapter 17 Financial statements Part5 Financial management FaHCSIA Annual Report 2008–2009
Fina
ncia
l man
agem
ent
Part 5
Notes to and forming part of the Financial Statements
Note 1:
Summary of Significant Accounting Policies
1.1
Objectives of Aboriginal and Torres Strait Islander Land Account
The Aboriginal and Torres Strait Islander Land Account (ATSILA) was established to recognise that most Indigenous
people will not benefit from the High Court’s Mabo (No. 2) decision (Mabo and Others v Queensland (No. 2) [1992]
HCA 23) and the Native Title Act 1993 because they were disposessed of their land and therefore cannot demostrate
the continuous association necessary to prove native title.
An amendment to the Financial Management and Accountability Act 1997 (FMA Act), constituting the replacement
of the Reserved Money Fund by Special Accounts, took effect on 1 July 1999. The Financial Management
Legislation Amendment Act 1999 converted the Land Fund Reserve to a Special Account under section 20.1 of the
FMA Act on 1 July 1999. As a consequence, the Land Fund Reserve became known as the Land Account.
On 24 March 2005, at the abolition of the Aboriginal and Torres Strait Islander Commission under the Aboriginal and
Torres Strait Islander Commission Amendment Act 2005 , responsibility of ATSILA was transferred to the then
Immigration and Multicultural and Indigenous Affairs Portfolio. An Administrative Arrangement Order made on
27 January 2006 transferred ATSILA to the renamed Families, Housing, Community Services and Indigenous Affairs
Portfolio (FaHCSIA)
ATSILA's purpose is to provide a secure stream of income to the Indigenous Land Corporation (ILC) in perpetuity to
provide economic, environmental, social and cultural benefits for Aboriginal people and Torres Strait Islanders by
assisting in the acquisition and management of an Indigenous land base.
The continued existence of ATSILA in its present form and with its present programs, is dependent on Government
policy.
1.2
Basis of Preparation of the Financial Statements
ATSILA's activities are classified as administered items in the FaHCSIA financial statements.
In addition to being consolidated into FaHCSIA’s financial statements, ATSILA prepares separate audited financial
statements as required by subsection 193H(1) of the Aboriginal and Torres Strait Islander Act 2005.
The Minister for Finance and Deregulation has issued ATSILA an exemption on the form of ATSILA's financial
statements as part of the Finance Ministers Orders (FMOs) for reporting periods ending on or after 1 July 2008, Part
C - 17. This has been done on the basis that disclosure of accounts on a purely administered basis would not satisfy
the definition of a General Purpose Financial Report.
The financial statements have been prepared in accordance with:
· the exemptions granted as part of the FMOs Part C - 17 for reporting periods ending on or after 1 July 2008, to
present its administered activities in departmental format as illustrated in Annexure A; and
· Australian Accounting Standards and Interpretations issued by the Australian Accounting Standards Board
(AASB) that apply for the reporting period.
The FMOs exemptions specifically exempt ATSILA from complying with the following requirements of the FMOs:
(a)
Part G and the administered disclosures in Annexure A;
(b)
Part I to the extent that ATSILA has no appropriation transactions and balances other than through its special
account; and
(c)
Section 121 to the extent that ATSILA does not have any defined outcomes and outputs.
-8-

512 FaHCSIA Annual Report 2008–2009 Part5 Financial management Chapter 17 Financial statements
Notes to and forming part of the Financial Statements
The financial statements have been prepared on an accrual basis and is in accordance with historical cost convention,
except for certain assets at fair value. Except where stated, no allowance is made for the effect of changing prices on
the results or the financial position.
The financial statements are presented in Australian dollars and values are rounded to the nearest thousand dollars
unless otherwise specified.
Unless an alternative treatment is specifically required by an accounting standard or the FMOs, assets and liabilities
are recognised in the balance sheet when and only when it is probable that future economic benefits will flow to
ATSILA or a future sacrifice of economic benefits will be required and the amounts of the assets or liabilities can be
reliably measured. However, assets and liabilities arising under Agreements Equally Proportionately Unperformed
are not recognised unless required by an accounting standard.
Unless alternative treatment is specifically required by an accounting standard, income and expenses are recognised in
the income statement when and only when the flow, consumption or loss of economic benefits has occurred and can
be reliably measured.
1.3
Significant Accounting Judgements and Estimates
No accounting assumptions or estimates have been identified that have a significant risk of causing a material
adjustment to carrying amounts of assets and liabilities within the next accounting period.
1.4
Changes in Australian Accounting Standards
Adoption of New Australian Accounting Standard Requirements
No accounting standard has been adopted earlier than the application date as stated in the standard.
There have been no new standards, amendments to standards or interpretations that have been issued by the AASB in
the current financial year which have had a material financial impact on ATSILA.
Future Australian Accounting Standard Requirements
A number of new standards, amendments to standards and interpretations have been issued by the AASB that are
effective for future reporting periods. It is estimated that the impact of adopting these pronouncements when effective
will have no material financial impact on future reporting periods.
1.5
Revenue
Interest Revenue
Interest revenue is recognised using the effective interest method as set out in AASB 139 Financial Instruments:
Recognition and Measurement.
1.6
Gains
Realisation of Assets
A gain or loss on realisation is recognised when the market value of the investment is different from that of the
purchase value.
-9-

513Chapter 17 Financial statements Part5 Financial management FaHCSIA Annual Report 2008–2009
Fina
ncia
l man
agem
ent
Part 5
Notes to and forming part of the Financial Statements
1.7
Cash
Cash and cash equivalents includes notes and coins held and any deposits in bank accounts with an original maturity
of 3 months or less that are readily convertible to known amounts of cash and subject to insignificant risk of changes
in value.
For an investment to qualify as a cash equivalent, it must be readily convertible to a known amount of cash and be
subject to an insignificant risk of changes in value. Refer to Note 7 where disclosure of the investments is made.
Cash is recognised at its nominal amount.
1.8
Financial Assets
ATSILA classifies its financial assets as 'held-to-maturity' investments.
Held-to-Maturity Investments
Non-derivative financial assets with fixed or determinable payments and fixed maturity dates that ATSILA has the
positive intent and ability to hold to maturity are classified as held-to-maturity investments. Held-to-maturity
investments are recorded at amortised cost using the effective interest method less impairment, with revenue
recognised on an effective yield basis.
Effective Interest Method
The effective interest method is a method of calculating the amortised cost of a financial asset and of allocating
interest income over the relevant period. The effective interest rate is the rate that exactly discounts estimated future
cash receipts through the expected life of the financial asset, or, where appropriate, a shorter period.
Income is recognised on an effective interest rate basis except for financial assets that are recognised at fair value
through profit or loss.
Impairment of Financial Assets
Financial assets are assessed for impairment at each balance date.
· financial assets held at amortised cost - if there is objective evidence that an impairment loss has been incurred
for loans and receivables or held to maturity investments held at amortised cost, the amount of the loss is
measured as the difference between the asset's carrying amount and the present value of estimated future cash
flows discounted at the asset's original effective interest rate. The carrying amount is reduced by way of an
allowance account. The loss is recognised in the Income Statement.
-10-

514 FaHCSIA Annual Report 2008–2009 Part5 Financial management Chapter 17 Financial statements
Notes to and forming part of the Financial Statements
1.9
Financial Liabilities
ATSILA does not have any financial liabilities for this year.
1.10
Contingent Liabilities and Contingent Assets
Contingent liabilities and contingent assets are not recognised in the balance sheet. They may arise from uncertainty as
to the existence of a liability or asset or represent an asset or liability in respect of which the amount cannot be reliably
measured. Contingent assets are disclosed when settlement is probable but not virtually certain and contingent
liabilities are disclosed when settlement is greater than remote.
ATSILA had no contingent liabilities or assets reported this year (2008: Nil).
1.11
Commitments
ATSILA had no commitments reported this year (2008: Nil).
1.12
Taxation / Competitive Neutrality
ATSILA is exempt from all forms of taxation except the Goods and Services Tax (GST).
Revenues, expenses and assets are recognised net of GST:
· except where the amount of GST incurred is not recoverable from the Australian Taxation Office; and
· except for receivables and payables.
1.13
Payments to the ILC
Under section 193C of the Aboriginal and Torres Strait Islander Act 2005, an annual payment is made to the
Indigenous Land Corporation equivalent to the realised real return on the investments of ATSILA for the previous
financial year.
The realised real return is based on investment returns adjusted by an indexation factor. As a result, the actual
payment varies from year to year and no payment is made where the realised real return is nil or negative.
-11-

515Chapter 17 Financial statements Part5 Financial management FaHCSIA Annual Report 2008–2009
Fina
ncia
l man
agem
ent
Part 5
Notes to and forming part of the Financial Statements
Note 2:
Events after Balance Sheet Date
There are no known events occurring after the reporting date that need to be disclosed in the financial statements.
-12-
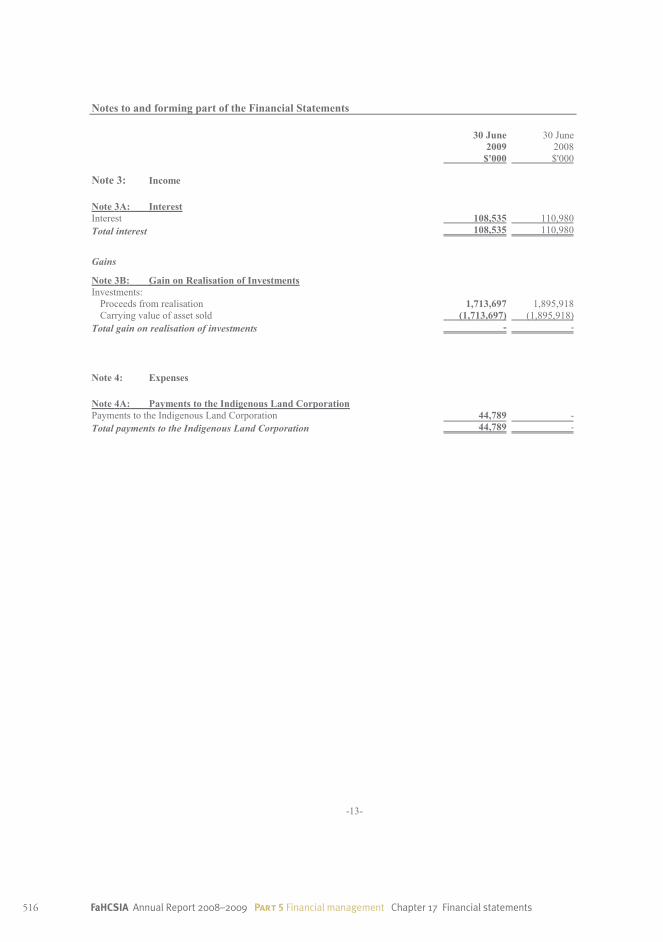
516 FaHCSIA Annual Report 2008–2009 Part5 Financial management Chapter 17 Financial statements
Notes to and forming part of the Financial Statements
30 June
30 June
2009
2008
$'000
$'000
Note 3:
Income
Note 3A: Interest
Interest
108,535
110,980
Total interest
108,535
110,980
Gains
Note 3B: Gain on Realisation of Investments
Investments:
Proceeds from realisation
1,713,697
1,895,918
Carrying value of asset sold
(1,713,697)
(1,895,918)
Total gain on realisation of investments
-
-
Note 4:
Expenses
Note 4A: Payments to the Indigenous Land Corporation
Payments to the Indigenous Land Corporation
44,789
-
Total payments to the Indigenous Land Corporation
44,789
-
-13-

517Chapter 17 Financial statements Part5 Financial management FaHCSIA Annual Report 2008–2009
Fina
ncia
l man
agem
ent
Part 5
Notes to and forming part of the Financial Statements
30 June
30 June
2009
2008
$'000
$'000
Note 5:
Financial Assets
Note 5A: Cash and Cash Equivalents
Cash on hand or on deposit
321
166
Total cash and cash equivalents
321
166
Note 5B: Trade and Other Receivables
Interest receivable
53
1
Total trade and other receivables (net)
53
1
All receivables are current.
Note 5C: Investments
Term deposits
1,187,867
260,204
Bank issued negotiable certificates of deposit
47,709
708,522
Nominal bonds
-
318,091
Capital indexed bonds
499,129
384,349
Total investments
1,734,705
1,671,166
Investments are represented by:
Current
1,285,454
1,395,584
Non-current
449,251
275,582
Total investments
1,734,705
1,671,166
-14-

518 FaHCSIA Annual Report 2008–2009 Part5 Financial management Chapter 17 Financial statements
Notes to and forming part of the Financial Statements
30 June
30 June
2009
2008
$'000
$'000
Note 6:
Cash Flow Reconciliation
Reconciliation of cash and cash equivalents as per Balance Sheet to Cash Flow Statement
Report cash and cash equivalents as per:
Cash flow statement
321
166
Balance sheet
321
166
Difference
-
-
Reconciliation of operating result to net cash from operating activities:
Operating result
63,746
110,980
Interest on investments
(108,535)
(110,980)
Net cash (used by) operating activities
(44,789)
-
Note 7:
Investments
The investment objective of FaHCSIA as administrators for ATSILA, is to ensure that ATSILA complies with
legislative obligations under the FMA Act and the Aboriginal and Torres Strait Islander Act 2005; and that ATSILA
maintains and preserves its capital base.
The investment portfolio and bank accounts are managed to ensure sufficient funds are available for payment, where
applicable, to the Indigenous Land Corporation on the last business day of the financial year.
Investment activities are conducted in accordance with the requirements of s39 of the FMA Act. Consequently,
investments are typically low risk and take the form of Term Deposits, Negotiable Certificates of Deposits, Capital
bonds and Nominal bonds.
Investment practices are also governed by the investment policy of ATSILA which requires the management of the
portfolio to respond to positive investment opportunities in the market so as to achieve the best possible returns for the
account within the legislative framework.
The asset allocation of the portfolio as at 30 June 2009 is 71 percent with Australian banks and 29 percent in Capital
bonds (Semi Government bonds).
Note 8:
Remuneration of Auditors
The remuneration to the Auditor-General for auditing the financial statements for the reporting period is $23,000
(2008: $25,000) and is paid by FaHCSIA.
No other services were provided by the Auditor-General.
-15-

519Chapter 17 Financial statements Part5 Financial management FaHCSIA Annual Report 2008–2009
Fina
ncia
l man
agem
ent
Part 5
Notes to and forming part of the Financial Statements
30 June
30 June
2009
2008
$'000
$'000
Note 9:
Financial Instruments
Note 9A: Categories of Financial Instruments
Financial Assets
Held-to-maturity:
Term Deposits
1,187,867
260,204
Bank issued negotiable certificates of deposit
47,709
708,522
Nominal bonds
-
318,091
Capital indexed bonds
499,129
384,349
1,734,705
1,671,166
Loans and receivables:
Cash
321
166
Interest Receivable
53
1
374
167
Carrying amount of financial assets
1,735,079
1,671,333
Note 9B: Net Income and Expense from Financial Assets
Held-to-maturity
Interest revenue
106,086
110,304
Net gain held-to-maturity
106,086
110,304
Loans and receivables
Interest revenue
2,449
676
Net gain loans and receivables
2,449
676
Net gain from financial assets
108,535
110,980
The above net gain is from financial assets not at fair value from profit and loss.
-16-

520 FaHCSIA Annual Report 2008–2009 Part5 Financial management Chapter 17 Financial statements
Notes to and forming part of the Financial Statements
Note 9C: Fair Value of Financial Instruments
Carrying
amount
Fair Value Carrying
amount
Fair value
2009
2009
2008
2008
$'000
$'000
$'000
$'000
Financial Assets
Term deposits
1,187,867
1,187,867
260,204
260,204
Bank issued negotiable certificates of deposit
47,709
47,709
708,522
708,522
Nominal bonds
-
-
318,091
309,028
Capital indexed bonds
499,129
492,205
384,349
364,718
Total
1,734,705
1,727,781
1,671,166
1,642,472
Valuation Method used for determining the fair value of financial instruments
The following table identifies for those assets and liabilities (those at fair value through profit and loss) carried at fair
value (above) whether fair value was obtained by reference to market prices or by a valuation technique that employs
observable market transactions, or one that uses non-market inputs to determine a fair value.
Valuation technique
utilising
Market values
Market inputs Non-market
inputs
Total
$'000
$'000
$'000
$'000
Financial assets at fair value
Term deposits
-
-
1,187,867
1,187,867
Bank issued negotiable certificates of deposit
-
-
47,709
47,709
Nominal bonds
-
-
-
-
Capital indexed bonds
492,205
-
-
492,205
Total financial assets at fair value
492,205
-
1,235,576
1,727,781
-17-

521Chapter 17 Financial statements Part5 Financial management FaHCSIA Annual Report 2008–2009
Fina
ncia
l man
agem
ent
Part 5
Notes to and forming part of the Financial Statements
Note 9D: Credit Risk
ATSILA is exposed to credit risk through cash and receivables (recognised as loans and receivables) and investments
(recognised as held to maturity). The maximum exposure to credit risk is the risk that arises from potential default of a
debtor or financial institution. This amount is equal to the total amount of cash, receivables and investments. ATSILA
only hold funds with Australian banks and Semi Government Bonds. ATSILA has assessed the risk of potential
default and has determined that no allowances or provisions are required to be recognised.
The following table illustrates ATSILA's gross exposure to credit risk, excluding any collateral or credit enhancement:
2009
2008
$'000
$'000
Financial assets
Term deposits
1,187,867
260,204
Bank issued transferable certificates of deposit
47,709
708,522
Nominal bonds
-
318,091
Capital indexed bonds
499,129
384,349
Cash
321
166
Receivables
53
1
Total
1,735,079
1,671,333
No financial instruments are past due or impaired.
Note 9E: Liquidity Risk
The exposure to liquidity risk is based on the notion that ATSILA will encounter difficulty in meeting its obligations
associated with financial liabilities. This is highly unlikely due to ATSILA having no financial liabilities, and the
significant self funding capital base available to ATSILA and those procedures put in place to ensure there are
appropriate resources to meet its financial obligations.
ATSILA manages its budgeted funds to ensure it has adequate funds to meet payments as they fall due. In addition,
ATSILA has policies in place to ensure timely payments are made when due and has no past experience of default.
Note 9F: Market risk
ATSILA holds basic financial instruments and held to maturity investments that are not exposed to market risks.
ATSILA is not exposed to 'Currency risk', 'Other price risk' or 'Interest Rate Risk'.
Note 10: Compensation and Debt Relief
No 'Act of Grace' expenses were incurred during the reporting period (2008: Nil).
No waivers of amounts owing to the Australian Government were made pursuant to subsection 34(1) of the Financial
Management and Accountability Act 1997 (2008: Nil).
No payments were made under section 73 of the Public Service Act 1999 during the reporting period (2008: Nil).
No payments were made under ex-gratia programs during the reporting period (2008: Nil).
No payments were made under the Compensation for Detriment caused by Defective Administration (CDDA) Scheme
during the reporting period (2008: Nil).
-18-

522 FaHCSIA Annual Report 2008–2009 Part5 Financial management Chapter 17 Financial statements
Notes to and forming part of the Financial Statements
Note 11: Special Accounts
Aboriginal and Torres Strait Islander Land Account (Administered)
2009
2008
$'000
$'000
Legal Authority: Aboriginal and Torres Strait Islander Act 2005; section 192W Appropriation: Financial Management and Accountability Act 1997; section 21 Purpose: to provide a secure stream of income to the Indigenous Land Corporation in perpetuity to provide economic,
environmental, social and cultural benefits for Aboriginal people and Torres Strait Islanders by assisting in the
acquisition and management of an Indigenous land base.
This account is interest bearing
Balance carried from previous period
166
313
Realised investments
1,713,697
1,895,918
Interest receipts
122,663
82,146
Total credits
1,836,526
1,978,377
Payments made to the Indigenous Land Council
(44,789)
-
Investments debited from the special account (FMA s39)
(1,791,416)
(1,978,211)
Total debits
(1,836,205)
(1,978,211)
Balance carried to next period (excluding investment balances) and represented
by:
321
166
Cash - held by the agency
321
166
Total balance carried to the next period
321
166
Aboriginal and Torres Strait Islander Land Account Investment of Public
Money:
Special Appropriations under section 39 of the FMA Act
2009
2008
$'000
$'000
Opening Balance
1,635,510
1,553,217
Investments made:
From special account
1,791,416
1,978,211
Investments realised
(1,713,697)
(1,895,918)
Closing Balance
1,713,229
1,635,510
-19-
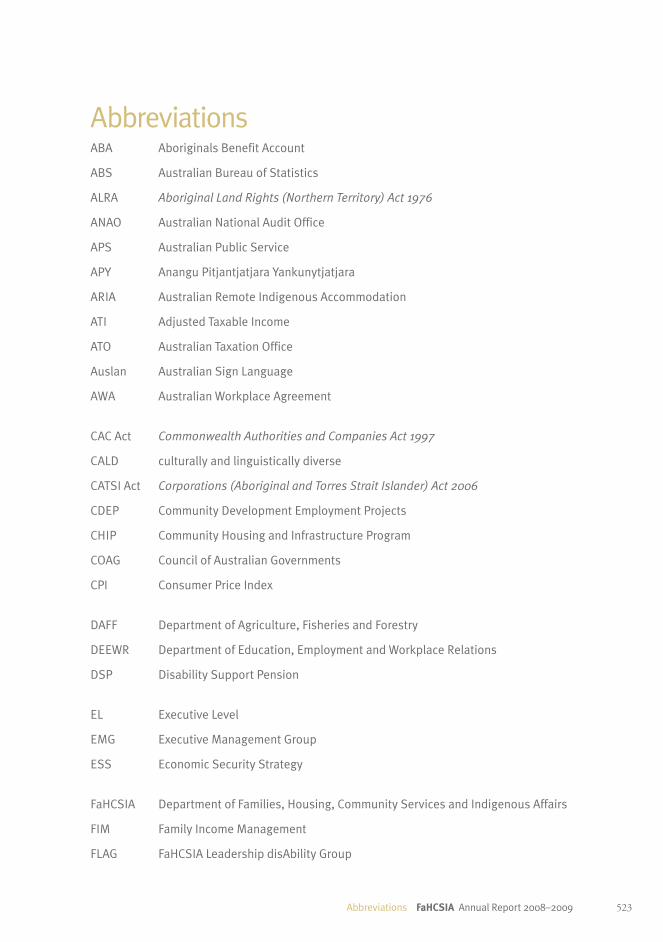
523Abbreviations FaHCSIA Annual Report 2008–2009
AbbreviationsABA Aboriginals Benefit Account
ABS Australian Bureau of Statistics
ALRA Aboriginal Land Rights (Northern Territory) Act 1976
ANAO Australian National Audit Office
APS Australian Public Service
APY Anangu Pitjantjatjara Yankunytjatjara
ARIA Australian Remote Indigenous Accommodation
ATI Adjusted Taxable Income
ATO Australian Taxation Office
Auslan Australian Sign Language
AWA Australian Workplace Agreement
CAC Act Commonwealth Authorities and Companies Act 1997
CALD culturally and linguistically diverse
CATSI Act Corporations (Aboriginal and Torres Strait Islander) Act 2006
CDEP Community Development Employment Projects
CHIP Community Housing and Infrastructure Program
COAG Council of Australian Governments
CPI Consumer Price Index
DAFF Department of Agriculture, Fisheries and Forestry
DEEWR Department of Education, Employment and Workplace Relations
DSP Disability Support Pension
EL Executive Level
EMG Executive Management Group
ESS Economic Security Strategy
FaHCSIA Department of Families, Housing, Community Services and Indigenous Affairs
FIM Family Income Management
FLAG FaHCSIA Leadership disAbility Group

524 FaHCSIA Annual Report 2008–2009 Abbreviations
FMA Act Financial Management and Accountability Act 1997
FOI freedom of information
FRSP Family Relationship Services Program
FTB Family Tax Benefit
FTE full‑time equivalent
IDPwD International Day of People with Disability
ILC Indigenous Land Corporation
MTAWE Male Total Average Weekly Earnings
MWT Mining Withholding Tax
NAIDOC National Aboriginal and Islander Day Observance Committee
NATSISS National Aboriginal and Torres Strait Islander Social Survey
NDAP National Disability Advocacy Program
NIDS National Illicit Drugs Strategy
NRAS National Rental Affordability Scheme
NTER Northern Territory Emergency Response
OECD Organisation for Economic Cooperation and Development
OHS occupational health and safety
OHS Act Occupational Health and Safety Act 1991
PAES Portfolio Additional Estimates Statements
PBS Portfolio Budget Statements
SAAP Supported Accommodation Assistance Program
SEIFA Socio‑economic Indexes for Areas
SES Senior Executive Service
SPP specific purpose payment
SSAT Social Security Appeals Tribunal
UN United Nations

525Glossary FaHCSIA Annual Report 2008–2009
GlossaryTerm Meaning
A New Tax System (Family Assistance) (Administration) Act 1999
An Act to implement A New Tax System by providing assistance to families, and for related purposes.
Aboriginal and Torres Strait Islander Act 2005
An Act to establish a Torres Strait Regional Authority, an Indigenous Land Corporation and a corporation to be known as Indigenous Business Australia, and for related purposes.
Aboriginal and Torres Strait Islander Commission Amendment Act 2005 (Amendment Act)
An Act to amend the Aboriginal and Torres Strait Islander Commission Act 1989, and for other purposes.
Aboriginal Land Grant (Jervis Bay Territory) Act 1986
An Act providing for the establishment of the Wreck Bay Aboriginal Community Council and the granting of land to Aboriginal people in the Jervis Bay Territory.
Aboriginal Land Rights (Northern Territory) Act 1976
An Act providing for the granting of Traditional Aboriginal Land in the Northern Territory for the benefit of Aboriginals, the establishment of land councils to represent Aboriginal interests and the setting up of the Aboriginals Benefit Account.
Aboriginal Land Rights (Northern Territory) Amendment Act 2006
An Act to amend the Aboriginal Land Rights (Northern Territory) Act 1976, and for other purposes.
Additional Estimates Where amounts appropriated at Budget time are insufficient, Parliament may appropriate more funds to portfolios through the Additional Estimates Acts.
Administrative Arrangements Order
Issued by the Governor‑General, provides for the arrangements of government administration, including the matters that are dealt with by each department and the legislation administered by each minister.
Appropriation An authorisation by Parliament to spend moneys from the Consolidated Revenue Fund for a particular purpose.
assets Future economic benefits controlled by an entity as a result of past transactions or other past events.

526 FaHCSIA Annual Report 2008–2009 Glossary
Term Meaning
Budget measure A finalised decision by the Cabinet that has a financial impact in the budget or forward years.
Clearing House Collects and disseminates information on best practice and success factors, providing the public with online access to a repository of rigorously assessed and catalogued research, summaries and issues papers.
Commonwealth Authorities and Companies Act 1997
An Act to provide reporting, accountability and other rules for Commonwealth authorities and Commonwealth companies, and for related purposes.
Consolidated Revenue Fund
Section 81 of the Constitution stipulates that all revenue raised or money received by the Commonwealth forms the one Consolidated Revenue Fund. The fund is not a bank account. The Official Public Account reflects most of the operations of the fund.
Corporations (Aboriginal and Torres Strait Islander) Act 2006
An Act providing for Aboriginal and Torres Strait Islander corporations, and for related purposes.
depreciation Apportionment of an asset’s capital value as an expense over its estimated useful life to take account of normal usage, obsolescence, or the passage of time.
Disability Discrimination Act 1992
An Act relating to discrimination on the ground of disability.
discretionary grants Discretionary grants are payments where the portfolio Minister or paying agency has discretion in determining whether or not a particular applicant receives funding and may or may not impose conditions in return for the grant.
Environment Protection and Biodiversity Conservation Act 1999
An Act relating to the protection of the environment and the conservation of biodiversity, and for related purposes.
Estimates Estimates are an agency’s expected revenues, expenses, assets, liabilities and cash flows. They are prepared for each output in the Budget, in consultation with the Department of Finance and Deregulation.

527Glossary FaHCSIA Annual Report 2008–2009
Term Meaning
ex gratia/Act of Grace payment
A benevolent payment made to anyone in the public interest for a loss or incurred expenditure for which the Commonwealth has no legal or financial responsibility or liability. Payments are available (but not guaranteed) only when no other statutory, regulatory or policy avenues exist for the granting of financial relief.
expenses Expenses represent the full costs of an activity, that is, the total value of all the resources consumed in producing goods and services or the loss of future economic benefits in the form of reductions in assets or increases in liabilities of the entity. Expenses include cash items such as salary payments, as well as expenses that have been incurred, such as accruing employee entitlements that will be paid in the future.
fair value The amount for which an asset could be exchanged or a liability settled, between knowledgeable, willing parties in an arm’s length transaction.
Families, Community Services and Indigenous Affairs and Other Legislation Amendment (Northern Territory National Emergency Response and other Measures) Act 2007
An Act to amend laws in order to respond to the Northern Territory’s national emergency, including laws in relation to prohibited material, law enforcement, infrastructure, and access to Aboriginal land.
Financial Management and Accountability Act 1997
An Act to provide for the proper use and management of public money, public property and other Commonwealth resources, and for related purposes.
Freedom of Information Act 1982
An Act to give members of the public rights of access to official documents of the Australian Government and of its agencies.
grants Non‑reciprocal transfers of economic resources, where the payer agency does not receive approximately equal value in return.
Green Paper A preliminary government report of a proposal intended to stimulate debate and launch a process of consultation on a particular subject.

528 FaHCSIA Annual Report 2008–2009 Glossary
Term Meaning
Income Tax (Mining Withholding Tax) Act 1979
An Act to impose income tax upon certain payments made in connection with the use of Aboriginal land.
key performance indicators
Outline what is expected of each piece of work that is undertaken against the criteria that apply to it. Those criteria will be several of business outcomes, financial, staff and other resource allocation, operational expectations, risk parameters and expected impact.
national agreements COAG National Agreements contain the objectives, outcomes, outputs and performance indicators, and clarify the roles and responsibilities that will guide the Commonwealth and states and territories in the delivery of services across the relevant sectors.
national partnership agreement
A COAG endorsed agreement made between the Commonwealth and state and territory governments to fund payments to deliver nationally significant reforms.
National Partnerships An agreement made between the Commonwealth and one or more state or territory governments to fund payments to deliver nationally significant reforms.
Native Title Act 1993 An Act about native title in relation to land or waters, and for related purposes.
Northern Territory National Emergency Response Act 2007
An Act to respond to the Northern Territory’s national emergency, and for related purposes.
Northern Territory (Self-Government) Act 1978
An Act to provide for the Government of the Northern Territory of Australia, and for related purposes.
Occupational Health and Safety Act 1991
An Act to promote the occupational health and safety of persons employed by the Commonwealth, Commonwealth authorities and certain licensed corporations, and for related purposes.

529Glossary FaHCSIA Annual Report 2008–2009
Term Meaning
outcomes The Government’s objectives for the FaHCSIA portfolio. Outcomes are desired results, impacts or consequences for the Australian community as influenced by the actions of the Australian Government. Actual outcomes are assessments of the end results or impacts actually achieved.
output groups A logical aggregation of agency outputs, where useful, and based either on homogeneity, type of product, business line or beneficiary target group. Aggregation of outputs may also be needed for the provision of adequate information for performance monitoring, or based on a materiality test.
payable Are recognised to the extent that goods or services have been received irrespective of having been invoiced. An agency expects to settle the liability in its normal operating cycle and it holds the liability primarily for the purpose of trading. Payables are expected to be settled within twelve months after the reporting period.
performance information Evidence about performance that is collected and used systematically. Evidence may relate to appropriateness, effectiveness and efficiency. It may be about outcomes, factors that affect outcomes, and what can be done to improve them.
Portfolio Additional Estimates
Changes in funding requirements that occur after the presentation of the Budget. These changes to funding require the consideration of Additional Estimates by the House of Representatives and the Senate.
Portfolio Budget Statements
The purpose of the 2008 –09 Portfolio Budget Statements is to inform Senators and Members of Parliament of the proposed allocation of resources to government outcomes by agencies within the portfolio.
Portfolio Supplementary Additional Estimates
The purpose of the Portfolio Supplementary Additional Estimates Statements is to explain the Appropriation (Nation Building and Jobs) Bill (No. 2) 2008–09. This document serves to inform Senators and Members of Parliament and the public of the proposed allocation of supplementary additional appropriations to government outcomes by agencies within the portfolio.

530 FaHCSIA Annual Report 2008–2009 Glossary
Term Meaning
Portfolio Supplementary Estimates
The purpose of the Portfolio Supplementary Estimates Statements is to explain Appropriation (Economic Security Strategy) Bill (No. 1). This serves to inform senators and members of parliament and the public of the proposed allocation of supplementary appropriations to Government outcomes by agencies within the portfolio.
Privacy Act 1988 An Act to make provision to protect the privacy of individuals, and for related purposes.
Public Service Act 1999 An Act to provide for the establishment and management of the Australian Public Service, and for other purposes.
Racial Discrimination Act 1975
An Act relating to the elimination of racial and other discrimination.
receipts The total or gross amount received by the Commonwealth. Each receipt item is either revenue, an offset within outlays, or financing transactions. Receipts include taxes, interest, charges for goods and services, borrowings and Government Business Enterprise dividends received.
revenue Total value of resources earned or received to cover the production of goods and services.
Social Security (Administration) Act 1999
An Act to provide for the administration of the social security law, and for related purposes.
Social Security Act 1991 An Act to provide for the payment of certain pensions, benefits and allowances to eligible Australians, and for related purposes.
Special Account Balances existing within the Consolidated Revenue Fund that are supported by standing appropriations (Financial Management and Accountability Act 1997 (FMA Act) ss.20 and 21). Special accounts allow money in the fund to be acknowledged as set aside for a particular purpose. Amounts credited to a Special Account may only be spent for the purposes of the Special Account. Special Accounts can only be established by a written determination of the Finance Minister (s.20 FMA Act) or through an Act of Parliament (referred to in s.21 of the FMA Act).

531Glossary FaHCSIA Annual Report 2008–2009
Term Meaning
Special Appropriations An amount of money appropriated by a particular Act of Parliament for a specific purpose and number of years. For special appropriations the authority to withdraw funds from the Consolidated Revenue Fund does not generally cease at the end of the financial year.
specific purpose payments
Commonwealth payments to the states are divided into General Purpose Payments and Specific Purpose Payments. The term payments is used because the amounts referred to are gross transfers, not net, which would include repayments of advances to the state and territory governments. Most specific purpose payments are conditional on policy objectives set by the Commonwealth or the achievement of national policy objectives agreed between the Commonwealth and state and territory governments.
statutory authority A government agency set up by an Act of Parliament, more or less independent of day‑to‑day ministerial control, usually not bound by public service procedures to the same extent as ordinary departments, and which is responsible finally to Parliament.
Tax Assessment Act 1936 An Act to consolidate and amend the law relating to the imposition, assessment and collection of a tax upon incomes.
Taxation Laws Amendment Act (No. 3) 1994
An Act to amend the law relating to taxation.
White Paper A parliamentary paper enunciating government policy and often explaining the results or conclusions of research. Follows a Green Paper (see Green Paper).

532 FaHCSIA Annual Report 2008–2009 Compliance index
Compliance indexThis report is prepared in accordance with the Requirements for Annual Reports approved by the Joint Committee of Public Accounts and Audit under subsections 63(2) and 70(2) of the Public Service Act 1999. This index refers to mandatory and suggested reporting items.
Description Requirement Page
Letter of transmittal Mandatory I
Table of contents Mandatory IV–VII
Index Mandatory 536
Glossary Mandatory 525
Contact officer(s) Mandatory Inside back cover
Internet home page address and Internet address for report Mandatory III
Review by Secretary
Review by departmental secretary Mandatory 4–8
Summary of significant issues and developments Suggested 3
Overview of department’s performance and financial results Suggested 3
Outlook for following year Suggested 42–44
Significant issues and developments—portfolio Portfolio departments—suggested
4–8, 10–14, 29–44
Departmental Overview
Overview description of department Mandatory 2, 10–11
Role and functions Mandatory 2, 10–11
Organisational structure Mandatory 214–215
Outcome and output structure Mandatory 47
Where outcome and output structures differ from PBS format, details of variation and reasons for change
Mandatory N/A
Portfolio structure Portfolio departments—mandatory
14

533Compliance index FaHCSIA Annual Report 2008–2009
Description Requirement Page
Report on Performance
Review of performance during the year in relation to outputs and contribution to outcomes
Mandatory 45–205
Actual performance in relation to performance targets set out in PBS/ PAES
Mandatory 45–205
Performance of purchaser/ provider arrangements If applicable, mandatory
249, 285–286
Where performance targets differ from the PBS/PAES, details of both former and new targets, and reasons for the change
Mandatory 45–205
Narrative discussion and analysis of performance Mandatory 45–205
Trend information Suggested 15–25, 45–205
Factors, events or trends influencing departmental performance Suggested 15–25, 45–205
Significant changes in nature of principal functions/services Suggested N/A
Performance against service charter customer service standards, complaints data, and the department’s response to complaints
If applicable, mandatory
252
Social justice and equity impacts Suggested 25
Discussion and analysis of the department’s financial performance
Mandatory 3, 378–384
Discussion of any significant changes from the prior year or from budget.
Suggested 3, 378–384
Summary resource tables by outcomes Mandatory 293–302
Developments since the end of the financial year that have affected or may significantly affect the department’s operations or financial results in future
If applicable, mandatory
N/A
Management Accountability
Corporate Governance Mandatory 207–226
Statement of the main corporate governance practices in place Mandatory 207–226
Names of the senior executive and their responsibilities Suggested 207–219
Senior management committees and their roles Suggested 216–219
Corporate and operational planning and associated performance reporting and review
Suggested 207–226
Approach adopted to identifying areas of significant financial or operational risk and arrangements in place to manage risks
Suggested 219–221, 255–259

534 FaHCSIA Annual Report 2008–2009 Compliance index
Description Requirement Page
Agency heads are required to certify that their agency comply with the Commonwealth Fraud Control Guidelines.
Mandatory 282–283
Policy and practices on the establishment and maintenance of appropriate ethical standards
Suggested 26–28, 223–224
How nature and amount of remuneration for SES officers is determined
Suggested 303–307
External Scrutiny
Significant developments in external scrutiny Mandatory 269–289
Judicial decisions and decisions of administrative tribunals Mandatory 280–281
Reports by the Auditor‑General Mandatory 278–280
Reports by Parliamentary Committees Mandatory 270–277
Reports by Commonwealth Ombudsman Mandatory 278, 281
Management of Human Resources
Assessment of effectiveness in managing and developing human resources to achieve departmental objectives
Mandatory 227–245
Workforce planning, staff turnover and retention Suggested 241
Impact and features of collective agreements, determinations, common law contracts, certified agreements and AWAs
Suggested 235, 307
Training and development undertaken and its impact Suggested 232–235
Occupational health and safety performance Suggested 243–245
Productivity gains Suggested 241–242
Statistics on staffing Mandatory 227–245, 303–307
Collective agreements, determinations, common law contracts, certified agreements and AWAs
Mandatory 235, 307
Performance pay Mandatory 306
Assets management
Assessment of effectiveness of assets management If applicable, mandatory
381
Purchasing
Assessment of purchasing against core policies and principles Mandatory 381

535Compliance index FaHCSIA Annual Report 2008–2009
Description Requirement Page
Consultants
Number of Consultancy services contracts let and total expenditure on consultancy services
Mandatory 382, 317–338
Australian National Audit Office Access Clauses
Absence of provisions in contracts allowing access by the Auditor‑General
Mandatory 317–338, 382
Exempt contracts
Contracts exempt from the AusTender Mandatory NIL (317)
Commonwealth Disability Strategy
Report on performance in implementing the Commonwealth Disability Strategy
Mandatory 308–311
Financial Statements
Financial Statements Mandatory 385–522
Other Information
Agency Resource Statements and Resources by Outcomes Mandatory 291–302
Occupational health and safety (section 74 of the Occupational Health and Safety Act 1991)
Mandatory 245
Freedom of Information (subsection 8(1) of the Freedom of Information Act 1982)
Mandatory 282, 342–346
Advertising and Market Research (Section 311A of the Commonwealth Electoral Act 1918)
Mandatory 312–316
Ecologically sustainable development and environmental performance (Section 516A of the Environment Protection and Biodiversity Conservation Act 1999)
Mandatory 260–262
Grants Programs Mandatory 339–341
Correction of material errors in previous annual report If applicable, mandatory
363

536 FaHCSIA Annual Report 2008–2009 Index
AAboriginal Hostels Limited, 11, 14, 379,
383–84
Aboriginal Land Commissioner, 13
Aboriginal and Torres Strait Islander Land Account, 73, 381
financial statements 502–22
Aboriginal Rental Housing Program, 74–75
Aboriginals Benefit Account, 73, 279, 364–376, 381
financial statements, 469–501
act of grace payments, 285see also ex‑gratia payments,
advertising and market research, 93, 312–16
Age Pension, 4, 17–18, 91, 110, 124–26, 287, 350–56, 369
centenary of, 4, 18, 91, (inside cover)see also Pension Assets Test, Pension,
Bonus Scheme, Pensioner Concession Card, Pension Review
Annual Report 2007–08, 46statement of material error, 363
Attorney‑General’s Department, 107, 150, 163, 272, 274, 276
Auslan, see Interpreting
Australia’s Future Tax System, 33, 43
Australian Council of Social Services, 251, 322
Australian Council of Trade Unions, 24, 171, 188
Australian Disability Enterprises, 97, 99
Australian Federal Police, 66, 80, 107
Australian Government Disaster Recovery Committee, 191
Australian Government DisasterRecovery Payment, 5, 24, 183–85, 191,
192, 201see also Disaster Recovery Payment
Australian Housing and Urban Research Institute, 342
Australian Human Rights Commission, 30
Australian Institute of Family Studies, 321, 322
Australian National Audit Office, 278, 378see also audits
Australian Public Service, 26, 303–04
Australian Remote Indigenous Accommodation Program, 74–75
Autism, helping children with, 36, 98, 100–01
Autism Specific Early Learning and Care Centres, 100, 111, 114, 133
Autism Advisor Program, 98, 101
BBaby Bonus, 34, 148, 154, 161, 381
Bali terrorist attacks, 201–02
Beauchamp, Glenys, 208, 214, 218–19, 224
Bereavement Allowance, 122
bilateral agreements, 110
Blacklow, Les, 14
Budget Policy Committee, 216, 220–21
Budget Measures, 64–70, 113–19, 148, 154–58, 191–93
business continuity, 256
Business Partnership Agreement, 249, 285
business planning, 253, 254
Index

537Index FaHCSIA Annual Report 2008–2009
Ccapability development, see staff
captioning information services, 95
carers, support for, 36, 37, 47, 49, 90, 103–04, 112, 132, 136, 139, 270, 273, 341
Carer Allowance, 19, 36, 103, 113–14, 136–37, 287
Carer Bonus, 113–14Carer Payment, 103, 113, 121, 138, 287Carer Payment (Child), 19, 37, 91, 103,
112, 115
case studies, refer to Case Study Index
Centrelink, 12, 67, 94, 111–38, 150, 222, 249, 268–75, 156–58, 285–89, 316, 333–35, 346, 361, 378–81
control of program and incorrect payments, 123, 126, 131, 138, 164, 197, 286–88
Debt Raising and Recovery, 288identity fraud, 289
child care, 70, 111, 114, 133, 251Child Care Benefit, 114Child Care Tax Rebate, 114
child support, 12, 14, 22, 39, 47, 50, 145, 146, 150, 167–68
Child Support Scheme reforms, 39, 150, 167–68
Child Support Agency, 150, 169
Clarke, Keith, 14
Closing the Gap, 17, 30–1, 49, 52, 54, 64–70, 80, 83, 117, 157, 223, 238, 364
Closing the Gap Committee, 216, 223
Commission on the status of Women, see United Nations
Commonwealth Authorities and Companies Act 1997 (CAC Act),
Commonwealth Disability Strategy, 308–11
Performance Report, 308–11
Commonwealth Ombudsman, 278, 281
Commonwealth Procurement Guidelines, 381
Commonwealth Seniors Health Card, 94, 114, 117, 127
Commonwealth State Housing Agreement, 195
Commonwealth—State Relations Committee, 216, 225
Commonwealth State TerritoryDisability Agreement, 95, 115, 130, 278see also Commonwealth Disability
Strategy; National Disability Agreement; Disability, support for people with
communities for children, 146, 149–50
Community Development Employment Projects, 58–60, 73–74, 273–74
community engagement, 65, 82, 203–04
Community Housing and Infrastructure Program, 74–75
community recovery, 47, 50, 170, 183, 200see also disaster recovery
community sector, 17, 24, 171, 249‑51
compensation for Extension of Fringe Benefits to Pensioners and Older Long‑Term Retirees, 126–27
Compliance and Integrity Committee, 216, 223–24
concession cards, 94, 113, 127
Consultants, 317–38
Corporations (Aboriginal and Torres Strait Islander) Act 2006 (CATSI Act), 85–86
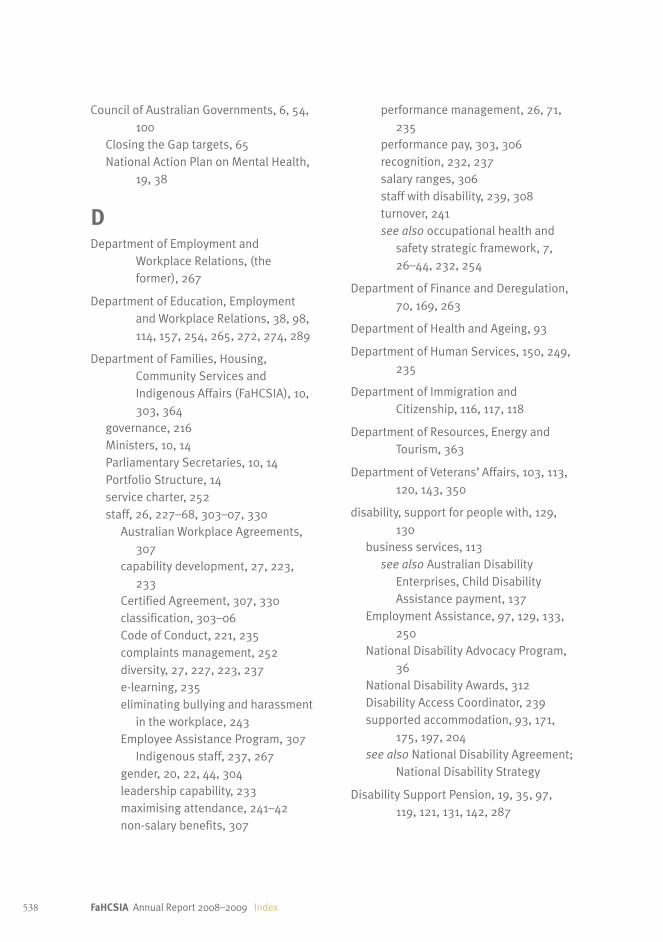
538 FaHCSIA Annual Report 2008–2009 Index
Council of Australian Governments, 6, 54, 100
Closing the Gap targets, 65National Action Plan on Mental Health,
19, 38
DDepartment of Employment and
Workplace Relations, (the former), 267
Department of Education, Employment and Workplace Relations, 38, 98, 114, 157, 254, 265, 272, 274, 289
Department of Families, Housing, Community Services and Indigenous Affairs (FaHCSIA), 10, 303, 364
governance, 216Ministers, 10, 14Parliamentary Secretaries, 10, 14Portfolio Structure, 14service charter, 252staff, 26, 227–68, 303–07, 330
Australian Workplace Agreements, 307
capability development, 27, 223, 233
Certified Agreement, 307, 330classification, 303–06Code of Conduct, 221, 235complaints management, 252diversity, 27, 227, 223, 237e‑learning, 235eliminating bullying and harassment
in the workplace, 243Employee Assistance Program, 307
Indigenous staff, 237, 267gender, 20, 22, 44, 304leadership capability, 233maximising attendance, 241–42non‑salary benefits, 307
performance management, 26, 71, 235
performance pay, 303, 306recognition, 232, 237salary ranges, 306staff with disability, 239, 308turnover, 241see also occupational health and
safety strategic framework, 7, 26–44, 232, 254
Department of Finance and Deregulation, 70, 169, 263
Department of Health and Ageing, 93
Department of Human Services, 150, 249, 235
Department of Immigration and Citizenship, 116, 117, 118
Department of Resources, Energy and Tourism, 363
Department of Veterans’ Affairs, 103, 113, 120, 143, 350
disability, support for people with, 129, 130
business services, 113see also Australian Disability
Enterprises, Child Disability Assistance payment, 137
Employment Assistance, 97, 129, 133, 250
National Disability Advocacy Program, 36
National Disability Awards, 312Disability Access Coordinator, 239supported accommodation, 93, 171,
175, 197, 204see also National Disability Agreement;
National Disability Strategy
Disability Support Pension, 19, 35, 97, 119, 121, 131, 142, 287

539Index FaHCSIA Annual Report 2008–2009
Disaster Recovery, 5, 24, 171, 133, 135, 191, 200, 201
Mumbai terrorist attack, 171, 133, 190, 201
New South Wales floods, 190Queensland floods, 190, 192, 201south‑east Queensland storms, 171,
183, 201Victorian bushfires, 24, 41, 183, 185,
190, 201, 230, 268see also Australian Government
Disaster Recovery Committee; Australian Government Disaster Recovery Payment
Discretionary grants, 339–41
domestic violence, 104
Double Orphan Pension, 161–62
Eearly childhood, 38, 66, 70, 114, 249–50
Economic Security Strategy (ESS), 3, 5
environmentalimpacts, 262, 271management, 253–60Management System, 253, 260, 262performance, 261–62see also Sustainability Report
Equal Opportunity for Women in the Workplace Agency, 11, 14, 40
Executive Management Group, 207, 216–21, 224–26, 232, 241, 253, 255, 258
committees reporting to, 220
ex‑gratia paymentsEast Timor medical evacuees, 191Bali terrorist attacks, 201
FFaHCSIA, see Department of Families,
Housing, Community Services and Indigenous Affairs
Families, support for, 20, 47, 50, 145–48, 160
Family Relationship Services Program, 146–48, 150
Family Violence Partnership Program, 150, 152, 162
Family Violence Regional Activities Program, 152, 162
Services for Families with Children, 146see also Family Relationship Services;
Family Support Package; Family Support Program; National Framework for Protecting Australia’s Children
Family Assistance Office, 156, 288, 346
Family Income Management, 183
Family Relationship Services, 147, 150, 152, 214
Family Relationship Services Australia, 150
Family Support Package, 63, 70, 81Safe Places, 63, 70
Family Support Program, 20, 39, 50, 146, 148, 152, 154
Family Tax Benefit, 50, 148, 154, 156, 161, 163–64, 287–88, 357–58, 363, 378, 381
Large Family Supplement, 164Part A, 121, 127, 148, 159, 161, 163–64,
361–62Part B, 148, 154, 159, 161, 163–64,
361–62reconciliation data, 357
Financial Management and Accountability Act 1997, 11–13, 73, 121–22, 219, 385, 364, 376

540 FaHCSIA Annual Report 2008–2009 Index
fraud and compliance, 114–15, 211
fraud control, 269, 282–83
Freedom of Information, 282, 342–46
Gglobal financial crisis, 5, 15–16, 24, 91, 94,
110–12, 171, 181, 183, 188, 190, 194
Government Business Managers, 53, 55, 56, 82, 227–28, 230, 243
HHarmer, Jeff, 4–9, 14, 33, 91–92, 214,
216–19, 223
Health Care Card, 127, 137
Homelessness, 29, 39–40, 44, 108, 112, 139–40, 171–72, 175–76, 188, 193, 195–96
A Place to Call Home, 191, 196White Paper on homelessness, 40, 108,
171, 175, 196, 334youth homelessness, 108, 112, 139–40,
341see also National Partnership
Agreement on Homelessness
Housing, 4–6, 16, 23, 31–32, 39–40, 44, 93, 171–72, 173, 177–80, 188, 193–96
Housing Affordability Fund, 39–40, 171, 173, 191
Housing Ministers’ Advisory Committee, 343
housing support, 172, 94National Rental Affordability Scheme
(NRAS), 39–40, 173–74, 192, 194–96, 348
see also Community Housing Infrastructure Program; Indigenous Housing; National Affordable Housing Agreement;
Rent Assistance; Social Housing Initiative; Social Housing Subsidy Program; Supported Accommodation Assistance Program
Hunter, Bruce, 8, 212, 214, 218–21, 224
IIndigenous
ancestral remains, 57, 84children, 20, 211, 264land rights and reform, 79Executive Director of Township Leasing,
13, 372township leases, 13, 367, 370, 372
National Indigenous Representative Body, 30, 43, 53, 58, 63, 210
substance abuse, 68, 72, 75, 274violence and child abuse in Indigenous
communities, 75, 147, 152, 163whole‑of‑government policy, 47, 49,
51, 71women, 58, 65, 77–78, 92see also Closing the Gap; Indigenous
Housing; Indigenous Engagement Officers, Little Children are Sacred report; Overcoming Indigenous Disadvantage report; National Aboriginal and Islander Day Observance Committee; National Aboriginal and Torres Strait Islander Social Survey; National Apology; Native Title; Northern Territory Emergency Response; Northern Territory Land Councils; Repatriation; Resetting the Relationship
Indigenous Business Australia, 11, 14
Indigenous community engagement, 51, 57, 65, 77, 230

541Index FaHCSIA Annual Report 2008–2009
Indigenous Communities Strategic Investment, 77
Indigenous Coordination Centres, 227, 230, 253–54, 261, 265
Indigenous Engagement Officers, 53, 55, 57, 65, 82, 230
Indigenous housing, 40, 42, 54–55, 63, 195
Indigenous Housing and Infrastructure Agreements, 74
see also Aboriginal Rental Housing Program; Australian Remote Indigenous Accommodation Program; Community Housing and Infrastructure Program; National Partnership Agreement on Remote Indigenous Housing
Indigenous Land Corporation, 12, 14, 279
Indigenous Leadership, 53, 58, 72, 77Women’s Leadership and Development
Program, 143
Indigenous Parenting Support Services, 167
information management and technology, 48, 254, 265, 268
Information and Communications Technology Committee, 212, 216, 224
information technology, 173, 262internal audit, 219, 243, 264, 269, 284
International Day of People with Disability, 240
interpreting, 57, 65, 82, 133Auslan, 133
Jjudicial decisions, 280
KKeys to Living Together, see Family
Relationship Services Program
Kris, John (Toshie), 14
LLand Councils, see Northern Territory
Land Councils
land rights, see Indigenous, land rights and reforms
leadership in FaHCSIA, 26, 207, 221, 224, 227, 228, 231, 233
Leeper, Geoff, 8, 209, 224, 240
legislation, 347
Longitudinal Study of Australian Children, 264
Longitudinal Study of Indigenous Children, 264
MMacklin, Jenny, 10, 14, 190, 247, 364
McKay, Robyn, 209
McPherson, Shirley, 14
mainstream services, 42, 198
Maternity Immunisation Allowance 148, 156, 165
mental health, 19, 100, 132COAG Mental Health Measures, 19Mental Health Community Based
Program, 38, 132National Action Plan on Mental Health,
19, 38, 100
Migration Program, 117, 118, 154, 157, 158
Mining Withholding Tax, 373
ministerial and parliamentary services, 247–49

542 FaHCSIA Annual Report 2008–2009 Index
Morony, Ron, 14
Multiple Birth Allowance,
MyTime program, 104
NNational Aboriginal and Islander Day
Observance Committee, 83
National Aboriginal and Torres Strait Islander Social Survey, 64
National Affordable Housing Agreement, 23, 40, 74, 171, 172, 195, 197, 198
National Apology to Australia’s Indigenous Peoples, 52
National Compact, 43, 188
National Disability Strategy, 36, 91, 95, 96, 111, 115
National Disability Agreement, 37, 91, 95, 130
National Framework for Protecting Australia’s Children, 6, 38, 146, 147, 152, 157, 165
National Illicit Drugs Strategy, 162
National Information Centre on Retirement Investments, 24
National Museum of Australia, 84
National Partnership Agreement on Homelessness, 40, 171–72, 175, 191, 198
National Plan to Reduce Violence against Women, 7, 22, 41, 44, 92, 104, 112, 144
National Rental Affordability Scheme, 39–40, 173, 192, 194–96
Native Title, 79Native Title Act 1993, 79Native Title Amendment Bill 2009, 276Native Title Representative Bodies, 79
Northern Territory Emergency Response, 7, 31, 42, 55, 63, 66, 68, 80, 160, 230, 268, 273, 380
community engagement, 65community stores, 60, 80–81, 270, 365employment reform, 68governance, 60review, 31
Review Board, 31, 33, 52welfare reform, 7, 68, 157
Northern Territory Land Councils, 12, 14, 73, 365, 367, 371
Anindilyakwa Land Council, 12, 14, 370 371, 375
Central Land Council, 12, 14, 366, 370–71, 375
Northern Land Council, 12, 14, 84, 280, 370–71, 375
Tiwi Land Council, 12, 14, 370–71, 375
OOffice for Women, 112, 272
Office of Indigenous Policy Coordination, 271
Office of the Registrar of Indigenous Corporations, 13, 85–87, 265, 284
governance, 53, 60litigation, 86
Office of Township Leasing, 13, 367, 372
operating results, 3
Operation Sunlight, 70, 119, 159, 193, 256
organisational structure, 214–15
Organisation for Economic Cooperation and Development, 146
outcomes, 2, 29, 47–51, 90, 145, 170
Overcoming Indigenous Disadvantage report, 16
outputs, 47–51, 90, 145, 170

543Index FaHCSIA Annual Report 2008–2009
PPaid Parental Leave, 20, 21, 34, 38, 43,
145, 146, 147
parenting support, 147, 167Indigenous, 167
Parliamentary committees, 269, 270
peak bodies, 250–51
peer support groups, 104, 139, 341
Pension Assets Test, 8, 355
Pension Bonus Scheme, 355
Pensioner Concession Card, 126–27
Pension Review, 4, 9, 18, 33–34, 91, 92, 313, 316, 325, 336
people trafficking, support for victims of, 106, 107, 279
performance reporting, 45–205
Personal Helpers and Mentors Program, 38, 100, 102, 132
petrol sniffing, 274Petrol Sniffing Strategy, 274
playgroups, 66, 98, 133Community Playgroups, 167
Plibersek, Tanya, 10, 14, 69, 105, 106, 175, 176, 247
Portfolio Additional Estimates, 70, 119, 158, 193
Portfolio Budget Statements, 28, 46
Portfolio Supplementary Additional Estimates Statements, 121, 159, 193
Portfolio Supplementary Additional Estimates Statements No.2, 160, 193
Portfolio Supplementary Estimates Statements, 120, 159
print disability services, 133
privacy, 281
Productivity Commission, 16, 21, 277
project management, 233
prosecutions, 141, 270, 289Commonwealth Director of Public
Prosecutions, 107, 286
protective security, 235, 264–65
Rreconciliation, 25, 156, 288
Reconciliation Action Plan, 25, 238, 261
Reconnect, 108, 112, 140
Reconnecting People Assistance Package, 203, 204
Regional Partnership Agreements, 78
Remote Area Exemptions, 68
Remuneration Committee, 216, 220
Rent Assistance, 44, 172, 175, 196
Repatriation, 57, 72, 84Repatriation Reference Committee,
343
Research and Evaluation Committee, 209, 211, 225, 263
Resetting the relationship, 52
Right Payments to the Right People, 285
Risk Assessment and Audit Committee, 209, 216, 219, 222, 223
risk management, 254, 255, 256, 257, 286
Rudd, Kevin, 104, 105, 106, 175, 176

544 FaHCSIA Annual Report 2008–2009 Index
SSafe Places, see Family Support Package
same‑sex couplesRemoval of differential treatment of
same‑sex couples and their children—law reform, 119, 158, 192
Secretary, 4, 14, 207, 214, 215, 216, 217, 218, 219
Secretary’s Message, 4–8
Senior Management Group, 216, 218–19
seniors, 2, 5, 9, 14, 16, 17, 18, 33, 35, 47, 49, 90, 91, 92, 94, 110, 111, 113, 114, 115, 116, 117, 120, 123, 214
see also Age Pension; Commonwealth Seniors Health Card; concession cards
Shorten, Bill, 8, 10, 14, 41, 96, 99, 111, 185, 191, 247
Social Housing Initiative, 5, 16, 23, 40, 171, 177–81, 190, 193, 215, 274
Social Housing Subsidy Program, 197
social justice and equity impact, 25
social policy, 2, 10, 27, 28, 214, 228, 253research services, 263
social security, 94, 110, 114, 117, 118, 131, 136, 137, 271, 273, 275, 289
international social security agreements, 18, 110, 116, 122
Social Security Appeals Tribunal, 12, 14, 249, 285
Sole Parent Pension, 142
Special Benefit, 107, 121, 122
Special Disability Trust, 36, 97–98, 276
staffing overview, 303–07
staff survey, 227, 231–2
Steele, Mairi, 14
Stephens, Ursula, 8, 10, 14, 183, 247
strategic risks, 27, 253, 255
strategic themes, 225
Stronger Families and CommunitiesStrategy, 189Communities for Children, 146, 149–50
substance abuse, 23, 68, 72, 188, 274
superannuation, 18, 22, 24, 94, 110, 116, 117, 118, 158, 355
Superannuation Guarantee, 17, 354
Supported Accommodation Assistance Program, 194, 197, 204
supported employment services, 134, 135
Sustainability Report, 253, 260, 262
TTelephone Allowance, 128
Tiwi Islands, 365
Torres Strait Regional Authority, 12, 14
Township Leasing, see Indigenous
Treasury, the, 129
Tuggeranong Office Park, 262
UUnited Nations Commission on the Status
of Women, 106–08Secretary General Ban Ki‑moon, 106
United Nations Convention on the Elimination of All Forms of Discrimination against Women, 40
United Nations Convention on the Rights of Persons with Disabilities, 36, 111
United Nations Declaration on the Rights of Indigenous Peoples, 29, 52, 210

545Index FaHCSIA Annual Report 2008–2009
Utilities Allowance, 128
VValues, 26
Voluntary Income Management, 157
Volunteers, 25, 171, 185, 192, 203–04Volunteer Management Program, 192Volunteer Resource Centres, 192
WWidow B Pension, 141, 142
Wife PensionAge, 141–43DSP, 141–43
Wilson, Serena, 8, 211, 214, 217, 218, 219, 220, 221, 223, 225
womensupport for, 104, 141Women’s Leadership and Development
Program, 109, 143Women’s Safety Agenda, 144see also National Plan to Reduce
Violence against Women; United Nations Convention on the Elimination of All Forms of Discrimination against Women
workforce planning, 241
Wreck Bay Aboriginal Community Council, 13, 14
YYates, Bernie, 210–11, 215, 217, 218, 219,
220, 223, 224
youth, 68, 81, 90, 108, 112, 139–40, 187Newly Arrived Youth Support Services,
112Reconnect program, 108, 112, 140see also Homelessness

546 FaHCSIA Annual Report 2008–2009 Case studies index
AAge Pension 1909–2009, inside front cover
Staff in focus—Anura Samara, 236
Assisting flood victims in Queensland and New South Wales, 184
Australian Disability Enterprises, 99
BBasicsCard—faster, easier, better, 67
Building Strong Stores, 62
Building stronger communities on APY lands, 61
CCaseworkers in the Australian Red Cross Support for Victims of People Trafficking Program,
107
Charities talk about FaHCSIA Staff donations making a difference, 229
Communities for Children—Broadmeadows, 149
Consultations on the development of the National Disability Strategy, 96
EEconomic Security Strategy campaigns, 93
Emergency Relief—supporting service providers to respond to the Victorian Bushfires, 186
FFaHCSIA a winner in Comcover awards, 257
FaHCSIA Leadership Disability Group, 240
FaHCSIA People Strategy 2009–10, The, 234
FaHCSIA’s Reconciliation Action Plan 2008–09, 238
Family Relationship Services for Humanitarian Entrants, 155
Financial Management Program, 182
Fixing Houses for Better Health at Nyirripi, Northern Territory, 32
HHelping Children with Autism Package—Autism Advisor Program, 101
Homelessness White Paper, 176
Case studies index

547Case studies index FaHCSIA Annual Report 2008–2009
IIndigenous Leadership program—women’s leadership, 59
Information sharing to better protect Australia’s children, 169
LLocal Answers—the Frankston Community Kitchen, 189
NNational Plan to Reduce Violence against Women and their Children, 105
National Rental Affordability Scheme—St George Community Housing, 174
New FaHCSIA funding agreements, 259
Ngaanyatjarra Pitjantjatjara Yankuntjatjara Cross Border Project, 153
Northern Territory Emergency Response—ensuring access to food and other essentials, 56
PPaid Parental Leave scheme, 21
Pension Review, 9
Personal Helpers and Mentors remote services model, 102
Port Augusta Family Relationship Centre, 151
SSocial Housing Initiative—first dwelling to be upgraded as part of the Economic Stimulus
Plan, 180
Social Housing Initiative—In focus, 178
Social Housing Initiative—new job opportunity for local development company in South Australia, 179
VVictorian Bushfires—youth support response, 187
WWomen’s Leadership and Development Program Grants, 109
YYajilarra—To Dream, 69

548 FaHCSIA Annual Report 2008–2009 Case studies index
FaHCS
IA1034
3.09
09
FaHCSIA A
nnual Report
www.fahcsia.gov.auDepartment of Families, Housing, Community Services and Indigenous AffairsTelephone: 1300 653 227
Annual Report
08 09
Improving the lives of Australians


