68
Annual Defined Contribution Benchmarking Survey Ease of Use Drives Engagement in Saving for Retirement 2015 Edition
Annual Defined Contribution Benchmarking SurveyEase of Use Drives Engagement in Saving for Retirement
2015 Edition
Annual Defined Contribution Benchmarking SurveyStronger economy provides the building blocks for positive trends in DC plans
2013–2014 Edition
Executive summary
Demographics and background information
Hot topics
Eligibility and enrollment
Contributions
Investments
Fees
Administration capabilities and innovation
Provider relationships
Plan effectiveness
Appendix
Contents
Annual Defined Contribution Benchmarking Survey: Ease of Use Drives Engagement in Saving for Retirement 1
Executive summary
Key findings of the 2015 Deloitte Defined Contribution Benchmarking Survey revealed that many of the approaches taken by plan sponsors to make it easier for employees to participate in saving for retirement are paying dividends. From auto-enrollment and step-up contributions to an easing of service requirements for plan entry and immediate plan matching, from managed accounts and fund rebalancing to offering individual counseling, and from providing smartphone/tablet apps, the focus on “ease of use” is helping to move the participation needle in the right direction.
By the numbers As evidenced in previous surveys, the overall economic environment plays a major role in employee participation as well. The approaches noted above, supported by a stable, growing economy and steady job market, translated to positive trends in the defined contribution world. The 2015 survey showed that the average employee participation rate remained high at 75% and consistent with 77% reported in 2013-14. Plan sponsors are tuned into the importance of this measure with 60% ranking “high level of participation” as the top indicator of plan effectiveness, compared to 51% last year.
From a participant perspective, the average account balance grew in 2015 to $99,011, up almost 4% from $95,227 in 2013-14. A measurable advance in actual deferral percentages (ADP) was also recorded. For non-highly compensated employees (NHCEs), the median ADP was 5.9% (compared to 5.2% in 2013-14), while the median ADP for highly compensated employees (HCEs) was 7.0% (compared to 6.9% in 2013-14). This growth may be attributed to the continued emphasis that plan sponsors—and providers—place on engaging employees.
The annual defined contribution survey brings into focus how employers are thinking about—and acting upon—the challenges of providing a defined contribution plan that effectively supports the needs of employees in saving for retirement as well as the strategic objectives of the organization’s overall rewards program.
Smoothing the pathOne clear message from surveys over the last several years is that there is no single answer to the employee engagement question. Aligned with this reality is the data point that 34% of employers view lack of awareness or understanding as the primary reason employees do not participate. In light of this situation, plan sponsors are addressing the challenge with strategies that encompass plan mechanics and plan offerings, along with a heavy emphasis on communications and education.
Automatic enrollment again scored high marks from plan sponsors in terms of having a positive impact on the average contribution rate (70%, up from 56%), plan participation rate (88%, up from 79%), and participant awareness (64%, up from 57%). These trends point to a lesson learned with respect to automatic enrollment in that it improves employee engagement in a number of key areas by removing a decision barrier and literally programming it into the employee’s rewards package. Step-up contributions, where a participant’s deferral percentage is automatically increased each year, are moving the engagement index as well, with 62% of plans employing this feature (up from 46% in the previous survey). Utilization of the step-up (also known as escalation) feature continues to grow, with 7% of plan sponsors indicating more than 50% of participants making step-up contributions (up from 6%).
Annual Defined Contribution Benchmarking Survey: Ease of Use Drives Engagement in Saving for Retirement 2
From a plan mechanics perspective, two-thirds of plan sponsors (66%) indicated no service requirements for plan entry compared to 62% in the last survey, while age requirements were less restrictive as well, with 49% having no requirement (up from 42%). The same holds true for service requirements related to matching contributions where the match is made immediately upon participation at 71% of employers in 2015, continuing an upward trend from 62% in 2013-14 and 56% in 2012. At the same time, immediate, full vesting in the match continues to gain ground among plan sponsors at 43%, up from 32% in 2013-14. It is clear that organizations are increasingly providing a valued incentive for newly hired employees, smoothing the path for getting them engaged in retirement savings.
Taking the driver’s seat The survey confirmed that many employees are not experienced—or comfortable—in choosing and managing an investment portfolio. This is reflected in the finding that, for employers who sought employee feedback, 40% of employees indicated that “where to invest and which funds to use” was a top concern. In response, plan sponsors and providers are offering a number of options. For example, managed accounts allow an employee to choose a professional manager to take the driver’s seat and make investment decisions in line with the individual’s objectives and risk tolerance. Over one-third of plans offer managed accounts, and participation continues to grow as employees find it easier to hand off the responsibility to the experts and ride along as a passenger.
Another area in which employees can take their hands off the investment wheel is provided via fund rebalancing. Here employees can elect a target allocation percentage among fund offerings and the system will automatically initiate interfund transfers on a regular basis to achieve the target allocation. Seventy-two percent of providers offer this functionality, up from 67% on the previous survey.
Providing individual financial counseling/investment advice is another means to support employees in navigating the complex world of investments. Sixty-six percent of plans make this service available to all or some employees, compared to 62% last year. One area that’s on the rise is in direct response to the mobile world of smartphones and tablets. Over half of plan sponsors indicated that their providers support mobile transaction processing, up from one-fourth of respondents in 2012. Participant use of smartphone/tablet applications grew to 40% from 31% in the previous survey.
Annual Defined Contribution Benchmarking Survey: Ease of Use Drives Engagement in Saving for Retirement 3
For each of these tactics, the objective is to tailor the interaction to employee preferences and generate greater engagement. Based on survey results, these efforts are paying off, as 63% of plan sponsors agree that participants are well-informed of plan features and investment options, up from 54% in last year’s survey.
New insights New questions introduced on the 2015 survey focused on two truly hot topics—cyber security and predictive analytics. The survey found that more than half (55%) of plan sponsors have reviewed their provider’s cyber security policy and procedures within the past year, with another 25% conducting a review in the past one to five years. Confidence in cyber security policies is generally high, with 89% of respondents either very or somewhat confident.
Turning to predictive analytics, more than half of plan sponsors (55%) agree that predictive analytics offer valuable insight into improving defined contribution plan efficiency and effectiveness, but only 41% feel their organization understands how to use predictive analytics. With respect to adoption, just more than one quarter (28%) of plan sponsors are using predictive analytics. These findings indicate that the perceived value of predictive analytics outpaces the understanding of how to apply these data insights, which in turn outpaces actual adoption. This could point to predictive analytics as an area of growth—and opportunity—in the future for plan sponsors.
Multiple touch points When asked about the tactics used to encourage savings and raise awareness of assets needed in retirement, the highest rated approaches were general and multiple communications/education at 83%, followed by targeted communications at 68%, up from 56% in the last survey. Group meetings remained in the top three at 66%, up from 60%.
Communications are clearly linked to these objectives, so plan sponsors were asked to choose the most effective way to communicate with employees. The top three methods were unchanged from last year—individual meetings (23%), group meetings (21%), and targeted communications (21%). It is worth noting that each of the top three put the employee at the center of communications, making it easier for the employee to get engaged—and stay engaged—in saving for retirement.
The match and more There are a number of reasons employees participate in a defined contribution plan, and the survey seeks to identify the most prominent drivers. Based on the 2015 results, the personal desire to save for retirement at 40% (up slightly from 39%) overtook the leader from the 2013-14 survey, which was taking advantage of the company match at 35% (down from 43%). At the same time, there is no underestimating the power of the match.
Annual Defined Contribution Benchmarking Survey: Ease of Use Drives Engagement in Saving for Retirement 4
Consistent with findings over the last three years, the survey showed nearly all plan sponsors (94%) are offering some form of matching or profit-sharing contribution in their defined contribution plans, with 6% increasing the match. Significantly, this is the first time in five surveys dating back to 2009 that 100% of plan sponsors with discretionary matching reported making matching contributions. The matching formula varies to a large degree. Of the options listed in the survey, 50% of the first 6% of the employee’s contribution led other options at 18% (up from 15% in 2013-14). A notable increase was seen in the 100% of the first 6% match, the formula used by 12% of plans (up from 7%).
Consistent prioritiesWhen first introduced, defined contribution plans were not intended to be the sole—or even primary—retirement vehicle of the American worker. However, as access to retirement income sources, such as employer-sponsored defined benefit plans continues to decline and Social Security benefits are not the “slam-dunk” certainty as in the past, defined contribution plans now represent the main source of future retirement income for a wide—and growing—majority of the workforce. Within this context, two-thirds of employers responding to the 2015 survey feel that only some of their employees are saving adequately.
This reality is top of mind for plan sponsors when asked to prioritize areas of importance to their organization’s plan. Providing the right investments to help participants achieve retirement goals continues to top the list for 89%, followed by improving participant education at 86%, and retirement readiness at 83%. These top three were consistent with the previous survey. Here
again, plan sponsors are taking steps to address the readiness gap, with 65% providing retirement readiness assessments to employees in 2015, up from 55% in the previous survey.
Additional data related to priorities was also revealed. Improving plan governance saw the largest increase, with 69% of plan sponsors viewing this as very or quite important, compared to 57% in 2013-14. At the same time, reducing plan risk (77%), potentially reducing plan expenses (77%), and improving administrative services (61%) showed slight gains from the previous survey.
The right mix, the right options Given that providing the right investments is the number one priority, plan sponsors continually assess the total number of investment options offered. In the 2015 survey, the average among all plans was 22.31, which is up from 20.75 in 2013-14. Consistent with the previous survey, 2015 results showed that 90% of plan sponsors feel the appropriate number of investment options are currently offered.
Annuities are a frequent topic in retirement savings discussions, but there continues to be limited interest from plan sponsors. In-plan retirement income products allow participants to protect longer-term investments against loss, while maintaining the opportunity for investment growth. At this point, 2% of plan sponsors have added this option, with another 11% looking into it. At-retirement income solutions include annuity purchase options and/or annuity selection software. The 2015 survey revealed that 5% of plan sponsors have added this option, with another 14% looking into it.
Annual Defined Contribution Benchmarking Survey: Ease of Use Drives Engagement in Saving for Retirement 5
Meanwhile, a Roth 401(k) is now offered by 60% of plan sponsors, a substantial move up from the 51% reported on the 2013-2014 survey. The Roth 401(k) appears to be consistently popular, with adoption rates climbing slightly in 2015 based on survey data.
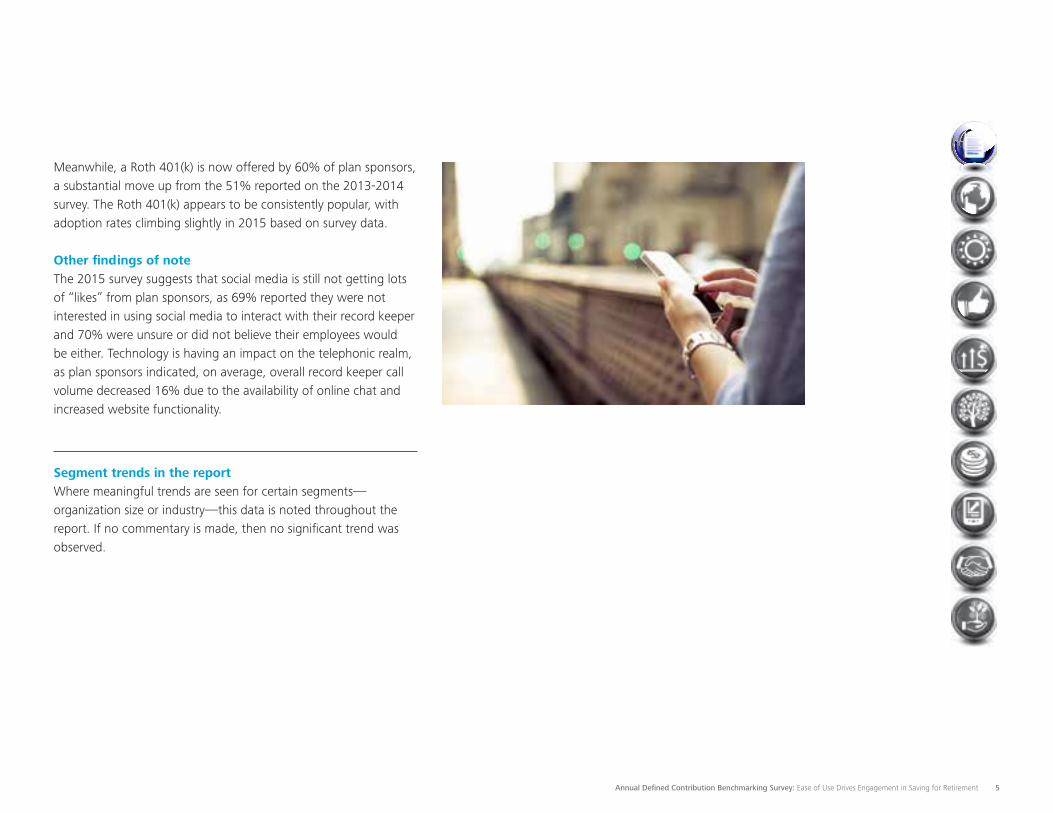
Other findings of note The 2015 survey suggests that social media is still not getting lots of “likes” from plan sponsors, as 69% reported they were not interested in using social media to interact with their record keeper and 70% were unsure or did not believe their employees would be either. Technology is having an impact on the telephonic realm, as plan sponsors indicated, on average, overall record keeper call volume decreased 16% due to the availability of online chat and increased website functionality.
Segment trends in the report Where meaningful trends are seen for certain segments—organization size or industry—this data is noted throughout the report. If no commentary is made, then no significant trend was observed.
Annual Defined Contribution Benchmarking Survey: Ease of Use Drives Engagement in Saving for Retirement 6
Demographics and background information
In 2015, Deloitte1 conducted an online defined contribution survey, collecting data from nearly 400 plan sponsors, an increase in the number of respondents from last year reflecting a growing interest in the many areas explored in the survey. Responses to every question were not required for survey submission. This report illustrates an overview of the 401(k) and 403(b) plans features, policies, objectives, and attitudes of the participating defined contribution plan sponsors for this year’s survey. Throughout this report, we focus on the current issues and trends faced by employers. While the findings of this survey cannot be expanded to reflect the entire population of defined contribution plan sponsors in the United States, it is representative of a broad variety of defined contribution plans.
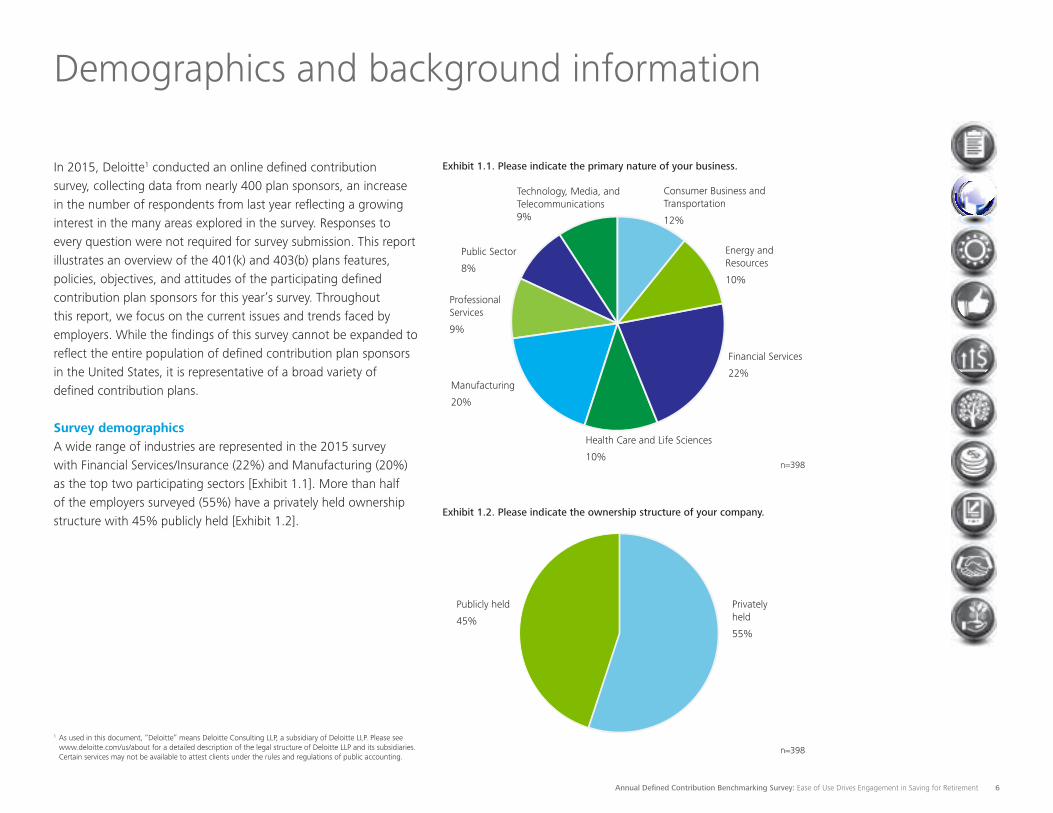
Survey demographics A wide range of industries are represented in the 2015 survey with Financial Services/Insurance (22%) and Manufacturing (20%) as the top two participating sectors [Exhibit 1.1]. More than half of the employers surveyed (55%) have a privately held ownership structure with 45% publicly held [Exhibit 1.2].
Exhibit 1.1. Please indicate the primary nature of your business.
Exhibit 1.2. Please indicate the ownership structure of your company.
Consumer Business and Transportation
12%
Energy and Resources
10%
Financial Services
22%
Health Care and Life Sciences
10%
Manufacturing
20%
Publicly held
45%
Privately held
55%
Professional Services
9%
Public Sector
8%
Technology, Media, and Telecommunications 9%
1 As used in this document, “Deloitte” means Deloitte Consulting LLP, a subsidiary of Deloitte LLP. Please see www.deloitte.com/us/about for a detailed description of the legal structure of Deloitte LLP and its subsidiaries. Certain services may not be available to attest clients under the rules and regulations of public accounting.
n=398
n=398
Annual Defined Contribution Benchmarking Survey: Ease of Use Drives Engagement in Saving for Retirement 7
Exhibit 1.3. How many employees work for your company?
2012 2013-2014 2015
1 – 100 11% 13% 8%
101 – 500 12% 23% 11%
501 – 1,000 8% 9% 10%
1,001 – 5,000 30% 10% 31%
5,001 – 10,000 12% 22% 13%
More than 10,000 27% 23% 27%
n=398
Exhibit 1.4. What is the average age of your participating group?
2012 2013-2014 2015
Less than 30 1% 1% 1%
31 – 40 27% 25% 26%
41 – 50 69% 69% 66%
Greater than 50 3% 5% 7%
n=368
Exhibit 1.5. What is the average length of service of your participating group?
2012 2013-2014 2015
Less than one year 1% 1% 1%
1 – 5 years 16% 14% 16%
6 – 10 years 44% 38% 41%
11 – 15 years 27% 32% 31%
16 – 20 years 9% 12% 8%
21 – 25 years 3% 2% 2%
Greater than 25 years 0% 1% 1%
n=354
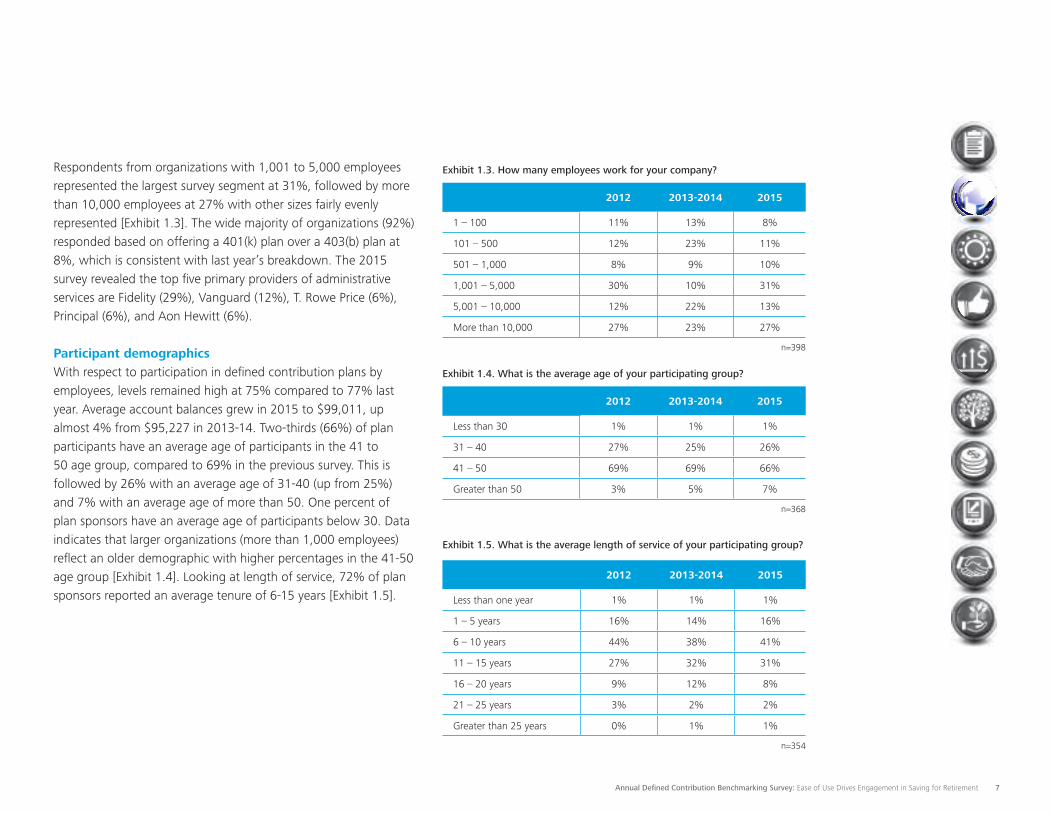
Respondents from organizations with 1,001 to 5,000 employees represented the largest survey segment at 31%, followed by more than 10,000 employees at 27% with other sizes fairly evenly represented [Exhibit 1.3]. The wide majority of organizations (92%) responded based on offering a 401(k) plan over a 403(b) plan at 8%, which is consistent with last year’s breakdown. The 2015 survey revealed the top five primary providers of administrative services are Fidelity (29%), Vanguard (12%), T. Rowe Price (6%), Principal (6%), and Aon Hewitt (6%).
Participant demographics With respect to participation in defined contribution plans by employees, levels remained high at 75% compared to 77% last year. Average account balances grew in 2015 to $99,011, up almost 4% from $95,227 in 2013-14. Two-thirds (66%) of plan participants have an average age of participants in the 41 to 50 age group, compared to 69% in the previous survey. This is followed by 26% with an average age of 31-40 (up from 25%) and 7% with an average age of more than 50. One percent of plan sponsors have an average age of participants below 30. Data indicates that larger organizations (more than 1,000 employees) reflect an older demographic with higher percentages in the 41-50 age group [Exhibit 1.4]. Looking at length of service, 72% of plan sponsors reported an average tenure of 6-15 years [Exhibit 1.5].
Annual Defined Contribution Benchmarking Survey: Ease of Use Drives Engagement in Saving for Retirement 8
Exhibit 1.6. What is the total number of participant accounts with a balance greater than $0 in your plan?
2012 2013-2014 2015
1 – 100 11% 13% 11%
101 – 500 13% 20% 13%
501 – 1,000 8% 8% 9%
1,001 – 5,000 31% 26% 33%
5,001 – 10,000 15% 11% 11%
Greater than 10,000 21% 22% 23%
n=360
Exhibit 1.7. What are the total plan assets in your plan?
2012 2013-2014 2015
Less than $5M 10% 9% 7%
$5M – 10M 5% 10% 4%
$10M – 25M 8% 10% 8%
$25M – 50M 8% 9% 8%
$50M – 100M 12% 8% 9%
$100M – 500M 29% 23% 27%
$500M – 1B 14% 11% 13%
$1B – 5B 12% 16% 18%
Greater than $5B 3% 3% 6%
n=367
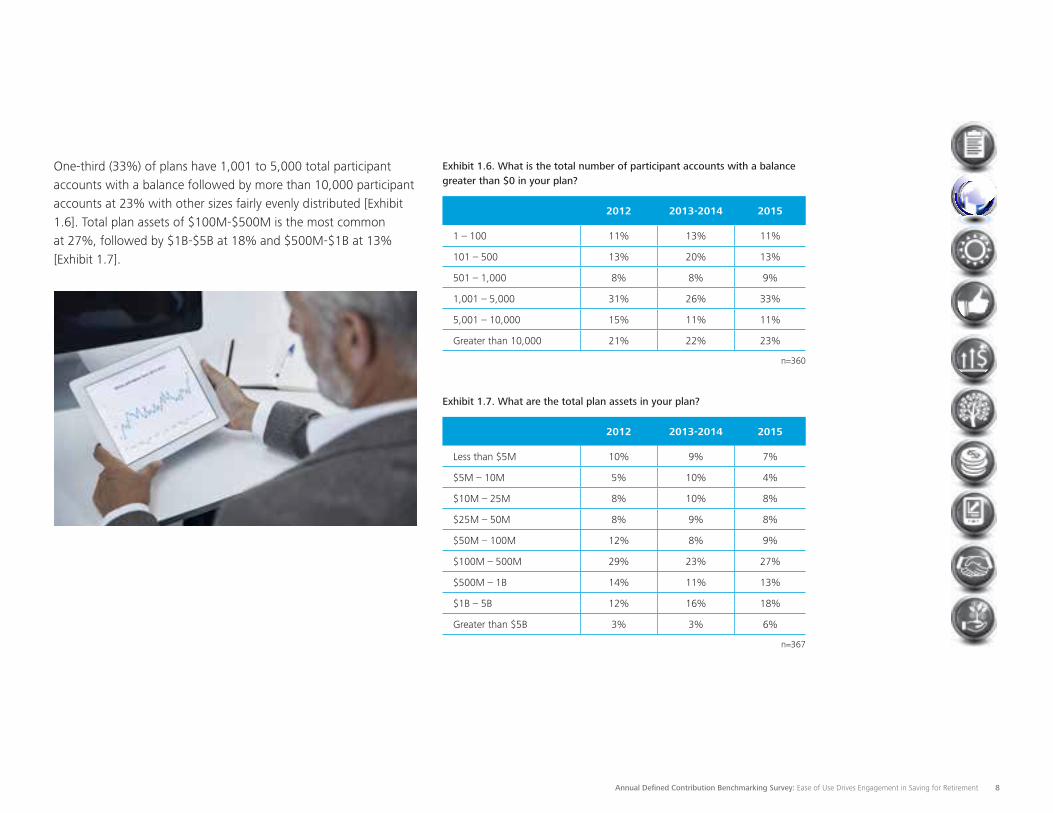
One-third (33%) of plans have 1,001 to 5,000 total participant accounts with a balance followed by more than 10,000 participant accounts at 23% with other sizes fairly evenly distributed [Exhibit 1.6]. Total plan assets of $100M-$500M is the most common at 27%, followed by $1B-$5B at 18% and $500M-$1B at 13% [Exhibit 1.7].
Annual Defined Contribution Benchmarking Survey: Ease of Use Drives Engagement in Saving for Retirement 9
Exhibit 1.8. What do you consider to be the most important objective of your plan?
2013-2014
2015
Facilitating optimal retirement income replacement 27% 38%
Increasing participant savings rate 32% 25%
Increasing participation rates 12% 14%
Improving communication and education efforts 19% 14%
Improving investment outcomes 5% 5%
Improving investment line up 4% 3%
Improving asset allocation 1% 1%
Minimizing leverage of assets from the plan 1% 0%
n=341
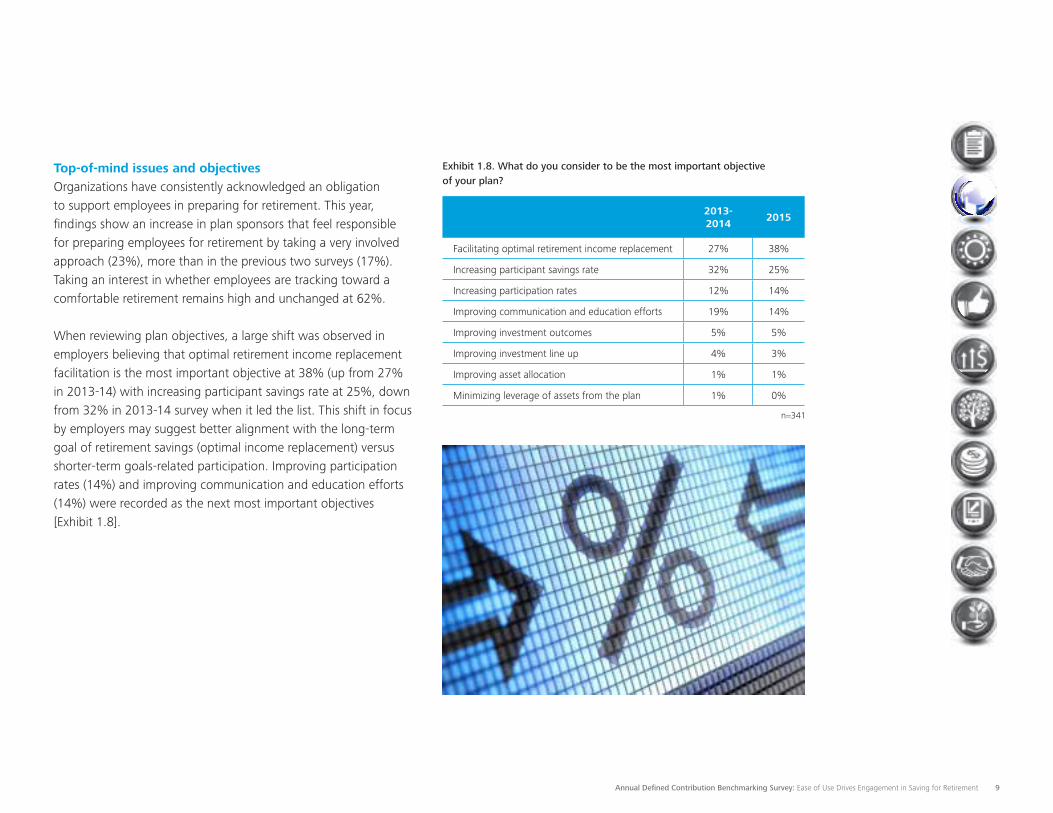
Top-of-mind issues and objectives Organizations have consistently acknowledged an obligation to support employees in preparing for retirement. This year, findings show an increase in plan sponsors that feel responsible for preparing employees for retirement by taking a very involved approach (23%), more than in the previous two surveys (17%). Taking an interest in whether employees are tracking toward a comfortable retirement remains high and unchanged at 62%.
When reviewing plan objectives, a large shift was observed in employers believing that optimal retirement income replacement facilitation is the most important objective at 38% (up from 27% in 2013-14) with increasing participant savings rate at 25%, down from 32% in 2013-14 survey when it led the list. This shift in focus by employers may suggest better alignment with the long-term goal of retirement savings (optimal income replacement) versus shorter-term goals-related participation. Improving participation rates (14%) and improving communication and education efforts (14%) were recorded as the next most important objectives [Exhibit 1.8].
Annual Defined Contribution Benchmarking Survey: Ease of Use Drives Engagement in Saving for Retirement 10
Hot topics
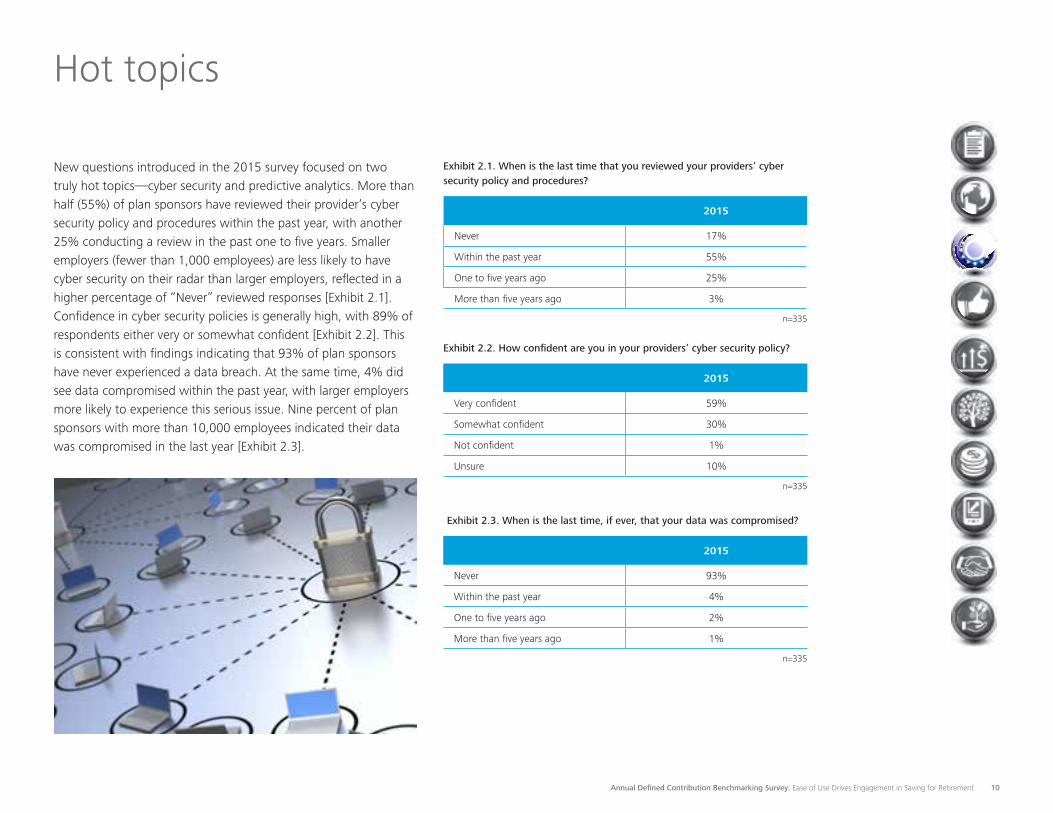
New questions introduced in the 2015 survey focused on two truly hot topics—cyber security and predictive analytics. More than half (55%) of plan sponsors have reviewed their provider’s cyber security policy and procedures within the past year, with another 25% conducting a review in the past one to five years. Smaller employers (fewer than 1,000 employees) are less likely to have cyber security on their radar than larger employers, reflected in a higher percentage of “Never” reviewed responses [Exhibit 2.1]. Confidence in cyber security policies is generally high, with 89% of respondents either very or somewhat confident [Exhibit 2.2]. This is consistent with findings indicating that 93% of plan sponsors have never experienced a data breach. At the same time, 4% did see data compromised within the past year, with larger employers more likely to experience this serious issue. Nine percent of plan sponsors with more than 10,000 employees indicated their data was compromised in the last year [Exhibit 2.3].
Exhibit 2.1. When is the last time that you reviewed your providers’ cyber security policy and procedures?
2015
Never 17%
Within the past year 55%
One to five years ago 25%
More than five years ago 3%
n=335
Exhibit 2.2. How confident are you in your providers’ cyber security policy?
2015
Very confident 59%
Somewhat confident 30%
Not confident 1%
Unsure 10%
n=335
Exhibit 2.3. When is the last time, if ever, that your data was compromised?
2015
Never 93%
Within the past year 4%
One to five years ago 2%
More than five years ago 1%
n=335
Annual Defined Contribution Benchmarking Survey: Ease of Use Drives Engagement in Saving for Retirement 11
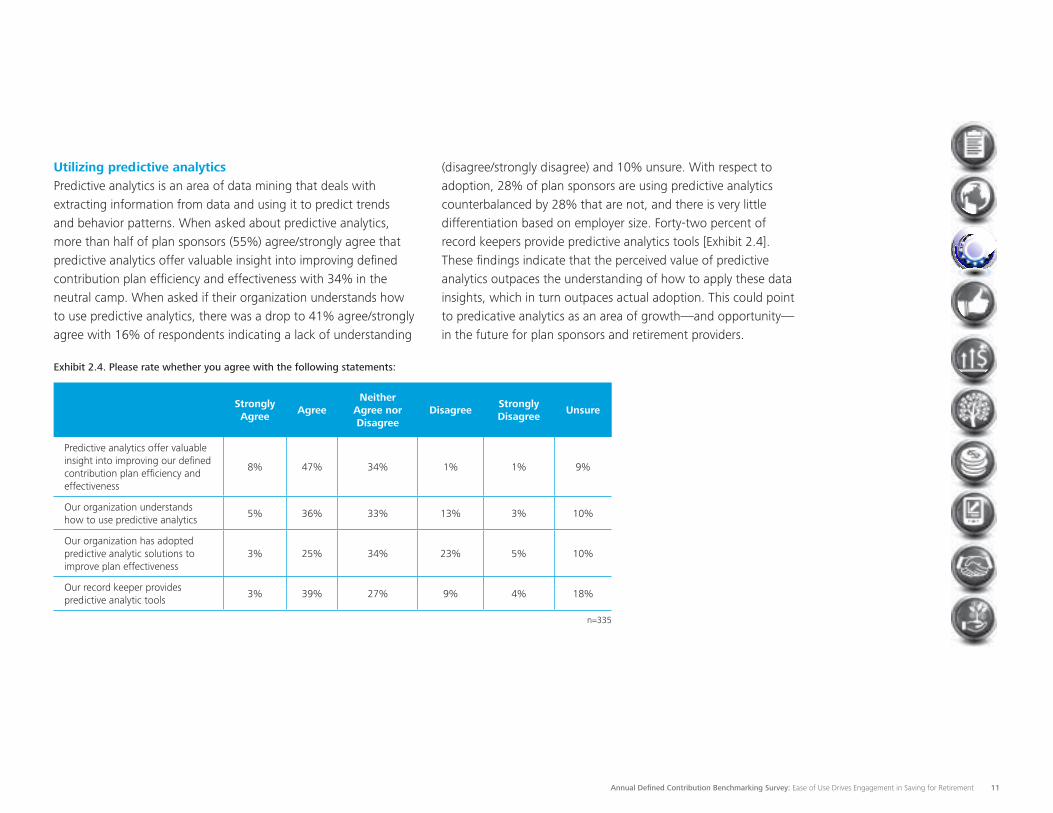
Utilizing predictive analytics Predictive analytics is an area of data mining that deals with extracting information from data and using it to predict trends and behavior patterns. When asked about predictive analytics, more than half of plan sponsors (55%) agree/strongly agree that predictive analytics offer valuable insight into improving defined contribution plan efficiency and effectiveness with 34% in the neutral camp. When asked if their organization understands how to use predictive analytics, there was a drop to 41% agree/strongly agree with 16% of respondents indicating a lack of understanding
Exhibit 2.4. Please rate whether you agree with the following statements:
Strongly Agree
AgreeNeither
Agree nor Disagree
DisagreeStrongly Disagree
Unsure
Predictive analytics offer valuable insight into improving our defined contribution plan efficiency and effectiveness
8% 47% 34% 1% 1% 9%
Our organization understands how to use predictive analytics
5% 36% 33% 13% 3% 10%
Our organization has adopted predictive analytic solutions to improve plan effectiveness
3% 25% 34% 23% 5% 10%
Our record keeper provides predictive analytic tools
3% 39% 27% 9% 4% 18%
n=335
(disagree/strongly disagree) and 10% unsure. With respect to adoption, 28% of plan sponsors are using predictive analytics counterbalanced by 28% that are not, and there is very little differentiation based on employer size. Forty-two percent of record keepers provide predictive analytics tools [Exhibit 2.4]. These findings indicate that the perceived value of predictive analytics outpaces the understanding of how to apply these data insights, which in turn outpaces actual adoption. This could point to predicative analytics as an area of growth—and opportunity—in the future for plan sponsors and retirement providers.
Annual Defined Contribution Benchmarking Survey: Ease of Use Drives Engagement in Saving for Retirement 12
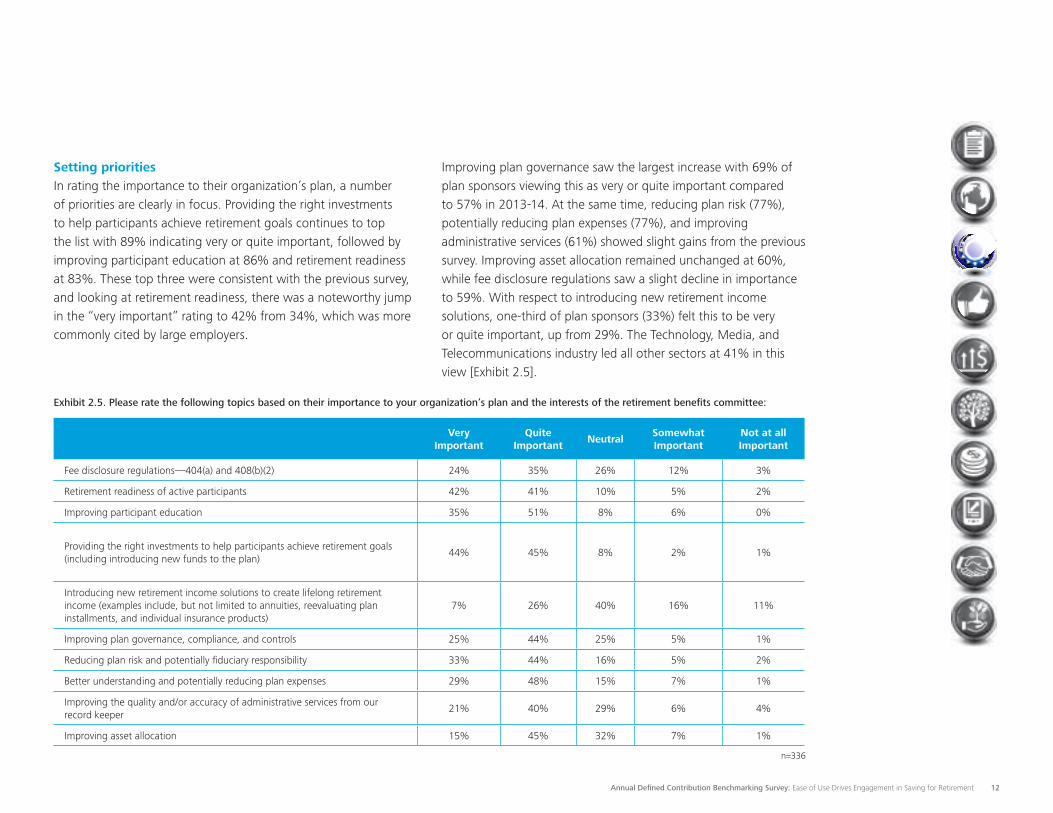
Setting priorities In rating the importance to their organization’s plan, a number of priorities are clearly in focus. Providing the right investments to help participants achieve retirement goals continues to top the list with 89% indicating very or quite important, followed by improving participant education at 86% and retirement readiness at 83%. These top three were consistent with the previous survey, and looking at retirement readiness, there was a noteworthy jump in the “very important” rating to 42% from 34%, which was more commonly cited by large employers.
Improving plan governance saw the largest increase with 69% of plan sponsors viewing this as very or quite important compared to 57% in 2013-14. At the same time, reducing plan risk (77%), potentially reducing plan expenses (77%), and improving administrative services (61%) showed slight gains from the previous survey. Improving asset allocation remained unchanged at 60%, while fee disclosure regulations saw a slight decline in importance to 59%. With respect to introducing new retirement income solutions, one-third of plan sponsors (33%) felt this to be very or quite important, up from 29%. The Technology, Media, and Telecommunications industry led all other sectors at 41% in this view [Exhibit 2.5].
Exhibit 2.5. Please rate the following topics based on their importance to your organization’s plan and the interests of the retirement benefits committee:
Very
ImportantQuite
ImportantNeutral
Somewhat Important
Not at all Important
Fee disclosure regulations—404(a) and 408(b)(2) 24% 35% 26% 12% 3%
Retirement readiness of active participants 42% 41% 10% 5% 2%
Improving participant education 35% 51% 8% 6% 0%
Providing the right investments to help participants achieve retirement goals (including introducing new funds to the plan)
44% 45% 8% 2% 1%
Introducing new retirement income solutions to create lifelong retirement income (examples include, but not limited to annuities, reevaluating plan installments, and individual insurance products)
7% 26% 40% 16% 11%
Improving plan governance, compliance, and controls 25% 44% 25% 5% 1%
Reducing plan risk and potentially fiduciary responsibility 33% 44% 16% 5% 2%
Better understanding and potentially reducing plan expenses 29% 48% 15% 7% 1%
Improving the quality and/or accuracy of administrative services from our record keeper
21% 40% 29% 6% 4%
Improving asset allocation 15% 45% 32% 7% 1%
n=336
Annual Defined Contribution Benchmarking Survey: Ease of Use Drives Engagement in Saving for Retirement 13
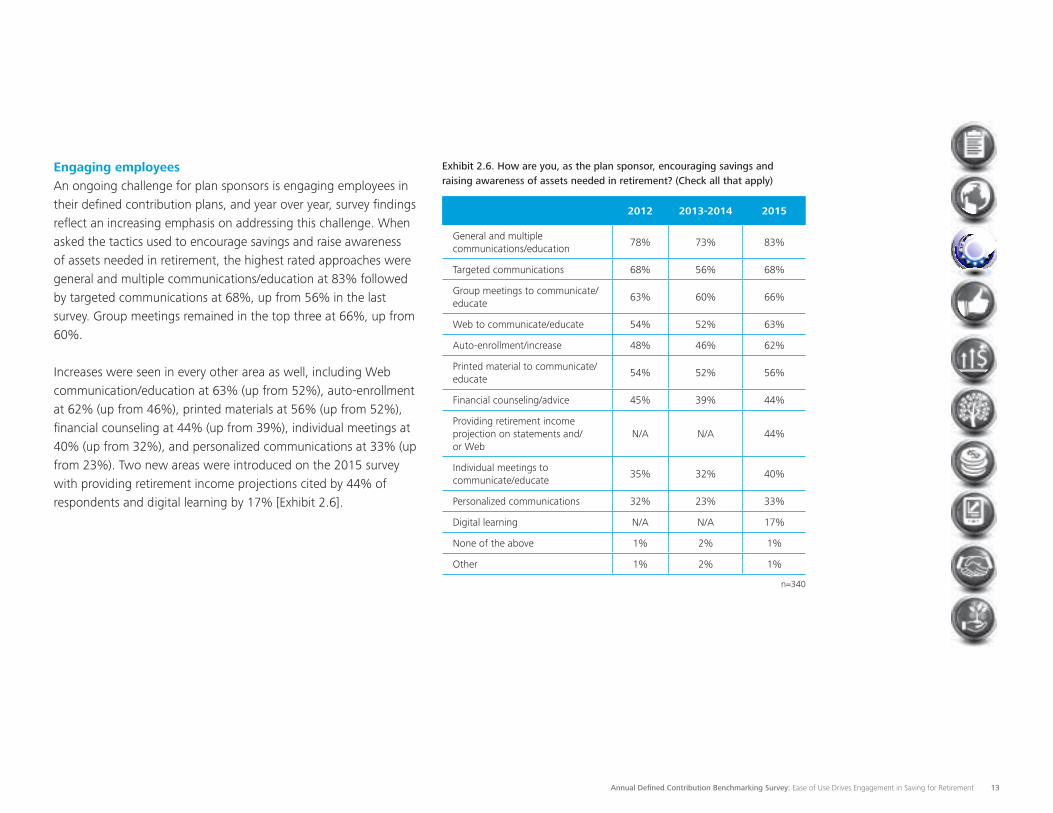
Engaging employees An ongoing challenge for plan sponsors is engaging employees in their defined contribution plans, and year over year, survey findings reflect an increasing emphasis on addressing this challenge. When asked the tactics used to encourage savings and raise awareness of assets needed in retirement, the highest rated approaches were general and multiple communications/education at 83% followed by targeted communications at 68%, up from 56% in the last survey. Group meetings remained in the top three at 66%, up from 60%.
Increases were seen in every other area as well, including Web communication/education at 63% (up from 52%), auto-enrollment at 62% (up from 46%), printed materials at 56% (up from 52%), financial counseling at 44% (up from 39%), individual meetings at 40% (up from 32%), and personalized communications at 33% (up from 23%). Two new areas were introduced on the 2015 survey with providing retirement income projections cited by 44% of respondents and digital learning by 17% [Exhibit 2.6].
Exhibit 2.6. How are you, as the plan sponsor, encouraging savings and raising awareness of assets needed in retirement? (Check all that apply)
2012 2013-2014 2015
General and multiple communications/education
78% 73% 83%
Targeted communications 68% 56% 68%
Group meetings to communicate/educate
63% 60% 66%
Web to communicate/educate 54% 52% 63%
Auto-enrollment/increase 48% 46% 62%
Printed material to communicate/educate
54% 52% 56%
Financial counseling/advice 45% 39% 44%
Providing retirement income projection on statements and/or Web
N/A N/A 44%
Individual meetings to communicate/educate
35% 32% 40%
Personalized communications 32% 23% 33%
Digital learning N/A N/A 17%
None of the above 1% 2% 1%
Other 1% 2% 1%
n=340
Annual Defined Contribution Benchmarking Survey: Ease of Use Drives Engagement in Saving for Retirement 14
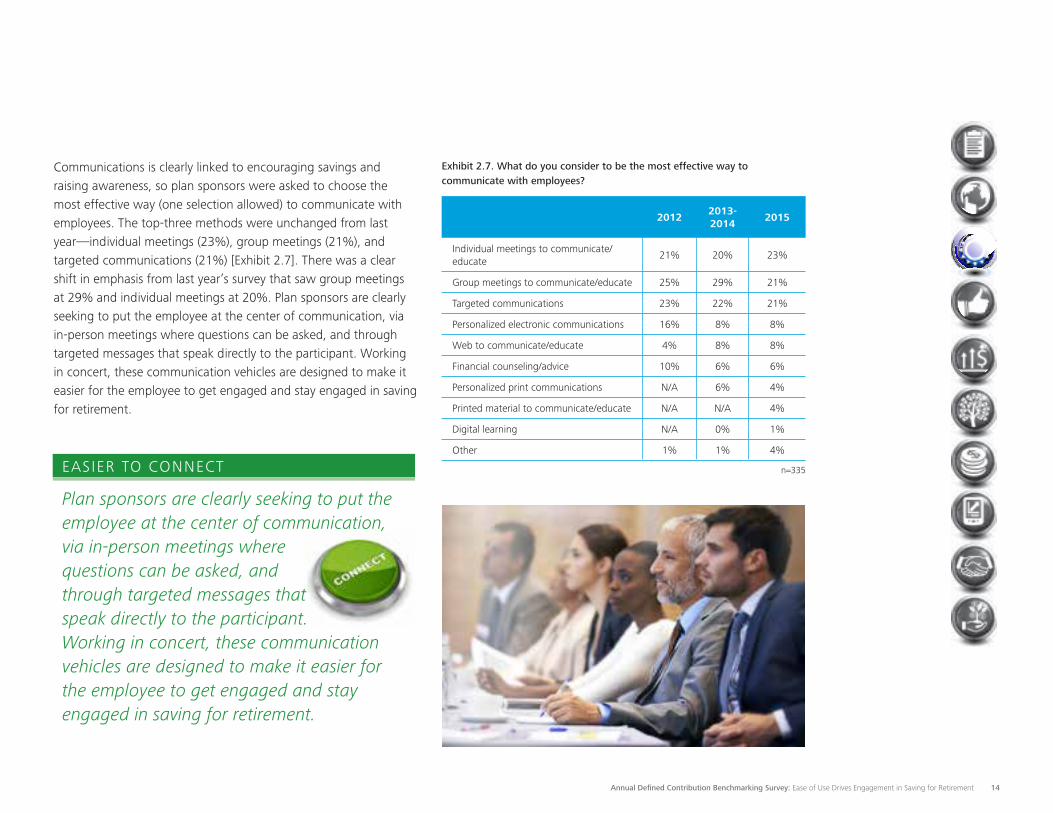
Communications is clearly linked to encouraging savings and raising awareness, so plan sponsors were asked to choose the most effective way (one selection allowed) to communicate with employees. The top-three methods were unchanged from last year—individual meetings (23%), group meetings (21%), and targeted communications (21%) [Exhibit 2.7]. There was a clear shift in emphasis from last year’s survey that saw group meetings at 29% and individual meetings at 20%. Plan sponsors are clearly seeking to put the employee at the center of communication, via in-person meetings where questions can be asked, and through targeted messages that speak directly to the participant. Working in concert, these communication vehicles are designed to make it easier for the employee to get engaged and stay engaged in saving for retirement.
Exhibit 2.7. What do you consider to be the most effective way to communicate with employees?
20122013-2014
2015
Individual meetings to communicate/educate
21% 20% 23%
Group meetings to communicate/educate 25% 29% 21%
Targeted communications 23% 22% 21%
Personalized electronic communications 16% 8% 8%
Web to communicate/educate 4% 8% 8%
Financial counseling/advice 10% 6% 6%
Personalized print communications N/A 6% 4%
Printed material to communicate/educate N/A N/A 4%
Digital learning N/A 0% 1%
Other 1% 1% 4%
n=335
Plan sponsors are clearly seeking to put the employee at the center of communication, via in-person meetings where questions can be asked, and through targeted messages that speak directly to the participant. Working in concert, these communication vehicles are designed to make it easier for the employee to get engaged and stay engaged in saving for retirement.
EASIER TO CONNECT
Annual Defined Contribution Benchmarking Survey: Ease of Use Drives Engagement in Saving for Retirement 15
Eligibility and enrollment
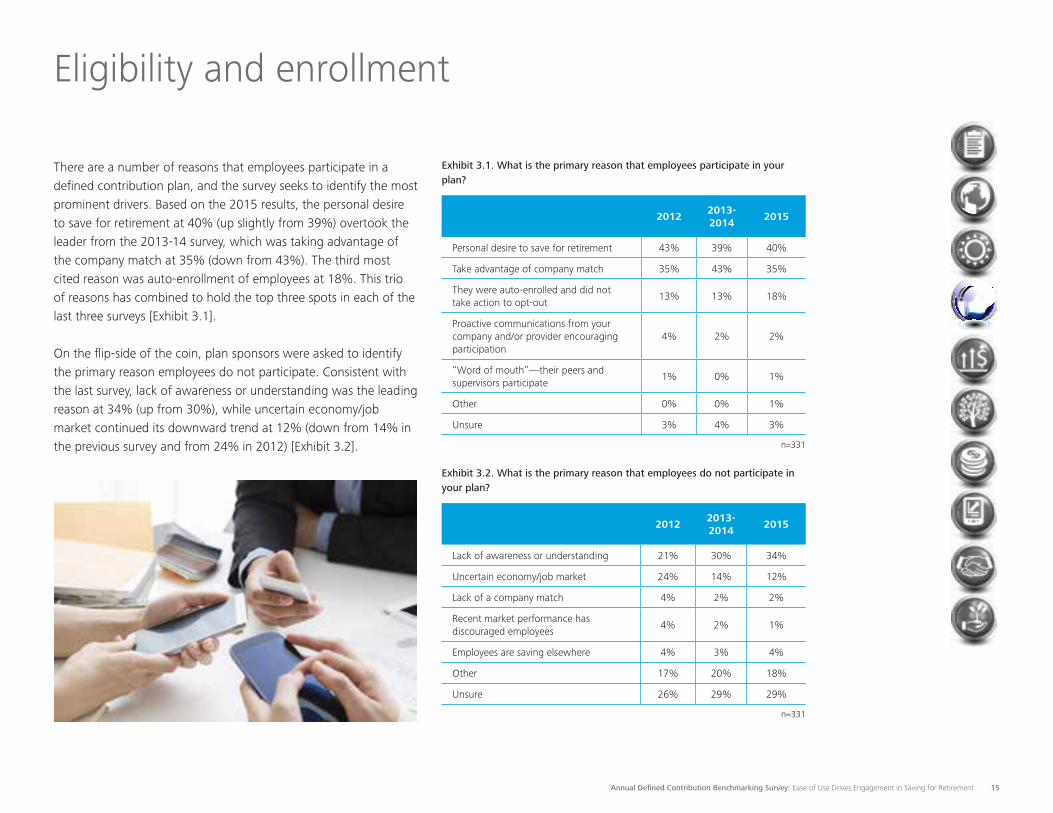
There are a number of reasons that employees participate in a defined contribution plan, and the survey seeks to identify the most prominent drivers. Based on the 2015 results, the personal desire to save for retirement at 40% (up slightly from 39%) overtook the leader from the 2013-14 survey, which was taking advantage of the company match at 35% (down from 43%). The third most cited reason was auto-enrollment of employees at 18%. This trio of reasons has combined to hold the top three spots in each of the last three surveys [Exhibit 3.1].
On the flip-side of the coin, plan sponsors were asked to identify the primary reason employees do not participate. Consistent with the last survey, lack of awareness or understanding was the leading reason at 34% (up from 30%), while uncertain economy/job market continued its downward trend at 12% (down from 14% in the previous survey and from 24% in 2012) [Exhibit 3.2].
Exhibit 3.1. What is the primary reason that employees participate in your plan?
20122013-2014
2015
Personal desire to save for retirement 43% 39% 40%
Take advantage of company match 35% 43% 35%
They were auto-enrolled and did not take action to opt-out
13% 13% 18%
Proactive communications from your company and/or provider encouraging participation
4% 2% 2%
“Word of mouth”—their peers and supervisors participate
1% 0% 1%
Other 0% 0% 1%
Unsure 3% 4% 3%
n=331
Exhibit 3.2. What is the primary reason that employees do not participate in your plan?
20122013-2014
2015
Lack of awareness or understanding 21% 30% 34%
Uncertain economy/job market 24% 14% 12%
Lack of a company match 4% 2% 2%
Recent market performance has discouraged employees
4% 2% 1%
Employees are saving elsewhere 4% 3% 4%
Other 17% 20% 18%
Unsure 26% 29% 29%
n=331
Annual Defined Contribution Benchmarking Survey: Ease of Use Drives Engagement in Saving for Retirement 16
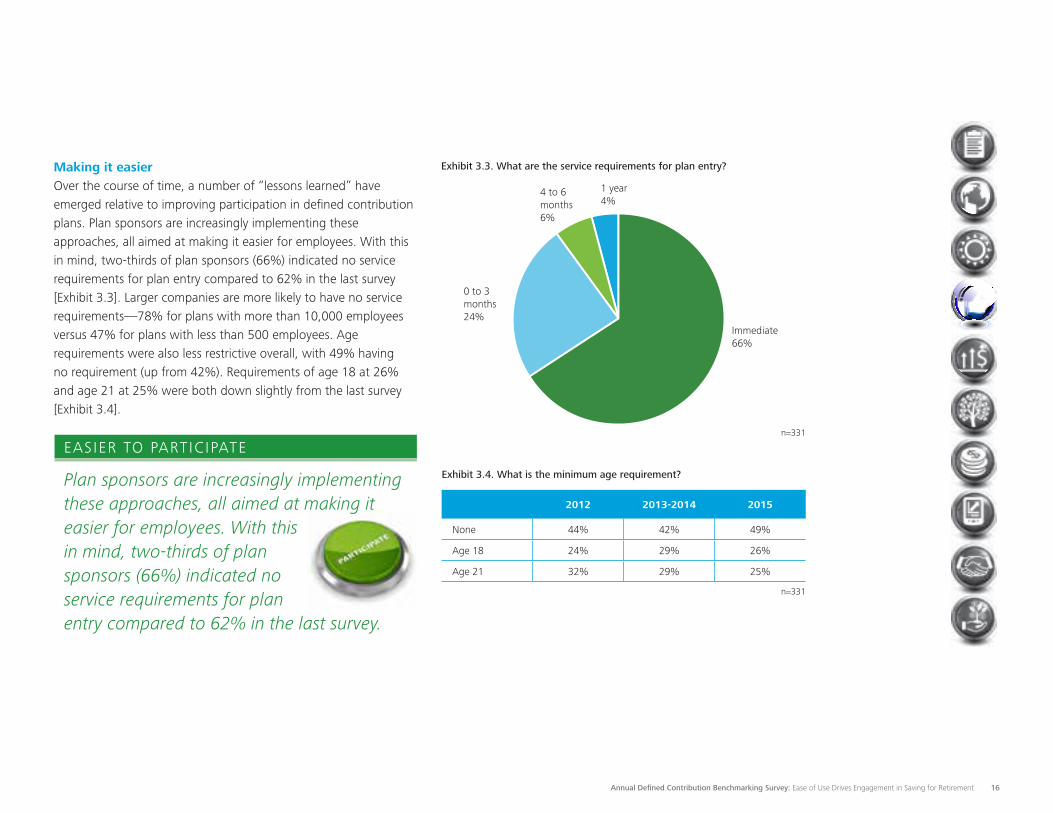
Making it easier Over the course of time, a number of “lessons learned” have emerged relative to improving participation in defined contribution plans. Plan sponsors are increasingly implementing these approaches, all aimed at making it easier for employees. With this in mind, two-thirds of plan sponsors (66%) indicated no service requirements for plan entry compared to 62% in the last survey [Exhibit 3.3]. Larger companies are more likely to have no service requirements—78% for plans with more than 10,000 employees versus 47% for plans with less than 500 employees. Age requirements were also less restrictive overall, with 49% having no requirement (up from 42%). Requirements of age 18 at 26% and age 21 at 25% were both down slightly from the last survey [Exhibit 3.4].
Exhibit 3.3. What are the service requirements for plan entry?
Immediate66%
0 to 3 months24%
4 to 6 months6%
1 year4%
Exhibit 3.4. What is the minimum age requirement?
2012 2013-2014 2015
None 44% 42% 49%
Age 18 24% 29% 26%
Age 21 32% 29% 25%
n=331
n=331
Plan sponsors are increasingly implementing these approaches, all aimed at making it easier for employees. With this in mind, two-thirds of plan sponsors (66%) indicated no service requirements for plan entry compared to 62% in the last survey.
EASIER TO PARTICIPATE
Annual Defined Contribution Benchmarking Survey: Ease of Use Drives Engagement in Saving for Retirement 17
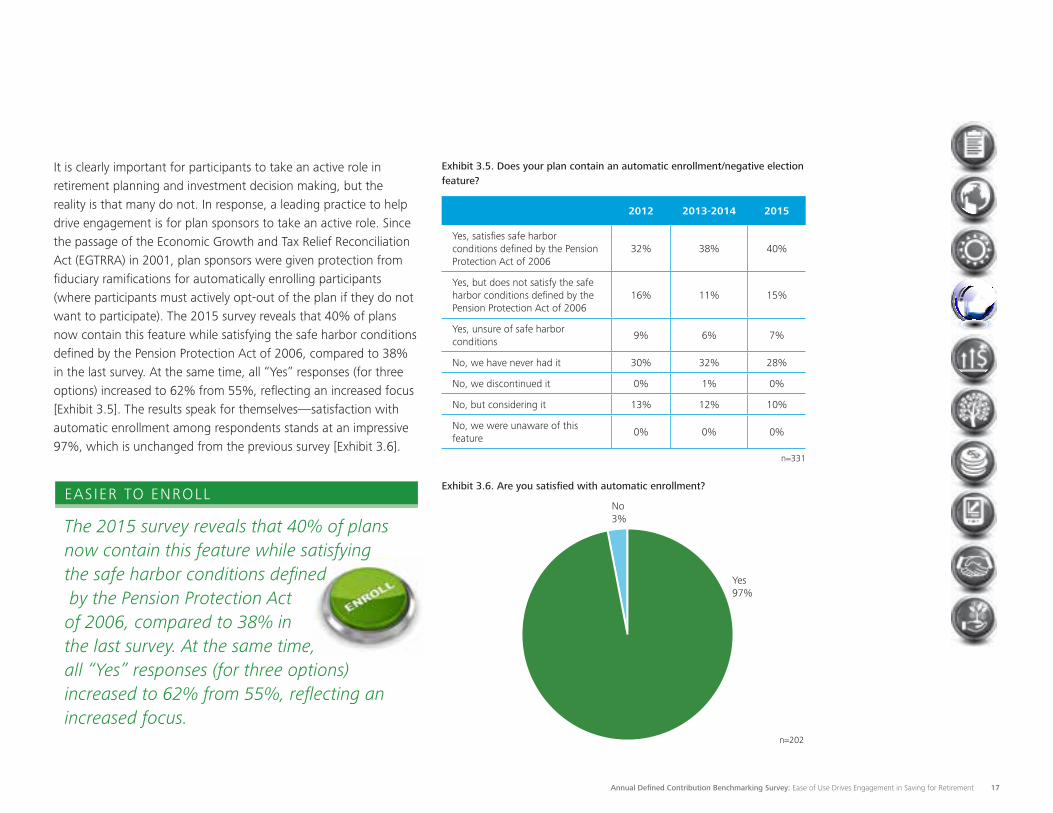
It is clearly important for participants to take an active role in retirement planning and investment decision making, but the reality is that many do not. In response, a leading practice to help drive engagement is for plan sponsors to take an active role. Since the passage of the Economic Growth and Tax Relief Reconciliation Act (EGTRRA) in 2001, plan sponsors were given protection from fiduciary ramifications for automatically enrolling participants (where participants must actively opt-out of the plan if they do not want to participate). The 2015 survey reveals that 40% of plans now contain this feature while satisfying the safe harbor conditions defined by the Pension Protection Act of 2006, compared to 38% in the last survey. At the same time, all “Yes” responses (for three options) increased to 62% from 55%, reflecting an increased focus [Exhibit 3.5]. The results speak for themselves—satisfaction with automatic enrollment among respondents stands at an impressive 97%, which is unchanged from the previous survey [Exhibit 3.6].
Exhibit 3.5. Does your plan contain an automatic enrollment/negative election feature?
2012 2013-2014 2015
Yes, satisfies safe harbor conditions defined by the Pension Protection Act of 2006
32% 38% 40%
Yes, but does not satisfy the safe harbor conditions defined by the Pension Protection Act of 2006
16% 11% 15%
Yes, unsure of safe harbor conditions
9% 6% 7%
No, we have never had it 30% 32% 28%
No, we discontinued it 0% 1% 0%
No, but considering it 13% 12% 10%
No, we were unaware of this feature
0% 0% 0%
n=331
Yes97%
No3%
Exhibit 3.6. Are you satisfied with automatic enrollment?
n=202
The 2015 survey reveals that 40% of plans now contain this feature while satisfying the safe harbor conditions defined by the Pension Protection Act of 2006, compared to 38% in the last survey. At the same time, all “Yes” responses (for three options) increased to 62% from 55%, reflecting an increased focus.
EASIER TO ENROLL
Annual Defined Contribution Benchmarking Survey: Ease of Use Drives Engagement in Saving for Retirement 18
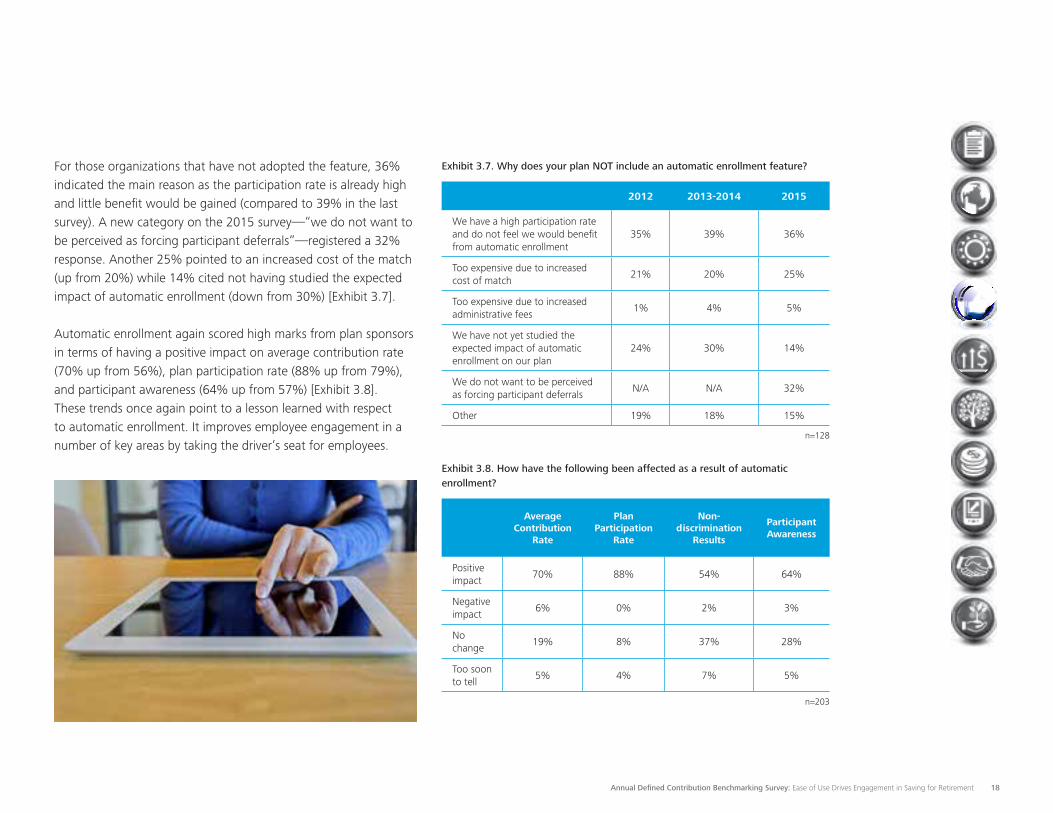
For those organizations that have not adopted the feature, 36% indicated the main reason as the participation rate is already high and little benefit would be gained (compared to 39% in the last survey). A new category on the 2015 survey—“we do not want to be perceived as forcing participant deferrals”—registered a 32% response. Another 25% pointed to an increased cost of the match (up from 20%) while 14% cited not having studied the expected impact of automatic enrollment (down from 30%) [Exhibit 3.7].
Automatic enrollment again scored high marks from plan sponsors in terms of having a positive impact on average contribution rate (70% up from 56%), plan participation rate (88% up from 79%), and participant awareness (64% up from 57%) [Exhibit 3.8]. These trends once again point to a lesson learned with respect to automatic enrollment. It improves employee engagement in a number of key areas by taking the driver’s seat for employees.
Exhibit 3.7. Why does your plan NOT include an automatic enrollment feature?
2012 2013-2014 2015
We have a high participation rate and do not feel we would benefit from automatic enrollment
35% 39% 36%
Too expensive due to increased cost of match
21% 20% 25%
Too expensive due to increased administrative fees
1% 4% 5%
We have not yet studied the expected impact of automatic enrollment on our plan
24% 30% 14%
We do not want to be perceived as forcing participant deferrals
N/A N/A 32%
Other 19% 18% 15%
n=128
Exhibit 3.8. How have the following been affected as a result of automatic enrollment?
Average
Contribution Rate
Plan Participation
Rate
Non-discrimination
Results
Participant Awareness
Positive impact
70% 88% 54% 64%
Negative impact
6% 0% 2% 3%
No change
19% 8% 37% 28%
Too soon to tell
5% 4% 7% 5%
n=203
Annual Defined Contribution Benchmarking Survey: Ease of Use Drives Engagement in Saving for Retirement 19
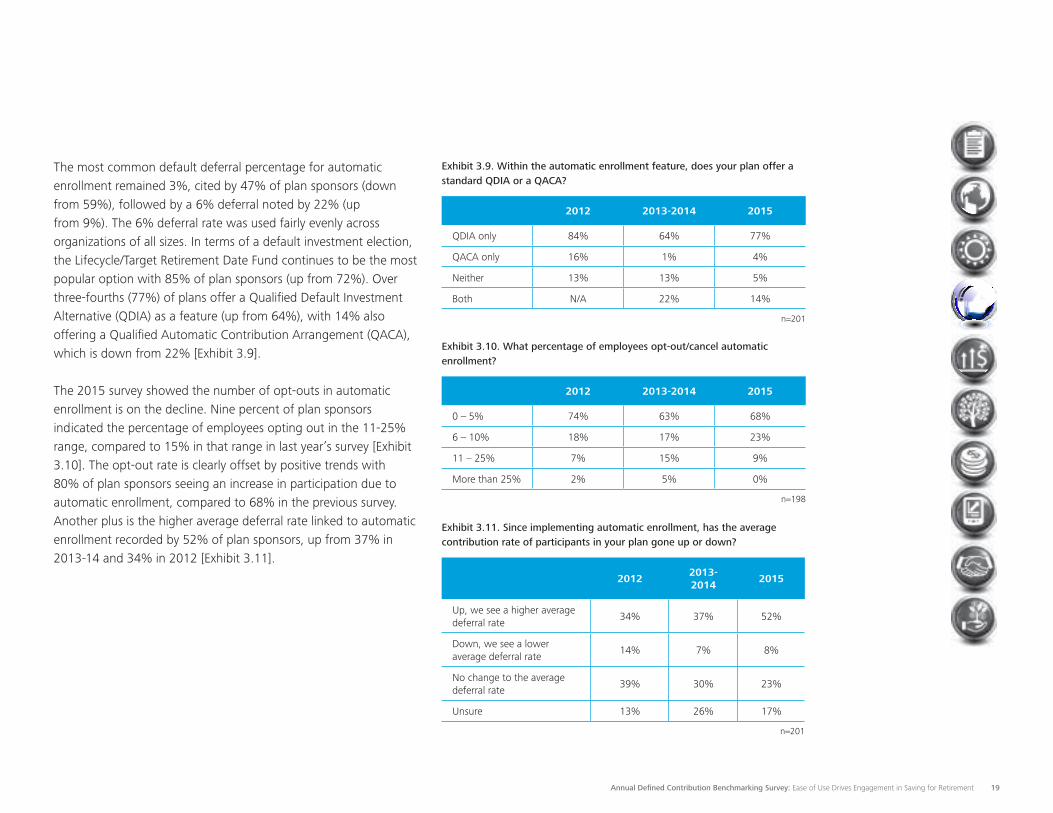
The most common default deferral percentage for automatic enrollment remained 3%, cited by 47% of plan sponsors (down from 59%), followed by a 6% deferral noted by 22% (up from 9%). The 6% deferral rate was used fairly evenly across organizations of all sizes. In terms of a default investment election, the Lifecycle/Target Retirement Date Fund continues to be the most popular option with 85% of plan sponsors (up from 72%). Over three-fourths (77%) of plans offer a Qualified Default Investment Alternative (QDIA) as a feature (up from 64%), with 14% also offering a Qualified Automatic Contribution Arrangement (QACA), which is down from 22% [Exhibit 3.9].
The 2015 survey showed the number of opt-outs in automatic enrollment is on the decline. Nine percent of plan sponsors indicated the percentage of employees opting out in the 11-25% range, compared to 15% in that range in last year’s survey [Exhibit 3.10]. The opt-out rate is clearly offset by positive trends with 80% of plan sponsors seeing an increase in participation due to automatic enrollment, compared to 68% in the previous survey. Another plus is the higher average deferral rate linked to automatic enrollment recorded by 52% of plan sponsors, up from 37% in 2013-14 and 34% in 2012 [Exhibit 3.11].
Exhibit 3.9. Within the automatic enrollment feature, does your plan offer a standard QDIA or a QACA?
2012 2013-2014 2015
QDIA only 84% 64% 77%
QACA only 16% 1% 4%
Neither 13% 13% 5%
Both N/A 22% 14%
n=201
Exhibit 3.10. What percentage of employees opt-out/cancel automatic enrollment?
2012 2013-2014 2015
0 – 5% 74% 63% 68%
6 – 10% 18% 17% 23%
11 – 25% 7% 15% 9%
More than 25% 2% 5% 0%
n=198
Exhibit 3.11. Since implementing automatic enrollment, has the average contribution rate of participants in your plan gone up or down?
20122013-2014
2015
Up, we see a higher average deferral rate
34% 37% 52%
Down, we see a lower average deferral rate
14% 7% 8%
No change to the average deferral rate
39% 30% 23%
Unsure 13% 26% 17%
n=201
Annual Defined Contribution Benchmarking Survey: Ease of Use Drives Engagement in Saving for Retirement 20
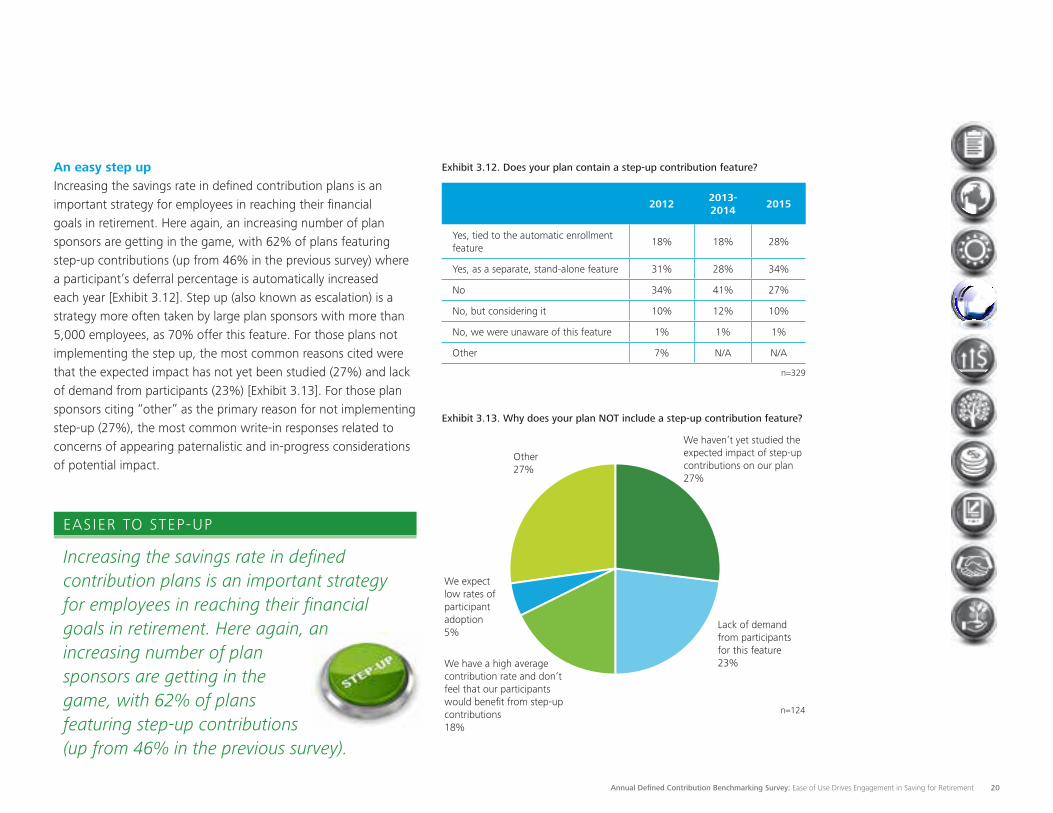
An easy step upIncreasing the savings rate in defined contribution plans is an important strategy for employees in reaching their financial goals in retirement. Here again, an increasing number of plan sponsors are getting in the game, with 62% of plans featuring step-up contributions (up from 46% in the previous survey) where a participant’s deferral percentage is automatically increased each year [Exhibit 3.12]. Step up (also known as escalation) is a strategy more often taken by large plan sponsors with more than 5,000 employees, as 70% offer this feature. For those plans not implementing the step up, the most common reasons cited were that the expected impact has not yet been studied (27%) and lack of demand from participants (23%) [Exhibit 3.13]. For those plan sponsors citing “other” as the primary reason for not implementing step-up (27%), the most common write-in responses related to concerns of appearing paternalistic and in-progress considerations of potential impact.
Exhibit 3.13. Why does your plan NOT include a step-up contribution feature?
We have a high average contribution rate and don’t feel that our participants would benefit from step-up contributions18%
Lack of demand from participants for this feature23%
We expect low rates of participant adoption5%
We haven’t yet studied the expected impact of step-up contributions on our plan27%
Other27%
Increasing the savings rate in defined contribution plans is an important strategy for employees in reaching their financial goals in retirement. Here again, an increasing number of plan sponsors are getting in the game, with 62% of plans featuring step-up contributions (up from 46% in the previous survey).
EASIER TO STEP-UP
Exhibit 3.12. Does your plan contain a step-up contribution feature?
20122013-2014
2015
Yes, tied to the automatic enrollment feature
18% 18% 28%
Yes, as a separate, stand-alone feature 31% 28% 34%
No 34% 41% 27%
No, but considering it 10% 12% 10%
No, we were unaware of this feature 1% 1% 1%
Other 7% N/A N/A
n=329
n=124
Annual Defined Contribution Benchmarking Survey: Ease of Use Drives Engagement in Saving for Retirement 21
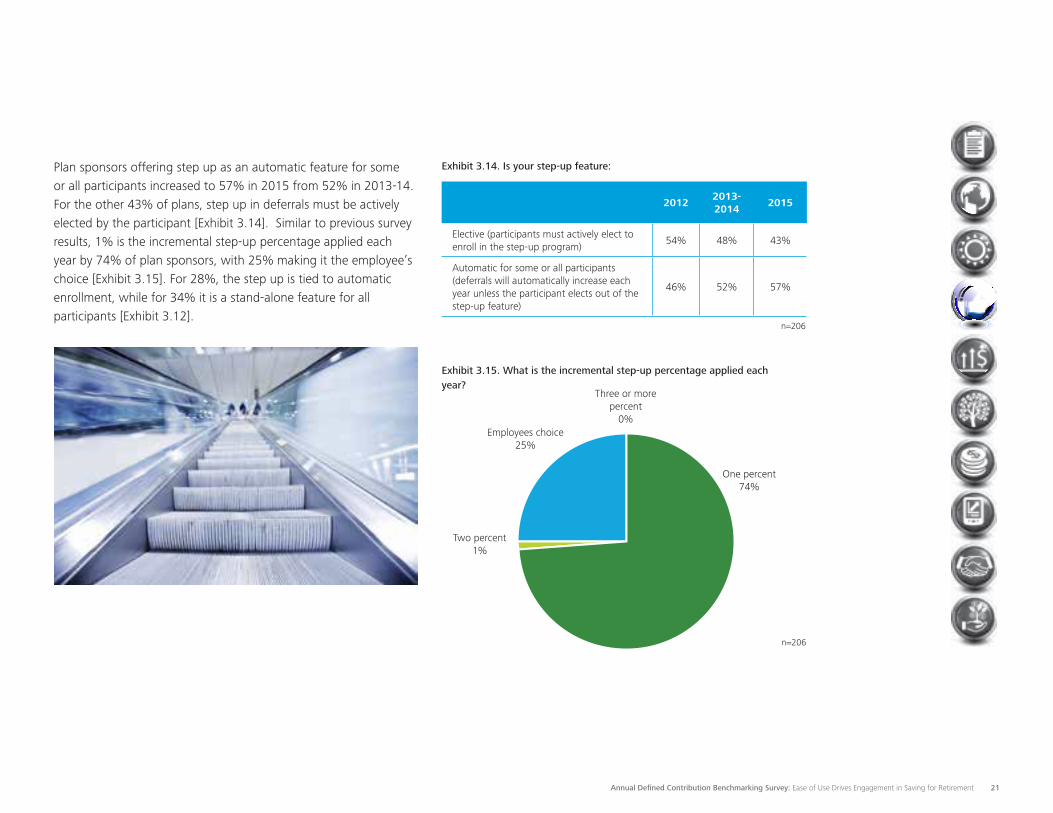
Plan sponsors offering step up as an automatic feature for some or all participants increased to 57% in 2015 from 52% in 2013-14. For the other 43% of plans, step up in deferrals must be actively elected by the participant [Exhibit 3.14]. Similar to previous survey results, 1% is the incremental step-up percentage applied each year by 74% of plan sponsors, with 25% making it the employee’s choice [Exhibit 3.15]. For 28%, the step up is tied to automatic enrollment, while for 34% it is a stand-alone feature for all participants [Exhibit 3.12].
Exhibit 3.14. Is your step-up feature:
20122013-2014
2015
Elective (participants must actively elect to enroll in the step-up program)
54% 48% 43%
Automatic for some or all participants (deferrals will automatically increase each year unless the participant elects out of the step-up feature)
46% 52% 57%
n=206
One percent 74%
Two percent 1%
Employees choice25%
Exhibit 3.15. What is the incremental step-up percentage applied each year?
Three or more percent
0%
n=206
Annual Defined Contribution Benchmarking Survey: Ease of Use Drives Engagement in Saving for Retirement 22
Utilization of the step-up feature remained fairly stable year over year, with 7% of plan sponsors indicating more than 50% of participants making step-up contributions (up from 6%), 27% citing 11%-25% participation (unchanged), and 52% less than 10% participation (up from 50%) [Exhibit 3.16]. Overall, plan sponsor satisfaction with the step-up feature remains extremely high at 86%, with 12% not satisfied due to low utilization by participants [Exhibit 3.17].
Exhibit 3.16. What percentage of your participants is currently in the step-up contribution program?
20122013-2014
2015
0 – 10% 62% 50% 52%
11 – 25% 20% 27% 27%
25 – 50% 14% 17% 14%
More than 50% 4% 6% 7%
n=194
Exhibit 3.17. Are you satisfied with the step-up contribution feature?
20122013-2014
2015
Yes 92% 80% 86%
No, due to low utilization by participants 8% 20% 12%
No, due to the design of the feature N/A 0% 2%
n=203
Annual Defined Contribution Benchmarking Survey: Ease of Use Drives Engagement in Saving for Retirement 23
Contributions
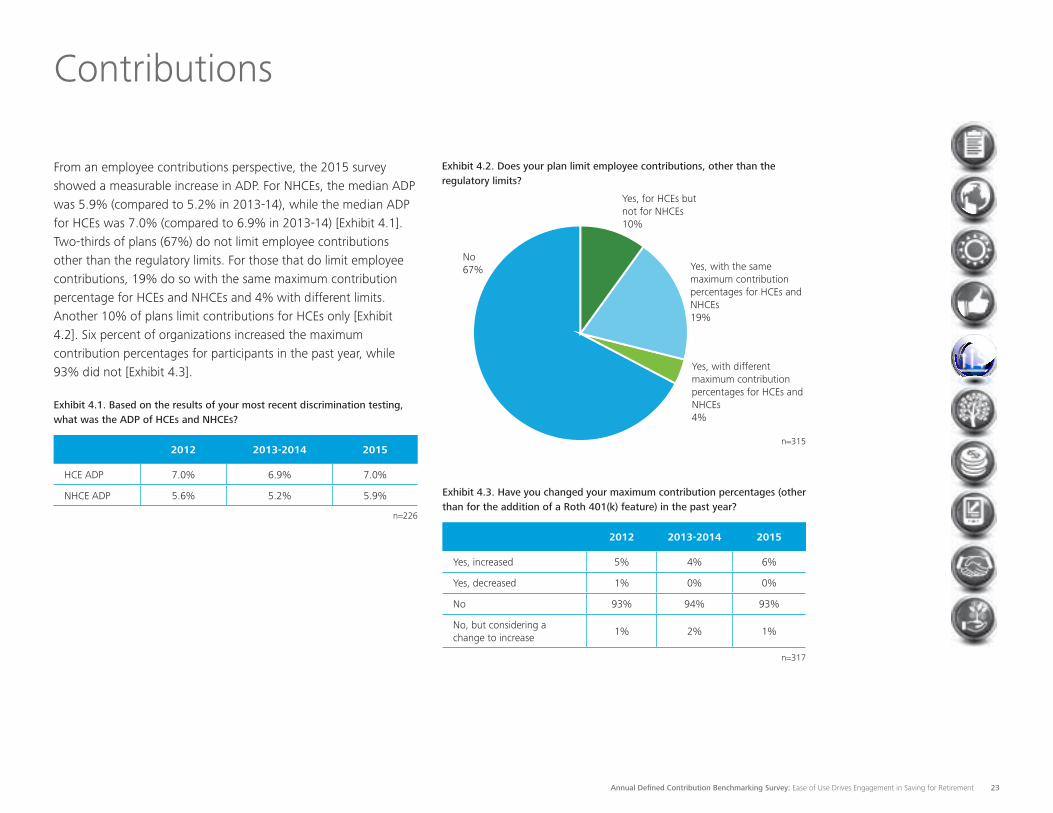
From an employee contributions perspective, the 2015 survey showed a measurable increase in ADP. For NHCEs, the median ADP was 5.9% (compared to 5.2% in 2013-14), while the median ADP for HCEs was 7.0% (compared to 6.9% in 2013-14) [Exhibit 4.1]. Two-thirds of plans (67%) do not limit employee contributions other than the regulatory limits. For those that do limit employee contributions, 19% do so with the same maximum contribution percentage for HCEs and NHCEs and 4% with different limits. Another 10% of plans limit contributions for HCEs only [Exhibit 4.2]. Six percent of organizations increased the maximum contribution percentages for participants in the past year, while 93% did not [Exhibit 4.3].
Exhibit 4.1. Based on the results of your most recent discrimination testing, what was the ADP of HCEs and NHCEs?
2012 2013-2014 2015
HCE ADP 7.0% 6.9% 7.0%
NHCE ADP 5.6% 5.2% 5.9%
n=226
Exhibit 4.2. Does your plan limit employee contributions, other than the regulatory limits?
Yes, for HCEs but not for NHCEs10%
Yes, with the same maximum contribution percentages for HCEs and NHCEs 19%
Yes, with different maximum contribution percentages for HCEs and NHCEs 4%
No67%
n=315
Exhibit 4.3. Have you changed your maximum contribution percentages (other than for the addition of a Roth 401(k) feature) in the past year?
2012 2013-2014 2015
Yes, increased 5% 4% 6%
Yes, decreased 1% 0% 0%
No 93% 94% 93%
No, but considering a change to increase
1% 2% 1%
n=317
Annual Defined Contribution Benchmarking Survey: Ease of Use Drives Engagement in Saving for Retirement 24
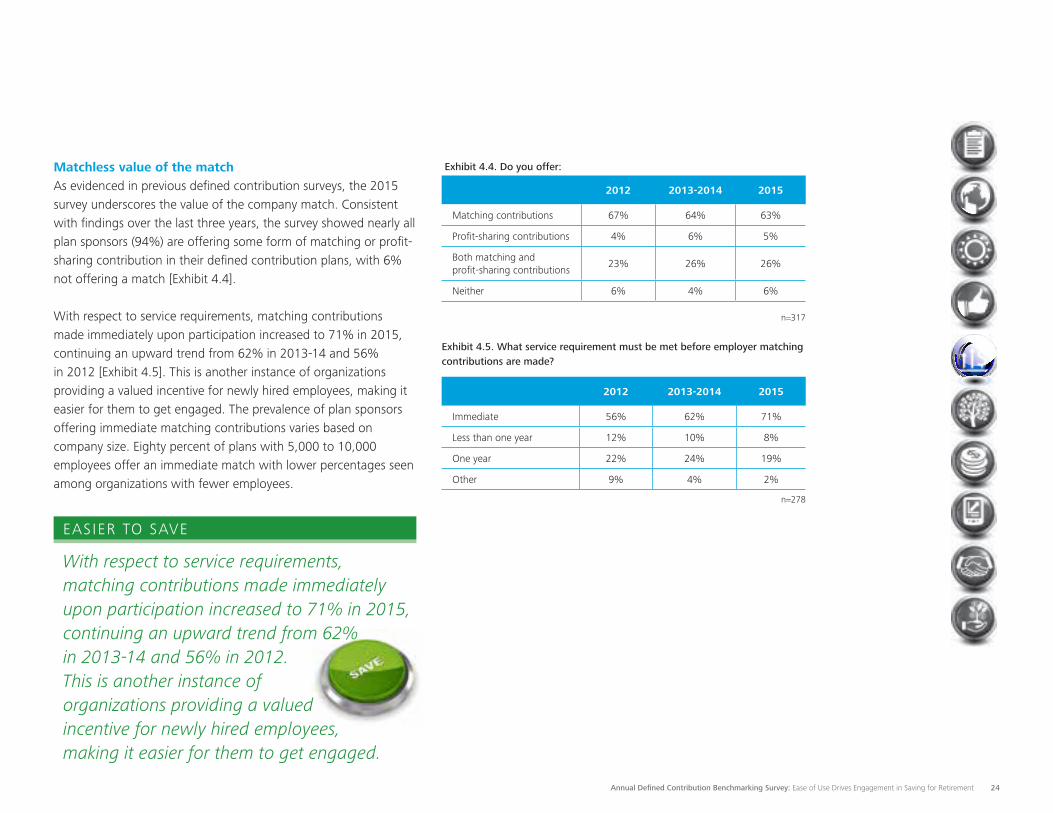
Matchless value of the match As evidenced in previous defined contribution surveys, the 2015 survey underscores the value of the company match. Consistent with findings over the last three years, the survey showed nearly all plan sponsors (94%) are offering some form of matching or profit-sharing contribution in their defined contribution plans, with 6% not offering a match [Exhibit 4.4].
With respect to service requirements, matching contributions made immediately upon participation increased to 71% in 2015, continuing an upward trend from 62% in 2013-14 and 56% in 2012 [Exhibit 4.5]. This is another instance of organizations providing a valued incentive for newly hired employees, making it easier for them to get engaged. The prevalence of plan sponsors offering immediate matching contributions varies based on company size. Eighty percent of plans with 5,000 to 10,000 employees offer an immediate match with lower percentages seen among organizations with fewer employees.
With respect to service requirements, matching contributions made immediately upon participation increased to 71% in 2015, continuing an upward trend from 62% in 2013-14 and 56% in 2012. This is another instance of organizations providing a valued incentive for newly hired employees, making it easier for them to get engaged.
EASIER TO SAVE
Exhibit 4.4. Do you offer:
2012 2013-2014 2015
Matching contributions 67% 64% 63%
Profit-sharing contributions 4% 6% 5%
Both matching and profit-sharing contributions
23% 26% 26%
Neither 6% 4% 6%
n=317
Exhibit 4.5. What service requirement must be met before employer matching contributions are made?
2012 2013-2014 2015
Immediate 56% 62% 71%
Less than one year 12% 10% 8%
One year 22% 24% 19%
Other 9% 4% 2%
n=278
Annual Defined Contribution Benchmarking Survey: Ease of Use Drives Engagement in Saving for Retirement 25
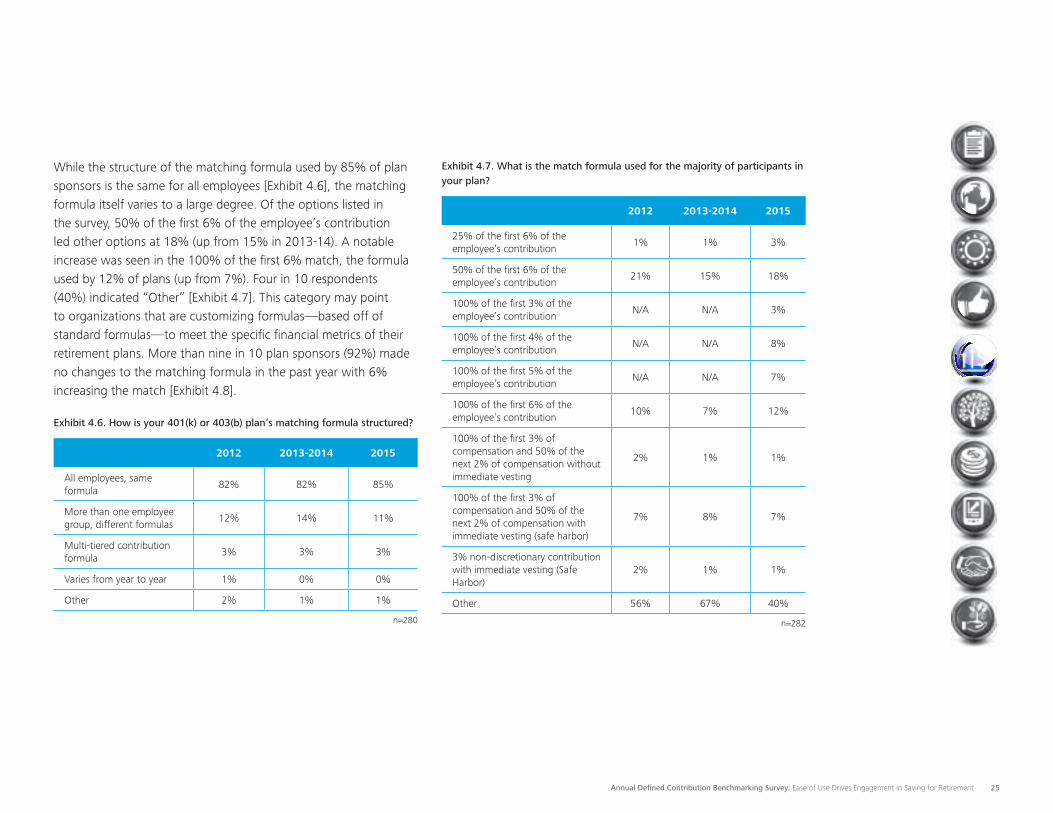
While the structure of the matching formula used by 85% of plan sponsors is the same for all employees [Exhibit 4.6], the matching formula itself varies to a large degree. Of the options listed in the survey, 50% of the first 6% of the employee’s contribution led other options at 18% (up from 15% in 2013-14). A notable increase was seen in the 100% of the first 6% match, the formula used by 12% of plans (up from 7%). Four in 10 respondents (40%) indicated “Other” [Exhibit 4.7]. This category may point to organizations that are customizing formulas—based off of standard formulas—to meet the specific financial metrics of their retirement plans. More than nine in 10 plan sponsors (92%) made no changes to the matching formula in the past year with 6% increasing the match [Exhibit 4.8].
Exhibit 4.6. How is your 401(k) or 403(b) plan’s matching formula structured?
2012 2013-2014 2015
All employees, same formula
82% 82% 85%
More than one employee group, different formulas
12% 14% 11%
Multi-tiered contribution formula
3% 3% 3%
Varies from year to year 1% 0% 0%
Other 2% 1% 1%
n=280
Exhibit 4.7. What is the match formula used for the majority of participants in your plan?
2012 2013-2014 2015
25% of the first 6% of the employee’s contribution
1% 1% 3%
50% of the first 6% of the employee’s contribution
21% 15% 18%
100% of the first 3% of the employee’s contribution
N/A N/A 3%
100% of the first 4% of the employee’s contribution
N/A N/A 8%
100% of the first 5% of the employee’s contribution
N/A N/A 7%
100% of the first 6% of the employee’s contribution
10% 7% 12%
100% of the first 3% of compensation and 50% of the next 2% of compensation without immediate vesting
2% 1% 1%
100% of the first 3% of compensation and 50% of the next 2% of compensation with immediate vesting (safe harbor)
7% 8% 7%
3% non-discretionary contribution with immediate vesting (Safe Harbor)
2% 1% 1%
Other 56% 67% 40%
n=282
Annual Defined Contribution Benchmarking Survey: Ease of Use Drives Engagement in Saving for Retirement 26
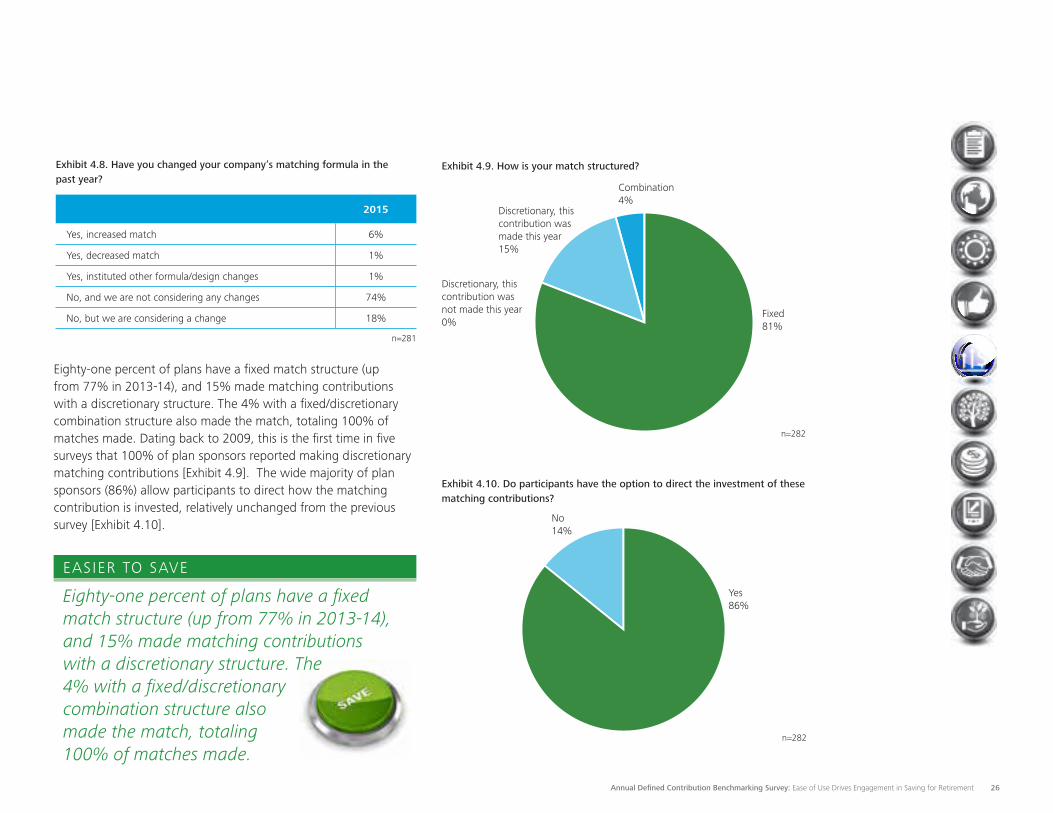
Eighty-one percent of plans have a fixed match structure (up from 77% in 2013-14), and 15% made matching contributions with a discretionary structure. The 4% with a fixed/discretionary combination structure also made the match, totaling 100% of matches made. Dating back to 2009, this is the first time in five surveys that 100% of plan sponsors reported making discretionary matching contributions [Exhibit 4.9]. The wide majority of plan sponsors (86%) allow participants to direct how the matching contribution is invested, relatively unchanged from the previous survey [Exhibit 4.10].
Exhibit 4.9. How is your match structured?
Fixed81%
Discretionary, this contribution was made this year15%
Discretionary, this contribution was not made this year0%
Combination4%
n=282
Eighty-one percent of plans have a fixed match structure (up from 77% in 2013-14), and 15% made matching contributions with a discretionary structure. The 4% with a fixed/discretionary combination structure also made the match, totaling 100% of matches made.
EASIER TO SAVE
Yes86%
No14%
Exhibit 4.10. Do participants have the option to direct the investment of these matching contributions?
n=282
Exhibit 4.8. Have you changed your company’s matching formula in the past year?
2015
Yes, increased match 6%
Yes, decreased match 1%
Yes, instituted other formula/design changes 1%
No, and we are not considering any changes 74%
No, but we are considering a change 18%
n=281
Annual Defined Contribution Benchmarking Survey: Ease of Use Drives Engagement in Saving for Retirement 27
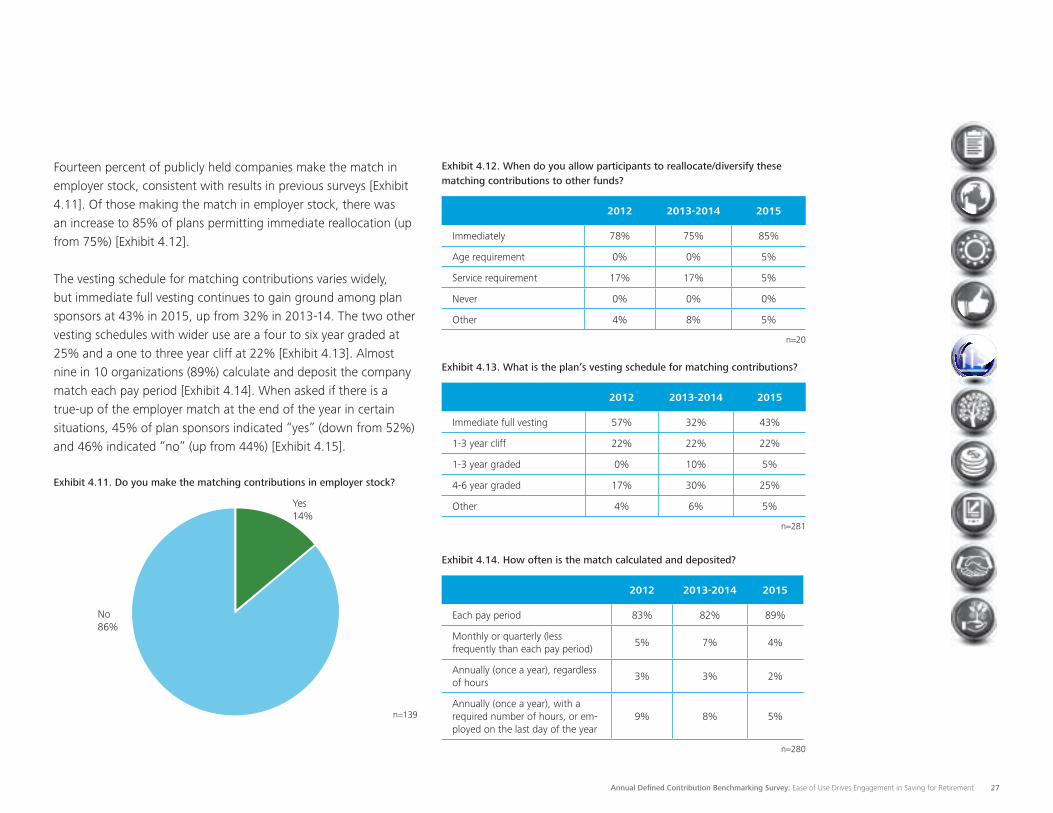
Fourteen percent of publicly held companies make the match in employer stock, consistent with results in previous surveys [Exhibit 4.11]. Of those making the match in employer stock, there was an increase to 85% of plans permitting immediate reallocation (up from 75%) [Exhibit 4.12].
The vesting schedule for matching contributions varies widely, but immediate full vesting continues to gain ground among plan sponsors at 43% in 2015, up from 32% in 2013-14. The two other vesting schedules with wider use are a four to six year graded at 25% and a one to three year cliff at 22% [Exhibit 4.13]. Almost nine in 10 organizations (89%) calculate and deposit the company match each pay period [Exhibit 4.14]. When asked if there is a true-up of the employer match at the end of the year in certain situations, 45% of plan sponsors indicated “yes” (down from 52%) and 46% indicated “no” (up from 44%) [Exhibit 4.15].
Exhibit 4.11. Do you make the matching contributions in employer stock?
Yes14%
No86%
n=139
Exhibit 4.12. When do you allow participants to reallocate/diversify these matching contributions to other funds?
2012 2013-2014 2015
Immediately 78% 75% 85%
Age requirement 0% 0% 5%
Service requirement 17% 17% 5%
Never 0% 0% 0%
Other 4% 8% 5%
n=20
Exhibit 4.13. What is the plan’s vesting schedule for matching contributions?
2012 2013-2014 2015
Immediate full vesting 57% 32% 43%
1-3 year cliff 22% 22% 22%
1-3 year graded 0% 10% 5%
4-6 year graded 17% 30% 25%
Other 4% 6% 5%
n=281
Exhibit 4.14. How often is the match calculated and deposited?
2012 2013-2014 2015
Each pay period 83% 82% 89%
Monthly or quarterly (less frequently than each pay period)
5% 7% 4%
Annually (once a year), regardless of hours
3% 3% 2%
Annually (once a year), with a required number of hours, or em-ployed on the last day of the year
9% 8% 5%
n=280
Annual Defined Contribution Benchmarking Survey: Ease of Use Drives Engagement in Saving for Retirement 28
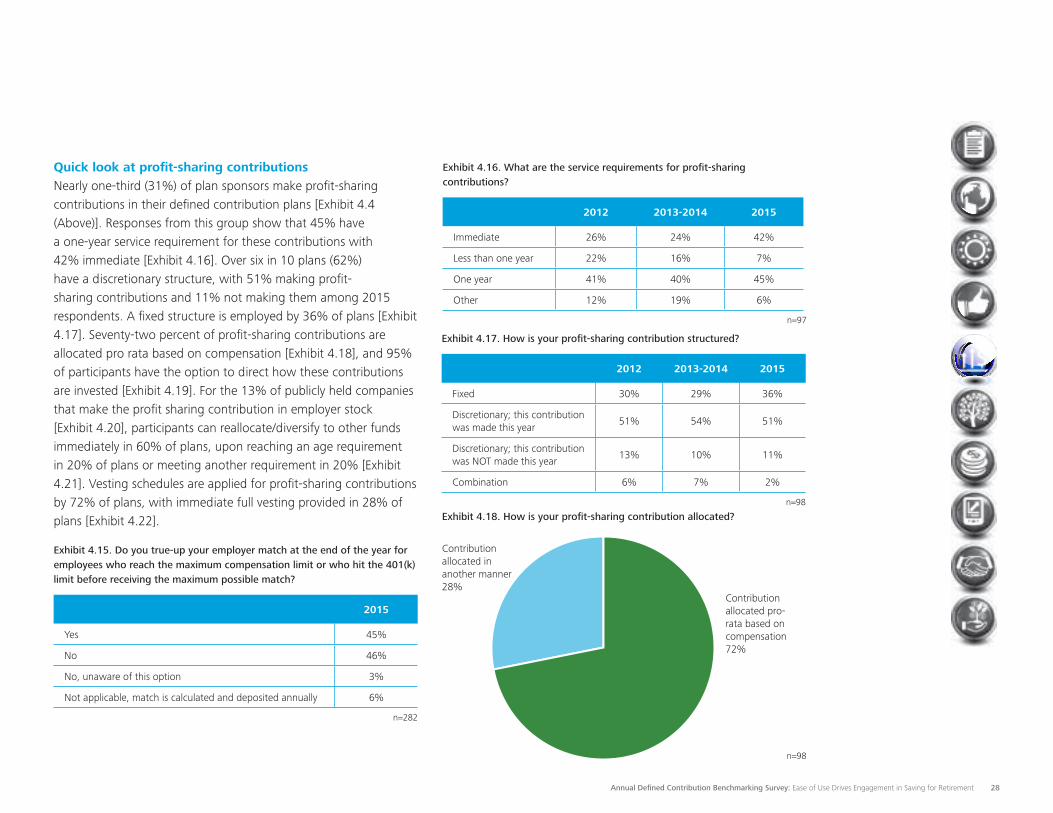
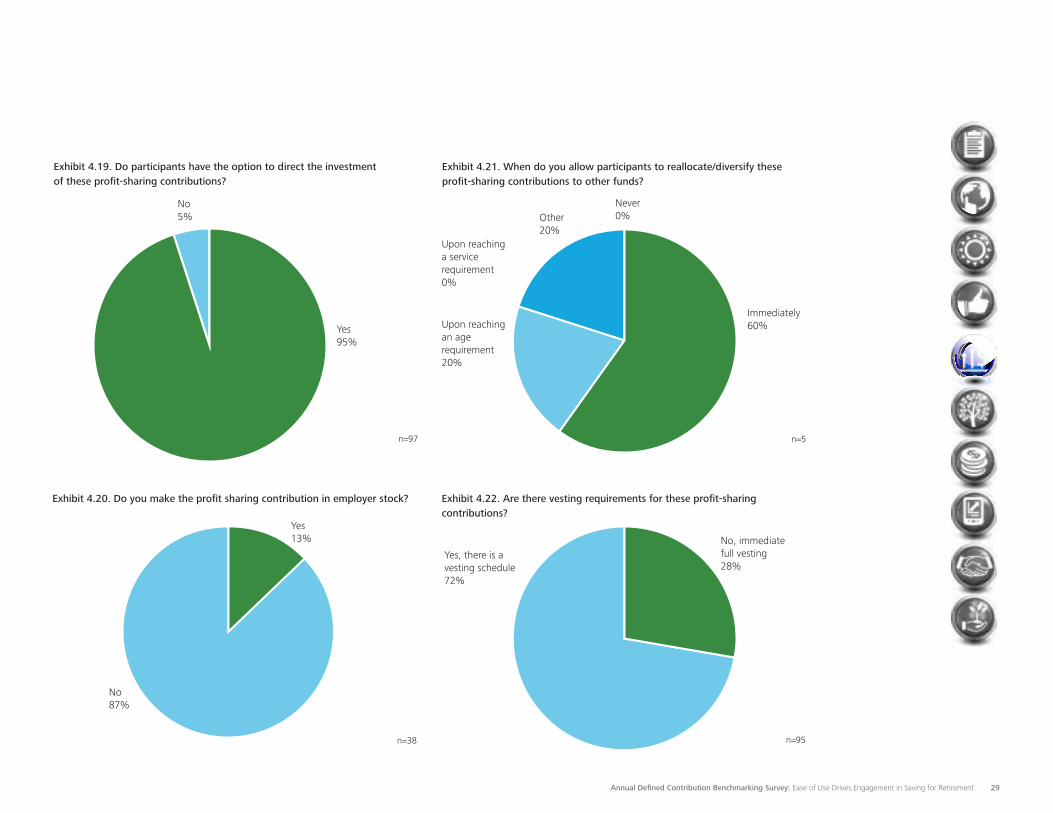
Quick look at profit-sharing contributions Nearly one-third (31%) of plan sponsors make profit-sharing contributions in their defined contribution plans [Exhibit 4.4 (Above)]. Responses from this group show that 45% have a one-year service requirement for these contributions with 42% immediate [Exhibit 4.16]. Over six in 10 plans (62%) have a discretionary structure, with 51% making profit-sharing contributions and 11% not making them among 2015 respondents. A fixed structure is employed by 36% of plans [Exhibit 4.17]. Seventy-two percent of profit-sharing contributions are allocated pro rata based on compensation [Exhibit 4.18], and 95% of participants have the option to direct how these contributions are invested [Exhibit 4.19]. For the 13% of publicly held companies that make the profit sharing contribution in employer stock [Exhibit 4.20], participants can reallocate/diversify to other funds immediately in 60% of plans, upon reaching an age requirement in 20% of plans or meeting another requirement in 20% [Exhibit 4.21]. Vesting schedules are applied for profit-sharing contributions by 72% of plans, with immediate full vesting provided in 28% of plans [Exhibit 4.22].
Exhibit 4.16. What are the service requirements for profit-sharing contributions?
2012 2013-2014 2015
Immediate 26% 24% 42%
Less than one year 22% 16% 7%
One year 41% 40% 45%
Other 12% 19% 6%
n=97
Exhibit 4.17. How is your profit-sharing contribution structured?
2012 2013-2014 2015
Fixed 30% 29% 36%
Discretionary; this contribution was made this year
51% 54% 51%
Discretionary; this contribution was NOT made this year
13% 10% 11%
Combination 6% 7% 2%
n=98
Contribution allocated pro-rata based on compensation72%
Contribution allocated in another manner28%
Exhibit 4.18. How is your profit-sharing contribution allocated?
n=98
Exhibit 4.15. Do you true-up your employer match at the end of the year for employees who reach the maximum compensation limit or who hit the 401(k) limit before receiving the maximum possible match?
2015
Yes 45%
No 46%
No, unaware of this option 3%
Not applicable, match is calculated and deposited annually 6%
n=282
Annual Defined Contribution Benchmarking Survey: Ease of Use Drives Engagement in Saving for Retirement 29
Yes95%
No5%
Exhibit 4.19. Do participants have the option to direct the investment of these profit-sharing contributions?
n=97
Immediately60%Upon reaching
an age requirement20%
Upon reaching a service requirement0%
Other20%
Never0%
Exhibit 4.21. When do you allow participants to reallocate/diversify these profit-sharing contributions to other funds?
n=5
No, immediate full vesting28%
Yes, there is a vesting schedule72%
Exhibit 4.22. Are there vesting requirements for these profit-sharing contributions?
n=95
Yes13%
No87%
Exhibit 4.20. Do you make the profit sharing contribution in employer stock?
n=38
Annual Defined Contribution Benchmarking Survey: Ease of Use Drives Engagement in Saving for Retirement 30
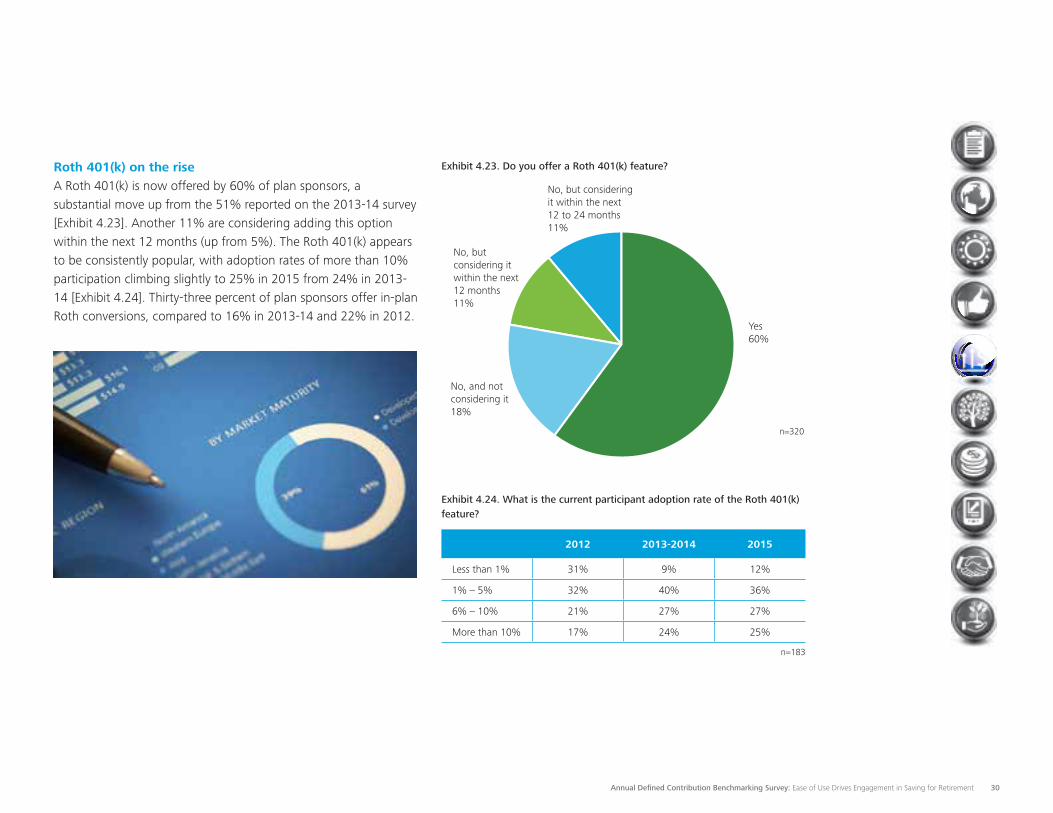
Exhibit 4.24. What is the current participant adoption rate of the Roth 401(k) feature?
2012 2013-2014 2015
Less than 1% 31% 9% 12%
1% – 5% 32% 40% 36%
6% – 10% 21% 27% 27%
More than 10% 17% 24% 25%
n=183
Yes60%
No, and not considering it18%
No, but considering it within the next 12 months11%
No, but considering it within the next 12 to 24 months11%
Exhibit 4.23. Do you offer a Roth 401(k) feature?
n=320
Roth 401(k) on the rise A Roth 401(k) is now offered by 60% of plan sponsors, a substantial move up from the 51% reported on the 2013-14 survey [Exhibit 4.23]. Another 11% are considering adding this option within the next 12 months (up from 5%). The Roth 401(k) appears to be consistently popular, with adoption rates of more than 10% participation climbing slightly to 25% in 2015 from 24% in 2013-14 [Exhibit 4.24]. Thirty-three percent of plan sponsors offer in-plan Roth conversions, compared to 16% in 2013-14 and 22% in 2012.
Annual Defined Contribution Benchmarking Survey: Ease of Use Drives Engagement in Saving for Retirement 31
Investments
As noted in the “Hot topics” section, providing the right investments to help participants achieve retirement goals was selected by 89% of plan sponsors as the number one topic of importance. The “Investments” section of the 2015 survey digs deeper to help reveal how these “right investments” are defined by plan sponsors.
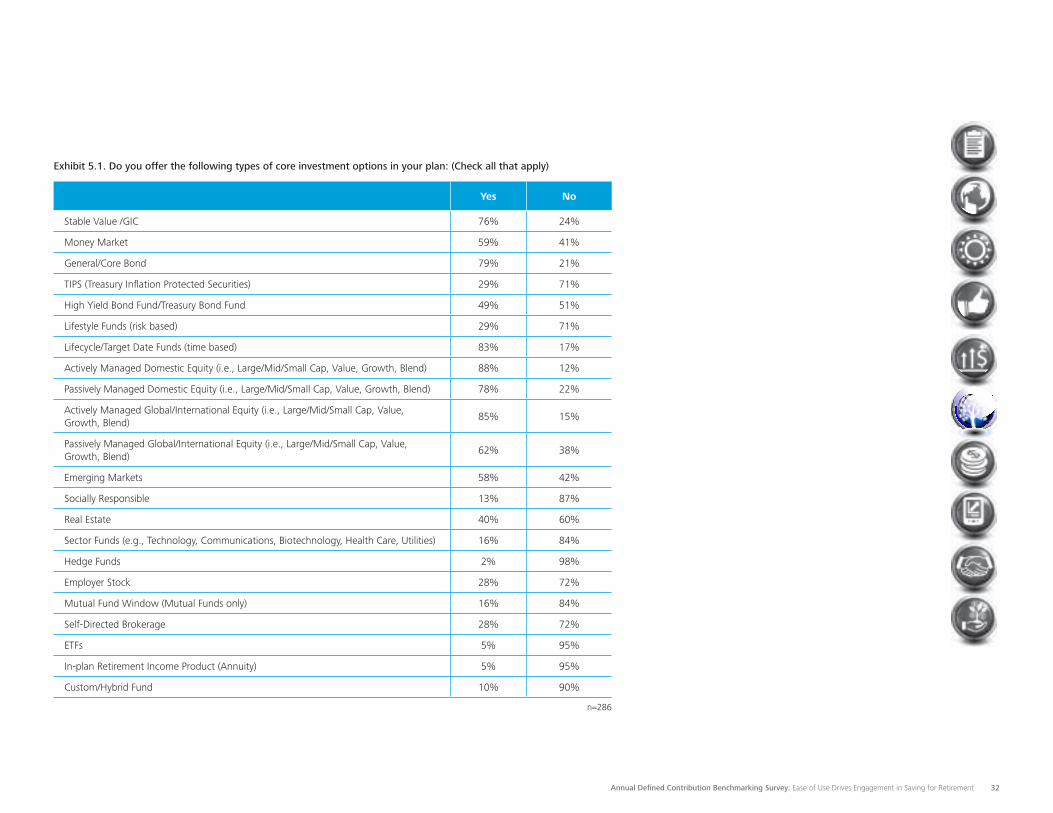
Considering all the optionsIn terms of core investment options, lifecycle funds continue to gain ground in defined contribution plans, with other findings fairly consistent with past surveys. Here are the top 10 offerings from the 2015 survey: •88%: Actively managed domestic equity•85%: Actively managed global/international equity •83%: Lifecycle/target date funds (time based), up from 77%
in 2013-14•79%: General/core bond •78%: Passively managed domestic equity, up from 73% in
2013-14 •76%: Stable value/guaranteed investment contract (GIC)•62%: Passively managed global/international equity•59%: Money market•58%: Emerging markets, up from 47% in 2013-14•49%: High yield bond fund/Treasury bond fund, down from 56%
in 2013-14
Survey findings revealed some upward trends in other options for a defined contribution portfolio with 2015 results compared to 2013-14 results:•40% offering real estate funds compared to 37% •29% offering lifestyle funds (risk based) compared to 26% •28% offering employer stock compared to 23%
Other defined contribution plan options remained relatively flat:•28% offering self-directed brokerage (unchanged from 2013-
14)—this option most prevalent among plans with more than 10,000 employees at 43%
•6% offering sector funds compared to 15%•16% offering mutual fund window compared to 15% •13% offering socially responsible funds compared to 14%—
this option more common among plans with less than 1,000 employees at 21%
There continued to be limited interest in in-plan retirement income products (annuities) with 5% of plans offering this option in 2015, down from 6% in 2013-14. A closer look at annuities appears below. At the same time, 5% of plans offered exchange-traded funds (ETFs), up from 4% in the previous survey [Exhibit 5.1].
Annual Defined Contribution Benchmarking Survey: Ease of Use Drives Engagement in Saving for Retirement 32
Exhibit 5.1. Do you offer the following types of core investment options in your plan: (Check all that apply)
Yes No
Stable Value /GIC 76% 24%
Money Market 59% 41%
General/Core Bond 79% 21%
TIPS (Treasury Inflation Protected Securities) 29% 71%
High Yield Bond Fund/Treasury Bond Fund 49% 51%
Lifestyle Funds (risk based) 29% 71%
Lifecycle/Target Date Funds (time based) 83% 17%
Actively Managed Domestic Equity (i.e., Large/Mid/Small Cap, Value, Growth, Blend) 88% 12%
Passively Managed Domestic Equity (i.e., Large/Mid/Small Cap, Value, Growth, Blend) 78% 22%
Actively Managed Global/International Equity (i.e., Large/Mid/Small Cap, Value, Growth, Blend)
85% 15%
Passively Managed Global/International Equity (i.e., Large/Mid/Small Cap, Value, Growth, Blend)
62% 38%
Emerging Markets 58% 42%
Socially Responsible 13% 87%
Real Estate 40% 60%
Sector Funds (e.g., Technology, Communications, Biotechnology, Health Care, Utilities) 16% 84%
Hedge Funds 2% 98%
Employer Stock 28% 72%
Mutual Fund Window (Mutual Funds only) 16% 84%
Self-Directed Brokerage 28% 72%
ETFs 5% 95%
In-plan Retirement Income Product (Annuity) 5% 95%
Custom/Hybrid Fund 10% 90%
n=286
Annual Defined Contribution Benchmarking Survey: Ease of Use Drives Engagement in Saving for Retirement 33
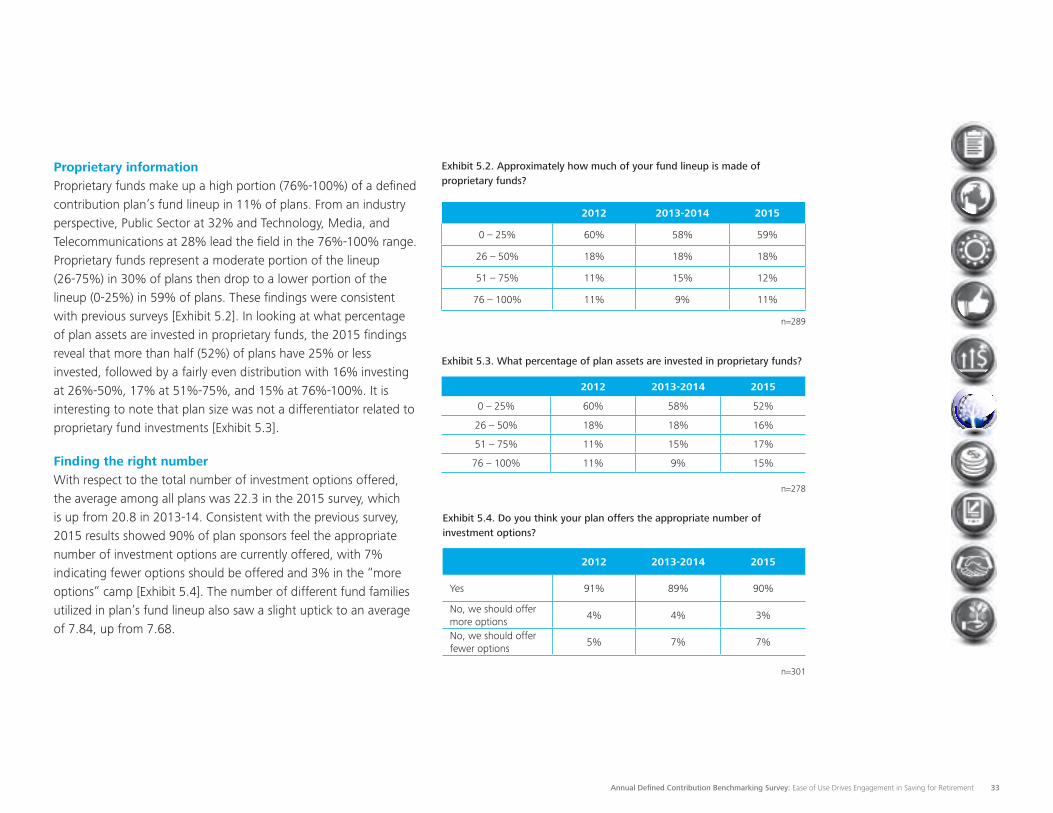
Proprietary informationProprietary funds make up a high portion (76%-100%) of a defined contribution plan’s fund lineup in 11% of plans. From an industry perspective, Public Sector at 32% and Technology, Media, and Telecommunications at 28% lead the field in the 76%-100% range. Proprietary funds represent a moderate portion of the lineup (26-75%) in 30% of plans then drop to a lower portion of the lineup (0-25%) in 59% of plans. These findings were consistent with previous surveys [Exhibit 5.2]. In looking at what percentage of plan assets are invested in proprietary funds, the 2015 findings reveal that more than half (52%) of plans have 25% or less invested, followed by a fairly even distribution with 16% investing at 26%-50%, 17% at 51%-75%, and 15% at 76%-100%. It is interesting to note that plan size was not a differentiator related to proprietary fund investments [Exhibit 5.3].
Exhibit 5.3. What percentage of plan assets are invested in proprietary funds?
2012 2013-2014 2015
0 – 25% 60% 58% 52%
26 – 50% 18% 18% 16%
51 – 75% 11% 15% 17%
76 – 100% 11% 9% 15%
n=278
Exhibit 5.2. Approximately how much of your fund lineup is made of proprietary funds?
2012 2013-2014 2015
0 – 25% 60% 58% 59%
26 – 50% 18% 18% 18%
51 – 75% 11% 15% 12%
76 – 100% 11% 9% 11%
Exhibit 5.4. Do you think your plan offers the appropriate number of investment options?
2012 2013-2014 2015
Yes 91% 89% 90%
No, we should offer more options
4% 4% 3%
No, we should offer fewer options
5% 7% 7%
n=301
n=289
Finding the right number With respect to the total number of investment options offered, the average among all plans was 22.3 in the 2015 survey, which is up from 20.8 in 2013-14. Consistent with the previous survey, 2015 results showed 90% of plan sponsors feel the appropriate number of investment options are currently offered, with 7% indicating fewer options should be offered and 3% in the “more options” camp [Exhibit 5.4]. The number of different fund families utilized in plan’s fund lineup also saw a slight uptick to an average of 7.84, up from 7.68.

Annual Defined Contribution Benchmarking Survey: Ease of Use Drives Engagement in Saving for Retirement 34
Exhibit 5.5. Which types of investment vehicles are utilized in your plan?
2012 2013-2014 2015
Yes No Yes No Yes No
Annuities 9% 91% 14% 86% 9% 91%
Collective trust funds 35% 65% 39% 61% 33% 67%
Mutual funds 89% 11% 89% 11% 82% 18%
Separate accounts 25% 75% 24% 76% 19% 81%
Other 6% 94% 7% 93% 6% 94%
n=309
Putting a lens on types of investment vehicles utilized, the breakdown was fairly consistent with past surveys. Mutual funds top the list at 82%, followed by collective trust funds at 33%, separate accounts at 19%, and annuities at 9% [Exhibit 5.5]. The percentage of investment options offered as specialty funds or funds that only target specific sectors came in at 8% across all plans.
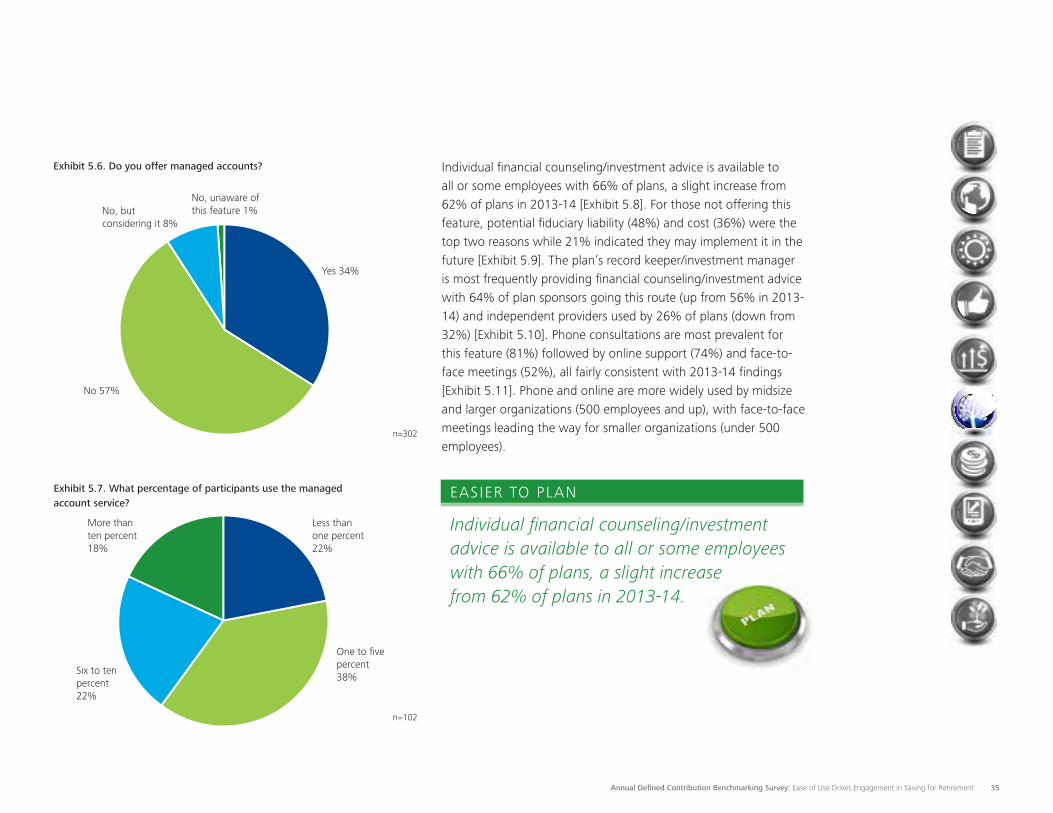
Investing made easier The 2015 survey zeroed in on the individual participant level, finding that managed accounts are in place in 34% of plans (consistent with the past two surveys), offering employees the ability to choose a professional manager for their defined contribution plan account where investment decisions are made and executed in line with their objectives and risk tolerance [Exhibit 5.6]. Participation in managed account service sees 18% of plans indicating more than 10%; 22% indicating 6%-10% and another 38% at 1%-5% [Exhibit 5.7]. This is another example of plan sponsors making it easier for employees to let the experts do the thinking and investing for them.
Participation in managed account service sees 18% of plans indicating more than 10%; 22% indicating 6%-10% and another 38% at 1%-5%. This is another example of plan sponsors making it easier for employees to let the experts do the thinking and investing for them.
EASIER TO INVEST
Annual Defined Contribution Benchmarking Survey: Ease of Use Drives Engagement in Saving for Retirement 35
Exhibit 5.6. Do you offer managed accounts?
Yes 34%
No 57%
No, but considering it 8%
No, unaware of this feature 1%
n=302
Exhibit 5.7. What percentage of participants use the managed account service?
Less than one percent22%
More than ten percent18%
One to five percent38%
Six to ten percent22%
n=102
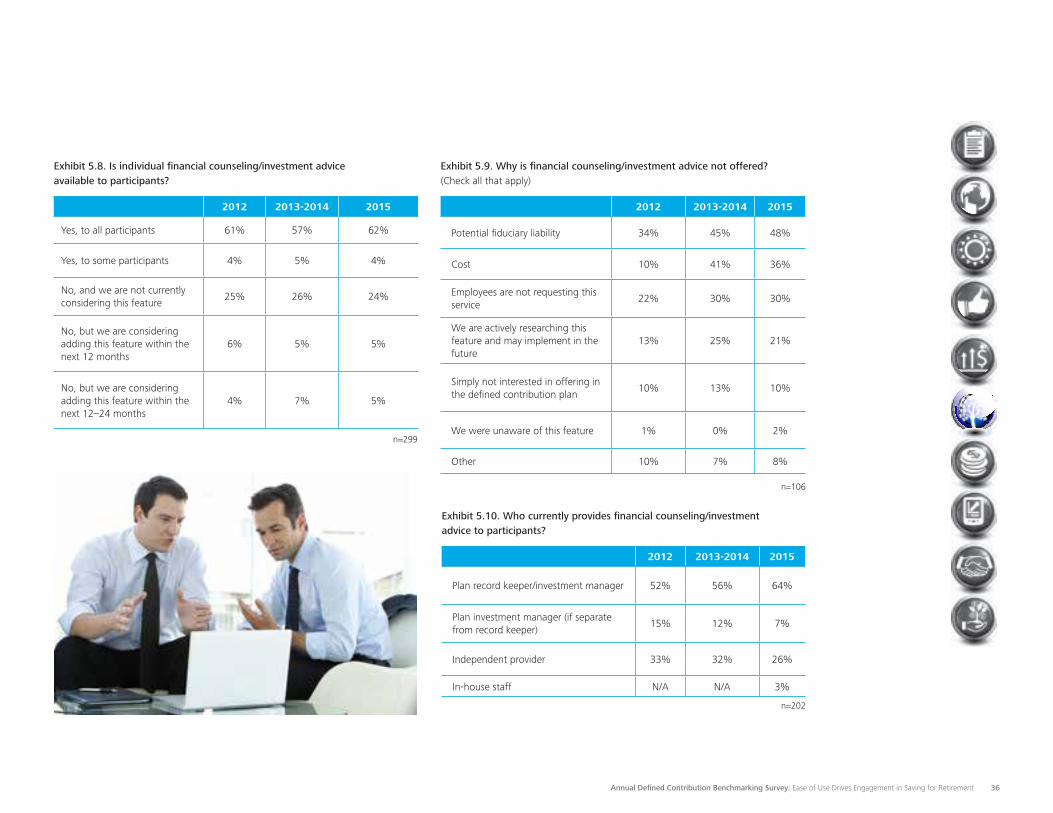
Individual financial counseling/investment advice is available to all or some employees with 66% of plans, a slight increase from 62% of plans in 2013-14 [Exhibit 5.8]. For those not offering this feature, potential fiduciary liability (48%) and cost (36%) were the top two reasons while 21% indicated they may implement it in the future [Exhibit 5.9]. The plan’s record keeper/investment manager is most frequently providing financial counseling/investment advice with 64% of plan sponsors going this route (up from 56% in 2013-14) and independent providers used by 26% of plans (down from 32%) [Exhibit 5.10]. Phone consultations are most prevalent for this feature (81%) followed by online support (74%) and face-to-face meetings (52%), all fairly consistent with 2013-14 findings [Exhibit 5.11]. Phone and online are more widely used by midsize and larger organizations (500 employees and up), with face-to-face meetings leading the way for smaller organizations (under 500 employees).
Individual financial counseling/investment advice is available to all or some employees with 66% of plans, a slight increase from 62% of plans in 2013-14.
EASIER TO PLAN
Annual Defined Contribution Benchmarking Survey: Ease of Use Drives Engagement in Saving for Retirement 36
Exhibit 5.8. Is individual financial counseling/investment advice available to participants?
2012 2013-2014 2015
Yes, to all participants 61% 57% 62%
Yes, to some participants 4% 5% 4%
No, and we are not currently considering this feature
25% 26% 24%
No, but we are considering adding this feature within the next 12 months
6% 5% 5%
No, but we are considering adding this feature within the next 12–24 months
4% 7% 5%
n=299
Exhibit 5.9. Why is financial counseling/investment advice not offered? (Check all that apply)
2012 2013-2014 2015
Potential fiduciary liability 34% 45% 48%
Cost 10% 41% 36%
Employees are not requesting this service
22% 30% 30%
We are actively researching this feature and may implement in the future
13% 25% 21%
Simply not interested in offering in the defined contribution plan
10% 13% 10%
We were unaware of this feature 1% 0% 2%
Other 10% 7% 8%
n=106
Exhibit 5.10. Who currently provides financial counseling/investment advice to participants?
2012 2013-2014 2015
Plan record keeper/investment manager 52% 56% 64%
Plan investment manager (if separate from record keeper)
15% 12% 7%
Independent provider 33% 32% 26%
In-house staff N/A N/A 3%
n=202
Annual Defined Contribution Benchmarking Survey: Ease of Use Drives Engagement in Saving for Retirement 37
Exhibit 5.11. How is this financial counseling/investment advice delivered? (Check all that apply)
Online 74%
Over the phone 81%
Face-to-face 52%
n=207
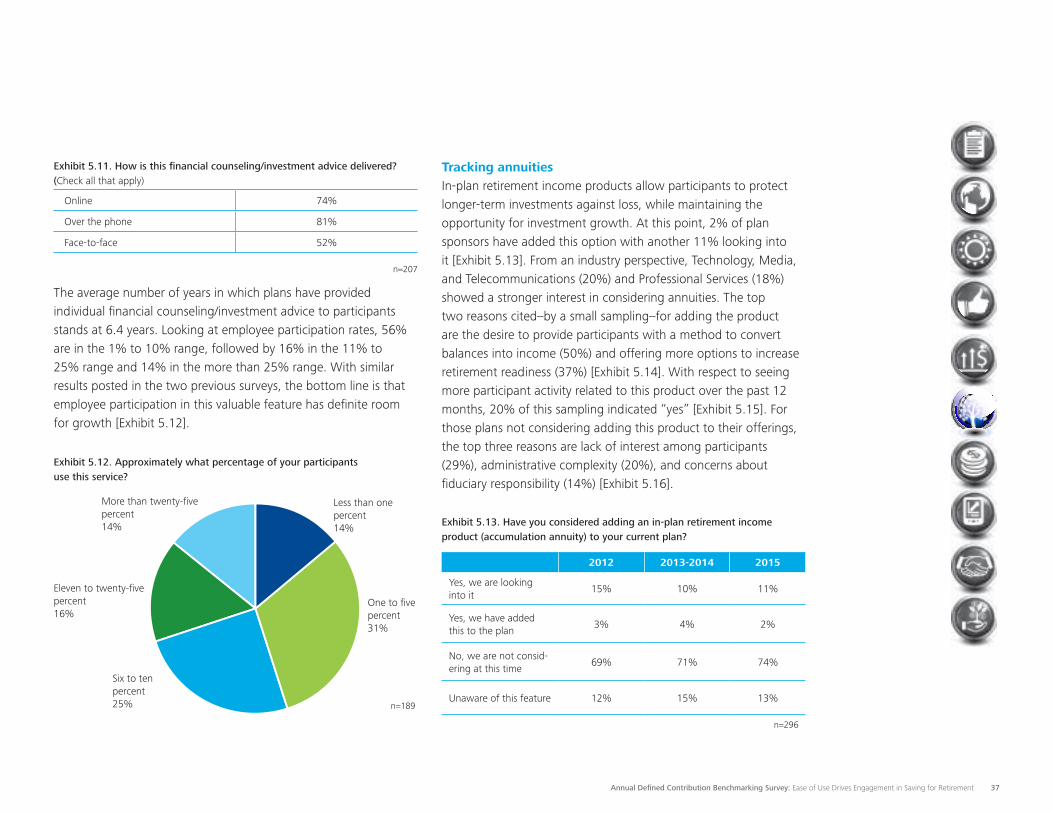
The average number of years in which plans have provided individual financial counseling/investment advice to participants stands at 6.4 years. Looking at employee participation rates, 56% are in the 1% to 10% range, followed by 16% in the 11% to 25% range and 14% in the more than 25% range. With similar results posted in the two previous surveys, the bottom line is that employee participation in this valuable feature has definite room for growth [Exhibit 5.12].
Exhibit 5.12. Approximately what percentage of your participants use this service?
Less than one percent 14%
One to five percent31%
Six to ten percent 25%
Eleven to twenty-five percent16%
More than twenty-five percent14%
n=189
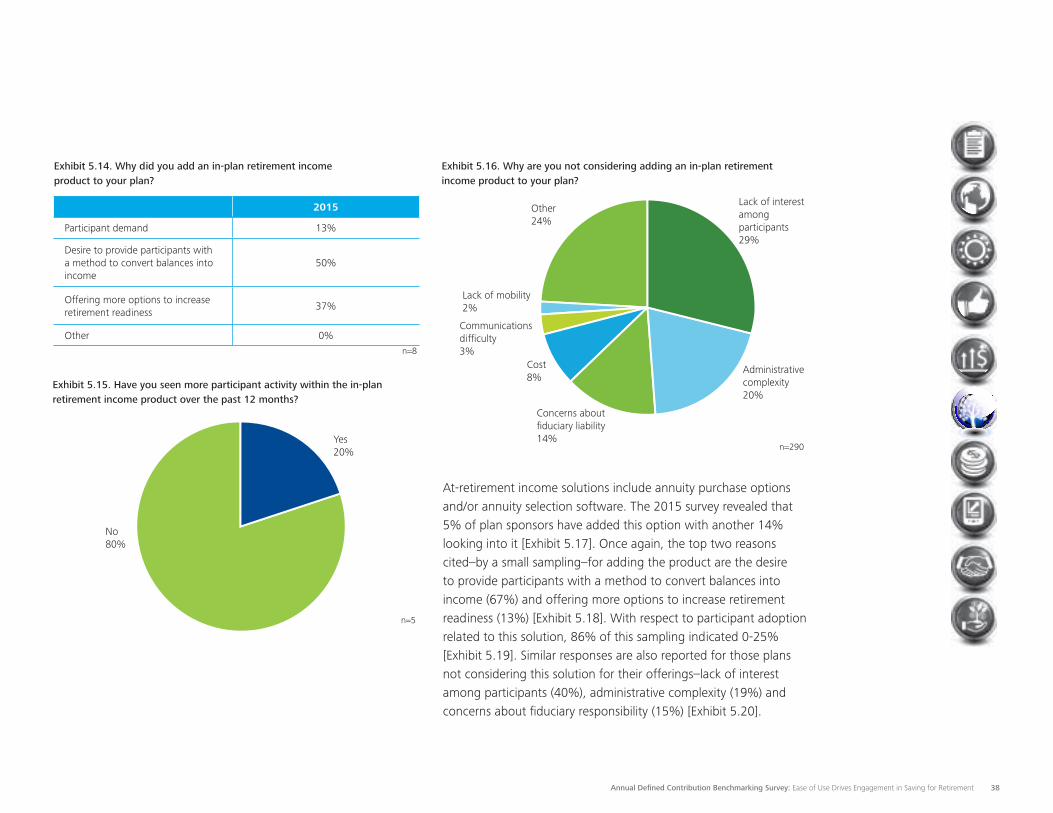
Tracking annuities In-plan retirement income products allow participants to protect longer-term investments against loss, while maintaining the opportunity for investment growth. At this point, 2% of plan sponsors have added this option with another 11% looking into it [Exhibit 5.13]. From an industry perspective, Technology, Media, and Telecommunications (20%) and Professional Services (18%) showed a stronger interest in considering annuities. The top two reasons cited–by a small sampling–for adding the product are the desire to provide participants with a method to convert balances into income (50%) and offering more options to increase retirement readiness (37%) [Exhibit 5.14]. With respect to seeing more participant activity related to this product over the past 12 months, 20% of this sampling indicated “yes” [Exhibit 5.15]. For those plans not considering adding this product to their offerings, the top three reasons are lack of interest among participants (29%), administrative complexity (20%), and concerns about fiduciary responsibility (14%) [Exhibit 5.16].
Exhibit 5.13. Have you considered adding an in-plan retirement income product (accumulation annuity) to your current plan?
2012 2013-2014 2015
Yes, we are looking into it
15% 10% 11%
Yes, we have added this to the plan
3% 4% 2%
No, we are not consid-ering at this time
69% 71% 74%
Unaware of this feature 12% 15% 13%
n=296
Annual Defined Contribution Benchmarking Survey: Ease of Use Drives Engagement in Saving for Retirement 38
Exhibit 5.14. Why did you add an in-plan retirement income product to your plan?
2015
Participant demand 13%
Desire to provide participants with a method to convert balances into income
50%
Offering more options to increase retirement readiness
37%
Other 0%
Yes 20%
No 80%
Exhibit 5.15. Have you seen more participant activity within the in-plan retirement income product over the past 12 months?
n=5
n=8
Administrative complexity20%
Concerns about fiduciary liability14%
Communications difficulty3%
Cost8%
Lack of interest among participants29%
Lack of mobility2%
Other24%
n=290
Exhibit 5.16. Why are you not considering adding an in-plan retirement income product to your plan?
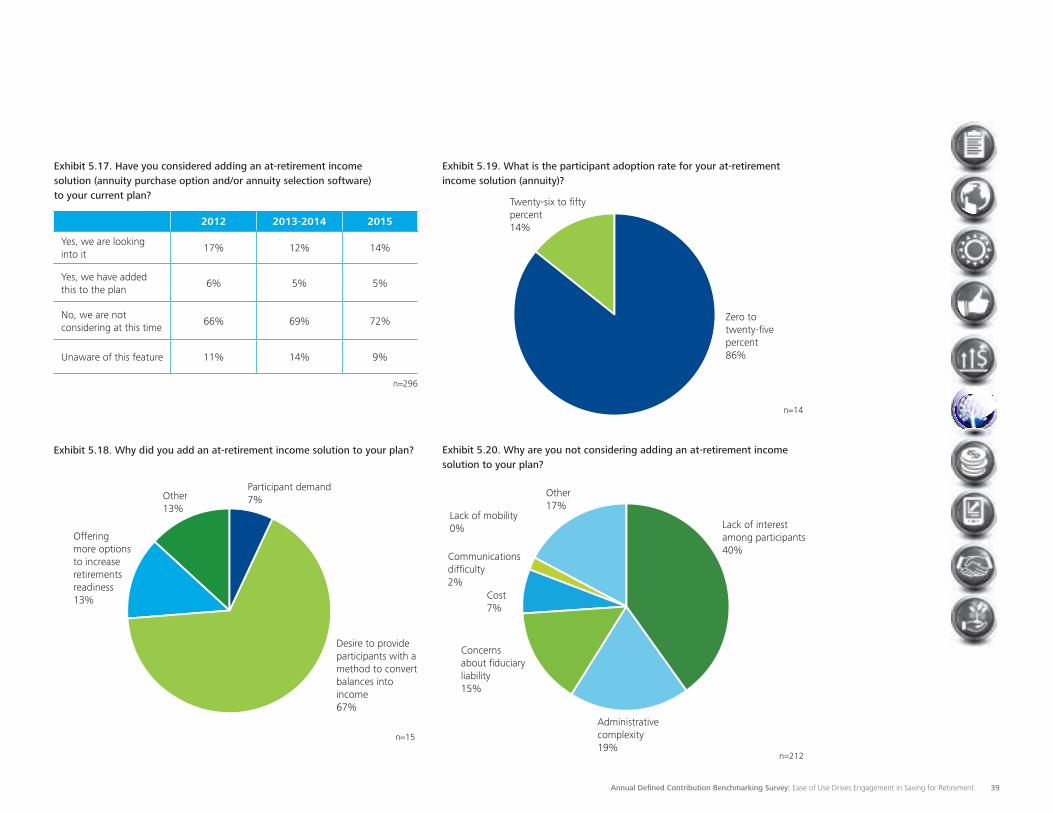
At-retirement income solutions include annuity purchase options and/or annuity selection software. The 2015 survey revealed that 5% of plan sponsors have added this option with another 14% looking into it [Exhibit 5.17]. Once again, the top two reasons cited–by a small sampling–for adding the product are the desire to provide participants with a method to convert balances into income (67%) and offering more options to increase retirement readiness (13%) [Exhibit 5.18]. With respect to participant adoption related to this solution, 86% of this sampling indicated 0-25% [Exhibit 5.19]. Similar responses are also reported for those plans not considering this solution for their offerings–lack of interest among participants (40%), administrative complexity (19%) and concerns about fiduciary responsibility (15%) [Exhibit 5.20].
Annual Defined Contribution Benchmarking Survey: Ease of Use Drives Engagement in Saving for Retirement 39
Exhibit 5.18. Why did you add an at-retirement income solution to your plan?
Participant demand7%
Desire to provide participants with a method to convert balances into income67%
Offering more options to increase retirements readiness13%
Other 13%
n=15
Exhibit 5.19. What is the participant adoption rate for your at-retirement income solution (annuity)?
Twenty-six to fifty percent14%
Zero to twenty-five percent86%
n=14
Exhibit 5.20. Why are you not considering adding an at-retirement income solution to your plan?
Administrative complexity19%
Concerns about fiduciary liability15%
Lack of interest among participants40%
Other17%
Lack of mobility0%
Communications difficulty2%
Cost7%
n=212
Exhibit 5.17. Have you considered adding an at-retirement income solution (annuity purchase option and/or annuity selection software) to your current plan?
2012 2013-2014 2015
Yes, we are looking into it
17% 12% 14%
Yes, we have added this to the plan
6% 5% 5%
No, we are not considering at this time
66% 69% 72%
Unaware of this feature 11% 14% 9%
n=296
Annual Defined Contribution Benchmarking Survey: Ease of Use Drives Engagement in Saving for Retirement 40
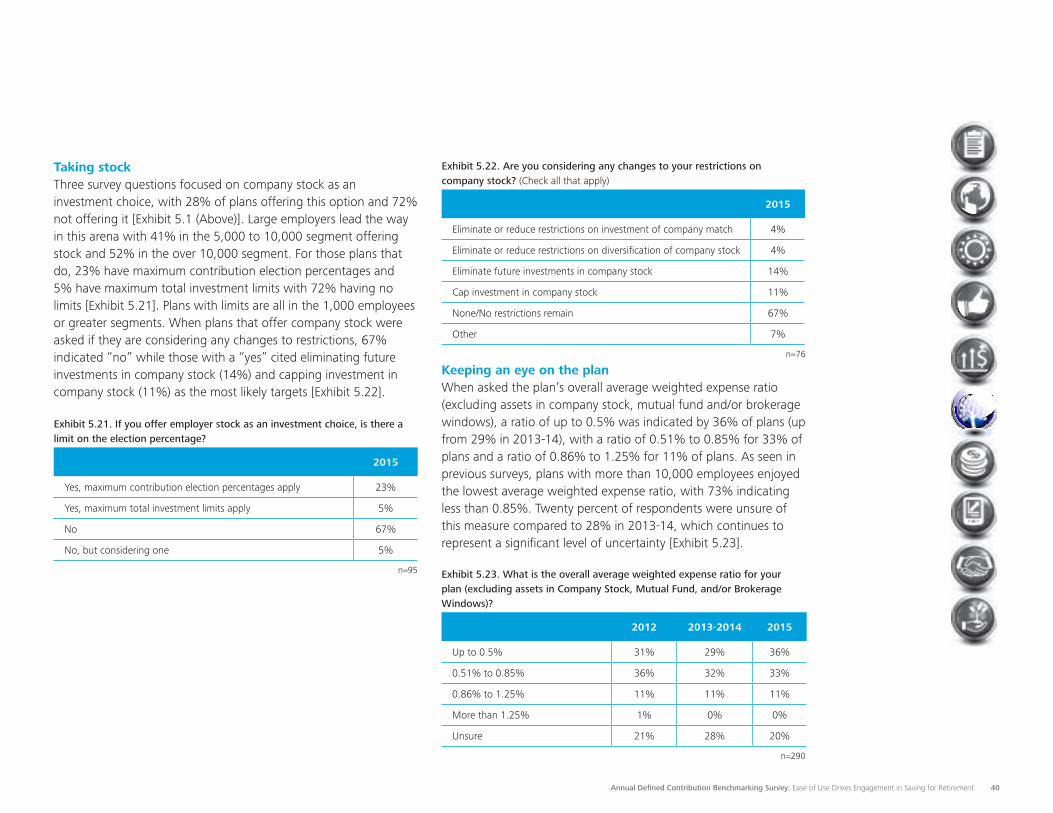
Taking stock Three survey questions focused on company stock as an investment choice, with 28% of plans offering this option and 72% not offering it [Exhibit 5.1 (Above)]. Large employers lead the way in this arena with 41% in the 5,000 to 10,000 segment offering stock and 52% in the over 10,000 segment. For those plans that do, 23% have maximum contribution election percentages and 5% have maximum total investment limits with 72% having no limits [Exhibit 5.21]. Plans with limits are all in the 1,000 employees or greater segments. When plans that offer company stock were asked if they are considering any changes to restrictions, 67% indicated “no” while those with a “yes” cited eliminating future investments in company stock (14%) and capping investment in company stock (11%) as the most likely targets [Exhibit 5.22].
Exhibit 5.21. If you offer employer stock as an investment choice, is there a limit on the election percentage?
2015
Yes, maximum contribution election percentages apply 23%
Yes, maximum total investment limits apply 5%
No 67%
No, but considering one 5%
n=95
Exhibit 5.22. Are you considering any changes to your restrictions on company stock? (Check all that apply)
2015
Eliminate or reduce restrictions on investment of company match 4%
Eliminate or reduce restrictions on diversification of company stock 4%
Eliminate future investments in company stock 14%
Cap investment in company stock 11%
None/No restrictions remain 67%
Other 7%
n=76
Keeping an eye on the plan When asked the plan’s overall average weighted expense ratio (excluding assets in company stock, mutual fund and/or brokerage windows), a ratio of up to 0.5% was indicated by 36% of plans (up from 29% in 2013-14), with a ratio of 0.51% to 0.85% for 33% of plans and a ratio of 0.86% to 1.25% for 11% of plans. As seen in previous surveys, plans with more than 10,000 employees enjoyed the lowest average weighted expense ratio, with 73% indicating less than 0.85%. Twenty percent of respondents were unsure of this measure compared to 28% in 2013-14, which continues to represent a significant level of uncertainty [Exhibit 5.23].
Exhibit 5.23. What is the overall average weighted expense ratio for your plan (excluding assets in Company Stock, Mutual Fund, and/or Brokerage Windows)?
2012 2013-2014 2015
Up to 0.5% 31% 29% 36%
0.51% to 0.85% 36% 32% 33%
0.86% to 1.25% 11% 11% 11%
More than 1.25% 1% 0% 0%
Unsure 21% 28% 20%
n=290
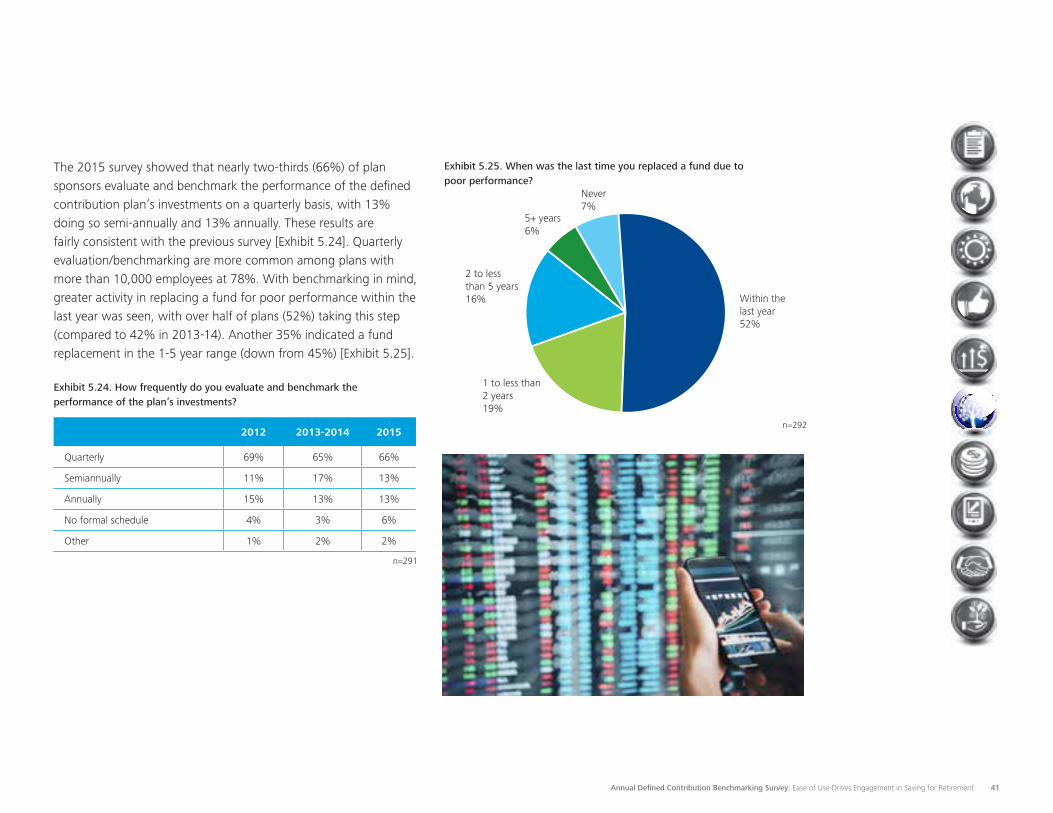
Annual Defined Contribution Benchmarking Survey: Ease of Use Drives Engagement in Saving for Retirement 41
The 2015 survey showed that nearly two-thirds (66%) of plan sponsors evaluate and benchmark the performance of the defined contribution plan’s investments on a quarterly basis, with 13% doing so semi-annually and 13% annually. These results are fairly consistent with the previous survey [Exhibit 5.24]. Quarterly evaluation/benchmarking are more common among plans with more than 10,000 employees at 78%. With benchmarking in mind, greater activity in replacing a fund for poor performance within the last year was seen, with over half of plans (52%) taking this step (compared to 42% in 2013-14). Another 35% indicated a fund replacement in the 1-5 year range (down from 45%) [Exhibit 5.25].
Exhibit 5.24. How frequently do you evaluate and benchmark the performance of the plan’s investments?
2012 2013-2014 2015
Quarterly 69% 65% 66%
Semiannually 11% 17% 13%
Annually 15% 13% 13%
No formal schedule 4% 3% 6%
Other 1% 2% 2%
n=291
Exhibit 5.25. When was the last time you replaced a fund due to poor performance?
Within the last year52%
1 to less than 2 years19%
5+ years6%
Never7%
2 to less than 5 years16%
n=292
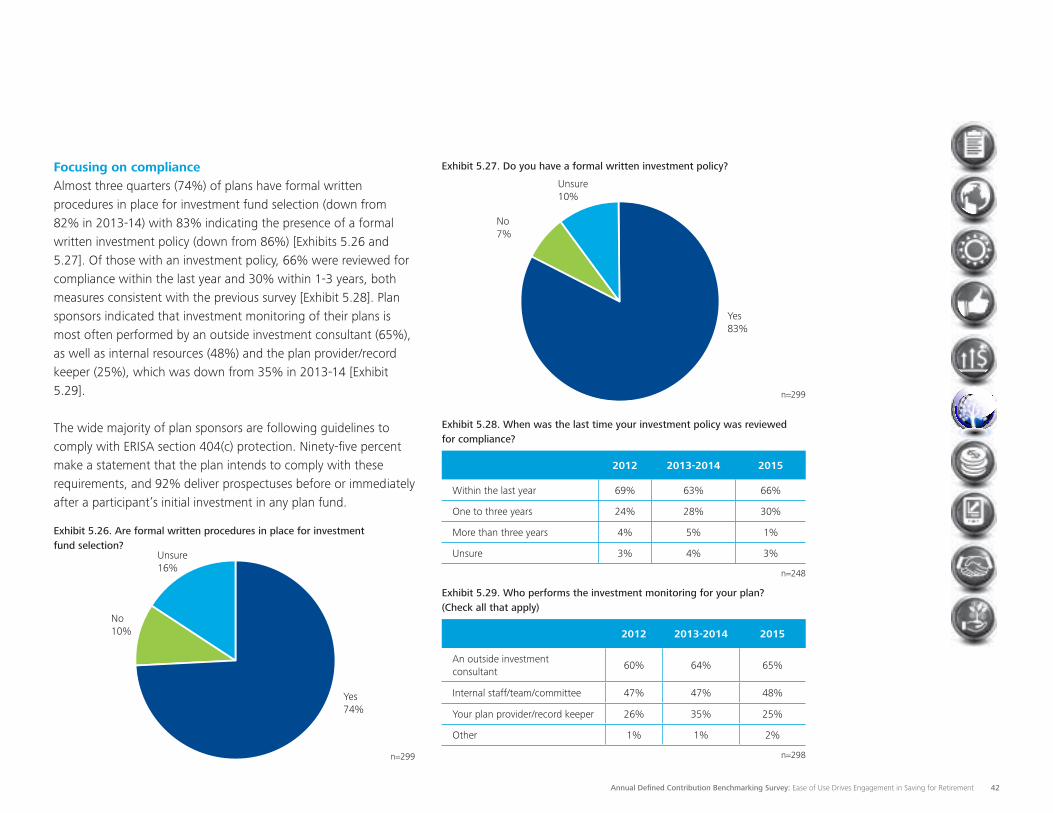
Annual Defined Contribution Benchmarking Survey: Ease of Use Drives Engagement in Saving for Retirement 42
Focusing on compliance Almost three quarters (74%) of plans have formal written procedures in place for investment fund selection (down from 82% in 2013-14) with 83% indicating the presence of a formal written investment policy (down from 86%) [Exhibits 5.26 and 5.27]. Of those with an investment policy, 66% were reviewed for compliance within the last year and 30% within 1-3 years, both measures consistent with the previous survey [Exhibit 5.28]. Plan sponsors indicated that investment monitoring of their plans is most often performed by an outside investment consultant (65%), as well as internal resources (48%) and the plan provider/record keeper (25%), which was down from 35% in 2013-14 [Exhibit 5.29].
The wide majority of plan sponsors are following guidelines to comply with ERISA section 404(c) protection. Ninety-five percent make a statement that the plan intends to comply with these requirements, and 92% deliver prospectuses before or immediately after a participant’s initial investment in any plan fund.
Exhibit 5.26. Are formal written procedures in place for investment fund selection?
Yes74%
No10%
Unsure16%
n=299
Exhibit 5.27. Do you have a formal written investment policy?
Yes83%
No7%
Unsure10%
n=299
Exhibit 5.28. When was the last time your investment policy was reviewed for compliance?
2012 2013-2014 2015
Within the last year 69% 63% 66%
One to three years 24% 28% 30%
More than three years 4% 5% 1%
Unsure 3% 4% 3%
n=248
Exhibit 5.29. Who performs the investment monitoring for your plan? (Check all that apply)
2012 2013-2014 2015
An outside investment consultant
60% 64% 65%
Internal staff/team/committee 47% 47% 48%
Your plan provider/record keeper 26% 35% 25%
Other 1% 1% 2%
n=298
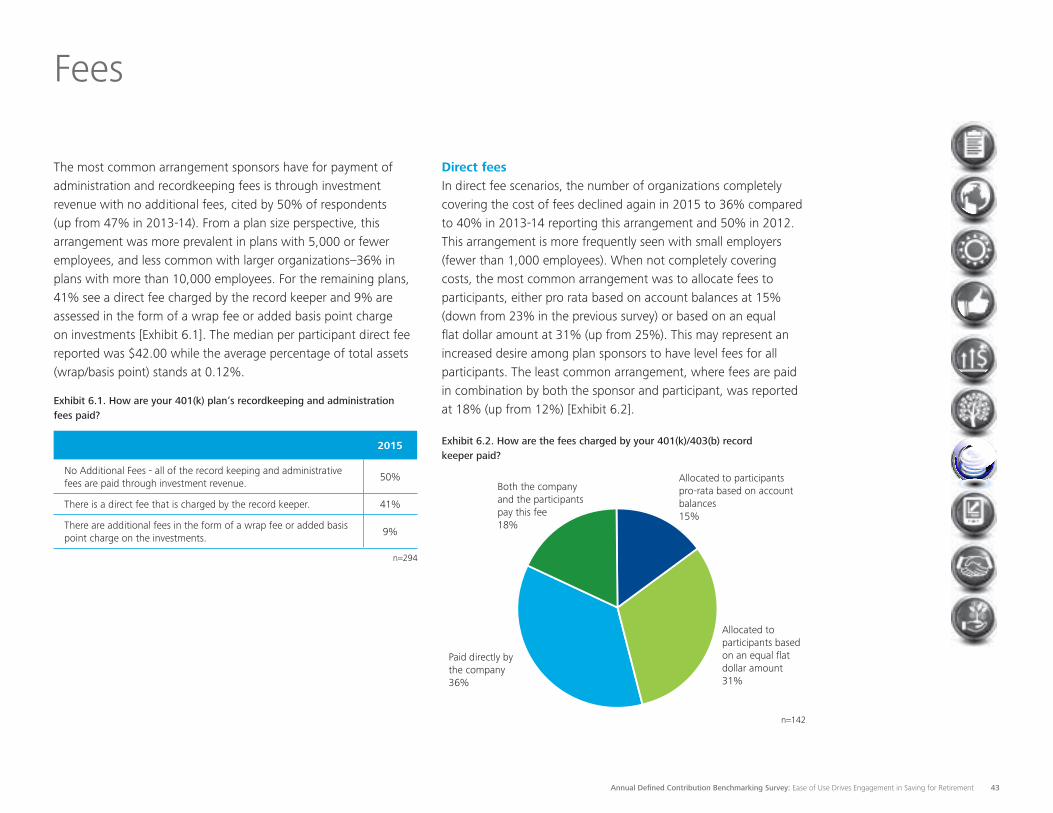
Annual Defined Contribution Benchmarking Survey: Ease of Use Drives Engagement in Saving for Retirement 43
Fees
The most common arrangement sponsors have for payment of administration and recordkeeping fees is through investment revenue with no additional fees, cited by 50% of respondents (up from 47% in 2013-14). From a plan size perspective, this arrangement was more prevalent in plans with 5,000 or fewer employees, and less common with larger organizations–36% in plans with more than 10,000 employees. For the remaining plans, 41% see a direct fee charged by the record keeper and 9% are assessed in the form of a wrap fee or added basis point charge on investments [Exhibit 6.1]. The median per participant direct fee reported was $42.00 while the average percentage of total assets (wrap/basis point) stands at 0.12%.
Exhibit 6.1. How are your 401(k) plan’s recordkeeping and administration fees paid?
2015
No Additional Fees - all of the record keeping and administrative fees are paid through investment revenue.
50%
There is a direct fee that is charged by the record keeper. 41%
There are additional fees in the form of a wrap fee or added basis point charge on the investments.
9%
n=294
Direct feesIn direct fee scenarios, the number of organizations completely covering the cost of fees declined again in 2015 to 36% compared to 40% in 2013-14 reporting this arrangement and 50% in 2012. This arrangement is more frequently seen with small employers (fewer than 1,000 employees). When not completely covering costs, the most common arrangement was to allocate fees to participants, either pro rata based on account balances at 15% (down from 23% in the previous survey) or based on an equal flat dollar amount at 31% (up from 25%). This may represent an increased desire among plan sponsors to have level fees for all participants. The least common arrangement, where fees are paid in combination by both the sponsor and participant, was reported at 18% (up from 12%) [Exhibit 6.2].
Exhibit 6.2. How are the fees charged by your 401(k)/403(b) record keeper paid?
Allocated to participants pro-rata based on account balances15%
Allocated to participants based on an equal flat dollar amount 31%
Paid directly by the company 36%
Both the company and the participants pay this fee18%
n=142
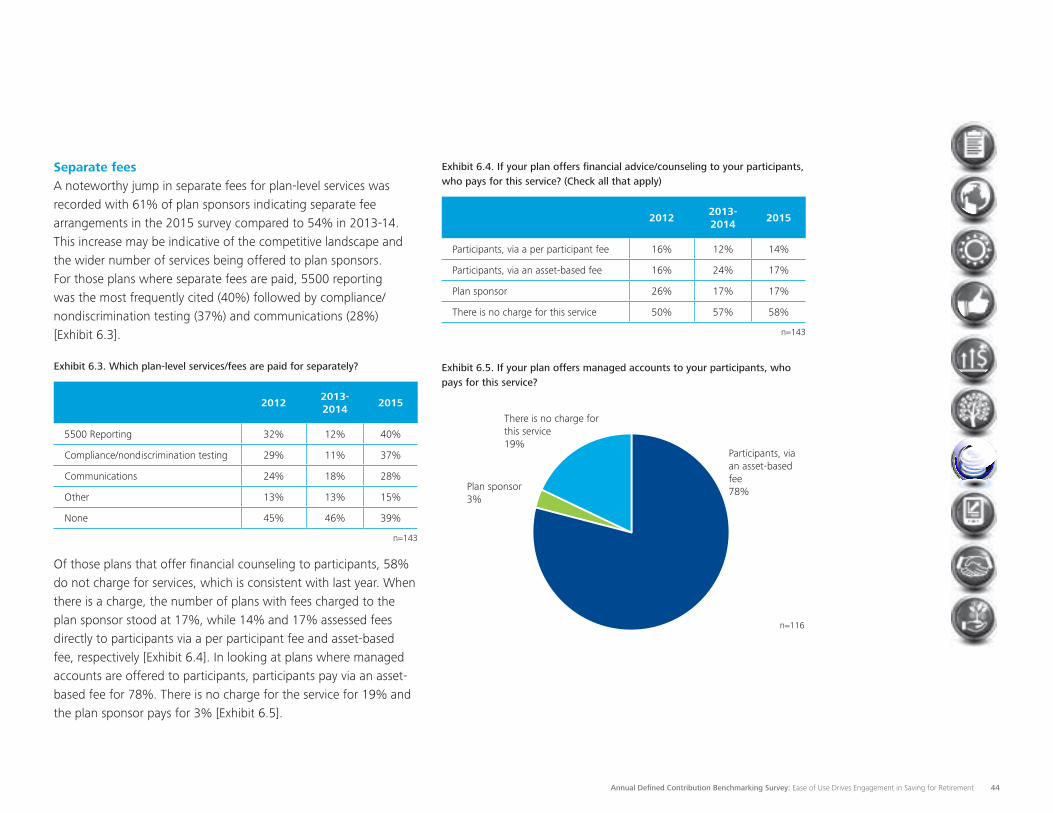
Annual Defined Contribution Benchmarking Survey: Ease of Use Drives Engagement in Saving for Retirement 44
Separate fees A noteworthy jump in separate fees for plan-level services was recorded with 61% of plan sponsors indicating separate fee arrangements in the 2015 survey compared to 54% in 2013-14. This increase may be indicative of the competitive landscape and the wider number of services being offered to plan sponsors. For those plans where separate fees are paid, 5500 reporting was the most frequently cited (40%) followed by compliance/nondiscrimination testing (37%) and communications (28%) [Exhibit 6.3].
Exhibit 6.3. Which plan-level services/fees are paid for separately?
20122013-2014
2015
5500 Reporting 32% 12% 40%
Compliance/nondiscrimination testing 29% 11% 37%
Communications 24% 18% 28%
Other 13% 13% 15%
None 45% 46% 39%
n=143
Of those plans that offer financial counseling to participants, 58% do not charge for services, which is consistent with last year. When there is a charge, the number of plans with fees charged to the plan sponsor stood at 17%, while 14% and 17% assessed fees directly to participants via a per participant fee and asset-based fee, respectively [Exhibit 6.4]. In looking at plans where managed accounts are offered to participants, participants pay via an asset-based fee for 78%. There is no charge for the service for 19% and the plan sponsor pays for 3% [Exhibit 6.5].
Exhibit 6.4. If your plan offers financial advice/counseling to your participants, who pays for this service? (Check all that apply)
20122013-2014
2015
Participants, via a per participant fee 16% 12% 14%
Participants, via an asset-based fee 16% 24% 17%
Plan sponsor 26% 17% 17%
There is no charge for this service 50% 57% 58%
n=143
Exhibit 6.5. If your plan offers managed accounts to your participants, who pays for this service?
There is no charge for this service19%
Participants, via an asset-based fee 78%Plan sponsor
3%
n=116
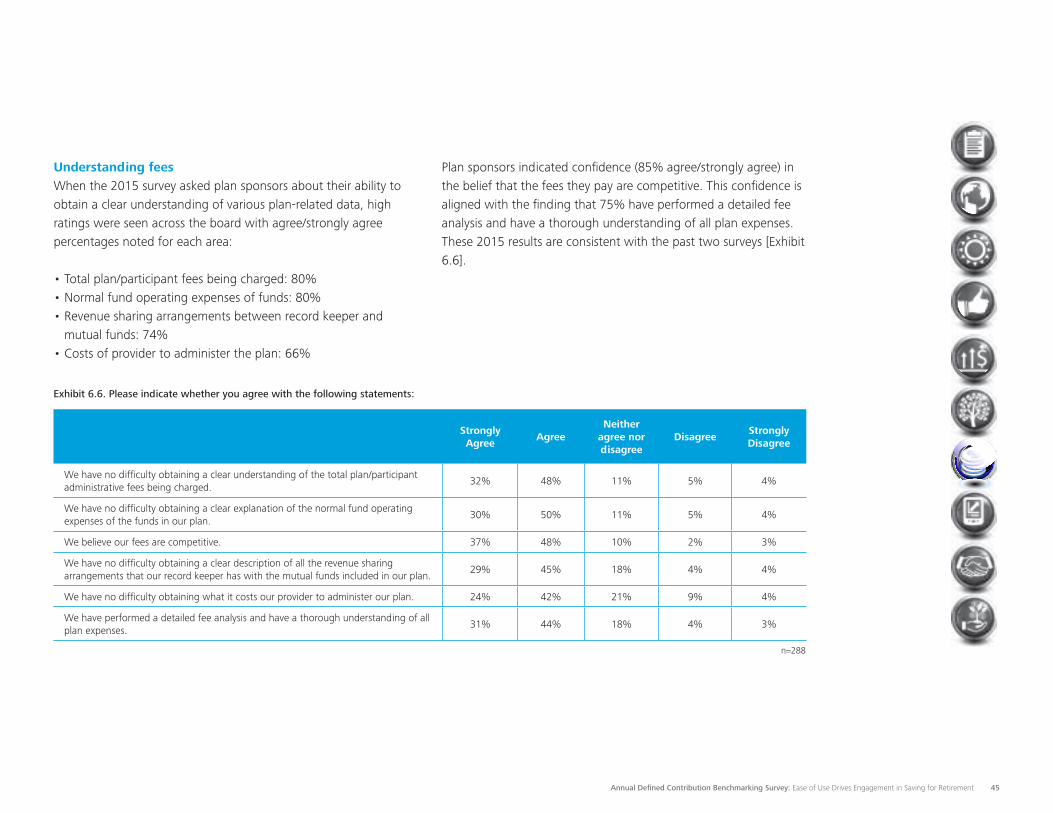
Annual Defined Contribution Benchmarking Survey: Ease of Use Drives Engagement in Saving for Retirement 45
Understanding feesWhen the 2015 survey asked plan sponsors about their ability to obtain a clear understanding of various plan-related data, high ratings were seen across the board with agree/strongly agree percentages noted for each area:
•Total plan/participant fees being charged: 80% •Normal fund operating expenses of funds: 80%•Revenue sharing arrangements between record keeper and
mutual funds: 74%•Costs of provider to administer the plan: 66%
Exhibit 6.6. Please indicate whether you agree with the following statements:
Strongly Agree
AgreeNeither
agree nor disagree
DisagreeStrongly Disagree
We have no difficulty obtaining a clear understanding of the total plan/participant administrative fees being charged.
32% 48% 11% 5% 4%
We have no difficulty obtaining a clear explanation of the normal fund operating expenses of the funds in our plan.
30% 50% 11% 5% 4%
We believe our fees are competitive. 37% 48% 10% 2% 3%
We have no difficulty obtaining a clear description of all the revenue sharing arrangements that our record keeper has with the mutual funds included in our plan.
29% 45% 18% 4% 4%
We have no difficulty obtaining what it costs our provider to administer our plan. 24% 42% 21% 9% 4%
We have performed a detailed fee analysis and have a thorough understanding of all plan expenses.
31% 44% 18% 4% 3%
n=288
Plan sponsors indicated confidence (85% agree/strongly agree) in the belief that the fees they pay are competitive. This confidence is aligned with the finding that 75% have performed a detailed fee analysis and have a thorough understanding of all plan expenses. These 2015 results are consistent with the past two surveys [Exhibit 6.6].
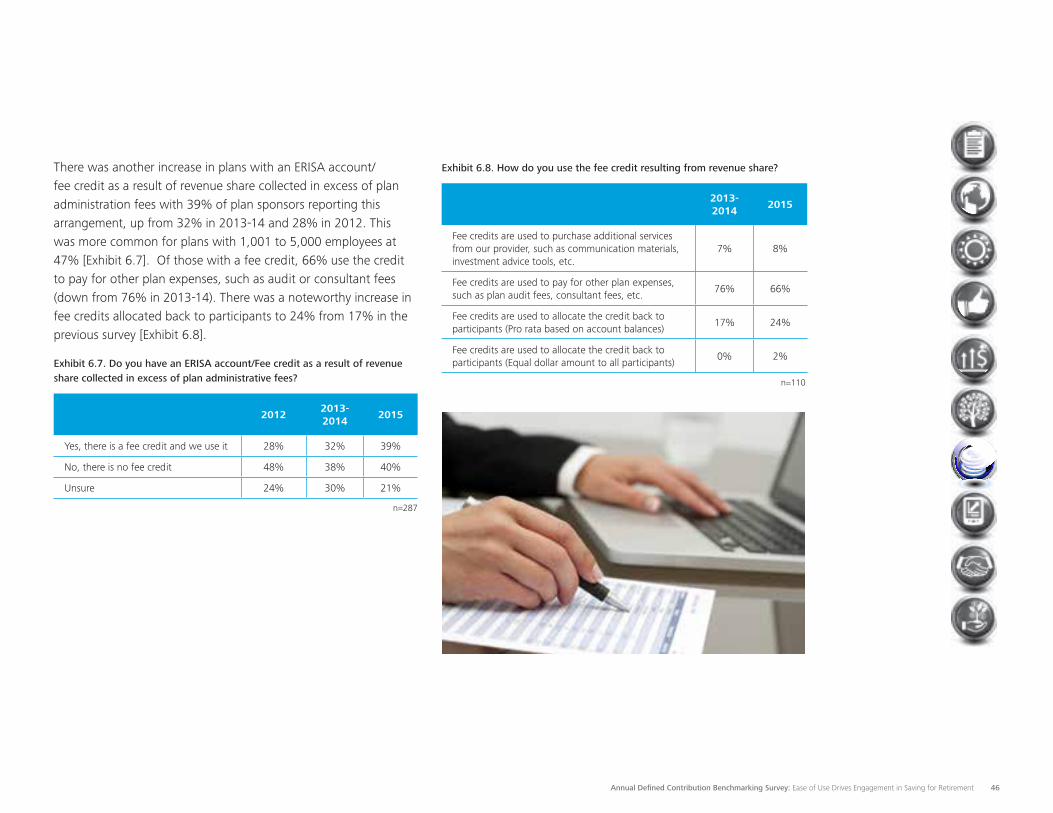
Annual Defined Contribution Benchmarking Survey: Ease of Use Drives Engagement in Saving for Retirement 46
There was another increase in plans with an ERISA account/fee credit as a result of revenue share collected in excess of plan administration fees with 39% of plan sponsors reporting this arrangement, up from 32% in 2013-14 and 28% in 2012. This was more common for plans with 1,001 to 5,000 employees at 47% [Exhibit 6.7]. Of those with a fee credit, 66% use the credit to pay for other plan expenses, such as audit or consultant fees (down from 76% in 2013-14). There was a noteworthy increase in fee credits allocated back to participants to 24% from 17% in the previous survey [Exhibit 6.8].
Exhibit 6.7. Do you have an ERISA account/Fee credit as a result of revenue share collected in excess of plan administrative fees?
20122013-2014
2015
Yes, there is a fee credit and we use it 28% 32% 39%
No, there is no fee credit 48% 38% 40%
Unsure 24% 30% 21%
n=287
Exhibit 6.8. How do you use the fee credit resulting from revenue share?
2013-2014
2015
Fee credits are used to purchase additional services from our provider, such as communication materials, investment advice tools, etc.
7% 8%
Fee credits are used to pay for other plan expenses, such as plan audit fees, consultant fees, etc.
76% 66%
Fee credits are used to allocate the credit back to participants (Pro rata based on account balances)
17% 24%
Fee credits are used to allocate the credit back to participants (Equal dollar amount to all participants)
0% 2%
n=110
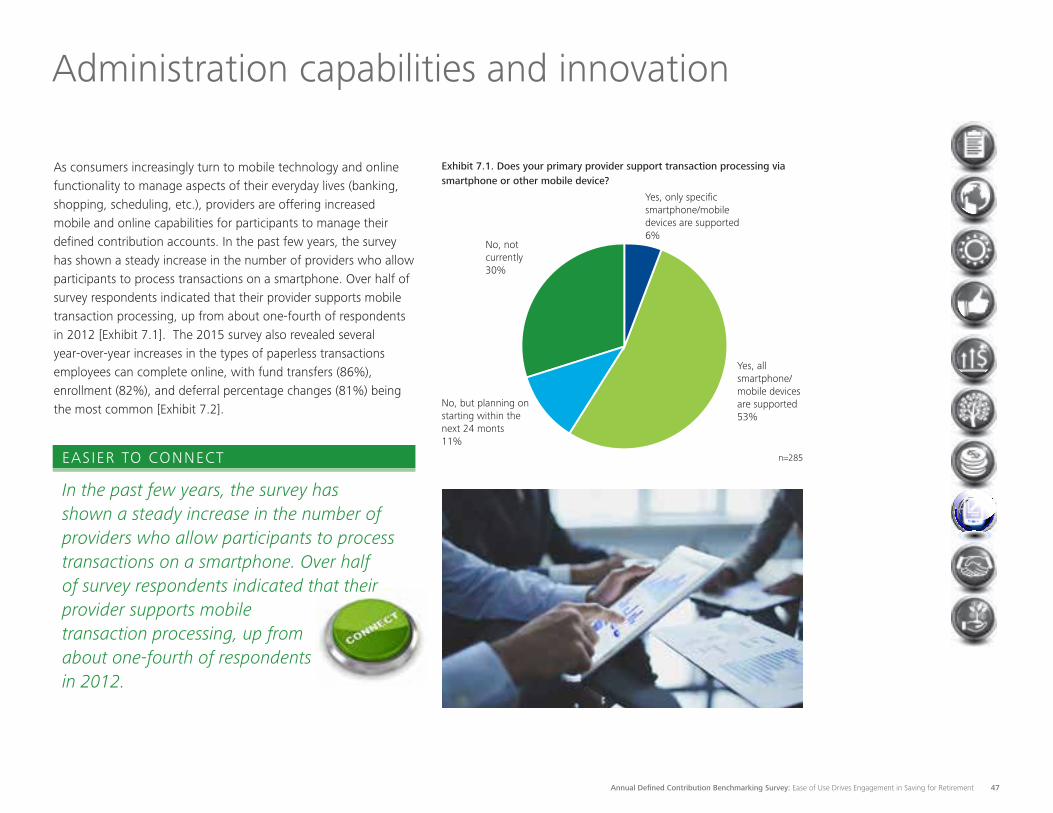
Annual Defined Contribution Benchmarking Survey: Ease of Use Drives Engagement in Saving for Retirement 47
Administration capabilities and innovation
As consumers increasingly turn to mobile technology and online functionality to manage aspects of their everyday lives (banking, shopping, scheduling, etc.), providers are offering increased mobile and online capabilities for participants to manage their defined contribution accounts. In the past few years, the survey has shown a steady increase in the number of providers who allow participants to process transactions on a smartphone. Over half of survey respondents indicated that their provider supports mobile transaction processing, up from about one-fourth of respondents in 2012 [Exhibit 7.1]. The 2015 survey also revealed several year-over-year increases in the types of paperless transactions employees can complete online, with fund transfers (86%), enrollment (82%), and deferral percentage changes (81%) being the most common [Exhibit 7.2].
In the past few years, the survey has shown a steady increase in the number of providers who allow participants to process transactions on a smartphone. Over half of survey respondents indicated that their provider supports mobile transaction processing, up from about one-fourth of respondents in 2012.
EASIER TO CONNECT
Exhibit 7.1. Does your primary provider support transaction processing via smartphone or other mobile device?
Yes, only specific smartphone/mobile devices are supported6%
Yes, all smartphone/mobile devices are supported53%
No, but planning on starting within the next 24 monts11%
No, not currently30%
n=285
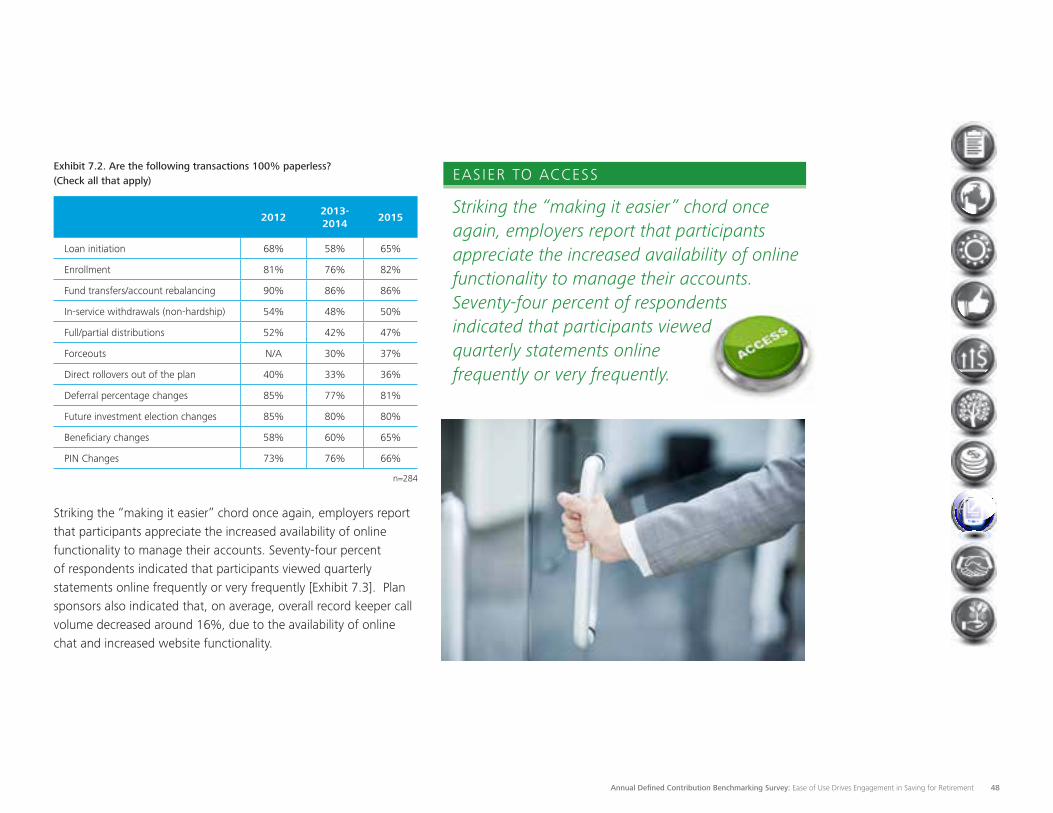
Annual Defined Contribution Benchmarking Survey: Ease of Use Drives Engagement in Saving for Retirement 48
Exhibit 7.2. Are the following transactions 100% paperless? (Check all that apply)
20122013-2014
2015
Loan initiation 68% 58% 65%
Enrollment 81% 76% 82%
Fund transfers/account rebalancing 90% 86% 86%
In-service withdrawals (non-hardship) 54% 48% 50%
Full/partial distributions 52% 42% 47%
Forceouts N/A 30% 37%
Direct rollovers out of the plan 40% 33% 36%
Deferral percentage changes 85% 77% 81%
Future investment election changes 85% 80% 80%
Beneficiary changes 58% 60% 65%
PIN Changes 73% 76% 66%
n=284
Striking the “making it easier” chord once again, employers report that participants appreciate the increased availability of online functionality to manage their accounts. Seventy-four percent of respondents indicated that participants viewed quarterly statements online frequently or very frequently [Exhibit 7.3]. Plan sponsors also indicated that, on average, overall record keeper call volume decreased around 16%, due to the availability of online chat and increased website functionality.
Striking the “making it easier” chord once again, employers report that participants appreciate the increased availability of online functionality to manage their accounts. Seventy-four percent of respondents indicated that participants viewed quarterly statements online frequently or very frequently.
EASIER TO ACCESS
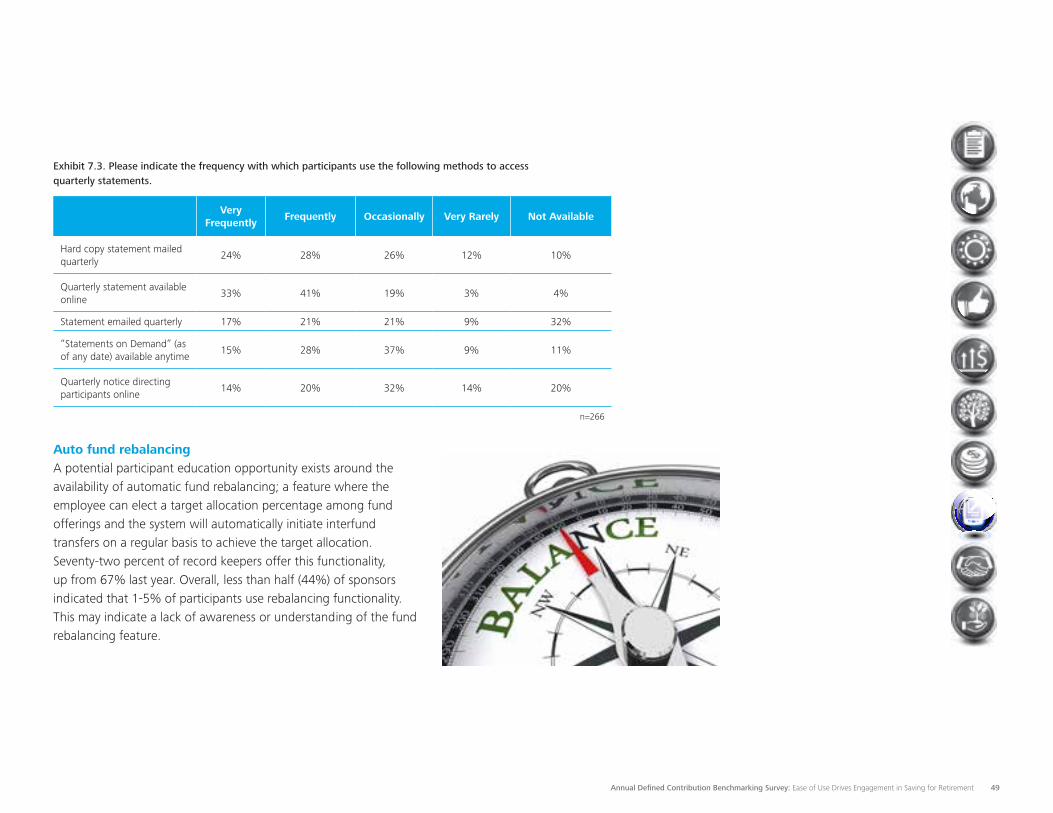
Annual Defined Contribution Benchmarking Survey: Ease of Use Drives Engagement in Saving for Retirement 49
Exhibit 7.3. Please indicate the frequency with which participants use the following methods to access quarterly statements.
Very
FrequentlyFrequently Occasionally Very Rarely Not Available
Hard copy statement mailed quarterly
24% 28% 26% 12% 10%
Quarterly statement available online
33% 41% 19% 3% 4%
Statement emailed quarterly 17% 21% 21% 9% 32%
“Statements on Demand” (as of any date) available anytime
15% 28% 37% 9% 11%
Quarterly notice directing participants online
14% 20% 32% 14% 20%
n=266
Auto fund rebalancing A potential participant education opportunity exists around the availability of automatic fund rebalancing; a feature where the employee can elect a target allocation percentage among fund offerings and the system will automatically initiate interfund transfers on a regular basis to achieve the target allocation. Seventy-two percent of record keepers offer this functionality, up from 67% last year. Overall, less than half (44%) of sponsors indicated that 1-5% of participants use rebalancing functionality. This may indicate a lack of awareness or understanding of the fund rebalancing feature.
Annual Defined Contribution Benchmarking Survey: Ease of Use Drives Engagement in Saving for Retirement 50
Socially awkward?While there is still some uncertainty around how and if participants will interact directly with record keepers through online channels, 69% of plan sponsors reported that they were not interested in using social media to interact with their record keeper [Exhibit 7.4]. Further, 26% of plan sponsors do not believe that participants are interested in using social media to interact with record keepers, with an additional 44% being unsure if there is participant interest [Exhibit 7.5]. Participant use of smartphone apps to interact with record keepers increased a good margin – up 9 percentage points from 31% last year [Exhibit 7.6]. While the availability and utilization of social media functionality around account management continues to evolve, whether participants and plan sponsors will utilize these new technologies to communicate with record keepers is uncertain.
Exhibit 7.4. Are you interested in interacting with retirement providers via social media channels?
2012 2013-2014 2015
Yes 2% 1% 1%
Not yet, but possibly in the future
33% 27% 22%
No 59% 67% 69%
Unsure 6% 5% 8%
n=280
Exhibit 7.5. Do you believe participants are interested in interacting with retirement providers via social media channels?
2012 2013-2014 2015
Yes 11% 8% 9%
Not yet, but possibly in the future
33% 37% 21%
No 18% 23% 26%
Unsure 38% 32% 44%
n=277
Exhibit 7.6. Have participants interacted with your record keeper through any of the following methods? (Check all that apply)
20122013-2014
2015
Hand-held devices are used in group and individual meetings to allow immediate partic-ipant action (enrollment, investment changes, allocation changes, etc.)
9% 8% 14%
Participants use Social Media to interact with our record keeper (Facebook, LinkedIn, etc.)
7% 5% 4%
Participants use instant chat via the record keeper’s secure participant website
9% 8% 13%
Participants use smartphone and/or tablet applications to interact with our record keeper (via iPhone, iPad, Android, Blackberry, etc.)
26% 31% 40%
No 31% 28% 20%
Unsure 41% 39% 38%
n=280
Annual Defined Contribution Benchmarking Survey: Ease of Use Drives Engagement in Saving for Retirement 51
Plan sponsor interactionCompared to last year, plan sponsor use of new technologies to connect with their defined contribution data did not grow significantly [Exhibit 7.7]. Seventy-eight percent of plan sponsors do not currently use these, compared to 79% last year. Use of smartphone technology grew to 16% compared to 11% in the previous year. Satisfaction among smartphone users, however, showed rapid improvement. Of those who report using smartphone/tablet applications, 73% reported being satisfied or very satisfied with the experience, up from 64% of smartphone users in the 2013-14 survey [Exhibit 7.8]. For record keepers determining where they will invest–or not invest–in new technologies, they can look to areas where growth has been seen over the last few years (smartphone technologies) and where little to no movement in plan sponsor use and interest is evident (social media).
Exhibit 7.7. As a plan administrator, please identify the methods that you have used to interact with your record keeper: (Check all that apply)
2012 2013-2014 2015
Social Media (Facebook, LinkedIn, Twitter, etc.)
1% 3% 0%
Instant chat via the secure participant Web
4% 7% 5%
Smartphone and/or tablet applications (via iPhone, iPad, Android, Blackberry, etc.)
12% 11% 16%
None 82% 79% 78%
Unsure 4% 5% 4%
n=280
Exhibit 7.8. How satisfied are you with the experience of interacting with your record keeper via:
Very
SatisfiedSatisfied
Neither Satisfied
nor Dissatisfied
DissatisfiedVery
Dissatisfied
Social Media (Facebook, LinkedIn, etc.)
0% 8% 88% 0% 4%
Instant chat via the secure plan sponsor website
3% 35% 62% 0% 0%
Smartphone applications (via iPhone, Android, Blackberry, etc.)
17% 56% 27% 0% 0%
n=48
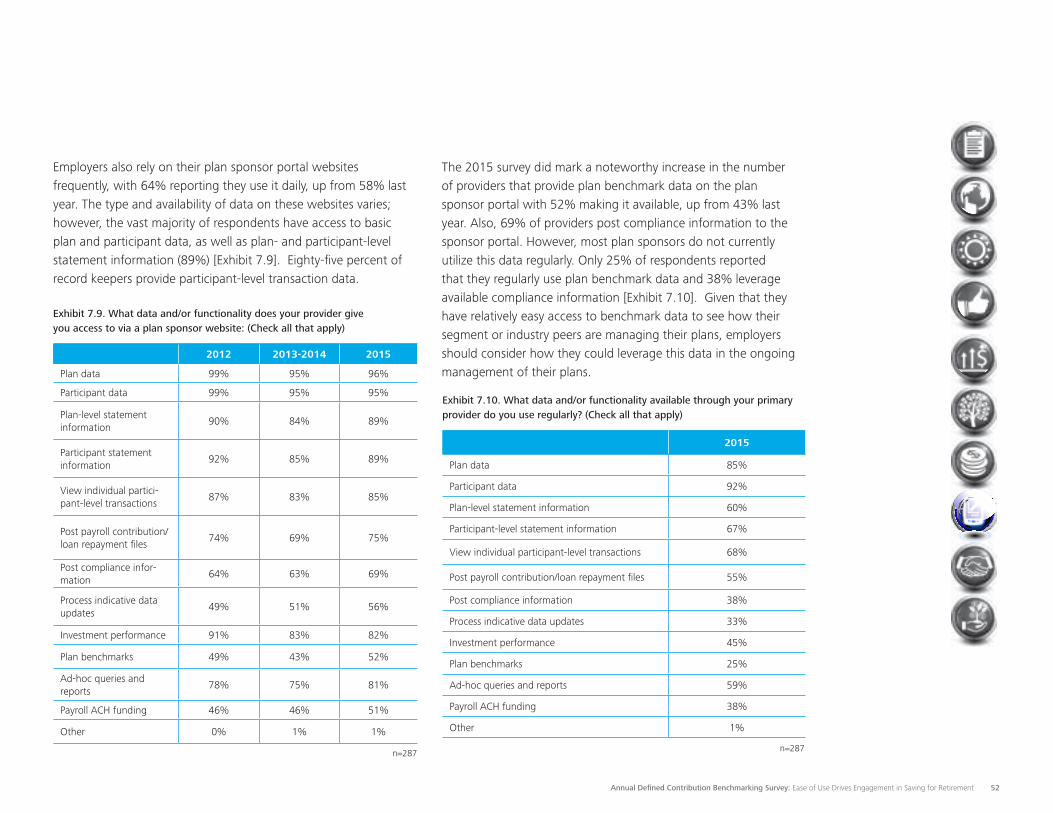
Annual Defined Contribution Benchmarking Survey: Ease of Use Drives Engagement in Saving for Retirement 52
Employers also rely on their plan sponsor portal websites frequently, with 64% reporting they use it daily, up from 58% last year. The type and availability of data on these websites varies; however, the vast majority of respondents have access to basic plan and participant data, as well as plan- and participant-level statement information (89%) [Exhibit 7.9]. Eighty-five percent of record keepers provide participant-level transaction data.
Exhibit 7.9. What data and/or functionality does your provider give you access to via a plan sponsor website: (Check all that apply)
2012 2013-2014 2015
Plan data 99% 95% 96%
Participant data 99% 95% 95%
Plan-level statement information
90% 84% 89%
Participant statement information
92% 85% 89%
View individual partici-pant-level transactions
87% 83% 85%
Post payroll contribution/loan repayment files
74% 69% 75%
Post compliance infor-mation
64% 63% 69%
Process indicative data updates
49% 51% 56%
Investment performance 91% 83% 82%
Plan benchmarks 49% 43% 52%
Ad-hoc queries and reports
78% 75% 81%
Payroll ACH funding 46% 46% 51%
Other 0% 1% 1%
n=287
The 2015 survey did mark a noteworthy increase in the number of providers that provide plan benchmark data on the plan sponsor portal with 52% making it available, up from 43% last year. Also, 69% of providers post compliance information to the sponsor portal. However, most plan sponsors do not currently utilize this data regularly. Only 25% of respondents reported that they regularly use plan benchmark data and 38% leverage available compliance information [Exhibit 7.10]. Given that they have relatively easy access to benchmark data to see how their segment or industry peers are managing their plans, employers should consider how they could leverage this data in the ongoing management of their plans.
Exhibit 7.10. What data and/or functionality available through your primary provider do you use regularly? (Check all that apply)
2015
Plan data 85%
Participant data 92%
Plan-level statement information 60%
Participant-level statement information 67%
View individual participant-level transactions 68%
Post payroll contribution/loan repayment files 55%
Post compliance information 38%
Process indicative data updates 33%
Investment performance 45%
Plan benchmarks 25%
Ad-hoc queries and reports 59%
Payroll ACH funding 38%
Other 1%
n=287
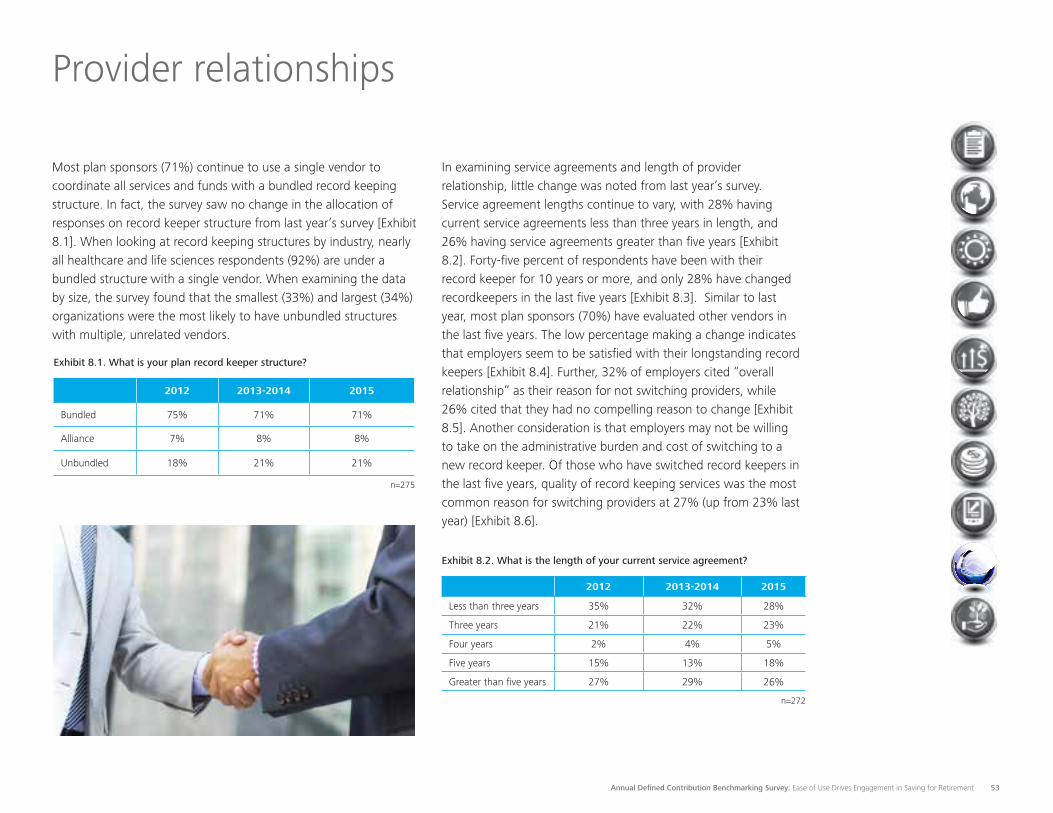
Annual Defined Contribution Benchmarking Survey: Ease of Use Drives Engagement in Saving for Retirement 53
Provider relationships
Most plan sponsors (71%) continue to use a single vendor to coordinate all services and funds with a bundled record keeping structure. In fact, the survey saw no change in the allocation of responses on record keeper structure from last year’s survey [Exhibit 8.1]. When looking at record keeping structures by industry, nearly all healthcare and life sciences respondents (92%) are under a bundled structure with a single vendor. When examining the data by size, the survey found that the smallest (33%) and largest (34%) organizations were the most likely to have unbundled structures with multiple, unrelated vendors.
Exhibit 8.1. What is your plan record keeper structure?
2012 2013-2014 2015
Bundled 75% 71% 71%
Alliance 7% 8% 8%
Unbundled 18% 21% 21%
n=275
In examining service agreements and length of provider relationship, little change was noted from last year’s survey. Service agreement lengths continue to vary, with 28% having current service agreements less than three years in length, and 26% having service agreements greater than five years [Exhibit 8.2]. Forty-five percent of respondents have been with their record keeper for 10 years or more, and only 28% have changed recordkeepers in the last five years [Exhibit 8.3]. Similar to last year, most plan sponsors (70%) have evaluated other vendors in the last five years. The low percentage making a change indicates that employers seem to be satisfied with their longstanding record keepers [Exhibit 8.4]. Further, 32% of employers cited “overall relationship” as their reason for not switching providers, while 26% cited that they had no compelling reason to change [Exhibit 8.5]. Another consideration is that employers may not be willing to take on the administrative burden and cost of switching to a new record keeper. Of those who have switched record keepers in the last five years, quality of record keeping services was the most common reason for switching providers at 27% (up from 23% last year) [Exhibit 8.6].
Exhibit 8.2. What is the length of your current service agreement?
2012 2013-2014 2015
Less than three years 35% 32% 28%
Three years 21% 22% 23%
Four years 2% 4% 5%
Five years 15% 13% 18%
Greater than five years 27% 29% 26%
n=272
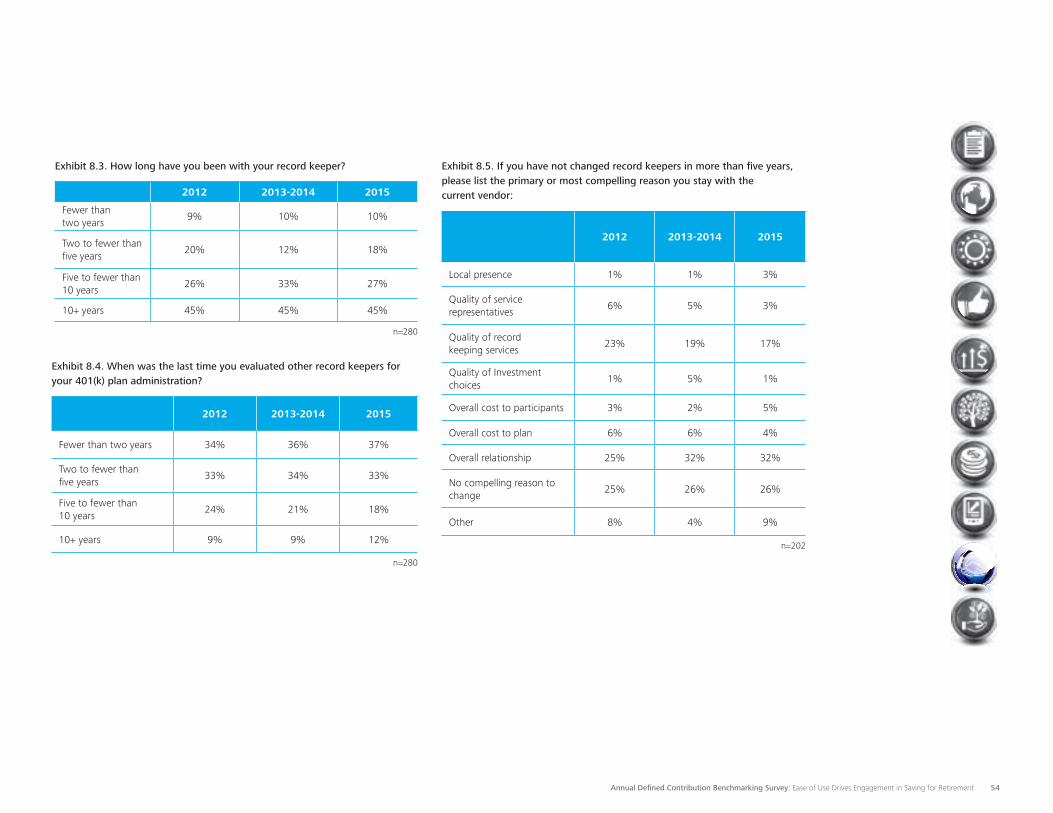
Annual Defined Contribution Benchmarking Survey: Ease of Use Drives Engagement in Saving for Retirement 54
Exhibit 8.3. How long have you been with your record keeper?
2012 2013-2014 2015
Fewer than two years
9% 10% 10%
Two to fewer than five years
20% 12% 18%
Five to fewer than 10 years
26% 33% 27%
10+ years 45% 45% 45%
n=280
Exhibit 8.4. When was the last time you evaluated other record keepers for your 401(k) plan administration?
2012 2013-2014 2015
Fewer than two years 34% 36% 37%
Two to fewer than five years
33% 34% 33%
Five to fewer than 10 years
24% 21% 18%
10+ years 9% 9% 12%
n=280
Exhibit 8.5. If you have not changed record keepers in more than five years, please list the primary or most compelling reason you stay with the current vendor:
2012 2013-2014 2015
Local presence 1% 1% 3%
Quality of service representatives
6% 5% 3%
Quality of record keeping services
23% 19% 17%
Quality of Investment choices
1% 5% 1%
Overall cost to participants 3% 2% 5%
Overall cost to plan 6% 6% 4%
Overall relationship 25% 32% 32%
No compelling reason to change
25% 26% 26%
Other 8% 4% 9%
n=202
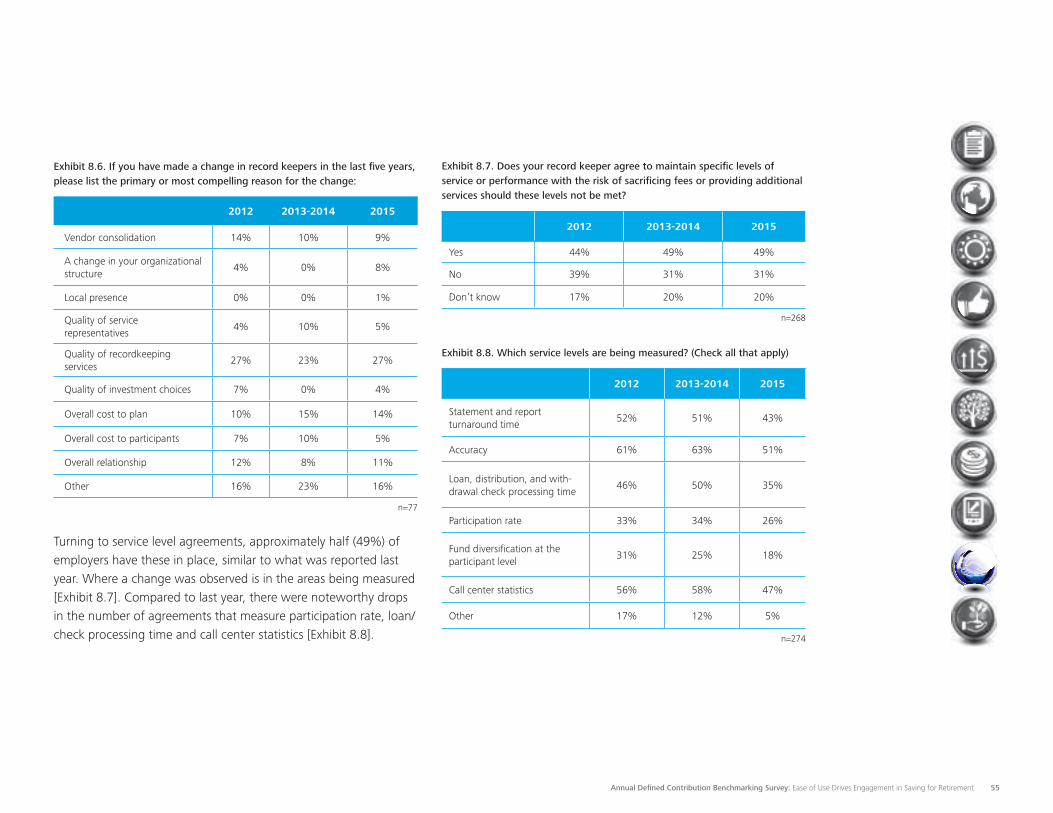
Annual Defined Contribution Benchmarking Survey: Ease of Use Drives Engagement in Saving for Retirement 55
Turning to service level agreements, approximately half (49%) of employers have these in place, similar to what was reported last year. Where a change was observed is in the areas being measured [Exhibit 8.7]. Compared to last year, there were noteworthy drops in the number of agreements that measure participation rate, loan/check processing time and call center statistics [Exhibit 8.8].
Exhibit 8.7. Does your record keeper agree to maintain specific levels of service or performance with the risk of sacrificing fees or providing additional services should these levels not be met?
2012 2013-2014 2015
Yes 44% 49% 49%
No 39% 31% 31%
Don’t know 17% 20% 20%
n=268
Exhibit 8.8. Which service levels are being measured? (Check all that apply)
2012 2013-2014 2015
Statement and report turnaround time
52% 51% 43%
Accuracy 61% 63% 51%
Loan, distribution, and with-drawal check processing time
46% 50% 35%
Participation rate 33% 34% 26%
Fund diversification at the participant level
31% 25% 18%
Call center statistics 56% 58% 47%
Other 17% 12% 5%
n=274
Exhibit 8.6. If you have made a change in record keepers in the last five years, please list the primary or most compelling reason for the change:
2012 2013-2014 2015
Vendor consolidation 14% 10% 9%
A change in your organizational structure
4% 0% 8%
Local presence 0% 0% 1%
Quality of service representatives
4% 10% 5%
Quality of recordkeeping services
27% 23% 27%
Quality of investment choices 7% 0% 4%
Overall cost to plan 10% 15% 14%
Overall cost to participants 7% 10% 5%
Overall relationship 12% 8% 11%
Other 16% 23% 16%
n=77
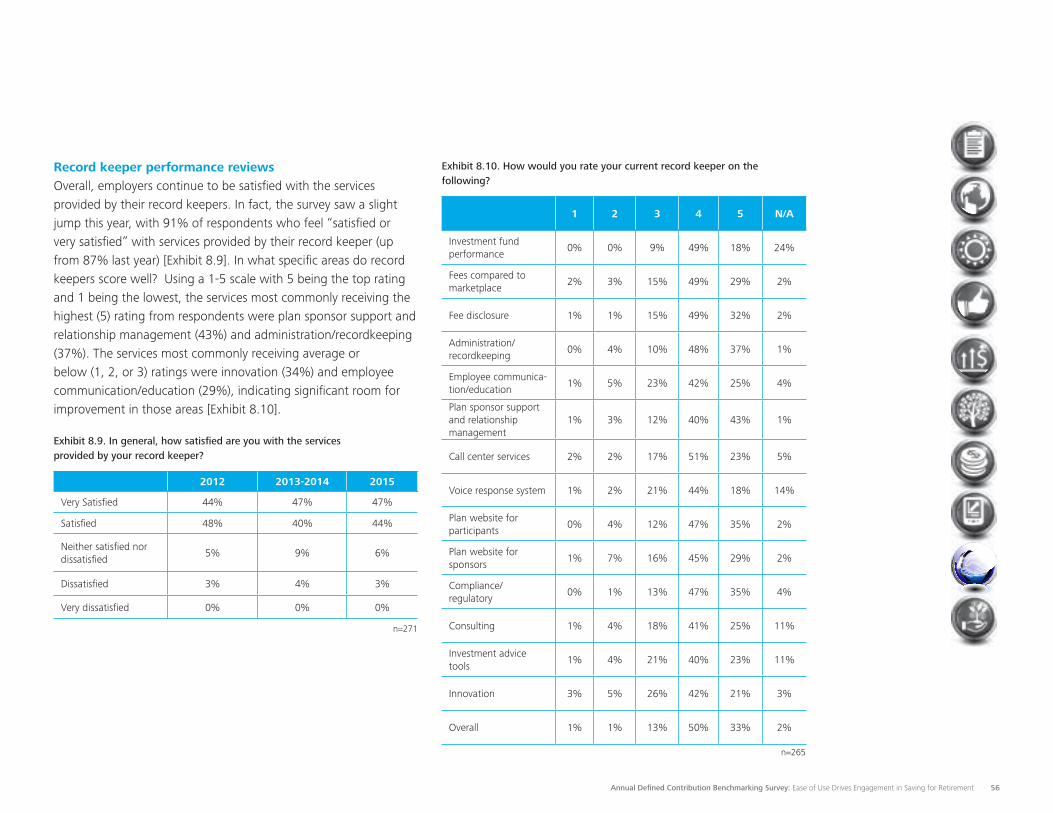
Annual Defined Contribution Benchmarking Survey: Ease of Use Drives Engagement in Saving for Retirement 56
Record keeper performance reviewsOverall, employers continue to be satisfied with the services provided by their record keepers. In fact, the survey saw a slight jump this year, with 91% of respondents who feel “satisfied or very satisfied” with services provided by their record keeper (up from 87% last year) [Exhibit 8.9]. In what specific areas do record keepers score well? Using a 1-5 scale with 5 being the top rating and 1 being the lowest, the services most commonly receiving the highest (5) rating from respondents were plan sponsor support and relationship management (43%) and administration/recordkeeping (37%). The services most commonly receiving average or below (1, 2, or 3) ratings were innovation (34%) and employee communication/education (29%), indicating significant room for improvement in those areas [Exhibit 8.10].
Exhibit 8.9. In general, how satisfied are you with the services provided by your record keeper?
2012 2013-2014 2015
Very Satisfied 44% 47% 47%
Satisfied 48% 40% 44%
Neither satisfied nor dissatisfied
5% 9% 6%
Dissatisfied 3% 4% 3%
Very dissatisfied 0% 0% 0%
n=271
Exhibit 8.10. How would you rate your current record keeper on the following?
1 2 3 4 5 N/A
Investment fund performance
0% 0% 9% 49% 18% 24%
Fees compared to marketplace
2% 3% 15% 49% 29% 2%
Fee disclosure 1% 1% 15% 49% 32% 2%
Administration/ recordkeeping
0% 4% 10% 48% 37% 1%
Employee communica-tion/education
1% 5% 23% 42% 25% 4%
Plan sponsor support and relationship management
1% 3% 12% 40% 43% 1%
Call center services 2% 2% 17% 51% 23% 5%
Voice response system 1% 2% 21% 44% 18% 14%
Plan website for participants
0% 4% 12% 47% 35% 2%
Plan website for sponsors
1% 7% 16% 45% 29% 2%
Compliance/ regulatory
0% 1% 13% 47% 35% 4%
Consulting 1% 4% 18% 41% 25% 11%
Investment advice tools
1% 4% 21% 40% 23% 11%
Innovation 3% 5% 26% 42% 21% 3%
Overall 1% 1% 13% 50% 33% 2%
n=265
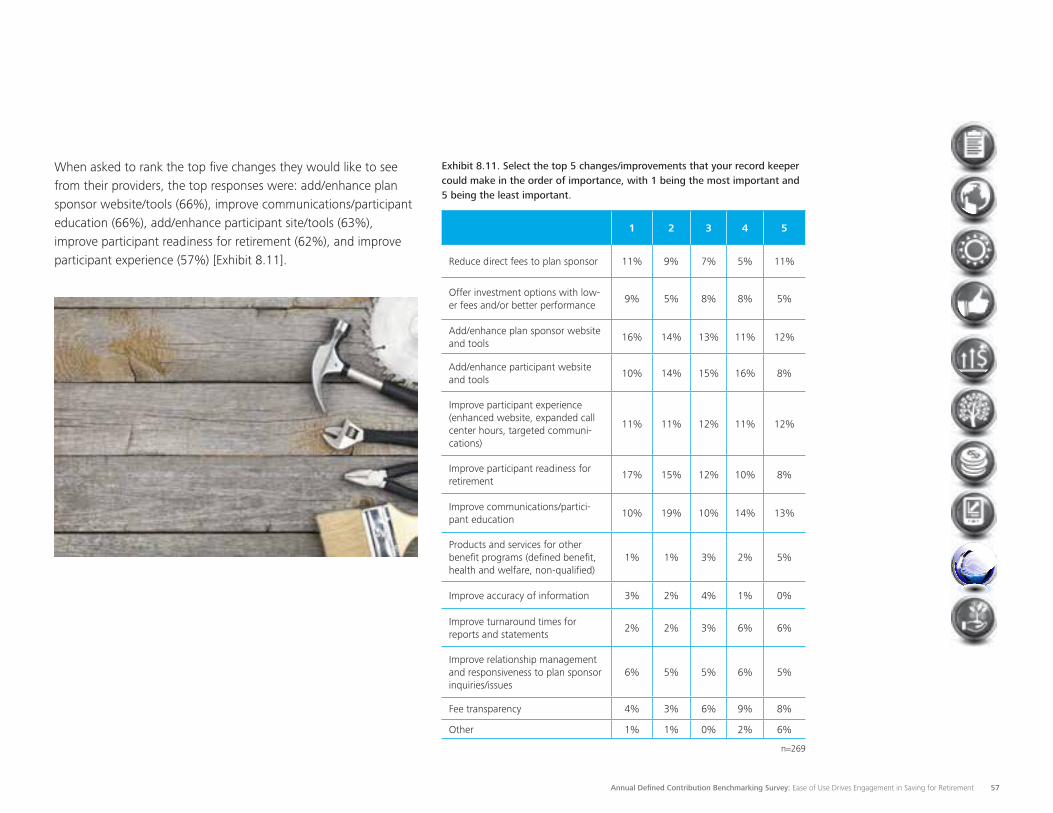
Annual Defined Contribution Benchmarking Survey: Ease of Use Drives Engagement in Saving for Retirement 57
When asked to rank the top five changes they would like to see from their providers, the top responses were: add/enhance plan sponsor website/tools (66%), improve communications/participant education (66%), add/enhance participant site/tools (63%), improve participant readiness for retirement (62%), and improve participant experience (57%) [Exhibit 8.11].
Exhibit 8.11. Select the top 5 changes/improvements that your record keeper could make in the order of importance, with 1 being the most important and 5 being the least important.
1 2 3 4 5
Reduce direct fees to plan sponsor 11% 9% 7% 5% 11%
Offer investment options with low-er fees and/or better performance
9% 5% 8% 8% 5%
Add/enhance plan sponsor website and tools
16% 14% 13% 11% 12%
Add/enhance participant website and tools
10% 14% 15% 16% 8%
Improve participant experience (enhanced website, expanded call center hours, targeted communi-cations)
11% 11% 12% 11% 12%
Improve participant readiness for retirement
17% 15% 12% 10% 8%
Improve communications/partici-pant education
10% 19% 10% 14% 13%
Products and services for other benefit programs (defined benefit, health and welfare, non-qualified)
1% 1% 3% 2% 5%
Improve accuracy of information 3% 2% 4% 1% 0%
Improve turnaround times for reports and statements
2% 2% 3% 6% 6%
Improve relationship management and responsiveness to plan sponsor inquiries/issues
6% 5% 5% 6% 5%
Fee transparency 4% 3% 6% 9% 8%
Other 1% 1% 0% 2% 6%
n=269
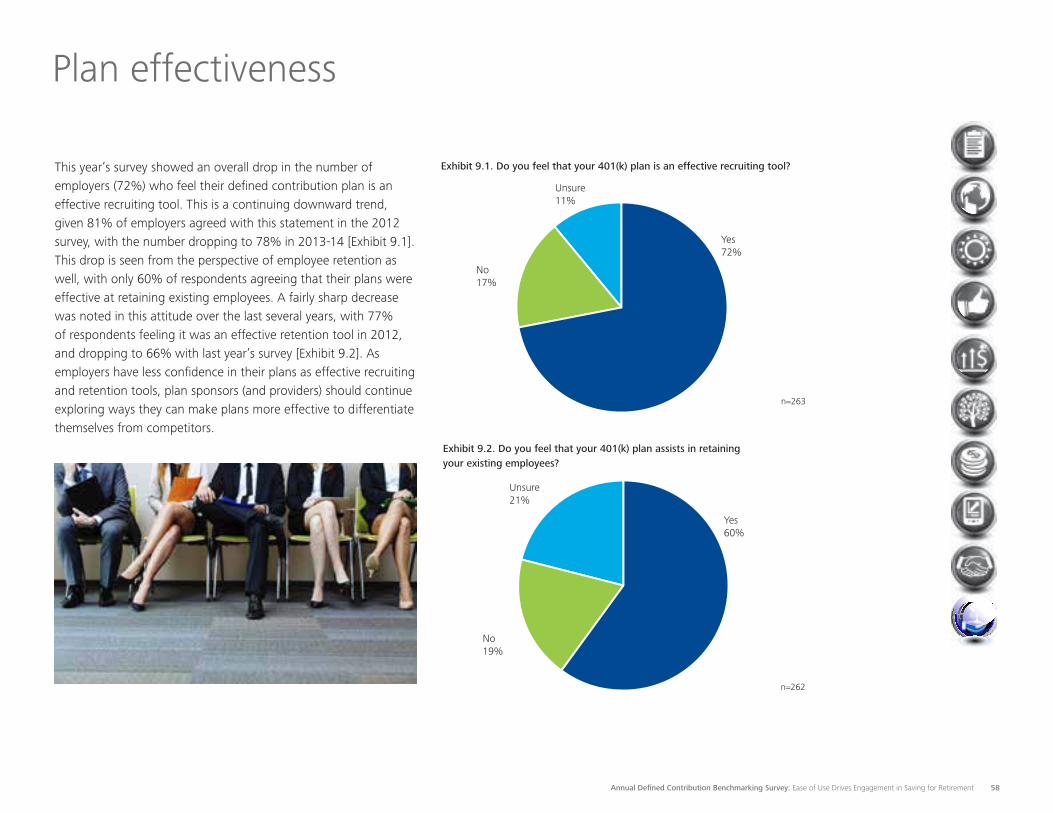
Annual Defined Contribution Benchmarking Survey: Ease of Use Drives Engagement in Saving for Retirement 58
Plan effectiveness
This year’s survey showed an overall drop in the number of employers (72%) who feel their defined contribution plan is an effective recruiting tool. This is a continuing downward trend, given 81% of employers agreed with this statement in the 2012 survey, with the number dropping to 78% in 2013-14 [Exhibit 9.1]. This drop is seen from the perspective of employee retention as well, with only 60% of respondents agreeing that their plans were effective at retaining existing employees. A fairly sharp decrease was noted in this attitude over the last several years, with 77% of respondents feeling it was an effective retention tool in 2012, and dropping to 66% with last year’s survey [Exhibit 9.2]. As employers have less confidence in their plans as effective recruiting and retention tools, plan sponsors (and providers) should continue exploring ways they can make plans more effective to differentiate themselves from competitors.
Exhibit 9.1. Do you feel that your 401(k) plan is an effective recruiting tool?
Exhibit 9.2. Do you feel that your 401(k) plan assists in retaining your existing employees?
Yes 72%
Yes 60%
No19%
Unsure21%
n=263
n=262
No17%
Unsure11%
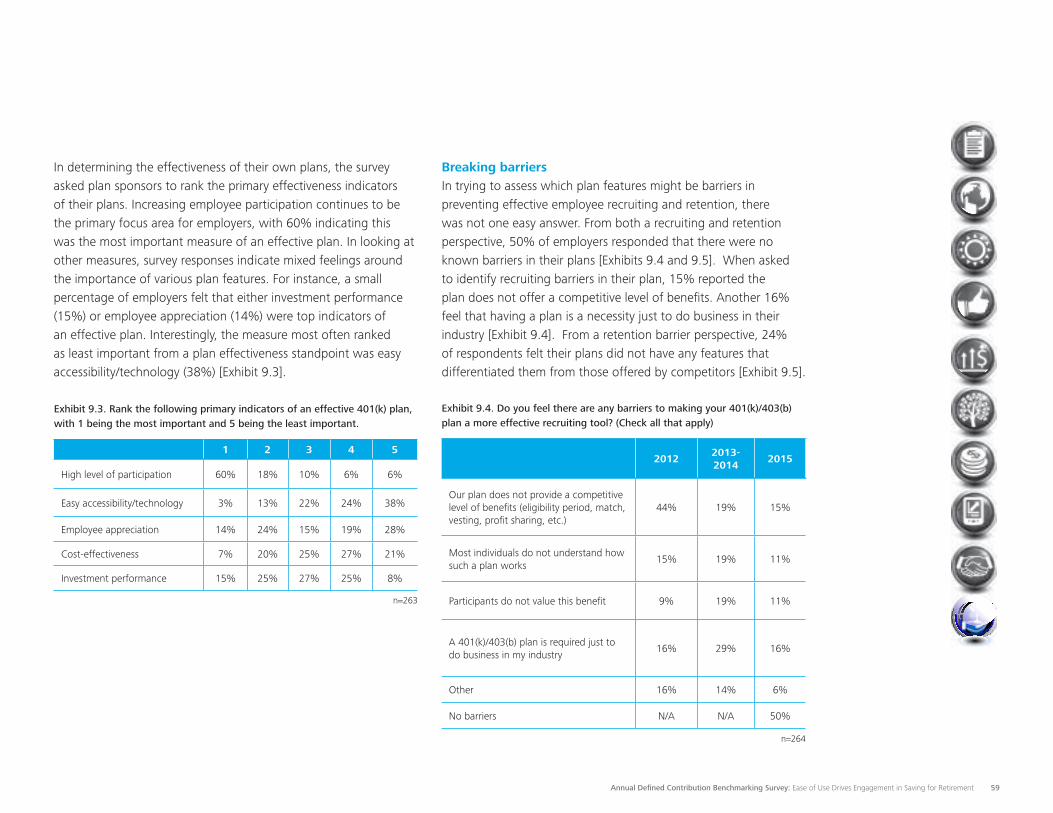
Annual Defined Contribution Benchmarking Survey: Ease of Use Drives Engagement in Saving for Retirement 59
In determining the effectiveness of their own plans, the survey asked plan sponsors to rank the primary effectiveness indicators of their plans. Increasing employee participation continues to be the primary focus area for employers, with 60% indicating this was the most important measure of an effective plan. In looking at other measures, survey responses indicate mixed feelings around the importance of various plan features. For instance, a small percentage of employers felt that either investment performance (15%) or employee appreciation (14%) were top indicators of an effective plan. Interestingly, the measure most often ranked as least important from a plan effectiveness standpoint was easy accessibility/technology (38%) [Exhibit 9.3].
Exhibit 9.3. Rank the following primary indicators of an effective 401(k) plan, with 1 being the most important and 5 being the least important.
1 2 3 4 5
High level of participation 60% 18% 10% 6% 6%
Easy accessibility/technology 3% 13% 22% 24% 38%
Employee appreciation 14% 24% 15% 19% 28%
Cost-effectiveness 7% 20% 25% 27% 21%
Investment performance 15% 25% 27% 25% 8%
n=263
Breaking barriersIn trying to assess which plan features might be barriers in preventing effective employee recruiting and retention, there was not one easy answer. From both a recruiting and retention perspective, 50% of employers responded that there were no known barriers in their plans [Exhibits 9.4 and 9.5]. When asked to identify recruiting barriers in their plan, 15% reported the plan does not offer a competitive level of benefits. Another 16% feel that having a plan is a necessity just to do business in their industry [Exhibit 9.4]. From a retention barrier perspective, 24% of respondents felt their plans did not have any features that differentiated them from those offered by competitors [Exhibit 9.5].
Exhibit 9.4. Do you feel there are any barriers to making your 401(k)/403(b) plan a more effective recruiting tool? (Check all that apply)
20122013-2014
2015
Our plan does not provide a competitive level of benefits (eligibility period, match, vesting, profit sharing, etc.)
44% 19% 15%
Most individuals do not understand how such a plan works
15% 19% 11%
Participants do not value this benefit 9% 19% 11%
A 401(k)/403(b) plan is required just to do business in my industry
16% 29% 16%
Other 16% 14% 6%
No barriers N/A N/A 50%
n=264
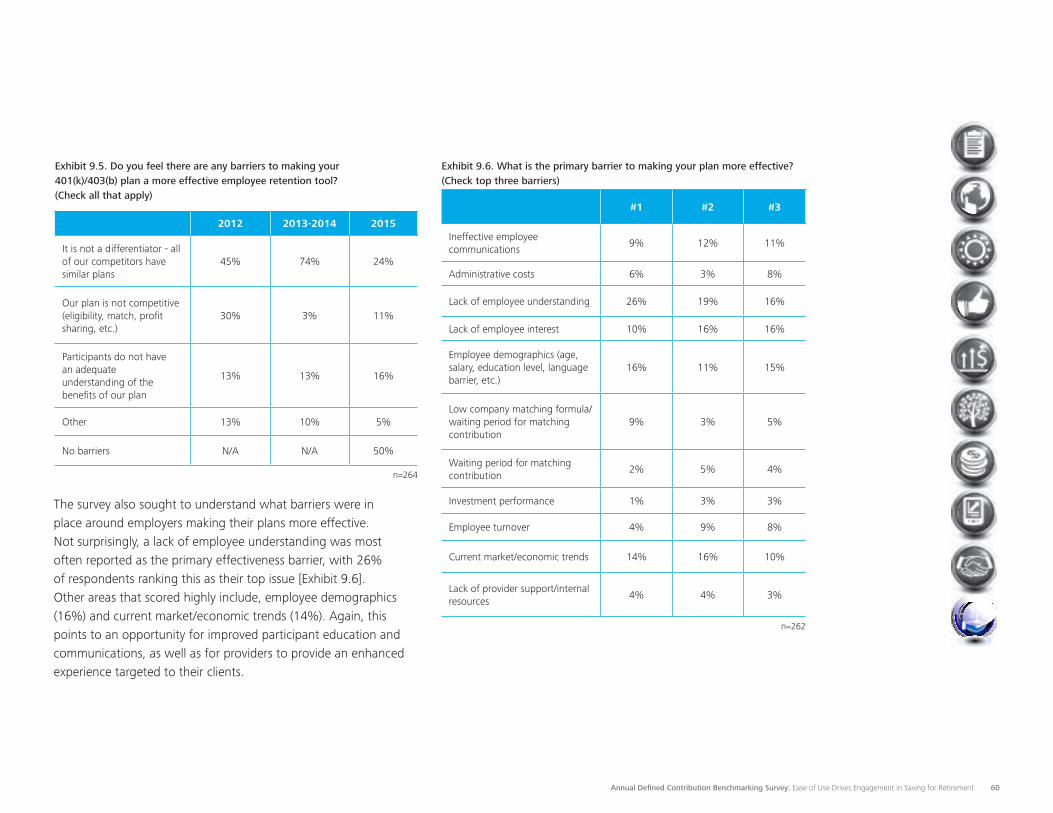
Annual Defined Contribution Benchmarking Survey: Ease of Use Drives Engagement in Saving for Retirement 60
Exhibit 9.5. Do you feel there are any barriers to making your 401(k)/403(b) plan a more effective employee retention tool? (Check all that apply)
2012 2013-2014 2015
It is not a differentiator - all of our competitors have similar plans
45% 74% 24%
Our plan is not competitive (eligibility, match, profit sharing, etc.)
30% 3% 11%
Participants do not have an adequate understanding of the benefits of our plan
13% 13% 16%
Other 13% 10% 5%
No barriers N/A N/A 50%
n=264
The survey also sought to understand what barriers were in place around employers making their plans more effective. Not surprisingly, a lack of employee understanding was most often reported as the primary effectiveness barrier, with 26% of respondents ranking this as their top issue [Exhibit 9.6]. Other areas that scored highly include, employee demographics (16%) and current market/economic trends (14%). Again, this points to an opportunity for improved participant education and communications, as well as for providers to provide an enhanced experience targeted to their clients.
Exhibit 9.6. What is the primary barrier to making your plan more effective?(Check top three barriers)
#1 #2 #3
Ineffective employee communications
9% 12% 11%
Administrative costs 6% 3% 8%
Lack of employee understanding 26% 19% 16%
Lack of employee interest 10% 16% 16%
Employee demographics (age, salary, education level, language barrier, etc.)
16% 11% 15%
Low company matching formula/waiting period for matching contribution
9% 3% 5%
Waiting period for matching contribution
2% 5% 4%
Investment performance 1% 3% 3%
Employee turnover 4% 9% 8%
Current market/economic trends 14% 16% 10%
Lack of provider support/internal resources
4% 4% 3%
n=262
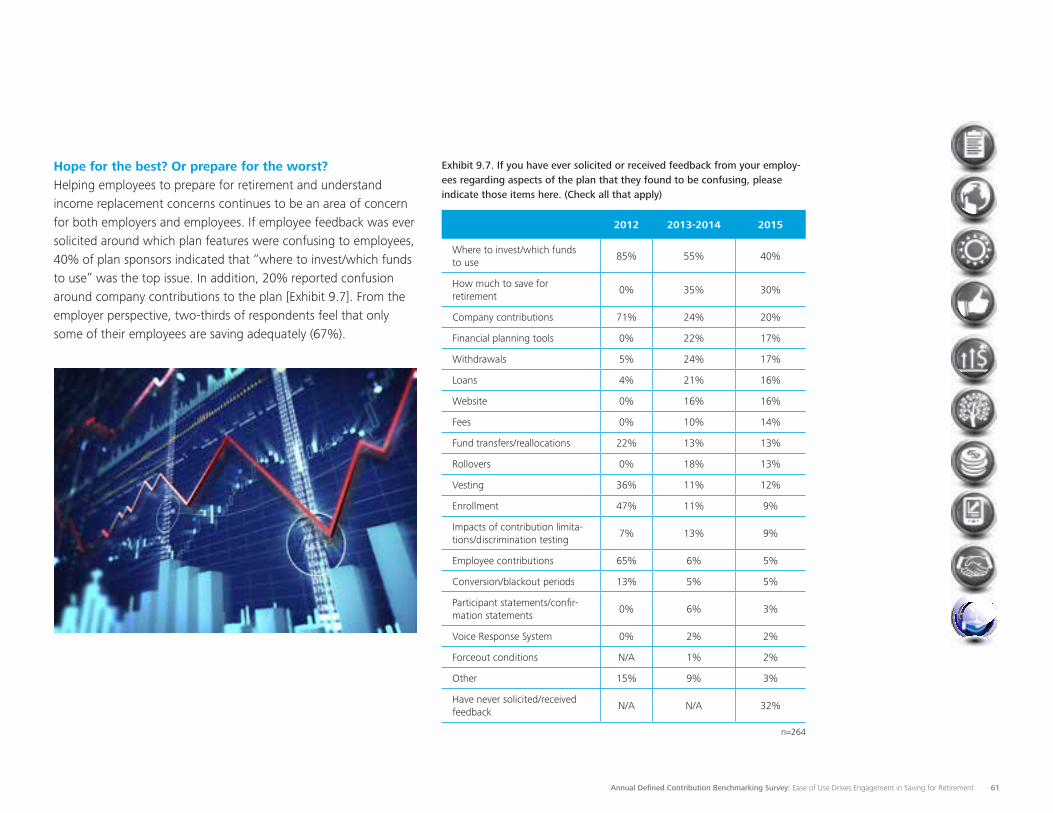
Annual Defined Contribution Benchmarking Survey: Ease of Use Drives Engagement in Saving for Retirement 61
Hope for the best? Or prepare for the worst?Helping employees to prepare for retirement and understand income replacement concerns continues to be an area of concern for both employers and employees. If employee feedback was ever solicited around which plan features were confusing to employees, 40% of plan sponsors indicated that “where to invest/which funds to use” was the top issue. In addition, 20% reported confusion around company contributions to the plan [Exhibit 9.7]. From the employer perspective, two-thirds of respondents feel that only some of their employees are saving adequately (67%).
Exhibit 9.7. If you have ever solicited or received feedback from your employ-ees regarding aspects of the plan that they found to be confusing, please indicate those items here. (Check all that apply)
2012 2013-2014 2015
Where to invest/which funds to use
85% 55% 40%
How much to save for retirement
0% 35% 30%
Company contributions 71% 24% 20%
Financial planning tools 0% 22% 17%
Withdrawals 5% 24% 17%
Loans 4% 21% 16%
Website 0% 16% 16%
Fees 0% 10% 14%
Fund transfers/reallocations 22% 13% 13%
Rollovers 0% 18% 13%
Vesting 36% 11% 12%
Enrollment 47% 11% 9%
Impacts of contribution limita-tions/discrimination testing
7% 13% 9%
Employee contributions 65% 6% 5%
Conversion/blackout periods 13% 5% 5%
Participant statements/confir-mation statements
0% 6% 3%
Voice Response System 0% 2% 2%
Forceout conditions N/A 1% 2%
Other 15% 9% 3%
Have never solicited/received feedback
N/A N/A 32%
n=264
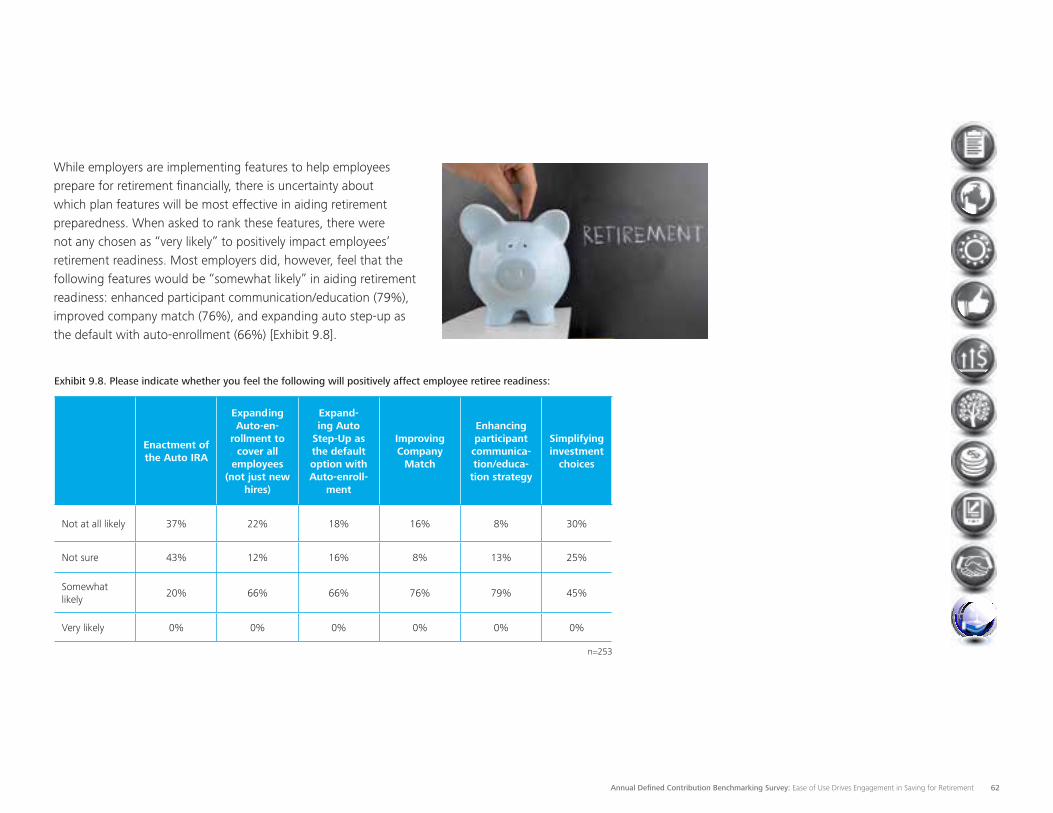
Annual Defined Contribution Benchmarking Survey: Ease of Use Drives Engagement in Saving for Retirement 62
While employers are implementing features to help employees prepare for retirement financially, there is uncertainty about which plan features will be most effective in aiding retirement preparedness. When asked to rank these features, there were not any chosen as “very likely” to positively impact employees’ retirement readiness. Most employers did, however, feel that the following features would be “somewhat likely” in aiding retirement readiness: enhanced participant communication/education (79%), improved company match (76%), and expanding auto step-up as the default with auto-enrollment (66%) [Exhibit 9.8].
Exhibit 9.8. Please indicate whether you feel the following will positively affect employee retiree readiness:
Enactment of the Auto IRA
Expanding Auto-en-
rollment to cover all
employees (not just new
hires)
Expand-ing Auto
Step-Up as the default option with Auto-enroll-
ment
Improving Company
Match
Enhancing participant
communica-tion/educa-
tion strategy
Simplifying investment
choices
Not at all likely 37% 22% 18% 16% 8% 30%
Not sure 43% 12% 16% 8% 13% 25%
Somewhat likely
20% 66% 66% 76% 79% 45%
Very likely 0% 0% 0% 0% 0% 0%
n=253
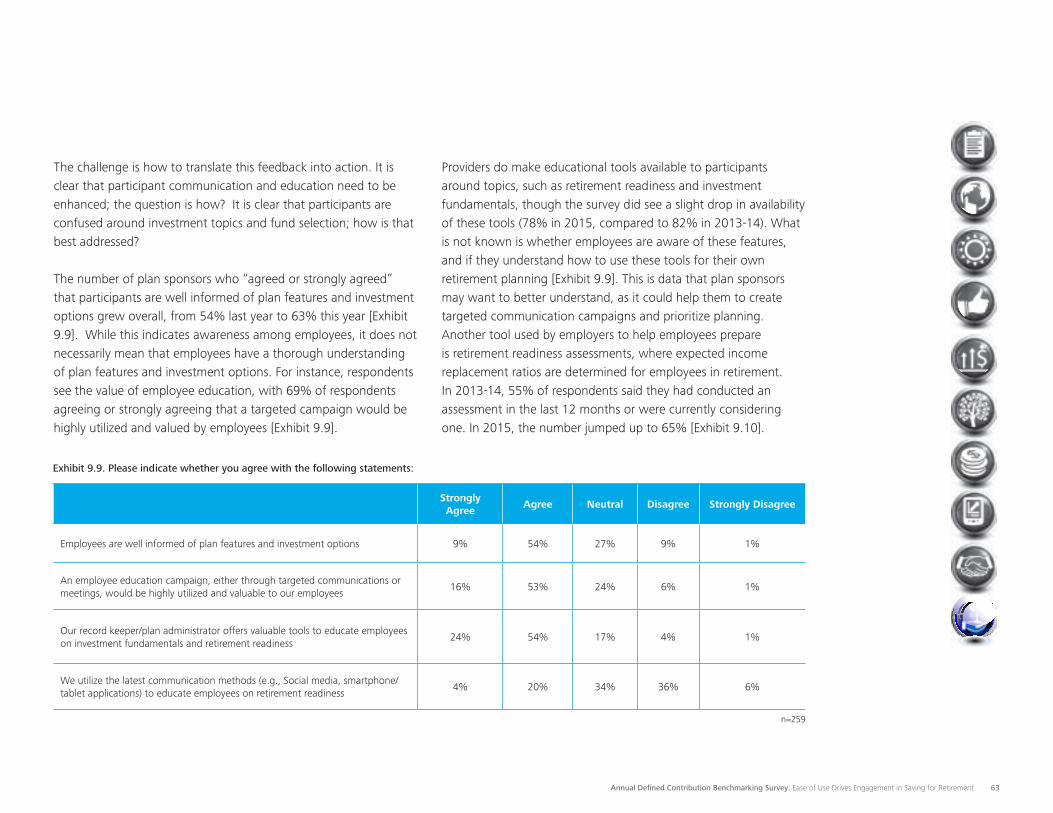
Annual Defined Contribution Benchmarking Survey: Ease of Use Drives Engagement in Saving for Retirement 63
The challenge is how to translate this feedback into action. It is clear that participant communication and education need to be enhanced; the question is how? It is clear that participants are confused around investment topics and fund selection; how is that best addressed?
The number of plan sponsors who “agreed or strongly agreed” that participants are well informed of plan features and investment options grew overall, from 54% last year to 63% this year [Exhibit 9.9]. While this indicates awareness among employees, it does not necessarily mean that employees have a thorough understanding of plan features and investment options. For instance, respondents see the value of employee education, with 69% of respondents agreeing or strongly agreeing that a targeted campaign would be highly utilized and valued by employees [Exhibit 9.9].
Providers do make educational tools available to participants around topics, such as retirement readiness and investment fundamentals, though the survey did see a slight drop in availability of these tools (78% in 2015, compared to 82% in 2013-14). What is not known is whether employees are aware of these features, and if they understand how to use these tools for their own retirement planning [Exhibit 9.9]. This is data that plan sponsors may want to better understand, as it could help them to create targeted communication campaigns and prioritize planning. Another tool used by employers to help employees prepare is retirement readiness assessments, where expected income replacement ratios are determined for employees in retirement. In 2013-14, 55% of respondents said they had conducted an assessment in the last 12 months or were currently considering one. In 2015, the number jumped up to 65% [Exhibit 9.10].
Exhibit 9.9. Please indicate whether you agree with the following statements:
Strongly Agree
Agree Neutral Disagree Strongly Disagree
Employees are well informed of plan features and investment options 9% 54% 27% 9% 1%
An employee education campaign, either through targeted communications or meetings, would be highly utilized and valuable to our employees
16% 53% 24% 6% 1%
Our record keeper/plan administrator offers valuable tools to educate employees on investment fundamentals and retirement readiness
24% 54% 17% 4% 1%
We utilize the latest communication methods (e.g., Social media, smartphone/tablet applications) to educate employees on retirement readiness
4% 20% 34% 36% 6%
n=259
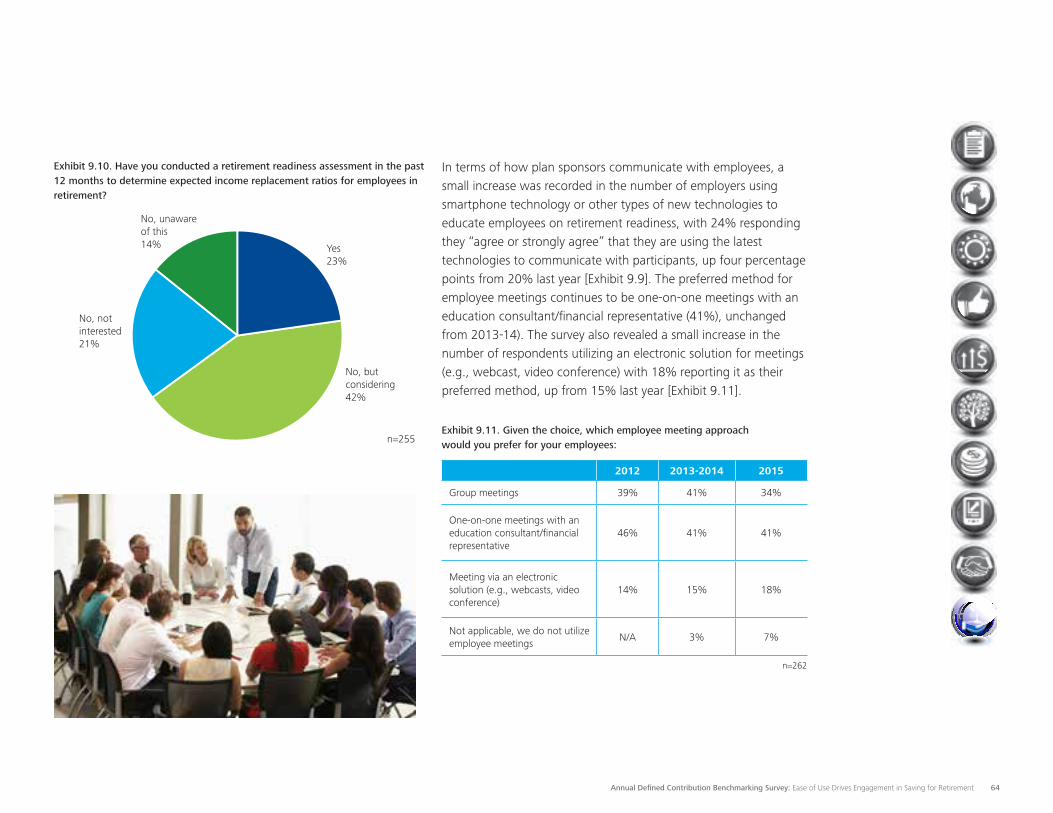
Annual Defined Contribution Benchmarking Survey: Ease of Use Drives Engagement in Saving for Retirement 64
Exhibit 9.10. Have you conducted a retirement readiness assessment in the past 12 months to determine expected income replacement ratios for employees in retirement?
Yes23%
No, but considering42%
n=255
No, not interested21%
No, unaware of this14%
In terms of how plan sponsors communicate with employees, a small increase was recorded in the number of employers using smartphone technology or other types of new technologies to educate employees on retirement readiness, with 24% responding they “agree or strongly agree” that they are using the latest technologies to communicate with participants, up four percentage points from 20% last year [Exhibit 9.9]. The preferred method for employee meetings continues to be one-on-one meetings with an education consultant/financial representative (41%), unchanged from 2013-14). The survey also revealed a small increase in the number of respondents utilizing an electronic solution for meetings (e.g., webcast, video conference) with 18% reporting it as their preferred method, up from 15% last year [Exhibit 9.11].
Exhibit 9.11. Given the choice, which employee meeting approach would you prefer for your employees:
2012 2013-2014 2015
Group meetings 39% 41% 34%
One-on-one meetings with an education consultant/financial representative
46% 41% 41%
Meeting via an electronic solution (e.g., webcasts, video conference)
14% 15% 18%
Not applicable, we do not utilize employee meetings
N/A 3% 7%
n=262
Survey acknowledgements and sponsors
Sponsored jointly by Deloitte Consulting LLP, the International Foundation of Employee Benefit Plans, and the International Society of Certified Employee Benefit Specialists, the Annual Defined Contribution Benchmarking Survey measures the essential aspects of DC plans for major U.S. companies. Our sincere appreciation goes to the 398 companies and their executives who contributed their time and information to this survey.
The statements in this report reflect our analysis of survey respondents and are not intended to reflect facts or opinions of any other entities. All survey data and statistics referenced and presented, as well as the representations made and opinions expressed, unless specifically described otherwise, pertain only to the participating organizations and their responses to the Deloitte survey.
For questions and additional information about Deloitte and the Annual Defined Contribution Survey, please contact:
Stacy SandlerPrincipalDeloitte Consulting [email protected]
Cheryl OuelletteSpecialist MasterDeloitte Consulting [email protected]
Sarah TrowbridgeManagerDeloitte Consulting [email protected]
About the International Foundation of Employee Benefit Plans The International Foundation of Employee Benefit Plans is the premier educational organization dedicated to providing the diverse employee benefits community with objective, solution-oriented education, research and information to ensure the health and financial security of plan beneficiaries worldwide. Total membership includes 33,000 individuals representing multiemployer trust funds, corporations, public employer groups and professional advisory firms throughout the United States and Canada. Each year, the International Foundation offers over 100 educational programs, including conferences and e-learning courses. Membership provides access to personalized research services and daily news delivery. The International Foundation sponsors the Certified Employee Benefit Specialist® (CEBS®) program in conjunction with the Wharton School of the University of Pennsylvania and Dalhousie University in Canada.
For more information, please visit the International Foundation website at www.ifebp.org.
About the International Society of Certified Employee Benefit Specialists The International Society of Certified Employee Benefit Specialists is a nonprofit educational association providing continuing education opportunities for those who hold or are pursuing the Certified Employee Benefit Specialist (CEBS)®, Compensation Management Specialist (CMS), Group Benefits Associate (GBA) or Retirement Plan Associate (RPA) offered through the CEBS® program.
Visit the Society website at www.iscebs.org.
This publication contains general information only and is based on the experiences and research of Deloitte practitioners. Deloitte is not, by means of this publication, rendering business, financial, investment, or other professional advice or services. This publication is not a substitute for such professional advice or services, nor should it be used as a basis for any decision or action that may affect your business. Before making any decision or taking any action that may affect your business, you should consult a qualified professional advisor. Deloitte, its affiliates, and related entities shall not be responsible for any loss sustained by any person who relies on this publication.
Copyright © 2015 Deloitte Development LLC. All rights reserved.Member of Deloitte Touche Tohmatsu Limited


