112
ANNUAL REPORT 2001 CONSISTENT CHANGE

ANN
UAL
REP
OR
T 20
01
ANNUAL REPORT 2001
CONSISTENTCHANGE
KEY DATA FOR THE GROUP ACCORDING TO US GAAP
Change
2001 2000 %
PROFIT AND LOSS ACCOUNT
Net sales million € 1,147.9 1,072.5 7.0
EBIT million € 67.1 54.0 24.3
EBITDA million € 111.9 82.5 35.6
Net income million € 14.3 11.7 22.2
Income before taxes million € 36.5 26.2 39.3
Cash flow million € 67.7 39.6 71.0
Research and development expenses million € 48.5 46.5 4.3
BALANCE SHEET
Equity million € 268.8 263.5 2.0
Capital expenditures million € 58.1 32.3 79.9
Balance sheet total million € 931.4 859.6 8.4
EMPLOYEES
Number of employees on balance sheet date * 5,488 5,558 (1.8)
Personnal expenses million € 277.3 269.8 2.8
* including trainees
65.563.254.6
68.461.9
36.834.5
31.6
45.438.1
Net sales, Germany (%)
Net sales, abroad (%)
NET SALES (million €)
65.569.7
70.668.9
66.5
30.334.5
31.1
29.433.5
97 98 99 00 01
564 493 580 643 750 979 1,108 1,038 1,073 1,148
92 93 94 95 96
CONTACT
CLAAS KGaA mbH
P.O. Box 1163
Münsterstrasse 33
D-33426 Harsewinkel
Germany
www.claas.com
This annual report is available in German
and English. Both versions may be down-
loaded on the Internet at www.claas.com
Additional copies of this report and further
information about CLAAS are available
free of charge on request.
Tel.: (05247) 12-1555
Fax: (05247) 12-1751
E-mail: [email protected]
Your contacts for any questions:
CORPORATE COMMUNICATION
Tel.: (05247) 12-1555
Fax: (05247) 12-1751
E-mail: [email protected]
INVESTOR RELATIONS
Tel.: (05247) 12-1583
Fax: (05247) 12-1664
E-mail: [email protected]
CONCEPT & DESIGN
Kirchhoff Consult AG
Hamburg
DEFINITIONS
Return on sales = Income before taxes
Net sales
EBIT = Net income + taxes on income + interest expense + profit transferred under
a partial profit transfer agreement (CMG) + remuneration profit participation rights
EBITDA = EBIT + depreciation of tangible assets + amortization of intangible assets
Return on equity =Net income
Equity
Return on total capital employed =EBIT
Balance sheet total
Cashflow according to DVFA/SG = Net income + depreciation of tangible assets + amortization of intangible assets
+/- changes of pension provisions and other long-term provisions +/-
other expenses/ income without cash flow impact
Equity ratio =Equity
Balance sheet total
First-degree liquidity =Liquidity
Short-term liabilities
Equity to fixed assets ratio =Equity, funds similar to equity and long-term liabilities
Fixed assets
Working capital = Inventories ./. advance payments received +/- accounts receivable/ trade payables +/-
accounts receivable/payable to investments or associates +/- notes receivable/
notes payable

ANN
UAL
REP
OR
T 20
01
ANNUAL REPORT 2001
CONSTANCYIN CHANGE
KEY DATA FOR THE GROUP ACCORDING TO US GAAP
Change
2001 2000 %
PROFIT AND LOSS ACCOUNT
Net sales million € 1,147.9 1,072.5 7.0
EBIT million € 67.1 54.0 24.3
EBITDA million € 111.9 82.5 35.6
Net income million € 14.3 11.7 22.2
Income before taxes million € 36.5 26.2 39.3
Cash flow million € 67.7 39.6 71.0
Research and development expenses million € 48.5 46.5 4.3
BALANCE SHEET
Equity million € 268.8 263.5 2.0
Capital expenditures million € 58.1 32.3 79.9
Balance sheet total million € 931.4 859.6 8.4
EMPLOYEES
Number of employees on balance sheet date * 5,488 5,558 (1.8)
Personnal expenses million € 277.3 269.8 2.8
* including trainees
65.563.254.6
68.461.9
36.834.5
31.6
45.438.1
Net sales, Germany (%)
Net sales, abroad (%)
NET SALES (million €)
65.569.7
70.668.9
66.5
30.334.5
31.1
29.433.5
97 98 99 00 01
564 493 580 643 750 979 1,108 1,038 1,073 1,148
92 93 94 95 96
CONTACT
CLAAS KGaA mbH
P.O. Box 1163
Münsterstrasse 33
D-33426 Harsewinkel
Germany
www.claas.com
This annual report is available in German
and English. Both versions may be down-
loaded on the Internet at www.claas.com
Additional copies of this report and further
information about CLAAS are available
free of charge on request.
Tel.: (05247) 12-1555
Fax: (05247) 12-1751
E-mail: [email protected]
Your contacts for any questions:
CORPORATE COMMUNICATION
Tel.: (05247) 12-1555
Fax: (05247) 12-1751
E-mail: [email protected]
INVESTOR RELATIONS
Tel.: (05247) 12-1583
Fax: (05247) 12-1664
E-mail: [email protected]
LAYOUT & DESIGN
Kirchhoff Consult AG
Hamburg
DEFINITIONS
Return on sales = Income before taxes
Net sales
EBIT = Net income + taxes on income + interest expense + profit transferred under
a partial profit transfer agreement (CMG) + remuneration profit participation rights
EBITDA = EBIT + depreciation of tangible assets + amortization of intangible assets
Return on equity =Net income
Equity
Return on total capital employed =EBIT
Balance sheet total
Cashflow according to DVFA/SG = Net income + depreciation of tangible assets + amortization of intangible assets
+/- changes of pension provisions and other long-term provisions +/-
other expenses/ income without cash flow impact
Equity ratio =Equity
Balance sheet total
First-degree liquidity =Liquidity
Short-term liabilities
Equity to fixed assets ratio =Equity, funds similar to equity and long-term liabilities
Fixed assets
Working capital = Inventories ./. advance payments received +/- accounts receivable/ trade payables +/-
accounts receivable/payable to investments or associates +/- notes receivable/
notes payable

SEGMENTS OF THE CLAAS GROUP
AGRICULTURAL ENGINEERING
Agricultural engineering is CLAAS’ core
business. In Europe, we are the undispu-
ted market leader for our main products,
combine harvesters and self-propelled
forage harvesters. Our world market share
of combine harvesters is 17%. Almost
every other self-propelled forage harve-
ster sold in the world comes from Harse-
winkel. CLAAS also holds top market
shares in the baler and green harvest
machinery product lines.
NET SALES (million €)
EBIT (million €)
1,058 990 56.4 44.2
01 00 01 00
PRODUCTION ENGINEERING
Sophisticated production engineering
comes from our subsidiary, CLAAS
Fertigungstechnik GmbH. This company,
based in Beelen, Westphalia, with subsidi-
aries in Baden-Württemberg and the UK,
has specialist expertise in the area of spe-
cial machinery and toolmaking. Among
other things, it develops and manufactu-
res complete transfer lines and production
lines for groups in the automotive and
aviation industries.
NET SALES (million €)
EBIT (million €)
75 71 4.2 2.8
01 00 01 00
INDUSTRIAL ENGINEERING
CLAAS Industrietechnik GmbH is the
system supplier of drive assemblies and
hydraulic components within the CLAAS
Group. Ultra-modern transmissions and
axles for mobile machines, both within
the Group itself and (increasingly) for the
international construction machinery and
commercial vehicle sector, are developed
and produced at the Paderborn factory.
NET SALES (million €)
EBIT (million €)
106 96 6.6 3.5
01 00 01 00
PRODUCT OVERVIEW
COMBINE HARVESTERS
GREEN HARVEST MACHINERY
FORAGE HARVESTERS
TELESCOPIC LOADERS SPECIAL PRODUCTS
BALERS INDUSTRIAL ENGINEERING/PRODUCTION ENGINEERING

2 Management
4 Preface
8 »Consistent Change«
MARKET 10 POSITIONING 16 EMPLOYEES 22 ENVIRONMENT 26 STRATEGY 28
32 CLAAS on the Capital Market
38 History
40 Report of the Supervisory Board
42 Management report and consolidated financial statements (US GAAP)
(detailed directory at page 43)
98 The CLAAS-Group
100 Overview 1995-2001
101 Product overview
MISSION STATEMENT
The human race is expanding by the hour. Feeding the world’s population is a global
and so far unsolved challenge. In that respect, agriculture is the most vital and at
the same time the oldest industry in the world. Professional cultivation of the soil
began long before our era. Today, there are 6 billion people in the world; only 20
years from now, the figure will be 8 billion. Arable land is limited, and is set to
become a bottleneck factor.
To meet the demand for nutrition and at the same time in order to farm the land in a
sustainable, ecologically and environmentally sound way, the world economy needs
sophisticated agricultural machinery and expert know-how. As the market and tech-
nological leader in agricultural machines, CLAAS may be regarded as a pioneer of
this vital process. We provide the international agricultural industry with machines
of a quality and technical performance that set standards – in order to continue feed-
ing people in future.

2
MANAGEMENT

NIKOLAUS FEIL_
3
FINANCE AND CONTROLLING/MERGERS & ACQUISITIONS
Born 1958, Business graduate, international career in banking and finance with a US bank,
Finance Manager of a leading global trading company, responsible for Finance at CLAAS
since 1993.
RÜDIGER A. GÜNTHER_
SALES/MARKETING AND PERSONNEL
Born 1952, studied philology (senior master), company trainee, distribution and logistics
management, Executive in charge of materials management, logistics, sales in the steel indu-
stry, Marketing Director of an elevator manufacturer, Marketing Manager at CLAAS since 1998.
MARTIN RICHENHAGEN_
RESEARCH & DEVELOPMENT
Born 1951, held research and teaching posts at Braunschweig Technical University
(Agricultural Machinery Institute), Development Manager for combine harvesters,
self-propelled forage harvesters and tractors, R & D Manager with CLAAS since 1999.
PRODUCTION
Born 1944, Engineering graduate, Factory Manager at an automotive group’s central
plant, developed an automotive plant in South America, in charge of Production at all
CLAAS factories since 2000.
DR. ING. HERMANN GARBERS_

4 PREFACE
LADIES AND GENTLEMEN,
»Consistent change« is our motto for the annual report for fiscal year 2001. We have learned
that only those who are capable of change achieve their goals via the fastest route. Agricultural
engineering is undergoing dramatic transformations in its core markets and constantly evolving
through of mergers and completely new trading dynamics. Changes in underlying conditions
require continuous adaptation by the Group. Those who react to the radical changes in the
markets only after they have occurred are waiting far too long. We see consistent change as
an opportunity. We wish to be at the forefront.
CLAAS emerged stronger than ever from the crises which afflicted the agricultural economy
in the year under review, and posted significant growth. The robust condition of the Group is
measured against an environment characterized by declining sales in agricultural engineering.
In addition to the general economic slowdown, the markets were supressed by sustained low
prices for grain as well as the effects of BSE and foot-and-mouth. The sales development in the
German agricultural engineering sector in the first six months of 2001 illustrates the difficult
situation. Domestic revenues fell by 17%. Across Europe, sales in this sector dropped by
approximately 10%.
Development at CLAAS clearly bucked this market trend. We not only achieved but, for the
most part, even surpassed our planned goals. Sales of € 1.148 billion set a new record. Growth
was 7%. The result before income taxes improved by 40% to € 36.5 million, reflecting the
considerable efforts to reduce costs. Inventories were again € 12.7 million below last year´s
low levels.
The positive figures hide a variety of developments. Growth was based first and foremost on
the good performance of our core products, the combine harvester and the self-propelled forage
harvester, which achieved noteworthy sales growth. The already high market share in the com-
bine harvester segment in Germany rose to over 44%, while in Western Europe it rose by 2 per-
centage points to nearly 36%. In the forage harvester segment, we have consolidated our world-
wide market leadership with a share of approximately 50%. We had to increase the total pro-
duction planned for 2001 in stages by 500 to a total of 4,800 self-propelled harvesters.

5
The absorptive capacity of the markets varied from region to region. The overall market decline
of more than 25% in France contrasted with considerable sales increases in Central and Eastern
Europe. The German market and most of the West European markets proved to be stable to a
large degree. Foot-and-mouth disease and BSE influenced the baler and forage harvest machin-
ery segment only slightly for the year overall.
The development of our Group demonstrates that we made the right decisions early to secure
our future and are on the right path. Unlike our competitors CLAAS is investing even in econo-
mic downturns.
The newly defined Group architecture, with its flexible, independent units, has further increased
our reactive capabilities as well as our efficiency. We do not rely on conventional solutions,
but search for new and innovative approaches throughout all company divisions. This applies
to product development, production, sales and marketing, and finance. This strategy has made
CLAAS the leader in the market as well as in technology.
The changes that we are implementing throughout the Group are not changing our strategy, but
driving it forward. We are a globally active company, customer-oriented and easily accessible to
our customers everywhere. We take care of our customers with well-designed service and spare
parts systems throughout the world. Our regional focus is on Europe as well as North and South
America. At the same time, we are looking at the potential for growth in the densely populated
regions of Asia. Our customer-oriented service includes financing tailored specifically to our cus-
tomers’ needs. Through CLAAS Financial Services (CFS), which now serves the Polish market
as well as many West European countries, we secure local financing for CLAAS customers.

6 PREFACE
The development of innovative financing instruments is an important part of our growth strat-
egy. Effective financial management is closely connected to the potential of our markets; ex-
ploitation of which can lead us to exceed our operative capital requirements. Asset-backed
financing (ABS), introduced last year, has completely fulfilled expectations with regard to
the improvement of short-term liquidity and balance sheet structure. Being a global market
leader in a cyclical market environment and a company listed on the debt capital market, we
maintain close relationships with our investors. The annual report you are presently reading is
the 25th in our history. It will contribute to making the workings of CLAAS even more transpa-
rent. It enables investors and analysts to compare our financial reporting with regard to content
and currency with international capital market standards. With the present financial statement
we have converted Group accounting to US GAAP format and published a consolidated financial
statement with a discharging effect.
We have high expectations for the future. One sign of our optimism are the extensive investment
programs we have undertaken to secure our market and technological leadership as well as to
improve quality. All projects are integrated in a program which should increase efficiency for
our customers as well as operational efficiency in our plants. We have set a new record with our
planned capital expenditures of € 141 million for the new fiscal year. The primary focus thereby
is on the remodeling of the plant in Harsewinkel, but also on the structural renovation of the
plant in Bad Saulgau. We will also increase the budget for research and development. The con-
version of internal information processing to the SAP R/3 system will make our operating
processes even more efficient. System migration starting in autumn of 2002 will occasionally
increase workload in the organization.
We are quietly confident with the outlook for the new fiscal year. The tendency to invest in
agriculture is slightly better since the crises have abated. Our new products will create additional
stimuli. Current cash resources of well over one third of a billion euros provides us with financi-
al flexibility and ensures entrepreneurial independence in a sector which is highly concentrated
worldwide.
7
Our management and employees are well prepared to react decisively to unforeseeable events.
The lean organization of cooperative management introduced in June 2001 takes the different
requirements of research and development, production, finance, sales and marketing into
account and leads to pragmatic solutions. The guiding principles practised are cooperation,
the ability to give and receive constructive criticism, teamwork, and open communication.
The expanded definition of cooperative management also includes employee participation in
the decision-making process. In a globally active company, it is the organization of employee
cooperation which determines success. The cornerstones of such a global organization are
trust and independence.
At this point we would like to thank our employees for their hard work and their help us to
achieve our company goals. We extend our thanks to our customers, dealers and importers,
suppliers and other business partners. Your continued confidence is foundation of our work.
Last but not least, we thank our shareholders and their comitees for their constructive input
during the year.
Best regards,
DR. ING. HERMANN GARBERS NIKOLAUS FEIL
RÜDIGER A. GÜNTHER MARTIN RICHENHAGEN


Planning horizons are getting shorter all the time. Cus-
tomers’ expectations and the competition are changing ever
more rapidly. The ability to react swiftly to new develop-
ments and demands is essential for growth and secure
employment.
CONSISTENT CHANGE

10 MARKET POSITIONING EMPLOYEES ENVIRONMENT STRATEGY
• Agricultural engineering has been and is a vital growth sector
• The opening up of new markets calls for specific concepts
and processes
• Electronics and information technology are driving
development of innovative products
• Our strategy in agricultural engineering is:
Think global, act local
• We know the trends on our markets because we have
many years of experience and expertise
WE KNOWTHE GLOBAL
AGRICULTURAL ENGINEERING MARKET

11
FEEDING THE WORLD – A GLOBAL CHALLENGE
MORE AND MORE PEOPLE...
The human race is expanding by the hour. Today, there are over 6 billion people in the world;
in 12 years’ time, the figure will be 7 billion. This increase is accompanied by a change in nutri-
tional habits. The population explosion and improved standards of living are pushing up demand
for cereals and meat, a trend which is more marked in the developed industrialized countries
than in developing countries. According to FAO estimates, annual per capita cereal consumption
in the industrialized countries will rise from 572 kg at present to 615 kg by the year 2015, with
meat consumption rising from 87 kg to 94 kg. In the developing countries, per capita cereal
consumption over the same period is set to grow from 249 kg to 268 kg, and that of meat from
23 kg to 30 kg.
...AND LESS AND LESS LAND
The agricultural acreage available to meet the demand cannot be increased significantly. World-
wide, approximately 1 billion hectares of land are currently used for agriculture. Without increas-
ing harvest yields, almost 4 billion hectares would need to be available by 2050. However, farm
land is no longer a ubiquitous resource. The belief that it could be endlessly increased has been
dissipated certainly since the huge land losses in the US Midwest in the early nineteen-twenties.
A careless attitude to the land allows wind and water to erode and carry away the arable topsoil,
until in the end it can no longer be used for farming.
Erosion is a virulent problem. All the continents are now in the grip of advancing desertification.
10 million hectares of fertile farmland are lost every year – equivalent to the area of Bavaria and
Baden-Württemberg together. The growing world population calls for more intensive agriculture,
which in turn takes more and more out of the soil. The fallow period, part of the natural regen-
erative cycle in times past, has today been omitted from the crop rotation cycle.
The LEXION is the world’s most
powerful combine harvester,
with a throughput of over
40 tonnes of wheat per hour.

12 MARKET POSITIONING EMPLOYEES ENVIRONMENT STRATEGY
THE RACE BETWEEN THE STORK AND THE PLOUGH
The only way to guarantee a food supply for the world’s population and improve living standards
at the same time is to achieve sizeable harvest productivity increases and to treat the sensitive
system that is the land with respect. Mechanized agriculture, in the form of tractors and other
machines, runs over the soil time and time again, compressing and compacting it. The race
between the stork and the plough, or between more population and more food production, will
be decided by responsible, efficient farming practices. Agricultural engineering, which supplies
international agriculture with the machinery it needs, will thus continue to be a vital growth
sector for a long time to come.
A CHANGING AGRO INDUSTRY
The world agricultural industry has been undergoing a process of structural change for years.
In particular, it has to withstand growing pressure from the food industry, which in turn is
feeling the effects of concentration on the distribution side. Four trends are pushing ahead
the structural change in agriculture:
• an on-going process of concentration into larger units, in order to utilize economies of scale;
• increasing mechanization;
• a move away from the traditional farmer’s single-machine approach, towards working
with machine systems;
• greater use of information technology, aimed at precision cultivation via yield mapping.
A significant rise in demand for efficient, high-quality agricultural machinery is foreseeable
on an increasingly competitive agricultural market. For the agricultural engineering industry,
professional groups such as big farmers and contractors are set to play a growing role.
The JAGUAR: a successful
product that is a world leader.
Every other self-propelled
forage harvester sold in the
world is made by CLAAS.

13
Developments in Western Europe serve as an example. Progress in biological engineering has
led to higher yield levels and ever-growing surpluses. Despite state controls and shielding of
markets, falling prices and pressure on incomes have been unavoidable. The structural change
under way has brought a decline in the number of farms, an increase in the land area per farm
and growing involvement of contractors and shared machine use across large parts of Europe.
The large machinery segment now covers around two-thirds of the total West European market.
The world market volume in the main segments is considerable. Last year, just under 24,000
combine harvesters, over 30,000 round balers, 2,900 large-square balers and 2,100 self-pro-
pelled forage harvesters were sold worldwide.
ELECTRONICS AND INFORMATION TECHNOLOGY AS A MOTOR OF GROWTH
The breathtaking advances of electronics and information technology are opening up a whole
new world for agricultural engineering, of a significance comparable with genetic engineering.
No area of agriculture will be untouched. The emphasis is on the further development of pre-
cision farming through parcel-specific management.
AGRICULTURAL ENGINEERING IS A GLOBAL BUSINESS
Competition in agricultural engineering is international. All round the world, farmers are depend-
ent on the use of economical, crop-specific machines. Unpredictable weather and sharply fluctu-
ating prices involve a high risk. Harvest seasons are getting shorter all the time, as a result of
developments in plant breeding. The ever-closer association between maximum yield and fast
ripening places big demands on the efficiency of machines.
CLAAS machines are the
leaders when it comes
to harvesting grass or
sugar cane (right).

14 MARKET POSITIONING EMPLOYEES ENVIRONMENT STRATEGY
The trend towards globalization began in the early 1980s and has been increasing ever since.
The decision by many countries to throw their markets open to free competition has changed
the framework conditions, creating new opportunities for tapping markets. The opening up of the
former state-trading countries of Comecon, China, most of Eastern Asia, India and many South
American countries offers various openings for market penetration, besides traditional exporting.
Uncompetitiveness, shortage of foreign exchange and also geographical distances in these coun-
tries mean that production and added value creation take place in the areas where the machines
are sold. Think global, act local is the distinguishing characteristic of globalization in the present-
day context, in comparison to the largely concentrated added value creation in conventional
export business.
The global orientation of agricultural engineering is accompanied by a wave of mergers and
acquisitions. In Western Europe alone, due to this movement of concentration, of the thirteen
manufacturers formerly in business besides CLAAS, only three international full liners are left.
AN INDUSTRY CHARACTERIZED BY CYCLICAL SWINGS
Willingness to invest in agriculture is largely determined by grain prices. The market experienced
a vigorous growth phase in the 90s. Demand outstripped production, and with rising prices,
worldwide stocks shrank considerably. 1998 saw a reversal of the trend, as grain prices plunged.
The drop in income suffered by farmers as a result, especially in the growing countries of the
West, coupled with financing difficulties in some key importing countries, led to a sharp cutback
in investment in agriculture. A sustained improvement of the market situation in Western Europe
has been held back, in the past year, by outbreaks of BSE and foot-and-mouth disease.
The harvesting systems approach
is gaining ground in agriculture.
Several harvest, transport and
storage vehicles are involved.

15
CLAAS – A FIRST MOVER ON THE MARKET
The CLAAS Group’s path to world leadership in agricultural engineering has been marked by
technological milestones. These denote unique positions on the market and set us apart from
the competition as a First Mover. We can put forward plenty of instances in support of this claim.
CLAAS presented Europe’s first pick-up baler in 1934, the first combine harvester designed for
Europe in 1936 and the first self-propelled forage harvester in 1973. We can also lay claim to
the invention of continuous yield measurement during combining, using the photo cell principle;
the development of 3D combine cleaning; and a laser-assisted automatic steering system for
agricultural machines. A further milestone was the market launch of the Lexion, a high-perform-
ance machine using the hybrid threshing system.
Our First Mover strategy has helped us become market leader and has broken down significant
barriers to market entry. We are the technological leaders and we hold patents that put us way
out in front. CLAAS is Number One in Europe in combine harvesters and the world leader in self-
propelled forage harvesters.
LEAD IN PRODUCT DEVELOPMENT
We play a big part in shaping the markets, because we are quicker than the competition
to identify customer needs and trends. CLAAS did not wait until the early 1980s to join the
globalization trek, but on the contrary took positions in Europe, North America, South Africa
and Australia very early on. This early market entry firmly anchored the CLAAS brand in the
consciousness of international agriculture and created a pool of experience to consolidate the
lead in product development. As suppliers of system solutions, our staff in every corner of
the world cover a wide range of customer requirements. A CLAAS service team is available to
assist and advise customers, as well as having an ear to the market. Getting off to a prompt
start on international terrain has enabled us to get to know our markets of tomorrow.

16 MARKET POSITIONING EMPLOYEES ENVIRONMENT STRATEGY
MARKET LEADERSHIP IN AGRICULTURAL ENGINEERING
The CLAAS Group holds excellent positions on agricultural engineering markets. We sell one
combine harvester in every three in Europe, and every second self-propelled forage harvester in
the world. Our product range is a wide one, tailored to the needs of farmers on every continent.
As well as combine harvesters and forage harvesters, we produce large-square balers and round
balers, along with conventional balers. Our green harvest machinery range comprises mowers,
tedders, swathers and self-loading forage wagons. We supply the world’s tropical and subtrop-
ical regions with sugar cane harvesters. Also included in our product line are modern system,
transport and commercial vehicles for agricultural use, together with the latest agricultural infor-
mation technology. We are system suppliers on the drive assemblies and hydraulic components
markets, not just for the CLAAS Group but also for outside customers. We manufacture through
seven product companies in Germany and other countries; we have seven sales companies and
we have relations with over 80 importers. Many of our product companies run their own research
and development departments.
• CLAAS – a well-known name in global agricultural engineering
• Market leader, technology leader
• We look after customers all over the world
• Financing products are included in our service package
• »Win-win« positions with our partners
KEEPING AHEAD OF THE PRESENT

17
We maintained our dominant position in the major segments of agricultural engineering in
2001, developing it further in some instances. The sale of close on 3,900 combine harvesters
represents a world market share of nearly 17%. In Western and Central Europe, that figure is
over 35%. We also have a significant market share in the CIS. Our worldwide market share of
self-propelled forage harvesters has reached 50%, corresponding to sales of around 1,100
units. On nearly all the main markets, our share is at the upper end in terms of percentage.
Of 100 self-propelled forage harvesters sold in the CIS, no fewer than 95 are CLAAS machi-
nes. We have approximately a 10% share of the world round baler market, and nearly 20%
of the world large-square baler market. We also hold a leading position with engineering and
machines from our »green harvest company«.
HIGH-TECH FROM HARSEWINKEL
Success on world markets is due to our ability to keep ahead of the competition with progressive
technologies and rapid implementation of new products. The history of CLAAS is marked by in-
novations. The development of the first European combine harvester and, later, the first self-pro-
pelled machines revolutionized the market. The launch of the totally new Lexion combine harvester
in the mid-nineties set new standards. We invest approximately 4.2% of our turnover in research
and development, a high figure for the industry worldwide. Technological leadership is the key to
maintaining and developing market leadership.
A combine harvester at work,
with the latest technology such
as a Laser Pilot on the cutterbar.

18 MARKET POSITIONING EMPLOYEES ENVIRONMENT STRATEGY
Our strategy is an integrated approach to agricultural operations. We see the individual harvest
machines as components of an economically and environmentally oriented agricultural produc-
tion system. Our engineers and technicians develop machines which slot into the harvesting
process, to offer the customer maximum functionality on an economical basis. Mastery of the
entire process chain calls for skilful knowledge management, which increasingly combines crop-
farming knowledge with expertise in machine design and co-ordination. Our objective is to blend
customer ideas with technical feasibility.
The efforts we put into research and development are reflected in a young product line, protected
by patents. This gives us an edge when supplying big farmers and contractors, and is recognized
by the market as a strategic differentiation and unique position characteristic.
EFFICIENT AND CLOSE TO THE MARKET
For us, market leadership is not some abstract goal to be achieved as an embellishment in
the competitive context. Leading positions on the market lead to a series of synergistic effects,
which we systematically utilize. Concentrating on core skills and gathering outstanding expertise
around us have also secured us technological leadership.
One aspect of our strategy is the combination of focussed facility and factory marketing. By
focussed facility, we mean creating legally independent corporate units which, using their own
know-how and under their own control, develop and manufacture the products of a division. The
network developed at CLAAS, of distributed expertise and added value creation in development
and production, links central process and design competence with local application requirements.
At the same time, we have expanded production management to include tasks from the area of
sales and marketing. The combination of focussed facility and factory marketing creates corpo-
rate units that are innovation-driven, cost-conscious, market-oriented, profitable and competitive.
Not only Sales but our technical staff, too, have their ear to the market.
A PLANT FOR TOMORROW
At our Harsewinkel factory, where nearly two-thirds of the Group’s sales originate, a forward-
looking investment project worth € 55 million is under way. The aim is to enable us to act even
faster and more flexibly on the markets. The ever larger, highly complex combine harvesters
and forage harvesters, tailored to individual customers’ requirements, demand changes to pro-
duction systems and plant. In future, not only will complete combine harvesters come off the
production line at Harsewinkel, but components and assemblies will also be produced there,
in order to build combine harvesters elsewhere in the world.
19
STRENGTH BASED ON CLOSENESS TO THE CUSTOMER
Successful agricultural machinery business without comprehensive service is inconceivable.
Service to the customer is part of our corporate culture. The range of applications for our ma-
chines is as diverse as our customers. They work with varying field sizes, different types of soil,
vegetation and harvesting conditions. Their work is a loop of interlinking processes. A break-
down at any point has serious consequences for the process as a whole.
Harvest seasons are getting shorter all the time, due to modern farming methods, and are
affected by the weather and the time of day. If the general conditions are favorable, the machines
then have to perform flawlessly at top output. If the weather is good and the grain is dry, but
the machines are not working, then the farmer or contractor depends on getting service and
parts on site as fast as possible.
CLAAS pays due regard to the complex conditions that govern cultivation of the soil. We have
set up a full network of service stations and parts warehouses in Germany to carry out service
and repairs in a matter of hours at harvest season. The worldwide supply of parts is handled
by our Logistics Center at Hamm-Uentrop, which performs the functions of accepting incoming
goods, storage, order picking and distribution of some 88,000 items. Our status of global player
is underpinned by a service task force, which can be deployed worldwide to service CLAAS
machines.
NEW FINANCING CHANNELS
Our international customers expect a package of services that includes more than just sale of
machinery and after-sales service. By founding CLAAS Financial Services (CFS), Paris, a joint
venture with the French BNP-Paribas group, we have opened up new channels in financial ser-
vices for our customers. The product range comprises credit, leasing, hire and insurance. One
area of particular significance is flexible sales financing in the emerging markets, which almost
without exception are growth markets for agricultural engineering. We have now developed
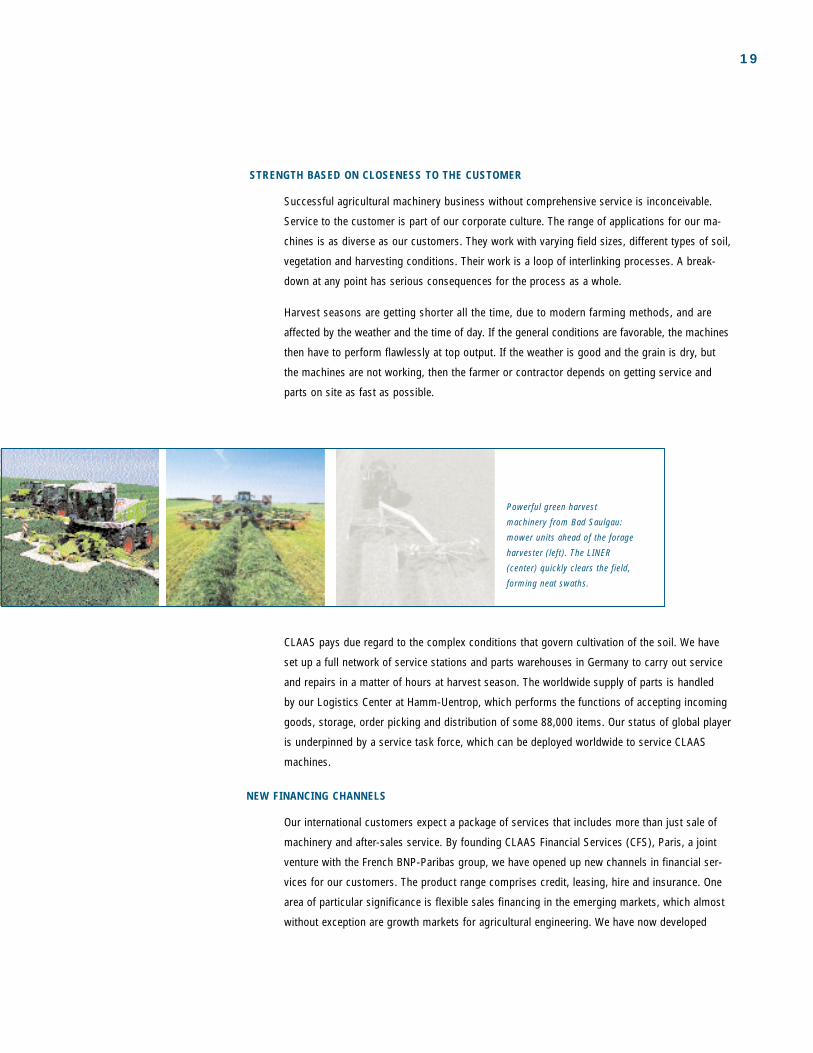
Powerful green harvest
machinery from Bad Saulgau:
mower units ahead of the forage
harvester (left). The LINER
(center) quickly clears the field,
forming neat swaths.

20 MARKET POSITIONING EMPLOYEES ENVIRONMENT STRATEGY
numerous sales financing programs in newly industrializing countries and countries in transition,
using unconventional channels, which substantially increase our selling opportunities in growth
regions while eliminating significant balance sheet risks. CFS, which has processed several
thousand applications since its formation and handles a financing volume of over € 240 million,
has expanded into Poland in the year under review, besides doing business in Germany, France,
Italy, Spain, the USA and Canada.
AT WORK IN FIELDS ALL OVER THE WORLD
The business has its origins in agriculture in Westphalia. Being rooted in the soil and conscious
of tradition doesn´t preclude from operating globally. We started setting this company on an
international course long before the word ‘globalization’ even existed. Today, CLAAS machines are
at work in nearly all the world’s fields. The success of our international strategy is not measured
in terms of numbers present on all the continents, though. The strategic core of our globaliza-
tion is the development and production of machines that can process a wide variety of crops, in
very different climatic zones, rationally and efficiently. Standardized products are not suitable for
global use.
Our international strength can also be attributed to our readiness to take risks in worldwide
business. Global presence involves substantial financial and human resources and requires will-
ingness to co-operate. We are pursuing this path of partnership. Through collaboration and the
interplay of different skills and abilities in the areas of product line, manufacture and distribution,
we build »win-win« partnerships for everyone concerned, without any loss of independence.
WIN-WIN PARTNERSHIPS IN WEST AND EAST
The joint venture with Indian tractor manufacturer, Escorts Ltd., is a pioneering one. With 140
million hectares under cultivation and a mechanization level of 10%, India is one of the growth
markets par excellence for agricultural engineering. The Crop Tiger combine harvester produced
by the joint venture represents exemplary technology for this huge market, giving us jointly a
very good market position. The development of local added value has made it possible to
operate profitably at a very early stage.
We are also resolutely pursing the development of local added value in Eastern Europe. Tapping
these markets remains a challenge. The growth potential is enormous. The road to joint ventures
is a stony one. Political framework conditions are uncertain, the climate is still not particularly
business- or investment-friendly. In Russia, we are negotiating for a production facility; in the
Ukraine, we are one stage further, with local combine harvester production already under way
there.

21
INNOVATION ON THE LINE
CLAAS is an established name in agricultural engineering. No other competitor has effectively
achieved a comparable profile on the relevant markets. Year by year, we launch beneficial inno-
vations on to the market. The LEXION 480 is the world’s most powerful combine harvester, with
a throughput of over 40 tonnes of wheat per hour – unimaginable only a few years ago. During
the year under review, only six years since the market launch, the 10,000th vehicle in the LEXION
product family rolled off the production line, fitted – like the others – with an on-board computer.
Customers now have a choice of three new models, with the LEXION 470 and the two evolution-
ary models, the LEXION 460 and the LEXION 430.
In all the LEXION models, we offer Caterpillar engines, which are characterized by high power
and fuel efficiency. The vehicle cabs feature a number of new equipment details to further opti-
mize stress-free working with CLAAS combine harvesters.
The new series of the JAGUAR self-propelled forage harvester, introduced last year, met with
excellent market acceptance in the year under review. In the round baler segment, the UNIWRAP
product is a new combination machine that wraps the bales directly in plastic. Another new
addition to the product line is the VARIANT 280 round baler, equipped with a function-enhanced
control unit and a new pick-up generation.
In the area of electronic assistance for farmers, our subsidiary AGROCOM is working on the
further development and internationalization of the interface between tractor, mounted imple-
ments and on-board computer. LBS+ has been approved and implemented as an industry stand-
ard, based on DIN 9684, with the collaboration of CLAAS and AGROCOM. At Group level, CLAAS
has developed an on-board computer for the control of tractor-mounted implements with stand-
ardized interfaces, which meets both LBS+ and the future ISO standard. During the year under
review, Agrocom won the silver medial for a pioneering innovation in precision farming for its
AGRO-NET software. AGRO-NET offers the user yield mapping, a crop cutting record and area
management in a single software product with a standard interface for all the necessary man-
agement and control operations in crop growing.
22 MARKET POSITIONING EMPLOYEES ENVIRONMENT STRATEGY
• High level of identification with the firm
• A living culture
• Personnel development is a priority
• Career opportunities for young people
• We reward performance and innovation
WE ARE ALL CLAAS

23
REGARDING THE GROUP AS A SINGLE ENTITY
CLAAS sells high-tech agricultural machinery all over the world. Our staff are deployed inter-
nationally. The bond that unites them is a common will. We regard CLAAS as a single entity.
The cohesion of the individual parts of the Group and shared use of potential are what determine
our success.
We are living in a knowledge-based society. Products and systems are becoming increasingly
complex, and the demands made on staff skills and know-how are growing all the time. The
CLAAS Group represents a huge pool of knowledge. That knowledge has to be available to
everyone. Willingness to transfer and exchange knowledge across divisions and boundaries is
part of our corporate culture.
PRINCIPLES OF MANAGEMENT AND COLLABORATION
We do a lot in order to be successful with professional, motivated employees. During the year
under review, we invested over € 6 million in personnel development. This is investment in
the future. Our principles of management and collaboration state that we are guided by mutual
respect, readiness to accept change, reliability and involvement in decision processes. The
yardstick by which the success of our personnel policy is measured is customer satisfaction.
During the year under review, we received the Company Award from the Federal Association of
German Management Consultants for our innovative company management. One of the award
criteria was trendsetting personnel management.
IDENTIFICATION WITH CORPORATE GOALS
One key pillar of our personnel strategy is a working relationship without hierarchies and de-
veloping the ability to take responsibility and demonstrate own initiative at all levels of the com-
pany. Absence of barriers and freedom from self-doubt creates a »feeling of belonging«. This is
firmly anchored in the consciousness of all CLAAS employees.
Commitment to the Group is attested by low staff turnover and the continuing success of our
employee shareholding scheme. During the year under review, more than 56% of the 4,100 em-
ployees entitled to subscribe in the CLAAS domestic companies acquired shares in CLAAS Mit-
arbeiterbeteiligungs-Gesellschaft (CMG). CMG now has capital of over € 15 million. The total
interest payout for the 2001 financial year amounts to over € 2.8 million.

24 MARKET POSITIONING EMPLOYEES ENVIRONMENT STRATEGY
Benefits paid out by the company pension scheme for the German companies increased further
during the year. Superannuation payments to former employees and their surviving dependents
rose by 4.1% to € 5.3 million. The number of eligible pensioners reached 2,497.
The CLAAS Group as a whole had an average for the year of 5,458 employees, 209 fewer than
the previous year. The domestic companies employed 4,187 people, and the international
companies 1,271.
A PLATFORM FOR KNOWLEDGE TRANSFER
We have institutionalized the gathering and exchange of knowledge by founding the CLAAS
Academy. This is a worldwide training organization, open not only to our staff but also to distri-
bution partners and importers. Through training courses and practical work in the field, we
equip staff from the engineering side with production and service knowledge, and support
our marketing specialists with benefit arguments for our machine and system product lines. In
2001, a total of 2,755 people from the technical and marketing functions took this opportunity
for further training at our training centers in Harsewinkel, Bad Saulgau, Metz and Belgorod in
Russia.
OPPORTUNITIES FOR YOUNG PEOPLE
The training ratio, i.e. the proportion of trainees to employees, at the CLAAS production plants
is 7.5%, two to three percentage points higher than the industry average. During the year under
review, 82 young people were taken on. At the end of the year, we had 374 trainees in the Group.
It is part of the CLAAS tradition to invite the trainees’ families to come along on introduction day
and find out about the Group, our position on the world market, training places available and
career opportunities.
Maintaining our leading position on agricultural engineering markets calls for a big pool of spe-
cialists and managers. To meet that need, we lost no time in designing an effective international
trainee program. Within the framework of this program, university graduates from a range of
disciplines spend 12 to 18 months with the firm, moving from Production to Administration to
Sales. At least one period of time spent with one of our subsidiaries abroad is always a requisite
in order to work in our global business.
25
Through this postgraduate further training scheme, we gain employees who have both the theo-
retical knowledge of their subject and an in-depth understanding of the Group and its markets.
Our traditional close links with prominent universities stand us in good stead when recruiting
graduates.
CLAAS has pioneered twin-track studying at professional training institutions and technical
colleges. This has proved to be an extremely effective way of training up highly qualified staff
with a commitment to the Group.
SCHOLARSHIPS IN GERMANY AND BRITAIN
For several years now, the CLAAS Foundation has made awards to outstanding dissertations or
project work in the agricultural engineering, engineering and business management fields. The
first bursary awarded, the »Helmut Claas Scholarship«, provides € 300 per month for a period
of two years. The second prize is of € 250 for one and a half years. During the year under review,
these scholarships were awarded in Germany to students at Munich Technical University and the
University of Stuttgart-Hohenheim. In Britain, the prizes went to students at Cranfield University.
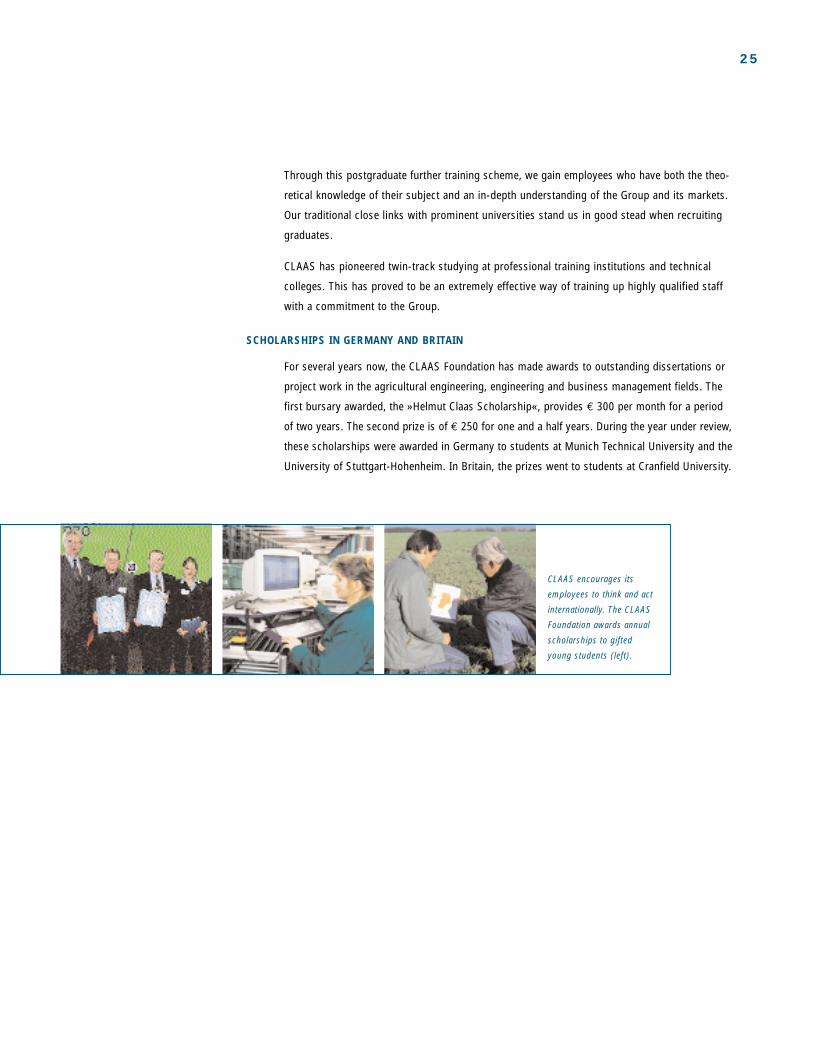
CLAAS encourages its
employees to think and act
internationally. The CLAAS
Foundation awards annual
scholarships to gifted
young students (left).

26 MARKET POSITIONING EMPLOYEES ENVIRONMENT STRATEGY
• We take responsibility for soil conservation
• We build machines for economically…
• ...and environmentally well-designed processes
• Exemplary, environmentally friendly painting line
• Grant from the Federal Minister for the Environment
OUR ENVIRONMENT REMAINS LIVELY
THE SOIL NEEDS TO BE CONSERVED...
Agriculture and environmental protection are interdependent. Farmers and contractors not only
need to provide the food essential for life, but at the same time, they have to ensure that the
basis of their work remains intact.
Without fertile, healthy soil, agriculture is impossible. For a long time, this was not a problem
in the world. As recently as the 19th century, land was still regarded as a ubiquitous commodity,
which only required to be taken in hand by human beings. Its unlimited availability was taken
for granted. Marshes were drained, lowlands were diked and sand turned into arable land. In
Prussia, farmers from all over Europe showed how Brandenburg heaths and marshy land on
the Oder and the Havel could be developed into fertile farmland.
Times have changed. The idea of unlimited land at our disposal is now an illusion. The world
population explosion, rising standards of living and globalization of markets have hugely pushed
up demand for food. The agricultural industry has to work the soil intensively, allowing it only
a short time to recover.

27
However, this development has not altered our responsibility for successful conservation of
the soil. On the contrary, countermovements are emerging, demanding better soil conservation.
CLAAS is among them. Our big agricultural machines and tractors are essential for economically
efficient agriculture. We realize that when used intensively, they exert tremendous pressure on
the ground. This realization is a key component of our development strategy: if agricultural
machinery has to travel over the soil, then better that it should do so in a way that avoids en-
vironmental damage.
... AND THAT´S SUPPLIED BY CLAAS
We develop machines to meet both economic and environmental demands in the closed system
that is soil cultivation. We bring our influence to bear in tire technology and we build agricultural
machines that combine individual operations into one. That saves costs, as well as protecting
the environment.
Our CHALLENGER models and some of the big LEXIONs are fitted with rubber track roller units
to protect the ground, while also making them more economical to operate. Our modern cane
harvesters can also process green sugar cane. These machines permit more environmentally
compatible harvesting, as they collect up the leafy part of the sugar cane from the field in a sec-
ond pass, for use as an energy source. The traditional burning down of plantations before har-
vest is no longer necessary. We develop agricultural software systems to help make not only
harvesting processes but also livestock breeding operations more economical and environmen-
tally sound.
EXEMPLARY PAINTING LINE
Looking after the environment also means making our own production facilities more environ-
mentally friendly. At our new plant in Harsewinkel, fitted out at a cost of € 55 million for modern
combine harvester and self-propelled forage harvester production, the painting line is the core
of the operation. Introduction of a new surface treatment method has enabled pollution to be
significantly reduced. Compared to conventional processes, emissions of volatile organic com-
pounds, which are precursors of surface ozone, spray-painting residues and contaminated waste-
water are avoided. The new CLAAS powder coating process also reduces the use of organic sol-
vents, lacquers and other chemicals.
The Federal Ministry of the Environment is supporting the modern painting process at our main
factory with subsidized interest rates under the »Investment program for the reduction of envir-
onmental pollution«. The Ministry regards the line as an example for other industries to follow.
»This approach to surface treatment,« the Environment Minister said in his commendation,
»serves as an example not only for agricultural engineering but also for whole sectors of large
vehicle painting and mechanical engineering. The process is superior to previous painting
methods and is sure to find many emulators, following the demonstration run.«

28 MARKET POSITIONING EMPLOYEES ENVIRONMENT STRATEGY
• We are geared up for globalization
• Focus on Eastern Europe and America
• We look for innovative financing for our customers
• We develop benefit leadership and cost competence
• Above all, though, we remain a First Mover in
agricultural engineering
WE INTEND TO CONTINUE GROWING

29
GLOBALIZATION SETS THE STRATEGIC DIRECTION
CLAAS has developed world leadership in agricultural engineering through the work of past
years. We are determined to create the conditions for further growth and to develop this domi-
nant position. The necessary readiness to accept change is already assured within the Group.
Our new structures permit even faster, consistent implementation of decisions. The strategic
direction is set by globalization: opening up new markets, while maintaining and strengthening
our position on our core markets. We make it our priorities to ensure that CLAAS will continue
to play its part in shaping trends on agricultural engineering markets in future and perform the
function of First Mover.
The pillars of our corporate philosophy are still innovative products, customer-oriented solutions,
high productivity, excellent service and distribution. We have identified opportunities to further
improve our relative competitive positions in the case of our self-propelled machines, i.e. com-
bines and forage harvesters, on the one hand. Towed machines too, namely balers and green
harvest machinery, also offer export opportunities on new markets.
NEW FOCUSES OF ATTENTION OUTSIDE WESTERN EUROPE
Expansion into the major markets outside Western Europe is essential in pursuit of our growth
strategy. Machine ownership in the principal West European markets is comparatively high, and
replacement demand tends to be low. The only way to further expand our positions is at the ex-
pense of the competition. To some extent, this also applies to North America. We are strength-
ening our overseas position through our partnerships and are in the process of securing a sig-
nificant market share, by developing local manufacture.
The CROP TIGER, a small
rice harvester made in India,
at work in the rice-growing
areas of Eastern Asia.

30 MARKET POSITIONING EMPLOYEES ENVIRONMENT STRATEGY
The FAO predicts that future growth in cereal production will mainly take place in South America
and Eastern Europe. In the CIS especially, the technology is obsolete and domestic production
is too low. In many countries, lack of machinery puts the harvest in jeopardy. We already have
strong positions in Central and Eastern Europe. The CLAAS name is well known on fields nearly
everywhere. Our existing market leadership in combine harvesters and forage harvesters built in
Western Europe is set to be developed. In order to optimize costs, logistics and distribution,
we are striving to set up local production. This is a necessary step, albeit an arduous one.
In India, we launched a successful joint venture with a major local company quite a few years
ago, to manufacture rice harvesters. In Russia, talks are in progress for an assembly plant in the
south of the country. In the Ukraine, where our machines are built under contract, further joint
ventures are planned.
OVERCOMING FINANCING BARRIERS
The bottleneck in expansion into Eastern Europe is, in many cases, financing the big agricultural
machines sold. We have already accumulated a lot of valuable experience in assisting our cus-
tomers with intelligent financing solutions. We regard it as proof of our successful efforts in this
area that CLAAS is the first agricultural engineering manufacturer to obtain Hermes export credit
insurance again for sales to the CIS since the Russian crisis of 1998. In order to seize our oppor-
tunities, which stem in particular from the rapid expansion of mechanization in many threshold
countries, we shall further refine the instruments of innovative financing and orient ourselves
more firmly to the international financial markets.
INVESTMENT OFFENSIVE LAUNCHED
The bases of our growth strategy are extensive investment in our plants, our production and
logistics concepts and a Web-based purchasing system. We are investing € 55 million in rebuild-
ing and restructuring the main factory at Harsewinkel. This is the biggest corporate investment
in Westphalia. At Bad Saulgau, a further € 3 million are going into replacing the plant structure
and we are devoting significant resources to building up our distribution networks. Finally, every
year we spend a lot of money on consolidating our technological leadership. Expenditure on
research and development has risen steadily and is set to continue to do so in coming years.

31
OUR CORE EXPERTISE
CLAAS’ market leadership is based on core expertise built up throughout our history. That in-
cludes mature technologies, leadership in value, cost competence and lots of know-how in the
areas of information technology and service logistics. We see the continual improvement of
these core skills as an on-going commitment. We shall further expand our knowledge about
value for the customer and the development of superior benefit machines and services. Our
streamlined organization and increasing networking with selected qualified suppliers will enable
us to react even faster and more specifically to cyclical swings. To take account of rising de-
mands for machine availability for harvests, we shall continue to invest in jointly developing
integrated systems with our distribution partners. Lastly, we will continue along our chosen
path of internal Group structuring. We place our reliance in customer-oriented, decentralized
processes and delegation of responsibility.
CLAAS has successfully main-
tained market leadership over the
competition through numerous
technical innovations, such as the
GPS satellite navigation system.


33
CLAAS ON THECAPITAL MARKET
We were one of the first names in European industry
to take the step on to the new European debt capital
market with the issuance of a euro bond with a nominal
value of €100 million in March 1999.
34 CLAAS ON THE CAPITAL MARKET
TURBULENCE IN THE MARKET ENVIRONMENT
Developments in the international capital markets were not under a lucky star in 2001. From
autumn/spring onwards, the economic environment declined appreciably. The terrorist attacks
of 11 September accelerated the recession beginning in the U.S.A. and the slowdown in economic
growth in Europe. The decline in the world economic activity was accompanied by a sharp
downturn in the stock and bond markets. Individual sectors were pushed to the edge of a major
slump. As a result of the unfavorable market outlook combined with drastic profit warnings,
the major rating agencies downgraded the ratings of many renowned industrial companies.
Indications of a crisis in several emerging markets repeatedly flared up, which further exacer-
bated the economic situation.
In this environment, the risk awareness of international capital market investors increased signif-
icantly and led to an expansion of the credit spreads in existing and new capital market trans-
actions in the corporate sector. From the point of view of the issuers, the changed risk awareness
of the investors meant that advantages of the generally favorable interest rates could no longer
be fully exploited due to the increased credit spreads.
HIGH RESILIENCE OF THE CLAAS BOND AND FLEXIBILITY IN CAPITAL PROCUREMENT
The bond issue, floated at a nominal value of € 100 million by CLAAS in March 1999, which
was one of the first euro bonds, has remained very steady under these economic conditions.
The increase in credit spread was moderate compared to the industry overall and confirmed
the stability of the CLAAS bond.
However, the spread development in the individual debt capital market segments – like the
euro bond market listed on the stock exchange – conceals two issues. On the one hand, there
are still price differences between the traditional bilateral credit market and the growing euro
bond market. On the other, our financial result is influenced by our overall financial liabilities
profile (terms, currencies, etc.) as well as by the spread development.
We have drawn appropriate conclusions from this for our position in the capital market.
Our policy is to individually address specific segments of the debt capital market with regard
to the procurement of financial resources and to separate funding considerations from the
management of our liabilities profile. For instance, such separation may ensue via a combina-
tion of fund-raising and currency derivatives or via interest rate hedging policies using interest
rate swaps preceding such fund-raising.
• Euro bond showing high resilience
• Great flexibility in capital procurement

35
THE GROWING SIGNIFICANCE OF NAME RECOGNITION
The establishment of the euro currency area has further globalized the world of finance and
increased the significance of name recognition in capital market transactions. International
financial investors are more and more emphasizing a neutral evaluation standard when taking
their investment decisions. The official rating by a neutral rating agency is being increasingly
used to evaluate the credit quality of capital market operators. In most cases, non-rated capital
market transactions can be placed only upon acceptance of a significantly higher credit spread.
For European industrial borrowers a rating has gained additional significance due to the plans
of the Bank for International Settlements (BIS) to make equity capital reserves required at
commercial banks in lending transactions dependent on the rating of the borrower on an
individual basis.
CLAAS is considering the option to obtain an external rating. We have already familiarized
ourselves in detail with the implications of the rating process.
SUCCESSFUL ASSET-BACKED PROGRAM
The asset-backed financing program introduced last year has completely fulfilled our stipulated
goals. Asset-backed securities (ABS) programs facilitate the efficient management of short
term capital employed, improve balance sheet ratios within the business year and open up
additional financing opportunities.
CLAAS BOND SPREAD TRENDS COMPARISON (basis points*)
CLAAS
Corptoplnd European industrial bond index
(Source: Reuters)
ECIBBB European BBB industrial bond index
(Source: Dresdner Kleinwort Wasserstein)
*1 % = 100 basis points, term adjusted
02.10.000
50
100
150
200
250
28.09.01

36 CLAAS ON THE CAPITAL MARKET
ENTERPRISE VALUE AS THE GUIDING PRINCIPLE FOR MANAGEMENT
Only those companies whose return on capital exceeds cost of capital will attain long-term
success. The same applies to large publicly held corporations and family-owned companies.
Over the past years, CLAAS has established consistent value management throughout all levels
of the Group. Since the beginning of the new fiscal year, incentive systems for management are
also based on our value based management concept.
Value based management sets internal guiding principles for operative units and divisions and
provides important assistance in making investment decisions. Thus the increase in enterprise
value is taken into account in all decisions. This benefits not only investors, but employees
and other stakeholders as well. After all, the value increase is a primary requirement for the con-
tinuing existence of the company. Externally, we use value based management as an instrument
to open up the company to investors and the interested financial community, customers, sup-
pliers and other partners important to us. Examples of our open communication policy include
our transparent accounting in accordance with US GAAP, a considerably extended coverage of
our annual report, increasingly so in the past several years, and an intensive information sharing
with our financial partners.
FOCUS ON CASH FLOW, INVESTED CAPITAL AND COST OF CAPITAL
The primary measure used in our value based management concept is cash flow return on
investment (CF ROI), which provides information on how much after-tax liquidity has been
generated through operations in comparison to the invested capital.
• Profitable growth through value based management
• Focus is on cash flow, capital base and cost of capital
GROSS CASH FLOW
Operating result after tax
(special impacts adjusted)
+ interest expense
+ depreciation/amortization
+/- changes of long-term provisions
+/- other non-cash
expenses/income
Gross cash flow
GROSS INVESTED CAPITAL
Assets
– tax and other provisions
– trade liabilities
– other non-interest bearing liabilities
+ accumulated depreciation
Gross invested capital
/

37
The CF ROI is defined as the ratio of gross cash flow to gross invested capital. In the gross cash
flow, non-operative variables and variables not counted as payments – such as depreciation –
are eliminated. As this cash flow is calculated before interest expense we are effectively applying
a ‘Cash flow to Total Capital’ approach. The gross invested capital reflects invested operating
assets by which gross cash flow is generated. Non-interest bearing capital (e.g. provisions),
is eliminated from gross investment.
The CF ROI becomes economically meaningful when it is compared with the cost of capital.
These determine the weighted required returns after tax to equity and debt capital providers. A
company-specific expected market yield to an investment in a »fictitious« CLAAS share is app-
lied, which we derive from a risk analysis of our competitors listed on the stock market. The
cost of debt is based on the long-term financing conditions of CLAAS. The cost of capital rate
determined in this fashion is approximately 10% per year – this includes a system-dependent
reinvestment premium of 2%.
Being traditionally results-focused, CLAAS now gives additional priority to three criteria: cash
flow, the management of the capital base and the cost of capital. In 2001, despite the difficult
environment, we nearly achieved our capital costs.
Value based management targets profitable growth. The value increase during one period, i.e.
the cash value added (CVA), is thereby calculated from the difference between the return on
investment (CF ROI) and the capital cost rate, multiplied by the capital used.
As the most important components of CF ROI, the gross cash flow and the gross invested capital
can be broken down into individual operative value drivers. For product and sales companies in
our group, working capital is a value driver that must be constantly optimized. The development
of our inventories confirms the interaction of value drivers and CF ROI. In the year under review,
we have reduced once again our inventories at € 169 million below the already low figure of the
previous year (€ 181 million). Since 1999, the share of the inventories in the balance sheet total
has been reduced by over 9 percentage points to the current level of 18%, which corresponds in
absolute figures to a reduction of € 53 million in the past three years.
We view value based management as the task of every single employee. Value based management
with its core values is the bridge between daily work and the valuation standards, the capital market
is already applying to CLAAS and will apply even more when additional capital market segments will
be addressed. We see this as a decisive factor in profitable growth.
RETURN ONINVESTMENT 15 %(CF-ROI)
./.COST OF CAPITAL 10 %
=ADDED PROFIT 5 %
GROSS INVESTED
CAPITAL
100 €X =
CASH VALUE
ADDED
(CVA)
5 €

THE STORY OF CLAAS
1913 Business established by August Claas at Clarholz, Westphalia
1914 August and Franz Claas found the firm of Gebr. CLAAS
1919 Move to Harsewinkel. Manufacture of straw binders
1921 First CLAAS patent for a knotter for efficient straw binding
1930 Start of development of the first combine harvester
1934 Manufacture of the first pick-up baler
1936 CLAAS markets the first combine harvester built in and for Europe
1937 Volume production of trailed combine harvester starts (reaper-binder)
1953 Construction of the first self-propelled combine harvester
1956 Paderborn factory opened
1962 Production starts at the new baler factory at Metz, France
Production of green harvest machinery begins (takeover of Bautz, Saulgau)
1971 Development of a pick-up sugar cane harvester
1973 Presentation of the first self-propelled forage harvester
1976 ROLLANT, the first CLAAS round baler
1983 New range of JAGUAR self-propelled forage harvesters
1988 CLAAS Fertigungstechnik (Engineering for Production) starts up in Harsewinkel
1992 CLAAS Fertigungstechnik moves to new factory at Beelen in Westphalia
88 YEARS
OF CLAAS
38 HISTORY

1995 Launch of the LEXION large combine harvester
1996 Three plants become independent product companies: CLAAS Selbstfahrende Erntemaschinen
GmbH in Harsewinkel, CLAAS Industrietechnik GmbH in Paderborn and Usines CLAAS
France S.A. in Metz
1997 Takeover of a new plant at Törökszentmiklos, Hungary
1998 LEXION combine harvester is »Machine of the Year«
1999 CLAAS Foundation set up. First company bonds issued on the Euro capital market
2000 New parts logistics centre at Hamm-Uentrop becomes operational
25 YEARS OF THE CLAAS ANNUAL REPORT – TAKE A LOOK!
2001 AND IN 2001…
Laying of the foundation stone for the new factory building at Harsewinkel. At € 55 million,
this plant structuring project is the biggest corporate investment in the whole of Westphalia.
Supervisory Board Chairman, Helmut Claas, celebrates his 75th birthday.
The European combine harvester marks an anniversary. Series production began 66 years
ago. A summer birthday party attended by many prominent personalities from the world of
business and politics is a big success.
The highest sales in the Group’s history are achieved: € 1.148 billion.
Combine harvesters in the
olden days. A big summer
party is held to celebrate the
development of a machine
that revolutionised agriculture.
Left: Helmut Claas and his
daughter, Cathrina, who
hosted the event.
39

Commencement of
documented financial
communication: the
first annual report
in 1977
The need for information in the world of finance is constantly growing. Convincing and
reliable investor relations do require a high degree of corporate transparency. As a company
not listed on the stock exchange, we have taken up the challenge of achieving material
comparability of our publications with listed peers. The annual report has been particularly
significant for 25 years as the calling card of our company. Our customers, partners, banks
and employees are in a position to obtain regular information about our current business
development.
25 YEARSANNUAL REPORT
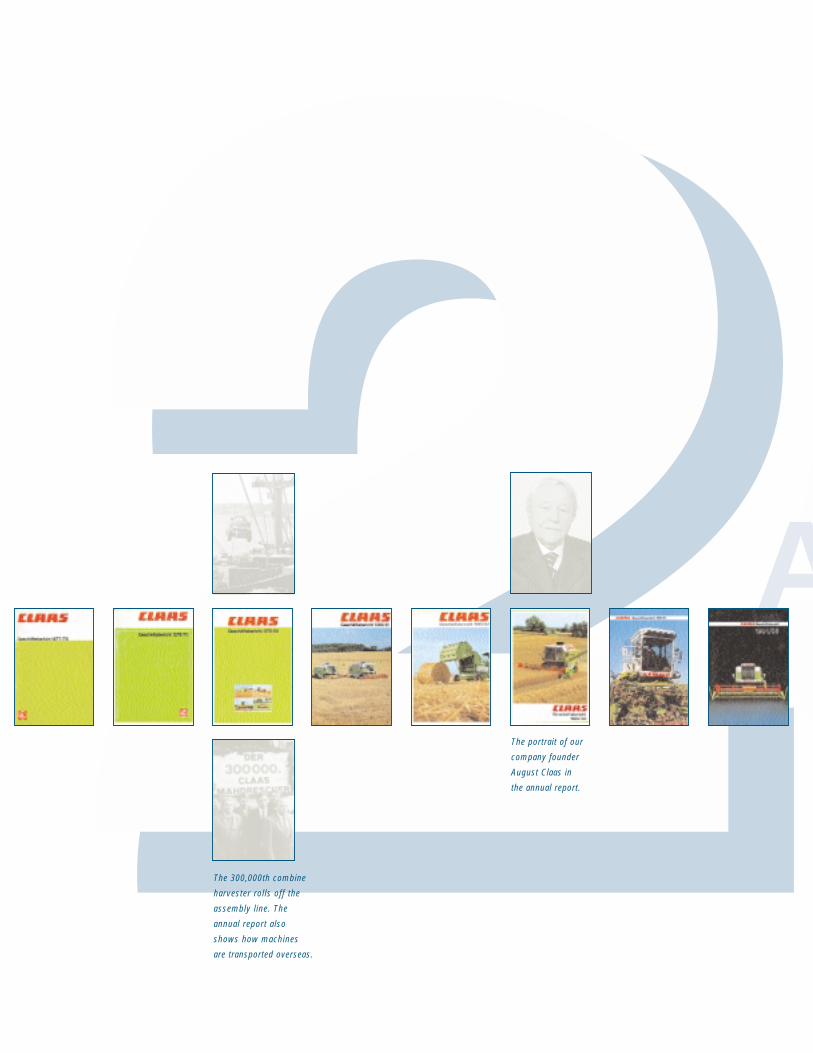
A
The 300,000th combine
harvester rolls off the
assembly line. The
annual report also
shows how machines
are transported overseas.
The portrait of our
company founder
August Claas in
the annual report.

ANNUAL RE
The annual report is
distinguished by a
special design for
several years.

PORTAgricultural motifs on
the cover provide color
in the annual report.
Professional financial
communication
characterizes the
company at the
end of the century.

40 REPORT OF THE SUPERVISORY BOARD
LADIES AND GENTLEMEN,
The Supervisory Board of CLAAS KGaA mbH monitored and analyzed the Group's business
situation at its regular meetings during fiscal year 2001. The Board's assessments were based
on reports by the Executive Board on the Group's strategic orientation, the asset, financial and
income positions and operating decisions. The reports were received at two sessions and
used as a basis for the decisions of the Supervisory Board.
The primary focal points of the Supervisory Board's deliberations comprised plans for the
year 2002, including:
• Implementation of the new plant layout for the Harsewinkel production site
• Conversion to SAP R/3
• Growth strategy for Claas production engineering
• Conversion to the euro
• Projects in the Ukraine and Russia
• Structural changes in production designed to improve material flow for CLAAS Saulgau
• After-sales strategy
• Preparation for founding a Brazilian subsidiary
• Cooperation with a well-known German manufacturer in the field of gear development
• Restructuring measures at Usines CLAAS France
At its meeting on October 4, 2000, the Supervisory Board elected Dr. h.c. Helmut Claas as its
chairman and Mr. Guntram Schneider as the deputy chairman. On November 2, 2000, Dr. h.c.
Günther Claas and Mr. Reinhold Claas resigned their positions. Their sons Oliver Claas and
Volker Claas were elected as their successors. Otherwise, the composition of the Supervisory
Board remains unchanged from the previous year.
In order to meet the increased demands of the capital markets for transparency and interna-
tional comparability of annual financial statements, CLAAS published consolidated financial
statements in accordance with the US Generally Accepted Accounting Principles (US GAAP)
for the first time. These consolidated financial statements release from preparing consolidated
financial statements in accordance with German GAAP (§ 292 HGB).
The financial statements of CLAAS KGaA mbH and the consolidated financial statements of the
CLAAS Group as at September 30, 2001 as well as the management reports for CLAAS KGaA
mbH and the Group were audited by Deloitte & Touche GmbH, Düsseldorf, the auditors elected
by the general meeting on January 22, 2001 and appointed by the Supervisory Board, and
received a full audit opinion on November 26 and December 7, 2001 respectively.

41
The auditors' audit assignment also included the risk management system required by the
Law on Control and Transparency in Business (KonTraG). The audit revealed that the Group's
risk early warning system meets the statutory requirements.
The financial statements of CLAAS KGaA, the consolidated financial statements and manage-
ment reports as well as the proposal for the appropriation of profit were presented to the
Supervisory Board upon completion. These documents as well as the auditors' reports were
available to the members of the Supervisory Board and were discussed in detail at the
Supervisory Board's meeting on January 14, 2002 in the presence of the auditor.
Thereupon the Supervisory Board passed the following resolution:
Following an audit of its own, the Supervisory Board agrees with the audit findings. The final
result of the audit by the auditor did not give rise to any objections. The Supervisory Board
therefore recommends to the shareholders that the annual financial statements be approved
as they stand and agrees with the proposal for appropriation of income made by the Executive
Board of the personally liable partner.
The Supervisory Board would like to thank the Executive Board and all the employees for their
commitment during the past fiscal year. Despite the crises in the agricultural sector (BSE and
foot-and-mouth disease) as well as the general slowdown of the economy, close cooperation
among the Supervisory Board, the Shareholders' Committee, the Executive Board and the
employees made it possible to achieve a result significantly higher than that of the previous year.
Harsewinkel, January 14, 2002
The Supervisory Board
Dipl.-Ing. Dr. h. c. Helmut Claas
(Chairman)

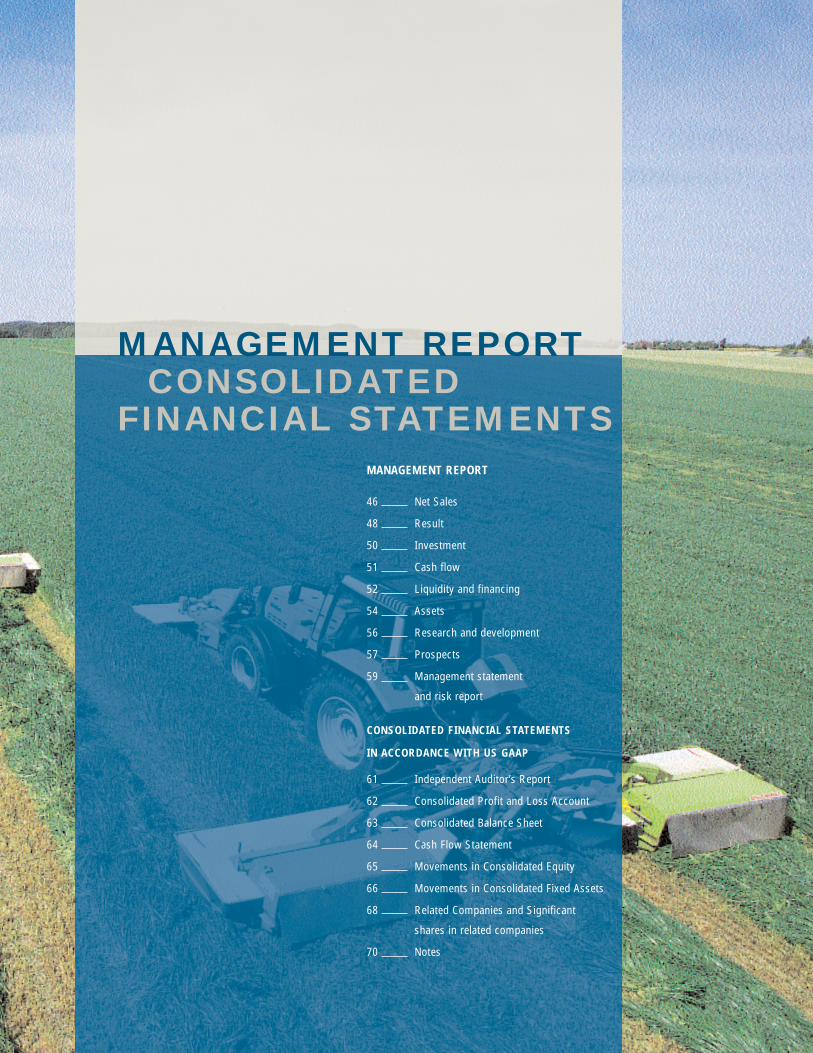
MANAGEMENT REPORT CONSOLIDATED
FINANCIAL STATEMENTS MANAGEMENT REPORT
46 Net Sales
48 Result
50 Investment
51 Cash flow
52 Liquidity and financing
54 Assets
56 Research and development
57 Prospects
59 Management statement
and risk report
CONSOLIDATED FINANCIAL STATEMENTS
IN ACCORDANCE WITH US GAAP
61 Independent Auditor’s Report
62 Consolidated Profit and Loss Account
63 Consolidated Balance Sheet
64 Cash Flow Statement
65 Movements in Consolidated Equity
66 Movements in Consolidated Fixed Assets
68 Related Companies and Significant
shares in related companies
70 Notes

44 MANAGEMENT REPORT
MANAGEMENT REPORT OF CLAAS GROUP
CONTINUAL ALTERNATIONS BETWEEN GOOD AND BAD PERIODS IN THE
AGRICULTURAL ENGINEERING INDUSTRY
The agricultural engineering industry experienced continual alterations between good and bad
periods in the year 2001. In the first half of 2001 the consequences of the cattle disease BSE
and the foot and mouth disease led to reductions by about 2% of worldwide sales from the
German production of agricultural machinery. In the year before, the total sales from agricultural
machines and tractors were increased by 2% to € 3.51 billion.
Only in summer 2001 did the influence of BSE and foot and mouth disease slowly recede and
reduced the uncertainty in agriculture. New confidence of the farmers who before had delayed
planning and realization of capital expenditure on machines led to clearly rising sales in the
second half of the year.
On account of the unchanged, weak development in Western Europe, marked by the structural
changes in agriculture, two substantial growth regions have developed for the agricultural en-
gineering industry: North America and Central and Eastern Europe. In particular in the countries
of the former Comecon community of states, the financial possibilities for capital expenditure on
urgently required modern agricultural engineering stabilized.
The global market for combine harvesters, for example, clearly reflects the different demand
development. While the Western European market declined from about 8,050 machines in 2000
to about 7,300 combine harvesters in 2001, sales in Central and Eastern Europe were increased
from approximately 2,050 to 2,740 machines. The North American market rose from 6,940 in
the year 2000 to 7,800 machines. Overall, the global market recorded sales of about 23,700
combine harvesters in 2001 (22,570 in the year 2000).

45
The demand for green harvest machinery that had still been substantially influenced by the BSE
crisis in the first quarter, increased, however, before the harvest period. The unit figures fell in
Germany by 13% in the seasonal year, but were more or less on the prior year level with 80,000
machines sold in Western Europe.
In respect of the other harvest machinery, the seasonal year was declining slightly overall. While
the Western European market for round balers and large square balers suffered losses of about
13% (approximately 13,700 machines in 2001), the global market remained approximately on
prior year level. With about 2,050 machines sold worldwide, self-propelled forage harvesters
recorded a slightly lower demand.
The countries of Central and Eastern Europe offer grounds for optimism, above all the new can-
didates for accession to the European Union (EU). Despite the generally overcast world econom-
ic climate, the macroeconomic data leads to the conclusion of a considerable expansion of these
economies, also resulting in benefits for the agricultural engineering industry.
The exports to Central and Eastern European countries have been increasing continuously since
the bottom in 1999. In the first half of 2001, they exceeded the prior year period by 26%. Ex-
ports to the Ukraine, Belarus, Poland and the Czech Republic increased disproportionately. The
sales volume growth was supported by harvesters – above all by combine harvesters. In the
course of an on-going changeover in agriculture to free-market processes, the industry in future
expects growing volumes in these markets.

46 MANAGEMENT REPORT
RECORD SALES: INCREASE BY 7%
In contrast to the general slow-down in the economy and the business decline in agricultural
engineering industry, CLAAS showed a positive development in the business year 2001**.
Sales increased by 7% to € 1,147.9 million and exceeded the previous high figure of 1998
(€ 1,108.4 million).
The sales push into Central and Eastern Europe has been successful. Following the slump in
the years 1998 and 1999, the business volume in the region increased markedly for the second
year in a row. The positive development is based, on the one hand, on the general economic
stabilization in these states and, on the other hand, on the continuous high commitment of
CLAAS in these future markets.
Russia, Belarus and the Ukraine have been showing clear economic growth in the meantime that
goes hand in hand with an increase in agricultural production. CLAAS benefits from this process
through trendsetting service and the use of intelligent financing products. The Company has
been the first manufacturer to meet the Hermes collateralization requirements for Russia and
accordingly obtained the first Hermes guarantee in the Russian Federation since the Russia crisis
1998. Also in countries such as Poland, the Czech Republic and Hungary, sales increases of
more than 50% were generated. State promotional programs to modernize agriculture gave addi-
tional positive impulses to CLAAS operations. Overall, sales in European countries outside the
European Union (other European countries) rose by about 49% to € 155.9 million.
In non-European countries, sales also clearly improved to € 185.3 million and exceeded the
prior year by € 32.3 million or 21.1%. Above all, the U.S.A., Argentina – represented through
our new sales subsidiary –, Mexico and India contributed to this positive development.
Sales share domestic %
Sales share foreign in %
(*Figures based on German GAAP)
979 1,108 1,038 1,073 1,148
SALES in € million
69.770.6
68.965.5
29.430.3
31.1
66.6
33.434.5
97* 98* 99* 00 01
** The annual figures refer to the respective business years

47
Sales in the EU fell slightly by 1.0% to € 806.7 million (prior year: € 814.8 million). The indi-
vidual countries developed differently. In Germany, the high prior year level was maintained more
or less; the expansion of market leadership in particular for combine harvesters to more than
44% proves the leading role of CLAAS in this market. In France, sales declined on account
of a shrunken overall market by 12%; after some top-selling years, the French market is char-
acterized by a marked capital expenditure restraint. The decrease in this important market was
mitigated largely by positive developments in other EU countries. Very satisfactory was the busi-
ness in Great Britain, where we could realize a clear sales growth, starting out from a low level;
our market share for combine harvesters increased in Great Britain from 34% in the prior year
to 38% in 2001.
CLAAS further expanded the market shares for its main products on the Western European mar-
ket that declined as a whole. This success is closely connected with the product program offered
by CLAAS that concentrates on more powerful and higher performanced classes of machines.
In particular the growth of CLAAS in Central and Eastern Europe affected a further increase in
the foreign share in total sales from 66.6% in the prior year to 68.9%.
SALES OF COMBINE HARVESTERS AND FORAGE HARVESTERS CLEARLY POSITIVE
In agricultural engineering, sales rose overall to € 1,051.2 million. Above all, CLAAS realized
growth with its main products of combine harvesters and self-propelled forage harvesters. The
newly introduced combine harvester family MEDION and a new forage harvester series JAGUAR
proved to be a success already in its first year. By contrast, the sales volume declined slightly
for balers and green harvest machinery. This development reflects the – even if only minor –
effects of the crisis in agriculture (BSE and foot and mouth disease). The sales with spare parts/
accessories returned to normal compared with the prior year. Roughly half of the increase by
12.8% to € 166.3 million is accounted for by the expansion of merchandise business and the
sales increase for the other products in the spare parts sector, respectively. Without including
the spare parts business, sales of agricultural machines increased by 5.8% to € 884.9 million.
A 356.8 (-0.4%) Domestic
B 449.9 (-1.5%) EU without Germany
C 155.9 (+48.9%) Other European countries
D 185.3 (+21.1%) Non-European countries
SALES BY REGION in € million
D
C
B
A
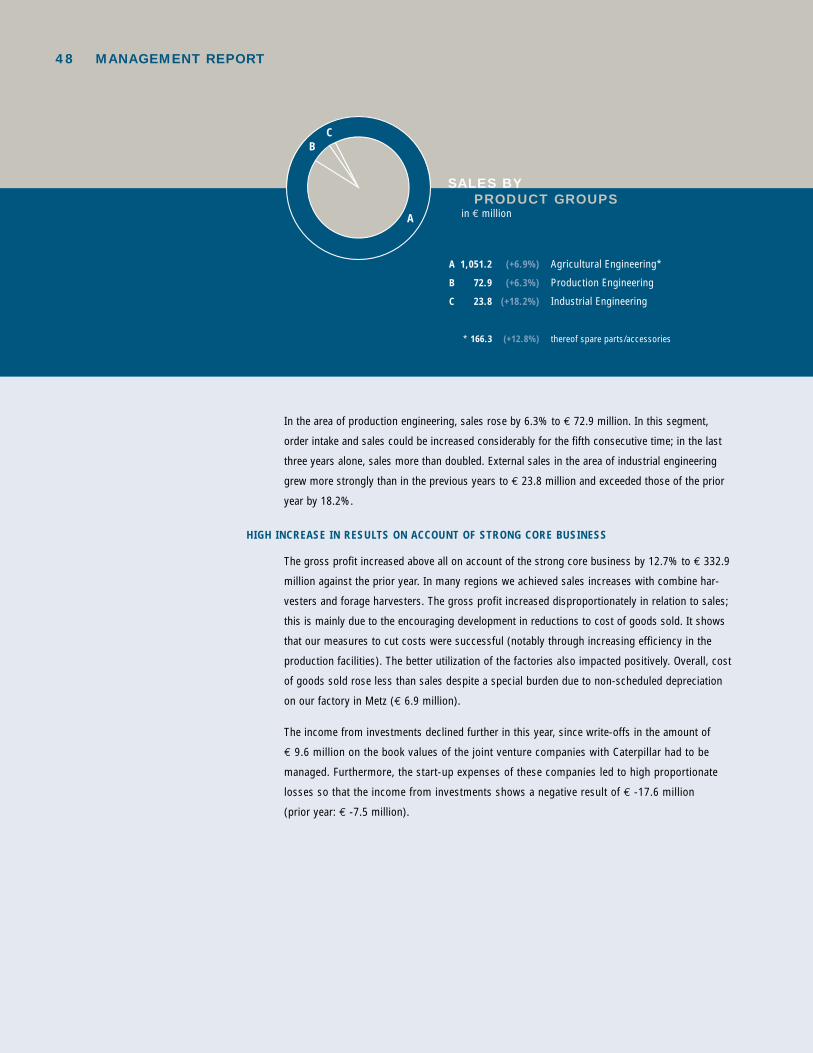
48 MANAGEMENT REPORT
In the area of production engineering, sales rose by 6.3% to € 72.9 million. In this segment,
order intake and sales could be increased considerably for the fifth consecutive time; in the last
three years alone, sales more than doubled. External sales in the area of industrial engineering
grew more strongly than in the previous years to € 23.8 million and exceeded those of the prior
year by 18.2%.
HIGH INCREASE IN RESULTS ON ACCOUNT OF STRONG CORE BUSINESS
The gross profit increased above all on account of the strong core business by 12.7% to € 332.9
million against the prior year. In many regions we achieved sales increases with combine har-
vesters and forage harvesters. The gross profit increased disproportionately in relation to sales;
this is mainly due to the encouraging development in reductions to cost of goods sold. It shows
that our measures to cut costs were successful (notably through increasing efficiency in the
production facilities). The better utilization of the factories also impacted positively. Overall, cost
of goods sold rose less than sales despite a special burden due to non-scheduled depreciation
on our factory in Metz (€ 6.9 million).
The income from investments declined further in this year, since write-offs in the amount of
€ 9.6 million on the book values of the joint venture companies with Caterpillar had to be
managed. Furthermore, the start-up expenses of these companies led to high proportionate
losses so that the income from investments shows a negative result of € -17.6 million
(prior year: € -7.5 million).
A 1,051.2 (+6.9%) Agricultural Engineering*
B 72.9 (+6.3%) Production Engineering
C 23.8 (+18.2%) Industrial Engineering
* 166.3 (+12.8%) thereof spare parts/accessories
SALES BY PRODUCT GROUPS in € million
CB
A

49
The financial income changed only slightly in the year under review. In the past years, CLAAS
took precautions against a possible capital-market interest rate rise. Thus, at the beginning of
1999, advantage was taken of the historically low interest rate level with a Euro bond issuance
in the amount of € 100 million. In addition, we almost eliminated the interest risk for a part of
the seasonally fluctuating current capital requirement through derivatives. However, due to these
measures we could not fully participate in the declining capital-market interest rate level. This
development also influenced the derivatives position that had a clearly lower positive valuation
influence on the net interest income/expenditure against the prior year. By contrast, the increase
in the money market interest level in the prior year was used by CLAAS to improve the income
from interest and securities through active asset management. The thus stabilized income from
interest and securities could be improved through positive results in foreign currency manage-
ment; in total, the financial income improved compared with the prior year by approx. € 2.3 mil-
lion to € -13.1 million.
The successes realized in the operative areas are also reflected in the profits from ordinary ac-
tivities; with 37% they rose considerably from € 28.0 million to € 38.4 million. The measures to
reduce administration expenses also contributed to this result. Despite the increased business
volume, we lowered the general and administration expenses by 4% to € 50.7 million. Thus,
we were able in the past business year to influence central elements of our expense structure –
notably cost of goods sold and administration expenses – and to raise the results potentials.
The chart on expense structure clarifies that cost of goods sold and administration expenses
comprise about 79% of our operating expenses. The selling expenses, which increased in pro-
portion with sales and the research and development expenses, increased by 4% and developed
as expected. The increase in selling expenses results mainly from the increased sales in other
European countries. Overall, the special burdens in the results from investments were more
than compensated by the good core business and successful cost reduction measures.
These effects also impacted on the income before taxes of € 36.5 million, which is nearly 40%
higher than that of the prior year (€ 26.2 million).
71.6 61.9 24.4 28.0 38.4
97* 98* 99* 00 01
PROFITS FROM ORDINARY ACTIVITIES in € million
(*Figures based on German GAAP)

50 MANAGEMENT REPORT
The net income increased by 22.2% from € 11.7 million to € 14.3 million; it increased less than
the income before taxes notably on account of the taxes on income charge. The high burden
from taxes on income was, among other things, due to the net losses for the year of foreign
companies that are disallowed as a deduction for tax purposes. Furthermore, the write-offs on
the US joint venture with Caterpillar that had no tax effects could not be balanced through de-
ferred taxes, so that the net income was burdened with a disproportionately high income taxes
charge.
GROWTH STRATEGY: CAPITAL EXPENDITURE IN INNOVATION AND MODERNIZING
The capital expenditures reached a record level with € 58.1 million. The increased depreciation
on tangible assets and intangible assets of € 35.1 million, which rose in connection with the
high capital expenditure, was again clearly below the capital expenditure.
Capital expenditure focused, as in the prior years, on measures for the structural adjustment of
production facilities and production processes. The consistent modernization of the main factory
in Harsewinkel continued swiftly with a total expenditure of almost € 60 million. The Federal
Ministry for the Environment decided to partially fund the pilot project »Erection of an innovative
painting plant« as core of the new factory from a special capital expenditure program. The envi-
ronmentally friendly plant is considered a model for other industries.
The changeover of production processes will direct the production to completely new methods.
While so far only finished machines left the assembly line, components and packages can now
be produced in Harsewinkel for worldwide assembly. This is the decisive precondition for build-
ing up a flexible production network around the globe.
2001 2000
A 74.0 73.8 Cost of goods sold
B 14.7 14.4 Selling expenses
C 4.6 5.0 General and administration expenses
D 4.4 4.4 Research and development expenses
E 2.3 2.4 Other operating expenses
C
B
A
D E
EXPENSE STRUCTURE in % of Total Operative Expenses

51
The project, started in the prior year, to introduce the SAP R/3 software in the whole Group will
enable CLAAS to be able to react simply and flexibly to the requirements of the markets with
newly structured corporate processes. In the year under review, the first module was set suc-
cessfully »Go Live”.
The innovation push in the product range required additional capital expenditure on type-related
tools and specific installations for model maintenance. This related, among other things, to the
new baler series »VARIANT« and the combine harvester »VOLLHANG MEDION« which can also
be used on extreme slopes. CLAAS’ capital expenditure on securing and expanding the market
presence on the European core markets remained unchanged on a high level and the activities
of CLAAS Financial Services were intensified further.
CASH FLOW FROM OPERATING ACTIVITIES INCREASED BY MORE THAN 50%
The cash inflow for CLAAS Group from current business activities totaled € 113.1 million (prior
year: € 73.1 million). This is above all due to the very good core business which also led to an
improvement of gross profit by € 37.5 million – analogously to the cash flow from operating
activities. Another positive effect was the further reduction of working capital, since it was pos-
sible in the year under review to further lower the already low inventories by another € 12.7 mil-
lion. The capital expended in the year under review – above all to expand and modernize our
production facilities – led to a rise of net capital expenditure on fixed assets (capital expenditure
less disinvestments) to € 61.5 million; it thus exceeded the prior year value (€ 31.3 million)
by € 30.2 million. The total cash flow used for investing activities exceeded the cash flow from
operating activities by € 12.5 million. This includes also the cash outflow for additions to securi-
ties under US GAAP in the amount of € 64.0 million (prior year: € 46.1 million). These securi-
ties constitute short-term investments. Connected with a slight cash outflow from financing
activities, cash and cash equivalents fell by a total of € 14.4 million or 8% to € 172.4 million.
Capital expenditures
Depreciation
(* Figures based on German GAAP)
32.331.235.1
58.1
29.032.9
47.5
37.0
27.924.2
97* 98* 99* 00 01
CAPITAL EXPENDITURES AND DEPRECIATION in € million

52 MANAGEMENT REPORT
The cash flow according to DVFA/SG of € 67.7 million exceeded the prior year level (€ 39.6 million)
by 71%; the cash flow to sales ratio increased from 3.7% to 5.9%.
LIQUIDITY AND FINANCING FLUCTUATE DURING THE YEAR
At the balance sheet date, CLAAS discloses liquidity which increased from € 284.8 million to
€ 334.1 million (liquidity includes cash and cash equivalents plus securities held as current
assets). This high level of cash and cash equivalents results above all from the fact that the
funds commitment in the working capital is lowest towards the end of the business year. Li-
quidity at year-end is thus not representative for the entire business year. Rather, the cyclical
course of business typical for the agricultural machines industry leads to considerable liquidity
fluctuations during the year. This »swing« has been reduced considerably with an Asset Backed
Securities Program (ABS Program) started in the prior year. In this ABS Program, trade receiva-
bles are sold to a special purpose vehicle, in particular to reduce the liquidity requirement during
the year.
2001 2001 2000 2000
CASH FLOW STATEMENT € million % € million %
Cash flow according to DVFA/SG 67.7 39 39.6 21
Cash flow from operating activities 113.1 66 73.1 39
Cash flow used for investing activities (125.6) (73) (77.4) (41)
Cash flow from financing activities (1.9) (1) 5.3 3
Change in cash and cash equivalents with cash flow impact (14.4) (8) 1.0 1
Influence of foreign exchange (0.4) 0 0.9 0
Opening balance of cash and cash equivalents 187.2 109 185.4 99
Closing balance of cash and cash equivalents 172.4 100 187.2 100
63.3 70.9 53.1 39.6 67.7
97* 98* 99* 00 01
CASH FLOW ACCORDING TO DVFA/SG in € million
Cash flow
Cash flow to sales ratio
(* Figures based on German GAAP)
6.5 6.4
5.1
3.7
5.9

53
The first-degree liquidity (liquidity in relation to short-term external capital) fell to a value of
109.7% (prior year: 118.3%) through the build-up of cash and cash equivalents with simulta-
neous increase in short-term liabilities. The second-degree liquidity (monetary current assets
in relation to short-term external capital) fell to 173.1% (prior year: 197.2%).
Apart from the ABS Program (volume: € 114 million), the CLAAS Group has financing commit-
ments of about € 500 million which are broken down in the notes to the accounts. They include
a Euro bond that CLAAS issued on the international capital market. This bond in the amount of
€ 100 million was issued by CLAAS KGaA mbH on 8 March 1999, at the time of a historically
favorable interest rate level. It bears an interest coupon of 4.5% and has a maturity of 7 years.
Furthermore, we took precautions for the financial safeguarding of future growth of CLAAS
Group through the issuance of profit participation rights in the amount of € 41 million and the
conclusion of a syndicated credit facility of more than € 100 million.
2001 2001 2000 2000
BALANCE SHEET STRUCTURE € million % € million %
Fixed assets 211.2 22.7 187.1 21.8
Current assets 720.2 77.3 672.5 78.2
Assets 931.4 100.0 859.6 100.0
Equity 268.8 28.9 263.5 30.6
Funds similar to equity 56.3 6.0 55.5 6.5
Long-term liabilities 301.9 32.4 299.9 34.9
Short-term liabilities 304.4 32.7 240.7 28.0
Equity and liabilities 931.4 100.0 859.6 100.0

54 MANAGEMENT REPORT
ACTIVE INVENTORY MANAGEMENT, HIGH LIQUIDITY
The balance sheet total expanded in the year under review by € 71.8 million to € 931.4 million.
Fixed assets changed from € 187.1 million to € 211.2 million. The additions and increases from
first-time consolidation totaling € 84.8 million (prior year: € 70.7 million) are contrasted with
disposals at residual book values of € 15.1 million (prior year: € 33.6 million) and depreciation
of € 44.7 million (prior year: € 28.5 million). The disposal amount disclosed in the movements
in fixed assets under financial assets under shares in associated companies constitutes changes
caused by valuation in the amount of € 11.9 million (prior year: € 10.1 million).
After inventories were reduced already in the prior year, a further reduction of € 12.7 million to
€ 168.5 million has been achieved. This low inventory level is due to targeted inventory manage-
ment besides very good sales.
Trade receivables increased from € 122.9 million to € 130.5 million, but thus still remain on a
low level. The ratio of trade receivables to sales revenues amounts to about 11%. This favorable
ratio is caused, apart from the receivables sale through the ABS Program, by a strict receivables
control that also aims at minimizing credit and country risks.
Liquidity, already high in the prior year (including securities held as current assets), increased
from € 284.8 million to € 334.1 million. It accounts for 36% (prior year: 33%) of the balance
sheet total.
CAPITAL WITH SOLID COVER RATIOS
Equity increased slightly against the prior year from € 263.5 million to € 268.8 million with the
equity ratio falling from 30.6% to 28.9%. The decline of this ratio is due to the only to low in-
crease in equity against the clearly expanded financing volume.

55
The long-term external capital amounts to € 301.9 million (prior year: € 299.9 million). It is
composed of pension provisions, the other non-current pension provisions and liabilities with a
remaining term of more than one year. The silent partnership of CLAAS-Mitarbeiterbeteiligungs-
Gesellschaft (CMG) which is not classified as equity in the actual sense under US GAAP
amounts to € 15.0 million (prior year: € 14.1 million).
Including equity, the equity-to-fixed-assets ratio amounts to 297.0% (prior year: 330.9%). The
extended equity-to-fixed-assets ratio (non-current capital in relation to sum of fixed assets and
50% of inventories) amounted to 212.2% (prior year: 222.9%). The cover ratios between non-
current capital and assets thus again reached very good values.
COST REDUCTION IN PROCUREMENT
In purchasing, the supplier basis in Central and Eastern Europe has been expanded. We support
further internationalization through intensive qualifying measures at supplier level in order to
safeguard the high requirements to our product quality. Apart from process optimizing in the
supply chain, we advanced the development of electronic order catalogues for indirect goods
and direct supply concepts through logistic service providers.
QUALITY CONTINUES ON HIGH LEVEL
Our products and services continued to be subject to highest requirements in the year under
review. We ensured this, among other things, through introducing product release audits in pilot
series machines and quality improvements of internal material transport. With a new painting
plant in our Hungarian production facility, we further improved the quality of the cutterbars. CLAAS
Industrietechnik was certified in April 2001 according to the new norm DIN EN ISO 9001-2000.
Equity
Funds similar to equity
Long-term liabilities
Short-term liabilities
Fixed assets
Inventories
Liquidity
Other current assets
ASSETS EQUITY AND LIABILITIES
860 931 931 860
BALANCE SHEET STRUCTURE in %
18%
36%
23%
21%
33%
24%
35%
31%
28%
22% 23%
6%32%
29%
33%
6%
00 01 01 00
Balance sheet total in € million

56 MANAGEMENT REPORT
OPTIMIZING PRODUCTION STRUCTURE: MORE FLEXIBLE, FASTER AND LEANER!
The main Harsewinkel factory is at present renovated from top to bottom and is equipped with
a state-of-the-art central enameling line with powder coating varnish technology. At the same
time, shell construction and assembly of combine harvesters and forage harvesters will be per-
formed in future on three instead of two production lines in order to be able to react more flex-
ible to the market. This capital expenditure in connection with matching logistic measures will
allow a further reduction of inventories until the end of 2003 according to our planning and lead
to considerable cost savings.
In the Saulgau factory, production structure and logistics will be made more flexible and leaner
with the project »ProLog«. Through changed material flow, leaner parts manufacture (among
other things setting up machine tool islands), more flexible assembly with shorter assembly line
change times and mixed assembly as well as increased modularizing, we strive for even higher
flexibility to supply the market.
Highly specialized production know-how has been gathered at CLAAS Fertigungstechnik, which
manufactures, among other things, press dies for complicated body parts. »Manufactured cam-
shafts« are in the meantime being produced with full automation. The constantly increasing
orders at CLAAS Fertigungstechnik confirm our strategic intention to build up a further success-
ful line outside of agricultural engineering.
HIGH RATING FOR RESEARCH AND DEVELOPMENT
For years, CLAAS has expended capital on a knowledge management system in order to pre-
serve and expand its leadership in technology. A material element is the search and selection of
trendsetting technologies and their conversion into products. In the entire CLAAS Group, tech-
nology teams have been created who work together on new product ideas. Electronic support,
which makes available the acquired knowledge in a structured form, is being prepared.
34.6 43.9 45.4 46.5 48.5
97* 98* 99* 00 01
RESEARCH AND DEVELOPMENT EXPENSES in € million
(* Figures based on German GAAP)

57
Throughout the Group, CLAAS develops an on-board computer to control add-on units at stan-
dard interfaces. This helps to establish a uniform operation philosophy for the »human-machine-
interface«.
In the business year 2001, CLAAS continued its intensive development activities and once more
increased the expenses for research and development (R&D) from € 46.5 million to € 48.5 mil-
lion. They account for more than 4% of sales. This documents the high standing that CLAAS
attributes to the further development of its products and systems.
Results of R&D activities:
• Reworking of entire LEXION series
• LEXION 470 and LEXION 460/430 Evolution
• Entire green harvest machinery chain more efficient through new powerful machines
OUTLOOK
The attacks in the U.S.A. have clearly led to a more unstable political and economic situation.
The effects on agriculture and agricultural engineering are hard to predict.
In Western Europe, the concentration process in agriculture will continue so that overall a
further reduction of the total market is to be expected. The structural adjustments that could
be observed in the past years are likely to increase. In many agricultural operations, funds will
increasingly be directed towards enlargement, specialization and rationalization of machine
capacities.
In Central Europe and CIS countries, the domestic food production with local inputs has a high
priority. Therefore, capital expenditure on a pool of agricultural machines in order to expand
harvesting capacity is a material precondition to stabilize the economic development. CLAAS
already consistently took advantage of the resulting growth opportunities in the past and sees
further sales potential in future.

58 MANAGEMENT REPORT
The North American market recovered slightly in the past year. It is likely to stabilize on this level.
Overall, we largely expect a balance of positive and negative market developments for the CLAAS
operations. However, the risk structure of the operations tends to become higher with the ex-
pansion of the market position in Central Europe and CIS countries, since a set back in respect
of financing in these countries might be possible in the future. The development in Argentina is
cause for particular concern. To which extent the payment crisis in Argentina will spill over to
other newly industrializing countries cannot be estimated conclusively at present.
Against this background, CLAAS will further consolidate its position as market leader in Western
Europe and expand its positions in Central and Eastern Europe.
The successful introduction of new products and the leadership in technology are two material
factors for success. Although the increase in the required research and development budget will
burden the results in the short term, it also safeguards the company’s future and makes it faster
and more flexible.
CLAAS Fertigungstechnik has expanded its position in the automobile, supply and aviation in-
dustry through the development of specific components in tool manufacture and in transfer lines.
The once more extended capacities are fully utilized and will hence lead to higher business vol-
ume. At the level of CLAAS Industrietechnik, too, the business with external customers will grow
on the basis of attractive new developments of hydraulic components and drive assemblies and
improved production and test facilities.
The product innovations are accompanied by a capital expenditure offensive. CLAAS will spend
more than € 50 million in the year 2002 on expanding its production locations. The most im-
portant single capital expenditure is the newly structured production in the main Harsewinkel
factory including a modern, green painting plant.
Likewise, the introduction of a new generation of information technology will be the focus of the
business year 2002. The SAP/R3 system is accompanied by e-commerce and further Internet
business processes. We are convinced that our company will gain a substantial competitive
advantage from the intelligent use of data networks.
For the business year 2002, we expect to be able to again achieve the record sales of the prior
year. The result will have to absorb some special charges for research and development, for
information technology as well as burdens from the planned restructuring. Therefore, we con-
sider achieving the results of the prior year level to be an ambitious goal.

59
The core business of agricultural engineering is always subject to uncertainties caused by
weather and politics, for which the company is prepared. Employees and management are ready
to react appropriately and decisively to unforeseen developments. CLAAS will take advantage of
every opportunity to consolidate and expand its position on the global market.
MANAGEMENT STATEMENT CONCERNING THE PREPARATION OF THE
CONSOLIDATED FINANCIAL STATEMENTS AND RISK CONTROL (RISK REPORT)
The management of CLAAS KGaA mbH is responsible for the preparation of the consolidated
financial statements and the group management report. The consolidated financial statements as
at 30 September 2001 were prepared according to United States Generally Accepted Accounting
Principles (US GAAP). They correspond with the directive 83/349/EEC. The prior year figures
have been determined according to the same principles. According to § 292a HGB, the consoli-
dated financial statements under US GAAP thus have exempting effect. Therefore, consolidated
financial statements prepared according to German GAAP were no longer required.
The internal control system, standardized guidelines throughout the Group and continuous
employee training and further training ensure that the consolidated financial statements and
group management report are orderly drawn up and comply with statutory requirements. The
internal auditors keep a running check on compliance with the guidelines as well as the reliabil-
ity and effectiveness of the control systems.
Deloitte & Touche GmbH, Wirtschaftsprüfungsgesellschaft, audited the consolidated financial
statements and group management report and issued the full audit opinion below.
Monitoring and control of potential risks to the assets is part of business management. These
functions are supported by an early warning system for risks, which also meets the requirements
of the law on control and transparency in business (KonTraG).
CLAAS has systematically identified and analyzed the risks that exist in all the Group companies
and has grouped them together according to potential level of damage and probability of occur-
rence. The main risks arise from the product market, the environment and the financial markets.
A risk information system has also been developed to enable significant risks to the Group being
detected at an early stage.
From the business year 2001, control of market risks identified will be improved by structured
monitoring of indicators relevant to the market and comprehensive information gathered at
central points in the Group. By doing so, we can respond even more promptly to developments
in the competitive environment. The same applies to risks stemming from agricultural policy
decisions and climate changes that indirectly affect the profit situation of CLAAS.

60 MANAGEMENT REPORT
Early recognition of environmental risks which could, for example, lead to loss of market shares
due to political or economic changes on particular sales markets is facilitated by the gathering
of information relevant to the outside world by the marketing divisions and companies of the
CLAAS Group. In addition there are new indicators that take account of predicted income devel-
opments on certain national markets. An important component of the continuous monitoring of
economic risks is the reporting system. Besides the external data, detailed internal reports and
analyses are drawn up monthly on such issues as inventories, liquidity positions and outstand-
ing debts. On an on-going basis, deviations from budgets, the satisfiability of forecasts and the
occurrence of new monetary and non-monetary risks are monitored and reviewed. This allows
prompt reaction to risks arising from changes in CLAAS’ business environment.
CLAAS counters financial and foreign exchange risks by hedging currency and interest positions
with derivative financial instruments as well as regular close monitoring of a number of early
warning indicators. To avoid foreign exchange risks and interest rate fluctuation risks, CLAAS
operates systematic currency and interest rate management. This is controlled centrally by
CLAAS KGaA mbH and is organized according to the principles of due segregation of functions.
The relevant risk assessments and detailed guidelines and specifications are taken into account
in connection with the use of derivatives.
Provisions have been made where necessary for the risks arising from the different areas.
Contingencies and other financial liabilities are monitored; the extent of these is shown in the
Notes.
After examining the current risk situation we have come to the conclusion that no specific risks
exist which could jeopardize the continued existence of the CLAAS Group.
Harsewinkel, 7 December 2001
Nikolaus Feil Dr.-Ing. Hermann Garbers
Rüdiger A. Günther Martin Richenhagen

61
CONSOLIDATED FINANCIAL STATEMENTS
ACC. TO US GAAPIndependent Auditor’s Report
We have audited the consolidated financial statements prepared by Claas Kommanditgesellschaft auf
Aktien mbH, Harsewinkel, consisting of balance sheet, profit and loss account, statement of changes
in shareholders’ equity, cash flow statement and notes to the accounts for the business year from 1
October 2000 to 30 September 2001. The preparation and contents of the consolidated financial state-
ments pursuant to United States Generally Accepted Accounting Principles (US GAAP) are the responsi-
bility of the Company’s management. Our responsibility is to express an opinion based on our audit
whether the consolidated financial statements comply with US GAAP.
We conducted our audit of the consolidated annual financial statements in accordance with the German
auditing provisions and the generally accepted German standards for the audit of financial statements
promulgated by the Institut der Wirtschaftsprüfer in Deutschland (German Institute of Auditors). Those
standards require that we plan and perform the audit such that the opinion that the consolidated finan-
cial statements are free from material misstatements can be given with reasonable assurance. Knowledge
of the business activities and the economic and legal environment of the Group and evaluations of pos-
sible misstatements are taken into account in the determination of audit procedures. The evidence sup-
porting the values and disclosures in the consolidated financial statements is examined primarily on
a test basis within the framework of the audit. The audit includes assessing the accounting principles
used and significant estimates made by the legal representatives, as well as evaluating the overall
presentation of the consolidated financial statements. We believe that our audit provides a reasonable
basis for our opinion.
In our opinion, the consolidated financial statements give a true and fair view of the net assets, financial
position and results of operations of the Group as well as of the cash flows of the business year in
accordance with United States Generally Accepted Accounting Principles.
Our audit, which also covered the group management report prepared by management for the business
year from 1 October 2000 to 30 September 2001, has not led to any reservations. In our view, the group
management report on the whole provides a suitable understanding of the Group’s position and suitably
presents the risks of future development. Furthermore, we confirm that the consolidated financial state-
ments and the group management report for the business year from 1 October 2000 to 30 September
2001 meet the requirements for exempting the Company from preparing consolidated financial state-
ments and a group management report according to German law. We audited the compliance of the
preparation of consolidated financial statements with the 7th EU Directive, required for exemption from
the requirement to prepare consolidated financial statements under commercial law, on the basis of the
interpretation of the directive by DRS 1 »Befreiender Konzernabschluss nach § 292a HGB« (exempting
consolidated financial statements according to § 292a HGB).
Düsseldorf, 7 December 2001
Deloitte & Touche GmbH
Wirtschaftsprüfungsgesellschaft
Euskirchen Kalvelage
German Public Auditor German Public Auditor
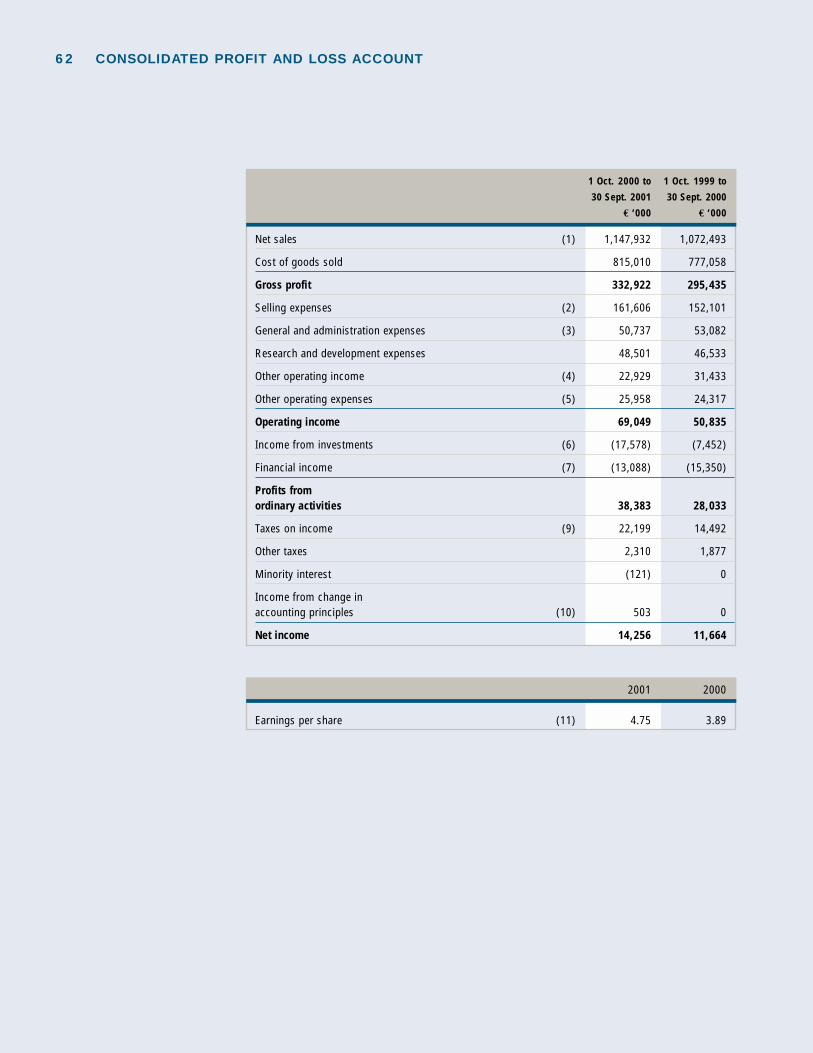
62
1 Oct. 2000 to 1 Oct. 1999 to
30 Sept. 2001 30 Sept. 2000
€ ‘000 € ‘000
Net sales (1) 1,147,932 1,072,493
Cost of goods sold 815,010 777,058
Gross profit 332,922 295,435
Selling expenses (2) 161,606 152,101
General and administration expenses (3) 50,737 53,082
Research and development expenses 48,501 46,533
Other operating income (4) 22,929 31,433
Other operating expenses (5) 25,958 24,317
Operating income 69,049 50,835
Income from investments (6) (17,578) (7,452)
Financial income (7) (13,088) (15,350)
Profits from ordinary activities 38,383 28,033
Taxes on income (9) 22,199 14,492
Other taxes 2,310 1,877
Minority interest (121) 0
Income from change in accounting principles (10) 503 0
Net income 14,256 11,664
2001 2000
Earnings per share (11) 4.75 3.89
CONSOLIDATED PROFIT AND LOSS ACCOUNT

63CONSOLIDATED BALANCE SHEET AS AT 30 SEPTEMBER 2001
ASSETS 30 Sept. 2001 30 Sept. 2000
€ ‘000 € ‘000
Intangible assets 6,790 3,507
Tangible assets 155,491 138,710
Financial assets 48,872 44,838
Total fixed assets (12) 211,153 187,055
Inventories (13) 168,537 181,219
Accounts receivable and other assets (14) 192,772 189,985
Securities with a maturity between 90 and 360 days (15) 161,616 97,574
Derivative financial instruments 2,820 417
Cash and cash equivalents (16) 172,437 187,239
Total current assets 698,182 656,434
Deferred taxes (9) 17,660 12,267
Prepaid expenses 4,437 3,856
Balance sheet total 931,432 859,612
EQUITY AND LIABILITIES 30 Sept. 2001 30 Sept. 2000
€ ‘000 € ‘000
Subscribed capital 78,000 76,694
Capital reserves 38,347 38,347
Revenue reserves 133,557 133,981
Other comprehensive Income (17) 4,627 2,837
Net income 14,256 11,664
Total equity (18) 268,787 263,523
Profit participation right 40,903 40,903
Silent partnership (19) 15,044 14,100
Minority interest 390 449
Total funds similar to equity 56,337 55,452
Provisions (20/21) 278,511 256,196
Liabilities (22) 318,361 283,576
Deferred taxes (9) 9,436 865
Total external capital 606,308 540,637
Balance sheet total 931,432 859,612

64 CASH FLOW STATEMENT
2001 2000
€ ‘000 € ‘000
Net income 14,256 11,664
Depreciation on fixed assets 44,740 28,536
Change in pension provisions 612 2,371
Change in other non-current provisions (2,562) (2,876)
Other expenditure/income not counted as payment 10,670 (114)
Cash flow according to DVFA/SG 67,716 39,581
Change in current provisions 33,458 6,165
Losses/gains on disposal of fixed assets (2,166) 658
Change in inventories, receivables and other assets 257 10,874
Change in other liabilities and other equity 16,236 16,241
Change in derivative financial instruments (2,403) (417)
Cash flow from operating activities 113,098 73,102
Expenditure on investment in fixed assets (67,005) (69,139)
Proceeds from retirement of fixed assets 5,459 37,844
Cash outflow for purchase of securities (180,588) (115,452)
Cash inflow from disposal of securities 116,546 69,359
Cash flow used for investing activities (125,588) (77,388)
Proceeds from issuing bonds and other current and non-current borrowing 16,631 31,908
Disbursement on repayment of credit and loans (14,556) (19,466)
Proceeds to silent partnership (CMG) 944 1,150
Increase/decrease in loan accounts of the partners 2,823 (707)
Proceeds from minority shareholders (58) 79
Dividends paid out (7,669) (7,669)
Cash flow from financing activities (1,885) 5,295
Change in cash and cash equivalents (14,375) 1,009
Influence of exchange rate and other value changes on cash and cash equivalents (427) 861
Opening balance of cash and cash equivalents 187,239 185,369
Closing balance of cash and cash equivalents 172,437 187,239
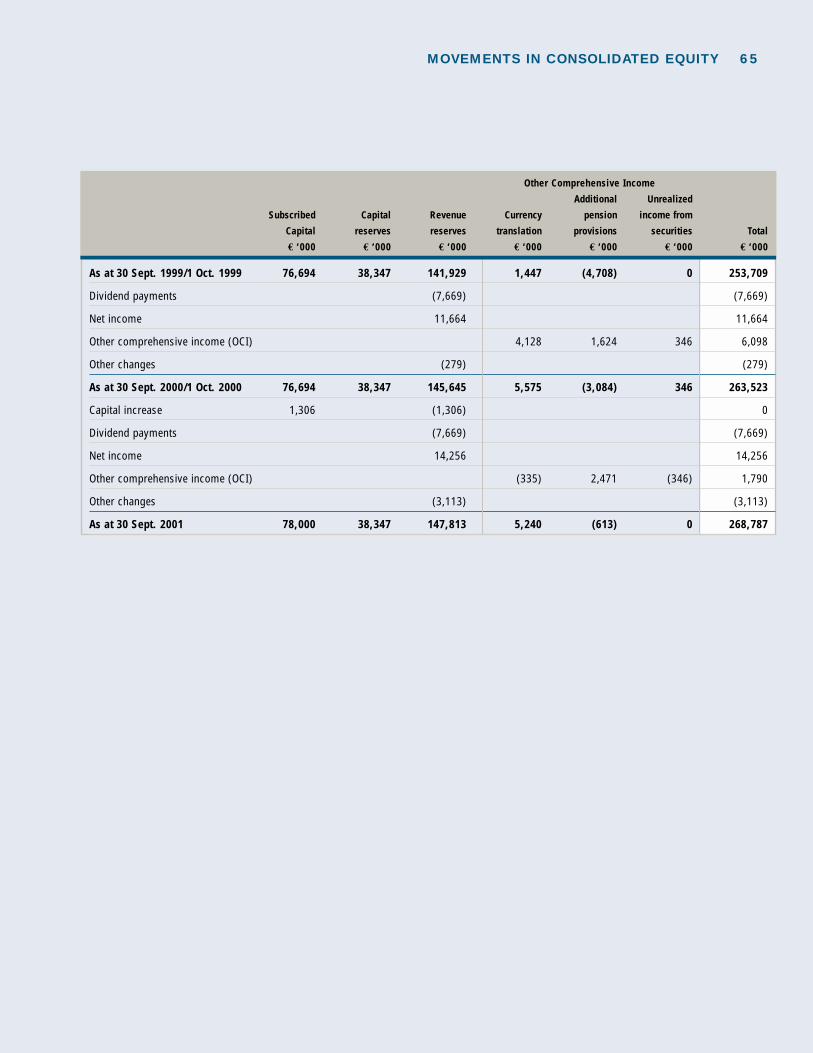
65MOVEMENTS IN CONSOLIDATED EQUITY
Other Comprehensive Income
Additional Unrealized
Subscribed Capital Revenue Currency pension income from
Capital reserves reserves translation provisions securities Total
€ ‘000 € ‘000 € ‘000 € ‘000 € ‘000 € ‘000 € ‘000
As at 30 Sept. 1999/1 Oct. 1999 76,694 38,347 141,929 1,447 (4,708) 0 253,709
Dividend payments (7,669) (7,669)
Net income 11,664 11,664
Other comprehensive income (OCI) 4,128 1,624 346 6,098
Other changes (279) (279)
As at 30 Sept. 2000/1 Oct. 2000 76,694 38,347 145,645 5,575 (3,084) 346 263,523
Capital increase 1,306 (1,306) 0
Dividend payments (7,669) (7,669)
Net income 14,256 14,256
Other comprehensive income (OCI) (335) 2,471 (346) 1,790
Other changes (3,113) (3,113)
As at 30 Sept. 2001 78,000 38,347 147,813 5,240 (613) 0 268,787

66 MOVEMENTS IN CONSOLIDATED FIXED ASSETS
Historical purchase or
manufacturing cost
Change in Com-As at Currency As at panies included
30 Sept. 2000 adjustment 1 Oct. 2000 in consolidation Additions€ ‘000 € ‘000 € ‘000 € ‘000 € ‘000
I. Intangible assets
1. Concessions, industrial and similar rights and assets and licenses in such rights 8,055 0 8,055 0 4,733
2. Goodwill 8,925 (2) 8,923 0 0
3. Payments in advance 21 1 22 0 0
17,001 (1) 17,000 0 4,733
II. Tangible assets
1. Land, land rights and buildings including buildings on third-party land 96,183 (378) 95,805 207 2,456
2. Plant and machinery 188,568 (60) 188,508 96 6,663
3. Other equipment, factory and office equipment 114,069 (172) 113,897 590 10,632
4. Payments in advance for construction work in progress 3,083 7 3,090 0 18,652
5. Capital lease 6,953 0 6,953 0 14,917
408,856 (603) 408,253 893 53,320
III. Financial assets
1. Shares in associated companies 12,060 (41) 12,019 (94) 22,848
2. Securities held as fixed assets 33,232 (306) 32,926 0 3,134
45,292 (347) 44,945 (94) 25,982
Total 471,149 (951) 470,198 799 84,035

67
Historical purchase or Depreciation Net values
manufacturing costThereof in
Depreciation Thereof Companies As atReclassi- in the busi- Accumulated Currency included in 30. Sept. As at
Disposals fications ness year depreciation adjustments consolidation 2001 Prior year € ‘000 € ‘000 € ‘000 € ‘000 € ‘000 € ‘000 € ‘000 € ‘000
420 1 1,279 6,038 0 0 6,331 2,913
0 0 114 8,464 (2) 0 459 572
22 0 0 0 0 0 0 22
442 1 1,393 14,502 (2) 0 6,790 3,507
1,422 360 2,287 30,952 (128) 24 66,454 66,332
10,331 313 17,036 156,681 (81) 53 28,568 38,822
11,222 1,102 11,220 89,374 (107) 410 25,625 25,622
622 (1,776) 0 0 0 0 19,344 3,082
1,957 0 3,179 4,413 0 0 15,500 4,852
25,554 (1) 33,722 281,420 (316) 487 155,491 138,710
11,880 0 9,625 10,079 0 0 12,814 11,606
2 0 0 0 0 0 36,058 33,232
11,882 0 9,625 10,079 0 0 48,872 44,838
37,878 0 44,740 306,001 (318) 487 211,153 187,055

68 RELATED COMPANIES AND SIGNIFICANT SHARES IN RELATED COMPANIES
AS AT 30 SEPTEMBER 2001
I. RELATED COMPANIES INCLUDED IN THE CONSOLIDATED FINANCIAL STATEMENTS
DOMESTIC Capital Holding
Ser. No. Company in % with *
1 CLAAS Kommanditgesellschaft auf Aktien mbH, Harsewinkel € 78,000,000
2 CLAAS Selbstfahrende Erntemaschinen GmbH, Harsewinkel € 25,600,000 100 1
3 CLAAS Beteiligungsgesellschaft mbH, Harsewinkel € 52,000 100 2
4 CLAAS Saulgau GmbH, Bad Saulgau € 7,700,000 100 1
5 CLAAS Vertriebsgesellschaft mbH, Harsewinkel € 3,100,000 100 1
6 CLAAS Fertigungstechnik GmbH, Beelen € 5,300,000 100 1
7 CLAAS Industrietechnik GmbH, Paderborn € 7,700,000 100 1
8 Burkhardt GmbH, Nördlingen € 260,000 100 6
9 Rothe Landtechnik GmbH, Heiligengrabe € 410,000 80 5
10 Landtechnik Steigra GmbH, Steigra € 615,000 90 5
11 Mühlengeez Landtechnik GmbH & Co. Handels KG, Mühlengeez € 52,000 100 5
12 Mühlengeez Landtechnik GmbH € 26,000 100 5
13 Semmenstedt Landtechnik GmbH, Semmenstedt € 500,000 100 5
14 AGROCOM GmbH & Co. Agrarsystem KG, Bielefeld € 117,600 87.5 1
15 AGROCOM Verwaltungs GmbH, Bielefeld € 32,150 87.5 1
16 agrocom. Systempartner GmbH, Rostock € 26,000 52.5 14
17 CLAAS Ukraine Investitions GmbH, Harsewinkel € 100,000 100 1
FOREIGN Capital Holding
Ser. No. Company in % with *
18 Usines CLAAS France S.A.S., Metz-Woippy/France € 2,000,000 100 1
19 CLAAS France S.A.S., Paris/France € 8,842,043 100 1
20 CLAAS Holdings Ltd., Saxham/Great Britain £ 10,800,000 100 1
21 CLAAS U.K. Ltd., Saxham/Great Britain £ 101,100 100 20
22 J. Mann & Son Ltd., Saxham/Great Britain £ 3,000,000 100 21
23 Southern Harvesters Ltd., Saxham/Great Britain £ 150,000 100 21
24 Seward Agricultural Machinery Ltd., Doncaster/Great Britain £ 500,000 100 21
25 Mill Engineers Ltd., Cheltenham/Great Britain £ 125,000 62 21
* Serial number of company owning the holding

69
FOREIGN Capital Holding
Ser. No. Company in % with *
26 Kirby Agricultural Ltd., Market Harborough/Great Britain £ 100 100 22
27 Teleporters Ltd., Saxham/Great Britain £ 2,500,010 100 20
28 S.I.S. Ltd., Coventry/Great Britain £ 45,000 100 6
29 CLAAS Italia S.p.A., Vercelli/Italy £ 2,600,000 100 1
30 CLAAS Ibérica S.A., Madrid/Spain £ 3,307,000 100 1
31 CLAAS of America Inc., Columbus/Indiana/US US-$ 9,800,000 100 1
32 CLAAS Hungaria Kft., Törökszentmiklos/Hungary HUF 552,740,000 100 1
33 CLAAS Australia Pty. Ltd., Albury/N.S.W./Australia AUD 1,532,445 100 1
34 CLAAS Finance B.V., Amsterdam/The Netherlands NLG 40,000 100 1
35 CLAAS Vostok GmbH, Moscow/Russia RUB 170,000 100 1
36 CLAAS-Ukraina DP, Kiev/Ukraine UAH 30,000 100 1
37 Port Mellen S.A., Montevideo/Uruguay UYU 360,000 100 1
38 CLAAS Argentina S.A., Sunchales/Argentine ARS 12,000 100 1
II. SIGNIFICANT SHARES IN RELATED COMPANIES
Capital Holding
Ser. No. Company in % with *
39 CLAAS GUSS GmbH, Bielefeld € 4,680,000 44.45 -
40 CS Parts Logistics GmbH, Bremen € 1,550,000 50 1
41 CLAAS CATERPILLAR EUROPE GmbH & Co. KG, Harsewinkel € 6,140,000 50 2
42 CLAAS CATERPILLAR EUROPE Verwaltungs GmbH, Harsewinkel € 52,000 50 2
43 Mecklenburger Landtechnik GmbH, Mühlengeez € 1,000,000 40 5
44 Landtechnik-Zentrum Chemnitz GmbH, Hartmannsdorf € 750,000 40 5
45 Worch und Schütze Landtechnik GmbH, Schora € 55,000 39 5
46 CATERPILLAR CLAAS AMERICA LLC., Omaha/Nebraska/US US-$ 20,000,000 50 3
47 Escorts CLAAS Ltd., Faridabad/India INR 70,000,000 40 1
48 CLAAS Valtra Finance Ltd., Basingstoke/Great Britain £ 3,000,000 49 20
49 RW Marsh Ltd., Lincolnshire/Great Britain £ 310,000 25 21
50 CLAAS Financial Services S.A.S., Paris/France FRF 24,000,000 10 1
51 HMC Investments Ltd., Drogheda/Ireland IEP 120,000 20 1
* Serial number of company owning the holding
70 CONSOLIDATED FINANCIAL STATEMENTS IN ACCORDANCE WITH UNITED STATES
GENERALLY ACCEPTED ACCOUNTING PRINCIPLES (US GAAP)
GENERAL INFORMATION
The consolidated financial statements of CLAAS KGaA mbH for the business year 2001 (1 October 2000
to 30 September 2001) were prepared in compliance with United States Generally Accepted Accounting
Principles (US GAAP). They were supplemented by a group management report and further explanations
required under § 292a of the Commercial Code (HGB). They thus meet the requirements of exemption
from the duty to prepare consolidated financial statements in accordance with German GAAP (HGB).
The cost of goods sales format has been applied to the consolidated profit and loss account. The classi-
fication of consolidated balance sheet and consolidated profit and loss account is based, as far as admis-
sible under US GAAP, on disclosure principles of German GAAP in the interest of a clear and continuous
disclosure. The prior year is reported accordingly.
In order to improve the clarity of presentation, individual items of the consolidated balance sheet and
the consolidated profit and loss account have been grouped. These items are broken down in the notes
to the accounts and explained correspondingly.
In accordance with § 264 (3) HGB, we do no publish the annual financial statements of our subsidiaries
CLAAS Fertigungstechnik GmbH, Beelen, CLAAS Industrietechnik GmbH, Paderborn, CLAAS Selbstfah-
rende Erntemaschinen GmbH, Harsewinkel, CLAAS Vertriebsgesellschaft mbH, Harsewinkel, CLAAS Saul-
gau GmbH, Bad Saulgau, and Burkhardt GmbH, Nördlingen, in the Official Gazette and do not prepare
notes to the accounts and management reports.
SCOPE OF CONSOLIDATION
CLAAS KGaA mbH and all subsidiaries are included in the consolidated financial statements. Apart from
CLAAS KGaA mbH, these are 38 companies in total (prior year: 34), 17 domestic and 21 foreign. The
companies consolidated according to the principles of full consolidation are companies in which CLAAS
KGaA mbH directly or indirectly holds the majority of voting rights or which are under the common
control of CLAAS KGaA mbH.
CLAAS GUSS GmbH, Bielefeld, Escorts CLAAS Ltd., Faridabad/India, CLAAS Valtra Finance Ltd.,
Basingstoke/Great Britain, as well as CLAAS CATERPILLAR EUROPE GmbH & Co., Harsewinkel,
CATERPILLAR CLAAS AMERICA LLC., Omaha/US, and CS Parts Logistics GmbH, Bremen, are included
in the consolidated financial statements as associated companies according to the equity method.
The list of shareholdings is attached to this report.

ACCOUNTING AND VALUATION METHODS
INTANGIBLE ASSETS AND TANGIBLE ASSETS
Intangible assets acquired are capitalized at cost and are amortized on a straight-line basis over their
estimated useful life. For intangible assets (except for goodwill), the useful lives amount to three years
as a rule; goodwill is amortized in principle over 4-10 years. Research and development expenses are
not capitalized in principle.
Tangible assets are valued at acquisition or production cost and, where depreciable, taking into account
scheduled depreciation. Movable assets are depreciated on a straight-line basis over their estimated use-
ful life. The useful lives amount to 20 to 50 years for buildings. The other items of tangible assets are
recognized at useful lives between three and twelve years. Material interest on borrowed capital which
arises for a qualified asset during its construction time is capitalized and depreciated after completion
of the asset over its useful life.
Where indications of impairments exist for fixed assets, impairment tests according to the Statement
of Financial Accounting Standards (SFAS) No. 121 are performed. If an impairment exists, a write-down
is made on the asset and or the superior cash-generating unit. In the case of non-current assets which
continue to be used and are not intended for sale, the carrying amount of the non-current asset and the
sum of the expected undiscounted cash flow resulting from the use of the asset are compaired in the
impairment test. If the sum of the expected undiscounted cash flows is lower than the carrying amount,
a write-down to the fair value is performed.
INVESTMENTS
To the extent that it is possible to exercise significant influence, investments in associated companies
and joint ventures are accounted for at the relevant proportion of equity capital (application of the equity
method). The other investments are classified as securities that are neither part of the trading portfolio
nor held-to-maturity (»available-for-sale«), if the shares held by CLAAS are listed on a stock exchange
and/or market prices are publicly available. If no publicly available market price is on hand for other
investments, they are accounted for at cost (possibly reduced by non-scheduled depreciation).
71

72 CONSOLIDATED FINANCIAL STATEMENTS
SECURITIES
According to SFAS 115, securities are classified into three categories: held-to-maturity, available-for-sale
and trading. The securities held by CLAAS are either securities held-to-maturity or sold within the last
three months before final maturity (»held-to-maturity«) and securities that are neither part of the trading
portfolio nor held-to-maturity (»available-for-sale«). Securities classified as »held-to-maturity« are carried
at net book value. Securities classified as »available-for-sale« are valued at market price (if available).
In a separate equity item, other comprehensive income, unrealized income and expenses from »available-
for-sale« securities are disclosed without profit and loss impact, taking into account deferred taxes.
DERIVATIVE FINANCIAL INSTRUMENTS
CLAAS Group uses derivative financial instruments such as swaps, exchange futures, options on interest
rate swaps, forward interest rate dealings, caps and floors for hedging purposes. As at 1 October 2000,
CLAAS for the first time applied SFAS No. 133, »Accounting for Derivative Instruments and Hedging
Activities«. Accordingly, all derivative financial instruments are either to be reported in the balance sheet
either as asset or as liability at their respective fair value. If a clear hedging connection exists, hedge
accounting (setting up valuation units) is possible. In hedge accounting, the market price changes of the
derivatives depend on the type of the hedge. In the case of a cash flow hedge, market price changes of
the effective part of the derivative are initially booked in equity (other comprehensive income) and only
released with profit and loss impact, if the underlying transaction has profit and loss impact. The ineffect-
ive part of a hedge is immediately recorded with profit and loss impact. Market price changes of the deri-
vative in the case of a fair value hedge are recognized with profit and loss impact together with the market
price changes of the underlying transaction.
MARKET PRICES OF DERIVATIVES
Under US GAAP, financial instruments include derivative instruments (e.g. swaps, options) and original
financial instruments (at the level of CLAAS e.g. participation certificates, silent partnership, bonds, cash
and cash equivalents).
Under US GAAP, the market price of a financial instrument indicates the value at which a financial instru-
ment can be traded among unrelated parties dealing at arm’s length if there are parties willing to buy
and sell and the transaction concerned is not a compulsory or winding-up sale. The buying and selling
prices realized by CLAAS in transactions can, hence, deviate from the market prices disclosed.
Where the market prices of financial instruments are not stated explicitly, they do not or only insignifi-
cantly deviate from the book values.

73
INVENTORIES
Inventories are carried at the lower of cost or market value. Raw materials and consumables as well as
merchandise are capitalized at average cost, work in process and finished goods at production-related
full cost, i.e. apart from direct material and prime cost, the directly allocable parts of necessary indirect
material and production overhead and production-related administration expenses are also capitalized.
Inventory risks that result from reduced likelihood of full utilization, as well as disposal risks based on
estimate of achievable sale prices are taken into account through depreciation.
RECEIVABLES
The accounts receivable and other assets are shown in the balance sheet at face value. Adequate allow-
ances are being made for anticipated risks of non-payment. A discount is applied to non-interest-bearing
receivables that are not expected to be received within normal payment deadlines.
The Percentage of Completion method (PoC) is applied when reporting long-term production orders.
The amount to be capitalized is disclosed under receivables; at the same time, net sales are realized.
The stage of completion is determined according to expenses incurred. At each balance sheet date,
the existing contracts are reviewed in respect of possible risks. In the case of anticipated losses, corres-
ponding allowances are made or provisions set up.
CASH AND CASH EQUIVALENTS
Under US GAAP, cash and cash equivalents also include securities with a remaining term at the date
of acquisition of up to 90 days. The cash and cash equivalents disclosed in the cash flow statement
correspond with the cash and cash equivalents in the balance sheet.
PROVISIONS/LIABILITIES
The pension commitments are measured through actuarial methods according to the projected unit credit
method. This projected unit credit method does not only take into account the pensions and accrued
vested rights known at the balance sheet date but also anticipated pay and pension increases. Actuarial
gains and losses, which are outside a range of 10% of the scope of commitments, are distributed over
the average residual period of service.
Other provisions are set up in respect of all identifiable commitments as at the balance sheet date that
are based on past business transactions or past events and the amount and/or due date of which is un-
certain. They are valued at the amount repayable and are not netted with positive profit contributions.
If the amount repayable is uncertain, the repayment amount with the highest probability of occurrence
is taken as a basis. Provisions are only set up if there is a corresponding legal or de facto obligation to
a third party.
Liabilities are generally carried at the amount at which they will be repaid; liabilities in a foreign currency
are translated at the rate in effect at the balance sheet date.

74 CONSOLIDATED FINANCIAL STATEMENTS
CURRENT AND DEFERRED TAXES ON INCOME
With effect from 1 October 2001 the corporate income tax rate for distributed profits declined for CLAAS
from 30% to 25% and the corporate income tax rate for retained profits from 40% to 25%. Gains on or
losses from disposal resulting from investments in domestic companies are nontaxable for CLAAS with
effect from 1 October 2002.
Deferred taxes are determined according to SFAS 109 »Accounting of Income Taxes«. They reflect future
tax reduction or future tax burdens that arise from temporary balance sheet differences between consoli-
dated balance sheet and tax balance sheet. The deferred tax assets also comprise tax reduction claims
arising from the expected availability of existing loss carryforwards in subsequent years, the realization
of which is probable. Deferred taxes are computed using the tax rate that will be authoritative according
to the present legal situation at the probable compensation time of the temporary differences. Abroad,
tax rates specific to the country are used. An allowance is made on deferred tax assets, if there is a
sufficiently high likelihood that not all deferred tax assets can be realized in future through fiscal profits,
or if the realization is limited in time (SFAS 109.17).
SALES RECOGNITION
Sales are regognized after passage of risk to the customer and performed delivery or service.
In the case of long-term production orders, sales are recorded according to the Percentage of
Completion method in line with reaching contractually agreed milestones or performance progress.
CONSOLIDATION PRINCIPLES
In line with the statutory regulations, the accounts of the individual companies are prepared on a uni-
form basis for inclusion in the consolidated financial statements according to the accounting and valu-
ation guidelines existing for CLAAS Group. All financial statements are in principle prepared as at
30 September 2001.
For the purposes of capital consolidation, the book values of the investments are offset against the pro-
portionate shareholders’ equity of the subsidiaries at the date of acquisition. We attributed debit differ-
ences, where requisite, to the assets. Any residual debit differences are capitalized as goodwill and
amortized with profit and loss impact in line with their future useful life. Normally, four to ten years
are taken as the basis as useful life.
The investments in associated companies are consolidated according to the equity method. In respect
of the procedure the same principles as for the full consolidation are used.

75
Receivables and payables, net sales as well as expenses and income between consolidated entities are
eliminated. Stocks from intercompany deliveries included in inventories are adjusted for unrealized
profits and losses on intra-group transactions.
Consolidation measures with profit and loss impact take into account deferred taxes to the extent that
the deviating tax charge will probably be balanced in later business years. Deferred tax assets and de-
ferred tax liabilities are offset where requisite. The deferred taxes are adapted to the tax rates changed
in the business year.
CURRENCY TRANSLATION
The currency translation according to SFAS 52 is based on the concept of functional currency. The func-
tional currency is the currency predominating in the environment in which a company engages in oper-
ations. As a rule, it is the currency in which cash and cash equivalents are generated and used.
In the consolidated financial statements, all balance sheet items of foreign entities are translated at the
middle price as at the balance sheet date, expenses and income at the average rate. The translation
differences resulting from currency translations in the balance sheets are disclosed without profit and
loss impact in equity.
The following exchange rates are used for the countries not participating in the European Monetary Union:
LEGAL DISPUTES AND DAMAGE CLAIMS
Companies of CLAAS Group are involved in various legal and official proceedings within the framework of
general operations or such proceedings could be initiated or asserted in future (e.g. concerning patents,
product liability and competition). Even if the result of individual proceedings cannot be predicted with
certainty with a view to the unforeseeable events surrounding legal disputes, according to present esti-
mates the Group’s profit situation will not in any way be adversely effected beyond the risks taken into
account as liabilities or provisions.
Average Balance Sheet Date
in € 2001 2000 2001 2000
1 US dollar 1.13 1.05 1.09 1.14
1 Pound Sterling 1.62 1.63 1.60 1.67
100 Hungarian forint 0.39 0.39 0.39 0.38

76 CONSOLIDATED FINANCIAL STATEMENTS
USE OF ESTIMATES
Estimates and assumptions must be made in the consolidated financial statements to a certain degree
that influence the recorded assets and liabilities, the indication of contingent liabilities as at the balance
sheet date and the disclosure of income and expenses during the reporting period. The amounts actually
arising can deviate from the estimates.
NEW ACCOUNTING STANDARDS
In June 2001, the FASB issued the Standard SFAS No. 142 »Goodwill and Other Intangible Assets«. This
standard contains new regulations on, among other things, scope of reporting and accounting of good-
will resulting from capital consolidation. Accordingly, goodwill from consolidation is no longer amortized
on a scheduled basis, but its recoverability is tested periodically with impairment tests. SFAS No. 142
becomes effective for business years beginning after 15 December 2001.
Further, SFAS No. 143 was approved in June 2001 according to which obligations to demolish or remove
assets can constitute an element of acquisition or production cost of the asset. The standard becomes
effective for business years beginning after 15 June 2002.
Also revised were the regulations on the impairment test in APB Opinion 30 and SFAS No. 121. SFAS
No. 144 approved in this respect in August 2001 contains, among other things, new regulations for im-
pairments of discontinued operations; in the case of impairment tests for goodwill, the special standard
SFAS No. 142 now applies. SFAS No. 144 becomes effective for business years beginning after
15 December 2001.
As matters stand at present, these new standards are not expected to have any material effects on the
presentation of the economic situation of CLAAS.
1 | NET SALES
Net sales also include sales from long-term production orders which are accounted for according
to the Percentage of Completion method. The amount to be capitalized from long-term production
orders, which cannot yet be invoiced, is disclosed under PoC receivables and net sales.
2 | SELLING EXPENSES
The selling expenses disclose freight out in the amount of € 31,433 thousand
(prior year: € 25,920 thousand).

3 | GENERAL AND ADMINISTRATION EXPENSES
The general and administration expenses do not contain general and administration expenses of the
marketing subsidiaries, since these expenses constitute selling expenses from the point of view of the
Group.
4 | OTHER OPERATING INCOME
The other operating income is composed as follows:
Above all, the disposal of the production of Teleporters Ltd. had an impact on the other operating income.
5 | OTHER OPERATING EXPENSES
The other expenses comprise a number of minor items, e.g. for litigation, goodwill amortization, fees
and charges and personnel expenses not related to functions.
2001 2000
€ ‘000 € ‘000
Income on retirement of fixed assets 328 2,218
Income from release of discounts and allowances on receivables 519 1,618
Income from release of provisions 7,467 4,025
Rental and leasing income 1,225 240
Other income 13,390 23,332
Total 22,929 31,433
2001 2000
€ ‘000 € ‘000
Loss on retirement of fixed assets 320 1,255
Allowances on receivables 1,628 1,341
Other expenses 24,010 21,721
Total 25,958 24,317
77

78 CONSOLIDATED FINANCIAL STATEMENTS
6 | INCOME FROM INVESTMENTS
The income from investments also includes all income and expenses realized and incurred in connection
with holding or disposal of not fully consolidated investments. The expenses from investments in
associated companies reflect the losses from the two joint ventures with Caterpillar in the amount of
€ 10,460 thousand (prior year: € 8,707 thousand).
Because of the losses from these joint ventures, an impairment test was performed in accordance with
APB Opinion 18. Overall, the test resulted in depreciation of € 9,626 thousand disclosed as write-downs
on investments.
7 | FINANCIAL INCOME
The financial income is composed of the two components »income from interest and securities« and
»other financial income«.
The income from interest and securities discloses all income and expenses realized and incurred in con-
nection with holding or disposal of securities and/or financial assets that are not investments.
2001 2000
€ ‘000 € ‘000
Income from other investments 169 21
Income from investments in associated companies (equity method) 2,339 1,234
Expenses from investments in associated companies (equity method) (10,460) (8,707)
Gains/loss from disposal of investments 0 0
Write-downs on investments (9,626) 0
Total (17,578) (7,452)
2001 2000
INCOME FROM INTEREST AND SECURITIES € ‘000 € ‘000
Interest expenses (25,001) (23,065)
Interest income 10,642 13,487
Proceeds from other securities and non-current financial investments 1,717 1,293
Losses from disposal of securities (423) (1,623)
Gains on disposal of securities 2,580 3
Write- downs of financial assets (not including investments) and other investments held as current assets 0 (47)
Reversals of write-downs of financial assets (not including investments) and other investments held as current assets 0 182
Total (10,485) (9,770)

The item »Profits transferred under a partial profits transfer agreement (CMG)« records the remuneration
for the silent partnership held by CLAAS-Mitarbeiterbeteiligungs-Gesellschaft mbH (CMG) based on the
net income/loss of CLAAS Group. A substantial part of exchange gains results from appreciation of deri-
vatives. The other financing expenses disclosed above all under other operating expenses, mainly include
bank charges, travel expenses etc. (in order to guarantee the comparison with the prior year, the prior
year figures were adjusted).
8 | INCOME BEFORE TAXES
The Income before taxes is to be allocated as follows to domestic and foreign profit contributions:
2001 2000
OTHER FINANCIAL INCOME € ‘000 € ‘000
Remuneration profit participation rights (2,806) (2,806)
Profits transferred under a partial profits transfer agreement (CMG) (2,856) (1,932)
Interest expenses leasing (353) (435)
Exchange gains 7,713 745
Exchange losses (3,615) (471)
Other financing income 133 0
Other financing expenses (819) (681)
Total other financial income (2,603) (5,580)
Total financial income (13,088) (15,350)
2001 2000
€ ‘000 € ‘000
Domestic 48,603 21,267
Foreign (12,149) 4,889
Total 36,454 26,156
79
9 | TAXES ON INCOME
The taxes on income are composed of current taxes and deferred taxes.
2001 2000
CURRENT TAXES € ‘000 € ‘000
Domestic
Corporate income tax/solidarity surcharge 12,228 11,782
Municipal trade tax 8,206 7,385
Subtotal current taxes domestic 20,434 19,167
Foreign 3,907 2,072
Total current taxes 24,341 21,239

80 CONSOLIDATED FINANCIAL STATEMENTS
Deferred taxes of domestic companies were determined based on a tax rate of 37% in the case of
temporary differences.
The deferred taxes result from temporary differences for the following balance sheet items:
2001 2000
DEFERRED TAXES € ‘000 € ‘000
Domestic
Corporate income tax/solidarity surcharge (427) (3,428)
Municipal trade tax (290) (1,846)
Subtotal deferred taxes domestic (717) (5,274)
Foreign (1,425) (1,473)
Total deferred taxes (2,142) (6,747)
Total taxes on income 22,199 14,492
30 Sept. 2001 30 Sept. 2000
€ ‘000 € ‘000
Deferred tax assets
Current assets 10,339 14,996
Capital lease 5,296 1,856
Provisions 21,617 16,655
Loss carryforwards 7,218 7,729
Other 6,317 1,003
Total 50,787 42,239
Allowances (12,576) (7,729)
Total 38,211 34,510
Deferred tax liabilities
Current assets 11,180 7,052
Tangible assets 17,775 14,934
Other 1,032 1,122
Total 29,987 23,108
Surplus deferred tax assets 8,224 11,402

After netting, the deferred taxes are disclosed as follows:
The following table reconciles the expenses from taxes on income expected in the prior year and the
year under review with the expenses actually recorded. To determine the expected tax charge, the group
tax rate valid in 2001 in the amount of 51.0% (prior year: 51.0%), which results from the domestic cor-
porate income tax rate, the solidarity surcharge and the municipal trade tax, is multiplied with the total
income for the year before taxes on income.
* including losses of associated companies not recognizable for tax purposes
2001 2000
€ ‘000 € ‘000
Actual taxes on income 24,341 21,239
Deferred taxes (2,142) (6,747)
Effective tax charge 22,199 14,492
Income before taxes 36,454 26,156
Theoretical tax charge at 51.0% 18,592 13,340
Difference to foreign tax rates * 8,473 5,478
Tax effects on
Payment of taxes for prior years (530) (176)
Application of tax burden on distributions (1,763) (822)
Non-tax deductibles expenses 1,028 675
Amortization of goodwill from consolidation 59 1,427
Application of the equity methode (644) (579)
Revaluation of deferred taxes to lower future tax rates 3,220 607
Other consolidation influences (3,996) (6,325)
Other (2,240) 867
Effective tax charge 22,199 14,492
Effective tax rate in % 60.9 55.4
81
30 Sept. 2001 30 Sept. 2000
€ ‘000 € ‘000
Deferred tax assets 17,660 12,267
thereof non-current 741 0
Deferred tax liabilities 9,436 865
thereof non-current 9,436 865
Surplus deferred tax assets 8,224 11,402

82 CONSOLIDATED FINANCIAL STATEMENTS
12 | FIXED ASSETS
The movements in fixed assets of CLAAS Group in the business year 2001 are presented on pages 66
and 67.
The additions in shares in associated companies are mainly attributable to the participation in CLAAS
CATERPILLAR EUROPE GmbH & Co. KG and CATERPILLAR CLAAS AMERICA LLC. Besides, the propor-
tionate net income/loss for the year of the companies accounted for at equity is recorded. The disposals
mainly include proportionate results and the distributions of associated companies collected in the indi-
vidual financial statements and to be consolidated to this extent.
The additions to intangible assets notably relate to capitalized expenses for the changeover from SAP
R/2 to R/3. Among other things, license fees for software and software implementation costs were capi-
talized and depreciated over an estimated useful life of eight years.
Overall, depreciation in the amount of € 33,722 thousand (prior year: € 24,364 thousand) was booked
on tangible assets and € 1,393 thousand (prior year: € 4,173 thousand) on intangible assets.
2001 2000
Net income € thousand 14,256 11,664
Dividend per share € 2,56 2,56
Number of shares outstanding on 30 September (in ‘000 units) 3,000 3,000
Earnings per share € 4.75 3.89
€ 13,443 thousand (prior year: € 13,235 thousand) of the tax loss carryforwards of the group in the
amount of € 21,340 thousand (prior year: € 39,328 thousand) can be realized without limitation; the
other loss carryforwards can be carried 2004. On account of the lack of recoverability, allowances of €
7,218 thousand (prior year: € 7,729 thousand) are made on the tax loss carryforwards and € 5,358
thousand (prior year: € 0 thousand) on other deferred tax assets. The loss carryforwards are attributable
to foreign companies.
10 | INCOME FROM CHANGE IN ACCOUNTING PRINCIPLES
The first-time application of SFAS No. 133 »Accounting for Derivative Instruments and Hedging Acti-
vities« as at 1 October 2000 resulted in income in the amount of € 503 thousand (after deducting the
attributable tax charge in the amount of € 295 thousand).
11 | EARNINGS PER SHARE
The undiluted earnings per share is obtained by dividing the net income accruing to the shares by the
average number of shares. CLAAS does not issue so-called potential shares (chiefly share options and
convertibles) that can dilute the earnings per share. The diluted and the undiluted earnings per share
are thus the same.

Due to the unsatisfactory profit situation of the factory in Metz (Usines CLAAS France S.A.S.), CLAAS
performed an impairment test in accordance with SFAS 121. Since the book values of this cash-genera-
ting unit exceeded the allocable undiscounted cash flows from its use, a non-scheduled depreciation was
made. The non-scheduled depreciation in the amount of € 6,945 thousand indicates how far the book
values of the plant and machinery mainly affected exceeded their fair values. The depreciation amount
is disclosed in production cost.
The fair values of these securities only differ insignificantly from the book values.
13 | INVENTORIES
As at 30 September 2001, payments received in the amount of € 26,302 thousand (prior year: € 11,734
thousand) were offset in finished goods and merchandise.
14 | ACCOUNTS RECEIVABLES AND OTHER ASSETS
Accounts receivables and other assets are composed as follows:
30 Sept. 2001 30 Sept. 2000
€ ‘000 € ‘000
Securities »held-to-maturity« 1,119 33,232
Securities »available-for-sale« 34,939 0
Total securities held as fixed assets 36,058 33,232
30 Sept. 2001 30 Sept. 2000
€ ‘000 € ‘000
Trade receivables 130,450 122,871
Receivables from companies in which investments are held 6,556 15,096
PoC receivables 10,851 10,086
Other assets 44,915 41,932
Other 192,772 189,985
30 Sept. 2001 30 Sept. 2000
€ ‘000 € ‘000
Raw materials, consumables and supplies 29,611 29,557
Work in process 26,140 25,667
Finished goods and merchandise 103,342 122,261
Payments made on account 9,444 3,734
Total 168,537 181,219
83

84 CONSOLIDATED FINANCIAL STATEMENTS
CLAAS sells trade receivables through an on-going ABS Program to a special purpose entity that is re-
financed through issuing securities on the international capital market. The sold receivables constitute
a so-called »True Sale« according to SFAS 125 respectively SFAS 140. In 2001 trade receivables with a
carrying amount of € 282.146 thousand (prior year: € 26.879 thousand) were sold for € 195.123 thou-
sand (prior year: € 18.063 thousand). Differences between the fair values of the remaining obligations
in connection with these receivables and their carrying amounts are not material. On account of the ABS
Program, funds in the amount of € 16,159 thousand (prior year: € 9,797 thousand) are held as reserves
for money in trust. They are disclosed under other assets.
Only € 2,384 thousand (prior year: € 227 thousand) of the trade receivables have a remaining term of
more than one year. € 18,719 thousand (€ 19,335 thousand) of the other assets have a remaining term
of more than one year.
15 | SECURITIES WITH A MATURITY BETWEEN 90 AND 360 DAYS
The securities held by CLAAS with a maturity between 90 and 360 days are either securities held-to-
maturity or sold within the last three months before final maturity (»held-to-maturity«) and securities
(»available-for-sale«) which are neither part of the trading portfolio nor held-to-maturity.
Securities classified as available-for-sale are valued at market prices (where available). Unrealized reve-
nue from securities available-for-sale is reported in equity as other comprehensive income in the amount
of € 0 (prior year: € 346 thousand) without profit and loss impact. Securities disclosed as »held-to-ma-
turity« are reported at net book value, more or less corresponding to the current market value.
30 Sept. 2001 30 Sept. 2000
€ ‘000 € ‘000
Funds 121,309 82,151
Total securities »available-for-sale« 121,309 82,151
Foreign notes 30,351 15,423
Domestic issue notes 9,956 0
Total securities »held-to-maturity« 40,307 15,423
Total securities maturing between 90 and 360 days 161,616 97,574

30 Sept. 2001 30 Sept. 2000
€ ‘000 € ‘000
Securities (maturity up to 90 days) 0 0
Checks, cash-in-hand, bank balances 172,437 187,239
Total 172,437 187,239
17 | COMPREHENSIVE INCOME
The comprehensive income is comprised of the net income and the other comprehensive income
(see p. 63). It covers, hence, all changes in equity that are not due to transactions with shareholders
(e.g. through capital increases or dividends paid out). The components of the other comprehensive
income are determined after deducting income taxes.
18 | EQUITY/MOVEMENTS IN EQUITY
The amounts disclosed as subscribed capital and capital reserves in the consolidated financial state-
ments correspond to the amounts in the individual accounts of CLAAS KGaA mbH. The subscribed capi-
tal of CLAAS KGaA mbH is composed of 3 million individual share certificates; the capital increase in
the year under review did not change the number of shares.
General partner without capital contribution is Helmut Claas GmbH; the shareholders of the commercial
partnership limited by shares, CLAAS KGaA mbH, are exclusively family members.
The movements in equity are separately presented on the face of the financial statements on p. 63.
30 Sept. 2001 30 Sept. 2000
€ ‘000 € ‘000
Net income 14,256 11,664
Translation adjustments (335) 4,128
Unrealized income from securities (346) 346
Difference arising on pension valuation 2,471 1,624
Other comprehensive income 1,790 6,098
Comprehensive income 16,046 17,762
85
16 | CASH AND CASH EQUIVALENTS
Cash and cash equivalents are composed as follows:

86 CONSOLIDATED FINANCIAL STATEMENTS
19 | SILENT PARTNERSHIP/PROFIT PARTICIPATION RIGHTS
The respective repayable profit participation rights and the silent partnership of CLAAS Mitarbeiter-
beteiligungsgesellschaft mbH (CMG) are remunerated through a profit and loss-related compensation
and are to be treated as subordinate in the event of liability. Under US GAAP, repayable transferred capi-
tal is, however, to be disclosed outside the so-called stockholders’ equity formally cut off.
The profit participation rights disclosed include eighty registered, participation certificates made out to
bearer at a total par value of € 40,903 thousand, which were issued in September 1997. The receivables
from the participation certificates are subordinate and possibly participate in potential losses up to the
full amount. The participation certificates are repayable on 1 March 2005; premature termination through
the holders of the profit participation rights is excluded.
CMG is paid for its subordinated contribution a compensation that is based on the net income/loss
for the year of CLAAS Group; there is also a corresponding loss participation. € 5,515 thousand of the
silent partnership can be terminated as of 30 September 2002; there are rights of termination between
2003 and 2006 with respect to another € 4,694 thousand.
20 | PROVISIONS
An analysis of provisions is as follows:
The provisions for income and other taxes are comprised exclusively of provisions for effective taxes;
deferred tax liabilities are separately disclosed.
The long-term provisions amount to € 130,069 thousand (prior year: € 132,071 thousand).
21 | PENSION PROVISIONS AND SIMILAR OBLIGATIONS
Under the defined benefit pension plans implemented by CLAAS, the Company undertakes to comply
with its pension commitments towards active and former employees. The pension provision that covers
commitments under defined benefit schemes includes also pension fund commitments and is reduced
by the amount of the fund assets. Fund surpluses, if any, are capitalized as other assets. Pension provi-
sions are set up for commitments from vested rights and current benefits paid to eligible active and for-
mer employees and surviving dependants. The commitments relate primarily to old age pensions, which
are paid partially as basic partially as supplementary benefits. Pension commitments are normally based
on company seniority and the employees’ remuneration.
30 Sept. 2001 30 Sept. 2000
€ ‘000 € ‘000
Provisions for pensions and similar obligations 104,601 103,986
Provisions for income and other taxes 16,081 14,237
Other provisions 157,829 137,973
Total 278,511 256,196

87
The pension commitments are measured through actuarial methods according to the projected unit credit
method. This projected unit credit method does not only take into account the pensions and accrued
vested rights known at the balance sheet date but also anticipated pay and pension increases. Actuarial
gains and losses that are outside a range of 10% of the scope of commitments are distributed over the
average residual period of service.
The computation was based on an interest factor of 6% (prior year: 6%), pay rises of 3% (prior year: 3%)
and pension increases of 1.5% (prior year: 2%). These assumptions refer to the employees working in
Germany to whom the predominant part of the pension commitment relates. For the employees assigned
abroad, deviating assumptions that take into account the specific circumstances in the country concerned
have to be used.
The pension commitments (pension claims) covered by funds developed as follows:
The surplus of plan assets in excess of PBO in the amount of € 14,816 thousand (prior year: € 15,587
thousand) is capitalized under other assets. The fund assets developed as follows:
30 Sept. 2001 30 Sept. 2000
€ ‘000 € ‘000
Projected benefit obligation financed by funds (plan assets) 27,826 28,085
Less cover by fund (30,550) (40,818)
Subtotal (2,724) (12,733)
Adjustment based on (non-recognized) actuarial gains/losses and commitments (12,092) (2,854)
Plan assets in excess of PBO (14,816) (15,587)
2001 2000
€ ‘000 € ‘000
Fair value of fund assets as at 1 October 40,818 37,845
Actual return on fund assets (7,547) 3,393
Employer’s contributions 469 380
Employees’ contributions 263 222
Actual pension payments (815) (668)
Exchange rate effects 88 (1,603)
Other (1,035) (441)
Fair value of fund assets as at 30 September 30,550 40,818

88 CONSOLIDATED FINANCIAL STATEMENTS
The pension provision is derived as follows from the projected benefit obligation not financed by funds:
The presentation of movements shows the development of the pension provision from the previous year:
A classification of pension costs is as follows:
30 Sept. 2001 30 Sept. 2000
€ ‘000 € ‘000
Projected benefit obligation not financed by funds 110,638 112,154
Difference arising on pension valuation carried as a liability 1,243 4,895
Adjustment based on (non-recognized) prior service costs (1,810) 0
Adjustment based on (non-recognized) actuarial gains/losses (5,470) (13,063)
Pension provision 104,601 103,986
2001 2000
€ ‘000 € ‘000
Pension provision balance 1 October 103,986 101,615
Additions pension claims 2,781 3,027
Release (3,645) (2,577)
Interest portion of additions 6,540 6,436
Changes in scope of consolidation 0 0
Consumption (5,061) (4,515)
Pension provision balance 30 September 104,601 103,986
2001 2000
€ ‘000 € ‘000
Cost of pension claims accrued in year under review 4,453 4,154
Interest expense on existing pension claims 8,262 8,001
Adjustment based on recognized prior service costs 0 0
Adjustment based on recognized actuarial gains/losses (801) (635)
Fund income (2,801) (2,963)
Other - 49
Pension costs 9,113 8,606

89
The cost of the pension claims accrued in the year under review as well as the interest paid on existing
pension claims relate to pension claims that are financed, and that are not financed, by funds.
The pension claims developed as follows:
22 | LIABILITIES
2001 2000
€ ‘000 € ‘000
Pension claims as at 1 October 140,240 135,014
Cost of pension claims accrued in year under review 4,453 4,312
Interest expense on existing pension claims 8,262 8,001
Actuarial losses/(gains) (7,476) (2,873)
Actual pension payments (5,877) (5,069)
Other (1,137) 855
Pension claims as at 30 September of following calendar year 138,465 140,240
30 Sept. 2001 30 Sept. 2000
Remaining term Total Remaining term Total
€ ‘000 up to 1 year more than 1 year 30 Sept. 01 up to 1 year more than 1 year 30 Sept. 00
Bonds 0 100,000 100,000 0 100,000 100,000
Liabilities to insurance companies 3,801 21,459 25,260 2,062 25,260 27,322
Liabilities to banks 8,938 15,709 24,647 5,535 14,917 20,452
Payments received on account 6,876 0 6,876 0 0 0
Trade payables 44,244 0 44,244 36,429 10 36,439
Liabilities on bills accepted and drawn 1,282 0 1,282 2,187 0 2,187
Accounts payable to investments/associates 1,243 0 1,243 6,525 0 6,525
Leasing payables 10,238 7,277 17,515 1,347 3,160 4,507
Other liabilities 69,386 27,908 97,294 61,066 25,078 86,144
Total 146,008 172,353 318,361 115,151 168,425 283,576

90 CONSOLIDATED FINANCIAL STATEMENTS
The liabilities to insurance companies and the liabilities to banks include liabilities which are collateralized
through encumbrances on real property and transfers by way of security in the amount of € 25,260 thou-
sand (prior year: € 27,322 thousand) and € 2,876 thousand (prior year: € 8,334 thousand), respectively.
The fair values and nominal values of the bond as well as of the loans granted by banks and insurance
companies are as follows:
The bond (maturity until 2006) accrues interest at a rate of 4.5%; interest rates ranging from 4.8% to
8.3% apply to the loans granted by banks and insurance companies (maturity from 2001 to 2011).
The other liabilities include payables to the shareholders of the commercial partnership limited by shares
in the amount of € 45,800 thousand (prior year: € 41,605 thousand) of which € 27,861 thousand are
long-term (prior year: € 25,037 thousand).
23 | CONTINGENT LIABILITIES AND OTHER FINANCIAL COMMITMENTS
The maturities of commitments from leasing and tenancy relationships are as follows:
In the year under review, rent and rental expenses amounted to € 7,674 thousand. The rentals received
under non-terminable sublease agreements as at the balance sheet date amount to € 10,612 thousand.
Capital lease Operating lease
Nominal value Nominal value
€ ‘000 € ‘000
Minimum lease payments
1 year to maturity 11,246 5,383
2 years to maturity 3,818 4,598
3 years to maturity 2,647 2,330
4 years to maturity 359 637
5 years to maturity 351 75
Total 18,421 13,023
Interest portion 906
Present value of commitments 17,515
30 Sept. 2001 30 Sept. 2000
€ million Nominal value Fair value Nominal value Fair value
Bond 100.0 95.5 100.0 91.1
Loans granted by banks and insurance companies (with fair value difference) 11.8 12.0 12.3 12.6
Loans granted by banks and insurance companies (without fair value difference) 38.1 38.1 35.4 35.4
Total 149.9 145.6 147.7 139.1

91
The capital lease and operating lease commitments arise predominantly under leasing programs under
which CLAAS agricultural machines are leased from CLAAS Leasing GmbH and subleased to final cus-
tomers. The other financial commitments do not include rental and leasing commitments.
On account of the capital expenditure and investments specified in the management report – notably on
production facilities at the Harsewinkel location – there are presently financial commitments at group level
that exceed the level of capital expenditure and investments in the course of ordinary business activities.
24 | FINANCING COMMITMENTS
The financing commitments as at the balance sheet date may be classified as follows:
25 | STATEMENT OF CASH FLOWS
The statement of cash flows is classified by cash flows from current business activities, from investment
activities and from financing activities. Effects of changes in the scope of consolidation have been elimi-
nated; their impact on cash and cash equivalents – like the influence of exchange rate fluctuations on
cash and cash equivalents – is separately shown.
30 Sept. 2001 30 Sept. 2000
€ ‘000 € ‘000
Contingent liabilities
Notes payable 29,909 37,945
Liabilities related to guarantees 276 282
Liabilities under warranty agreements 15,461 16,167
Total 45,646 54,394
Other financial commitments 2,110 350
Up to 1 year 1-5 years > 5 years Total
€ million 30 Sept.01 30 Sept.00 30 Sept.01 30 Sept.00 30 Sept. 01 30 Sept. 00 30 Sept. 01 30 Sept.00
Bond issue - - 100.0 - - 100.0 100.0 100.0
Credit syndication - - 102.3 102.3 - - 102.3 102.3
Credit lines granted by banks and insurance companies 198.8 199.1 45.7 20.4 37.4 54.2 281.9 273.7
Total 198.8 199.1 248.0 122.7 37.4 154.2 484.2 476.0
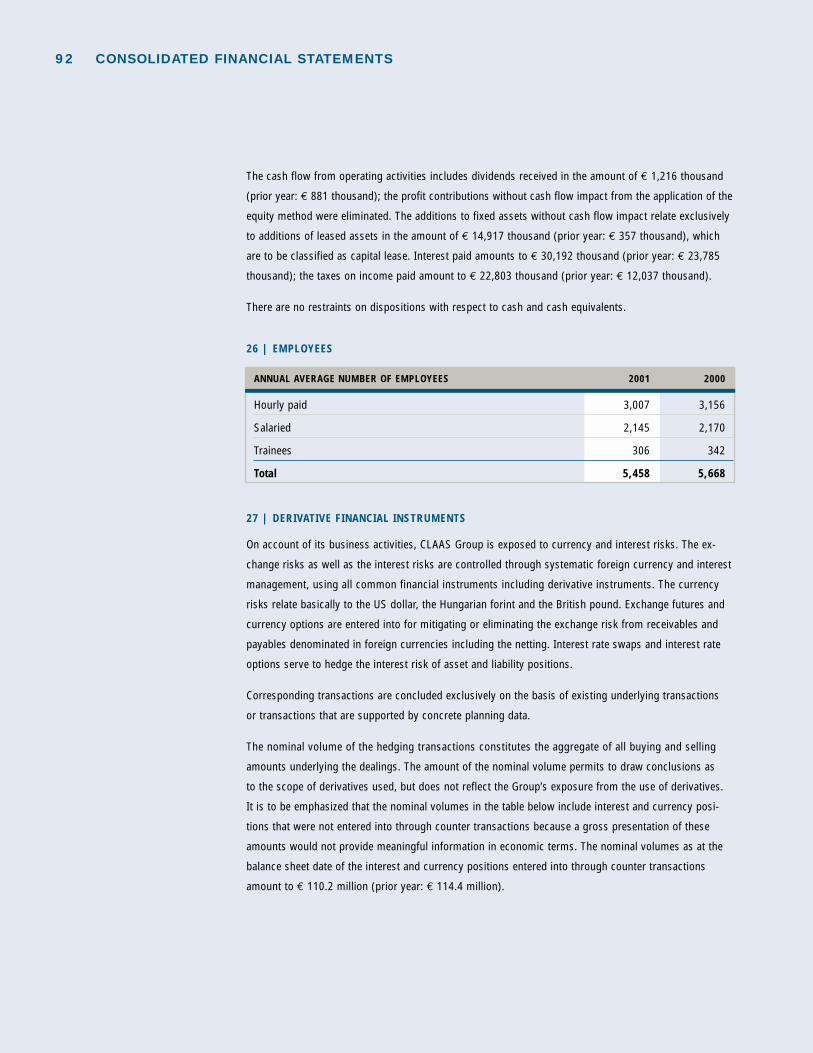
92 CONSOLIDATED FINANCIAL STATEMENTS
The cash flow from operating activities includes dividends received in the amount of € 1,216 thousand
(prior year: € 881 thousand); the profit contributions without cash flow impact from the application of the
equity method were eliminated. The additions to fixed assets without cash flow impact relate exclusively
to additions of leased assets in the amount of € 14,917 thousand (prior year: € 357 thousand), which
are to be classified as capital lease. Interest paid amounts to € 30,192 thousand (prior year: € 23,785
thousand); the taxes on income paid amount to € 22,803 thousand (prior year: € 12,037 thousand).
There are no restraints on dispositions with respect to cash and cash equivalents.
26 | EMPLOYEES
27 | DERIVATIVE FINANCIAL INSTRUMENTS
On account of its business activities, CLAAS Group is exposed to currency and interest risks. The ex-
change risks as well as the interest risks are controlled through systematic foreign currency and interest
management, using all common financial instruments including derivative instruments. The currency
risks relate basically to the US dollar, the Hungarian forint and the British pound. Exchange futures and
currency options are entered into for mitigating or eliminating the exchange risk from receivables and
payables denominated in foreign currencies including the netting. Interest rate swaps and interest rate
options serve to hedge the interest risk of asset and liability positions.
Corresponding transactions are concluded exclusively on the basis of existing underlying transactions
or transactions that are supported by concrete planning data.
The nominal volume of the hedging transactions constitutes the aggregate of all buying and selling
amounts underlying the dealings. The amount of the nominal volume permits to draw conclusions as
to the scope of derivatives used, but does not reflect the Group’s exposure from the use of derivatives.
It is to be emphasized that the nominal volumes in the table below include interest and currency posi-
tions that were not entered into through counter transactions because a gross presentation of these
amounts would not provide meaningful information in economic terms. The nominal volumes as at the
balance sheet date of the interest and currency positions entered into through counter transactions
amount to € 110.2 million (prior year: € 114.4 million).
ANNUAL AVERAGE NUMBER OF EMPLOYEES 2001 2000
Hourly paid 3,007 3,156
Salaried 2,145 2,170
Trainees 306 342
Total 5,458 5,668

93
There is a strict segregation of functions in physical and organizational terms between conclusion, con-
trol and booking of transactions. The competences in terms of amount and contents are defined in internal
guidelines. In the finance area, risk positions are continuously measured by means of tested software.
Business partners are exclusively German and international banks of unquestionable financial standing.
Since management and the supervisory bodies of CLAAS attach great importance to systematic risk
management, a comprehensive monitoring system, which meets the requirements under the Act on
Control and Transparency in the Corporate Sector (KonTraG), has been installed. In this context, the effi-
ciency of the hedging instruments used and the reliability of the internal control systems are regularly
controlled through internal and external examinations.
The carrying amounts of the derivative financial instruments recognized in the balance sheet are as follows:
Remaining term
Nominal volume > 1 year Market price
30 Sept. 01 30 Sept. 00 30 Sept. 01 30 Sept. 00 30 Sept. 01 30 Sept. 00
CURRENCY HEDGING € ‘000 € ‘000 € ‘000 € ‘000 € ‘000 € ‘000
Exchange futures 117,341 89,880 0 0 1,966 (2,906)
Currency options 44,001 38,503 0 0 550 (300)
Other currency hedging instruments 0 0 0 0 0 0
Total 161,342 128,383 0 0 2,516 (3,206)
Remaining term
Nominal volume > 1 year Market price
30 Sept. 01 30 Sept. 00 30 Sept. 01 30 Sept. 00 30 Sept. 01 30 Sept. 00
INTEREST RATE HEDGING € ‘000 € ‘000 € ‘000 € ‘000 € ‘000 € ‘000
Interest rate options 40,903 40,903 40,903 40,903 (51) 387
Interest rate swaps 24,800 97,657 20,200 72,092 (560) (4,096)
Other interest rate hedging instruments 20,000 20,000 20,000 20,000 (191) (255)
Total 85,703 158,560 81,103 132,995 (802) (3,964)
Carrying amounts
30 Sept. 01 30 Sept. 00
CURRENCY HEDGING € ‘000 € ‘000
Exchange futures 1,966 (1,683)
Currency options 550 (112)
Other currency hedging instruments 0 0
Total 2,516 (1,795)

94 CONSOLIDATED FINANCIAL STATEMENTS
28 | SEGMENT REPORTING
Carrying amounts
30 Sept. 01 30 Sept. 00
INTEREST RATE HEDGING € ‘000 € ‘000
Interest rate options (51) 375
Interest rate swaps (898) (414)
Other interest rate hedging instruments 83 (66)
Total (866) (105)
CLAAS Agricultural CLAAS Industrial CLAAS Production
Engineering Engineering Engineering Eliminations CLAAS Group
€ million 2001 2000 2001 2000 2001 2000 2001 2000 2001 2000
External sales 1,051 984 24 20 73 69 0 0 1,148 1,073
Internal sales 7 6 82 76 2 2 (91) (84) 0 0
Total sales 1,058 990 106 96 75 71 (91) (84) 1,148 1,073
Operating profit (EBIT) 56 46 7 5 4 3 0 0 67 54
Segmental assets 866 815 39 33 50 36 (24) (25) 931 859
Investment in fixed assets 53 26 3 5 2 2 0 0 58 33
Depreciation 39 24 4 3 2 1 0 0 45 28
Interest income 11 13 0 0 0 0 0 0 11 13
CLAAS defines its segments according to the areas of business covered by the different divisions. The
definition of divisions and regions is based on internal reporting data.
Agricultural Engineering is CLAAS’ core business. CLAAS is market leader in Europe for its main pro-
ducts, the combine harvester and the forage harvester. CLAAS also holds significant market shares in
the baler and green harvest machinery product lines, especially in Western Europe.
The Production Engineering Division is run by CLAAS Fertigungstechnik GmbH. This company has spe-
cific expertise in special-purpose mechanical engineering and tool making and in the development and
manufacturing of complete transfer and production lines.
CLAAS Industrietechnik GmbH is the system supplier within the CLAAS Group for drive assemblies and
hydraulic components. The third-party business mainly relates to components for construction machi-
nery and utility vehicles.

95
The increase in sales from € 1,072.5 million to € 1,147.9 million is primarily due to increases in the
European countries outside the European Union (other European countries), where a sales growth from
49% to € 155.9 million was realized. In non-European countries, sales amounted to € 185.3 million,
which is also a marked improvement and a 21.1% increase from the previous year.
Internal sales reflect the amount of sales between Group companies. Internal sales are accounted for
under conditions like among unrelated parties dealing at arm’s length. Investment in fixed assets relates
to acquired tangible assets.
Reconciliation of the operating profit, which is defined as EBIT at the level of CLAAS, with the consolida-
ted net income:
2001 2000
€ ‘000 € ‘000
Operating profit (EBIT) 67,117 53,959
./. Taxes on income 22,199 14,492
./. Interest expenses 25,001 23,065
./. Compensation CMG 2,855 1,932
./. Compensation profit participation rights 2,806 2,806
Consolidated net income 14,256 11,664
2001 2000
CLASSIFICATION OF SALES BY REGIONS in € million in € million
Domestic 356.9 358.3
Other EU countries 449.8 456.5
Other European countries (excluding EU) 155.9 104.7
Non-European countries 185.3 153.0
Total 1,147.9 1,072.5
Disclosure concerning important customers: Since CLAAS realizes its sales primarily with green harvest
machinery, the clientele of CLAAS also operates predominantly in the agricultural sector. On account of
the large number of customers, there are no customers whose sales volume would account for a signifi-
cant percentage of the Group’s sales volume. Furthermore, except for the German market, the customer
structure shows no significant concentration on certain geographic regions.

96 CONSOLIDATED FINANCIAL STATEMENTS
FIXED ASSETS
INVENTORIES
MATERIAL DIFFERENCES BETWEEN GERMAN GAAP (HGB) AND US GAAP
Material accounting and valuation differences between the German GAAP (HGB) and US GAAP are
described below.
Under German GAAP, fixed assets are predominantly depreciated on a reducing-balance basis, with tax
depreciation normally being applied also to the commercial balance sheet. The useful lives are generally
based on fiscal depreciation tables. No asset item is permitted to be recognized under German GAAP for
intangible fixed assets that were not acquired for compensation.
Under US GAAP, the depreciation method that best reflects the anticipated depreciation of the asset con-
cerned is to be chosen. Normally, fixed assets are, hence, depreciated on a straight-line basis; no tax
depreciation is made at all. Deviating from German GAAP, depreciation is based on a useful life that can
differ from the useful life provided in the fiscal depreciation tables. Furthermore, leased fixed assets are
capitalized if the requirements for a capital lease are met. Certain self-generated intangible fixed assets
are required to be capitalized under US GAAP.
Whereas under German accounting principles, inventories are permitted to be valued at prime cost or at
full cost (in compliance with tax regulations), inventories are measured at so-called production-related
full cost under US GAAP. This means that all allocable overheads are capitalized. The Percentage of Com-
pletion (PoC) Method is applied under US GAAP when reporting long-term production orders. Long-term
production orders in process are disclosed as PoC receivables depending on the stage of completion.
According to German accounting principles, deferred tax assets and provisions are only recognized for
temporary differences between the result under German GAAP and the tax result. Netting deferred tax
assets and deferred provisions for income and other taxes is admissible.
Under US GAAP, deferred taxes are to be recognized for temporary differences between the values reco-
gnized in the consolidated balance sheet and the tax balance sheet. Furthermore, deferred tax assets are
to be recognized for anticipated tax reductions from loss carryforwards. Netting of short-term deferred
tax assets and deferred provisions for income and other taxes is admissible.
Under German GAAP, a general allowance is made on receivables in accordance with the prudence prin-
ciple. According to US GAAP, general allowances are only permitted to be made if substantiable empirical
values are available or if a loss of receivables is probable. Furthermore, an excess of pension assets
over pension commitments is disclosed under other assets at the level of CLAAS in compliance with
US GAAP.
Under German accounting principles, securities are recognized at acquisition cost or at their lower of
market value as at the balance sheet date. Under US GAAP, there are the following three types of securi-
ties: Securities that are held-to-maturity (»held-to-maturity securities«) should generally be valued at
acquisition cost. Securities that are available-for-sale (»available-for-sale securities«) and securities that
are intended to be sold shortly (»trading securities«) are valued at their current market value as at the
balance sheet date.
DEFERRED TAXES
RECEIVABLES/OTHER ASSETS
INVESTMENTS AND SECURITIES

97
PENSION PROVISIONS Under German GAAP, pension provisions are normally measured according to the going-concern value
method under tax law. Probable fluctuations are taken into account on a lump-sum basis. Pay and pen-
sion rises must not be taken into account. The discounting factor can be based on tax regulations. Un-
der US GAAP, pension provisions are measured according to the projected unit credit method. Official
fluctuation probabilities as well as pay and pension rises are taken into account. The discounting factor
corresponds to the interest rate in the capital market. If, on account of the change in the bases of com-
putation, the present value of vested pension rights exceeds the pension provision that has been set up
with profit and loss impact, the pension provision is increased without profit and loss impact by an addi-
tional provision amount (»additional minimum liability«) according to SFAS 87. This amount must be
lower than the additional expenses from plan adjustments that remain to be allocated. Otherwise, it is
offset against equity. The difference arising on the pension valuation has no profit and loss impact under
US GAAP. Under German GAAP, the funding and release of this minimum pension commitment is imme-
diately charged against profit and loss in the profit and loss account.
Under German GAAP, there are certain options with respect to provisions and accruals and provisions
for charges that are based on an internal commitment are permitted to be carried as a liability. Accor-
ding to US GAAP, there are more restrictive requirements for setting up provisions and accruals. There
are no options to show or not to show corresponding items as a liability on the balance sheet and
recognition is made contingent upon a high probability that a liability will actually arise. Provisions are
only recognized for obligations against third parties resulting from past events or transactions.
Deviating from German GAAP, cash and cash equivalents include also securities with a remaining term
at the date of acquisition of up to 90 days under US GAAP.
The allocation to equity or external capital according to German GAAP depends decisively on profit and
loss-related compensation, the loss participation and the treatment as subordinate in the case of bank-
ruptcy. According to these criteria, the silent partnership and the profit participation rights of CLAAS are
to be classified as equity in accordance with German GAAP. Under US GAAP, however, the repayability
of the capital transfer decides on the disclosure within or outside equity.
Under German GAAP, minority interest is taken into account within equity. Under US GAAP, minority
interest is disclosed as a separate item outside equity on the balance sheet.
Deviating from German accounting rules, US GAAP provides for a separate equity component, the other
comprehensive income, which together with the net income forms a kind of total operating performance,
the so-called comprehensive income. The following elements of the other comprehensive income are to
be separately disclosed: Foreign currency translation differences, supplementary pension provisions (see
pension provisions), unrealized gains and losses in connection with the market valuation of securities as
well as the effective portion of the market price variance of derivative instruments that meet cash flow
hedge requirements.
OTHER PROVISIONS
CASH AND CASH EQUIVALENTS
MINORITY INTEREST
SILENT PARTNERSHIP/PROFIT
PARTICIPATION RIGHTS
COMPREHENSIVE INCOME/
OTHER COMPREHENSIVE INCOME

98 CLAAS GROUP
STRUCTURE OF CLAAS KGaA mbH
Shareholders’ committee
Helmut Claas, Harsewinkel
Chairman
Supervisory Board
Helmut Claas, Harsewinkel,
Chairman
Guntram Schneider, Münster *
Deputy Chairman
Oliver Claas, Wedel/Holstein
(since 11/00)
Volker Claas, Harsewinkel
(since 11/00)
Reinhold Claas, Harsewinkel
(until 11/00)
Günther Claas, Harsewinkel
(until 11/00)
Günther Groß, Beckum *
Claus Helbig, München
Heinz Jacobi, Lichtenau *
Günter Laumann, Harsewinkel *
Wilfried Lochte, Groß Schwülper
Jens Möller, Rheda-Wiedenbrück *
Gerd Peskes, Düsseldorf
Carmelo Zanghi, Paderborn *
Executive Board
Nikolaus Feil
Hermann Garbers
Rüdiger A. Günther
Martin Richenhagen
Personally liable partner
Helmut Claas GmbH
Shareholders
Helmut Claas
Günther Claas
Reinhold Claas
KGaA shareholders
Family Helmut Claas
Family Günther Claas
Family Reinhold Claas
BODIES OF CLAAS KGaA mbH
CLAAS KOMMANDITGESELLSCHAFT AUF AKTIEN, HARSEWINKEL
Holding company, Sales, Customer Service, Parts
100% CLAAS Fertigungstechnik GmbH,
Beelen
Executive management
Hans-Bernd Veltmaat
PRODUCTION ENGINEERING
100% CLAAS Industrietechnik GmbH,
Paderborn
Executive management
Hans-Joachim Herbermann (spokesman)
Karl Heinz Kalze
INDUSTRIAL ENGINEERING
* Employee representatives

99
AGRICULTURAL ENGINEERING
FINANCING COMPANIES
49% CLAAS Valtra Finance Ltd.,
Basingstoke/Großbritannien
10% CLAAS Financial Services S.A.S.,
Paris/Frankreich
SALES COMPANIES
100% CLAAS Vertriebsgesellschaft mbH,
Harsewinkel
Executive management
Henning-Christian Paulsen (spokesman)
Uwe Lütkeschümer
100% CLAAS France S.A.S.,
Paris/Frankreich
President
Philippe Lagache
(until 12/00)
Thierry Lemaire
(since 01/01)
Generaldirektor
Luc Montgobert
(since 11/00)
100% CLAAS U.K. Ltd.,
Saxham/Großbritannien
Executive management
Clive E. Last
100% CLAAS Italia S.p.A.,
Vercelli/Italien
Executive management
Pierluigi Navone
100% CLAAS Ibérica S.A.,
Madrid/Spanien
Executive management
August Moormann
100% CLAAS of America Inc.,
Columbus/Indiana/USA
President
Theo Freye
Executive management
Roger A. Parker
100% CLAAS Argentina S.A.,
Sunchales/Argentinien
President
Gero Schulze-Isfort
Executive management
Kai Gieselmann
* substantial investments
PRODUCT COMPANIES
100% CLAAS Selbstfahrende
Erntemaschinen GmbH, Harsewinkel
Executive management
Lothar Kriszun (spokesman)
Hermann Garbers
100% CLAAS Saulgau GmbH, Bad Saulgau
Executive management
Rolf Meuther
100% Usines CLAAS France S.A.S.,
Metz-Woippy/Frankreich
Präsident
Philippe Lagache
(until 03/01)
Guy Larrue
(since 04/01)
100% CLAAS Hungaria Kft.,
Törökszentmiklos/Ungarn
Executive management
Thomas Lorf
87,5% AGROCOM GmbH & Co.
Agrarsystem KG,
Bielefeld
Executive management
Michael Quinckhardt
50% CLAAS CATERPILLAR
EUROPE GmbH & Co. KG *,
Harsewinkel
Executive management
Jim Brophy
50% CATERPILLAR CLAAS
AMERICA LLC. *,
Omaha/Nebraska/USA
Executive management
Theo Freye
40% Escorts CLAAS Ltd. *,
Faridabad/Indien
Executive management
P. K. Malik

SUMMARY OF FINANCIAL STATISTICS 2001 2000 1999 * 1998 * 1997 * 1996 * 1995 *
PROFIT AND LOSS ACCOUNT
Net sales € million 1,147.9 1,072.5 1,038.5 1,108.5 978.7 749.8 642.5
Exports as a share of sales % 68.9 66.6 65.5 69.7 70.6 68.4 61.9
Income before taxes € million 36.5 26.2 22.4 59.9 68.9 48.6 66.0
Net income € million 14.3 11.7 5.8 27.2 27.0 27.9 33.2
BALANCE SHEET
Fixed assets € million 211.2 187.1 148.1 132.0 119.3 101.3 87.2
Intangible assets € million 6.8 3.5 6.0 8.4 8.0 2.6 2.6
Tangible assets € million 155.5 138.7 99.3 83.3 77.1 72.0 65.1
Financial assets € million 48.9 44.8 42.8 40.3 34.2 26.7 19.5
Current assets € million 698.2 656.4 582.5 542.8 519.5 383.3 360.1
Inventories € million 168.5 181.2 212.6 224.6 141.0 113.8 131.2
Accounts receivable and other assets € million 195.6 190.4 133.1 137.2 149.9 115.6 106.1
Liquidity € million 334.1 284.8 236.8 181.0 228.6 153.8 122.8
Prepaid expenses € million 22.0 16.1 25.5 16.9 5.1 7.6 6.4
Equity € million 268.8 263.5 261.6 261.0 241.2 175.6 144.4
Funds similar to equity ** € million 56.3 55.5
External capital € million 606.3 540.6 494.5 430.7 402.7 316.6 309.2
Provisions € million 287.9 257.0 246.7 263.1 234.1 198.9 184.2
Liabilities € million 318.4 283.6 247.8 167.6 168.6 117.7 125.0
Balance sheet total € million 931.4 859.6 756.1 691.7 643.9 492.2 453.7
RATIOS
Return on sales % 3.2 2.4 2.2 5.4 7.0 6.5 5.8
EBIT € million 67.1 54.0 48.7 89.6 90.1 69.9 55.3
EBITDA € million 111.9 82.5 79.9 113.8 118.0 89.9 72.7
Return on equity % 5.3 4.4 2.2 10.4 11.2 15.9 23.0
Return on total capital employed % 7.2 6.3 6.4 13.0 14.0 14.2 18.5
Cash flow according to DVFA/SG *** € million 67.7 39.6 53.1 70.9 63.3 42.1 33.3
Equity ratio % 28.9 30.7 34.6 37.7 37.4 35.7 31.8
First-degree liquidity % 109.7 118.3 111.9 74.3 103.6 91.0 84.5
Equity-to-fixed-assets ratio % 297.0 330.9 367.7 339.5 354.7 318.9 353.4
Working capital € million 258.6 274.0 286.6 298.1 209.8 167.4 184.9
EMPLOYEES
Employees as at the balance sheet date (including trainees) 5,488 5,558 5,853 6,030 5,571 4,831 4,511
Personnel expenses € million 277.3 269.8 269.1 262.0 222.8 204.6 192.2
* The figures up to and including 1999 are based on German GAAP.
** Under US GAAP, profit participation rights, the silent partnership and minority interest are not part of equity in a narrow sense in contrast to German GAAP.
*** Deutsche Vereinigung für Finanzanalyse und Anlageberatung e.V./Schmalenbach-Gesellschaft (DVFA commission for methodology of financial analysis / Schmalenbach-Gesellschaft)

SEGMENTS OF THE CLAAS GROUP
AGRICULTURAL ENGINEERING
Agricultural engineering is CLAAS’ core
business. In Europe, we are the undispu-
ted market leader for our main products,
combine harvesters and self-propelled
forage harvesters. Our world market share
of combine harvesters is 17%. Almost
every other self-propelled forage harve-
ster sold in the world comes from Harse-
winkel. CLAAS also holds top market
shares in the baler and green harvest
machinery product lines.
NET SALES (million €)
EBIT (million €)
1,058 990 56.4 44.2
01 00 01 00
PRODUCTION ENGINEERING
Sophisticated production engineering
comes from our subsidiary, CLAAS
Fertigungstechnik GmbH. This company,
based in Beelen, Westphalia, with subsidi-
aries in Baden-Württemberg and the UK,
has specialist expertise in the area of spe-
cial machinery and toolmaking. Among
other things, it develops and manufactu-
res complete transfer lines and production
lines for groups in the automotive and
aviation industries.
NET SALES (million €)
EBIT (million €)
75 71 4.2 2.8
01 00 01 00
INDUSTRIAL ENGINEERING
CLAAS Industrietechnik GmbH is the
system supplier of drive assemblies and
hydraulic components within the CLAAS
Group. Ultra-modern transmissions and
axles for mobile machines, both within
the Group itself and (increasingly) for the
international construction machinery and
commercial vehicle sector, are developed
and produced at the Paderborn factory.
NET SALES (million €)
EBIT (million €)
106 96 6.6 3.5
01 00 01 00
PRODUCT OVERVIEW
COMBINE HARVESTERS
GREEN HARVEST MACHINERY
FORAGE HARVESTERS
TELESCOPIC LOADERS SPECIAL PRODUCTS
BALERS INDUSTRIAL ENGINEERING/PRODUCTION ENGINEERING

ANN
UAL
REP
OR
T 20
01
ANNUAL REPORT 2001
CONSTANCYIN CHANGE
KEY DATA FOR THE GROUP ACCORDING TO US GAAP
Change
2001 2000 %
PROFIT AND LOSS ACCOUNT
Net sales million € 1,147.9 1,072.5 7.0
EBIT million € 67.1 54.0 24.3
EBITDA million € 111.9 82.5 35.6
Net income million € 14.3 11.7 22.2
Ergebnis vor Steuern million € 36.5 26.2 39.3
Cash flow million € 67.7 39.6 71.0
Expenditure on R&D million € 48.5 46.5 4.3
BALANCE SHEET
Equity million € 268.8 263.5 2.0
Investments in fixed assets million € 58.1 32.3 79.9
Balance sheet total million € 931.4 859.6 8.4
EMPLOYEES
Number of employees on balance sheet date * 5,488 5,558 (1.8)
Staff costs million € 277.3 269.8 2.8
* including trainees
65.563.254.6
68.461.9
36.834.5
31.6
45.438.1
Net sales, Germany (%)
Net sales, abroad (%)
NET SALES (million €)
65.569.7
70.668.9
66.5
30.334.5
31.1
29.433.5
97 98 99 00 01
564 493 580 643 750 979 1,108 1,038 1,073 1,148
92 93 94 95 96
CONTACT
CLAAS KGaA mbH
P.O. Box 1163
Münsterstrasse 33
D-33426 Harsewinkel
Germany
www.claas.com
This annual report is available in German
and English. Both versions may be down-
loaded on the Internet at www.claas.com
Additional copies of this report and further
information about CLAAS are available
free of charge on request.
Tel.: (05247) 12-1555
Fax: (05247) 12-1751
E-mail: [email protected]
Your contacts for any questions:
CORPORATE COMMUNICATION
Tel.: (05247) 12-1555
Fax: (05247) 12-1751
E-mail: [email protected]
INVESTOR RELATIONS
Tel.: (05247) 12-1583
Fax: (05247) 12-1664
E-mail: [email protected]
LAYOUT & DESIGN
Kirchhoff Consult AG
Hamburg
DEFINITIONS
Return on sales = Income before taxes
Net sales
EBIT = Net income + taxes on income + interest expense + profit transferred under
a partial profit transfer agreement (CMG) + remuneration profit participation rights
EBITDA = EBIT + depreciation of tangible assets + amortization of intangible assets
Return on equity =Net income
Equity
Return on total capital employed =EBIT
Balance sheet total
Cashflow according to DVFA/SG = Net income + depreciation of tangible assets + amortization of intangible assets
+/- changes of pension provisions and other long-term provisions +/-
other expenses/ income without cash flow impact
Equity ratio =Equity
Balance sheet total
First-degree liquidity =Liquidity
Short-term liabilities
Equity to fixed assets ratio =Equity, funds similar to equity and long-term liabilities
Fixed assets
Working capital = Inventories ./. advance payments received +/- accounts receivable/ trade payables +/-
accounts receivable/payable to investments or associates +/- notes receivable/
notes payable

ANN
UAL
REP
OR
T 20
01
ANNUAL REPORT 2001
CONSISTENTCHANGE
KEY DATA FOR THE GROUP ACCORDING TO US GAAP
Change
2001 2000 %
PROFIT AND LOSS ACCOUNT
Net sales million € 1,147.9 1,072.5 7.0
EBIT million € 67.1 54.0 24.3
EBITDA million € 111.9 82.5 35.6
Net income million € 14.3 11.7 22.2
Income before taxes million € 36.5 26.2 39.3
Cash flow million € 67.7 39.6 71.0
Research and development expenses million € 48.5 46.5 4.3
BALANCE SHEET
Equity million € 268.8 263.5 2.0
Capital expenditures million € 58.1 32.3 79.9
Balance sheet total million € 931.4 859.6 8.4
EMPLOYEES
Number of employees on balance sheet date * 5,488 5,558 (1.8)
Personnal expenses million € 277.3 269.8 2.8
* including trainees
65.563.254.6
68.461.9
36.834.5
31.6
45.438.1
Net sales, Germany (%)
Net sales, abroad (%)
NET SALES (million €)
65.569.7
70.668.9
66.5
30.334.5
31.1
29.433.5
97 98 99 00 01
564 493 580 643 750 979 1,108 1,038 1,073 1,148
92 93 94 95 96
CONTACT
CLAAS KGaA mbH
P.O. Box 1163
Münsterstrasse 33
D-33426 Harsewinkel
Germany
www.claas.com
This annual report is available in German
and English. Both versions may be down-
loaded on the Internet at www.claas.com
Additional copies of this report and further
information about CLAAS are available
free of charge on request.
Tel.: (05247) 12-1555
Fax: (05247) 12-1751
E-mail: [email protected]
Your contacts for any questions:
CORPORATE COMMUNICATION
Tel.: (05247) 12-1555
Fax: (05247) 12-1751
E-mail: [email protected]
INVESTOR RELATIONS
Tel.: (05247) 12-1583
Fax: (05247) 12-1664
E-mail: [email protected]
CONCEPT & DESIGN
Kirchhoff Consult AG
Hamburg
DEFINITIONS
Return on sales = Income before taxes
Net sales
EBIT = Net income + taxes on income + interest expense + profit transferred under
a partial profit transfer agreement (CMG) + remuneration profit participation rights
EBITDA = EBIT + depreciation of tangible assets + amortization of intangible assets
Return on equity =Net income
Equity
Return on total capital employed =EBIT
Balance sheet total
Cashflow according to DVFA/SG = Net income + depreciation of tangible assets + amortization of intangible assets
+/- changes of pension provisions and other long-term provisions +/-
other expenses/ income without cash flow impact
Equity ratio =Equity
Balance sheet total
First-degree liquidity =Liquidity
Short-term liabilities
Equity to fixed assets ratio =Equity, funds similar to equity and long-term liabilities
Fixed assets
Working capital = Inventories ./. advance payments received +/- accounts receivable/ trade payables +/-
accounts receivable/payable to investments or associates +/- notes receivable/
notes payable


