184
Annual Report 2009 Our path to the energy supply of the future
Annual Report 2009Our path to the energy supply of the future

E stands for the future
e³ = 3 x eThis formula stands for three concepts with which EWE AG expresses its vision of a future energy supply: the expansion of renewable ener-gies, increased energy efficiency and sustainable energy conservation. Starting from these core objectives the energy services company has developed the e3 programme, at the heart of which stands decentral-ised energy management.
The e3 programme –our path to the energy supply of the future
energy conservation
Creating awareness
EWE trio smartbox
Creating transparency
energy efficiency
Freezers
E3 electric car
CHP / fuel cell
Renewable energies
Biogas
alpha ventus
Weser Stadium PV system
e3

Our energy partners 2009
4
3Katherina Reiche, Parliamentary Secretary of State at the German Federal Environment Ministry“ By 2020 the federal government wants to cover 30 per cent of the energy supply in Germany with renewable energies.”
Prof. Dr.-Ing. Volker Droste, Architect, BDA DWB, Oldenburg“ The earlier people are made aware, the sooner a frugal approach to resources will be a matter of course.”
Prof. Dr. Carsten Agert, Director NEXT ENERGY,EWE-Forschungszentrum für Energietechnologie e.V.“ Greater efficiency in converting and using energy is of-ten easier to achieve than expanding the energy supply.”
Dr. Jörg Hermsmeier, Head of Research and Development at EWE AG“ With eTelligence we are creating a community of energy producers and consumers for the energy supply of tomorrow.”

eWe Group key figures
The accounting methods applied may result in rounding differences of +/- one unit (euro, per cent, etc.)
EUR million 2009 2008Change
in %
Electricity sales in million kWh 14,068.2 13,348.4 5
Natural gas sales in million kWh 49,849.9 40,454.1 23
Sales1 5,798.4 5,327.3 9
Return on sales in % 3.4 4.0 -13
EBITDA 825.9 746.23 11
EBITDA margin in % 14.2 14.03 2
EBIT 414.0 426.13 -3
EBIT margin in % 7.1 8.03 -11
Consolidated net profit for the period 199.4 211.03 -6
Capital expenditure (total) 698.8 923.9 -24
Cash flow from operating activities 647.2 382.0 69
Share capital 243.0 200.0 21
Shareholders’ equity 3,409.8 2,002.23 70
Equity ratio in % 31.6 27.33 20
Return on equity in % 7.4 11.13 -34
Balance sheet total 10,453.9 7,347.13 42
Borrowings2 2,719.9 2,027.43 34
Employees avg. 6,446 5,347 21
Apprentices and trainees (31.12.) 500 331 66
1 Without electricity and natural gas taxes2 Bonds and liabilities to banks3 Figures adjusted retroactively
Sales by business areas ( in per cent)
0
20
40
60
80
100100
80
60
40
20
0
70
17
8 5
2008 2009
74
16
10
* pro rata for 4th quarter
ICT
swb *
Network
Energy
Employees by business areas
Network 1,503
Holding 414
ICT 2,972
Energy 964
swb 594
2009

eWe Group and business areas
Corporate Centre energy Network swb ICT
The Corporate Centre business area mainly includes Group head office functions as well as strategically important mi-nority shareholdings and other business activities. It is there-fore distinctly separate from the operational Energy, Net-work, swb and ICT business ar-eas. The Group head office func-tions are primarily carried out by EWE Aktiengesellschaft.
The Energy business area is re-sponsible for sales of electricity, natural gas and energy services as well as energy procurement and production for EWE AG. The sales areas are situated in northern Germany. Via its for-eign subsidiaries EWE AG is also active in Poland and Turkey. A total of around 1.0 million elec-tricity customers and 1.3 mil-lion natural gas customers are supplied. The focus of produc-tion is on renewable energies. One of the Group’s additional core competences is operating its own natural gas storage fa-cilities.
The Network business area con-sists of the business operations of EWE NETZ GmbH. The com-pany owns and operates an ex-tensive electricity and natural gas network in the Ems / Weser /Elbe region and further natural gas networks in Brandenburg, Rügen and in northern West Pomerania. EWE NETZ also op-erates drinking water networks and an extensive communica-tion network to control and monitor the energy networks.
The swb business area pools all the activities of the swb group. As one of the leading providers in northern Germany of ener-gy and drinking water, waste and wastewater disposal, and technical services, swb sup-plies around 390,000 electric-ity customers and 170,000 nat-ural gas customers, primarily in Bremen and Bremerhaven. The company has proprietary power generation capacities of more than 1,000 MW.
Information and telecommuni-cations technologies are EWE’s key to customer-centric value-added offerings and the basis for sustainable energy con-cepts. The EWE subsidiary BTC has developed into an IT com-pany with nationwide and in-ternational operations and a wide range of services. The tel-ecommunications group EWE TEL offers its customers the full portfolio of landline, in-ternet, mobile and television services.
Group companies
1 Subgroup2 Associated company accounted for under the equity method3 Held for sale
EWE AG
VNG AG3
EWE AG
EWE Enerji A.Ş.1
EWE Polska Sp. z o.o.1
EWE Wasser GmbH
DOTI GmbH & Co. KG2
MVR GmbH & Co. KG2
EWE NETZ GmbH
Aequamus GmbH2
swb AG1 EWE TEL GmbH
BREKOM GmbH
BCC Business Communica-
tion Company GmbH
BTC AG1
htp GmbH 2
ncN GmbH
Front cover – Electric mobility for tomorrow
Electric mobility is a topic of equal interest to both automotive manufactur-ers and energy suppliers. That is because with their high-performance batter-ies, electric cars can serve as flexible storage media in the power grid of the future. EWE has therefore developed its own electric vehicle, the E3, in col-laboration with the automotive supplier Karmann. More on page 22 3

Group Review 2009 42Letter from the Board of Management 44Board of Management 47Report of the Supervisory Board 48Supervisory Board 50Corporate Governance Report 51
Investor Relations 54
Social responsibility 56
Group Management Report 2009 58
Course of Business and Economic Environment 59Earnings, Assets and Financial Position 77Supplementary Report 83Risk Report 84Outlook 86
Consolidated Financial Statements 88
Statement of Comprehensive Income for the EWE Group 89
Condensed Statement of Comprehensive Income for the EWE Group Reconciliation 89
Balance Sheet for the EWE Group 90
Statement of changes in shareholders’ equity for the EWE Group 92
Cash flow statement for the EWE Group 94
Notes to the consolidated financial statements for the EWE Group 95
Confirmation by the legal representatives 173
Auditors’ Report 174
Service 175
Glossary 175Index and list of abbreviations 177Financial calendar 178Imprint 178EWE Supply area
The e3 programme –our path to the energy supply of the future 4
Content
EWE Annual Report 2009

The e3 programme – magazine
18 26
4
Renewable energiesThe sustainable use of resourcesRenewable energies already play a much greater role than average in electricity and heat generation at EWE. 3 S. 4
Energy efficiencyMutual reciprocityHow EWE pieces together the jigsaw of fluctuating power production, electricity storage, shifting power loads and actual energy needs. 3 S. 18
Energy conservationValuing energyAs an energy services company EWE bears responsi-bility for future generations and is establishing a new energy awareness today. 3 S. 26
eTelligenceThe intelligent energy networkOne of EWE AG’s visions is becoming reality: in the trial region of Cuxhaven, eTelligence is heralding the advent of a new energy supply. 3 S. 32
Research cooperation projects and competitionsenergy projects on their way into the worldHow EWE and its partners research, access and apply opportunities for a sustainable energy supply and are recognised for it at a federal level. 3 S. 38
3238
3

RENEWABLE ENERGIES
The sustainable use of resourcesRenewable energies already play a much greater role than average in electricity and heat generation at EWE.
“ By 2020 the federal government wants to cover 30 per cent of the energy supply in Germany with renewable energies. Environmental and climate protection will de-fine tomorrow’s markets and open up enormous poten-tial for innovation and the growth of our economy.”
Katherina Reiche, Parliamentary State Secretary at the German Federal Environment Ministry
4 EWE Annual Report 2009 Renewable energies

Wind farm alpha ventusof the coast of Borkum
The alpha ventus test field not only supplies wind power, but also valuable knowledge. EWE will use the findings from the pilot project for future offshore projects.
3 Page 6
Photovoltaics system in the Weser Stadium
Environmental power generation and architectural aesthetics come together at this striking site on the Weser river. EWE and swb are buil-ding Germany’s largest PV system for a football stadium in Bremen. 3 Page 12
Biogas processingin Wüsting
Only once biogas has been upgra-ded to natural gas quality can it be used for generating heat and power as well as for refilling natu-ral gaspowered vehicles.
3 Page 16


hat is because work can only be carried out on the wind power facility when the sea is calm. Just 60km off the
German North Sea coast a vision has become reality. Today, the alpha ventus wind farm supplies up to 50,000 house-holds on the mainland with environmentally friendly elec-tricity from the North Sea. As the largest shareholder in this challenging project, EWE AG has taken another great step into the future of energy generation.
“The weather is good – we’re a go.” This is the news that everyone has been waiting for: the crew of Wind Force I, engineers from Munich, ornithologists from Osterholz- Scharmbeck near Bremen – people who are part of the pi-oneering alpha ventus project. They all rearrange their original schedule for the week, pack their bags and set off for Norddeich.
The Wind Force I casts off at 6 a.m. the next morning at the crack of dawn. Destination: – the trans former station in the alpha ventus construction field. The average wind speed here is a force 5, equivalent to 36 km / h.
The Wind Force I picks up speed. Waves slam into the bow of the ship. Working conditions out at sea are rough – that is something even experienced people notice as soon as they start the journey to the offshore wind farm. But today, the seasickness pills can stay in the ship’s first-aid box.
Two hours later, six gigantic wind turbines appear on the horizon in the grey dawn. Wind Force I reports to the traf-fic control ship Otto Treplin in the construction field and approaches the enormous transformer station. There is a flurry of activity: the workers climb into their offshore suits, fiddle impatiently with the clips of their life jackets and put helmets on. They are preparing to disembark and climb aboard the transformer station. EWE man Tjado de Groot from alpha ventus subproject A is the one responsible for organisation here. The transformer station on the high seas is his second home.
“We can even stay here for a few days in an emergency, if the weather turns bad for example,” says the expert, who has already made use of this possibility. The offshore trans-former station soars 30m out of the North Sea at the south- eastern corner of the alpha ventus wind farm. 3
The units used for calculations are “weather windows”, i.e. periods of suitable weather conditions. On the pioneering alpha ventus project they are what determine the com-plex interweaving of man, technology and nature.
EWE MAKES ELECTRICITy OUT OF NORTH SEA WINDS
alpha ventus – a symbiosis of vision, research and technology
T
7

Left: A gigantic wind farm – alpha ventus is about the size of 500 football pitches.
A 60km submarine cable leads from here via the island of Norderney to the mainland, where the electricity generated by the wind is ultimately delivered. This makes the transfor-mer station the technical heart of alpha ventus. The massive steel island in the North Sea is also the logistical centre for the wind farm, however, and is equipped with a docking sta-tion for ships, a helicopter landing pad, a workshop and accommodation for the workers. Here, working life ebbs and flows with the elements. Wind and waves dictate the duty roster. When the weather allows work to be carried out, the “weather window” is used effectively and with
First offshore wind farm in German territorial waters.•
The test field lies in the North Sea, around 45km north •of the island Borkum.
November 2001: planning permission granted.•
July 2007: preparatory construction work begins on •the island Norderney.
2008: first construction phase carried out at sea. •
The alpha ventus test field covers a total area of •4 square kilometres – that is the equivalent of around 500 football pitches.
With a total of twelve wind turbines, the offshore •wind farm is intended to generate energy for some 50,000 three-person households in future.
Autumn 2009: six turbines go into operation on a test •basis.
16 November 2009: the twelfth and final wind power •plant is completed for alpha ventus.
alpha ventus: just the facts
great concentration. Getting from the wildly pitching Wind Force I onto the ladder of the transformer station is an art in itself – half stepping, half leaping. Tjado de Groot checks his equipment and starts to climb. Today, he has a variety of maintenance work on his list. In addition, de Groot will be hel ping other members of the project team with their work. Two ornithologists want to install their infrared cam-eras and a video system on the transformer station. This equipment is intended to record birds’ flight movements around alpha ventus. This is because so far there is no data on how an offshore wind farm of these dimensions affects the environment. “alpha ventus is a test field, so its effects on the environment should be examined as well. This en-vironmental aspect has a very high priority for EWE AG,” underlines Dr. Jörg Buddenberg, Director of Energy and Environmental Technology at EWE.
The alpha ventus test field is an experiment in every respect. Three German energy companies are all pulling in the same direction: EWE, E.ON and Vattenfall are carrying out pioneer-ing work in the field of offshore wind energy in Germany.
8 EWE Annual Report 2009 Renewable energies

This is new territory for all of the partners. Financially, there is no planning certainty either. The original investment for alpha ventus was tabled at Euro 190 million. During the con -struction phase in autumn 2009 this was revised to Euro 252 million. “The price of experience,” admits Buddenberg, who sees these additional costs as an investment in the future. “The logistics in particular cost more than originally planned.” A single day spent out at sea is enough to realise that logistics are indeed a difficult element to quantify: in the middle of the construction field stands the impo sing form of the largest ship’s crane in the world – the Thialf. A total of 283 people from all over the world are at work on this floating colossus for the alpha ventus project. The mas-sive construction ship is used to help lay the foundations for the wind turbines.
Cutting-edge technology enables the offshore construction ship to place what are known as “jackets” onto pilings pre-viously anchored in the seabed with a tolerance of just a few millimetres. The timetable depends on the meteorol-ogists’ forecasts. Ultimately, the progress of the work is again determined by the wind and the waves – elemen tary forces that are difficult to predict for a project that in these dimensions has no parallel in Germany.
The transformer station was the first element of the offshore wind farm alpha ventus to be built, in Septem-ber 2008. It is both the technical and logistical base for the wind farm. This is where the cables from the twelve wind turbines come together, this is where the electricity is transformed and it is from here that the wind power generated ultimately flows as three-phase current along a 60km cable on the seabed to the mainland. The three-storey transformer station is equipped with a docking station for ships, a helicopter pad, a workshop and accommodation for the workers.
Technical heart: the offshore transformer station
Despite the difficult conditions, alpha ventus is an innova-tive project of full of superlatives that stands for climate protection, job security and technological progress. “We will certainly benefit from the experience we have gained here and can transfer this knowledge to other projects be-ing planned,” says Buddenberg. Wind power ahead to the future: “Renewable energies are becoming increasingly important and this is a sector in which EWE intends to achieve further growth.” 3

y 2020 a total of 20 per cent of total end-user energy consumption in the European Union is to come from
renewable energies. For Germany a target of 18 per cent has been prescribed. Katherina Reiche, Parliamentary Sec-retary of State at the German Federal Ministry for the En-vironment, Nature Conservation and Nuclear Safety, speaks about the future of renewable energies and the targets set by the federal government.
The federal government wants to cover 30 per cent of the energy supply with renewable energies by 2020. This is well above the figure laid down by Brussels. In which areas do you see the greatest potential for achieving this target?
The future belongs to renewable energies. That is why this government has set ambitious goals. Our aim is for renewa-ble energies to account for the majority of the energy supply. Wind energy in particular, both on and off-shore, and bioen-ergy have the greatest potential; looking further ahead, solar energy as well, especially solar thermal power.
What can the energy sector expect of the federal government in the years ahead?
The federal government will continue to develop its clear research focus on renewable energies. One key area at the moment is the interface between renewable energies and storage technologies. Electric mobility combined with renew-able energies also opens up completely new possibilities.
You are planning for solar energy to make up 5 per cent of electricity production by 2020. Are the reductions aimed for in solar energy subsidies not then counterproductive?
Technical developments and price reductions for photo-voltaics have advanced more quickly than originally expected. This is good news. The payments under the Renewable Energy Act (EEG) have to be adjusted in line with these developments in order to avoid paying people for doing what they would have done anyway and to create further incentives. The corollary is that we are now assuming much more ambitious development goals in this area. Photovoltaics has a future in Germany.
To what extent is the target of 30 per cent renewables by 2020 compatible with the extension of operating permits for nuclear power plants planned by the CDU / CSU and FDP political parties?
Nuclear energy is a bridging technology. We still need it for an interim period until it can be reliably replaced by renewable energies. The future belongs to renewable ener-gies, they definitely have priority. Extending operating per-mits and continuing to develop renewable energies are not mutually exclusive.
Just a few years ago the role of an energy utility was basically limited to supplying electricity and natural gas. Do you believe that modern energy services companies have a responsibility to carry out research and to educate?
Research and innovation are elementary, precisely for energy companies. It is only by means of modern, highly efficient technologies that they will be able to improve the climate footprint of their energy mix. This applies equally to education and to gaining acceptance in society at large. They are very much in a company’s own interests.
Germany is considered an international pioneer in the devel-opment of renewable energies. How do you see the position of the German energy sector in competition with other indus-trialised European countries?
Environmental and climate protection will define tomor-row’s markets and open up enormous potential for innovation and the growth of our economy. Germany is a global leader in environmental and energy technologies. Around the world, ever more markets are emerging for environmental technologies, bringing enormous growth opportunities. In order for German companies to maintain their leadership and secure a substan-tial market share on the rapidly growing global market, it will be necessary to accelerate technological developments and intensify export endeavours. Now more than ever it is impor-tant that technical advances and innovations are brought to market in order to build on Germany’s leading position. The task and the objective of the German Federal Environment Ministry is to encourage and support this work.
INTERVIEW
“The future belongs to renewable energies”
B
Katherina Reiche
10 EWE Annual Report 2009 Renewable energies

“ Of all renewable energies, wind energy has by far the greatest growth potential in the years ahead. The focus is on using offshore wind energy.” (German Federal Min-istry for the Environment, Nature Conservation and Nu-clear Safety, 2008)
EWE recognised the potential of wind energy for its busi-ness at an early stage. The first steps in the offshore arena came in 2004 when the energy group from Oldenburg in-vested in the wind energy project RIFFGAT that had been launched by the ENOVA group from Bunderhee in the East Friesian region. This was a shot in the arm for the regional economy. In 2008 the vision held by the two northern Ger-man offshore wind-energy pioneers was given some stable backing when the Oldenburg trade supervisory authority gave preliminary planning permission, confirming the
RIFFGAT
A northern German wind farm of a new magnitude
While offshore wind power projects were all the rage in 2009, Oldenburg-based EWE AG also kept a sharp eye on the land, extending its terrestrial wind energy activities as well. In June 2009 the Group acquired the Elsdorf II wind farm in the Rotenburg (Wumme) district of Lower Saxony with an output of 18 megawatts (MW). This increases the proportion of EWE’s power output derived from wind en-ergy to around 20 per cent.
“The acquisition of the Elsdorf II wind farm is a further step in our growth strategy for wind energy,” explains Dr. Thomas Neuber, Chief Officer of Procurement and Pro-duction at EWE. EWE is planning further land-based wind energy projects in future too.
The Elsdorf II wind farm generates around 42 million kilowatt hours of electricity a year. That is equivalent to the annual electricity consumption of around 12,000 average house-holds. The wind farm also helps to save around 22,850 tonnes of CO2 per year. It has been part of the net work since summer 2008, and since 2009 has been one of 45 wind power facilities at EWE AG with a total installed ca-pacity of around 100 MW.
LAND IN SIGHT
eWe increases output with the elsdorf II wind farm
site’s general suitability for building and operating an off-shore wind farm. The realisation of RIFFGAT is now just around the corner with construction work due to begin in 2011. A wind farm the size of 850 football pitches with 30 wind turbines is to be built in the North Sea, 15 kilome-tres off the coast of the East Friesian island of Borkum. Planned investment comes to some Euro 350 million.
For EWE the RIFFGAT project is the systematic continua-tion of the path that began with alpha ventus. Other part-ners are to be brought on board and RIFFGAT is due to go online in late 2012. It will represent a new order of magni-tude on the market, supplying 100,000 households with electricity from the wind.
11

ELECTRICITy FROM THE GLASS MANTLE
eWe makes the Weser Stadium an ambassador for new energy concepts
ince the stadium was refurbished the pitch isn’t the only fascinating thing to look at in Bremen. The world
behind the stands also offers a visual display that is full of energy. At this striking site on the Weser river, EWE, the energy supplier from Oldenburg, has now also made a strik-ing move towards the energy management of the future, together with swb AG and Bremer Weser-Stadion GmbH, both from Bremen.
Two years ago, in spring 2008, EWE AG, swb, an energy ser-vices company from Bremen, and Bremer Weser-Stadion GmbH unveiled their joint plants for refurbishing the We-ser Stadium. EWE is responsible for the innovative energy concept: the photovoltaics (PV) system of a new magnitude that envelopes the Weser Stadium like a glass mantle will generate around 840,000 kilowatt hours of electricity when it is completed at the end of 2010. “It is the largest photo-voltaic power plant integrated into a building in Germany. The power it generates covers half the stadium’s energy requirement,” explains Ulf Brommelmeier, the manager in charge of the project at EWE AG. That is equivalent to the annual electricity consumption of around 250 homes. This relieves the environment of more than 450 tonnes of CO2 emissions. “The electricity generated from the sun’s ener-gy flows directly into the public network,” says Brommel-meier and points to the three feed-in points in the stadium. Power from the PV building elements in the Weser Stadium
that are already up and run-ning is being fed into the swb network in Bremen. This net-work also supplies the sta-dium with the electricity it requires. While the PV ex-pert from EWE AG reels off figures, he looks down from
the roof of the Weser Stadium over the skyline of the Han-seatic city of Bremen, silhouetted against the setting sun. Inside the houses the first lights are being switched on – with solar power from the Weser Stadium.
Here, high above Bremen’s roofs, photovoltaic thin film modules collect the sun during the day. The thin film cells are much lighter than conventional, thicker PV cells, mak-ing them the perfect material for building the roof of the Weser Stadium, which is intended to be as light as possible. The others, known as glass PV modules, have been inte-grated into the south and east facades. They are the ones that not only generate electricity when the sun shines, but also create the fascinating play of light and shade in the restaurant area on the south side.
The photovoltaic power plant in the Weser Stadium is a pio-neering work in every regard. “There is no PV project of com parable complexity anywhere in the world. All the PV components have a structural function, and the rain takes care of cleaning the facade. We have married the photovol-taic and the building industries,” boasts EWE Project Man-ager Ulf Brommelmeier and talks about a transformation in the energy industry and in architecture in which EWE AG plays a vital role. 3
Where it is not absorbed, the full force of the sun breaks through the glass roof of the Weser Stadium, inscribing an impressive geometric pattern of light and shade on the concrete walls of the restaurant area.
S
12 EWE Annual Report 2009 Renewable energies


Climate protection with aesthetic aspirations: the photovoltaics system determines the architecture at the Weser Stadium in Bremen.
With the Weser Stadium project the two energy services companies EWE and swb, together with the football club SV Werder Bremen, have made the photovoltaics system something worth looking at. It now doesn’t simply serve to generate environmentally clean power. Neither has it been propped up like an alien appendage on an existing building. In Bremen it rises beyond this to become an integrated con-struction element, a means of aesthetic expression with maximum functionality. By their achievement the partners involved have set a trend in the cons truction industry that can now be followed by other energy utilities, building companies and architects.
Transparent design – the facadePhotovoltaic elements are plainly visible in the facade of the Weser Stadium in Bremen and meld into one with the transparent architecture. This structural elegance was made possible with the help of glass PV modules. Each individual module measures 2.50m by 1m and con-sists of two sheets of glass. As if in a picture frame there are 60 – 70 crystalline photovoltaic cells sandwiched between them. The dark PV cells are about the size of a CD cover and are held sufficiently far apart for 40 per cent of the sunlight that falls on them to pass through the gaps into the stadium.
High performance – the external roofing ringThe largest photovoltaics system integrated into the Weser Stadium is the external roofing ring. The PV thin film modules each measure around 5m by 40cm, are made of flexible material and serve to keep off the sun and seal the roof at the same time. They are delivered rolled up like normal roofing felt and then laid in strips. The thin film modules cover a total area of 7,000 sq m, making them the biggest sun collectors for the Weser Stadium project.
Technical innovation – the internal roofing ringThe structural engineers specified lightweight material for the internal roofing ring. That meant something new was required. As in the facade, crystalline PV cells are sandwiched between two sheets. Not between sheets of heavy glass, however, but of Makrolon.
This plastic is produced by Bayer AG and is remarkable for its high light transmission, stability under heat and good electrical insulation properties. As Makrolon expands and contracts more than glass under different temperatures, the PV cells had to be adapted accord-ingly and were sealed in a special silicone. This led to the development of an innovative construction product. It achieved a weight-saving of around 60 per cent com-pared to the glass solution.
Weser stadium – behind the scenes:
14 EWE Annual Report 2009 Renewable energies

In a single hour the sun radiates more energy onto the Earth than the entire population of the world consumes in a year. This makes the sun one of the most important fu-ture sour ces of energy. EWE, the energy services compa-ny from Olden burg, has for decades been using the power of the sun to generate environmentally friendly electrici-ty. Now, with its innovative schools project ‘sonnenklar’, EWE is going a step further. Future generations are being taught about renewable energies in order to foster a new awareness of responsible energy use.
The solar project is unique in Lower Saxony and shines some light on a dull theory: the EWE Group equips project schools with a photovoltaics system, monitors, measuring instru-ments and a mobile workshop. This turns the solar panels on the roof, which are pretty abstract for school children, into an object of scientific research. The children can track precisely how much electricity their solar panels are gen-erating at any given time.
With the sonnenklar project EWE AG has set itself an am-bitious educational goal: the next-generation energy cus-tomers are to acquire wide-ranging knowledge of renewa-ble energies. Solar energy is not the only topic on the
agenda for the school children – EWE makes it fully realis-tic for the schools and also teaches them about the im-portance of wind and water for tomorrow’s energy supply. The children receive guidance on how to build a miniature wind turbine or a solar-mobile and can thus access the practical significance of renewable energies. In addition, EWE also provides the project schools with teaching ma-terials and invites their teachers to take part in training courses.
The first sonnenklar project school is Waldschule Hatten in Sandkrug, south of Oldenburg. Its photovoltaics system was installed on the roof of the assembly hall in September 2009 and with optimal sunshine can produce around 25,000 kilo-watt hours of electricity a year – that corresponds to the annual power consumption of about seven average house-holds. So far, EWE has installed some 15 solar power plants with a total output of around 280 kilowatts on school roofs in the Ems / Weser / Elbe region, and there will be more to follow.
SONNENKLAR: EWE BRINGS THE SUN TO SCHOOL
Oldenburg energy services company promotes new energy awareness

HEAT AND POWER FROM MAIZE AND SLURRy
eWe biogas plant in Wüsting illustrates regional potential
aize, grass, manure and slurry are the basic ingredi-ents for the energy cocktail from which farmer Hel-
mut Urban in Wüsting produces biogas. This project in the township of Hude, in the district of Oldenburg, is a further element of EWE’s consistent commitment to using biogas. In September 2009 the energy services group began oper-ations at the largest biogas processing plant in northwest Lower Saxony, situated in the village of Wüsting. The farmer Helmut Urban had previously taken a decision to connect a gas feed-in plant to his existing biogas facility. In June 2008 the project documentation was ready for signing. Now, the EWE plant is running at full speed, producing enough gas to supply 3,800 households for a year. In concrete terms this means that around 5.8 million cubic metres of bio natural gas from Wüsting are being fed into the public gas network every year. EWE built the facility together with many partners from the region and invested Euro 3.7 million.
As an operator of several biogas processing plants EWE is a strong partner for regional agriculture.
M
16 EWE Annual Report 2009 Renewable energies

Pediram-me que escrevesse um Blindtext português seria algo como o texto para
Conventional biogas plants have no additional heat strat-egy and no processing and therefore lose a lot of energy, but the innovative processing and feed-in plant in Wüsting is a showcase for northern German biogas technology. It has a high level of operating efficiency, bringing the bio-methane up to natural gas quality before feeding it directly into the EWE natural gas network that runs between the rivers Ems and Elbe. This enables it to be used directly in homes and businesses.
The feed-in plant in Wüsting is an example of new, effec-tive solutions for using biogas based on sustainable tech-nology. The energy group from Oldenburg wants to build on this achievement, as Dr. Thomas Neuber, Chief Officer Procurement and Production, confirms: “In the years ahead EWE intends to expand its biogas business. The focus will be on upgrading biogas to natural gas quality and feeding it into the natural gas network.” EWE intends to use inno-vative technology in future to obtain the maximum energy yield from biogas. “We also see ourselves as a strong part-ner for the farmers in the region.”, added Neuber.
In the years ahead eWe intends to expand its biogas business. The focus will be on upgrading biogas to natural gas quality and feeding it into the natural gas network.
EWE currently operates two biogas processing plants and three biogas plants and holds a stake in a fourth. Planning is underway for two more processing plants in the northwest.
The processed biogas is not only used to generate heat and power, but also for natural gas powered vehicles. Natural gas filling stations in the Ems / Weser / Elbe region now blend a total of ten per cent biogas with the natural gas, which already produces lower emissions when combusted. This results in a reduction of up to 30 per cent in environmen-tally harmful CO2 emissions. This is EWE’s contribution to the trend of blending biofuel with fossil vehicle fuels.

ENERGy EFFICIENCy
Mutual reciprocityHow EWE pieces together the jigsaw of fluctuating power production, electricity storage, shifting power loads and actual energy needs.
“ Greater efficiency in converting and using energy is often easier and quicker to achieve than extending the energy supply. Alongside the expansion of renewable energies this will therefore be an economically attractive component of future energy systems.”
Prof. Dr. Carsten Agert, Director NEXT ENERGY, EWE-Forschungszentrum für Energietechnologie e.V.
18 EWE Annual Report 2009 energy efficiency

e3 electric car
EWE stores electricity in a car and takes a close look at the way people drive. The E3 is not only a vehicle, but also serves researchpurposes. 3 Page 22
Combined heat and power
A CHP plant that provides power and heat at the same time is already highly energy efficient. With smart controls it has even greater potential. 3 Page 20
Intelligent household appliances
Household appliances learn about the wind. If fridges started up at the right time, Germany would save one coal-fired power plant.
3 Page 24

CHP CONTRACTING AS AN ExAMPLE OF
DECENTRALISED ENERGy MANAGEMENT
Papenburg Basil Alliance for energy efficiency
When a human being – a biological engine – starts to move, it involves power, when riding a bicycle for instance. With the right technology this can generate electricity, to power a light bulb for example. In the process, the body begins to sweat and generates heat. So a human being is a very ele-mentary type of combined heat and power plant, CHP for short. This principle works in a similar way in the world of energy technology. Combined heat and power means that electricity and heat are produced simultaneously. The clas-sical CHP plant, a block heat and power plant, is run using
an engine. This combustion engine drives a generator that produces electricity. At the same time it produces waste heat from the engine, which is used for heating. The advan-tage of CHP plants is that power and heat are generated where they are needed. These small power plants are mainly used in detached and semi-detached houses or in small blocks of flats. The principle of combined heat and power works particularly well with the fuel cell. Its high electrical efficiency coefficient make it one of the most efficient technologies in the field of CHP.
HP contracting is an energy concept that offers many opportunities for using energy efficiently and sharing
it with others. EWE AG is constantly developing new strat-egies in this field and increasing its customers’ awareness of this economically sensible and environmentally sustain-able form of electricity generation. In CHP contracting the utility company and the customer sign a contract for the supply of heat and power from a CHP plant. The utility com-pany provides the customer with the plant and operates it, so it contributes expertise and financing. The customer gets power and heat from the CHP plant at low-cost rates and does not have to worry about service and maintenance. Furthermore, a cooperative partnership can also develop if the customer is open to optimising his energy manage-ment. The result is individual solutions for energy conser-vation, sustainable energy efficiency and load and gener-ation management by the utility company – what is known as demand side management.
Over a period of two years EWE tested how CHP contracting partners can achieve the greatest energy efficiency in collaboration with two plant nurseries near Papenburg. In the EWE demand side management project for business customers, i.e. the manage-
ment of electricity generation and demand for industrial and commercial customers, the herb basil plays a vital role. That’s because Papenburg is the German capital of herb growing. And because the sunlight in Emsland isn’t as strong as in Provence, basil from Papenburg needs greenhouses, electrical light and warmth. An ideal proving ground for CHP plants such as those in use in the plant nurseries that supply electricity and heat at the same time.
“The aim of the project was to find out how the volume of energy generated in the nurseries could be shifted a little,” explains Dr. Ulli Arndt, a member of the EWE Research and Development department. This is based on the fact that when the customer does not require the power from the CHP plant at a given time, it is fed into the public grid. The energy company can then deploy the electricity generat-ed as needed. In order to optimise energy management for the nurseries in Papenburg, EWE calculated their energy
Combined heat and power – an elementary principle
CHP contracting is an energy concept that offers many opportunities for using energy efficiently and sharing it with others.
C
20 EWE Annual Report 2009 energy efficiency
The fuel cell: the CHP model of the future
“ I believe that water will one day be employed as fuel, that hydrogen and oxygen which constitute it, used singly or together, will furnish an inexhaustible source of heat and light. Water is the coal of the future.”
(Jules Verne, French novelist, The Mysterious Island, 1870)
A visionary idea from the past is taking shape: environmen-tally friendly heat and power are being produced from hy-drogen and oxygen. The fuel cell is what makes this inno-vative way of producing energy possible. Its principle is to
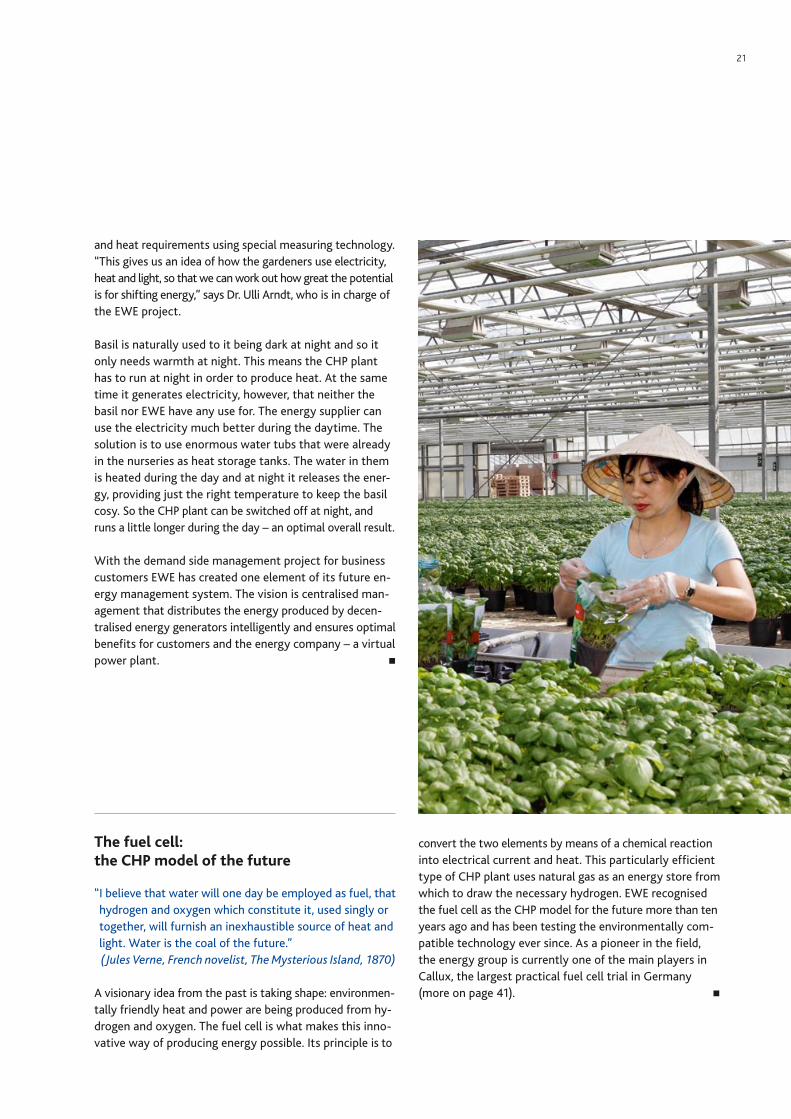
and heat requirements using special measuring technology. “This gives us an idea of how the gardeners use electricity, heat and light, so that we can work out how great the potential is for shifting energy,” says Dr. Ulli Arndt, who is in charge of the EWE project.
Basil is naturally used to it being dark at night and so it only needs warmth at night. This means the CHP plant has to run at night in order to produce heat. At the same time it generates electricity, however, that neither the basil nor EWE have any use for. The energy supplier can use the electricity much better during the daytime. The solution is to use enormous water tubs that were already in the nurseries as heat storage tanks. The water in them is heated during the day and at night it releases the ener-gy, providing just the right temperature to keep the basil cosy. So the CHP plant can be switched off at night, and runs a little longer during the day – an optimal overall result.
With the demand side management project for business customers EWE has created one element of its future en-ergy management system. The vision is centralised man-agement that distributes the energy produced by decen-tralised energy generators intelligently and ensures optimal benefits for customers and the energy company – a virtual power plant.
convert the two elements by means of a chemical reaction into electrical current and heat. This particularly efficient type of CHP plant uses natural gas as an energy store from which to draw the necessary hydrogen. EWE recognised the fuel cell as the CHP model for the future more than ten years ago and has been testing the environ mentally com-patible technology ever since. As a pioneer in the field, the energy group is currently one of the main players in Callux, the largest practical fuel cell trial in Germany (more on page 41).
21
WHEN yOU CAN’T BELIEVE yOUR EARS
Preparing for the era of electric mobility
ne day, things will be quieter on Germany’s roads. Pe-destrians will have to use their ears more than their
eyes when crossing the street. Inside the vehicle, the sound of the radio will no longer have to compete with the noise of the engine. For today’s drivers it is hard to imagine, but the E3 developed by EWE and Wilhelm Karmann GmbH from Osnabrück is a vehicle that makes virtually no noise. A futuristic feeling takes hold of the passengers when the electromobile starts to move: they can’t believe their ears. A silent, quite different and very relaxing driving sensation.
In ten years there are to be one million electric cars on Ger-many’s roads. This is the target set by the federal govern-ment. EWE’s CEO Dr. Werner Brinker is still sceptical about this figure. “It is important and right to start now though because CO2 emissions, exhaust fumes and noise in cities are a real problem.” EWE AG from Oldenburg has taken the first step with the E3. The electromobile with a research function is prompting change in the motor state of Lower Saxony, as it is the first car worldwide to sport the logo of an energy company on its radiator grill. Why an energy supplier is putting a car on the road solely for research purposes is explained by Dr. Jörg Hermsmeier, Director of the EWE Research and Development department, “As an energy supplier, we don’t intend to start building cars. We want to prepare ourselves for integrating electric vehicles into the network. That means we need to know how bat-teries and network management work.”
The E3 is the latest example of EWE AG’s work on the sub-ject of storing electricity. It is also one of the energy group’s answers to the question of how renewable energies can be used in future. Because wind and sun don’t take human requirements and the load curve on the power network into account. Power generation using elementary forces is var-iable and so attempts must be made to store or modulate energy for periods of consumption. The E3’s battery offers one possibility for doing so. The car will draw power from the grid when there is an oversupply of renewable energies – at night for instance. When the car is not in use it will also be plugged into a charging station and can bridge bottle-necks in the power supply by allowing the utility compa-ny to feed electricity from the battery back into the net-work or to offer system services. Of course the car’s driver has to be sure that the vehicle is ready for use at all times as well. In future an intelligent IT system will make this role-changing possible. EWE wants to balance three com-ponents: current energy supply, customer needs and the responsibility of the energy supplier to maintain a system of equilibrium in the electricity grid.
In practice, EWE intends to construct a network of charg-ing stations in northwest Germany and test their func-tionality. Battery-switching stations are also a possibility. The Director of the Research and Development depart-ment, Jörg Hermsmeier, believes these are even simpler for car drivers: “You drive up a ramp and the battery is
Why EWE AG from Oldenburg with its E3 is the first energy supplier in the world to put a car on the road that advances research, protects the climate and prompts change in the state of Lower Saxony, whose economy is closely linked with the automobile industry.
O
22 EWE Annual Report 2009 energy efficiency

OL – E 3 This is the registration number of the E3 that has been driving around northwest Germany as a research vehicle since November 2009. The five-door car in metallic sil-ver blue combines the energy of a sports saloon with a comfortable interior. A total of eight prototypes of the electric car will soon be out for road testing in the Weser / Ems region. The model is aimed at commuters in the re -gion, where charging stations for the E3 are being instal-led. EWE AG is coordinating the entire project and finan-cing the development of the concept cars. Karmann, the car developer from Osnabrück, is building the proto types. The two partners only needed one year from initial dis-cussions in November 2008 until the E3 was approved for road use in November 2009. The E3 is thereby also a demonstration of the effective pooling of energy in the Weser / Ems region.
swapped automatically. It takes just one minute. The driver simply stays seated in the car.” Hermsmeier sees filling a car with liquid fuel as an outdated technology that con-sumers only stick to out of habit. That is another objective that EWE AG is pursuing with its E3 model for the future: to break old habits and gain acceptance for new things. “Ultimately, it the customer who will decide whether there are electric vehicles on Germany’s roads. That is not least a matter of range, speed and everyday dependability,” emphasises EWE’s CEO Brinker. One thing is certain: when the era of electric mobility arrives in Germany, EWE will be ready for it and will have created an intelligent network that the e-mobile customer only has to plug into.
EWE and the E3 electric car
Its innovative overall concept means that the E3 makes itself heard, even without engine noise.

ots of EWE customers will soon be asking themselves these questions, because in 2010 the energy supplier
from Oldenburg is bringing the EWE trio smartbox to mar-ket. The electronic smart-metering system provides the opportunity of flattening peak loads in the electricity grid and making better use of renewable energies by charging different rates. When the innovative metering system is introduced, customers will know precisely how much elec-tricity their television uses, for instance. When its full func-tionality can finally be used in combination with other ap-pliances, consumers will really have to make that decision about their washing. Indeed in future, energy-conscious customers are supposed to give their EWE trio smartbox instructions. One example could be that the washing should be clean by 6 o’clock in the morning. Armed with this in-formation the smart system then ensures that at a given time of the night, perhaps when a lot of wind energy is available, the preloaded washing machine is switched on and runs on electricity produced from renewable energies.
The Director of the EWE Research and De-velopment department, Dr. Jörg Hermsmeier, illustrates the immense potential of this energy management by taking the exam-ple of a fridge: “There are 40 million house-holds in Germany. If you imagine that the
fridge goes on at the same time in every fourth house hold, that makes 10 million fridges that are consuming electric-ity at the same time. A refrigerator uses around 100 watts, so that adds up to 1,000 megawatts in total. A large coal-fired power plant also has an output of around 1,000 mega-watts. So in Germany one large power plant is actually running just for fridges.” By controlling the fridges intelli-gently, power plant capacity and the integration of renew-able energies could be managed much more efficiently. This would also reduce CO2 emissions considerably. For EWE this was the decisive factor behind the cooperation agreement with Miele. Several of the manu facturer’s household ap-pliances are already equipped with intelligent communi-cations technology and are technically compatible with EWE’s smart-metering system. A fridge-freezer combina-tion is very well suited to EWE’s purposes, explains Jörg Hermsmeier.
How much electricity does my television use? Does my fridge need peak-load power? When should the washing be clean by?
The lightness of energy efficiency: with intelligent household appliances climate protection is just a matter of programming.
L
ENERGy EFFICIENCy By MEANS
OF APPLIANCE MANAGEMENT
The power of the fridge on the energy market
24 EWE Annual Report 2009 energy efficiency

“A freezer compartment must have a temperature of -18 °C. The EWE trio smartbox could now control the appliance so that it switches on at a particular time and chills the freezer down to -21 °C. This has no effect on the quality of the food stored there. Then the freezer needs no elec-tricity at all for a while, until it gets back to -18 °C, when it has to switch on again.”
The energy services company is now looking for several households where the special fridge-freezers can be in-stalled for a practical trial this year. “The results should be ready by the end of 2010,” confirms EWE development di-rector Hermsmeier. The energy group aims to use the project to demonstrate that the energy-efficient manage-ment of domestic appliances really is effective and has a positive effect on the load curve for electricity.
25

ENERGy CONSERVATION
Valuing energyAs an energy services company EWE bears responsibility for future generations and is establishing a new energy awareness today.
“ We should be able to create an awareness of energy in children, starting in kindergartens and schools. It can be fostered by showing children how energy use varies de-pending on the time of day and the seasons of the year. If in addition the buildings are economical, well designed and understandable in terms of their purpose and func-tion, then a feeling for the frugal use of resources of all kinds will soon be taken for granted.”
Prof. Dr.-Ing. Volker Droste, Architect BDA DWB, Oldenburg
26 EWE Annual Report 2009 energy conservation
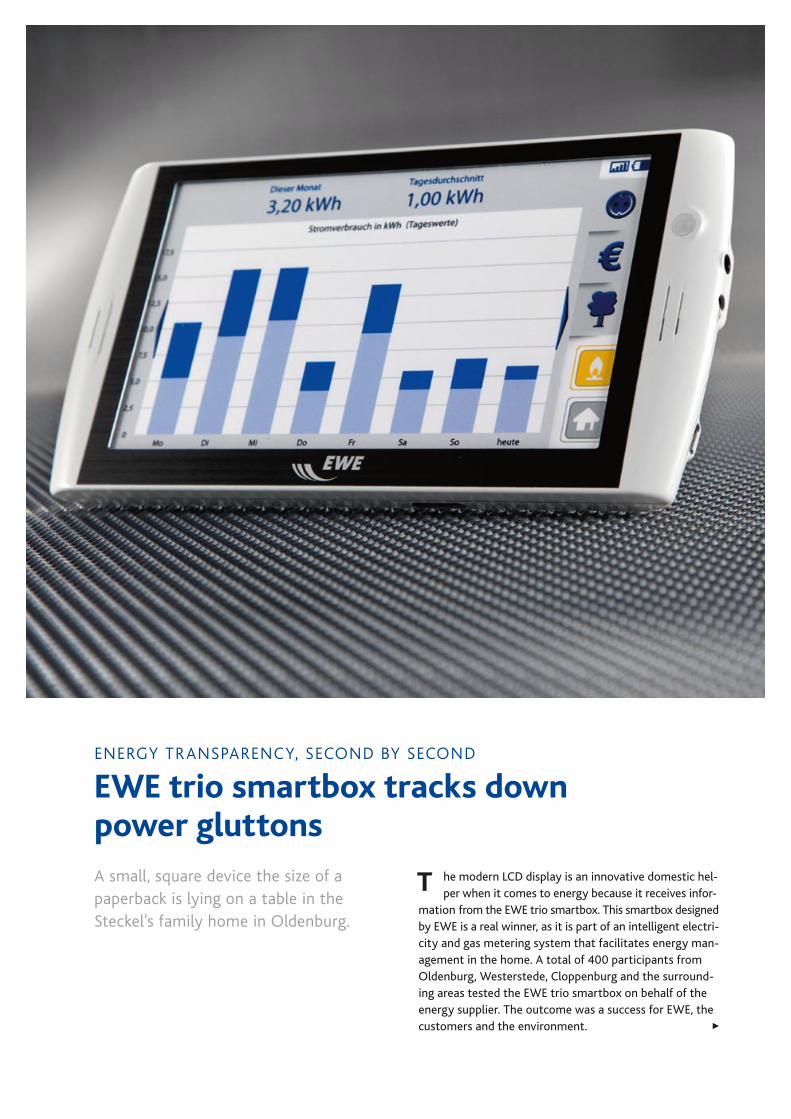
ENERGy TRANSPARENCy, SECOND By SECOND
eWe trio smartbox tracks down power gluttons
he modern LCD display is an innovative domestic hel-per when it comes to energy because it receives infor-
mation from the EWE trio smartbox. This smartbox designed by EWE is a real winner, as it is part of an intelligent electri-city and gas metering system that facilitates energy man-agement in the home. A total of 400 participants from Olden burg, Westerstede, Cloppenburg and the surround-ing areas tested the EWE trio smartbox on behalf of the energy supplier. The outcome was a success for EWE, the customers and the environment. 3
A small, square device the size of a paperback is lying on a table in the Steckel’s family home in Oldenburg.
T

In coordination with the participants, who include the Steckel family, the new technology needed to be turned into a marketable product and fine-tuned to meet cus-tomers’ needs. That has now been achieved: from summer 2010 the EWE trio smartbox is to be available for all cus-tomers in the northwest.
Since the four members of the Steckel family have had the EWE trio smartbox in their home, their nose for tracking down power gluttons has improved sharply. Eight-year-old Felix, who attends primary school in Oldenburg, thinks the EWE trio smartbox is great because its display tells him exactly how much electricity he is using at any given time, “I like electronics, so I take a look at the screen quite
often.” The device has sparked his interest in saving energy. He has already gone through his bedroom and discovered all the electricity guzzlers. “The fish use the most” says Fe-lix and lists the different pieces of equipment he needs for his aquarium. For his parents, Andrea and Stephan Steck-el, the EWE trio smartbox was also an eye-opener. “The kettle sends the energy curve up the fastest,” says Stephan Steckel and gives a practical demonstration of the EWE trio smartbox. In the kitchen Andrea Steckel turns the kettle on, and straight away the energy curve on the display shoots upwards. Despite this, the Steckels don’t intend to forego all their modern conveniences and the kettle is simply use-ful. “I don’t expect we can reduce our electricity and gas consumption much in future,” says Stephan Steckel. By using the EWE trio smartbox the family has now nearly exhausted the possibilities of saving energy in normal everyday life. That is confirmed by the smileys on the dis-play, which appear when a household’s energy consump-tion is exemplary.
Stephan Steckel has achieved his goal, which was for him and his family to make a contribution to protecting the climate. He especially wanted to get his sons involved in the topic, “The visualisation on the display makes it under-standable for kids straight away.” Even the household’s CO2 emissions are shown on the display. Having taken part in the test, Stephan Steckel is convinced that the EWE trio smartbox has helped his whole family reach a new level of energy-awareness. In order to give the boys an incentive too, their parents paid them both an energy bonus, “We had quite a high rebate on our bill that we owe to the way we used the EWE trio smartbox. As the children contrib-uted to the rebate by the commitment they showed to saving energy, it’s only fair that they should have a share of it as well.”
The EWE trio smartbox didn’t just change the way the family from Oldenburg thinks about energy – it also coor-dinated their daily routines with the sensible use of ener-gy. This is because EWE introduced flexible energy pricing for the project participants. In summer, electricity for testers of the EWE trio smartbox is five cents cheaper from 4 p.m. In winter the cheap rate applies from 9 p.m. Since then the Steckel family’s programmable washing machine only runs at night. EWE AG is already planning to introduce an intelligent electricity rate for all future EWE trio smartbox customers. This would not only be of benefit
28 EWE Annual Report 2009 energy conservation

An innovative metering system for electricity and gas consumption
With its EWE trio smartbox the energy supplier from Olden-burg is one of the first utilities in Germany to have tested an innovative metering system for electricity and gas con-sumption. Three devices are in permanent operation: the central server at EWE AG on one side and on the other, in the customer’s home, the EWE trio smartbox combined with modern electronic electricity and gas meters as well as a display to view the information generated by the EWE trio smartbox. Among other things, the intelligent trio records the household’s energy consumption in real time by means of continual communication between the three components. The EWE trio smartbox then sends the cus-tomer’s consumption figures via the internet to the EWE server, where they are analysed. The processed measure-ments are then made available to customers on a web portal.
At the same time the EWE trio smartbox installed in the customer’s home transmits the data to the display by wire-less. This special LCD display enables the customer to see what is going on second by second. EWE AG developed the innovative system, including the display, in cooperation with the Fraunhofer Institute for Solar Energy Systems, ISE, and the Fraunhofer Application Center System Technology, AST.
While the conventional black electricity meters leave con-sumers in the dark until the bill comes, the EWE trio smartbox gives them full transparency on their energy use. It pro vides information about current electricity and gas consump tion and daily costs, it shows a steep climb in the energy curve when appliances are turned on or draw cur-rent, it supplies analyses and forecasts and even records a household’s CO2 emissions.
The EWE trio Smart Box in a nutshell
to the environment and to customers, but also to the en-ergy services company itself. At the moment the load on the electricity grid is particularly high at certain times of day, i.e. lots of consumers draw current at peak times. This leads to bottlenecks that the energy supplier has to bridge by purchasing expensive peak-load power on the energy market. If lots of people shift part of their electricity con-sumption to the night, however, the load on the grid will be more evenly spread.
The 400 EWE trio smartbox pioneers in the northwest al-ready see themselves as winners: the permanent real-time access to all their electricity and natural gas con-sumption data enables them to use resources sensibly and brings financial benefits. “The test showed that custom-ers cut their electricity use by up to ten per cent with this technical innovation,” confirms Project Manager Ludwig Kohnen. Since January 2010 intelligent electricity meters have been mandatory in all newly built houses in Germa-ny. EWE AG far-sightedly took this step at its own initia-tive and will soon offer all its customers energy transpar-ency, second by second.
When fish turn out to be power hungry: Felix Steckel has discovered that his aquarium is an electricity guzzler.
29

A COMPLETE DEMONSTRATION
OF ENERGy TOPICS
The Zentrum Zukunft It looks futuristic, but it stands right in the here and now: the EWE Zentrum Zukunft in Emstek near Cloppenburg is a reality. In this puristic building the energy group illustrates how the people of tomorrow will live. The focus is on net-working energy supply with new media and on EWE AG’s e3 programme, which is all about energy efficiency, ener-gy conservation and renewable energies. The Zentrum Zukunft is a platform for all the approaches developed in the EWE Group for a sustainable energy supply.
The facade is made of stainless steel mesh, which under-lines the technical character of the building and brings ther mal benefits at the same time. In summer the woven metal casts a shadow and wards off the strong sun; in winter the sun’s rays can still find their way through the filigree structure to the interior. A weather station on the roof adjusts the energy supply in the Zentrum Zukunft depending on the conditions outside. It measures wind speed, precipitation and sunlight and reports the data to the intelligent central building control systems. They con-trol all the appliances in the Zentrum Zukunft and turn it into a complete demonstration of energy efficiency.
The Zentrum Zukunft is a training and conference centre for business partners from various trades, architectural, political and research fields. The different groups of pro-fessionals can obtain information about technological in-novations there and prepare for the markets of the future. The centre also organises regular open days for the general public.
Top: Futuristic architecture underlines the building’s message – here, the future is made visible.
Above: Functional aesthetics – the facade of the Zentrum Zukunft ensures thermal equilibrium.
30 EWE Annual Report 2009 energy conservation

EWE DAy-CARE CENTER
BIBERBURG
Kids from the Biberburg learn to appreciate energyAnna would like to eat waffles, and on her way to EWE’s Biberburg day-care centre she looks up to the sky in con-cern – was there enough wind for waffles? After one glance at the wind-waffle monitor in the Biberburg her mouth starts to water – 40 bright green lights signal that 40 waffles can be baked using wind power.
In the Biberburg, electricity from renewable energies is made visible in a way children can relate to. There is a small wind-mill on the roof that is connected to the waffle monitor outside the kitchen. Every time a waffle is baked one of the lights changes colour again and becomes dark green. This helps the kids to develop an understanding and
appreciation of where energy comes from. There is also a photovoltaic power plant on the roof of the EWE day-care centre. Its electricity production is also visualised using the VisiKid display designed at the University of Applied Sci-ences Münster. When the sun shines, small balls roll down as in a marble run and land in a container at the bottom. It could be called a sunshine counter: lights go on at the same time to illustrate the electrical output of the photo-voltaics system.
The Biberburg includes a crèche, nursery school and after-school day-care and currently looks after around 100 chil-dren for 84 EWE employees. There is a huge range of ac-tivities on offer: a laboratory for young researchers, a work shop and even a greenhouse on the roof, where the temperature is kept above freezing in winter using the heat from the playrooms. With the Biberburg EWE not only provides support for employees with children, but has also created a building where energy is made tangible for the children.
Left: When the windmill turns, the Biberburg is full of the smell of waffles.
Above: Another day at the Biberburg – energetic activities in a low-tension environment.
31
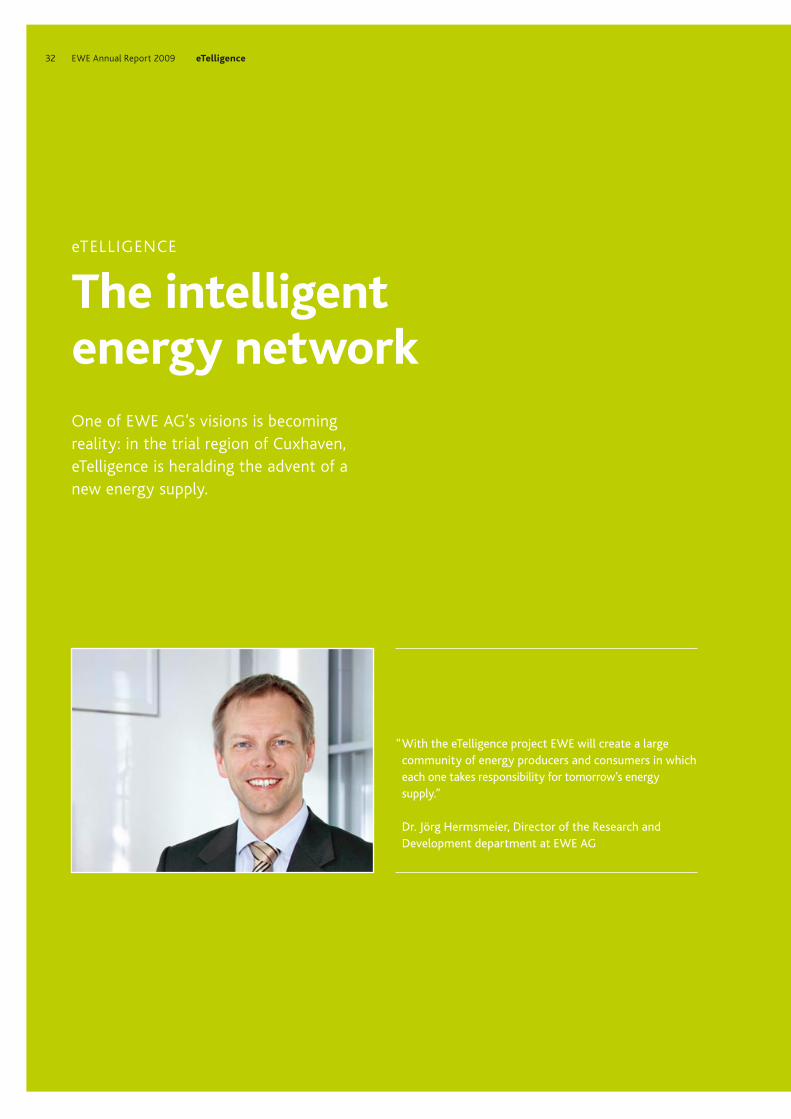
“ With the eTelligence project EWE will create a large community of energy producers and consumers in which each one takes responsibility for tomorrow’s energy supply.”
Dr. Jörg Hermsmeier, Director of the Research and Development department at EWE AG
eTELLIGENCE
The intelligent energy networkOne of EWE AG’s visions is becoming reality: in the trial region of Cuxhaven, eTelligence is heralding the advent of a new energy supply.
32 EWE Annual Report 2009 eTelligence

Smart Grid
One for all and all for one: EWE is building a community full of energy. The intelligent grid in Cuxhaven takes nature into account and uses innovative technology to do so.
3 Page 34
The participants
EWE connects the cold store with the wind turbine, integrates the biogas plant and keeps the sun in mind. Together, decentralised energy generators shift peak loads in the power network. 3 Page 36
Trial region Cuxhaven
In the coastal region of Cuxhaven the fluctuating electricity levels generated from wind power can be tamed with intelligent techno logy – a great example for the future. 3 Page 34

he weather forecast not only helps to choose between an umbrella and sunglasses, but also signals whether
tourists will be coming and if the trawlers can head out to sea. In future there are likely to be even more people in Cux- haven with a keen interest in the weather. They will be look-ing out for the sun, and in particular for the wind. These elementary forces are the energetic capital for EWE’s in-novative eTelligence trial project in Cuxhaven.
eTELLIGENCE BRINGS A BREATH OF FRESH AIR
TO THE FUTURE OF ENERGy
energetic market bustle in the Cuxhaven trial region
A smart grid is an intelligent electricity network. It refers to the networking and controlling of decentralised power generators, storage devices and consumers using commu-nications technology. Networking these individual entities makes a secure and efficient electricity supply possible. It also optimises the integration of fluctuating energy pro-duction from the wind and the sun.
Smart grid: the intelligent electricity grid
Wherever fishermen live, the weather has always been of great importance. On the coast, rain, storms and sunshine not only affect people’s moods, but also the economic climate.
T
Above: No longer just a consumer – the cold store is used to store electricity.
Left: The Cuxhaven region already covers 50% of its energy needs from wind power.
34 EWE Annual Report 2009 etelligence

When the wind blows in Cuxhaven, it produces current. Even today, the region gets 50 per cent of its energy needs from wind power – the energy potential of this coastal region is literally in the air. However, wind power is not always avail-able – the wind turbines often rotate at just the right speed, but sometimes the wind drops and they come to a stand-still and at others it is too gusty and the turbines have to be switched off for safety reasons. To smooth out these fluc-tuations in the energy supply it is necessary to steer the volume of electricity intelligently. The Oldenburg-based en-ergy services company EWE has now created the rudder for doing so: eTelligence.
eTelligence is one of six projects to be sponsored by the German federal government as part of the E-Energy initi-ative. The research project runs until 2012. Taken togeth-er, the findings of those involved in the project are intend-ed to produce standards that will subsequently set trends for the whole of Germany. In Cuxhaven EWE intends to build a regional marketplace for energy trading. “Goods will be traded there according to supply and demand, just like at a vegetable market. There also has to be someone to run the market, to set the rules for the traders,” explains
The district of Cuxhaven is one of the largest in terms of surface area in both Lower Saxony and the whole of Germany. The coastal region at the mouth of the Elbe is, however, predominantly populated by cows – 300,000 head of cattle are in a majority compared with the approximately 202,000 human inhabitants. 70 per cent of the land in the Cuxhaven region is used for agriculture. And so this is an area where biogas plants are also becoming increasingly important – in 2009 there were already 13 of these plants producing energy from biogas in the district of Cuxhaven. They are now to be integrated into the EWE project eTelli-gence as decentralised energy generators.
However, the greatest potential source of energy in the coastal region of Cuxhaven comes from the wind: lo-cal wind power facilities have a total capacity of more than 375 megawatts. The region has also created an-other high-potential sector with the construction of an offshore port. EWE sees Cuxhaven as a perfect test bed for eTelligence, in order to develop a secure energy supply for the future with fluctuating levels of energy production. Cuxhaven is also an interesting economic location for commercial fishing and tourism, situated on the coast and not far from the metropolitan re-gions Hamburg and Bremen-Oldenburg. This means the region has plenty of cold storage houses and swimming baths, which play an important role in the eTelligence project for shifting power loads.
Cuxhaven – there’s energy in the air
Dr. Jörg Hermsmeier, Director of the EWE Research and Development department. It has to be established who can sell on the market, who has which rights and how the set-tlement process should work. Laying down these market rules is one of the main tasks of the eTelligence project.
The energy market will be open to consumers, network operators and energy providers. Everyone can be both a consumer and a producer of energy. For instance a cold store operator can make his / her business available as a power storage plant; operators of photovoltaics systems, wind or biogas facilities can act as decentralised energy generators. Furthermore, every home and every company can steer their actual energy needs by efficient energy management. They will all be networked using the latest communications technology and together, they ensure that power loads can be shifted efficiently. This produces an energetic market bustle for a common goal – a sus-tainable energy supply and climate protection.
35

SOMETIMES ELECTRICITy CAN BE
WAREHOUSED
Cold storage houses There is plenty of fish in the Lentzkai cold store in Cux-haven’s Amerika dock. It’s lying on pallets, in boxes, crates and barrels in enormous halls at an average temperature of -25 °C. But as well as their frozen goods, the warehouse operators Erwin Gooss GmbH & Co. KG and Cuxhavener Kühlhaus GmbH have recently started storing something quite different, namely electricity. The two companies are taking part in the EWE eTelligence project and their two cold storage houses serve as an energy buffer.
Behind the scenes is a sophisticated system. When the wind is strong, wind turbines produce a lot of electricity. At cer-tain times, however, such as at night, there is hardly any demand for the wind power. This is where the two cold storage houses integrated into the eTelligence project come into play. When there is a surplus of wind power, the refrig-eration equipment leaps into action with the support of intelligent communications technology and uses it. For a time, the fish is then not stored at -25 °C, but at -27 °C, which causes it absolutely no problems. When consumers in Cuxhaven finally need more power and the load curve on the network rises, the refrigeration equipment is switched off again. In a modern cold store this is not an issue, as good insulation ensures that the temperature only increases by 1 °C per day, even when the refrigeration is switched off. The fish needs to be kept at a certain regular temperature, but within this range there is room for manoeuvre. eTelli-gence uses this range as a power storage device. The re-frigeration units on the Lentzkai only switch themselves back on again when they need to.
The control technology for the refrigeration equipment is housed in a small white box. It was put together specially at great time and expense, however, as this intelligent com-munications technology for cooling units is not yet availa-ble on the market, explains Dr. Jörg Hermsmeier. “We need to develop standards for controlling the refrigeration equip-ment and straightforward plug-and-play connections like on a computer. Then it will be a standardised connection, which needs matching software with stan dardised commu-nications protocols.” This is one of the tasks EWE wants to solve as part of the eTelligence project.
For Axel Stahlbuck, the managing director of the cold stor-age houses, the control technology is not a problem – for him, the slightly changed processes in his warehouses have been hardly noticeable. His only concern is that they are at the right temperature. “And if we can also make an ac-tive contribution to protecting the climate and optimising our energy costs, then so much the better,” he says and adds that he will be interested to see the financial effects of his new energy activities. This is because as an additional form of support, EWE offers those taking part in the energy marketplace in Cuxhaven flexible, low-cost rates.

NExT-GENERATION ENERGy
MANAGEMENT
Virtual power plantEWE AG is currently building a power plant in Cuxhaven – not of steel and concrete but of ideas and communications technology. It doesn’t generate electricity either, but con-trols its distribution. The power plant under construction in Cuxhaven is a virtual one – a platform for many large and small decentralised energy producers. Power from wind farms, biogas plants, photovoltaics systems and CHP plants is fed-in here, managed and shifted. The virtual power plant in EWE’s eTelligence project is the manager in an intelligent, cutting-edge electricity network, also known as a smart grid. This command and control centre knows the energy needs and habits of the consumers and producers that are networked across it. Private homes can be integrated into this system too. They coordinate their energy requirements with the vir-tual power plant and thereby help to shift load peaks in the network by optimising the time they use electricity. The
innovative system can draw on cold storage houses and swimming baths to use as buffers when energy produc-tion fluctuates.
“All the players must be able to communicate with one another at all times and it must be simple to integrate new ones,” explains Dr. Jörg Hermsmeier, Director of the EWE Research and Development department. A plug-and-play IT infrastructure is therefore vital for the energy supply of the future. This is what EWE now wants to create in Cux-haven as part of the eTelligence project. The aim is to de-velop standardised interfaces for future networks, which will subsequently ensure a secure, efficient and climate-friendly energy supply nationwide.
MAKING INDIVIDUAL ELECTRICITy
CONSUMPTION TRANSPARENT
Private households EWE has already made the first connections in Cuxhaven – large customers such as cold storage houses and swim-ming baths have been networked and can be controlled in
an energy-efficient manner. In 2010 private households will also be included in the eTelligence project. “We already have 450 volunteers and are still looking for a few more,” says Dr. Jörg Hermsmeier, Director of the EWE Research and Development department. Consumption patterns in private homes will be a decisive factor in the energy supply system because eTelligence is essentially about matching supply and demand for electricity as efficiently as possible.
To do so, the households will be equipped with the eTelli-gence box. They will also receive an iPod touch with an app to visualise their consumption. It also serves as an ad-ditional display alongside the internet portal and receives information on individual electricity consumption.

RESEARCH COOPERATION PROjECTS
AND COMPETITIONS
energy projects on their way into the worldHow EWE and its partners research, access and apply opportunities for a sustainable energy supply and are recognised for it at a federal level.
H2H2 O2
Schematic diagramme of a fuel cell
Membrane
CathodeAnode
38 EWE Annual Report 2009 Research cooperation projects and competitions

RESEARCH CENTER NExT ENERGy
Where researchers lure light into a trapOn the natural sciences university campus in Oldenburg, work on the future of energy is being carried out in a 4,000 sqm building.
hysics, chemistry, engineering and information tech-nology are the pillars for the ideas being developed
by currently around 50 scientists carrying out research on behalf of NEXT ENERGY. “We have space for about 100 staff,” says Prof. Dr. Carsten Agert, the Director of the re-search centre and implies that this contingent is also to be filled in the years ahead. NEXT ENERGY conducts research into renewable energies, energy efficiency and energy in-frastructure. In collaboration with various partners from industry, business and the scientific community, the insti-tute is looking for solutions for the energy supply of to-morrow. The focus is on photovoltaics, fuel cells and en-ergy storage devices.
Opening the doors to the laboratories in the NEXT ENERGY research centre is like entering a world of ideas bristling with energy. Everything you see here doesn’t actually ex-ist yet, at least not outside in the market. It is a ground-breaking world of new inventions – a world of discoveries, hopes, disappointments and triumphs. The laboratories are sterile and dust-free, everyone coming in has to wear a lab coat and protective glasses. And everyone working here wants to know more – about materials and how they behave in time and space. 3
Rays of light: Kambulakwao Chakanga and Stefan Geissendörfer at the solar simulator.
P
39

On the first floor a heavy door opens to reveal a laborato-ry in the fuel cell department. Department head Dr. Olaf Conrad and his colleagues are working here on the heart of the fuel cell, the membrane electrode unit. They are looking to optimise it using novel materials. A few doors down, research is going on into developing storage sys-tems for mobile applications, i.e. electric mobility. Another topic is redox flow batteries for stationary applications. One floor down are the characterisation laboratories of the photovoltaics group. The heart of these laboratories is a solar simulator from the company Wacom that enables newly developed solar cells to be tested inside and out. “This solar simulator has two light sources and is pretty much the highest technical standard that can be reached at the moment,” explains Clemens Feser, a PhD student at the institute. “The simulator’s high degree of accuracy is especially important for our novel materials. The silicon thin film solar cells being developed at NEXT ENERGY are no longer made up of one light-absor bing layer, as in the past, but consist of up to three layers. We hope that this will make our cells substantially more efficient than com-parable systems on the market.”
In order to achieve even greater efficiency coefficients, the scientists at NEXT ENERGY are going one step further and attempting to contain the light using a process known as light trapping. This technology uses sophisticated surface structures inside the solar cell to try and refract or reflect the light so that its path through the cell is as long as pos-sible. The aim is to transform all the sun’s rays into elec-trical energy within the ultra-thin layers. The researchers are aided by a device that resembles a record player. It is used to conduct a surface analysis on every new layer de-veloped here. The layer is laid on a turntable like a record and a special needle is run over its surface. By looking at the deflection of the needle (by a few tens of nanometres), the scientists can discover how rough the newly developed layers are. If the outer surface of the thin layers is rough, it can trap light better than if it is smooth. NEXT ENERGY is very important for Oldenburg as a sci-entific location. But the location also has advantages for the institute as well, confirms Prof. Dr. Carsten Agert, Di-rector of NEXT ENERGY. “When we are trying to get a project up and running we have strong partners right here on our doorstep.” As a major partner and sponsor of the research centre, EWE also benefits from the scientists’ findings. “The proximity to EWE is extremely helpful in many cases because we mostly work on topics that are
relevant to EWE as well. At the same time, NEXT ENERGY can enjoy the satisfaction of seeing joint projects gradu ally producing results,” explains Agert.
He believes that a secure and environmentally friendly energy supply is the central challenge for the future. NEXT ENERGY is taking up this challenge by means of research.
is a research institute affiliated with the Carl von Ossi-etzky University, Oldenburg. NEXT ENERGY is organised under the auspices of the EWE Research Centre for Energy Technology e.V., an association with charitable status. Its members include the university and the state of Lower Saxony, as well as EWE AG as the main sponsor. NEXT ENERGY is an independent research institute funded by donations from the association without federal or local state subsidies.
Its research is concentrated on the e3 programme
“The term e3 is often used at EWE – it is based on the Bul-lensee Assumptions and stands for renewable energies, energy efficiency and energy conservation. At NEXT ENERGY we have also decided to focus on three themes and to choose research topics in similar categories. In renewable energies we are concentrating on thin film photovoltaics and in energy efficiency on combined heat and power using fuel cells. As research into energy con-servation is not very feasible, our third e stands for energy supply systems and energy infrastructure. In this field we are going to look at storage devices and electric mobility.”
Prof. Dr. Carsten Agert, Director of the NEXT ENERGY research centre in Oldenburg
NEXT ENERGY
40 EWE Annual Report 2009 Research cooperation projects and competitions

everyday use. The German federal government’s target is one million electric vehicles on Germany’s roads by 2020.
The fuel cell is also well on the way to market – the effi-cient combined heat and power plants should be compet-itive by 2015. To advance this goal the federal government set up and funded with Euro 86 million the pilot project Callux, in which EWE AG has taken a leading role. Energy utilities, appliance manufacturers and university institutes are all taking part in the largest practical trial of fuel cell heating systems for the home in Germany. Altogether, the partners are investing Euro 1 billion to promote the use of this innovative technology. The project name Callux stands for calor (warmth) and lux (light). A total of 800 detached houses throughout Germany are to be equipped with the highly efficient heating systems – EWE is taking on a large share, with more than 300 appliances. Around 30 natural gas customers in EWE’s supply region have already been equipped and a further 75 are planned for 2010.
he eTelligence project for instance, which EWE AG and its partners are carrying out in the region of Cuxhaven,
convinced the federal jury and won a prize in the E-Energy innovation competition. E-Energy was launched by the German Federal Ministry of Economics and Technology in partnership with the German Federal Ministry for the En-vironment, Nature Conservation and Nuclear Safety. Over the period to 2012 an integrated energy network for the future based on information and communications tech-nology, ICT for short, is to be developed in a total of six selected trial regions. Standards are to be set that will subsequently apply throughout Germany and even be-yond. The six trial regions have a total of Euro 140 million in funding for the development of this smart grid, made up of their own funds and government grants.
Within the framework of the eTelligence project EWE AG has also set up a new project known as GridSurfer. The objective is to develop a power storage management sys-tem based on ICT. The E3 electric vehicle jointly designed and built by EWE and Karmann, the car developer from Osnabrück, plays a leading role in the project. In a field trial in north-western Germany the energy services com-pany from Oldenburg is building a complete system around the E3 – with charging stations, metering and control sys-tems and a battery exchange strategy. Billing and market-ing procedures are also being developed. EWE was one of five winners in the ICT for Electric Mobility competition with GridSurfer. The competition was organised by the German Federal Ministry of Economics and Technology using funds from the second economic stimulus package. This is EWE’s contribution to laying the foundations for the propulsion technology of the future in the automotive industry, and for this project in northwest Germany the Group received additional federal funding – the Bremen-Oldenburg metropolitan region is one of eight subsidised trial regions where electric mobility is to be made fit for
EWE AG has generated a great many ideas. Some of these concepts have elicited very positive reactions.
IDEAS GET A PULSE OF ENERGy
Prizes and funding for eWe projects
“EWE responded to the changes in the energy industry early on and has built a business with three stable pillars: energy, telecommunications and information technology. It is very gratifying when the ideas and achievements based on these pillars are recognised, most recently with the prize for our sustainable innovation management in the Best Innovator 2009 competition.”
Dr. Werner Brinker, CEO of EWE AG
EWE and research competitions
T
41

EWE and Deutsche Telekom intend to jointly advance the installation of fibre optic cables in eight towns in Lower Saxony and in Bremer-haven in future. The partnership is to create the technical foundations for high-speed broadband internet access. The German federal govern-ment’s broadband strategy forms the framework for this initiative. It aims to give all households in Ger-many internet connections of 50Mb per second by 2018.
EWE TEL is awarded the contract to expand and operate the tele-communications network for pub-lic administration in Lower Saxony by the statistics and communica-tions technology authority. This is the largest customer win to date for EWE TEL. The company nordcom Niedersachsen GmbH was estab-lished in 2009 to execute the con-tract, for which a period of three years is planned.
For the third time, EWE presents a variety of ideas relating to the energy supply of the future at Hannover Messe. The world’s largest industrial fair showcases innovations and sets trends. EWE attracts both professional visitors and politicians to its stand with exhibits on decentralised energy management systems and the E3 programme. The E3 electric car was also shown here for the first time.
EWE’s second biogas processing plant starts operations in the district of Ol denburg. This enables biogas to be used throughout the supply area. Until now it was only available for producing heat and power locally. The processing technology is a key aspect of adding value to EWE’s investment in biogas.
January February April
Group review 2009
September
42 EWE Annual Report 2009
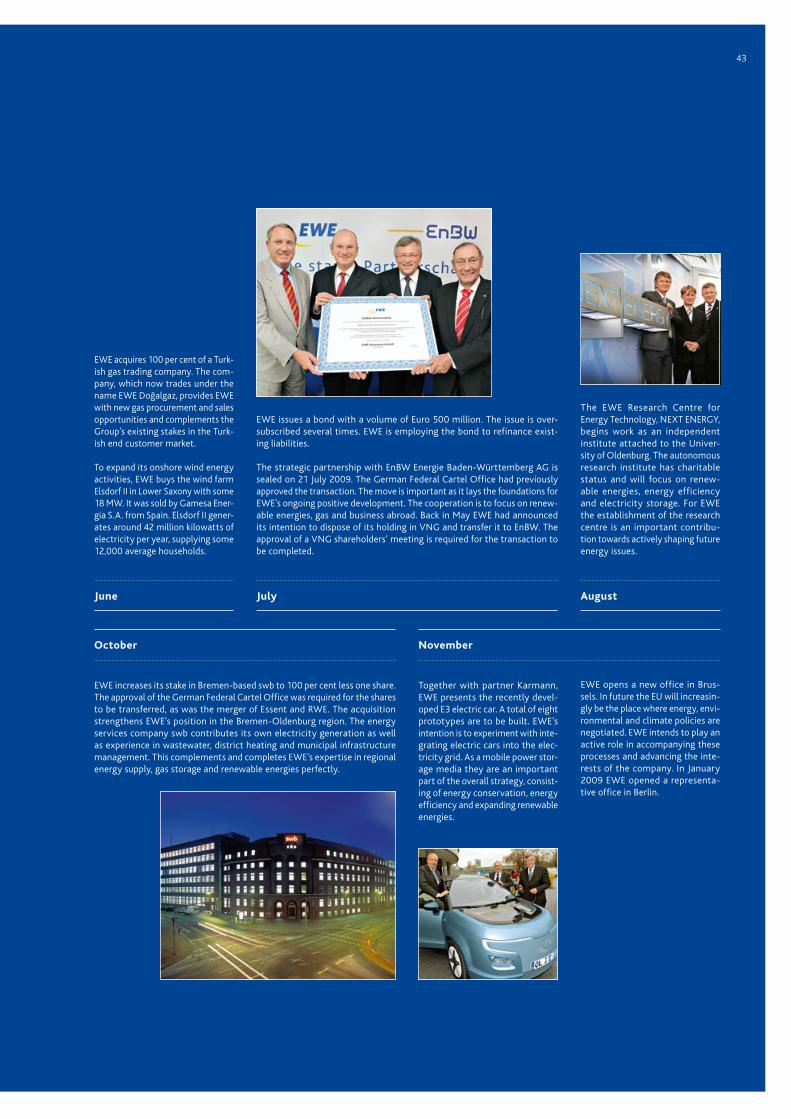
The EWE Research Centre for Energy Technology, NExT ENERGy, begins work as an independent institute attached to the Univer-sity of Ol denburg. The autonomous research institute has charitable status and will focus on renew-able energies, energy efficiency and electricity storage. For EWE the establishment of the research centre is an important contribu-tion towards actively shaping future energy issues.
EWE issues a bond with a volume of Euro 500 million. The issue is over-subscribed several times. EWE is employing the bond to refinance exist-ing liabilities.
The strategic partnership with EnBW Energie Baden-Württemberg AG is sealed on 21 july 2009. The German Federal Cartel Office had previously approved the transaction. The move is important as it lays the foundations for EWE’s ongoing positive development. The cooperation is to focus on renew-able energies, gas and business abroad. Back in May EWE had announced its intention to dispose of its holding in VNG and transfer it to EnBW. The approval of a VNG shareholders’ meeting is required for the transaction to be completed.
EWE acquires 100 per cent of a Turk-ish gas trading company. The com-pany, which now trades under the name EWE Doğalgaz, provides EWE with new gas procurement and sales opportunities and complements the Group’s existing stakes in the Turk-ish end customer market.
To expand its onshore wind energy activities, EWE buys the wind farm Elsdorf II in Lower Saxony with some 18 MW. It was sold by Gamesa Ener-gia S.A. from Spain. Elsdorf II gener-ates around 42 million kilowatts of electricity per year, supplying some 12,000 average households.
EWE increases its stake in Bremen-based swb to 100 per cent less one share. The approval of the German Federal Cartel Office was required for the shares to be transferred, as was the merger of Essent and RWE. The acquisition strengthens EWE’s position in the Bremen-Oldenburg region. The energy services company swb contributes its own electricity generation as well as experience in wastewater, district heating and municipal infrastructure management. This complements and completes EWE’s expertise in regional energy supply, gas storage and renewable energies perfectly.
AugustJulyJune
Together with partner Karmann, EWE presents the recently devel-oped E3 electric car. A total of eight prototypes are to be built. EWE’s intention is to experiment with inte-grating electric cars into the elec-tricity grid. As a mobile power stor-age media they are an important part of the overall strategy, consist-ing of energy conservation, energy efficiency and expanding renewable energies.
EWE opens a new office in Brus-sels. In future the EU will increasin-gly be the place where energy, envi-ronmental and climate policies are negotiated. EWE intends to play an active role in accompanying these processes and advancing the inte-rests of the company. In january 2009 EWE opened a representa-tive office in Berlin.
October November
4343

44 EWE Annual Report 2009
A year ago, at this point in the foreword to the 2008 annual report we were only able to speculate. The expectation was that EWE would also be affected by the fall-out from the economic crisis in 2009. In view of the many imponderabilities involved we were not able nor did we want to give a precise forecast of the extent to which this would be the case. Today, with the economic indicators fortu-nately pointing towards a recovery, we can say looking back that yes, the crisis did cost us earnings. For one thing, we felt the recession in our business with industrial clients, due to lower sales of elec-tricity and natural gas. Demand for IT services also fell appreciably for a time. Our operations in Po-land and Turkey were also affected by the economic crisis. At the same time, however, we can say that stable business with private and commercial customers, which accounts for a large proportion of EWE’s energy business, helped to compensate. Furthermore, the telecommunications services business was hardly affected by the economic crisis.
All in all, we made it through a difficult period well, thanks to our broad-based business model and decisive entrepreneurial counter-measures. We achieved sales of Euro 5,798 million (previous year: Euro 5,327 million) and therefore improved on 2008 sales by 9 per cent, partly due to the acquisition of swb AG and the resulting consolidated numbers. EBIT came to Euro 414 million (previous year: Euro 426 million). Consolidated net profit for the year came to Euro 199 million (previous year: Euro 211 million).
A Group structure that plays to our strengths
To sum up in advance, we can say that 2009 was probably one of the most important years in EWE’s recent history. We are particularly pleased that we successfully took a number of vital steps for the company’s future development at precisely such a difficult time. We were able to pursue our growth strategy consistently. The acquisition of the remaining shares (less one share) in the Bremen-based energy company swb strengthened the EWE Group’s service portfolio considerably and our presence in the Bremen/Oldenburg region. Like EWE, swb focuses on the end-customer market, has a stable customer base and has successfully marketed innovative energy products and services for decades. swb’s own power generation and experience in wastewater, district heating and municipal infrastruc-ture management open up exciting new prospects for the EWE Group. Furthermore, we were able to add around 20 per cent to our financial and sales performance by taking over swb.
In EnBW we have found a competent partner. The strategic partnership was sealed in July 2009 with the transfer of 26 per cent of the EWE shares to the energy provider from Baden-Württemberg. In the years ahead we plan to cooperate in renewable energies, in the gas business and abroad. This new collaboration will give EWE numerous opportunities to increase its footprint in these areas over the long term.
To compete more efficiently and more competitively – those were our objectives when we reorganised our telecommunications division last year. All regional telephone companies have now been merged into the central subsidiary EWE TEL. With the contract from the state of Lower Saxony to build a state-wide communications network, EWE TEL gave an impressive demonstration of its position in the
Letter from the Board of Management

market. For the future we have a lot planned in this sector. We intend to expand our offering in the field of entertainment services for instance, in order to open up new prospects in this highly competi-tive market.
Investment in research and development, more than ever when times are tough
Innovation is our strength and our competitive advantage. Starting from the three pillars of our core business – energy, telecommunications and information technology – we strengthen our market po-sition definitively by making a clear commitment to developing sustainable energy concepts and in-novative products. That is why we stuck to our investment strategy for research and development in 2009, despite the difficult economic environment. Our projects in this area are long-term in nature, as the infrastructure sector has long investment cycles of 30 to 50 years. Anyone who thinks and acts for the short term here will not participate in the key developments of the future.
A milestone of great importance in 2009 was the completion of the offshore wind farm alpha ventus, in which EWE holds a majority stake. Offshore technology is a topic of the future with great potential for innovation and growth. We will soon be able to use the experience and findings gained on alpha ventus in our next offshore project, the construction of the maritime wind farm RIFFGAT.
Another success and by no means an everyday occurrence was the presentation of the prototype for our E3 electric car, which we realised in collaboration with the well-known auto motive manufacturer Karmann. The goal is to integrate these cars into the electricity network intelligently so that we can use them as a means of mobile electricity storage. This represents a further important staging post on our way to building a decentralised energy management system.
Management Board (from left)Heiko Harms,Dr. Werner Brinker,Michael Wagener,Dr. Thomas Neuber

The demands of our markets define what we do
For 2010 we have again set ourselves ambitious goals. Let us describe three of them:
From the current perspective we expect the course of business in 2010 to bring a significant increase in sales and positive earnings development. The first-time consolidation of swb for the full year and the incipient, if slow economic recovery in our markets will play a vital role.
Today we already benefit from the efforts made in recent years to trim the company for innovation and growth and make it competitive. We are now planning to adjust our structures in order to chan-nel this success even more precisely and advance our business. The aim will be to ensure optimal and effective management and cooperation within the Group and to establish a structure that does jus-tice to the Group companies’ different markets.
Our main priority remains innovative products such as the EWE trio smartbox, a new metering and information system for the electricity and gas consumption, as well as expanding our offering in entertainment services of EWE TEL. Our intention is to reinforce our competitiveness and build on our position as a leading multi-service company in northern Germany.
We would like to express our heartfelt thanks to all our employees for their hard work and commit-ment. We send a warm welcome to the staff of swb and look forward to continuing the successful collaboration. Our thanks also go to our customers, shareholders and business partners for their trust and support. We will continue to do all we can to show ourselves worthy of them. Yours sincerely,
Oldenburg, Germany, April 2010
Board of Management
Dr. Werner Brinker Heiko Harms Dr. Thomas Neuber Michael Wagener
46 EWE Annual Report 2009

Board of Management
Dr. Thomas Neuber Chief Officer Procurement and Production
Oldenburg, born 1965, Dr.-Ing., Technical University Clausthal and Berlin, member of the Board of Management since 2007.
Responsible for corporate develop-ment, energy trading, gas purchasing and storage as well energy and envi-ronmental technologies
Heiko HarmsChief Operating Officer
Rastede, born 1965, Dipl.-Ing., Brunswick Technical University,member of the Board of Manage-ment since 2000.
Responsibility for the Network and ICT business areas, operations in Tur-key, as well as safety at work, sales accounting and data protection.
Michael WagenerChief Financial Officer and Board member for Human Resources
Rastede, born 1957, banker, member of the Board of Management since 2005.
Responsible for the areas of account-ing and taxes, controlling, finances and investor relations, and human resources.
Dr. Werner BrinkerChief Executive Officer and Board member of Sales and Marketing
Rastede, Germany, born 1952, Dr.-Ing., Brunswick Technical University, member of the Board of Management since 1996.
Responsibility for the EWE Group’s strategic orientation, energy sales and services, research and development, as well as marketing, communications and legal affairs.
47The e3-programme Management Investor Relations Social Responsibility Group Management Report Consolidated Financial Statements

During the course of the financial year 2009 the Supervisory Board monitored the management of the company and received regular, comprehensive reports from the Board of Management on the company’s position, all significant events and company performance, both verbally and in writing.
The Supervisory Board discussed all matters requiring its approval either under law or the Company articles in detail and took the necessary decisions. In a total of five meetings the Supervisory Board dealt in particular with capital expenditure and its financing, the income statement as well as indi-vidual transactions of particular importance. Two events merit special mention. On 6 July 2009 the German Federal Cartel Office approved the investment by EnBW Energie Baden-Württemberg AG in EWE Aktiengesellschaft, taking a strategic stake of 26 per cent. In order to meet the conditions set under competition law, the Supervisory Board approved the potential disposal of EWE’s sharehold-ing in VNG Verbundnetz Gas Aktiengesellschaft. In addition, on 21 October 2009 EWE AG acquired a further 51 per cent of the shares in swb, so that EWE now owns 100 per cent less one share of swb. This acquisition enabled EWE to expand its conventional power generation capacity to more than 1,100 megawatts. Abroad, EWE strengthened its commitment in Turkey by acquiring a 100 per cent interest in the trading company EWE Doğalgaz. The gas procurement contract signed for this pur-pose in Turkey in June 2009 secures EWE’s trading volume and thereby ensures stable growth. An-other high light is the construction and operating start of the twelfth turbine at alpha ventus, the first German offshore wind farm in the North Sea, in which EWE AG is the largest shareholder with 47.5 per cent. In addition to the topics mentioned above, the Supervisory Board also looked closely at the performance of the Group, the performance of VNG – Verbundnetz Gas Aktiengesellschaft, the German Corporate Governance Code, the German Accounting Modernisation Act (BilMoG), the development of energy prices, the approval process for network fees and the broader political envi-ronment for the energy business. Comprehensive changes to EWE AG’s Company articles also came into effect on 8 July 2009. As a result of EnBW’s strategic investment, Mr. Villis, Dr. Zimmer and Dr. Gaul were appointed to the Supervisory Board of EWE AG as representatives of EnBW on 21 July 2009. Dr. Harig, Mr. Reiners and Mr. Grotheer left the Supervisory Board of EWE AG. In the new Supervisory Board elections Mr. Villis was voted Second Deputy Chairman, Mr. Döscher Third Deputy Chairman and Mr. Eveslage Fourth Deputy Chairman of the Supervisory Board. The members of the Supervisory Board committees, in-cluding the Steering Committee, also changed along with the new appointments.
Together with the Board of Management, the Supervisory Board committees prepared the meetings and the resolutions of the Supervisory Board. In total the Steering Committee met eight times, and the Finance and Audit Committee and Operating Committee each met twice.
The individual financial statements of EWE AG prepared by the Board of Management in accordance with the German Commercial Code (HGB), the IFRS consolidated financial statements, and the ma-nage ment reports for EWE AG and the Group have been audited by PricewaterhouseCoopers AG, Wirtschaftsprüfungsgesellschaft, Oldenburg, elected as auditors at the Annual General Meeting on 23 April 2009 and appointed by the Supervisory Board. The auditors expressed no reservations.
Report of the Supervisory Board
48 EWE Annual Report 2009

The auditors’ reports were distributed to the members of the Supervisory Board and included in the discussion and examination of the individual financial statements and the consolidated financial state ments. The auditors were present at the Supervisory Board meeting dealing with the financial statements, where they reported on the major findings of their audit and were available to answer questions. Having conclusively examined the individual financial statements and consolidated finan-cial statements prepared by the Board of Management, the management report for EWE AG and the Group management report as well as the proposal for the appropriation of distributable profit, the Supervisory Board has no objections to make and today approved the individual financial state-ments and the consolidated financial statements. The Supervisory Board concurs with the Board of Management’s proposal for the appropriation of profit.
The Board of Management also prepared a report as required under Section 312 of the German Stock Corporation Act (AktG) on transactions with related parties. The auditors have audited this report and, having no objections to make, gave the following statement:
“On the basis of our audit and in our professional opinion we confirm that
the factual statements of the report are correct,1.
the consideration paid by the company for the transactions mentioned was not 2. inappropriately high.”
After examining the report ourselves the Supervisory Board concurs with the results of the audit and declares that it has no objections to the statement of the Board of Management at the end of the report on transactions with related parties.
The Supervisory Board expresses its thanks and appreciation to the Board of Management, all members of staff and the Works Council members for their work in 2009.
Oldenburg, Germany, 26 April 2010
Supervisory Board
Günther BoekhoffChairman
49The e3-programme Management Investor Relations Social Responsibility Group Management Report Consolidated Financial Statements
Günther Boekhoff Honorary Mayor of LeerChairman
Rainer Janßen Technical Supervisor, EWEFirst Deputy Chairman NETZ GmbH, Varel
Hans-Peter Villis Chairman of the Board of Second Deputy Chairman Management of EnBW AG, Castrop-Rauxel,
Martin Döscher Honorary District Third Deputy Chairman Administrator, Köhlen
Hans eveslage District Administrator, Fourth Deputy Chairman Cloppenburg
Wolfgang Behnke Systems Integrator, EWE AG, Oldenburg
Hermann Bröring District Administrator, Meppen
Claus Christ Technical Supervisor, EWE NETZ GmbH, Remels
Karl-Heinz Funke Minister (retired), Varel
Dr. Hans Michael Gaul Member of the Board of Management of E.ON AG (retired), Dusseldorf
Heiner Grotheer Managing Director, Osterholz-Scharmbeck, until 21 July 2009
Carsten Hahn Administrator, EWE NETZ GmbH, Osterholz-Scharmbeck
Dr. Hans-Dieter Harig Former Chief Executive Officer of E.ON Energie AG, Hanover, until 21 July 2009
Supervisory Board
Gregor Heller Senior Trades Consultant, EWE AG, Haselünne
Dr. Stephan-Andreas Chairman of the Board of Kaulvers Management of Bremer Landesbank, Bremen
Aloys Kiepe ver.di District Trade Secretary, Emden
Sigrid Leidereiter ver.di District Trade Secretary, Bremen
Gerd Reiners Former EWE Board member for technology, Oldenburg, until 21 July 2009
Immo Schlepper Regional Department Director of ver.di, Lower Saxony-Bremen, Oldenburg
Alwin Schlörmann Regional Director, EWE AG, Bad Zwischenahn
Prof. Dr. Gerd Mayor, OldenburgSchwandner
Dierk Schwarting Technical Supervisor, EWE NETZ GmbH, Ganderkesee
Dr. Hans-Josef Zimmer Member of the Board of Management of EnBW AG, Steinfeld (Rhineland-Palati- nate)
50 EWE Annual Report 2009

Corporate Governance Report
Corporate governance describes the framework for managing and supervising a commercial entity. It includes the division of responsibility amongst the different management and control instances with-in the company as well as principles for corporate leadership and control which are transparent, re-sponsible and add value.
In recent years these principles have become ever more important in Germany as a decision-making criterion for providers of equity and borrowed capital. They relate not only to the statutory require-ments, but also to internationally acknowledged conduct and standards.
EWE AG has committed itself to the principles of good and responsible corporate governance. Although the company is not publicly listed, its capital market focus has nevertheless increased considerably, especially thanks to the issue of a bond for a total of Euro 1.5 billion in 2004 and another bond for Euro 500 million in July 2009, which were both successfully placed with international institutional investors.
In February 2002 the Government Commission of the German Corporate Governance Code convened by the Federal Ministry of Justice presented the German Corporate Governance Code. This set of rules – its current version was published on 5 August 2009 – contains important legal directives on the man-agement and control of publicly listed German companies as well as standards of good, trustworthy corporate governance respected and required internationally.
EWE AG organises its business in line with the principles laid down in the German Corporate Govern-ance Code. According to Section 161 of the German Stock Corporation Act, publicly listed companies are obliged to issue an annual statement on whether they are and intend to remain in compliance with the Code or which of its recommendations they have not applied. Despite the fact that EWE is not publicly listed, the Board of Management and Supervisory Board issue this declaration of conformity, as it is known, every year. This year the wording of the declaration is as follows:
51The e3-programme Management Investor Relations Social Responsibility Group Management Report Consolidated Financial Statements

The Board of Management and Supervisory Board of EWE Aktiengesellschaft acknowledge interna-tional and nationally accepted standards of good and responsible corporate governance. EWE Aktien-gesellschaft is not a publicly listed company, however, and the Board of Management and the Super-visory Board are therefore not obliged to issue a declaration of conformity in accordance with Section 161 AktG. In the spirit of responsible corporate governance the Board of Management and Supervisory Board of EWE Aktiengesellschaft nevertheless issue the following declaration on the recommendations of the German Corporate Governance Code:
EWE Aktiengesellschaft follows and complies with the recommendations of the Government Com-mission on the German Code of Corporate Governance as adopted on 18 June 2009 and published in the electronic Federal Gazette on 5 August 2009 with the following exceptions and has complied with them continuously since making the last declaration of conformity. The exceptions are mainly due to the fact that EWE Aktiengesellschaft is not a broadly held publicly listed company but has only three shareholders. The small number of shareholders allows the shareholder representatives to be closely involved in the Supervisory Board of EWE Aktiengesellschaft, which in turn ensures that share-holders are implicated directly and continuously in all matters of relevance to the company. At the same time EWE Aktiengesellschaft aims to distinguish itself from large international groups and as part of its responsible corporate governance to reflect the company’s regional roots in its organisa-tional and staff structures as well as in internal administration.
We declare that EWE Aktiengesellschaft differs from specific recommendations of the German Cor-porate Governance Code as follows:
Annual General Meeting The Board of Management does not publish the reports and documents required by law for the •
Annual General Meeting, including the annual report, on the company’s website at the same time as the agenda, but sends them directly to the three shareholders (2.3.1).
Notification of the Annual General Meeting and the documents convening the meeting are not •
sent to financial services providers in Germany and abroad and to shareholders’ associations (2.3.2).
No proxies are appointed to whom the shareholders can give voting instructions (2.3.3).•
Interaction between Board of Management and Supervisory Board The D&O insurance for the Supervisory Board does not include a deductible of at least 10% of •
damages, up to a maximum of one and a half times the fixed annual salary of the Supervisory Board member (3.8).
The D&O insurance for EWE Aktiengesellschaft provides no cover for actions or omissions committed deliberately. An deductible can therefore only be agreed for breaches of duty committed negligently.
In the interests of the company we do not currently consider it appropriate to have a higher deduct-ible for breaches of duty committed negligently by members of the Supervisory Board. The company’s aim is to attract experienced entrepreneurs to the Supervisory Board. We see a danger that suitable candidates could be deterred from taking a seat on the Supervisory Board by greater liability in the
Declaration of conformity in accordance with Section 161 of the German Stock Corporation Act (AktG) for the financial year 2009
52 EWE Annual Report 2009

event of negligent conduct. The structure of the D&O insurance in the Group is currently under re-view given the new statutory regulations. This will also include a critical evaluation of the strategy for insuring the members of the Supervisory Board.
Board of Management In 2009 the remuneration system for the Board of Management was only discussed and regularly •
reviewed by the Steering Committee of the Supervisory Board (4.2.2). In future the remuneration system for the Board of Management will also be discussed and regularly reviewed by the full Supervisory Board. The Chairman of the Supervisory Board has not notified the Annual General Meeting of the principles of the remuneration system (4.2.3).
The remuneration system is not explained as part of the corporate governance report (4.2.5). •
Supervisory BoardThe Supervisory Board sets no age limit for Board members (5.1.2). •
The Chairman of the Finance and Audit Committee represents the main shareholder. The Finance •
and Audit Committee includes members with particular knowledge and experience of applying accounting principles and internal controlling procedures (5.3.2).
The Supervisory Board has not formed a Nomination Committee (5.3.3). •
Members of the Supervisory Board hold board seats or advisory positions at major competitors of •
the company (5.4.2).
The members of the Supervisory Board do not receive performance related remuneration in addi-•
tion to their fixed remuneration. The remuneration for the members of the Supervisory Board is not disclosed individually in the corporate governance report (5.4.6).
Transparency The internet is not used to inform all shareholders and investors equally and at the same time (6.4).•
Accounting Information for shareholders and third parties is mainly provided by means of the consolidated •
financial statements and the half-yearly financial report, but not by means of quarterly financial reporting or interim statements (7.1.1).
The consolidated financial statements are not published within 90 days and the interim reports •
are not published within 45 days of the end of the reporting period. Neither the Supervisory Board nor its Audit Committee discuss half-yearly financial reports with the Board of Manage-ment prior to publication (7.1.2).
Information (name and registered offices of the company, equity interest, total equity, result of •
the last financial year) is not published for all companies in which EWE Aktiengesellschaft holds a stake which is not of minor importance for the company (7.1.4).
Oldenburg, Germany, 15 December 2009
Board of ManagementSupervisory Board
53The e3-programme Management Investor Relations Social Responsibility Group Management Report Consolidated Financial Statements

Investor Relations
eWe bonds and the capital market
In October 2004, EWE issued two euro bonds (maturities: 10 and 15 years, respectively) with an aggregate volume of Euro 1.5 billion. In July 2009, EWE used the favourable market environment to issue another euro bond for Euro 500 million. The bond, which has a term of twelve years, received a great deal of investor interest and was hugely oversubscribed within just a short period of time.
Developments on fixed-interest markets in 2009 reflected a tangible improvement in investor sentiment. The prima-ry markets for corporate bonds reported record highs for new issue volumes. Risk premiums for corporate bonds fell subs tantially. One reason was the incipient economic re-covery, together with the policy of low interest rates fol-lowed by all the main central banks. This led to rising li-quidity and increasing interest from buyers on international capital mar kets. Declining risk and liquidity premiums drove down yield spreads by around 209 basis points (bp) or 70 per cent to around 90 bp over the mid-swap rate, as mea-sured by the iBoxx Euro Corporate Bond Index, which tracks bonds issued by selected European com panies. Companies’ issuing activities rose to more than Euro 290 billion (pre-vious year: Euro 142 billion).
The reasons were both companies’ increased need for refi-nancing in comparison with 2008 and the generally positive market environment that they were able to make use of.
Companies from the utilities sector were able to benefit from their defensive credit profile. Risk premiums for these companies tumbled by around 110 bp to an average of 74 bp. This represents a fall of 60 per cent. Utilities also con-firmed the tendency to bulk up on bond issues. The volume of corporate bonds issued by the utilities sector was almost twice as high as the previous year.
The course taken by the EWE bonds in the secondary market largely followed the performance of the index for utilities bonds. The bonds issued in 2004 closed on 31 December 2009 at a yield premium of 62 bp for the one maturing in 2014 and of 85 bp for the one maturing in 2019. This put them around 100 bp and 120 bp respectively below their mark at the start of 2009. The EWE bond issued in July 2009 and maturing in 2021 performed strongly in the secondary market, ending the year at a spread of 103 bp. The risk premium was therefore around 57 bp below that of the emission date.
20
40
60
80
100
120
Jan. Feb. Mar. Aug. Sep. Oct. Nov. Dec. Jan.Apr. June JulyMay. Feb.
Performance of the EWE bonds in 2009
Spread vs. mid-swaps (bp)
EWE 10-year
EWE 15-year
EWE 12-year
Utility Index
iBoxx Corporates
120
100
80
60
40
20
54 EWE Annual Report 2009

Financing activity 2009
After a five-year break, EWE returned to the bond market as an issuer in July 2009. The bond was issued at a spread of 160 bp over the mid-swap rate. This transaction enabled EWE to refinance short-term debt accumulated as a result of the financial market crisis with long-term borrowings on comparatively favourable terms.
IR communications
In the financial year 2009 EWE carried out vigorous investor relations work and was in regular communication with fi-nancial market participants. The annual roadshow allowed us to further cement the existing relationships of trust be-tween the company and its target groups. These include institutional investors, financial analysts, private investors, and everyone with an interest in the EWE bonds.
EWE has extended the range of investor relations material available on its website (www.ewe.de). Internet users will find a wealth of information here for analysing the EWE
EWE 10-year bond EWE 15-year bond EWE 12-year bond
ISIN DE000A0DLU51 DE000A0DLU69 DE000A0Z2A12
Security code no. A0DLU5 A0DLU6 A0Z2A1
Issue date 14.10.2004 14.10.2004 16.7.2009
Maturity 14.10.2014 14.10.2019 16.7.2021
Remaining term (as from April 2010) 4.5 years 10.5 years 11.3 years
Currency EUR EUR EUR
Volume 1 billion 0.5 billion 0.5 billion
Nominal amount 1,000.0 1,000.0 1,000.0
Coupon type Fixed coupon Fixed coupon Fixed coupon
Nominal interest 4.375% 4.875% 5.25%
Interest paid annually annually annually
Interest payment date 14.10. 14.10. 16.7.
Issue spread +40 bp +52 bp +160 bp
Spread as per 31.12.2009 +62 bp +85 bp +102 bp
bonds. In addition to financial information such as rating and financial reports, information on sector-related topics which underline the sustainability of the EWE Group’s busi-ness activities are another focal point. These include facts, targets and strategies for future energy supply. With this online offering EWE is also catering to the increasing level of interest from capital markets in whether and how com-panies are dealing with their responsibility towards the environment and society.
A regular exchange of views with the rating agencies Stan-dard & Poor’s (S&P) and Moody’s builds confidence in the bonds issued by EWE AG. In March 2010 S&P confirmed its corporate credit rating as well as the rating for senior un-secured debt with “A-”. The rating agency altered the cor-porate credit rating from “CreditWatch negative” to “neg-ative outlook”. Moody’s continues to rate EWE at “A2” with a stable outlook.
55The e3-programm Management Investor Relations Social Responsibility Group Management Report Consolidated Financial Statements

Social responsibility
As a regional committed utility company, the EWE Group demonstrates social responsibility on top of its commercial activities. In this vein, EWE AG and its subsidiaries commit themselves to a forward-looking economic and societal development path and support projects in the fields of society, edu-cation, culture and sports. This involvement is focused on the regions where companies in the EWE Group operate.
eWe Foundation: promoting utility and beauty
The EWE Foundation, founded in 2002, pursues the objectives of generating the greatest possible benefits for the public good and of maintaining quality of life and economic efficiency in the Ems/Weser/Elbe region, in parts of Brandenburg and on the Baltic island of Rügen. The charitable founda-tion supports innovative and sustainable projects in the arts and culture, childcare and education as well as research and the sciences.
Continuity, growth and employment
The Cooperation Alliance for a Regional Weser/Ems Innovation Strategy (RIS), which EWE sponsors, was founded in the 1990s and aims to develop growth and employment in the Weser/Ems region by funding innovation in specific sectors. These are the food industry, transport and logistics, renewable raw materials, future energy supply, and healthcare, as well as the cross-sector subjects of IT usage, technology transfer, and education and training. From the perspective of its members the Coopera-tion Alliance has since successfully achieved its aims. In early 2010 the association therefore wound down its active operations.
Climate and environmental protection
The topic of climate and environmental protection has a high priority in the EWE Group. Back in early 2007 EWE launched a novel climate protection programme using Emsland as trial region. This enabled an initial 150 private households to benefit from CO2 emissions trading, as they were rewarded for the amount of CO2 they saved. Since autumn 2009 all EWE customers have been able to take part in the project, which has since been certified by TÜV and the German Emissions Trading Authority and is therefore acknowledged as an international climate protection project.
The Group subsidiary swb has clear goals in the area of a sustainable energy supply. In comparison with the reference year 2005, by 2020 the energy services company from Bremen intends
to cut specific CO• 2 emissions per kilowatt hour generated by 20 per cent,
to improve the efficiency of energy production and use by 20 per cent, from the power plant to •
the end-user, and
to generate 20 per cent of the power and heat that swb produces in its own plants from renewable •
sources.
swb prepares its own environmental report to inform customers and business partners about its sustainability activities.
56 EWE Annual Report 2009

Compatibility of family and career
The reconciliation of career and family is one of society’s greatest challenges. EWE approaches the issue with activities including flexible working hours, home-offices and its own children’s day-care centre.
encouraging volunteer work
The Group subsidiary EWE TEL sponsors social institutions in Oldenburg. As part of the ‘A Different Perspective’ project, an initiative by the Caritas und Diakonie charities, the company has been giving employees two days off so that they can help in homes for the disabled and the homeless, senior citizens’ homes and nursery schools.
Furthermore, on national volunteer day, staff from EWE assisted charitable organisations. Senior cit-izens’ homes, shelters for the homeless, schools and nursery centres thus received organisational and maintenance support. In autumn 2009 EWE was recognised for its work by the state government of Lower Saxony.
Staff at the EWE Group have been making a joint contribution to social cohesion with their ‘last cents’ donation scheme. The amount that is accumulated from the regular monthly waiver of payment of the residual cent amounts in pay slips is doubled by EWE and donated to charitable institutions.
education, prevention and mentoring for the next generation
As part of several educational projects, EWE sponsors children, adolescents and young adults from primary school to university. The subsidiaries BTC, BREKOM and hmmh multimediahaus concentrate on the youngest schoolchildren. In cooperation with the society Das erste Buch e.V. (The First Book), children in their third school year write stories for first-year children, thereby improving their language skills. The main focal points of the prevention project Sign, which EWE sponsors, are to communicate to young people the dangers of addiction and violence and to show them alternatives. With some 50,000 schoolchildren and adolescents taking part, the project is the largest addiction and violence prevention project in north-western Lower Saxony.
As one of the main sponsors EWE supports the Business and Grammar Schools (WiGy) project, which promotes more wide-spread economic education in generalist schools on a nationwide basis. The project is run by the WiGy-Club e.V., a society in which around 700 private members, schools and companies are involved.
Showing young people career prospects is the aim of the MINToring initiative, sponsored by EWE since 2007 in cooperation with the Foundation of German Business and the German Federal Ministry of Education and Research. University students from the subject areas mathematics, information tech-nology, natural sciences and technology provide guidance to sixth-form students in Oldenburg to boost their interest in the subjects in question. The active support is designed to overcome any ex-isting apprehension.
EWE also sponsors education in the natural sciences by supporting the state competition ‘Jugend forscht – Schüler experimentieren’, the junior category of the ‘Jugend forscht’ (Young researchers) competition aimed at schoolchildren up to the age of 14.
57The e3-programm Management Investor Relations Social Responsibility Group Management Report Consolidated Financial Statements

Course of business and economic environment 59
Group structure and business operations 59 Corporate Centre business area 59 Energy business area 60 Network business area 64 swb business area 64 ICT business area 64
Company management and strategy 66 Internal management system 66 Group strategy 66
Research and development 67 Focus of R & D activities 67 R & D spending 68 R & D staff 68
Overview of the course of business 68 General economic conditions 68 Energy market 70 Telecommunications market 72 Legal environment 73 Personnel 76
earnings, assets and financial position 77
Earnings position 78Assets and financial position 79Performance of business areas 81
Supplementary report 83
Risk report 84
Structure and core elements of the oppurtunity and risk management system 84
Early risk recognition process 84Main categories of risk 84Summary assessment of the risk situation 85
Report on the internal control and risk management system with regard to consolidated accounting procedures 86
Outlook 86
Future macroeconomic situation 86Possible changes in the structure of the Group 87Earnings forecast 87Expected development in the business areas 87
Group Management Report 2009
58 EWE Annual Report 2009

eWe Group and business areas
Holding energyProduction,
Procurement, Sales
Network swb ICT
1 Subgroup 2 Associated company accounted for under the equity method 3 Held for sale
EWE AG
VNG AG3
EWE AG
EWE Enerji A.Ş.1
EWE Polska Sp. z o.o.1
EWE WASSER GmbH
DOTI GmbH & Co. KG2
MVR GmbH & Co. KG2
EWE NETZ GmbH
Aequamus GmbH2
swb AG1 EWE TEL GmbH
BREKOM GmbH
BCC Business Communi-cation Company GmbH
BTC AG1
htp GmbH 2
ncN GmbH
Businessareas
GroupCompanies
Group structure and business operations
The EWE Group has its head offices in Oldenburg and pro-vides regional, national and international energy, telecom-munications and IT services in regionally contiguous market areas. It is organised into five business areas.
Corporate Centre business area
The Corporate Centre business area mainly includes Group head office functions as well as strategically important mino -rity shareholdings and other business activities. It is therefore distinctly separate from the operational Energy, Network, swb and ICT business areas. The Group head office functions are primarily carried out by the different departments of EWE Aktiengesellschaft. This is also where centralised services are situated, unless they are provided for the entire Group by one of the business areas.
VNG
VNG – Verbundnetz Gas AG (VNG), based in Leipzig, is pre-sented in this business area. VNG is a pan-regional energy wholesale trading company which supplies regional pro-
viders, municipal utilities and industrial companies with nat-ural gas, mainly in Eastern Germany. Its main activities are trading, transporting and storing natural gas.
EWE has a 47.9 per cent shareholding in VNG. In September 2008 VNG’s second largest shareholder, VNG Verwaltungs- und Beteiligungsgesellschaft mbH (25.8 per cent), terminated the syndication agreement agreed with EWE in 2003. EWE considers this termination to be invalid; arbitration proceed-ings are still underway.
In May 2009 EWE announced its intention of selling its VNG shares to its new strategic partner, EnBW Energie Baden-Württemberg AG. The German Federal Cartel Office approved the sale in August 2009 subject to conditions. Approval by a shareholders’ meeting of VNG is still necessary to com-plete the transaction. In late 2009 EWE and EnBW agreed to extend the pre-emption right for the shares for two years.
VNG’s operating business performed well in 2009, although the company did not remain unscathed by the consequences of the economic crisis and its effects on energy sales. In the first half of the year VNG was nevertheless still able to in-crease gas sales by around 4 per cent compared with the same period the previous year. This was due to higher sales
Course of business and economic environment
59The e3-programme Management Investor Relations Social responsibility Group Management Report Consolidated financial statements

Sales of heating services for private customers grew slightly in 2009 compared with the previous year. EWE works closely with local tradespeople in order to make contracting serv-ices for heating equipment more attractive for this customer segment.
Competition increased sharply in 2009 in both the electricity and gas markets. A large number of new providers entered the market, acquiring household customers in EWE’s sales area as well. In spite of increased competitive pressure, how-ever, EWE was able to keep churn rates down to a reasonable level. Aggregate churn for electricity customers came to around 9 per cent at the end of 2009 (German federal av-erage: 21 per cent). Among EWE’s gas customers, around 5 per cent decided to switch to a new provider (German federal average: 11 per cent). EWE attributes its customers’ comparatively low willingness to change providers to its optimised product portfolio. The EWE trio package, which is unique in the German energy sector and combines elec-tricity, natural gas and telecommunications services, has become a successful instrument of customer retention. A number of measures to win back customers were also im-plemented with success in 2009.
An independent rating of customer service quality again awarded EWE the grade “very good”. Sales channels were also further optimised in 2009. Increased staff capacities and a reorganisation of business processes improved avail-ability via telephone and the introduction of a new corre-spondence management system meant that emails were answered more swiftly.
Industrial customers and local utilities
For industrial customers and municipal utilities EWE not only offers traditional full-service supply, but also innova-tive pro ducts such as purchasing in tranches and fully flex-ible port folio management as well as consulting on mat-ters concer ning CO2 emissions certificates and certificate trading. Industrial and business customers as well as local councils are increasingly asking themselves how they can respond to the social challenge of protecting the climate in a responsible commercial manner. In future EWE intends to offer new approaches and solutions in this field with the business area CO2 Solutions.
volumes from spot and futures trading as well as higher sales outside VNG’s core market, both in Germany and abroad.
In 2009 VNG acquired the upstream company Endeavour Energy Norge AS and merged it with VNG Norge AS. VNG Norge AS now holds stakes in 26 extraction licenses along the Norwegian coast. VNG is aiming for annual production of 1.5 billion cubic metres of natural gas by 2020. With four underground storage caverns, VNG had a working gas volume of 2.56 billion cubic metres at the end of 2009 and is ex-pecting to fully utilise these capacities in the storage year 2009/2010.
Energy business area
The Energy business area comprises electricity and natural gas sales, energy service sales, energy procurement and pro duction as well as other energy-related services provid-ed by EWE Aktiengesellschaft. In addition to EWE AG, the fully consolidated subsidiary EWE WASSER GmbH (EWE WASSER) and the subgroups EWE Enerji A.Ş. (EWE Enerji) and EWE Polska Sp. z o.o. (EWE Polska) have been allocat-ed to this business area. DOTI Deutsche Offshore-Testfeld- und Infrastruktur GmbH & Co. KG (DOTI) and MVR Müll-ver wer tung Rugenberger Damm GmbH & Co. KG (MVR) are held as associated companies.
Sales
EWE AG sells electricity, natural gas and energy services to private and business customers, industrial clients and munic-ipal utilities, thereby covering all customer segments. The sales focus is on the Ems/Weser/Elbe region, Brandenburg and Rügen. New customers were, however, also acquired out side these domestic markets in 2009.
Private and business customers
EWE is present locally with more than 40 ServicePoints and offers private and business customers a varied range of pro-ducts and services, from eco-power and biogas to emotion-al products such as Werder power as well as extensive advice on conserving energy. In the Ems/Weser/Elbe region and parts of Brandenburg, EWE AG operates its own network of natural gas stations, which was expanded again in 2009 and now includes 78 stations.
60 EWE Annual Report 2009

Heat contracting inst. capacity (in MW, therm.)
0
100
200
300
400
500
600
700
800800
700
600
500
400
300
200
100
0
716.8 725.6
2008 2009
Heat contracting inst. capacity (in MW, elect.)
0
10
20
3030
20
10
0
25.7 26.2
2008 2009
The statutory framework set by the Renewable Energy Act (EEG), the Combined Heat and Power Act (KWKG) and the Renewable Energy Heating Act (EEWärmeG) promotes the use of renewable energies for generating heat. This means that market conditions for the corresponding energy ser-vices are generally positive. Despite this, the economic cri-sis and declining willingness of many industrial customers to concern themselves with energy efficiency activities in 2009 had an adverse effect on business. Demand only be-gan to recover slowly in the second half of the year.
As a rule, EWE looks for new ways of approaching custom-ers to sell energy services: a successful experiment in 2009 was the “Energy Pub Evening for East Frisia” organised joint-ly with Stadtwerke Emden GmbH and the East Frisia and Papenburg Chamber of Commerce and Industry. As well as providing advice on energy efficiency, this also acted as a forum for small and medium-sized companies to share ex-periences.
Other services
In addition to its energy business, the EWE Group also pro-vides sewage and waste disposal services. EWE WASSER manages the operation of municipal and private wastewater purification plants and drainage networks. In 2009 the com-pany cleaned a total of 17.3 million cubic metres of waste-water in 34 wastewater purification plants.
In the waste disposal business EWE operates composting sites in Ammerland and Rodenkirchen on behalf of local authorities. The contract for operating the site in Gnarren-burg expired in 2009. EWE holds a 20 per cent stake in the Rugenberger Damm waste processing plant (MVR) in Ham-burg. At the MVR waste undergoes thermal treatment to produce energy and other saleable products such as gyp-sum and slag.
61The e3-programme Management Investor Relations Social responsibility Group Management Report Consolidated financial statements

Generation capacity for renewable energies (in MW)
0
25
50
75
100100
75
50
25
00.8 0.9
6.4 7.1
77.9
97.5
2008 2009
Solar
Biomass, Biogas
Wind
2008 2009 2008 2009
Natural gas procurement (total: 51,033.4 million kWh) (in %)
Netherlands 27.5
Others 17.4
Germany 39.0
Russia 16.1
2009
1 Previous year’s figures adjusted
with a planned total working gas volume of 300 million m³. This construction phase is scheduled for completion in late 2013.
In Moeckow in the Ostvorpommern district, test drilling in 2008 revealed that the salt domes were well suited to the development of around 20 gas storage caverns. Four caverns comprising an approximate working gas volume of 250 mil-lion m³ will be built during the first phase of construction. The Moeckow location is strategically well located, near the ex-pected landing point of the Nord Stream Baltic pipeline, which is intended to transport large quantities of Russian natural gas to Western Europe. In 2009 EWE obtained initial approval to develop the storage facilities at this site. The pro-ject managers are anticipating that all the necessary final ap-provals will be received in 2010. Procuring the required trans-port capacities is also a challenge.
Production
In 2009 the company produced 201 million m³ of its own natural gas. It stems from EWE shareholdings in gas fields in the German and Dutch areas of the North Sea. Extraction volumes fell by 9.7 per cent compared with the previous year. In order to open up new reserves EWE is participating in five exploration projects in 2009 in the Dutch and British North Sea and off the coast of Denmark with total potential reserves amounting to 660 million m³ (EWE share). Four of the test wells drilled struck natural gas. As of 1 January 2010 EWE’s gas reserves came to 2.294 billion cubic metres, or 14.5 per cent down on the previous year.
Procurement
EWE AG purchases electricity from upstream suppliers and on wholesale markets. In the reporting period the company purchased at total of 12.9 billion kilowatt-hours (kWh) from third parties. Electricity purchasing is optimised by short-term buying and selling on the spot market.
The companies included in the Energy business area of the EWE Group purchase natural gas from foreign and domestic suppliers. The following diagram shows the origin of total purchases of 51.0 billion kWh in 2009 (see chart below).
Natural gas storage
EWE operates 25 caverns at the Huntorf and Nüttermoor natural gas storage facilities in Lower Saxony and a further one at Rüdersdorf near Berlin. Based on new measurements this gives EWE a current storage capacity (working gas vol-ume) of 1.4 billion cubic metres (m³). More than half of the storage capacity is leased to third parties.
Increasing gas trading, declining domestic gas production in Germany and North-Western Europe and stronger natural gas flows from East to West mean that the need for storage capacities in Europe is set to grow further. Acting on these trends, EWE continued to invest in expanding and modern-ising the existing gas storage facilities in 2009. Plans were also advanced to develop new storage capacities.
All the necessary authorisations have now been obtained for the large-scale Jemgum gas storage project. The leaching process was started in February 2010. The first phase of construction will see EWE construct six caverns in Jemgum
62 EWE Annual Report 2009

In the area of power generation EWE AG has its own pro-duction capacities in the field of renewable energies (wind, biomass, biogas, solar), with total output of 105.5 mega-watts. In 2009 installed capacity was primarily increased in the area of wind energy (+25.2 per cent), largely by pur-chasing the Elsdorf II wind farm located in the Rotenburg (Wümme) district.
EWE is continuously increasing its production of electricity from renewable energies. In November 2009 Deutsche Off-shore-Testfeld- und Infrastruktur GmbH (DOTI), a consor-tium made up of EWE, E.ON and Vattenfall, successfully completed the twelfth and final wind power plant in the German part of the North Sea, north of the island of Bor-kum. Allowing for a necessary interruption the previous year, construction work for the wind turbines themselves took just seven months. This makes alpha ventus the first offshore wind farm in the world with a dozen wind tur-bines in the 5 MW class. EWE’s share of the wind farm’s installed capacity comes to 28.5 MW.
EWE also furthered the development of another offshore project in the reporting year. The RIFFGAT project, in which EWE has held a stake since 2004, involves planning and buil-ding a commercial offshore wind farm. The project is current-ly in the process of applying for planning permission. Con-struction work is scheduled to begin in 2011 / 2012 and be completed by 2012 / 2013.
EWE and swb, a company in the EWE Group, have made one of the most sophisticated photovoltaics projects a reality by integrating a photovoltaics system into the structure of the Weser Stadium in Bremen. The system is unique in terms of its shape and size and has a total output of more than 1.2 MW. Construction work was largely completed in 2009. In 2010 the last panels are to be finished and the plant can then begin operations.
eWe Polska
EWE Polska is based in Poznan and was established in 1998 to represent EWE AG in the Polish market. It acts as the man-agement company for all EWE Group’s energy ope rations in Poland and serves as a platform for future growth in this market.
The core business of EWE Polska is the construction and leasing of modern high-pressure gas lines in regions of Po-land not previously connected to a natural gas distribution network. It also provides central services for the operating subsidiaries in Poland.
Energy sales, as well as the construction and operation of the facilities this requires, are combined in the sales company EWE Energia. The company, established in 1999 and renamed in 2009, is organised on the basis of two business regions. It ensures the natural gas supply in large parts of the Lubusz voivodeship, and since 2007 has also focused on the town of Wielun. Industrial customers are additionally supplied throughout Poland. The aim is to increase sales in the areas already supplied and to selectively develop additional sales areas. The minority shareholder of the Miedzyrzecz-based com-pany is the Odra Warta council association, which is made up of local councils from the region.
In early 2009 operations began at EWE Zielona Energia, a wholly owned subsidiary of EWE Polska. The company is in-volved in generating energy from renewable sources in Po-land. Its activities focus on developing wind power and bi-ogas projects in Western and Southern Poland.
eWe enerji
EWE established EWE Enerji in Istanbul in early 2007. EWE Enerji is the management company for the sale and trans-port of natural gas in Turkey. Via this company EWE holds shares in two regional natural gas utilities: Bursagaz in North-Western Turkey and Kayserigaz, which is based in one of the country’s largest industrial regions. Four more EWE com panies hold equity stakes in EWE Enerji in addition to the main shareholder EWE AG.
In June 2009 EWE acquired 100 per cent of a Turkish gas trading company. The company, since renamed EWE Doğal gaz, opens up new opportunities for purchasing and sell-ing gas, which makes it a good complement to the existing shareholdings in Turkey and their end-consumer business.
Entry into the Turkish market is of high strategic significance for the EWE Group. Notwithstanding the current downturn in growth due to the global recession, the country has a very dynamic economy. The country’s energy needs are likely to rise again concurrently with the economy in the years ahead. Tur-key is also considered an important energy transit country and will play a decisive role in Europe’s future energy supply.
63The e3-programme Management Investor Relations Social responsibility Group Management Report Consolidated financial statements

swb has a clear strategy of sustainability and aims to ex-pand its power generation from renewable sources of en-ergy. In 2009 the subsidiary swb CREA acquired a wind farm with an installed capacity of 30 MW in Märkisch Linden, Brandenburg.
ICT business area
The ICT business area is made up of the business units in-formation technology (IT) and telecommunications (TC). The IT business is represented by the BTC subgroup and the TC business by the fully consolidated companies EWE TEL GmbH (EWE TEL), Bremer Kommunikationstechnik GmbH (BREKOM), BCC Business Communication Company GmbH (BCC) and nordcom Niedersachsen GmbH (ncN). The tele-phone company htp GmbH (htp) is held as an associated company. In 2009 the companies osnatel GmbH, Osnabrück (osnatel), and Martens Antennen- und Kabelanlagen-Gesell-schaft mbH, Hamburg (Martens), were merged into EWE TEL in the course of further market consolidation.
Telecommunications
Via the independent infrastructure of its subsidiary EWE TEL, the EWE Group is positioning itself towards commercial and private customers as a full-service provider of telecommu-nications services (internet, voice telephony, mobile and television). EWE TEL is one of the largest regional telephone companies in Germany, serving some 620,000 customers at the end of 2009. EWE TEL made changes to its organisational structure in 2009 so as to optimise its market focus and in-ternal processes. Markets are to be defined by target groups and addressed by the business units Private Customers, Busi-ness Customers, Carriers and Financial Services Providers. The regional multi-brand strategy ensures proximity to the cus-tomer. In the Ems/Weser/Elbe region, East Westphalia and Brandenburg EWE TEL is currently building a modern fibre optic network to enable high-speed data transfer and form the basis for the competitive 3Play product that delivers internet, telephone and TV to customers via a single line.
Network business area
The Network business area consists of the operations of EWE NETZ GmbH (EWE NETZ). On 9 March 2009, Aequamus GmbH, established with equal shares by EWE NETZ GmbH, Erdgas Münster Transport GmbH & Co. KG and Gasunie Deutsch land Transport Services GmbH, was entered in Bre-men’s Commercial Register. The company is taking on the balancing and coordination of the new market area “L-Gas 1” and commenced its operating activities as of 1 April 2009.
EWE NETZ operates an electricity grid 80,000 km in length in the Ems/Weser/Elbe region, a gas network over 50,000 km long in the Ems/Weser/Elbe and Brandenburg regions, on the island of Rügen and in the Northern part of West Pomerania as well as a telecommunications network covering 30,000 km. All the activities for providing drinking water to Bremer vörde, Cuxhaven, Oldenburg, Scheeßel and Varel are also pooled in this business area.
swb business area
The energy supply company swb AG (swb) has been fully consolidated since 1 October 2009 and is the EWE Group’s vehicle for developing its value creation and presence in the Bremen-Oldenburg region. swb is one of the leading pro-viders in Northern Germany of energy and drinking water, as well as water and waste removal services. The core busi-ness areas of swb are electricity, natural gas, drinking wa-ter and heat. Growth potential exists in the areas of power generation, waste and wastewater treatment and technical services.
swb has conventional heat and power generation capacities of more than 1,000 MW in net output, making it a valuable addition to EWE’s business model. In 2009 swb began op-erations at a new solid recovered fuel power plant with a total net output of around 30 MW. The plant is fired with high-calorie sorted household and commercial refuse. This form of energy generation makes sense both ecologically and economically: the solid recovered fuel reduces the amount of coal required and thereby fuel costs as well as carbon dioxide emissions.
64 EWE Annual Report 2009

Telecommunication customers*
720,000
630,000
540,000
450,000
360,000
270,000
180,000
90,000
0
EWE TEL
osnatel
Martens
htp
Total (including htp)
* inclusive BCC (unlisted)
2009 2009 20092009 2009
0
90000
180000
270000
360000
450000
540000
630000
720000620,089
433,176
108,008 79,77076,225
700,146671,524
53,832
2008 2008 20082008 2008
BREKOM is a telecommunications services company with long-term framework agreements to operate the commu-nications network for the municipal authorities and insti-tutions of the Free and Hanseatic City of Bremen. Its range of services includes installing and operating the telecom-munications system, voice telephony services, installing data transmission equipment and operating emergency telephone services to the fire brigade.
BCC builds and operates multi-service networks for business customers throughout Germany. Its technical infrastructure consists of a fibre optic network, 21,000 km in length, which enables broadband connections of up to 40 Gbit/s. As an experienced managed services provider, the Wolfsburg-based company also has close ties to various other network oper-ators. In line with its nationwide sales activities, BCC has service and sales offices in Baden-Württemberg, Bavaria, Ber-lin, Hesse, Saxony and Saxony-Anhalt.
ncN is headquartered in Oldenburg and manages the refur-bishment of the telecommunications infrastructure for the state authorities of Lower Saxony. This principally involves configuring and operating the voice and datanet work for the state’s administration. To do so, ncN is merging the state’s previously separate data and voice networks into a modern, convergent network based on internet protocol (IP). EWE TEL was appointed as general contractor by the state of Lower Saxony in 2009.
The telecommunications provider htp operates in the eco-nomic triangle formed by Hanover, Brunswick and Hildes-heim. The company is based in Hanover and offers landline and internet products as well as DSL connections at varying bandwidths. Its product portfolio also includes call centres, value-added services and network services. htp advised around 80,000 customers in 2009.
Information technology
The subsidiary BTC has its head offices in Oldenburg and offers IT consulting, system integration and management, geo-information systems and network control services throughout Germany. Its customers include companies in the energy, industrial and service sectors, telecommunica-tions providers, the public sector, and automotive manu-facturers and suppliers. BTC also offers multi-media services via subsidiaries and has international operations in Switzer-land, Turkey, Poland and Japan. The company is increasingly taking part in research and development projects such as decentralised energy management systems, the EWE project eTelligence and the development of the EWE trio smart-box. Furthermore, BTC has been sub-contracted by DOTI as the main systems provider on the groundbreaking alpha ventus project.
65The e3-programme Management Investor Relations Social responsibility Group Management Report Consolidated financial statements

Internal and external Group reporting is continually adjusted to meet the operating requirements for managing the Group and current legal requirements.
Group strategy
EWE is a multiservice company for energy, telecommunica-tions and information technology. EWE combines a strong regional position in the energy supply sector with the dy-namic growth of the technology-driven telecommunications and IT market. This convergence gives rise to new ideas for products, services and networks. EWE intends to continue growing in the years ahead, building on the current market position and the company’s strengths. This will be achieved by means of steady organic growth and targeted acquisitions as part of the Group strategy, which pursues five core de-velopments.
Further development of foreign business
To achieve further growth EWE is also turning towards in-ternational markets. The focus here will be on expanding the existing foreign shareholdings. EWE entered the Polish natural gas market in 1999 and in 2007 became the first German utility company to take an equity stake in a Turk-ish natural gas provider.
Develop generation and storage
To optimise its supply portfolio EWE intends to develop its gas production activities and its power generation capacities. To do so EWE is investing in renewable energies and intends to make the best use of regional competitive advantages. For a long time, gaining a foothold in conventional power gen-eration was a key objective in order to close a gap in the value chain. This goal was achieved in 2009 by means of the new equity stake in the swb group and the resulting integration of its power generation portfolio into the EWE Group. EWE intends to build on its position in natural gas storage, as demand for storage capacities has grown sub-stantially in line with rising imports of natural gas by the EU member states.
Strengthen the telecommunications and IT business
EWE aims to continue expanding its customer base in the telecommunications sector and also intends to grow through-out Germany in the corporate customer segment. EWE also plans to expand its range of entertainment services in or-der to strengthen the company’s competitiveness further.
Company management and strategy
Internal management system
The 2009 consolidated financial statements for EWE AG are prepared in line with International Financial Reporting Standards (IFRS) as applicable and binding in the EU. The transition to IFRS for external reporting leads to a conver-gence between internal and external reporting systems. This convergence of the reporting lines is reflected in uniform reporting structures as well as a common basis of data and indicators derived from them.
The reporting structures are aligned with the new Group structure as presented under IFRS, with the operating busi-ness areas Energy, Network, swb and ICT. In addition, the Corporate Centre business area is responsible for the head office functions of the Group. This organisational structure is the starting point for a multi-tier management system, which enables entrepreneurial responsibility to be devolved and creates a high degree of transparency at the same time. EWE’s internal management system distinguishes between Group and business area levels. The operating management systems in the decentralised reporting units have a finer granularity than Group reporting.
Both internal and external reporting are based on the same management information systems. This technological plat-form enables a uniform basis of data to be used for different reporting purposes and guarantees that the information used is congruent across reporting levels and within each reporting level. This is the basis for EWE’s system of indi-cators. At Group level, attention is focussed on financial in-dicators and certain industry-specific indicators. The busi-ness areas and the organisational units below them monitor additional specific indicators for the decentralised manage-ment of their operating business.
Across all reporting levels, the system of indicators concen-trates on the principal variables for managing the Group. At its core is the focus on operating earnings before interest and taxes (EBIT) when looking at margins and returns. This ag-gregate approach is supplemented by specific analy ses of margins and yields for the operating business areas. Another focus of Group reporting is capital expenditure to ensure the Group’s future viability. It also considers financial indicators intended to secure financing on favourable terms and to maintain the company’s good rating. Finally, the return on capital and on sales is calculated to assess profitability.
66 EWE Annual Report 2009
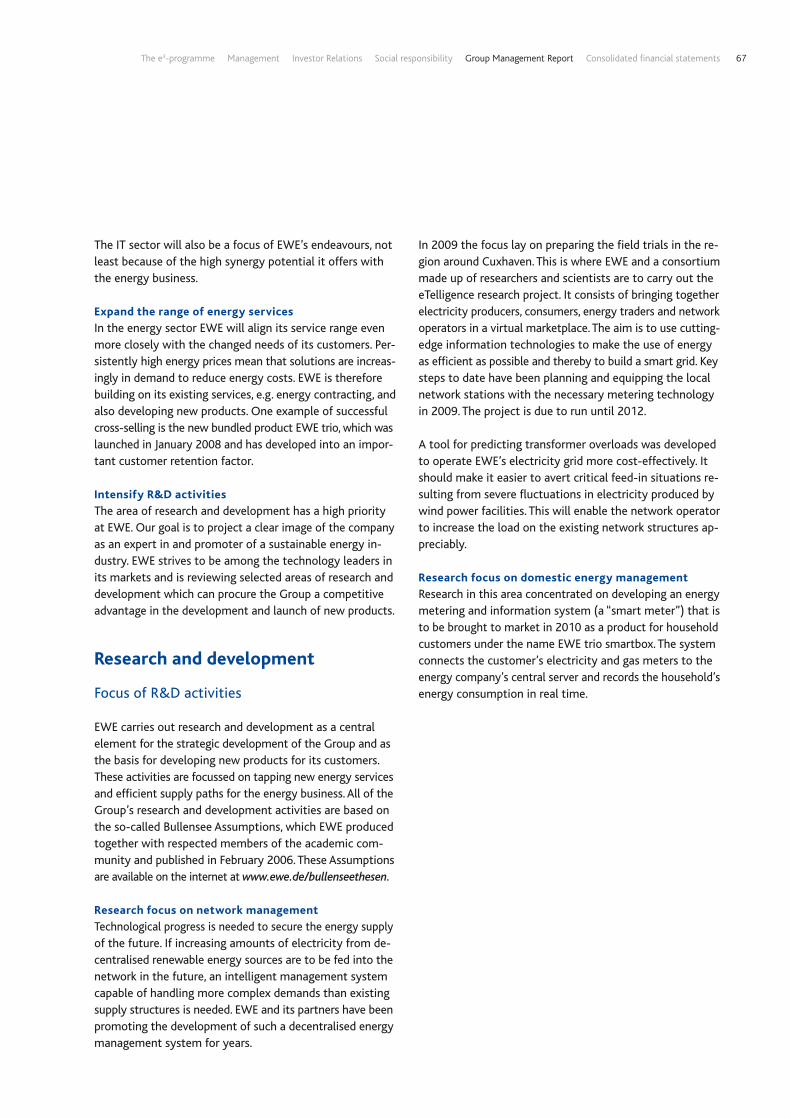
The IT sector will also be a focus of EWE’s endeavours, not least because of the high synergy potential it offers with the energy business.
expand the range of energy services
In the energy sector EWE will align its service range even more closely with the changed needs of its customers. Per-sistently high energy prices mean that solutions are increas-ingly in demand to reduce energy costs. EWE is there fore building on its existing services, e.g. energy contracting, and also developing new products. One example of successful cross-selling is the new bundled product EWE trio, which was launched in January 2008 and has developed into an impor-tant customer retention factor.
Intensify R&D activities
The area of research and development has a high priority at EWE. Our goal is to project a clear image of the company as an expert in and promoter of a sustainable energy in-dustry. EWE strives to be among the technology leaders in its markets and is reviewing selected areas of research and development which can procure the Group a competitive advantage in the development and launch of new products.
Research and development
Focus of R&D activities
EWE carries out research and development as a central ele ment for the strategic development of the Group and as the basis for developing new products for its customers. These activities are focussed on tapping new energy services and efficient supply paths for the energy business. All of the Group’s research and development activities are based on the so-called Bullensee Assumptions, which EWE produced together with respected members of the academic com-munity and published in February 2006. These Assumptions are available on the internet at www.ewe.de/bullenseethesen.
Research focus on network management
Technological progress is needed to secure the energy supply of the future. If increasing amounts of electricity from de-centralised renewable energy sources are to be fed into the network in the future, an intelligent management system capable of handling more complex demands than existing supply structures is needed. EWE and its partners have been promoting the development of such a decentralised energy management system for years.
In 2009 the focus lay on preparing the field trials in the re-gion around Cuxhaven. This is where EWE and a consortium made up of researchers and scientists are to carry out the eTelligence research project. It consists of bringing together electricity producers, consumers, energy traders and network operators in a virtual marketplace. The aim is to use cutting-edge information technologies to make the use of energy as efficient as possible and thereby to build a smart grid. Key steps to date have been planning and equipping the local network stations with the necessary metering technology in 2009. The project is due to run until 2012.
A tool for predicting transformer overloads was developed to operate EWE’s electricity grid more cost-effectively. It should make it easier to avert critical feed-in situations re-sulting from severe fluctuations in electricity produced by wind power facilities. This will enable the network operator to increase the load on the existing network structures ap-preciably.
Research focus on domestic energy management
Research in this area concentrated on developing an energy metering and information system (a “smart meter”) that is to be brought to market in 2010 as a product for household customers under the name EWE trio smartbox. The system connects the customer’s electricity and gas meters to the energy company’s central server and records the household’s energy consumption in real time.
67The e3-programme Management Investor Relations Social responsibility Group Management Report Consolidated financial statements

R & D spending (in EUR mill.)
0
5
10
15
20
25
30
35
40
4545
40
35
30
25
20
15
10
5
0
12.2
40.0
2008 2009
the E3 electric car. Several experimental vehicles are current-ly undergoing trials. In addition to network integration the subsidised research projects are in collaboration with other partners to examine intelligent battery charging stra tegies, an infrastructure of charging stations and user acceptance of electric vehicles.
R & D spending
In 2009 EWE AG spent Euro 40.0 million on research and development (previous year: Euro 12.2 million).
R & D staff
Since 2008 EWE has had a separate department for re-search and development, which pools all the Group’s ac-tivities. The department has 15 full-time employees and works closely with other departments in the EWE Group. They provide support for the development and launch of product and process innovations and for opening up new business areas.
Overview of the course of business
General economic conditions
The global economy began to recover slightly at the end of 2009 following the deepest recession in the post-war period. The preceding slump was particularly characterised by the abrupt collapse in global trade at the start of 2009, which hardly any country escaped from unscathed. Worldwide pro-duction sank significantly by 1.1 per cent in 2009.
According to the German Council of Economic Experts, four factors were principally responsible for the stabilisation of the global economy towards the middle of the year: central banks’ expansive monetary policy, a sharp increase in public-sector demand due to economic stimulus packages, the rela-tive resilience of emerging economies and the comparative-ly low oil price. These factors were aided by the fact that the global economy moved past the torpor it had exhibited since the beginning of the year and rediscovered an appe-tite for risk.
In industrialised economies outside of Europe the economy has stabilised. This was largely the result of massive mone-tary and fiscal stimulus measures and the lessening of ten-sion on financial markets thanks to government stabilisation
The topic of demand side management for households is another key component in connecting the EWE trio smart-box (“smart metering”) and developing “smart grids”. Essen-tially, it is about the precise management of demand for electricity. To make this possible, a communications channel must be set up to the customer’s household appliances. EWE is testing potential ways of bridging the communication gap in cooperation with the white goods manufacturer Miele. In 2009 a prototype was built of a fridge-freezer and it has al-ready been possible to verify initial potential for shifting power loads.
Research focus on power generation management
The precise controlling of the demand and generation of electricity by major customers is the subject of a research project that EWE is carrying out jointly with selected con-tracting customers. The aim is to develop a functioning communications infrastructure to control decentralised heat and power generation plants from a central control room. The project is an important contribution to EWE AG’s development goal of building a virtual power plant. Research focus on mobility management
The topic of electric mobility was considerably advanced in 2009 by funding from the second economic stimulus package. In the years ahead the federal government will be making research funding available that is intended to make Germany the benchmark in this field. As an energy supply company, EWE will be examining how to integrate electric vehicles into the grid and incorporate their batteries into a decentralised energy management system. To do so, EWE and the car manufacturer Karmann have jointly developed
68 EWE Annual Report 2009

programmes. In the United States, which were hard hit by the property and financial crisis, the economy’s downward trend slowed considerably in the first half of 2009. Gross domestic product again registered positive growth in the third quarter of 2009. The Japanese economy was also af-fected particularly severely by the indirect consequences of the crisis via its foreign trade. In comparison with the USA it was nevertheless striking that economic activity in Japan began to recover much earlier.
Emerging economies in Asia were able to turn the corner remarkably swiftly after the sudden, sharp collapse in their exports. At first, the effects of the crisis were pronounced here too, however, with only the large economies of China, India and Indonesia not entering recession. As a large ex-porter of raw materials, Russia suffered particularly badly.
Economic conditions in the eurozone saw a sharp collapse at the beginning of 2009 but stabilised again towards the middle of the year. The downturn had flattened out by the summer and in the third quarter economic activity picked up again slightly. The economic revival is nevertheless pri-marily due to the effects of the stimulus programmes and an end to the strong scaling back of inventories that char-acterised the first half-year. For the full year the German Council of Economic Experts is expecting the fall in gross domestic product to amount to some 3.9 per cent. The fi-nancial crisis had a considerable impact on the labour mar-ket in almost all the countries in the eurozone.
In Germany weak global demand caused an unprecedent-ed fall in exports and investment in capital goods in early 2009. In the first half of the year exports decreased by 18.9 per cent. Investment in capital goods was scaled back significantly due to dwindling foreign demand. Despite a slight improvement in the second half-year, total econom-ic output fell by an average of 5.0 per cent over the year. This cast the economy back to where it was in 2005. Wide-ranging economic policy measures were taken to halt the downward spiral. The federal government adopted broad packages of measures to stabilise the economy, which in conjunction with those of other countries helped to bolster demand and stabilise expectations. This averted an even more severe collapse. The contraction of gross domestic product over four successive quarters ended in Q2 2009 with a positive quarter-on-quarter increase of 0.3 per cent.
Poland surprised observers by reporting economic growth in 2009 despite the global recession. A positive trade balance boosted the economy as imports fell faster than exports due to the decline of the Polish currency. The main source of encouragement came from the public sector, thanks to infrastructure investment in preparation for the European Football Championship in 2012, above all in motor ways and national roads. Export-oriented sectors such as auto-motive manufacturing and engineering reported particu-larly steep falls of 20 per cent and 8 per cent respectively.
Turkey was one of the countries hardest hit by the economic crisis, recording a fall in gross domestic product of around 6 per cent in 2009. In the second half of the year several indicators began to signal an improvement, however. Use of production capacity increased and export volumes began to rise slowly again. A significant increase in unemployment and a swollen budget deficit remain, however, and will bur-den the incipient recovery.
The economy in Lower Saxony has also been back on track since spring 2009, after the dramatic collapse in autumn and winter 2008/2009. According to a survey by the Hanover Chamber of Industry and Commerce, the business climate index for Lower Saxony, which reflects both the current state of business and companies’ expectations, had at the end of 2009 regained exactly its albeit weak level of immediately before the severe slump in autumn 2008.
In the state of Bremen the economy performed in line with the nationwide average. Most companies were able to im-prove their competitiveness in recent years. Parts of the ser-vice and manufacturing sectors in particular are pleased with current business developments. Export-oriented industries, car manufacturers and steel producers suffered particularly from the financial market crisis.
According to an autumn 2009 report from the East Branden-burg Chamber of Industry and Commerce the recession caused by the global economic and financial crisis is still be-ing felt there, although not to the same extent as in regions with more exports and not as strongly as in the first half of 2009. The current state of business for companies in East Brandenburg is considerably more stable than in early summer 2009.
69The e3-programme Management Investor Relations Social responsibility Group Management Report Consolidated financial statements

0
50
100
150
200
2009 2009 2009 2009 2009 2009 20092008 2008 2008 2008 2008 2008 2008
Primary energy consumption in Germany* (in million TCE)
156.8
98.5
166.4
104.4
50.151.550.341.3
4.6
55.453.061.4
39.7
4.2
Nuclear energy
Renewable energies
Other
Oil
Natural gas
Hard coal
Lignite
* Source: Arbeitsgemeinschaft Energiebilanzen e.V.
200
150
100
50
0
Consumption of natural gas fell by 5.5 per cent to 98.5 MTCE. Demand dropped both from industry and for use in power plants. Private households increased their consumption slightly in the first quarter due to the considerably lower temperatures. Natural gas accounted for a slightly higher proportion of total energy consumption at 21.7 per cent in 2009.
Hard coal was affected most severely by the economic de-velopments in 2009. Consumption fell by 18 per cent to 50.3 MTCE. Use in power plants fell by nearly 13 per cent compared with the previous year, while deliveries to the iron and steel industry slumped dramatically by more than 30 per cent. The market for heating also finished down on the year. In 2009 hard coal only accounted for around 11 per cent of energy consumption in Germany.
Lignite’s share of the energy balance declined by some 3 per cent to 51.5 MTCE. This is approximately equivalent to the fall in deliveries to power plants. Generation of nuclear power fell by around 10 per cent to 50.1 MTCE. Lignite and nuclear each accounted for around 11 per cent of total energy consumption.
Hydroelectric power plants generated around 7 per cent less electricity in 2009. Power production from wind tur-bines fell by some 8 per cent. Overall, renewable energies were able to increase their contribution to covering Ger-many’s total energy needs to around 9 per cent. Electricity generation from renewable energies in Germany rose to 16.0 per cent in 2009 (previous year: 15.1 per cent).
Impact on the Group
EWE was affected by the economic crisis in 2009 and suf-fered a sharp fall in sales of electricity and natural gas. By capping risk positions in good time we were nevertheless able to limit the financial consequences for the Group. Sta-ble business with private and commercial customers, which accounts for a large proportion of EWE’s energy business, also helped compensate. The telecommunications services business was hardly affected by the economic crisis. On the other hand, new orders in the IT area were down on the previous year due to the weak state of the economy.
Energy market
Energy consumption in Germany declined sharply in 2009. According to preliminary calculations by the Working Group for Energy Balances (AGEB), consumption fell year on year by 6.5 per cent to 453.1 million tonnes of coal equivalent (MTCE). Macroeconomic developments accounted for a large part of the unusually pronounced sales trend. As energy-intensive primary-materials industries were particularly af-fected by the recession, energy consumption fell by more than gross domestic product. The level of consumption was the lowest since the early 1970s.
Oil consumption fell by 5.8 per cent in 2009, hitting its lowest point since reunification at 156.8 MTCE. Mineral oil remains the primary source of energy in Germany, however, account-ing for 34.6 per cent.
70 EWE Annual Report 2009

0
20
40
60
80
0
18
36
54
72
9080
60
40
20
0Jan. Mar. Sep. Nov.JulyMay
Development of crude
oil price (Brent) in 2009 (in US$ / bbl)
90
72
54
36
18
0Jan. Mar. Sep. Nov.JulyMay
Development of base load electricity
trading prices (EEx) in 2009 (in EUR./ MWh)
Competition on the energy market
Competition on the energy market continued to increase in 2009. Numerous new providers are now active on the market and many established energy utilities are also of-fering their products outside their home regions or even nationwide. According to the German Association of Ener-gy and Water Industries (BDEW), 21 per cent of German households have switched their electricity provider since liberalisation began. Since October 2006, gas customers of all types have also been able to change their supplier. To date 11 per cent of the 10 million households that have direct contracts have switched to a different gas supplier.
energy prices
Price developments on energy markets were defined by the global economic crisis in 2009. A sharp fall in demand for energy led to in part massive price erosion at the start of the year. Between mid-February and March prices stabi-lised again and by May the first months’ losses had been nearly fully recouped. From May onwards the picture was more varied: wholesale prices for electricity and gas declined steadily from then on, but prices for hard coal and emissions certificates maintained their new level. Crude oil prices continued to rise, going up by nearly 90 per cent between March and November.
Sharp production cuts in industry reduced electricity sales for many energy supply companies. Electricity purchased beforehand had to be resold on the spot market and short-term futures market. This resulted in a steep fall in spot market prices in the first quarter. In consequence, the price for base load supplies the following year fell from Euro 59 per megawatt hour (Euro / MWh) in early January to a his-toric low of below 43 Euro / MWh at the end of February. The recovery that began in March and April in expectation of an imminent end to the recession caused the price to rise again to over 57 Euro / MWh. Futures prices fell again successively over the remainder of the year as the eco-nomic data was not able to satisfy these expectations. At the end of the year the wholesale price for one megawatt of electricity was around Euro 49.
71The e3-programme Management Investor Relations Social responsibility Group Management Report Consolidated financial statements

0,0
27,5
55,0
82,5
110,0
0
5
10
15
20
Hard coal price development in 2009
110.0
82.5
55.0
27.5
0Jan. Mar. Sep. Nov.JulyMay
20
15
10
5
0
Euro / t
USD / t
Development of prices for CO2
certificates in 2009 (in / AAU)
Jan. Mar. Sep. Nov.JulyMay
Natural gas prices in Europe are linked to the quoted prices for fuel oil, which are predominantly determined by price developments on the crude oil market. Prices for imported natural gas lag the oil market, so that the latter’s steady increase from March drove up import prices considerably in the second half of the year.
Telecommunications market
The telecommunications market remains characterised by brisk competition. Internet service providers and cable op-erators are entering the market for telephone services in addition to existing telephone network operators, and mobile phone companies are moving into the landline and DSL mar -kets with convergence products. Telecommunications prod-ucts are also increasingly being brokered by discount super-markets. Prices appear to be stabilising at a low level. Growth rates in the DSL broadband market are now slowing after years of rapid expansion. The broadband offensive launched by the German federal government to connect unserved rural areas may result in new growth trends. The basic ten-dency is that demand for broadband is rising, partly as a re-sult of new services such as television via broadband.
The oil price also hit a low at the end of February but rose steadily thereafter from US$41 per barrel (US$ / bbl) to 78 US$ / bbl. The price increase began in expectation of an economic recovery and never went down again. Investor’s hopes that the economy in India and China would keep growing strongly kept the price up at around 80 US$ / bbl until the end of the year. The price rise observed over the course of 2009 cannot be explained solely by real develop-ments in supply and demand.
The low-water mark for hard coal for delivery in 2010 came in mid-March at US$71 per tonne (US$/t). Prices picked up again thereafter. In mid-June they regained the level at which they had started the year at 96 US$/t. This was followed by a slight slip over the summer, before prices stabilised in the second half of the year at 75 – 85 US$/t.
Cutbacks in production at many industrial companies due to the recession resulted in a surplus of emissions rights in the first quarter of the year. Selling these rights helped com pa nies avert cash-flow bottlenecks at a time when bank len ding was tight. The price for an assigned amount unit (AAU) for de-livery in 2010 fell accordingly from Euro 16 per AAU at the beginning of the year to a low for the year of 8.40 Euro / AAU in mid-February. Prices subsequently picked up again, reaching their high for the year in mid-May at 16.56 Euro / AAU. A wide trading band then developed from 13 – 16 Euro / AAU, a range in which the price for CO2 certificates remained until the end of the year.
72 EWE Annual Report 2009

Legal environment
Energy policy
German energy policy was again a focus of public interest last year, partly due to the federal elections. EWE sees some of the topics and targets defined in the coalition agreement between the governing parties as definitive for the sector, such as increasing the share of renewable energies in the overall energy mix, increasing energy efficiency or promot-ing alternative forms of vehicle propulsion. With regard to the Energy Strategy 2010 announced in the coalition agree-ment, EWE hopes for a constructive cooperation with all political stakeholders, in particular the federal ministries involved.
Generally, politics and business work within what is known as the “energy policy triangle”. This means that all activities should be in keeping with the sub-goals of cost-effective-ness, security of supply and environmental protection. The government took measures in all three areas in 2009.
In the area of economic efficiency the aim is to supply energy at the lowest possible price. This includes the efficient use of energy and energy conservation measures, which ultimately also lead to cost-savings. The federal government was not able to pass the Energy Efficiency Act (EnEfG) in 2009, con-trary to original plans. Disagreements between ministries and the upcoming federal election caused the passage and implementation of the act to be postponed until 2010. The EnEfG is intended to transpose into national law the EU di-rective on energy end-use efficiency and energy services dating from 2006. Its objective is to reduce end-energy use in the member states by nine per cent within nine years. In addition, a market for energy services is also to be created. EWE hopes that this will lead to a positive market environ-ment for its own contracting business.
Energy standards for buildings will be increased by 30 per cent on average from 2009 in order to raise the energy ef-ficiency in buildings. This is the subject of the Energy Con-servation by-law that came into force in October 2009.
Once the liberalisation of the metering regime was com-pleted in 2008 and the introduction of “smart metering” was made mandatory, a new market for these smart me-ters has developed.
EWE has also prepared for this market with the development of the EWE trio smartbox that visualises a household’s en-ergy consumption in detail and is due to be launched as a commercial product in 2010.
The new Gas Network Access Ordinance (GasNZV) is due to be passed in 2010. In its amended version it is intended to reduce the number of market areas in Germany succes-sively to one per gas grade. It is also intended to lend legis-lative authority to the regulatory practice of the German Federal Network Agency since 2005 on network access (dual-contract model), on balancing and on switching sup-pliers. Ultimately, these changes also contribute to the se curity of supply, the second sub-goal of the energy poli-cy triangle.
The third side of the energy policy triangle relates to envi-ronmental and climate protection. This includes the use of renewable energies. In order to meet the federal government’s goal of increasing renewable energies’ share of power gen-eration to 30 per cent, one aspect of the strategy lies in pro-moting offshore wind-power technology.
Two by-laws relating to the Renewable Energy Act (EEG) were also discussed. They are aimed at regulating the direct marketing of electricity derived from renewable energies not covered by the EEG and new mechanisms for recircu-lating EEG costs. Though the decision on direct marketing was postponed, the regulation on the recirculation mecha-nism came into force as planned.
The regulation stipulates that transmission network opera-tors will in future no longer pass on EEG electricity to their sales units as part of their load balancing, but instead are to sell it on the European Energy Exchange in Leipzig at the quoted spot rate. The sales proceeds are credited to a ficti-tious EEG account and netted with payments made to supp-liers for EEG feed-in power. The expectation is that these proceeds will not cover the feed-in payments made to fa-cility operators and that the balance will therefore be neg-ative. This amount is to be priced into the total volume of electricity sold to end-consumers to give a single fixed, na-tionwide figure in cents per kilowatt hour.
73The e3-programme Management Investor Relations Social responsibility Group Management Report Consolidated financial statements

In terms of natural gas storage the 3rd IEMP contains rules on unbundling operators of storage facilities and regulating access to storage as well as provisions on the powers of regulatory authorities. The regulation on natural gas pipe-line networks also codifies the previously non-binding GGPSSO (Guidelines for Good TPA Practice for Storage System Operators). As a storage system operator EWE AG is directly affected by the new rules.
The new electricity and gas regulations must be transposed into national law by March 2011 at the latest, whereby companies have until March 2012 to adjust to the unbund-ling rules at the transmission level. From March 2011 the regulations apply in the member states directly.
Another significant event was the European Commission’s proposal in July 2009 for a regulation to secure European natural gas supplies. The new regulation is to replace the previous regulation on security of gas supply and update European legislation in line with recent fundamental devel-opments in the internal gas market. Its core components include the instructions to member states to develop in-frastructure and supply standards as well as an emergency plan to deal with any crisis of supply. The proposal would also give the Commission wide-ranging powers. The draft proposal is currently being dealt with under the codecision procedure.
Incentive regulation
Since 1 January 2009 network fees for operators of gas and electricity networks in Germany have been determined by what is known as incentive regulation. The German Incen-tive System Ordinance (ARegV) governs the basic principles of the incentive regulation in use in Germany, whereby in practice the legislature has left a great many of the details up to the German Federal Network Agency. A key element of the incentive regulation is a clear separation of network operators’ costs from their revenue and the setting of spe-cific economic incentives for network operators to become more efficient. The introduction of the incentive regulation in Germany marks a clear break with the principle defined in Section 23a of the Energy Economy Law (EnWG) applied since July 2005 of genera ting and authorising network fees on a cost-plus basis. The German Federal Network Agency is responsible for applying the German Incentive System Ordinance (ARegV) to EWE NETZ GmbH and the network companies in the swb subgroup and laid down the revenue paths for the company for the first regulatory period (elec-
The federal government recognised the importance of elec-tric mobility and in 2009 adopted the National Develop-ment Plan for Electric Mobility that forms the framework for future technological developments and the market launch of plug-in hybrid and electric vehicles in Germany. EWE is taking an active role in the trial region Bremen /Oldenburg in order to promote the exchange of informa-tion between the various research projects located there.
european Union
The Treaty of Lisbon came into effect on 1 December 2009. It gives the European Union a new legal basis for its work. Energy policy objectives and EU responsibility for energy policy matters are now defined in European primary law for the first time. This strengthens the hand of the European Commission for taking further energy policy measures. In September 2009 the European Parliament confirmed José Manuel Barroso as president of the Commission. He has since put together the new college of commissioners, which began its work in February 2010.
One of the major events in energy policy at the European level took place in September 2009 when the third internal energy market package (3rd IEMP) came into effect. The 3rd IEMP aims primarily to create a functioning, competitive European internal energy market and contains regulations covering all the links in the energy value chain. Particularly relevant for EWE are the rules on unbundling network op-erations from generation and supply, rules relating to stor-ing natural gas and those on consumer protection.
The new electricity and gas regulations stipulate that pow-er transmission networks and gas pipeline networks must be separated from integrated energy suppliers to a greater extent than was previously required, by means of three al-ternative approaches: ownership unbundling, independent system operator and independent transmission operator. The gas regulation is nevertheless unclear about whether operators of regional gas pipeline networks are to be subject to the more restrictive rules. EWE NETZ GmbH operates re-gional gas pipeline networks in Western and Eastern German network areas. Partly due to the fundamental nature of the 3rd IEMP, EWE is of the opinion that these networks do not come within the scope of the three unbundling models men-tioned. The networks of the subgroup swb do not come within the scope of ownership unbundling, independent system operator or independent transmission operator.
74 EWE Annual Report 2009

tricity up to 2014, gas until 2013) in 2008 based on costs for 2006. This means that the profitability of the company’s network operations is basically predetermined for the du-ration of the first regulatory period. The calculation was based partly on the cost audits in the relevant base year 2006 and partly on the efficiency comparisons carried out by the German Federal Network Agency. EWE NETZ there-by benefits from the efficiency rating of 100 per cent that was given in 2008 both for the electricity and the gas networks.
The practice of the German Federal Network Agency in de-fining revenue ceilings for the first time has shown that the agency and the network operators have differing opinions on the legal aspects of applying the Incentive System Ordi-nance. Network operators have therefore lodged a number of complaints against the revenue ceilings with the com-plaints tribunals. EWE NETZ and the network companies in the swb subgroup are also affected by the German Federal Network Agency’s restrictive application of the Incentive System Ordinance, which is to the detriment of the network operators, and has therefore lodged complaints against the revenue ceilings and other negative decisions by the regu-latory agency. The first hearings on the complaints are to take place before the Higher Regional Court in Düsseldorf in early 2010.
EWE NETZ surplus revenue absorption
In a ruling dated 14 August 2008 the German Federal Su-preme Court found that the so-called surplus revenue absorption was legal. In autumn 2009 the German Federal Network Agency gave EWE NETZ the opportunity of taking part in what it terms the simplified surplus revenue absorp-tion procedure, after the company had supplied certain data. The offer applies throughout Germany to all network op-erators and consists of granting a flat-rate rebate of one third on the surplus revenue calculated – as compensation for all aspects of the previous and any future positive rul-ings by the German Federal Supreme Court and uncertain-ties in connection with the calculation of the surplus reve-nue absorption amount. EWE NETZ accepted this offer for the electricity network and the gas networks and waived its rights to seek further redress. In 2010 the company is to implement the revenue absorption by reducing the rev-enue ceiling.
Significant events
Acquisition of Bremen-based swb
On 21 October 2009 EWE increased its stake in Bremen-based swb AG to 100 per cent. One share remains with Bremer Verkehrsgesellschaft mbH, a subsidiary of the city of Bremen.
Consortium and cooperation agreements secure the energy, economic and local interests of the state of Bremen and of swb. Through this move the EWE Group has strengthened its presence in the region and gained capacities and valuable expertise in the area of electricity generation. In addition to obtaining approval from the German Federal Cartel Office, one of the conditions for the transfer of the shares was the merger of Essent with RWE AG. This transaction was com-pleted on 30 September 2009. Dr. Thomas Neuber has held the new board of management seat for renewable energies at swb AG since 1 January 2010.
75The e3-programme Management Investor Relations Social responsibility Group Management Report Consolidated financial statements

Employees by business areas Employees by business areas
Network 1,472 Network 1,503
Holding 354 Holding 414
ICT 2,820 ICT 2,972
Energy 701
Energy 964
swb 594
2008 2009
Major order from the state of Lower Saxony
Since January 2009, Deutsche Telekom and EWE have been cooperating to extend the fibre optic network in eight towns in Lower Saxony and in Bremerhaven. Providing subscribers with higher bandwidths is a basic prerequisite of high-speed internet access. In the reporting period the German state of Lower Saxony’s statistics and communications technology authority (LSKN) awarded EWE TEL the order to establish and operate the future communications network of Lower Saxony’s state administration, thereby becoming the com-pany’s largest customer so far.
Personnel
The number of employees shown below includes all current personnel, both full and part-time, trainees and assistants. In 2009 the EWE Group had an average of 6,446 employees. This corresponds to an increase of 21 per cent compared with 2008. The sharp rise in the number of employees is largely due to the first-time consolidation of the subgroup swb. Several business areas also recruited new staff.
In the Corporate Centre business area the average number of employees rose year on year by 17.0 per cent to 414. More new staff were recruited in 2009 as part of the con-tinued development of Group functions.
In the Energy business area the figure for 2009 was sub-stantially higher than the previous year at an average of 964.3 (+37.6 per cent). The increase is principally due to the first-time consolidation of shareholdings in Turkey for
enBW is new strategic partner
A few months beforehand, EWE welcomed an investment by its new strategic partner. After the German Federal Cartel Office had given its approval, the acquisition of 26 per cent of the shares in EWE by EnBW Energie Baden-Württemberg AG was successfully completed on 21 July 2009. The total volume of the transaction was approximately Euro 2 billion.
In May 2009 EWE and EnBW had reached an agreement regarding the sale of EWE’s 47.9 per cent shareholding in VNG to EnBW. The share transfer has been approved by the competition authorities, but still requires confirmation at a shareholders’ meeting of VNG.
Investment in Turkey expanded
Also in June 2009, EWE acquired 100 per cent of a gas tra-ding company from the Turkish Akfel group. The company, which now trades under the name EWE Doğalgaz, provides EWE with new gas procurement and sales opportunities and complements the Group’s existing stakes in the Turkish end customer market.
Telecommunications division is reorganised
The Osnabrück-based telecommunications company osnatel was merged with EWE TEL GmbH with retroactive effect from 1 January 2009 and will henceforth trade under the name of EWE TEL. osnatel is bringing some 200 employees and 110,000 customers into the company. Martens was mer ged with EWE TEL as of 1 July 2009. Following the merger of the Herford-based telephone company Teleos in 2008, these are additional steps in the establishment of an efficient re-gional telecommunications provider.
76 EWE Annual Report 2009

the full financial year and to growth-driven recruitment at EWE AG.
The average number of employees in the Network business area was 1,503. This was roughly the same as the previous year (+2.1 per cent).
A slight increase in employee numbers was reported in the ICT business area in 2009, where the average figure went up to 2,972 (+5.4 per cent). The increase is due to organic growth at the companies in the ICT business area.
earnings, assets and financial position
The financial statements for EWE AG as of 31 December 2009 have been prepared in accordance with International Financial Reporting Standards (IFRS) as applicable in the EU. Compared with the previous year the group of consolidated companies increased by 18 fully consolidated companies and five companies accounted for under the equity method, while six fully consolidated companies were deconsolidated.
In the Energy business area the Turkish wholesale company EWE Doğalgaz Sanayi ve Ticaret A.Ş. (EWE Doğalgaz) acquired on 11 June 2009 has been fully consolidated as of the ac-quisition date.
The following companies that form the new swb business area were fully consolidated in EWE’s financial statements when the remaining shares (less one share) in swb AG were acquired as of 21 October 2009:
swb AG, swb Bremerhaven GmbH, Bohn GmbH Energie- und Kraftwerkstechnik, swb Beleuchtung GmbH, swb CREA GmbH, swb Entsorgung GmbH, swb Erzeugung GmbH & Co. KG, swb Immobilien GmbH, swb Messung und Abrechnung GmbH, swb Netze Bremerhaven GmbH & Co. KG, swb Netze GmbH & Co. KG, swb Services GmbH & Co. KG, swb Vertrieb Bremen GmbH, swb Vertrieb Bremerhaven GmbH & Co. KG and Windfarm Märkisch Linden GmbH & Co. KG.
In the ICT business area, ncN (established on 1 October 2009) and BTC IT Services GmbH (spun off from BTC AG as of 1 July 2009) were fully consolidated for the first time. osnatel and Martens were merged with EWE TEL as of 1 January 2009 and 1 July 2009 respectively. As of 1 January 2009 BTC Busi-ness Technology Consulting Sp. z o.o., BTC Ekonum Bilişim Hizmetleri A.Ş. and BTC (Schweiz) AG were deconsolidated.
MVR Müllverwertung Rugenberger Damm, part of the Ener-gy business area, has been accounted for under the equity method, retrospectively to 1 January 2008. In addition, Aequamus GmbH, which offers balancing group management as a service provider, has been included in the Network busi-ness area under the equity method since 1 April 2009.
When the additional shares in swb AG were acquired the com-pany was fully consolidated and no longer accounted for under the equity method. The companies swb Weserwind GmbH & Co. KG, Hansewasser Ver- und Entsorgungs-GmbH, hanseWasser Bremen GmbH and Stadtwerke Bielefeld GmbH were all included in the swb business area of the EWE Group under the equity method as of 1 October 2009.
The VNG shares, which had previously been accounted for in the Corporate Centre business area under the equity method, are classified as held for sale as a decision has been made to dispose of them.
All in all, the corresponding period last year is therefore only partially comparable with the current period.
77The e3-programme Management Investor Relations Social responsibility Group Management Report Consolidated financial statements

in EUR million 01.01. – 31.12.2009 01.01. – 31.12.2008 Change absolute Change in %
Sales (without electricity and natural gas tax) 5,798.4 5,327.3 471.1 8.8
Cost of materials and services - 4,435.7 - 4,177.7 -258.0 6.2
Personnel expenses - 406.7 - 324.1 -82.6 25.5
Other income and expenses - 275.5 - 203.4 -72.1 35.4
Result of equity investments¹ 145.4 124.1 21.3 17.2
eBITDA 825.9 746.2 79.7 10.7
Depreciation, amortisation and impairment¹ - 411.9 - 320.1 -91.8 28.7
eBIT 414.0 426.1 -12.1 -2.8
Net interest income/expense - 120.0 - 134.5 14.5 -10.8
Profit before tax 294.0 291.6 2.4 0.8
Income taxes¹ - 94.6 - 80.6 -14.0 17.4
Consolidated net profit for the period 199.4 211.0 -11.6 -5.5
of which attributable to minority interests¹ 0.9 0.9 0.0 0.0
of which attributable to shareholders of eWe AG 198.5 210.1 -11.6 -5.5
1 Previous year’s figures adjusted
Summary consolidated income statement
This meant that EBITDA increased overall by Euro 79.7 million or 10.7 per cent to Euro 825.9 million.
Depreciation, amortisation and impairment charges for goodwill and assets reduced the result.
Net interest income/expense is principally made up of in-terest paid on three bearer bonds (EWE bonds), interest on current bank debt and expenses for compounding non-current provisions. Interest income includes a one-off ef-fect in connection with the share purchase by the new strategic partner EnBW Energie Baden-Württemberg AG.
The consolidated net profit for the period was Euro 199.4 million and thus 5.5 per cent lower than the corresponding period last year. The return on sales fell from 4.0 per cent to 3.4 per cent.
Overall, EWE continued to hold its ground well in difficult economic conditions.
earnings position
In 2009 the EWE Group generated sales (without electricity and natural gas tax) of Euro 5.8 billion (previous year: Euro 5.3 billion). Of total Group sales, 69.7 per cent came from the Energy business area, 16.7 per cent from the Network business area, 8.4 per cent from the ICT business area and 5.2 per cent from the swb business area. The Corporate Cen-tre business area has no appreciable sales.
The increase in sales in the financial year 2009 is largely due to the full consolidation of swb AG for three months.
The materials usage ratio, measured as the cost of materials and services in relation to revenue from sales, fell from 78.4 per cent to 76.5 per cent. This is due to lower gas pro-curement costs. Economies of scale and favourable price movements on world markets both contributed to the de-cline. Electricity procurement costs moved in the opposite direction due to higher purchasing costs and higher EEG levies. Personnel expenses rose by 0.9 percentage points to 7.0 per cent due to a new wage settlement and greater staff numbers.
The balance of other income and expenses went up by 35.3 per cent in the reporting year, partly as a result of ex-penses in connection with various research projects.
78 EWE Annual Report 2009

Consolidated revenue (EUR mill.)
0
1000
2000
3000
4000
5000
60006,000
5,000
4,000
3,000
2,000
1,000
0
5,327.3
5,798.4
2008 2009
Sales by business areas ( in per cent)
0
20
40
60
80
100100
80
60
40
20
0
70
17
8 5
2008 2009
74
16
10
* pro rata for 4th quarter
ICT
swb *
Network
Energy
Consolidated balance sheet structure 2009 (EUR mill.)
0
1000
2000
3000
4000
5000
6000
7000
8000
9000
10000
1100011,000
10,000
9,000
8,000
7,000
6,000
5,000
4,000
3,000
2,000
1,000
0
Current assets
3,287.3
Equity
3,409.8
Non-current liabilities
5,402.4
Current liabilities
1,641.7Non-
current assets
7,166.6
Assets Equity and Liabilities
Assets and financial position
The consolidated balance sheet total rose by Euro 3.1 billion or 42.3 per cent to Euro 10.5 billion in the financial year 2009. This is largely due to the full consolidation of swb AG fol-lowing the acquisition of the remaining 51 per cent of the shares (less one share).
The nature of business engaged in by EWE means that it has a high investment intensity and a correspondingly high level of capital commitment. Non-current assets therefore ac-count for some 69 per cent of total assets.
The increase in the proportion of current assets as compared with 31 December 2008 results from the reclassification of the VNG shares as held for sale in accordance with IFRS 5.
Capital expenditure came to Euro 698.8 million in financial year 2009 (previous year: Euro 923.8 million). It was princi-pally invested in acquiring shareholdings aimed at the stra-tegic expansion of existing business areas as well as for infrastructure development, including new technologies.
Non-current assets are financed by means of equity and non-current borrowings.
Non-current borrowings include three EWE bonds with a total volume of Euro 2.0 billion and terms of 10 years (2014), 12 years (2021) and 15 years (2019).
The equity ratio rose from 27.3 per cent to 31.6 per cent. This is principally due to a capital increase and a contribu-tion to the capital reserve in connection with the purchase of 26.0 per cent of EWE shares by EnBW Energie Baden-Württemberg AG.
The summary Group cash flow statement shows that EWE’s cash flow from operating activities came to Euro 647.2 million in the 2009 reporting year. The significant increase stems in particular from changes in receivables and other assets, which fell year on year by Euro 273.5 million.
79The e3-programme Management Investor Relations Social responsibility Group Management Report Consolidated financial statements

EUR million 1.1. – 31.12.2009 1.1. – 31.12.2008 Change
Cash flow from operating activities 647.2 382.0 265.2
Cash flow from investing activities -1,336.7 -826.7 -510.0
Cash flow from financing activities 1,071.7 547.3 524.4
Currency translation and consolidation charges -0.3 10.3 -10.6
Net change in cash and cash equivalents 381.9 112.9 269.0
Cash and cash equivalents at the beginning of the period 223.0 110.1 112.9
Cash and cash equivalents at the end of the period 604.9 223.0 381.9
Summary Group cash flow statement
Assets in EUR million 31.12.2009 in % 31.12.2008 in %
Non-current assets 7,166.6 69 5,804.4 79
Current assets (of which held for sale Euro 1,000 million) 3,287.3 31 1,542.7 21
Total assets 10,453.9 100 7,347.1 100
equity and liabilitiesin Euro million 31.12.2009 in % 31.12.2008 in %
Shareholders’ equity 3,409.8 32 2,002.2 27
Non-current liabilities 5,402.4 52 3,637.1 50
Current liabilities 1,641.7 16 1,707.8 23
Total equity and liabilities 10,453.9 100 7,347.2 100
Consolidated balance sheet
The EWE Group’s financial flexibility is also secured by credit lines and the arrangement of a syndicated revolving credit facility for Euro 850.0 million. As of 31 December 2009, EWE AG had drawn down Euro 0.0 million (previous year: Euro 220.0 million) of the facility. Overall, EWE benefits from its good credit rating, which is also confirmed by the rating agencies Standard & Poor’s and Moody’s. It currently stands at A- with the addition “watch negative” (Standard & Poor’s) and A2 with outlook stable (Moody’s).
Cash flow for investing activities went up due to expendi-ture for investments in property, plant and equipment and in financial investments and in particular to expenditure for investment in interests in fully consolidated companies.
Cash inflows in connection with the share purchase by the strategic partner EnBW Energie Baden-Württemberg AG and the issue of an EWE bond contributed to the increase in cash flow from financing activities.
Both equity and new fund raising were used to finance growth.
80 EWE Annual Report 2009

in EUR million Corporate Centre Energy Network swb ICT Group
2009 2008 2009 2008 2009 2008 2009 2009 2008 2009 2008
Business area sales 7.1 7.5 4,169.2 4,036.4 1,786.8 1,647.9 308.6 603.1 601.0 6,874.8 6,292.8
Consolidation -1,076.4 -965.5
Group sales 5,798.4 5,327.3
eBITDA 388.0 299.8 262.6 226.0 306.8 279.4 73.6 95.6 133.4 1,126.6 938.6
Consolidation -300.7 -192.4
Group EBITDA 825.9 746.2
eBIT 361.8 278.8 106.1 137.2 179.4 137.6 49.1 18.6 65.2 715.0 618.8
Consolidation -301.0 -192.6
Group EBIT 414.0 426.2
Capital expenditure 1,372.7 106.6 283.4 606.7 197.3 162.2 34.1 67.7 79.5 1,955.2 955.0
Consolidation -1,256.4 -31.2
Group capital expenditure 698.8 923.8
Average number of employees 414 354 964 701 1,503 1,472 594 2,971 2,820 6,446 5,347
Overview of Group business areas
Performance of business areas
Corporate Centre business area
The Corporate Centre business area consists of Group head office functions as well as strategically important minority shareholdings and other activities such as central services. The Corporate Centre has no appreciable sales. In 2009 it reported revenue of Euro 7.1 million (previous year: Euro 7.5 million), which is mostly derived from internal revenue for providing Group functions.
EBIT for the Corporate Centre business area rose significantly compared with the previous year by 29.8 per cent to Euro 361.8 million, largely due to the positive result of equity investments from VNG and a higher earnings contribution from the Network business area.
Capital expenditure in the Corporate Centre segment amoun- ted to Euro 1,372.7 million, well above the previous year’s level of Euro 106.6 million. The acquisition of the swb shares is the main reason for the increase. It is made up of the ac-quisition of a 51 per cent stake (less one share) from the Free and Hanseatic City of Bremen and the transfer of the
49 per cent interest previously held in the Energy business area to the Corporate Centre.
Energy business area
Electricity sales in the Energy business area declined by 3.6 per cent to 12.9 billion kWh in 2009. The fall stems mainly from the customer segments special-rate customers, par-ticularly industrial customers, and local utilities. Economic factors and the ensuing decline in production had an adverse effect on EWE’s sales to both customer groups.
Natural gas sales in the Energy business area came to 47.3 billion kWh in 2009, an increase of 16.9 per cent compared with 2008. The sharp rise is principally the result of the first- time consolidation of sales companies in Turkey for the full year. Weather conditions and successful new customer wins also had a positive effect in the standard-rate customer group. EWE was also able to acquire two municipal utilities as new customers, which increased sales volumes in the local utility segment. A sales decline in the special-rate customers segment had the opposite effect. This was due to lost customers and production cutbacks as a result of the recession.
81The e3-programme Management Investor Relations Social responsibility Group Management Report Consolidated financial statements

0
2000
4000
6000
8000
10000
12000
14000
Electricity sales by customer group (in million kWh)
14,000
12,000
10,000
8,000
6,000
4,000
2,000
0
4,274 4,219
6,529
2,427 2,306
13,348
2008 2009
Standard-rate customers
Special-rate customers
Local utilities
Million kWh
2008 2009 2008 2009 2008 2009
6,119
12,866
Network business area
The Network business area reported sales of Euro 1.8 billion in 2009. The year-on-year rise of 8.4 per cent stems primarily from the increased feed-in of renewable energies, which had virtually no effect on the result due to a parallel increase in the cost of materials and services, and from higher network use charges for electricity and gas.
EBIT rose substantially by 30.4 per cent. This is largely thanks to efficient cost management and lower depreciation due to extending the useful life of equipment.
Capital expenditure in the Network business area was Euro 35.1 million up on the previous year. The main reason for the increase was higher investment in telecommunications equipment compared with 2008 due to the expansion of the fibre optic network (LSKN project). Higher capital ex-penditure on electricity supply equipment in the reporting period was offset by lower capital expenditure in gas sup-ply facilities compared with the previous year.
Sales in the Energy business area rose by 3.3 per cent to Euro 4.2 billion. The sales increase stems mainly from the fact that sales by the Turkish companies were only included pro rata the previous year. Higher sales of natural gas also had a positive impact on sales development. Sales revenue was reduced by lower sales volumes of electricity and gas due to the recession, as well as the fact that EWE cut its natu-ral gas prices three times in 2009.
EBIT fell year on year by 22.7 per cent to Euro 106.1 million, largely as a result of impairment losses on goodwill for the subgroup Turkey and the result of equity investments from swb, which is no longer shown in this business area.
Capital expenditure was Euro 323.3 million lower than the previous year. The purchases in 2008 of additional shares in Bursagaz and Kayserigaz were the main cause. Capital ex-penditure was incurred in 2009 for DOTI and property, plant and equipment.
82 EWE Annual Report 2009

0
10000
20000
30000
40000
50000
Natural gas sales by customer group (in million kWh)
13,566
27,308
22,776
12,577
5,424
47,299
4,196
40,454
2008 2008 2008 20082009 2009 2009 2009
Standard-rate customers
Special-rate customers
Local utilities
Million kWh
50,000
40,000
30,000
20,000
10,000
0
swb business area
The swb business area was fully consolidated into the EWE Group for the first time in the fourth quarter 2009. The fig-ures shown are therefore pro rata for the period of full con-solidation. Sales include sales of electricity, natural gas and sales revenue from the area environment and others.
Pro rata EBIT for the business area was Euro 49.1 million, which includes the earnings offset from allocating the ac-quisition price.
Pro rata capital expenditure for the period came to Euro 34.1 million. This includes investment in power plants (retrofits) and networks.
ICT business area
The telecommunications and IT companies in the EWE Group allocated to the ICT business area continued their growth path in 2009. The tough competitive environment nevertheless put pressure on operating activities.
Including the telecommunications company htp, which is presented as an associated company, the telecommunica-tions companies served more than 700,146 customers as of 31 December 2009. This corresponds to an increase of 4.3 per cent compared with the previous year. Despite the weak economic climate, the BTC group was able to report higher sales.
Total sales for the ICT business area came to Euro 603.1 million, matching the previous year’s figure of Euro 601.0 million. New customer wins in voice telephony and weaker, but still successful marketing of DSL products contributed to sales growth. In the IT business some softening of sales due to the recession was made up for with internal revenue.
EBIT fell considerably by 71.5 per cent to Euro 18.6 million, largely due to declining average yields as a result of com-petition. Organisational costs required by the merger of several telecommunications companies into the EWE Group depressed earnings, as did start-up costs for nordcom Niedersachsen GmbH.
Supplementary reportNo events of particular significance have occurred since the end of the financial year.
83The e3-programme Management Investor Relations Social responsibility Group Management Report Consolidated financial statements

The risks identified at the level of the individual companies are included in summarised reporting at business area and Group level in accordance with their significance as meas-ured by the key budget target figures. The data gathered in the regular, systematic risk early recognition process and urgent risk reports at short notice when certain thresholds are reached form the basis for an evaluation of the EWE Group’s current and future risk situation. Regular reports based on this information and geared towards materiality are submitted to the Board of Management and the super-visory bodies.
Main categories of risk
The main categories of risk which according to current in-formation can affect the course of business and assets, earnings and financial position of EWE are as follows:
Ambient risks
Ever more changes to the international macroeconomic mar-ket environment, especially in connection with the finan-cial and economic crisis, as well as adjustments to the legal and social framework increase the potential risks to the EWE Group’s sustainable business development in terms of the main objectives of its business areas. Of particular im-portance to EWE now and in the future are the effects of regulatory decisions on the energy market in Germany, Poland and Turkey as well as the terms of competition in the telecommunications market. Legal risks also continue to exist in connection with the enforceability of necessary gas price adjustments. EWE sees its active involvement in the industry associations relevant to its business areas as an opportunity to play a constructive role in the political decision-making process and shape ambient conditions.
Market risks
In its Energy, swb and ICT business areas EWE remains ex-posed to volume and margin risks as well as rising credit risk for business partners due to the increasing pressure of competition on both national and international procure-ment and sales markets as a result of the financial and economic crisis. Our IT activities in the ICT business area remain exposed to the risk that they will be affected by a reluctance to invest which may prevail in their core mar-kets due to the tense market environment.
Risk report
Structure and core elements of the opportunity and risk management system
The early identification and active control of potential op-portunities and risks is of crucial importance for the lasting successful development of the EWE Group, especially against the backdrop of the current financial and economic crisis. The standardised planning and controlling process at Group level, featuring an integrated early recognition system for opportunities and risks, is the integral base of the Group-wide opportunity and risk management system. Its princi-pal organisational elements are the Opportunities and Risks Committee and the central Risk Controlling team, whose main task is the further development and coordination of the process-oriented early recognition system for risks on the basis of guidelines applicable throughout the Group as well as the risk reporting to the Board of Management. The Board of Management has also set up a frame work for the Energy Trading division reflecting its specific requirements and the corporate goals and equipped it with suitable in-struments and rules, particularly relating to supervision and separation of functions, as well as risk guidelines for energy trading.
early risk recognition process
The risks are identified early at the level of the individual com panies with responsibility for the risks in a regular and structured process while observing the relevant Group stan-dards as defined in Group guidelines, evaluated in terms of potential damage and likelihood of occurrence, and report-ed to EWE’s central Risk Controlling team along with a list of appropriate measures to limit the risks. Regular reporting for the Energy Trading division is based on risk measurement instruments specially developed for this area.
84 EWE Annual Report 2009

In order to meet the various challenges posed by the market and the competition EWE developed early on flexible and customer-oriented product and price strategies and offers product portfolios which reflect the demands of the market. Successful cooperation between business areas in develop-ing combined energy and telecommunications pro ducts has proven to provide an important competitive edge. Operating risks
The basis for EWE’s sustainable commercial success lies in continuing to operate innovative and highly complex pro-duction and network infrastructure efficiently and to make corresponding targeted investments, both in the energy and telecommunications areas.
To reduce potential risks and make consistent use of avail-able opportunities, the highly qualified staff working there take part in a continuous training process to secure and im-prove their high level of qualifications in terms of present and future standards and especially with regard to safety measures and statutory requirements. Furthermore, special quality assurance plans and coordinated redundancy con-cepts have been implemented so as to guarantee process stability and are developed continually in line with re-quirements.
Financial risks
EWE’s operating activities in the various business areas in Germany and abroad give rise to financial risks in the form of liquidity, credit, interest and exchange rate risks as well as market price risks on the international energy procure-ment and sales markets which are vital to EWE. In light of the financial and economic crisis, EWE has stepped up its continuous monitoring, position evaluation, credit scoring of business partners and active risk management and is im-plementing suitable instruments related to relevant target figures to manage risk on the basis of risk guidelines for specific business areas. The financial risk management in-struments used are explained in detail in the section cov-ering disclosures on financial instruments in the Notes to the consolidated financial statements.
Risks from joint Group functions
The latest information and communications technology is used to provide efficient support for all business processes in the individual segments. As the quality and, in particular, the permanent availability of the systems are a critical factor in the success of the business and the further development of the business, extensive hardware and software measures are implemented and constantly refined using the latest models to improve the quality of software development and ensure high availability. Starting from this high quality level, systems are constantly refined, including intensive staff training, data security and data protection.
Summary assessment of the risk situation
The established and process-oriented early recognition sys -tem for risk did not reveal any individual risks or a total risk position in 2009 which could jeopardise the continued existence of the EWE Group. The Group Internal Audit de-partment supervises and regularly audits the risk early rec-ognition system to ensure that it functions correctly and effectively and complies with legal requirements. For the current financial year, 2010, no risks to the continued ex-istence of the Group have been identified to date.
85The e3-programme Management Investor Relations Social responsibility Group Management Report Consolidated financial statements

The Board of Management gives a declaration under oath that accounting standards have been complied with and that the figures present a true and fair view of the Group’s earnings, assets and financial position.
OutlookFuture macroeconomic situation
Following the worst recession in the post-war period the global economy is now in a phase of tentative recovery that according to several economic experts will proceed slug-gishly for some time to come. The economy is only picking up steam slowly in 2010, despite a better starting position. The problems in the financial sector have not yet been re-solved and unemployment is expected to continue rising in the short term. On the other hand, positive effects can be expected from worldwide stimulus programmes and ro-bust performance by emerging economies.
Leading economic institutes are forecasting moderate growth for Germany. Gross domestic product is predicted to rise at a rate of 1.6 to 2.1 per cent. The unemployment rate is forecast to go up to between 8.8 and 9.7 per cent. Fiscal policy measures and low interest rates are expected to bol-ster the economy in 2010, but the stagnant labour market and restricted access to funding for some companies in the real economy will hamper recovery. Estimates by the Ger-man Council of Economic Experts come to the con clusion that potential production, i.e. the total production capacity of the economy, will only rise by 0.7 per cent, which is sig-nificantly less than beforehand. Funds made available as part of the economic stimulus packages are also gradually drying up and lending hurdles for capital expenditure and jobs remain high. Overall, this means that the German economy will remain fragile.
In view of surprising economic growth in Poland in 2009, international, public-sector and private banks have revised their forecasts for gross domestic product and are now as-suming growth of 1.0 to 1.5 per cent.
Though Turkey was one of the countries hardest hit by the recession in 2009, forecasts are nevertheless predicting positive growth for 2010. The Turkish government, the In-ternational Monetary Fund (IMF) and various analysts at large banks broadly concur in forecasting GDP growth of around 3.5 per cent.
Report on the internal control and risk management system with regard to consolidated accounting procedures
EWE’s internal control system (ICS) consists of systemati-cally defined organisational and technical measures and controls intended to guarantee the security and integrity of data and IT systems relevant to Group accounting. The consolidated financial statements for EWE AG in accord-ance with IFRS are prepared centrally by the Group account-ing department using the IT system SAP-SEM-BCS. Consol-idation takes place at the level of the Group parent EWE AG, with the exception of the subgroup swb AG.
Primary bookkeeping by the individual companies takes place partly centrally and partly decentrally in accordance with local standards. In all cases these include a separation of functions, systematic authorisation routines for data processing and physical and software access controls.
An accounting handbook is intended to ensure that IFRS are applied in a uniform manner throughout the Group. Impor-tant matters such as the allocation of purchase prices and impairment testing are carried out centrally. The data re-quired for consolidation is transmitted to EWE AG by means of uniform, standardised processes using a consolidated account framework.
The internal control system is systematically safeguarded via descriptions of procedures based on a structured time-table for preparing the consolidated financial statements, process descriptions for important accounting procedures and other process descriptions. Pension provisions are cal-culated by external experts on the basis of fundamental assumptions provided by EWE AG. External expertise is also obtained when dealing with other complex accounting and measurement matters.
The Internal Audit department carries out random checks on the ICS. As a head office function the Internal Audit de-partment performs its audits and prepares its reports on the basis of risk-focused audit plans approved by the Board of Management.
86 EWE Annual Report 2009
Possible changes in the structure of the Group
The EWE Group has grown continually over the past twelve years. The most recent example was increasing the share-holding in swb AG to 100 per cent (less one share). EWE is taking this opportunity to examine whether it is necessary to adapt the organisational structure of the Group in 2010. The aim is to ensure optimal and efficient management and cooperation within the Group. The company’s senior man-agement is looking for a Group structure that does justice to the different markets and the regional principle of the subsidiaries and is therefore considering the introduction of a holding company structure.
earnings forecast
The exceptional circumstances of the financial and econom-ic crisis and the uncertainty this has wrought in the indus-try mean that this year too, forecasting future earnings is a difficult proposition. Nevertheless, even under these diffi-cult conditions, EWE sees opportunities for the Group to develop and reach its strategic goals. The first full-year con-solidation of swb will have a significant effect on the year 2010. Group sales are expected to go up substantially and then maintain this level in 2011 as well. The EWE Group as-sumes that synergy effects will lead to cost savings in the medium term and that positive EBIT growth at Group level can be expected in 2011 at the latest.
expected developments in the energy business area
Sales and earnings developments in the Energy business area are subject to the swings of the economy and are largely determined by weather conditions and movements in the oil price. These are factors over which EWE has no control. With this reservation, the economic recovery in sight for 2010 and 2011 gives grounds for expecting moderate, but overall positive growth in sales and a steady improvement in EBIT.
expected developments in the Network business area
Sales and earnings developments in the Network business area will be restrained this year by the surplus revenue ab-sorption. Lowering the revenue ceiling will probably mean a slight decline in sales and a lower EBIT than in 2009. EWE NETZ is planning additional cost-cutting measures to add to the company’s already impressive efficiency as confirmed by the regulatory authorities and expects that these will have a positive effect on sales and earnings the following year.
expected developments in the swb business area
This year will be the first in which the subgroup swb is con-solidated in the EWE Group for the full twelve months. swb intends to develop its products and services further with the aim of gaining and keeping new customers. Sales and EBIT are planned to remain stable for 2010 and 2011.
expected developments in the ICT business area
In the ICT business area EWE is expecting to expand the customer base, win new contracts and generate higher sales as a result in 2010 and 2011. EBIT will be diminished in 2010 by additional expenses for redesigning the telecommunica-tions infrastructure for the state authorities in Lower Saxony. Earnings are then expected to pick up significantly in 2011.
These statements are based on current knowledge and assumptions. They are estimates made on the basis of all information currently available to us. If the assumptions do not materialise or additional risks should come to light, actual results may differ from the forecast results. For this reason we make no guarantee as to the accuracy of these statements.
87The e3-programme Management Investor Relations Social responsibility Group Management Report Consolidated financial statements

Consolidated Financial Statements
Consolidated financial statements 89
Statement of comprehensive income for the EWE Group 89Condensed statement of comprehensive income for the EWE Group Reconciliation 89Balance sheet for the EWE Group 90Statement of changes in shareholders’ equity for the EWE Group 92Cash flow statement for the EWE Group 94
Notes to the consolidated financial statements for the eWe Group 95
Basic information on the company 95Basis of preparation 95Principles of accounting and valuation 112Notes to the income statement 122Notes to the balance sheet 127Other disclosures 161
Confirmation by the legal representatives 173
Auditors’ Report 174
88 EWE Annual Report 2009
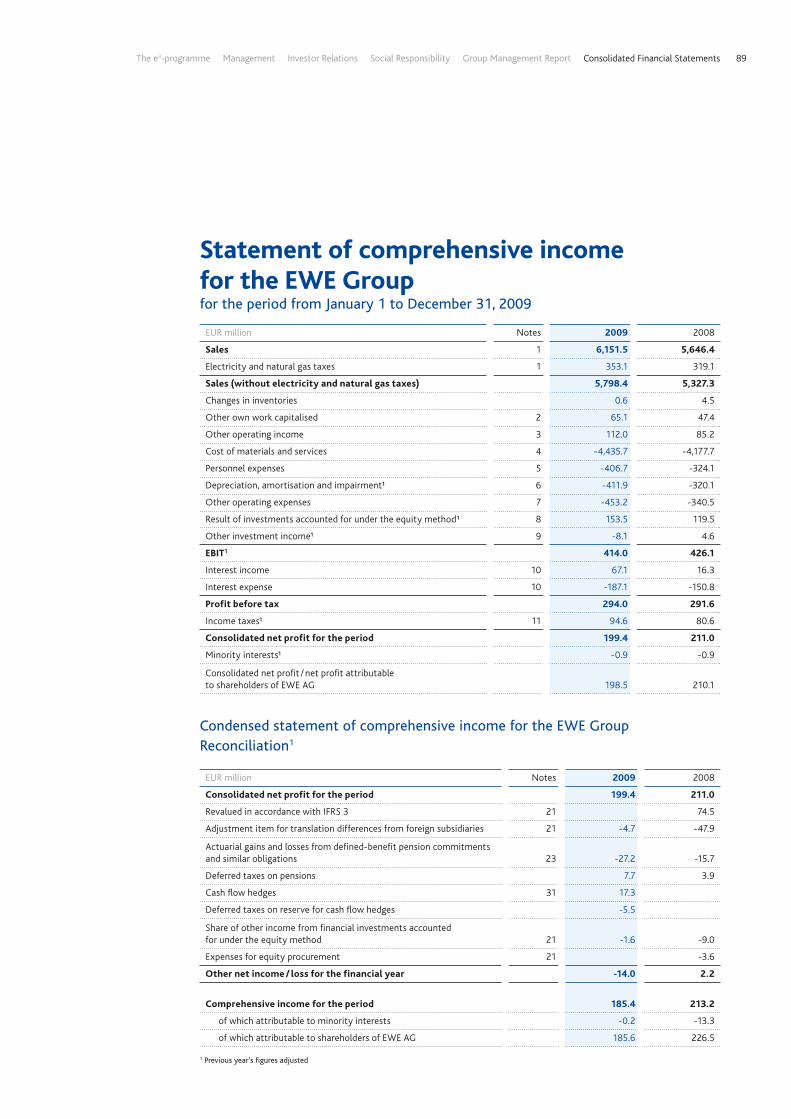
EUR million Notes 2009 2008
Sales 1 6,151.5 5,646.4
Electricity and natural gas taxes 1 353.1 319.1
Sales (without electricity and natural gas taxes) 5,798.4 5,327.3
Changes in inventories 0.6 4.5
Other own work capitalised 2 65.1 47.4
Other operating income 3 112.0 85.2
Cost of materials and services 4 -4,435.7 -4,177.7
Personnel expenses 5 -406.7 -324.1
Depreciation, amortisation and impairment¹ 6 -411.9 -320.1
Other operating expenses 7 -453.2 -340.5
Result of investments accounted for under the equity method¹ 8 153.5 119.5
Other investment income¹ 9 -8.1 4.6
eBIT1 414.0 426.1
Interest income 10 67.1 16.3
Interest expense 10 -187.1 -150.8
Profit before tax 294.0 291.6
Income taxes¹ 11 94.6 80.6
Consolidated net profit for the period 199.4 211.0
Minority interests¹ -0.9 -0.9
Consolidated net profit / net profit attributable to shareholders of EWE AG 198.5 210.1
Statement of comprehensive income for the eWe Groupfor the period from January 1 to December 31, 2009
EUR million Notes 2009 2008
Consolidated net profit for the period 199.4 211.0
Revalued in accordance with IFRS 3 21 74.5
Adjustment item for translation differences from foreign subsidiaries 21 -4.7 -47.9
Actuarial gains and losses from defined-benefit pension commitments and similar obligations 23 -27.2 -15.7
Deferred taxes on pensions 7.7 3.9
Cash flow hedges 31 17.3
Deferred taxes on reserve for cash flow hedges -5.5
Share of other income from financial investments accounted for under the equity method 21 -1.6 -9.0
Expenses for equity procurement 21 -3.6
Other net income / loss for the financial year -14.0 2.2
Comprehensive income for the period 185.4 213.2
of which attributable to minority interests -0.2 -13.3
of which attributable to shareholders of EWE AG 185.6 226.5
1 Previous year’s figures adjusted
Condensed statement of comprehensive income for the EWE GroupReconciliation1
89The e3-programme Management Investor Relations Social Responsibility Group Management Report Consolidated Financial Statements

Assets
EUR million Notes 31.12.2009 31.12.2008 01.01.2008
Non-current assets
Intangible assets¹ 12 1,573.7 720.8 120.3
Property, plant and equipment 13 4,821.0 3,348.0 3,101.9
Financial investments accounted for under the equity method¹ 14 497.4 1,585.7 1,633.3
Other non-current assets¹ 15 262.0 143.1 139.6
Deferred taxes¹ 28 12.5 6.8 5.2
7,166.6 5,804.4 5,000.3
Current assets
Inventories 16 266.6 180.9 219.9
Trade receivables 17 732.2 684.3 478.5
Other receivables and assets 18 635.0 414.6 275.0
Income tax receivables 49.0 39.9 6.0
Cash and cash equivalents 19 604.5 223.0 110.1
2,287.3 1,542.7 1,089.5
Non-current assets held for sale 20 1,000.0
3,287.3 1,542.7
Total assets 10,453.9 7,347.1 6,089.8
1 Previous year’s figures adjusted
Balance sheet for the eWe Groupas of December 31, 2009
90 EWE Annual Report 2009

Equity and liabilities
EUR million Notes 31.12.2009 31.12.2008 01.01.2008
Shareholders’ equity 21
Subscribed capital 243.0 200.0 200.0
Capital reserve 1,532.1 278.5 282.1
Retained earnings¹ 1,598.7 1,478.9 1,306.9
Equity attributable to EWE AG's shareholders 3,373.8 1,957.4 1,789.0
Minority interests¹ 36.0 44.8 5.5
3,409.8 2,002.2 1,794.5
Non-current liabilities
Construction subsidies 22 749.3 604.5 561.8
Provisions 23 1,314.6 707.0 681.2
Bonds 24 1,988.9 1,494.9 1,494.2
Liabilities to banks 25 731.0 532.4 167.7
Other non-current liabilities 27 144.0 61.5 64.1
Deferred taxes¹ 28 474.6 236.8 174.0
5,402.4 3,637.1 3,143.0
Current liabilities
Construction subsidies and emissions rights 22 93.1 35.6 41.7
Provisions 23 94.5 34.6 49.0
Liabilities to banks 25 36.6 570.4 254.1
Trade payables 26 690.6 539.5 477.6
Income tax liabilities 11.5 16.2 11.3
Other current liabilities 27 715.4 511.5 318.6
1,641.7 1,707.8 1,152.3
Total equity and liabilities 10,453.9 7,347.1 6,089.8
1 Previous year’s figures adjusted
91The e3-programme Management Investor Relations Social Responsibility Group Management Report Consolidated Financial Statements

EUR million
Subscribed capital of the
eWe Group
Capital reserve of the
eWe Group ReTAINeD eARNINGSAttributable to
eWe GroupMinority interests Total
Accumulated income Comprehensive other income
Revaluation reserve in
accordance with IFRS 3
Reserve for cash flow hedges
Cumulative translation differences
Measurement of pension provisions IFRS 5
Change from equi-ty valuation with-out effect on prof-
it and loss
As of 31.12.2007 200.0 282.1 1,165.9 7.4 72.6 48.6 1,776.6 5.5 1,782.1
Adjustment for first-time consolidation of associated companies 12.4 12.4 12.4
As of 1.1.2008 200.0 282.1 1,178.3 7.4 72.6 48.6 1,789.0 5.5 1,794.5
Dividend payments -65.0 -65.0 -0.1 -65.1
Income and expenses recognised directly in equity1 -3.6 74.5 -33.6 -11.8 -9.0 16.5 -14.2 2.3
Change in the group of consolidated companies 1.3 1.3 51.8 53.1
Consolidated net profit / consolidated net profit for the year 210.1 210.1 0.9 211.0
Transactions under joint control -20.7 -20.7 -20.7
Other changes 26.2 26.2 0.9 27.1
As of 31.12.20082 200.0 278.5 1,330.2 74.5 -26.2 60.8 39.6 1,957.4 44.8 2,002.2
Capital increase 43.0 1,273.5 1,316.5 1,316.5
Dividend payments -65.0 -65.0 -3.8 -68.8
Income and expenses recognised directly in equity 11.9 -3.6 -19.5 10.3 -11.9 -12.8 -1.1 -13.9
Change in the group of consolidated companies 26.7 -26.9 -0.2 -0.4 -0.6
Consolidated net profit / consolidated net profit for the year 198.5 198.5 0.9 199.4
Transactions under joint control -19.9 -19.9 -19.9
Other changes -0.7 -0.7 -4.4 -5.1
As of 31.12.2009 243.0 1,532.1 1,489.7 74.5 11.9 -29.8 41.3 10.3 0.8 3,373.8 36.0 3,409.8
1 In accordance with IAS 32.35 equity procurement costs must be charged directly against equity, not against earnings.
The capital reserve decreased by Euro 3.6 million in the reporting year.2 Previous year’s figures adjusted
Statement of changes in shareholders’ equity for the eWe Group
92 EWE Annual Report 2009

EUR million
Subscribed capital of the
eWe Group
Capital reserve of the
eWe Group ReTAINeD eARNINGSAttributable to
eWe GroupMinority interests Total
Accumulated income Comprehensive other income
Revaluation reserve in
accordance with IFRS 3
Reserve for cash flow hedges
Cumulative translation differences
Measurement of pension provisions IFRS 5
Change from equi-ty valuation with-out effect on prof-
it and loss
As of 31.12.2007 200.0 282.1 1,165.9 7.4 72.6 48.6 1,776.6 5.5 1,782.1
Adjustment for first-time consolidation of associated companies 12.4 12.4 12.4
As of 1.1.2008 200.0 282.1 1,178.3 7.4 72.6 48.6 1,789.0 5.5 1,794.5
Dividend payments -65.0 -65.0 -0.1 -65.1
Income and expenses recognised directly in equity1 -3.6 74.5 -33.6 -11.8 -9.0 16.5 -14.2 2.3
Change in the group of consolidated companies 1.3 1.3 51.8 53.1
Consolidated net profit / consolidated net profit for the year 210.1 210.1 0.9 211.0
Transactions under joint control -20.7 -20.7 -20.7
Other changes 26.2 26.2 0.9 27.1
As of 31.12.20082 200.0 278.5 1,330.2 74.5 -26.2 60.8 39.6 1,957.4 44.8 2,002.2
Capital increase 43.0 1,273.5 1,316.5 1,316.5
Dividend payments -65.0 -65.0 -3.8 -68.8
Income and expenses recognised directly in equity 11.9 -3.6 -19.5 10.3 -11.9 -12.8 -1.1 -13.9
Change in the group of consolidated companies 26.7 -26.9 -0.2 -0.4 -0.6
Consolidated net profit / consolidated net profit for the year 198.5 198.5 0.9 199.4
Transactions under joint control -19.9 -19.9 -19.9
Other changes -0.7 -0.7 -4.4 -5.1
As of 31.12.2009 243.0 1,532.1 1,489.7 74.5 11.9 -29.8 41.3 10.3 0.8 3,373.8 36.0 3,409.8
1 In accordance with IAS 32.35 equity procurement costs must be charged directly against equity, not against earnings.
The capital reserve decreased by Euro 3.6 million in the reporting year.2 Previous year’s figures adjusted
93The e3-programme Management Investor Relations Social Responsibility Group Management Report Consolidated Financial Statements

EUR million 2009 2008
eBIT¹ 414.0 426.1
Depreciation, amortisation and impairment¹ 432.7 320.1
Reversals of depreciation, amortisation and impairment -0.2 -
Reversal of construction subsidies -41.5 -38.7
Interest paid -130.8 -99.7
Interest received 59.2 15.8
Income tax payments / rebates -68.2 -96.1
Net gain / loss on disposal of non-current assets 7.0 0.2
Non-cash foreign currency gains / losses - 0.6
Non-cash changes in provisions 26.2 -
Income / loss from companies accounted for under the equity method1 -100.6 -39.3
Net non-cash gain / loss from derivative financial instruments -6.5 22.5
Other non-cash income and expenses 15.1 2.9
Changes in inventories -42.4 45.6
Changes in receivables and other assets 47.0 -226.5
Changes in liabilities 36.2 48.5
Cash flow from operating activities 647.2 382.0
Construction subsidies received 72.0 29.7
Proceeds from disposal of intangible assets - 5.5 -
Expenditure for investments in intangible assets -16.5 -18.6
Proceeds from disposal of property, plant and equipment 11.5 17.8
Expenditure for investments in property, plant and equipment -548.3 -428.0
Proceeds from disposal of financial assets 27.1 3.4
Expenditure for investment in financial assets -133.9 -43.1
Expenditure for investment in interests in fully consolidated companies -743.1 -387.9
Cash flow from investing activities -1,336.7 - 826.7
Proceeds from issuing equity instruments 1,316.5 - 3.6
Dividend payments to shareholders and minority shareholders -68.8 -65.1
Proceeds from assumption of financial liabilities 834.0 1,440.6
Repayment of non-current financial liabilities -1,011.7 -824.6
Other net cash flow from / for financing activities 1.7 -
Cash flow from financing activities 1,071.7 547.3
Change in cash and cash equivalents 382.2 102.6
Change in cash and cash equivalents due to changes in exchange rates and in the group of consolidated companies -0.3 10.3
Cash and cash equivalents at the beginning of the period 223.0 110.1
Cash and cash equivalents at the end of the reporting period 604.9 223.0
1 Previous year’s figures adjusted
Cash flow statement for the eWe GroupSource of funds (+), use of funds (-)
94 EWE Annual Report 2009

Notes to the consolidated financial statements for the eWe Group
Basic information on the company
EWE Aktiengesellschaft (known in the following as “the company” or “EWE AG”) and its subsidiaries (in the following “the EWE Group”) supply energy (in particular electricity and gas), water and also provide information technology and telecommunications services. It operates in the Ems / Weser / Elbe region of Germany as well as in Lower Saxony and Bremen and its gas operations extend to Eastern Germany, Poland and Turkey. Electricity and gas are predominantly purchased from third parties.
EWE’s registered offices are at Tirpitzstraße 39 in 26122 Oldenburg, Germany. The company is regis-tered in the Commercial Register of the Oldenburg District Court under the number HRB 33.
Basis of preparation
Presentation of the consolidated financial statements
EWE AG publishes its consolidated financial statements pursuant to Section 315a para. 1 of the German Commercial Code (HGB) as of 31 December 2009 in accordance with the binding International Financial Reporting Standards (IFRS) and Interpretations issued by the International Accounting Standards Board (IASB), London, as of 31 December 2009, as adopted by the European Union. Other requirements of the German Commercial Code have also been taken into account.
These consolidated financial statements were approved by the Board of Management for presentation to the Supervisory Board on 12 March 2010.
Previous year’s figures adjusted
In accordance with IFRS 3, EWE AG has taken the opportunity of finalising the allocation of the ac-quisition costs for the Turkish subsidiaries Bursagaz Bursa Şehiriçi Doğalgaz Dağitim Ticaret ve Taah-hüt A.Ş. (Bursagaz), Bursa, Turkey, and Kayserigaz Kayseri Doğalgaz Dağitim Pazarlama ve Ticaret A.Ş. (Kayserigaz), Kayseri, Turkey, within one year. The preliminary figures as of 31 December 2008 have therefore been adjusted accordingly.
The figures for MVR Müllverwertung Rugenberger Damm GmbH & Co. KG (MVR), Hamburg, were ret-roactively adjusted as of 1 January 2008 in accordance with IAS 8. First-time accounting for the shares was performed using the equity method. This resulted in a reclassification of the shares from other shareholdings to investments accounted for under the equity method.
The result of investments accounted for under the equity method was adjusted in the income state-ment. As a result of this retroactive restatement, the financial statements have been extended to in-clude an opening balance sheet for the comparable period (known as a three-column balance sheet).
95The e3-programme Management Investor Relations Social Responsibility Group Management Report Consolidated Financial Statements

The IASB has adopted amendments to existing IFRS as well as new IFRS that came into effect on 1 January 2009. The following standards and interpretations have been applied for the first time in the reporting year and have affected EWE’s consolidated financial statements:
IAS 1 “Presentation of Financial Statements” (December 2008): The revised IAS 1 replaces the in-come statement as a separate component of financial statements by the statement of comprehensive income. Comprehensive income includes expenses and income recognised in the income statement as well as expenses and income recognised in other comprehensive income.
An important change is the strict separation and corresponding presentation of changes in equity between those affecting the owners and those not affecting the owners.
EWE AG makes use of the option of presenting two separate statements.
For each component of other comprehensive income the amounts reclassified and the income taxes relating to them are to be disclosed in the Notes or within the statement of comprehensive income.
In the event of changes in accounting or measurement methods, restatements or reclassifications of individual items, the balance sheet is also to be extended to include an opening balance sheet for the comparable period.
The amendment to the standard has no effect on the earnings, assets and financial position, but it does affect the presentation of the financial statements (three-column balance sheet, statement of comprehensive income and two-statement approach).
The amendments to IFRS 7 “Improved Disclosures on Financial Instruments” (November 2009) provide for additional disclosures on financial instruments to be made in the Notes. In particular, what is known as a “fair value hierarchy” is to show the extent to which fair values of financial instruments have been measured using published market prices or non-observable internal company data. The re-quired disclosures on liquidity risks from financial instruments have also been clarified and expanded.
The amendments are effective for financial years beginning on or after 1 January 2009 and earlier application is permitted. The amendments result in additional Notes to EWE’s consolidated financial statements.
All the following pronouncements or amendments to pronouncements by the IASB that are applicable for the first time in the financial year 2009 had no or no significant effects on the consolidated financial statements for EWE.
IAS 23 “Borrowing Costs” (December 2008): The main amendment was to abolish the alternative of recognising borrowing costs which are directly attributable to the acquisition or production of so-called qualifying assets directly as an expense. Hereafter, companies must capitalise these borrowing costs as costs of acquisition or production. The standard applies to borrowing costs relating to qualifying assets which are initially capitalised on or after 1 January 2009.
The amendment to IAS 23 could cause the EWE Group to incur additional acquisition or production costs during qualifying investment projects. The amendment primarily affects net interest income /expense and depreciation and amortisation. In the financial year 2009 there were no significant bor-rowing costs requiring capitalisation.
96 EWE Annual Report 2009

Amendment to IAS 32 and IAS 1 “Puttable Instruments and Obligations Arising on Liquidation” (January 2009) contains altered regulations for differentiating between equity and borrowings. The amendment to the standard permits, for example, the reclassification of puttable instruments as equity under certain conditions. The amendments to IAS 1 will lead to additional disclosures in the Notes.
The amended rules are effective for financial years beginning on or after 1 January 2009. Their first-time application had no impact on the EWE Group.
Amendments to standards as part of the 2008 annual improvement process (January 2009): The IASB published various minor amendments to IFRS as part of its first annual collection of standards. The majority of the rules are applicable to reporting periods beginning on or after 1 January 2009. The first-time application of these amendments had no significant impact on the EWE consolidated finan-cial statements.
Amendments to IFRS 1 and IAS 27 “Cost of an Investment in a Subsidiary, Jointly Controlled entity or Associate” (January 2009): The amendment to IAS 27 mainly contains the elimination of the definition of the acquisition cost method as well as rules regarding the distribution of dividends and group reorganisation. The amendments are effective for financial years beginning on or after 1 January 2009 and earlier application is permitted. The amendments to IFRS 1 and IAS 27 have no effect on the consolidated financial statements of the EWE Group.
Amendment to IFRS 2 “Share-based Payment: Vesting Conditions and Cancellations” (December 2008): The amendment clarifies the definition and treatment of vesting conditions, non-vesting conditions and cancellations of a commitment by a party other than the company itself. The amendments are effective for financial years beginning on or after 1 January 2009. The application of the standard will not affect EWE’s consolidated financial statements as the EWE Group has no share-based remuneration schemes.
IFRS 8 “Segment Reporting” contains new rules on a company’s reporting for its reportable segments. It requires segment reporting to be prepared under the so-called management approach.
The standard is effective for financial years beginning on or after 1 January 2009. The first-time application of IFRS 8 did not result in any changes to the segment structure.
IFRIC 13 “Customer Loyalty Programmes” (December 2008) governs the accounting treatment of customer bonus schemes operated by manufacturers or service providers themselves or by third parties.
IFRIC 13 is effective retroactively for financial years beginning on or after 1 January 2009. Its first-time application had no significant impact on the EWE consolidated financial statements.
IFRIC 14 “IAS 19 – The Limit on a Defined Benefit Asset, Minimum Funding Requirements and their Interaction” (December 2008) provides guidance on determining the limit of a pension fund surplus which can be recognised under IAS 19 as a defined-benefit asset. It also explains how statuto-ry or contractual minimum funding requirements can affect plan assets and liabilities. Under IFRIC 14, the employer need not recognise any further obligations unless the amounts payable under the minimum funding requirements are not repayable to the company.
IFRIC 14 is effective for financial years beginning on or after 1 January 2009. The first-time application of IFRIC 14 did not have any effect on EWE’s consolidated financial statements.
97The e3-programme Management Investor Relations Social Responsibility Group Management Report Consolidated Financial Statements

The following standard and the following interpretation have been amended or revised and have been applied voluntarily in advance by the EWE Group:
IFRS 3 “Business Combinations” (revised January 2008) contains amended requirements for accounting for company transactions. The main amendments are as follows:
Transaction costs in connection with an acquisition are to be recognised as an expense.•
Contingent consideration is measured at fair value at the acquisition date.•
In the event of step acquisitions, the existing shares held in the company acquired are revalued •through profit or loss at the time control is gained.
A separately exercisable option for measuring minority interests exists for each acquisition. •Minority interests can be measured at fair value or with their share of identifiable net assets.
IFRS 3 (revised 2008), IFRS 3R for short, is effective for financial years beginning on or after 1 July 2009. The standard can nevertheless be applied in advance to financial years beginning on or after 30 June 2007.
In the reporting year IFRS 3R was applied in advance to the step acquisition of swb AG and the acqui-sition of EWE Doğalgaz.
IFRIC 9 “Reassessment of embedded Derivatives”: According to IFRIC 9, the assessment of whether an embedded derivative is to be separated from the host contract takes place when the company becomes a party to the contract. A reassessment is only necessary if payments under the contract change significantly as a result of an amendment to the contract.
A decision was taken in response to IFRS 3R to exclude explicitly from the scope of IFRIC 9 not only contracts acquired in the course of a business combination as defined in IFRS 3R, but also contracts that are transferred in the course of business combinations involving companies or business opera-tions under joint control or when joint ventures are established.
The amendments are effective for financial years beginning on or after 1 July 2009 and earlier appli-cation is permitted. To the extent that IFRS 3R is applied in advance, the amendments to IFRIC 9 apply to this earlier period as well.
The IASB and the International Financial Reporting Interpretations Committee (IFRIC) have amended or adopted additional standards and interpretations which are not yet binding for the financial year 2009 and which the EWE Group has not applied voluntarily. These are as follows:
IAS 24 “Related Party Disclosures” (November 2009) clarifies the definition of a related party. An-other important aspect of the revision is the introduction of exemptions for companies that are controlled, jointly managed or under the significant influence of the public sector (“government-related entities”).
The revised standard is effective for financial years beginning on or after 1 January 2011. The EU has not yet endorsed it for application in Europe. The effects of the amendment to the standard on EWE’s consolidated financial statements are currently under review.
98 EWE Annual Report 2009

IAS 27 “Consolidated and Separate Financial Statements under IFRS” (January 2008): In the revised version of IAS 27 the IASB amended in particular the rules on accounting for transactions with non-controlling owners of a group. Transactions by which a parent company alters its stake in a subsidiary without losing control are in future to be treated as equity transactions without effect on profit or loss. New rules also apply to the accounting treatment of a loss of controlling influence over a subsidiary. The standard stipulates how a deconsolidation gain is calculated and how a remaining equity interest in a former subsidiary is to be measured following a partial disposal.
The revised version of IAS 27 is applicable at the latest for financial years beginning on or after 1 July 2009. The effects of the revised standard on EWE’s consolidated financial statements are currently under review.
IAS 32 “Financial Instruments: Presentation” – classification of rights issues (December 2009):The revision of IAS 32 means that if a company grants subscription rights, options or warrants for a fixed number of its own shares at a fixed currency amount in a currency other than its functional cur-rency, these are to be classified as equity rather than as financial liabilities as previously.
The amendments are effective for financial years beginning on or after 1 February 2010. The first-time application is not expected to have any effect on the consolidated financial statements of the EWE Group.
Amendments to IAS 39 “Financial Instruments: Recognition and Measurement” – eligible hedged items in a hedging relationship (September 2009): The revised version of IAS 39 emphasises that inflation risks can only be hedged by hedging transac-tions if payments are directly linked to an inflation index. It is also made clear that it is not generally possible to hedge one-sided risks effectively by an entire option.
The amendments are effective retroactively for financial years beginning on or after 1 July 2009. The effects of applying this amendment to IAS 39 for the first time on EWE’s consolidated financial state-ments are currently under review.
Amendments to IAS 39 “Reclassification of Financial Assets: Effective Date and Transition” (September 2009): This amendment stipulates that reclassifications made on or after 1 November 2008 are effective from the date of reclassification. Reclassifications made before 1 November 2008 can be reclassified with effect from 1 July 2008 or later. The reclassification regulations cannot be applied to any date before 1 July 2008. The amendments are not expected to have an effect on the consolidated financial statements of the EWE Group.
Amendments to standards as part of the 2009 annual improvement process (revised April 2009): The IASB has issued a further collection of amendments to standards as part of its annual improve-ment process. They include a large number of minor amendments intended to illustrate the rules and remove inconsistencies. The overwhelming majority of amendments is applicable to financial years beginning on or after 1 January 2010. Early application is possible. The amendments have not yet been endorsed by the EU as European law. The EWE Group is currently reviewing the effects of applying the individual amendments to the consolidated financial statements for the first time.
99The e3-programme Management Investor Relations Social Responsibility Group Management Report Consolidated Financial Statements

IFRS 1 “First-time Adoption of International Financial Reporting Standards” (November 2008):The structure of IFRS 1 was revised in order to make it more understandable and easier to integrate subsequent amendments. There were no significant amendments to its contents.
The revised standard is effective for financial years beginning on or after 1 January 2010. IFRS 1 does not apply to the EWE Group as the first-time adoption of IFRS has already taken place.
IFRS 1 “Additional exemptions for First-time Adopters” (July 2009): The amendments to IFRS 1 introduce additional exceptions to the rule that all applicable standards and interpretations must be applied retroactively as of the reporting date of the first IFRS financial statements. These relate to companies in the oil and gas industry that used full-cost valuations at the time they switched to IFRS and to first-time adopters of IFRS applying the transitional provisions of IFRIC 4.
The amendments are effective for financial years beginning on or after 1 January 2010. The EU has not yet endorsed the amendments for European law. Applying the standard will not have any effect on EWE’s consolidated financial statements.
Amendment to IFRS 2 “Group Cash-settled Share-based Payment Transactions” (June 2009):It is made clear that a company receiving goods or services as part of a share-based payment trans-action has to account for those goods or services. This applies irrespectively of which company in the group settles the transaction and by which means settlement takes place.
The amendments are effective retroactively for financial years beginning on or after 1 January 2010. The amendments have not yet been endorsed by the EU as European law. Applying the standard is not expected to have any effect on the EWE consolidated financial statements.
IFRS 9 “Financial Instruments” (November 2009): This standard is part of the project for a successor to IAS 39. IFRS 9 deals with the classification and measurement of financial instruments. It also revises the rules on impairment and hedging relationships.
The amendments are effective retroactively for financial years beginning on or after 1 January 2013. Early application is possible. The amendments have not yet been endorsed by the EU as European law.
The effects of the amendment to the standard on EWE’s consolidated financial statements are currently under review.
The amendment to IFRIC 9 and IAS 39 “Embedded Derivatives” (December 2009) makes it clear that if financial assets are reclassified from the category “at fair value through profit or loss” to the category “at amortised cost”, an assessment must be made as to whether an embedded derivative needs to be separated from a host contract and accounted for separately. If separate recognition is necessary but separate measurement of the embedded derivative is not possible, the financial asset may not be re-classified.
The amendments are effective retroactively for financial years ending on or after 30 June 2009. The effects of the application of the new regulations on the consolidated financial statements of EWE Group are currently under review.
100 EWE Annual Report 2009

IFRIC 12 “Service Concession Arrangements” (March 2009) governs the accounting treatment of agreements by which a government or other public-sector institution awards contracts (service con-cessions) to private companies to provide public services. To provide the services, the private company uses infrastructure which remains public property. The private company is usually responsible for build-ing, operating and maintaining the infrastructure.
IFRIC 12 is effective for financial years beginning on or after 30 March 2009. The amendments are not expected to have a significant effect on the consolidated financial statements of the EWE Group.
IFRIC 14 “Prepayments of Existing Minimum Funding Requirements”: The amendment to IFRIC 14 is relevant in those rare cases in which a company has minimum funding requirements and makes prepayments to meet these minimum funding requirements. The amendment allows companies to recognise the benefit of this prepayment as an asset.
The amendment to IFRIC 14 is binding as of 1 January 2011. The interpretation has not yet been adopt-ed by the EU as European law. The amendments are not expected to have an effect on the consolidat-ed financial statements of the EWE Group.
IFRIC 15 “Agreements for the Construction of Real Estate” (July 2009) provides guidance on how to determine whether an agreement for the construction of real estate falls within the scope of IAS 11 “Construction Contracts” or IAS 18 “Revenue” and, accordingly, when revenue from the con-struction should be recognised.
IFRIC 15 is binding for financial years beginning on or after 31 December 2009. The first-time application of the interpretation is not expected to have any significant effect on the consolidated financial state-ments of the EWE Group.
IFRIC 16 “Hedges of a Net Investment in a Foreign Operation” (June 2009) clarifies grey areas in connection with currency hedging for a foreign operation. The interpretation lays down in particular what risks can be hedged, which group companies can hold the hedging instrument and the accounting treatment in the event that the foreign entity is disposed of.
IFRIC 16 is effective for financial years beginning on or after 1 July 2009. The effects of applying IFRIC 16 for the first time on EWE’s consolidated financial statements are currently under review.
IFRIC 17 “Distributions of Non-cash Assets to Owners” (November 2009) deals with issues related to non-cash dividends for shareholders. Among other issues, it regulates when a dividend payable should be recognised and measured. In addition, it results in further disclosures in the Notes.
The interpretation is effective for financial years beginning on or after 1 November 2009. First-time application of IFRIC 17 is not expected to have any effect on the consolidated financial statements of the EWE Group.
IFRIC 18 “Transfers of Assets from Customers” deals among other things with cases in which a com-pany receives an item of property, plant and equipment from a customer (or the funds to produce or purchase an item of property, plant and equipment) in order to connect the customer to a network or to provide the customer with ongoing access to a supply of goods or services.
101The e3-programme Management Investor Relations Social Responsibility Group Management Report Consolidated Financial Statements

The interpretation is effective prospectively for transfers of assets from customers completed on or after 1 July 2009. The effects of applying IFRIC 18 for the first time on EWE’s consolidated financial statements are currently under review.
IFRIC 19 “Extinguishing Financial Liabilities with Equity Instruments” is relevant in the event that the renegotiated terms of a contract for a financial liability allow the debtor to extinguish all or part of the financial liability by issuing equity instruments (known as debt-for-equity swaps). The interpre-tation deals exclusively with the accounting for the debtor, i.e. the issuer of the equity instrument.
On condition that the creditor is an independent third party, the equity instruments are to be measured at fair value at the time of issue. If this cannot be reliably determined the equity instruments are to be measured at the fair value of the liability extinguished in part or in full.
IFRIC 19 is applicable to financial years beginning on or after 1 July 2010 and is to be applied retrospec-tively to the extent that fair value can be determined retroactively. The amendments have not yet been endorsed by the EU as European law. First-time application of IFRIC 19 is not expected to have any effect on the consolidated financial statements of the EWE Group.
The consolidated financial statements have been prepared based on depreciated or amortised cost except for certain financial instruments measured at fair value.
The financial year used by EWE AG and its main subsidiaries is the calendar year. The consolidated fi-nancial statements are prepared in euros. Unless otherwise stated, all amounts are in millions of euros (EUR million). The income statement and the balance sheet are presented separately, as are the state-ment of comprehensive income, the cash flow statement and the statement of changes in shareholders’ equity. Segment reporting is an integral part of the Notes.
Rounding may result in minor variations in totals and percentages in the consolidated financial state-ments.
To improve clarity of presentation, certain items have been condensed in the balance sheet and the in-come statement; these are disclosed separately and explained in the Notes.
The income statement has been prepared using the total cost method.
The consolidated financial statements and the Group management report for EWE AG for 2009 are published in the electronic version of the German Federal Gazette.
Group of consolidated companies
All subsidiaries are fully consolidated in the financial statements to the extent that the parent company can exercise control over their financial and operating policies within the meaning of IAS 27. In deter-mining whether a controlling influence can be exercised, the existence and effects of potential voting rights which can be exercised or converted at the present time are taken into account. Consolidation begins when the possibility of control begins and ceases when the possibility no longer exists.
Associated companies are companies in which the parent company exerts a significant influence over company policy and which are neither subsidiaries nor joint ventures. Associated companies are account-ed for in the consolidated financial statements using the equity method.
102 EWE Annual Report 2009

Shares in subsidiaries and associated companies which are of minor importance from an overall Group perspective are accounted for in accordance with IAS 39. This particularly relates to subsidiaries with-out own operations or with only a negligible amount of business.
In addition to EWE AG the consolidated financial statements include the following companies in which EWE AG directly or indirectly holds a majority of voting rights:
Name and registered officeEquity interest
in %
1 AOV IT.Services GmbH, Gütersloh4 50.07
2 BCC Business Communication Company GmbH, Brunswick4 100.00
3 Bremer Kommunikationstechnik GmbH, Bremen4 100.00
4 BTC Business Technology Consulting AG, Oldenburg 100.00
5 BTC IT Services GmbH, Oldenburg2, 4 100.00
6 Bursagaz Bursa Şehiriçi Doğalgaz Dağıtım Ticaret ve Taahhüt A.Ş., Bursa, Turkey4 80.00
7 EWE Doğalgaz Sanayi ve Ticaret A.Ş., (formerly Avrasya Enerji San. ve Tic A.Ş.), Istanbul, Turkey1, 4 100.00
8 EWE ENERGIA Sp. z o.o., Międzyrzecz, (formerly Media Odra Warta Sp. z o.o.), Poland4 99.98
9 EWE ENERjI ANONIM ŞIRKETI A.Ş., Istanbul, Turkey 100.00
10 EWE NETZ GmbH, Oldenburg 100.00
11 EWE Polska Sp. z o.o., Poznań, Poland 100.00
12 EWE TEL GmbH, Oldenburg 100.00
13 EWE WASSER GmbH, Cuxhaven 100.00
14 hmmh multimediahaus AG, Bremen4 100.00
15 Kayserigaz Kayseri Doğalgaz Dağıtım Pazarlama ve Ticaret A.Ş., Kayseri, Turkey4 80.00
16 nordcom Niedersachsen GmbH, Oldenburg3, 4 100.00
17 PRO Consult Management- und Systemberatung GmbH, Bad Homburg4 100.00
swb subgroup3
18 Bohn GmbH Energie- und Kraftwerkstechnik, Bremen5 100.00
19 swb AG, Bremen 100.00
20 swb Beleuchtung GmbH, Bremen5 100.00
21 swb Bremerhaven GmbH, Bremerhaven 100.00
22 swb CREA GmbH, Bremerhaven 100.00
23 swb Entsorgung GmbH, Bremen 100.00
24 swb Erzeugung GmbH & Co. KG, Bremen 100.00
25 swb Immobilien GmbH, Bremen 100.00
26 swb Messung und Abrechnung GmbH, Bremen 100.00
27 swb Netze Bremerhaven GmbH & Co. KG, Bremerhaven 100.00
28 swb Netze GmbH & Co. KG, Bremen 100.00
29 swb Services GmbH & Co. KG, Bremen 100.00
30 swb Vertrieb Bremen GmbH, Bremen 100.00
31 swb Vertrieb Bremerhaven GmbH & Co. KG, Bremerhaven 100.00
32 Windfarm Märkisch Linden GmbH & Co. KG, Kränzlin5 100.00
1 Included as fully consolidated companies in the 2009 consolidated financial statements for the first time as of 30.6.20092 Included as fully consolidated companies in the 2009 consolidated financial statements for the first time as of 1.7.20093 Included as fully consolidated companies in the 2009 consolidated financial statements for the first time as of 1.10.20094 Indirect equity investment of EWE AG5 Indirect equity investment of swb AG
103The e3-programme Management Investor Relations Social Responsibility Group Management Report Consolidated Financial Statements

The subsidiaries BTC Business Technology Consulting Sp. z o.o., Poznań, Poland, BTC Ekonum Bilişim Hizmetleri A.Ş., Istanbul, Turkey, and BTC (Schweiz) AG, Bern, Switzerland, were deconsolidated as of 1 January 2009.
nordcom Niedersachsen GmbH, Oldenburg, began operations in 2009 and was included in the group of consolidated companies for the first time as of 1 October 2009.
BTC IT Services GmbH, Oldenburg, was spun out of BTC Business Technology Consulting AG (BTC AG), Oldenburg, with effect from 1 July 2009.
With effect from 1 July 2009 Martens Antennen- und Kabelanlagen-Gesellschaft mbH (Martens), Hamburg, was merged with EWE TEL GmbH (EWE TEL), Oldenburg.
As of 1 November 2009 Kommunale Gasunion GmbH & Co. KG, Stuhr, was merged by way of legal succession with swb Vertrieb Bremen GmbH, Bremen.
Company acquisitions in 2008
In late October 2008 the fully consolidated subsidiary EWE ENERJI ANONIM ŞIRKETI A.Ş. (EWE ENERJI), Istanbul, Turkey, acquired a further 40.1 per cent of the shares in Bursagaz, having already acquired 39.9 per cent of the shares in April 2007.
The acquisition costs for the shares came to Euro 282.6 million. Of the purchase price, Euro 270.4 million was paid in cash. In addition to the cash payment the seller was also given a call option for 25 per cent of the shares. The option can still be exercised within the next three years. The fair value of the option amounted to Euro 12.2 million at the time of the acquisition.
As the acquisition date was so close to the reporting date, the allocation of the purchase price could not be finalised and so recognition in the consolidated financial statements as of 31 December 2008 was only provisional. The difference arising from the capital consolidation was therefore provisionally recognised in full as goodwill.
The necessary adjustments resulting from the final allocation of the purchase price are reflected in the present financial statements. This entails the capitalisation for Euro 276.1 million of the licence grant-ed by the Turkish regulation authority that allows Bursagaz to supply customers in the licensing area of Bursa until 2033. Goodwill therefore declined by the amount of the licence and the deferred tax li-abilities of Euro 55.2 million recognised on it. Goodwill reflects the expectation that the company will continue its business model even after 2033. As the fair value of the acquired licence went up in com-parison with the first purchase price allocation, the corresponding adjustment to the 39.9 per cent stake acquired in April 2007 has been recognised in other comprehensive income as a revaluation re-serve in accordance with IFRS 3 (2004).
The following table shows the fair values of the identifiable assets and liabilities of Bursagaz at the acquisition date in late October 2008 and the carrying amounts directly before the acquisition:
104 EWE Annual Report 2009

Bursagaz (acquisition date 31.10.2008)
in EUR ‘000 Carrying amountRecognised at
acquisition
Intangible assets 218 276,369
Property, plant and equipment 104,033 104,033
Other non-current assets 67 67
Current assets 55,259 55,259
Total assets 159,577 435,728
Non-current liabilities 35,592 90,822
Current liabilities 62,290 62,290
Total liabilities 97,882 153,112
Net assets 61,695 282,616
eWe’s equity interest in net assets 40.1 % 24,740 113,329
Acquisition costs 282,557
of which purchase price (270,372)
of which call option (12,185)
Goodwill 169,228
In late October 2008 EWE ENERJI acquired a further 40.1 per cent of the shares in Kayserigaz, having already acquired a 39.9 per cent stake in April 2008.
The purchase price for the first 39.9 per cent of the shares was Euro 49.0 million and was paid in cash. The purchase price for the additional 40.1 per cent of the shares was Euro 60.4 million and was also paid in cash. In addition to the cash payment the seller was also given a call option for 25 per cent of the shares. The option can still be exercised within the next three years. The fair value of the option amounted to Euro 2.7 million at the time of the acquisition.
As the acquisition date was so close to the reporting date, the allocation of the purchase price could not be finalised and so recognition in the consolidated financial statements as of 31 December 2008 was only provisional. The difference arising from the capital consolidation was therefore provisionally recognised in full as goodwill.
The necessary adjustments resulting from the final allocation of the purchase price are reflected in the present financial statements. This entails the capitalisation for Euro 58.8 million of the licence granted by the Turkish regulation authority that allows Kayserigaz to supply customers in the licensing area of Kayseri until 2033. Goodwill therefore declined by the amount of the licence and the deferred taxes of Euro 11.8 million recognised on it. Goodwill reflects the expectation that the company will continue its business model even after 2033.
105The e3-programme Management Investor Relations Social Responsibility Group Management Report Consolidated Financial Statements

The following table shows the fair values of the identifiable assets and liabilities of Kayserigaz at the acquisition dates in late April and late October 2008 and the carrying amounts directly before the acquisition:
Kayserigaz (acquisition date 30.4.2008)
in EUR ‘000 Carrying amountRecognised at
acquisition
Intangible assets 1,275 58,978
Property, plant and equipment 26,609 26,609
Other non-current assets 5,041 5,041
Current assets 10,580 10,580
Total assets 43,505 101,208
Non-current liabilities 37,762 49,302
Current liabilities 9,974 9,974
Total liabilities 47,736 59,276
Net assets -4,231 41,932
eWe’s equity interest in net assets 39.9 % -1,688 16,731
Acquisition costs 48,975
of which purchase price (48,975)
Goodwill 32,244
Kayserigaz (acquisition date 31.10.2008)
in EUR ‘000 Carrying amountRecognised at
acquisition
Intangible assets 188 58,955
Property, plant and equipment 40,536 40,536
Other non-current assets 496 496
Current assets 11,510 11,510
Total assets 52,730 111,497
Non-current liabilities 33,992 45,746
Current liabilities 23,111 23,111
Total liabilities 57,103 68,857
Net assets -4,373 42,640
eWe’s equity interest in net assets 40.1 % -1,754 17,099
Acquisition costs 63,141
of which purchase price (60,418)
of which call option (2,723)
Goodwill 46,042
106 EWE Annual Report 2009

The intangible assets recognised for the first time at the acquisition of Bursagaz and Kayserigaz include the licences, which are amortised over a period of 25 years.
Company acquisitions in 2009
As of 1 January 2009, the fully consolidated subsidiary EWE TEL acquired the remaining 25.1 per cent of the shares in the already fully consolidated company osnatel. The acquisition costs were Euro 24.7 million and were paid in cash. The goodwill of Euro 20.0 million arising from consolidation was set off in full against the capital reserve (entity method). osnatel was merged with EWE TEL effective as from 1 January 2009.
On 11 June 2009 EWE ENERJI purchased 100 per cent of the shares in Avrasya Enerji Sanayi ve Ticaret A.Ş., Istanbul, Turkey, which was renamed EWE Doğalgaz Sanayi ve Ticaret A.Ş. (EWE Doğalgaz), Istanbul, Turkey. EWE Doğalgaz is a wholesale gas trading company and supplies local utilities and industrial customers. The EWE Group is thereby extending its operations in Turkey to include gas wholesaling.
The purchase price of Euro 30.0 million for the shares was paid in cash. This corresponds to the fair value of the total assets acquired and liabilities assumed.
The following table shows the fair values of the identifiable assets and liabilities of EWE Doğalgaz at the acquisition date and the carrying amounts directly before the acquisition:
EWE Doğalgaz (acquisition date 11.6.2009)
in EUR ‘000 Carrying amountRecognised at
acquisition
Intangible assets 21 21
Current assets 1,140 1,140
Total assets 1,161 1,161
Current liabilities 8 8
Total liabilities 8 8
Net assets 1,153 1,153
eWe’s equity interest in net assets 100.0 % 1,153 1,153
Acquisition costs 30,022
of which purchase price (30,022)
Goodwill 28,869
The goodwill of Euro 28.9 million is a bonus for market entry into a new business area.
The fair value of the receivables as of the acquisition date is Euro 22,000, which corresponds to their carrying amount and gross nominal value. The receivables have not been written down and are con-sidered recoverable.
Since the acquisition date EWE Doğalgaz has contributed sales of Euro 32.9 million and earnings of Euro 1.0 million. The company has been operating since mid-June 2009.
107The e3-programme Management Investor Relations Social Responsibility Group Management Report Consolidated Financial Statements

On 21 October 2009 EWE AG acquired a further 51 per cent of the shares in swb AG, Bremen (swb), thereby increasing its stake to 100 per cent less one share.
The activities of swb and its subsidiaries are focused on providing energy and water services, particularly on supplying Bremen and Bremerhaven and the surrounding areas with energy and water. EWE AG acquired swb because its business model complements the operations of EWE AG. In addition to gen-erating its own electricity, swb has experience in wastewater and district heating as well as in building and servicing urban infrastructure, while EWE AG contributes expertise in regional utility services, gas storage and in developing renewable energies.
The acquisition of the remaining 51 per cent of the shares and transition to full consolidation constitutes a step acquisition. The fair value of the 49 per cent stake held previously was Euro 571.8 million on the acquisition date and corresponds to the carrying amount.
As the acquisition date is so close to the reporting date the purchase price allocation has not yet been finalised and is therefore provisional.
The following table shows the fair values of the identifiable assets and liabilities of swb at the acquisition date and the carrying amounts directly before the acquisition:
swb (acquisition date 21.10.2009)
EUR million Carrying amountRecognised at
acquisition
Intangible assets 63.5 589.8
Property, plant and equipment 1,090.9 1,233.8
Other non-current assets 382.5 382.5
Current assets 369.1 369.1
Total assets 1,906.0 2,575.2
Non-current liabilities
Borrowings 241.7 295.4
Provisions 546.2 544.9
Deferred tax liabilities 35.7 221.4
Miscellaneous borrowings 124.7 131.7
Total non-current liabilities 948.3 1,193.4
Current liabilities
Borrowings 277.9 289.5
Trade payables 79.9 79.9
Miscellaneous borrowings 139.1 185.3
Total current liabilities 496.9 554.7
Total liabilities 1,445.2 1,748.1
Net assets 460.8 827.1
eWe’s equity interest in net assets 100.0 % 827.1
Acquisition costs 1,278.2
Goodwill 451.1
108 EWE Annual Report 2009

The intangible assets recognised at the acquisition date mainly consist of the swb brand (Euro 95.9 million), customer-related intangible assets (Euro 81.6 million) and contract-based intangible assets (Euro 351.6 million), which primarily result from concession agreements (Euro 292.3 million). The brand and the concession agreements have indefinite useful lives. The contract-based intangible assets have terms of 7 to 17 years.
Goodwill of Euro 451.1 million primarily includes synergies in the areas of generation and waste disposal.
The fair value of income tax receivables is Euro 27.5 million, which corresponds to the gross nominal amount. The fair value of trade receivables is Euro 110.7 million, which corresponds to the gross nominal amount. The fair value of other receivables is Euro 33.7 million, which corresponds to the gross nominal amount. None of the receivables have been written down and the full amount is considered recoverable.
A contingent liability with a fair value of Euro 7 million on the acquisition date exists for the surplus revenue absorption in connection with the regulation of network fees by the German Federal Network Agency.
Certain groups of employees are obligatorily insured with the state insurance agency Versicherungs-anstalt des Bundes und der Länder. In accordance with IAS 19 this contingent liability is not recognised.
Since the acquisition date swb has contributed sales of Euro 298.7 million and earnings of Euro 31.5 million. Had the merger taken place at the beginning of the year, sales in the EWE Group would have been Euro 1,147.9 million higher and the consolidated net profit for the period Euro 39.0 million higher, notwithstanding the fact that the purchase price allocation could not have been continued hypothetically for the whole calendar year 2009.
The acquisition costs for the purchase of the additional 51 per cent stake came to Euro 706.4 million, of which Euro 698.4 was paid in cash. EWE AG assumes that the town of Bielefeld will not exercise its option to sell swb’s 49.9 per cent interest in Stadtwerke Bielefeld GmbH. This means that the purchase price will go up by Euro 8.0 million, which was taken into account at the time of the acquisition.
Transaction costs of Euro 4.1 million were recognised in the income statement as other operating expenses.
The following associated companies are accounted for under the equity method in EWE’s consolidated financial statements:
109The e3-programme Management Investor Relations Social Responsibility Group Management Report Consolidated Financial Statements

Investments accounted for under the equity method as at 31.12.2009
Name and registered officeEquity interest
in %
1 Aequamus GmbH, Bremen1, 2 33.33
2 DOTI Deutsche Offshore-Testfeld- und Infrastruktur-GmbH & Co. KG, Oldenburg 47.50
3 htp GmbH, Hanover 50.00
4 MVR Müllverwertung Rugenberger Damm GmbH & Co. KG, Hamburg 20.00
5 swb AG, Bremen4 49.00
6 VNG – Verbundnetz Gas Aktiengesellschaft, Leipzig5 47.90
swb subgroup
7 swb Weserwind GmbH & Co.v KG, Bremen1, 3 50.00
8 Hansewasser Ver- und Entsorgungs-GmbH, Bremen1 51.00
9 hanseWasser Bremen GmbH, Bremen1, 3 38.20
10 Stadtwerke Bielefeld GmbH, Bielefeld1 49.90
1 Accounted for under the equity method for the first time2 Indirect equity investment of EWE AG3 Indirect equity investment of swb AG4 Until 30.9.20095 Reclassified in the reporting year to non-current assets held for sale
Aequamus GmbH, Bremen, began operations in 2009 and was included in the group of consolidated companies for the first time as of 1 April 2009.
An overview of significant equity investments is provided separately in Note 35.
Principles of consolidation
Consolidation takes place on the basis of the financial statements for EWE AG and the fully consolidated subsidiaries as of 31 December 2009, which are prepared using uniform accounting principles.
From financial year 2009 onwards, business combinations have been accounted for using the purchase method in line with IFRS 3R. The acquisition costs (consideration transferred) are measured at fair value at the acquisition date and also include contingent acquisition costs.
Capital consolidation is carried out by setting off the acquisition costs for each subsidiary against the pro rata remeasured equity of the subsidiary at the acquisition date. All identifiable assets, liabilities and contingent liabilities are measured at fair value with the exception of deferred taxes, pension ob-ligations and non-current assets held for sale. The relevant fair values are those at the time when control was acquired. Income and expenses of a subsidiary are included in the consolidated financial statements from the acquisition date. The amount by which the acquisition costs exceed the Group’s interest in the fair value of the net assets is capitalised as goodwill. If the acquisition costs are lower than the fair value of the net assets acquired, the negative difference is recognised directly in the income statement.
Positive differences arising on the acquisition of minority interests are set off against other retained earnings without effect on profit and loss and are not capitalised as goodwill (transaction under joint control, entity method).
110 EWE Annual Report 2009

Receivables, liabilities, expenses and income between consolidated companies are eliminated in full in accordance with IAS 27.
Material interim results from intra-Group transactions are eliminated in full and deferred taxes recog-nised as necessary.
The Group’s equity interests in associated companies are accounted for under the equity method, ap-plying the accounting standards in use at the EWE Group from the date of acquisition; the companies are therefore shown as “investments accounted for under the equity method”.
Currency translation
The items in the individual financial statements of each consolidated subsidiary are measured in the currency of the primary economic environment in which the company operates (functional currency). The functional currency of foreign subsidiaries is the respective national currency.
Transactions in currencies other than the functional currency are recognised at the exchange rate pre-vailing on the transaction date. Monetary assets and liabilities in foreign currencies are measured at the exchange rate prevailing on each reporting date. Non-monetary items in foreign currencies are recognised on the balance sheet date at the exchange rate prevailing on the date of initial recognition. Exchange rate gains and losses from the measurement of monetary balance sheet items in foreign currencies up to the reporting date are recognised in the income statement.
In the course of consolidation, the assets and liabilities of foreign operations are translated into euros, the functional currency of EWE AG, at the exchange rate on the balance sheet date. Items of income and expense are translated at average rates for the period. Any currency translation differences are dis-closed separately in other comprehensive income as differences from currency translation. The currency translation differences are reversed through profit and loss in the period in which the companies are de-consolidated.
Goodwill arising on the acquisition of foreign subsidiaries and adjustments to fair value are treated as assets and liabilities of the independent subsidiary and translated at the exchange rate on the balance sheet date.
The following exchange rates were used to translate individual financial statements in foreign currencies:
1 Euro Spot rate Average rate
31.12.2009 31.12.2008 2009 2008
Polish złoty (PLN) 4.13 4.15 4.34 3.49
New Turkish lira (TRy) 2.16 2.15 2.17 1.89
111The e3-programme Management Investor Relations Social Responsibility Group Management Report Consolidated Financial Statements

Principles of accounting and valuation
Revenues from the sale of goods and services are recognised when the substantial risks and rewards pass to the buyer. When supplying customers with electricity and gas this is when the flow rate has been metered. As meter readings cannot be taken on the balance sheet date, some of the sales reve-nues are recognised on the basis of statistical calculations.
The electricity and energy taxes (natural gas taxes) paid by the companies in the Group are deducted from recognised sales revenue.
Telecommunications services and IT services provided by the EWE Group are invoiced promptly in regular intervals. Sales revenue is recognised when the services are provided.
Revenue from production contracts (Euro 17.3 million in the reporting year, previous year: Euro 0.8 million) is recognised under the percentage of completion method. The percentage of completion is determined by the ratio of costs incurred to the total costs estimated for the contract at the balance sheet date. Receivables from production contracts are composed of the net amounts of
costs incurred plus recognised profits, less•
total recognised losses and interim invoiced amounts•
for all production contracts for which the costs incurred plus recognised profits (less recognised losses) exceed the amounts of interim invoices. If the interim invoiced amounts exceed the costs incurred plus recognised profits (less recognised losses), the amount is recognised under “other current liabilities”.
If it is likely that total costs will exceed the total income from a production contract, the imminent losses are recognised immediately as an expense by deducting them from the balance of the production contract. Imminent losses only include losses still anticipated on the balance sheet date.
Customers’ construction subsidies are reversed pro rata temporis over the useful life of mains con-nections and recognised in sales.
Interest on borrowings that can be directly attributed to the acquisition or production of qualifying assets are capitalised as acquisition or production costs.
Income taxes include actual income taxes payable under national tax legislation and deferred taxes.
In the course of an acquisition, the acquisition costs for the shares in the company are compared with the fair value of the acquired assets and liabilities at the time of acquisition. If the acquisition costs exceed the net assets of the acquired stake in the company, the excess is recognised as goodwill. This has an indefinite useful life and is not amortised. If this results in negative goodwill, it is recognised immediately in profit and loss after having examined the purchase price allocation again as necessary. An impairment test is carried out for positive goodwill at least annually or whenever there is indication of impairment. Impairment losses cannot be reversed at a later time.
Separately acquired other intangible assets are recognised at cost. They are amortised over their use-ful lives on a straight-line basis. Internally generated other intangible assets are recognised at produc-tion cost if economic benefits are likely to accrue to the Group and they can be reliably determined. Production cost consists of the direct costs and the directly attributable share of overhead costs.
112 EWE Annual Report 2009

Research costs are expensed in the relevant period. Development costs in the Group do not currently meet the recognition requirements of IAS 38 and are therefore not capitalised.
As part of the second round of the European emissions trading system and in line with the second national allocation plan, the subgroup swb receives annual emissions rights free of charge until 2012. In exchange, the Group is obliged to return a quantity of emissions rights equivalent to its emissions the previous year.
Emissions rights (CO2 certificates) are recognised as intangible assets under other current receivables. The emissions rights allocated to the subgroup swb free of charge are recognised at a value of Euro 0.0 at the time they are issued. Purchased certificates are initially recognised at their acquisition cost and subsequently measured at amortised cost, whereby a comparison is always made with market prices. A liability is recognised for those emissions rights held on the reporting date that are to be returned the following year based on actual use. They are measured at the amortised cost of existing rights. If there is a shortfall of emissions certificates on the reporting date a provision is made for the market value of the emissions rights that still have to be purchased.
Acquired or internally generated intangible assets may have either a finite or an indefinite useful life. Intangible assets with an indefinite useful life are not amortised; instead, an impairment test is carried out annually and whenever there is indication of impairment. Intangible assets that are amortised are tested for impairment if events or indications suggest that the recoverable amount from an asset or a cash-generating unit could be lower than its carrying amount. The recoverable amount is to be deter-mined for each individual asset, unless the asset does not generate cash inflows which are largely in-dependent of those from other assets or groups of assets.
The impairment test involves estimating the recoverable amount for the relevant asset. If an estimate cannot be made and the asset does not generate cash inflows largely independent of those of other assets, the recoverable amount is instead estimated for the cash-generating unit to which the asset belongs. An impairment loss is determined by comparing the recoverable amount of a cash-generating unit with its carrying amount. If the carrying amount is higher an impairment loss is recognised for the difference with effect on net income. If the impairment loss relates to goodwill attributed to a cash- generating unit, the impairment loss is first recognised for the goodwill. If the amount of the impair-ment loss is greater it is then allocated to each individual asset in the unit based on their respective car-rying amounts.
In the 2009 financial year, the financial crisis is considered an indication of possible impairment. EWE AG has therefore carried out an impairment test for all the cash-generating units in the following table. The cash-generating units also represent the lowest level at which goodwill is monitored.
113The e3-programme Management Investor Relations Social Responsibility Group Management Report Consolidated Financial Statements

Cash-generating unitsValuation
methodDiscount factors2
Goodwill3 (in Euro m)
Goodwill4 (in Euro m)
Brand3 (in Euro m)
Brand4 (in Euro m)
Concession agreements3
(in Euro m)
Energy business area (total) DCF 6.42 % / 5.42 % 220.8 -
Poland subgroup1 DCF 6.98 % / 5.98 % - -
Bursagaz1 DCF 9.58 % / 8.58 % 144.3 -
Kayserigaz1 DCF 9.58 % / 8.58 % 47.6 -
Doğalgaz1 DCF 9.58 % / 8.58 % 28.9 -
Network business area DCF 5.29 % / 4.29 % - -
swb business area DCF 6.42 % / 5.42 % 451.1 49.5 95.9 292.3
TC unit DCF 6.24 % / 5.24 % 46.8 19.1 3.8 1.7
IT unit DCF 9.36 % / 8.36 % 8.3 -
1 Attributable to the Energy business area2 Extrapolated cash flow is based on an assumed drop in growth of 1.0 per cent3 For fully consolidated companies4 Included in equity value of shares in associated companies
As at 31 December 2009 the total goodwill attributable to the fully consolidated companies amounted to Euro 727.0 million (previous year: Euro 336.6 million). In the previous year the amount was attribut-ed to the cash-generating units Bursagaz (Euro 206.9 million), Kayserigaz (Euro 72.6 million) and ICT (Euro 57.1 million). Goodwill attributable to companies accounted for under the equity method amounted to Euro 68.6 million (previous year: Euro 301.6 million).
Trademarks of fully consolidated companies are held at Euro 95.9 million for the swb business area and Euro 3.8 million for the TC unit (previous year: Euro 3.8 million). Trademarks of shareholdings accounted for under the equity method are held at Euro 1.7 million (previous year: Euro 11.8 million).
The recoverable amount is calculated by calculating the fair value less costs to sell. For this, the present values of the future cash flows which are expected to be produced by a cash-generating unit were ag-gregated. The sum of the present values (enterprise value) was reduced by 1.0 per cent to take the costs to sell into account. The resulting total is the recoverable amount of the fully consolidated units. The en-terprise value was reduced by the net financial liabilities as at the reporting date of 31 December 2009 for the impairment test of associated companies accounted for under the equity method. This provides the equity value. The proportional equity value corresponding to the equity investment amount was sub-sequently calculated. This is taken as the recoverable amount of the companies accounted for under the equity method and compared with the carrying amount for the equity.
Future cash flows for the Energy, Network and swb business areas and the TC and IT units are determined based on current budgets as approved by the Board of Management and the Supervisory Board. A budget horizon of three years is used for the Energy, Network, TC and IT business areas, followed by a normal year, which forms the basis for extrapolating cash flows thereafter. For the swb business area the plan-ning horizon is ten years, followed by a normal year, which forms the basis for extrapolating cash flows thereafter.
The budgets take past experience into account as well as certain assumptions, for example on exchange rates and oil price developments. For the fully consolidated companies Bursagaz, EWE Doğalgaz and Kayserigaz the latest available budgets provided by the managing directors or business managers are used as the basis for calculations. The future cash flow of the cash-generating unit Poland is determined
114 EWE Annual Report 2009

based on current company forecasts as approved by the Board of Management and Supervisory Board of EWE AG, followed by an initial management forecast and then a normal year, which forms the basis for extrapolating cash flows thereafter.
The discount rates are derived from capital market rates for sector-specific peer groups. They take into account expectations of the risk-free market interest rate and the specific risks of the cash-generating unit. The individual weighted average cost of capital (WACC) after taxes determined in this way was then used for the respective planning horizon. The extrapolated cash flow takes a discount for sustain-able growth of 1.0 per cent into account. All of the respective discount rates used are also listed in the table.
The previous year’s impairment test for the cash-generating unit Poland revealed an impairment loss on gas supply facilities totalling Euro 25.8 million (2009: Euro 0.0 million).
In the reporting year an impairment loss of Euro 84.1 million was recognised on goodwill (previous year: Euro 0.0 million). The impairment loss related solely to the cash-generating units Bursagaz (Euro 60.1 million) and Kayserigaz (Euro 24.0 million). As in the previous year, no impairment losses were recog-nised on intangible assets with an indefinite useful life.
The following useful lives have been determined for intangible assets:
years
Concessions, licences and rights 15 – 25
Computer software and licences 3 – 5
Client base 5 – 17
The useful lives are reviewed annually and adjusted as necessary.
Property, plant and equipment is recognised at cost of acquisition or production, plus the present value of existing future obligations to recultivate land and remove buildings, less accumulated depre-ciation and impairment losses. The cost of production consists of the direct costs plus the directly at-tributable share of overhead costs.
Exploratory drilling is accounted for under the successful efforts method. If exploratory drilling is suc-cessful, all costs for this drilling are capitalised. All other costs, such as seismic and geological analy-ses, are recognised as an expense.
Items of property, plant and equipment are depreciated on a straight-line basis. Depreciation relating to gas exploration and production is also carried out under the unit of production method.
115The e3-programme Management Investor Relations Social Responsibility Group Management Report Consolidated Financial Statements

The following table shows the useful lives:
years
Buildings up to 50
Technical equipment and machines
Electricity supply equipment 8 – 45
Gas supply facilities 10 – 55
Other technical equipment and machines 3 – 50
Gas storage facilities 33 – 40
Other plant, operating and office equipment 5 – 14
The useful lives are reviewed annually and adjusted as necessary.
Items of property, plant and equipment are tested for impairment if there are indications that this is necessary. An impairment loss is recognised if the carrying amount exceeds the recoverable amount. The recoverable amount of an asset or a cash-generating unit is the higher of net realisable value and value in use. The recoverable amount is to be determined for each individual asset, unless the asset does not generate cash inflows which are largely independent of those from other assets or groups of assets.
If the grounds on which impairment losses were recognised in previous years no longer apply, appro-priate reversals are conducted.
Leases are classified as operating leases under IAS 17 as not substantially all of the risks and rewards incidental to ownership of the assets are transferred.
Lease payments for operating leases are recognised on a straight-line basis as current expense.
Investments accounted for under the equity method are held at the amount of the equity interest plus goodwill less any negative difference. The carrying amounts of these equity investments are ad-justed annually for the pro rata change in equity. If there is an objective indication of impairment, the carrying amount is tested for each company and any impairment is recognised through profit and loss in the result of equity investments.
On every balance sheet date, the Group examines whether there is an indication of impairment. If such indications exist, or an asset requires annual impairment testing, the Group makes an estimate of the recoverable amount. The recoverable amount of an asset or a cash-generating unit is the higher of fair value less costs to sell and value in use. The recoverable amount is to be determined for each individu-al asset, unless the asset does not generate cash inflows which are largely independent of those from other assets or groups of assets.
Financial assets are divided into the following categories:
Financial assets at fair value through profit and loss•
Loans and receivables•
Held-to-maturity financial assets•
Available-for-sale financial assets•
116 EWE Annual Report 2009
The classification depends on the purpose for which the financial assets were acquired. Group manage-ment determines the classification of the individual financial assets on initial recognition and reassess-es the classification on each balance sheet date. There are no held-to-maturity financial assets.
(a) Financial assets at fair value through profit and lossThis category has two sub-categories: financial assets that are classified as held for trading from the outset and those which are held at fair value through profit and loss from the outset.
A financial asset is classified to this category if it has primarily been acquired with the intention of reselling it in the short term or if it is designated as such by management. The EWE Group does not currently hold any instruments designated as such.Derivatives also belong to this category unless they form part of a hedging relationship.
(b) Loans and receivablesLoans and receivables are non-derivative financial assets with fixed or determinable payments that are not listed on an active market. The EWE Group has allocated trade receivables, other receivables and loans, as well as cash and cash equivalents to this category. Impairment allowances are made as nec-essary on the basis of the current default risk.
(c) Available-for-sale financial assetsAvailable-for-sale financial assets are non-derivative financial assets which are either allocated to this category or have not been classified in any other category. EWE Group holds equity investments and interests in non-consolidated companies in this category.
Regular sales and purchases of financial assets are recognised as of the settlement date. Financial assets are derecognised when rights to payment expire or are transferred and the EWE Group has transferred substantially all of the risks and rewards associated with ownership. Financial assets are presented in the balance sheet as current assets if they mature within twelve months of the balance sheet date.
Loans and receivables and available-for-sale financial assets are initially recognised at fair value plus transaction costs. Financial assets at fair value through profit and loss are initially recognised at fair value. Transaction costs are recognised in profit and loss.
Available-for-sale financial assets and financial assets at fair value through profit and loss are subse-quently recognised at fair value. Financial investments in equity instruments for which a quoted price on an active market is not available and whose fair value cannot be reliably determined are recognised at acquisition cost. Loans and receivables are held at amortised cost using the effective interest method.
Changes in the fair value of available-for-sale financial assets are recognised in other comprehensive income. On disposal, the accumulated changes in fair value recognised in equity are recognised in prof-it and loss. If there is no active market for a financial asset, or it is not listed on a stock exchange, fair value is determined using suitable valuation methods.
At each balance sheet date the Group assesses whether indications exist that a financial asset or group of financial assets is impaired. For equity interests which are classified as available-for-sale financial assets, a significant or persistent decline in fair value below the cost of acquisition is considered to be an indication that the assets are impaired.
117The e3-programme Management Investor Relations Social Responsibility Group Management Report Consolidated Financial Statements

Derivative financial instruments are initially recognised at fair value on the transaction date. Subse-quent measurement is also at fair value on the balance sheet date. Gains and losses from changes in the fair value are recognised in profit and loss and disclosed in the income statement.
Among other things, the EWE Group conducts its electricity and gas business by means of futures con-tracts. These are transacted according to the EWE Group’s anticipated purchase, sales or consumption requirements. Settlement is by means of physical delivery. As pending transactions, these transactions are not recognised in the balance sheet.
Derivatives are categorised as held for trading unless subject to hedge accounting.
A cash flow hedge is a hedge against the risk arising from varying cash flows which can be attributed to a specific risk in connection with a recognised asset or liability or an expected transaction with a high level of probability which could have an impact on profit and loss for the period. If a cash flow hedge meets the criteria for hedge accounting, the portion of the profit or loss on the hedging instru-ment that is determined to be an effective hedge is recognised in other comprehensive income. The ineffective part of the profit or loss from the hedging instrument is recognised through profit and loss in the income statement. If the cash flow hedge is not related to a hedge of a forecast transaction or is related to a hedge of a forecast transaction which does not subsequently result in the recognition of a financial asset or a liability, the amounts recognised in other comprehensive income must be recog-nised through profit and loss in the same period(s) in which the hedged cash flows from the item affect the result. The corresponding amounts are transferred from equity to the income statement (recycling).
A fair value hedge is a hedge of the exposure to changes in fair value of a recognised asset or liability or an unrecognised firm commitment that is attributable to a particular risk and could affect the re-sult for the period. The change in fair value of the derivative hedging instrument and the hedged item are recognised through profit and loss in the income statement. If an unrecognised firm commitment is designated as the hedged item, recognising the hedging relationship will cause the recognition of an asset or liability worth the total of the subsequent cumulative changes in fair value of the firm com-mitment attributable to the hedged risk and the recognition of a corresponding profit or loss in the income statement.
Cash and cash equivalents, which consist of current accounts and short-term bank deposits, have a residual term of up to three months and are held at amortised cost.
Inventories are held at the lower of acquisition or production cost and net realisable value. The costs of acquisition and production are determined using the average cost method. Net realisable value is determined as the forecast sales proceeds less estimated costs of completion and costs to sell.
Construction subsidies include investment and construction subsidies.
The EWE Group receives construction subsidies for installing mains electricity, gas and water connec-tions for standard-rate and special-rate customers. The construction subsidies are recognised as liabil-ities and reversed in line with the useful life of the subsidised equipment. The reversal is made to sales, as the income from the construction subsidies is closely linked to the fundamental electricity and gas business and therefore relates to the EWE Group’s normal operations.
118 EWE Annual Report 2009

Provisions for pensions and similar obligations are made for direct pension commitments to (former) staff with vested entitlements to company pension benefits. In the EWE Group the legal basis for these obligations are collective bargaining agreements, works agreements and individual commitments. They are accounted for using the projected unit credit method in accordance with IAS 19. This involves meas-uring the amount of future obligations using actuarial methods as well as estimating the relevant parameters (e.g. interest rate, mortality rates, pay and pension forecasts). This method allocates the expenses required for the increased entitlements to the period in which they arise. The increase in en-titlement is the share of the total forecast benefit that is attributable to a given financial year, taking vesting conditions into account.
EWE Treuhandverein e.V. was established in 2009 as part of the introduction of defined-contribution, funded direct commitments. To the extent that assets are transferred to EWE Treuhandverein e.V. to fund retirement benefits, these assets constitute plan assets eligible for netting out within the mean-ing of IAS 19.7.
EWE Group recognises actuarial gains and losses immediately, i.e. in the financial year in which they arise, directly and for the full amount in other comprehensive income. Interest on pension obligations is disclosed within interest expense.
In addition to the direct commitments, certain groups of employees are obligatorily insured with the state insurance agency Versicherungsanstalt des Bundes und der Länder (VBL). Annual levies and re-capitalisation payments have to be made annually to VBL to fund these commitments. These benefit commitments are accounted for as a defined-contribution multi-employer plan within the meaning of IAS 19.30 and are recognised in profit and loss. If the plan is underfunded, the participating em-ployers are obliged to compensate for the shortfall. The amount of additional funding required is de-termined by VBL and levied on the members in line with their obligations in the form of the recapi-talisation payment, which is currently of indefinite duration.
Similar long-term obligations to employees include long-term obligations under phased early retire-ment agreements. In the EWE Group these are generally concluded in the form of the block model. The resulting obligations are determined on the basis of actuarial principles. If these obligations are funded by plan assets, the obligations are netted out with the fair value of the relevant plan assets.
Other provisions cover all identifiable obligations to third parties at the balance sheet date, the tim-ing or amount of which is uncertain, in accordance with IAS 37.
Provisions for recultivation obligations after caverns and natural gas fields have ceased operations are made for the present value of the obligation. They are capitalised and amortised or the provisions are compounded.
Provisions for imminent losses are made to the extent that the general conditions for onerous contracts are met and for the amount by which the costs unavoidably connected with the contract exceed the expected economic benefits.
If there is a shortage of emissions rights in the current year, i.e. emissions have already been produced and these emissions exceed the amount of emissions rights allocated or purchased for the full year, a provision is made for the emissions certificates that still have to be purchased. Provisions may not be made for future emissions, however, even if forecasts indicate that a shortage of emissions rights is likely.
119The e3-programme Management Investor Relations Social Responsibility Group Management Report Consolidated Financial Statements

Provisions are classified according to their term. Provisions or parts of a provision for an obligation which is likely to fall due within twelve months of the balance sheet date are classified as current provisions. Provisions which are only likely to fall due after twelve months are classified as non-current.
Current and deferred taxes are recognised in the income statement unless they relate to items rec-ognised in other comprehensive income. In this case the taxes are also recognised in other compre-hensive income.
Current tax expenses are calculated based on the tax regulations in effect on the balance sheet date or due to come into effect shortly thereafter in the countries in which subsidiaries and associated companies operate and generate taxable income.
Deferred taxes are recognised for all temporary differences between the tax base of the assets and li-abilities and their carrying amounts in the IFRS financial statements (liabilities method). However, if deferred taxes arise on initial recognition of an asset or a liability as part of a transaction that is not a business combination, and at the time of the transaction they do not affect profit and loss for either accounting or tax purposes, they are not recognised on initial recognition or thereafter. Deferred taxes are measured using the tax rates (and tax regulations) in effect on the balance sheet date or those which have largely completed the legislative process and are expected to apply at the time the deferred tax asset is realised or the deferred tax liability is settled.
Deferred tax assets are only recognised to the extent that taxable profits against which the temporary difference can be offset are likely.
Deferred tax liabilities arising on temporary differences in connection with shareholdings in subsidiaries and associated companies are recognised unless the Group can control the time at which the tempo-rary differences will reverse and that due to this control it is probable that the temporary differences will not reverse for the foreseeable future.
Financial liabilities are initially recognised at fair value less transaction costs and in subsequent peri-ods at amortised cost. Differences between the amount paid out and the repayable amount are rec-ognised in the income statement over the term of the debt using the effective interest method. They are derecognised when they cease to exist, i.e. when the contractual obligations are met, cancelled or expire.
Liabilities are classified as current unless the EWE Group has the right to postpone repayment of the liability for a period of more than twelve months after the balance sheet date.
Bonds and liabilities to banks are held at the amount of issue proceeds, less directly attributable costs of issue. Financing costs, including any premiums due on repayment, are recognised in profit and loss for the period using the effective interest method. The same applies to other liabilities to the extent that these represent financial instruments.
Current trade payables which do not accrue interest are recognised at nominal value.
Contingent liabilities are possible or present obligations which arise from past events but where it is not probable that an outflow of resources will be required to settle the obligation, or the amount of the obligation cannot be measured with sufficient reliability. They are not recognised in the balance sheet.
120 EWE Annual Report 2009

Forward-looking assumptions and estimates
Preparing the consolidated financial statements for the EWE Group required assumptions and estimates to be made which affect the recognition and measurement of the amount of assets and liabilities. Forward-looking assumptions and estimates will only very seldom correspond precisely to the actual subsequent developments and are therefore described hereafter.
Accounting for acquisitions: when an equity interest is acquired, all identifiable assets, liabilities and contingent liabilities are recognised at fair value as of the acquisition date for the purpose of initial consolidation as part of the purchase price allocation. In identifying intangible assets the fair values are determined using suitable valuation methods.
Goodwill: an impairment test is carried out for goodwill at least annually or whenever information from internal or external sources indicates possible impairment. This impairment test is based on assump-tions about the future, which requires estimates to be made of future cash flows from cash-generat-ing units that include goodwill. These estimates can affect the measurement of future cash flows and lead to impairment losses on goodwill.
Intangible assets and property, plant and equipment: expected useful lives and measurement of im-pairment losses on these assets are based on management judgement.
Provisions for pensions and similar obligations: the measurement of pension obligations takes place using actuarial assumptions on demographic variables (staff fluctuation, mortality rates) and financial variables (interest rates, future pay increases, future pension increases, expected return on claims for reimbursement). The discount rate used is determined taking the specific structure of the cash flow for the obligations earned into account. The calculation is based on the pension obligations as of the bal-ance sheet date. Calculations are made using the yield curve, the DJ EuroStoxx 50 and the iBoxx indi-ces and taking the daily values as of 31 December 2009. In accordance with IAS 19.78 the discount rate is determined as being the capital market return on high-quality corporate bonds whose currency and maturity correspond to those of the obligation being measured. If there is no sufficient market for the required maturities, the return is interpolated or extrapolated for these maturities along the available yield curve in accordance with IAS 19.81.
Provisions for recultivation: the provisions for recultivation and demolition are based on surveys by third parties. The costs of recultivation have been estimated for all caverns in the event that they cease to be used. This amount is discounted to the balance sheet date. The measurement of the provision for re-cultivation is reviewed on every balance sheet date and any adjustment to a revised best estimate is made as necessary. Changes in the expected timing and amount of the payments needed to settle the obligation and changes in the discount rate result in an adjustment of the provisions for recultivation.
Income taxes: calculating effective and deferred taxes involves assumptions. The use of deferred tax assets depends on earning sufficient taxable income.
Changes in estimates: at the time the consolidated financial statements were prepared, there was no indication of significant changes in the assumptions and estimates used for accounting and valuation.
121The e3-programme Management Investor Relations Social Responsibility Group Management Report Consolidated Financial Statements

Notes to the income statement
1. Sales
The segment reporting presents sales according to business area. Sales include electricity and energy taxes (natural gas taxes) invoiced to customers of Euro 353.1 million (previous year: Euro 319.1 million).
Sales are initially presented as gross sales including the electricity and energy taxes (natural gas taxes). Net sales are the sales after deducting the electricity and energy taxes (natural gas taxes).
2. Other own work capitalised
Own work capitalised includes construction and extension work on supply networks. The capitalised amount also includes directly attributable overhead costs.
3. Other operating income
EUR million 2009 2008
Derivative financial instruments 24.7 1.1
Reversal of provisions 15.3 20.6
Rental and lease income 7.9 5.9
Income from CHP charges / premiums 7.5 7.6
Income from gas hedging 9.0
Reimbursement of costs from EnBW 4.4
Claim for reimbursement from E.ON Westfalen Weser AG 4.0 6.9
Foreign currency gains 2.9 7.4
Management of waterworks 2.8 2.6
Disposal proceeds on items of property, plant and equipment 1.9 3.1
Income from adjusting impairment allowances 0.8 0.6
Other 39.8 20.4
Total 112.0 85.2
4. Cost of materials and services
EUR million 2009 2008
Raw materials, consumables and supplies and purchased merchandise 3,905.9 3,719.0
Purchased services 529.8 458.7
Total 4,435.7 4,177.7
122 EWE Annual Report 2009

5. Personnel expenses
EUR million 2009 2008
Wages and salaries 324.4 266.0
Social security contributions and retirement and other benefits 82.3 58.1
Total 406.7 324.1
Retirement benefits amount to Euro 23.5 million (previous year: Euro 13.3 million), of which service expense in the reporting period accounts for Euro 11.3 million (previous year: Euro 10.0 million) and past service expense for Euro 0.0 million (previous year: Euro 0.1 million).
Expenses for the employer’s share of contributions to statutory retirement pension insurance amounted to Euro 37.8 million (previous year: Euro 23.3 million).
The following table shows the average number of employees over the year:
2009 2008
Full-time staff 5,647 4,697
Part-time staff 689 564
Trainees and assistants 110 86
Total 6,446 5,347
6. Depreciation, amortisation and impairment
Depreciation and amortisation of property, plant and equipment and intangible assets is carried out on a straight-line basis over the useful life of the assets.
Depreciation of property, plant and equipment amounts to Euro 288.8 million (previous year: Euro 259.9 million) and amortisation of intangible assets to Euro 33.5 million (previous year: Euro 18.8 million).
In the reporting year an impairment loss of Euro 4.2 million was recognised on property, plant and equipment (previous year: Euro 41.5 million). The impairment loss on intangible assets amounted to Euro 85.4 million (previous year: Euro 0.0 million). Of this, Euro 84.1 million related to goodwill.
123The e3-programme Management Investor Relations Social Responsibility Group Management Report Consolidated Financial Statements

7. Other operating expenses
EUR million 2009 2008
Concession fees (cf. Note 34) 89.6 81.4
Fees and advisory expenses 27.6 15.9
Derivative financial instruments 27.2 23.3
Combined Heat and Power Act (KWKG) 21.9 19.2
Rental and lease expenses 15.8 11.8
Disposal of intangible assets and property, plant and equipment 13.3 2.7
Exploration and production of gas reserves 12.5 12.1
Other taxes 9.1 7.7
Hedging expenses 8.9
Impairment allowances on receivables 5.0 5.1
Foreign currency losses 4.4 8.2
Additions to provisions 3.2 6.7
Other 214.7 146.4
Total 453.2 340.5
Expenses for natural gas exploration and production consist of exploratory drilling, production, trans-port and administration as well as geological and geophysical analyses.
Of the expenses in connection with the Combined Heat and Power Act (KWKG), Euro 20.7 million (pre-vious year: Euro 18.0 million) result from the vertical allocation of expenses between the upstream net-work operator of EWE NETZ GmbH, Oldenburg, and EWE NETZ GmbH itself in line with Section 9 para. 4 KWKG. A further Euro 1.2 million (previous year: Euro 1.2 million) relates to claims for payment against EWE NETZ GmbH by downstream municipal utilities for the subsidies they pay to operators of combined heat and power stations.
Exchange rate gains of Euro 2.9 million (previous year: Euro 7.4 million) were set off against exchange rate losses.
8. Result of investments accounted for under the equity method
EUR million 2009 2008
Result of investments accounted for under the equity method 153.5 119.5
The result of investments accounted for under the equity method principally relates to the share-holdings in VNG – Verbundnetz Gas Aktiengesellschaft (VNG), Leipzig, swb and MVR.
124 EWE Annual Report 2009

9. Other investment income
EUR million 2009 2008
Income from equity investments 7.7 6.3
Impairment losses on financial investments -20.9
Income from profit transfer agreements 1.3 0.1
Expenses from loss transfer agreements -0.8 -1.1
Gains from the disposal of equity investments 5.3
Losses from the disposal of equity investments -0.6
Other expenses for equity investments -0.8 -0.1
Total -8.2 4.6
The write-downs on financial investments reflect permanent impairment of shares in other equity investments.
10. Net interest income / expense
EUR million 2009 2008
Interest and similar income 67.1 16.3
Interest and similar expenses -141.0 -115.9
Interest portion of additions to
pension provisions -40.6 -31.2
recultivation provisions -3.2 -3.1
other provisions -2.3 -0.6
Total -120.0 -134.5
The increase in interest income was mainly due to a one-off effect in connection with the share pur-chase by our strategic partner EnBW Baden-Württemberg AG (EnBW), Karlsruhe.
It was agreed that interest should be paid on the share premium for the period between the agreed transfer date for the shareholders’ rights (31 December 2008 / 1 January 2009) and the effective date of the share transfer (“closing”), which meant that EWE AG received interest income of Euro 42.5 million.
125The e3-programme Management Investor Relations Social Responsibility Group Management Report Consolidated Financial Statements

11. Income taxes
EUR million 2009 2008
effective income taxes 81.4 67.0
Of which:
Tax expense for the current period 76.6 53.8
Tax expense / (income) for prior periods 4.8 13.2
Deferred taxes 13.2 13.6
Of which:
Temporary differences 14.4 8.9
Tax losses carried forward -1.2 4.7
94.6 80.6
The weighted average Group tax rate for 2009 was 29.0 per cent (previous year: 28.5 per cent) for the EWE Group. This is made up of corporation tax at a rate of 15.0 per cent (previous year: 15.0 per cent) and the solidarity surcharge, which is levied at 5.5 per cent of the corporation tax payment, as in the previous year, and trade tax at an average multiple of 375.5 per cent (previous year: 362.41 per cent).
The amount of tax on the Group’s net profit before tax differs from the theoretical tax expense ob-tained by applying the weighted average Group tax rate to net profit before taxes. The following table shows the reconciliation between the two:
Tax reconciliation
EUR million 2009 2008
Profit before tax 294.0 291.6
Hypothetical tax expense 85.3 83.1
Difference due to taxable profit for trade tax 4.3 8.1
Divergence from expected tax rate
Divergence due to difference with Group tax rate 13.3 11.8
Divergences due to tax balance sheet – permanent 25.8 4.7
Tax rate increase 2009 1.2
Other 0.9
Non-recognised deferred tax assets 0.8 4.9
Use of tax losses carried forward -0.1 -0.5
Non-deductible expenses 1.6 3.8
Tax-free income -2.7 -3.0
Equity accounting for associated companies -44.6 -31.8
Non-periodic taxes 7.3 -2.0
Consolidation steps from subgroups 2.7
Other -0.3 0.6
effective tax expense 94.6 80.6
Effective tax rate in % 32.2 27.7
126 EWE Annual Report 2009

Notes to the balance sheet
12. Intangible assets
EUR million 31.12.2009 31.12.2008
Concessions, trademarks, licences and similar rights 450.7 380.3
Payments made on account 4.0 0.1
Intangible assets with indefinite useful lives 392.0 3.8
Goodwill 727.0 336.6
Total 1,573.7 720.8
The following table shows the changes in intangible assets:
EUR million
Concessions, trademarks, licences and
similar rights
Payments made on account Goodwill
Intangible assets with
indefinite useful lives Total
Cost
As at 1.1.2009 471.6 0.1 336.6 3.8 812.1
Change in group of consolidated companies / company acquisitions 125.8 2.5 516.7 388.2 1,033.2
Additions / disposals from mergers and spin-outs 0.0 0.0 0.0 0.0 0.0
Additions 15.5 1.0 0.0 0.0 16.5
Reclassifications 0.7 0.4 0.0 0.0 1.1
Currency adjustments -2.6 0.0 -2.6 0.0 -5.2
Disposals 8.1 0.0 0.0 0.0 8.1
As at 31.12.2009 602.9 4.0 850.7 392.0 1,849.6
Accumulated amortisation and impairment
As at 1.1.2009 91.3 0.0 0.0 0.0 91.3
Change in group of consolidated companies / company acquisitions 32.2 0.0 38.2 0.0 70.4
Additions / disposals from mergers and spin-outs 0.0 0.0 0.0 0.0 0.0
Amortisation in the reporting year 33.5 0.0 0.0 0.0 33.5
Impairment in the reporting year 1.3 0.0 84.1 0.0 85.4
Reclassifications 0.0 0.0 0.0 0.0 0.0
Currency adjustments 0.0 0.0 1.4 0.0 1.5
Disposals 6.1 0.0 0.0 0.0 6.1
Reversals of amortisation and impairment 0.0 0.0 0.0 0.0 0.0
As at 31.12.2009 152.2 0.0 123.7 0.0 275.9
Carrying amounts
As at 31.12.2009 450.7 4.0 727.0 392.0 1,573.7
127The e3-programme Management Investor Relations Social Responsibility Group Management Report Consolidated Financial Statements

EUR million
Concessions, trademarks, licences and
similar rights
Payments made on account Goodwill
Intangible assets with
indefinite useful lives Total
Cost
As at 1.1.2008 132.6 0.1 53.1 4.0 189.8
Change in group of consolidated companies / company acquisitions 353.1 0.0 318.0 0.0 671.1
Additions / disposals from mergers and spin-outs 0.8 0.0 0.0 -0.2 0.6
Additions 18.6 0.0 0.0 0.0 18.6
Reclassifications 5.9 0.0 0.0 0.0 5.9
Currency adjustments -38.3 0.0 -34.5 0.0 -72.8
Disposals 1.1 0.0 0.0 0.0 1.1
As at 31.12.2008 471.6 0.1 336.6 3.8 812.1
Accumulated amortisation and impairment
As at 1.1.2008 69.3 0.0 0.0 0.1 69.4
Change in group of consolidated companies / company acquisitions 4.5 0.0 0.0 0.0 4.5
Additions / disposals from mergers and spin-outs 0.7 0.0 0.0 -0.1 0.6
Amortisation in the reporting year 18.8 0.0 0.0 0.0 18.8
Impairment in the reporting year 0.0 0.0 0.0 0.0 0.0
Reclassifications 0.0 0.0 0.0 0.0 0.0
Currency adjustments -0.9 0.0 0.0 0.0 -0.9
Disposals 1.1 0.0 0.0 0.0 1.1
Reversals of amortisation and impairment 0.0 0.0 0.0 0.0 0.0
As at 31.12.2008 91.3 0.0 0.0 0.0 91.3
Carrying amounts
As at 31.12.2008 380.3 0.1 336.6 3.8 720.8
128 EWE Annual Report 2009

The conditions required for capitalising development costs were not met. Development costs were therefore recognised as expenses, together with research costs. In 2009 Euro 40.0 million (previous year: Euro 12.2 million) was spent on research and development.
Goodwill was allocated to the cash-generating units defined in the Group. The impairment tests re-sulted in an impairment charge of Euro 84.1 million (previous year: Euro 0.0 million).
Goodwill and the values for brands and concession agreements determined in the course of the purchase price allocation have indefinite useful lives and are therefore not amortised.
Limits to the useful lives of intangible assets such as software, licences, client base, rights of use and operating concessions are based on economic factors or contractual terms. Amortisation on these in-tangible assets is shown in the income statement under depreciation, amortisation and impairment.
There are no restrictions of title to intangible assets and none have been pledged as collateral for liabilities.
13. Property, plant and equipment
EUR million 31.12.2009 31.12.2008
Land and buildings 441.3 331.4
Technical equipment and machines
Electricity supply equipment 1,261.5 799.8
Gas supply facilities 1,480.4 1,308.9
Other 1,077.2 652.6
Other plant, operating and office equipment 108.2 69.5
Payments made on account and plant under construction 452.4 185.8
Total 4,821.0 3,348.0
129The e3-programme Management Investor Relations Social Responsibility Group Management Report Consolidated Financial Statements

The following table shows changes in property, plant and equipment:
EUR millionLand and buildings
Technical equipment and
machines
Other plant, operating and
office equipment
Payments made on
account and plant under
construction Total
Cost
As at 1.1.2009 531.5 6,811.2 207.7 185.9 7,736.3
Change in group of consolidated companies 234.6 2,800.4 104.2 137.3 3,276.5
Additions / disposals from mergers and spin-outs 0.0 0.0 0.0 0.0 0.0
Additions 40.9 287.9 31.5 188.0 548.3
Reclassifications 7.2 28.7 9.4 -48.4 -3.1
Currency adjustments 0.0 -0.6 0.0 0.0 -0.6
Disposals 3.3 90.6 22.1 7.2 123.2
As at 31.12.2009 810.9 9,837.0 330.7 455.6 11,434.2
Accumulated depreciation and impairment
As at 1.1.2009 200.1 4,049.9 138.2 0.0 4,388.2
Change in group of consolidated companies 154.6 1,802.4 82.7 0.0 2,039.7
Additions / disposals from mergers and spin-outs 0.0 0.0 0.0 0.0 0.0
Depreciation in the reporting year 15.6 250.2 23.0 0.0 288.8
Impairment in the reporting year 0.0 1.0 0.0 3.2 4.2
Reclassifications 0.0 1.3 -1.3 0.0 0.0
Currency adjustments 0.0 0.0 0.0 0.0 0.0
Disposals 0.9 86.8 20.1 0.0 107.8
Reversals of depreciation and impairment 0.2 -0.1 0.0 0.0 0.1
As at 31.12.2009 369.6 6,017.9 222.5 3.2 6,613.2
Carrying amounts
As at 31.12.2009 441.3 3,819.1 108.2 452.4 4,821.0
130 EWE Annual Report 2009

Property, plant and equipment – table continued
EUR millionLand and buildings
Technical equipment and
machines
Other plant, operating and
office equipment
Payments made on
account and plant under
construction Total
Cost
As at 1.1.2008 500.9 6,321.9 191.9 191.1 7,205.7
Change in group of consolidated companies 1.4 168.8 3.3 22.2 195.7
Additions / disposals from mergers and spin-outs 0.3 11.9 0.0 1.6 13.8
Additions 12.5 282.6 21.8 114.1 431.0
Reclassifications 20.9 96.6 4.3 -127.8 -6.0
Currency adjustments -0.4 -29.6 -0.4 -1.0 -31.4
Disposals 4.1 41.0 13.1 14.3 72.5
As at 31.12.2008 531.5 6,811.2 207.7 185.9 7,736.3
Accumulated depreciation and impairment
As at 1.1.2008 188.3 3,785.4 130.2 0.0 4,103.9
Change in group of consolidated companies 0.0 34.4 1.7 0.0 36.1
Additions / disposals from mergers and spin-outs 0.0 1.4 0.3 0.0 1.7
Depreciation in the reporting year 13.5 227.6 18.8 0.0 259.9
Impairment in the reporting year 0.0 41.5 0.0 0.0 41.5
Reclassifications 0.0 0.0 0.0 0.0 0.0
Currency adjustments 0.0 -3.6 -0.2 0.0 -3.8
Disposals 1.7 36.8 12.6 0.0 51.1
Reversals of depreciation and impairment 0.0 0.0 0.0 0.0 0.0
As at 31.12.2008 200.1 4,049.9 138.2 0.0 4,388.2
Carrying amounts
As at 31.12.2008 331.4 2,761.3 69.5 185.9 3,348.0
Items of property, plant and equipment amounting to Euro 34.0 million (previous year: Euro 3.8 million) were pledged as collateral, of which the lending bank imposes restrictions on the use of Euro 41.6 million (previous year: Euro 0.0 million).
Impairment losses of Euro 2.6 million (previous year: Euro 15.7 million) on property, plant and equipment for exploration (gas supply facilities) were recognised in profit and loss. The residual carrying amount came to Euro 26.8 million as of the balance sheet date (previous year: Euro 14.6 million).
Impairment losses of Euro 4.2 million (previous year: Euro 41.5 million) are shown under depreciation, amortisation and impairment in the income statement.
131The e3-programme Management Investor Relations Social Responsibility Group Management Report Consolidated Financial Statements

14. Investments accounted for under the equity method
The following table shows summarised financial information on companies accounted for under the equity method, none of which are publicly listed. However, these key figures do not correspond to EWE AG’s equity interest, but rather are reported in full.
EUR million 2009 2008
Balance sheet total 4,022.7 4,092.4
Borrowings 2,389.0 2,669.3
Sales 6,119.2 7,055.5
Result 238.5 234.0
Interests in companies accounted for under the equity method changed as follows:
EUR million 2009 2008
Opening balance on 1 january 1,585.7 1,617.9
Reclassification from other shareholdings 3.0
Adjustment to first-time consolidation due to IAS 8 12.4
Restated opening balance on 1 january 1,585.7 1,633.3
Group share of net profit / loss 153.5 119.5
Dividends received -71.1 -80.2
Capital increases 92.2 20.0
Change in group of consolidated companies 310.5
Additions 49.0
Reclassification -1,571.8 -146.9
Changes without effect on profit and loss -1.6 -9.0
Closing balance on 31 December 497.4 1,585.7
As of 31 December 2009 investments in associated companies include goodwill of Euro 68.6 million (previous year: Euro 301.6 million).
The addition to the group of consolidated companies results from shares acquired in associated com-panies in the course of consolidating swb in full for the first time.
The reclassifications relate to VNG shares that were reclassified from non-current assets to held-for-sale (Euro 1,000.0 million) and the swb shares (Euro 571.8 million) that were reclassified to shares in affili-ated companies that were eliminated during capital consolidation now that the company is fully con-solidated.
132 EWE Annual Report 2009

15. Other non-current assets
EUR million 31.12.2009 31.12.2008
Financial assets at fair value through profit and loss
Derivative financial instruments 37.0
Loans and receivables
Loans to affiliated companies 8.8 13.9
Loans to other shareholdings 0.1
Other loans 29.7 2.3
Energy saving loans 2.5 1.5
Other 6.6 0.9
Available-for-sale financial assets
Interests in affiliated companies 69.5 40.7
Other shareholdings 92.9 72.5
Financial assets 247.0 131.9
Non-financial assets 15.0 11.2
Total 262.0 143.1
The interests in affiliated companies and loans to affiliated companies relate to non-consolidated equity investments.
16. Inventories
EUR million 31.12.2009 31.12.2008
Gas reserves 206.4 158.6
Raw materials, consumables and supplies 30.3 5.3
Work in progress 13.5 11.6
Finished goods and merchandise 15.4 3.7
Payments made on account 1.0 1.7
Total 266.6 180.9
There were no restrictions on use or other charges over inventories.
In the reporting year, inventories were written down by Euro 0.5 million (previous year: Euro 0.3 million) to net realisable value.
133The e3-programme Management Investor Relations Social Responsibility Group Management Report Consolidated Financial Statements

17. Trade receivables
Trade receivables are all due within one year.
Collateral of Euro 4.1 million (previous year: Euro 6.9 million) was received in the form of cash.
EUR million Carrying amount Of which individually
written down as
of balance sheet date
Of which overdue on balance sheet date and not individually written down
TotalLess than
30 daysBetween 30 and 90 days
Between 91 and 180
days
Between 181 and 360
daysMore than
360 days
Trade receivablesas at 31.12.2009
732.2 33.3 145.2 102.6 15.0 7.2 10.1 10.3
Trade receivablesas at 31.12.2008
684.3 10.2 71.8 48.2 12.1 3.8 4.2 3.5
The following table shows changes in impairment allowances for trade receivables:
EUR million 2009 2008
Impairment allowances on 1 january 17.2 12.3
Exchange rate differences -0.2
Additions 9.0 3.1
Used -1.4
Reversals -1.2 -0.3
Change in group of consolidated companies 15.2 2.3
Impairment allowances on 31 December 38.8 17.2
The total amount of impairment allowances consists of individual write-downs of Euro 32.7 million (previous year: Euro 11.8 million) and generalised impairment allowances of Euro 6.1 million (previous year: Euro 5.4 million).
The individual write-downs were on trade receivables from customers that are in unexpected economic difficulties. The assumption is nevertheless that some of the receivables will be recovered in future.
Trade receivables from customers with whom instalments have been agreed and from customers not subject to a court payment order or insolvency proceedings are not considered to be impaired. As of 31 December 2009 trade receivables amounting to Euro 145.2 million (previous year: Euro 71.8 million) were overdue, but not individually written down. The overdue receivables stem from transactions with several independent customers who have not defaulted on their liabilities in the recent past.
Additions to write-downs on trade receivables are shown in the income statement under other operating expenses, and amounts from the reversal of write-downs are shown under other operating income.
134 EWE Annual Report 2009

18. Other receivables and assets
EUR million 31.12.2009 31.12.2008
Financial assets at fair value through profit and loss
Derivative financial instruments 241.0 178.8
Miscellaneous other financial assets 1.2
Loans and receivables
Receivables from affiliated companies 72.3 46.1
Receivables from companies accounted for under the equity method 23.8 11.9
Receivables from investee 18.0 26.5
Receivables from credit vouchers 3.1
Energy saving loans 1.7 4.9
Miscellaneous other financial assets 47.2 52.9
Financial assets 404.0 325.4
Payments made on account 85.3 63.8
Own-use electricity trading 58.4
Emissions rights 50.2
VAT 20.1 10.6
Miscellaneous other non-financial assets 16.9 14.8
Non-financial assets 230.9 89.2
Total 634.9 414.6
The other receivables and assets are due within one year.
The receivables from affiliated companies are non-consolidated equity investments.
EUR million Of which individually
written down as
of balance sheet date
Of which overdue on balance sheet date and not individually written down
Carrying amount TotalLess than
30 daysBetween 30 and 90 days
Between 91 and 180
days
Between 181 and 360
daysMore than
360 days
Other financial receivables and assets
as at 31.12.2009
404.0 0.4 0.4 0.1 0.2 0.1
Other financial receivables and assets
as at 31.12.2008
325.4 1.2
135The e3-programme Management Investor Relations Social Responsibility Group Management Report Consolidated Financial Statements

The following table shows valuation allowances for other financial receivables and assets:
EUR million 2009 2008
Impairment allowances on 1 january 1.5 2.2
Reversals -0.1 -0.7
Impairment allowances on 31 December 1.4 1.5
Additions to write-downs on other receivables and assets are shown in the income statement under other operating expenses, and amounts from the reversal of write-downs are shown under other op-erating income.
19. Cash and cash equivalents
Cash and cash equivalents mainly consist of bank balances and cash in hand.
Cash of Euro 9.9 million has been deducted as these funds act as security for the credit balance (payment arrears) under phased early retirement agreements.
20. Non-current assets held for sale
The VNG shares measured using the equity method were classified as held for sale due to the decision to dispose of them. They were measured at their carrying amount. The shares have been attributed to the Corporate Centre business area. The sale is expected to be concluded in financial year 2010.
21. Shareholders’ equity
Components and changes in equity are shown in the statement of changes in shareholders’ equity.
The subscribed capital of EWE AG amounts to Euro 242,988,000 (previous year: Euro 200,000,000) and is divided into 242,988 (previous year: 200,000) registered shares of Euro 1,000. In accordance with a resolution taken at the Annual General Meeting on 8 July 2009, share capital was increased by Euro 42,988,000 to be paid in cash as a result of the strategic partnership between EWE AG and EnBW.
EnBW is EWE’s new strategic partner. On 21 July 2009, 26 per cent of the EWE AG share capital was transferred to EnBW. Weser-Ems-Energiebeteiligungen GmbH (WEE), Oldenburg, holds 59 per cent of the shares in EWE AG (previous year: 81.8 per cent) and Energieverband Elbe-Weser Beteiligungsholding GmbH (EEW), Oldenburg, holds 15 per cent (previous year: 18.2 per cent). The shareholder of WEE is Ems-Weser-Elbe Versorgungs- und Entsorgungsverband Beteiligungsgesellschaft mbH (EWE-Verband GmbH), Oldenburg, which was established on 12 November 2007 by way of a notarised investment in kind. The sole shareholder of EWE-Verband GmbH and EEW is the local authority alliance Ems-Weser-Elbe Versorgungs- und Entsorgungsverband, Oldenburg, which was created with effect from 1 November 2006 from the merger between the two local authority alliances Landeselektrizitätsverband Oldenburg (LEV) and Energieverband Elbe-Weser. The merger was carried out by dissolving Energieverband Elbe-Weser as of 31 October 2006, upon which its members joined LEV. The members of Ems-Weser-Elbe Versorgungs- und Entsorgungsverband are the local authorities and municipalities in our supply area between the rivers Ems, Weser and Elbe.
136 EWE Annual Report 2009
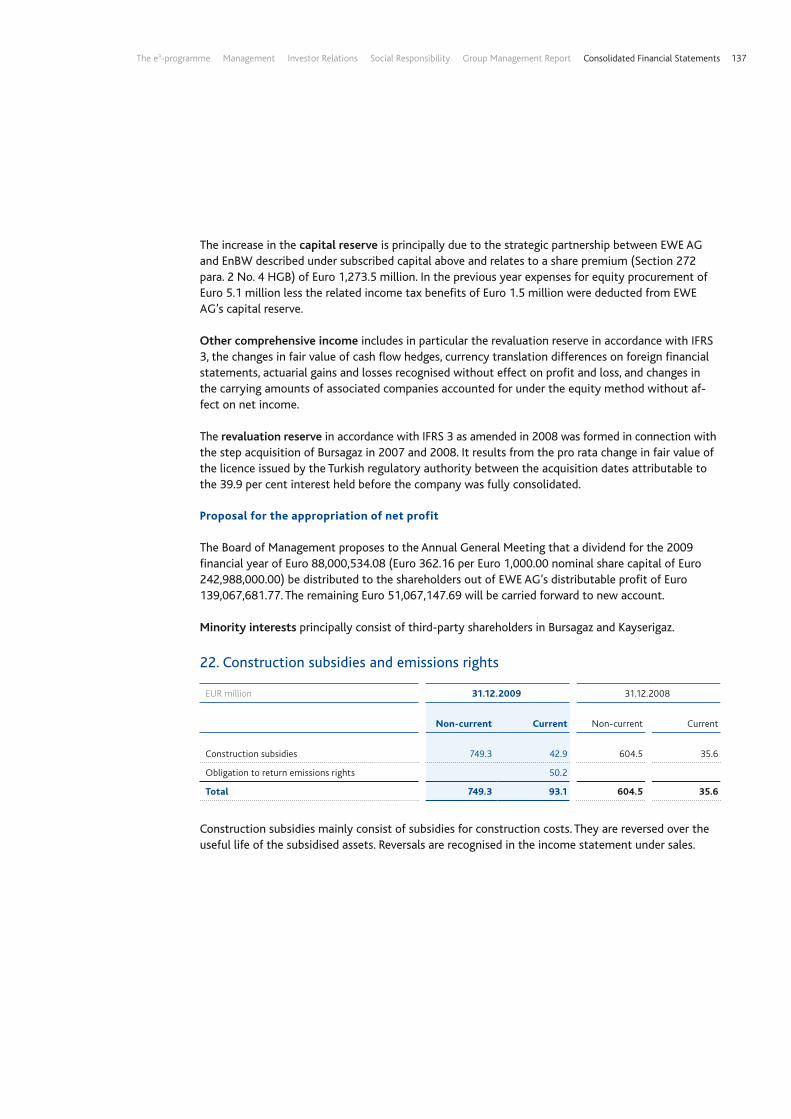
The increase in the capital reserve is principally due to the strategic partnership between EWE AG and EnBW described under subscribed capital above and relates to a share premium (Section 272 para. 2 No. 4 HGB) of Euro 1,273.5 million. In the previous year expenses for equity procurement of Euro 5.1 million less the related income tax benefits of Euro 1.5 million were deducted from EWE AG’s capital reserve.
Other comprehensive income includes in particular the revaluation reserve in accordance with IFRS 3, the changes in fair value of cash flow hedges, currency translation differences on foreign financial statements, actuarial gains and losses recognised without effect on profit and loss, and changes in the carrying amounts of associated companies accounted for under the equity method without af-fect on net income.
The revaluation reserve in accordance with IFRS 3 as amended in 2008 was formed in connection with the step acquisition of Bursagaz in 2007 and 2008. It results from the pro rata change in fair value of the licence issued by the Turkish regulatory authority between the acquisition dates attributable to the 39.9 per cent interest held before the company was fully consolidated.
Proposal for the appropriation of net profit
The Board of Management proposes to the Annual General Meeting that a dividend for the 2009 financial year of Euro 88,000,534.08 (Euro 362.16 per Euro 1,000.00 nominal share capital of Euro 242,988,000.00) be distributed to the shareholders out of EWE AG’s distributable profit of Euro 139,067,681.77. The remaining Euro 51,067,147.69 will be carried forward to new account.
Minority interests principally consist of third-party shareholders in Bursagaz and Kayserigaz.
22. Construction subsidies and emissions rights
EUR million 31.12.2009 31.12.2008
Non-current Current Non-current Current
Construction subsidies 749.3 42.9 604.5 35.6
Obligation to return emissions rights 50.2
Total 749.3 93.1 604.5 35.6
Construction subsidies mainly consist of subsidies for construction costs. They are reversed over the useful life of the subsidised assets. Reversals are recognised in the income statement under sales.
137The e3-programme Management Investor Relations Social Responsibility Group Management Report Consolidated Financial Statements

23. Provisions
EUR million 31.12.2009 31.12.2008
Non-current Current Total Non-current Current Total
Provisions for pensions and similar obligations 1,138.0 1,138.0 607.4 607.4
Other provisions
Obligations towards staff 51.1 7.4 58.5 18.9 8.5 27.4
Obligations from recultivation of gas caverns 76.6 76.6 66.5 66.5
Miscellaneous other provisions 48.9 87.1 136.0 14.2 26.1 40.3
Total 1,314.6 94.5 1,409.1 707.0 34.6 741.6
Provisions for pensions and similar obligations
The EWE Group’s benefit payments to its employees correspond to the IAS 19 definition of post-em-ployment defined-benefit plans. Overall, the pension commitments largely depend on the length of service and the employee’s remuneration.
The obligations include both those from pensions already being paid and those from entitlements to future pensions.
The characteristic feature of obligations under defined-benefit plans is that the EWE Group has to fulfil them in the amount agreed and therefore bears both the funding risk and the biometric risks (e.g. longevity risk) in full.
In the case of the funded direct commitments introduced for the first time in 2009, the Group companies that take part in this model pay an annual benefit charge to EWE-Treuhandverein e.V. for each entitled employee. The accumulated benefit charges over the period of entitlement, plus the returns earned on them, are converted into an annuity when benefits begin to be drawn. EWE AG guarantees the value of the nominal contributions. In line with IFRIC D9 the defined-benefit obligation (DBO) of the new direct commitment is recognised as the higher of the present value of the guaranteed obligation and fund assets. Similarly, current service expense is the higher of the current service expense of the guar-anteed obligations and fund contributions. Finally, to the extent that plan assets exceed the present val-ue of the guarantee obligation, the interest expense on the obligation is considered to mirror the ex-pected return on plan assets, with a reversed positive or negative value. The result is recognition of the actual extent of the obligation and the costs. As long as plan assets exceed the present value of the minimum benefit there is no balance sheet disclosure and expenses generally correspond to the contributions made, which is basically the same as accounting for a defined-contribution plan. It does, however, ensure that the minimum obligation under labour law is permanently covered by external assets or if necessary by internal reserves, which is enough to satisfy the defined-benefit element of the plan’s structure.
On balance this model also transfers the bulk of the funding risk for the retirement benefits to the employees who benefit from them, particularly with regard to the nominal guarantee during the enti-tlement phase. In exchange they have the opportunity of earning appropriate returns on the capital invested.
138 EWE Annual Report 2009

Current contributions in the form of annual service expenses are recognised as personnel expenses for the respective period and disclosed in the operating result (EBIT). The interest component is in-cluded in net interest income / expense.
The balance sheet figures for the defined-benefit pension commitments are as follows:
EUR million 2009 2008 2007
Present value of financial obligations funded via EWE Treuhandverein 0.8 - -
Fair value of plan assets 0.8
Funding status 0.0 - -
Present value of financial obligations not funded via EWE Treuhandverein 1,138.0 607.4 583.7
Unrecognised past service expense 0.0 - -
Amount not recognised as an asset due to IAS 19 limit 0.0 - -
Carrying amount 1,138.0 607.4 583.7
The following amounts have been recognised in the income statement:
EUR million 2009 2008
Current service expense 11.3 10.0
Interest expense 40.7 31.2
Forecast return on plan assets 0.0 0.0
Past service expense 0.0 0.1
Total 52.0 41.3
The following table shows the change in the present value of the obligations:
EUR million 31.12.2009 31.12.2008 31.12.2007
Present value at beginning of year 607.4 583.7 661.5
Current service expense 11.3 10.0 10.3
Interest expense 40.7 31.2 29.0
Actuarial (gains) / losses without effect on profit and loss 27.5 15.7 -85.2
Past service expense 0.0 0.1 0.0
Pension payments from company assets -43.9 -33.7 -32.1
Pension payments from plan assets 0.0 0.0 0.0
Change in group of consolidated companies 496.2 0.3 0.0
Other -0.4 0.1 0.2
Present value as of the balance sheet date 1,138.8 607.4 583.7
139The e3-programme Management Investor Relations Social Responsibility Group Management Report Consolidated Financial Statements
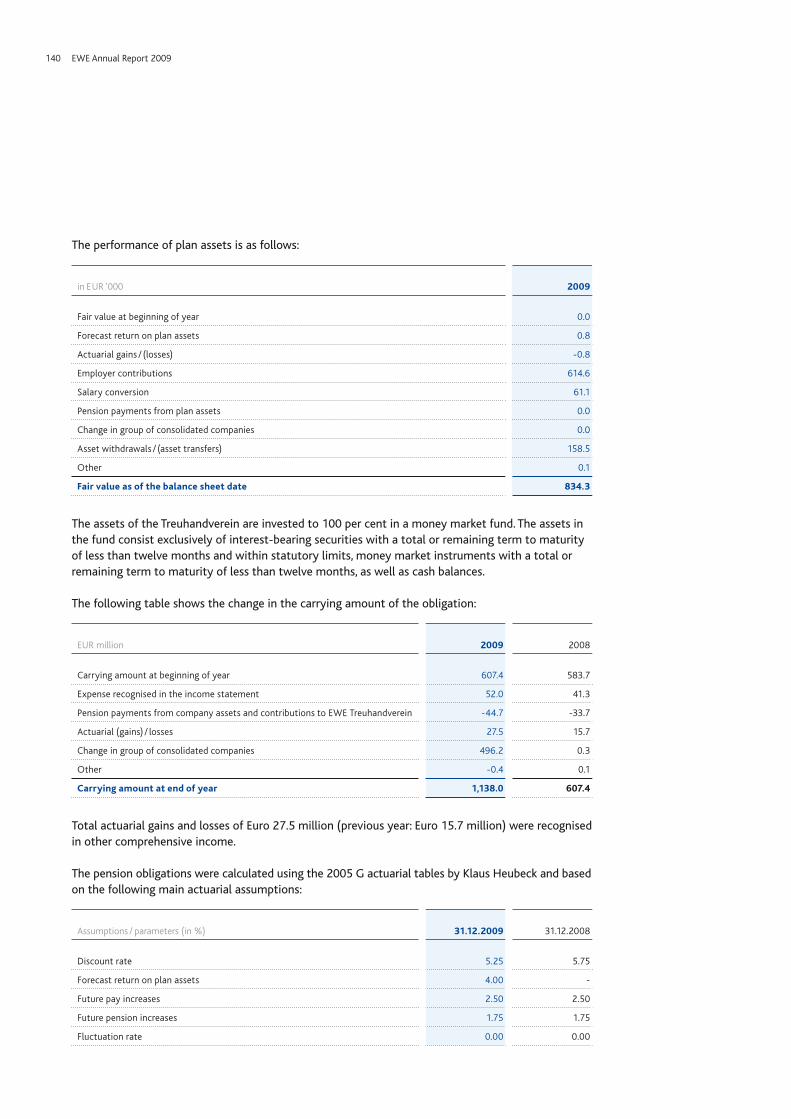
The performance of plan assets is as follows:
in EUR ‘000 2009
Fair value at beginning of year 0.0
Forecast return on plan assets 0.8
Actuarial gains / (losses) -0.8
Employer contributions 614.6
Salary conversion 61.1
Pension payments from plan assets 0.0
Change in group of consolidated companies 0.0
Asset withdrawals / (asset transfers) 158.5
Other 0.1
Fair value as of the balance sheet date 834.3
The assets of the Treuhandverein are invested to 100 per cent in a money market fund. The assets in the fund consist exclusively of interest-bearing securities with a total or remaining term to maturity of less than twelve months and within statutory limits, money market instruments with a total or remaining term to maturity of less than twelve months, as well as cash balances.
The following table shows the change in the carrying amount of the obligation:
EUR million 2009 2008
Carrying amount at beginning of year 607.4 583.7
Expense recognised in the income statement 52.0 41.3
Pension payments from company assets and contributions to EWE Treuhandverein -44.7 -33.7
Actuarial (gains) / losses 27.5 15.7
Change in group of consolidated companies 496.2 0.3
Other -0.4 0.1
Carrying amount at end of year 1,138.0 607.4
Total actuarial gains and losses of Euro 27.5 million (previous year: Euro 15.7 million) were recognised in other comprehensive income.
The pension obligations were calculated using the 2005 G actuarial tables by Klaus Heubeck and based on the following main actuarial assumptions:
Assumptions / parameters (in %) 31.12.2009 31.12.2008
Discount rate 5.25 5.75
Forecast return on plan assets 4.00 -
Future pay increases 2.50 2.50
Future pension increases 1.75 1.75
Fluctuation rate 0.00 0.00
140 EWE Annual Report 2009

Notwithstanding the assumptions mentioned above, the pension obligations calculated as of the current balance sheet date for swb are based on a salary progression of 2.0 per cent p.a., a pension progression of 1.0 per cent p.a. (plus a premium of 0.67 per cent of the DBO for expected one-off payments in lieu of adjustments to the pension, as well as an average fluctuation rate of 1.0 per cent p.a.). Obligations with historically higher adjustment rates have been measured using the adjustment rates observed in the past and expected to continue over the long term, including a pension progression of 4.0 per cent p.a.
Adjustments to the obligations from past experience are the difference between expected and actual developments. These amounted to Euro -55.1 million in the reporting year (2008: Euro +35.3 million, 2007: Euro -6.0 million, 2006: Euro +8.1 million).
The expected pension payments for 2010 amount to Euro 68.0 million.
Increasing or reducing the discount rate by one percentage point would have the following effects:
Change in discount rate in EUR million 2009 2008
Increase by 1 %
Decrease by 1 %
Increase by 1 %
Decrease by 1 %
Effect on
present value of obligations not funded externally -130.3 162.6 -65.5 83.5
current service expense in the following financial year -3.4 4.5 -1.8 2.4
interest expense on the obligation in the following financial year 3.0 -4.2 1.5 -1.9
Defined-contribution pension schemes in the EWE Group relate to the statutory retirement pension insurance. In 2009 employer contributions amounted to Euro 37.8 million (2008: Euro 23.3 million).
Statement of provisions
EUR million As at 1.1.2009
Change in group of consolidated
companies Additions ReversalsOther
changes1
Interest effects Used
As at 31.12.2009
Provisions for pensions and similar obligations 607.4 496.2 10.6 26.9 40.6 -43.7 1,138.0
Other provisions
Obligations towards staff 27.4 33.0 6.9 -3.1 -2.7 0.4 -3.4 58.5
Obligations from recul-tivation of gas caverns 66.5 8.9 -1.8 -0.2 3.2 76.6
Miscellaneous other provisions 40.3 78.0 24.6 -10.4 7.4 1.8 -5.7 136.0
Total 741.6 616.1 42.1 -15.3 31.4 46.0 -52.8 1,409.1
1 Other changes mainly relate to changes without effect on profit or loss.
141The e3-programme Management Investor Relations Social Responsibility Group Management Report Consolidated Financial Statements

Provisions relating to personnel expenses include obligations for phased early retirement and anniversaries.
Additional provisions for phased early retirement of Euro 14.6 million were recognised in the EWE Group in the course of the initial consolidation of swb. The financial assets, in particular bank balances, of Euro 12.1 million pledged as collateral for this entitlement to phased early retirement have been set off against the corresponding provision.
Change in credit balance to insure phased early retirement and long-term working hours accounts in the swb subgroup
EUR million 31.12.2009
Present value of assets as at 1.1. 12.5
Increase (addition) 1.8
Gain (interest, etc.) 0.3
Present value of assets as at 31.12. 14.6
The assets consist of Euro 4.7 million in pledged fixed-income securities and Euro 9.9 million in bank balances.
The fair values of the assets as of past balance sheet dates were as follows: 31.12.2007 Euro 10.1 million, 31.12.2006 Euro 8.5 million, 31.12.2005 Euro 8.4 million and 31.12.2004 Euro 8.1 million.
In total, the following entitlements of employees in the subgroup swb have been insured against insolvency:
Employee entitlements insured against insolvency in the swb subgroup
EUR million 31.12.2009
Phased early retirement 11.1
Employer contribution to social security for phased early retirement 2.2
Long-term working hours accounts 1.1
Employer contribution to social security for long-term working hours accounts 0.2
Total as at 31.12. 14.6
The swb subgroup expects that employee entitlements under insolvency insurance will go up slightly in 2010.
The subgroup swb accounts for Euro 12.1 million of the phased early retirement entitlements insured against insolvency. Of the phased early retirement entitlements, Euro 1.2 million relate to third-party credit balances for which swb has provided collateral.
Recultivation provisions are primarily made for the costs of recultivating natural gas caverns in the event of closure. The provisions are based on a public law obligation under the Mining Ordinance for Drilling, Underground Storage and Raw Material Extraction by Means of Drilling in Lower Saxony (BVOT) and the German Federal Mining Act (BBergG). The amount of the provisions is determined by external sur-veys. Provisions for recultivation expenses are disclosed under non-current liabilities as no recultivation
142 EWE Annual Report 2009
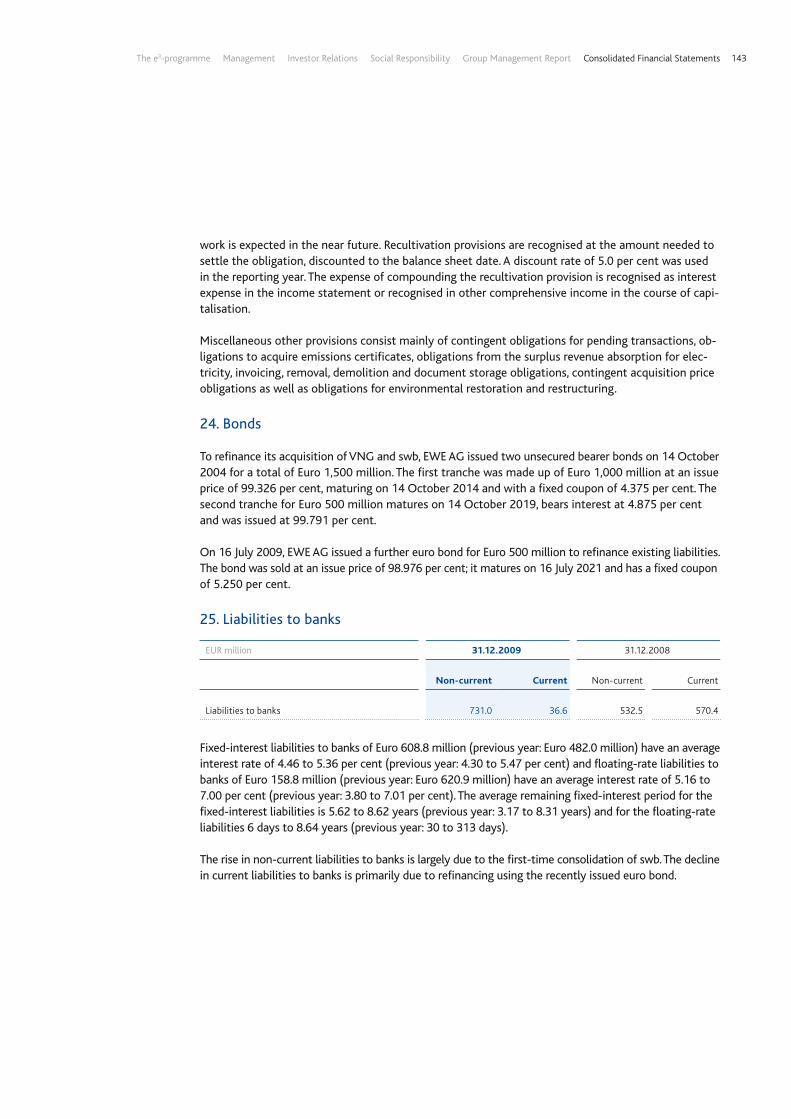
work is expected in the near future. Recultivation provisions are recognised at the amount needed to settle the obligation, discounted to the balance sheet date. A discount rate of 5.0 per cent was used in the reporting year. The expense of compounding the recultivation provision is recognised as interest expense in the income statement or recognised in other comprehensive income in the course of capi-talisation.
Miscellaneous other provisions consist mainly of contingent obligations for pending transactions, ob-ligations to acquire emissions certificates, obligations from the surplus revenue absorption for elec-tricity, invoicing, removal, demolition and document storage obligations, contingent acquisition price obligations as well as obligations for environmental restoration and restructuring.
24. Bonds
To refinance its acquisition of VNG and swb, EWE AG issued two unsecured bearer bonds on 14 October 2004 for a total of Euro 1,500 million. The first tranche was made up of Euro 1,000 million at an issue price of 99.326 per cent, maturing on 14 October 2014 and with a fixed coupon of 4.375 per cent. The second tranche for Euro 500 million matures on 14 October 2019, bears interest at 4.875 per cent and was issued at 99.791 per cent.
On 16 July 2009, EWE AG issued a further euro bond for Euro 500 million to refinance existing liabilities. The bond was sold at an issue price of 98.976 per cent; it matures on 16 July 2021 and has a fixed coupon of 5.250 per cent.
25. Liabilities to banks
EUR million 31.12.2009 31.12.2008
Non-current Current Non-current Current
Liabilities to banks 731.0 36.6 532.5 570.4
Fixed-interest liabilities to banks of Euro 608.8 million (previous year: Euro 482.0 million) have an average interest rate of 4.46 to 5.36 per cent (previous year: 4.30 to 5.47 per cent) and floating-rate liabilities to banks of Euro 158.8 million (previous year: Euro 620.9 million) have an average interest rate of 5.16 to 7.00 per cent (previous year: 3.80 to 7.01 per cent). The average remaining fixed-interest period for the fixed-interest liabilities is 5.62 to 8.62 years (previous year: 3.17 to 8.31 years) and for the floating-rate liabilities 6 days to 8.64 years (previous year: 30 to 313 days).
The rise in non-current liabilities to banks is largely due to the first-time consolidation of swb. The decline in current liabilities to banks is primarily due to refinancing using the recently issued euro bond.
143The e3-programme Management Investor Relations Social Responsibility Group Management Report Consolidated Financial Statements

26. Trade payables
Trade payables are all due within one year.
27. Other liabilities
EUR million 31.12.2009 31.12.2008
Non-current Current Non-current Current
Financial liabilities at fair value through profit and loss
Derivative financial instruments 67.6 288.5 12.8 186.1
Miscellaneous other financial liabilities 12.3
Other liabilities
Liabilities towards affiliated companies 8.6 2.2
Liabilities towards companies accounted for under the equity method 16.0 47.3
Liabilities towards investee companies 39.2 44.3
Collateral 59.9 59.2
Purchase price obligations 6.2 9.3
Sponsorship agreement with EWE Research Institute 31.4 34.6
Research and development 21.6
Accrued interest on bonds 26.9 14.7
Liabilities from contract production 4.6 1.4
Liabilities towards staff 6.4 25.3 10.7
Miscellaneous other financial liabilities 8.2 101.1 10.6 51.3
Financial liabilities 135.2 576.3 58.0 438.8
Own-use electricity trading 64.8
Tax liabilities 38.2 31.7
Payments received on account 15.0 0.1 39.5
Miscellaneous other non-financial liabilities 8.8 21.1 3.4 1.5
Non-financial liabilities 8.8 139.1 3.5 72.7
Total 144.0 715.4 61.5 511.5
The liabilities towards affiliated companies relate to non-consolidated equity investments.
Collateral relates to payments that Bursagaz and Kayserigaz receive from all new customers when the contract is signed and which are repayable on termination of the contract. The liabilities are classified as current as customers can terminate the contracts at any time.
144 EWE Annual Report 2009

28. Deferred taxes
Deferred tax assets of Euro 12.5 million (previous year: Euro 6.8 million) and deferred tax liabilities of Euro 474.6 million (previous year: Euro 236.8 million) primarily result from taxable temporary differences.
Deferred tax assets and liabilities relate to the following items:
EUR million 31.12.2009 31.12.2008
Assets Liabilities Assets Liabilities
Non-current assets 16.6 748.9 10.8 383.3
Current assets 4.1 147.1 4.7 78.2
Construction subsidies 176.8 101.9
Pension provisions 100.2 19.5 63.6 24.5
Other provisions 41.8 36.3 24.1 16.5
Borrowings 150.9 2.0 68.6 1.3
490.4 953.8 273.7 503.8
Tax losses carried forward 1.3 0.1
Gross amount 491.7 953.8 273.7 503.8
Offsetting -479.2 -479.2 -267.0 -267.0
Net amount 12.5 474.6 6.8 236.8
Of the net deferred tax assets, Euro 0.8 million (previous year: Euro 0.3 million) have a term of more than one year. Net deferred tax liabilities of Euro 29.8 million (previous year: Euro 22.4 million) will be realised within one year and Euro 444.8 million (previous year: Euro 214.4 million) will be realised later than twelve months.
Deferred tax assets for tax losses carried forward are recognised to the extent that it is probable that tax benefits will be realised by future taxable profits. It is sufficiently certain that the benefits from these tax losses carried forward will be realised.
At the end of the reporting year, the amount of tax loss carry forwards for which no deferred tax assets were recognised was Euro 7.6 million (previous year: Euro 6.9 million). Of the tax losses carried forward, Euro 2.5 million will expire within one year and Euro 4.1 million between two and five years. Of the tax losses carried forward, Euro 0.7 million can be carried forward indefinitely.
No deferred tax assets are recognised for these tax loss carry forwards as it is not probable that the tax benefits will be realised in the foreseeable future.
Temporary differences for which no deferred tax claims were recognised in the balance sheet amounted to Euro 0.6 million.
145The e3-programme Management Investor Relations Social Responsibility Group Management Report Consolidated Financial Statements
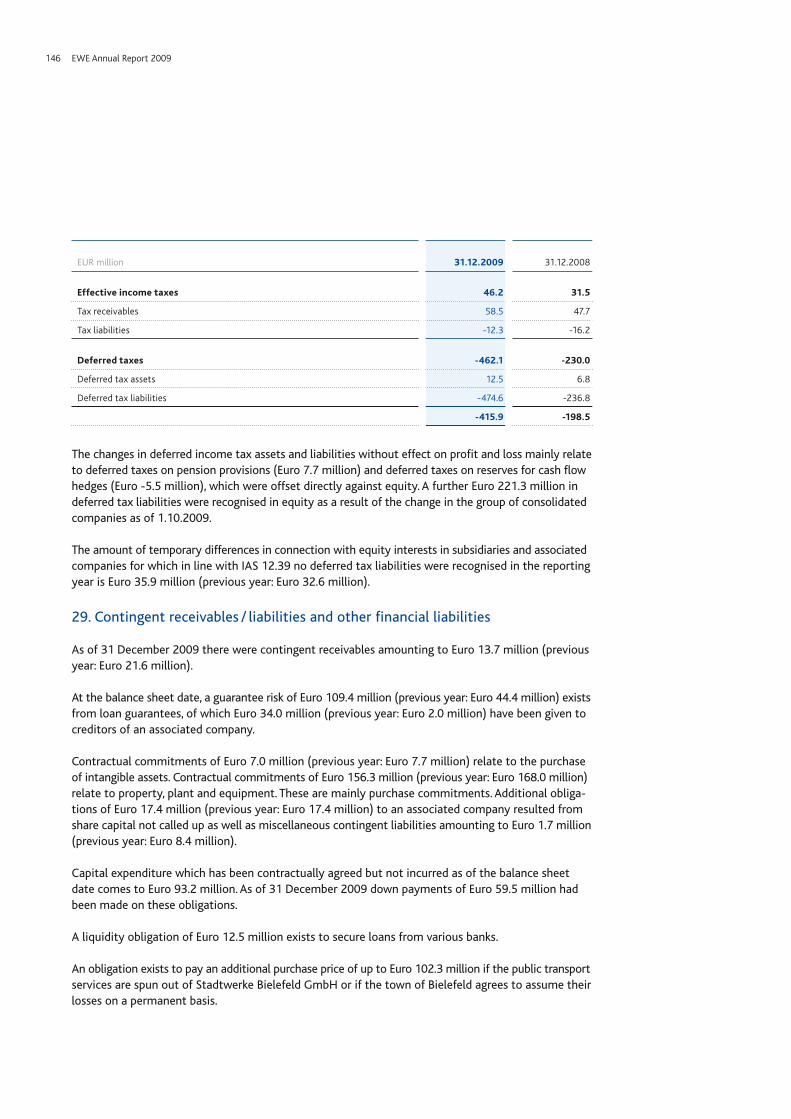
EUR million 31.12.2009 31.12.2008
effective income taxes 46.2 31.5
Tax receivables 58.5 47.7
Tax liabilities -12.3 -16.2
Deferred taxes -462.1 -230.0
Deferred tax assets 12.5 6.8
Deferred tax liabilities -474.6 -236.8
-415.9 -198.5
The changes in deferred income tax assets and liabilities without effect on profit and loss mainly relate to deferred taxes on pension provisions (Euro 7.7 million) and deferred taxes on reserves for cash flow hedges (Euro -5.5 million), which were offset directly against equity. A further Euro 221.3 million in deferred tax liabilities were recognised in equity as a result of the change in the group of consolidated companies as of 1.10.2009.
The amount of temporary differences in connection with equity interests in subsidiaries and associated companies for which in line with IAS 12.39 no deferred tax liabilities were recognised in the reporting year is Euro 35.9 million (previous year: Euro 32.6 million).
29. Contingent receivables / liabilities and other financial liabilities
As of 31 December 2009 there were contingent receivables amounting to Euro 13.7 million (previous year: Euro 21.6 million).
At the balance sheet date, a guarantee risk of Euro 109.4 million (previous year: Euro 44.4 million) exists from loan guarantees, of which Euro 34.0 million (previous year: Euro 2.0 million) have been given to creditors of an associated company.
Contractual commitments of Euro 7.0 million (previous year: Euro 7.7 million) relate to the purchase of intangible assets. Contractual commitments of Euro 156.3 million (previous year: Euro 168.0 million) relate to property, plant and equipment. These are mainly purchase commitments. Additional obliga-tions of Euro 17.4 million (previous year: Euro 17.4 million) to an associated company resulted from share capital not called up as well as miscellaneous contingent liabilities amounting to Euro 1.7 million (previous year: Euro 8.4 million).
Capital expenditure which has been contractually agreed but not incurred as of the balance sheet date comes to Euro 93.2 million. As of 31 December 2009 down payments of Euro 59.5 million had been made on these obligations.
A liquidity obligation of Euro 12.5 million exists to secure loans from various banks.
An obligation exists to pay an additional purchase price of up to Euro 102.3 million if the public trans port services are spun out of Stadtwerke Bielefeld GmbH or if the town of Bielefeld agrees to assume their losses on a permanent basis.
146 EWE Annual Report 2009

In addition, there are defined-contribution pension obligations.
Long-term, market-standard supply contracts are in place for the purchase of electricity and gas.
30. Leases
Operating leasing
Financial obligations under operating leases relate primarily to real estate, office buildings, branch offices, warehouses, wind farms, vehicles, combined heat and power plants, telecommunications apparatus and other property, plant and equipment. The leases have different terms and conditions. The lease payments for office buildings are regularly adjusted in line with price indices.
The following table shows future accumulated minimum lease payments from uncancellable operating leases:
EUR million 31.12.2009 31.12.2008
Up to one year 23.5 13.3
After between one and five years 66.1 23.7
After more than five years 30.6 28.1
Total 120.2 65.1
Minimum lease payments of Euro 20.9 million and contingent rental payments of Euro 0.6 million were recognised in profit and loss in the 2009 reporting period.
31. Additional disclosures on financial instruments
Capital management
Long-term capital management at the EWE Group is based on an analysis of the optimal capital structure considering both equity and borrowings. Optimising the capital structure means minimising the total cost of capital and implies a target rating in the A band for the EWE Group.
Shareholders’ equity consists of equity attributable to shareholders of the parent company and mi-nority interests.
Shareholders’ equity and the balance sheet total have developed as follows:
EUR million 31.12.2009 31.12.2008
Total shareholders’ equity 3,409.8 2,002.2
Equity ratio 32.6 % 27.3 %
Balance sheet total 10,453.9 7,347.1
147The e3-programme Management Investor Relations Social Responsibility Group Management Report Consolidated Financial Statements

Risk management and derivative financial instruments
Both primary and derivative financial instruments are disclosed under financial instruments.
The Board of Management lays down the basic financial policy. Implementing the financial policy is the responsibility of the Finance and Investor Relations department and the Energy Trading division of the EWE Group and of the Finance department and Portfolio Management department of the swb sub-group. The specialist departments identify, measure and hedge financial risks in close cooperation with the operating units in the EWE Group. The prior approval of the Board of Management is required for certain transactions. The Board of Management is also informed on a regular basis about the extent and total of the risk exposure.
On the assets side, primary financial instruments are mainly composed of equity investments recognised at cost of acquisition, and loans, trade receivables, other monetary receivables and cash carried at am-ortised cost. As liabilities, the primary financial instruments are principally made up of bonds, liabilities to banks, trade payables and other liabilities held at amortised cost. The amount of primary financial instruments is disclosed in the balance sheet. The maximum default risk is for the equivalent carrying amount. To the extent that default risks have been identified, impairment allowances have been rec-ognised.
Derivative financial instruments are used to limit the price risks relating to exchange rates, interest rates and commodities to which the EWE Group is exposed. The Finance and Investor Relations department is responsible for the financial risk management of exchange rate and interest rate risks. Commodity risks are limited by systematic risk management in the Energy Trading division of the EWE Group and the Portfolio Management department of the swb subgroup.
EUR million Nominal volume Positive market values Negative market values
31.12.2009 31.12.2008 31.12.2009 31.12.2008 31.12.2009 31.12.2008
Non-current Current Current Non-current Current Non-current Current
Currency derivatives
Forwards (outside hedging relationships) -0,3 0,1 0,9 0,1 0,1
Forwards (in connection with cash flow hedges) 168,4 1,2 3,2 3,2 2,0
Interest rate derivatives
Other (outside hedging relationships) 102,2 0,2 2,1 2,6
Other (in connection with cash flow hedges) 30,0 2,3
Commodity derivatives
Electricity futures contracts (outside hedging relationships) 1.909,0 1.968,2 27,9 218,3 164,8 39,4 229,7 166,6
Commodity derivatives (outside hedging relationships) 17,0 40,8 2,5 13,0 1,7 2,5 14,6 9,2
Commodity derivatives (in connection with cash flow hedges) 163,9 4,1 4,5 10,7 27,1
Commodity derivatives (in connection with fair value hedges) 66,4 22,8 1,0 1,1 0,3 2,0 9,0
Other derivatives
Options (outside hedging relationships) 422,4 26,3 12,3 7,0 10,4 12,8 1,3
Total 2.879,0 2.058,1 37,0 241,0 178,8 67,6 288,5 12,8 186,1
Derivative financial instruments
148 EWE Annual Report 2009

The aim of financial risk management is to identify exchange rate and interest rate risks arising in the course of ongoing operating and financing activities and, depending on the risk assessment, to limit these risks by hedging. Only those exchange rate and interest rate risks which affect Group cash flow are hedged. Derivative financial instruments may not be used for speculative purposes.
Derivative financial instruments
As of the balance sheet date hedging transactions were in place for oil price risks under gas supply contracts, electricity futures, coal swaps, AAU and CER transactions, foreign currency derivatives and interest rate derivatives. Only business partners with excellent credit ratings are considered.
The market values of derivative financial instruments are dependent on movements in the underlying market factors. Individual measurement is made using the market data available on the valuation date.
The nominal volume of gas price hedges and electricity futures is shown without offsetting; it corre-sponds to the total of all open purchase and sales amounts on which these transactions are based. The nominal volume allows conclusions to be drawn about the degree to which derivative financial instru-ments are used, but does not represent the risk incidental to the use of the financial instruments.
The fair value is equal to the sum of positive and negative market values on the reporting date for the relevant transactions. The market prices are based on the official closing rates at the European Energy Exchange (EEX) or, for gas price hedges, on the latest futures prices from Bayerische Landesbank, J.P. Morgan and the information provider ICIS Heren.
EUR million Nominal volume Positive market values Negative market values
31.12.2009 31.12.2008 31.12.2009 31.12.2008 31.12.2009 31.12.2008
Non-current Current Current Non-current Current Non-current Current
Currency derivatives
Forwards (outside hedging relationships) -0,3 0,1 0,9 0,1 0,1
Forwards (in connection with cash flow hedges) 168,4 1,2 3,2 3,2 2,0
Interest rate derivatives
Other (outside hedging relationships) 102,2 0,2 2,1 2,6
Other (in connection with cash flow hedges) 30,0 2,3
Commodity derivatives
Electricity futures contracts (outside hedging relationships) 1.909,0 1.968,2 27,9 218,3 164,8 39,4 229,7 166,6
Commodity derivatives (outside hedging relationships) 17,0 40,8 2,5 13,0 1,7 2,5 14,6 9,2
Commodity derivatives (in connection with cash flow hedges) 163,9 4,1 4,5 10,7 27,1
Commodity derivatives (in connection with fair value hedges) 66,4 22,8 1,0 1,1 0,3 2,0 9,0
Other derivatives
Options (outside hedging relationships) 422,4 26,3 12,3 7,0 10,4 12,8 1,3
Total 2.879,0 2.058,1 37,0 241,0 178,8 67,6 288,5 12,8 186,1
149The e3-programme Management Investor Relations Social Responsibility Group Management Report Consolidated Financial Statements

exchange rate risks
Exchange rate risk is the risk of changes in the fair value or future cash flows of a financial instrument denominated in a foreign currency due to changes in exchange rates.
The EWE Group’s exchange rate risks can result from capital expenditure, financing activities and the operating business. Risks from foreign currencies are hedged if they significantly affect Group cash flow. Exchange rate differences from translating financial statements in a foreign currency into the Group’s presentation currency are not hedged. However, EWE AG can hedge this foreign currency risk if required.
In the area of investing activities, foreign currency risks result in part from the acquisition of share-holdings in foreign companies and the procurement of materials for construction projects from foreign suppliers who issue invoices in a foreign currency. In the reporting year, hedge accounting presented in the balance sheet included, among other things, hedging via currency futures for the exchange rate risk resulting from the acquisition of a Turkish shareholding.
In terms of operating activities, exchange rate risks arise from the invoicing of raw materials supplies in foreign currencies. In the reporting year, in addition to the exchange rate exposure from gas supplies to a Group company, in particular, price risks from coal procurement were hedged.
Cash flow hedges therefore exist to hedge exchange rate risks from future purchases of shares in sub-sidiaries and associated companies as well as to hedge the risk of invoicing in foreign currencies for sup-plies of raw materials. The hedging instruments used are generally currency futures and / or currency options. Currency futures meet the requirements of hedge accounting, they are highly effective and changes in the market value of these financial instruments are accounted for during their term using hedge accounting. This also applies to the inner value of currency options, to the extent that any such arises as a result of currency movements. Effective changes in the fair value of hedges are recognised directly in other comprehensive income. The ineffective or undesignated part of the profit or loss from the hedging instrument is recognised immediately in profit and loss. The accumulated profit contribu-tion from the hedge is derecognised in equity in the hedging reserve when the underlying transactions are realised and subsequently recognised as an adjustment in the acquisition cost of the shares (basis adjustment).
At the reporting date the recognised fair values of currency derivatives used as cash flow hedges were made up of positive market values of Euro 4.4 million (previous year: Euro 0.0 million) and negative market values of Euro 5.2 million (previous year: Euro 0.0 million). In the reporting year the effective part of cash flow hedges came to Euro 1.7 million (previous year: Euro 9.5 million) and was recognised in other comprehensive income. In the previous year expenses resulting from the ineffective part of cash flow hedges amounted to Euro 28,000; this amount was transferred in full from equity and rec-ognised in profit and loss for the period. In the previous year Euro 9.5 million was reallocated from the hedging reserve in equity for the purpose of adjusting the carrying amount of the underlying transactions.
The effectiveness of the hedging relationship is checked prospectively and retrospectively at every balance sheet date via an effectiveness test using the critical term match method and the dollar offset method.
The following table shows the sensitivity of the Group result before taxes and of shareholders’ equity (due to changes in the fair value of coal swaps and currency futures) to movements in the exchange rate for the US dollar that can reasonably be considered possible. This is based on EWE Group’s as-sumption that the coal swaps and currency futures used as hedging instruments constitute a highly effective hedging relationship. All other variables remain constant.
150 EWE Annual Report 2009

Overview of foreign currency risk
Change in exchange rate
US dollar
Effect on share-holders’ equity
in Euro ‘000
2009
Coal swaps +0.01 eUR / US$ -2,392
-0.01 EUR / US$ 2,392
Currency futures +0.01 eUR / US$ 2,192
-0.01 EUR / US$ -2,192
2008
Coal swaps +0.01 eUR / US$ -2,465
-0.01 EUR / US$ 2,465
Currency futures +0.01 eUR / US$ 2,941
-0.01 EUR / US$ -2,941
The exchange rate risk of the coal swaps and currency futures relates to the transactions carried out at year-end in the course of hedge accounting.
Interest rate risks
Interest rate risk is the risk of changes in the fair value or future cash flows of a financial instrument due to changes in market interest rates.
The EWE Group is exposed to interest rate risks which may have an effect on profit and loss. Taking the existing and the planned borrowings structure into account, the Finance and Investor Relations depart-ment can use interest rate derivatives to adjust the type of interest paid on financial instruments.
Management of interest expense for the Group is carried out using a combination of fixed and floating-rate borrowings. The EWE Group aims for a large part of its borrowing to be at fixed interest rates. To achieve this aim, the Group has taken out interest rate swaps to hedge non-current floating-rate fi-nancial liabilities, under which the Group swaps the difference between fixed and variable interest on a previously agreed nominal amount with a financial counterparty at regular intervals. These interest rate swaps hedge the underlying obligation.
In 2007 the swb subgroup took out borrower’s note loans for Euro 130 million at floating interest rates. Interest is set every three months based on 3-month EURIBOR plus a fixed margin. To hedge against interest rate risks the swb subgroup entered into interest rate swaps in which it receives cash flows at a variable rate and pays cash flows at a fixed rate. Insofar as these interest rates swaps meet the re-quirements of hedge accounting, namely in terms of their effectiveness as hedges, the changes in the market value of these financial instruments are accounted for during their term using hedge accounting. As of 31 December 2009 these interest rates swaps, which expire in 2014 at the latest, related to a nominal volume of Euro 30 million and had a negative market value of Euro 2.3 million. The interest rate hedges with a nominal volume of Euro 100 million that are not included in hedge accounting had a negative market value of Euro 4.4 million and a positive market value of Euro 0.2 million as of 31 December 2009. In the reporting year the effective portion of cash flow hedges of Euro 0.1 million (previous year: Euro 0.0 million) was recognised in other comprehensive income.
151The e3-programme Management Investor Relations Social Responsibility Group Management Report Consolidated Financial Statements
Interest rate risks for primary financial instruments are assessed using individual sensitivity analyses. This method shows the effect, if any, of changes in market interest rates on interest income and ex-pense, other items of the income statement and on equity. The sensitivity analyses for interest rate risk are based on the following assumptions:
Changes in the market interest rates for fixed-interest primary financial instruments only have an effect on profit and loss for the period if these are carried at fair value. Fixed-interest financial instruments carried at amortised cost are not subject to interest rate risk.
Changes in the market interest rates of floating-rate primary financial instruments always affect net interest income / expense. They have an effect on profit and loss for the period and are therefore in-cluded in the sensitivity analyses.
The analysis is carried out on the basis of average totals of floating-rate financial instruments as the year-end totals are not representative.
If the market interest rate had been 100 base points higher (lower) on average over the year, earnings and shareholders’ equity would have been Euro 1.6 million (2008: Euro 3.0 million) lower (higher). The hypothetical effect on earnings stems from the floating-rate primary financial instruments.
Other price risks
Other price risks are the risks of changes in the fair value or future cash flows of a financial instrument due to market risks other than those previously mentioned. For the EWE Group this concerns price risks for commodities.
EWE Group is confronted with risks as a result of its operations on wholesale markets for electricity and gas as well as in coal procurement. Systematic risk management is used to limit these risks, the frame-work, responsibilities and control mechanisms for which are laid down in internal risk guidelines. Respon-sibility for risk management at EWE AG lies with the Energy Trading division, and the Risk Controlling team monitors compliance with the guidelines. Energy Trading and Risk Controlling act independently of one another and report to different members of the Board of Management.
Risk items are evaluated on a daily basis, and structured figures together with an analysis are presented to the Board of Management in a monthly report. The risks arising from commodity derivatives which are relevant to EWE AG as well as the instruments for measuring and limiting risk are described below.
Market risks in electricity trading at eWe AG
To measure, manage and limit the market price risks which affect the whole electricity trading portfolio, a dynamic loss limit is used to limit possible losses from open positions during the planning period. The amount of the limit is determined for each supply year and the Risk Controlling team monitors com-pliance on a regular basis.
152 EWE Annual Report 2009

As the mark-to-market procedure used in connection with the dynamic loss limit does not supply in-formation on the risk of future market price movements, sensitivity analyses in the form of scenarios and stress testing are used as necessary.
Although scenarios and stress tests can illustrate the effects of potential future price movements on the value of the current portfolio, they are only used for individual analyses as the underlying as-sumptions cannot be derived in a standardised way.
In order to assess portfolio risk based on realistic future fluctuations in market prices, a risk value is calculated using a value at risk approach (VaR). A Monte Carlo simulation is performed with a 95 per cent probability range and a holding period of five days.
The following table shows the value at risk figures for three or four successive years as well as total value at risk. The figure for total value at risk is not equal to the sum of the individual value at risk figures due to the effects of correlation.
Value at risk
EUR million 2009 2008
Delivery period
2009 0.9
2010 1.2 1.3
2011 0.1 0.5
2012 0.1 1.2
Total 1.2 2.2
Market risks in gas trading at eWe AG
In contrast to the gas supply contracts with end customers which are tied to the oil price, supply con-tracts with end customers which have a fixed gas price are subject to a market risk. To eliminate this risk, the Energy Trading division concludes futures contracts in the form of oil swaps or TTF-based hedges, taking into account the individual terms of supply.
153The e3-programme Management Investor Relations Social Responsibility Group Management Report Consolidated Financial Statements

Coal hedging / CO2 certificates at the swb subgroup
The main market risks for financial instruments at the swb subgroup relate to changes in the price of coal. The following table shows the sensitivity of shareholders’ equity at the swb subgroup to changes in the coal price (due to changes in the fair value of coal swaps) that can reasonably be considered pos-sible, as quoted in US dollars on the API-2 index. This is based on EWE Group’s assumption that the coal swaps used as hedging instruments constitute a highly effective hedging relationship. Hedging trans-actions are in place for coal deliveries up to 2014, meaning that different delivery prices are possible depending on the settlement date. The sensitivity analysis assumes an even rise in coal prices across all delivery dates; the effects were translated from US dollars into euros at each reporting date.
Overview of market price risk for coal
Price developments in the API-2 index
Effect on shareholders’
equity in EUR ’000
2009
Coal swaps +1 USD / t 1,527
-1 USD / t -1,527
2008
Coal swaps +1 USD / t 1,900
-1 USD / t -1,900
Currency futures, currency options and coal swaps are used to hedge price risks in coal procurement. In addition, the amount of CO2 certificates required in future is calculated on the basis of the NAP II rules in order to hedge the price. Certificates are purchased in accordance with the risk guideline, whereby both AAU and CER are used.
Cash flow hedges and fair value hedges for commodities
At the reporting date the recognised fair values of derivatives used as cash flow hedges for commodities were made up of positive market values of Euro 8.6 million (previous year: Euro 0.0 million) and negative market values of Euro 37.8 million (previous year: Euro 0.0 million). In the reporting year the effective part of cash flow hedges came to Euro 10.1 million (previous year: Euro 0.0 million) and was recognised in other comprehensive income.
Fair value hedges for commodities to hedge against gas price risks resulting from future sales are also rec-ognised. Oil swaps or TTF-based hedges are used as hedging instruments. When using fair value hedges, both the underlying transaction and the derivative are recognised at fair value through profit and loss in terms of the hedged risk. Value changes in the underlying transactions are compensated for by valua-tion changes in the derivatives. For the fair value of the derivatives, valuation changes totalling Euro 8.9 million (previous year: Euro 9.0 million) were recognised in profit and loss in the reporting year. The corresponding market value fluctuations of the underlying transactions were recognised for the same amount in the income statement. The fair values of derivatives used in fair value hedges were made up of negative market values of Euro 2.3 million (previous year: Euro 9.0 million) and positive market values of Euro 2.1 million (previous year: Euro 0.0 million).
154 EWE Annual Report 2009

The effectiveness of the hedging relationship is checked prospectively and retrospectively at every balance sheet date via an effectiveness test using the critical term match method and the dollar offset method.
Default risks
Default risks on receivables
Default risk describes the threat of economic loss if a business or trading partner is not able to meet its contractual obligations. The maximum default risk is the carrying amount of the financial assets recognised in the balance sheet. In the operating business, trade receivables are monitored continually. Default risk is accounted for by recognising individual impairment allowances and generalised impair-ment allowances. As of the balance sheet date there were no significant agreements which would di-minish the maximum default risk.
In connection with the investment of cash and cash equivalents, the EWE Group is exposed to losses from credit risk if the counterparty does not meet their contractual payment obligations. Cash and cash equivalents are therefore invested solely with banks as overnight and term deposits and in money market funds with daily redemption and excellent credit ratings. Risk is also managed by diversifying across counterparties by means of a limit system.
155The e3-programme Management Investor Relations Social Responsibility Group Management Report Consolidated Financial Statements

Default risks in energy trading at eWe AG
Trading transactions can give rise to risks in that the counterparty and trading partner is insolvent or unable to deliver. The risk can come to bear if the trading partner defaults (e.g. in the case of bankruptcy) and can consist of:
Loss of receivables for physical merchandise and financial transactions,•
Repurchase risk for purchase contracts if prices have since risen,•
Non-acceptance risk for sales contracts if prices have since dropped.•
Potential default risks are limited, among other things, by means of specific clauses in framework agree-ments with trading partners. These framework agreements lay down the general terms for individual contracts in order to allow them to be carried out efficiently. Together with the joint arrangements for amending the framework agreement – normally a framework agreement from the European Federation of Energy Traders (EFET) – they contribute to ensuring that business is orderly and risk-focused. The frame work agreements include clauses on any collateral to be provided or on measures to protect the parties from losses due to insolvency.
The credit risk associated with energy trading partners is, however, considered to be low as business is only conducted with trading partners with excellent credit ratings. To determine their credit score, all trading partners are subject to an internal ranking at least once a year. After they have been classified in a rating category, a limit is set for the maximum market value of open positions with this partner. The internal credit scoring includes both quantitative and qualitative factors. If available, the results of ex-ternal rating agencies and providers of commercial information (Standard & Poor’s, Moody’s, Fitch, D & B) are used wherever possible. Transactions are only permitted with trading partners for whom a euro limit has been set and who have not reached their limit. The Energy Trading division is obliged to ensure that the limits are not exceeded. The Risk Controlling team monitors compliance with limits on a regular basis.
EUR million CASH FLOWS
Carrying amount 31.12.09
< 1 year 1 – 5 years > 5 years
Interest fixed
Interest floating Repayment
Interest fixed
Interest floating Repayment
Interest fixed
Interest floating Repayment
Primary financial liabilities:
Bonds 1,988.9 94.4 377.5 1,000.0 305.6 1,000.0
Liabilities to banks 767.6 30.8 2.3 24.7 105.4 7.5 271.0 38.9 2.6 460.9
Trade payables 690.6 690.6
Other financial liabilities 355.4 1.3 0.3 286.1 2.5 0.3 40.9 0.2 0.2 14.5
Derivative financial liabilities:
Currency derivatives 5.4 2.1 3.3
Interest rate derivatives 7.0 2.6 4.4
Electricity derivatives (not own-use) 269.1 229.7 39.4
Other commodity derivatives (not own-use) 57.2 43.7 13.5
Other derivatives 17.4 10.4 7.0
Presentation of contractually agreed (non-discounted) interest and principle repayments for the primary financial liabilities and the derivative financial instruments with a positive or negative fair value:
156 EWE Annual Report 2009
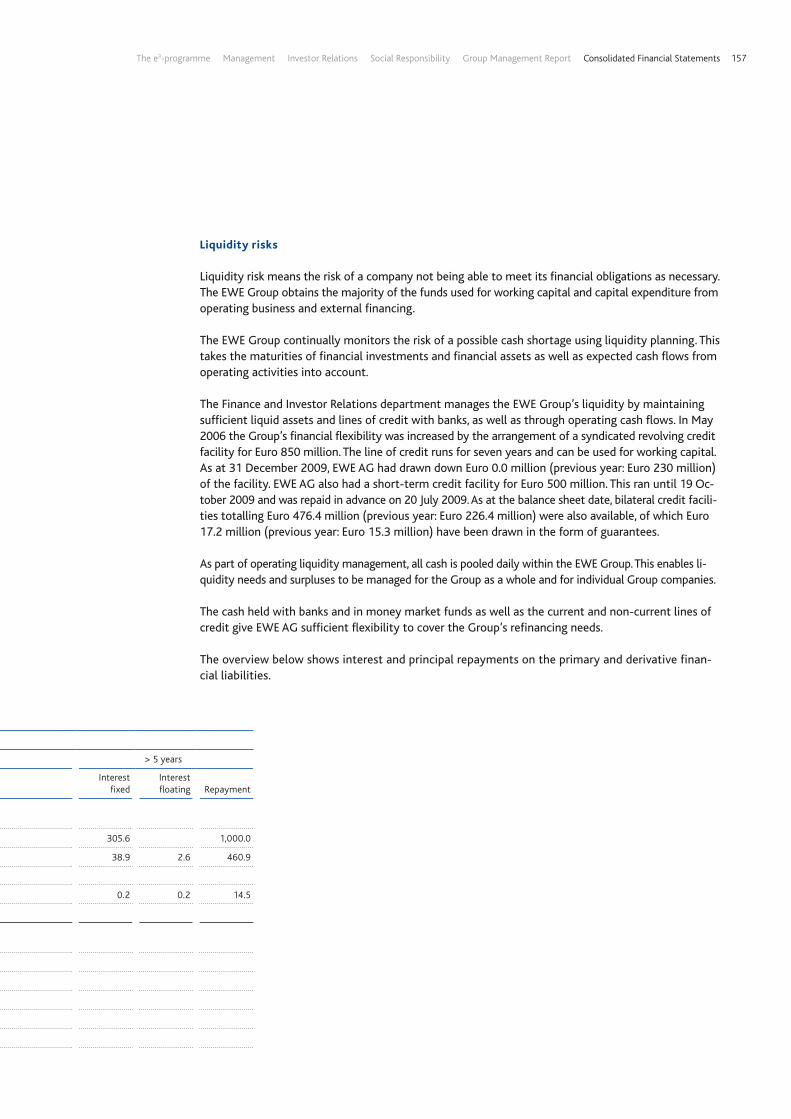
Liquidity risks
Liquidity risk means the risk of a company not being able to meet its financial obligations as necessary. The EWE Group obtains the majority of the funds used for working capital and capital expenditure from operating business and external financing.
The EWE Group continually monitors the risk of a possible cash shortage using liquidity planning. This takes the maturities of financial investments and financial assets as well as expected cash flows from operating activities into account.
The Finance and Investor Relations department manages the EWE Group’s liquidity by maintaining sufficient liquid assets and lines of credit with banks, as well as through operating cash flows. In May 2006 the Group’s financial flexibility was increased by the arrangement of a syndicated revolving credit facility for Euro 850 million. The line of credit runs for seven years and can be used for working capital. As at 31 December 2009, EWE AG had drawn down Euro 0.0 million (previous year: Euro 230 million) of the facility. EWE AG also had a short-term credit facility for Euro 500 million. This ran until 19 Oc-tober 2009 and was repaid in advance on 20 July 2009. As at the balance sheet date, bilateral credit facili-ties totalling Euro 476.4 million (previous year: Euro 226.4 million) were also available, of which Euro 17.2 million (previous year: Euro 15.3 million) have been drawn in the form of guarantees.
As part of operating liquidity management, all cash is pooled daily within the EWE Group. This enables li-quidity needs and surpluses to be managed for the Group as a whole and for individual Group companies.
The cash held with banks and in money market funds as well as the current and non-current lines of credit give EWE AG sufficient flexibility to cover the Group’s refinancing needs.
The overview below shows interest and principal repayments on the primary and derivative finan-cial liabilities.
EUR million CASH FLOWS
Carrying amount 31.12.09
< 1 year 1 – 5 years > 5 years
Interest fixed
Interest floating Repayment
Interest fixed
Interest floating Repayment
Interest fixed
Interest floating Repayment
Primary financial liabilities:
Bonds 1,988.9 94.4 377.5 1,000.0 305.6 1,000.0
Liabilities to banks 767.6 30.8 2.3 24.7 105.4 7.5 271.0 38.9 2.6 460.9
Trade payables 690.6 690.6
Other financial liabilities 355.4 1.3 0.3 286.1 2.5 0.3 40.9 0.2 0.2 14.5
Derivative financial liabilities:
Currency derivatives 5.4 2.1 3.3
Interest rate derivatives 7.0 2.6 4.4
Electricity derivatives (not own-use) 269.1 229.7 39.4
Other commodity derivatives (not own-use) 57.2 43.7 13.5
Other derivatives 17.4 10.4 7.0
157The e3-programme Management Investor Relations Social Responsibility Group Management Report Consolidated Financial Statements

Carrying amounts, basis of recognition and fair values according to measurement categories
EUR million
Measurement category
under IAS 39
Carrying amount
31.12.2009 BASIS OF ReCOGNITION UNDeR IAS 39Fair value
31.12.2009
Amortised cost
Acquisition cost
Fair value through profit
and loss
Assets
Other non-current assets
Loans and receivables LaR 47.6 47.6 48.0
Available-for-sale financial assets1 AfS 162.4 162.4 162.4
Financial assets at fair value through profit and loss
Derivatives outside hedging relationships (held for trading) FAHfT 30.7 30.7 30.7
Derivatives in a hedging relationship n.a. 6.3 6.3 6.3
Trade receivables LaR 732.2 732.2 732.2
Other receivables and assets LaR 163.0 163.0 163.0
Cash and cash equivalents LaR 604.5 604.5 604.5
Financial assets at fair value through profit and loss (current)
Derivatives outside hedging relationships (held for trading) FAHfT 232.2 232.2 232.2
Derivatives in a hedging relationship n.a. 8.8 8.8 8.8
Miscellaneous other financial assets FAHfT
equity and liabilities
Bonds FLAC 1,988.9 1,988.9 2,093.2
Liabilities to banks FLAC 767.6 767.6 821.0
Trade payables FLAC 690.6 690.6 690.6
Other liabilities FLAC 355.4 355.4 355.4
Financial liabilities at fair value through profit and loss
Derivatives outside hedging relationships (held for trading) FLHfT 308.5 308.5 308.5
Derivatives in a hedging relationship n.a. 47.6 47.6 47.6
Miscellaneous other financial liabilities FLHfT
Of which aggregated by measurement category under IAS 39:
Loans and receivables (LaR) 1,547.3 1,547.3 1,547.7
Available-for-sale financial assets (AfS) 162.4 162.4 162.4
Financial assets held for trading (FAHfT) 262.9 262.9 262.9
Financial liabilities measured at amortised cost (FLAC) 3,802.5 3,802.5 3,960.2
Financial liabilities held for trading (FLHfT) 308.5 308.5 308.5
1 Previous year’s figures adjusted
158 EWE Annual Report 2009

EUR million
Measurement category
under IAS 39
Carrying amount
31.12.2008 BASIS OF ReCOGNITION UNDeR IAS 39Fair Value
31.12.2008
Amortised cost
Acquisition cost
Fair value through profit
and loss
Assets
Other non-current assets
Loans and receivables LaR 18.7 18.7 18.7
Available-for-sale financial assets1 AfS 113.2 113.2 113.2
Financial assets at fair value through profit and loss
Derivatives outside hedging relationships (held for trading) FAHfT
Derivatives in a hedging relationship n.a.
Trade receivables LaR 684.3 684.3 684.3
Other receivables and assets LaR 145.4 145.4 145.4
Cash and cash equivalents LaR 223.0 223.0 223.0
Financial assets at fair value through profit and loss (current)
Derivatives outside hedging relationships (held for trading) FAHfT 178.8 178.8 178.8
Derivatives in a hedging relationship n.a.
Miscellaneous other financial assets FAHfT 1.2 1.2 1.2
equity and liabilities
Bonds FLAC 1,494.9 1,494.9 1,490.0
Liabilities to banks FLAC 1,102.9 1,102.9 1,140.2
Trade payables FLAC 539.5 539.5 539.5
Other liabilities FLAC 285.6 285.6 285.6
Financial liabilities at fair value through profit and loss
Derivatives outside hedging relationships (held for trading) FLHfT 189.9 189.9 189.9
Derivatives in a hedging relationship n.a. 9.0 9.0 9.0
Miscellaneous other financial liabilities FLHfT 12.3 12.3 12.3
Of which aggregated by measurement category under IAS 39:
Loans and receivables (LaR) 1,071.4 1,071.4 1,071.4
Available-for-sale financial assets (AfS) 113.2 113.2 113.2
Financial assets held for trading (FAHfT) 180.0 180.0 180.0
Financial liabilities measured at amortised cost (FLAC) 3,422.9 3,422.9 3,455.3
Financial liabilities held for trading (FLHfT) 202.2 202.2 202.2
1 Previous year’s figures adjusted
159The e3-programme Management Investor Relations Social Responsibility Group Management Report Consolidated Financial Statements

The carrying amounts of other non-current assets are generally equal to fair value. The available-for-sale financial assets are non-consolidated shareholdings that are not traded on an active market and whose fair value cannot be reliably determined. These financial instruments are measured at cost.
Trade receivables, other receivables and assets as well as cash and cash equivalents have short residual maturities. Their carrying amounts on the reporting date are therefore generally equal to fair value.
The EWE Group trades derivative financial instruments with various partners, especially market partners with sound credit ratings. The derivatives measured using input parameters observable on a market primarily include interest rate swaps, currency futures and options, coal swaps and CO2 forwards. The most common measurement methods include forward price and swap models that calculate present values. The models include a range of forward rates, e.g. currency spot and futures rates, yield curves and forward rates for the underlying commodities.
One derivative was measured using input parameters not observable on a market, but based on an options pricing model. The parameter not observable on a publicly quoted market was the current value of the option item, which was measured using forecast discounted cash flows and discount rates cur-rently applicable to items with comparable terms and risk characteristics.
The fair value of publicly listed bonds is equal to the nominal amount multiplied by the quoted price on the reporting date. As at 31 December 2009 the fair value of the bonds is higher than their carrying amount.
The fair value of liabilities to banks is determined as the present value of debt-related payments based on the relevant interest rate curve.
Trade payables and other liabilities mostly have short residual maturities and the carrying amounts are therefore generally equivalent to fair value.
Net results according to measurement category
EUR million From interest From subsequent measurement Net result
At fair valueCurrency
translationImpairment allowance
2009 2008 2009 2008 2009 2008 2009 2008 2009 2008
Loans and receivables (LaR) 67.1 16.3 -1.5 -0.8 -5.0 -5.1 60.6 10.4
Available-for-sale financial assets (AfS) -20.9 -20.9
Financial instruments held for trading (FAHfT and FLHfT) -2.5 -22.7 -2.5 -22.7
Financial liabilities measured at amor-tised cost (FLAC) -141.0 -115.9 -141.0 -115.9
Total -73.9 -99.6 -2.5 -22.7 -1.5 -0.8 -25.9 -5.1 -103.8 -128.2
Interest income and expense on financial instruments is recognised in the item net interest income /expense. Other components of the net result are recognised in other operating income and expenses and in other investment income.
160 EWE Annual Report 2009

The following table allocates financial instruments measured at fair value to the three levels of the fair-value hierarchy:
EUR million Level 1 Level 2 Level 3 Total
Financial assets held at fair value
Derivative financial instruments - 278.0 - 278.0
Financial liabilities held at fair value
Derivative financial instruments - 338.7 17.4 356.1
The levels of the fair-value hierarchy and their application to assets and liabilities are described below:
Level 1: Quoted prices (unadjusted) on active markets for identical assets or liabilities.
Level 2: Information other than quoted market prices that is observable directly (e.g. prices) or indirectly (e.g. derived from prices).
Level 3: Information on assets or liabilities that is not based on observable market data.
The following table gives an overview of financial instruments allocated to Level 3:
EUR millionDerivative financial
instruments (liabilities)
As at 1.1.2009 12.8
Change in group of consolidated companies 11.6
Total income in the income statement 6.8
Currency adjustments -0.2
As at 31.12.2009 17.4
Other disclosures
32. Segment reporting
In accordance with IFRS 8, segment reporting is to be prepared using what is known as the management approach. The segments in the EWE Group are determined in accordance with internal reporting lines. The first-time application of IFRS 8 in the financial year 2009 did not lead to any change in the seg-mentation of the business areas compared with the previous year.
For operating reasons, the Group is split into five business areas. Based on their different products and services the Energy, Network and ICT business areas have been identified as segments within the mean-ing of IFRS 8. As a recently acquired company, swb is considered a separate segment. The Corporate Centre is considered separately based on its services for the Group. These business areas form the basis for the primary segment reporting format.
161The e3-programme Management Investor Relations Social Responsibility Group Management Report Consolidated Financial Statements

The Corporate Centre business area consists of EWE AG’s corporate centre activities such as shared ser-vices, financing and other activities which are not attributable to the segments presented separately.
In this business area the shares in VNG have been reclassified from financial investments accounted for under the equity method to held-for-sale non-current assets at their equity value of Euro 1,000.0 million as measured most recently at 30 June 2009.
The Energy business area combines electricity and natural gas sales and trading, natural gas production, procurement and storage, electricity generation from renewable sources and other energy-related serv-ices. In addition to EWE AG and its energy activities this business area includes the fully consolidated subsidiaries EWE WASSER GmbH, Cuxhaven, EWE Doğalgaz, EWE ENERJI, Bursagaz, Kayserigaz, EWE Polska Sp. z o.o., Poznań, Poland, and EWE ENERGIA Sp. z o.o., Międzyrzecz, Poland (formerly Media Odra Warta Sp. z o.o.). MVR and DOTI Deutsche Offshore-Testfeld- und Infrastruktur-GmbH & Co. KG, Oldenburg, are presented as associated companies. Up to 30 September 2009 swb was included in the equity valuation as an associated company. With the acquisition of the remaining 51 per cent stake in swb and the transition to full consolidation, the subgroup swb constitutes a business area in its own right.
The Network business area consists of EWE NETZ GmbH and Aequamus GmbH, Bremen, which is ac-counted for under the equity method. The company plans, builds and operates electricity, natural gas and telecommunications networks in the Ems / Weser / Elbe and Brandenburg regions. EWE NETZ GmbH also combines all operations for supplying drinking water in Bremervörde, Cuxhaven, Oldenburg, Scheeßel and Varel.
The swb business area consists of the subgroup swb. The activities of swb and its subsidiaries are fo-cused on providing energy and water services, particularly on supplying Bremen and Bremerhaven and the surrounding areas with energy and water.
The ICT business area is a miscellaneous segment made up of the business units information technology (IT) and telecommunications (TC). The TC business is represented by the fully consolidated companies EWE TEL, Bremer Kommunikationstechnik GmbH, Bremen, nordcom Niedersachsen GmbH, Oldenburg, Martens and BCC Business Communication Company GmbH. htp GmbH, Hanover, is shown as an as-sociated company. The IT business is represented by the fully consolidated BTC AG and its subsidiaries.
The eliminations refer to the effects of consolidation.
Intra-Group sales represents sales between segments. These sales are invoiced at arm’s length terms. The total of external and internal sales is the segment sales.
The segment result corresponds to earnings before interest and taxes (EBIT) for the year.
Depreciation, amortisation and impairment relates to intangible assets and property, plant and equipment.
Capital expenditure relates to intangible assets and property, plant and equipment (including capitali-sation from recognised provisions) and financial investments.
162 EWE Annual Report 2009

The following table shows external sales by product and service:
EUR millionCorporate
Centre 2009Corporate
Centre 2008 energy 2009 Energy 2008Network
2009Network
2008
Electricity 0.0 0.0 -2,101.3 -2,089.0 -894.5 -828.9
Gas 0.0 0.0 -1,807.5 -1,754.9 -48.5 -25.4
ICT 0.0 0.0 0.0 0.0 0.0 0.0
Other -1.6 -3.4 -130.2 -97.7 -23.5 -22.9
external sales -1.6 -3.4 -4,039.1 -3,941.6 -966.5 -877.2
EUR million swb 2009 ICT 2009 ICT 2008eliminations
2009Eliminations
2008Consolidated
2009Consolidated
2008
Electricity -150.5 0.0 0.0 0.0 0.0 -3,146.3 -2,917.9
Gas -87.1 0.0 0.0 0.0 0.0 -1,943.2 -1,780.2
ICT 0.0 -492.5 -505.1 0.0 0.0 -492.5 -505.1
Other -61.1 0.0 0.0 0.0 0.0 -216.4 -123.9
external sales -298.7 -492.5 -505.1 0.0 0.0 -5,798.4 -5,327.3
The following table shows external sales, assets and capital expenditure by region:
EUR millionGermany
2009Germany
2008Abroad
2009Abroad
2008eWe Group
2009EWE Group
2008
External sales 5,523.5 5,223.3 274.9 104.0 5,798.4 5,327.3
Segment assets 8,892.6 4,669.4 830.2 917.1 9,722.8 5,586.5
Capital expenditure 677.8 548.6 21.1 375.3 698.8 923.9
Due to the large number of customers and the wide range of business activities there are no customers whose volume of business in relation to the entire volume of business of the EWE Group is significant.
Due to the restatement of the previous year’s figures for MVR in accordance with IAS 8 (see “Presen-tation of the consolidated financial statements”), the segment reporting is also to be extended by an opening balance sheet for the comparable period. As the retroactive restatement of MVR as of 1 January 2008 has no effects on the presentation of segment assets, the figures as of 1 January 2008 are not shown here.
As of 1 January 2008 an adjustment was made in the segment reporting between financial investments and shares in associated companies accounted for under the equity method as part of the reconciliation with consolidated assets.
163The e3-programme Management Investor Relations Social Responsibility Group Management Report Consolidated Financial Statements

2009 segment reporting of the eWe Group1
EUR millionCorporate
Centre 2009Corporate
Centre 2008 energy 2009 Energy 2008 Network 2009Network
2008swb
20092
ICT 2009
ICT 2008
eliminations 2009
Eliminations 2008
Consolidated 2009
Consolidated 2008
SALeS
External sales 1.6 3.4 4,039.1 3,941.6 966.5 877.2 298.7 492.5 505.1 5,798.4 5,327.3
Inter-segment sales 5.5 4.1 130.1 94.8 820.3 770.7 9.9 110.6 95.9 -1,076.4 -965.5
Total sales 7.1 7.5 4,169.2 4,036.4 1,786.8 1,647.9 308.6 603.1 601.0 -1,076.4 -965.5 5,798.4 5,327.3
ReSULT
Segment earnings (EBIT) 361.8 278.8 106.1 137.2 179.4 137.6 49.1 18.6 65.2 -301.0 -192.6 414.0 426.2
Interest expense -187.1 -150.8
Interest income 67.1 16.3
Income taxes -94.6 -80.6
Result for the period 199.4 211.1
OTHeR INFORMATION
Segment assets 2,682.5 1,712.9 2,504.3 2,575.2 2,343.5 2,353.1 2,712.3 538.5 531.5 -1,058.3 -1,586.2 9,722.8 5,586.5
Financial investments 172.3 128.2
Interests in associated companies accounted for under the equity method 909.5 139.1 641.6 0.7 322.2 35.4 34.6 497.4 1,585.7
Income tax receivables and deferred tax assets 61.4 46.7
Consolidated assets 10,453.9 7,347.1
Segment liabilities 650.7 750.4 2,180.4 2,636.9 1,122.5 1,047.0 1,324.6 309.3 277.3 -1,787.6 -2,217.6 3,799.9 2,494.0
Debt instruments (bonds and liabilities to banks) 2,756.5 2,597.8
Deferred taxes, provisions for taxes and outstanding income taxes 487.7 253.2
Consolidated liabilities 7,044.1 5,345.0
Capital expenditure 1,372.7 106.6 283.4 606.7 197.3 162.2 34.1 67.7 79.5 -1,256.4 -31.2 698.8 923.8
Other operating income -241.7 -253.1 -61.6 -53.0 -24.0 -23.6 -20.9 -11.1 -22.5 247.3 267.1 112.0 -85.1
Cost of materials and services -11.9 -10.1 -3,724.0 -3,694.4 -1,168.6 -1,052.4 -184.5 -279.2 -270.1 932.5 849.2 -4,435.7 -4,177.8
Personnel expenses -41.5 -36.8 -48.0 -39.4 -109.9 -101.7 -47.2 -160.1 -146.2 -406.7 -324.1
Depreciation and amortisation -26.1 -21.0 -69.3 -47.3 -127.3 -141.8 -24.9 -74.4 -68.2 -0.3 -0.3 -322.3 -278.6
Impairment -87.3 -41.5 0.4 -2.7 -89.6 -41.5
Other operating expenses -242.3 -193.9 -199.5 -171.3 -255.1 -263.3 -38.0 -93.4 -81.4 375.1 369.5 -453.2 -340.4
Result of equity investments 297.5 193.4 -5.3 3.6 0.9 -0.6 -300.7 -192.4 -8.2 4.6
Funds from operations 207.6 130.9 276.7 208.8 277.3 249.7 65.7 97.0 116.8 -317.9 -191.8 606.3 514.5
Result of equity investments in associated companies 135.5 84.7 5.8 34.8 0.7 10.7 0.8 0.1 153.5 119.6
1 Previous year’s figures adjusted2 Consolidated in full for the first time from 1 October 2009
164 EWE Annual Report 2009

2009 segment reporting of the eWe Group1
EUR millionCorporate
Centre 2009Corporate
Centre 2008 energy 2009 Energy 2008 Network 2009Network
2008swb
20092
ICT 2009
ICT 2008
eliminations 2009
Eliminations 2008
Consolidated 2009
Consolidated 2008
SALeS
External sales 1.6 3.4 4,039.1 3,941.6 966.5 877.2 298.7 492.5 505.1 5,798.4 5,327.3
Inter-segment sales 5.5 4.1 130.1 94.8 820.3 770.7 9.9 110.6 95.9 -1,076.4 -965.5
Total sales 7.1 7.5 4,169.2 4,036.4 1,786.8 1,647.9 308.6 603.1 601.0 -1,076.4 -965.5 5,798.4 5,327.3
ReSULT
Segment earnings (EBIT) 361.8 278.8 106.1 137.2 179.4 137.6 49.1 18.6 65.2 -301.0 -192.6 414.0 426.2
Interest expense -187.1 -150.8
Interest income 67.1 16.3
Income taxes -94.6 -80.6
Result for the period 199.4 211.1
OTHeR INFORMATION
Segment assets 2,682.5 1,712.9 2,504.3 2,575.2 2,343.5 2,353.1 2,712.3 538.5 531.5 -1,058.3 -1,586.2 9,722.8 5,586.5
Financial investments 172.3 128.2
Interests in associated companies accounted for under the equity method 909.5 139.1 641.6 0.7 322.2 35.4 34.6 497.4 1,585.7
Income tax receivables and deferred tax assets 61.4 46.7
Consolidated assets 10,453.9 7,347.1
Segment liabilities 650.7 750.4 2,180.4 2,636.9 1,122.5 1,047.0 1,324.6 309.3 277.3 -1,787.6 -2,217.6 3,799.9 2,494.0
Debt instruments (bonds and liabilities to banks) 2,756.5 2,597.8
Deferred taxes, provisions for taxes and outstanding income taxes 487.7 253.2
Consolidated liabilities 7,044.1 5,345.0
Capital expenditure 1,372.7 106.6 283.4 606.7 197.3 162.2 34.1 67.7 79.5 -1,256.4 -31.2 698.8 923.8
Other operating income -241.7 -253.1 -61.6 -53.0 -24.0 -23.6 -20.9 -11.1 -22.5 247.3 267.1 112.0 -85.1
Cost of materials and services -11.9 -10.1 -3,724.0 -3,694.4 -1,168.6 -1,052.4 -184.5 -279.2 -270.1 932.5 849.2 -4,435.7 -4,177.8
Personnel expenses -41.5 -36.8 -48.0 -39.4 -109.9 -101.7 -47.2 -160.1 -146.2 -406.7 -324.1
Depreciation and amortisation -26.1 -21.0 -69.3 -47.3 -127.3 -141.8 -24.9 -74.4 -68.2 -0.3 -0.3 -322.3 -278.6
Impairment -87.3 -41.5 0.4 -2.7 -89.6 -41.5
Other operating expenses -242.3 -193.9 -199.5 -171.3 -255.1 -263.3 -38.0 -93.4 -81.4 375.1 369.5 -453.2 -340.4
Result of equity investments 297.5 193.4 -5.3 3.6 0.9 -0.6 -300.7 -192.4 -8.2 4.6
Funds from operations 207.6 130.9 276.7 208.8 277.3 249.7 65.7 97.0 116.8 -317.9 -191.8 606.3 514.5
Result of equity investments in associated companies 135.5 84.7 5.8 34.8 0.7 10.7 0.8 0.1 153.5 119.6
1 Previous year’s figures adjusted2 Consolidated in full for the first time from 1 October 2009
165The e3-programme Management Investor Relations Social Responsibility Group Management Report Consolidated Financial Statements

33. Cash flow statement
The cash flow statement shows the flow of funds from operating activities, investing activities and fi-nancing activities.
Cash and cash equivalents consist of the balance sheet item cash and cash equivalents, amounting to Euro 604.5 million (previous year: Euro 233.0 million), and cash pool receivables of Euro 0.4 million (previous year: Euro 0.0 million). The former consist of cash in hand and bank balances.
To determine cash flow from operating activities, the additions to and reversals of provisions are pre-sented as non-cash changes in provisions and use of provisions is shown in changes in liabilities and other components of equity and liabilities.
Cash flow from financing activities includes profit distributions and dividends of Euro 65.0 million (previous year: Euro 65.0 million) to EWE shareholders and Euro 3.8 million (previous year: Euro 0.1 million) to other shareholders.
Expenditure for the acquisition of consolidated companies in financial year 2009 relates to the purchase of shares in swb, EWE Doğalgaz and osnatel. In 2008 the item largely consisted of purchases of shares in Bursagaz, Kayserigaz, Teleos and Martens.
In the financial year 2009 a total of Euro 743.1 million (previous year: Euro 387.9 million) was spent on acquiring shares in fully consolidated subsidiaries. This was largely made up of the purchase prices for swb (Euro 698.4 million, including interest on the purchase price of Euro 18.4 million), osnatel (Euro 24.7 million) and EWE Doğalgaz (Euro 30.0 million), after deduction of Euro 10.6 million in cash balances acquired. Of the total cash acquired with the purchases, Euro 9.5 million came from swb and Euro 1.1 million from EWE Doğalgaz.
The non-cash capital expenditure consists essentially of Euro 8.0 million in connection with the purchase of the remaining 51 per cent stake in swb and of Euro 2.2 million (previous year: Euro 3.0 million) for the capitalisation of recultivation provisions and removal obligations. In the previous year the figure of Euro 14.9 million related to the purchase of shares in Bursagaz und Kayserigaz via a call option for Euro 14.9 million.
As in the previous year, cash and cash equivalents were not subject to any restrictions on use as of 31 December 2009.
34. Information on easements
A number of easements, or agreements on the use of land for electricity, natural gas and water mains, exist between companies in the EWE Group and the local authorities in EWE’s supply area.
These easements give the EWE Group the right to use public rights of way in the area covered by the agreement to install, operate and maintain facilities and equipment for directly providing end-users with electricity, natural gas and water.
A concession fee is payable to the local authorities for the use of the public rights of way.
The agreements generally run for 20 years. If the easements are not renewed, there is a statutory obligation to surrender the local distribution facilities to the new energy utility against payment of reasonable compensation to the EWE Group.
166 EWE Annual Report 2009

35. Significant shareholdings
in EUR ’000
Name and registered office of the companyEquity
interest in %Shareholders’
equity
Net profit /loss for the
period
Affiliated companies
Consolidated:
AOV IT.Services GmbH, Gütersloh 50.07 6,104 +279 2, 5
BCC Business Communication Company GmbH, Brunswick 100.00 5,273 -1 336 2, 5
Bohn GmbH Energie- und Kraftwerkstechnik, Bremen 100.00 3 -4 2, 5
Bremer Kommunikationstechnik GmbH, Bremen 100.00 15,027 +1,166 2, 5
BTC Business Technology Consulting AG, Oldenburg 100.00 12,449 3, 5
BTC IT Services GmbH, Oldenburg 100.00 1,439 2, 3, 5
Bursagaz Bursa Şehiriçi Doğalgaz Dağıtım Ticaret ve Taahhüt A.Ş., Bursa, Turkey 80.00 58,051 +9,360 2, 5
EWE Doğalgaz Sanayi ve Ticaret A.Ş., (formerly Avrasya Enerji San. ve Tic A.Ş.), Istanbul, Turkey 100.00 2,664 +993 6
EWE ENERGIA Sp. z o.o., Międzyrzecz, (formerly Media Odra Warta Sp. z o.o.), Poland 99.98 34,940 -3,183 2, 4
EWE ENERjI ANONIM ŞIRKETI (A.Ş.), Istanbul, Turkey 100.00 474,885 +12,108 5
EWE NETZ GmbH, Oldenburg 100.00 552,714 3, 5
EWE Polska Sp. z o.o., Poznań, Poland 100.00 93,470 -5,429 4
EWE TEL GmbH, Oldenburg 100.00 95,512 3, 5
EWE WASSER GmbH, Cuxhaven 100.00 200 3, 5
hmmh multimediahaus AG, Bremen 100.00 3,936 +788 2, 5
Kayseri Doğalgaz Dağıtım Pazarlama ve Ticaret A.Ş., Kayseri, Turkey 80.00 7,017 +786 2, 5
nordcom Niedersachsen GmbH, Oldenburg 100.00 525 -495 2, 3, 5
PRO CONSULT Management- und Systemberatung GmbH, Bad Homburg 100.00 573 +426 2, 5
swb AG, Bremen 100.00 367,002 +25,092 2, 5
swb Beleuchtung GmbH, Bremen 100.00 250 +447 2, 5
swb Bremerhaven GmbH, Bremerhaven 100.00 31,666 + 2,313 2, 5
swb CREA GmbH, Bremerhaven 100.00 77 -850 2, 5
swb Entsorgung GmbH, Bremen 100.00 30,153 -1,623 2, 5
swb Erzeugung GmbH & Co. KG, Bremen 100.00 58,468 +16,630 2, 5
swb Immobilien GmbH, Bremen 100.00 43 -66 2, 5
swb Messung und Abrechnung GmbH, Bremen 100.00 500 +1,355 2, 5
swb Netze Bremerhaven GmbH & Co. KG, Bremerhaven 100.00 31,519 +7,668 2, 5
swb Netze GmbH & Co. KG, Bremen 100.00 212,487 +25,541 2, 5
swb Services GmbH & Co. KG, Bremen 100.00 4,903 -981 2, 5
swb Vertrieb Bremen GmbH, Bremen 100.00 7,072 +13,437 2, 5
swb Vertrieb Bremerhaven GmbH & Co. KG, Bremerhaven 100.00 500 +2,009 2, 5
Windfarm Märkisch Linden GmbH & Co. KG, Kränzlin 100.00 13,739 -591 2, 5
167The e3-programme Management Investor Relations Social Responsibility Group Management Report Consolidated Financial Statements

in EUR ’000
Name and registered office of the companyEquity
interest in %Shareholders’
equity
Net profit /loss for the
period
Other equity investments:
BIBER GmbH – Bildung, Betreuung, Erziehung, Oldenburg 100.00 73 1, 3, 5
E&D Energie- und Dienstleistungs GmbH & Co. KG, Cologne 84.76 5,044 -56 4
ENRO Ludwigsfelde Energie GmbH, Ludwigsfelde 50.00 4,012 +208 4
Entwässerungsgesellschaft Cuxhaven mbH, Cuxhaven 100.00 2,747 +1,310 2, 5
EWE Biogas GmbH & Co. KG, Wittmund 100.00 713 +30 4
EWE Urbanisation Dienstleistungs GmbH (UDG), Bremervörde 100.00 2,267 1, 3, 5
NaturWatt GmbH, (formerly EWE NaturWatt GmbH), Oldenburg 90.00 1,202 -64 4
PBB GmbH, Oldenburg 100.00 4,780 -95 4
Riffgat Beteiligungs GmbH & Co. KG, Oldenburg 100.00 5,478 -18 5
SOCON Sonar Control Kavernenvermessung GmbH, Giesen 62.00 4,426 +2,017 4
TEWE Energieversorgungsgesellschaft mbH Erkner, Erkner 100.00 6,070 +574 4
Associated companies
Consolidated:
Aequamus GmbH, Bremen 33.33 546 +516 2, 5
DOTI Deutsche Offshore-Testfeld- und Infrastruktur-GmbH & Co. KG, Oldenburg 47.50 94,162 -75 4
hanseWasser Bremen GmbH, Bremen 38.20 74,459 +7,666 2, 5
Hansewasser Ver- und Entsorgungs-GmbH, Bremen 51.00 38,556 +9,569 2, 5
htp GmbH, Hanover 50.00 18,557 +2,879 5
MVR Müllverwertung Rugenberger Damm GmbH & Co. KG, Hamburg 20.00 31,760 +16,421 5
Stadtwerke Bielefeld GmbH, Bielefeld 49.90 257,912 +29,765 2, 5
swb Weserwind GmbH & Co. KG, Bremen 50.00 623 +204 2, 5
VNG - Verbundnetz Gas AG, Leipzig 47.90 706,208 +140,777 7
Other equity investments:
Abfallwirtschaftsgesellschaft Landkreis Vechta mbH, Vechta 49.00 1,091 251 4
Gasversorgung Angermünde GmbH, Angermünde 49.00 1,125 -26 4
Offshore Windpark RIFFGAT GmbH & Co. KG, Oldenburg 90.00 13,508 -149 5
Stadtwerke Eberswalde GmbH, Eberswalde 49.00 2,766 -409 4
Stadtwerke Ludwigsfelde GmbH, Ludwigsfelde 20.00 7,569 +1,505 4
Stadtwerke Strausberg GmbH, Strausberg 38.38 11,737 +1,685 4
Städtische Betriebswerke Luckenwalde GmbH, Luckenwalde 20.00 7,247 +1,376 4
Verkehr und Wasser GmbH, Oldenburg 26.00 8,000 -1,295 4
1 The company changed its financial year as of 2009 (short financial year)2 Indirect equity investment3 Control and / or profit transfer agreements exist with this company4 Figures for equity and net profit / loss are from 20085 Figures for equity and net profit / loss are from 20096 99.97 per cent of the shares are held indirectly7 Reclassified in the reporting year to non-current assets held for sale
168 EWE Annual Report 2009

36. Related party disclosures
Transactions with companies included in the consolidated financial statements are eliminated as part of consolidation. The related parties of the EWE Group include the shareholders of EWE AG, non-con-solidated affiliated companies and the associated companies accounted for under the equity method, as well as the members of the Board of Management and Supervisory Board of EWE AG.
The relations with the group of shareholders are primarily financial and for the exchange of commercial services. The capital increase took place when EnBW became a shareholder of EWE AG (Notes 10, 21).
The relations with the group of associated companies accounted for under the equity method and VNG are primarily financial and for supplies and services relating to natural gas. All transactions are concluded on standard market terms.
The following table shows the transactions with related parties:
Shareholders of eWe AG
EUR million 2009 2008
Services purchased 0.1
Capital increase 1,316.5
Financing 41.1 0.1
Receivables 5.3
Liabilities 4.1 2.5
Associated companies accounted for under the equity method and VNG
EUR million 2009 2008
Services rendered 4.9 2.7
Purchase of goods 3.0
Sale of goods 13.6 1.2
Energy purchased 195.9 248.6
Services purchased 2.0 7.1
Financing 0.4 0.8
Receivables 23.8 11.9
Liabilities1 49.2 47.3
1 of which Euro 33.2 million to VNG as of 31.12.2009 (IFRS 5)
Non-consolidated affiliated companies
EUR million 2009 2008
Receivables 81.1 60.0
Liabilities 8.6 2.2
169The e3-programme Management Investor Relations Social Responsibility Group Management Report Consolidated Financial Statements

The members of Ems-Weser-Elbe Versorgungs- und Entsorgungsverband are the local authorities and municipalities in our supply area between the rivers Ems, Weser and Elbe. They are supplied with elec-tricity, gas and telecommunications and information services on standard market terms.
The EWE Group concluded no significant transactions with related individuals. The supply of electricity and natural gas and telecommunications services to related parties takes place on arm’s length terms.
Information on the Boards of EWE AG
Supervisory Board
Günther Boekhoff Chairman Honorary Mayor of Leer
Rainer Janßen First Deputy Chairman Technical Supervisor, EWE NETZ GmbH, Varel
Hans-Peter Villis Second Deputy Chairman Chairman of the Board of Management of EnBW AG, Castrop-Rauxel, from 21 July 2009
Martin Döscher Third Deputy Chairman Honorary District Administrator, Köhlen
Hans Eveslage Fourth Deputy Chairman District Administrator, Cloppenburg
Wolfgang Behnke Systems Integrator, EWE AG, Oldenburg
Hermann Bröring District Administrator, Meppen
Claus Christ Technical Supervisor, EWE NETZ GmbH, Remels
Karl-Heinz Funke Minister (retired), Varel
Dr. Hans Michael Gaul Member of the Board of Management of E.ON AG (retired), Düsseldorf, from 21 July 2009
Heiner Grotheer Managing Director, Osterholz-Scharmbeck, until 21 July 2009
Carsten Hahn Administrator, EWE NETZ GmbH, Osterholz-Scharmbeck
Dr. Hans-Dieter Harig Former Chief Executive Officer of E.ON Energie AG, Hanover, until 21 July 2009
Gregor Heller Senior Trades Consultant, EWE AG, Haselünne
Dr. Stephan-Andreas Kaulvers Chairman of the Board of Management of Bremer Landesbank, Bremen
170 EWE Annual Report 2009

Aloys Kiepe ver.di District Trade Secretary, Emden
Sigrid Leidereiter ver.di District Trade Secretary, Bremen
Gerd Reiners Former EWE Board member for technology, Oldenburg, until 21 July 2009
Immo Schlepper Regional Department Director of ver.di, Lower Saxony-Bremen, Oldenburg
Alwin Schlörmann Regional Director, EWE AG, Bad Zwischenahn
Prof. Dr. Gerd Schwandner Mayor, Oldenburg
Dierk Schwarting Technical Supervisor, EWE NETZ GmbH, Ganderkesee
Dr. Hans-Josef Zimmer Member of the Board of Management of EnBW AG, Steinfeld (Rhineland-Palatinate), from 21 July 2009
Board of Management
Dr. Werner Brinker Chief Executive Officer and Board member for Sales and Marketing, Rastede
Heiko Harms Chief Operating Officer, Rastede
Dr. Thomas Neuber Chief Officer for Procurement and Production, Oldenburg
Michael Wagener Chief Financial Officer and Board member for Human Resources, Rastede
The remuneration paid to the members of EWE’s Board of Management for work on the management and supervisory boards of subsidiaries totalled Euro 3.4 million in financial year 2009 (previous year: Euro 3.3 million). The members of the Supervisory Board received remuneration of Euro 0.5 million (previous year: Euro 0.5 million).
Provisions totalling Euro 9.1 million (previous year: Euro 9.0 million) were made for pension obligations to former members of the Board of Management and their surviving dependents. Total payments of Euro 0.8 million (previous year: Euro 0.8 million) were made in the reporting period.
171The e3-programme Management Investor Relations Social Responsibility Group Management Report Consolidated Financial Statements

37. Auditors’ fees and services provided
Companies consolidated in the EWE Group purchased the following services from the auditors of the consolidated financial statements, PricewaterhouseCoopers Aktiengesellschaft Wirtschaftsprüfungs-gesellschaft:
EUR million 2009 2008
Auditing financial statements 1.3 1.0
Other certification and valuation services 0.6 2.4
Tax advisory services 0.1 0.1
Other services 3.4 1.1
Total 5.4 4.6
38. Use of Section 264 para. 3 of the German Commercial Code (HGB)
The following subsidiaries made use of the exemption under Section 264 para. 3 of the German Com-mercial Code (HGB) in financial year 2009:
BTC Business Technology Consulting AG, OldenburgBTC IT Services GmbH, OldenburgEWE TEL GmbH, OldenburgEWE WASSER GmbH, Cuxhaven
39. Declaration of conformity in accordance with Section 161 of the German Stock Corporation Act (AktG)
The Board of Management and the Supervisory Board of EWE AG have issued the declaration of con-formity with the recommendations of the German Corporate Governance Code as required under Section 161 of the German Stock Corporation Act (AktG) for the financial year 2009 and made it per-manently available to shareholders. EWE AG follows the recommendations of the Code with exceptions, due largely to the fact that EWE AG is not a publicly listed company.
Additional information on corporate governance and the declaration of conformity can be found on EWE AG’s website http://www.ewe.com/investor-relations/corporate-governance.php.
40. Events after the balance sheet date
Apart from the proposal for the appropriation of profit (Note 21) there were no significant events af-ter the balance sheet date.
Oldenburg, Germany, 12 March 2010
Board of Management
172 EWE Annual Report 2009
Confirmation by the legal representativesWe confirm that – to the best of our knowledge and in accordance with the applicable accounting standards – the consolidated financial statements give a true and fair view of the assets, financial and earnings position of the Group and that the Group management report presents the course of busi-ness, earnings and the Group’s situation in a true and fair way and that the main risks and opportuni-ties of the Group’s expected future development are described.
Oldenburg, Germany, 12 March 2010
Board of Management
Dr. Werner Brinker Heiko Harms Dr. Thomas Neuber Michael Wagener
173The e3-programme Management Investor Relations Social Responsibility Group Management Report Consolidated Financial Statements

Auditors’ reportWe have audited the consolidated financial statements of EWE Aktiengesellschaft, Oldenburg – con-sisting of the balance sheet, statement of comprehensive income, statement of changes in sharehold-ers’ equity and cash flow statement, together with the Notes to the consolidated financial statements – and the Group management report for the financial year from 1 January 2009 to 31 December 2009. The preparation of the consolidated financial statements and the Group management report in accordance with IFRS as applied in the EU and also with the provisions of Section 315a para. 1 of the German Commercial Code (HGB) is the responsibility of the company’s Board of Management. Our responsibility is to express an opinion on the consolidated financial statements and on the Group management report on the basis of our audit.
We conducted our audit of the consolidated financial statements in accordance with Section 317 of the German Commercial Code (HGB) and the generally accepted German standards for the audit of finan cial statements as determined by the German Institute of Auditors (Institut der Wirtschaftsprüfer, IDW). Those standards require that we plan and conduct the audit such that misstatements and i rregularities materially affecting the presentation of the net assets, financial position and result of operations in the consolidated financial statements, drawn up in accordance with accepted accounting principles, and in the Group management report are detected with reasonable assurance. Knowledge of the business activities and the economic and legal environment of the Group and of expectations of possible misstatements are taken into account when determining audit procedures. The effective-ness of the accounting-based internal control system and the evidence provided for the disclosures in the consolidated financial statements and the Group management report are assessed principally on the basis of spot checks within the framework of the audit. The audit includes an assessment of the financial statements of the companies included in the consolidated financial statements, of consoli-dation methods, of the accounting principles applied and of significant estimates made by the com-pany’s Board of Management as well as an evaluation of the overall presentation of the consolidated financial statements and the Group management report. We believe that our audit provides a reason-able basis for our opinion.
Our audit has not given rise to any objections.
In our opinion, based on the findings of our audit, the consolidated financial statements comply with IFRS as applicable in the EU and with Section 315a para. 1 of the German Commercial Code (HGB) and give a true and fair view of the net assets, financial and earnings position of the Group in accord-ance with these regulations. The Group management report is in accordance with the consolidated fi-nancial statements and gives a fair view of the Group’s situation and of the risks and rewards of fu-ture development.
Oldenburg, Germany, 15 March 2010
PricewaterhouseCoopers AktiengesellschaftWirtschaftsprüfungsgesellschaft
Dr. Gerhard Rolfes ppa. Carsten EngelhardtAuditor Auditor
174 EWE Annual Report 2009

Glossary
alpha ventus
The first German offshore wind farm in the North Sea, some 45km north of the island of Borkum. al-pha ventus is a pioneering joint venture between EWE, E.ON Cli-mate & Renewables and Vattenfall Europe New Energy. The operator of the wind farm is Deutsche Off-shore-Testfeld- und Infrastruktur-GmbH & Co. KG (DOTI), a consor-tium made up of the three project companies. EWE AG is lead inves-tor with a stake of 47.5 per cent.
AST – Fraunhofer Application Center System Technology
Develops optimised system tech-nology solutions for all energy sources, with a special focus on electrical energy.
Barrel
A unit of measurement for liquids. A distinction is made between Im-perial (i.e. British) and American barrels as well as between barrels for petroleum products (which were known in Germany until the 1980s as 159-litre barrels).
Bioenergy
Energy derived from renewable sources.
Biogas / Biomethane
Describes a blend consisting main-ly of methane and carbon dioxide. The valuable part used for energy is the methane.
Biomass
Describes the total mass of organ-ic material in a defined ecosystem which has been biochemically syn-thesised.
Brent
Is the most important type of crude oil from a European per-spective. Brent is a light crude oil with low sulphur content. It comes from the North Sea and is traded on the International Petroleum Ex-change in London and on other fu-tures exchanges.
CO2
Carbon dioxide is a colourless, odourless gas that in very low concentrations is a natural part of the air. Carbon dioxide is also pro-duced by the combustion of sub-stances containing carbon, such as the fossil fuels coal and gas.
CO2 emissions
In the energy industry carbon di-oxide is produced when fuels con-taining carbon are burnt. The gas emitted into the atmosphere is blamed for causing the green-house effect – the warming of the Earth’s surface – thus earning the name “greenhouse gas”.
CO2 emissions rights trading /certificates
European system for trading CO2
emissions rights in two trading periods (2005–2007 and 2008–2012) based on the Kyoto Proto-col and EU climate protection res-olutions. Facility operators must hold rights for their CO2 emis-sions. The rights are allocated by national governments. If they produce more CO2 than they are entitled to, they must reduce the amount of CO2 emitted by their facilities or purchase additional emissions rights. If they produce less CO2 than they are entitled to, they can sell their excess entitle-ment on the free market.
Cavern / cavern borehole
Subterranean cavities in salt for-mations which have been hol-lowed out by water several hun-dred metres underground. Caverns can be used, for example, as natu-ral gas storage facilities, to com-pensate for seasonal fluctuations in natural gas sales.
Combined heat and power plant
A power plant which generates power and heat at the same time. It uses primary energy sources such as natural gas or biomass to do so.
Combined Heat and Power (CHP) / CHP plants
A CHP plant uses both the electri-cal energy generated by convert-ing primary energy and the result-ing (waste) heat. This increases the efficiency of these plants consid-erably.
Contracting
The process of outsourcing a com-pany’s own activities to a service company. When used in connec-tion with supply, plant, heat or energy contracting it means the supply of consumables (heat, cold, power, steam, compressed air, etc.) and the construction and opera-tion of the necessary facilities.
Decentralised energy manage-ment system
A control system for the central-ised management of decentralised power generation plants.
Demand side management
A process using energy rate and /or load management. It enables energy consumption to be man-aged and network loads to be op-timised.
District heating
Heat which is produced in a cen-tral heat plant or a decentralised CHP plant and then distributed to individual households or compa-nies by means of pipes.
DSL (digital subscriber line)
Broadband technology (high-speed data transmission over the internet) using simple copper wire, such as that which is found in traditional telephone lines. This transmission protocol allows data to be transferred and received at great speed (up to 16 Mbit / s for private customers).
e-energy
A programme of subsidies from the German Federal Ministry of Economics and Technology and the German Federal Ministry for the Environment, Nature Conser-vation and Nuclear Safety. Six trial regions have been selected as part of the E-Energy technology com-petition. One of these trial regions is eTelligence.
efficiency coefficient
Generally speaking, the efficiency coefficient is the ratio of output to input. For energy generation plants the efficiency coefficient is used to evaluate the efficiency of an energy conversion process.
eTelligence
A project sponsored by the Ger-man Federal Ministry of Econom-ics and Technology as part of the E-Energy programme. eTelligence conducts research into how elec-tricity generators, consumers, en-ergy service providers and network operators can be brought together on a regional energy market in the trial region of Cuxhaven. This en-tails coordinating the power con-sumption of business customers and private households with elec-tricity generation from renewable sources using modern IT and tele-communications technology.
eU targets 20-20-20
Climate protection targets in the European Union that involve cut-ting CO2 emissions in Europe by 20 per cent compared with 1990, in-creasing energy efficiency by 20 per cent and raising the share of renewable energy to 20 per cent of primary energy generation, all by the year 2020.
eWe trio Smart Box
The name given to an intelligent gas and electricity metering sys-tem for end consumers. It enables EWE customers to see how much energy they are using in the home at any time, where any “energy guzzlers” are hiding and how they can save energy by altering their consumption patterns.
175

Fuel cell
In a fuel cell, hydrogen and oxygen react to produce water. The two gases are separated by an electro-lyte and only exchange electrons via an electrical conductor. This flow of electrons makes the fuel cell a source of electrical power. The heat produced is also used, however. The product of the re-action is pure water, which means that the fuel cell is particularly en-vironmentally friendly.
German emissions Trading Authority
The division of the German Fed-eral Environment Agency respon-sible for implementing emissions trading as a market-based climate protection instrument as well as project-based mechanisms (Joint Implementation and Clean Devel-opment Mechanism) under the Kyoto protocol.
German Federal Network Agency
Higher federal authority with-in the German Federal Ministry of Economics and Technology. Among its other responsibilities, the Agency has regulated the Ger-man gas and electricity networks together with the relevant region-al authorities since July 2005.
Glass PV module
Two sheets of glass holding photo-voltaic (PV) cells or a PV coating. Crystalline silicon cells are used in the Weser Stadium, sandwiched between the sheets of glass.
GRID Surfer
A project based on the eTelligence trial to develop and test electric vehicles, storage media and charg-ing stations as well as metering and control systems. The con-cept also includes creating ICT-based storage management, bill-ing and marketing processes as well as rates and business models together with the necessary inter-faces. The German Federal Minis-try of Economics and Technology (BMWi) subsidised GRID Surfer as part of the second economic stim-ulus package.
ISe – Fraunhofer Institute for Solar energy Systems
Largest solar research institute in Europe.
Makrolon sheets
A type of plastic made by Bayer AG, which can be used with PV, similar to glass. It is much lighter than glass and has therefore been fitted on the internal roofing ring at the Weser Stadium.
Membrane electrode unit
The heart of the fuel cell.
Offshore transformer station
Connects alpha ventus to the Ger-man electricity grid, enabling the electricity from the North Sea to be fed into the network. The transformer station steps up the voltage from the 30 kV produced by the wind turbines to the 110 kV required for transport.
Offshore wind farm
A collection of wind turbines built as a permanent construction in the open sea in areas with strong winds.Since the German Renewable En-ergies Act came into force, wind farms have been subsidised by of-fering the operators a fixed price for the power they feed into the grid and guaranteeing that it will be purchased.
Peak loads / load curves
Peak load is the maximum output that a maximum load in the elec-tricity grid can produce within a short period of time.The load curve shows the load fac-tor used by an electricity custom-er over the period in which this load factor is supplied.
Photovoltaics
The direct transformation of radi-ant energy, primarily solar energy, into electrical energy. It has been used since 1958, initially for sup-plying power to space satellites using solar cells. Nowadays it is used all over the world for gen-erating power and panels can be found on the roofs of buildings, noise protection walls or in the open. Photovoltaics is a subsec-tion of the more general field of solar technology, which also in-cludes other technical uses of the sun’s energy.
Primary energy
The term for energy derived from naturally occurring forms or sources (oil, natural gas, coal, bio-mass).
Redox flow batteries
An alternative to lead batteries. They have a similar energy densi-ty but last almost ten times longer than lead batteries.
Renewable energies
The term for energy derived from sustainable sources. These include solar energy, hydroelectrical pow-er, wind energy, biomass and geo-thermal power.
Renewable energy Act (eeG)
The “Act on granting priority to re-newable energy sources” is aimed at increasing the amount of elec-tricity produced from renewable sources. The Act, as amended in 2008, came into effect on 1 Janu-ary 2009 and requires that renew-able energies account for between 25 and 30 per cent of the German power supply by 2020.
RIS – Kooperationsverbund Weser-ems-Regionale Innova-tionsstrategie e.V.
An alliance with the goal of gen-erating growth and employment in the Weser / Ems region. This as-sociation supported by EWE pro-moted innovations in specific in-dustries. RIS ceased operations at the beginning of 2010.
Smart grids
Electricity networks which sup-port coordinated management through timely and bidirectional communication between network components, producers, storage facilities and consumers to allow systems to be operated in an en-ergy-efficient and cost-effective manner in order to meet future requirements.
Ten Bullensee Assumptions
Together with a group of exter-nal scientists, EWE AG drew up ten theses – the Bullensee As-sumptions – on how the energy supply can be sustainably guar-anteed into the year 2030 and be-yond. The name is derived from the place where the assumptions were formulated, a small lake in the countryside near Oldenburg. (www.ewe.de/bullenseethesen)
Virtual energy marketplace
The main goal of constructing a virtual energy marketplace to bring together electricity produc-ers, consumers and network op-erators is to increase energy effi-ciency. This is achieved by the use of information and telecommuni-cations technology.
VisiKid display
Display system designed for chil-dren to help visualise the energy generated by a photovoltaics sys-tem.
Wind farm
A collection of wind turbines.
176 EWE Annual Report 2009
Index
Glossary of abbreviations
Accounting 47-48, 53, 58, 86, 95-99, 101-102, 110-112, 118, 121, 126, 138, 150-151, 173-174Accounting or measurement methods 96Actuarial assumptions 121, 140Annual General Meeting 48, 52-53, 136-137Associated companies 60, 92, 102-103, 109, 111, 114, 120, 126, 132, 137, 146, 150, 162-164, 168-169
Board of Management 2, 44, 46,-47, 48-53, 75, 84, 86, 95, 114-115, 137, 148, 152, 169, 171-174Borrowing costs 96
Capital expenditure 48, 66, 79, 81-83, 86, 146, 150, 157, 162-164, 166Cash and cash equivalents 80, 90, 94, 117-118, 155, 158-160, 166Cash flow 2, 72, 79-80, 88-89, 9-94, 102, 114-115, 118, 121, 137, 146, 148-152, 154, 156-157, 160, 166, 174Cash flow statement 2, 79-80, 88, 94, 166, 174Consolidated financial statements 2, 48-49, 53, 66, 85-86, 88, 95-105, 109, 121, 163, 169, 172-174Contingent liabilities 110, 120-121, 146Corporate Centre 58-59, 66, 76-78, 81, 136, 161-164Corporate governance 2, 48, 51-53, 172Corporate leadership 51Cost management 83Credit facility 80, 157Credit risk 84, 155-156Currency translation difference 111, 137
Default risks 84, 155-156Deferred taxes 89, 90-91, 105, 110-112, 120-121, 126, 145-146, 164Discount rate 115, 121, 140-141, 143, 160Distributable profit 49, 137Dividend, total dividends 97, 101, 132, 166
early recognition system for opportunities and risks 84eBIT 44, 66, 78, 81-83, 87, 89, 94, 139, 162, 164eBITDA 78, 81energy efficiency 3, 18, 20, 24, 30, 39, 40, 43, 61, 73, 175-176energy taxes 122equity method 77, 89-90, 94-95, 102, 109-111, 114, 116, 124, 132, 135-137, 144, 162-164, 169,equity ratio 79, 147entity method 107, 110
Fair value 96, 98, 100-112, 114, 116-119, 121, 133, 137, 139-140, 142, 144, 148-152, 154, 156-161Finance and Audit Committee 48, 53Financial instruments 48, 53, 85, 96, 99-100, 102, 118, 120, 122, 147-148, 150-152, 154, 156, 160, 161Financial liabilities 94, 99, 102, 114, 120, 144, 146, 151, 156-157, 158-161 Financial market crisis 55, 69Financial statements 2, 48-49, 53, 77, 95-105, 109-111, 120, 137, 150, 172, 174Financing 20, 23, 48, 54-55, 66, 80, 84, 120, 143, 149-150, 157, 162, 166, 169Foreign currency risk 150-151
Goodwill 78, 82, 104-108, 110-114, 116, 121, 123, 127-129, 132Gross domestic product 69, 70, 86Group of consolidated companies 77, 92, 94, 102, 104, 110, 127-128, 130-132, 134, 138, 140-141, 146, 161
Hedge accounting 118, 150-151
Intangible assets 90, 94, 105-109, 112-113, 115, 121, 123-124, 127-129, 146, 162Interest rate risk 148-149, 151-152Inventories 69, 89-90, 94, 118, 133Investor relations 148, 151, 157, 172
Liquidity risk 96,157
Market risks 84, 152,-154Measurement category 158-160Minority interests 78, 89, 91, 93, 98, 110, 137, 147
Operating leases 116, 147Other income 125
Pension provision 86, 93, 125, 145-146Personnel expenses 78, 89, 123, 139, 142, 164Procurement and sales markets 84Proposal for the appropriation of profit 49, 172Provisions for recultivation 49, 119, 121, 142Rating 55, 60, 66, 75, 80, 155-156, 160Research and development (R&D) 20, 22, 32, 44, 65, 67-68, 129Risk management 58, 84-86, 148-149, 152
Segment reporting 97, 102, 122, 161, 163-164Subscribed capital 91-92, 136-137Subsidiaries 56-57, 63, 65, 87, 89, 95, 102-104, 108, 110-111, 120, 146, 150Successful efforts method 115Supervisory Board 2, 48-53, 95, 114-115, 169-172
Tax reconciliation 126Total cost method 102The future of energy 7, 39Tranche 60, 143Transaction costs 98, 109, 117, 120Transparency 29, 53, 66
Value in use 116
WACC (weighted average cost of capital) 115
AST: Fraunhofer Application Center System TechnologyBCC: Business Communication Company GmbHBReKOM: Bremer Kommunikationstechnik GmbHBTC: BTC Business Technology Consulting AGCHP: Combined heat and power plantDeHSt: German Emissions Trading AuthorityDOTI: Deutsche Offshore-Testfeld und Infrastruktur-GmbH & Co. KGe-energy: An innovation competition run by the German Federal Minis-try of Economics and Technology
htp: Hannovers Telefon Partner GmbHICT: Information and communications technologyISe: Fraunhofer Institute for Solar Energy Systemsncn: nordcom Niedersachsen GmbHNext energy: EWE Research Centre for Energy TechnologyRIS: Kooperationsverbund Weser-Ems-Regionale Innovationsstrategie e. V.VNG: Leipziger Verbundnetz Gas AG
177

Published by
EWE AktiengesellschaftTirpitzstraße 3926122 OldenburgGermany
editorial team
EWE AktiengesellschaftCorporate CommunicationsPhone: +49 (0) 4 41/803-18 30Email: [email protected]
Concept and design
IR-One AG & Co., Hamburgwww.ir-1.com
Text page 2 – 39
Anke Weber, Grethem
Photography
Stephan Meyer-Bergfeld, Oldenburgistockphoto.com, EWE picture library
Calendar 2010
This annual report contains forward-loo-king statements based on assumptions and estimates by the management of EWE AG. Although company management believes that these assumptions and estimates are accurate, actual future developments and results may differ considerably from these assumptions and estimates due to a wide variety of factors. These factors may include changes in the general eco-nomic situation, in the statutory and
Imprint
Thursday, 29 April 2010 Annual report 2009 – Press conference on results 2009
Thursday, 26 August 2010 Interim report 2010
Forward-looking statements
Printed by
W. Zertani, Druckerei und Verlag, Bremen
Translated by
EnglishBusiness, Hamburg
eWe on the Internet
www.ewe.com
regulatory framework for Germany and the EU, and in the sector. EWE AG is neit-her liable for, nor guarantees that future developments and the actual results achieved in future will coincide with the assumptions and estimates made in this annual report. EWE AG neither intends nor assumes any obligation to update for-ward-looking statements to reflect events or developments after the date of this report.
This annual report also exists in German; in the event of any divergences, the Ger-man version of the annual report has prece-dence over the English version. Both lan-guage versions are available for download from http://www.ewe.de.
178 EWE Annual Report 2009

Energy and telecommunications (in Brandenburg: in parts)
EnergyPoland: sales area EWE energiaTurkey: sales areas Bursagaz, Kayserigaz
Telecommunications
Gas transmission and trade (VNG)
Communication network with network interconnection points belonging to the associated company BCC
Germany: EWE head officePoland, Turkey: sites of EWE subsidiaries and / or Group holdings
Germany
Poland Turkey
Warszawa (Warsaw)
Międzyrzecz
LUBUSKIE
LUBELSKIE
OPOLSKIE
DOLNOŚLĄSKIEŚWIĘTOKRZYSKIE
Poznań
Wieluń
Kayseri
AnkaraBursa
Istanbul
Nürnberg
München
Stuttgart
Frankfurt
Hannover
OldenburgHamburg
Berlin
Magde-burg
Leipzig
Erfurt
Braun-schweig
Regensburg
Bremen
Kayseri
AnkaraBursa
Istanbul
Warszawa (Warschau)
Międzyrzecz
LUBUSKIE
LUBELSKIE
OPOLSKIE
DOLNOŚLĄSKIEŚWIĘTOKRZYSKIE
Poznań (Posen)
Wieluń
Kayseri
AnkaraBursa
Istanbul
Nuremberg
Munich
Stuttgart
Frankfurt
Hanover
OldenburgHamburg
Berlin
Magde-burg
Leipzig
Erfurt
Bruns-wick
Regensburg
Bremen
eWe supply territory: energy, telecommunicationsGermany, Poland, Turkey

eWe AktiengesellschaftTirpitzstraße 39, 26122 Oldenburgwww.ewe.com


![SDCCN - Cache de Conteudo Program´ avel Definido por ...portais4.ufes.br/posgrad/teses/tese_9088_VERS%C3O%20FINAL.pdf · ternet em 2017 [Cisco 2013], ... O encaminhamento do pacote](https://static.documents.pub/doc/80x56/5b5bcbd97f8b9a68368b6856/sdccn-cache-de-conteudo-program-avel-denido-por-c3o20finalpdf-ternet.jpg)


