76
ANNUAL REPORT 2010
| Date post: | 29-May-2018 |
| Category: |
Documents |
| Upload: | truongmien |
| View: | 212 times |
| Download: | 0 times |

| Annual Report 2010 | 1
AnnuAl RepoRt 2010

2 | Annual Report 2010 |

| Annual Report 2010 | 3
Financial review 5
Financial statements 27
AnnuAl RepoRt 2010

| Annual Report 2010 | 5
Financialreview
Group overview 6
Metals and minerals 19
Energy products 21
Agricultural products 23

financial review
6 | Annual Report 2010 |
Performance highlights
US $ million
December31, 2010
December31, 2009
December31, 2008
Adjusted EBITDA 1, 2 6 201 3 929 6 787
Adjusted EBIT 1, 2 5 290 3 307 6 212
Glencore net income 1, 2 3 799 2 724 4 754
Cash generated by operating activities before working capital changes 4 234 3 095 4 587
Funds from operations (FFO) 3 3 333 2 333 3 631
US $ millionDecember
31, 2010December
31, 2009December
31, 2008
Total assets 79 787 66 276 61 311
Glencore shareholders’ funds 2 19 613 16 686 15 405
Gross debt 4 30 616 24 066 18 316
Net debt 4 14 756 10 186 11 500
Net working capital 2 7 458 8 144 5 802
Current capital employed (CCE) 2 19 588 16 997 11 047
December31, 2010
December31, 2009
December31, 2008
working capital ratios:
Current ratio (times) 2 1.20 1.27 1.19
Adjusted current ratio (times) 2 1.26 1.37 1.33
equity, gearing and coverage ratios:
Net debt to net debt plus Glencore shareholders’ funds (%) 42.9 37.9 42.7
CCE to Gross debt (times) 0.64 0.71 0.60
CCE plus listed associates (at carrying value) to Gross debt (times) 1.15 1.26 1.22
FFO to Net debt (%) 22.6 22.9 31.6
Net debt to Adjusted EBITDA (times) 2.38 2.59 1.69
Adjusted EBITDA to net interest (times) 6.91 6.69 8.11
1 Refer to page 11.2 Refer to glossary on page 24 for definitions and calculations.3 Refer to page 14.4 Refer to page 13.
financial review
| Annual Report 2010 | 7
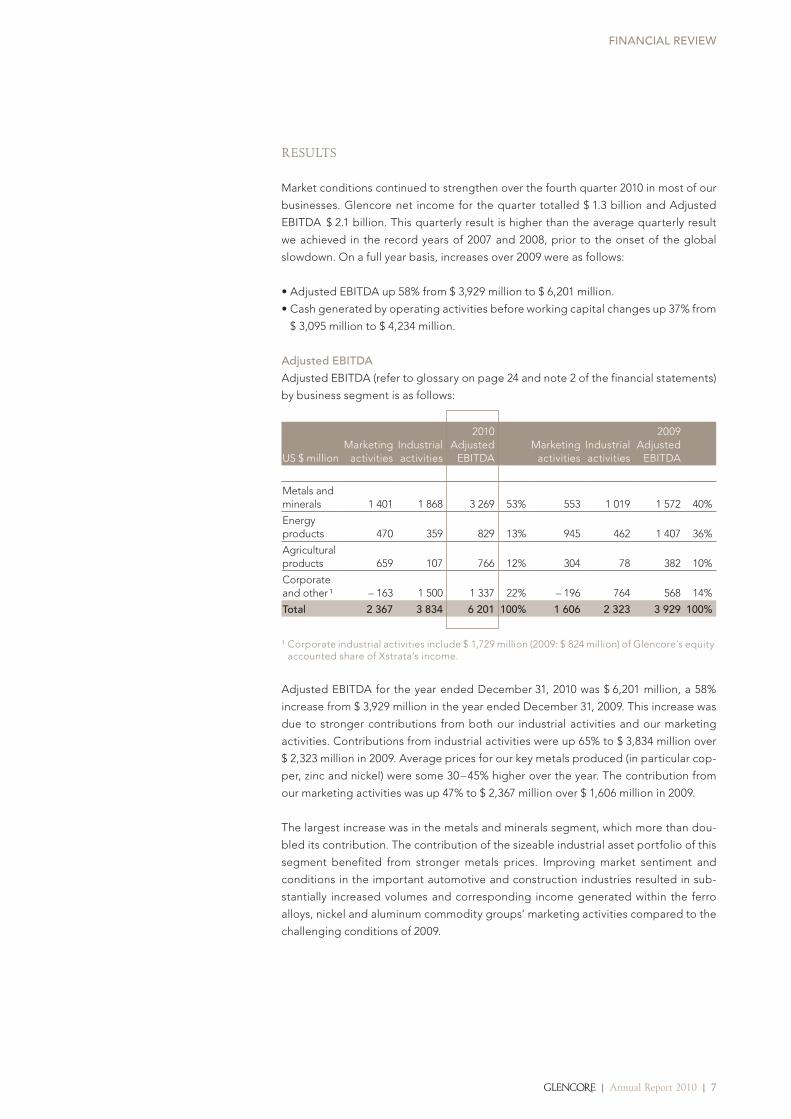
Results
Market conditions continued to strengthen over the fourth quarter 2010 in most of our
businesses. Glencore net income for the quarter totalled $ 1.3 billion and Adjusted
EBITDA $ 2.1 billion. This quarterly result is higher than the average quarterly result
we achieved in the record years of 2007 and 2008, prior to the onset of the global
slowdown. On a full year basis, increases over 2009 were as follows:
• Adjusted EBITDA up 58% from $ 3,929 million to $ 6,201 million.
• Cash generated by operating activities before working capital changes up 37% from
$ 3,095 million to $ 4,234 million.
adjusted eBiTDa
Adjusted EBITDA (refer to glossary on page 24 and note 2 of the financial statements)
by business segment is as follows:
US $ millionMarketing
activitiesIndustrial activities
2010 Adjusted
EBITDAMarketing
activitiesIndustrial activities
2009Adjusted
EBITDA
Metals and minerals 1 401 1 868 3 269 53% 553 1 019 1 572 40%
Energy products 470 359 829 13% 945 462 1 407 36%
Agricultural products 659 107 766 12% 304 78 382 10%
Corporate and other ¹ – 163 1 500 1 337 22% – 196 764 568 14%
Total 2 367 3 834 6 201 100% 1 606 2 323 3 929 100%
¹ Corporate industrial activities include $ 1,729 million (2009: $ 824 million) of Glencore’s equity accounted share of Xstrata’s income.
Adjusted EBITDA for the year ended December 31, 2010 was $ 6,201 million, a 58%
increase from $ 3,929 million in the year ended December 31, 2009. This increase was
due to stronger contributions from both our industrial activities and our marketing
activities. Contributions from industrial activities were up 65% to $ 3,834 million over
$ 2,323 million in 2009. Average prices for our key metals produced (in particular cop-
per, zinc and nickel) were some 30 – 45% higher over the year. The contribution from
our marketing activities was up 47% to $ 2,367 million over $ 1,606 million in 2009.
The largest increase was in the metals and minerals segment, which more than dou-
bled its contribution. The contribution of the sizeable industrial asset portfolio of this
segment benefited from stronger metals prices. Improving market sentiment and
conditions in the important automotive and construction industries resulted in sub-
stantially increased volumes and corresponding income generated within the ferro
alloys, nickel and aluminum commodity groups’ marketing activities compared to the
challenging conditions of 2009.

financial review
8 | Annual Report 2010 |
The agricultural products segment also produced a significantly increased percentage
contribution over 2009, as it benefited from tight and dislocated market conditions.
These resulted primarily from severe weather conditions which severely affected sup-
ply from some traditionally strong export markets such as Russia, Ukraine and Aus-
tralia.
The energy products segment’s contribution was down 41% over the prior year to
$ 829 million. The results of the oil commodity group’s marketing activities were sub-
dued due to a relatively stable price environment and a poor freight market which
prevailed for most of the year. In addition, the contribution of coal industrial assets
was affected by certain infrequent events, most notably, a lengthy strike at one of the
coal mines in Colombia and extreme wet weather conditions that affected operations
at both our Colombian and South African operations. These impacts on 2010 earnings
within the energy products segment are expected to recede in 2011 with a return to
more “normal” operating conditions. The contribution from industrial activities was
further impacted by $ 40 million of oil exploration expenses (2009: $ 26 million), in-
curred as part of the ongoing build-up of the promising West African exploration and
production portfolio which was not able to be capitalized. Production and earnings
from the portfolio are expected from first quarter 2012.
Corporate primarily relates to our equity accounted interest in Xstrata and the variable
pool bonus accrual, the net result of which was up 135% to $ 1,337 million compared
to 2009. This was mainly owing to an increase in Xstrata’s earnings, which reflected
higher commodity prices.
The Group’s large scale, vertically integrated business model, with its unique com-
bination of marketing and industrial activities across a diverse commodity portfolio,
serves to underpin the Group’s long term sustainability and resilience.
The following table sets out the average market prices in U.S. dollars for the main com-
modities Glencore produces and/or markets.
Spot end
2010
Spot end
2009Change
in %Average
2010Average
2009Change
in %
Metals and Minerals lMe (cash)
Zinc metal US$/mt 2 444 2 529 – 3% 2 162 1 663 30%
Copper metal US$/mt 9 650 7 342 31% 7 556 5 179 46%
Aluminum US$/mt 2 461 2 197 12% 2 175 1 673 30%
Nickel US$/mt 24 708 18 452 34% 21 852 14 699 49%
energy products
Coal – API4 US$/mt 123 76 62% 92 65 42%
Oil – WTI US$/bbl 91 79 15% 80 62 29%
agricultural products
Wheat – CBOT US¢/bu 794 542 47% 581 530 10%
Sugar – # 11 US¢/lb 32 27 19% 22 18 22%

financial review
| Annual Report 2010 | 9
revenue
Revenue for the year ended December 31, 2010 was $ 144,978 million, a 36% increase
from $ 106,364 million in the year ended December 31, 2009. This increase was primar-
ily due to significantly higher average commodity prices for most of the commodities
Glencore produced and marketed during 2010 compared to 2009. Higher year on year
average prices were most notable in nickel (49%), copper (46%), thermal coal (42%),
aluminum (30%), zinc (30%) and crude oil (29%), contributing to an overall increase
in revenues of $ 38,614 million. Given the relatively high revenue proportion of Glen-
core’s oil business, the increase in average oil prices was the largest driver of the total
revenue increase in 2010.
cost of goods sold
Cost of goods sold for the year ended December 31, 2010 was $ 140,467 million, a 36%
increase from $ 103,133 million in the year ended December 31, 2009. This increase
was primarily due to the higher commodity prices noted above and the resulting im-
pact on the purchases of the respective commodities.
Selling and administrative expenses
Selling and administrative expenses for the year ended December 31, 2010 were
$ 1,063 million, a 27% increase from $ 839 million in the year ended December 31, 2009.
This increase was primarily due to higher variable payroll cost, consistent with the
increased earnings in 2010.
Share of income from associates and jointly controlled entities
Share of income from associates for the year ended December 31, 2010 was $ 1,829 mil-
lion, up from $ 82 million in the year ended December 31, 2009. The 2009 balance
was negatively impacted by impairment charges recorded by underlying associates,
our share being $ 761 million. Adjusting for these exceptional items, there was still
a greater than twofold increase over the prior year mainly due to higher earnings at
Xstrata, which in turn reflected improved commodity prices.
Other (expense)/income – net
Net other expense for the year ended December 31, 2010 was $ 8 million, compared
to a net other income of $ 35 million in the year ended December 31, 2009. The net
amount in 2010 primarily comprised $ 790 million negative mark to market adjust-
ments related to certain fixed priced forward coal sales contracts of Prodeco’s future
production. These forward contracts did not qualify for “own use” or cash flow hedge
accounting. The net amount for 2010 also included $ 225 million of Prodeco call option
expenses, offset by $ 674 million of impairment reversals associated with Glencore’s
investment in Xstrata following the rebound in market conditions and underlying valu-
ation assumptions. It also included a $ 462 million revaluation adjustment on the initial
40% interest in Vasilkovskoje Gold immediately prior to the acquisition of the remain-
ing 60% interest in February 2010.
interest expense
Interest expense for the year ended December 31, 2010 was $ 1,217 million, a 43% in-
crease from $ 854 million in the year ended December 31, 2009, or up 38% on a pre-
exceptional basis, taking into account $ 39 million of capitalized borrowing costs writ-
ten off in 2010. This increase was primarily due to higher average debt levels and to a
lesser extent, the incremental cost impact of a higher long term, fixed rate funding mix.

financial review
10 | Annual Report 2010 |
Excluding exceptional items, interest expense on floating rate debt increased by
$ 93 million to $551 million from $ 458 million in 2009. Floating rate debt is predomi-
nantly used to fund fast turning and liquid working capital, the funding cost of which
is taken into account in transactional pricing and terms and accordingly “recovered”
in adjusted marketing EBIT.
Interest expense on fixed rate funding was $ 627 million in 2010, an increase of $ 231 mil-
lion over 2009. The net increase is due to the Convertible, Euro and Swiss Franc/Per-
petual bond issuances in December 2009, March 2010 and October 2010 respectively.
interest income
Interest income for the year ended December 31, 2010 was $ 281 million, a 5% increase
from $ 267 million in the year 2009. Interest income includes interest earned on various
loans extended, including companies within the Russneft Group, and on cash bal-
ances held.
income taxes
Income tax expense for the year ended December 31, 2010 was $ 234 million, largely
in line with the prior year. The effective tax rate, excluding share of income from as-
sociates which is recorded post tax, was 9.3% compared to 12.6% for 2009. The lower
rate is due to the recognition of previously unrecognized tax losses following a review
of business plans, primarily at Katanga, partly offset by the recognition of additional
deferred tax expense in relation to the corporate tax rate increase in Kazakhstan from
15% to 20%.

financial review
| Annual Report 2010 | 11
earnings
A summary of the differences between Adjusted EBITDA and Glencore net income
including exceptional items is set out in the following table:
US $ million 2010 2009
adjusted eBiTDa ¹ 6 201 3 929
Depreciation and amortization – 911 – 622
adjusted eBiT ¹ 5 290 3 307
Net finance costs – 897 – 587
Net other items 3 – 152 338
Income tax expense – 234 – 238
Non controlling interest – 208 – 96
Glencore net income pre exceptional and other significant items 3 799 2 724
Write off of capitalized borrowing costs 2 – 39 0
Mark to market valuation forward contracts 3 – 790 0
Prodeco call option expense 3 – 225 – 303
Other 3 – 23 0
Gain on revaluation of Vasilkovskoje 3 462 0
Impairment reversal 3 674 0
Net gain on restructured Russneft interests 3 46 0
Net (loss)/gain on disposal of investments – 6 33
Other prior year items 4 0 – 60
Share of associates’ exceptional items 5 0 – 761
Non controlling interests 6 – 147 0
Total exceptional and other significant items – 48 – 1 091
Glencore net income 3 751 1 633
1 Refer to glossary on page 24.2 Recognized within interest expense.3 Recognized within other (expense)/income – net, see note 4 of the financial statements.4 Recognized within cost of goods sold.5 Recognized within share of income from associates and jointly controlled entities.6 Recognized within non controlling interests.
excePtionAl And otheR significAnt items
Exceptional and other significant items are items of income and expense which, due
to their financial impact and nature or the expected infrequency of the events giving
rise to them, are separated for internal reporting and analysis of Glencore’s results
to provide a better understanding and comparative basis of the underlying financial
performance.
In 2010, Glencore recognized $ 48 million of net exceptional and other significant losses.
These comprised $ 790 million of negative mark to market adjustments associated with
certain fixed price forward coal sales contracts relating to Prodeco’s future production.
These forward contracts did not qualify for “own use” or cash flow hedge accounting.
The net amount for 2010 also included $ 225 million of Prodeco call option expenses
(see below), offset by $ 674 million of impairment reversals following the rebound in
market conditions and underlying valuation assumptions. It also included $ 462 million
($ 315 million, net of non controlling interests) related to the revaluation of the initial 40%
interest in Vasilkovskoje Gold immediately prior to the acquisition of the remaining 60%
interest in February 2010. See note 4 of the financial statements for additional details.

financial review
12 | Annual Report 2010 |
In March 2009, Xstrata acquired Glencore’s Colombian Coal Group (Prodeco) for
$ 2,000 million and concurrently granted Glencore an option to repurchase Prodeco
within 12 months for $ 2,250 million plus profits accrued during the option period and
the net balance of any cash invested. Given the fixed price repurchase option, the
conditions for derecognition/disposal of Prodeco were not met under IFRS and as
a consequence, Prodeco’s operations remained in the consolidated financial state-
ments, while the “proceeds” were deferred and recognized as a liability. In March
2010, the option was exercised. Following the exercise of the option, in addition to the
option repurchase expenses (including the option premium and profit entitlement),
$ 115 million of additional depreciation expense was recognized to reflect the depre-
ciation that would have been charged if the related assets had not previously been
classified as held for sale.
liquidity And cAPitAl ResouRces – cAsh flow
cash generated by operating activities before working capital changes
Net cash generated by operating activities before working capital changes was
$ 4,234 million in 2010 or $ 4,344 million after adjusting for the non recurring 2010 Pro-
deco call option related cash expenses, an increase of $ 1,249 million (40%) compared
to 2009, consistent with the improved earnings from both industrial and marketing
activities.
working capital changes
Amounts invested in working capital were $ 2,998 million in 2010 compared to an in-
vestment of $ 5,279 million in 2009. The 2010 movements included the payment of
$ 303 million in relation to the exercise of the Prodeco call option. The remaining in-
vestment was primarily due to movements in commodity prices affecting the carrying
value of inventory, trade receivables and margin calls with copper, zinc, oil and wheat
prices increasing by 21%, 13%, 14% and 18% respectively during the final quarter. It is
important to note that the primary drivers of the recent working capital investment,
namely higher prices, are fundamentally supportive for Glencore’s future profit and
debt coverage, most clearly identifiable in the industrial asset portfolio.
net cash used by investing activities
Net cash used by investing activities was $ 4,755 million in 2010 compared to
$ 1,164 million in 2009. The net outflow primarily related to the $ 2,000 million base
settlement of the 2009 Xstrata rights issue via exercise of the Prodeco call option, the
acquisition of a 51.5% stake in Chemoil and 100% of Pacorini Metals, the provision of
a $ 200 million secured loan to PT Bakrie Group (secured by a 4.7% interest in PT Bumi
Resources); and the continued capital expenditure programs in respect of Vasilkovs-
koje Gold’s start up, upstream oil development projects in West Africa, the develop-
ment of the Mutanda copper/cobalt mine and production expansions at Katanga and
Prodeco. The production growth initiatives (primarily coal, copper, gold and oil) are
all expected to progressively result in substantially enhanced income and cashflow
generating potential in future periods.
net cash generated by financing activities
During 2010, Glencore issued $ 2,927 million of long term bonds – 7 year 5.25%
Euro 1,250 million bonds, 5.5 year 3.625% CHF 600 million bonds, $350 million 7.5%
perpetual bonds and $ 300 million of additional Convertible bonds.

financial review
| Annual Report 2010 | 13
Assets, leveRAge And woRking cAPitAl
Total assets were $ 79,787 million as at December 31, 2010, representing an increase of
20% from $ 66,276 million as at December 31, 2009.
Current assets increased from $ 38,725 million in 2009 to $ 44,296 million in 2010. The
adjusted current ratio at December 31, 2010 was 1.26 compared to 1.37 at Decem-
ber 31, 2009. This reduction is primarily attributable to the Xstrata secured bank loans
($ 2,292 million) and the 2011 Eurobond ($ 765 million) moving from non current to cur-
rent borrowings. Excluding the Xstrata secured bank loans, which are expected to be
extended/refinanced with a new long term tenor, from current borrowings results in
an adjusted current ratio of 1.37, consistent with the corresponding prior year period.
Non current assets increased from $ 27,551 million in 2009 to $ 35,491 million as at
December 31, 2010, primarily due to the first time consolidation of Vasilkovkoje Gold,
following its full acquisition by Kazzinc, the reclassification of Prodeco from “assets
held for sale’ and the capital expenditure and project funding programs noted above.
Consistent with December 31, 2009, 98% ($ 14,331 million) of total marketing inven-
tories were contractually sold or hedged (readily marketable inventories) at Decem-
ber 31, 2010. These inventories are readily convertible into cash due to their liquid
nature, widely available markets, and the fact that any associated price risk is covered
either by a physical sale transaction or a hedge transaction on a commodity exchange
or with a highly rated counterparty. Given the highly liquid nature of these inventories,
Glencore believes it is appropriate to consider them as cash equivalents in analyzing
Group net debt levels and computing certain debt coverage ratios and credit trends.
Balance sheet liquidity is healthy such that current capital employed plus liquid stakes
in listed associates (at book carrying value) covers 115% of Glencore’s total gross debt,
or 144%, taking into account the market value of the listed associates as at Decem-
ber 31, 2010.
net debt
US $ million 2010 2009
Borrowings 30 132 23 589
Commodities sold with agreements to repurchase 484 477
Gross debt 30 616 24 066
Cash and cash equivalents and marketable securities – 1 529 – 935
Readily marketable inventories – 14 331 – 12 945
net debt 14 756 10 186

financial review
14 | Annual Report 2010 |
Movement in net debt
US $ million 2010 2009
Cash generated from operations before working capital changes 4 234 3 095
Net interest paid – 802 – 609
Tax paid – 323 – 217
Dividends received from associates 224 64
funds from operations 3 333 2 333
Non current advances and loans – 825 – 624
Acquisition and disposal of subsidiaries – 624 109
Purchase and sale of investments – 2 060 318
Purchase and sale of property, plant and equipment – 1 470 – 1 031
Working capital changes, excluding readily marketable inventory movements – 1 640 1 751
Other movements – 105 – 2
cash movement in net debt – 3 391 2 854
Debt assumed in business combination – 745 – 102
Foreign currency revaluation movements and other non cash items 70 – 445
Departed shareholder movements – 504 – 993
non cash movement in net debt – 1 179 – 1 540
Total movement in net debt – 4 570 1 314
Net debt, beginning of year – 10 186 – 11 500
net debt, end of year – 14 756 – 10 186
As detailed in the tables above, net debt as at December 31, 2010 increased to
$ 14,756 million from $ 10,186 million as at December 31, 2009, with the exercise of the
Prodeco call option accounting for a substantial part of the increase – some $ 2.4 bil-
lion, including all cash components in 2010.
Although net debt was up $ 4,570 million, the ratio of net debt to Adjusted EBITDA
improved from 2.59 in 2009 to 2.38 in 2010. The ratio of FFO to net debt of 22.6% was
largely in line with the previous year. After adjusting for the non recurring Prodeco
related call option cash expense of $ 110 million, the ratio of FFO to net debt improves
to 23.3% in 2010. Furthermore, as can be seen in the table below, these ratios show
substantial sequential improvement based on the last 6 months’ annualized perfor-
mance.
Last 6 monthsannualized
Last 12 months
Net debt to EBITDA (times) 2.06 2.38
FFO to net debt (%) 28.0 22.6
Glencore shareholders’ funds as of December 31, 2010 were $ 19,613 million, an increase
of $ 2,927 million compared to $ 16,686 million as at December 31, 2009.

financial review
| Annual Report 2010 | 15
notional allocation of debt and interest expense
Glencore’s indebtedness is primarily arranged centrally with the proceeds then
applied to marketing and industrial activities as required.
Glencore does not allocate borrowings or interest to its three operating segments.
However, to assist investors in the assessment of overall performance and underly-
ing value contributors of its integrated business model, Glencore notionally allocates
its borrowings and interest expense between its marketing and industrial activities as
follows:
• At a particular point in time, Glencore estimates the borrowings attributable to fund-
ing key working capital items within the marketing activities, including inventories,
net cash margining and other accounts receivable/payable, through the application
of an appropriate loan to value ratio for each item. The balance of group borrowings
is allocated to industrial activities (including Glencore’s stake in Xstrata).
• Once the average amount of borrowings notionally allocated to marketing activities
for the relevant period has been estimated, the corresponding interest expense on
those borrowings is estimated by applying the Group’s average variable rate cost of
funds during the relevant period to the average borrowing amount. The balance of
group interest expense and all interest income is allocated to industrial activities.
The allocation is a company estimate only and is unaudited.
The table below summarizes the notional allocation of borrowings and interest and
corresponding implied earnings before tax of the marketing and industrial activities
for the year ended December 31, 2010.
US $ millionMarketing
activitiesIndustrial activities Total
Adjusted EBIT 2 337 2 953 5 290
Interest expense allocation ¹ – 299 – 878 – 1 178
Interest income allocation 0 281 281
allocated profit before tax 2 038 2 356 4 393
Allocated borrowings ² – year end 12 835 17 782 30 616
Allocated borrowings ² – quarterly average 10 460 15 663 26 123
¹ Adjusted to exclude the write off of capitalized borrowings costs.² Includes commodities sold with agreement to repurchase.
Based on the implied equity funding for the marketing activities’ working capital re-
quirements as well as the relatively modest level of non current assets employed in
the marketing activities (assumed to be equity funded), return on notional equity for
the marketing activities was very healthy in 2010. The industrial activities’ return on
notional equity, although still respectable, was held back by early/mid stage oil, cop-
per, coal and gold development and expansion projects where significant investments
have been made to date, however the projects did not make a material contribution to
earnings in the year.
liquidity
Available committed liquidity (see glossary on page 24) as at December 31, 2010,
amounted to $ 4,220 million, comfortably ahead of our minimum internal target of
$ 3 billion.

financial review
16 | Annual Report 2010 |
cAPitAl ResouRces And finAncing
In 2010, the following important financing activities took place:
• In March 2010, issued 7 year, 5.25% EUR 1,250 million ($ 1,708 million) bonds;
• In March/May 2010, issued an additional $ 300 million Convertible bonds;
• In May 2010, replaced the 364 day $ 815 million revolving credit facility with a new
$ 1,375 million 364 day plus one year term out option facility and also concluded a
debut 364 day $ 515 million Asian focused tranche. In addition, replaced the $ 8,180
million medium term revolving credit facility with a new 3 year committed revolving
credit facility of $ 8,370 million and cancelled the $ 6,650 million forward start facility
concluded in 2009. In aggregate, the three tranches represent an increase in com-
mitted available liquidity of $ 1,265 million, provided by 97 banks, including 42 new
banks;
• In October 2010, issued 6 year, 3.625% CHF 600 million ($ 593 million) bonds and
7.5% $ 350 million perpetual notes;
• In November 2010, concluded a new $ 1.7 billion secured inventory and receivables
borrowing base facility which replaced the $1.5 billion receivables ABCP program
along with the $ 600 million base metals inventory program that expired in November.
Detailed descriptions of each of the total borrowings and a summary of borrowings
can be found in note 15 of the financial statements.

financial review
| Annual Report 2010 | 17

financial review
18 | Annual Report 2010 |
Net current capital employedNet non current capital employed
2010 Net assets
2009 200849% 42%51% 58%
44%
56%
Select marketing volumes sold
millions MT 2010 2009
Zinc metal 1 .7 1.3
Zinc concentrate 2 .4 2 .5
Copper metal 1 .4 1.4
Copper concentrate 1.8 2.0
Aluminum 3.9 3 .2
Alumina 6 .7 5.8
Nickel (kMT) 194 175
Iron ore 9.3 4.8
2010 Adjusted EBIT
2009 200853% 57%47% 43%
55%
45%
Marketing activitiesIndustrial activities

financial review
| Annual Report 2010 | 19
metals and mineralsThe metals and minerals business segment comprises the following underlying key
commodities – zinc, copper, lead, alumina, aluminum, ferro alloys, nickel, cobalt and
iron ore. Activities within the segment include marketing, smelting, refining, mining,
processing and storage related operations for each relevant commodity.
A summary of selected key earnings and investment related financial information for
the metals and minerals segment is as follows:
US $ millionMarketing
activitiesIndustrial activities
2010 Total
Marketing activities
Industrial activities
2009 Total
Revenue 37 889 7 322 45 211 30 221 5 170 35 391
Adjusted EBITDA ¹ 1 401 1 868 3 269 553 1 019 1 572
Adjusted EBIT ¹ 1 401 1 160 2 561 553 498 1 051
Adjusted EBITDA margin 3.7% 25.5% – 1.8% 19.7% –
Allocatable CE ² 9 304 11 807 21 111 8 485 8 855 17 340
Adjusted EBIT return on average CE ² 15.8% 11.2% 13.3% 7.8% 6.0% 6.8%
¹ Refer to note 2 of the financial statements.² Segment current and non current capital employed (see note 2 of the financial statements)
applied as a proxy for marketing and industrial activities respectively.
highlights
• Adjusted EBITDA up 108% to $ 3.3 billion, with marketing and industrial activities up
153% and 83%, respectively.
• Notable increases in marketing volumes and contributions from the alumina, alumi-
num and nickel commodity groups following a challenging 2009.
• Adjusted EBIT return on average capital employed was a healthy 13.3% compared to
6.8% in 2009, particularly taking into account the naturally high leverage embedded
in the marketing activities, which enhances return on equity.
• Kazzinc acquired the remaining 60% of Vasilkovskoje Gold, providing it with a size-
able gold portfolio capable of producing 800,000 ounces of gold per year (including
silver in gold equivalents) by 2013.
• Acquired the metals warehousing division of Pacorini to further enhance and sup-
port the marketing logistics chain (refer note 21 of the financial statements).
• Continued to enhance the near term growth pipeline of copper, zinc and cobalt
through ongoing development activities at Katanga and Mutanda and by concluding
future development agreements related to Kansuki and Perkoa.

financial review
20 | Annual Report 2010 |
Net current capital employedNet non current capital employed
2010 Net assets
2009 200870% 47%30% 53%
41%
59%
Select marketing volumes sold
millions MT 2010 2009
Coal thermal 92.2 98.0
Coal metallurgical 8.0 7.7
Crude oil 51.9 39.7
Oil products 66.9 69.4
2010 Adjusted EBIT
2009 200870% 76%30% 24%
66%
34%
Marketing activitiesIndustrial activities

financial review
| Annual Report 2010 | 21
energy productsThe energy products business segment comprises the following underlying key com-
modities – crude oil, oil products, steam coal and metallurgical coal. Activities within
the segment include marketing and investments in coal mining and oil production
operations, ports, vessels and storage facilities.
A summary of selected key earnings and investment related financial information for
the energy products segment is as follows:
US $ millionMarketing
activitiesIndustrial activities
2010 Total
Marketing activities
Industrial activities
2009 Total
Revenue 87 850 1 499 89 349 60 790 1 601 62 391
Adjusted EBITDA ¹ 470 359 829 945 462 1 407
Adjusted EBIT ¹ 450 235 685 945 413 1 358
Adjusted EBITDA margin 0.5% 23.9% – 1.6% 28.9% –
Allocatable CE ² 4 522 6 429 10 951 7 016 2 985 10 001
Adjusted EBIT return on average CE ² 7.8% 7.2% 3 7.6% 17.4% 14.1% 3, 4 16.2%
¹ Refer to note 2 of the financial statements.² Segment current and non current capital employed (see note 2 of the financial statements)
applied as a proxy for marketing and industrial activities respectively.³ For the purposes of this calculation, capital employed has been adjusted to exclude Russneft,
Atlas and PT Bakrie loans (see note 8 of the financial statements), which generate interest income and do not contribute to Adjusted EBIT.
4 For the purposes of this calculation, capital employed has been adjusted to include the Prodeco related assets disclosed as held for sale.
highlights
• Adjusted EBITDA down 41% to $ 829 million, with the oil commodity group’s mar-
keting activities experiencing a significant decline compared to 2009, due to the
unusually low volatility in the market, exacerbated by a weak freight market.
• Coal industrial assets were impacted by a lengthy strike at one of the Colombian
mines and extreme wet weather conditions in Colombia and South Africa, which
significantly affected operational and financial performance.
• The contribution from industrial activities was further affected by $ 40 million of oil
exploration expenses (2009: $ 26 million), incurred as part of the ongoing build-up
of the promising West African exploration and production portfolio, which was not
able to be capitalized. Production and earnings from the portfolio are expected
from first quarter 2012.
• Adjusted EBIT return on average capital employed was 7.6% compared to 16.2% in
2009.
• Completed the acquisition of a 51.5% stake in Chemoil in April, a leading global
marine fuel supplier to complement the segment’s sizeable storage and freight
capabilities.
• Significantly increased presence and future marketing volumes in the Indonesian
coal market.

financial review
22 | Annual Report 2010 |
Net current capital employedNet non current capital employed
2010 Net assets
2009 200871% 65%29% 35%
80%
20%
Select marketing volumes sold
millions MT 2010 2009
Grains 20.9 19.8
Oil seeds 9.4 8.1
Sugar 0.5 1.0
2010 Adjusted EBIT
2009 200888% 85%12% 15%
92%
8%
Marketing activitiesIndustrial activities

financial review
| Annual Report 2010 | 23
Agricultural productsThe agricultural products business segment comprises the following underlying key
commodities – wheat, corn, barley, rice, oilseeds, meals, edible oils, biodiesel, cotton
and sugar. Activities within the segment include marketing and investments in storage,
handling, processing and port facilities.
A summary of selected key earnings and investment related financial information for
the agricultural products segment is as follows:
US $ millionMarketing
activitiesIndustrial activities
2010 Total
Marketing activities
Industrial activities
2009 Total
Revenue 8 238 2 180 10 418 6 793 1 789 8 582
Adjusted EBITDA ¹ 659 107 766 304 78 382
Adjusted EBIT ¹ 659 58 717 304 41 345
Adjusted EBITDA margin 8.0% 4.9% – 4.5% 4.4% –
Allocatable CE ² 3 958 1 009 4 967 1 412 569 1 981
Adjusted EBIT return on average CE ² 24.7% 7.4% 20.7% 25.4% 7.4% 19.7%
¹ Refer to note 2 of the financial statements.² Segment current and non current capital employed (see note 2 of the financial statements)
applied as a proxy for marketing and industrial activities respectively.
highlights
• Adjusted EBITDA up 101% to $ 766 million, driven in large part by the significant phys-
ical commodity market dislocations brought on by the severe weather related supply
shocks and the resulting increased market volatility prevalent over much of 2010.
• Adjusted EBIT return on average capital employed was a strong 20.7% compared to
19.7% in 2009, particularly taking into account the naturally high leverage embedded
in the marketing activities, which enhances return on equity.
• Industrial footprint further expanded and diversified via the acquisitions of a 60.3%
stake in Biopetrol Industries, a biodiesel processer with sizeable operations in
Europe, a 76% stake in Rio Vermelho, a sugar cane/ethanol processing operation in
Brazil and a 50% stake in Moinhos Cruzeiro, a wheat milling facility in Brazil.

financial review
24 | Annual Report 2010 |
glossary AvAilAble committed liquidity
US $ million 2010 2009 2008
Cash and cash equivalents and marketable securities 1 529 935 939
Headline committed syndicated revolving credit facility 10 260 8 995 9 135
Amount drawn under syndicated revolving credit facility – 7 259 – 5 890 – 4 819
Amount drawn under US commercial paper program – 310 – 214 0
Total 4 220 3 826 5 255
AdJusted cuRRent RAtioCurrent assets over current liabilities, both adjusted to exclude other financial liabilities.
AdJusted ebit/ebitdA
US $ million 2010 2009 2008
Revenue 144 978 106 364 152 236
Cost of goods sold – 140 467 – 103 133 – 147 565
Selling and administrative expenses – 1 063 – 839 – 850
Share of income from associates and jointly controlled entities 1 829 82 1 067
Dividend income 13 12 238
adjusted eBiT 5 290 2 486 5 126
Exceptional items included in segment results ¹ 0 821 1 086
adjusted eBiT pre exceptional items 5 290 3 307 6 212
Depreciation and amortization 911 622 575
adjusted eBiTDa pre exceptional items 6 201 3 929 6 787
¹ Refer to note 2 of the financial statements.
cuRRent cAPitAl emPloyedCurrent capital employed is current assets, presented before assets held for sale, less
accounts payable, other financial liabilities and income tax payable.
cuRRent RAtioCurrent assets over current liabilities.
glencoRe net incomeIncome before attribution less attribution to non controlling interests.

financial review
| Annual Report 2010 | 25
glencoRe shAReholdeRs’ fundsTotal net assets attributable to profit participation shareholders, non controlling
interests and equity holders less non controlling interests.
net woRking cAPitAlCurrent assets less current liabilities.
ReAdily mARketAble inventoRiesReadily marketable inventories are readily convertible into cash due to their very liquid
nature, widely available markets and the fact that the price risk is covered either by
a physical sale transaction or hedge transaction on a commodity exchange or with a
highly rated counterparty.

26 | Annual Report 2010 |

| Annual Report 2010 | 27
financialStatementS
Independent auditors’ report 29
Consolidated statement of income 30
Consolidated statement of comprehensive income 31
Consolidated statement of financial position 32
Consolidated statement of cash flows 33
Consolidated statement of changes in equity 34
Notes to the financial statements 35

28 | Annual Report 2010 |

| Annual Report 2010 | 29
Deloitte AG General Guisan-Quai 38 P.O. Box 2232 CH-8022 Zurich Switzerland
Tel: +41 (0) 44 421 60 00 Fax: +41 (0) 44 421 66 00 www.deloitte.ch
Wirtschaftsprüfung. Steuerberatung. Consulting. Corporate Finance. Member of Deloitte Touche Tohmatsu
Independent Auditors’ Report To the Board of Directors of GLENCORE INTERNATIONAL AG, BAAR We have audited the accompanying consolidated financial statements of Glencore International AG and its subsidiaries (the “Group”), which comprise the consolidated statement of financial position as at December 31, 2010, and the related consolidated statements of income, comprehensive income, cash flows and changes in equity for the year then ended, and a summary of significant accounting policies and other explanatory notes, set out on pages 30 to 74. Board of Directors’ Responsibility The Board of Directors is responsible for the preparation and fair presentation of these consolidated financial statements in accordance with International Financial Reporting Standards. This responsibility includes: designing, implementing and maintaining an internal control system relevant to the preparation and fair presentation of consolidated financial statements that are free from material misstatement, whether due to fraud or error; selecting and applying appropriate accounting policies; and making accounting estimates that are reasonable in the circumstances. Auditors’ Responsibility Our responsibility is to express an opinion on these consolidated financial statements based on our audit. We conducted our audit in accordance with International Standards on Auditing. Those standards require that we comply with ethical requirements and plan and perform the audit to obtain reasonable assurance whether the consolidated financial statements are free from material misstatement. An audit involves performing procedures to obtain audit evidence about the amounts and disclosures in the consolidated financial statements. The procedures selected depend on the auditor’s judgment, including the assessment of the risks of material misstatement of the consolidated financial statements, whether due to fraud or error. In making those risk assessments, the auditor considers internal control relevant to the Group’s preparation and fair presentation of the consolidated financial statements in order to design audit procedures that are appropriate in the circumstances, but not for the purpose of expressing an opinion on the effectiveness of the Group’s internal control. An audit also includes evaluating the appropriateness of accounting policies used and the reasonableness of accounting estimates made by management, as well as evaluating the overall presentation of the consolidated financial statements. We believe that the audit evidence we have obtained is sufficient and appropriate to provide a basis for our audit opinion. Opinion In our opinion, the consolidated financial statements present fairly, in all material respects, the financial position of Glencore International AG and its subsidiaries as of December 31, 2010 and of its financial performance and its cash flows for the year then ended in accordance with International Financial Reporting Standards. Deloitte AG
David Quinlin Cameron Walls Zurich, February 28, 2011
Independent AudItoRs’ RepoRt

Financial StatementS
30 | Annual Report 2010 |
ConsolIdAted stAtement of InCome foR the yeARs ended deCembeR 31, 2010 And 2009
US $ million Notes 2010 2009
Revenue 144 978 106 364
Cost of goods sold – 140 467 – 103 133
Selling and administrative expenses – 1 063 – 839
Share of income from associates and jointly controlled entities 1 829 82
(Loss)/gain on sale of investments – net 3 – 6 33
Other (expense)/income – net 4 – 8 35
Dividend income 13 12
Interest income 281 267
Interest expense – 1 217 – 854
income before income taxes and attribution 4 340 1 967
Income tax expense 5 – 234 – 238
income before attribution 4 106 1 729
Attribution to hybrid profit participation shareholders 14 – 367 – 96
Attribution to ordinary profit participation shareholders 14 – 2 093 – 554
income for the year 1 646 1 079
attributable to:
Non controlling interests 355 96
Equity holders 1 291 983
earnings per share
Basic and diluted (US $) 14 8 606 6 555
The accompanying notes are an integral part of these consolidated financial statements

Financial StatementS
| Annual Report 2010 | 31
ConsolIdAted stAtement of CompRehensIve InCome foR the yeARs ended deCembeR 31, 2010 And 2009
US $ million 2010 2009
Income for the year 1 646 1 079
Exchange gain on translation of foreign operations 26 37
(Loss)/gain on cash flow hedges – 182 293
Gain on available for sale financial instruments 25 0
Share of comprehensive (loss)/income from associates and jointly controlled entities – 43 175
Income tax relating to components of other comprehensive income 2 – 7
net (loss)/income recognized directly in equity – 172 498
Cash flow hedges transferred to the statement of income, net of tax 6 82
Other comprehensive (loss)/income – 166 580
total comprehensive income 1 480 1 659
attributable to:
Non controlling interests 373 96
Equity holders 1 107 1 563
The accompanying notes are an integral part of these consolidated financial statements

Financial StatementS
32 | Annual Report 2010 |
ConsolIdAted stAtement of fInAnCIAl posItIon As At deCembeR 31, 2010 And 2009
US $ million Notes 2010 2009
assets
non current assets
Property, plant and equipment 6 12 088 6 845
Investments in associates and jointly controlled entities 7 16 766 14 881
Other investments 7 2 438 3 202
Advances and loans 8 3 830 2 535
Deferred tax assets 5 369 88
35 491 27 551
current assets
Inventories 9 17 393 15 073
Accounts receivable 10 18 994 15 189
Other financial assets 11 5 982 6 125
Prepaid expenses and other assets 118 54
Marketable securities 66 75
Cash and cash equivalents 12 1 463 860
44 016 37 376
Assets held for sale 13 280 1 349
44 296 38 725
total assets 79 787 66 276
equity and liabilities
net assets attributable to profit participation shareholders, non controlling interests and equity holders
Share capital 14 46 46
Reserves and retained earnings 5 378 4 395
Non controlling interests 2 894 1 258
8 318 5 699
Hybrid profit participation shareholders 14 1 823 1 461
Ordinary profit participation shareholders 14 12 366 10 784
total net assets attributable to profit participation shareholders, non controlling interests and equity holders
22 507
17 944
Other non current liabilities
Borrowings 15 18 251 16 403
Deferred income 16 164 177
Deferred tax liabilities 5 1 308 626
Provisions 17 719 545
20 442 17 751
current liabilities
Borrowings 15 11 881 7 186
Commodities sold with agreements to repurchase 9 484 477
Prodeco call option arrangement 4 0 2 303
Accounts payable 19 16 145 11 482
Other financial liabilities 20 8 066 8 643
Income tax payable 217 254
36 793 30 345
Liabilities held for sale 13 45 236
36 838 30 581
total equity and liabilities 79 787 66 276
The accompanying notes are an integral part of these consolidated financial statements

Financial StatementS
| Annual Report 2010 | 33
ConsolIdAted stAtement of CAsh flowsfoR the yeARs ended deCembeR 31, 2010 And 2009
US $ million Notes 2010 2009
Operating activitiesIncome before income taxes and attribution 4 340 1 967adjustments for:Depreciation and amortization 1 026 622Share of income from associates and jointly controlled entities – 1 829 – 82Increase in non current provisions 11 42Loss/(gain) on sale of investments – net 6 – 33Unrealized mark to market movements on other investments 178 – 222Impairments and other non cash items – net – 434 214Interest expense – net 936 587cash generated by operating activities before working capital changes 4 234 3 095Working capital changesDecrease in marketable securities 28 38(Increase)/decrease in accounts receivable 1 – 4 170 6 729Increase in inventories – 1 724 – 7 334Increase/(decrease) in accounts payable 2 2 868 – 4 712total working capital changes – 2 998 – 5 279Income tax paid – 323 – 217Interest received 229 218Interest paid – 1 031 – 827net cash generated/(used) by operating activities 111 – 3 010investing activitiesPayments of non current advances and loans – 825 – 624Acquisition of subsidiaries 21 – 624 – 27Disposal of subsidiaries 21 0 136Purchase of investments – 191 – 251Xstrata rights issue settlement via exercise of Prodeco call option 4 – 2 000 0Proceeds from sale of investments 131 569Purchase of property, plant and equipment – 1 657 – 1 088Payments for exploration and evaluation – 233 – 28Proceeds from sale of property, plant and equipment 420 85Dividends received from associates 224 64net cash (used) by investing activities – 4 755 – 1 164Financing activitiesProceeds from issuance/(repurchase) of Euro, Swiss Franc and Sterling bonds 2 317 – 90Proceeds from Perpetual bonds – net of repurchases of $ 20 million (2009: $ nil million) 327 0Proceeds from Convertible bonds 283 1 915Proceeds from other non current borrowings 776 40Repayment of other non current borrowings – 413 0Proceeds from Xstrata secured bank loans 0 642Net proceeds from current borrowings 2 945 2 495Acquisition of additional interest in subsidiaries – 75 0Payment of profit participation certificates – 883 – 792Return of capital to non controlling interests – 28 0Dividend – 2 – 2net cash generated by financing activities 5 247 4 208Increase in cash and cash equivalents 603 34Cash and cash equivalents, beginning of year 860 826cash and cash equivalents, end of year 1 463 860
1 Includes movements in other financial assets and prepaid expenses and other assets.2 Includes movements in other financial liabilities.
The accompanying notes are an integral part of these consolidated financial statements

Financial StatementS
34 | Annual Report 2010 |
ConsolIdAted stAtement of ChAnges In equIty foR the yeARs ended deCembeR 31, 2010 And 2009
US $ millionRetained earnings Reserves 1
Total reserves
and retained earnings
Share capital
Total equity
attributable to equity
holders
Non controlling
interestsTotal
equity
Balance January 1, 2009 3 255 – 500 2 755 46 2 801 906 3 707
Income for the year 983 0 983 0 983 96 1 079
Other comprehensive income 175 405 580 0 580 0 580
Dividend ² – 2 0 – 2 0 – 2 0 – 2
Acquisition of subsidiaries 0 0 0 0 0 256 256
Equity portion of Convertible bonds 0 77 77 0 77 0 77
Other 2 0 2 0 2 0 2
Balance December 31, 2009 4 413 – 18 4 395 46 4 441 1 258 5 699
Balance January 1, 2010 4 413 – 18 4 395 46 4 441 1 258 5 699
Income for the year 1 291 0 1 291 0 1 291 355 1 646
Other comprehensive (loss)/income – 43 – 141 – 184 0 – 184 18 – 166
Dividend ² – 2 0 – 2 0 – 2 0 – 2
Return of capital to non controlling interests 0 0 0 0 0 – 28 – 28
Change in ownership interest in subsidiaries 0 – 134 – 134 0 – 134 59 – 75
Acquisition of subsidiaries 0 0 0 0 0 1 232 1 232
Equity portion of Convertible bonds 0 12 12 0 12 0 12
Balance December 31, 2010 5 659 – 281 5 378 46 5 424 2 894 8 318
1 See note 14.² During 2010, a dividend of $ 13.33 per share (2009: $ 13.33) was declared and paid.
The accompanying notes are an integral part of these consolidated financial statements

Financial StatementS
| Annual Report 2010 | 35
NOTES TO THE FINANCIAL STATEMENTS
1. ACCountIng polICIes
corporate information
The Glencore Group (Glencore) is a leading integrated marketer
and producer of natural resources, with worldwide activities in
the marketing of metals and minerals, energy products and ag
ricultural products and the production, refinement, processing,
storage and transport of these products. Glencore operates on
a global scale, marketing and distributing physical commodi
ties sourced from third party producers and own production
to industrial consumers, such as those in the automotive, steel,
power generation, oil and food processing industries. Glencore
also provides financing, logistics and other services to produ
cers and consumers of commodities. Glencore’s long experi
ence as a commodity merchant has allowed it to develop and
build upon its expertise in the commodities which it markets
and cultivate longterm relationships with a broad supplier and
customer base across diverse industries and in multiple geo
graphic regions. Glencore’s marketing activities are supported
by investments in industrial assets operating in Glencore’s core
commodities.
On February 28, 2011, the Board of Directors approved these
financial statements for issue.
Statement of compliance
The accounting policies adopted are in accordance with In
ternational Financial Reporting Standards (IFRS) issued by the
International Accounting Standards Board (IASB) and interpre
tations of the International Financial Reporting Interpretations
Committee (IFRIC) effective for Glencore’s reporting for the
year ended December 31, 2010.
Basis of preparation
The financial statements are prepared under the historical cost
convention except for the revaluation to fair value of certain fi
nancial assets, liabilities and marketing inventories. All amounts
are expressed in millions of United States Dollars, unless other
wise stated, consistent with the predominant functional cur
rency of Glencore’s operations.
changes in accounting policies and comparability
Glencore has adopted all of the new and revised standards and
interpretations issued by the International Accounting Stan
dards Board (IASB) and the International Financial Reporting
Interpretations Committee (IFRIC) that are relevant to its opera
tions and effective for accounting periods beginning on Janu
ary 1, 2010 and that are expected to be applied for the account
ing period beginning on January 1, 2011. In addition, Glencore
adopted IFRS 8 “Operating Segments“ which requires disclo
sure of certain information relating to Glencore’s operating seg
ments and IAS 33 “Earnings per share” to be consistent with
publicly listed comparable companies. The adoption of these
new and revised standards and interpretations did not have a
material impact on the recognition and measurement of report
ed amounts.
At the date of authorization of these financial statements, the
following standards and interpretations applicable to Glencore
were issued but not yet effective:
IFRS 9 – Financial Instruments (as amended in 2010)
IAS 24 – Related Party Disclosures (revised 2009)
IFRIC 19 – Extinguishing Financial Liabilities with Equity Instru
ments
Amendment to IFRS 3 (2008) – Business Combinations
Amendment to IFRS 7 – Transfers of Financial Assets
Amendment to IAS 32 – Classification of Rights Issues
Amendment to IFRIC 13 – Customer Loyalty Programmes
Amendment to IFRIC 14 – IAS 19: The Limit on a Defined Benefit
Asset, Minimum Funding Requirements and their Interaction –
November 2009 Amendment with respect to voluntary prepaid
contributions
Amendment to IAS 12 – Income Taxes: Recovery of Underlying
Assets
The Directors anticipate that the adoption of these standards
and interpretations in future periods will not have a material
impact on the financial statements of Glencore other than ad
ditional note disclosures.
Principles of consolidation
The consolidated financial statements of Glencore include the
accounts of Glencore International AG, a Swiss domiciled com
pany with its registered office at Baarermattstrasse 3, 6341 Baar,
(the Company) and its subsidiaries. A subsidiary is an entity that
is ultimately controlled by the Company. Control is the power
to govern the financial and operating policies of an entity so as
to obtain benefits from its activities. Control is usually assumed
where Glencore ultimately owns or controls more than 50% of
the voting rights, unless evidence exists to the contrary. The
results of subsidiaries acquired or disposed of during the year
are consolidated from the effective date of acquisition or up to
the effective date of disposal, as appropriate. All intercompany
balances, transactions and unrealized profits are eliminated.
Non controlling interests in subsidiaries are identified sepa
rately from Glencore’s equity and are initially measured either
at fair value or at the non controlling interests’ proportionate
share of the fair value of the acquiree’s identifiable net assets.
Subsequent to acquisition, the carrying amount of non control
ling interests is the amount of those interests at initial recog
nition plus the non controlling interests’ share of subsequent
changes in equity. Total comprehensive income is attributed to
non controlling interests even if this results in the non controlling
interests having a deficit balance.

Financial StatementS
36 | Annual Report 2010 |
NOTES TO THE FINANCIAL STATEMENTS (CONTINUED)
Changes in Glencore’s interests in subsidiaries that do not re
sult in a loss of control are accounted for as equity transactions
with any difference between the amount by which the non con
trolling interests are adjusted and the fair value of the consider
ation paid or received being recognized directly in equity and
attributed to owners of Glencore.
investments in associates, jointly controlled entities and joint
venture operations
Associates and jointly controlled entities (together Associates)
in which Glencore exercises significant influence or joint control
are accounted for using the equity method. Significant influence
is the power to participate in the financial and operating policy
decisions of the investee but is not control over those policies.
Significant influence is presumed if Glencore holds between 20%
and 50% of the voting rights, unless evidence exists to the con
trary. Joint control is the contractually agreed sharing of control
over an economic entity where strategic and operating decisions
require unanimous decision making.
Equity accounting involves Glencore recording its share of the
Associate’s net income and equity. Glencore’s interest in an As
sociate is initially recorded at cost and is subsequently adjusted
for Glencore’s share of changes in net assets of the Associate,
less any impairment in the value of individual investments.
Where Glencore transacts with an Associate, unrealized profits
and losses are eliminated to the extent of Glencore’s interest in
that Associate.
Changes in Glencore’s interests in Associates are accounted for
as a gain or loss on disposal with any difference between the
amount by which the carrying value of the Associate is adjusted
and the fair value of the consideration received being recog
nized directly in the statement of income.
Where Glencore undertakes activities under joint venture op
eration or asset arrangements, Glencore reports such interests
using the proportionate consolidation method. Glencore’s
share of the assets, liabilities, income, expenses and cash flows
of jointly controlled operations or asset arrangements are con
solidated with the equivalent items in the consolidated financial
statements on a line by line basis.
Business combinations
Acquisitions of subsidiaries and businesses are accounted for
using the acquisition method of accounting, whereby the iden
tifiable assets, liabilities and contingent liabilities (identifiable
net assets) are measured on the basis of fair value at the date
of acquisition. Acquisition related costs are recognized in the
statement of income as incurred.
Where a business combination is achieved in stages, Glencore’s
previously held interests in the acquired entity are remeasured
to fair value at the acquisition date (i.e. the date Glencore at
tains control) and the resulting gain or loss, if any, is recognized
in the statement of income.
Where the fair value of consideration transferred for a business
combination exceeds the fair values attributable to Glencore’s
share of the identifiable net assets, the difference is treated
as purchased goodwill, which is not amortized but is reviewed
annually for impairment and when there is an indication of im
pairment. Any impairment identified is immediately recognized
in the statement of income. If the fair value attributable to Glen
core’s share of the identifiable net assets exceeds the consid
eration transferred, the difference is immediately recognized in
the statement of income.
Similar procedures are applied in accounting for the purchases
of interests in Associates. Any goodwill arising from such pur
chases is included within the carrying amount of the investment
in Associates, but not amortized thereafter. Any excess of Glen
core’s share of the net fair value of the Associate’s identifiable
net assets over the cost of the investment is included in the
statement of income in the period of the purchase.
The main operating and finance subsidiaries and industrial
investments of Glencore are listed in note 28.
non current assets held for sale and disposal groups
Non current assets and assets and liabilities included in disposal
groups are classified as held for sale if their carrying amount
will be recovered principally through a sale transaction rather
than through continuing use, they are available for immediate
disposal and the sale is highly probable. Non current assets
held for sale are measured at the lower of their carrying amount
or fair value less costs to sell.
Revenue recognition
Revenue is recognized when the seller has transferred to the
buyer all significant risks and rewards of ownership of the assets
sold. Revenue excludes any applicable sales taxes and is recog
nized at the fair value of the consideration received or receiv
able to the extent that it is probable that economic benefits
will flow to Glencore and the revenues and costs can be reliably
measured. In most instances sales revenue is recognized when
the product is delivered to the destination specified by the
customer, which is typically the vessel on which it is shipped, the
destination port or the customer’s premises.
For certain commodities, the sales price is determined on a
provisional basis at the date of sale as the final selling price is
subject to movements in market prices up to the date of final
pricing, normally ranging from 30 to 180 days after initial book
ing. Revenue on provisionally priced sales is recognized based
on the estimated fair value of the total consideration receivable.

Financial StatementS
| Annual Report 2010 | 37
NOTES TO THE FINANCIAL STATEMENTS (CONTINUED)
The revenue adjustment mechanism embedded within provi
sionally priced sales arrangements has the character of a com
modity derivative. Accordingly, the fair value of the final sales
price adjustment is reestimated continuously and changes in
fair value are recognized as an adjustment to revenue. In all cases,
fair value is estimated by reference to forward market prices.
Interest and dividend income is recognized when the right to
receive payment has been established, it is probable that the
economic benefits will flow to Glencore and the amount of in
come can be measured reliably. Interest income is accrued on a
time basis, by reference to the principal outstanding and at the
applicable effective interest rate.
Foreign currency translation
Glencore’s reporting currency and the functional currency of
the majority of its operations is the U.S. Dollar as this is assessed
to be the principal currency of the economic environment in
which they operate.
Foreign currency transactions
Transactions in foreign currencies are converted into the func
tional currency of each entity using the exchange rate pre
vailing at the transaction date. Monetary assets and liabilities
outstanding at year end are converted at year end rates. The re
sulting exchange differences are recorded in the consolidated
statement of income.
Translation of financial statements
For the purposes of consolidation, assets and liabilities of group
companies whose functional currency is in a currency other than
the U.S. Dollar are translated into U.S. Dollars using year end
exchange rates, while their statements of income are translat
ed using average rates of exchange for the year. Goodwill and
fair value adjustments arising from the acquisition of a foreign
operation are treated as assets and liabilities of the foreign
operation and are translated at the closing rate. Translation
adjustments are included as a separate component of share
holders’ equity and have no statement of income impact to the
extent that no disposal of the foreign operation has occurred.
Securitizations
Glencore may obtain sources of liquidity by securitizing certain
of its receivables which generally result in the legal sale of these
assets to special purpose entities (SPEs) which, in turn, issue se
curities to investors. After securitization, Glencore continues to
maintain customer relationships and provide servicing for the
receivables transferred to the SPEs.
In accounting for such securitizations, two key accounting de
terminations are made:
An evaluation is made as to whether the securitization entity
should be considered a subsidiary of Glencore and be included
in Glencore’s consolidated financial statements or whether the
entity is sufficiently independent that it does not need to be
consolidated. For all securitizations in which Glencore partici
pates, an evaluation is made of whether Glencore controls the
entity.
Where the securitization entity is not considered a subsidiary, an
evaluation is made then as to whether Glencore has transferred
the rights to the cash flows, risks and rewards of owner ship and
control of the underlying assets, thus qualifying it for derecog
nition and a sale under IFRS. If a transfer of assets meets the
derecognition and sale requirements, the assets are removed
from Glencore’s consolidated financial statements. If the con
ditions for derecognition and sale are not met, the transfer is
considered to be a secured borrowing, the assets remain in the
consolidated financial statements and the proceeds are recog
nized as a liability.
Repurchase agreements
Glencore enters into repurchase transactions where it sells cer
tain marketing inventories, but retains all or a significant portion
of the risks and rewards relating to the transferred inventory.
Repurchase transactions are treated as collateralized borrow
ings, whereby the inventories are not derecognized from the
statement of financial position and the cash received is recorded
as a corresponding obligation within the statement of financial
position as “commodities sold with agreements to repurchase”
or, if the repurchase obligation is optional, within “trade advances
from buyers”.
Borrowing costs
Borrowing costs are generally expensed as incurred except
where they relate to the financing of construction or develop
ment of qualifying assets in which case they are capitalized up to
the date when the qualifying asset is ready for its intended use.
Retirement benefits
Glencore operates various pension schemes in accordance with
local requirements and practices of the respective countries. The
annual costs for defined contribution plans that are funded by
payments to separate trustee administered funds or insurance
companies equal the contributions that are required under the
plans and are accounted for as an expense. Glencore uses the
projected unit credit actuarial method to determine the present
value of its defined benefit obligations and the related current
service cost and, where applicable, past service cost. Actuarial
gains and losses are recognized in the statement of income over
the average remaining service lives of employees. Past service
cost is recognized immediately to the extent that the benefits
are already vested, and otherwise is amortized on a straight line
basis over the average period until the benefits become vested.

Financial StatementS
38 | Annual Report 2010 |
NOTES TO THE FINANCIAL STATEMENTS (CONTINUED)
income taxes
Income taxes consist of current and deferred income taxes.
Current taxes represent income taxes expected to be payable
based on enacted or substantively enacted tax rates at the pe
riod end and expected current taxable income, and any adjust
ment to tax payable in respect of previous years. Deferred taxes
are recognized for temporary differences between the carrying
amounts of assets and liabilities in the financial statements and
the corresponding tax bases used in the computation of taxable
profit, using enacted or substantively enacted income tax rates.
Deferred tax assets and unused tax losses are only recognized
to the extent that their recoverability is probable. Deferred tax
assets are reviewed at reporting period end and amended to the
extent that it is no longer probable that the related benefit will
be realized. To the extent that a deferred tax asset not previously
recognized fulfils the criteria for recognition, an asset is recog
nized. Deferred tax assets and liabilities are offset when they re
late to income taxes levied by the same authority and Glencore
has both the right and the intention to settle its current tax assets
and liabilities on a net or simultaneous basis. The tax effect of
certain temporary differences is not recognized principally with
respect to the initial recognition of an asset or liability (other than
those arising in a business combination or in a manner that ini
tially impacted accounting or taxable profit) and temporary dif
ferences relating to investments in subsidiaries and associates to
the extent that Glencore can control the timing of the reversal of
the temporary difference and it is probable the temporary dif
ference will not reverse in the foreseeable future. Deferred tax
is provided in respect of fair value adjustments on acquisitions.
These adjustments may relate to assets such as extraction rights
that, in general, are not eligible for income tax allowances.
Royalties, extraction taxes and other levies/taxes are treated as
taxation arrangements when they have the characteristics of an
income tax including being imposed and determined in accor
dance with regulations established by the respective govern
ment’s taxation authority.
Current and deferred tax are recognized as an expense or in
come in the statement of income, except when they relate to
items that are recognized outside the statement of income
(whether in other comprehensive income or directly in equity)
or where they arise from the initial accounting for a business
combination.
exploration and evaluation expenditure
Exploration and evaluation expenditure relates to costs in
curred on the exploration and evaluation of potential mineral
and petroleum resources and includes costs such as research
ing and analyzing historical exploration data, exploratory drill
ing, trenching, sampling and the costs of prefeasibility studies.
Exploration and evaluation expenditure for each area of inter
est, other than that acquired from the purchase of another com
pany, is charged to the statement of income as incurred except
when the expenditure will be recouped from future exploitation
or sale of the area of interest and it is planned to continue with
active and significant operations in relation to the area, or at
the reporting period end, the activity has not reached a stage
which permits a reasonable assessment of the existence of
commercially recoverable reserves, in which case the expendi
ture is capitalized. Purchased exploration and evaluation assets
are recognized at their fair value at acquisition if purchased as
part of a business combination.
Capitalized exploration and evaluation expenditure is recorded
as a component of mineral and petroleum rights in property,
plant and equipment.
All capitalized exploration and evaluation expenditure is moni
tored for indications of impairment. Where a potential impair
ment is indicated, an assessment is performed for each area of
interest or at the cash generating unit level. To the extent that
capitalized expenditure is not expected to be recovered it is
charged to the statement of income.
Development expenditure
When commercially recoverable reserves are determined and
such development receives the appropriate approvals, capital
ized exploration and evaluation expenditure is transferred to
construction in progress. Upon completion of development and
commencement of production, capitalized development costs
are transferred to deferred mining costs and depreciated using
the unit of production method.
Property, plant and equipment
Property, plant and equipment are stated at cost, being the fair
value of the consideration given to acquire or construct the as
set, including directly attributable costs required to bring the as
set to the location or to a condition necessary for operation and
the direct cost of dismantling and removing the asset, less accu
mulated depreciation and any accumulated impairment losses.
Property, plant and equipment is depreciated to its estimated
residual value over the estimated useful life of the specific asset
concerned, or the estimated remaining life of the associated
mine, field or lease, if shorter. Depreciation commences when
the asset is available for use.
The major categories of property, plant and equipment are de
preciated on a unit of production and/or straightline basis as
follows:
Buildings 10 – 45 years
Land not depreciated
Plant and equipment 3 – 20 years
Mineral rights and development costs unit of production

Financial StatementS
| Annual Report 2010 | 39
NOTES TO THE FINANCIAL STATEMENTS (CONTINUED)
Assets under finance leases, where substantially all the risks
and rewards of ownership transfer to the Group as lessee, are
capitalized and amortized over their expected useful lives on
the same basis as owned assets or, where shorter, the term of
the relevant lease. All other leases are classified as operating
leases, the expenditures for which, are charged against income
over the accounting periods covered by the lease term.
Deferred stripping costs
Stripping costs incurred in the development of a mine (or pit)
before production commences are capitalized as part of the
cost of constructing the mine (or pit) and subsequently amor
tized over the life of the mine (or pit) on a unit of production
basis. Production stripping costs are deferred when the actual
stripping ratio incurred significantly exceeds the expected long
term average stripping ratio and are subsequently amortized
when the actual stripping ratio falls below the long term aver
age stripping ratio. Where the ore is expected to be evenly dis
tributed, waste removal is expensed as incurred.
mineral and petroleum rights
Mineral and petroleum reserves, resources and rights (together
Mineral Rights) which can be reasonably valued, are recognized
in the assessment of fair values on acquisition. Mineral Rights
for which values cannot be reasonably determined are not rec
ognized. Exploitable Mineral Rights are amortized using the
unit of production method over the commercially recoverable
reserves.
Restoration, rehabilitation and decommissioning
Restoration, rehabilitation and decommissioning costs arising
from the installation of plant and other site preparation work,
discounted to their present value, are provided for and capi
talized at the time such an obligation arises. The costs are
charged to the statement of income over the life of the opera
tion through depreciation of the asset and the unwinding of the
discount on the provision.
Costs for restoration of subsequent site disturbance, which is
created on an ongoing basis during production, are provided
for at their net present values and charged to the statement of
income as extraction progresses.
Other investments
Equity investments, other than investments in Associates, are
recorded at fair value unless such fair value is not reliably de
terminable in which case they are carried at cost. Changes in
fair value are recorded in the statement of income unless they
are classified as available for sale, in which case fair value move
ments are recognized in other comprehensive income and are
subsequently recognized in the statement of income when real
ized by sale or redemption, or when a reduction in fair value is
judged to be a significant or prolonged decline.
impairment
Investments in Associates and other investments, advances and
loans and property, plant and equipment are reviewed for impair
ment whenever events or changes in circumstances indicate the
carrying value may not be recoverable. If there are indicators of
impairment, a review is undertaken to determine whether the
carrying amounts are in excess of their recoverable amounts.
An asset’s recoverable amount is determined as the higher of
its fair value less costs to sell and its value in use. Such reviews
are undertaken on an assetbyasset basis, except where as
sets do not generate cash flows independent of other assets,
in which case the review is undertaken at the cash generating
unit level.
Where a cash generating unit, or group of cash generating
units, has goodwill allocated to it, or includes intangible assets
which are either not available for use or which have an indefinite
useful life (and which can only be tested as part of a cash gen
erating unit), an impairment test is performed at least annually
or whenever there is an indication that the carrying amounts of
such assets may be impaired.
If the carrying amount of an asset exceeds its recoverable
amount, an impairment loss is recorded in the income state
ment to reflect the asset at the lower amount.
An impairment loss is reversed in the statement of income if
there is a change in the estimates used to determine the recov
erable amount since the prior impairment loss was recognized.
The carrying amount is increased to the recoverable amount but
not beyond the carrying amount net of depreciation or amorti
zation which would have arisen if the prior impairment loss had
not been recognized. Goodwill impairments and impairments
of available for sale equity investments are not reversed.
Provisions
Provisions are recognized when Glencore has a present obliga
tion, as a result of past events, and it is probable that an outflow
of resources embodying economic benefits that can be reliably
estimated will be required to settle the liability.
inventories
The majority of marketing inventories are valued at fair value
less costs to sell with the remainder valued at the lower of cost
or net realizable value. Unrealized gains and losses from changes
in fair value are reported in cost of goods sold.
Production inventories are valued at the lower of cost or net
realizable value. Cost is determined using the first in first out
(FIFO) or the weighted average method and comprises material
costs, labor costs and allocated production related overhead
costs. Financing and storage costs related to inventory are
expensed as incurred.

Financial StatementS
40 | Annual Report 2010 |
NOTES TO THE FINANCIAL STATEMENTS (CONTINUED)
Financial instruments
Financial assets are classified as either financial assets at fair
value through profit or loss, loans and receivables, heldto
maturity investments or available for sale financial assets de
pending upon the purpose for which the financial assets were
acquired. Financial assets are initially recognized at fair value
on the trade date, including, in the case of instruments not re
corded at fair value through profit or loss, directly attributable
transaction costs. Subsequently, financial assets are carried at
fair value (other investments, derivatives and marketable securi
ties) or amortized cost less impairment (accounts receivable and
advances and loans). Financial liabilities other than derivatives
are initially recognized at fair value of consideration received net
of transaction costs as appropriate and subsequently carried at
amortized cost.
convertible bonds
At the date of issue, the fair value of the liability component
is determined by discounting the contractual future cash flows
using a market rate for a similar non convertible instrument. The
liability component is recorded as a liability on an amortized
cost basis using the effective interest method. The equity com
ponent is recognized as the difference between the fair value of
the proceeds as a whole and the fair value of the liability com
ponent and it is not subsequently remeasured.
Derivatives and hedging activities
Derivative instruments, which include contracts to sell or purchase
commodities that do not meet the own use exemption, are ini
tially recognized at fair value when Glencore becomes a party to
the contractual provisions of the instrument and are subsequently
remeasured to fair value at the end of each reporting period. Fair
values are determined using quoted market prices, dealer price
quotations or using models and other valuation techniques, the
key inputs for which include current market and contractual prices
for the underlying instrument, time to expiry, yield curves, volatil
ity of the underlying instrument and counterparty risk.
Gains and losses on derivative instruments for which hedge
accounting is not applied, other than the revenue adjustment
mechanism embedded within provisionally priced sales, are
recognized in cost of goods sold.
Those derivatives qualifying and designated as hedges are
either (i) a Fair Value Hedge of the change in fair value of a
recognized asset or liability or an unrecognized firm commit
ment, or (ii) a Cash Flow Hedge of the change in cashflows to
be received or paid relating to a recognized asset or liability or
a highly probable transaction.
A change in the fair value of derivatives designated as a Fair
Value Hedge is reflected together with the change in the fair
value of the hedged item in the statement of income.
A change in the fair value of derivatives designated as a Cash
Flow Hedge is initially recognized as a cash flow hedge reserve
in shareholders’ equity. The deferred amount is then released to
the statement of income in the same periods during which the
hedged transaction affects the statement of income. Hedge inef
fectiveness is recorded in the statement of income when it occurs.
When a hedging instrument expires or is sold, or when a hedge
no longer meets the criteria for hedge accounting, any cumula
tive gain or loss existing in equity at that time remains in share
holders’ equity and is recognized in the statement of income
when the committed or forecast transaction is ultimately recog
nized in the statement of income. However, if a forecast or com
mitted transaction is no longer expected to occur, the cumula
tive gain or loss that was recognized in equity is immediately
transferred to the statement of income.
A derivative may be embedded in a “host contract”. Such com
binations are known as hybrid instruments and at the date of
issuance, the embedded derivative is separated from the host
contract and accounted for as a stand alone derivative if the
criteria for separation are met. The host contract is accounted
for in accordance with its relevant accounting policy.
critical accounting policies, key judgments and estimates
The preparation of the consolidated financial statements re
quires management to make estimates and assumptions that
affect the reported amounts of assets and liabilities as well as
the disclosure of contingent assets and liabilities at the date of
the financial statements and the reported amounts of revenues
and expenses during the reporting period.
The estimates and associated assumptions are based on his
torical experience and other factors that are considered to be
relevant. Actual outcomes could differ from those estimates.
Glencore has identified the following areas as being critical
to understanding Glencore’s financial position as they require
management to make complex and/or subjective judgments
and estimates about matters that are inherently uncertain.
Valuation of derivative instruments
Derivative instruments are carried at fair value and Glencore
evaluates the quality and reliability of the assumptions and data
used to measure fair value in the three hierarchy levels, Level 1,
2 and 3, as prescribed by IFRS 7. Fair values are determined in
the following ways: externally verified via comparison to quoted
market prices in active markets (Level 1); by using models with
externally verifiable inputs (Level 2); or by using alternative pro
cedures such as comparison to comparable instruments and/or
using models with unobservable market inputs requiring Glen
core to make market based assumptions (Level 3). For more de
tails refer to note 23.

Financial StatementS
| Annual Report 2010 | 41
NOTES TO THE FINANCIAL STATEMENTS (CONTINUED)
Depreciation and amortization of mineral and petroleum rights
and project development costs
Mineral and petroleum rights and project development costs
are amortized using the unit of production method (UOP). The
calculation of the UOP rate of amortization, and therefore the
annual amortization charge to operations, can fluctuate from
initial estimates. This could generally result when there are sig
nificant changes in any of the factors or assumptions used in
estimating mineral or petroleum reserves, notably changes in
the geology of the reserves and assumptions used in determin
ing the economic feasibility of the reserves. Such changes in
reserves could similarly impact the useful lives of assets depre
ciated on a straight line basis, where those lives are limited to
the life of the project, which in turn is limited to the life of the
proven and probable mineral or petroleum reserves. Estimates
of proven and probable reserves are prepared by experts in ex
traction, geology and reserve determination. Assessments of
UOP rates against the estimated reserve base and the operat
ing and development plan are performed regularly.
Impairments
Investments in Associates and other investments, advances and
loans and property, plant and equipment, goodwill and other
intangible assets are reviewed for impairment whenever events
or changes in circumstances indicate that the carrying value
may not be fully recoverable or at least annually for goodwill and
other indefinite life intangible assets. If an asset’s recoverable
amount is less than the asset’s carrying amount, an impairment
loss is recognized. Future cash flow estimates which are used to
calculate the asset’s fair value are based on expectations about
future operations primarily comprising estimates about produc
tion and sales volumes, commodity prices, reserves, operating,
rehabilitation and restoration costs and capital expenditures.
Changes in such estimates could impact recoverable values of
these assets. Estimates are reviewed regularly by management.
Restoration, rehabilitation and decommissioning costs
A provision for future restoration, rehabilitation and decommis
sioning costs requires estimates and assumptions to be made
around the relevant regulatory framework, the magnitude of
the possible disturbance and the timing, extent and costs of
the required closure and rehabilitation activities. To the extent
that the actual future costs differ from these estimates, adjust
ments will be recorded and the statement of income could be
impacted. The provisions including the estimates and assump
tions contained therein are reviewed regularly by management.
Provisions
The amount recognized as a provision, including tax, legal,
contractual and other exposures or obligations, is the best esti
mate of the consideration required to settle the related liability,
including any related interest charges, taking into account the
risks and uncertainties surrounding the obligation. The Group
assesses its liabilities and contingencies based upon the best
information available, relevant tax laws and other appropriate
requirements.
Fair value
In addition to recognizing derivative instruments at fair value,
as discussed above, an assessment of fair value of assets and
liabilities is also required in accounting for other transactions,
most notably, business combinations and disclosures related to
fair values of financial assets and liabilities. In such instances,
fair value measurements are estimated based on the amounts
for which the assets and liabilities could be exchanged at the
relevant transaction date or reporting period end, and are
therefore not necessarily reflective of the likely cashflow upon
actual settlements. Where fair value measurements cannot be
derived from publicly available information, they are estimated
using models and other valuation methods. To the extent pos
sible, the assumptions and inputs used take into account exter
nally verifiable inputs. However, such information is by nature
subject to uncertainty, particularly where comparable market
based transactions rarely exist.

Financial StatementS
42 | Annual Report 2010 |
NOTES TO THE FINANCIAL STATEMENTS (CONTINUED)
2. segment InfoRmAtIon
Glencore is organized and operates on a worldwide basis in three core business segments – metals and minerals, energy products and
agricultural products, with each business segment responsible for the marketing, sourcing, hedging, logistics and industrial investment
activities of their respective markets and reflecting the structure used by Glencore’s management to assess the performance of Glencore.
The business segments’ contributions to the Group are primarily derived from the net margin or premium earned from physical
marketing activities (net sale and purchase of physical commodities), provision of marketing and related valueadd services and the
margin earned from industrial asset activities (net resulting from the sale of physical commodities over the cost of production and/or
cost of sales) and comprise the following underlying key commodities:
• Metals and minerals: Zinc, copper, lead, alumina, aluminum, ferro alloys, nickel, cobalt and iron ore, including smelting, refining,
mining, processing and storage related operations of the relevant commodities;
• Energy products: Crude oil, oil products, steam coal and metallurgical coal supported by investments in coal mining and oil produc
tion operations, ports, vessels and storage facilties;
• Agriculture products: Wheat, corn, barley, rice, oilseeds, meals, edible oils, biodiesel, cotton and sugar supported by investments
in storage, handling, processing and port facilities.
Corporate and other: statement of income amounts represent Glencore’s share of income related to Xstrata and other unallocated
Group related expenses (mainly variable pool bonus accrual). Balance sheet amounts represent Group related balances.
The financial performance of the segments is principally evaluated with reference to Adjusted EBIT/EBITDA which is the net result of
revenue less cost of goods sold and selling and administrative expenses plus share of income from associates and jointly controlled
entities and dividends as disclosed on the face of the consolidated statement of income. Furthermore, given that funding costs in re
lation to working capital employed in the marketing activities are sought to be “recovered“ via transactional terms, the performance
of marketing activities is also assessed at a net income level.
The accounting policies of the operating segments are the same as those described in the summary of significant accounting poli
cies. Glencore accounts for intersegment sales and transfers where applicable as if the sales or transfers were to third parties, i.e. at
current market prices.

Financial StatementS
| Annual Report 2010 | 43
NOTES TO THE FINANCIAL STATEMENTS (CONTINUED)
2010US $ million
Metals and minerals
Energyproducts
Agricultural products
Corporate and other Total
Revenue
Revenue from third parties 45 211 89 349 10 418 0 144 978
marketing activities
Adjusted EBIT 1 401 450 659 – 173 2 337
Depreciation and amortization 0 20 0 10 30
adjusted eBitDa 1 401 470 659 – 163 2 367
industrial activities
Adjusted EBIT 1 160 235 58 1 500 2 953
Depreciation and amortization 708 124 49 0 881
adjusted eBitDa 1 868 359 107 1 500 3 834
total adjusted eBitDa 3 269 829 766 1 337 6 201
Depreciation and amortization excluded above – 708 – 144 – 49 – 10 – 911
total adjusted eBit 2 561 685 717 1 327 5 290
Interest expense – net – 936
(Loss)/gain on sale of investments – net – 6
Other (expense)/income – net – 8
Income tax expense – 234
income before attribution 4 106
2010US $ million
Metals and minerals
Energyproducts
Agriculturalproducts
Corporate and other Total
Current assets 17 901 15 759 5 958 2 869 42 487
Current liabilities – 8 597 – 11 237 – 2 000 – 2 594 – 24 428
allocatable current capital employed 9 304 4 522 3 958 275 18 059
Property, plant and equipment 8 860 2 489 739 0 12 088
Investments in Associates and other investments 2 134 1 108 157 15 805 19 204
Non current advances and loans 813 2 832 113 72 3 830
allocatable non current capital employed 11 807 6 429 1 009 15 877 35 122
Other assets 1 0 0 0 2 178 2 178
Other liabilities 2 0 0 0 – 32 852 – 32 852
total net assets 21 111 10 951 4 967 – 14 522 22 507
included in property, plant and equipment are:
Additions 1 001 818 71 0 1 890
1 Other assets include deferred tax assets, marketable securities, cash and cash equivalents and assets held for sale.2 Other liabilities include borrowings, deferred income, deferred tax liabilities, provisions, commodities sold with agreements to repurchase
and liabilities held for sale.

Financial StatementS
44 | Annual Report 2010 |
NOTES TO THE FINANCIAL STATEMENTS (CONTINUED)
2009US $ million
Metals andminerals
Energyproducts
Agriculturalproducts
Corporate and other Total
RevenueRevenue from third parties 35 391 62 391 8 582 0 106 364
marketing activitiesAdjusted EBIT 523 945 304 – 211 1 561Exceptional items included above ¹ 30 0 0 0 30adjusted eBit pre exceptional items 553 945 304 – 211 1 591Depreciation and amortization 0 0 0 15 15adjusted eBitDa pre exceptional items 553 945 304 – 196 1 606
industrial activitiesAdjusted EBIT 443 413 41 28 925Exceptional items included above ¹ 55 0 0 736 791adjusted eBit pre exceptional items 498 413 41 764 1 716Depreciation and amortization 521 49 37 0 607adjusted eBitDa pre exceptional items 1 019 462 78 764 2 323
total adjusted eBitDa pre exceptional items 1 572 1 407 382 568 3 929Depreciation and amortization excluded above – 521 – 49 – 37 – 15 – 622total adjusted eBit pre exceptional items 1 051 1 358 345 553 3 307
Exceptional items excluded above – 821Interest expense – net – 587(Loss)/gain on sale of investments – net 33Other (expense)/income – net 35Income tax expense – 238income before attribution 1 729
¹ Exceptional items represent significant items of income and expense which, due to their financial impacts, nature or the expected infrequency of
the events giving rise to them, have been separated for internal reporting and analysis of Glencore’s results. In 2009, $ 30 million of marketing activities exceptional items related primarily to inventory net realizable value adjustments and $ 791 million of industrial activities exceptional items related to severance and other related expenses ($ 30 million) and Glencore’s share of asset impairment charges booked directly by Xstrata ($ 736 million) and Century ($ 25 million).
2009US $ million
Metals andminerals
Energyproducts
Agriculturalproducts
Corporate and other Total
Current assets 18 244 13 860 2 294 2 043 36 441Current liabilities – 9 759 – 6 844 – 882 – 2 894 – 20 379allocatable current capital employed 8 485 7 016 1 412 – 851 16 062
Property, plant and equipment 5 672 679 494 0 6 845Investments in Associates and other investments 2 129 924 41 14 989 18 083Non current advances and loans 1 054 1 382 34 65 2 535allocatable non current capital employed 8 855 2 985 569 15 054 27 463
Other assets 1 0 0 0 2 372 2 372Other liabilities 2 0 0 0 – 27 953 – 27 953total net assets 17 340 10 001 1 981 – 11 378 17 944
included in property, plant and equipment are:Additions 607 393 116 0 1 116
1 Other assets include deferred tax assets, marketable securities, cash and cash equivalents and assets held for sale.2 Other liabilities include borrowings, deferred income, deferred tax liabilities, provisions, commodities sold with agreements to repurchase,
Prodeco call option arrangement and liabilities held for sale.

Financial StatementS
| Annual Report 2010 | 45
NOTES TO THE FINANCIAL STATEMENTS (CONTINUED)
Geographical information
US $ million 2010 2009
Revenue from third parties 1
The Americas 39 183 27 736
Europe 47 724 37 647
Asia 42 820 31 081
Africa 13 975 9 089
Oceania 1 276 811
144 978 106 364
non current assets ²
The Americas 3 755 2 554
Europe 15 224 12 858
Asia 5 880 2 730
Africa 2 702 2 252
Oceania 1 293 1 332
28 854 21 726
1 Revenue by geographical destination is based on the country of incorporation of the sales counterparty.² Non current assets are non current operating assets other than financial instruments and deferred tax assets.
3. (loss)/gAIn on sAle of Investments – net
US $ million 2010 2009
Gain on sale of subsidiaries 0 97
Loss on sale of investments in associates – 6 – 64
total – 6 33
The net gain on sale of subsidiaries and investments in 2009 comprised primarily the disposal of East Tennessee Zinc Company LLC
in December 2009 (see note 21) and a gain on the disposal of Refineria de Cartagena, offset by a dilution loss following Xstrata’s
capital raising in March 2009, which resulted in Glencore’s effective ownership reducing from 35.2% to 34.9%.

Financial StatementS
46 | Annual Report 2010 |
NOTES TO THE FINANCIAL STATEMENTS (CONTINUED)
4. otheR (expense)/InCome – net
US $ million Notes 2010 2009
Changes in mark to market valuation – net 1 – 178 222
Prodeco transaction and related expenses 2 13 – 225 – 303
Changes in mark to market valuation of forward contracts 3 – 790 0
Gain on settlement of restructured Russneft loans 8 382 0
Impairment on equity interest in various Russneft Group entities 8 – 336 0
Impairment reversal 4 674 0
Revaluation of previously held interest in newly acquired businesses 21 462 161
Impairment on Katanga related goodwill 21 0 – 161
Foreign exchange gain 31 26
Other – 28 90
total – 8 35
In addition to foreign exchange gains/(losses) and mark to market movements on investments held for trading, other (expense)/income – net includes other significant items of income and expense which due to their non operational nature or expected infrequency of the events giving rise to them are reported separately from operating segment results. Other (expense)/income – net includes, but is not limited to, impairment charges/reversals, gains/losses on restructured loans, revaluation of previously held interests in business combinations and restructuring and closure costs.
1 Changes in mark to market valuation – net primarily relates to movements on interests in other investments classified as held for trading and carried at fair value, with Glencore’s stake in Volcan Compania Minera S.A.A. accounting for the majority of the movement in 2010 and 2009.
2 In March 2009, Xstrata acquired Glencore’s Colombian Coal Group (Prodeco) for $ 2 billion and concurrently granted Glencore an option to repurchase Prodeco within 12 months for $ 2.25 billion plus notional profits accrued during the option period and the net balance of any cash invested. Given the fixed price repurchase option, the conditions for derecognition/disposal of Prodeco were not met under IFRS and as a consequence, Prodeco’s operations remained in the consolidated financial statements, while the “proceeds” were deferred and recognized as a liability. In March 2010, the option was exercised (see note 13). Following the exercise of the option, in addition to the option repurchase expenses (including the option premium and profit entitlement) incurred during the year, $ 115 million of additional depreciation expense was recognized to reflect the depreciation that would have been charged if the related assets had not previously been classified as held for sale.
3 Changes in mark to market valuation of forward contracts represents movements in fair value of certain fixed price forward coal sales contracts relating to Prodeco’s future production, into which it plans to physically deliver. Following the legal reacquisition of Prodeco in March 2010, from an accounting perspective, these forward sales contracts could not technically be classified as “own use” or as cashflow hedges, which would have deferred the income statement effect until performance of the underlying future sale transactions. As at year end, approximately 19.3 million tonnes of such coal had been sold forward at a fixed price in respect of quarterly periods to the end of 2013.
4 During the regular assessment of whether there is an indication of an asset impairment or whether a previously recorded impairment may no longer be required, an upward revision of long term base metals and coal price assumptions resulted in an impairment reversal of $ 674 million against Glencore’s interest in Xstrata. The recoverable amount of Glencore’s share of the underlying net assets have been determined on the basis of its fair value less costs to sell using discounted cash flow techniques.

Financial StatementS
| Annual Report 2010 | 47
NOTES TO THE FINANCIAL STATEMENTS (CONTINUED)
5. InCome tAxes
Income taxes consist of the following:
US $ million 2010 2009
Current income tax expense – 292 – 259
Deferred income tax credit 58 21
total – 234 – 238
The effective Group tax rate is different from the statutory Swiss income tax rate applicable to the Company for the following
reasons:
US $ million 2010 2009
income before income taxes and attribution 4 340 1 967
Less: share of income from Associates – 1 829 – 82
Parent companies’ and subsidiaries’ income before income tax and attribution 2 511 1 885
Income tax expense calculated at the Swiss income tax rate – 401 – 297
Effect of different tax rates of subsidiaries operating in other jurisdictions – 78 – 19
Tax exempt income, net of nondeductible expenses and other permanent differences 254 56
Effect of use of tax losses and other deferred tax assets, not previously recognized1 135 15
Effect of change in tax rate on temporary differences – 145 0
Other 1 7
income tax expense – 234 – 238
1 Following the regular assessment and review of business plans related to Katanga Mining Limited, it was determined that a substantial portion
of the previously unrecognized tax losses could be recognized.
Deferred taxes as at December 31, 2010 and 2009, are attributable to the items detailed in the table below:
US $ million 2010 2009
Deferred tax assets 1
Tax losses carried forward 274 29
Mark to market valuations 95 59
total 369 88
Deferred tax liabilities 1
Depreciation and amortization – 926 – 257
Mark to market valuations – 320 – 328
Other – 62 – 41
total – 1 308 – 626
Deferred tax – net – 939 – 538
Reconciliation of deferred tax – net
Opening balance – 538 – 541
Recognized in income for the year 58 21
Recognized in other comprehensive (loss)/income 2 – 7
Acquisitions – 461 – 11
closing balance – 939 – 538
1 Asset and liability positions in the same category reflect the impact of tax assets and liabilities arising in local tax jurisdictions that cannot be
offset against tax assets and liabilities arising in other tax jurisdictions.

Financial StatementS
48 | Annual Report 2010 |
NOTES TO THE FINANCIAL STATEMENTS (CONTINUED)
Deferred tax assets are recognized for tax losses carried forward only to the extent that realization of the related tax benefit is
probable. As at December 31, 2010, $ 562 million (2009: $ 312 million) of deferred tax assets related to available loss carry forwards
have been brought to account, of which $ 274 million (2009: $ 29 million) are disclosed as deferred tax assets with the remaining
balance being offset against deferred tax liabilities arising in the same respective entity. Available gross tax losses carried forward,
for which no deferred tax assets have been recognized in the consolidated financial statements are detailed below and will expire
as follows:
US $ million 2010 2009
1 year 75 85
2 years 56 48
3 years 38 8
Thereafter 394 904
total 563 1 045
As at December 31, 2010, unremitted earnings of $ 12,255 million (2009: $ 10,263 million) have been retained by subsidiaries and
associates for reinvestment. No provision is made for income taxes that would be payable upon the distribution of such earnings.
If earnings were remitted, an immaterial tax charge would result based on the tax statutes currently in effect.

Financial StatementS
| Annual Report 2010 | 49
NOTES TO THE FINANCIAL STATEMENTS (CONTINUED)
6. pRopeRty, plAnt And equIpment
US $ million Notes
Landand
buildings
Plantand
equipment
Mineral andpetroleum
rights
Deferredmining
costs Total
Gross carrying amount:
January 1, 2010 1 066 6 255 1 718 229 9 268
Business combination 370 910 2 283 91 3 654
Additions 26 1 346 422 96 1 890
Disposals – 35 – 525 – 38 – 2 – 600
Reclassified from held for sale 13 112 908 73 155 1 248
Other movements – 258 293 26 – 27 34
December 31, 2010 1 281 9 187 4 484 542 15 494
accumulated depreciation and impairment:
January 1, 2010 235 1 810 364 14 2 423
Depreciation 77 752 171 26 1 026
Disposals – 15 – 177 – 12 0 – 204
Reclassified from held for sale 13 7 128 7 10 152
Other movements – 65 43 18 13 9
December 31, 2010 239 2 556 548 63 3 406
net book value December 31, 2010 1 042 6 631 3 936 479 12 088
US $ million Notes
Landand
buildings
Plantand
equipment
Mineral andpetroleum
rights
Deferredmining
costs Total
Gross carrying amount:January 1, 2009 1 046 6 518 1 075 319 8 958Business combination 1 257 598 0 856
Additions 40 960 62 54 1 116
Business divestment – 31 – 135 – 51 0 – 217
Disposals – 9 – 230 – 7 – 8 – 254
Held for sale 13 – 112 – 908 – 73 – 155 – 1 248
Other movements 131 – 207 114 19 57
December 31, 2009 1 066 6 255 1 718 229 9 268
accumulated depreciation and impairment:January 1, 2009 179 1 580 325 15 2 099Business divestment – 2 – 96 – 47 0 – 145
Depreciation 63 466 82 11 622
Disposals – 2 – 75 0 – 2 – 79
Held for sale 13 – 7 – 128 – 7 – 10 – 152
Other movements 4 63 11 0 78
December 31, 2009 235 1 810 364 14 2 423net book value December 31, 2009 831 4 445 1 354 215 6 845
Plant and equipment includes expenditure for construction in progress of $ 1,343 million (2009: $ 1,233 million) and a net book
value of $ 64 million (2009: $ 72 million) of obligations recognized under finance lease agreements. Mineral and petroleum rights
include expenditures for exploration and evaluation of $ 379 million (2009: $ 146 million). Depreciation expenses included in cost
of goods sold are $ 893 million (2009: $ 607 million), in selling and administrative expenses $ 18 million (2009: $ 15 million) and in
other (expense)/income – net – Prodeco transaction related expenses $ 115 million (2009: $ nil million).

Financial StatementS
50 | Annual Report 2010 |
NOTES TO THE FINANCIAL STATEMENTS (CONTINUED)
7. Investments In AssoCIAtes And otheR Investments
US $ million 2010 2009
Listed Associates 15 511 13 267
Non listed Associates 1 255 1 614
investments in associates 16 766 14 881
Other investments 2 438 3 202
total 19 204 18 083
A list of the principal operating, finance and industrial subsidiaries and Associates and other investments is included in note 28. As
at December 31, 2010, the fair value of listed Associates using published price quotations was $ 24,511 million (2009: $ 19,090 million).
Other investments
Other investments primarily include a 8.8% interest in United Company Rusal (“UCR”) ($ 2,048 million; 2009: $ 2,003 million) which,
following its listing on the Hong Kong Stock Exchange in January 2010, is carried at fair value with associated movements recog
nized within a related equity reserve (see note 14). As at December 31, 2010, $ 113 million (2009: $ nil million) of Glencore’s invest
ment in UCR was pledged as a guarantee against certain borrowings of UCR.
Summarized financial information in respect of Glencore’s Associates, reflecting 100% of the underlying Associate’s relevant figures,
are set out below. Glencore’s share of the joint venture’s capital commitments for which the joint venture already has contractually
committed financing in place, amounts to $ 831 million (2009: $ 346 million).
US $ million 2010 2009
Total assets 77 247 66 522
Total liabilities 32 506 30 136
Revenue 48 116 25 337
Net profit 4 941 826

Financial StatementS
| Annual Report 2010 | 51
NOTES TO THE FINANCIAL STATEMENTS (CONTINUED)
8. AdvAnCes And loAns
US $ million 2010 2009
Loans to Parents 72 66
Loans to Associates 426 832
Other non current receivables and loans 3 332 1 637
total 3 830 2 535
Loans to Parents (see note 14) and Associates bear interest at applicable floating market rates plus a premium.
Other non current receivables and loans comprise the following:
US $ million 2010 2009
counterpartyOAO Russneft Interest bearing loan at 9% per annum (see note below)
2 082
1 033
Atlas Petroleum International Limited (“Atlas”)Interest bearing loans at LIBOR plus 3% 1
477
270
PT Bakrie & Brothers TbkInterest bearing secured loans at LIBOR plus 9% 2
200
0
Secured marketing related financing arrangements 3 330 148
Other 243 186
total 3 332 1 637
1 Primarily relates to carried interest loans associated with the development of the Aseng oil project in Equatorial Guinea, where Atlas is one of the equity
partners. The operator of the field and project is Noble Energy, based in Houston. The Aseng project is expected to commence oil production in Q1 2012, with loans subsequently repaid from oil proceeds.
2 The principal under this loan is payable in five equal semiannual installments from June 2012 to June 2014. The loan is secured by 968,442,000 shares (equivalent to 4.66%) in PT BUMI Resources Tbk., which at December 31, 2010, were valued at $ 323 million.
3 Various marketing related financing facilities, generally secured against certain assets and/or payable from the future sale of production of the counterparty. The weighted average interest rate of the loans is 10% and on average are to be repaid over a 3 year period.
Russneft loans
In December 2010, OAO Russneft (“Russneft”) completed a significant debt amendment and restatement with its major lenders,
whereby Glencore’s previously existing facilities including some amounts, which had been advanced for conversion into Russneft
equity, were consolidated into a single facility. The consolidated facility, with a principal amount of $ 2,080 million, bears interest at
9% per annum, with 3% paid quarterly and the remaining 6% payable along with the principal. Repayment is expected in monthly
installments over a 3 year period commencing Q4 2017, but in any event, not before repayment of the debt owing to the other
major lender. The facility is secured by a second ranked charge over certain of Russneft’s assets.
Glencore has accounted for this amendment and restatement as a substantial modification, which resulted in derecognition of all
amounts carried under the previous facilities including principal, accrued interest and equity conversion advances and recogni
tion, at fair value, of the consolidated facility. The transaction resulted in a gain (after taking into account the carrying value of
the principal, net of allowance for doubtful accounts, and the accrued interest ($ 1,413 million) and equity conversion advances
($ 285 million)) of $ 382 million.
The loan amendment also constituted a loss event with respect to Glencore’s equity holdings in certain Russneft subsidiaries due
to the increased leverage, amended repayment profile and the enhancement of prioritized security of the consolidated loans and,
as a consequence, an impairment charge of $ 336 million was recognized against other investments.

Financial StatementS
52 | Annual Report 2010 |
NOTES TO THE FINANCIAL STATEMENTS (CONTINUED)
9. InventoRIes
US $ million 2010 2009
Production inventories 2 805 1 894
Marketing inventories 14 588 13 179
total 17 393 15 073
Production inventories consist of materials, spare parts, work in process and finished goods held by the production entities. Mar
keting inventories are commodities held by the marketing entities. Marketing inventories include readily marketable inventories
of $ 14,331 million (2009: $ 12,945 million). Readily marketable inventories are inventories that Glencore considers to be readily
convertible into cash due to their very liquid nature, widely available markets and the fact that the price risk is covered either by a
physical sale transaction or hedge transaction on a commodity exchange or with a highly rated counterparty.
Glencore has a number of dedicated financing facilities, which finance a portion of its marketing inventories. In each case, the inventory
has not been derecognized as the Group retains the principal risks and rewards of ownership. The proceeds received are recognized as
either current borrowings, commodities sold with agreements to repurchase or trade advances from buyers, depending upon their funding
nature. As at December 31, 2010, the total amount of inventory securitized under such facilities was $ 2,426 million (2009: $ 3,192 million).
The proceeds received and recognized as current borrowings were $ 1,338 million (2009: $ 1,663 million), as commodities sold with
agreements to repurchase $ 484 million (2009: $ 477 million) and as trade advances from buyers $ 67 million (2009: $ 419 million).
10. ACCounts ReCeIvAble
US $ million 2010 2009
Trade receivables 1 12 663 9 156
Trade advances and deposits 1 4 297 4 415
Associated companies 1 494 315
Other receivables 1 540 1 303
total 18 994 15 189
1 Collectively referred to as receivables.
The average credit period on sales of goods is 28 days (2009: 33 days).
As at December 31, 2010, 5% of receivables were between 1– 60 days overdue, and 2% were greater than 60 days overdue (2009: 6%
were between 1– 60 days overdue and 2% were greater than 60 days overdue). Such receivables, although contractually past their
due dates, are not considered impaired as there has not been a significant change in credit quality of the relevant counterparty, and
the amounts are still considered recoverable taking into account customary payment patterns and in many cases, offsetting accounts
payable balances. Receivables are net of allowances for doubtful accounts of $ 155 million (2009: $ 302 million), which take into con
sideration the diverse geographic and industrial composition of the accounts receivable portfolio. The decrease in allowance for
doubtful accounts over 2010 is primarily attributable to the Russneft loan amendment and restatement described in note 8.
Glencore has a number of dedicated financing facilities, which finance a portion of its receivables. In each case, the receivables have
not been derecognized, as the Group retains the principal risks and rewards of ownership. The proceeds received are recognized
as current borrowings (see note 15). As at December 31, 2010, the total amount of trade receivables securitized was $ 2,349 million
(2009: $ 1,590 million) and proceeds received and classified as current borrowings amounted to $ 1,950 million (2009: $ 1,300 million).
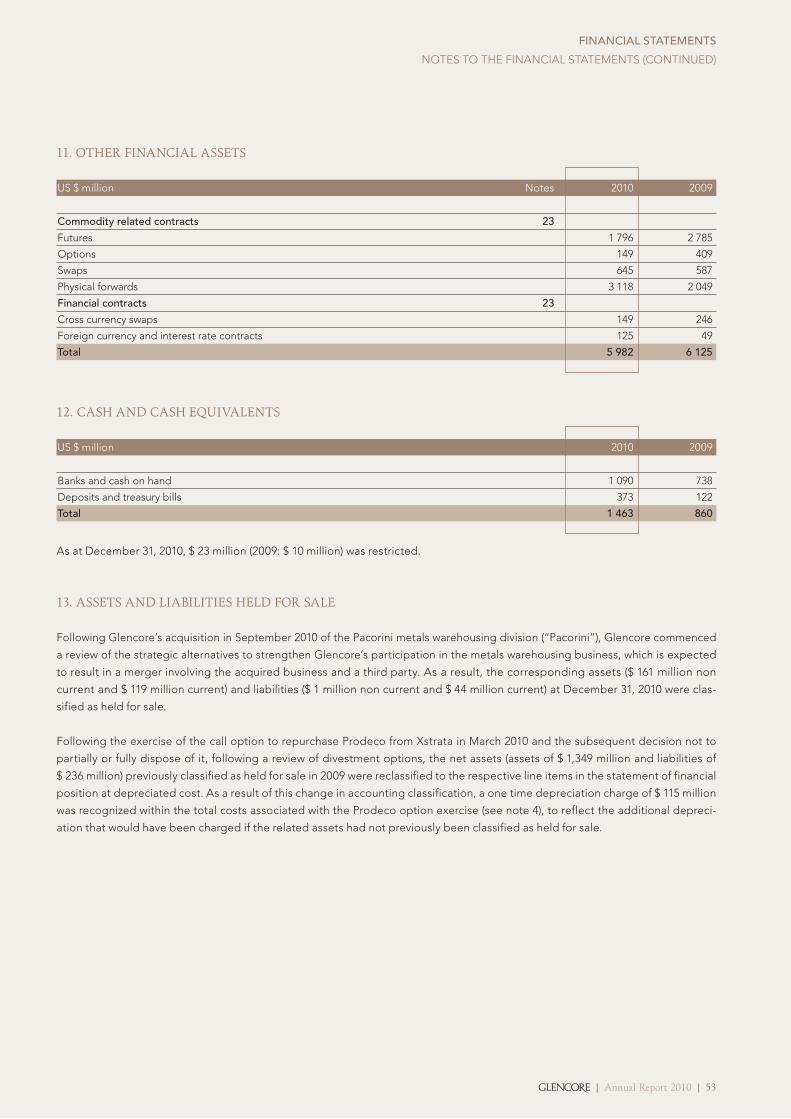
Financial StatementS
| Annual Report 2010 | 53
NOTES TO THE FINANCIAL STATEMENTS (CONTINUED)
11. otheR fInAnCIAl Assets
US $ million Notes 2010 2009
commodity related contracts 23
Futures 1 796 2 785
Options 149 409
Swaps 645 587
Physical forwards 3 118 2 049
Financial contracts 23
Cross currency swaps 149 246
Foreign currency and interest rate contracts 125 49
total 5 982 6 125
12. CAsh And CAsh equIvAlents
US $ million 2010 2009
Banks and cash on hand 1 090 738
Deposits and treasury bills 373 122
total 1 463 860
As at December 31, 2010, $ 23 million (2009: $ 10 million) was restricted.
13. Assets And lIAbIlItIes held foR sAle
Following Glencore’s acquisition in September 2010 of the Pacorini metals warehousing division (“Pacorini”), Glencore commenced
a review of the strategic alternatives to strengthen Glencore’s participation in the metals warehousing business, which is expected
to result in a merger involving the acquired business and a third party. As a result, the corresponding assets ($ 161 million non
current and $ 119 million current) and liabilities ($ 1 million non current and $ 44 million current) at December 31, 2010 were clas
sified as held for sale.
Following the exercise of the call option to repurchase Prodeco from Xstrata in March 2010 and the subsequent decision not to
partially or fully dispose of it, following a review of divestment options, the net assets (assets of $ 1,349 million and liabilities of
$ 236 million) previously classified as held for sale in 2009 were reclassified to the respective line items in the statement of financial
position at depreciated cost. As a result of this change in accounting classification, a one time depreciation charge of $ 115 million
was recognized within the total costs associated with the Prodeco option exercise (see note 4), to reflect the additional depreci
ation that would have been charged if the related assets had not previously been classified as held for sale.

Financial StatementS
54 | Annual Report 2010 |
14. shARe CApItAl And ReseRves
The share capital of the Company consists of 150,000 registered shares with a nominal value of CHF 500 each, a restriction on trans
ferability and carry the right to a preferred dividend at the Company’s discretion of up to 10% of nominal value per annum. Glencore
Holding AG (the ultimate parent) and Glencore L.T.E. AG (together the “Parents”), both wholly owned by the management and em
ployees of Glencore, own 85% and 15% respectively, of the Company.
The Company is authorized by its articles of incorporation to issue to employees of Glencore, non voting profit participation
certificates (“PPC”) with no nominal value, enabling the employees to participate in the four profit sharing arrangements de
scribed below. The profit sharing arrangements entitle the participating employees to a portion of Glencore shareholders’ funds
accumulated during the period that such employees hold the PPCs. The PPCs attribute Glencore’s net income pro rata based on
the 150,000 (2009: 150,000) shares issued, however, upon termination of employment, the arrangements differ in the way that the
accumulated financial benefits are settled as follows:
Glencore l.t.e. Profit Participation Shareholders (“ltS”)
Participants in the Glencore L.T.E. AG Profit Participation Plan, representing 15% of the Company’s registered share capital, have
pooled both their shares in Glencore L.T.E. AG and their respective PPCs. Under such agreements, in contrast to PPS and HPPS
(noted below), termination of employment of a LTS does not trigger any claims against the Company, but rather, it is in the
Company’s control if and when any amount should be redeemed. In this manner, the portion of net income accumulated by LTS is
consistent with the traditional characteristics of an entity’s retained earnings and is classified as equity.
long term Profit Participation Shareholders (“ltPPS”)
LTPPS, upon termination of employment, have agreed to forgo their accumulated financial benefits in the Company until the
occurrence of certain triggering events, such as an IPO. Until such triggering event occurs, the accumulated financial benefits are
noninterest bearing. As with LTS above, given that termination of employment does not trigger any claims against the Company,
but rather it is in the Company’s control if and when any amount will be redeemed, the portion of net income accumulated by
LTPPS is consistent with the traditional characteristics of an entity’s retained earnings and is classified as equity. As at Decem
ber 31, 2010, LTPPS represented 15% of the Company’s registered share capital.
Hybrid Profit Participation Shareholders (“HPPS”)
HPPS have agreed to receive their accumulated financial benefits upon termination of employment in the form of hybrid notes, which
have been structured to achieve Basket D equity credit (75%) from Moody’s and high equity content (100%) from Standard & Poor’s.
The key features include no maturity (perpetual), legally binding replacement covenant and mandatory coupon deferral where non
current borrowings exceeds equity, current ratio falls below 1.1x, or a minimum cash flow to net debt ratio is breached. The notes,
upon issuance, will constitute unsecured and subordinated obligations, that will rank senior to LTS claims (see above), pari passu with
PPS/LTPPS claims and junior to any present or future claims of unsecured lenders and investors. As at December 31, 2010, HPPS rep
resented 10% of the Company’s registered share capital. As at December 31, 2010 and 2009 no such hybrid notes were outstanding.
Ordinary Profit Participation Shareholders (“PPS”)
Upon termination of employment, the accumulated financial benefits of a PPS employee are reclassified into non current borrow
ings, as “Ordinary profit participation certificates” and paid in installments over a period of five years, with the portion falling due
within 12 months included in current borrowings.
In 2009, many key employees, including department heads, holding in aggregate 76% of PPS as at December 31, 2010 agreed to
defer the commencement of all payments of PPS claims, which may become due to them as a result of termination of their employ
ment, until January 2012 at the earliest. In December 2009, various senior executives agreed to a further extension, such that 45% of
PPS as at December 31, 2010 is locked up until January 2013 at the earliest. In the event of certain triggering events, which include
any breach of a financial covenant, redemptions under all four plans are subordinated to claims of unsecured lenders and investors.
According to the existing agreements, the Company redeemed and reclassified as borrowings during 2010 a certain number of
PPC from PPS representing an aggregate amount of $ 504 million (2009: $ 993 million).
NOTES TO THE FINANCIAL STATEMENTS (CONTINUED)

Financial StatementS
| Annual Report 2010 | 55
NOTES TO THE FINANCIAL STATEMENTS (CONTINUED)
Reserves
US $ million Notes
Translation
adjustment
Equity portion of Convertible
bonds
Cash flow
hedge reserve
Net unreal
ized gain/ (loss)
Net ownership changes in
subsidiariesReserves
restricted Total
Balance January 1, 2009 – 44 0 – 457 0 0 1 – 500
Exchange gain on translation of foreign operations 37 0 0 0 0 0 37
Gain on cash flow hedges, net of tax 22 0 0 286 0 0 0 286
Cash flow hedges transferred to the statement of income, net of tax
0
0
82
0
0
0
82
Equity portion of Convertible bonds 15 0 77 0 0 0 0 77
Balance December 31, 2009 – 7 77 – 89 0 0 1 – 18
Balance January 1, 2010 – 7 77 – 89 0 0 1 – 18
Exchange gain on translation of foreign operations 8 0 0 0 0 0 8
Loss on cash flow hedges, net of tax 22 0 0 – 180 0 0 0 – 180
Gain on available for sale financial instruments 7 0 0 0 25 0 0 25
Cash flow hedges transferred to the statement of income, net of tax 0 0 6 0 0 0 6
Change in ownership interest in subsidiaries 21 0 0 0 0 – 134 0 – 134
Equity portion of Convertible bonds 15 0 12 0 0 0 0 12
Balance December 31, 2010 1 89 – 263 25 – 134 1 – 281
earnings per share
2010 2009
Profit attributable to equity holders (US $ million) 1 291 983
Weighted average number of shares for the purposes of basic and diluted earnings per share 150 000 150 000
Basic and diluted earnings per share (US $) 8 606 6 555
Convertible bonds, convertible into 9,584 shares (2009: 188 shares), have been excluded from the determination of diluted earnings
per share as they are antidilutive. There are no other potentially dilutive investments outstanding.

Financial StatementS
56 | Annual Report 2010 |
NOTES TO THE FINANCIAL STATEMENTS (CONTINUED)
15. boRRowIngs
US $ million Notes 2010 2009
non current borrowings
144A Notes 946 945
Xstrata secured bank loans 0 2 282
Convertible bonds 2 132 1 838
Eurobonds 3 725 3 001
Swiss franc bonds 639 0
Sterling bonds 999 1 013
Perpetual notes 735 700
Ordinary profit participation certificates 14 1 059 1 392
Committed syndicated revolving credit facility 6 744 4 734
Other bank loans 1 1 272 498
total non current borrowings 18 251 16 403
current borrowings
Committed syndicated revolving credit facility 515 1 156
Committed secured inventory/receivables facility 9/10 1 700 0
Committed secured inventory facility 9 0 310
Committed secured receivables facilities 10 700 0
Committed asset backed (receivables) commercial paper program 10 0 1 300
Bilateral uncommitted secured inventory facilities 9 888 1 353
U.S. commercial paper 310 214
Xstrata secured bank loans 2 292 0
Eurobonds 765 0
Perpetual notes 292 0
Ordinary profit participation certificates 14 796 830
Other bank loans 1, 2 3 623 2 023
total current borrowings 11 881 7 186
¹ Includes $ 63 million (2009: $ 65 million) of obligations under financial leases of which $ 4 million (2009: $ 6 million) were current as at year end.² Comprises various uncommitted bilateral bank credit facilities and other financings.
144a notes
$ 950 million 6% coupon Notes due 2014. The Notes are recognized at amortized cost at an effective interest rate of 6.15% per
annum.
Xstrata secured bank loans
Comprising two facilities with a total amount of $ 2,800 million, with $ 2,300 million outstanding at December 31, 2010 and 2009.
Both facilities mature in September 2011. The facilities have been accounted for as secured bank loans which bear interest at a rate
of U.S. $ LIBOR plus a margin. As at December 31, 2010 $ 4,199 million (2009: $ 4,188 million) of the carrying value of Glencore’s
investment in Xstrata was pledged as security.
convertible bonds
In December 2009, the Group issued $ 2,000 million 5.0% coupon convertible bonds due December 2014. The bonds are convert
ible at the option of investors into a certain percentage of Glencore’s equity upon a qualifying IPO or upon other predetermined
qualifying events. The bonds contain several embedded derivatives which IFRS requires be accounted for separately, the most sig
nificant of these being that if the bonds have not been converted and no qualifying event occurs, they will be redeemed at maturity
at 108.1% of their nominal amount. In addition, if a qualifying IPO or other predetermined qualifying events have not occurred
prior to December 2012, bondholders may, subject to Glencore having achieved a “pre exceptional“ net income of $ 3.5 billion in
the preceding 12 months or in the event that Glencore is acquired for cash consideration, put the bonds back to Glencore at an
amount which achieves a cumulative annualized return of 20%. Payment in this regard could occur from mid 2013 at the earliest.

Financial StatementS
| Annual Report 2010 | 57
NOTES TO THE FINANCIAL STATEMENTS (CONTINUED)
The bonds consist of a liability component and an equity component. The fair values of the liability component ($ 1,923 million) and
the equity component ($ 77 million) were determined, using the residual method, at issuance of the bonds. The liability component
is measured at amortized cost at an effective interest rate of 5.90% per annum. At issuance and each subsequent period end, the
embedded derivatives were concluded to have a fair value of $ nil due to the probability weighting attributed to the related con
ditions. Over the first half of 2010, $ 300 million of additional Convertible bonds, convertible into 0.84% of the Company’s equity,
were issued under the same terms and conditions as those issued in December 2009 with the equity component equalling to
$ 12 million and the liability component equalling $ 288 million. In relation to the potential conversion, the terms of the bonds
enable a conversion into 6.25% of the Company’s equity as at December 31, 2010.
euro, Sterling and Swiss Franc bonds
The Group has issued bonds denominated in Euro, Sterling and Swiss Franc where upon issuance, the principal amounts and the
future interest payments were swapped into their U.S. Dollar equivalent. The details of amounts issued and outstanding are as
follows:
US $ million MaturityInitial US
$ equivalent
US $ fixed interest
rate in % 2010 2009
Euro 600 million 5.375% coupon bonds Sep 2011 739 5.78 765 817
Euro 850 million 5.250% coupon bonds Oct 2013 1 078 6.60 1 080 1 154
Euro 750 million 7.125% coupon bonds April 2015 1 200 6.86 968 1 030
Euro 1 250 million 5.250% coupon bonds March 2017 1 708 6.07 1 677 0
eurobonds 4 725 4 490 3 001
GBP 650 million 6.50% coupon bonds Feb 2019 1 266 6.58 999 1 013
CHF 600 million 3.625% coupon bonds April 2016 593 4.87 639 0
total 6 584 6 128 4 014
Perpetual notes
$ 700 million 8% notes, callable after February 2011 at par. In December 2010, Glencore announced its intention to call $ 300 million
of the outstanding notes. This partial redemption was subsequently completed on 6 February 2011. In October 2010, Glencore
issued $ 350 million 7.5% notes, callable after October 2015 at par.
Ordinary profit participation certificates
Profit participation certificates (PPC) bear interest at 6 month U.S. $ LIBOR and in the event of certain triggering events (see
note 14), all PPC would be subordinated to unsecured lenders.
committed revolving credit facilities
In May 2010, Glencore replaced the previous 364 day $ 815 million revolving credit facility with a new 364 day $ 1,375 million facility
with a one year term out option at Glencore’s discretion as well as a 364 day $ 515 million Asian focused tranche. In addition, Glencore
replaced the $ 8,180 million medium term revolving credit facility with a new 3 year revolving credit facility of $ 8,370 million and
cancelled the $ 6,650 million forward start facility concluded in 2009. Up to $ 1,000 million of the medium term tranche may be used
as liquidity back up for Glencore’s corporate U.S. commercial paper program.
committed secured inventory/receivables facility
In November 2010, Glencore entered into a 364 day committed $ 1.7 billion secured inventory and receivables borrowing base
facility. Under the program, Glencore has the option to pledge up to $ 750 million of eligible base metals inventory or up to
$ 1.7 billion of eligible receivables. Funds drawn under the facility bear interest at U.S. $ LIBOR plus a margin.
committed secured receivables facilities
In April 2010, Glencore entered into a six month $ 550 million committed secured receivables financing program which was
extended for a further year and increased to $ 700 million in December 2010. Funds drawn under the facility bear interest at
U.S. $ LIBOR plus a margin.

Financial StatementS
58 | Annual Report 2010 |
NOTES TO THE FINANCIAL STATEMENTS (CONTINUED)
U.S. commercial paper
Glencore has in place a stand alone U.S. commercial paper program for $ 1,000 million rated A3 and P2 respectively by Standard
& Poor’s and Moody’s rating agencies. The notes issued under this program carry interest at floating market rates and mature not
more than 270 days from the date of issue.
16. defeRRed InCome
During 2006, Glencore entered into an agreement to deliver a fixed quantity of silver concentrate, a byproduct from its mining
operations, for a period of 15 years at a fixed price for which Glencore received an upfront payment of $ 285 million. The outstanding
balance represents the remaining non current portion of the upfront payment. The upfront payment is released to revenue at a rate
consistent with the implied forward price curve at the time of the transaction and the actual quantities delivered.
17. pRovIsIons
US $ million
Post retirement benefits ¹
Employeeentitlement ²
Rehabilitationcosts ³ Other 4
Total
January 1, 2009 58 71 197 76 402Provision utilized in the year – 2 – 4 0 – 26 – 32Provisions assumed in business combination 2 0 10 40 52Additional provision in the year 1 18 29 75 123December 31, 2009 59 85 236 165 545
January 1, 2010 59 85 236 165 545Provision utilized in the year – 4 – 2 – 5 – 22 – 33Provisions assumed in business combination 4 0 3 0 7Additional provision in the year 1 15 145 39 200December 31, 2010 60 98 379 182 719
¹ See note 18.² The employee entitlement provision represents the value of state governed employee entitlements due to employees upon their termination of
employment. ³ Rehabilitation provision represents the accrued cost required to provide adequate restoration and rehabilitation upon the completion of
extraction activities. These amounts will be settled when rehabilitation is undertaken, generally at the end of a project’s life, which ranges from 2 to 50 years. The Group makes contributions to rehabilitation trusts to meet some of the costs of rehabilitation liabilities in South Africa.
4 Other includes primarily provisions in respect of mine concession obligations of $ 54 million (2009: $ 56 million) and construction related contractual provisions of $ 29 million (2009: $ 45 million).

Financial StatementS
| Annual Report 2010 | 59
NOTES TO THE FINANCIAL STATEMENTS (CONTINUED)
18. peRsonnel Costs And RetIRement benefIts
Total personnel costs, which includes salaries, wages, social security and other personnel costs and excludes attribution to profit
participation shareholders, incurred for the years ended December 31, 2010 and 2009, were $ 1,677 million and $ 1,281 million, re
spectively. Personnel costs related to consolidated industrial subsidiaries of $ 885 million (2009: $ 672 million) are included in cost
of goods sold. Other personnel costs are included in selling and administrative expenses.
The Company and certain subsidiaries sponsor various pension schemes in accordance with local regulations and practices. Eli
gibility for participation in the various plans is either based on completion of a specified period of continuous service, or date of
hire. The plans provide for certain employee and employer contributions, ranging from 5% to 16% of annual salaries, depending on
the employee’s years of service. Among these schemes are defined contribution plans as well as defined benefit plans. The main
locations with defined benefit plans are Switzerland, the UK and the US.
Defined contribution plans
Glencore’s contributions under these plans amounted to $ 11 million in 2010 and to $ 6 million in 2009.
Defined benefit plans
The amounts recognized in the statement of income are as follows:
US $ million 2010 2009
Current service cost 14 15Interest cost 16 15Expected return on plan assets – 11 – 9Net actuarial (gains)/losses recognized in the year 6 4Past service cost 1 0Exchange differences – 1 2total 25 27
The actual return on plan assets amounted to a gain of $ 14 million (2009: a gain of $ 17 million).
The amounts recognized in the statement of financial position are determined as follows:
US $ million Notes 2010 2009
Present value of defined benefit obligations 422 363Less: fair value of plan assets – 267 – 232Unrecognized actuarial gains/(losses) – 91 – 71Restrictions of assets recognized – 4 – 1liability in the statement of financial position 17 60 59
Movement in the present value of the defined benefit obligation is as follows:
US $ million 2010 2009
Opening defined benefit obligation 363 324Current service cost 14 15Interest cost 16 15Past service cost 1 0Benefits paid – 27 – 24Actuarial (gain)/loss 17 4Exchange differences on foreign plans – 5 9Other movements 43 20closing defined benefit obligation 422 363

Financial StatementS
60 | Annual Report 2010 |
NOTES TO THE FINANCIAL STATEMENTS (CONTINUED)
Movement in the present value of the plan assets is as follows:
US $ million 2010 2009
Opening fair value of plan assets 232 190
Expected return on plan assets 11 9
Contribution from the employer 27 24
Actuarial gain/(loss) – 5 0
Exchange differences on foreign plans – 5 5
Other movements 7 4
closing fair value of plan assets 267 232
The plan assets consist of the following:
US $ million 2010 2009
Cash and short term investments 5 5
Fixed income 115 107
Equities 96 77
Other 51 43
total 267 232
The overall expected rate of return is a weighted average of the expected returns of the various categories of plan assets held.
Glencore’s assessment of the expected returns is based on historical return trends and analysts’ predictions of the market for the
asset in the next twelve months.
The principal actuarial assumptions used were as follows:
US $ million 2010 2009
Discount rate 3 – 6% 4 –10%
Expected return on plan assets 3 – 8% 4 – 9%
Future salary increases 2 – 6% 2 – 6%
Future pension increases 3 – 4% 1–10%
The Group expects to make a contribution of $ 27 million (2009: $ 24 million) to the defined benefit plans during the next financial year.
Summary historical information:
US $ million
Present value of defined benefit
obligationFair value of plan assets
2008 324 190
2007 370 260
2006 471 399

Financial StatementS
| Annual Report 2010 | 61
NOTES TO THE FINANCIAL STATEMENTS (CONTINUED)
19. ACCounts pAyAble
US $ million Notes 2010 2009
Trade payables 12 450 8 162
Trade advances from buyers 9 634 946
Associated companies 1 788 1 371
Other payables and accrued liabilities 1 273 1 003
total 16 145 11 482
20. otheR fInAnCIAl lIAbIlItIes
US $ million Notes 2010 2009
commodity related contracts 23
Futures 4 142 5 747
Options 194 565
Swaps 784 657
Physical forwards 2 218 1 274
Financial contracts 23
Cross currency swaps 660 371
Foreign currency and interest rate contracts 68 29
total 8 066 8 643

Financial StatementS
62 | Annual Report 2010 |
21. ACquIsItIon And dIsposAl of subsIdIARIes
2010
Acquisitions
During 2010, Glencore acquired controlling interests in various businesses, the most significant being Vasilkovskoje Gold, Chemoil
Energy Limited (Chemoil) and Pacorini. The net cash used in the acquisition of subsidiaries and the fair value of the assets acquired
and liabilities assumed at the date of acquisition are detailed below:
US $ millionVasilkovs
koje Chemoil Pacorini ¹ Other 2 Total
Property, plant and equipment 2 855 519 0 280 3 654Investments in Associates 0 69 0 0 69Inventories 44 317 0 93 454Accounts receivable 103 703 0 76 882Cash and cash equivalents 13 108 0 11 132Assets held for sale 0 0 277 0 277Non controlling interest – 947 – 230 0 – 55 – 1 232Non current borrowings – 14 – 166 0 – 61 – 241Deferred tax liabilities – 365 – 96 0 0 – 461Accounts payable – 81 – 493 0 – 212 – 786Current borrowings 0 – 494 0 – 10 – 504Liabilities held for sale 0 0 – 68 0 – 68total fair value of net assets acquired 1 608 237 209 122 2 176
Less: amounts previously recognized through investments and loans 1 403 0 0 17 1 420Less: cash and cash equivalents acquired 13 108 0 11 132net cash used in acquisition of subsidiaries 192 129 209 94 624
1 Acquisition accounting determined on a provisional basis.2 Includes the acquisitions of a 76% interest in Rio Vermelho, a 60% interest in Biopetrol Industries AG and a 100% interest in Minera Altos de
Punitaqui.
Vasilkovskoje
In February 2010, Kazzinc purchased the remaining 60% of Vasilkovskoje Gold, a gold development company, that it did not previ
ously own for $ 1,140 million to enhance its existing gold production base. The acquisition was funded through the payment of
$ 204 million and the issuance of new Kazzinc shares which resulted in Glencore’s ultimate ownership in Kazzinc being diluted from
69% to 50.7% (without a loss of control). The dilution resulted in a loss of $ 99 million which has been recognized in reserves (see
note 14). Prior to acquisition, Kazzinc owned a 40% interest in Vasilkovskoje Gold which, at the date of acquisition, was revalued to
its fair value of $ 760 million and as a result, a net gain of $ 462 million was recognized in other income (see note 4). The acquisition
has been accounted for as a business combination with the non controlling interest being measured at its percentage of net assets
acquired determined by using discounted cash flow techniques with a discount rate of 8.5%.
For the period post acquisition, Vasilkovskoje Gold contributed revenue of $ 130 million and a loss before attribution of $ 15 million.
If the acquisition had taken place effective January 1, 2010, the operation would have contributed revenue of $ 131 million and a
loss before attribution of $ 22 million.
Chemoil
In April 2010, Glencore completed the acquisition of a 51.5% stake in Chemoil, a Singapore listed fuel oil storage and supply
company, for $ 237 million cash consideration. The acquisition has been accounted for as a business combination with the non
controlling interest being measured at its percentage of net assets acquired.
For the period post acquisition, Chemoil contributed revenue of $ 6,089 million and income before attribution of $ 4 million. If the
acquisition had taken place effective January 1, 2010, the operation would have contributed revenue of $ 7,175 million and a loss
before attribution of $ 3 million.
NOTES TO THE FINANCIAL STATEMENTS (CONTINUED)

Financial StatementS
| Annual Report 2010 | 63
NOTES TO THE FINANCIAL STATEMENTS (CONTINUED)
Pacorini
In September 2010, Glencore acquired the metals warehousing division of the Pacorini Group for $ 209 million in cash. As con
templated at the time of the acquisition, Glencore commenced a review of the strategic alternatives to strengthen Glencore’s
participation in the metals warehousing business, which is expected to result in a merger involving the acquired business and a
third party. As a result, the assets and liabilities have been classified as held for sale (see note 13).
For the period post acquisition, Pacorini contributed revenue of $ 64 million and income before attribution of $ 5 million. If the
acquisition had taken place effective January 1, 2010, the operation would have contributed revenue of $ 220 million and an income
before attribution of $ 31 million.
2009
Acquisitions
During 2009, the net cash used in the acquisition of subsidiaries related mainly to Katanga Mining Limited (Katanga). The fair value
of the assets acquired and liabilities assumed at the date of acquisition were:
US $ million 2009
Property, plant and equipment 856
Goodwill 161
Inventories 83
Accounts receivable 61
Cash and cash equivalents 242
Non controlling interest – 240
Non current borrowings – 102
Provisions and other non current borrowings – 52
Deferred tax liability – 11
Accounts payable – 192
total fair value of net assets acquired 806
Less: amounts previously recognized through investments and loans 537
Less: cash and cash equivalents acquired 242
net cash used in acquisition of subsidiaries 27
In January 2009, Glencore participated in a Katanga convertible loan issue via a combination of existing and new loans which, when
converted on June 2, 2009, resulted in Glencore holding a 68% interest in Katanga. Shortly thereafter, Glencore acquired an addi
tional 1.2% interest, bringing its ownership to 69.2%. The acquisition has been accounted for as a business combination with the non
controlling interest being measured at fair value using discounted cash flow techniques. The total cash consideration of the acquisi
tion, including the amounts paid prior to 2009, was $ 619 million. However, under IFRS, the consideration, for acquisition purposes,
is deemed to be fair value of the previously held equity interests and the convertible loan determined by reference to the quoted
share price on the date of acquisition. In this regard, Glencore realized a net, non cash gain of $ 161 million comprising a gain on
conversion of the convertible loan, offset by a loss on its original 8.5% interest in Katanga. The total consideration measured under
IFRS 3 was therefore $ 780 million and a goodwill impairment of $ 161 million was recognized forthright, based on a detailed fair
value assessment of the acquired assets and liabilities, using discounted cash flow techniques with a discount rate of 12%.

Financial StatementS
64 | Annual Report 2010 |
NOTES TO THE FINANCIAL STATEMENTS (CONTINUED)
Disposals
In 2010, there were no material disposals of subsidiaries.
In 2009, Glencore disposed of its interests in the East Tennessee Zinc Company LLC operations.
US $ million 2009
Property, plant and equipment 72
Inventories 12
Accounts receivable 52
Cash and cash equivalents 6
Accounts payable – 119
total net assets disposed 23
Net gain on disposal 97
net cash proceeds 120
22. fInAnCIAl And CApItAl RIsk mAnAgement
Components of Glencore’s business could be impacted by various external factors, such as a major global economic downturn, which
could result in significantly lower commodity prices and demand, political events, unfavorable actions by governments, natural ca
tastrophes, operational disruptions or financial risks such as market risk (including commodity price risk, interest rate risk and currency
risk), credit risk (including performance risk) and liquidity risk. It is Glencore’s policy and practice to identify and, where appropriate
and practical, actively manage such risks to support its objectives in managing its capital and future financial security and flexibility.
Glencore’s objectives in managing its capital (see table below) include preserving its overall financial health and strength for the ben
efit of all stakeholders and safeguarding its ability to continue as a going concern, while generating sustainable long term profitability.
US $ million 2010 2009
Total net assets attributable to profit participation shareholders, non controlling interests and equity holders
22 507 17 944
Less: non controlling interests 2 894 1 258
Glencore shareholders’ funds 19 613 16 686
Glencore believes that effective, proactive and transparent risk management supports its objective of protecting its current and
future financial security, and is of primary importance to its success. An important component of this process is Glencore’s employee
ownership structure, which aligns the interests of shareholders and management, and fosters a culture of excellence, teamwork
and accountability. As management has significant amounts of capital invested in Glencore, with overall compensation skewed
in favor of longer term incentives, it is strongly motivated to take a long term view of overall business performance and to protect
Glencore’s capital base. Glencore believes that its consistent profitability, the long term tenure of its senior management and its
prudent risk management policies can in part be attributed to its employee ownership structure. Furthermore, Glencore operates
a number of centralized financial, operational, compliance and legal risk management functions in order to monitor, manage and
mitigate overall risk exposure, within approved guidelines.
Glencore’s overall risk management program focuses on the unpredictability of financial markets and seeks to protect its financial
security and flexibility by using derivative financial instruments where possible to substantially hedge these financial risks. Glencore’s
finance and risk professionals, working in coordination with the commodity departments, monitor, manage and report regularly to
senior management on the financial risks and exposures facing the Group.
Certain borrowing arrangements require compliance with specific financial covenants related to working capital, minimum current ratio
and a maximum long term debt to tangible net worth ratio. During the period, the Company has complied with these requirements.

Financial StatementS
| Annual Report 2010 | 65
NOTES TO THE FINANCIAL STATEMENTS (CONTINUED)
commodity price risk
Glencore is exposed to price movements for the inventory it holds and the products it produces which are not held to meet priced
forward contract obligations and forward priced purchase or sale contracts which are not hedged. Glencore manages a significant
portion of this exposure through futures and options transactions on worldwide commodity exchanges or in over the counter
(OTC) markets, to the extent available. Commodity price risk management activities are considered an integral part of Glencore’s
physical commodity marketing activities and the related assets and liabilities are included in other financial assets from and other
financial liabilities to derivative counterparties, including clearing brokers and exchanges.
Glencore has entered into futures transactions to hedge the price risk of specific future operating expenditures. These trans
actions were identified as cash flow hedges. The fair value of these derivatives is as follows:
Notional amounts Recognized fair values
US $ million Buy Sell Assets Liabilities Maturity
Commodity futures – 2010 0 187 0 75 2012
Commodity futures – 2009 0 195 0 41 2011
Value at risk
One of the tools used by Glencore to monitor and limit its primary market risk exposure, namely commodity price risk related to its
physical marketing activities, is the use of a value at risk (VaR) computation. VaR is a risk measurement technique which estimates the
potential loss that could occur on risk positions as a result of movements in risk factors over a specified time horizon, given a specific
level of confidence. The VaR methodology is a statistically defined, probability based approach that takes into account market volatili
ties, as well as risk diversification by recognizing offsetting positions and correlations between commodities and markets. In this way,
risks can be measured consistently across all markets and commodities and risk measures can be aggregated to derive a single risk
value. Glencore has set a consolidated VaR limit (1 day 95%) of $ 100 million representing less than 1% of Glencore shareholders’ funds.
Glencore uses a VaR approach based on Monte Carlo simulations and is either a one day or one week time horizon computed at a
95% confidence level with a weighted data history.
Daily position sheets are distributed and monitored, and weekly Monte Carlo simulations are applied to the various business
groups’ net marketing positions to determine potential future exposures. As at December 31, 2010, Glencore’s 95%, one day
market risk VaR was $ 58 million (2009: $ 28 million). Average market risk VaR (1 day 95%) during 2010 was $ 43 million compared to
$ 27 million during 2009.
VaR does not purport to represent actual gains or losses in fair value on earnings to be incurred by Glencore, nor does Glencore claim
that these VaR results are indicative of future market movements or representative of any actual impact on its future results. VaR should
always be viewed in the context of its limitations; notably, the use of historical data as a proxy for estimating future events, market illi
quidity risks and tail risks. Glencore recognizes these limitations, and thus complements and continuously refines its VaR analysis by an
alyzing forward looking stress scenarios and back testing calculated VaR against actual movements arising in the next business week.
During 2009, certain commodities that Glencore markets and accounts for at fair value were not included in the VaR calculation as
well established and liquid price points were not available. These positions are nonetheless reported on the daily position sheets and
assuming the net year end positions had been outstanding for the whole year, and market prices were 5% higher/lower and all other
variables held constant, Glencore’s income and shareholders’ funds for the year ended December 31, 2009, would have decreased/
increased by $ 30 million. During 2010, all key commodities which Glencore markets have been included in the VaR analysis.
net present value at risk
Glencore’s future cash flows related to its forecast energy, minerals and agricultural production activities are also exposed to
commodity price movements. Glencore manages this exposure through a combination of portfolio diversification, occasional
shorter term hedging via futures and options transactions, insurance products and continuous internal monitoring, reporting and
quantification of the underlying operations’ estimated valuations.

Financial StatementS
66 | Annual Report 2010 |
NOTES TO THE FINANCIAL STATEMENTS (CONTINUED)
interest rate risk
Glencore is exposed to various risks associated with the effects of fluctuations in the prevailing levels of market interest rates on
its assets and liabilities and cash flows. Matching of assets and liabilities is utilized as the dominant method to hedge interest rate
risks. Floating rate debt which is predominantly used to fund fast turning working capital (interest is internally charged on the funding
of this working capital) is primarily based on U.S. $ LIBOR plus an appropriate premium. Accordingly, prevailing market interest
rates are continuously factored into transactional pricing and terms.
Assuming the amount of floating rate liabilities at the reporting period end were outstanding for the whole year, interest rates were
50 basis points higher/lower and all other variables held constant, Glencore’s income and shareholders’ funds for the year ended
December 31, 2010 would decrease/increase by $ 91 million (2009: decrease/increase by $ 71 million).
currency risk
The U.S. Dollar is the predominant functional currency of the Group. Currency risk is the risk of loss from movements in exchange
rates related to transactions and balances in currencies other than the U.S. Dollar. Such transactions include operating expendi
ture, capital expenditure and to a lesser extent purchases and sales in currencies other than the functional currency. Purchases or
sales of commodities concluded in currencies other than the functional currency, apart from certain limited domestic sales at in
dustrial operations which act as a hedge against local operating costs, are promptly hedged through forward exchange contracts.
Consequently, foreign exchange movements against the U.S. Dollar on recognized transactions would have a negligible financial
impact. Glencore enters into currency hedging transactions with leading financial institutions.
Glencore’s debt related payments (both principal and interest) are denominated in or swapped using hedging instruments into
U.S. Dollars. Glencore’s operating expenses, being a small portion of its revenue base, are incurred in a mix of currencies of which
the U.S. Dollar, Swiss Franc, Pound Sterling, Australian Dollar and Euro are the predominant currencies.
Glencore has issued Euro, Swiss Franc and Sterling denominated bonds (see note 15). Cross currency swaps were concluded to
hedge the currency risk on the principal and related interest payments of these bonds. These contracts were designated as cash
flow hedges of the foreign currency risks associated with the bonds. The fair value of these derivatives is as follows:
Notional amounts Recognized fair values Average
US $ million Buy Sell Assets Liabilities maturity ¹
Cross currency swap agreements – 2010 0 6 584 0 185 2015
Cross currency swap agreements – 2009 0 4 283 0 48 2015
¹ Refer to note 15 for details.
credit risk
Credit risk arises from the possibility that counterparties may not be able to settle obligations due to Glencore within their agreed
payment terms. Financial assets which potentially expose Glencore to credit risk consist principally of cash and cash equivalents,
marketable securities, receivables and advances, derivative instruments and non current advances and loans. Glencore’s credit
management process includes the assessment, monitoring and reporting of counterparty exposure on a regular basis. Glencore’s
cash equivalents are placed overnight with a diverse group of highly credit rated financial institutions. Credit risk with respect to
receivables and advances is mitigated by the large number of customers comprising Glencore’s customer base, their diversity
across various industries and geographical areas, as well as Glencore’s policy to mitigate these risks through letters of credit, net
ting, collateral and insurance arrangements where appropriate. Additionally, it is Glencore’s policy that transactions and activities
in trade related financial instruments be concluded under master netting agreements or long form confirmations to enable offset
ting of balances due to/from a common counterparty in the event of default by the counterparty. Glencore actively and continu
ously monitors the credit quality of its counterparties through internal reviews and a credit scoring process, which includes, where
available, public credit ratings. Balances with counterparties not having a public investment grade or equivalent internal rating
are typically enhanced to investment grade through the extensive use of credit enhancement products, such as letters of credit or
insurance products. Glencore has a diverse customer base, with no customer representing more than 3.4% (2009: 2.3%) of its trade
receivables or accounting for more than 3% of its revenues over the year ended 2010 (2009: 2.8%).

Financial StatementS
| Annual Report 2010 | 67
NOTES TO THE FINANCIAL STATEMENTS (CONTINUED)
The maximum exposure to credit risk, without considering netting agreements or without taking account of any collateral held or
other credit enhancements, is equal to the carrying amount of Glencore’s financial assets plus the guarantees to third parties and
Associates (see note 25).
Performance risk
Performance risk arises from the possibility that counterparties may not be willing or able to meet their future contractual physical
sale or purchase obligations to/from Glencore. Glencore undertakes the assessment, monitoring and reporting of performance
risk within its overall credit management process. Glencore’s market breadth, diversified customer base as well as the standard
pricing mechanism in the majority of Glencore’s commodity portfolio which does not fix prices beyond three months, with the main
exception being coal where longer term fixed price contracts are common, ensure that performance risk is adequately mitigated.
The commodity industry is continuing a trend towards shorter fixed price contract periods, in part to mitigate against such po
tential performance risk, but also due to the development of more transparent and liquid spot markets, e.g. coal and iron ore and
associated derivative products and indexes.
liquidity risk
Liquidity risk is the risk that Glencore is unable to meet its payment obligations when due, or that it is unable, on an ongoing basis,
to borrow funds in the market on an unsecured or secured basis at an acceptable price to fund actual or proposed commitments.
Prudent liquidity risk management implies maintaining sufficient cash and cash equivalents through the availability of adequate
committed funding facilities. Glencore has set itself an internal minimum liquidity target to maintain at all times, available com
mitted undrawn credit facilities of $ 3 billion. Glencore’s credit profile, diversified funding sources and committed credit facilities,
ensure that sufficient liquid funds are maintained to meet its liquidity requirements. As part of its liquidity management, Glencore
closely monitors and plans for its future capital expenditure and proposed investments, as well as credit facility refinancing/exten
sion requirements, well ahead of time.
Glencore’s financial forecasts and projections, taking into account reasonably possible changes in performance, indicate it is
appropriate to adopt the going concern basis in preparing these financial statements.
As at December 31, 2010, Glencore had available committed undrawn credit facilities, cash and marketable securities amounting
to $ 4,220 million (2009: $ 3,826 million). The maturity profile of Glencore’s financial liabilities based on the contractual terms is as
follows:
2010US $ million
After 5 years
Due 3 – 5 years
Due 2 – 3 years
Due 1 – 2 years
Due 0 –1 years
Total
Borrowings 4 152 4 974 7 094 2 031 11 881 30 132
Expected future interest payments 668 949 766 800 834 4 017
Commodities sold with agreements to repurchase 0 0 0 0 484 484
Accounts payable 0 0 0 0 16 145 16 145
Other financial liabilities 0 739 288 955 6 084 8 066
Liabilities held for sale 0 0 0 0 45 45
total 4 820 6 662 8 148 3 786 35 473 58 889
Current assets 44 296 44 296

Financial StatementS
68 | Annual Report 2010 |
NOTES TO THE FINANCIAL STATEMENTS (CONTINUED)
2009US $ million
After 5 years
Due 3 – 5 years
Due 2 – 3 years
Due 1– 2 years
Due 0 –1 years
Total
Borrowings ¹ 2 943 4 344 5 507 3 950 6 845 23 589
Expected future interest payments 602 842 554 697 689 3 384
Commodities sold with agreements to repurchase 0 0 0 0 477 477
Prodeco call option arrangement 0 0 0 0 2 303 2 303
Accounts payable 0 0 0 0 11 482 11 482
Other financial liabilities 0 0 627 2 163 5 853 8 643
Liabilities held for sale 0 0 0 0 236 236
total 3 545 5 186 6 688 6 810 27 885 50 114
Current assets 38 725 38 725
¹ 2009: $ 341 million of reported current debt is drawn under a 3 year committed facility.
23. fInAnCIAl InstRuments
Fair value of financial instruments
The following table presents the carrying values and fair values of Glencore’s financial instruments. Fair value is the amount at
which a financial instrument could be exchanged in an arm’s length transaction between informed and willing parties, other than
in a forced or liquidated sale. Where available, market values have been used to determine fair values. When market values are
not available, fair values have been calculated by discounting expected cash flows at prevailing interest and exchange rates. The
estimated fair values have been determined using market information and appropriate valuation methodologies, but are not nec
essarily indicative of the amounts that Glencore could realize in the normal course of business.
2010 US $ million
Carryingvalue 1
Availablefor sale
FVtPL 2
Total Fair value
assets
Other investments 3 0 2 048 390 2 438 2 438
Advances and loans 3 830 0 0 3 830 3 830
Accounts receivable 18 994 0 0 18 994 18 994
Other financial assets 0 0 5 982 5 982 5 982
Cash and cash equivalents and marketable securities 0 0 1 529 1 529 1 529
total financial assets 22 824 2 048 7 901 32 773 32 773
liabilities
Ordinary and hybrid profit participation shareholders 14 189 0 0 14 189 14 189
Borrowings 30 132 0 0 30 132 31 476
Commodities sold with agreements to repurchase 484 0 0 484 484
Accounts payable 16 145 0 0 16 145 16 145
Other financial liabilities 0 0 8 066 8 066 8 066
total financial liabilities 60 950 0 8 066 69 016 70 360
1 Carrying value comprises investments, loans, accounts receivable, accounts payable and other liabilities measured at amortized cost.2 FVtPL – Fair value through profit and loss – held for trading.3 Other investments contain $ 2,438 million in Level 1. As at December 31, 2009, $ 2,624 million of other investments were considered Level 3
valuations, which during 2010, $ 2,003 million were reclassified to Level 1 following UCR’s listing on the Hong Kong Stock Exchange in January 2010 (see note 7) and as a result of the Russneft debt amendment and restatement (see note 8), $ 285 million of equity conversion advances were reclassified from other investments to non current advances (a level 2 fair value measurement) and the balance of the Russneft investment and the Level 3 valuation amount ($ 336 million) was impaired.

Financial StatementS
| Annual Report 2010 | 69
NOTES TO THE FINANCIAL STATEMENTS (CONTINUED)
2009 US $ million
Carryingvalue 1
Availablefor sale
FVtPL 2 Total Fair value
assets
Other investments 3 0 2 624 578 3 202 3 202
Advances and loans 2 535 0 0 2 535 2 535
Accounts receivable 15 189 0 0 15 189 15 189
Other financial assets 0 0 6 125 6 125 6 125
Cash and cash equivalents and marketable securities 0 0 935 935 935
total financial assets 17 724 2 624 7 638 27 986 27 986
liabilities
Ordinary and hybrid profit participation shareholders 12 245 0 0 12 245 12 245
Borrowings 23 589 0 0 23 589 23 641
Commodities sold with agreements to repurchase 477 0 0 477 477
Prodeco call option arrangement 0 0 2 303 2 303 2 303
Accounts payable 11 482 0 0 11 482 11 482
Other financial liabilities 0 0 8 643 8 643 8 643
total financial liabilities 47 793 0 10 946 58 739 58 791
1 Carrying value comprises investments, loans, accounts receivable, accounts payable and other liabilities measured at amortized cost.2 FVtPL – Fair value through profit and loss – held for trading.3 Other investments contain $ 578 million in Level 1 and $ 2,624 million in Level 3. There were no changes in Level 3 for the year.
The following tables show the fair values of the derivative financial instruments including trade related financial and physical for
ward purchase and sale commitments by type of contract as at December 31, 2010 and 2009. Fair values are primarily determined
using quoted market prices or standard pricing models using observable market inputs where available and are presented to
reflect the expected gross future cash in/outflows. Glencore classifies the fair values of its financial instruments into a three level
hierarchy based on the degree of the source and observability of the inputs that are used to derive the fair value of the financial
asset or liability as follows:
Level 1 unadjusted quoted inputs in active markets for identical assets or liabilities; or
Level 2 inputs other than quoted inputs included in Level 1 that are directly or indirectly observable in the market; or
Level 3 unobservable market inputs or observable but can not be market corroborated, requiring Glencore to make market
based assumptions.
Level 1 classifications primarily include futures with a tenor of less than one year and options that are exchange traded. Level 2
classi fications primarily include futures with a tenor greater than one year, over the counter options, swaps and physical forward
transactions which derive their fair value primarily from exchange quotes and readily observable broker quotes. Level 3 classifi
cations primarily include physical forward transactions which derive their fair value predominately from models that use broker
quotes and applicable market based estimates surrounding location, quality and credit differentials. In circumstances where Glen
core cannot verify fair value with observable market inputs (Level 3 fair values), it is possible that a different valuation model could
produce a materially different estimate of fair value.
It is Glencore’s policy that transactions and activities in trade related financial instruments be concluded under master netting
agreements or long form confirmations to enable balances due to/from a common counterparty to be offset in the event of default
by the counterparty.

Financial StatementS
70 | Annual Report 2010 |
NOTES TO THE FINANCIAL STATEMENTS (CONTINUED)
Other financial assets
2010US $ million
Level 1
Level 2
Level 3
Total
commodity related contracts
Futures 1 168 628 0 1 796
Options 106 43 0 149
Swaps 174 471 0 645
Physical forwards 0 1 744 1 374 3 118
Financial contracts
Cross currency swaps 0 149 0 149
Foreign currency and interest rate contracts 45 80 0 125
total 1 493 3 115 1 374 5 982
2009US $ million Level 1 Level 2 Level 3 Total
commodity related contracts
Futures 1 838 947 0 2 785
Options 132 277 0 409
Swaps 193 394 0 587
Physical forwards 0 343 1 706 2 049
Financial contracts
Cross currency swaps 0 246 0 246
Foreign currency and interest rate contracts 21 28 0 49
total 2 184 2 235 1 706 6 125
Other financial liabilities
2010US $ million
Level 1
Level 2
Level 3 Total
commodity related contracts
Futures 2 786 1 356 0 4 142
Options 25 70 99 194
Swaps 295 489 0 784
Physical forwards 0 1 199 1 019 2 218
Financial contracts
Cross currency swaps 0 660 0 660
Foreign currency and interest rate contracts 37 31 0 68
total 3 143 3 805 1 118 8 066
2009US $ million Level 1 Level 2 Level 3 Total
commodity related contractsFutures 3 463 2 284 0 5 747
Options 144 333 88 565
Swaps 241 415 1 657
Physical forwards 0 249 1 025 1 274
Financial contractsCross currency swaps 0 371 0 371
Foreign currency and interest rate contracts 19 10 0 29
total 3 867 3 662 1 114 8 643

Financial StatementS
| Annual Report 2010 | 71
NOTES TO THE FINANCIAL STATEMENTS (CONTINUED)
The following table shows the net changes in fair value of Level 3 other financial assets and other financial liabilities:
US $ million
SwapsPhysical
forwards
OptionsTotal
Level 3
January 1, 2009 0 502 – 56 446
Total gain/(loss) recognized in cost of goods sold 0 1 164 13 1 177
Sales – 1 0 – 101 – 102
Realized 0 – 985 56 – 929
December 31, 2009 – 1 681 – 88 592
January 1, 2010 – 1 681 – 88 592
Total gain/(loss) recognized in cost of goods sold 2 – 209 – 58 – 265
Sales 0 0 – 41 – 41
Realized – 1 – 117 88 – 30
December 31, 2010 0 355 – 99 256
24. futuRe CommItments
Capital expenditure for the acquisition of property, plant and equipment is generally funded through the cash flow generated by
the respective industrial entities. As at December 31, 2010, $ 787 million (2009: $ 815 million), of which 100% (2009: 63%) relates to
expenditure to be incurred over the next year, was contractually committed for the acquisition of property, plant and equipment.
Certain of Glencore’s exploration tenements and licenses require it to spend a minimum amount per year on development activities,
a significant portion of which would have been incurred in the ordinary course of operations. As at December 31, 2010, $ 404 mil
lion (2009: $ 284 million) of such development expenditures are to be incurred, of which 36% are for commitments to be settled
over the next year.
Glencore procures seagoing vessel/chartering services to meet its overall marketing objectives and commitments. At year end,
Glencore has committed to future hire costs to meet future physical delivery and sale obligations and expectations of $ 2,608 mil
lion (2009: $ 2,185 million) of which $ 325 million (2009: $ 272 million) are with associated companies. 50% of these charters are for
services to be received over the next 2 years.
As part of Glencore’s ordinary sourcing and procurement of physical commodities and other ordinary marketing obligations, the
selling party may request that a financial institution act as either a) the paying party upon the delivery of product and qualifying
documents through the issuance of a letter of credit or b) the guarantor by way of issuing a bank guarantee accepting responsibility
for Glencore’s contractual obligations. As at December 31, 2010, $ 8,956 million (2009: $ 7,178 million) of such commitments have
been issued on behalf of Glencore, which will generally be settled simultaneously with the payment for such commodity.
Glencore has entered into various operating leases mainly as lessee for office and warehouse/storage facilities. Rental expenses
for these leases totalled respectively $ 66 million and $ 53 million for the years ended December 31, 2010 and 2009. Future net
minimum lease payments under non cancellable operating leases are as follows:
US $ million 2010 2009
Within 1 year 97 26
Between 2 and 5 years 225 51
After 5 years 151 93
total 473 170
Financial StatementS
72 | Annual Report 2010 |
Future development and related commitments
Prodeco
Prodeco currently exports the majority of its coal through Puerto Zuniga which operates under a private concession awarded by
the Colombian government. This concession expired March 2009, however the Colombian government has continued to grant
Prodeco the right to use the port under annual lease agreements. To comply with new government regulations on loading meth
ods, which become effective from July 2010 and to alleviate itself from the uncertainty of the annual concession renewal process
associated with Puerto Zuniga, Prodeco has initiated construction of a new, wholly owned, port facility (Puerto Nuevo) which is es
timated to cost $ 520 million and be commissioned over the first half of 2013. If the concession does not continue to be extended,
Prodeco’s export capability would be curtailed, which could significantly impact operations until Puerto Nuevo is operational. As
at December 31, 2010, $ 55 million of the estimated initial investment has been incurred.
Kansuki
In August 2010, Glencore acquired an ultimate 37.5% interest in the Kansuki concession (Kansuki), a 180 square kilometer copper
and cobalt predevelopment project which borders Glencore’s partly owned Mutanda concession in the DRC. In exchange, Glen
core has a) an obligation to finance the first $ 400 million of development related expenditures, if any, as and when such expen
diture gets incurred, b) the right to operate the operations and c) a life of mine offtake agreement for all copper and cobalt pro
duced by Kansuki. In addition, one of the partners in Kansuki has the right to sell an additional 18.75% ultimate interest to Glencore
at the then calculated equity value of the operation, at the earlier of the date the operation produces a minimum annual 70,000
metric tons of copper and August 2013. Kansuki is currently completing its initial feasibility study for submission to Gecamines by
June 2011. As at December 31, 2010, $ 11 million of development expenditures had been incurred.
Perkoa
In November 2010, Glencore and Blackthorn Resources Limited completed a joint venture agreement to develop the Perkoa Zinc
Project (“Perkoa“) located in Burkina Faso, West Africa. Under the terms of the agreement, Glencore will obtain a 50.1% effective
ownership in Perkoa in exchange for a) an obligation to finance the first $ 80 million of development related expenditures, if any,
as and when such expenditure gets incurred, b) the right to operate the operations and c) a life of mine offtake agreement for all
zinc produced by Perkoa. As at December 31, 2010, $ nil million of development expenditure had been incurred.
25. ContIngent lIAbIlItIes
The amount of corporate guarantees in favor of associated and third parties as at December 31, 2010, was $ 69 million (2009:
$ 73 million). Also see note 7.
litigation
Certain legal actions, other claims and unresolved disputes are pending against Glencore. Whilst Glencore cannot predict the
results of any litigation, it believes that it has meritorious defenses against those actions or claims. Glencore believes the likelihood
of any liability arising from these claims to be remote and that the liability, if any, resulting from any litigation will not have a material
adverse effect on its consolidated income, financial position or cashflows.
environmental contingencies
Glencore’s operations, predominantly those arising from the ownership in industrial investments, are subject to various environmental
laws and regulations. Glencore is in material compliance with those laws and regulations. Glencore accrues for environmental contin
gencies when such contingencies are probable and reasonably estimable. Such accruals are adjusted as new information develops or
circumstances change. Recoveries of environmental remediation costs from insurance companies and other parties are recorded as
assets when the recoveries are virtually certain. At this time, Glencore is unaware of any material environmental incidents at its locations.
Bolivian constitution
In 2009 the Government of Bolivia enacted a new constitution. One of the principles of the constitution requires mining entities
to form joint ventures with the government. Glencore, through its subsidiary Sinchi Wayra, has, in good faith, entered into negoti
ations with the Bolivian government regarding this requirement. Whilst progress has been made, the final outcome and the timing
thereof cannot be determined at this stage.
NOTES TO THE FINANCIAL STATEMENTS (CONTINUED)

Financial StatementS
| Annual Report 2010 | 73
26. RelAted pARty tRAnsACtIons
In the normal course of business, Glencore enters into various arm’s length transactions with related parties (primarily Xstrata),
including fixed price commitments to sell and to purchase commodities, forward sale and purchase contracts, agency agreements
and management service agreements. Outstanding balances at period end are unsecured and settlement occurs in cash (see
notes 8, 10, 13 and 19). There have been no guarantees provided or received for any related party receivables or payables.
Related party transactions, unless discussed elsewhere in the notes to the financial statements, are summarized below. The prin
cipal related parties are included in notes 14 and 28. All transactions between Glencore and its subsidiaries are eliminated on
consolidation along with any unrealized profits and losses between its subsidiaries and Associates.
2010US $ million
Associatedcompanies
Parentcompanies
Total
Sales 1 086 0 1 086
Purchases – 9 472 0 – 9 472
Interest income 32 2 34
Interest expense – 1 0 – 1
Agency income 82 0 82
Agency expense – 5 0 – 5
2009US $ million
Associatedcompanies
Parentcompanies
Total
Sales 907 0 907
Purchases – 7 423 0 – 7 423
Interest income 20 2 22
Interest expense – 2 0 – 2
Agency income 51 0 51
Agency expense – 4 0 – 4
Remuneration of key management personnel
The remuneration of directors and other members of key management personnel recognized in the statement of income including
salaries and other current employee benefits amounted to $ 146 million (2009: $ 148 million) and amounts attributable to PPS and
HPPS (as described in note 14) amounted to $ 938 million (2009: $ 291 million). As at December 31, 2010, included in the amounts
attributable to PPS and HPPS are $ 6,130 million (2009: $ 5,192 million) related to key management personnel.
27. subsequent events
Subsequent to year end, the following significant events occurred:
• In January, Glencore issued CHF 225 million ($ 235 million) 3.625% interest bearing bonds due April 2016, increasing the size of
this CHF bond series to CHF 825 million. The proceeds from this bond issue (plus $ 65 million in cash on hand) were used to
redeem $ 300 million of the $ 700 million 8% perpetual notes.
NOTES TO THE FINANCIAL STATEMENTS (CONTINUED)

Financial StatementS
74 | Annual Report 2010 |
NOTES TO THE FINANCIAL STATEMENTS (CONTINUED)
28. lIst of pRInCIpAl opeRAtIng, fInAnCe And IndustRIAl subsIdIARIes And Investments
Method of consolidationin 2010 1
Country ofincorporation
% interest 2010
% interest 2009
Main activity
Glencore International AG P Switzerland OperatingGlencore AG F Switzerland 100.0 100.0 Operating Allied Alumina Inc. (Sherwin Alumina) F United States 100.0 100.0 Alumina production Century Aluminum Company 2 E United States 44.0 44.1 Aluminum production Glencore Funding LLC F United States 100.0 100.0 FinanceGlencore UK Ltd F U.K. 100.0 100.0 Operating Glencore Commodities Ltd F U.K. 100.0 100.0 Operating Glencore Energy UK Ltd F U.K. 100.0 100.0 OperatingGlencore Group Funding Limited F UAE 100.0 100.0 Finance Glencore Finance (Bermuda) Ltd F Bermuda 100.0 100.0 Finance AR Zinc Group F Argentina 100.0 100.0 Zinc/Lead production Empresa Minera Los Quenuales S.A. F Peru 97.1 97.1 Zinc/Lead production Glencore Exploration (EG) Ltd. F Bermuda 100.0 100.0 Oil exploration/development Glencore Finance (Europe) S.A. F Luxembourg 100.0 100.0 Finance Kansuki Group E DRC 37.5 0.0 Copper production Minera Altos de Punitaqui F Chile 100.0 0.0 Copper production Mopani Copper Mines PLC F Zambia 73.1 73.1 Copper production Mutanda Group E DRC 40.0 40.0 Copper production Prodeco Group F Colombia 100.0 100.0 Coal production Recylex S.A. E France 32.2 32.2 Zinc/Lead production Sinchi Wayra Group F Bolivia 100.0 100.0 Zinc/Tin production United Company Rusal Limited O Jersey 8.8 9.7 Aluminum productionFinges Investment B.V. F Netherlands 100.0 100.0 Finance Biopetrol Industries AG 3 F Switzerland 60.3 0.0 Biodiesel production Glencore Grain B.V. F Netherlands 100.0 100.0 Operating Nyrstar N.V. O Belgium 7.8 7.8 Zinc production Rio Vermelho F Brazil 76.0 0.0 Sugar cane/ethanol production Xstrata plc E U.K. 34.5 34.9 Diversified productionChemoil Energy Limited 4 F Hong Kong 51.5 0.0 Oil storageCobar Group F Australia 100.0 100.0 Copper productionGlencore Singapore Pte Ltd F Singapore 100.0 100.0 OperatingKazzinc Ltd. F Kazakhstan 50.7 69.0 Zinc/Lead production Vasilkovskoje Gold F Kazakhstan 100.0 40.0 Gold productionKatanga Mining Limited 5 F Bermuda 74.4 69.2 Copper productionMurrin Murrin Joint Venture 6 F Australia 40.0 40.0 Nickel productionMinara Resources Ltd 7 F Australia 70.6 70.6 Nickel productionMoreno Group F Argentina 100.0 100.0 Edible oils productionPacorini Group F Italy 100.0 0.0 Metals warehousingPasar Group F Philippines 78.2 78.2 Copper productionPolymet Mining Corp. O Canada 6.3 2.6 Copper productionPortovesme S.r.L. F Italy 100.0 100.0 Zinc/Lead productionRussneft Group (various companies) 8 O Russia 40.0 – 49.0 40.0 – 49.0 Oil productionShanduka Coal (Pty) Ltd F South Africa 70.0 70.0 Coal productionST Shipping & Transport Pte Ltd F Singapore 100.0 100.0 OperatingTopley Corporation F B.V.I. 100.0 100.0 Ship ownerVolcan Compania Minera S.A.A. O Peru 4.1 4.1 Zinc production
1 P=Parent; F = Full consolidation; E = Equity method; O = Other investment2 Represents Glencore’s economic interest in Century, comprising 39.1% (2009: 39.1%) voting interest and 4.9% (2009: 5%) non voting interest.3 Publicly traded on the Frankfurt Stock Exchange under a symbol A0HNQ5. Glencore owns 46,812,601 shares.4 Publicly traded on the Singapore Exchange under the symbol CHEL.SI. Glencore owns 666,204,594 shares.5 Publicly traded on the Toronto Stock Exchange under the symbol KAT.TO. Glencore owns 1,419,031,161 shares.6 The balance of the joint venture is held by Minara Resources Ltd, giving Glencore an effective interest of 82.4% in the joint venture.7 Publicly traded on the Australian Stock Exchange under the symbol MRE.AX. Glencore owns 824,829,760 shares.8 Although Glencore holds more than 20% of the voting rights, it has limited key management influence and thus does not exercise significant
influence.

| Annual Report 2010 | 75


