48
Annual Report 2015 Presentation 11 Feb 2016 1 Annual Report 2015 Copenhagen, 11 February 2016

Disclaimer included in Footer: The information contained or referenced in this presentation is confidential and proprietary to FLSmidth and is protected by copyright or trade secret laws. DO NOT CHANGE FOOTER! AND KEEP DISCLAIMER ON ALL SLIDES IN THE PRESENTATION. If by chance the footer is changed. Provide the upper text in the footer. Click Insert in the top menu - Click Header & Footer and change the settings under Footer
Annual Report 2015 Presentation
11 Feb 2016 1 Annual Report 2015
Copenhagen, 11 February 2016

Disclaimer included in Footer: The information contained or referenced in this presentation is confidential and proprietary to FLSmidth and is protected by copyright or trade secret laws. DO NOT CHANGE FOOTER! AND KEEP DISCLAIMER ON ALL SLIDES IN THE PRESENTATION. If by chance the footer is changed. Provide the upper text in the footer. Click Insert in the top menu - Click Header & Footer and change the settings under Footer
FLSmidth – One source of productivity
One source of productivity
11 Feb 2016 Annual Report 2015 2
Market leading key products
Boosting productivity and maximising return on assets
Minimising impact on society and environment
Providing uptime and performance guarantees
Reducing total cost of ownership
Customised equipment, complete plants and full Operation & Maintenance
Parts, services and maintenance
Working closely with
customers to understand performance
data

Disclaimer included in Footer: The information contained or referenced in this presentation is confidential and proprietary to FLSmidth and is protected by copyright or trade secret laws. DO NOT CHANGE FOOTER! AND KEEP DISCLAIMER ON ALL SLIDES IN THE PRESENTATION. If by chance the footer is changed. Provide the upper text in the footer. Click Insert in the top menu - Click Header & Footer and change the settings under Footer
Key highlights - Annual Report 2015
11 Feb 2016 Annual Report 2015 3
2015
• Order intake up 7% despite challenging market conditions
• Revenue and EBITA-margin in line with guidance
• Products and services provide a stable and profitable business
• Positive free cash flow reduced net debt by DKK 0.9bn
2016
• EBITA-margin guidance of 7-9% reflects low visibility and investments in people

Disclaimer included in Footer: The information contained or referenced in this presentation is confidential and proprietary to FLSmidth and is protected by copyright or trade secret laws. DO NOT CHANGE FOOTER! AND KEEP DISCLAIMER ON ALL SLIDES IN THE PRESENTATION. If by chance the footer is changed. Provide the upper text in the footer. Click Insert in the top menu - Click Header & Footer and change the settings under Footer
Safety ambition: No injuries
2015 LTIFR target achieved: < 2.6
New 2016 LTIFR target: < 1.6
Strong safety performance in 2015 Lost Time Injury Frequency Rate (LTIFR) 1.8
4
Safety
11 Feb 2016 Annual Report 2015
LTIFR (annually) Number of lost time injuries per million working hours
4.2 4.7
3.9
2.7
1.8
0.0
1.0
2.0
3.0
4.0
5.0
2011 2012 2013 2014 2015
33% improvement vs. 2014
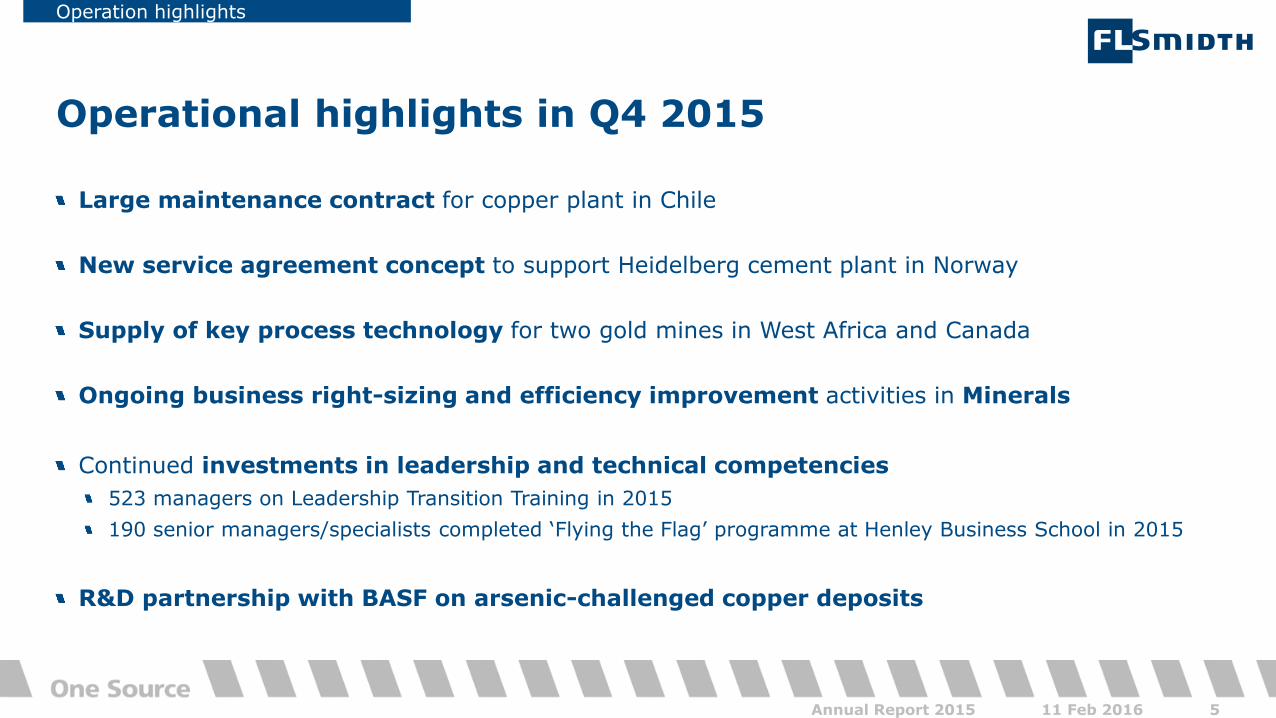
Disclaimer included in Footer: The information contained or referenced in this presentation is confidential and proprietary to FLSmidth and is protected by copyright or trade secret laws. DO NOT CHANGE FOOTER! AND KEEP DISCLAIMER ON ALL SLIDES IN THE PRESENTATION. If by chance the footer is changed. Provide the upper text in the footer. Click Insert in the top menu - Click Header & Footer and change the settings under Footer Large maintenance contract for copper plant in Chile
New service agreement concept to support Heidelberg cement plant in Norway
Supply of key process technology for two gold mines in West Africa and Canada
Ongoing business right-sizing and efficiency improvement activities in Minerals
Continued investments in leadership and technical competencies
523 managers on Leadership Transition Training in 2015
190 senior managers/specialists completed ‘Flying the Flag’ programme at Henley Business School in 2015
R&D partnership with BASF on arsenic-challenged copper deposits
Operational highlights in Q4 2015
Operation highlights
11 Feb 2016 Annual Report 2015 5

Disclaimer included in Footer: The information contained or referenced in this presentation is confidential and proprietary to FLSmidth and is protected by copyright or trade secret laws. DO NOT CHANGE FOOTER! AND KEEP DISCLAIMER ON ALL SLIDES IN THE PRESENTATION. If by chance the footer is changed. Provide the upper text in the footer. Click Insert in the top menu - Click Header & Footer and change the settings under Footer
Sustainable technology highlights in Q4 2015
Technology highlights
11 Feb 2016 Annual Report 2015 6
TRIBOMAX™ wear solution: Unique resistance against tramp metal and oversize feed – as well as heat and corrosion
First order booked January 8, 2016 for Lehigh Hanson Materials Limited
Advantages:
Increases strength of steel construction surfaces ~15 times
~5 times stronger than traditional welded coatings
Built-in surface roughness due to the welding technology (Plasma Transfer ARC) developed by leading engineers from FLSmidth R&D together with Aalborg University
Can be applied on all types of steel and aluminum – with low maintenance requirements
~10% reduction in capital investment
Strategic rationale:
Improving productivity for our customers and strengthening our position in wear parts
Supercoating of metallic surfaces multiplies resistance

Disclaimer included in Footer: The information contained or referenced in this presentation is confidential and proprietary to FLSmidth and is protected by copyright or trade secret laws. DO NOT CHANGE FOOTER! AND KEEP DISCLAIMER ON ALL SLIDES IN THE PRESENTATION. If by chance the footer is changed. Provide the upper text in the footer. Click Insert in the top menu - Click Header & Footer and change the settings under Footer
Revenue from total service activities +7% in 2015
Total service activities
11 Feb 2016 Annual Report 2015 7
Customer Services
Minerals Cement
Cement Product
Companies
Projects / Customised equipment Products
Products aftermarket
Cement Operation & Maintenance
Customised equipment aftermarket
Total service activities 55% of revenue 52% of order intake
Revenue growth +7% vs. 2014 Order intake growth unchanged vs. 2014
2015
Product Companies
Total capital business 45% of revenue 48% of order intake
Revenue growth -15% vs. 2014 Order intake growth +15% vs. 2014

Disclaimer included in Footer: The information contained or referenced in this presentation is confidential and proprietary to FLSmidth and is protected by copyright or trade secret laws. DO NOT CHANGE FOOTER! AND KEEP DISCLAIMER ON ALL SLIDES IN THE PRESENTATION. If by chance the footer is changed. Provide the upper text in the footer. Click Insert in the top menu - Click Header & Footer and change the settings under Footer
High market volatility and low visibility
Minerals Division High exposure to copper and gold => more favourable long term outlook Flattish order intake until end 2017
Cement Division Slower recovery based on shift in demand from oil-exporting to oil-importing countries Increasing utilisation rates to underpin growth over time Customer focus on both new capacity and productivity
Product Companies and Customer Services Overall stable and profitable business Mainly OPEX-related business
Customers focus on productivity and environment
Market developments for FLSmidth
Market update
11 Feb 2016 Annual Report 2015 8

Disclaimer included in Footer: The information contained or referenced in this presentation is confidential and proprietary to FLSmidth and is protected by copyright or trade secret laws. DO NOT CHANGE FOOTER! AND KEEP DISCLAIMER ON ALL SLIDES IN THE PRESENTATION. If by chance the footer is changed. Provide the upper text in the footer. Click Insert in the top menu - Click Header & Footer and change the settings under Footer
26%
21%
19%
18%
10% 6%
Revenue and order intake in 2015
Annual Report 2015
11 Feb 2016 Annual Report 2015 9
Revenue - by geography
North America
Africa
Europe
Australia
South America
Asia
32%
17% 7%
8%
5% 2%
29%
Order intake - by commodity
Cement
Coal
Iron ore
Adjacent
Copper Gold
Fertilizers
Order intake - by division
Product Companies
Minerals Cement
2015 2014 2015 2014 2015 2014 2015 2014
Customer Services
6,847
5,192
3,142
2,943
6,710
5,742
4,112
2,803
DKKm

Disclaimer included in Footer: The information contained or referenced in this presentation is confidential and proprietary to FLSmidth and is protected by copyright or trade secret laws. DO NOT CHANGE FOOTER! AND KEEP DISCLAIMER ON ALL SLIDES IN THE PRESENTATION. If by chance the footer is changed. Provide the upper text in the footer. Click Insert in the top menu - Click Header & Footer and change the settings under Footer
Financial performance in Q4 2015
Annual Report 2015
11 Feb 2016 10 Annual Report 2015
Reported numbers reflect challenging business environment and risk provisions
Organic growth in revenue -11%
One-off costs DKK 89m
Business right-sizing/efficiency (incl. discontinuation of product line)
Costs related to O&M contract in oil-exporting country
Order backlog declined DKK 1.8bn in Q4, reflecting the difference between order intake and revenue in the quarter.
Discontinuation, scope changes and run-off of O&M contracts reduced the backlog by DKK 2.5bn in 2015
Continuing activities (DKKm)
Q4 2015
Q4 2014
Change
Order intake 3,691 3,734 -1%
Revenue 5,297 5,627 -6%
Gross margin % 23.7% 22.5%
EBITA 384 419 -8%
EBITA % 7.2% 7.4%
EBITA % adjusted 8.9% 10.1%
Order backlog 14,858 17,726 -16%

Disclaimer included in Footer: The information contained or referenced in this presentation is confidential and proprietary to FLSmidth and is protected by copyright or trade secret laws. DO NOT CHANGE FOOTER! AND KEEP DISCLAIMER ON ALL SLIDES IN THE PRESENTATION. If by chance the footer is changed. Provide the upper text in the footer. Click Insert in the top menu - Click Header & Footer and change the settings under Footer
0
1,000
2,000
3,000
4,000
5,000
6,000
7,000
Q4
2013
Q1
2014
Q2
2014
Q3
2014
Q4
2014
Q1
2015
Q2
2015
Q3
2015
Q4
2015
Announced orders Unannounced orders
Stable level of unannounced orders No large orders in Q4’15
Annual Report 2015
11 Feb 2016 Annual Report 2015 11
Order intake (quarterly)
Order intake decreased 1% in Q4 2015
Unannounced orders increased in Q4’15 vs. Q4’14
DKKm
42%
32%
16%
10%
Order intake Q4 2015
– classified by segment
Customer Services
Product Companies
Cement
Minerals

Disclaimer included in Footer: The information contained or referenced in this presentation is confidential and proprietary to FLSmidth and is protected by copyright or trade secret laws. DO NOT CHANGE FOOTER! AND KEEP DISCLAIMER ON ALL SLIDES IN THE PRESENTATION. If by chance the footer is changed. Provide the upper text in the footer. Click Insert in the top menu - Click Header & Footer and change the settings under Footer
Annual Report 2015
11 Feb 2016 Annual Report 2015 12
1,938
1,451
1,407
1,098
1,920
1,473
1,126 985
Stable revenue in Customer Services and Product Companies
Revenue (quarterly)
DKKm
Revenue Q4 2015 vs. Q4 2014 - by division
Product Companies
Minerals Cement
Q4’15 Q4’14 Q4’15 Q4’14 Q4’15 Q4’14 Q4’15 Q4’14
Customer Services
Revenue declined 4% as a result of lower order intake the last two years
0
1,000
2,000
3,000
4,000
5,000
6,000
7,000
8,000
Q4
2013
Q1
2014
Q2
2014
Q3
2014
Q4
2014
Q1
2015
Q2
2015
Q3
2015
Q4
2015
DKKm

Disclaimer included in Footer: The information contained or referenced in this presentation is confidential and proprietary to FLSmidth and is protected by copyright or trade secret laws. DO NOT CHANGE FOOTER! AND KEEP DISCLAIMER ON ALL SLIDES IN THE PRESENTATION. If by chance the footer is changed. Provide the upper text in the footer. Click Insert in the top menu - Click Header & Footer and change the settings under Footer
22.5%
26.1%
16.2%
20.1%
29.5% 27.6%
15.9%
12.6%
Gross margin improvement in services and products more than offset decline in project divisions
Annual Report 2015
11 Feb 2016 Annual Report 2015 13
Gross margin
22.5% 23.7%
0%
10%
20%
30%
40%
0
200
400
600
800
1,000
1,200
1,400
1,600
Q4
2013
Q1
2014
Q2
2014
Q3
2014
Q4
2014
Q1
2015
Q2
2015
Q3
2015
Q4
2015
Gross profit (quarterly)
DKKm
Gross margin Q4 2015 vs. Q4 2014 - by division
Customer Services
Product Companies
Minerals Cement
Q4’15 Q4’14 Q4’15 Q4’14 Q4’15 Q4’14 Q4’15 Q4’14
Gross margin negatively impacted by DKK -64m one-off costs in Q4’15 (Q4’14: DKK -121m) (related to efficiency programme/business right-sizing and O&M contracts in oil-exporting countries)
Adjusted gross margin 24.9% in Q4 2015 (Q4 2014: 24.6%)
DKKm

Disclaimer included in Footer: The information contained or referenced in this presentation is confidential and proprietary to FLSmidth and is protected by copyright or trade secret laws. DO NOT CHANGE FOOTER! AND KEEP DISCLAIMER ON ALL SLIDES IN THE PRESENTATION. If by chance the footer is changed. Provide the upper text in the footer. Click Insert in the top menu - Click Header & Footer and change the settings under Footer
SG&A impacted by currency developments
Annual Report 2015
11 Feb 2016 Annual Report 2015 14
SG&A ratio*
14.3% 13.7% 15.0%
0%
3%
6%
9%
12%
15%
18%
0
200
400
600
800
1,000
1,200
Q4
2013
Q1
2014
Q2
2014
Q3
2014
Q4
2014
Q1
2015
Q2
2015
Q3
2015
Q4
2015
SG&A costs (quarterly)
DKKm
*) SG&A ratio: SG&A costs (Sales, General and Administration) as percentage of revenue
In local currencies, SG&A costs decreased 3% in Q4
Initiatives taken to further reduce costs, optimise global footprint, and to consolidate sites.
One-off costs DKK 25m in Q4 (Q4’14: DKK 26m)
Front-end loaded costs related to proposals and order intake

Disclaimer included in Footer: The information contained or referenced in this presentation is confidential and proprietary to FLSmidth and is protected by copyright or trade secret laws. DO NOT CHANGE FOOTER! AND KEEP DISCLAIMER ON ALL SLIDES IN THE PRESENTATION. If by chance the footer is changed. Provide the upper text in the footer. Click Insert in the top menu - Click Header & Footer and change the settings under Footer
0%
2%
4%
6%
8%
10%
12%
0
100
200
300
400
500
600
Q4
2013
Q1
2014
Q2
2014
Q3
2014
Q4
2014
Q1
2015
Q2
2015
Q3
2015
Q4
2015
Adjusted 10.1%
Adjusted EBITA margin Q4’15 8.9% (reported 7.2% incl. one-off costs DKK -89m)
Adjusted EBITA margin Q4’14 10.1% (reported 7.4% incl. one-off costs DKK -147m)
419 384
58 14 26
81
0
100
200
300
400
500
600
EBITA Q4'14 Change inone-off costs
Increase ingross margin
Increase inSG&A
Impact ofdecrease in
revenue
EBITA Q4'15
EBITA impacted by lower revenue in the quarter
Annual Report 2015
11 Feb 2016 Annual Report 2015 15
EBITA margin
EBITA (quarterly)
-8% vs. Q4 2014 DKKm DKKm
EBITA bridge Q4’15 vs. Q4’14
Adjusted 8.9%

Disclaimer included in Footer: The information contained or referenced in this presentation is confidential and proprietary to FLSmidth and is protected by copyright or trade secret laws. DO NOT CHANGE FOOTER! AND KEEP DISCLAIMER ON ALL SLIDES IN THE PRESENTATION. If by chance the footer is changed. Provide the upper text in the footer. Click Insert in the top menu - Click Header & Footer and change the settings under Footer
Financial performance in 2015
Annual Report 2015
11 Feb 2016 Annual Report 2015 16
Continuing activities (DKKm) 2015 2014 Change
Order intake 18,490 17,267 +7%
Revenue 19,682 20,499 -4%
Gross margin 25.1% 25.0%
EBITA 1,582 1,823 -13%
EBITA margin 8.0% 8.9%
EBITA margin adjusted 9.7% 9.7%
Financial costs net (256) (137)
Tax (282) (398)
Profit, discontinued activities (178) (68)
Profit for the year, Group 425 813 -48%
ROCE 10% 12%
Employees 12,969 14,765 -12%
Revenue -12% in local currencies due to low order intake in past couple of years
Adjusted EBITA margin 9.7% (2014: 9.7%) excl. one-off costs of DKK -321m
Tax rate 32% (2014: 31%)
Headcount impacted by sale of Cembrit (1,042 employees) and business right-sizing

Disclaimer included in Footer: The information contained or referenced in this presentation is confidential and proprietary to FLSmidth and is protected by copyright or trade secret laws. DO NOT CHANGE FOOTER! AND KEEP DISCLAIMER ON ALL SLIDES IN THE PRESENTATION. If by chance the footer is changed. Provide the upper text in the footer. Click Insert in the top menu - Click Header & Footer and change the settings under Footer
EBITA declined from 2014 to 2015 due to higher one-off costs and lower revenue, partly offset by an improvement in the underlying gross margin
Adjusted EBITA margin 2015: 9.7% (reported 8.0% incl. non-recurring costs DKK -321m)
Adjusted EBITA margin 2014: 9.7% (reported 8.9% incl. non-recurring costs DKK -175m)
EBITA margin 8.0% in 2015
Annual Report 2015
11 Feb 2016 Annual Report 2015 17
DKKm
EBITA bridge 2015 vs. 2014
1,823
1,582
172 146
60
207
1,400
1,500
1,600
1,700
1,800
1,900
EBITA 2014 Change inone-off costs
Increase ingross margin
Increase inSG&A
Impact ofdecrease in
revenue
EBITA 2015

Disclaimer included in Footer: The information contained or referenced in this presentation is confidential and proprietary to FLSmidth and is protected by copyright or trade secret laws. DO NOT CHANGE FOOTER! AND KEEP DISCLAIMER ON ALL SLIDES IN THE PRESENTATION. If by chance the footer is changed. Provide the upper text in the footer. Click Insert in the top menu - Click Header & Footer and change the settings under Footer
Annual Report 2015
11 Feb 2016 Annual Report 2015 18
NWC impacted by reduction in prepayments
NWC increased by DKK 0.3bn to DKK 2,583m in 2015
A combined reduction in inventories and trade receivables from 2014 to 2015 of DKK 0.3bn was more than offset by a reduction in net prepayments of DKK 0.6bn
0
500
1,000
1,500
2,000
2,500
3,000
3,500
Q4'13 Q1'14 Q2'14 Q3'14 Q4'14 Q1'15 Q2'15 Q3'15 Q4'15
Trade Payables
0
500
1,000
1,500
2,000
2,500
3,000
Q4'13 Q1'14 Q2'14 Q3'14 Q4'14 Q1'15 Q2'15 Q3'15 Q4'15
Net prepayments
0
500
1,000
1,500
2,000
2,500
3,000
3,500
Q4'13 Q1'14 Q2'14 Q3'14 Q4'14 Q1'15 Q2'15 Q3'15 Q4'15
Inventories
-200
0
200
400
600
800
1,000
1,200
1,400
1,600
Q4'13 Q1'14 Q2'14 Q3'14 Q4'14 Q1'15 Q2'15 Q3'15 Q4'15
Net work-in-progress
0
1,000
2,000
3,000
4,000
5,000
6,000
Q4'13 Q1'14 Q2'14 Q3'14 Q4'14 Q1'15 Q2'15 Q3'15 Q4'15
Trade Receivables
All charts include Cembrit before Q4’14 and bulk material handling before Q3’15
Not overdue Overdue

Disclaimer included in Footer: The information contained or referenced in this presentation is confidential and proprietary to FLSmidth and is protected by copyright or trade secret laws. DO NOT CHANGE FOOTER! AND KEEP DISCLAIMER ON ALL SLIDES IN THE PRESENTATION. If by chance the footer is changed. Provide the upper text in the footer. Click Insert in the top menu - Click Header & Footer and change the settings under Footer
Annual Report 2015
11 Feb 2016 Annual Report 2015 19
Cash flow statement in 2015
Group (DKKm) 2015 2014
EBITDA continuing adjusted 1,878 2,118
EBITDA discontinued (289) (60)
Change in provisions 68 (431)
Change in NWC*) (733) 168
Financial payments (50) (86)
Taxes paid (338) (411)
CFFO (Group) 538 1,298
CFFO (continuing activities) 991 1,178
CFFI excl. acquisitions & disposals (123) (414)
Acquisitions & disposals 873 (184)
CFFI 750 (598)
Free cash flow 1,288 700
CFFO declined in 2015 mainly due to lower adjusted EBITDA and negative impact from NWC
EBITDA from discontinued activities impacted cash flow by DKK -289m in 2015 (2014: DKK -60m)
Positive free cash flow attributable to divestment of Cembrit and a modest level of ‘ordinary’ investments
*) Cash flow effect from NWC includes discontinued activities and is
adjusted for currency effects

Disclaimer included in Footer: The information contained or referenced in this presentation is confidential and proprietary to FLSmidth and is protected by copyright or trade secret laws. DO NOT CHANGE FOOTER! AND KEEP DISCLAIMER ON ALL SLIDES IN THE PRESENTATION. If by chance the footer is changed. Provide the upper text in the footer. Click Insert in the top menu - Click Header & Footer and change the settings under Footer
Annual Report 2015
11 Feb 2016 Annual Report 2015 20
1148
1720
-157
1298
538
-500
0
500
1000
1500
2000
2011 2012 2013 2014 2015
Free cash flow highest in last five years - Supported by divestment of Cembrit
CFFO (annual)
DKKm
Free cash flow (annual) DKKm
-3000
-2500
-2000
-1500
-1000
-500
0
500
1000
1500
2011 2012 2013 2014 2015
Acquisitions & disposals
FCF excl. acquisitions and disposals
Disclaimer included in Footer: The information contained or referenced in this presentation is confidential and proprietary to FLSmidth and is protected by copyright or trade secret laws. DO NOT CHANGE FOOTER! AND KEEP DISCLAIMER ON ALL SLIDES IN THE PRESENTATION. If by chance the footer is changed. Provide the upper text in the footer. Click Insert in the top menu - Click Header & Footer and change the settings under Footer
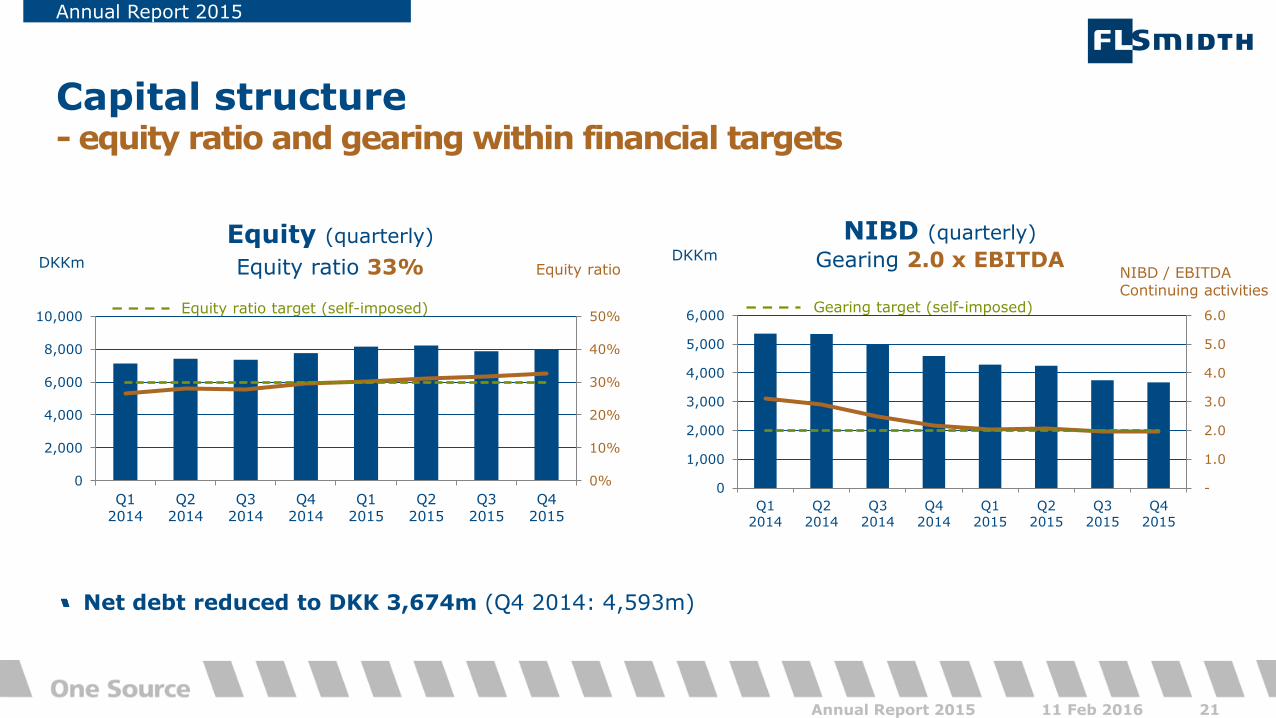
Capital structure - equity ratio and gearing within financial targets
Annual Report 2015
11 Feb 2016 Annual Report 2015 21
NIBD (quarterly) DKKm Gearing 2.0 x EBITDA
Gearing target (self-imposed)
0%
10%
20%
30%
40%
50%
0
2,000
4,000
6,000
8,000
10,000
Q12014
Q22014
Q32014
Q42014
Q12015
Q22015
Q32015
Q42015
Equity (quarterly)
DKKm Equity ratio Equity ratio 33%
Equity ratio target (self-imposed)
NIBD / EBITDA Continuing activities
*) Last 12 months EBITDA
Net debt reduced to DKK 3,674m (Q4 2014: 4,593m)
-
1.0
2.0
3.0
4.0
5.0
6.0
0
1,000
2,000
3,000
4,000
5,000
6,000
Q1
2014
Q2
2014
Q3
2014
Q4
2014
Q1
2015
Q2
2015
Q3
2015
Q4
2015

Disclaimer included in Footer: The information contained or referenced in this presentation is confidential and proprietary to FLSmidth and is protected by copyright or trade secret laws. DO NOT CHANGE FOOTER! AND KEEP DISCLAIMER ON ALL SLIDES IN THE PRESENTATION. If by chance the footer is changed. Provide the upper text in the footer. Click Insert in the top menu - Click Header & Footer and change the settings under Footer
ROCE 10% in 2015 (2014: 12%)
Reaching the 20% ROCE target requires an increase in EBITA to around DKK 3bn through a combination of top-line growth and margin expansion
Return on capital employed
Annual Report 2015
11 Feb 2016 Annual Report 2015 22
ROCE* Average capital employed
DKKm
0%
5%
10%
15%
20%
25%
30%
0
3,000
6,000
9,000
12,000
15,000
18,000
2011 2012 2013 2014 2015
ROCE
10% in 2015
*) ROCE: Return on capital employed calculated on a before tax basis, including goodwill and based on last 12 months’ EBITA and average capital employed
ROCE target
Disclaimer included in Footer: The information contained or referenced in this presentation is confidential and proprietary to FLSmidth and is protected by copyright or trade secret laws. DO NOT CHANGE FOOTER! AND KEEP DISCLAIMER ON ALL SLIDES IN THE PRESENTATION. If by chance the footer is changed. Provide the upper text in the footer. Click Insert in the top menu - Click Header & Footer and change the settings under Footer
Dividend
11 Feb 2016 Annual Report 2015 23
0.0%
1.0%
2.0%
3.0%
4.0%
5.0%
6.0%
0
2
4
6
8
10
12
2011 2012 2013 2014 2015
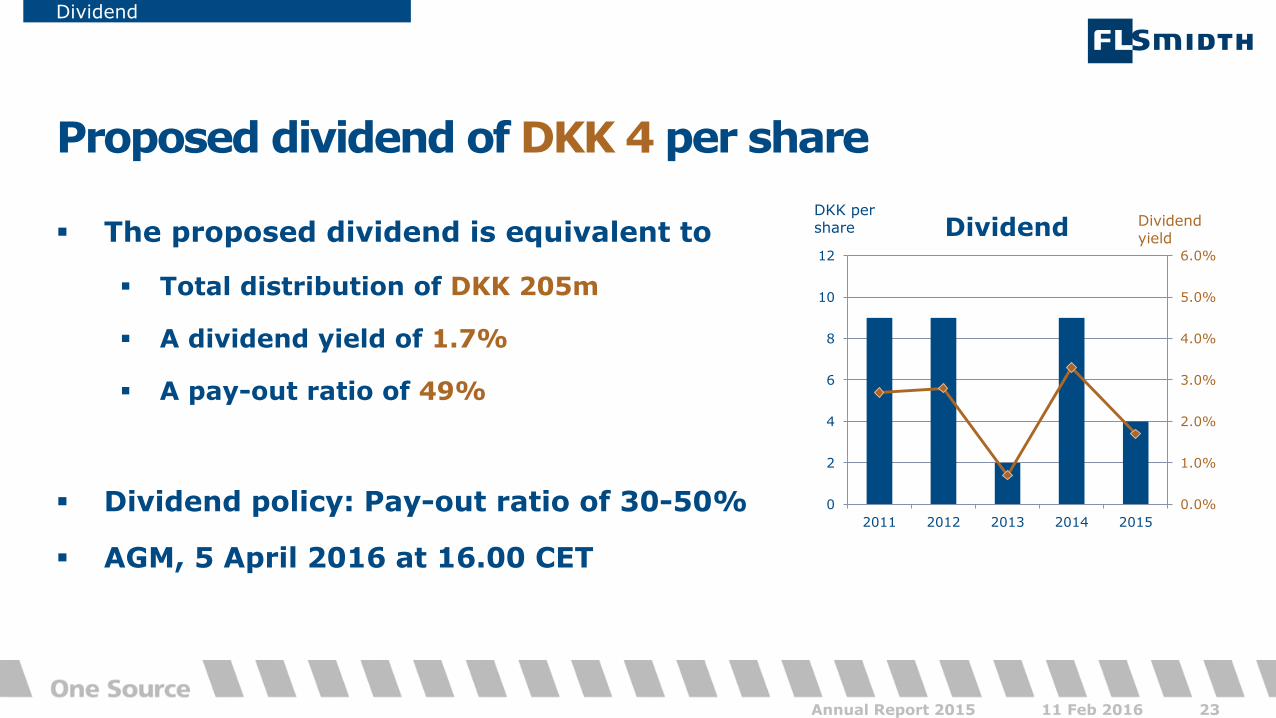
Proposed dividend of DKK 4 per share
The proposed dividend is equivalent to
Total distribution of DKK 205m
A dividend yield of 1.7%
A pay-out ratio of 49%
Dividend policy: Pay-out ratio of 30-50%
AGM, 5 April 2016 at 16.00 CET
Dividend DKK per share Dividend
yield
Disclaimer included in Footer: The information contained or referenced in this presentation is confidential and proprietary to FLSmidth and is protected by copyright or trade secret laws. DO NOT CHANGE FOOTER! AND KEEP DISCLAIMER ON ALL SLIDES IN THE PRESENTATION. If by chance the footer is changed. Provide the upper text in the footer. Click Insert in the top menu - Click Header & Footer and change the settings under Footer
Guidance
11 Feb 2016 Annual Report 2015 24
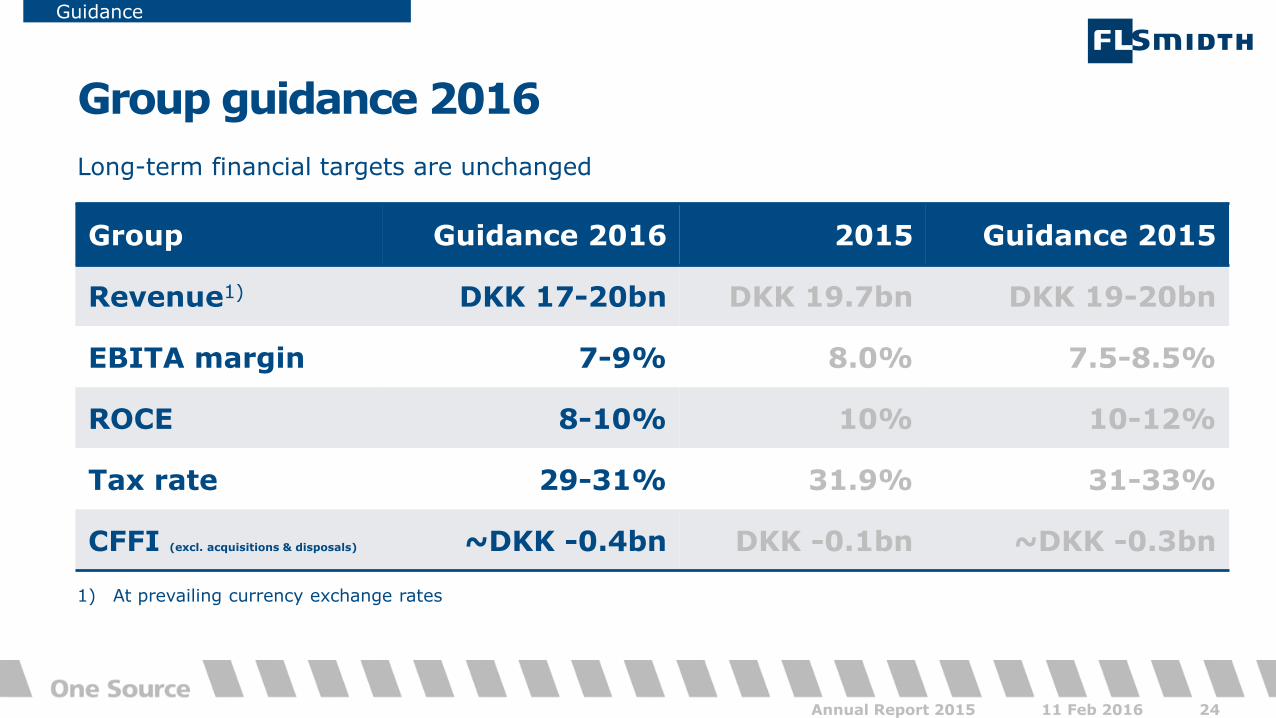
Group Guidance 2016 2015 Guidance 2015
Revenue1) DKK 17-20bn DKK 19.7bn DKK 19-20bn
EBITA margin 7-9% 8.0% 7.5-8.5%
ROCE 8-10% 10% 10-12%
Tax rate 29-31% 31.9% 31-33%
CFFI (excl. acquisitions & disposals) ~DKK -0.4bn DKK -0.1bn ~DKK -0.3bn
Group guidance 2016 Long-term financial targets are unchanged
1) At prevailing currency exchange rates

Disclaimer included in Footer: The information contained or referenced in this presentation is confidential and proprietary to FLSmidth and is protected by copyright or trade secret laws. DO NOT CHANGE FOOTER! AND KEEP DISCLAIMER ON ALL SLIDES IN THE PRESENTATION. If by chance the footer is changed. Provide the upper text in the footer. Click Insert in the top menu - Click Header & Footer and change the settings under Footer
Key highlights – Annual Report 2015
11 Feb 2016 Annual Report 2015 25
2015
• Order intake up 7% despite challenging market conditions
• Revenue and EBITA-margin in line with guidance
• Products and services provide a stable and profitable business
• Positive free cash flow reduced net debt by DKK 0.9bn
2016
• EBITA-margin guidance of 7-9% reflects low visibility and investments in people
Disclaimer included in Footer: The information contained or referenced in this presentation is confidential and proprietary to FLSmidth and is protected by copyright or trade secret laws. DO NOT CHANGE FOOTER! AND KEEP DISCLAIMER ON ALL SLIDES IN THE PRESENTATION. If by chance the footer is changed. Provide the upper text in the footer. Click Insert in the top menu - Click Header & Footer and change the settings under Footer
Questions & Answers
11 Feb 2016 26 Annual Report 2015

Disclaimer included in Footer: The information contained or referenced in this presentation is confidential and proprietary to FLSmidth and is protected by copyright or trade secret laws. DO NOT CHANGE FOOTER! AND KEEP DISCLAIMER ON ALL SLIDES IN THE PRESENTATION. If by chance the footer is changed. Provide the upper text in the footer. Click Insert in the top menu - Click Header & Footer and change the settings under Footer
Forward-looking statements
Interim Report Q3 2015
11 Feb 2016 Annual Report 2015 27
FLSmidth & Co. A/S’ financial reports, whether in the form of annual reports or interim reports, filed with the Danish Business Authority and/or announced via the company’s website and/or NASDAQ OMX Copenhagen, as well as any presentations based on such financial reports, and any other written information released, or oral statements made, to the public based on this interim report or in the future on behalf of FLSmidth & Co. A/S, may contain forward-looking statements. Words such as ‘believe’, ‘expect’, ‘may’, ‘will’, ‘plan’, ‘strategy’, ‘prospect’, ‘foresee’, ‘estimate’, ‘project’, ‘anticipate’, ‘can’, ‘intend’, ‘target’ and other words and terms of similar meaning in connection with any discussion of future operating or financial performance identify forward-looking statements. Examples of such forward-looking statements include, but are not limited to: • statements of plans, objectives or goals for future operations, including those related to FLSmidth & Co. A/S markets, products, product research and product
development • statements containing projections of or targets for revenues, profit (or loss), capital expenditures, dividends, capital structure or other net financial items • statements regarding future economic performance, future actions and outcome of contingencies such as legal proceedings and statements regarding the underlying
assumptions or relating to such statements • statements regarding potential merger & acquisition activities. These forward-looking statements are based on current plans, estimates and projections. By their very
nature, forward-looking statements involve inherent risks and uncertainties, both general and specific, which may be outside FLSmidth & Co. A/S’s influence, and which could materially affect such forward-looking statements.
FLSmidth & Co. A/S cautions that a number of important factors, including those described in this presentation, could cause actual results to differ materially from those contemplated in any forward-looking statements. Factors that may affect future results include, but are not limited to, global as well as local political and economic conditions, including interest rate and exchange rate fluctuations, delays or faults in project execution, fluctuations in raw material prices, delays in research and/or development of new products or service concepts, interruptions of supplies and production, unexpected breach or termination of contracts, market-driven price reductions for FLSmidth & Co. A/S’ products and/or services, introduction of competing products, reliance on information technology, FLSmidth & Co. A/S’ ability to successfully market current and new products, exposure to product liability and legal proceedings and investigations, changes in legislation or regulation and interpretation thereof, intellectual property protection, perceived or actual failure to adhere to ethical marketing practices, investments in and divestitures of domestic and foreign enterprises, unexpected growth in costs and expenses, failure to recruit and retain the right employees and failure to maintain a culture of compliance. Unless required by law FLSmidth & Co. A/S is under no duty and undertakes no obligation to update or revise any forward-looking statement after the distribution of this presentation.

Disclaimer included in Footer: The information contained or referenced in this presentation is confidential and proprietary to FLSmidth and is protected by copyright or trade secret laws. DO NOT CHANGE FOOTER! AND KEEP DISCLAIMER ON ALL SLIDES IN THE PRESENTATION. If by chance the footer is changed. Provide the upper text in the footer. Click Insert in the top menu - Click Header & Footer and change the settings under Footer
11 Feb 2016 Annual Report 2015 28
Backup slides Next update: Annual General Meeting: 5 April 2016 1st Quarter interim report: 18 May 2016 Follow us on Twitter and LinkedIn

Disclaimer included in Footer: The information contained or referenced in this presentation is confidential and proprietary to FLSmidth and is protected by copyright or trade secret laws. DO NOT CHANGE FOOTER! AND KEEP DISCLAIMER ON ALL SLIDES IN THE PRESENTATION. If by chance the footer is changed. Provide the upper text in the footer. Click Insert in the top menu - Click Header & Footer and change the settings under Footer
Long-term financial targets
11 Feb 2016 Annual Report 2015 29
Long-term financial targets unchanged
Group long-term financial targets
Annual revenue growth Above market average
EBITA margin 10-13%
ROCE* >20%
Tax rate 32-34%
Equity ratio >30%
Financial gearing (NIBD/EBITDA) <2
Pay-out ratio 30-50% *) ROCE: Return on capital employed calculated on a before tax basis as EBITA divided by average Capital Employed including goodwill
Disclaimer included in Footer: The information contained or referenced in this presentation is confidential and proprietary to FLSmidth and is protected by copyright or trade secret laws. DO NOT CHANGE FOOTER! AND KEEP DISCLAIMER ON ALL SLIDES IN THE PRESENTATION. If by chance the footer is changed. Provide the upper text in the footer. Click Insert in the top menu - Click Header & Footer and change the settings under Footer
Long-term financial targets
11 Feb 2016 Annual Report 2015 30
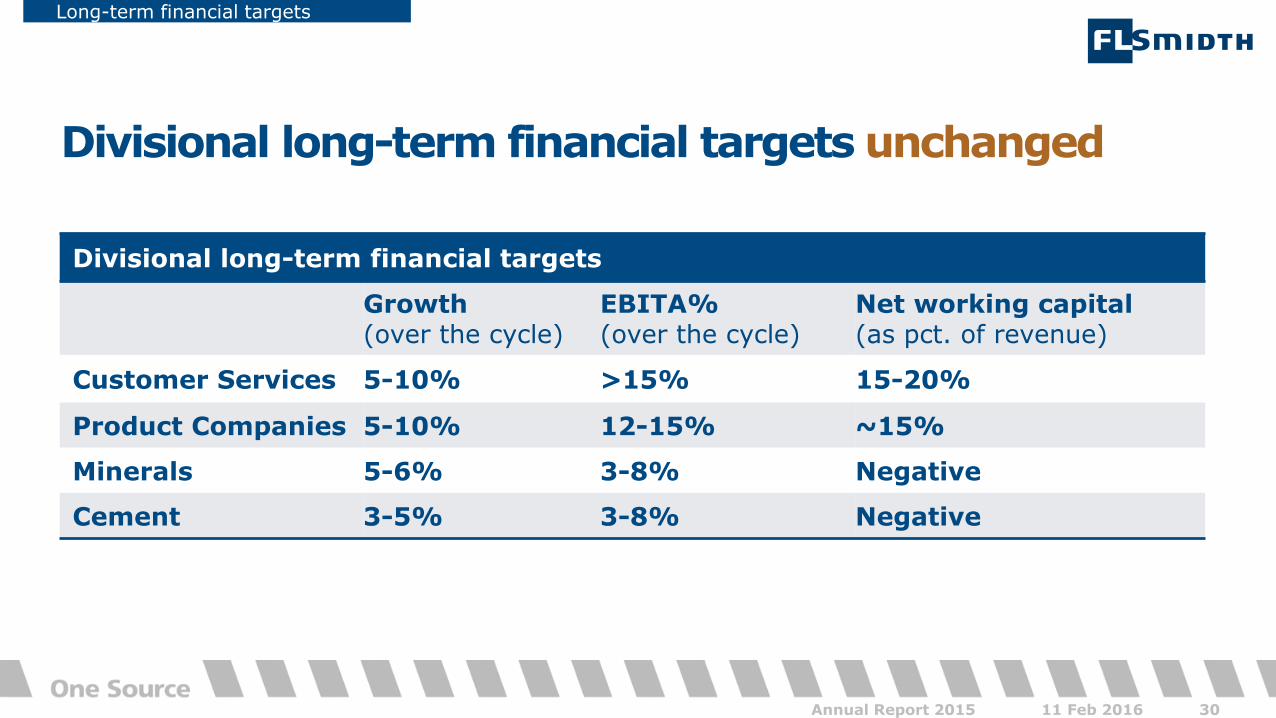
Divisional long-term financial targets unchanged
Divisional long-term financial targets
Growth (over the cycle)
EBITA% (over the cycle)
Net working capital (as pct. of revenue)
Customer Services 5-10% >15% 15-20%
Product Companies 5-10% 12-15% ~15%
Minerals 5-6% 3-8% Negative
Cement 3-5% 3-8% Negative

Disclaimer included in Footer: The information contained or referenced in this presentation is confidential and proprietary to FLSmidth and is protected by copyright or trade secret laws. DO NOT CHANGE FOOTER! AND KEEP DISCLAIMER ON ALL SLIDES IN THE PRESENTATION. If by chance the footer is changed. Provide the upper text in the footer. Click Insert in the top menu - Click Header & Footer and change the settings under Footer
11 Feb 2016 Annual Report 2015 31
Customer Services
Customer Services
(DKKm) Q4
2015 Q4
2014 Change 2015 2014 Change
Order intake 1,655 1,580 5% 6,710 6,847 -2%
Order backlog 2,469 3,575 -31% 2,469 3,575 -31%
Revenue 1,920 1,938 -1% 7,294 7,061 3%
Gross profit margin 29.6% 22.5% 28.9% 28.1%
EBITDA 305 222 37% 1,056 1,060 0%
EBITA 279 197 42% 951 968 -2%
EBITA margin 14.5% 10.2% 13.0% 13.7%
EBIT 240 150 60% 790 827 -4%
EBIT margin 12.5% 7.7% 11.7%

Disclaimer included in Footer: The information contained or referenced in this presentation is confidential and proprietary to FLSmidth and is protected by copyright or trade secret laws. DO NOT CHANGE FOOTER! AND KEEP DISCLAIMER ON ALL SLIDES IN THE PRESENTATION. If by chance the footer is changed. Provide the upper text in the footer. Click Insert in the top menu - Click Header & Footer and change the settings under Footer
11 Feb 2016 Annual Report 2015 32
Organic order intake growth of -1%
EBITA margin in Q4’14 impacted by DKK -90m related to delay of the now terminated O&M contract
Customer Services
Customer Services
0
500
1,000
1,500
2,000
2,500
Q4
2013
Q1
2014
Q2
2014
Q3
2014
Q4
2014
Q1
2015
Q2
2015
Q3
2015
Q4
2015
Order intake (quarterly)
5% vs. Q4 2014 DKKm
Revenue (quarterly)
DKKm EBITA margin -1% vs. Q4 2014
0%
4%
8%
12%
16%
20%
0
500
1,000
1,500
2,000
2,500
Q4
2013
Q1
2014
Q2
2014
Q3
2014
Q4
2014
Q1
2015
Q2
2015
Q3
2015
Q4
2015

Disclaimer included in Footer: The information contained or referenced in this presentation is confidential and proprietary to FLSmidth and is protected by copyright or trade secret laws. DO NOT CHANGE FOOTER! AND KEEP DISCLAIMER ON ALL SLIDES IN THE PRESENTATION. If by chance the footer is changed. Provide the upper text in the footer. Click Insert in the top menu - Click Header & Footer and change the settings under Footer
11 Feb 2016 Annual Report 2015 33
Product Companies
Product Companies
(DKKm) Q4
2015 Q4
2014 Change 2015 2014 Change
Order intake 1,252 1,194 5% 5,742 5,192 11%
Order backlog 2,536 2,667 -5% 2,536 2,667 -5%
Revenue 1,473 1,451 2% 5,711 5,523 3%
Gross profit margin 27.5% 26.1% 28.9% 28.3%
EBITDA 205 160 28% 849 774 10%
EBITA 184 138 33% 756 672 13%
EBITA margin 12.5% 9.5% 13.2% 12.2%
EBIT 166 119 39% 689 596
EBIT margin 11.3% 8.2% 12.1% 10.8%

Disclaimer included in Footer: The information contained or referenced in this presentation is confidential and proprietary to FLSmidth and is protected by copyright or trade secret laws. DO NOT CHANGE FOOTER! AND KEEP DISCLAIMER ON ALL SLIDES IN THE PRESENTATION. If by chance the footer is changed. Provide the upper text in the footer. Click Insert in the top menu - Click Header & Footer and change the settings under Footer
11 Feb 2016 Annual Report 2015 34
Organic order intake growth of 3%
Product Companies
Product Companies
Revenue (quarterly)
DKKm EBITA margin
2% vs. Q4 2014
0%
2%
4%
6%
8%
10%
12%
14%
16%
18%
0
200
400
600
800
1,000
1,200
1,400
1,600
1,800
Q4
2013
Q1
2014
Q2
2014
Q3
2014
Q4
2014
Q1
2015
Q2
2015
Q3
2015
Q4
2015
0
200
400
600
800
1,000
1,200
1,400
1,600
1,800
Q42013
Q12014
Q22014
Q32014
Q42014
Q12015
Q22015
Q32015
Q42015
Order intake (quarterly)
+5% vs. Q4 2014 DKKm

Disclaimer included in Footer: The information contained or referenced in this presentation is confidential and proprietary to FLSmidth and is protected by copyright or trade secret laws. DO NOT CHANGE FOOTER! AND KEEP DISCLAIMER ON ALL SLIDES IN THE PRESENTATION. If by chance the footer is changed. Provide the upper text in the footer. Click Insert in the top menu - Click Header & Footer and change the settings under Footer
11 Feb 2016 Annual Report 2015 35
Minerals
Minerals
(DKKm) Q4
2015 Q4
2014 Change 2015 2014 Change
Order intake 630 604 4% 4,112 3,142 31%
Order backlog 4,614 4,298 7% 4,614 4,298 7%
Revenue 1,126 1,407 -20% 3,576 4,933 -28%
Gross profit margin 15.9% 16.2% 16.3% 18.6%
EBITDA (10) 35 (193) 72
EBITA (32) 17 (258) 11
EBITA margin -2.8% 1.2% -7.2 0.2%
EBIT (70) (50) (424) (153)
EBIT margin -6.2% -3.6% -3.1%

Disclaimer included in Footer: The information contained or referenced in this presentation is confidential and proprietary to FLSmidth and is protected by copyright or trade secret laws. DO NOT CHANGE FOOTER! AND KEEP DISCLAIMER ON ALL SLIDES IN THE PRESENTATION. If by chance the footer is changed. Provide the upper text in the footer. Click Insert in the top menu - Click Header & Footer and change the settings under Footer
11 Feb 2016 Annual Report 2015 36
0
500
1,000
1,500
2,000
2,500
Q42013
Q12014
Q22014
Q32014
Q42014
Q12015
Q22015
Q32015
Q42015
Organic order intake growth of 3%
EBITA result negatively impacted by one-off costs related to efficiency and right-sizing activities
Material Handling legacy projects amounted to 7 (Q3’15: 8) with a total order backlog of DKK 147m (Q3’15: DKK 138m)
Minerals
Minerals
Revenue (quarterly)
DKKm EBITA margin -20% vs. Q4 2014
Order intake (quarterly)
4% vs. Q4 2014 DKKm
Announced orders Unannounced orders
-20%
-10%
0%
10%
20%
30%
-2,000
-1,000
0
1,000
2,000
3,000
Q4
2013
Q1
2014
Q2
2014
Q3
2014
Q4
2014
Q1
2015
Q2
2015
Q3
2015
Q4
2015

Disclaimer included in Footer: The information contained or referenced in this presentation is confidential and proprietary to FLSmidth and is protected by copyright or trade secret laws. DO NOT CHANGE FOOTER! AND KEEP DISCLAIMER ON ALL SLIDES IN THE PRESENTATION. If by chance the footer is changed. Provide the upper text in the footer. Click Insert in the top menu - Click Header & Footer and change the settings under Footer
11 Feb 2016 Annual Report 2015 37
Cement
Cement
(DKKm) Q4
2015 Q4
2014 Change 2015 2014 Change
Order intake 396 547 -28% 2,803 2,943 -5%
Order backlog 5,852 7,768 -25% 5,852 7,768 -25%
Revenue 985 1,098 -10% 3,911 3,951 -1%
Gross profit margin 12.5% 20.1% 15.4% 16.7%
EBITDA (15) 71 132 203 -35%
EBITA (29) 64 99 181 -45%
EBITA margin -3.0% 5.8% 2.5% 4.6%
EBIT (39) 52 52 155 -66%
EBIT margin -3.9% 4.7% 1.3% 3.9%

Disclaimer included in Footer: The information contained or referenced in this presentation is confidential and proprietary to FLSmidth and is protected by copyright or trade secret laws. DO NOT CHANGE FOOTER! AND KEEP DISCLAIMER ON ALL SLIDES IN THE PRESENTATION. If by chance the footer is changed. Provide the upper text in the footer. Click Insert in the top menu - Click Header & Footer and change the settings under Footer
11 Feb 2016 Annual Report 2015 38
0
500
1,000
1,500
Q42013
Q12014
Q22014
Q32014
Q42014
Q12015
Q22015
Q32015
Q42015
Order intake decreased due to lack of large orders
Revenue declined as result of lower order intake last two years
EBITA impacted by one-off costs of DKK -48m in Q4’15 related to O&M contracts in oil-exporting countries as well as execution of low margin orders – adjusted EBITA margin in Q4: +1.9%
Cement
Cement
Revenue (quarterly)
DKKm EBITA margin -10% vs. Q4 2014
Order intake (quarterly)
-28% vs. Q4 2014 DKKm
Announced orders Unannounced orders
-10%
-5%
0%
5%
10%
15%
-1,000
-500
0
500
1,000
1,500
Q4
2013
Q1
2014
Q2
2014
Q3
2014
Q4
2014
Q1
2015
Q2
2015
Q3
2015
Q4
2015

Disclaimer included in Footer: The information contained or referenced in this presentation is confidential and proprietary to FLSmidth and is protected by copyright or trade secret laws. DO NOT CHANGE FOOTER! AND KEEP DISCLAIMER ON ALL SLIDES IN THE PRESENTATION. If by chance the footer is changed. Provide the upper text in the footer. Click Insert in the top menu - Click Header & Footer and change the settings under Footer
Cash flow statement in Q4 2015
Annual Report 2015
11 Feb 2016 39 Annual Report 2015
Group (DKKm) Q4 2015 Q4 2014
EBITDA adjusted 295 483
Change in provisions (62) (91)
Change in NWC (74) 475
Financial payments 24 (68)
Taxes paid (35) (60)
CFFO (Group) 148 739
CFFI excl. acquisitions & disposals (32) (221)
Acquisitions & disposals 52 4
CFFI 20 (217)
Free cash flow (FCF) 168 522
CFFO down from Q4’14 due to lower EBITDA and no positive contribution from change in NWC
Despite modest CFFO in Q4’15, a positive free cash flow was achieved through a prudent investment level and DKK 52m contribution from disposals

Disclaimer included in Footer: The information contained or referenced in this presentation is confidential and proprietary to FLSmidth and is protected by copyright or trade secret laws. DO NOT CHANGE FOOTER! AND KEEP DISCLAIMER ON ALL SLIDES IN THE PRESENTATION. If by chance the footer is changed. Provide the upper text in the footer. Click Insert in the top menu - Click Header & Footer and change the settings under Footer
Working capital improved slightly in Q4
Annual Report 2015
11 Feb 2016 Annual Report 2015 40
Net working capital continuing activities DKKm
Net working capital developments in Q4´15
DKKm continuing activities
End Q4 2015 End Q3 2015
Change Change - currency adjusted
Inventories 2,445 2,517 -72 -120
Trade Receivables
4,884 4,476 +408 +368
Trade Payables
-2,546 -2,296 -250 -233
WIP Assets net 73 176 -103 -111
Prepayments net -920 -1,333 +413 +422
Other -1,353 -914 -439 -439
NWC total 2,583 2,626 -43 -113
-
500
1,000
1,500
2,000
2,500
3,000
3,500
Q4
2013
Q1
2014
Q2
2014
Q3
2014
Q4
2014
Q1
2015
Q2
2015
Q3
2015
Q4
2015
Current level is related to market situation in minerals and O&M contracts in oil-exporting countries
NWC 12.3% of revenue on average in 2015 (target over the cycle: <10%)

Disclaimer included in Footer: The information contained or referenced in this presentation is confidential and proprietary to FLSmidth and is protected by copyright or trade secret laws. DO NOT CHANGE FOOTER! AND KEEP DISCLAIMER ON ALL SLIDES IN THE PRESENTATION. If by chance the footer is changed. Provide the upper text in the footer. Click Insert in the top menu - Click Header & Footer and change the settings under Footer
Annual Report 2015
11 Feb 2016 Annual Report 2015 41
Growth Customer Services
Product Companies
Minerals Cement Group
Growth (currency adj.)
-1% +3% +3% -31% -5%
Currency effect
+6% +2% +1% +3% 4%
Total +5% +5% +4% -28% -1%
Order intake growth Q4 2015 vs. Q4 2014
Order intake by segment
42%
32%
16%
10%
Order intake Q4 2015
– classified by segment
Customer Services
Product Companies
Cement
Minerals

Disclaimer included in Footer: The information contained or referenced in this presentation is confidential and proprietary to FLSmidth and is protected by copyright or trade secret laws. DO NOT CHANGE FOOTER! AND KEEP DISCLAIMER ON ALL SLIDES IN THE PRESENTATION. If by chance the footer is changed. Provide the upper text in the footer. Click Insert in the top menu - Click Header & Footer and change the settings under Footer
Annual Report 2015
11 Feb 2016 Annual Report 2015 42
35%
27%
20%
18%
Product Companies
Minerals
Growth Customer Services
Product Companies
Minerals Cement Group
Growth (currency adj.)
-7% -2% -25% -15% -11%
Currency effect
6% 4% 5% 5% 5%
Total -1% 2% -20% -10% -6%
Revenue growth Q4’15 vs. Q4’14
Revenue by segment
Revenue Q4 2015
– classified by segment
Customer Services Cement

Disclaimer included in Footer: The information contained or referenced in this presentation is confidential and proprietary to FLSmidth and is protected by copyright or trade secret laws. DO NOT CHANGE FOOTER! AND KEEP DISCLAIMER ON ALL SLIDES IN THE PRESENTATION. If by chance the footer is changed. Provide the upper text in the footer. Click Insert in the top menu - Click Header & Footer and change the settings under Footer
Minerals EBITA improvement
11 Feb 2016 Annual Report 2015 43
Order backlog and conversion to revenue
0.00
0.10
0.20
0.30
0.40
0.50
0.60
0.70
0.80
0.90
1.00
0
5,000
10,000
15,000
20,000
25,000
Q4 2013 Q1 2014 Q2 2014 Q3 2014 Q4 2014 Q1 2015 Q2 2015 Q3 2015 Q4 2015
Order backlog (quarterly)
-16% vs. Q4 2014 DKKm
Order backlog/Revenue
*Order backlog divided by last 12 months revenue
Expected backlog conversion to revenue:
69% in 2016
17% in 2017
14% in 2018 and beyond

Disclaimer included in Footer: The information contained or referenced in this presentation is confidential and proprietary to FLSmidth and is protected by copyright or trade secret laws. DO NOT CHANGE FOOTER! AND KEEP DISCLAIMER ON ALL SLIDES IN THE PRESENTATION. If by chance the footer is changed. Provide the upper text in the footer. Click Insert in the top menu - Click Header & Footer and change the settings under Footer
Revenue and order intake
Annual Report 2015
11 Feb 2016 Annual Report 2015 44
0
3,000
6,000
9,000
12,000
15,000
18,000
21,000
24,000
27,000
30,000
2011 2012 2013 2014 2015
Revenue Order intake
Disclaimer included in Footer: The information contained or referenced in this presentation is confidential and proprietary to FLSmidth and is protected by copyright or trade secret laws. DO NOT CHANGE FOOTER! AND KEEP DISCLAIMER ON ALL SLIDES IN THE PRESENTATION. If by chance the footer is changed. Provide the upper text in the footer. Click Insert in the top menu - Click Header & Footer and change the settings under Footer
Annual Report 2015
11 Feb 2016 Annual Report 2015 45
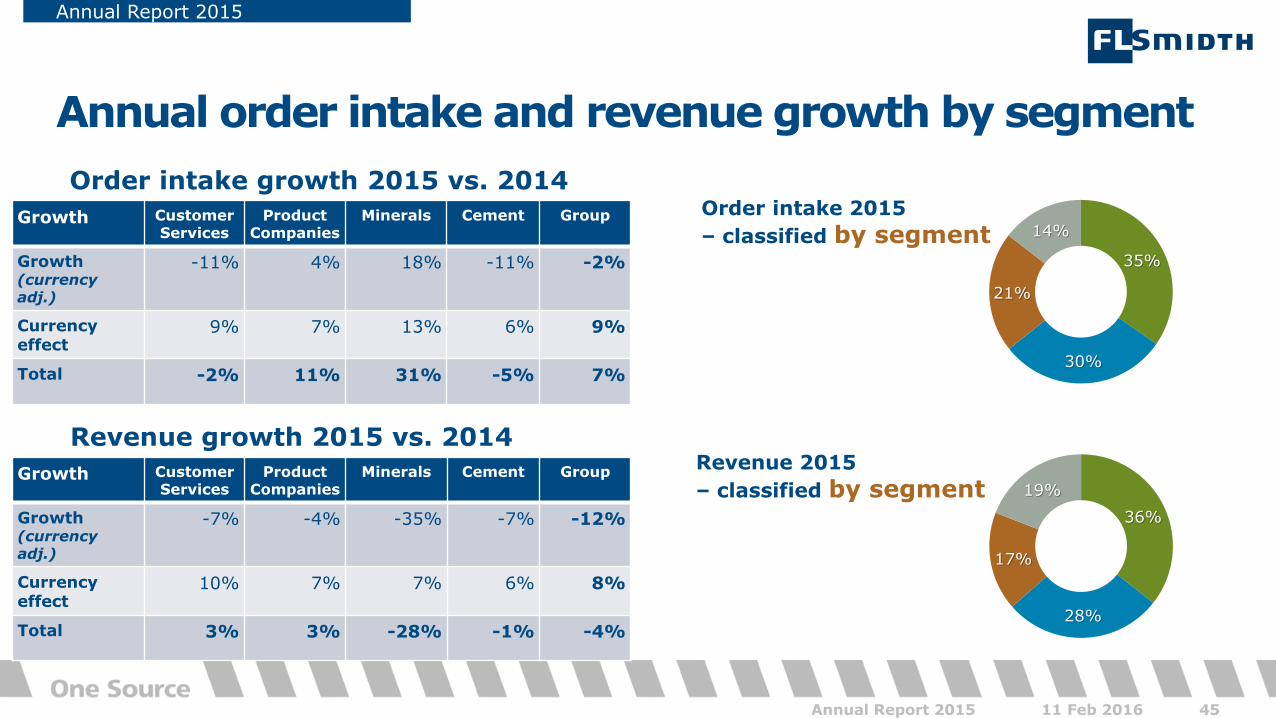
Annual order intake and revenue growth by segment Order intake growth 2015 vs. 2014
Growth Customer Services
Product Companies
Minerals Cement Group
Growth (currency adj.)
-11% 4% 18% -11% -2%
Currency effect
9% 7% 13% 6% 9%
Total -2% 11% 31% -5% 7%
Revenue growth 2015 vs. 2014
Growth Customer Services
Product Companies
Minerals Cement Group
Growth (currency adj.)
-7% -4% -35% -7% -12%
Currency effect
10% 7% 7% 6% 8%
Total 3% 3% -28% -1% -4%
35%
30%
21%
14%
Order intake 2015
– classified by segment
36%
28%
17%
19%
Revenue 2015
– classified by segment
Disclaimer included in Footer: The information contained or referenced in this presentation is confidential and proprietary to FLSmidth and is protected by copyright or trade secret laws. DO NOT CHANGE FOOTER! AND KEEP DISCLAIMER ON ALL SLIDES IN THE PRESENTATION. If by chance the footer is changed. Provide the upper text in the footer. Click Insert in the top menu - Click Header & Footer and change the settings under Footer
Annual Report 2015
11 Feb 2016 Annual Report 2015 46
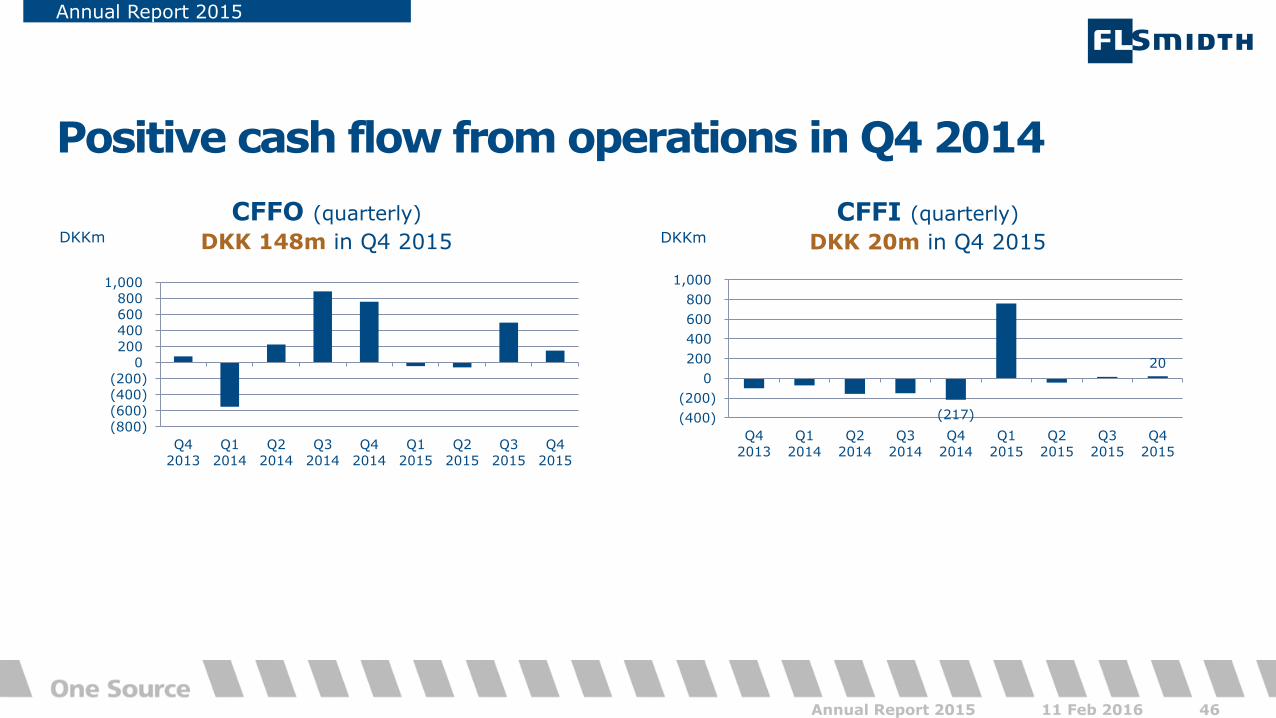
Positive cash flow from operations in Q4 2014
CFFO (quarterly) DKKm
CFFI (quarterly)
DKK 20m in Q4 2015 DKKm DKK 148m in Q4 2015
(217)
20
(400)
(200)
0
200
400
600
800
1,000
Q4
2013
Q1
2014
Q2
2014
Q3
2014
Q4
2014
Q1
2015
Q2
2015
Q3
2015
Q4
2015
(800)(600)(400)(200)
0200400600800
1,000
Q4
2013
Q1
2014
Q2
2014
Q3
2014
Q4
2014
Q1
2015
Q2
2015
Q3
2015
Q4
2015

Disclaimer included in Footer: The information contained or referenced in this presentation is confidential and proprietary to FLSmidth and is protected by copyright or trade secret laws. DO NOT CHANGE FOOTER! AND KEEP DISCLAIMER ON ALL SLIDES IN THE PRESENTATION. If by chance the footer is changed. Provide the upper text in the footer. Click Insert in the top menu - Click Header & Footer and change the settings under Footer
Annual Report 2015
11 Feb 2016 Annual Report 2015 47
Number of employees decreasing
Number of employees Q4’15 vs. Q4’14 - by segment
4,473
3,376
2,386
3,227
4,731
3,325
1,881
2,793
Customer Services
Product Companies
Mineral Processing
Cement
Q4’15 Q4’14
Total number of employees Q4’15: 12,969
Number of employees decreased by 1,796 vs. Q4’14
Decline explained by divestment of Cembrit and efficiency programme and business right-sizing
Q4’15 Q4’14 Q4’15 Q4’14 Q4’15 Q4’14

Disclaimer included in Footer: The information contained or referenced in this presentation is confidential and proprietary to FLSmidth and is protected by copyright or trade secret laws. DO NOT CHANGE FOOTER! AND KEEP DISCLAIMER ON ALL SLIDES IN THE PRESENTATION. If by chance the footer is changed. Provide the upper text in the footer. Click Insert in the top menu - Click Header & Footer and change the settings under Footer
One-off costs (DKKm) Q4'15 Q4'14 2015 2014
Efficiency programme/Business right-sizing -70 -28 -151 -88
Gain on assets sold 29 0 34 0
Costs & provisions related to O&M contracts -48 -90 -121 0
Bad debt provisions Q2'15 (Chapter 11 filings) 0 0 -83 0
Other 0 -29 0 -87
Total one-off costs -89 -147 -321 -175
Impact on Gross profit -64 -121 -201 -57
Impact on SG&A costs -25 -26 -120 -118
Gross margin reported 23.7% 22.5% 25.1% 25.0%
Gross margin adjusted for one-off costs 24.9% 24.6% 26.2% 25.3%
SG&A ratio 15.0% 13.7% 15.6% 14.7%
SG&A ratio adjusted for one-off costs 14.5% 13.3% 15.0% 14.2%
EBITA margin reported 7.2% 7.4% 8.0% 8.9%
EBITA margin adjusted for one-off costs 8.9% 10.1% 9.7% 9.7%
Impact of one-off costs in Q4’15 and 2015
One-off costs
11 Feb 2016 Annual Report 2015 48


