149
Annual report 2013 Hypo Alpe-Adria-Bank d.d. Croatia

Annual report 2013Hypo Alpe-Adria-Bank d.d.
Croatia

2 Annual Report 2013

Hypo Alpe-Adria-Bank d.d.
3Annual Report 2013
Contents
Contents
Management Board report for the year 2013 7
Responsibility for the Financial Statements 13
Independent Auditor‘s Report 14
Consolidated Income Statement 16
Consolidated Statement of Comprehensive Income 17
Consolidated Statement of Financial Position 18
Consolidated Statement of Changes in Equity 20
Consolidated Statement of Cash Flows 21
Unconsolidated Income Statement 22
Unconsolidated Statement of Comprehensive Income 23
Unconsolidated Statement of Financial Position 24
Unconsolidated Statement of Changes in Equity 26
Unconsolidated Statement of Cash Flows 27
Notes to the Financial Statements for the year ended 31 December 2013 28
Appendix to the Financial Statements 133
Branch offices in Croatia 145

4
Hypo Alpe-Adria-Bank d.d.
Annual Report 2013
The Management Board
The Management Board
Markus FerstlPresident of the Management Board*
Responsible for:Board Assistance and Strategic DevelopmentInternal AuditLegal Compliance and SecurityHuman ResourcesMarketingCorporate CommunicationsEconomic Research
Tea MartinčićMember of the Management Board*
Responsible for:Corporate BankingPublic FinanceInvestment BankingSales Planning and ControllingHypo Alpe-Adria-Leasing d.o.o.
* As of 10 February 2014 Markus Ferstl is not the President of the Management Board.
Tea Martinčić was appointed Deputy President of the Management Board as of the same date.
Hypo Alpe-Adria-Bank d.d.
5Annual Report 2013
The Management Board
Ivo BilićMember of the Management Board
Responsible for:Sales Management Retail SMEDistribution ChannelsRetail Product MarketingAffluent BankingIndividual Clients and Retail Products
Brane GolubićMember of the Management Board
Responsible for:Risk Control Credit Management Retail Risk ManagementCredit ProcessingCredit Rehabilitation

6
Hypo Alpe-Adria-Bank d.d.
Annual Report 2013
The Management Board
Joško MihićMember of the Management Board
Responsible for:Financial ControllingAccounting and Reporting Balance Sheet Management and Treasury
Slawomir Roman KoniasMember of the Management Board
Responsible for:Business TechnologyProcurementCollectionReal Estate ManagementBusiness Continuity ManagementBusiness Process ManagementProject ManagementOperationsCard Processing Centre
Hypo Alpe-Adria-Bank d.d.
7Annual Report 2013
Management Board report for the year 2013
1. Future Development of the BankHypo Alpe-Adria-Bank d.d. Zagreb (hereinafter: the Bank) is part of Hypo Alpe-Adria-Bank International AG (hereinafter: the Group), a financial group operating in the extended Alps-Adriatic region. As of end 2009 the Grope is solely owned by the Republic of Austria.
Group’s basic strategy is aimed towards its announced pri-vatization by mid 2015, in line with the requirements of the European Commission.
By the European Commission decision as of 3 September 2013, the restructuring plan of the Group has been approved, pursuant to which the Group is to sell its operating banks in the SEE including Hypo Alpe-Adria-Bank d.d. Zagreb by 30 June 2015, while the transaction should be concluded by the end of 2015. In order to follow the European Commission’s scheme the Republic of Austria as the sole owner has to esta-blish an autonomous wind-down unit, while the SEE banks together form a so called SEE Holding (the process has been concluded at the beginning of 2014).
Pursuant to the Group strategy and the environment in which it operates, the Bank is focussed on securing stable and profitable business operations with substantial improvement of success indicators – capital adequacy, client base, cost ef-ficiency, risk coverage indicators and loans to deposits ratio. With the Bank’s goal being the improvement of the portfolio quality and the profitability.
Own sources of financing will be the foundation of the Bank’s business strategy, and it will be based on strong deposits coll-ection and shall result in improved loans to deposits ratio.
The Bank shall position itself as the leading service provider thus offering high quality products and services tailored to meet the clients’ needs; it shall increase its accessibility through regional approach, good coverage by branches and ATMs network as well as through efficient use of modern distribution and sales channels. The Bank shall be reliable partner to its clients, who our competent employers shall provide with comprehensive information and consulting services.
Strategic goals are further development of a universal Bank: i) Secure stable and profitable business operations of the Bank with considerable improvement of business indicators; ii) Improve the quality of the portfolio in regard to risk and
profitability; iii) Set up a system which will be based on primary funds; iv) Become the leading service provider and set up and/or improve business cooperation with clients; v) Continue focussing on retail and SME segment, followed by public finance and corporate segments.
1.1. Review of business results 2013
During 2013, pursuant to the Hypo Alpe Adria SEE Network privatization process, which started by mid 2013, the Bank conducted internal restructuring and strategic cleansing of its balance sheet in order to secure standard risk costs in the future.
This process had a negative effect on business results at the end of the year, which the Bank easily absorbed and which included the following transactions concluded in the year 2013: i) Additional provisions for risks; due to methodolo-gy change for calculating provisions for the small lending portfolio, implementation of the new regulations in provi-sioning calculation set by the Croatian National Bank, and due to effects of pre-bankruptcy settlements; ii) The Project of reducing the share of NPLs in total placement volume and transfer to a separate company owned by the Group (with gross exposure of HRK 1.65 billion) and iii) Value adjust-ment of tangible assets and investments, primarily share in subsidiaries.
These activities, along with the risk control strategy, focussed on improving the placement quality and pricing policy based on risks, caused the most significant changes in Balance Sheet positions as per 31 December 2013 in terms of decrease of lending to clients by HRK 2.68 billion (or 11%) and sub-sequent decrease of total assets by HRK 4.50 billion (or 13%) as well as the increase of provisions for losses by HRK 913.33 million.
Due to the already mentioned process of privatization prepa-ration and cleaning of the Balance Sheet, Bank’s profit before tax, which totalled HRK 284.69 million before provisions, resulted in a net loss of HRK 501.32 million after taxes. But along with the Assets cleaning process, the Bank at the same time improved key performance indicators, reduced the share of non-performing loans, improved the loans to deposits ratio and improved the quality of loan portfolio in all seg-
Management Board report for the year 2013
Annual Report 20138
Hypo Alpe-Adria-Bank d.d.
Management Board report for the year 2013
1.2. Review of key sectors business results
Retail Banking placed more than HRK 500 million of new loans in 2013, while keeping deposits level with only slight decrease compared to 2012. During the year 2013 the Bank paid particular attention to optimizing the interest expense with aspirations of preserving the existing base of depositors. In the coming period the Bank intends to further optimize its network by opening or re-locating of existing outlets.
Also, during 2013 almost 18,000 new transaction accounts were opened and 9,000 card products were approved, with continued cooperation with several insurance companies, while the growth of mobile banking, which has been targeted as one of the priorities, has resulted in 124 percent growth and the sales of 6,450 of new services. The number of Sector’s clients as per 31 December 2013 amounted to 393,153.
The SME Department continued upgrading its operations and products in 2013. The Bank has demonstrated its ori-entation towards small businesses by acquiring 1,700 new customers, increasing the availability of SME services in 40 business centres and by a constantly steady level of loans and deposits. The newly introduced packages of transactional services to small and medium-sized enterprises have resulted in 2013 with more than 2,500 new customers packages.
Despite unfavourable economic conditions which have largely affected corporate sector, the Bank continued with its active business approach in the Corporate Sector. During 2013 the sector was still focused on strategic acquisitions of clients that represent potential for Bank’s growth, and major activities were focused on collection of primary sources, restructuring of the existing portfolio and intensifying the cooperation with existing customers by providing compre-hensive and quality services in order to maximize the reve-nue potential. In this regard, during the year 2013 the Bank approved loans amounting to HRK 3.8 billion to corporate entities. Also during the year 2013, the Bank significantly improved the quality of the loan portfolio and shortened the average remaining maturity in the segment of corporate banking. The Bank continued its engagement in projects in cooperation with the Croatian Bank for Reconstruction and Development (HBOR) and has actively participated in the implementation of a large number of HBOR‘s loan programs. Strategic course in the future will be a further diversification of the existing portfolio through new acquisitions, strengthe-ning the cooperation with existing customers, collection of primary sources and further improvement of the quality of the existing portfolio.
ments with increased coverage ratio of partly collectible or non-collectible loans with provisions, thus securing a stable and solid starting point for the privatization process with standard risk costs in the future.
Beside the portfolio cleansing, in 2013 the Bank also faced challenges in its environment and strategy, the main of which being: i) Continuation of the extremely unfavourable mac-roeconomic environment for the whole economy, including the banking sector, which consequently resulted in reduction of the lending activity, and further decrease of EURIBOR, which, along with the optimization of interest rates on prima-ry funds resulted in a milder decrease of net interest income; II) A more conservative lending policy; iii) Continued efforts on improving L/D ratio in order to ensure an adequate Balan-ce Sheet structure.
Despite a certain decrease of lending portfolio, the Bank has successfully met business challenges and remained the fifth largest bank in Croatia with the market share of 7.43 percent and total assets of HRK 30.06 billion), which is by 13.3 percent less than a year before, when it totalled HRK 34.69 billion, i.e. 8.53 percent of the market share. Also, within difficult and unfavourable marketing conditions, the Bank has had only a mild drop of net interest income of HRK 8.49 million (or 1.3%), as well as net commission income of HRK 4.65 million (or 2.1%), but it has additionally strengthened its market presence and stability, which is visible in its Capital Adequacy Ratio of 31.08 percent, one of the highest ratios on Croatian and regional banking market.
In 2013, the Bank paid special attention to managing its funding position, with the focus on preserving the adequate funding in a difficult market environment. As at 31.12.2013 the Bank’s funding obligations towards customers amounts to HRK 17.12 billion; and the L/D ratio at 31 December 2013 is 1.26.
In 2013 the Bank, adjusting to market conditions, achieved a total income of HRK 1.04 billion, which is a key indicator of its current business operations, it gained 20.000 new clients, allocated more than HRK 5,2 billion of loans, while it main-tained the retail deposits at the level of HRK 12.35 billion, while total deposits amounted to HRK 17.12 billion.
In line with its business strategy, even in 2013 the Bank con-tinued developing its operations in Croatia and has made ext-ra efforts to intensify its market presence in the continuously unfavourable market conditions.

Hypo Alpe-Adria-Bank d.d.
Annual Report 2013 9
Management Board report for the year 2013
Despite market challenges, the Balance Sheet Management and Treasury Sector fulfilled the strategic and financial goals in 2013, and successfully managed the process of restructu-ring of the balance sheet structure of the Bank. The software for optimizing the cash flow has been fully introduced, and new processes in cash management have been implemented, which resulted in more efficient operations of the Bank. In cooperation with other departments, the Sector continu-ed with educational workshops for clients on possibilities for currency and interest rate risk management as well as hedging options.
Even in a year marked with continued difficult market conditions, the Bank continued expanding its network by opening one new branch and installing new 18 new ATMs, thus demonstrating its commitment to business development in Croatia.
1.3. Plan and strategy
During 2013 the Bank has thoroughly restructured its business, setting it on a very stable foundation. Along with and independently of the continued privatization process, in 2014 the Bank will continue implementing the development strategy of the overall business and key business segments, with the primary focus on the strong support to the retail and SME sector as well as corporate and public sector. One of the main activities of the Management Board in the future will be continued improvement of the quality of new loans in all business segments, further development of the universal bank, boosting the quality of service, product management and optimization of distribution channels, with optimization of the branch network and special emphasis on profitability and growth of the customer base.
The Bank shall continuously improve its functions for risk management, the tools, processes and measures for iden-tification of risk indicators, monitoring, management and reporting of all risks, particularly credit risks, in order to further raise the level of risk management efficiency.
Pursuant to the Group restructuring plan and in line with local regulations, the Bank will consider further steps aimed at reducing the NPL portfolio. In the retail segment it will consider the sale of NPL claims to a third investor. Possible conduction of this transaction the Bank shall coordinate with Croatian National Bank completely.
The public sector is one of Bank’s strategic priorities so that the Public Finance sector continued the trend of achieving good business results in 2013, as well, which is particularly evident in the acquisition of a significant number of clients and in increased primary funding sources. Also, throughout the year the Bank was an active participant of the banking market of public tendering for capital projects, current liqui-dity, IPARD programs - infrastructure development and IPA, enabling the participation in significant development and in-vestment projects. In accordance with the dynamic business environment, Bank constantly adapts its products and servi-ces to the needs of its clients, with particular emphasis being placed on providing comprehensive financial and advisory support to public sector clients.
The added value provided to customers during the year 2013 was also a series of lectures, workshops and publications organized by the Hypo EU Desk Department, through which 355 participants were informed about funding opportunities through the EU funds. In 2014 the Sector expects continued positive growth trends in the field of collecting primary sour-ces and in placements to the public sector.
The Investment Banking Sector continued providing bro-kering and custodian service at the Hypo Alpe Adria Group level in 2013, thus providing customers with direct access to the markets of Serbia, Bosnia and Herzegovina, Slovenia and Montenegro. The volume of trading in foreign equity markets increased in 2013 by more than 70 percent as compared to the previous year, while assets under custody reached nearly HRK 31 billion (an increase of 10% compared to 2012) at the end of the year. This has confirmed the Bank’s status as one of the leaders in custodial and deposit services for pensi-on and investment funds. The Sector collected additional revenues by providing new services of dividend payments and the share capital decrease, as well as the transfer of shares of newly established companies in the Central Depository and Clearing Company. Clients’ portfolio total assets under management increased by 4.2 percent compared to the status per 31.12.2012. In 2013 assets under management of Hypo Alpe-Adria-Invest d.d. increased by 34 percent, the revenues increased by 20 percent, profits doubled compared to the year 2012, while the open investment funds under management achieved attractive yields, with the HI-Conservative being the best bond fund in the domestic market by yields.

10
Hypo Alpe-Adria-Bank d.d.
Annual Report 2013
Management Board report for the year 2013
job shedding. Despite public capex cuts, we expect invest-ments to recover gradually which would lift imports given high intensity of investments for imports. Finally, we forecast slightly higher exports on tourism receipts and a gradual ex-ternal demand recovery, but the CEFTA knock-on impact on SEE exports and fragile outlook for the key trading partners will limit export gains for a non-existent net trade contributi-on within GDP formation.
Downside risks to our view include the EC-imposed austerity (trap), pre-bankruptcy proceedings (with reported claims around 18% of GDP) morphing into a systemic risk, and interest rate spikes amid EM woes.
We see de-leveraging being a mid-term affair, as we expect private credit succumbing to financial downsizing of both borrowers and lenders. Namely, citizens’ demand for new loans (notably housing) will be restrained by weak consumer confidence given uncertain disposable income prospects. Also, we see further corporate deleveraging in response to poor earnings and subdued investment activity. Meanwhile, bank lending could be constrained by lengthy pre-bank-ruptcy process, funding cost spikes amid rating pressures, regulatory uncertainty and the EM woes. Going forth, we would not proclaim any material reversal to the general de-leveraging trend of the private sector emanating from the CNB’s supply-side measures. Rather, we believe that a multi-pronged approach could do the battle with de-leveraging: im-proving NPL resolution and broadening the base of financial institutions able to identify and fund SMEs.
As for the monetary policy, bearing in mind more years of sub-potential growth as fiscal repair is long overdue, the CNB will be rather reactive rather than pre-emptive in 2014. After all, any further monetary relaxation will highly depend on the kuna stability given that short-term debt at 30% of GDP is non-negligible despite being at lower level than in the recent years.
3. Bank‘s SubsidiariesThe Bank is the sole owner of the investment fund manage-ment company Hypo Alpe-Adria-Invest d.d., Hypo Alpe-Adria-Leasing d.o.o. and Hypo Alpe-Adria-Nekretnine d.o.o., a real estate business and clients consulting in the implemen-tation of investment projects, property management services, agency sales and renting of own property.
2. Research and Development Activities2.1. Macroeconomic Environment
Croatian GDP fell by 1.0% in 2013 largely owing to weaker personal consumption amid deteriorated labour market fundamentals, real wage decline and citizens’ de-leveraging. Economic decline was additionally fuelled by investment contraction owing to slow restructuring and deteriorated medium-term profit prospects. Besides competitiveness weaknesses of Croatian producers, exports fell due to the EU-required shipyards restructuring and off-shoring a part of SEE-directed food processing after CEFTA exit. However, net trade was still neutral to GDP headline as domestic demand weighed on imports. Furthermore, private lending activity faltered on both retail and corporate de-leveraging amid aggravated macro prospects, the CNB’s tightening of banks’ risk provisioning requirements and general trend of parent banks’ de-leveraging. At the same time deposit growth was constrained by corporate external debt repayments, lower real disposable income of households and rising joblessness.
Total assets of domestic banks (Croatian National Bank, audited data as at December 31st 2013) totalled HRK 398.1 billion, i.e. 121.3 percent of GDP. As soft economic data has scuppered hopes in H2 recovery, the CNB launched a new credit model including a 1.5 pp mandatory reserve cut to 12%. Given on one hand hefty USD bond conversions and on the other monetary transmission impeded by de-leveraging, it is apparent that a classic MR liquidity bulge had to be avoided in order not to induce FX positioning. Therefore, total HRK 4bn injection is sterilized via obligatory banks‘ purchase of CB-bills, which the CNB can buy-back as banks present qualified credit demand. The CNB intervened only once in 2013, in mid-April by selling EUR 215m to banks after upside pressures to the EUR/HRK prevailed after the CNB injected HRK 3.4bn into the system via EUR 450m conversion of the sovereign’s USD bond funds.
2.2. Outlook
In 2014, we see a 0.7 percent GDP decline as the accelera-ted, EC-imposed fiscal tightening will combine with private de-leveraging and soaring unemployment. Namely, personal spending stays the biggest drag given i) fiscal actions with entitlement reforms‘ knock-on effect on real disposable income and ii) state firms‘ restructuring that partly results in

Hypo Alpe-Adria-Bank d.d.
Annual Report 2013 11
Management Board report for the year 2013
Hypo Alpe-Adria-Bank dd operates reliably and as a partner, since the Bank‘s activities are based on trust, security and stability. Based on these criteria, the Bank selects its emplo-yees, from whom it expects the highest standards in terms of sustainability and excellence, not only for the Bank itself, but also for the Bank‘s products and services.
The business operations of Hypo Alpe-Adria-Bank d.d. are based on the following core values:
• Fairness – Our relationships are based on fairness and mu-tual support. The Bank tries to be a reliable and available partner also during hard times.
• Local – We are proud to be part of the regional community with customs, traditions and history in common.
• Integrity – We nurture adequate partner relations without exceptions: sincere, honest and polite. We discuss the prob-lems we face objectively in order to resolve them amicably.
• Respect and Responsibility – We respond to other people‘s needs respectfully, and we are tolerable and responsible. We accept other peoples‘ opinions and listen carefully to them in order for us to be able to identify ourselves with them. We adhere to the reached agreements and we help each other.
• Transparency – Whatever we do in business relations and relations with clients is clear and obvious. We openly pub-lish facts and procedures leading to our decisions.
The Bank requires from its employees particular responsibi-lity in compliance with regulations based on legal, regulatory and internal requirements, and has a well developed policy framework and internal controls to resolve any deviation from legal norms. The Bank applies a policy of „zero tole-rance“ towards all forms of economic crime and applies “The Fraud Prevention Program“ to combat fraud.
Bank’s employees must always act professionally and in ac-cordance with the best interests of their clients. Information they provide to customers must always be communicated in a clear and unambiguous manner to ensure honest, fair, profes-sional and transparent communication. In particular, when establishing relationships with clients or providing services to a client, proper attention must be paid to ensure that the client gets the information they needed to make reasonable decisions.
Bank’s strategic decision for 2014 is to continue expanding and optimizing its business network in order to increase its market presence and acquire new clients. In line with this, the Bank shall continue with intensive efforts on developing new and further improvement of the existing products, inclu-ding alternative distribution channels, primarily the conti-nued development of the successful mobile banking platform ‘m-hypo’ and development in the card business segment.
4. Policies regarding Risk Management Bank‘s policies regarding risk management are presented in detail in the note 39 Risk Management to the financial statements.
5. Exposure to Credit Risk and Liquidity RiskBank‘s exposures to credit and liquidity risk are presented in detail in the note 39 Risk Management to the financial statements.
6. Corporate ManagementHypo Alpe-Adria-Bank d.d. provides banking and leasing services to retail, corporate and public institutions clients, offering classic banking products such as credit financing, payment transaction services, investment banking services, collecting of deposits, and leasing. As a member of the Group operating internationally and with a broad spectrum of servi-ces, the Bank wants to be a market example.
The reputation of the Bank is heavily influenced by the decisions, actions and behavior of all its employees, who are responsible to the public, financial markets and clients, as well as to other colleagues. For these reasons, the Bank has adopted general ethical standards and business policies for the collective and individual behavior, employee relationships with customers, competitors, business partners, government bodies, shareholders, as well as their interrelations. Ethical guidelines adopted by the Bank are based on the fundamental principles of the UN Global Agreement, the UN Conventi-on on the Elimination of All Forms of Discrimination, and OSCE Guidelines for international organizations. The Bank and its employees are committed to the highest standards of ethical conduct and full compliance with all applicable national and international law in order to maintain customer trust.

Annual Report 201312
Hypo Alpe-Adria-Bank d.d.
Management Board report for the year 2013
The Bank is trying to increase customer satisfaction with the service provided by creating a customer-focused envi-ronment and that is open to feedback. Clients’ feedback is an important way that allows the evaluation and continuous improvement of processes, products and services of the Bank. For the purpose of complaints consideration, research and management, the function of the Ombudsman has been established.
The Bank respects the dignity, privacy and individuality of each employee. The relations between the employees are cha-racterized by mutual respect, honesty, team spirit, professio-nalism and openness.
The Bank is dedicated to maintaining the business environ-ment in which all employees appreciate and respect each other and have opportunities to realize their potentials. The Bank provides equal employment opportunities and business progress to all employees regardless of race, gender, national origin, age, disability, sexual orientation or religion. The Bank is dedicated to developing and maintaining a work environment where differences are respected, and tries to provide its employees, customers, business partners and the public with an accurate, credible and correct presentation of its business operations.
HYPO ALPE-ADRIA-BANK d.d. Zagreb
Tea Martinčić Joško Mihić Brane GolubićMember of the Management Board Member of the Management Board Member of the Management Board
Ivo Bilić Slawomir Roman Konias Member of the Management Board Member of the Management Board

Hypo Alpe-Adria-Bank d.d.
Annual Report 2013 13
Responsibility for the Financial Statements
Pursuant to the Croatian Accounting Law (Official Gazette 109/2007) and the Croatian Credit Institutions Act (Official Gazette 159/2013), the Management Board is responsible for ensuring that financial statements are prepared for each fi-nancial year in accordance with the applicable legislation and regulatory requirements, which give a true and fair view of the financial position of Hypo Alpe-Adria-Bank d.d. Zagreb (“the Bank”) and Group HYPO ALPE-ADRIA-BANK d.d. Zagreb (“the Group”) and of the results of their operations, changes in equity and cash flows for that period.
After making enquiries, the Management Board has a reaso-nable expectation that the Bank and the Group have ade-quate resources to continue in operational existence for the foreseeable future. For this reason, the Management Board continues to adopt the going concern basis in preparing the financial statements.
In preparing those financial statements, the responsibilities of the Management Board include ensuring that:
• suitable accounting policies are selected and then applied consistently;
• judgements and estimates are reasonable and prudent;
• applicable accounting standards are followed, subject to any material departures disclosed and explained in the financial statements; and
• the financial statements are prepared on the going concern basis unless it is inappropriate to presume that the Bank and the Group will continue in business.
The Management Board is responsible for keeping proper accounting records, which disclose, with reasonable accu-racy at any time, the financial position of the Bank and the Group and must also ensure that the financial statements comply with the Croatian Accounting Law (Official Gazette 109/2007) and the Croatian Credit Institutions Act (Official Gazette 159/2013). The Management Board is also respon-sible for safeguarding the assets of the Bank and the Group and hence for taking reasonable steps for the prevention and detection of fraud and other irregularities.
These financial statements were authorized for issue by the Management Board on 15 April 2014 and were signed on its behalf as follows:
HYPO ALPE-ADRIA-BANK d.d. Zagreb
Tea Martinčić Joško Mihić Brane GolubićMember of the Management Board Member of the Management Board Member of the Management Board
Ivo Bilić Slawomir Roman Konias Member of the Management Board Member of the Management Board

Annual Report 201314
Hypo Alpe-Adria-Bank d.d.
Independent Auditor‘s Report
To the Shareholders of HYPO ALPE-ADRIA-BANK d.d. Zagreb:
Report on the Financial Statements:
• We have audited the accompanying unconsolidated and consolidated financial statements (“the financial state-ments”) of HYPO ALPE-ADRIA-BANK d.d. Zagreb (“the Bank”) and its subsidiaries (together “the Group”) which comprise the unconsolidated and consolidated statements of financial position as at 31 December 2013, and the un-consolidated and consolidated income statements, uncon-solidated and consolidated statements of comprehensive income, the unconsolidated and consolidated statements of changes in equity and the unconsolidated and consolidated cash flow statements for the year then ended and a summa-ry of significant accounting policies and other explanatory information (as set out on pages 19 to 144).
Management Responsibility for the Financial Statements
• Management is responsible for the preparation and fair presentation of these financial statements in accordance with statutory accounting requirements for banks in Re-public of Croatia, and for such internal control as manage-ment determines is necessary to enable the preparation of financial statements that are free from material misstate-ment, whether due to fraud or error.
Auditor’s Responsibility
• Our responsibility is to express an opinion on these finan-cial statements based on our audit. We conducted our audit in accordance with International Standards on Auditing. Those standards require that we comply with ethical requi-rements and plan and perform the audit to obtain reaso-nable assurance whether the financial statements are free from material misstatement.
• An audit involves performing procedures to obtain audit evidence about the amounts and disclosures in the finan-cial statements. The procedures selected depend on the auditor’s judgment, including the assessment of the risk of material misstatement of the financial statements, whether due to fraud or error. In making those risk assessments, the auditor considers internal controls relevant to the entity’s preparation and fair presentation of the financial statements in order to design audit procedures that are appropriate in the circumstances, but not for the purpose of expressing an opinion on the effectiveness of the entity’s internal control. An audit also includes evaluating the appropriateness of accounting policies used and the reaso-nableness of accounting estimates made by management, as well as evaluating the overall presentation of the financial statements.
• We believe that the audit evidence we have obtained is sufficient and appropriate to provide a basis for our audit opinion.
Opinion
• In our opinion the unconsolidated and consolidated financial statements present fairly, in all material respects, the financial position of the Bank and of the Group as at 31 December 2013, their financial performance and cash flows for the year then ended in accordance with statutory accounting requirements for banks in Republic of Croatia.
Emphasis of the Matter
• We draw attention to Note 28 to the financial statements which describes the uncertainty related to the outcome of the lawsuit filed by Consumer Protection Association “Potrošač” against the Bank and against seven other banks in Republic of Croatia and explains that at this time it is not possible to estimate the final outcome of the case and consequently potential financial impact on the Bank. Our opinion is not qualified in respect of this matter.
Independent Auditor‘s Report
Hypo Alpe-Adria-Bank d.d.
Annual Report 2013 15
Independent Auditor‘s Report
material respects, from the audited financial statements of the Group which were prepared in accordance with statutory accounting requirements for banks in Republic of Croatia as presented on pages 19 to 144 and are based on the underlying accounting records of the Group.
2) Management Board of the Bank has prepared Annual re-port as set out on pages 3 to 15. The Management Board is responsible for the preparation of the Annual report in accordance with the Croatian Accounting Law and for its accuracy. Our responsibility is to perform procedures we consider necessary to reach a conclusion on whether the Annual report is consistent with the audited financial statements. Our work as auditors was confined to che-cking the annual report with the aforementioned scope and did not include a review of any information other than that drawn from the audited accounting records of the Bank and the Group. In our opinion, the accounting information presented in the Annual report for the year 2013 is consistent, in all material respects, with the audi-ted financial statements for that year which are presented on pages 19 to 144.
Other legal and regulatory requirements
1) In accordance with the By-law on the structure and content of the annual financial statements (National Gazette no 62/08) (hereinafter „the By-Law“), the Bank‘s management has prepared forms which are presented on pages 145 to 155, and which contain a balance sheet as at 31 December 2013, profit and loss account, statement of changes in equity and cash flow statement for the year then ended together with notes on the reconciliation of the forms with the primary financial statements of the Group. This financial information is the responsibility of the Bank‘s management and is, pursuant to statutory accounting requirements for banks in Republic of Cro-atia, not a required part of the financial statements, but is required by the Bylaw. Our responsibility with respect to this financial information is to perform the proce-dures we consider appropriate to conclude whether this financial information have been properly derived from the audited financial statements. In our opinion, based on the procedures performed, the financial information presented in the forms has been properly derived, in all
Željko Faber
Direktor i ovlašteni revizor
Ernst & Young d.o.o.
Zagreb, 15 April 2014
Annual Report 201316
Hypo Alpe-Adria-Bank d.d.
Consolidated Income Statement
Note Unaudited*2013
EUR ’000
Unaudited*2012
EUR ’000
2013HRK ’000
2012HRK ’000
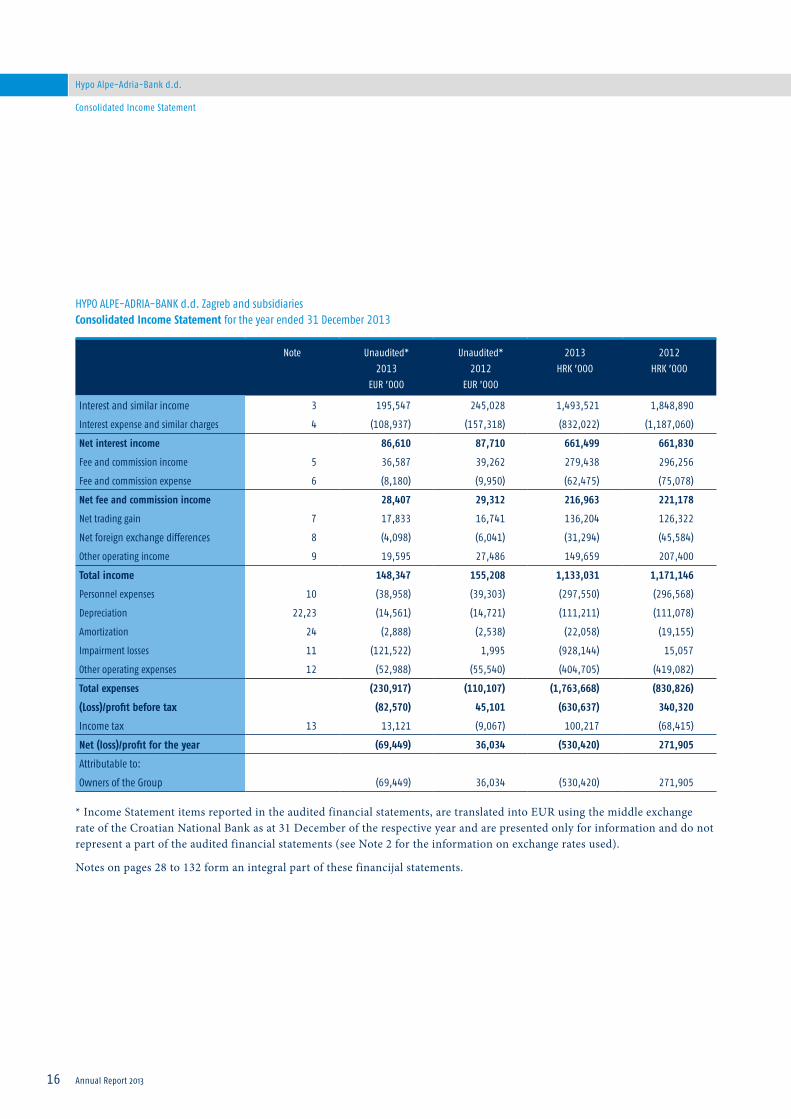
Interest and similar income 3 195,547 245,028 1,493,521 1,848,890
Interest expense and similar charges 4 (108,937) (157,318) (832,022) (1,187,060)
Net interest income 86,610 87,710 661,499 661,830
Fee and commission income 5 36,587 39,262 279,438 296,256
Fee and commission expense 6 (8,180) (9,950) (62,475) (75,078)
Net fee and commission income 28,407 29,312 216,963 221,178
Net trading gain 7 17,833 16,741 136,204 126,322
Net foreign exchange differences 8 (4,098) (6,041) (31,294) (45,584)
Other operating income 9 19,595 27,486 149,659 207,400
Total income 148,347 155,208 1,133,031 1,171,146
Personnel expenses 10 (38,958) (39,303) (297,550) (296,568)
Depreciation 22,23 (14,561) (14,721) (111,211) (111,078)
Amortization 24 (2,888) (2,538) (22,058) (19,155)
Impairment losses 11 (121,522) 1,995 (928,144) 15,057
Other operating expenses 12 (52,988) (55,540) (404,705) (419,082)
Total expenses (230,917) (110,107) (1,763,668) (830,826)
(Loss)/profit before tax (82,570) 45,101 (630,637) 340,320
Income tax 13 13,121 (9,067) 100,217 (68,415)
Net (loss)/profit for the year (69,449) 36,034 (530,420) 271,905
Attributable to:
Owners of the Group (69,449) 36,034 (530,420) 271,905
* Income Statement items reported in the audited financial statements, are translated into EUR using the middle exchange rate of the Croatian National Bank as at 31 December of the respective year and are presented only for information and do not represent a part of the audited financial statements (see Note 2 for the information on exchange rates used).
Notes on pages 28 to 132 form an integral part of these financijal statements.
HYPO ALPE-ADRIA-BANK d.d. Zagreb and subsidiariesConsolidated Income Statement for the year ended 31 December 2013

Hypo Alpe-Adria-Bank d.d.
Annual Report 2013 17
Consolidated Statement of Comprehensive Income
Signed on behalf of HYPO ALPE-ADRIA-BANK d.d. Zagreb on 15 April 2014:
Joško Mihić Brane Golubić Tea MartinčićMember of the Management Board Member of the Management Board Member of the Management Board
Unaudited*2013
EUR ’000
Unaudited*2012
EUR ’000
2013HRK ’000
2012HRK ’000
Net (loss)/profit for the year (69,449) 36,034 (530,420) 271,905
Other comprehensive income
Other comprehensive income to be reclassified to profit or loss in subsequent periods:
Net gain on available for sale financial assets 1,031 438 7,878 3,302
Income tax (138) (84) (1,056) (637)
Net other comprehensive income to be reclassified to profit or loss in subsequent periods:
893 354 6,822 2,665
Other comprehensive income not to be reclassified to profit or loss in subsequent periods:
Loss on revaluation of properties (31) - (234) -
Income tax (758) - (5,785) -
Net other comprehensive loss not to be reclassified to profit or loss in subsequent periods:
(789) - (6,019) -
Total net other comprehensive income for the year 104 354 803 2,665
Total comprehensive (loss)/income for the year (69,345) 36,388 (529,617) 274,570
Total comprehensive (loss)/income attributable to:
Owners of the Group (69,345) 36,388 (529,617) 274,570
*Statement of Comprehensive Income items reported in the audited financial statements, are translated into EUR using the middle exchange rate of the Croatian National Bank as at 31 December of the respective year and are presented only for infor-mation and do not represent a part of the audited financial statements (see Note 2 for the information on exchange rates used).
Notes on pages 28 to 132 form an integral part of these financijal statements.
HYPO ALPE-ADRIA-BANK d.d. Zagreb and subsidiariesConsolidated Statement of Comprehensive Income for the year ended 31 December 2013

Annual Report 201318
Hypo Alpe-Adria-Bank d.d.
Consolidated Statement of Financial Position
Notes on pages 28 to 132 form an integral part of these financijal statements.
HYPO ALPE-ADRIA-BANK d.d. Zagreb and subsidiariesConsolidated Statement of Financial Position as at 31 December 2013
Note Unaudited*2013
EUR ’000
Unaudited*2012
EUR ’000
2013HRK ’000
2012HRK ’000
Assets
Cash and balances with Croatian National Bank
14 493,420 606,083 3,768,564 4,573,277
Financial assets at fair value through profit or loss
15 12,478 1,272 95,306 9,596
Derivative financial assets 35 1,119 623 8,545 4,702
Placements with and loans to other banks 16 54,308 87,898 414,785 663,247
Loans and receivables 17 2,816,451 3,229,041 21,511,049 24,365,129
Available for sale financial assets 18 405,706 528,843 3,098,635 3,990,451
Assets acquired in lieu of uncollected receivables
20 15,144 18,071 115,664 136,359
Investment property 22 67,520 68,378 515,693 515,958
Property, plant and equipment 23 92,182 115,107 704,053 868,551
Intangible assets 24 6,367 7,367 48,630 55,588
Deferred tax assets 13 18,629 5,677 142,278 48,669
Current tax assets 3,548 - 27,098 -
Other assets 21 26,725 25,202 204,134 190,166
Total assets 4,013,597 4,693,562 30,654,434 35,421,693

Hypo Alpe-Adria-Bank d.d.
Annual Report 2013 19
Consolidated Statement of Financial Position
*Statement of Financial Position items reported in the audited financial statements, are translated into EUR using the middle exchange rate of the Croatian National Bank as at 31 December of the respective year and are presented only for information and do not represent a part of the audited financial statements (see Note 2 for the information on exchange rates used).
Notes on pages 28 to 132 form an integral part of these financijal statements.
HYPO ALPE-ADRIA-BANK d.d. Zagreb and subsidiariesConsolidated Statement of Financial Position as at 31 December 2013
Note Unaudited*2013
EUR ’000
Unaudited*2012
EUR ’000
2013HRK ’000
2012HRK ’000
Liabilities
Due to other banks 25 801,382 1,149,768 6,120,671 8,675,716
Due to customers 26 2,232,179 2,418,631 17,048,584 18,250,077
Finance lease liabilities 27 71 116 544 875
Derivative financial liabilities 35 3,745 7,809 28,603 58,925
Provisions for liabilities and charges 28 17,703 7,467 135,207 56,340
Current tax liabilities - 3,753 - 28,315
Other liabilities 29 29,390 30,175 224,473 227,699
Subordinated debt 30 288,678 323,459 2,204,821 2,440,703
Total liabilities 3,373,148 3,941,178 25,762,903 29,738,650
Equity
Share capital 31 681,985 690,302 5,208,760 5,208,760
Share premium 7,825 7,921 59,767 59,767
Unallocated (loss)/profit (69,449) 36,034 (530,420) 271,905
Retained earnings 268 647 2,045 4,884
Reserves 32 19,820 17,480 151,379 137,727
Total equity 640,449 752,384 4,891,531 5,683,043
Total liabilities and equity 4,013,597 4,693,562 30,654,434 35,421,693
Commitments and contingent liabilities 33 351,169 439,185 2,682,100 3,313,926
Signed on behalf of HYPO ALPE-ADRIA-BANK d.d. Zagreb on 15 April 2014:
Joško Mihić Brane Golubić Tea MartinčićMember of the Management Board Member of the Management Board Member of the Management Board
Annual Report 201320
Hypo Alpe-Adria-Bank d.d.
Consolidated Statement of Changes in Equity
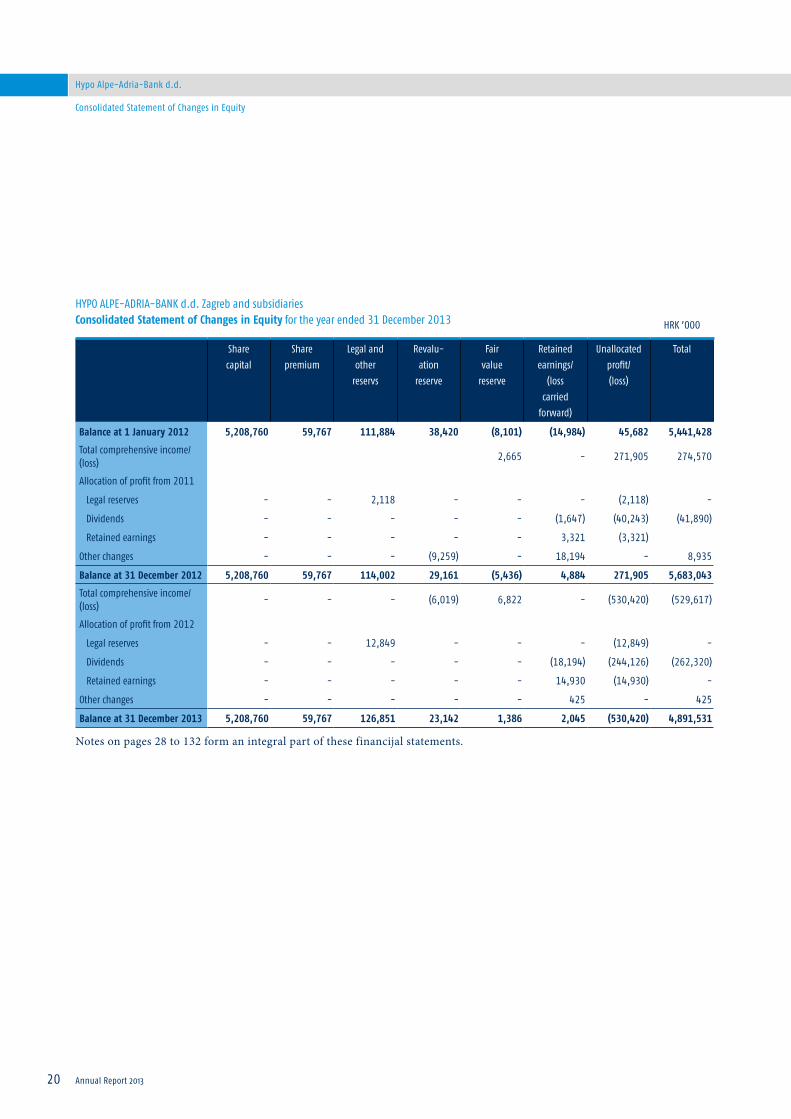
Notes on pages 28 to 132 form an integral part of these financijal statements.
HYPO ALPE-ADRIA-BANK d.d. Zagreb and subsidiariesConsolidated Statement of Changes in Equity for the year ended 31 December 2013
Sharecapital
Sharepremium
Legal andother
reservs
Revalu-ation
reserve
Fair value
reserve
Retainedearnings/
(losscarried
forward)
Unallocatedprofit/(loss)
Total
Balance at 1 January 2012 5,208,760 59,767 111,884 38,420 (8,101) (14,984) 45,682 5,441,428
Total comprehensive income/(loss)
2,665 - 271,905 274,570
Allocation of profit from 2011
Legal reserves - - 2,118 - - - (2,118) -
Dividends - - - - - (1,647) (40,243) (41,890)
Retained earnings - - - - - 3,321 (3,321)
Other changes - - - (9,259) - 18,194 - 8,935
Balance at 31 December 2012 5,208,760 59,767 114,002 29,161 (5,436) 4,884 271,905 5,683,043
Total comprehensive income/(loss)
- - - (6,019) 6,822 - (530,420) (529,617)
Allocation of profit from 2012
Legal reserves - - 12,849 - - - (12,849) -
Dividends - - - - - (18,194) (244,126) (262,320)
Retained earnings - - - - - 14,930 (14,930) -
Other changes - - - - - 425 - 425
Balance at 31 December 2013 5,208,760 59,767 126,851 23,142 1,386 2,045 (530,420) 4,891,531
HRK ’000

Hypo Alpe-Adria-Bank d.d.
Annual Report 2013 21
Consolidated Statement of Cash Flows
HYPO ALPE-ADRIA-BANK d.d. Zagreb and subsidiariesConsolidated Statement of Cash Flows for the year ended 31 December 2013
Note 2013 2012
Cash flow from operating activities:
Net (loss)/profit for the year (530,420) 271,905
Adjustments for:
Income tax recognized in profit or loss (100,217) 68,415
Interest expense recognized in income statement 832,022 1,187,060
Interest income recognized in income statement (1,427,877) (1,782,879)
Depreciation and amortization 133,269 130,233
Gain on disposal of property, plant and equipment (5,278) (54,629)
Fair value adjustment of financial assets at fair value through profit or loss (406) (263)
Fair value adjustment of derivative financial instruments 4,849 4,739
Dividends received (7) -
Impairment of assets 928,144 (15,057)
Operating cash flow before working capital movements (165,921) (190,476)
Decrease in balances with Croatian National Bank 620,035 327,196
Decrease/(increase) in placements with other banks 217,054 (353,152)
Decrease in loans and receivables 2,107,526 5,134,670
(Increase)/decrease in other assets (2,661) 70,394
Decrease in due to other banks (1,880,168) (6,806,608)
(Decrease)/increase in term deposits (1,030,400) 1,447,261
(Decrease)/increase in demand deposits (113,416) 68,588
Increase/(decrease) in provisions for liabilities and charges 62,889 (33,650)
Increase/(decrease) in other liabilities (70,643) (84,985)
Interest paid (893,568) (1,118,339)
Interest received 1,432,731 2,058,028
Income taxes paid (57,052) (13,947)
Net cash from operating activities 226,406 504,980
Cash flows from investing activities:
(Increase)/decrease in financial assets at fair value through profit or loss (35,970) 75,842
Decrease in available for sale financial assets 622,483 185,241
Dividends received 7 -
Increase of property, plant and equipment and intangible assets (86,586) (87,983)
Net cash from investing activities 499,934 173,100
Cash flows from financing activities:
(Decrease)/increase in subordinated debt (235,882) 10,669
Decrease in borrowings (671,356) (466,045)
Decrease in share capital - (751,070)
Dividends paid (262,321) (41,890)
Net cash from financing activities (1,169,559) (1,248,336)
Decrease in cash and cash equivalents (443,219) (570,256)
Cash and cash equivalents at the beginning of the year 2,606,530 3,176,786
Cash and cash equivalents at the end of the year 37 2,163,311 2,606,530
Notes on pages 28 to 132 form an integral part of these financijal statements.
HRK ’000
Annual Report 201322
Hypo Alpe-Adria-Bank d.d.
Unconsolidated Income Statement
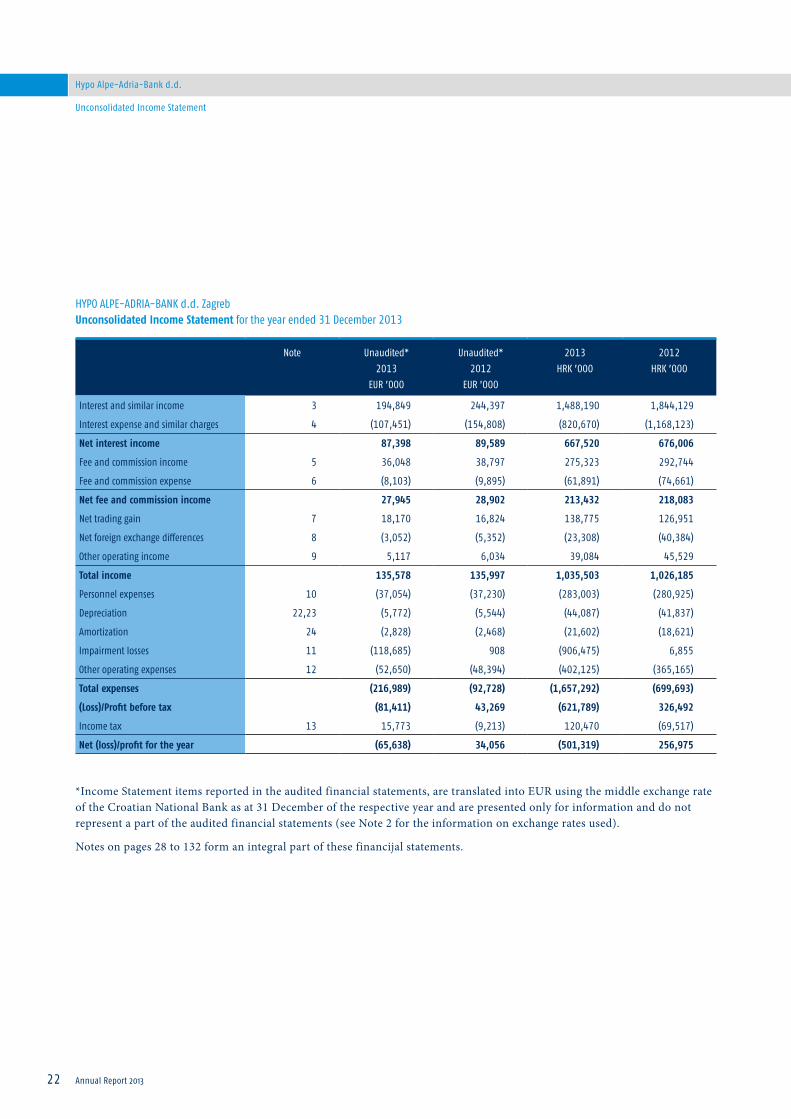
*Income Statement items reported in the audited financial statements, are translated into EUR using the middle exchange rate of the Croatian National Bank as at 31 December of the respective year and are presented only for information and do not represent a part of the audited financial statements (see Note 2 for the information on exchange rates used).
Notes on pages 28 to 132 form an integral part of these financijal statements.
HYPO ALPE-ADRIA-BANK d.d. Zagreb Unconsolidated Income Statement for the year ended 31 December 2013
Note Unaudited*2013
EUR ’000
Unaudited* 2012
EUR ’000
2013HRK ’000
2012HRK ’000
Interest and similar income 3 194,849 244,397 1,488,190 1,844,129
Interest expense and similar charges 4 (107,451) (154,808) (820,670) (1,168,123)
Net interest income 87,398 89,589 667,520 676,006
Fee and commission income 5 36,048 38,797 275,323 292,744
Fee and commission expense 6 (8,103) (9,895) (61,891) (74,661)
Net fee and commission income 27,945 28,902 213,432 218,083
Net trading gain 7 18,170 16,824 138,775 126,951
Net foreign exchange differences 8 (3,052) (5,352) (23,308) (40,384)
Other operating income 9 5,117 6,034 39,084 45,529
Total income 135,578 135,997 1,035,503 1,026,185
Personnel expenses 10 (37,054) (37,230) (283,003) (280,925)
Depreciation 22,23 (5,772) (5,544) (44,087) (41,837)
Amortization 24 (2,828) (2,468) (21,602) (18,621)
Impairment losses 11 (118,685) 908 (906,475) 6,855
Other operating expenses 12 (52,650) (48,394) (402,125) (365,165)
Total expenses (216,989) (92,728) (1,657,292) (699,693)
(Loss)/Profit before tax (81,411) 43,269 (621,789) 326,492
Income tax 13 15,773 (9,213) 120,470 (69,517)
Net (loss)/profit for the year (65,638) 34,056 (501,319) 256,975
Hypo Alpe-Adria-Bank d.d.
Annual Report 2013 23
Unconsolidated Statement of Comprehensive Income
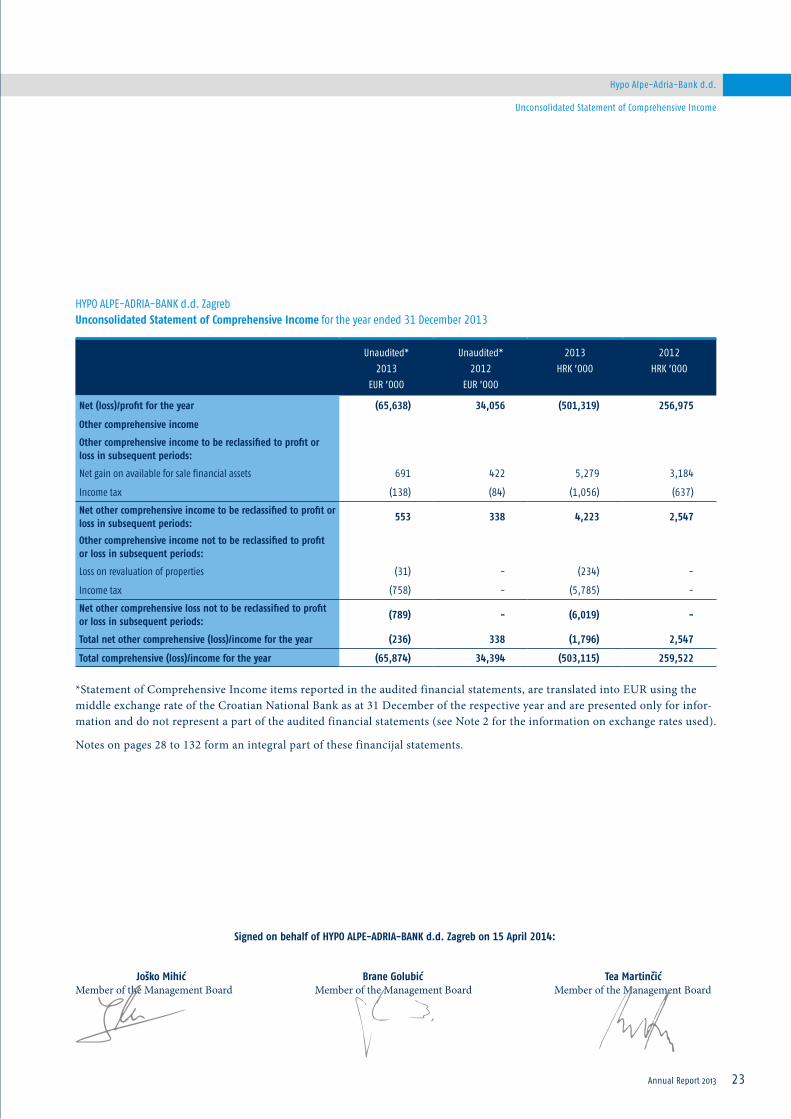
*Statement of Comprehensive Income items reported in the audited financial statements, are translated into EUR using the middle exchange rate of the Croatian National Bank as at 31 December of the respective year and are presented only for infor-mation and do not represent a part of the audited financial statements (see Note 2 for the information on exchange rates used).
Notes on pages 28 to 132 form an integral part of these financijal statements.
HYPO ALPE-ADRIA-BANK d.d. Zagreb Unconsolidated Statement of Comprehensive Income for the year ended 31 December 2013
Unaudited*2013
EUR ’000
Unaudited* 2012
EUR ’000
2013HRK ’000
2012HRK ’000
Net (loss)/profit for the year (65,638) 34,056 (501,319) 256,975
Other comprehensive income
Other comprehensive income to be reclassified to profit or loss in subsequent periods:
Net gain on available for sale financial assets 691 422 5,279 3,184
Income tax (138) (84) (1,056) (637)
Net other comprehensive income to be reclassified to profit or loss in subsequent periods:
553 338 4,223 2,547
Other comprehensive income not to be reclassified to profit or loss in subsequent periods:
Loss on revaluation of properties (31) - (234) -
Income tax (758) - (5,785) -
Net other comprehensive loss not to be reclassified to profit or loss in subsequent periods:
(789) - (6,019) -
Total net other comprehensive (loss)/income for the year (236) 338 (1,796) 2,547
Total comprehensive (loss)/income for the year (65,874) 34,394 (503,115) 259,522
Signed on behalf of HYPO ALPE-ADRIA-BANK d.d. Zagreb on 15 April 2014:
Joško Mihić Brane Golubić Tea MartinčićMember of the Management Board Member of the Management Board Member of the Management Board
Annual Report 201324
Hypo Alpe-Adria-Bank d.d.
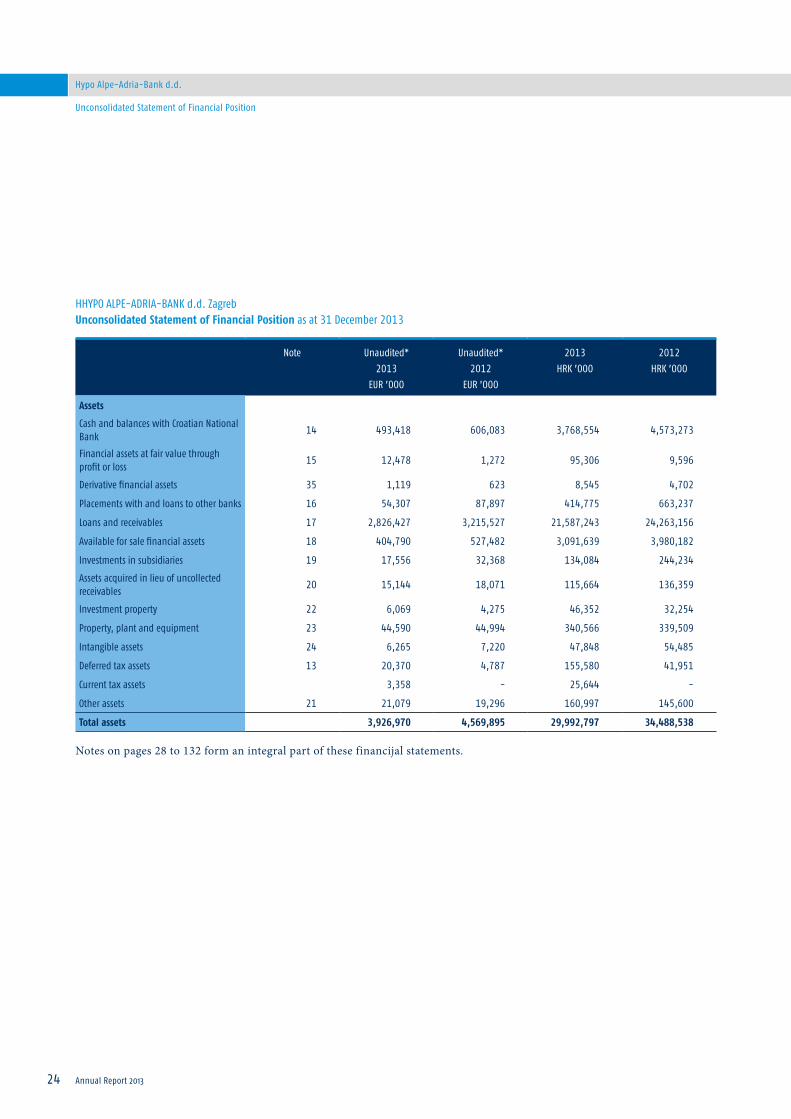
Unconsolidated Statement of Financial Position
Notes on pages 28 to 132 form an integral part of these financijal statements.
HHYPO ALPE-ADRIA-BANK d.d. Zagreb Unconsolidated Statement of Financial Position as at 31 December 2013
Note Unaudited*2013
EUR ’000
Unaudited* 2012
EUR ’000
2013HRK ’000
2012HRK ’000
Assets
Cash and balances with Croatian National Bank
14 493,418 606,083 3,768,554 4,573,273
Financial assets at fair value through profit or loss
15 12,478 1,272 95,306 9,596
Derivative financial assets 35 1,119 623 8,545 4,702
Placements with and loans to other banks 16 54,307 87,897 414,775 663,237
Loans and receivables 17 2,826,427 3,215,527 21,587,243 24,263,156
Available for sale financial assets 18 404,790 527,482 3,091,639 3,980,182
Investments in subsidiaries 19 17,556 32,368 134,084 244,234
Assets acquired in lieu of uncollected receivables
20 15,144 18,071 115,664 136,359
Investment property 22 6,069 4,275 46,352 32,254
Property, plant and equipment 23 44,590 44,994 340,566 339,509
Intangible assets 24 6,265 7,220 47,848 54,485
Deferred tax assets 13 20,370 4,787 155,580 41,951
Current tax assets 3,358 - 25,644 -
Other assets 21 21,079 19,296 160,997 145,600
Total assets 3,926,970 4,569,895 29,992,797 34,488,538

Hypo Alpe-Adria-Bank d.d.
Annual Report 2013 25
Unconsolidated Statement of Financial Position
*Statement of Financial Position items reported in the audited financial statements, are translated into EUR using the middle exchange rate of the Croatian National Bank as at 31 December of the respective year and are presented only for information and do not represent a part of the audited financial statements (see Note 2 for the information on exchange rates used).
Notes on pages 28 to 132 form an integral part of these financijal statements.
HYPO ALPE-ADRIA-BANK d.d. Zagreb Unconsolidated Statement of Financial Position as at 31 December 2013
Note Unaudited*2013
EUR ’000
Unaudited* 2012
EUR ’000
2013HRK ’000
2012HRK ’000
Liabilities
Due to other banks 25 707,996 1,028,497 5,407,418 7,760,648
Due to customers 26 2,241,210 2,424,472 17,117,563 18,294,152
Finance lease liabilities 27 71 116 544 875
Derivative financial liabilities 35 3,745 7,809 28,603 58,925
Provisions for liabilities and charges 28 17,645 7,408 134,766 55,895
Current tax liabilities - 4,162 - 31,403
Other liabilities 29 23,700 21,597 181,012 162,965
Subordinated debt 30 288,678 323,459 2,204,821 2,440,703
Total liabilities 3,283,045 3,817,520 25,074,727 28,805,566
Equity
Share capital 31 681,985 690,302 5,208,760 5,208,760
Share premium 7,825 7,921 59,767 59,767
Unallocated (loss)/profit (65,638) 34,056 (501,319) 256,975
Retained earnings 70 2,411 533 18,194
Reserves 32 19,683 17,685 150,329 139,276
Total equity 643,925 752,375 4,918,070 5,682,972
Total liabilities and equity 3,926,970 4,569,895 29,992,797 34,488,538
Commitments and contingent liabilities 33 366,314 441,364 2,797,772 3,330,366
Signed on behalf of HYPO ALPE-ADRIA-BANK d.d. Zagreb on 15 April 2014:
Joško Mihić Brane Golubić Tea MartinčićMember of the Management Board Member of the Management Board Member of the Management Board

Annual Report 201326
Hypo Alpe-Adria-Bank d.d.
Unconsolidated Statement of Changes in Equity
Notes on pages 28 to 132 form an integral part of these financijal statements.
HYPO ALPE-ADRIA-BANK d.d. Zagreb Unconsolidated Statement of Changes in Equity for the year ended 31 December 2013
Sharecapital
Sharepremium
Legalreserve
Revalu-ation
reserve
Fair value
reserve
Retainedearnings
Unallocatedprofit/(loss)
Total
Balance at 1 January 2012 5,208,760 59,767 110,834 38,420 (5,384) 1,647 42,361 5,456,405
Total comprehensive income 2,547 - 256,975 259,522
Allocation of profit from 2011
Legal reserves - - 2,118 - - - (2,118) -
Dividends - - - - - (1,647) (40,243) (41,890)
Other changes - - - (9,259) - 18,194 - 8,935
Balance at 31 December 2012 5,208,760 59,767 112,952 29,161 (2,837) 18,194 256,975 5,682,972
Total comprehensive income/(loss)
Allocation of profit from 2012 (6,019) 4,223 - (501,319) (503,115)
Legal reserves - - 12,849 - - - (12,849) -
Dividends - - - - - (18,194) (244,126) (262,320)
Other changes - - - - - 533 - 533
Balance at 31 December 2013 5,208,760 59,767 125,801 23,142 1,386 533 (501,319) 4,918,070
HRK ’000

Hypo Alpe-Adria-Bank d.d.
Annual Report 2013 27
Unconsolidated Statement of Cash Flows
HYPO ALPE-ADRIA-BANK d.d. Zagreb Unconsolidated Statement of Cash Flows for the year ended 31 December 2013
Note 2013 2012
Cash flow from operating activities:
Net (loss)/profit for the year (501,319) 256,975
Adjustments for:
Income tax recognized in income statement (120,470) 69,517
Interest expense recognized in income statement 820,670 1,168,123
Interest income recognized in income statement (1,422,546) (1,778,117)
Depreciation and amortization 65,689 60,458
Gain on disposal of property, plant and equipment (862) (10,145)
Fair value adjustment of financial assets at fair value through profit or loss (406) (263)
Fair value adjustment of derivative financial instruments 4,849 4,739
Dividends received (7) -
Impairment of assets 906,475 (6,855)
Operating cash flow before working capital movements (247,927) (235,568)
Decrease in balances with Croatian National Bank 620,035 327,196
Decrease/(increase) in placements with other banks 217,054 (353,142)
Decrease in loans and receivables 1,930,390 5,210,582
Decrease in other assets 4,265 61,266
Decrease in due to other banks (1,880,168) (6,806,608)
(Decrease)/increase in term deposits (1,014,413) 1,448,009
(Decrease)/increase in demand deposits (104,420) 42,827
Increase/(decrease) in provisions for liabilities and charges 62,893 (33,538)
Increase/(decrease) in other liabilities (52,351) (61,113)
Interest paid (882,290) (1,096,923)
Interest received 1,430,033 2,051,714
Income taxes paid (57,052) (13,909)
Net cash from operating activities 26,049 540,793
Cash flows from investing activities:
(Increase)/decrease in financial assets at fair value through profit or loss (35,970) 75,842
Decrease in available for sale financial assets 616,611 182,411
Dividends received 7 -
Increase of property, plant and equipment and intangible assets (82,174) (73,838)
Net cash from investing activities 498,474 184,415
Cash flows from financing activities:
(Decrease)/increase in subordinated debt (235,882) 10,669
Decrease in borrowings (469,545) (513,163)
Decrease in share capital - (751,070)
Dividends paid (262,321) (41,890)
Net cash from financing activities (967,748) (1,295,454)
Decrease in cash and cash equivalents (443,225) (570,246)
Cash and cash equivalents at the beginning of the year 2,606,526 3,176,772
Cash and cash equivalents at the end of the year 37 2,163,301 2,606,526
Notes on pages 28 to 132 form an integral part of these financijal statements.
HRK ’000

28
Hypo Alpe-Adria-Bank d.d.
Annual Report 2013
Notes to the Financial Statements for the year ended 31 December 2013
General information about the Bank and the Group
a) History and Incorporation
HYPO ALPE-ADRIA-BANK d.d. Zagreb (hereinafter: the Bank), is a joint stock company registered in Croatia. The registered office of the Bank is located in Slavonska avenija 6.
The Bank is a fully owned subsidiary of HYPO ALPE-ADRIA-BANK INTERNATIONAL AG Klagenfurt.
The Bank is a member of the Hypo Alpe Adria, with HYPO ALPE-ADRIA-BANK INTERNATIONAL AG, Klagenfurt as the parent company. The shareholder of HYPO ALPE-ADRIA-BANK INTERNATIONAL AG is the Republic of Austria, and con-sequently the ultimate parent of HYPO ALPE-ADRIA-BANK d.d. Zagreb.
During 2013 the operations were conducted through the Bank’s head office located in Zagreb and through branches organized into regional centres Zagreb, Central Croatia, Dalmatia, Istria and Kvarner and Slavonia.
The companies, which are consolidated with the Bank (hereinafter: the Group), are presented below together with the percen-tage of ownership:
Consolidated companies’ contribution within the Group net profit after intercompany eliminations for the year:
Consolidated companies’ contribution within the Group reserves:
Nature ofbusiness
2013% ownership
2012% ownership
HYPO ALPE-ADRIA-INVEST d.d., Zagreb Investment funds management 100% 100%
HYPO ALPE-ADRIA-NEKRETNINE d.o.o., Zagreb Real estate 100% 100%
HYPO ALPE-ADRIA-LEASING d.o.o., Zagreb Leasing 100% 100%
2013 2012
HYPO ALPE-ADRIA-BANK d.d. Zagreb (398,059) 279,489
HYPO ALPE-ADRIA-INVEST d.d., Zagreb 1,098 428
HYPO ALPE-ADRIA-NEKRETNINE d.o.o., Zagreb (141,951) (18,489)
HYPO ALPE-ADRIA-LEASING d.o.o., Zagreb 8,492 10,477
Total (530,420) 271,905
2013 2012
HYPO ALPE-ADRIA-BANK d.d. Zagreb 210,628 217,238
HYPO ALPE-ADRIA-INVEST d.d., Zagreb 5,183 4,766
HYPO ALPE-ADRIA-NEKRETNINE d.o.o., Zagreb 3,097 (8,445)
HYPO ALPE-ADRIA-LEASING d.o.o., Zagreb (5,717) (11,181)
Total 213,191 202,378
Notes to the Financial Statementsfor the year ended 31 December 2013
HRK ’000
HRK ’000

Hypo Alpe-Adria-Bank d.d.
Annual Report 2013 29
Notes to the Financial Statements for the year ended 31 December 2013
b) Activity
The Bank was granted a full banking license by the Croatian National Bank (“CNB”) in 1996 and started its banking activities in September 1997. This license includes, but is not limited to the following activities:
• taking deposits in local and foreign currencies,
• approving loans in local and foreign currencies,
• buying and selling of local and foreign currencies,
• opening nostro accounts abroad,
• transactions with securities, precious metals and bills of exchange, in Croatia and abroad,
• performing local and international payments, and
• issuing guarantees and letters of credit to customers.
The management considers that the Group operates in the segment of banking and related services in the Republic of Croatia.
c) Members of the Supervisory Board
The members of the Supervisory Board of the Bank during the year 2013 were as follows:
d) Members of the Management Board
The members of the Management Board of the Bank during the year 2013 were as follows:
Gottwald Kranebitter President Appointed as at 27 April 2010
Wolfgang EdelmÜller Deputy President Appointed as at 27 April 2010
Sebastian Firlinger Member Appointed as at 27 April 2010
Neven Raić Member Appointed as at 15 February 2012
Zoran Parać Member Appointed as at 28 November 2013
Goran Radman Member Resigned as at 30 May 2013
Markus FerstlPresident Appointed as at 14 December 2007
Resigned as at 10 February 2014
Tea MartinčićMemberDeputy President
Appointed as at 20 October 2010Appointed as at 10 February 2014
Ivo Bilić Member Appointed as at 18 December 2009
Brane Golubić Member Appointed as at 10 March 2010
Joško Mihić Member Appointed as at 01 August 2012
Slawomir Roman Konias Member Appointed as at 01 August 2012
Annual Report 201330
Hypo Alpe-Adria-Bank d.d.
Notes to the Financial Statements for the year ended 31 December 2013
2. Summary of significant accounting policies
a) Statement of ComplianceThe financial statements have been prepared in accordance with statutory accounting requirements for banks in Croatia. Ban-king operations in Croatia are subject to the Croatian Credit Institutions Act, in accordance with which financial reporting is regulated by the Accounting Act and the Croatian National Bank („the CNB“). These financial statements have been prepared in accordance with the regulatory accounting requirements as defined by the CNB.
The statutory accounting regulations for Banks in Croatia are based on International Financial Reporting Standards („IFRS“) as adopted in European Union adjusted by any specific accounting related regulations brought by the CNB. There are several differences between the accounting regulations of the CNB and International Financial Reporting Standards.
One of them is in the collective assessment of losses for balance sheet and off-balance sheet items for which no losses are identified on an individual basis, i.e. for performing loans and certain other financial assets, and off-balance sheet liabilities classified into risk category A. For these items the regulations require that credit institution performs collective assessment of latent losses by applying its internal experience-based methodology prepared and tested in advance, where the provision shall not be less than 0.8% of the total exposure to items qualifying for such latent losses. A credit institution having no internal methodology needs to maintain the level of such value adjustments at a minimum of 1% of the total relevant exposure. The Bank has adopted the methodology for the calculation of collective impairment and provisions for latent losses. As at 31 December 2013, the Bank recognized a portfolio based allowance for impairment losses in accordance with the CNB require-ments of HRK 216,501 thousand for balance sheet items which is 0.88% of items qualifying for such impairment losses (2012: HRK 249,767 thousand; 0.9%) and HRK 26,650 thousand for off-balance sheet items which is 0.98% of items qualifying for such impairment losses (2012: HRK 29,535 thousand; 0.9%). Related release of provisions for collective impairment in the in-come statement for 2013 for balance sheet items was HRK 33,266 thousand (2012: HRK 25,879 thousand) and for off-balance sheet items HRK 2,885 thousand (2012: HRK 6,538 thousand).
Also, IAS 39 requires that future cash flows of a group of financial assets that are collectively evaluated for impairment should be estimated on the basis of historical loss experience for such assets with credit risk characteristics similar to those in the group and provisioning levels per these losses cannot be prescribed generally by any means.
A further difference between IFRS and the accounting regulations of the CNB relates to the determination of impairment losses by discounting the estimated cash flows of the impaired asset at the instrument’s original effective interest rate. The Bank calculates impairment losses on individually significant items by estimating the future cash flows and discounting these estimated amounts at the instrument’s original effective interest rate. The Bank generally recognises the amortisation of such discounts as a release of impairment allowance rather than as interest income. In certain cases, however, collections are recog-nised as interest income once impairment losses are fully reversed.
Additionally the CNB prescribes minimum levels of impairment losses against certain specifically identified impaired exposu-res, which may be different from the impairment loss required to be recognised in accordance with IFRS.

Hypo Alpe-Adria-Bank d.d.
Annual Report 2013 31
Notes to the Financial Statements for the year ended 31 December 2013
b) New and amended standards and interpretations endorsed by European Union (EU) The accounting policies adopted are consistent with those of the previous financial year, except for the following standards and amendments to IFRS effective as of 1 January 2013:
• IFRS 1 First-time Adoption of International Financial Reporting Standards - Government Loans (Amendments) – effective January 1, 2013
• IFRS 1 First-Time Adoption of International Financial Reporting Standards (Amendment) - Severe Hyperinflation and Remo-val of Fixed Dates for First-Time Adopters
• IFRS 7 Financial Instruments: Disclosures (Amendment), effective January 1, 2013
• IFRS 13 Fair Value Measurement – effective January 1, 2013
• IAS 12 Income Taxes (Amendment) - Deferred Taxes: Recovery of Underlying Assets;
• IAS 19 Employee benefits (revised) – effective January 1, 2013
• IFRIC 20 Stripping Costs in the Production Phase of a Surface Mine – effective January 1, 2013
The adoption of the standards or interpretations is described below:
IFRS 1 Government Loans – Amendments to IFRS 1
These amendments require first-time adopters to apply the requirements of IAS 20 Accounting for Government Grants and Disclosure of Government Assistance, prospectively to government loans existing at the date of transition to IFRS. Entities may choose to apply the requirements of IFRS 9 (or IAS 39, as applicable) and IAS 20 to government loans retrospectively if the information needed to do so had been obtained at the time of initially accounting for that loan. The exception would give first-time adopters relief from retrospective measurement of government loans with a below-market rate of interest. The amendment is effective for annual periods on or after 1 January 2013. The amendment has no impact on the Group.
IFRS 1 First-Time Adoption of International Financial Reporting Standards (Amendment) – Severe Hyperinflation and Removal of Fixed Dates for First-Time Adopters
The IASB provided guidance on how an entity should resume presenting IFRS financial statements when its functional curren-cy ceases to be subject to hyperinflation. The amendment shall be applied as from the commencement date of its first financial year starting on or after 1 January 2013. The amendment had no impact to the Group financial position or performance.

Annual Report 201332
Hypo Alpe-Adria-Bank d.d.
Notes to the Financial Statements for the year ended 31 December 2013
IFRS 7 Disclosures — Offsetting Financial Assets and Financial Liabilities — Amendments to IFRS 7
These amendments require an entity to disclose information about rights to set-off and related arrangements (e.g., collateral agreements). The disclosures would provide users with information that is useful in evaluating the effect of netting arrange-ments on an entity’s financial position. The new disclosures are required for all recognized financial instruments that are set off in accordance with IAS 32 Financial Instruments: Presentation. The disclosures also apply to recognized financial instru-ments that are subject to an enforceable master netting arrangement or similar agreement, irrespective of whether they are set off in accordance with IAS 32. These amendments did not have impact on the Group’s financial position or performance and are effective for annual periods beginning on or after 1 January 2013.
IFRS 13 Fair Value Measurement
IFRS 13 establishes a single source of guidance under IFRS for all fair value measurements. IFRS 13 does not change when an entity is required to use fair value, but rather provides guidance on how to measure fair value under IFRS when fair value is required or permitted. The Standard did not affect financial position and performance of the Bank and the Group but has affected the fair value disclosures (additional disclosure requirements). Standard is effective for annual periods beginning on or after 1 January 2013.
IAS 12 Income Taxes (Amendment) – Deferred Taxes: Recovery of Underlying Assets
The amendment clarified the determination of deferred tax on investment property measured at fair value and introduces a rebuttable presumption that deferred tax on investment property measured using the fair value model in IAS 40 should be determined on the basis that its carrying amount will be recovered through sale. It includes the requirement that deferred tax on non-depreciable assets that are measured using the revaluation model in IAS 16 should always be measured on a sale basis. The amendment shall be applied as from the commencement date of its first financial year starting on or after 1 January 2013 and there has been no effect on the Group’s financial position, performance or its disclosures.
IAS 19 Employee Benefits (Revised)
The IASB has issued numerous amendments to IAS 19. These range from fundamental changes such as removing the corridor mechanism and the concept of expected returns on plan assets to simple clarifications and re-wording. The amendment is effective for annual periods beginning on or after 1 January 2013. There has been no impact on the Group’s financial position or results.
IFRIC 20 Stripping Costs in the Production Phase of a Surface Mine
This interpretation applies to waste removal (stripping) costs incurred in surface mining activity, during the production phase of the mine. The interpretation addresses the accounting for the benefit from the stripping activity. The interpretation is effec-tive for annual periods beginning on or after 1 January 2013. The new interpretation did not have an impact on the Group.
Hypo Alpe-Adria-Bank d.d.
Annual Report 2013 33
Notes to the Financial Statements for the year ended 31 December 2013
Following standards become effective for annual periods beginning on or after January 1, 2013. The endorsement process within EU adopted the standards and decided that standards should be applied, at the latest, as from the commencement date of a financial year starting on or after January 1, 2014.
• IAS 28 Investments in Associates and Joint Ventures (as revised in 2011)
• IFRS 10 Consolidated Financial Statements, IAS 27 Separate Financial Statements
• IFRS 11 Joint Arrangements
• IFRS 12 Disclosure of Interests in Other Entities
IAS 28 Investments in Associates and Joint Ventures (as revised in 2011)
As a consequence of the new IFRS 11 Joint Arrangements, and IFRS 12 Disclosure of Interests in Other Entities, IAS 28 Invest-ments in Associates, has been renamed IAS 28 Investments in Associates and Joint Ventures, and describes the application of the equity method to investments in joint ventures in addition to associates.
IFRS 10 Consolidated Financial Statements, IAS 27 Separate Financial Statements
IFRS 10 replaces the portion of IAS 27 Consolidated and Separate Financial Statements that addresses the accounting for con-solidated financial statements. It also addresses the issues raised in SIC-12 Consolidation Special Purpose Entities.
IFRS 10 establishes a single control model that applies to all entities including special purpose entities. The changes introdu-ced by IFRS 10 will require management to exercise significant judgment to determine which entities are controlled and there-fore are required to be consolidated by a parent, compared with the requirements that were in IAS 27. Based on the prelimina-ry analyses performed, IFRS 10 is not expected to have any impact on the currently held investments of the Group.
IFRS 11 Joint Arrangements
IFRS 11 replaces IAS 31 Interests in Joint Ventures and SIC-13 Jointly-controlled Entities — Non-monetary Contributions by Venturers. IFRS 11 removes the option to account for jointly controlled entities (JCEs) using proportionate consolidation. Instead, JCEs that meet the definition of a joint venture must be accounted for using the equity method.
IFRS 12 Disclosure of Interests in Other Entities
IFRS 12 includes all of the disclosures that were previously in IAS 27 related to consolidated financial statements, as well as all of the disclosures that were previously included in IAS 31 and IAS 28. These disclosures relate to an entity’s interests in subsidiaries, joint arrangements, associates and structured entities. A number of new disclosures are also required, but has no impact on the Group’s financial position or performance.
Annual Report 201334
Hypo Alpe-Adria-Bank d.d.
Notes to the Financial Statements for the year ended 31 December 2013
Standards endorsed by European Union but not yet effective
IAS 32 Offsetting Financial Assets and Financial Liabilities - Amendments to IAS 32
These amendments clarify the meaning of “currently has a legally enforceable right to set-off ”. The amendments also clarify the application of the IAS 32 offsetting criteria to settlement systems (such as central clearing house systems) which apply gross settlement mechanisms that are not simultaneous. These amendments are not expected to impact the Group’s financial position or performance and become effective for annual periods beginning on or after 1 January 2014.
Investment Entities (Amendments to IFRS 10, IFRS 12, IAS 27 and IAS 28)
In October 2012 IASB issued the amendments that are effective for annual periods beginning on or after January 1, 2014. These amendments will apply to investments in subsidiaries, joint ventures and associates held by a reporting entity that meets the definition of an investment entity. An investment entity will account for its investments in subsidiaries, associates and joint ventures at fair value through profit or loss in accordance with IFRS 9 (or IAS 39, as appropriate), except for investments in subsidiaries, associates and joint ventures that provide services that relate only to the investment entity, which would be consolidated or accounted for using the equity method, respectively. An investment entity will measure its investment in another controlled investment entity at fair value. Non-investment entity parents of investment entities will not be permitted to retain the fair value accounting that the investment entity subsidiary applies to its controlled investees. For non-investment entities, the existing option in IAS 28, to measure investments in associates and joint ventures at fair value through profit or loss, will be retained. The Group is currently assessing the impact that this standard could have on the financial position and performance.
Recoverable Amount Disclosures for Non-Financial Assets – Amendments to IAS 36 Impairment of Assets
These amendments remove the unintended consequences of IFRS 13 on the disclosures required under IAS 36. In addition, these amendments require disclosure of the recoverable amounts for the assets or CGUs for which impairment loss has been recognized or reversed during the period. These amendments are effective retrospectively for annual periods beginning on or after 1 January 2014 with earlier application permitted, provided IFRS 13 is also applied. The Group has early adopted these amendments to IAS 36 in the current period since the amended/additional disclosures provide useful information as intended by the IASB, however, there are no effects these financial statements.

Hypo Alpe-Adria-Bank d.d.
Annual Report 2013 35
Notes to the Financial Statements for the year ended 31 December 2013
Standards not yet endorsed by European Union
The standards and interpretations that are issued, but not yet endorsed by EU, up to the date of issuance of the Group’s finan-cial statements are disclosed below. The Group intends to adopt these standards, if applicable, when they become effective.
IFRS 9 Financial Instruments: Classification and Measurement
IFRS 9, as issued, reflects the first phase of the IASB’s work on the replacement of IAS 39 and applies to classification and mea-surement of financial assets and financial liabilities as defined in IAS 39. Most of the requirements in IAS 39 for classification and measurement of financial liabilities and derecognition of financial assets and liabilities were carried forward unchanged to IFRS 9. The standard eliminates categories of financial instruments currently existing in IAS 39: available-for-sale and held-to-maturity. According to IFRS 9 all financial assets and liabilities are initially recognized at fair value plus transaction costs.
Hedge accounting
A new chapter on hedge accounting has been added to IFRS 9. This represents a major overhaul of hedge accounting and puts in place a new model that introduces significant improvements principally by aligning the accounting more closely with risk management. There are also improvements to the disclosures about hedge accounting and risk management.
The standard does not currently indicate the mandatory effective date. The IASB decided to defer the mandatory effective date of IFRS 9 until the date of the completed version of IFRS 9 is known. The standard has not yet been endorsed by EU. The adoption of the first phase of IFRS 9 will have an effect on the classification and measurement of the Group’s financial assets, but will not have an impact on classification and measurements of financial liabilities. The Group will quantify the effect in conjunction with the other phases, when the final standard including all phases is issued and endorsed by EU.
IFRIC 21 Levies
The interpretation is applicable to all levies other than outflows that are within the scope of other standards (e.g., IAS 12) and fines or other penalties for breaches of legislation. Levies are defined in the interpretation as outflows of resources embodying economic benefits imposed by government on entities in accordance with legislation. The interpretation clarifies that an entity recognizes a liability for a levy when the activity that triggers payment, as identified by the relevant legislation, occurs. It also clarifies that a levy liability is accrued progressively only if the activity that triggers payment occurs over a period of time, in accordance with the relevant legislation. For a levy that is triggered upon reaching a minimum threshold, the interpretation clarifies that no liability is recognized before the specified minimum threshold is reached. The interpretation does not address the accounting for the debit side of the transaction that arises from recognizing a liability to pay a levy. Entities look to other standards to decide whether the recognition of a liability to pay a levy would give rise to an asset or an expense under the relevant standards. The interpretation is effective for annual periods beginning on or after January 1, 2014. The new interpre-tation will have no impact on the Group.
Annual Report 201336
Hypo Alpe-Adria-Bank d.d.
Notes to the Financial Statements for the year ended 31 December 2013
c) Basis of PreparationThe financial statements are presented in the Croatian currency, Kuna (HRK), rounded to the nearest thousand, unless stated otherwise. The financial statements for the year ended 31 December 2013 have been prepared under the historical cost con-vention except for financial assets and liabilities at fair value in accordance with IAS 39 “Financial Instruments: Recognition and Measurement” and revalued non-current assets. The accounting policies have been consistently applied, except where disclosed otherwise.
The financial statements have been prepared under the assumption that the Group will continue to operate as a going concern.
In preparing the financial statements, the Group’s management has made judgments, estimates and assumptions that affect the application of policies and reported amounts of assets and liabilities, and disclosure of commitments and contingent liabilities at the balance sheet date, as well as amounts of income and expenses for the period.
The estimates and associated assumptions are based on historical experience and various other factors that are believed to be reasonable under the circumstances, as well as information available at the date of the preparation of the financial statements, forms the basis of making the judgments about carrying amounts of assets and liabilities that are not readily apparent from other sources. Actual results may significantly differ from these estimates.
Quality of the credit portfolio and appropriateness of related bad debt provisions are notably influenced by macroeconomic developments. Unexpected development of economic conditions, especially related to real estate market, cannot be excluded and could have significant impact on the required allowance for impairment of the loan portfolio. Furthermore, there are uncertainties in relation to future outcomes and timings of legal actions initiated by the Bank and the Group in order to realise collections per non-performing loans and receivables.
The estimates and underlying assumptions are reviewed on an ongoing basis. Revisions to accounting estimates are recognized in the period in which the estimate is revised if the revision affects only that period or in the period of revision and future pe-riods if the revision affects both current and future periods. The accounting policies have been consistently applied by Group entities and are consistent with those applied in previous years.
d) Going Concern AssumptionThe financial statements have been prepared on the going concern basis, which assumes continuity of normal business activi-ties and the realisation of assets and the settlement of liabilities in the ordinary course of business.
The ability of the Group to continue as a going concern is dependent upon the continued funding and support from its share-holder Hypo Alpe-Adria-Bank International AG, Klagenfurt, Austria (the Parent) under the currently agreed financial terms. To this extent, the Parent has provided funding to the Group to support its operations. This support includes agreeing not to seek repayment, other than originally contracted, of intercompany loans to the Group for a period of at least 12 months from the date of these financial statements.

Hypo Alpe-Adria-Bank d.d.
Annual Report 2013 37
Notes to the Financial Statements for the year ended 31 December 2013
Following the acquisition of 100% of the shares in the Hypo Alpe-Adria-Bank International AG by the Republic of Austria completed on 30 December 2009, Hypo Alpe-Adria-Bank International AG and its subsidiaries (together Hypo Alpe Adria or HAA) is currently in the process of restructuring.
On 3 September 2013, the European Commission delivered a final ruling on the state aid investigation into Hypo Alpe Adria, which began in May 2009. The basis for the ruling was the final bank restructuring plan submitted at the end of June 2013. The bank is required to comply with the rules for new business included in the restructuring plan until reprivatisation. Furthermore, it is intended that the bank’s SEE network be reprivatised by mid-2015. The closing of the sale of the Austrian subsidiary bank Hypo Alpe-Adria-Bank AG, which was planned for mid-2014, was actually finalised in 2013. Furthermore, the Italian subsidiary bank was forced to close down its lending operations in 2013 and has therefore been allocated for win-ding down. Compliance with the restructuring plan and the behavioural measures that have been imposed will continue to be monitored by an independent monitoring trustee appointed by the European Commission. In accordance with the provisions of the final European Commission ruling, the subsidiary bank Hypo Alpe-Adria-Bank AG (Austria) was sold on 19 December 2013 (closing) following a bidding process lasting several months and careful consideration of submitted offers. This signified the completion of a major milestone in the European Commission’s reprivatisation requirements.
In order to prepare for the sale of the SEE network that is earmarked for reprivatisation, further portfolio transfers were car-ried out in wind-down companies in Slovenia, Croatia, Serbia, Bosnia and Herzegovina and Montenegro, leading to a normali-sation of the key financial figures of the units concerned, particularly net interest income, NPL ratios (non-performing loans) and refinancing capacity (loan/deposit ratio) and a strengthening of key capital figures. These measures were requested in the European Commission ruling on 3 September 2013 in order to increase the attractiveness of the SEE network for potential investors. Further preparatory activities for this sale included the establishment of a network-wide partnership structure in the SEE network and the licensing of the planned SEE management holding company for the next few months. When it comes to the remaining wind-down portfolios, the European Commission ruling provides for a swift, intensive wind-down of these units and portfolios.
The Hypo Alpe Adria restructuring plan reflects the European Commission’s requirements concerning the wind-down of the Italian subsidiary bank, the implementation of measures to aid sale in the form of portfolio transfers, more conservative risk assessments of the SEE portfolio as well as the accelerated sale of the portfolio allocated for wind-down. The resulting losses in the period between 2013 and 2017 mainly concern anticipated disposal losses from the sale of participations and increa-sed risk provisions; these losses were estimated at between EUR -3.58 bn (best case scenario) and EUR -6.33 bn (pessimistic stress case scenario) in the restructuring plan. The corresponding recapitalisation requirements stand at between EUR 2.65 bn (base case scenario) and EUR 5.40 bn (pessimistic stress case scenario) and were approved by the European Commission. The Republic of Austria injected a total of EUR 1.75 bn of capital into the bank in 2013 over the course of three recapitalisation measures. Together with another capital measure in April 2014 totalling EUR 0.75 bn, a total of EUR 2.50 bn was injected into the bank, leaving a remaining EUR 2.90 bn in capital measures still available under the state aid framework approved by the European Commission.
Once it became evident in mid-2013 that the European Commission’s state aid investigation would soon be completed, the Austrian Chancellor and Vice Chancellor formed an expert task force in May 2013 as part of the “Lux” project to investigate the various options available in relation to the implementation of the EU restructuring plan and the best possible liquidation of Hypo Alpe-Adria-Bank International AG’s assets within the scope of a wind-down unit. The task force was headed up by then Chairman of the Supervisory Board Dr. Klaus Liebscher until February 2014. Following Dr. Liebscher’s departure, Aust-rian central bank governor Dr. Ewald Nowotny took over leadership of the task force. On 18 March 2014, following a request by the Federal Minister of Finance, the Austrian government ruled in favour of the implementation of the task force’s proposal and the conversion of Hypo Alpe-Adria-Bank International AG into a deregulated wind-down company under private law wit-hout any general state guarantee until September 2014. The bank is currently focusing on putting these requirements in place.

Annual Report 201338
Hypo Alpe-Adria-Bank d.d.
Notes to the Financial Statements for the year ended 31 December 2013
Within the context of the Joint Risk Assessment & Decision Process (“JRAD”) issued by regulatory authorities that was started in 2011, Hypo Alpe Adria was required to achieve a defined minimum total capital ratio and ensure that the deficit between the expected losses in the area of credit risk and total risk provisions (shortfall) is covered from the date of implementation onwards. At the current time, there has been no new ruling on the JRAD investigation performed by regulatory authorities in 2013 (JRAD III), meaning that the requirements of JRAD II must be complied with as at 31 December 2013. Given current ca-pital funds of EUR 2.7 bn and risk-weighted assets (RWA) of EUR 18.4 bn, the group’s own capital funds ratio is 14.87%. As a result, the first requirement under JRAD II of maintaining an own funds ratio of 12.4% has been met. Current regulatory own capital funds (EUR 2.7 bn) as well as ineligible Tier II components (ineligible due to the cap defined by Basel II) of EUR 0.6 bn can be applied in terms of compliance with the second requirement of JRAD II, namely the coverage of the shortfall through own capital funds. This means that the funds necessary to cover the own capital funds requirement and the shortfall of a total of EUR 2.62 bn are offset by risk capital of EUR 3.37 bn. This equates to a surplus of EUR 0.75 bn, meaning that the second requirement has also been met. Should the SEE network be reprivatised in the near future, it must be expected that the value of the book equity of these banks, approximately EUR 1.3 bn, will not be able to be obtained on the market.
Should there be a material loss before the implementation of the deregulated wind-down unit planned by the government, non-compliance with JRAD capital requirements cannot be ruled out.
Even in consideration of the three recapitalisation measures implemented in 2013 totalling EUR 1.75 bn, the remaining core capital of the bank was unable to be prevented from falling to roughly EUR 0.18 bn. The own capital funds ratio of the parent company, which is determined pursuant to regulatory requirements, amounted to 1.87% as at 31 December 2013, and therefo-re did not meet the statutory minimum of 8.0% defined under Basel II. The core capital gap for meeting the regulatory requi-rements amounts to EUR 0.50 bn. The bank fulfilled its statutory obligations and informed the regulatory authorities imme-diately of these circumstances. The group’s consolidated equity, in which impairment write-downs from lower-than-expected disposal proceeds were not to be considered, came to 14.87% as at 31 December 2013 and met legal requirements (see above).
In the general shareholders’ meeting of Hypo Alpe-Adria-Bank International AG held on 9 April 2014, the Republic of Austria, as the owner of the bank, agreed a capital injection in the form of a share capital increase of EUR 0.75 bn, which was carried out on 11 April 2014. This capital measure was aimed at guaranteeing compliance with regulatory requirements until the im-plementation of a wind-down unit planned for September that, in future, will not require a banking licence and will therefore not be subject to any regulatory minimum capital requirements as defined by the Austrian Banking Act (BWG). The Executive Board based its assessment of Hypo Alpe Adria’s continuation as a going concern on the assumptions underlying the group’s restructuring plan approved by the European Commission and which provides for further capital measures to maintain the going concern assumption and cover anticipated losses over the course of the portfolio wind-down.
Furthermore, as in the past, future economic development is uncertain due to the current volatility on the financial markets.
Taking into consideration all ongoing activities listed above, the Bank‘s management is confident that the restructuring pro-cess of the parent bank and its owner will not have negative impact on the Bank‘s operations in the Republic of Croatia.

Hypo Alpe-Adria-Bank d.d.
Annual Report 2013 39
Notes to the Financial Statements for the year ended 31 December 2013
e) Basis of Consolidation
The financial statements are presented for the Bank and the Group. The Group’s financial statements comprise the consolida-ted financial statements of the Bank and its subsidiary entities.
Subsidiaries are the enterprises controlled by the Bank. Control exists when the Bank has the power, directly or indirectly, to govern the financial and operating policies of an enterprise so as to obtain benefits from its activities. The financial statements of the subsidiaries are included in the Group financial statements on a consolidated basis from the date that control commen-ces until the date that control ceases.
Intra-group balances and transactions, and any unrealised gains arising from intra-group transactions, are eliminated in pre-paring the consolidated financial statements.
Acquisitions and mergers with companies under the group Hypo Alpe Adria common control are not treated as acquisitions in accordance with IFRS 3: Business Combinations.
f ) Interest Income and Expense
Interest income and expense is recognized on the accrual basis, taking into account the effective yield of the asset and liability or an applicable floating rate. Interest income and expense include the amortization of any discount or premium or other dif-ferences between the initial carrying amount of an interest bearing financial instrument and its amount at maturity calculated on an effective interest rate basis.
The effective interest method is a method of calculating the amortised cost of a financial asset and of allocating interest income over the relevant period. The effective interest rate is the rate that exactly discounts estimated future cash receipts (in-cluding all fees on points paid or received that form an integral part of the effective interest rate, transaction costs and other premiums or discounts) through the expected life of the financial asset, or, where appropriate, a shorter period.
Loan origination fees, generated after the approval of the loans are deferred together with the related direct costs, and recog-nized as an adjustment to the effective yield of the loan over its life in „Interest and similar income“ in income statement.
g) Fee and Commission Income and Expense
Fee and commission income arises on financial services provided by the Group and mainly comprises fees receivable from domestic and foreign payment transactions, fees receivable from customers for guarantees, letters of credit, foreign currency transactions and other services provided by the Group.
Fee and commission income is credited to the income, when the corresponding service is provided.
Annual Report 201340
Hypo Alpe-Adria-Bank d.d.
Notes to the Financial Statements for the year ended 31 December 2013
h) Retirement Benefit CostsThe Group does not have pension arrangements separate from the state pension system of the Republic of Croatia. This sys-tem requires that current contributions by the employer be calculated as a percentage of current gross salary payments; these expenses are charged to the income statement in the period the related compensation is earned by the employee.
No liabilities arise to the Group from the payment of pensions to employees in the future.
i) Foreign Currency TransactionsTransactions in foreign currencies are translated into HRK at the rate of exchange ruling at the date of the transaction. Mo-netary assets and liabilities denominated in foreign currencies at the balance sheet date are translated into HRK at the foreign exchange rate ruling at that date. Foreign exchange differences arising on translation are recognized in the income statement. Non-monetary assets and liabilities that are measured in terms of historical cost in a foreign currency are translated using the exchange rate ruling at the date of the transaction. Non-monetary assets and liabilities denominated in foreign currency that are stated at fair value are translated into the reporting currency at the foreign exchange rates ruling at the dates that the values were determined.
The principal rates of exchange set forth by the Croatian National Bank and used in the preparation of the balance sheet of the Bank and the Group at the reporting dates were as follows:
j) Financial InstrumentsFinancial assets held by the Group are categorized into portfolios in accordance with the Group’s intent on the acquisition and pursuant to the Group’s investment strategy. Financial assets are classified as “At fair value through profit and loss”, “Loans and receivables”, “Held to maturity” or as “Assets available for sale”. The principal difference among the portfolios relates to the measurement of financial assets and the recognition of their fair values in the financial statements.
Financial Assets at Fair Value through Profit or Loss
Financial instruments included in this portfolio are held for trading financial instruments, which were either acquired for generating a profit from short term fluctuations in price or dealer’s margin, or are securities included in a portfolio in which a pattern of short term profit taking exists.
These instruments are initially recognized at cost and subsequently stated at fair value which approximates the price quoted on recognized stock exchanges.
All related realized and unrealised gains and losses are included in “Net trading gain”. Interest earned whilst holding these instruments is reported as “Interest and similar income”.
31 December 2013 1 EUR = HRK 7.637643
31 December 2013 1 CHF = HRK 6.231758
31 December 2012 1 EUR = HRK 7.545624
31 December 2012 1 CHF = HRK 6.245343

Hypo Alpe-Adria-Bank d.d.
Annual Report 2013 41
Notes to the Financial Statements for the year ended 31 December 2013
Loans and Receivables
Loans and receivables are non-derivative financial assets with fixed or determinable payments that are not quoted in an active market. All loans and receivables are recognized when cash is advanced to customers. Loan and receivables are measured after initial recognition at amortized cost using the effective interest method, less any allowance for impairment.
Third party expenses, such as legal fees, incurred in securing a loan and other fees, such as loan origination fees are treated as part of the cost of the transaction. Loan origination fees are deferred (together with related direct costs) and recognized as an adjustment to the effective yield of the loan.
Loans and receivables are stated net of allowances for impairment losses. Allowances for impairment losses are established if there is objective evidence that the Group will not be able to collect all amounts due. The amount of the allowance for impair-ment losses is the difference between the carrying amount and the recoverable amount, being the present value of expected cash flows, including amounts recoverable from guarantees and collateral, discounted at the original effective interest rate of loans computed at initial recognition.
Specific allowances for impairment losses are assessed with reference to the credit worthiness and performance of the borro-wer and are taking into account the value of any collateral or third party guarantees.
When a loan is known to be uncollectible, all the necessary legal procedures have been completed, and the final loss has been determined, the loan is written off. If in a subsequent period, the amount of allowance decreases and the decrease can be linked objectively to an event occurring after the write-down, the write-down or allowance is reversed through the income statement.
In addition to the above described impairment losses on assets identified as impaired, the Group recognizes impairment los-ses, in the income statement, on on- and off-balance-sheet credit risk exposures not identified as impaired at rates which are not less than 0.8%, in accordance with the accounting regulations of the Croatian National Bank (“CNB”).
Available for Sale Financial Assets
Available for sale financial assets are those non-derivative financial assets that are designated as available for sale or are not classified as financial assets at fair value through profit or loss or loans and receivables.
Financial instruments included in available for sale financial assets are initially recognized at cost and subsequently stated at fair value based on the quoted prices, or amounts derived from cash flow models. If estimated fair value is not reliable or its value significantly fluctuates, assets are recognized at cost.
For available for sale financial assets, gains and losses arising from changes in fair value are recognized in other comprehensive income, until the security is disposed of or is determined to be impaired, at which time the cumulative gain or loss previously recognized in other comprehensive income is included in the income statement for the period.
Impairment losses recognized in the income statement for equity investments classified as available for sale are not subse-quently reversed through the income statement. Impairment losses recognized in the income statement for debt instruments classified as available for sale are subsequently reversed if an increase in the fair value of the instrument can be objectively related to an event occurring after the recognition of the impairment loss.
Interest earned whilst holding available for sale securities is accrued on a daily basis and reported as “Interest and similar income” in the income statement.
Annual Report 201342
Hypo Alpe-Adria-Bank d.d.
Notes to the Financial Statements for the year ended 31 December 2013
Foreign exchange differences related to available for sale equity instruments held in foreign currency are reported together with fair value gains and losses in other comprehensive income until the financial asset is sold. Foreign exchange differences related to available for sale debt instruments held in foreign currency are reported in income statements.
Dividends on available for sale financial assets are recorded as declared and included as a receivable in the balance sheet line “Other assets” and in “Other operating income” in the income statement. Upon payment of the dividend, the receivable is offset against the collected cash.
k) Recognition and Derecognition of Financial AssetsPurchases and sales of financial assets at fair value through profit or loss and financial assets available for sale are recognised on the settlement date, which is the date when the financial instrument is delivered to or transferred from the Group.
Loans and receivables and financial liabilities at amortised cost are recognised when funds are advanced or received.
The Group derecognises a financial asset only when the contractual rights to the cash flows from the asset expire, or it trans-fers the financial asset and substantially all the risks and rewards of ownership of the asset to another entity. If the Group neither transfers nor retains substantially all the risks and rewards of ownership and continues to control the transferred asset, the Group recognises its retained interest in the asset and an associated liability for amounts it may have to pay.
If the Group retains substantially all the risks and rewards of ownership of a transferred financial asset, the Group continues to recognise the financial asset and also recognises a collateralised borrowing for the proceeds received.
l) Derivative Financial InstrumentsIn the normal course of business, the Group uses derivative financial instruments to manage its risks. The use of financial derivatives is governed by the Group’s policies approved by the Supervisory Board, which provide written principles on the use of financial derivatives.
Derivative financial instruments are initially recognised at acquiring cost and subsequently remeasured at their fair value. Fair values are obtained from quoted market prices, discounted cash flow models and option pricing models as appropriate. Fair value adjustments of derivative financial instruments are recognised in the income statement.
All derivatives are carried as assets, when the fair value is positive and as liabilities when the fair value is negative.
m) Property, Plant and EquipmentProperty, plant and equipment, except land and buildings are stated at cost less accumulated depreciation and impairment losses, if any. Cost includes the purchase price and directly associated cost of bringing the asset to a working condition for its intended use. Maintenance and repairs, replacements and improvements of minor importance are expensed as incurred. Depreciation commences when the assets are ready for their intended use. Depreciation is calculated on all assets, except land and assets in construction, on a straight-line basis over the estimated useful life of the applicable assets.

Hypo Alpe-Adria-Bank d.d.
Annual Report 2013 43
Notes to the Financial Statements for the year ended 31 December 2013
The annual rates of depreciation are as follows:
Land and buildings are stated in the balance sheet at their revalued amounts, being the fair value at the date of revaluation, less any subsequent accumulated depreciation and subsequent accumulated impairment losses. Revaluations are performed with sufficient regularity such that the carrying amounts do not differ materially from those that would be determined using fair values at the balance sheet date.
Any revaluation increase arising on the revaluation of such land and buildings is recognised in other comprehensive income, except to the extent that it reverses a revaluation decrease for the same asset previously recognised in profit or loss, in which case the increase is credited to profit or loss to the extent of the decrease previously charged. A decrease in the carrying amount arising on the revaluation of such land and buildings is recognised in profit or loss to the extent that it exceeds the balance, if any, held in the properties revaluation reserve relating to a previous revaluation of that asset.
Depreciation on revalued buildings is charged to profit or loss. The amount of the surplus transferred directly to “Retained earnings” is the difference between depreciation based on the revalued carrying amount of the building and depreciation based on the building’s original cost. On the subsequent sale or retirement of a revalued property, the attributable revaluation surplus remaining in the revaluation reserve is transferred directly to retained earnings.
Assets held under finance leases are depreciated over their expected useful lives on the same basis as owned assets or, where shorter, the term of the relevant lease.
The gain or loss arising on the disposal or retirement of an item of property, plant and equipment is determined as the difference between the sales proceeds and the carrying amount of the asset and is recognised in profit or loss in the year of disposal.
When the use of property changes from owner-occupied to rented, the property is reclassified to investment property.
n) Investment propertyInvestment property is property held by the Group to earn rentals or for capital appreciation or for both, but not for sale in the ordinary course of business or for administrative purposes. Investment property is measured initially at its cost, including transaction costs. Subsequently, investment property is stated at cost less accumulated depreciation and any impairment loss. Investment property is depreciated on a straight-line basis over a period of 20 to 50 years (2012: 20 to 50 years). Investment property is derecognised when it has been disposed. Any gains or losses on the disposal of investment property are recognised in the income statement in the year of disposal.
Investment property is stated in the balance sheet at their revalued amounts, being the fair value at the date of revaluation, less any subsequent accumulated depreciation and subsequent accumulated impairment losses. Any revaluation increase arising on the revaluation of investment property is recognised in other comprehensive income, except to the extent that it reverses a
2013 2012
Buildings 2% - 5% 2% - 5%
Equipment and computers 10% -20% 10% -20%
Equipment bought after leasing contract maturity 20% - 100% 20% - 100%
Other 10% - 20% 10% - 20%
Annual Report 201344
Hypo Alpe-Adria-Bank d.d.
Notes to the Financial Statements for the year ended 31 December 2013
revaluation decrease for the same asset previously recognised in profit or loss, in which case the increase is credited to profit or loss to the extent of the decrease previously charged. A decrease in the carrying amount arising on the revaluation is recog-nised in profit or loss to the extent that it exceeds the balance, if any, held in the properties revaluation reserve relating to a previous revaluation of that asset.
o) Intangible AssetsIntangible assets are recognized if it is probable that the future economic benefits that are attributable to the asset will flow to the enterprise and the cost of the asset can be measured reliably. Intangible assets are stated at cost less accumulated amortiza-tion and impairment losses, if any. Intangible assets are amortized on a straight line basis over the best estimate of their useful lives. The amortization period and the amortization method are reviewed at each reporting period.
Intangible assets are amortized over a period of 4 to 10 years (2012: 4 to 10 years).
p) Impairment of Non-Financial AssetsProperty, plant and equipment, investment property and intangible assets are reviewed for impairment whenever events or changes in the circumstances indicate that the carrying amount of an asset may not be recoverable. Whenever the carrying amount of an asset exceeds its recoverable amount, an impairment loss is recognized in income statement for assets carried at cost and treated as a revaluation decrease for assets that are carried at their revalued amount, to the extent that the impair-ment loss does not exceed the amount held in the revaluation surplus for the same asset. The recoverable amount is the higher of an asset’s net selling price and its value in use.
q) LeasesLeases of assets in terms of which the Group retains all the risks and rewards of ownership are classified as finance leases. Assets held under finance leases are initially recognised as assets of the Group at their fair value at the inception of the lease or, if lower, at the present value of the minimum lease payments. The corresponding liability to the lessor is included in the statement of financial position as a finance lease obligation. Leases of assets under which the risks and rewards of ownership are effectively retained with the lessor are classified as operating lease arrangements. Lease payments under operating lease are recognised as expenses on a straight-line basis over the lease term and included in other operating expenses.
Assets leased under operating lease arrangements where the Group is the lessor are included in tangible assets in the state-ment of financial position. They are depreciated over their expected useful lives which are based on the duration of the lease contracts. Initial direct costs incurred specifically to earn revenues from an operating lease are recognised as an expense in the income statement in the period in which they are incurred.

Hypo Alpe-Adria-Bank d.d.
Annual Report 2013 45
Notes to the Financial Statements for the year ended 31 December 2013
r) Sale and Repurchase Agreements
If a financial asset is sold under an agreement to repurchase it at a fixed price or at the sale price plus a lender’s return or if it is loaned under an agreement to return it to the transferor, it is not derecognised, because the Group retains substantially all the risks and rewards of ownership.
Securities sold under sale and repurchase agreements (“repos”) are recorded as assets in the balance sheet lines of assets in the original classification or the Group reclassifies the asset on its balance sheet. The counterparty liability is included in “Due to other banks” or “Due to customers”, as appropriate.
Securities purchased under agreements to purchase and resell (“reverse repos”) are not recognised in the balance sheet. The purchase consideration is recorded as increase of “Placements with and loans to other banks” or “Loans and receivables” as ap-propriate, with the corresponding decrease in cash. The difference between the sale and repurchase price is treated as interest and accrued evenly over the life of the repo agreement using the effective interest rate.
s) Provisions for Liabilities and Charges
Provisions are recognised when the Group has a present legal or constructive obligation as a result of past events, it is probable that an outflow of resources embodying economic benefits will be required to settle the obligation and a reliable estimate of the amount of the obligation can be made.
Provisions for liabilities and charges are maintained at the level that the Group‘s management considers sufficient for absorp-tion of incurred losses. The management determines the sufficiency of provisions on the basis of insight into specific items, current economic circumstances, risk characteristics of certain transaction categories, as well as other relevant factors.
Provisions are released only for expenditures in respect of which provisions are recognised at inception, and reversed if out-flow of economic benefits to settle the obligation is no longer probable.
t) Off Balance Sheet Financial Commitments
In the ordinary course of business, the Group enters into credit related commitments, which are recorded in off-balance sheet accounts and primarily include guarantees, letters of credit and undrawn loan commitments. Such financial commitments are recorded in the Group’s balance sheet if and when they become payable.
The provision for possible commitments and contingent liabilities losses is maintained at a level the Group management believes is adequate to absorb probable future losses. The Group Management Board determines the adequacy of the provision based upon reviews of individual items, recent loss experience, current economic conditions, the risk characteristics of the various categories of transactions and other pertinent factors.
u) Taxation
Income tax expense represents the sum of the tax currently payable and deferred tax.
The tax expense is based on taxable income for the year. Taxable income differs from net income as reported in the income statement because it excludes items of income or expense that are taxable or deductible in other years and it further excludes items that are never taxable or deductible. The Group’s liability for current tax is calculated using tax rates that have been enacted or substantively enacted by the balance sheet date.
Annual Report 201346
Hypo Alpe-Adria-Bank d.d.
Notes to the Financial Statements for the year ended 31 December 2013
Deferred tax is the tax expected to be payable or recoverable on differences between the carrying amount of assets and liabili-ties in the financial statements and the corresponding tax basis used in the computation of taxable profit, and is accounted for using the balance sheet liability method. Deferred tax liabilities are generally recognized for all taxable temporary differences and deferred tax assets are recognized to the extent that it is probable that taxable profits will be available against which de-ductible temporary differences can be utilized.
The carrying amount of deferred tax assets is reviewed at each balance sheet date and reduced to the extent that it is no longer probable that sufficient taxable profit will be available to allow all or part of the asset to be recovered. Deferred tax is calcu-lated at the tax rates that are expected to apply in the period when the liability is settled or the asset realized. Deferred tax is charged or credited in the income statement and statement of the comprehensive income respectively.
The Group’s tax returns are subject to examination by the tax authorities. Because the application of tax laws and regulations to many types of transactions is susceptible to varying interpretations, the amount reported in the annual financial statements could be changed at a later date upon final determination by the tax authorities.
v) Cash and Cash Equivalents for the Purpose of Cash Flow Statement
For the purpose of reporting cash flows, cash and cash equivalents are defined as cash and cash equivalents with maturity up to 90 days, which comprise of cash and current accounts and placements with and loans to other banks, balances with Croati-an National Bank (excluding the obligatory minimum reserve with the Croatian National Bank), and treasury bills.
Cash and cash equivalents exclude the obligatory minimum reserve with the Croatian National Bank as these funds are not available for the Group’s day to day operations.
w) Changes in disclosures and restatements in financial statements
Certain balances included in the corresponding figures have been reclassified to conform to the current year presentation.
The reclassification was done in 2013 order to align the presentation of certain balance sheet positions to IAS 16 and IAS 40 requirements: buildings and land held to earn rentals were reclassified from balance sheet position “Property, plant and equipment” to balance sheet position “Investment property”. The reclassification was only of presentational nature and did not affect profit for the year or value of net assets at the end of 2013 and at the end 2012. In accordance with IAS 1.38, the reclassi-fication of corresponding figures was carried out in order to enhance inter-period comparability of information.
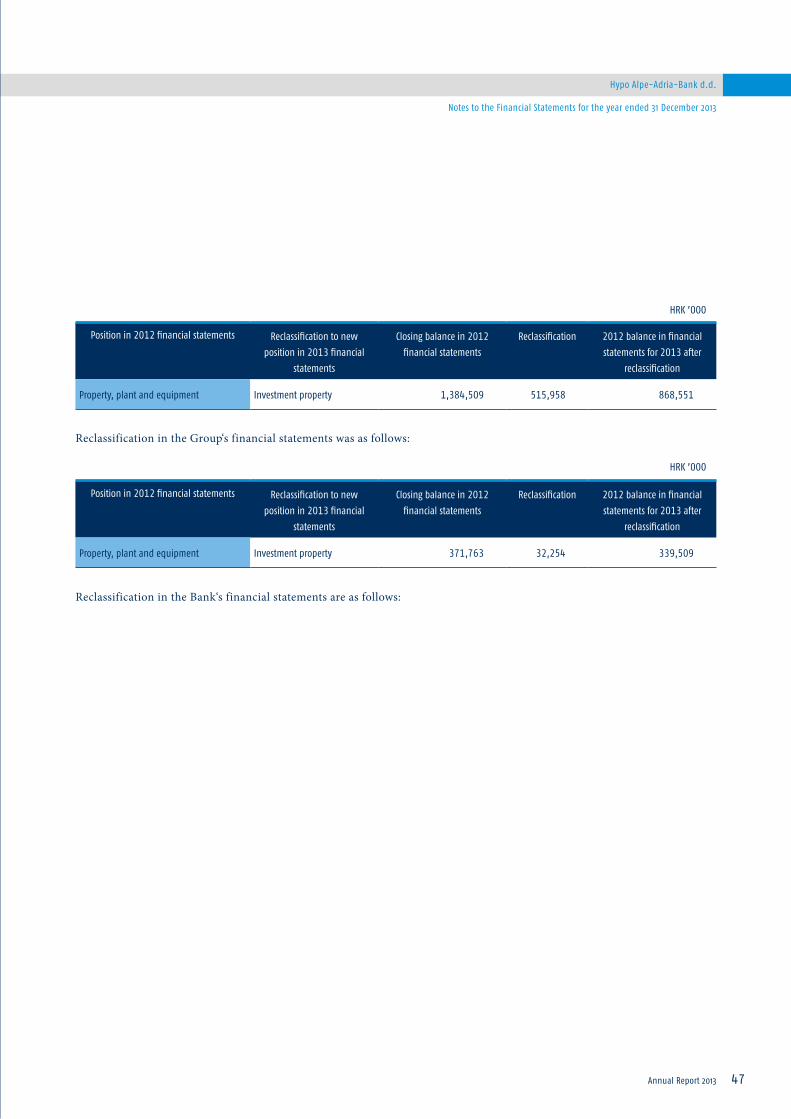
Hypo Alpe-Adria-Bank d.d.
Annual Report 2013 47
Notes to the Financial Statements for the year ended 31 December 2013
Reclassification in the Group‘s financial statements was as follows:
Reclassification in the Bank‘s financial statements are as follows:
Position in 2012 financial statements Reclassification to new position in 2013 financial
statements
Closing balance in 2012 financial statements
Reclassification 2012 balance in financial statements for 2013 after
reclassification
Property, plant and equipment Investment property 1,384,509 515,958 868,551
Position in 2012 financial statements Reclassification to new position in 2013 financial
statements
Closing balance in 2012 financial statements
Reclassification 2012 balance in financial statements for 2013 after
reclassification
Property, plant and equipment Investment property 371,763 32,254 339,509
HRK ’000
HRK ’000
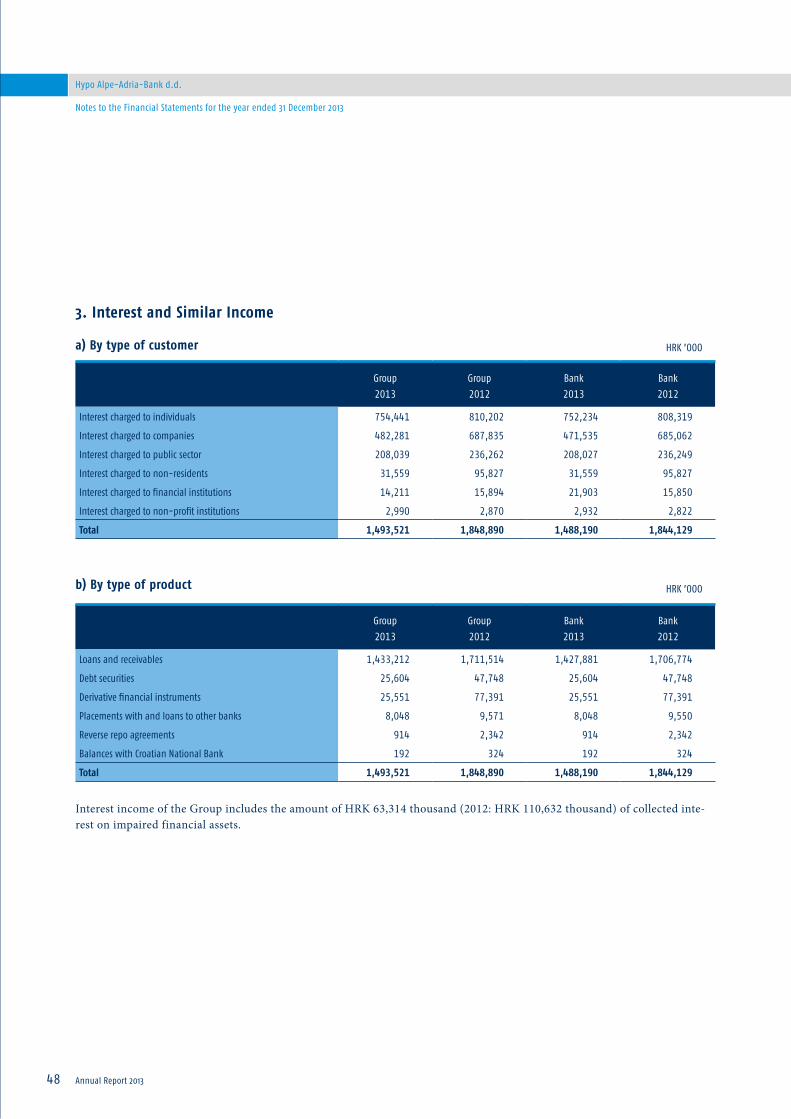
Annual Report 201348
Hypo Alpe-Adria-Bank d.d.
Notes to the Financial Statements for the year ended 31 December 2013
3. Interest and Similar Income
a) By type of customer
b) By type of product
Interest income of the Group includes the amount of HRK 63,314 thousand (2012: HRK 110,632 thousand) of collected inte-rest on impaired financial assets.
Group2013
Group2012
Bank2013
Bank2012
Loans and receivables 1,433,212 1,711,514 1,427,881 1,706,774
Debt securities 25,604 47,748 25,604 47,748
Derivative financial instruments 25,551 77,391 25,551 77,391
Placements with and loans to other banks 8,048 9,571 8,048 9,550
Reverse repo agreements 914 2,342 914 2,342
Balances with Croatian National Bank 192 324 192 324
Total 1,493,521 1,848,890 1,488,190 1,844,129
Group2013
Group2012
Bank2013
Bank2012
Interest charged to individuals 754,441 810,202 752,234 808,319
Interest charged to companies 482,281 687,835 471,535 685,062
Interest charged to public sector 208,039 236,262 208,027 236,249
Interest charged to non-residents 31,559 95,827 31,559 95,827
Interest charged to financial institutions 14,211 15,894 21,903 15,850
Interest charged to non-profit institutions 2,990 2,870 2,932 2,822
Total 1,493,521 1,848,890 1,488,190 1,844,129
HRK ’000
HRK ’000

Hypo Alpe-Adria-Bank d.d.
Annual Report 2013 49
Notes to the Financial Statements for the year ended 31 December 2013
4. Interest expense and Similar Charges
a) By type of customer
b) By type of product
Group2013
Group2012
Bank2013
Bank2012
Interest charged by individuals 390,157 431,656 390,156 431,656
Interest charged by non-residents 315,976 565,540 303,415 544,761
Interest charged by financial institutions 71,188 100,352 71,460 101,181
Interest charged by companies 47,510 74,106 48,448 75,119
Interest charged by public sector 5,431 13,715 5,431 13,715
Interest charged by non-profit institutions 1,760 1,691 1,760 1,691
Total 832,022 1,187,060 820,670 1,168,123
Group2013
Group2012
Bank2013
Bank2012
Due to customers 526,186 636,040 527,397 637,884
Subordinated debt 135,255 134,428 135,255 134,428
Due to other banks 134,042 354,186 121,479 333,405
Repo agreements 18,572 19,384 18,572 19,384
Derivative financial instruments 17,967 43,022 17,967 43,022
Total 832,022 1,187,060 820,670 1,168,123
HRK ’000
HRK ’000

Annual Report 201350
Hypo Alpe-Adria-Bank d.d.
Notes to the Financial Statements for the year ended 31 December 2013
5. Fee and Commission Income
Fees from services include fees for payment services, fees for approval of overdrafts, guarantees and letters of credit, fees for card business services and other fees.
6. Fee and Commission Expense
Group2013
Group2012
Bank2013
Bank2012
Fees from services to companies 126,700 139,807 122,249 136,080
Fees from services to individuals 105,703 109,251 105,703 109,251
Fees from financial institutions 31,758 29,555 32,094 29,770
Fees from services to non-residents 9,175 10,637 9,175 10,637
Fees from public sector 3,857 4,908 3,857 4,908
Fees from non-profit institutions 2,245 2,098 2,245 2,098
Total 279,438 296,256 275,323 292,744
Group2013
Group2012
Bank2013
Bank2012
Commissions for services of non-residents 28,776 37,279 28,776 37,280
Commissions for services of FINA (clearing house) 21,985 25,394 21,949 25,393
Commissions for services of financial institutions 10,121 10,865 10,051 10,822
Commissions for services of other companies 1,593 1,540 1,115 1,166
Total 62,475 75,078 61,891 74,661
HRK ’000
HRK ’000

Hypo Alpe-Adria-Bank d.d.
Annual Report 2013 51
Notes to the Financial Statements for the year ended 31 December 2013
7. Net Trading Gain
8. Net Foreign Exchange Differences
Common Croatian banking practice involves the pegging of HRK loans to a stable foreign currency, usually EUR or CHF. Any gain or loss as a result of the above noted pegging is shown as profit or loss, and is included in the net “foreign currency clause” adjustments caption.
Group2013
Group2012
Bank2013
Bank2012
Gains from trading in derivatives 79,922 72,610 79,921 72,609
Net gain on foreign exchange transactions 53,234 49,598 53,234 49,598
Realized gains from available for sale financial assets 513 2,032 3,085 1,807
Realized gains from financial assets held for trading 2,129 1,819 2,129 2,674
Fair value adjustment of financial assets held for trading 406 263 406 263
Total 136,204 126,322 138,775 126,951
Group2013
Group2012
Bank2013
Bank2012
Net “foreign currency clause” adjustments 98,132 49,494 92,619 51,722
Translation losses (129,426) (95,078) (115,927) (92,106)
Total (31,294) (45,584) (23,308) (40,384)
HRK ’000
HRK ’000
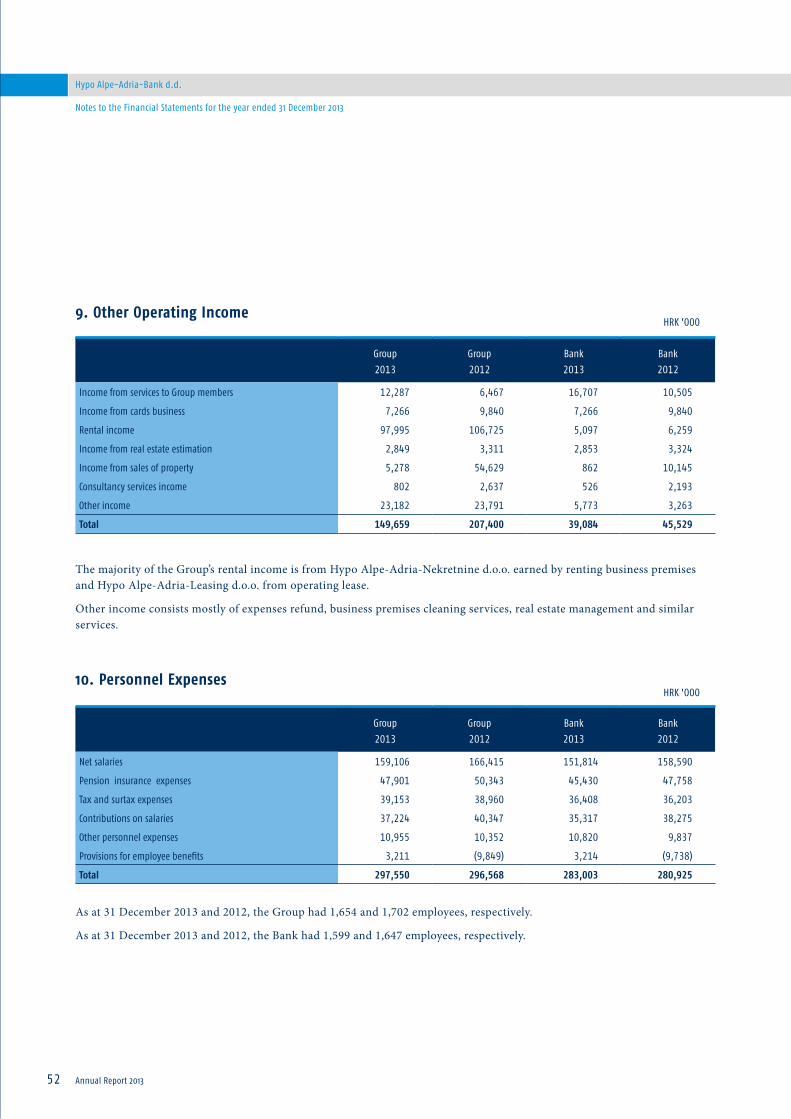
Annual Report 201352
Hypo Alpe-Adria-Bank d.d.
Notes to the Financial Statements for the year ended 31 December 2013
9. Other Operating Income
The majority of the Group’s rental income is from Hypo Alpe-Adria-Nekretnine d.o.o. earned by renting business premises and Hypo Alpe-Adria-Leasing d.o.o. from operating lease.
Other income consists mostly of expenses refund, business premises cleaning services, real estate management and similar services.
10. Personnel Expenses
As at 31 December 2013 and 2012, the Group had 1,654 and 1,702 employees, respectively.
As at 31 December 2013 and 2012, the Bank had 1,599 and 1,647 employees, respectively.
Group2013
Group2012
Bank2013
Bank2012
Income from services to Group members 12,287 6,467 16,707 10,505
Income from cards business 7,266 9,840 7,266 9,840
Rental income 97,995 106,725 5,097 6,259
Income from real estate estimation 2,849 3,311 2,853 3,324
Income from sales of property 5,278 54,629 862 10,145
Consultancy services income 802 2,637 526 2,193
Other income 23,182 23,791 5,773 3,263
Total 149,659 207,400 39,084 45,529
Group2013
Group2012
Bank2013
Bank2012
Net salaries 159,106 166,415 151,814 158,590
Pension insurance expenses 47,901 50,343 45,430 47,758
Tax and surtax expenses 39,153 38,960 36,408 36,203
Contributions on salaries 37,224 40,347 35,317 38,275
Other personnel expenses 10,955 10,352 10,820 9,837
Provisions for employee benefits 3,211 (9,849) 3,214 (9,738)
Total 297,550 296,568 283,003 280,925
HRK ’000
HRK ’000
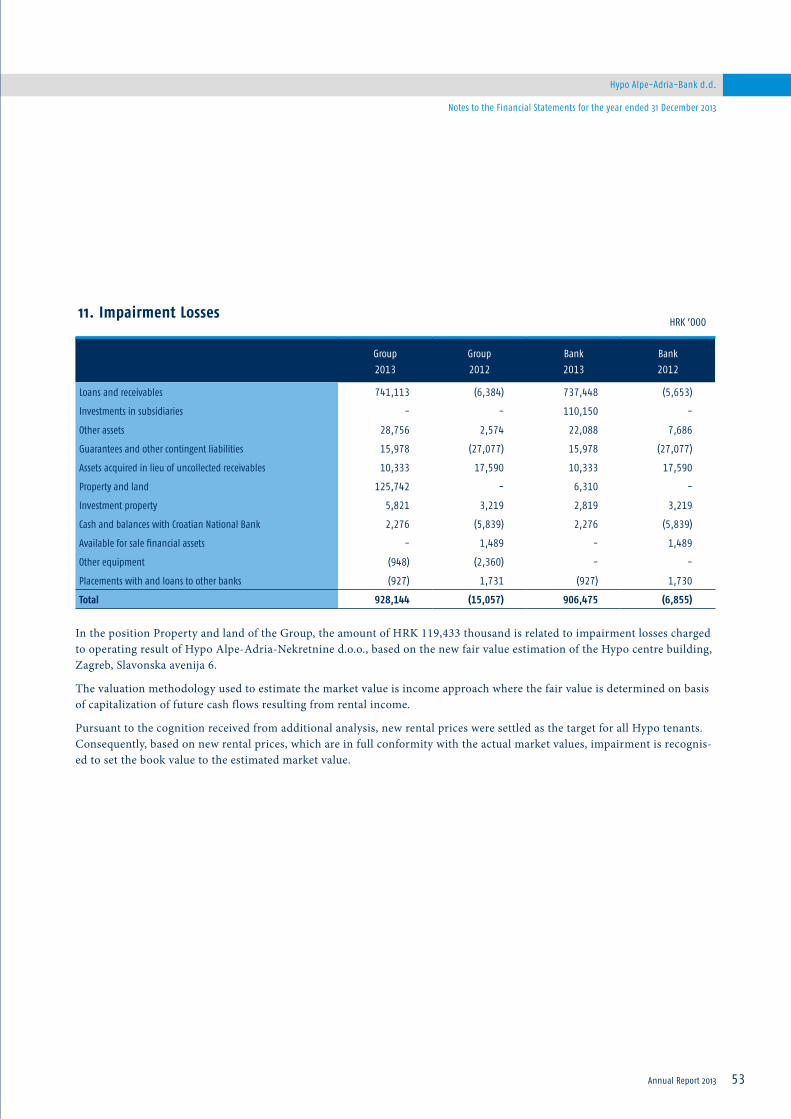
Hypo Alpe-Adria-Bank d.d.
Annual Report 2013 53
Notes to the Financial Statements for the year ended 31 December 2013
11. Impairment Losses
In the position Property and land of the Group, the amount of HRK 119,433 thousand is related to impairment losses charged to operating result of Hypo Alpe-Adria-Nekretnine d.o.o., based on the new fair value estimation of the Hypo centre building, Zagreb, Slavonska avenija 6.
The valuation methodology used to estimate the market value is income approach where the fair value is determined on basis of capitalization of future cash flows resulting from rental income.
Pursuant to the cognition received from additional analysis, new rental prices were settled as the target for all Hypo tenants. Consequently, based on new rental prices, which are in full conformity with the actual market values, impairment is recognis-ed to set the book value to the estimated market value.
Group2013
Group2012
Bank2013
Bank2012
Loans and receivables 741,113 (6,384) 737,448 (5,653)
Investments in subsidiaries - - 110,150 -
Other assets 28,756 2,574 22,088 7,686
Guarantees and other contingent liabilities 15,978 (27,077) 15,978 (27,077)
Assets acquired in lieu of uncollected receivables 10,333 17,590 10,333 17,590
Property and land 125,742 - 6,310 -
Investment property 5,821 3,219 2,819 3,219
Cash and balances with Croatian National Bank 2,276 (5,839) 2,276 (5,839)
Available for sale financial assets - 1,489 - 1,489
Other equipment (948) (2,360) - -
Placements with and loans to other banks (927) 1,731 (927) 1,730
Total 928,144 (15,057) 906,475 (6,855)
HRK ’000
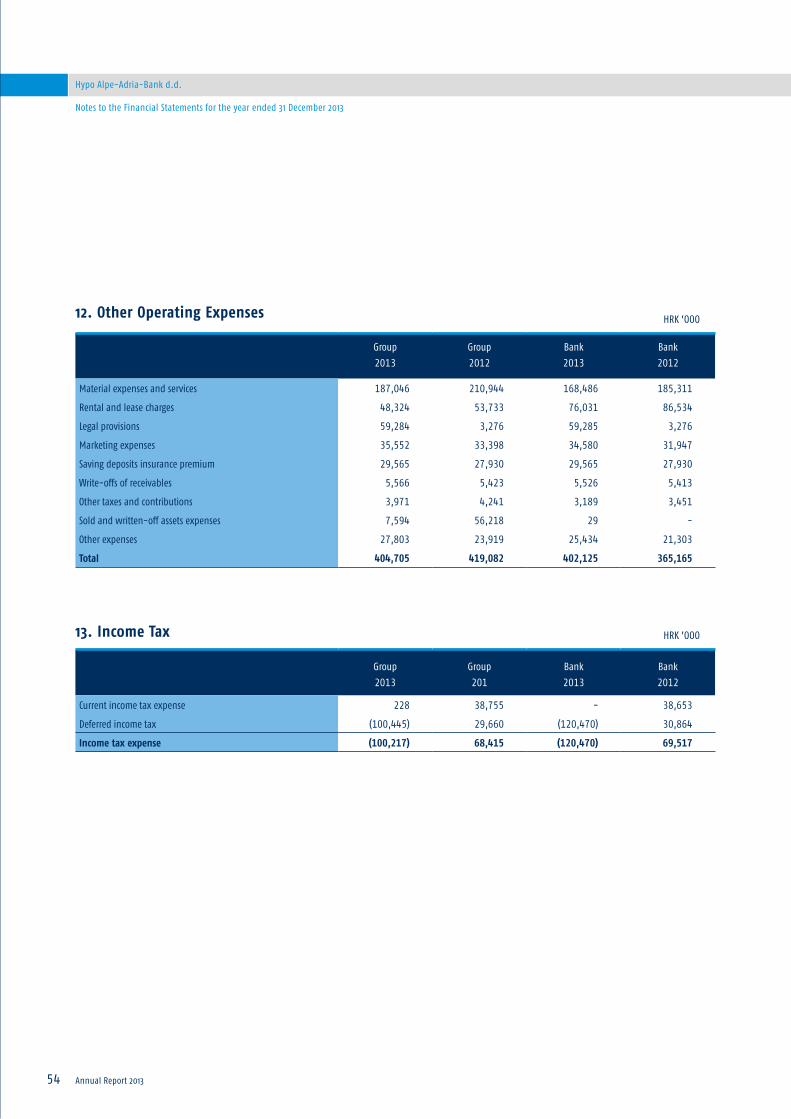
Annual Report 201354
Hypo Alpe-Adria-Bank d.d.
Notes to the Financial Statements for the year ended 31 December 2013
12. Other Operating Expenses
13. Income Tax
Group2013
Group2012
Bank2013
Bank2012
Material expenses and services 187,046 210,944 168,486 185,311
Rental and lease charges 48,324 53,733 76,031 86,534
Legal provisions 59,284 3,276 59,285 3,276
Marketing expenses 35,552 33,398 34,580 31,947
Saving deposits insurance premium 29,565 27,930 29,565 27,930
Write-offs of receivables 5,566 5,423 5,526 5,413
Other taxes and contributions 3,971 4,241 3,189 3,451
Sold and written-off assets expenses 7,594 56,218 29 -
Other expenses 27,803 23,919 25,434 21,303
Total 404,705 419,082 402,125 365,165
Group2013
Group201
Bank2013
Bank2012
Current income tax expense 228 38,755 - 38,653
Deferred income tax (100,445) 29,660 (120,470) 30,864
Income tax expense (100,217) 68,415 (120,470) 69,517
HRK ’000
HRK ’000

Hypo Alpe-Adria-Bank d.d.
Annual Report 2013 55
Notes to the Financial Statements for the year ended 31 December 2013
The reconciliation between tax expense and accounting profit is as follows:
As at 31 December 2013 the Group had tax losses carried forward amounting to HRK 573,318 thousand (2012: HRK 53,923 thousand). Such tax losses may only be used by the company that incurred the loss to reduce taxable profits of the following five years after the years in which the loss incurred.
Deferred tax asset related to unused tax losses of HRK 31,033 thousand (2012: HRK 43,463 thousand) in the subsidiary Hypo Alpe-Adria-Nekretnine d.o.o. has not been recognized as it is not probable that tax losses carried forward will be utilised during the period of the next 5 years. The availability of tax losses available for offset against taxable income in future periods, calculated at the tax rate of 20% enacted at the reporting date, subject to review by Ministry of Finance, is as follows:
Group2013
Group2012
Bank2013
Bank2012
Net profit before tax (630,637) 340,320 (621,789) 326,492
Tax at the statutory rate of 20% (126,127) 68,064 (124,358) 65,298
Tax effect of non-taxable income (2,091) (3,565) (564) (697)
Tax effect of non-deductible costs 5,351 5,704 4,452 4,916
Tax effect from consolidated companies 22,650 (1,788) - -
Income tax reported in the income statement (100,217) 68,415 (120,470) 69,517
Effective tax rate 16% 20% 19% 21%
2013 2012
No more than 1 year 8,387 -
No more than 2 years 20,968 20,817
No more than 3 years 1,678 20,968
No more than 4 years - 1,678
No more than 5 years - -
Total net tax losses carried forward not recognised as deferred tax asset 31,033 43,463
HRK ’000
HRK ’000
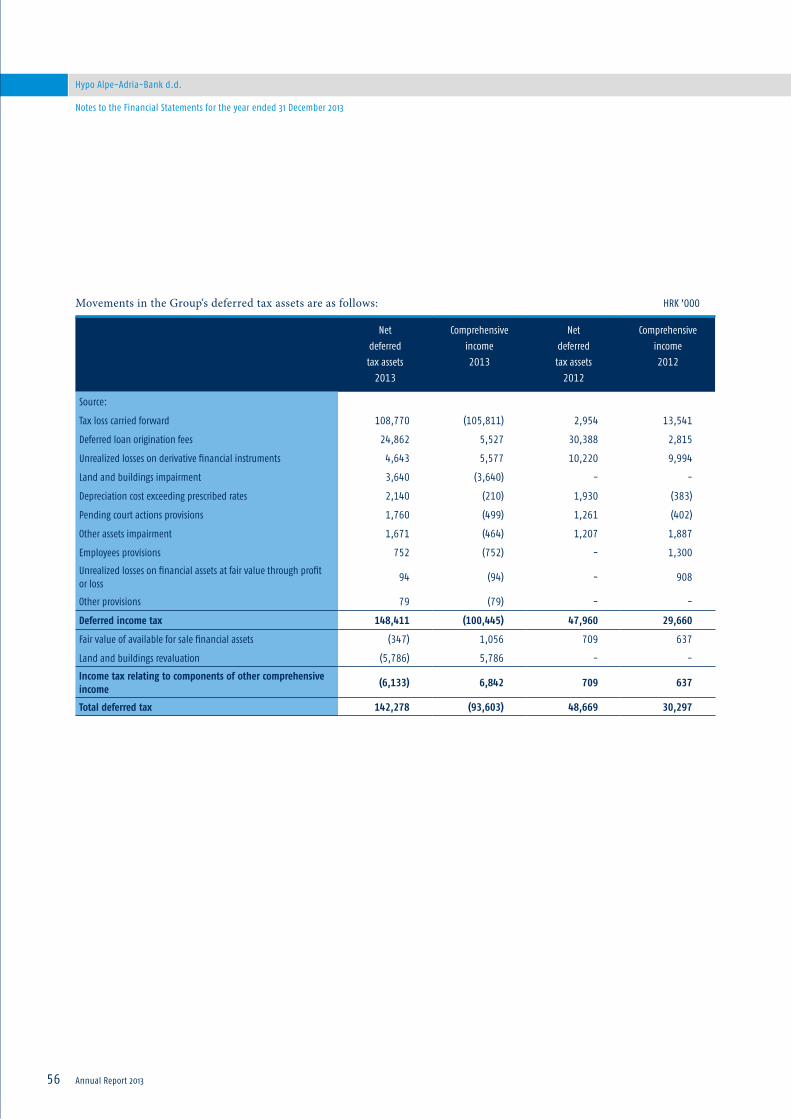
Annual Report 201356
Hypo Alpe-Adria-Bank d.d.
Notes to the Financial Statements for the year ended 31 December 2013
Movements in the Group‘s deferred tax assets are as follows:
Netdeferred tax assets
2013
Comprehensiveincome2013
Netdeferred tax assets
2012
Comprehensiveincome2012
Source:
Tax loss carried forward 108,770 (105,811) 2,954 13,541
Deferred loan origination fees 24,862 5,527 30,388 2,815
Unrealized losses on derivative financial instruments 4,643 5,577 10,220 9,994
Land and buildings impairment 3,640 (3,640) - -
Depreciation cost exceeding prescribed rates 2,140 (210) 1,930 (383)
Pending court actions provisions 1,760 (499) 1,261 (402)
Other assets impairment 1,671 (464) 1,207 1,887
Employees provisions 752 (752) - 1,300
Unrealized losses on financial assets at fair value through profit or loss
94 (94) - 908
Other provisions 79 (79) - -
Deferred income tax 148,411 (100,445) 47,960 29,660
Fair value of available for sale financial assets (347) 1,056 709 637
Land and buildings revaluation (5,786) 5,786 - -
Income tax relating to components of other comprehensive income
(6,133) 6,842 709 637
Total deferred tax 142,278 (93,603) 48,669 30,297
HRK ’000
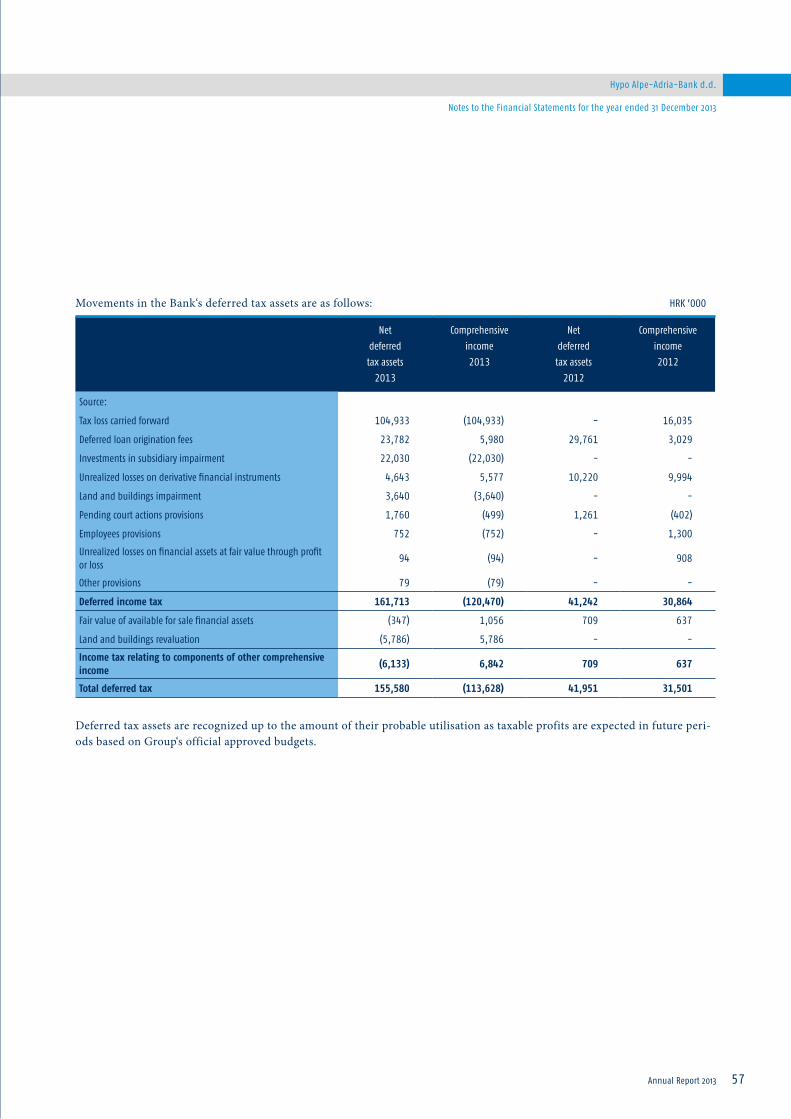
Hypo Alpe-Adria-Bank d.d.
Annual Report 2013 57
Notes to the Financial Statements for the year ended 31 December 2013
Movements in the Bank‘s deferred tax assets are as follows:
Deferred tax assets are recognized up to the amount of their probable utilisation as taxable profits are expected in future peri-ods based on Group‘s official approved budgets.
Netdeferred tax assets
2013
Comprehensiveincome2013
Netdeferred tax assets
2012
Comprehensiveincome2012
Source:
Tax loss carried forward 104,933 (104,933) - 16,035
Deferred loan origination fees 23,782 5,980 29,761 3,029
Investments in subsidiary impairment 22,030 (22,030) - -
Unrealized losses on derivative financial instruments 4,643 5,577 10,220 9,994
Land and buildings impairment 3,640 (3,640) - -
Pending court actions provisions 1,760 (499) 1,261 (402)
Employees provisions 752 (752) - 1,300
Unrealized losses on financial assets at fair value through profit or loss
94 (94) - 908
Other provisions 79 (79) - -
Deferred income tax 161,713 (120,470) 41,242 30,864
Fair value of available for sale financial assets (347) 1,056 709 637
Land and buildings revaluation (5,786) 5,786 - -
Income tax relating to components of other comprehensive income
(6,133) 6,842 709 637
Total deferred tax 155,580 (113,628) 41,951 31,501
HRK ’000

Annual Report 201358
Hypo Alpe-Adria-Bank d.d.
Notes to the Financial Statements for the year ended 31 December 2013
14. Cash and Balances with Croatian National Bank
The Bank calculates obligatory reserves of the Croatian National Bank (the “CNB”) in the amount of 12% (2012: 13.5%) of deposits. At least 70% (2012: 70%) of HRK obligatory reserves and 60% (2012: 60%) of foreign currency obligatory reserves have to be held with the CNB. The remaining amount can be held on accounts with the investment rated OECD banks and countries or as a balance in the settlement account and account for covering the negative balance in the clearing account with the National Clearing System.
According to the CNB decision obligatory reserve is not bearing remuneration.
Movement in impairment losses of cash and balances with the CNB:
Group2013
Group2012
Bank2013
Bank2012
Cash in hand and on CNB accounts 1,294,546 1,145,017 1,294,536 1,145,013
Nostro accounts and balances with other banks 201,294 533,225 201,294 533,225
Total cash and accounts with banks 1,495,840 1,678,242 1,495,830 1,678,238
Obligatory reserve in domestic currency 1,696,179 2,337,141 1,696,179 2,337,141
Obligatory reserve in foreign currency 408,356 595,842 408,356 595,842
Other deposits 208,412 - 208,412 -
Total balances with Croatian National Bank 2,312,947 2,932,983 2,312,947 2,932,983
Impairment losses (40,223) (37,948) (40,223) (37,948)
Total 3,768,564 4,573,277 3,768,554 4,573,273
Group2013
Unidentified
Group2012
Unidentified
Bank2013
Unidentified
Bank2012
Unidentified
Impairment losses at the beginning of the year 37,948 43,787 37,948 43,787
Net allowances/(releases) charged during the year 2,275 (5,839) 2,275 (5,839)
Impairment losses at the end of the year 40,223 37,948 40,223 37,948
HRK ’000
HRK ’000
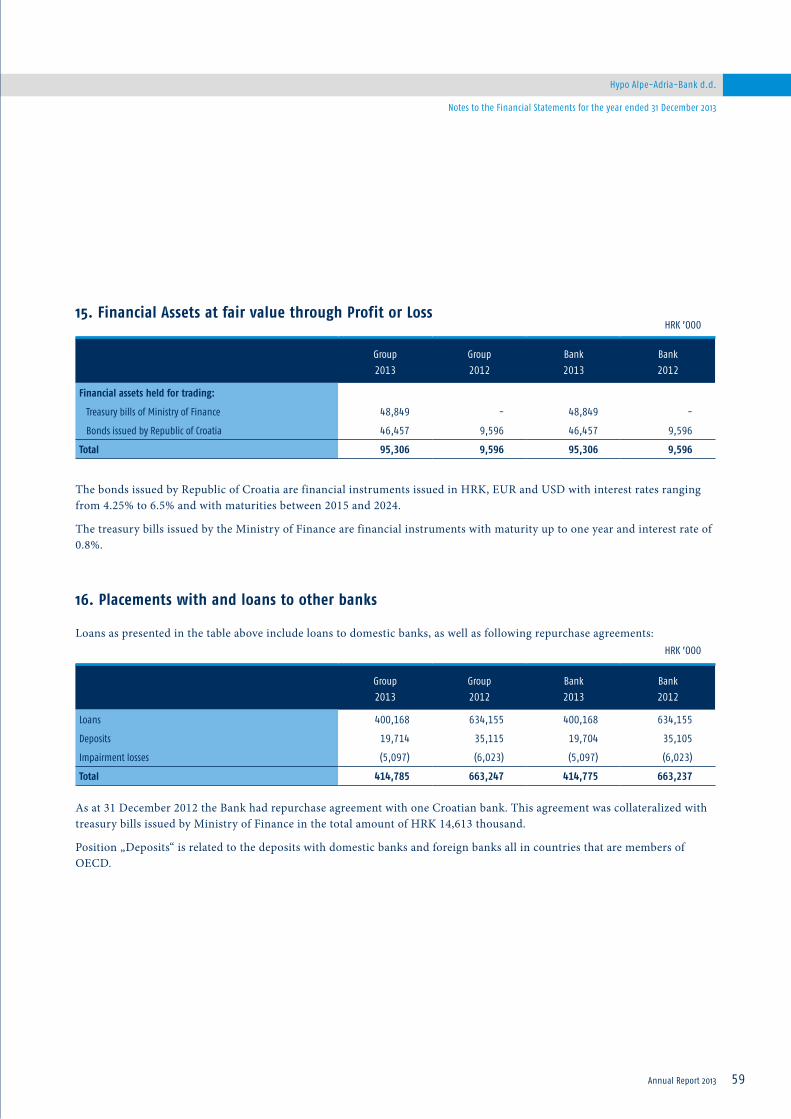
Hypo Alpe-Adria-Bank d.d.
Annual Report 2013 59
Notes to the Financial Statements for the year ended 31 December 2013
15. Financial Assets at fair value through Profit or Loss
The bonds issued by Republic of Croatia are financial instruments issued in HRK, EUR and USD with interest rates ranging from 4.25% to 6.5% and with maturities between 2015 and 2024.
The treasury bills issued by the Ministry of Finance are financial instruments with maturity up to one year and interest rate of 0.8%.
16. Placements with and loans to other banks
Loans as presented in the table above include loans to domestic banks, as well as following repurchase agreements:
As at 31 December 2012 the Bank had repurchase agreement with one Croatian bank. This agreement was collateralized with treasury bills issued by Ministry of Finance in the total amount of HRK 14,613 thousand.
Position „Deposits“ is related to the deposits with domestic banks and foreign banks all in countries that are members of OECD.
Group2013
Group2012
Bank2013
Bank2012
Financial assets held for trading:
Treasury bills of Ministry of Finance 48,849 - 48,849 -
Bonds issued by Republic of Croatia 46,457 9,596 46,457 9,596
Total 95,306 9,596 95,306 9,596
Group2013
Group2012
Bank2013
Bank2012
Loans 400,168 634,155 400,168 634,155
Deposits 19,714 35,115 19,704 35,105
Impairment losses (5,097) (6,023) (5,097) (6,023)
Total 414,785 663,247 414,775 663,237
HRK ’000
HRK ’000
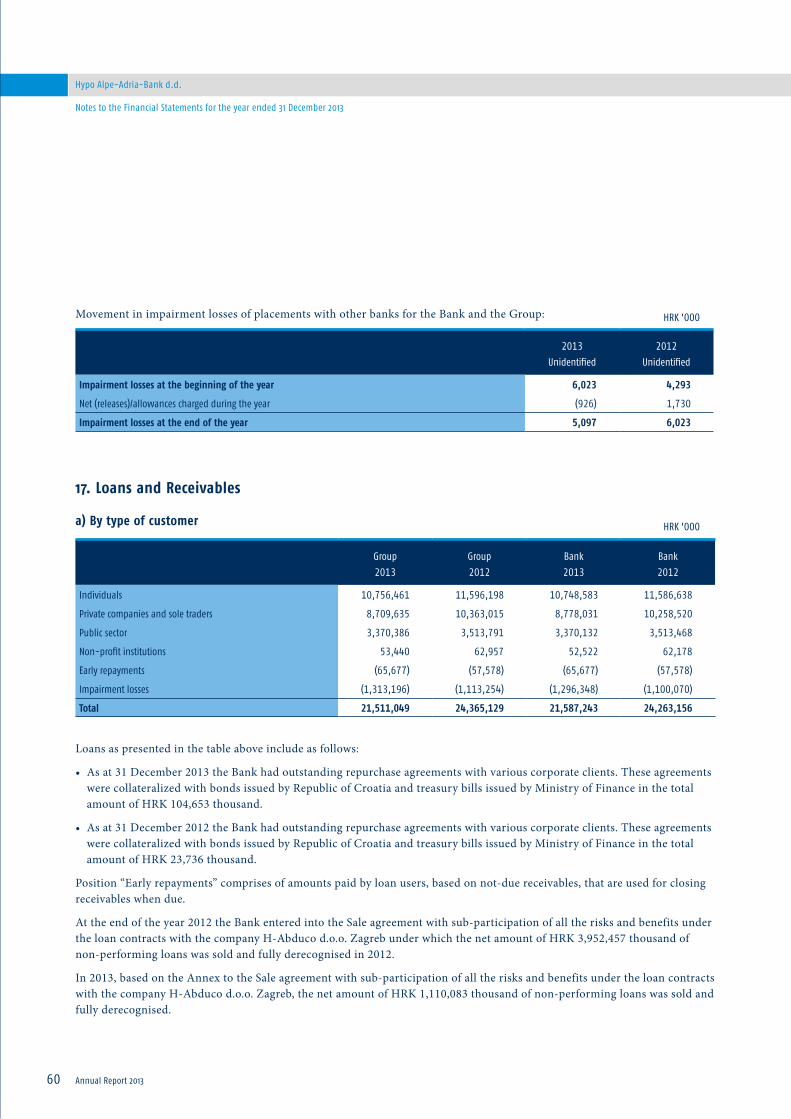
Annual Report 201360
Hypo Alpe-Adria-Bank d.d.
Notes to the Financial Statements for the year ended 31 December 2013
Movement in impairment losses of placements with other banks for the Bank and the Group:
17. Loans and Receivables
a) By type of customer
Loans as presented in the table above include as follows:
• As at 31 December 2013 the Bank had outstanding repurchase agreements with various corporate clients. These agreements were collateralized with bonds issued by Republic of Croatia and treasury bills issued by Ministry of Finance in the total amount of HRK 104,653 thousand.
• As at 31 December 2012 the Bank had outstanding repurchase agreements with various corporate clients. These agreements were collateralized with bonds issued by Republic of Croatia and treasury bills issued by Ministry of Finance in the total amount of HRK 23,736 thousand.
Position “Early repayments” comprises of amounts paid by loan users, based on not-due receivables, that are used for closing receivables when due.
At the end of the year 2012 the Bank entered into the Sale agreement with sub-participation of all the risks and benefits under the loan contracts with the company H-Abduco d.o.o. Zagreb under which the net amount of HRK 3,952,457 thousand of non-performing loans was sold and fully derecognised in 2012.
In 2013, based on the Annex to the Sale agreement with sub-participation of all the risks and benefits under the loan contracts with the company H-Abduco d.o.o. Zagreb, the net amount of HRK 1,110,083 thousand of non-performing loans was sold and fully derecognised.
2013Unidentified
2012Unidentified
Impairment losses at the beginning of the year 6,023 4,293
Net (releases)/allowances charged during the year (926) 1,730
Impairment losses at the end of the year 5,097 6,023
Group2013
Group2012
Bank2013
Bank2012
Individuals 10,756,461 11,596,198 10,748,583 11,586,638
Private companies and sole traders 8,709,635 10,363,015 8,778,031 10,258,520
Public sector 3,370,386 3,513,791 3,370,132 3,513,468
Non-profit institutions 53,440 62,957 52,522 62,178
Early repayments (65,677) (57,578) (65,677) (57,578)
Impairment losses (1,313,196) (1,113,254) (1,296,348) (1,100,070)
Total 21,511,049 24,365,129 21,587,243 24,263,156
HRK ’000
HRK ’000

Hypo Alpe-Adria-Bank d.d.
Annual Report 2013 61
Notes to the Financial Statements for the year ended 31 December 2013
b) Loans to individuals by purpose
Group2013
Group2012
Bank2013
Bank2012
Housing loans 8,000,730 8,488,073 8,000,730 8,488,073
Overdrafts 585,504 634,231 585,504 634,231
Car loans 313,141 458,605 313,141 458,605
Mortgage loans 194,552 188,096 194,552 188,096
Loans based on credit cards 112,181 127,346 112,181 127,346
Other loans 1,550,353 1,699,847 1,542,475 1,690,287
Total 10,756,461 11,596,198 10,748,583 11,586,638
HRK ’000

Annual Report 201362
Hypo Alpe-Adria-Bank d.d.
Notes to the Financial Statements for the year ended 31 December 2013
c) By industrial sector
Group2013
Group2012
Bank2013
Bank2012
Individuals 10,756,461 11,596,198 10,748,583 11,586,638
Public administration and defence 2,271,079 2,542,199 2,270,825 2,541,876
Wholesale and retail trade 2,191,210 2,957,479 2,101,428 2,920,696
Construction 2,006,656 2,107,234 1,978,843 2,080,410
Other personal service activities 1,123,262 1,017,282 1,024,447 927,084
Agriculture, hunting, forestry and fishing 759,575 1,039,018 738,368 1,025,318
Hotels and restaurants 617,969 696,283 608,020 685,581
Financial intermediation 163,434 86,953 577,159 86,648
Other manufacturing 558,975 692,409 531,950 674,538
Manufacturing of food products and beverages 451,243 637,516 442,017 626,197
Real estate business 411,387 280,283 428,595 456,684
Education 299,947 295,565 298,297 293,830
Transport, storage and equipment 251,653 292,654 230,258 258,511
Manufacturing of fabricated metal products 215,810 205,053 195,033 197,093
Electricity, gas and water supply 179,595 212,730 173,233 204,958
Health and social work 133,586 136,840 120,262 123,259
Manufacturing of chemicals 104,088 172,837 98,197 168,712
Manufacturing of other non-metallic mineral products 60,244 92,377 57,121 91,401
Manufacturing of other transport equipment 52,359 57,638 45,851 54,532
Manufacturing of wearing apparel, dressing and dying of fur 35,154 65,786 35,086 65,663
Other 246,235 351,627 245,695 351,175
Subtotal 22,889,922 25,535,961 22,949,268 25,420,804
Early repayments (65,677) (57,578) (65,677) (57,578)
Impairment losses (1,313,196) (1,113,254) (1,296,348) (1,100,070)
Total 21,511,049 24,365,129 21,587,243 24,263,156
HRK ’000

Hypo Alpe-Adria-Bank d.d.
Annual Report 2013 63
Notes to the Financial Statements for the year ended 31 December 2013
Movement in impairment losses of loans and receivables:
Group2013
Specific
Group2013
Unidentified
Group2013Total
Group2012
Specific
Group2012
Unidentified
Group2012Total
Impairment losses at the beginning of the year
907,342 205,912 1,113,254 2,537,170 226,978 2,764,148
Net allowances/(releases) charged during the year
777,414 (36,301) 741,113 14,681 (21,066) (6,385)
Foreign exchange differences 2,437 - 2,437 2,462 - 2,462
Sales and write off (543,608) - (543,608) (1,646,971) - (1,646,971)
Impairment losses at the end of the year 1,143,585 169,611 1,313,196 907,342 205,912 1,113,254
Bank2013
Specific
Bank2013
Unidentified
Bank2013Total
Bank2012
Specific
Bank2012
Unidentified
Bank2012Total
Impairment losses at the beginning of the year
895,185 204,885 1,100,070 2,524,238 225,994 2,750,232
Net allowances/(releases) charged during the year
774,717 (37,269) 737,448 15,456 (21,109) (5,653)
Foreign exchange differences 2,437 - 2,437 2,462 - 2,462
Sales and write off (543,607) - (543,607) (1,646,971) - (1,646,971)
Impairment losses at the end of the year 1,128,732 167,616 1,296,348 895,185 204,885 1,100,070
HRK ’000
HRK ’000

Annual Report 201364
Hypo Alpe-Adria-Bank d.d.
Notes to the Financial Statements for the year ended 31 December 2013
18. Available for sale financial assets
The treasury bills issued by the Ministry of Finance are financial instruments with maturity from 2014 to 2015 and interest rates in the range of 0.7% to 2.5% (2012: from 1.5% to 3.45%).
The foreign governments treasury bills are financial instruments issued by German Republic and French Republic with matu-rity up to one year and interest rates in the range of 0.107% to 0.218% (2012: 0.027% to 0.125%).
The bonds issued by the Government of Republic of Croatia are financial instruments issued in HRK with interest rates from 4.75% to 6.25% and maturity from 2015 to 2018 (2012: 5.75% to 6.25%).
The bonds issued by foreign governments are financial instruments issued in EUR by the German Republic with interest rate 0% and maturity in 2014 (2012: 0%).
The bonds issued by foreign banks are financial instruments issued in EUR by German banks with interest rates from 2.167% to 4.985% and maturity from 2014 to 2015 (2012: 0.873% to 4.985%).
Participations in investment funds are related to investments in Allianz Cash and HI-Cash open investment funds.
Equity securities are related to investments in domestic companies such as Prvi Maj d.d., Hoteli Brela d.d., Zagrebačka burza d.d. and similar.
Group2013
Group2012
Bank2013
Bank2012
Treasury bills of foreign governments 1,259,129 1,931,145 1,259,129 1,931,145
Bonds issued by foreign banks 839,593 976,828 839,593 976,828
Treasury bills of Ministry of Finance 571,467 661,073 571,467 661,073
Bonds issued by foreign governments 381,462 377,262 381,462 377,262
Bonds issued by the government 31,357 25,224 31,357 25,224
Equity securities 6,507 6,742 6,507 6,588
Participations in investment funds 12,381 15,438 5,385 5,323
Impairment losses (3,261) (3,261) (3,261) (3,261)
Total 3,098,635 3,990,451 3,091,639 3,980,182
HRK ’000

Hypo Alpe-Adria-Bank d.d.
Annual Report 2013 65
Notes to the Financial Statements for the year ended 31 December 2013
The treasury bills and bonds issued by foreign governments in the total amount of HRK 1,030,372 thousand (2012: HRK 1,848,268 thousand) are given as the collateral for the payables under repurchase agreements (see Note 25).
Movements in unrealised (losses)/gains from financial assets available for sale value adjustment:
Movement in impairment losses of financial assets available for sale for the Bank and the Group:
Group2013
Group2012
Bank2013
Bank2012
Balance as at 1st January (5,436) (8,101) (2,837) (5,384)
Net unrealized gain/(loss) of the year 7,878 3,302 5,279 3,184
Net deferred tax (1,056) (637) (1,056) (637)
Balance as at 31st December 1,386 (5,436) 1,386 (2,837)
2013Specific
2012Specific
Impairment losses at the beginning of the year 3,261 1,772
Allowances during the year - 1,489
Impairment losses at the end of the year 3,261 3,261
HRK ’000
HRK ’000

Annual Report 201366
Hypo Alpe-Adria-Bank d.d.
Notes to the Financial Statements for the year ended 31 December 2013
19. Investments in subsidiaries
At 31 December 2013 and 31 December 2012 the Bank was the sole owner of subsidiaries.
In 2013, the Bank performed impairment of its investment in subsidiary Hypo Alpe-Adria-Nekretnine d.o.o. which was recog-nised in the income statement in the position „Impairment losses“.
Impairment is performed as a consequence of Hypo centre building impairment charged to operating result of Hypo Alpe-Adria-Nekretnine d.o.o. for the year 2013, based on the new property fair value estimation.
Nature ofbusiness
Country ofincorporation
Bank2013
Bank2012
HYPO ALPE-ADRIA-NEKRETNINE d.o.o. Real estate business Croatia 214,575 214,575
HYPO ALPE-ADRIA-LEASING d.o.o. Leasing Croatia 25,000 25,000
HYPO ALPE-ADRIA-INVEST d.d.Establishing and managing investment funds
Croatia 4,659 4,659
Impairment of investment in HYPO ALPE-ADRIA-NEKRETNINE d.o.o.
Real estate business Croatia (110,150) -
Total 134,084 244,234
HRK ’000
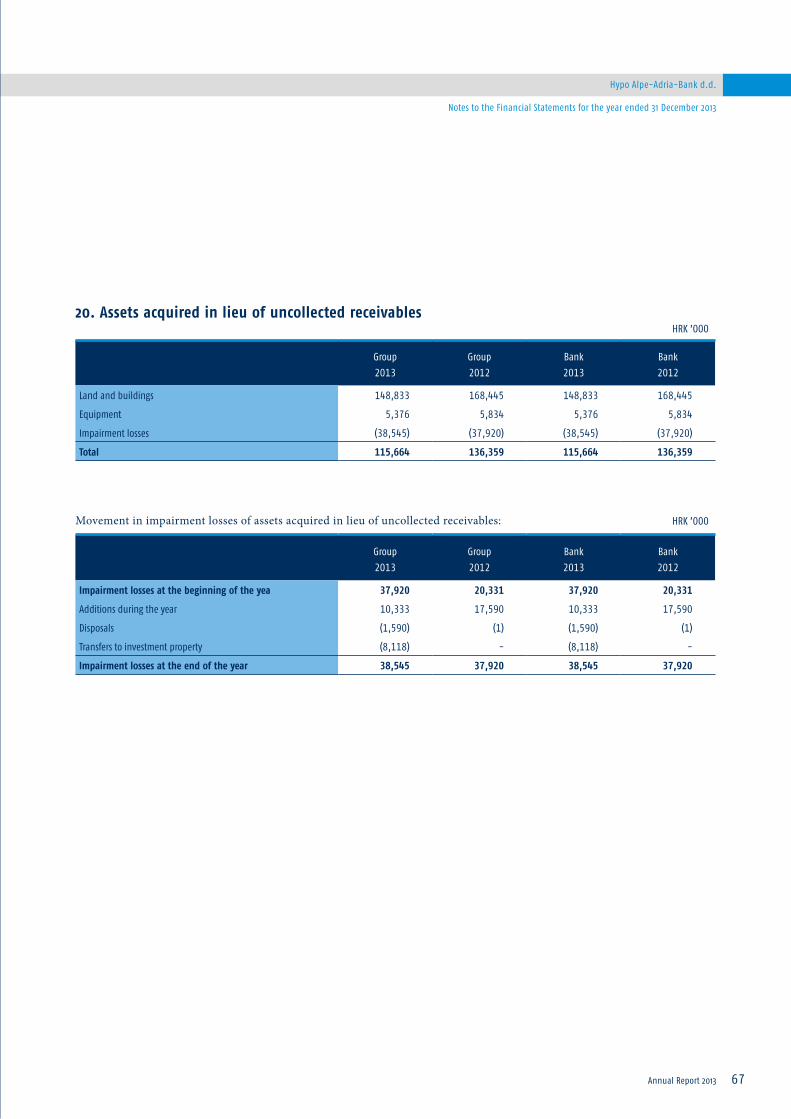
Hypo Alpe-Adria-Bank d.d.
67Annual Report 2013
Notes to the Financial Statements for the year ended 31 December 2013
20. Assets acquired in lieu of uncollected receivables
Movement in impairment losses of assets acquired in lieu of uncollected receivables:
Group2013
Group2012
Bank2013
Bank2012
Land and buildings 148,833 168,445 148,833 168,445
Equipment 5,376 5,834 5,376 5,834
Impairment losses (38,545) (37,920) (38,545) (37,920)
Total 115,664 136,359 115,664 136,359
Group2013
Group2012
Bank2013
Bank2012
Impairment losses at the beginning of the yea 37,920 20,331 37,920 20,331
Additions during the year 10,333 17,590 10,333 17,590
Disposals (1,590) (1) (1,590) (1)
Transfers to investment property (8,118) - (8,118) -
Impairment losses at the end of the year 38,545 37,920 38,545 37,920
HRK ’000
HRK ’000
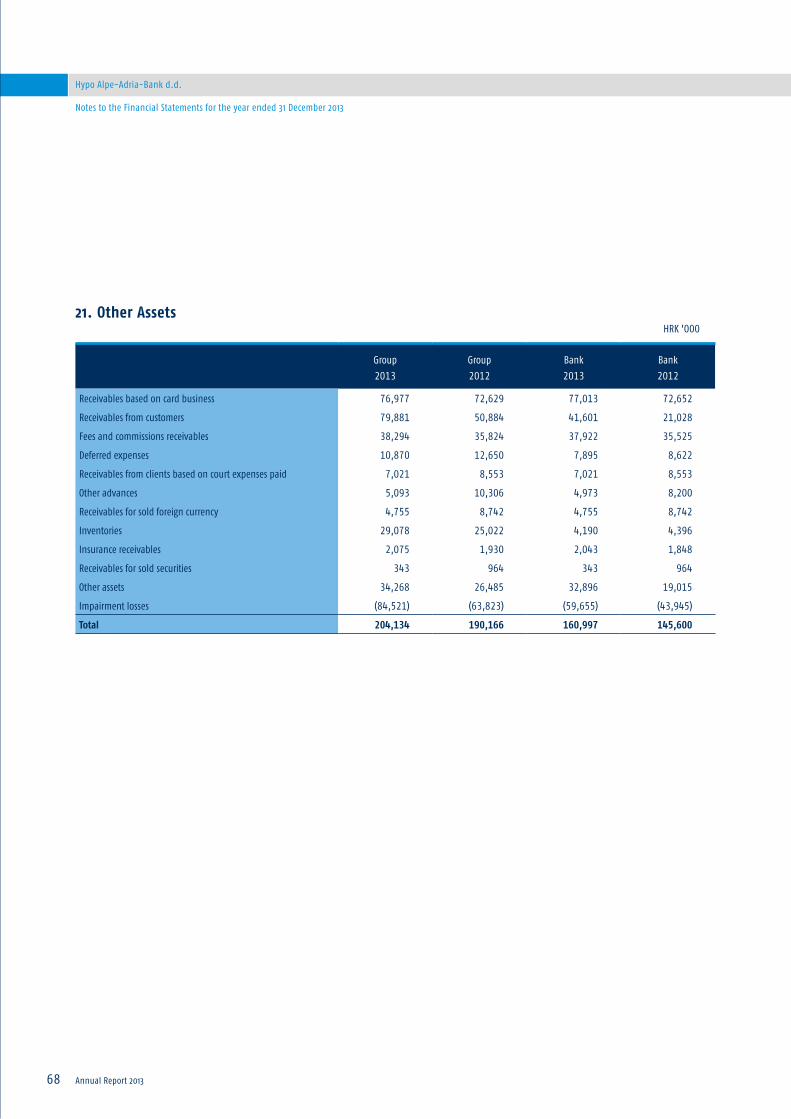
68
Hypo Alpe-Adria-Bank d.d.
Annual Report 2013
Notes to the Financial Statements for the year ended 31 December 2013
21. Other Assets
Group2013
Group2012
Bank2013
Bank2012
Receivables based on card business 76,977 72,629 77,013 72,652
Receivables from customers 79,881 50,884 41,601 21,028
Fees and commissions receivables 38,294 35,824 37,922 35,525
Deferred expenses 10,870 12,650 7,895 8,622
Receivables from clients based on court expenses paid 7,021 8,553 7,021 8,553
Other advances 5,093 10,306 4,973 8,200
Receivables for sold foreign currency 4,755 8,742 4,755 8,742
Inventories 29,078 25,022 4,190 4,396
Insurance receivables 2,075 1,930 2,043 1,848
Receivables for sold securities 343 964 343 964
Other assets 34,268 26,485 32,896 19,015
Impairment losses (84,521) (63,823) (59,655) (43,945)
Total 204,134 190,166 160,997 145,600
HRK ’000
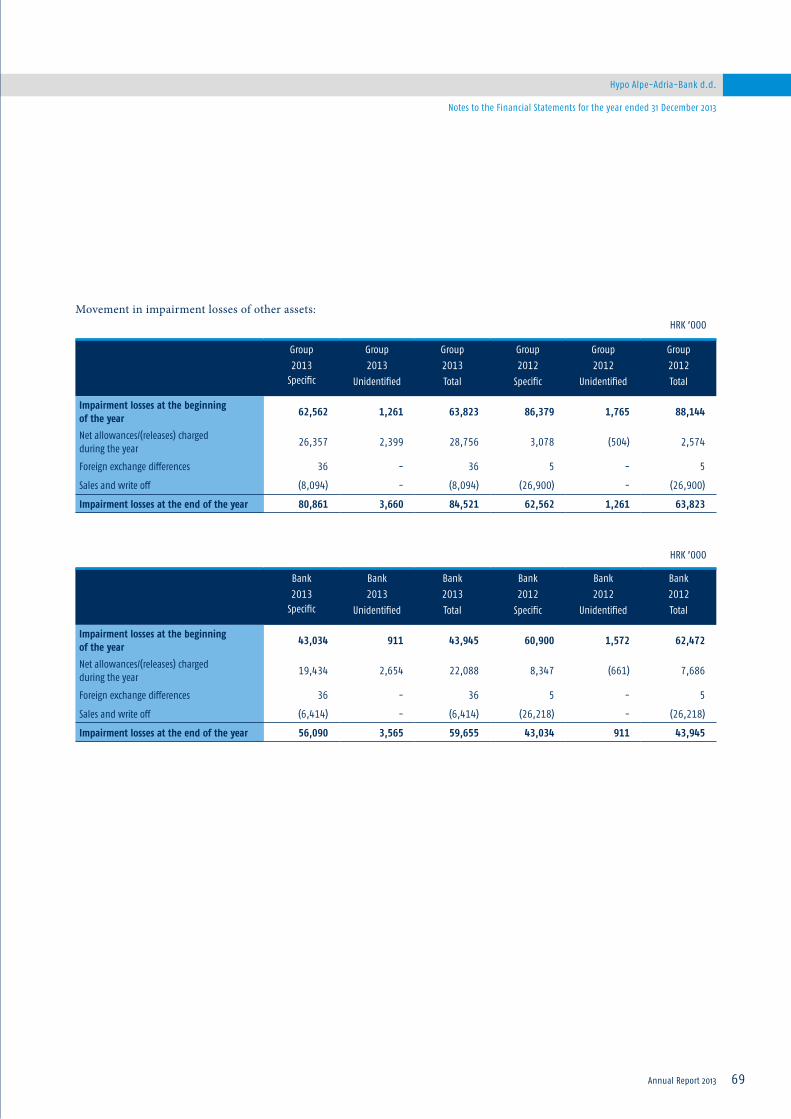
Hypo Alpe-Adria-Bank d.d.
69Annual Report 2013
Notes to the Financial Statements for the year ended 31 December 2013
Movement in impairment losses of other assets:
Group2013
Specific
Group2013
Unidentified
Group2013Total
Group2012
Specific
Group2012
Unidentified
Group2012Total
Impairment losses at the beginning of the year
62,562 1,261 63,823 86,379 1,765 88,144
Net allowances/(releases) charged during the year
26,357 2,399 28,756 3,078 (504) 2,574
Foreign exchange differences 36 - 36 5 - 5
Sales and write off (8,094) - (8,094) (26,900) - (26,900)
Impairment losses at the end of the year 80,861 3,660 84,521 62,562 1,261 63,823
Bank2013
Specific
Bank2013
Unidentified
Bank2013Total
Bank2012
Specific
Bank2012
Unidentified
Bank2012Total
Impairment losses at the beginning of the year
43,034 911 43,945 60,900 1,572 62,472
Net allowances/(releases) charged during the year
19,434 2,654 22,088 8,347 (661) 7,686
Foreign exchange differences 36 - 36 5 - 5
Sales and write off (6,414) - (6,414) (26,218) - (26,218)
Impairment losses at the end of the year 56,090 3,565 59,655 43,034 911 43,945
HRK ’000
HRK ’000

70
Hypo Alpe-Adria-Bank d.d.
Annual Report 2013
Notes to the Financial Statements for the year ended 31 December 2013
22. Investment property
Group Investment property
Investment property in construction
Total
Acquisition cost/revalued amount
At 1 January 2013 609,115 - 609,115
Additions 374 40 414
Disposals (5,776) - (5,776)
Revaluation 249 - 249
Transfers from assets acquired in lieu of uncollected receivables 26,608 - 26,608
Transfers from property, plant and equipment 7,437 - 7,437
At 31 December 2013 638,007 40 638,047
Accumulated depreciation
At 1 January 2013 76,301 - 76,301
Depreciation for the year 2013 12,689 - 12,689
Disposals (145) - (145)
Transfers from property, plant and equipment 2,164 - 2,164
At 31 December 2013 91,009 - 91,009
Impairment
At 1 January 2013 16,856 - 16,856
Impairment for the year 2013 charged to profit and loss 5,821 - 5,821
Impairment for the year 2013 charged to revaluation reserve 2,398 - 2,398
Disposals (1,848) - (1,848)
Transfers from assets acquired in lieu of uncollected receivables 8,118 - 8,118
At 31 December 2013 31,345 - 31,345
Book value
1 January 2013 515,958 - 515,958
31 December 2013 515,653 40 515,693
HRK ’000

Hypo Alpe-Adria-Bank d.d.
71Annual Report 2013
Notes to the Financial Statements for the year ended 31 December 2013
Group Investment property
Investment property in construction
Total
Acquisition cost/revalued amount
At 1 January 2012 582,300 40 582,340
Additions 1,209 - 1,209
Disposals (71) - (71)
Transfer from assets in construction 40 (40) -
Transfers from assets acquired in lieu of uncollected receivables 25,637 - 25,637
At 31 December 2012 609,115 - 609,115
Accumulated depreciation
At 1 January 2012 64,194 - 64,194
Depreciation for the year 2012 12,138 - 12,138
Disposals (31) - (31)
At 31 December 2012 76,301 - 76,301
Impairment
At 1 January 2012 12,432 - 12,432
Impairment for the year 2012 charged to profit and loss 3,219 - 3,219
Transfers from property, plant and equipment 1,205 - 1,205
At 31 December 2012 16,856 - 16,856
Book value
1 January 2012 505,674 40 505,714
31 December 2012 515,958 - 515,958
HRK ’000

72
Hypo Alpe-Adria-Bank d.d.
Annual Report 2013
Notes to the Financial Statements for the year ended 31 December 2013
Bank Investment property
Acquisition cost/revalued amount
At 1 January 2013 42,616
Additions 69
Disposals (5,713)
Revaluation 249
Transfers from assets acquired in lieu of uncollected receivables 26,608
Transfers from property, plant and equipment 7,437
At 31 December 2013 71,266
Accumulated depreciation
At 1 January 2013 539
Depreciation for the year 2013 984
Disposals (82)
Transfers from property, plant and equipment 2,164
At 31 December 2013 3,605
Impairment
At 1 January 2013 9,823
Impairment for the year 2013 charged to profit and loss 2,819
Impairment for the year 2013 charged to revaluation reserve 2,398
Disposals (1,849)
Transfers from assets acquired in lieu of uncollected receivables 8,118
At 31 December 2013 21,309
Book value
1 January 2013 32,254
31 December 2013 46,352
HRK ’000

Hypo Alpe-Adria-Bank d.d.
73Annual Report 2013
Notes to the Financial Statements for the year ended 31 December 2013
The last revaluation of Group‘s investment property was performed on 31 December 2013 and was based on estimations per-formed by independent external experts as well as internal experts. Certain significant inputs were used that are not observab-le (Level 3 of fair value hierarchy).
Valuation techniques used to determine fair values of investment property were:
• income approach, where the fair values were determined on basis of capitalisation of the future cash flows, i.e. net rental income (adequate interest rate was applied and the prospective economic remaining useful life was considered), and
• current replacement cost method, i.e. the cost approach (the fair value of the physical structure, including the outside and technical facilities was determined as the cost to a market participant buyer to acquire or construct a substitute asset of comparable utility, adjusted for obsolescence; the land component fair value was determined using the market approach).
Bank Investment property
Acquisition cost/revalued amount
At 1 January 2012 16,979
Additions -
Disposals -
Transfers from assets acquired in lieu of uncollected receivables 25,637
At 31 December 2012 42,616
Accumulated depreciation
At 1 January 2012 178
Depreciation for the year 2012 361
Disposals -
At 31 December 2012 539
Impairment
At 1 January 2012 5,399
Impairment for the year 2012 charged to profit and loss 3,219
Transfers from property, plant and equipment 1,205
At 31 December 2012 9,823
Book value
1 January 2012 11,402
31 December 2012 32,254
HRK ’000

74
Hypo Alpe-Adria-Bank d.d.
Annual Report 2013
Notes to the Financial Statements for the year ended 31 December 2013
If the investment property was measured by use of historical acquisition cost, the book value would be as follows:
Investment property of the Group is not subject to a mortgage or to a fiduciary relationship.
23. Property, plant and equipment
Group2013
Group2012
Bank2013
Bank2012
Acquisition cost 622,127 599,787 55,388 33,289
Accumulated depreciation (90,675) (76,052) (3,272) (290)
Impairment (17,278) (11,488) (7,243) (4,456)
Net book value 514,174 512,247 44,873 28,543
Group Land and buildings Computers and other equipment
Assets in construction
Total
Acquisition cost/revalued amount
At 1 January 2013 674,418 723,714 36,134 1,434,266
Additions 3,756 121,539 28,773 154,068
Transfer from assets in construction 4,654 23,815 (28,469) -
Revaluation 6,401 - - 6,401
Disposals (362) (177,518) - (177,880)
Transfers to investment property (7,437) - - (7,437)
At 31 December 2013 681,430 691,550 36,438 1,409,418
Accumulated depreciation
At 1 January 2013 154,543 392,505 - 547,048
Depreciation for the year 2013 17,272 81,250 - 98,522
Disposals (52) (85,397) - (85,449)
Transfers to investment property (2,164) - - (2,164)
At 31 December 2013 169,599 388,358 - 557,957
Impairment
At 1 January 2013 16,760 1,907 - 18,667
Impairment for the year 2013 charged to profit and loss 125,743 (982) 34 124,795
Impairment for the year 2013 charged to revaluation reserve 3,946 - - 3,946
At 31 December 2013 146,449 925 34 147,408
Book value
1 January 2013 503,115 329,302 36,134 868,551
31 December 2013 365,382 302,267 36,404 704,053
HRK ’000
HRK ’000

Hypo Alpe-Adria-Bank d.d.
75Annual Report 2013
Notes to the Financial Statements for the year ended 31 December 2013
Group Land and buildings Computers and other equipment
Assets in construction
Total
Acquisition cost/revalued amount
At 1 January 2012 706,087 705,616 38,421 1,450,124
Additions 4,898 158,046 29,440 192,384
Transfer from assets in construction 14,453 17,274 (31,727) -
Disposals (51,020) (157,222) - (208,242)
At 31 December 2012 674,418 723,714 36,134 1,434,266
Accumulated depreciation
At 1 January 2012 166,237 391,081 - 557,318
Depreciation for the year 2012 17,820 81,120 - 98,940
Disposals (29,514) (79,696) - (109,210)
At 31 December 2012 154,543 392,505 - 547,048
Impairment
At 1 January 2012 17,965 4,267 - 22,232
Impairment for the year 2012 - (2,360) - (2,360)
Transfers to investment property (1,205) - (1,205)
At 31 December 2012 16,760 1,907 - 18,667
Book value
1 January 2012 521,885 310,268 38,421 870,574
31 December 2012 503,115 329,302 36,134 868,551
HRK ’000
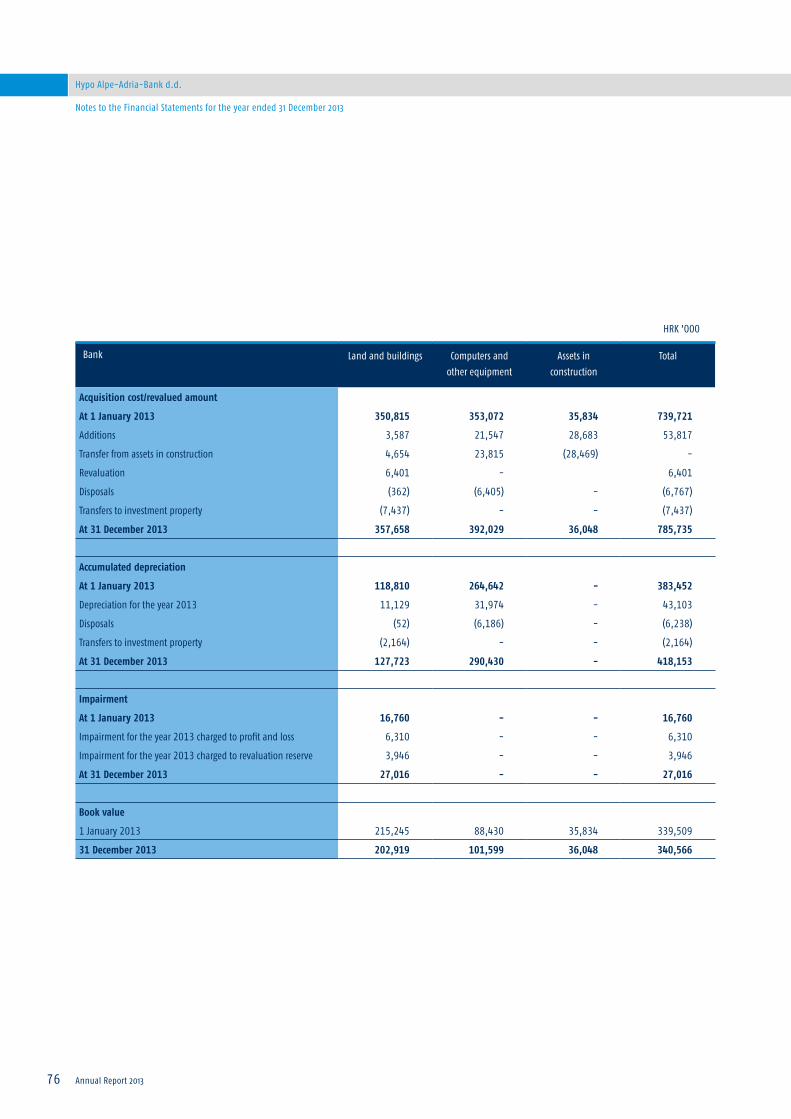
76
Hypo Alpe-Adria-Bank d.d.
Annual Report 2013
Notes to the Financial Statements for the year ended 31 December 2013
Bank Land and buildings Computers and other equipment
Assets in construction
Total
Acquisition cost/revalued amount
At 1 January 2013 350,815 353,072 35,834 739,721
Additions 3,587 21,547 28,683 53,817
Transfer from assets in construction 4,654 23,815 (28,469) -
Revaluation 6,401 - 6,401
Disposals (362) (6,405) - (6,767)
Transfers to investment property (7,437) - - (7,437)
At 31 December 2013 357,658 392,029 36,048 785,735
Accumulated depreciation
At 1 January 2013 118,810 264,642 - 383,452
Depreciation for the year 2013 11,129 31,974 - 43,103
Disposals (52) (6,186) - (6,238)
Transfers to investment property (2,164) - - (2,164)
At 31 December 2013 127,723 290,430 - 418,153
Impairment
At 1 January 2013 16,760 - - 16,760
Impairment for the year 2013 charged to profit and loss 6,310 - - 6,310
Impairment for the year 2013 charged to revaluation reserve 3,946 - - 3,946
At 31 December 2013 27,016 - - 27,016
Book value
1 January 2013 215,245 88,430 35,834 339,509
31 December 2013 202,919 101,599 36,048 340,566
HRK ’000

Hypo Alpe-Adria-Bank d.d.
77Annual Report 2013
Notes to the Financial Statements for the year ended 31 December 2013
Bank Land and buildings Computers and other equipment
Assets in construction
Total
Acquisition cost/revalued amount
At 1 January 2012 382,756 326,627 36,862 746,245
Additions 4,626 23,696 29,206 57,528
Transfer from assets in construction 14,453 15,781 (30,234) -
Disposals (51,020) (13,032) - (64,052)
At 31 December 2012 350,815 353,072 35,834 739,721
Accumulated depreciation
At 1 January 2012 136,643 247,809 - 384,452
Depreciation for the year 2012 11,681 29,795 - 41,476
Disposals (29,514) (12,962) - (42,476)
At 31 December 2012 118,810 264,642 - 383,452
Impairment
At 1 January 2012 17,965 - - 17,965
Impairment for the year 2012 - - - -
Transfers to investment property (1,205) (1,205)
At 31 December 2012 16,760 - - 16,760
Book value
1 January 2012 228,148 78,818 36,862 343,828
31 December 2012 215,245 88,430 35,834 339,509
The amount of fully depreciated Bank‘s property, plant and equipment at 31 December 2013 amounts to HRK 236,152 thousand (2012: HRK 201,258 thousand).
HRK ’000

78
Hypo Alpe-Adria-Bank d.d.
Annual Report 2013
Notes to the Financial Statements for the year ended 31 December 2013
The last revaluation of Group‘s land and buildings was performed on 31 December 2013 and was based on estimations perfor-med by independent external experts as well as internal experts. Certain significant inputs were used that are not observable (Level 3 of fair value hierarchy).
Valuation techniques used to determine fair values of land and buildings were:
• income approach, where the fair values were determined on basis of capitalisation of the future cash flows, i.e. net rental income (adequate interest rate was applied and the prospective economic remaining useful life was considered), and
• current replacement cost method, i.e. the cost approach (the fair value of the physical structure, including the outside and technical facilities was determined as the cost to a market participant buyer to acquire or construct a substitute asset of comparable utility, adjusted for obsolescence; the land component fair value determined using the market approach).
If the land and buildings were measured by acquisition cost, the book value would be as follows:
Property, plant and equipment of the Group were not subject to a mortgage or to a fiduciary relationship.
Group2013
Group2012
Bank2013
Bank2012
Acquisition cost 643,152 642,489 319,379 318,886
Accumulated depreciation (166,892) (152,272) (125,015) (116,539)
Impairment (138,328) (12,554) (18,895) (12,554)
Net book value 337,932 477,663 175,469 189,793
HRK ’000
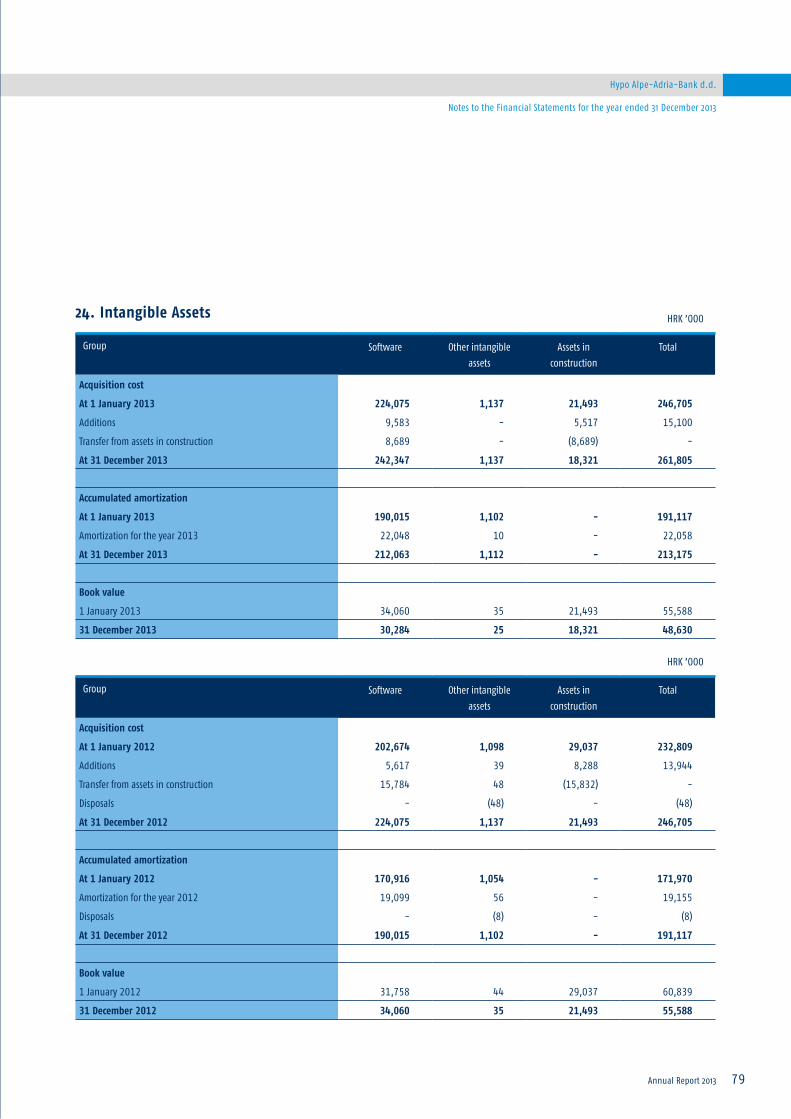
Hypo Alpe-Adria-Bank d.d.
79Annual Report 2013
Notes to the Financial Statements for the year ended 31 December 2013
24. Intangible Assets
Group Software Other intangible assets
Assets in construction
Total
Acquisition cost
At 1 January 2013 224,075 1,137 21,493 246,705
Additions 9,583 - 5,517 15,100
Transfer from assets in construction 8,689 - (8,689) -
At 31 December 2013 242,347 1,137 18,321 261,805
Accumulated amortization
At 1 January 2013 190,015 1,102 - 191,117
Amortization for the year 2013 22,048 10 - 22,058
At 31 December 2013 212,063 1,112 - 213,175
Book value
1 January 2013 34,060 35 21,493 55,588
31 December 2013 30,284 25 18,321 48,630
Group Software Other intangible assets
Assets in construction
Total
Acquisition cost
At 1 January 2012 202,674 1,098 29,037 232,809
Additions 5,617 39 8,288 13,944
Transfer from assets in construction 15,784 48 (15,832) -
Disposals - (48) - (48)
At 31 December 2012 224,075 1,137 21,493 246,705
Accumulated amortization
At 1 January 2012 170,916 1,054 - 171,970
Amortization for the year 2012 19,099 56 - 19,155
Disposals - (8) - (8)
At 31 December 2012 190,015 1,102 - 191,117
Book value
1 January 2012 31,758 44 29,037 60,839
31 December 2012 34,060 35 21,493 55,588
HRK ’000
HRK ’000
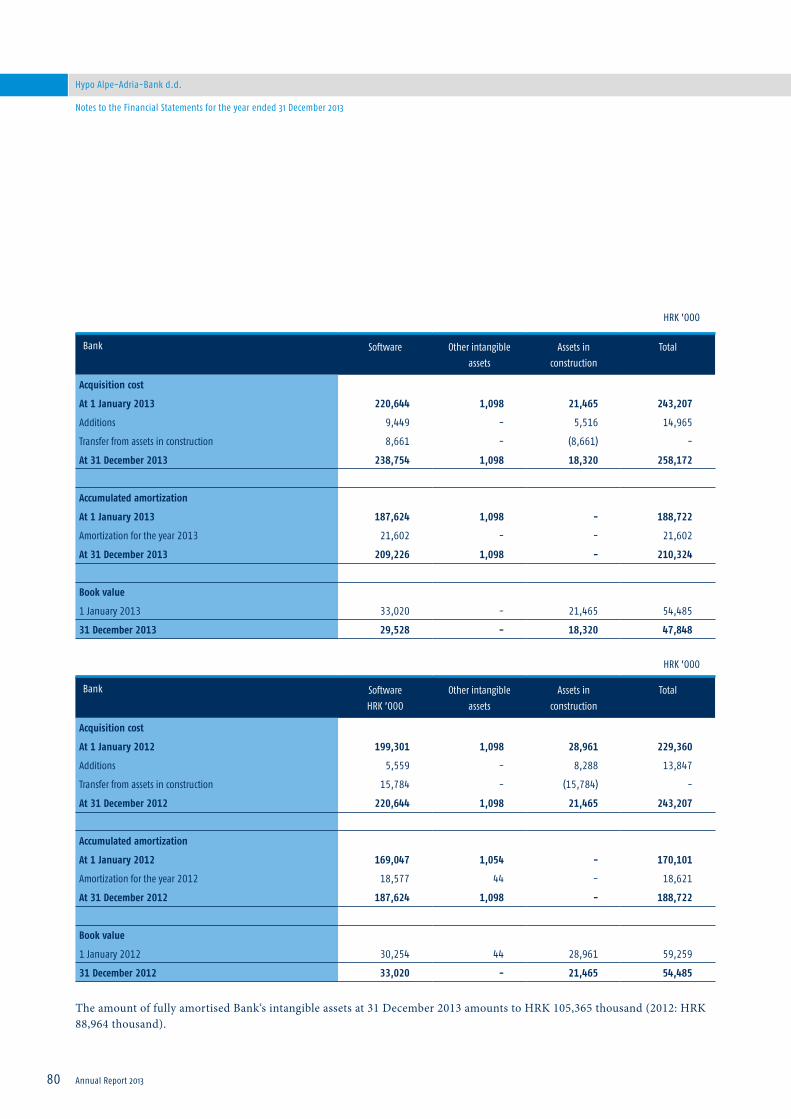
80
Hypo Alpe-Adria-Bank d.d.
Annual Report 2013
The amount of fully amortised Bank‘s intangible assets at 31 December 2013 amounts to HRK 105,365 thousand (2012: HRK 88,964 thousand).
Notes to the Financial Statements for the year ended 31 December 2013
Bank Software Other intangible assets
Assets in construction
Total
Acquisition cost
At 1 January 2013 220,644 1,098 21,465 243,207
Additions 9,449 - 5,516 14,965
Transfer from assets in construction 8,661 - (8,661) -
At 31 December 2013 238,754 1,098 18,320 258,172
Accumulated amortization
At 1 January 2013 187,624 1,098 - 188,722
Amortization for the year 2013 21,602 - - 21,602
At 31 December 2013 209,226 1,098 - 210,324
Book value
1 January 2013 33,020 - 21,465 54,485
31 December 2013 29,528 - 18,320 47,848
Bank SoftwareHRK ’000
Other intangible assets
Assets in construction
Total
Acquisition cost
At 1 January 2012 199,301 1,098 28,961 229,360
Additions 5,559 - 8,288 13,847
Transfer from assets in construction 15,784 - (15,784) -
At 31 December 2012 220,644 1,098 21,465 243,207
Accumulated amortization
At 1 January 2012 169,047 1,054 - 170,101
Amortization for the year 2012 18,577 44 - 18,621
At 31 December 2012 187,624 1,098 - 188,722
Book value
1 January 2012 30,254 44 28,961 59,259
31 December 2012 33,020 - 21,465 54,485
HRK ’000
HRK ’000
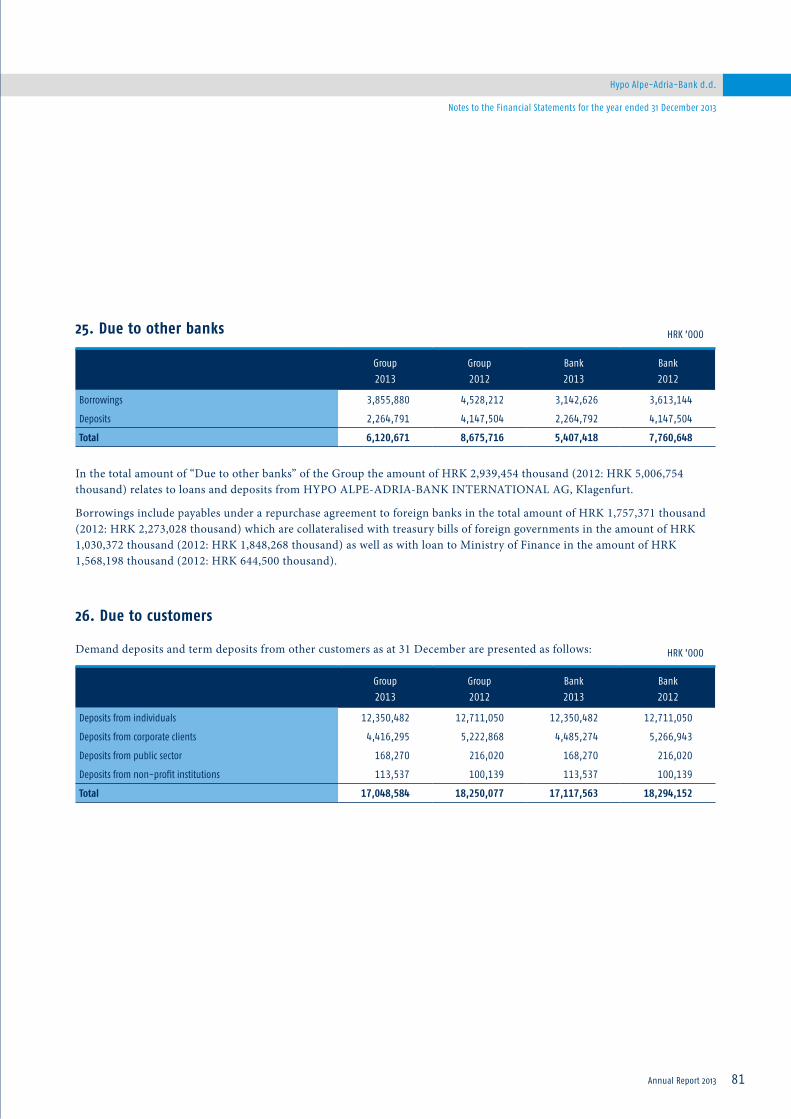
Hypo Alpe-Adria-Bank d.d.
81Annual Report 2013
Notes to the Financial Statements for the year ended 31 December 2013
25. Due to other banks
In the total amount of “Due to other banks” of the Group the amount of HRK 2,939,454 thousand (2012: HRK 5,006,754 thousand) relates to loans and deposits from HYPO ALPE-ADRIA-BANK INTERNATIONAL AG, Klagenfurt.
Borrowings include payables under a repurchase agreement to foreign banks in the total amount of HRK 1,757,371 thousand (2012: HRK 2,273,028 thousand) which are collateralised with treasury bills of foreign governments in the amount of HRK 1,030,372 thousand (2012: HRK 1,848,268 thousand) as well as with loan to Ministry of Finance in the amount of HRK 1,568,198 thousand (2012: HRK 644,500 thousand).
26. Due to customers
Demand deposits and term deposits from other customers as at 31 December are presented as follows:
Group2013
Group2012
Bank2013
Bank2012
Borrowings 3,855,880 4,528,212 3,142,626 3,613,144
Deposits 2,264,791 4,147,504 2,264,792 4,147,504
Total 6,120,671 8,675,716 5,407,418 7,760,648
Group2013
Group2012
Bank2013
Bank2012
Deposits from individuals 12,350,482 12,711,050 12,350,482 12,711,050
Deposits from corporate clients 4,416,295 5,222,868 4,485,274 5,266,943
Deposits from public sector 168,270 216,020 168,270 216,020
Deposits from non-profit institutions 113,537 100,139 113,537 100,139
Total 17,048,584 18,250,077 17,117,563 18,294,152
HRK ’000
HRK ’000
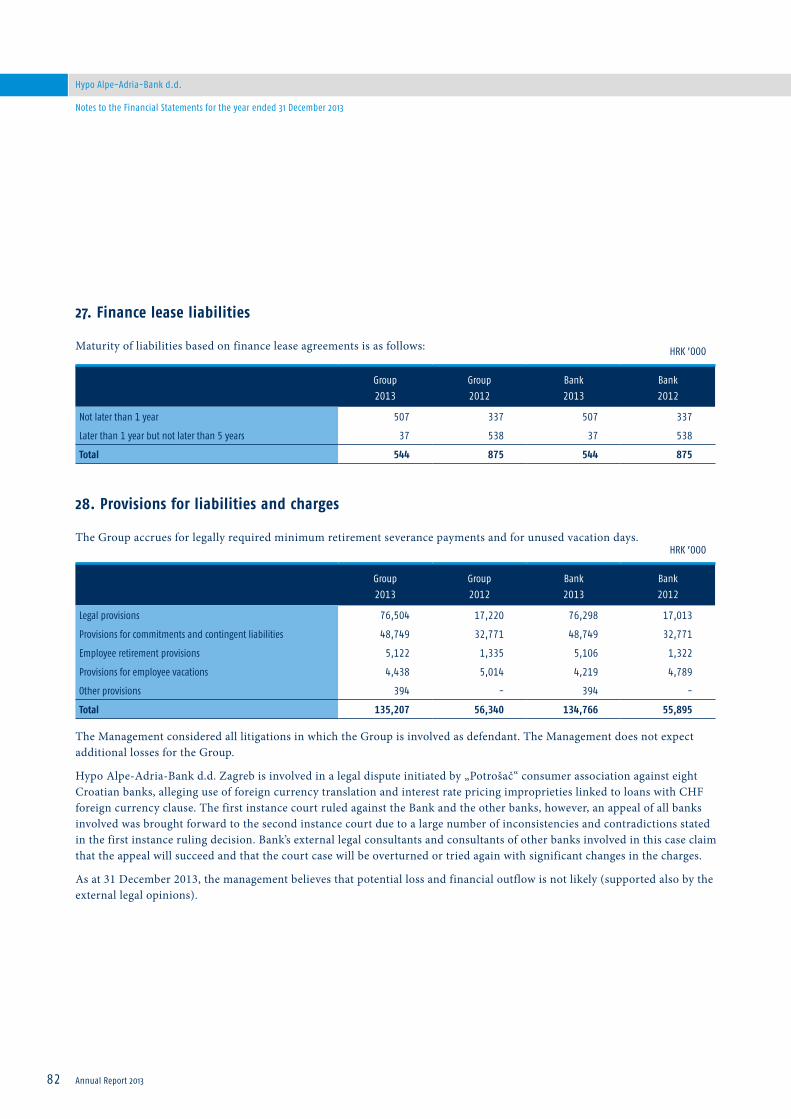
82
Hypo Alpe-Adria-Bank d.d.
Annual Report 2013
Notes to the Financial Statements for the year ended 31 December 2013
27. Finance lease liabilities
Maturity of liabilities based on finance lease agreements is as follows:
28. Provisions for liabilities and charges
The Group accrues for legally required minimum retirement severance payments and for unused vacation days.
The Management considered all litigations in which the Group is involved as defendant. The Management does not expect additional losses for the Group.
Hypo Alpe-Adria-Bank d.d. Zagreb is involved in a legal dispute initiated by „Potrošač“ consumer association against eight Croatian banks, alleging use of foreign currency translation and interest rate pricing improprieties linked to loans with CHF foreign currency clause. The first instance court ruled against the Bank and the other banks, however, an appeal of all banks involved was brought forward to the second instance court due to a large number of inconsistencies and contradictions stated in the first instance ruling decision. Bank’s external legal consultants and consultants of other banks involved in this case claim that the appeal will succeed and that the court case will be overturned or tried again with significant changes in the charges.
As at 31 December 2013, the management believes that potential loss and financial outflow is not likely (supported also by the external legal opinions).
Group2013
Group2012
Bank2013
Bank2012
Not later than 1 year 507 337 507 337
Later than 1 year but not later than 5 years 37 538 37 538
Total 544 875 544 875
Group2013
Group2012
Bank2013
Bank2012
Legal provisions 76,504 17,220 76,298 17,013
Provisions for commitments and contingent liabilities 48,749 32,771 48,749 32,771
Employee retirement provisions 5,122 1,335 5,106 1,322
Provisions for employee vacations 4,438 5,014 4,219 4,789
Other provisions 394 - 394 -
Total 135,207 56,340 134,766 55,895
HRK ’000
HRK ’000

Hypo Alpe-Adria-Bank d.d.
83Annual Report 2013
Notes to the Financial Statements for the year ended 31 December 2013
However, per requirements of Article 11 of the Decision on mandatory provisioning for legal cases against the credit instituti-on (Official Gazette 1/2009, 75/2009 and 2/2010), banks are obliged to set up a provision of at least 10 % of the total amount of ruling against the bank in the case of an appealable court ruling.
Although the final outcome can not be estimated at this moment, in order to comply with the local regulation, the manage-ment decided to recognize provision in the statutory financial statements as a certain percentage from claim (although any estimate cannot be considered as a reliable quantification as legal opinions clearly state that the first instance court ruling is not likely to be upheld in its current form and that an overall court process is likely to be significantly altered in the future).
Movement in provisions for liabilities and charges:
Group2013
Contingentliabilities
Group2013Legalcases
Group2013
Retirement
Group2013
Unusedvacations
Group2013Other
provisions
Group2013Total
Provisions at the beginning of the year 32,771 17,220 1,335 5,014 - 56,340
Net charges/(releases) in income statement 15,978 59,284 3,787 (576) 394 78,867
Provisions at the end of the year 48,749 76,504 5,122 4,438 394 135,207
Group2012
Contingentliabilities
Group2012Legalcases
Group2012
Retirement
Group2012
Unusedvacations
Group2012Total
Provisions at the beginning of the year 59,848 13,944 7,788 8,410 89,990
Net charges/(releases) in income statement (27,077) 3,276 (6,453) (3,396) (33,650)
Provisions at the end of the year 32,771 17,220 1,335 5,014 56,340
HRK ’000
HRK ’000

84
Hypo Alpe-Adria-Bank d.d.
Annual Report 2013
Notes to the Financial Statements for the year ended 31 December 2013
29. Other liabilities
Bank2013
Contingentliabilities
Bank2013
Legal cases
Bank2013
Retirement
Bank2013
Unusedvacations
Bank2013
Other provisions
Bank2013Total
Provisions at the beginning of the year 32,771 17,013 1,322 4,789 - 55,895
Net charges/(releases) in income statement 15,978 59,285 3,784 (570) 394 78,871
Provisions at the end of the year 48,749 76,298 5,106 4,219 394 134,766
Bank2012
Contingentliabilities
Bank2012
Legal cases
Bank2012
Retirement
Bank2012
Unusedvacations
Bank2012Total
Provisions at the beginning of the year 59,848 13,737 7,777 8,072 89,434
Net charges/(releases) in income statement (27,077) 3,276 (6,455) (3,283) (33,539)
Provisions at the end of the year 32,771 17,013 1,322 4,789 55,895
Group2013
Group2012
Bank2013
Bank2012
Liabilities to suppliers 80,859 70,567 78,023 67,508
Payables based on card business 36,455 32,741 36,455 32,743
Due to employees 23,091 23,684 21,914 22,482
Payables based on securities trading 14,430 12,028 14,430 12,028
Temporary deposits made as investments in domestic companies 6,742 5,999 6,742 5,999
Unallocated foreign currency receipts 1,081 5,007 1,081 5,007
Guarantee funds received 26,680 45,191 - -
Other 35,135 32,482 22,367 17,198
Total 224,473 227,699 181,012 162,965
HRK ’000
HRK ’000
HRK ’000

Hypo Alpe-Adria-Bank d.d.
85Annual Report 2013
Notes to the Financial Statements for the year ended 31 December 2013
30. Subordinated debt
Currency Interest rate Group2013
Amount inCurrency ’000
Group2013
Amount inHRK ’000
Bank2013
Amount inCurrency ’000
Bank2013
Amount inHRK ’000
EUR 3-month EURIBOR+2.00% 37,000 282,593 37,000 282,593
EUR 3-month 7% fixed 100,000 763,764 100,000 763,764
EUR 3-month EURIBOR+2.00% 28,000 213,854 28,000 213,854
CHF 6-month LIBOR+7.00% 151,580 944,610 151,580 944,610
Total 2,204,821 2,204,821
Currency Interest rate Group2012
Amount inCurrency ’000
Group2012
Amount inHRK ’000
Bank2012
Amount inCurrency ’000
Bank2012
Amount inHRK ’000
EUR 3-month EURIBOR+1.33% 33,000 249,006 33,000 249,006
EUR 3-month EURIBOR+2.00% 37,000 279,188 37,000 279,188
EUR 3-month 7% fixed 100,000 754,563 100,000 754,563
EUR 3-month EURIBOR+2.00% 28,000 211,277 28,000 211,277
CHF 6-month LIBOR+7.00% 151,580 946,669 151,580 946,669
Total 2,440,703 2,440,703

86
Hypo Alpe-Adria-Bank d.d.
Annual Report 2013
Notes to the Financial Statements for the year ended 31 December 2013
Subordinated debt is from HYPO ALPE-ADRIA-BANK INTERNATIONAL AG, Klagenfurt with maturity of up to 6 years. Repayment of these instruments is not possible before the redemption date. Repayment of these funds in case of liquidation is subordinated to all other deposits and liabilities.
Subordinated debt with remaining maturity over one year can be used, with Croatian National Bank permission, as supple-mentary capital for the purpose of calculation of regulatory capital and capital adequacy.
31. Share capital
The immediate parent bank of the Group is HYPO ALPE-ADRIA-BANK INTERNATIONAL AG Klagenfurt, Austria. Share-holders of the Group as at 31 December are as follows:
The movement in the number of shares was as follows:
At the end of 2013 Hypo Alpe-Adria-Bank d.d. had 1,101,441 issued ordinary shares of nominal value HRK 4,000 and 200,749 issued preference shares of nominal value HRK 4,000.
Preference shares are not redeemable and are entitled to receive a discretionary 6% non cumulative preference dividend before any dividends are declared to the ordinary shareholders and carry no voting rights.
The dividends are declared by the General Assembly. For the year 2012 Bank has paid the dividend in the amount of HRK 194.42 per ordinary share and HRK 240.00 per preference share (2011: HRK 208.67 per preference share).
2013HRK ’000
2013%
2012HRK ’000
2012%
HYPO ALPE-ADRIA-BANK INTERNATIONAL AG, Klagenfurt 5,208,760 100.00 5,208,760 100.00
Total 5,208,760 100.00 5,208,760 100.00
2013Shares
2013HRK ’000
2012Shares
2012HRK ’000
Balance as at 01 January 1,302,190 5,208,760 1,302,190 5,208,760
Balance as at 31 December 1,302,190 5,208,760 1,302,190 5,208,760

Hypo Alpe-Adria-Bank d.d.
87Annual Report 2013
Notes to the Financial Statements for the year ended 31 December 2013
32. Reserves
Movement in Group reserves was as follows:
Legalreserve
Revaluationreserve
Fair valuereserve
Otherreserves
Total
At 1 January 2012 110,884 38,420 (8,101) 1,000 142,203
Net unrealised losses on available for sale financial assets
- - 5,334 - 5,334
Net realised gains on available for sale financial asset
- - (2,032) - (2,032)
Income tax relating to components of other comprehensive income
- - (637) - (637)
Revaluation of buildings and land - (8,549) - - (8,549)
Transfer to retained earnings - (710) - - (710)
Allocation of profit for 2011 2,118 - - - 2,118
At 31 December 2012 113,002 29,161 (5,436) 1,000 137,727
Net unrealised losses on available for sale financial assets
- - 8,391 - 8,391
Net realised gains on available for sale financial asset
- - (513) - (513)
Income tax relating to components of other comprehensive income
- (5,785) (1,056) - (6,841)
Revaluation of buildings and land - 370 - - 370
Disposal of buildings and land - (71) - - (71)
Transfer to retained earnings - (533) - - (533)
Allocation of profit for 2012 12,849 - - - 12,849
At 31 December 2013 125,851 23,142 1,386 1,000 151,379
HRK ’000

88
Hypo Alpe-Adria-Bank d.d.
Annual Report 2013
Notes to the Financial Statements for the year ended 31 December 2013
Movement in Bank reserves was as follows:
The legal reserve has been created in accordance with the Croatian Company Act, which requires 5% of the net profit for the year of the Group to be transferred to this reserve, until it reaches 5% of issued share capital of the Group. Legal reserve can be used for covering prior period losses if the losses are not covered by current year profits or if other reserves are not available. The legal reserve is not distributable to the shareholders.
The properties revaluation reserve arises on the revaluation of land and buildings. When revalued land or buildings are sold, the portion of the properties revaluation reserve that relates to that asset, and is effectively realised, is transferred directly to retained earnings.
The fair value reserve includes unrealised gains or losses on changes in the fair value of financial assets available for sale, net of income tax.
Other reserves are created in accordance to the General assembly decision and can be used for purposes defined by the law or the General assembly decision.
The Bank‘s equity reserves, including retained earnings and profit for the year, distributable to the shareholders at 31 Decem-ber 2012 amounted to HRK 262,321. There were no distributable reserves at the end of 2013.
Legalreserve
Revaluationreserve
Fair valuereserve
Total
At 1 January 2012 110,834 38,420 (5,384) 143,870
Net unrealised losses on available for sale financial assets
- - 4,991 4,991
Net realised gains on available for sale financial asset
- - (1,807) (1,807)
Income tax relating to components of other comprehensive income
- - (637) (637)
Revaluation of buildings and land - (8,549) - (8,549)
Transfer to retained earnings - (710) - (710)
Distribution of profit for 2011 2,118 - - 2,118
At 31 December 2012 112,952 29,161 (2,837) 139,276
Net unrealised losses on available for sale financial assets
- - 8,364 8,364
Net realised gains on available for sale financial asset
- - (3,085) (3,085)
Income tax relating to components of other comprehensive income
- (5,785) (1,056) (6,841)
Revaluation of buildings and land - 370 - 370
Disposal of buildings and land - (71) - (71)
Transfer to retained earnings - (533) - (533)
Distribution of profit for 2012 12,849 - - 12,849
At 31 December 2013 125,801 23,142 1,386 150,329
HRK ’000

Hypo Alpe-Adria-Bank d.d.
89Annual Report 2013
Notes to the Financial Statements for the year ended 31 December 2013
33. Commitments and contingent liabilities
Provisions for liabilities and charges are presented in the Note 28.
34. Leases
Minimum future lease payments based on lease arrangements where the Group or the Bank is a lessee were as follows:
Minimum future lease receipts based on lease arrangements where the Group or the Bank is a lessor were as follows:
Group2013
Group2012
Bank2013
Bank2012
Commitments and contingent liabilities
Unutilised credit lines 1,653,658 1,862,919 1,769,184 1,878,975
Guarantees and letters of credit 1,028,442 1,451,007 1,028,588 1,451,391
Ukupno 2,682,100 3,313,926 2,797,772 3,330,366
Group2013
Group2012
Bank2013
Bank2012
Not later than 1 year 34,431 32,710 67,233 71,028
Later than 1 year but not later than 5 years 129,804 121,065 261,042 274,951
Later than 5 years 75,417 95,379 404,551 518,614
Total 239,652 249,154 732,826 864,593
Group2013
Group2012
Bank2013
Bank2012
Not later than 1 year 80,912 83,073 3,687 3,572
Later than 1 year but not later than 5 years 133,025 136,994 3,132 5,367
Later than 5 years 56,818 62,484 - -
Total 270,755 282,551 6,819 8,939
HRK ’000
HRK ’000
HRK ’000
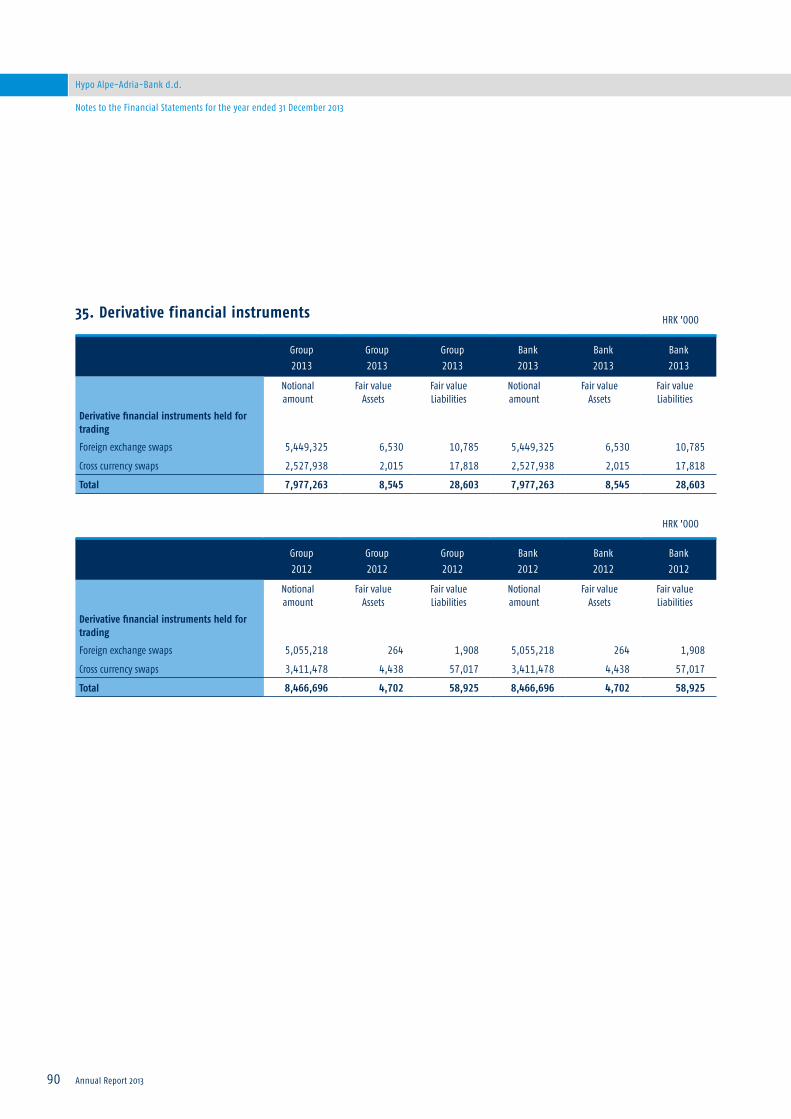
90
Hypo Alpe-Adria-Bank d.d.
Annual Report 2013
Notes to the Financial Statements for the year ended 31 December 2013
35. Derivative financial instruments
Group2013
Group2013
Group2013
Bank2013
Bank2013
Bank2013
Notional amount
Fair value Assets
Fair value Liabilities
Notional amount
Fair value Assets
Fair value Liabilities
Derivative financial instruments held for trading
Foreign exchange swaps 5,449,325 6,530 10,785 5,449,325 6,530 10,785
Cross currency swaps 2,527,938 2,015 17,818 2,527,938 2,015 17,818
Total 7,977,263 8,545 28,603 7,977,263 8,545 28,603
Group2012
Group2012
Group2012
Bank2012
Bank2012
Bank2012
Notional amount
Fair value Assets
Fair value Liabilities
Notional amount
Fair value Assets
Fair value Liabilities
Derivative financial instruments held for trading
Foreign exchange swaps 5,055,218 264 1,908 5,055,218 264 1,908
Cross currency swaps 3,411,478 4,438 57,017 3,411,478 4,438 57,017
Total 8,466,696 4,702 58,925 8,466,696 4,702 58,925
HRK ’000
HRK ’000

Hypo Alpe-Adria-Bank d.d.
91Annual Report 2013
Notes to the Financial Statements for the year ended 31 December 2013
36. Related party transactions
HYPO ALPE-ADRIA-BANK d.d., Zagreb and its subsidiaries are ultimately owned by HYPO ALPE-ADRIA-BANK INTER-NATIONAL AG, Klagenfurt, to whom and to whose affiliates, the Group provides banking services.
Balances with related parties at 31 December were as follows:
Group2013
Group2013
Group2013
Group2013
Assets Liabilities Contingent liabilities Collaterals received
Parent company 10,467 4,460,670 - -
Parent group 28,977 891,356 5,383 -
Key management 22,431 20,228 1,463 18,646
Other 2,038 57,547 - -
Total 63,913 5,429,801 6,846 18,646
Group2012
Group2012
Group2012
Group2012
Assets Liabilities Contingent liabilities Collaterals received
Parent company 11,635 6,593,577 10,200 10,000
Parent group 11,582 1,035,058 24,015 -
Key management 23,203 20,474 1,371 16,255
Other 2,032 52,751 - -
Total 48,452 7,701,860 35,586 26,255
Bank2013
Bank2013
Bank2013
Bank2013
Assets Liabilities Contingent liabilities Collaterals received
Parent company 10,467 4,460,670 - -
Parent group 28,919 177,957 5,383 -
Subsidiaries 831,774 69,562 115,672 -
Key management 22,431 20,228 1,463 18,646
Other 2,038 57,547 - -
Total 895,629 4,785,964 122,518 18,646
HRK ’000
HRK ’000
HRK ’000
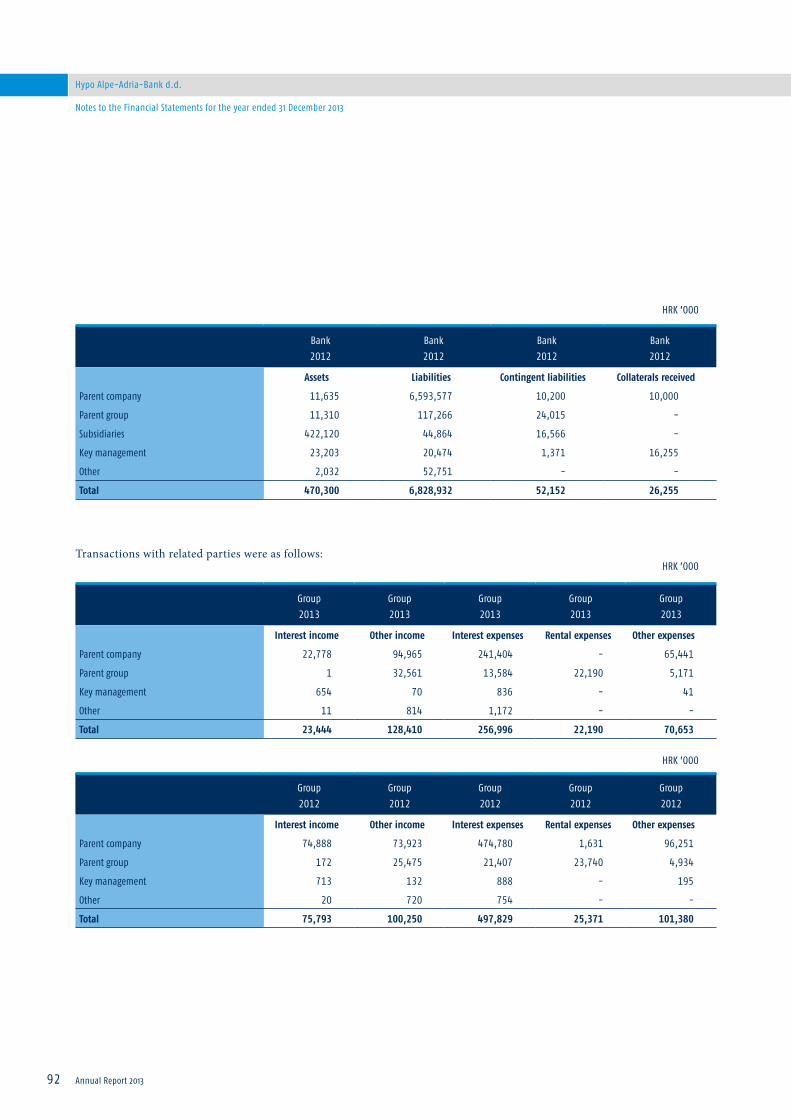
92
Hypo Alpe-Adria-Bank d.d.
Annual Report 2013
Notes to the Financial Statements for the year ended 31 December 2013
Transactions with related parties were as follows:
Group2013
Group2013
Group2013
Group2013
Group2013
Interest income Other income Interest expenses Rental expenses Other expenses
Parent company 22,778 94,965 241,404 - 65,441
Parent group 1 32,561 13,584 22,190 5,171
Key management 654 70 836 - 41
Other 11 814 1,172 - -
Total 23,444 128,410 256,996 22,190 70,653
Group2012
Group2012
Group2012
Group2012
Group2012
Interest income Other income Interest expenses Rental expenses Other expenses
Parent company 74,888 73,923 474,780 1,631 96,251
Parent group 172 25,475 21,407 23,740 4,934
Key management 713 132 888 - 195
Other 20 720 754 - -
Total 75,793 100,250 497,829 25,371 101,380
Bank2012
Bank2012
Bank2012
Bank2012
Assets Liabilities Contingent liabilities Collaterals received
Parent company 11,635 6,593,577 10,200 10,000
Parent group 11,310 117,266 24,015 -
Subsidiaries 422,120 44,864 16,566 -
Key management 23,203 20,474 1,371 16,255
Other 2,032 52,751 - -
Total 470,300 6,828,932 52,152 26,255
HRK ’000
HRK ’000
HRK ’000
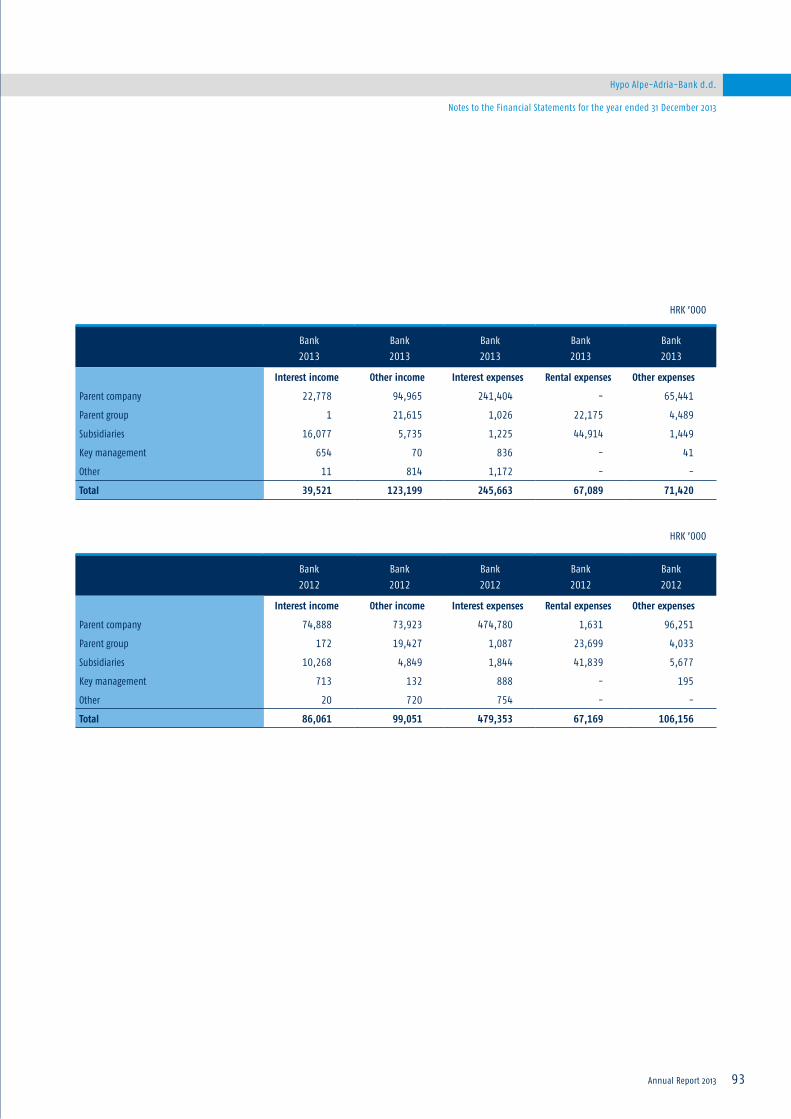
Hypo Alpe-Adria-Bank d.d.
93Annual Report 2013
Notes to the Financial Statements for the year ended 31 December 2013
Bank2013
Bank2013
Bank2013
Bank2013
Bank2013
Interest income Other income Interest expenses Rental expenses Other expenses
Parent company 22,778 94,965 241,404 - 65,441
Parent group 1 21,615 1,026 22,175 4,489
Subsidiaries 16,077 5,735 1,225 44,914 1,449
Key management 654 70 836 - 41
Other 11 814 1,172 - -
Total 39,521 123,199 245,663 67,089 71,420
Bank2012
Bank2012
Bank2012
Bank2012
Bank2012
Interest income Other income Interest expenses Rental expenses Other expenses
Parent company 74,888 73,923 474,780 1,631 96,251
Parent group 172 19,427 1,087 23,699 4,033
Subsidiaries 10,268 4,849 1,844 41,839 5,677
Key management 713 132 888 - 195
Other 20 720 754 - -
Total 86,061 99,051 479,353 67,169 106,156
HRK ’000
HRK ’000

94
Hypo Alpe-Adria-Bank d.d.
Annual Report 2013
Notes to the Financial Statements for the year ended 31 December 2013
Key management compensation
The Group considers that the key management personnel include Management Board and Supervisory Board members, as well as executive directors directly responsible to the Management Board.
The following table summarizes remuneration paid to the key management personnel:
Compensation to the Supervisory Board members for the year 2013 amounted to HRK 249 thousand (2012: HRK 194 thousand).
Group2013
Group2012
Bank2013
Bank2012
Salaries and other short-term benefits
Net salaries 16,805 16,436 14,596 13,266
Pension insurance expenses 5,212 5,615 4,406 4,448
Tax and surtax expenses 10,672 9,618 9,475 7,994
Contributions on salaries 4,969 4,986 4,328 4,050
37,658 36,655 32,805 29,758
Termination benefits
Net salaries - 505 - 505
Pension insurance expenses - 148 - 148
Tax and surtax expenses - 274 - 274
Contributions on salaries - 118 - 118
- 1,045 - 1,045
Total 37,658 37,700 32,805 30,803
HRK ’000
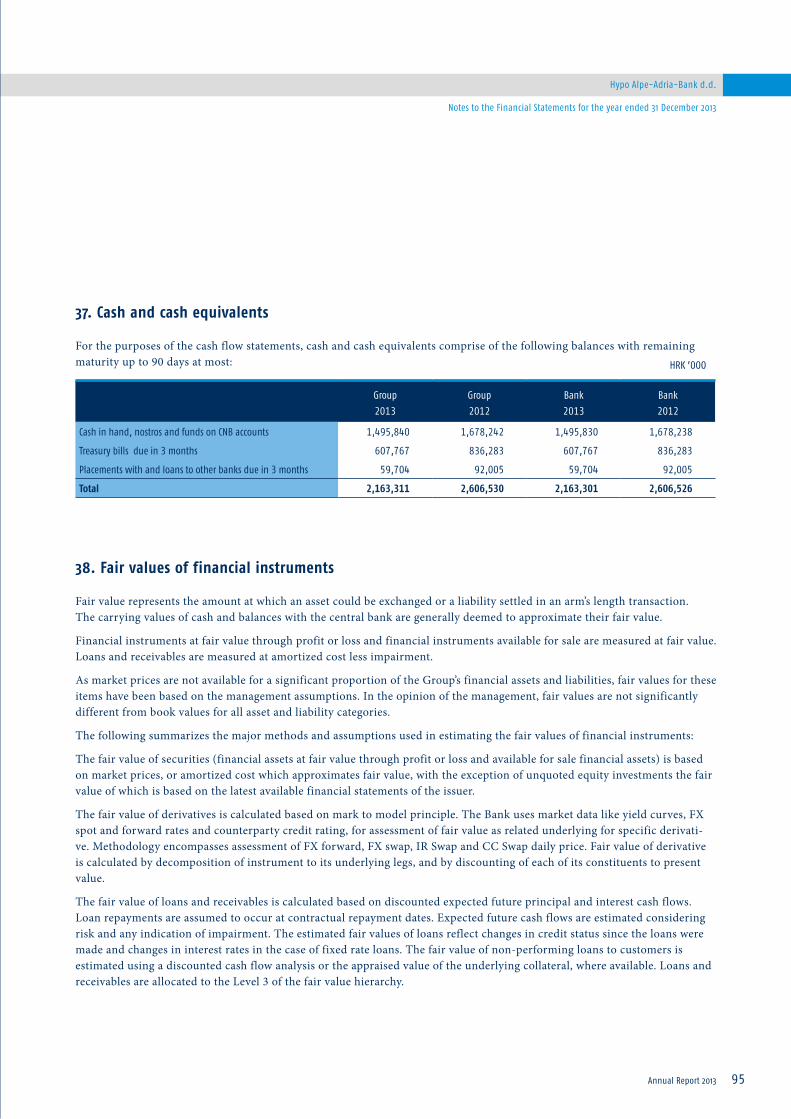
Hypo Alpe-Adria-Bank d.d.
95Annual Report 2013
Notes to the Financial Statements for the year ended 31 December 2013
37. Cash and cash equivalents
For the purposes of the cash flow statements, cash and cash equivalents comprise of the following balances with remaining maturity up to 90 days at most:
38. Fair values of financial instruments
Fair value represents the amount at which an asset could be exchanged or a liability settled in an arm’s length transaction. The carrying values of cash and balances with the central bank are generally deemed to approximate their fair value.
Financial instruments at fair value through profit or loss and financial instruments available for sale are measured at fair value. Loans and receivables are measured at amortized cost less impairment.
As market prices are not available for a significant proportion of the Group’s financial assets and liabilities, fair values for these items have been based on the management assumptions. In the opinion of the management, fair values are not significantly different from book values for all asset and liability categories.
The following summarizes the major methods and assumptions used in estimating the fair values of financial instruments:
The fair value of securities (financial assets at fair value through profit or loss and available for sale financial assets) is based on market prices, or amortized cost which approximates fair value, with the exception of unquoted equity investments the fair value of which is based on the latest available financial statements of the issuer.
The fair value of derivatives is calculated based on mark to model principle. The Bank uses market data like yield curves, FX spot and forward rates and counterparty credit rating, for assessment of fair value as related underlying for specific derivati-ve. Methodology encompasses assessment of FX forward, FX swap, IR Swap and CC Swap daily price. Fair value of derivative is calculated by decomposition of instrument to its underlying legs, and by discounting of each of its constituents to present value.
The fair value of loans and receivables is calculated based on discounted expected future principal and interest cash flows. Loan repayments are assumed to occur at contractual repayment dates. Expected future cash flows are estimated considering risk and any indication of impairment. The estimated fair values of loans reflect changes in credit status since the loans were made and changes in interest rates in the case of fixed rate loans. The fair value of non-performing loans to customers is estimated using a discounted cash flow analysis or the appraised value of the underlying collateral, where available. Loans and receivables are allocated to the Level 3 of the fair value hierarchy.
Group2013
Group2012
Bank2013
Bank2012
Cash in hand, nostros and funds on CNB accounts 1,495,840 1,678,242 1,495,830 1,678,238
Treasury bills due in 3 months 607,767 836,283 607,767 836,283
Placements with and loans to other banks due in 3 months 59,704 92,005 59,704 92,005
Total 2,163,311 2,606,530 2,163,301 2,606,526
HRK ’000

96
Hypo Alpe-Adria-Bank d.d.
Annual Report 2013
Notes to the Financial Statements for the year ended 31 December 2013
For demand deposits and deposits with no defined maturity within the Due to customers, the fair value is taken to be the amount payable on demand at the balance sheet date. The estimated fair value of fixed-maturity deposits is based on discoun-ted cash flows using rates currently offered for deposits of similar remaining maturity. The value of long-term relationships with depositors is not taken into account in estimating fair values. As most of the Group’s deposits are given with variable ra-tes, being the market rates, there is no significant difference between the fair value of these deposits and their carrying value. Due to customers are allocated to the Level 3 of the fair value hierarchy.
Group’s long-term debt has no quoted market prices and the fair value is estimated as the present value of future cash flows, discounted at interest rates available at the balance sheet date to the Group for new debt of similar type and remaining maturi-ty. Again, as the Group’s long-term debt is with variable interest, there is no significant difference between its carrying and fair value.
The following table presents the comparison of the consolidated carrying amounts and fair values as at 31 December 2013 and
31 December 2012:
Fair value measurements recognised in the statement of financial position
The following table provides an analysis of financial instruments that are measured subsequent to initial recognition at fair value, grouped into Levels 1 to 3 based on the degree to which the fair value is observable:
• Level 1 fair value measurements are those derived from quoted prices (unadjusted) in active markets for identical assets or liabilities;
• Level 2 fair value measurements are those derived from inputs other than quoted prices included within Level 1 that are observable for the asset or liability, either directly (i.e. as prices) or indirectly (i.e. derived from prices); and
• Level 3 fair value measurements are those derived from valuation techniques that include inputs for the asset or liability that are not based on observable market data (unobservable inputs).
The following tables present Fair value measurements recognised in the statement of financial position as at 31 December
2013Carrying amount
2013Fair value
2012Carrying amount
2012Fair value
Loans and receivables 21,511,049 21,487,445 24,365,129 24,353,056
Due to customers 17,048,584 17,125,021 18,250,077 18,308,837
HRK ’000

Hypo Alpe-Adria-Bank d.d.
97Annual Report 2013
Notes to the Financial Statements for the year ended 31 December 2013
2013 and 31 December 2012:
2013Level 1
2013Level 2
2013Level 3
2013Total
Financial assets at fair value through profit or loss
Securities held for trading 46,457 48,849 - 95,306
Derivative financial assets - 8,545 - 8,545
Available for sale financial assets
Securities available for sale 2,511,541 584,073 3,021 3,098,635
Total financial assets 2,557,998 641,467 3,021 3,202,486
Financial liabilities at fair value through profit or loss
Derivative financial liabilities - (28,603) - (28,603)
Total financial liabilities - (28,603) - (28,603)
2012Level 1
2012Level 2
2012Level 3
2012Total
Financial assets at fair value through profit or loss
Securities held for trading 9,596 - - 9,596
Derivative financial assets - 4,702 - 4,702
Available for sale financial assets
Securities available for sale 3,310,459 676,824 3,168 3,990,451
Total financial assets 3,320,055 681,526 3,168 4,004,749
Financial liabilities at fair value through profit or loss
Derivative financial liabilities - (58,925) - (58,925)
Total financial liabilities - (58,925) - (58,925)
HRK ’000
HRK ’000

98
Hypo Alpe-Adria-Bank d.d.
Annual Report 2013
Notes to the Financial Statements for the year ended 31 December 2013
During the year 2013 and 2012 no transfers between Level 1 and Level 2 occurred, as well as into and out of Level 3 There were also no changes to the methodology used in determining levels of the fair value hierarchy.
The following table shows a reconciliation of the opening and closing amounts of level 3 financial assets which are recorded at fair value:
At 1 January2013
Total gains/ (losses) recorded in other comprehensive
income
Sales At 31 December2013
Available for sale financial assets:
Equity securities 3,168 3 (150) 3,021
Total level 3 financial assets 3,168 3 (150) 3,021
At 1 January2012
Total gains/ (losses)recorded in profit
or loss
Sales Impairment At 31 December2012
Available for sale financial assets:
Commercial bills issued by companies 6,498 159 (6,657) - -
Equity securities 4,657 - - (1,489) 3,168
Total level 3 financial assets 11,155 159 (6,657) (1,489) 3,168
HRK ’000
HRK ’000
Hypo Alpe-Adria-Bank d.d.
99Annual Report 2013
Notes to the Financial Statements for the year ended 31 December 2013
39. Risk Management
This note provides details of the Bank risk exposure and describes methods used by management to identify, measure and manage risk in order to preserve Bank’s and Group’s capital. The main goal of the Bank is to adequately and efficiently mana-ge all major risks, which essentially involves systematic and deliberate planning and management, as well as maintaining an acceptable level of risk and profitability.
Due to this reasons, the Bank has established a strategic risk management function, conducted by the Risk Control division. In this way, risk identification, assessment and measurement and management processes are established for major risks and unexpected events, all in order to achieve a stable and profitable business performance with the Bank‘s improved performance indicators and the quality of the portfolio in terms of risk and profitability.
One of the basic processes that the Bank is implementing as part of a strategic risk management is Internal capital adequacy assessment process (ICAAP). The main purpose of internal capital adequacy assessment process is to determine a positive level of capital high enough to cover risks the Bank is exposed to and which are assessed as material. The ICAAP serves as an assessment of internal capital adequacy in relation to the Bank‘s risk profile and as an implementation of the Bank‘s strategy appropriate for maintaining an adequate internal capital level.
Also, by monitoring process of utilization of defined risk profile on a daily, monthly and quarterly basis, the Bank conducts limits steering process. The implementation and monitoring of various levels of limits from the product and client level to the level of different sub-portfolios such as market segments, regions, rating classes, levels of approved volumes, exposure levels etc,, enables informative and proactive approach to risk management and strategic decision making which is based on a group of factors and also on interaction with other influential factors.
Achieving Bank’s strategic targets and ways of managing risk are proscribed within Risk Strategy and a number of policies, regulations and directives in which the basic guidelines according to law regulations and Group requests are defined.
Main risks that the Bank is exposed to emerge from the Bank’s business activity and economic movements, and the Bank affronts them in the form of credit, market, liquidity and currency risks.
Hereafter, basic risks monitored and continuously managed in the Bank are presented. Also, in all upcoming risk analysis, ana-lytical data based on internal assumptions of risk management have been used, and because of that it can differ from the data presented in the Financial Statements.
39.1. Credit risk
Credit risk is defined as a possible loss that could occur due to non-fulfillment of a client’s contractual obligations towards credit institution. For the purpose of internal capital adequacy calculation for credit risk the Bank currently uses standardized approach i.e. calculates risk level as 12% of risk weighted assets pursuant to the Decision on the classification of placements and off-balance sheet liabilities of credit institutions. In this way, credit risk is directly included in the ICAAP process.
Credit risk in the Bank is further divided into:
1) Counterparty risk
2) Portfolio concentration risk
3) Currency induced credit risk (further in document: CICR)

100
Hypo Alpe-Adria-Bank d.d.
Annual Report 2013
Notes to the Financial Statements for the year ended 31 December 2013
Concentration risk and CICR represent forms of credit risk and due to their great importance for the Bank portfolio, they are monitored separately.
The process of identification, assessment, measurement and management of credit risk is being conducted on continuous basis and it comprises the entire Bank portfolio.
Exposure to credit risk is being managed through regular analysis of existing and potential borrower’s capability to pay obligations, and by changing loan limits when needed according to internal procedures and regulations proscribed by the Croatian National Bank. Furthermore, credit risk is additionally being managed by obtaining insurance instruments which reduce Bank’s exposure to credit risk. The process of credit risk reporting is conducted on a daily, monthly and quarterly basis, through reports which present current status and movement trends in the Bank portfolio, utilization of limits and portfolio quality indicators overview, these reports enable effective risk management and efficient decision making.
Hence, the automated production of strategically important reports such as NPL report (daily and monthly), Concentration Risk report, Credit risk report, ICAAP report, Provisioning report etc., until 10th working day at latest, has enabled more efficient and more detailed analysis of portfolio structure changes and defining of measures for mitigation of risk level.
For the purposes of internal capital adequacy of credit risk calculation, at the moment the Bank uses standardized approach meaning that the risk level is calculated as the 12% of the risk weighted assets according to Decision on capital adequacy of credit institutions.
In this way credit risk is directly involved in the ICAAP process. Even though the mentioned regulatory method is simple, the Bank finds it adequate and conservative in this moment.
Within the standardized approach and for the purposes of internal credit risk management, the Bank uses next mitigation techniques:
• Material credit protection (financial collateral only)
• Immaterial credit protection
39.1.1. Counterparty risk
Counterparty risk is the risk of loss that is a result of failure of debtor to fulfill his/her obligations. Additionally, the definition has been internally expanded in a way that it is a risk which results out of client’s credit transaction and country risk. Credit risk and country risk measure risk on the same portfolio, but from two different perspectives. The sum of those two risks represents the total counterparty risk.
Counterparty risk is monitored within credit risk.
39.1.2. Concentration risk
Concentration risk arises from each individual, direct or indirect, exposure to one client, or to group of related parties, or to group of exposures connected by common risk factors such as the same industry, the same geographical area, similar busines-ses or goods, or application of similar credit risk mitigation techniques, which could represent a threat to a survival of a credit institution.
Concentration risk arises from unequal allocation of exposure, which can arise in all risk types. One type of concentration risk is also credit risk arising from FX.
Hypo Alpe-Adria-Bank d.d.
101Annual Report 2013
Notes to the Financial Statements for the year ended 31 December 2013
The Bank measures and manages concentration risk from following points of view:
• Name/GoB concentration
• Sector concentration
• Collateral type and collateral provider concentration
• Foreign currency concentration
Concentration risk is measured within the risk management process and through ICAAP process. The main goals of concen-tration risk measurement are determination of certain changes in the structure of capital allocation for credit risk, improve-ment of strategy of loan approval connected to credit risk and setting/analyzing limits for credit risk.
39.1.3. Currency induced credit risk (CICR)
Currency induced credit risk is the risk of loss for the credit institution which approves loans in foreign currency or with FX clause is exposed to and which arises from debtor’s exposure to FX risk. We define Currency induced credit risk as a negative influence of currency value change to Bank’s credit portfolio.
Currency induced credit risk is measured through risk management process as well as within ICAAP process. As there is no minimum regulatory capital request for Currency induced credit risk, the Bank has implemented internal method of quantifi-cation of Currency induced credit risk which has been specified in detail in the ‘Currency Induced Credit Risk Policy’.
39.1.4. Country risk
Country risk refers to the ability and willingness of borrowers within a country to meet their obligations towards the credit institution, It is thus a credit risk on obligations advanced across borders.
Country Risk is a combination of:
• Transfer Risk (for cross boarder) and
• Currency induced credit risk (for currency mismatch),
Country risk is the risk arising from international transactions, and in that time, except for a standard credit risk. Bank is also subject to risk arising from the conditions in the home country of the foreign borrower or counterparty.
Country risk includes the entire range of risks arising from the economic, political and social environment in the home country of the foreign borrower that may have potential impacts on the foreign debt and equity investments in that country. Transfer risk lies more in the ability of the borrower to obtain the foreign currency needed to service its cross-border debts and other contractual obligations.
In accordance with the Bank‘s internal regulations, transfer risk has to be considered for cross-border transactions with coun-tries that are not members of the European Monetary Union.
Bank manages country risk by conducting an ongoing analysis of the structure and quality of the overall portfolio which is a subject to country risk and to ensure that timely and appropriate measures will be taken to reduce the country risk.
102
Hypo Alpe-Adria-Bank d.d.
Annual Report 2013
Notes to the Financial Statements for the year ended 31 December 2013
39.1.5. Object risk
Object risk is defined as a risk of loss due to change in market value of assets from Bank’s portfolio. Object risk can occur in the following cases:
• Banking: If a debtor defaults and the Bank is taking over the defaulted company and treats former collaterals (especially real estate and large producer durable goods) as own assets,
• Financial Lease: If a leasing taker defaults, the leased goods will become assets of the leasing company (repossessing),
• Operative Lease: The leased goods have always been assets of the leasing company,
• Objects in Bank’s ownership.
Object risk is measured and assessed based on quantitative indicators of tangible assets volume in the Bank‘s portfolio. Materi-ality of object risk is assessed based on its impact on total Bank‘s assets and the impact of realized and planned losses from the revaluation of tangible assets.
The process of risk level calculation is determined by the influence of change in tangible assets value within certain time period, i.e. the period in which the assets retained in Bank‘s portfolio. Market value, i.e. book value of assets is the basis for the calculation of the internal capital requirement out of object risk and represents basic parameter when assessing the object risk.
Since the Bank uses standardized approach for calculation of internal capital requirement for credit risk, object risk is mea-sured within credit risk, i.e. internal capital requirement for object risk is embedded within internal capital requirement for credit risk. According to standardized approach objects are categorized as „Other items“ so the basis values are multiplied with a risk weight of 100% and afterwards with a solvency factor of 12%.
The Bank manages object risk by conducting continuous analysis of the structure and quality of total tangible assets portfolio in order to ensure timely undertaking of appropriate risk mitigation measures.
Object risk management is mostly reflected through regular evaluation of tangible assets by updated and reliable market valu-es. If a new evaluation represents significant change in a book value of a real estate, adjustments in Bank‘s business books are performed. Real estate’s have the greatest share in total tangible assets so this type of assets is affected the most by changes in market value.
Object risk management methods are prescribed by Bank‘s internal acts „Tangible and intangible asset management“ and „Ma-nagement of repossessed asset“.
39.1.6. Residual risk
Residual risk is a risk that arises from the use of credit risk mitigation techniques, and represents probability of loss resulting from inability to realize a contracted risk insurance instrument in general or inability to realize it at an expected value or during an expected time period.
Residual risk is not assessed but is considered as an individual risk type and, being like that, it is not quantified individually but its impact is considered through other risks and, especially, through the real estate value stress testing.
Hypo Alpe-Adria-Bank d.d.
103Annual Report 2013
Notes to the Financial Statements for the year ended 31 December 2013
39.1.7. Dilution risk
Dilution risk is a risk of loss due to a reduction in the amount of purchased receivables as a result of cash or non-cash credits to the obligor, which arise from a legal relationship with the former creditor that is the basis for receivables which are the subject of the purchase.
The Bank measures dilution risk within credit risk on quarterly basis, i.e. internal capital requirements for dilution risk repre-sent part of internal capital requirements for credit risk and are not reported separately.
The Bank manages dilution risk by conducting continuous analysis of the structure and quality of total dilution risk relevant portfolio in order to ensure timely undertaking of appropriate risk mitigation measures.
Bank’s exposure to credit risk comes out of loan activity and investments and in cases where it acts as an arbiter on behalf of clients or third persons. The risk that counterparty will not fulfill his/her obligations from financial instruments is conti-nuously monitored on monthly basis.
The Bank exposure to credit risk arises from loans and advances to customers and banks, the amount of credit exposure in this regard, is the book value of these assets entered in the balance sheet. Furthermore, the Bank is exposed to credit risk for off-balance sheet items, through commitments from unused credit frames and issued guarantees.
Collateral types and collateral amounts depend on the client credit risk assessment, and their acceptability and evaluation are regulated by internal acts „Procedure for collateral monitoring“. The Bank is monitoring market values of accepted collaterals on an ongoing basis and requests additional collaterals if necessary and stipulated by the contract.
In the case when the counterparty is not able to pay the outstanding amounts due, the Bank can sell received collaterals (and does not use them for conducting its regular business) in order to close its receivables.
Analysis of type of collaterals and credit risk exposures secured with those collaterals are presented in the following tables. Amounts of collaterals are presented at the value more conservative than the estimated value, i.e. estimated value was decrea-sed by certain percentage, depending on the type of collateral.
Presented guarantees in the following table include government guarantees, provinces and local authority’s guarantees and banking guarantees.
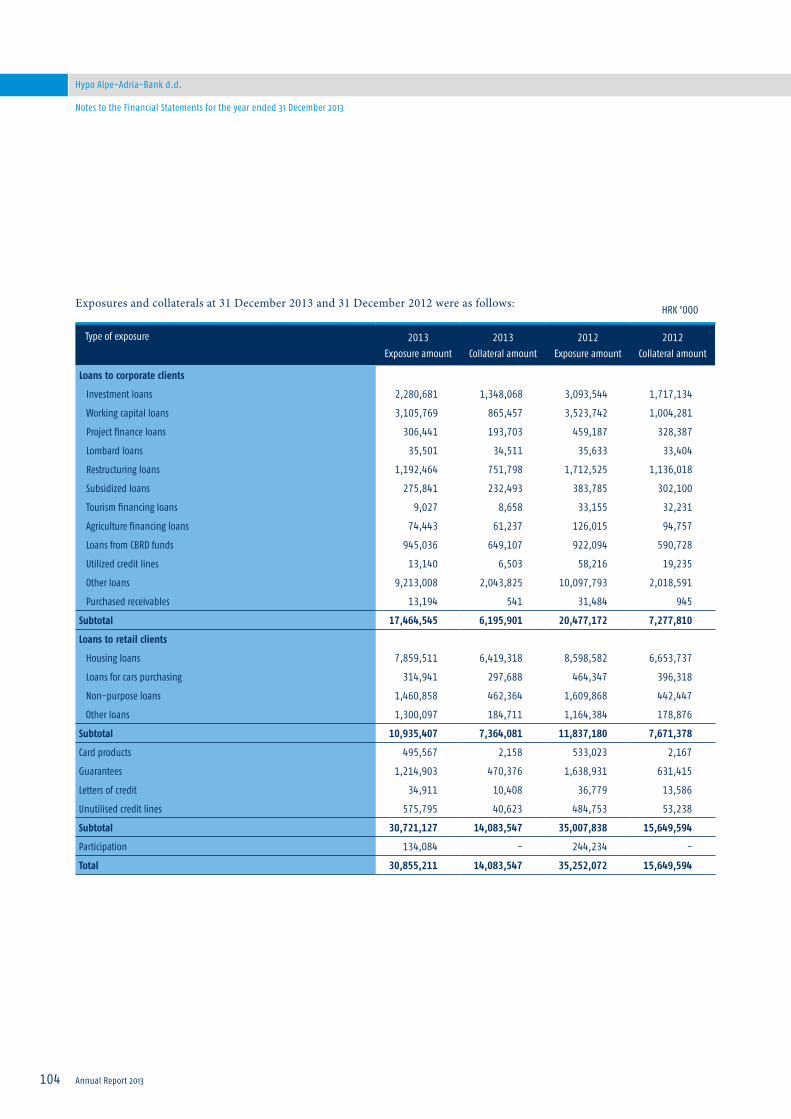
104
Hypo Alpe-Adria-Bank d.d.
Annual Report 2013
Notes to the Financial Statements for the year ended 31 December 2013
Exposures and collaterals at 31 December 2013 and 31 December 2012 were as follows:
Type of exposure 2013Exposure amount
2013Collateral amount
2012Exposure amount
2012Collateral amount
Loans to corporate clients
Investment loans 2,280,681 1,348,068 3,093,544 1,717,134
Working capital loans 3,105,769 865,457 3,523,742 1,004,281
Project finance loans 306,441 193,703 459,187 328,387
Lombard loans 35,501 34,511 35,633 33,404
Restructuring loans 1,192,464 751,798 1,712,525 1,136,018
Subsidized loans 275,841 232,493 383,785 302,100
Tourism financing loans 9,027 8,658 33,155 32,231
Agriculture financing loans 74,443 61,237 126,015 94,757
Loans from CBRD funds 945,036 649,107 922,094 590,728
Utilized credit lines 13,140 6,503 58,216 19,235
Other loans 9,213,008 2,043,825 10,097,793 2,018,591
Purchased receivables 13,194 541 31,484 945
Subtotal 17,464,545 6,195,901 20,477,172 7,277,810
Loans to retail clients
Housing loans 7,859,511 6,419,318 8,598,582 6,653,737
Loans for cars purchasing 314,941 297,688 464,347 396,318
Non-purpose loans 1,460,858 462,364 1,609,868 442,447
Other loans 1,300,097 184,711 1,164,384 178,876
Subtotal 10,935,407 7,364,081 11,837,180 7,671,378
Card products 495,567 2,158 533,023 2,167
Guarantees 1,214,903 470,376 1,638,931 631,415
Letters of credit 34,911 10,408 36,779 13,586
Unutilised credit lines 575,795 40,623 484,753 53,238
Subtotal 30,721,127 14,083,547 35,007,838 15,649,594
Participation 134,084 - 244,234 -
Total 30,855,211 14,083,547 35,252,072 15,649,594
HRK ’000

Hypo Alpe-Adria-Bank d.d.
105Annual Report 2013
Notes to the Financial Statements for the year ended 31 December 2013
Types of collaterals at 31 December 2013 and 31 December 2012 considered in the analysis above were as follows:
2013 2012
Real estate and land mortgages 11,057,030 12,745,371
Liens over movables 270,711 299,039
Cash deposits 481,209 429,803
Guarantees1 1,695,193 1,603,043
Insurance policies 280,628 357,517
Other collaterals 298,776 214,823
Total 14,083,547 15,649,594
HRK ’000
1 Government and municipal guarantees, bank guarantees
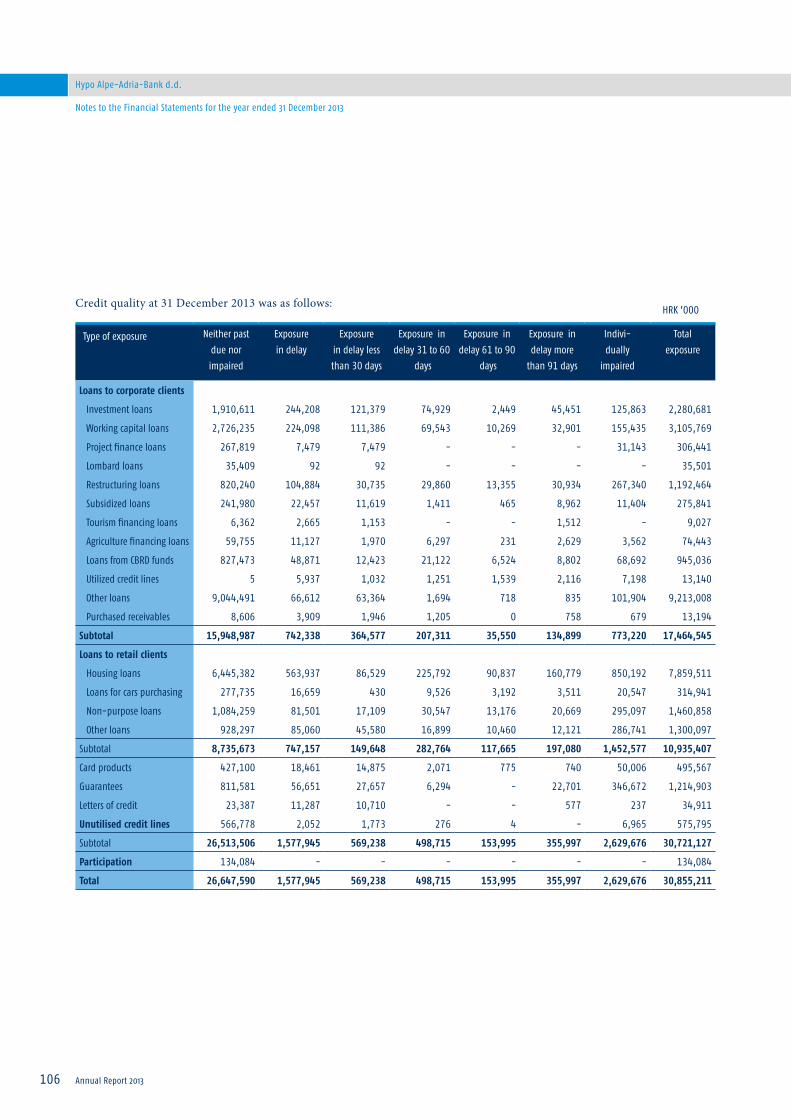
106
Hypo Alpe-Adria-Bank d.d.
Annual Report 2013
Notes to the Financial Statements for the year ended 31 December 2013
Credit quality at 31 December 2013 was as follows:
Type of exposure Neither pastdue norimpaired
Exposure in delay
Exposure in delay less than 30 days
Exposure in delay 31 to 60
days
Exposure in delay 61 to 90
days
Exposure in delay more
than 91 days
Indivi-dually
impaired
Totalexposure
Loans to corporate clients
Investment loans 1,910,611 244,208 121,379 74,929 2,449 45,451 125,863 2,280,681
Working capital loans 2,726,235 224,098 111,386 69,543 10,269 32,901 155,435 3,105,769
Project finance loans 267,819 7,479 7,479 - - - 31,143 306,441
Lombard loans 35,409 92 92 - - - - 35,501
Restructuring loans 820,240 104,884 30,735 29,860 13,355 30,934 267,340 1,192,464
Subsidized loans 241,980 22,457 11,619 1,411 465 8,962 11,404 275,841
Tourism financing loans 6,362 2,665 1,153 - - 1,512 - 9,027
Agriculture financing loans 59,755 11,127 1,970 6,297 231 2,629 3,562 74,443
Loans from CBRD funds 827,473 48,871 12,423 21,122 6,524 8,802 68,692 945,036
Utilized credit lines 5 5,937 1,032 1,251 1,539 2,116 7,198 13,140
Other loans 9,044,491 66,612 63,364 1,694 718 835 101,904 9,213,008
Purchased receivables 8,606 3,909 1,946 1,205 0 758 679 13,194
Subtotal 15,948,987 742,338 364,577 207,311 35,550 134,899 773,220 17,464,545
Loans to retail clients
Housing loans 6,445,382 563,937 86,529 225,792 90,837 160,779 850,192 7,859,511
Loans for cars purchasing 277,735 16,659 430 9,526 3,192 3,511 20,547 314,941
Non-purpose loans 1,084,259 81,501 17,109 30,547 13,176 20,669 295,097 1,460,858
Other loans 928,297 85,060 45,580 16,899 10,460 12,121 286,741 1,300,097
Subtotal 8,735,673 747,157 149,648 282,764 117,665 197,080 1,452,577 10,935,407
Card products 427,100 18,461 14,875 2,071 775 740 50,006 495,567
Guarantees 811,581 56,651 27,657 6,294 - 22,701 346,672 1,214,903
Letters of credit 23,387 11,287 10,710 - - 577 237 34,911
Unutilised credit lines 566,778 2,052 1,773 276 4 - 6,965 575,795
Subtotal 26,513,506 1,577,945 569,238 498,715 153,995 355,997 2,629,676 30,721,127
Participation 134,084 - - - - - - 134,084
Total 26,647,590 1,577,945 569,238 498,715 153,995 355,997 2,629,676 30,855,211
HRK ’000

Hypo Alpe-Adria-Bank d.d.
107Annual Report 2013
Notes to the Financial Statements for the year ended 31 December 2013
Credit quality at 31 December 2012 was as follows:
Type of exposure Neither pastdue norimpaired
Exposure in delay
Exposure in delay less than 30 days
Exposure in delay 31 to 60
days
Exposure in delay 61 to 90
days
Exposure in delay more
than 91 days
Indivi-dually
impaired
Totalexposure
Loans to corporate clients
Investment loans 2,406,381 376,584 85,268 123,085 21,257 146,975 310,578 3,093,544
Working capital loans 2,935,348 324,322 147,524 63,712 3,510 109,576 264,072 3,523,742
Project finance loans 294,291 80,896 46,013 18,094 - 16,790 84,000 459,187
Lombard loans 34,209 1,235 1,235 - - - 189 35,633
Restructuring loans 837,306 328,092 98,166 67,465 38,774 123,688 547,127 1,712,525
Subsidized loans 289,145 56,751 19,324 2,452 3,885 31,090 37,889 383,785
Tourism financing loans 25,780 2,352 194 - - 2,158 5,024 33,155
Agriculture financing loans 84,679 21,302 6,986 3,342 96 10,878 20,034 126,015
Loans from CBRD funds 813,363 67,705 2,970 25,220 8,135 31,380 41,025 922,094
Utilized credit lines 13 12,632 1,564 2,452 455 8,159 45,571 58,216
Other loans 9,975,735 28,268 7,083 2,702 1,079 17,404 93,790 10,097,793
Purchased receivables 23,433 3,237 1,298 - - 1,939 4,814 31,484
Subtotal 17,719,682 1,303,377 417,625 308,524 77,192 500,036 1,454,113 20,477,172
Loans to retail clients
Housing loans 7,310,805 583,349 58,293 221,595 98,726 204,735 704,429 8,598,582
Loans for cars purchasing 420,001 25,478 933 11,299 5,207 8,039 18,868 464,347
Non-purpose loans 1,269,540 103,666 14,642 36,533 12,193 40,299 236,661 1,609,868
Other loans 849,860 61,926 21,803 16,399 5,938 17,786 252,598 1,164,384
Subtotal 9,850,205 774,419 95,671 285,826 122,064 270,858 1,212,557 11,837,180
Card products 490,378 20,518 14,745 1,507 607 3,659 22,127 533,023
Guarantees 1,191,383 231,247 23,923 164,667 21,316 21,341 216,300 1,638,931
Letters of credit 27,386 8,270 3,879 2,936 - 1,454 1,123 36,779
Unutilised credit lines 435,484 43,245 27,444 3,453 - 12,348 6,023 484,753
Subtotal 29,714,519 2,381,076 583,287 766,913 221,179 809,697 2,912,243 35,007,838
Participation 244,234 - - - - - - 244,234
Total 29,958,753 2,381,076 583,287 766,913 221,179 809,697 2,912,243 35,252,072
HRK ’000

108
Hypo Alpe-Adria-Bank d.d.
Annual Report 2013
Notes to the Financial Statements for the year ended 31 December 2013
The primary purpose of credit related commitments is to ensure that funds are available to a customer as required. Guaran-tees, which represent irrevocable assurances that the Group will make payments in the event that a customer cannot meet its obligations to third parties, carry the same credit risk as loans.
Commitments to extend credit represent unused portions of authorizations to extend credit in the form of loans or guaran-tees. With respect to credit risk on commitments to extend credit, the Group is potentially exposed to loss in an amount equal to the total unused commitments. However, the likely amount of loss is less than the total unused commitments since most commitments to extend credit are contingent upon customers maintaining specific credit standards. The Group monitors the term to maturity of credit commitments because longer-term commitments generally have a greater degree of credit risk than shorter-term commitments.
As mentioned under the point 39.1.2. concentration risk arises from each individual, direct or indirect, exposure towards one client, or group of related parties, or group of exposures connected by common risk factors. The maximum exposure to individual client at 31 December 2013 excluding Republic of Croatia amounts to HRK 943,022 thousand (2012: HRK 501,892 thousand), without taking account of the amounts decreasing the total Bank‘s exposure or estimated values of collaterals obtai-ned.
The exposure to any one borrower (including banks) is further restricted by sublimit covering on- and off-balance sheet exposures which are set by the Credit Committee. The maximum credit risk exposure, ignoring the fair value of any collateral, in the event other parties fail to meet their obligations under financial instruments is equal to the carrying value of financial assets as presented in the accompanying financial statements and the disclosed financial commitments.
Majority of Bank‘s operations are performed in the Republic of Croatia, thus majority of credit risk is limited to the Republic of Croatia.
Credit risk by the type of financial assets
Credit risk by the type of financial assets for loans and similar receivables is monitored using internal classification of credit risk, required by the CNB Decision on the classification of placements and off-balance sheet liabilities of credit institutions.
Category A includes all receivables for which the Bank expects to collect full contracted amounts, including principle and interest. The Bank classifies all placements by their first approval in the risk category A. Category B includes receivables for which the Bank expects partly recoverable receivables, according to the amount of identified loss: risk category B-1 (place-ments for which the identified loss does not exceed 30% of the carrying amount of an individual placement), risk category B-2 (placements for which the identified loss is between more than 30% and 70% of the carrying amount of an individual place-ment) and B-3 (placements for which the identified loss is between more than 70% and less than 100% of the carrying amount of an individual placement). Category C includes receivables for which the Bank does not expect collections.
At 31 December 2013 in the total amount of placements classified into risk categories of HRK 33,168,159 thousand (2012: HRK 38,185,055 thousand) the amount of HRK 27,394,567 thousand (2012: HRK 31,033,911 thousand) relates to placements of category A.
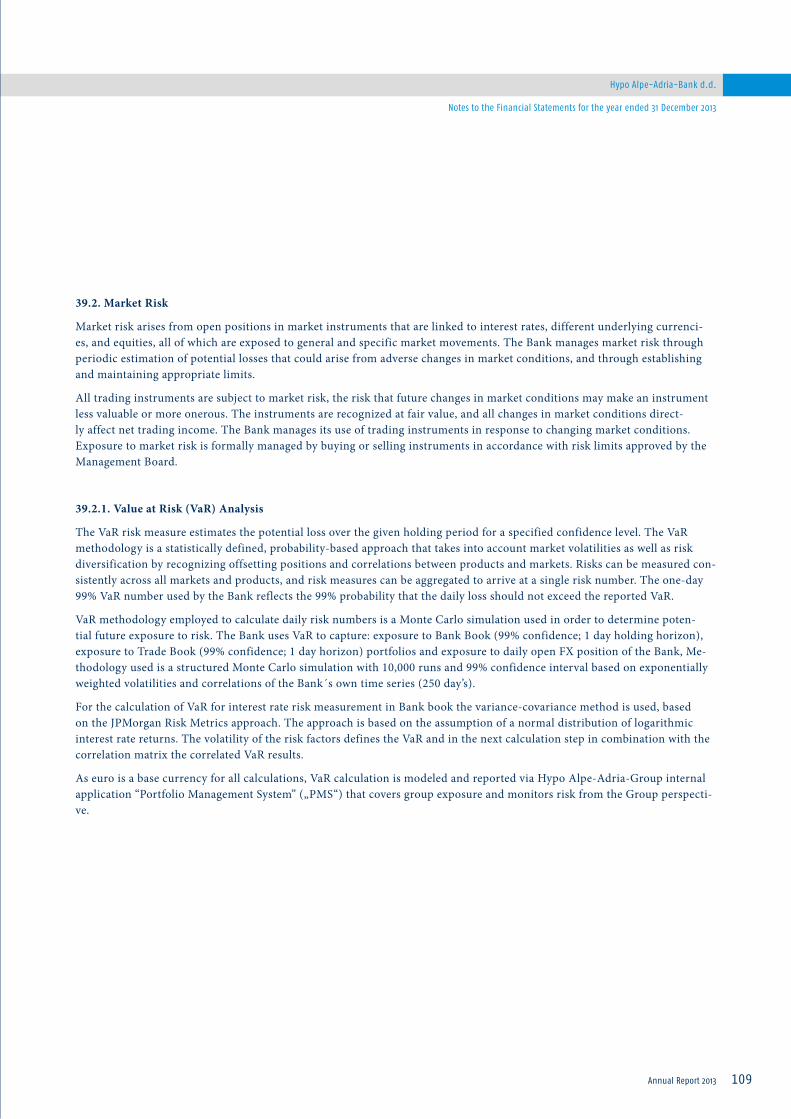
Hypo Alpe-Adria-Bank d.d.
109Annual Report 2013
Notes to the Financial Statements for the year ended 31 December 2013
39.2. Market Risk
Market risk arises from open positions in market instruments that are linked to interest rates, different underlying currenci-es, and equities, all of which are exposed to general and specific market movements. The Bank manages market risk through periodic estimation of potential losses that could arise from adverse changes in market conditions, and through establishing and maintaining appropriate limits.
All trading instruments are subject to market risk, the risk that future changes in market conditions may make an instrument less valuable or more onerous. The instruments are recognized at fair value, and all changes in market conditions direct-ly affect net trading income. The Bank manages its use of trading instruments in response to changing market conditions. Exposure to market risk is formally managed by buying or selling instruments in accordance with risk limits approved by the Management Board.
39.2.1. Value at Risk (VaR) Analysis
The VaR risk measure estimates the potential loss over the given holding period for a specified confidence level. The VaR methodology is a statistically defined, probability-based approach that takes into account market volatilities as well as risk diversification by recognizing offsetting positions and correlations between products and markets. Risks can be measured con-sistently across all markets and products, and risk measures can be aggregated to arrive at a single risk number. The one-day 99% VaR number used by the Bank reflects the 99% probability that the daily loss should not exceed the reported VaR.
VaR methodology employed to calculate daily risk numbers is a Monte Carlo simulation used in order to determine poten-tial future exposure to risk. The Bank uses VaR to capture: exposure to Bank Book (99% confidence; 1 day holding horizon), exposure to Trade Book (99% confidence; 1 day horizon) portfolios and exposure to daily open FX position of the Bank, Me-thodology used is a structured Monte Carlo simulation with 10,000 runs and 99% confidence interval based on exponentially weighted volatilities and correlations of the Bank´s own time series (250 day’s).
For the calculation of VaR for interest rate risk measurement in Bank book the variance-covariance method is used, based on the JPMorgan Risk Metrics approach. The approach is based on the assumption of a normal distribution of logarithmic interest rate returns. The volatility of the risk factors defines the VaR and in the next calculation step in combination with the correlation matrix the correlated VaR results.
As euro is a base currency for all calculations, VaR calculation is modeled and reported via Hypo Alpe-Adria-Group internal application “Portfolio Management System” („PMS“) that covers group exposure and monitors risk from the Group perspecti-ve.

110
Hypo Alpe-Adria-Bank d.d.
Annual Report 2013
Notes to the Financial Statements for the year ended 31 December 2013
The following table presents VaR trends of specific risk factors during the year 2013:
The following table presents VaR trends of specific risk factors during the year 2012:
* Correlation effects are not considered in the above analysis.
39.2.2. Back testing
Back testing is an evaluation process of VaR model by its application on a historical dataset. By performance of back testing, bank determines how much figures given by model itself differs from actual, i,e, from daily change in P/L. Testing is based on trading book dataset in order to determine predictive power of VaR model. Back testing is performed on yearly frequency, retrospectively for previous year.
Value at Risk HRK ’000 HRK ’000 HRK ’000 HRK ’000
Risk category Minimum Maximum Average End of year
Interest rate risk – trading book 40 564 176 159
Interest rate risk – banking book 2,740 11,589 7,002 10,694
Credit spread risk 500 2,500 1,154 508
Equity risk 1 3 2 2
Currency risk 327 2,123 1,142 367
Total* 3,608 16,779, 9,475 11,729
Value at Risk HRK ’000 HRK ’000 HRK ’000 HRK ’000
Risk category Minimum Maximum Average End of year
Interest rate risk – trading book - 511 145 15
Interest rate risk – banking book 1,824 6,032 3,940 2,946
Credit spread risk 931 3,055 2,223 931
Equity risk 1 4 2 3
Currency risk 237 2,301 868 1,140
Total* 2,994 11,904 7,178 5,035
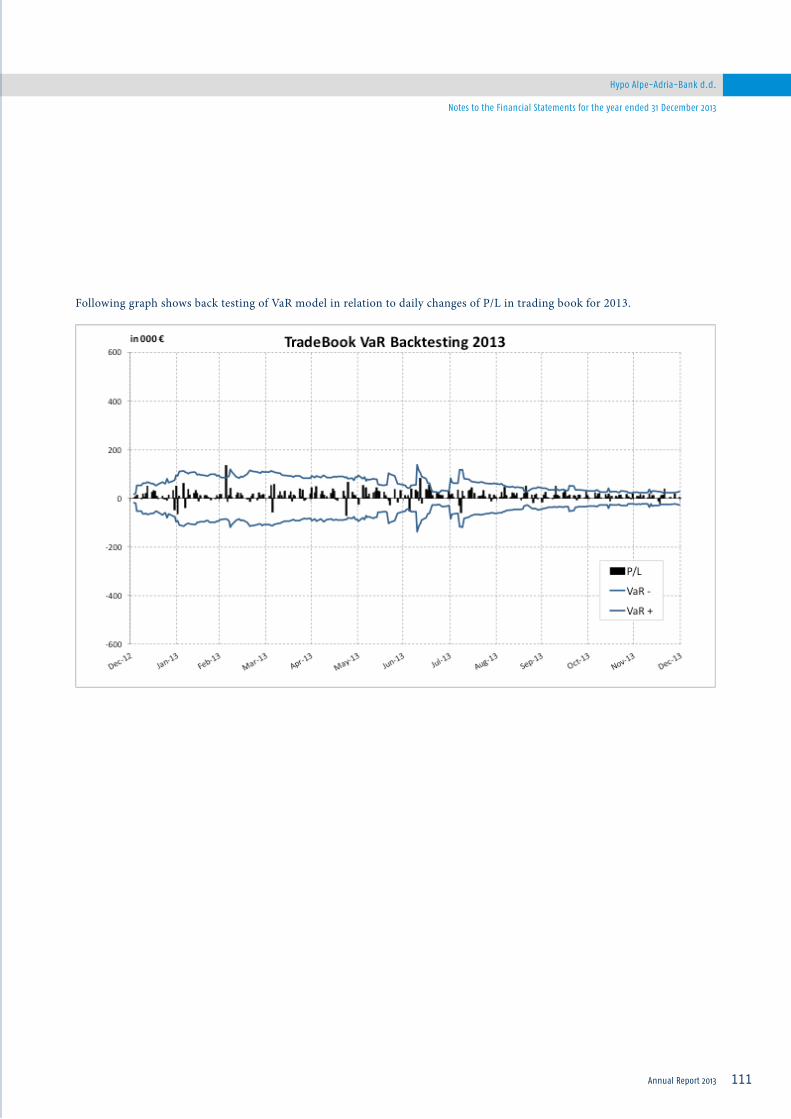
Hypo Alpe-Adria-Bank d.d.
111Annual Report 2013
Notes to the Financial Statements for the year ended 31 December 2013
Following graph shows back testing of VaR model in relation to daily changes of P/L in trading book for 2013.
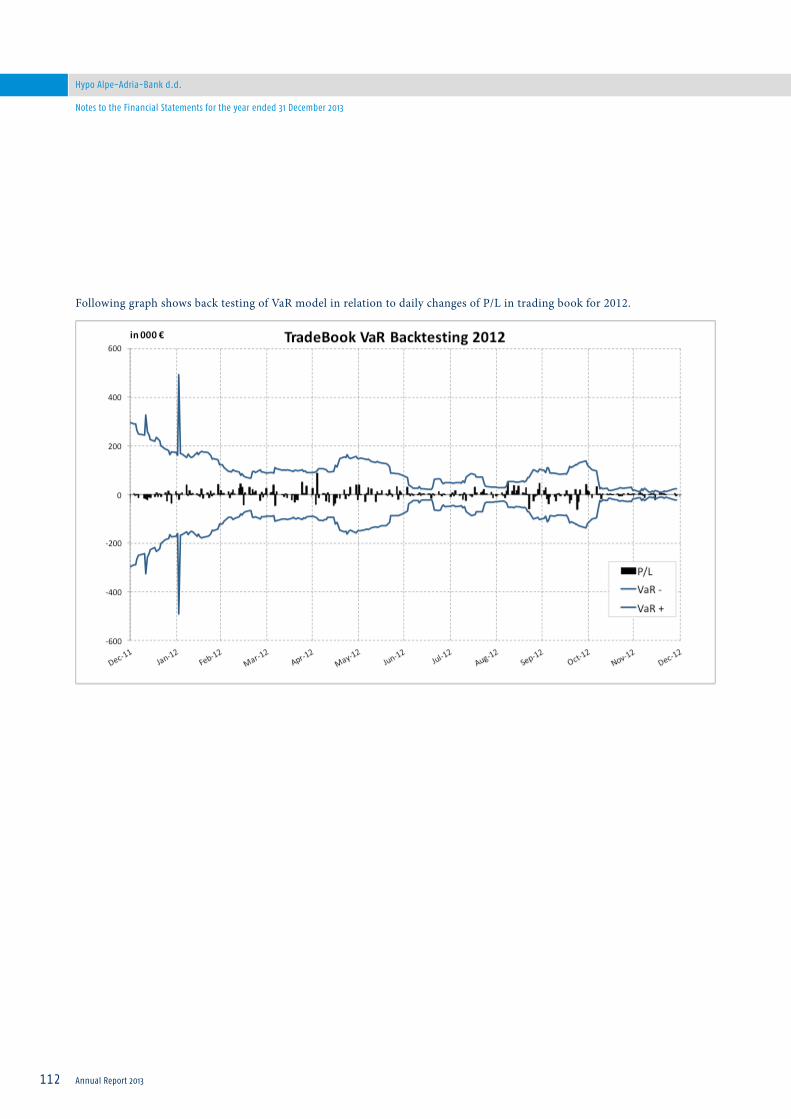
112
Hypo Alpe-Adria-Bank d.d.
Annual Report 2013
Notes to the Financial Statements for the year ended 31 December 2013
Following graph shows back testing of VaR model in relation to daily changes of P/L in trading book for 2012.

Hypo Alpe-Adria-Bank d.d.
113Annual Report 2013
Notes to the Financial Statements for the year ended 31 December 2013
Back testing results of VaR model shows us that five outliers were shown during the 2013. Out of five outliers, four of them are caused by positive daily shift while only one is caused by negative move. Given result represents acceptable amount of dissipa-tion from model predictions.
39.2.3. Foreign currency risk
Bank is exposed to changes of existing foreign currency rates which have influence its financial situation and its cash flows. Foreign currency risk exposures emerge out of credit, deposit and investment activities as well as out of trading activities. For-eign currency risk is controlled daily by regulatory requirement and by internally established limits toward particular curren-cies for assets and liabilities and off balance positions denominated in foreign currencies or in value clause.
Management Board establishes limits on exposure level per particular currency. Such determined internal limits are in line with minimal regulatory requirements of CNB regarding exposure to foreign currency risk (maximum exposure of 30% of liable capital).
The following graph shows comparison in movements of open foreign currency position related to regulatory capital for the year 2013 and 2012:
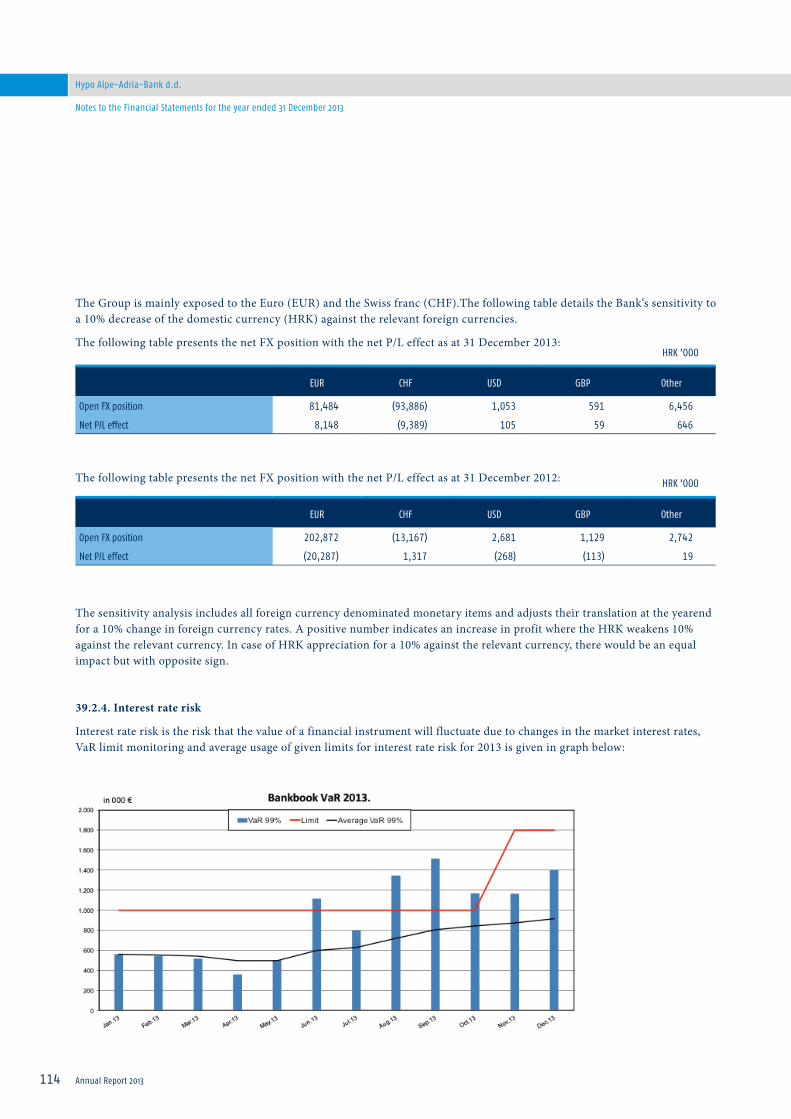
114
Hypo Alpe-Adria-Bank d.d.
Annual Report 2013
Notes to the Financial Statements for the year ended 31 December 2013
The Group is mainly exposed to the Euro (EUR) and the Swiss franc (CHF).The following table details the Bank‘s sensitivity to a 10% decrease of the domestic currency (HRK) against the relevant foreign currencies.
The following table presents the net FX position with the net P/L effect as at 31 December 2013:
The following table presents the net FX position with the net P/L effect as at 31 December 2012:
The sensitivity analysis includes all foreign currency denominated monetary items and adjusts their translation at the yearend for a 10% change in foreign currency rates. A positive number indicates an increase in profit where the HRK weakens 10% against the relevant currency. In case of HRK appreciation for a 10% against the relevant currency, there would be an equal impact but with opposite sign.
39.2.4. Interest rate risk
Interest rate risk is the risk that the value of a financial instrument will fluctuate due to changes in the market interest rates, VaR limit monitoring and average usage of given limits for interest rate risk for 2013 is given in graph below:
EUR CHF USD GBP Other
Open FX position 81,484 (93,886) 1,053 591 6,456
Net P/L eff ect 8,148 (9,389) 105 59 646
EUR CHF USD GBP Other
Open FX position 202,872 (13,167) 2,681 1,129 2,742
Net P/L eff ect (20,287) 1,317 (268) (113) 19
HRK ’000
HRK ’000

Hypo Alpe-Adria-Bank d.d.
115Annual Report 2013
Notes to the Financial Statements for the year ended 31 December 2013
Management of interest rate risk is performed through Interest GAP report, where internally acceptable limits for each time band are set and approved by the Management Board, and based on this report interest rate position steering within limits is performed through local and group Asset Liability Committees. Due receivables are taken into account in the following man-ner; receivables that are due and not impaired are distributed in 1 month time period and impaired receivables that are due are included in 2 year period under assumption that payment out of collaterals will on average occur in that time.
Interest GAP Balance as at 31 December 2013 is as follows:
Interest GAP Balance as at 31 December 2012 is as follows:
*”No Effect” position represents Share capital on Liability side and Tangible asset on Asset side.
Up to1 day
1 day to1 month
1 to 3months
3 monthsto 1 year
1 to 2years
2 to 3years
Over 3years
NoEffect*
Total
Assets 1,596 8,790 9,446 7,889 658 739 140 688 29,946
Liabilities (30) (2,533) (9,248) (8,608) (997) (685) (2,635) (5,210) (29,946)
Interest GAP 1,566 6,257 198 (719) (339) 54 (2,495) (4,522) -
Interest GAP (%)
5.23% 20.89% 0.66% (2.40%) (1.13%) 0.18% (8.33%) (15.10%) 0.00%
Up to1 day
1 day to1 month
1 to 3months
3 monthsto 1 year
1 to 2years
2 to 3years
Over 3years
NoEffect*
Total
Assets 1,693 5,698 17,335 7,543 960 159 683 615 34,686
Liabilities (20) (4,836) (13,031) (6,562) (1,289) (295) (3,439) (5,214) (34,686)
Interest GAP 1,674 861 4,304 981 (329) (136) (2,756) (4,599) -
Interest GAP (%)
4.83% 2.48% 12.41% 2.83% (0.95%) (0.39%) (7.94%) (13.26%) 0.00%
HRK Mio
HRK Mio
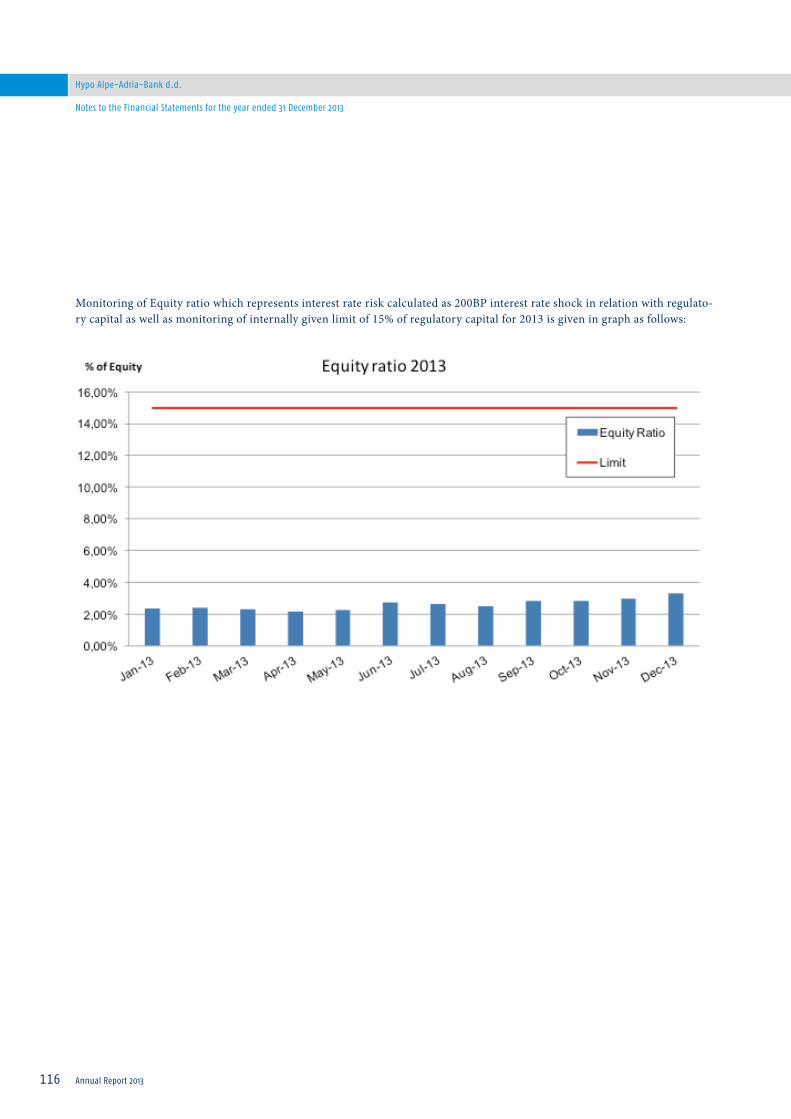
116
Hypo Alpe-Adria-Bank d.d.
Annual Report 2013
Notes to the Financial Statements for the year ended 31 December 2013
Monitoring of Equity ratio which represents interest rate risk calculated as 200BP interest rate shock in relation with regulato-ry capital as well as monitoring of internally given limit of 15% of regulatory capital for 2013 is given in graph as follows:

Hypo Alpe-Adria-Bank d.d.
117Annual Report 2013
Notes to the Financial Statements for the year ended 31 December 2013
The sensitivity analysis below has been determined based on the exposure to interest rates for both derivatives and non-derivative instruments at the balance sheet date. For floating rate liabilities, the analysis is prepared assuming the amount of liability presented at the balance sheet date was constant for the entire year.
A 50 basis point increase or decrease is used when reporting interest rate risk internally to key management personnel and represents Management Board’s assessment of the reasonably possible change in interest rates.
If interest rates had been 50 basis points higher/lower and all other variables were held constant, the impact on Bank’s income statement would be as presented in the following tables.
Interest GAP sensitivity as at 31 December 2013:
Interest GAP sensitivity as at 31 December 2012:
Sensitivity analysis is based on principle described in Basel Committee on Banking Supervision “Principles for the Manage-ment and Supervision of Interest Rate Risk“, July 2004, Annex 3 - The standardized interest rate shock.
Several key events which occurred in 2013, like interest rate conversion on retail loan portfolio from administrative to variable rate together with maturity and decrease of refinancing lines and selling of a part of loan portfolio as well influenced the change of the Bank’s sensitivity to interest rates. Mentioned events, in general, have shortened interest rate reset on asset side more than on liability side and therefore they contributed to Bank’s decreased sensitivity to changes in interest rates.
Up to1 day
1 day to1 month
1 to 3months
3 monthsto 1 year
1 to 2years
2 to 3years
Over 3years
NoEffect
Total
Interest GAP 1,566 6,257 198 (719) (339) 54 (2,495) (4,522) 0
50 BP parallel shift
0.00% 0.02% 0.08% 0.31% 0.69% 1.13% 3.58% 0.00%
P/L effect 0.00 1.25 0.16 (2.23) (2.34) 0.61 (89.33) 0.00 (91.88)
Up to1 day
1 day to1 month
1 to 3months
3 monthsto 1 year
1 to 2years
2 to 3years
Over 3years
NoEffect
Total
Interest GAP 1,674 861 4,304 981 (329) (136) (2,756) (4,599)
50 BP parallel shift
0.00% 0.02% 0.08% 0.31% 0.69% 1.13% 3.58% 0.00% 0.00%
P/L effect - 0.17 3.44 3.04 (2.27) (1.53) (98.66) - (95.80)
HRK Mio
HRK Mio
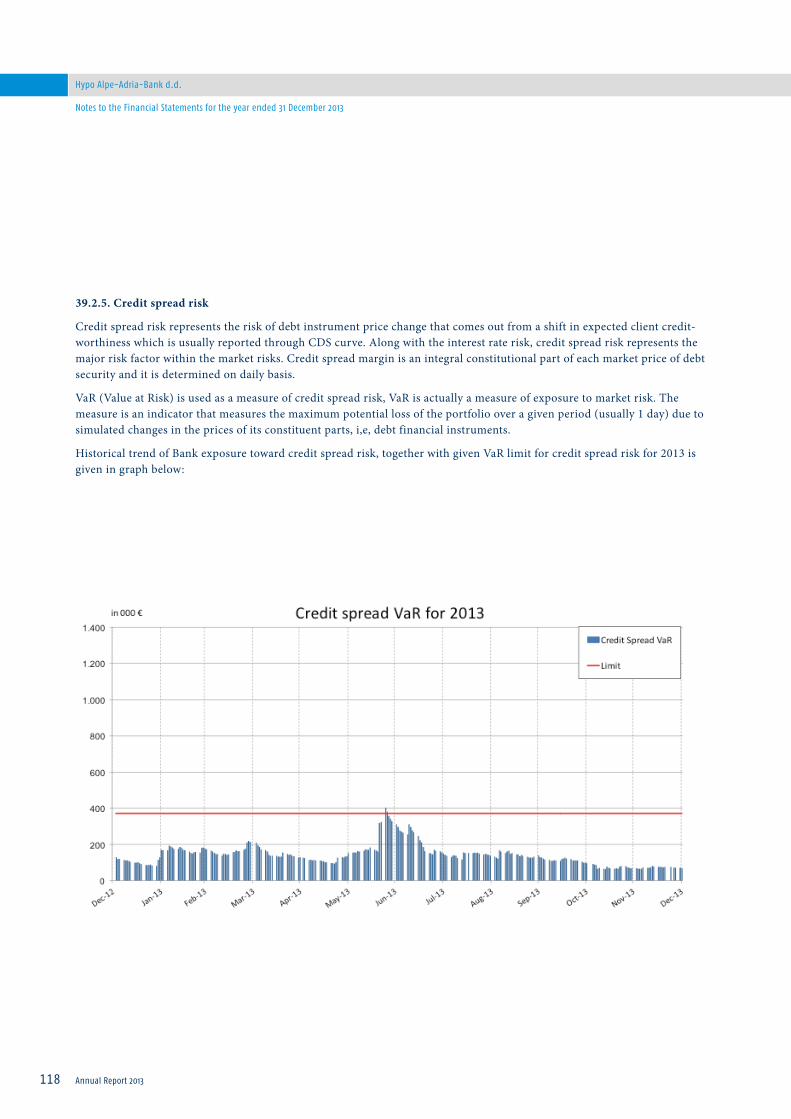
118
Hypo Alpe-Adria-Bank d.d.
Annual Report 2013
Notes to the Financial Statements for the year ended 31 December 2013
39.2.5. Credit spread risk
Credit spread risk represents the risk of debt instrument price change that comes out from a shift in expected client credit-worthiness which is usually reported through CDS curve. Along with the interest rate risk, credit spread risk represents the major risk factor within the market risks. Credit spread margin is an integral constitutional part of each market price of debt security and it is determined on daily basis.
VaR (Value at Risk) is used as a measure of credit spread risk, VaR is actually a measure of exposure to market risk. The measure is an indicator that measures the maximum potential loss of the portfolio over a given period (usually 1 day) due to simulated changes in the prices of its constituent parts, i,e, debt financial instruments.
Historical trend of Bank exposure toward credit spread risk, together with given VaR limit for credit spread risk for 2013 is given in graph below:
Hypo Alpe-Adria-Bank d.d.
119Annual Report 2013
Notes to the Financial Statements for the year ended 31 December 2013
Credit spread risk management is carried out through daily VaR reports, within which monitoring of internally accepted limits is conducted. On the basis of that report, Management and the relevant sectors have information on the amount of risk taken and whether bank is or it is not positioned within the defined/acceptable limits.
39.2.6. Liquidity risk
Liquidity risk is a measure of the extent up to which the Bank may be required to raise funds to meet its commitments associ-ated with financial instruments. Bank is obliged to continuously insure sufficient amount of liquid assets in order to cover all demands that arises from maturity of their obligations.
Bank has a clearly defined tolerance towards liquidity risk exposure which is determined in accordance with adopted strategy and business plans.
In order to meet all regulatory requirements, to achieve and respect security principles and to maintain stability and achieve-ment of planned profitability, systematic measurement, limitation and reporting of liquidity risk is applied within the insti-tution. Bank maintains its liquidity compliant to regulations given by CNB. Bank has applied measurement and reporting of minimum liquidity ratio in accordance with regulatory decision on liquidity risk management.
The following table represents minimum liquidity ratios up to one week and one month period in domestic and convertible (foreign) currencies for the year 2013:
Kuna Kuna Convertiblecurrencies
Convertiblecurrencies
TotalHRK & KVL
TotalHRK & KVL
1 week 1 month 1 week 1 month 1 week 1 month
Year End 3.48 2.31 8.82 2.00 5.25 2.15
Maximum 5.96 3.60 8.82 2.41 5.25 2.49
Minimum 1.55 1.55 1.41 1.12 1.80 1.45
Average 4.20 2.81 3.04 1.54 3.38 1.95
120
Hypo Alpe-Adria-Bank d.d.
Annual Report 2013
Notes to the Financial Statements for the year ended 31 December 2013
CNB Minimum liquidity ratio (MKL) defines that expected cash inflows up to one week and expected cash inflows up to one month must be higher than expected outflows up to one week and up to one month at each day. Amount of MKL recorded its maximum at 31 December 2013 due to decrease on liability side on professional market participants’ positions and due to maturity of refinancing line. In 2013 there were no breaches of minimum liquidity ratio.
The following table represents minimum liquidity ratios up to one week and one month period in domestic and convertible (foreign) currencies for the year 2012:
During 2013 Bank has successfully maintained obligatory amount of foreign currency claims in relation to foreign currencies obligations (so called A/L ratio) according to related Decision given by regulator, which minimum required amount was 17%.
The following table shows the level of A/L ratio in 2013 and 2012:
Amount of minimum required A/L ratio has been maintained on average level above 19%. The reason for A/L ratio increase lies in fact that Bank conducted sale of part of credit portfolio. While liquid foreign currency asset remained unchanged, for-eign currency liability decreased which caused ratio increase. Increment compared to previous year is visible through average ratio level which is for 1.54% higher in relation to previous year.
Furthermore, the Bank has set internal limitations and limits which represent constitutional part of Liquidity Risk Policy. Ratios which the Bank uses in liquidity risk management and which represents tolerance toward liquidity risk are:
- Current liquidity ratio
- Loans to Deposits ratio
- Short term assets to short term Liabilities ratio (up to 1 Year)
Kuna Kuna Convertiblecurrencies
Convertiblecurrencies
TotalHRK & KVL
TotalHRK & KVL
1 week 1 month 1 week 1 month 1 week 1 month
Year End 4.12 2.29 1.75 1.42 2.29 1.67
Maximum 5.88 3.71 12.20 2.57 6.78 2.53
Minimum 1.92 1.43 1.63 1.18 1.83 1.43
Average 3.62 2.37 3.68 1.71 3.48 1.91
2013%
2012%
Year End 18.70 21.64
Maximum 23.41 24.38
Minimum 17.80 17.30
Average 19.80 18.25
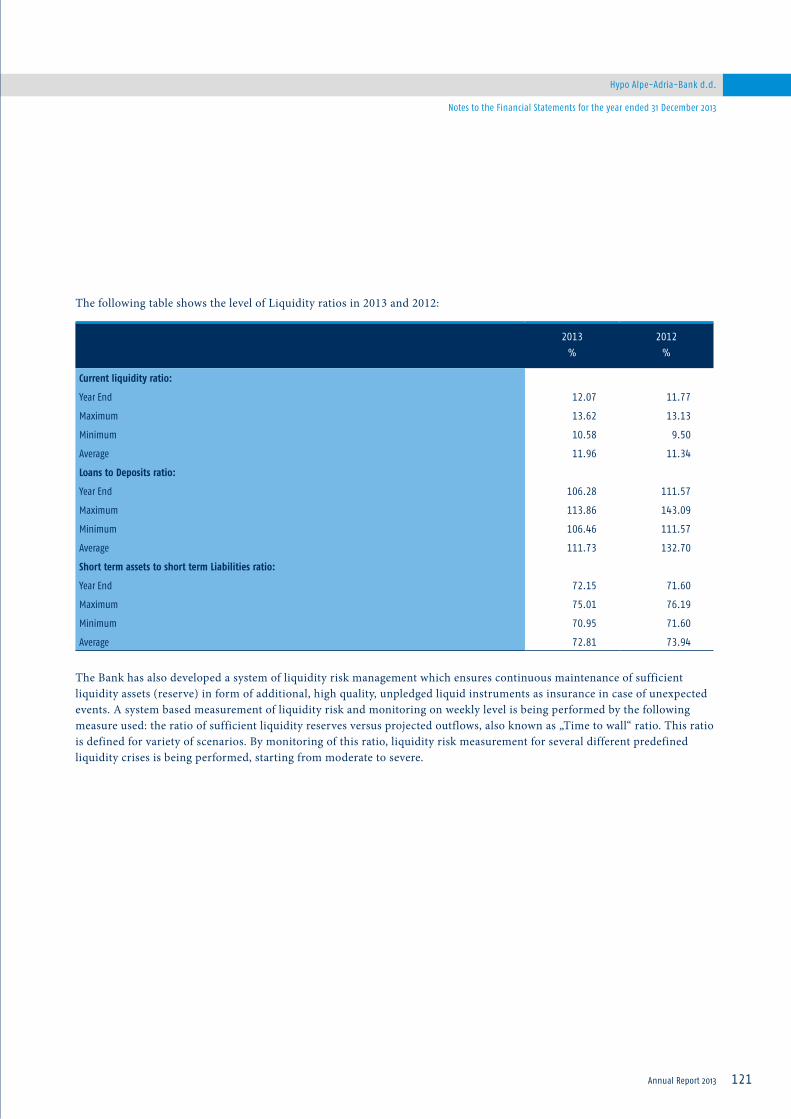
Hypo Alpe-Adria-Bank d.d.
121Annual Report 2013
Notes to the Financial Statements for the year ended 31 December 2013
The following table shows the level of Liquidity ratios in 2013 and 2012:
The Bank has also developed a system of liquidity risk management which ensures continuous maintenance of sufficient liquidity assets (reserve) in form of additional, high quality, unpledged liquid instruments as insurance in case of unexpected events. A system based measurement of liquidity risk and monitoring on weekly level is being performed by the following measure used: the ratio of sufficient liquidity reserves versus projected outflows, also known as „Time to wall“ ratio. This ratio is defined for variety of scenarios. By monitoring of this ratio, liquidity risk measurement for several different predefined liquidity crises is being performed, starting from moderate to severe.
2013%
2012%
Current liquidity ratio:
Year End 12.07 11.77
Maximum 13.62 13.13
Minimum 10.58 9.50
Average 11.96 11.34
Loans to Deposits ratio:
Year End 106.28 111.57
Maximum 113.86 143.09
Minimum 106.46 111.57
Average 111.73 132.70
Short term assets to short term Liabilities ratio:
Year End 72.15 71.60
Maximum 75.01 76.19
Minimum 70.95 71.60
Average 72.81 73.94

122
Hypo Alpe-Adria-Bank d.d.
Annual Report 2013
Notes to the Financial Statements for the year ended 31 December 2013
Graph below shows sufficiency of liquidity reserves in relation to net projected outflows („time to wall“ ratio) on 31 December 2013:

Hypo Alpe-Adria-Bank d.d.
123Annual Report 2013
Notes to the Financial Statements for the year ended 31 December 2013
Graph below shows sufficiency of liquidity reserves in relation to net projected outflows („time to wall“ ratio) on 31 December 2012:
Aside from above, the Bank has established a liquidity contingency plan which comprises a variety of measures and regulates procedures in case of particular crisis. Liquidity crisis declaration criteria are consisted of several quantitative and qualitative ratios which are monitored and reported weekly and monthly. In case that crisis declaration criteria is fulfilled Risk Control-ling department is obliged to inform Management Board, ALCO and LICO which is than in charge for further actions.

124
Hypo Alpe-Adria-Bank d.d.
Annual Report 2013
Notes to the Financial Statements for the year ended 31 December 2013
The Bank places special focus on term structure of assets and liabilities in scope of its liquidity risk management.
The following table gives overview on original maturity divided on short (below 12 months) and long (over 12 months) for Bank‘s financial assets and liabilities as of 31 December 2013:
Maturitybelow 1 year
Maturityover 1 yeare
Total
Assets
Cash 359 - 359
Balances with Croatian National Bank 3,002 - 3,002
Other deposits 221 - 221
Financial assets at fair value through P/L and available for sale 2,038 1,671 3,709
Loans and receivables 1,515 20,224 21,739
Other assets - 248 248
Investments in subsidiaries - 142 142
Property, plant and equipment and intangible assets - 636 636
Total assets 7,135 22,921 30,056
Liabilities
Received deposits 7,798 13,789 21,587
Received loans 1,257 1,892 3,149
Provisions for liabilities and charges 86 - 86
Other liabilities 256 60 316
Capital - 4,918 4,918
Total liabilities and equity 9,397 20,659 30,056
HRK Mio

Hypo Alpe-Adria-Bank d.d.
125Annual Report 2013
Notes to the Financial Statements for the year ended 31 December 2013
The following table gives overview on original maturity divided on short (below 12 months) and long (over 12 months) for Bank‘s financial assets and liabilities as of 31 December 2012:
Maturitybelow 1 year
Maturityover 1 yeare
Total
Assets
Cash 390 - 390
Balances with Croatian National Bank 3,688 - 3,688
Other deposits 588 - 588
Financial assets at fair value through P/L and available for sale 2,927 1,426 4,353
Loans and receivables 1,667 23,265 24,931
Other assets - 115 115
Investments in subsidiaries - 253 253
Property, plant and equipment and intangible assets - 375 375
Total assets 9,260 25,433 34,693
Liabilities
Received deposits 10,431 14,452 24,882
Received loans 1,872 1,742 3,614
Provisions for liabilities and charges 53 - 53
Other liabilities 400 61 461
Capital - 5,683 5,683
Total liabilities and equity 12,756 21,938 34,693
HRK Mio

126
Hypo Alpe-Adria-Bank d.d.
Annual Report 2013
Notes to the Financial Statements for the year ended 31 December 2013
The following table details the remaining contractual maturity for Bank financial assets and liabilities as of 31 December 2013:
The table has been drawn up based on the undiscounted cash flows of financial instruments. Financial instruments without contractual maturity like gyro and current accounts and savings deposits are deployed within maturities up to next 5 years, which is in accordance to historic movements of such instruments.
Retail clients have the possibility to withdraw their term deposits prior to their contractual maturity date. However, historical experience shows that this is not very likely. As of 31 December 2013 the balance of term deposits from customers was HRK 10,409 million and as of 31 December 2012 HRK 10,874 million.
Up to1 day
1 day to1 month
1 to 3months
3 monthsto 1 year
1 to 2years
2 to 3years
Over 3years
Total
Assets
Cash 1,185 109 - - - - - 1,295
Balances with Croatian National Bank
- 408 - 1,696 - 208 - 2,313
Financial assets at fair value through P/L and available for sale
84 198 504 1,679 877 1 24 3,366
Placements with and loans to other banks
191 170 - 6 - 361 - 729
Loans and receivables 26 561 1,102 4,338 3,782 2,939 14,274 27,023
Other assets - 758 11 65 (54) (54) (54) 671
Investments in subsidiaries - - - - - - 183 183
Property, plant and equip-ment and intangible assets
- 14 - - - - 549 564
Total assets 1,486 2,219 1,618 7,784 4,605 3,455 14,976 36,143
Liabilities
Due to other banks - (311) (1,712) (754) (130) (1,378) (2,657) (6,941)
Deposits from customers (148) (2,088) (2,882) (8,477) (1,455) (991) (1,866) (17,908)
Deferred items - (9) (20) (90) (23) - - (142)
Provisions for liabilities and charges
- (26) (5) - - - - (31)
Other liabilities (10) (730) (1) (4) - - - (745)
Capital - 26 52 232 12 12 (5,259) (4,926)
Total liabilities and equity (158) (3,136) (4,569) (9,094) (1,596) (2,357) (9,782) (30,692)
Gap per time band 1,329 (918) (2,951) (1,310) 3,009 1,098 5,194
Gap in % 3.68% (2.54%) (8.17%) (3.62%) 8.32% 3.04% 14.37%
HRK Mio
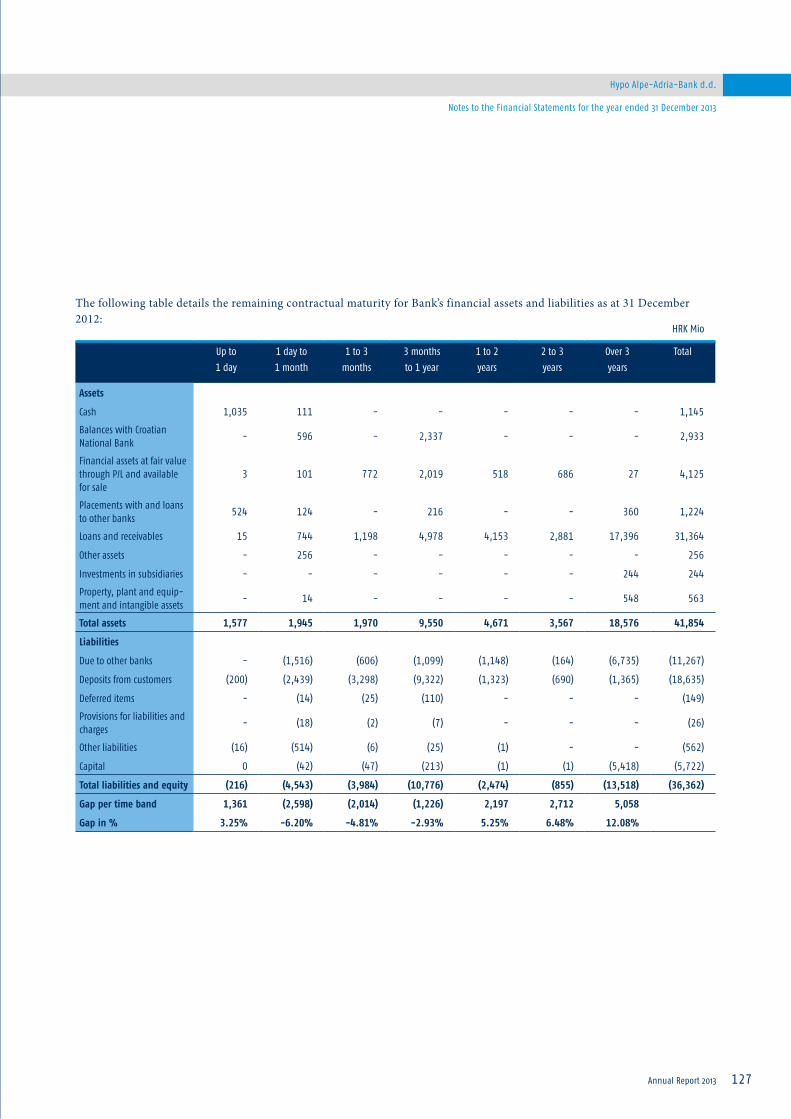
Hypo Alpe-Adria-Bank d.d.
127Annual Report 2013
Notes to the Financial Statements for the year ended 31 December 2013
The following table details the remaining contractual maturity for Bank’s financial assets and liabilities as at 31 December 2012:
Up to1 day
1 day to1 month
1 to 3months
3 monthsto 1 year
1 to 2years
2 to 3years
Over 3years
Total
Assets
Cash 1,035 111 - - - - - 1,145
Balances with Croatian National Bank
- 596 - 2,337 - - - 2,933
Financial assets at fair value through P/L and available for sale
3 101 772 2,019 518 686 27 4,125
Placements with and loans to other banks
524 124 - 216 - - 360 1,224
Loans and receivables 15 744 1,198 4,978 4,153 2,881 17,396 31,364
Other assets - 256 - - - - - 256
Investments in subsidiaries - - - - - - 244 244
Property, plant and equip-ment and intangible assets
- 14 - - - - 548 563
Total assets 1,577 1,945 1,970 9,550 4,671 3,567 18,576 41,854
Liabilities
Due to other banks - (1,516) (606) (1,099) (1,148) (164) (6,735) (11,267)
Deposits from customers (200) (2,439) (3,298) (9,322) (1,323) (690) (1,365) (18,635)
Deferred items - (14) (25) (110) - - - (149)
Provisions for liabilities and charges
- (18) (2) (7) - - - (26)
Other liabilities (16) (514) (6) (25) (1) - - (562)
Capital 0 (42) (47) (213) (1) (1) (5,418) (5,722)
Total liabilities and equity (216) (4,543) (3,984) (10,776) (2,474) (855) (13,518) (36,362)
Gap per time band 1,361 (2,598) (2,014) (1,226) 2,197 2,712 5,058
Gap in % 3.25% -6.20% -4.81% -2.93% 5.25% 6.48% 12.08%
HRK Mio

128
Hypo Alpe-Adria-Bank d.d.
Annual Report 2013
Notes to the Financial Statements for the year ended 31 December 2013
The following table details the remaining maturity for Bank’s off balance positions as at 31 December 2013:
The following table details the remaining maturity for Bank’s off balance positions as at 31 December 2012:
Up to1 day
1 day to1 month
1 to 3months
3 monthsto 1 year
1 to 2years
2 to 3years
Over 3years
Total
Off Balance
Non used overdrafts, frames and credit lines
492 15 37 194 151 246 128 1,263
Guarantees & Letters of credit
25 35 100 375 158 53 281 1,028
Derivatives nominal -long - 394 968 1,583 - 491 - 3,436
Derivatives nominal -short - (399) (981) (1,574) - (499) - (3,453)
Up to1 day
1 day to1 month
1 to 3months
3 monthsto 1 year
1 to 2years
2 to 3years
Over 3years
Total
Off Balance
Non used overdrafts, frames and credit lines
1,182 22 9 238 145 171 87 1,855
Guarantees & Letters of credit
60 77 189 383 187 75 428 1,400
Derivatives nominal -long - 653 1,086 1,129 221 - 491 3,580
Derivatives nominal -short - (654) (1,123) (1,123) (226) - (500) (3,626)
HRK Mio
HRK Mio
Hypo Alpe-Adria-Bank d.d.
129Annual Report 2013
Notes to the Financial Statements for the year ended 31 December 2013
39.3. Operational Risk
Operational Risk is the risk of a loss resulting from inadequate or failed internal processes, systems, people or external factors. This definition includes legal and reputational risk.
Regulatory requirements with respect to the operational risk management process are related to continuous determination of risk to which the Bank is exposed or could be exposed in their operations and analysis of the risk exposure causes. Standards for operational risk management process are aligned with the legislation of Croatian National Bank.
Operational risk management process includes comprehensiveness of the organizational structure, policies, processes, proce-dures, systems and resources for identifying, measuring and assessing, controlling, monitoring and reporting of operational risk exposures and risk management in general, and includes the establishment of appropriate corporate governance and risk culture.
The organizational structure of the operational risk management reflects the fact that operational risk is inherent in the ove-rall operations of the Bank including a Risk Control function as a central component that coordinates, analyzes and monitors operational risk, and a decentralized component in all organizational units of the Bank responsible for everyday practical use and implementation of operational risk management process.
Within the operational risk management roles and responsibilities are strictly defined and documented in internal documents which allow communication and collaboration at all levels, and an adequate flow and circulation of information relevant for operational risk management. Non blaming culture prevents any conflict of interest in the data collection process. Raising awareness on operational risk management is carried out by continuously maintaining of the internal trainings in the Bank and by establishment of the Operational Risk Committee as a body for approval and discussion of strategic issues related to monitoring and managing operational risk at the level of the Bank.
Operational risk management process is based on a proactive approach to the early detection and prevention of operational risk events that could cause a loss. In the document „Operational Risk Management Policy“ the Bank has summarized rules for the identification, assessment, management and control of the operational risk. Series of internal acts were created that strategically and operationally define operational risk management process and clearly define the roles and responsibilities of all the Bank‘s employees involved in it.
Methods of measuring the operational risk include both quantitative and qualitative methods which represents the tool for observation of changes in the Bank‘s risk profile.
Quantitative method of measuring the operational risk includes the data collection about the events that resulted in losses or could result in losses due to the operational risk. Qualitative method of measurement of the operational risk includes an ana-lysis of scenarios for the events of low frequency and significant consequences on an annual basis, a risk assessment during the implementation of new products, entering new markets, outsourced activities, project management and implementation of the internal control system which includes an assessment of the risk in business processes and test effectiveness of the controls.
To calculate the capital requirement for operational risk, Bank uses the standardized approach.
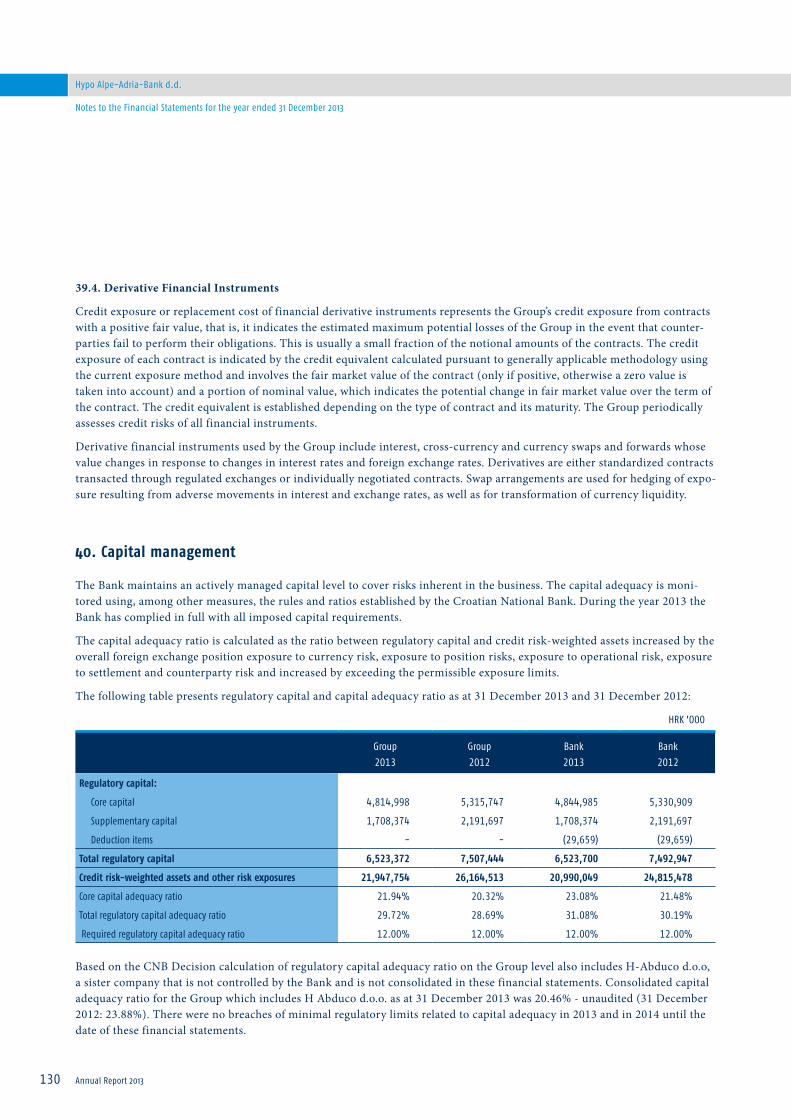
130
Hypo Alpe-Adria-Bank d.d.
Annual Report 2013
Notes to the Financial Statements for the year ended 31 December 2013
39.4. Derivative Financial Instruments
Credit exposure or replacement cost of financial derivative instruments represents the Group’s credit exposure from contracts with a positive fair value, that is, it indicates the estimated maximum potential losses of the Group in the event that counter-parties fail to perform their obligations. This is usually a small fraction of the notional amounts of the contracts. The credit exposure of each contract is indicated by the credit equivalent calculated pursuant to generally applicable methodology using the current exposure method and involves the fair market value of the contract (only if positive, otherwise a zero value is taken into account) and a portion of nominal value, which indicates the potential change in fair market value over the term of the contract. The credit equivalent is established depending on the type of contract and its maturity. The Group periodically assesses credit risks of all financial instruments.
Derivative financial instruments used by the Group include interest, cross-currency and currency swaps and forwards whose value changes in response to changes in interest rates and foreign exchange rates. Derivatives are either standardized contracts transacted through regulated exchanges or individually negotiated contracts. Swap arrangements are used for hedging of expo-sure resulting from adverse movements in interest and exchange rates, as well as for transformation of currency liquidity.
40. Capital management
The Bank maintains an actively managed capital level to cover risks inherent in the business. The capital adequacy is moni-tored using, among other measures, the rules and ratios established by the Croatian National Bank. During the year 2013 the Bank has complied in full with all imposed capital requirements.
The capital adequacy ratio is calculated as the ratio between regulatory capital and credit risk-weighted assets increased by the overall foreign exchange position exposure to currency risk, exposure to position risks, exposure to operational risk, exposure to settlement and counterparty risk and increased by exceeding the permissible exposure limits.
The following table presents regulatory capital and capital adequacy ratio as at 31 December 2013 and 31 December 2012:
Based on the CNB Decision calculation of regulatory capital adequacy ratio on the Group level also includes H-Abduco d.o.o, a sister company that is not controlled by the Bank and is not consolidated in these financial statements. Consolidated capital adequacy ratio for the Group which includes H Abduco d.o.o. as at 31 December 2013 was 20.46% - unaudited (31 December 2012: 23.88%). There were no breaches of minimal regulatory limits related to capital adequacy in 2013 and in 2014 until the date of these financial statements.
Group2013
Group2012
Bank2013
Bank2012
Regulatory capital:
Core capital 4,814,998 5,315,747 4,844,985 5,330,909
Supplementary capital 1,708,374 2,191,697 1,708,374 2,191,697
Deduction items - - (29,659) (29,659)
Total regulatory capital 6,523,372 7,507,444 6,523,700 7,492,947
Credit risk-weighted assets and other risk exposures 21,947,754 26,164,513 20,990,049 24,815,478
Core capital adequacy ratio 21.94% 20.32% 23.08% 21.48%
Total regulatory capital adequacy ratio 29.72% 28.69% 31.08% 30.19%
Required regulatory capital adequacy ratio 12.00% 12.00% 12.00% 12.00%
HRK ’000
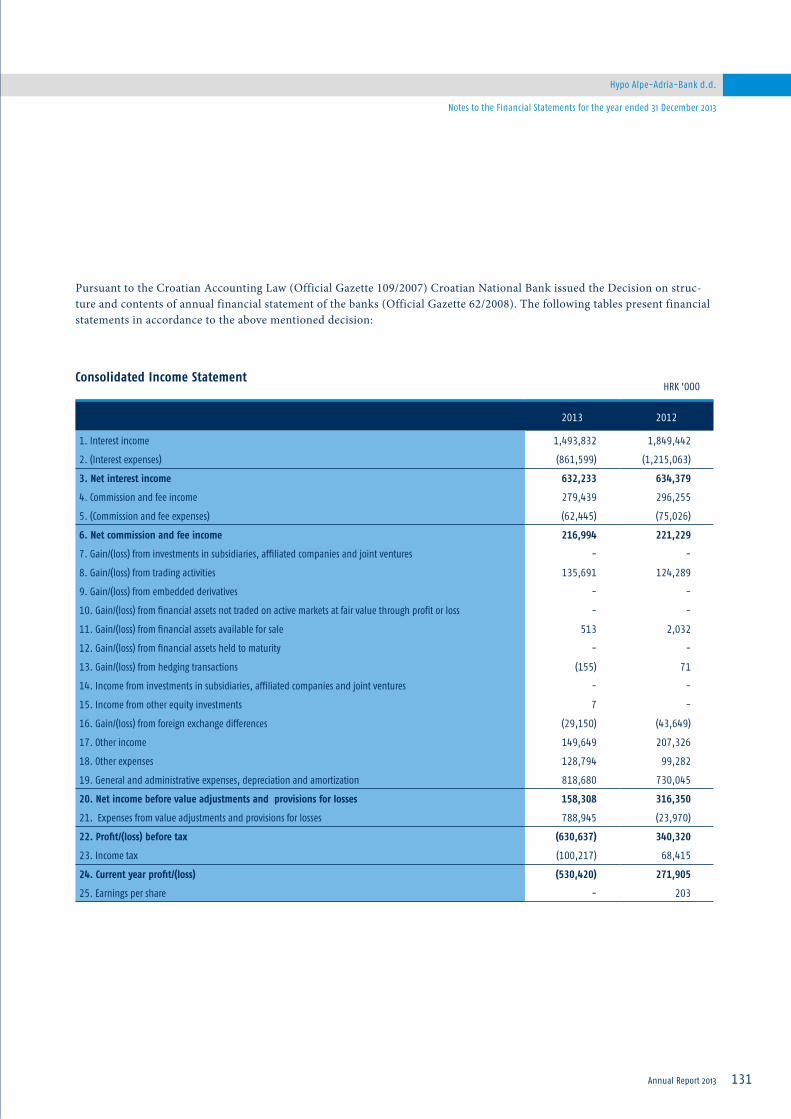
Hypo Alpe-Adria-Bank d.d.
131Annual Report 2013
Notes to the Financial Statements for the year ended 31 December 2013
Pursuant to the Croatian Accounting Law (Official Gazette 109/2007) Croatian National Bank issued the Decision on struc-ture and contents of annual financial statement of the banks (Official Gazette 62/2008). The following tables present financial statements in accordance to the above mentioned decision:
Consolidated Income Statement
2013 2012
1. Interest income 1,493,832 1,849,442
2. (Interest expenses) (861,599) (1,215,063)
3. Net interest income 632,233 634,379
4. Commission and fee income 279,439 296,255
5. (Commission and fee expenses) (62,445) (75,026)
6. Net commission and fee income 216,994 221,229
7. Gain/(loss) from investments in subsidiaries, affiliated companies and joint ventures - -
8. Gain/(loss) from trading activities 135,691 124,289
9. Gain/(loss) from embedded derivatives - -
10. Gain/(loss) from financial assets not traded on active markets at fair value through profit or loss - -
11. Gain/(loss) from financial assets available for sale 513 2,032
12. Gain/(loss) from financial assets held to maturity - -
13. Gain/(loss) from hedging transactions (155) 71
14. Income from investments in subsidiaries, affiliated companies and joint ventures - -
15. Income from other equity investments 7 -
16. Gain/(loss) from foreign exchange differences (29,150) (43,649)
17. Other income 149,649 207,326
18. Other expenses 128,794 99,282
19. General and administrative expenses, depreciation and amortization 818,680 730,045
20. Net income before value adjustments and provisions for losses 158,308 316,350
21. Expenses from value adjustments and provisions for losses 788,945 (23,970)
22. Profit/(loss) before tax (630,637) 340,320
23. Income tax (100,217) 68,415
24. Current year profit/(loss) (530,420) 271,905
25. Earnings per share - 203
HRK ’000

132
Hypo Alpe-Adria-Bank d.d.
Annual Report 2013
Notes to the Financial Statements for the year ended 31 December 2013
Appendix to the Income Statement
2013 2012
Current year profit/(loss) (530,420) 271,905
Distributable to the parent company shareholders (530,420) 271,905
Minority participation - -
Signed on behalf of HYPO ALPE-ADRIA-BANK d.d. Zagreb on 15 April 2014:
Joško Mihić Brane Golubić Tea MartinčićMember of the Management Board Member of the Management Board Member of the Management Board
HRK ’000

Hypo Alpe-Adria-Bank d.d.
133Annual Report 2013
Appendix to the Financial Statements for the year ended 31 December 2013
Consolidated Balance Sheet
2013 2012
Assets
1. Cash and deposits with CNB 3,567,429 4,044,803
1.1. Cash 359,025 389,515
1.2. Deposits with CNB 3,208,404 3,655,288
2. Deposits with banking institutions 220,652 563,272
3. Treasury bills of Ministry of Finance and treasury bills of CNB 471,715 625,725
4. Securities and other financial instruments held for trading 45,749 9,374
5. Securities and other financial instruments available for sale 2,674,975 3,364,087
6. Securities and other financial instruments held to maturity - -
7. Securities and other financial instruments that are not traded on active markets at fair value through profit or loss
- -
8. Derivative financial assets 8,545 4,702
9. Loans to financial institutions 572,808 708,756
10. Loans to other clients 21,259,551 24,299,314
11. Investments in subsidiaries, affiliated companies and joint ventures - -
12. Repossessed assets 115,664 136,359
13. Tangible assets (minus depreciation) 1,219,952 1,380,952
14. Interests, fees and other assets 566,410 493,671
A. Total assets 30,723,450 35,631,015
HRK ’000

134
Hypo Alpe-Adria-Bank d.d.
Annual Report 2013
Appendix to the Financial Statements for the year ended 31 December 2013
2013 2012
Liabilities and equity
1. Borrowings from financial institutions 1,382,339 1,336,859
1.1. Short-term borrowings 34,599 70,115
1.2. Long-term borrowings 1,347,740 1,266,744
2. Deposits 19,041,174 22,065,513
2.1. Deposits on giro-accounts and current accounts 2,111,731 2,294,038
2.2. Savings deposits 1,459,231 1,378,556
2.3. Term deposits 15,470,212 18,392,919
3. Other borrowings 2,468,793 3,185,629
3.1. Short-term borrowings 1,270,771 2,031,238
3.2. Long-term borrowings 1,198,022 1,154,391
4. Derivative financial liabilities and other trading financial liabilities 28,603 58,925
5. Issued debt securities - -
5.1. Issued short-term debt securities - -
5.2. Issued long-term debt securities - -
6. Issued subordinated instruments - -
7. Issued subordinated debt 2,204,821 2,440,703
8. Interests, fees and other liabilities 706,189 860,343
B. Total liabilities 25,831,919 29,947,972
Equity
1. Share capital 5,252,167 5,252,167
2. Current year gain/loss (530,420) 271,905
3. Retained earnings/(loss) 2,044 4,883
4. Legal reserves 125,851 113,002
5. Statutory and other capital reserves 40,155 47,230
6. Unrealised gain /(loss) from available for sale fair value adjustment 1,734 (6,144)
C. Total equity 4,891,531 5,683,043
D. Total liabilities and equity 30,723,450 35,631,015
HRK ’000

Hypo Alpe-Adria-Bank d.d.
135Annual Report 2013
Appendix to the Financial Statements for the year ended 31 December 2013
Appendix to the Balance Sheet
2013 2012
Total equity 4,891,531 5,683,043
Equity distributable to parent company shareholders 4,891,531 5,683,043
Minority participation - -
Signed on behalf of HYPO ALPE-ADRIA-BANK d.d. Zagreb on 15 April 2014:
Joško Mihić Brane Golubić Tea MartinčićMember of the Management Board Member of the Management Board Member of the Management Board
HRK ’000
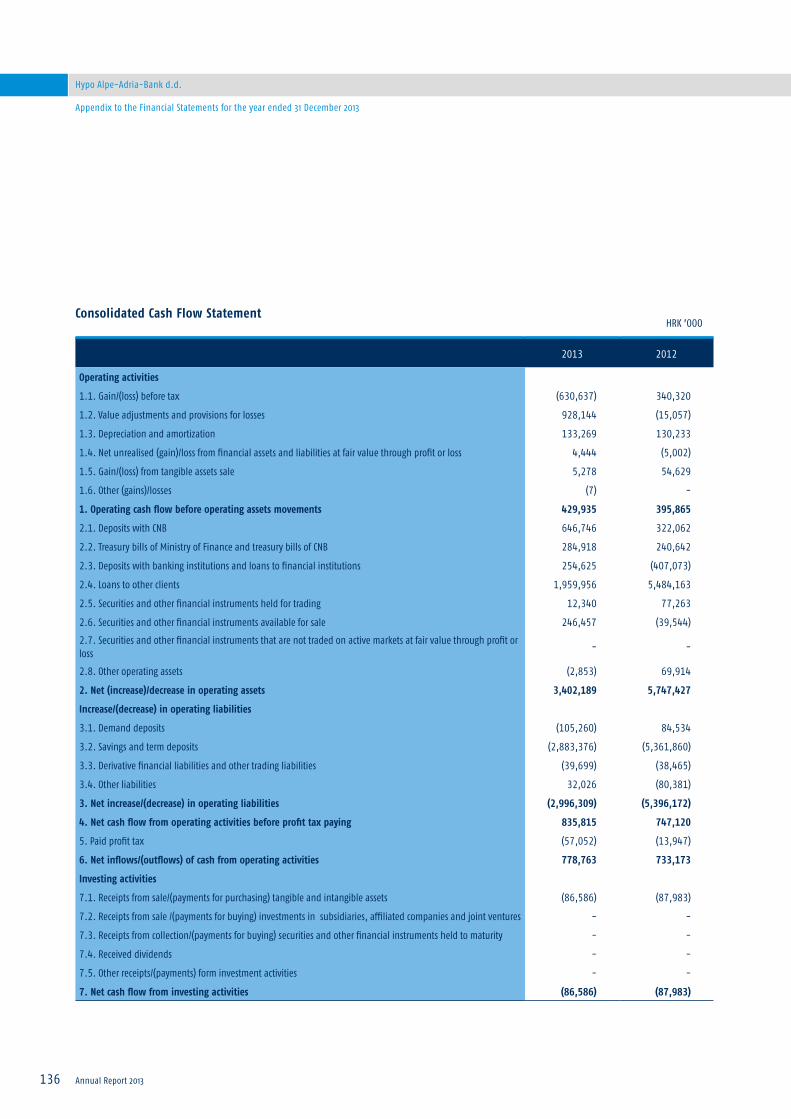
136
Hypo Alpe-Adria-Bank d.d.
Annual Report 2013
Appendix to the Financial Statements for the year ended 31 December 2013
Consolidated Cash Flow Statement
2013 2012
Operating activities
1.1. Gain/(loss) before tax (630,637) 340,320
1.2. Value adjustments and provisions for losses 928,144 (15,057)
1.3. Depreciation and amortization 133,269 130,233
1.4. Net unrealised (gain)/loss from financial assets and liabilities at fair value through profit or loss 4,444 (5,002)
1.5. Gain/(loss) from tangible assets sale 5,278 54,629
1.6. Other (gains)/losses (7) -
1. Operating cash flow before operating assets movements 429,935 395,865
2.1. Deposits with CNB 646,746 322,062
2.2. Treasury bills of Ministry of Finance and treasury bills of CNB 284,918 240,642
2.3. Deposits with banking institutions and loans to financial institutions 254,625 (407,073)
2.4. Loans to other clients 1,959,956 5,484,163
2.5. Securities and other financial instruments held for trading 12,340 77,263
2.6. Securities and other financial instruments available for sale 246,457 (39,544)
2.7. Securities and other financial instruments that are not traded on active markets at fair value through profit or loss
- -
2.8. Other operating assets (2,853) 69,914
2. Net (increase)/decrease in operating assets 3,402,189 5,747,427
Increase/(decrease) in operating liabilities
3.1. Demand deposits (105,260) 84,534
3.2. Savings and term deposits (2,883,376) (5,361,860)
3.3. Derivative financial liabilities and other trading liabilities (39,699) (38,465)
3.4. Other liabilities 32,026 (80,381)
3. Net increase/(decrease) in operating liabilities (2,996,309) (5,396,172)
4. Net cash flow from operating activities before profit tax paying 835,815 747,120
5. Paid profit tax (57,052) (13,947)
6. Net inflows/(outflows) of cash from operating activities 778,763 733,173
Investing activities
7.1. Receipts from sale/(payments for purchasing) tangible and intangible assets (86,586) (87,983)
7.2. Receipts from sale /(payments for buying) investments in subsidiaries, affiliated companies and joint ventures - -
7.3. Receipts from collection/(payments for buying) securities and other financial instruments held to maturity - -
7.4. Received dividends - -
7.5. Other receipts/(payments) form investment activities - -
7. Net cash flow from investing activities (86,586) (87,983)
HRK ’000

Hypo Alpe-Adria-Bank d.d.
137Annual Report 2013
Appendix to the Financial Statements for the year ended 31 December 2013
2013 2012
Financial activities
8.1. Net increase/(decrease) in borrowings (621,451) (477,097)
8.2. Net increase/(decrease) in issued debt securities - -
8.3. Net increase/(decrease) in subordinated debt (220,046) (131)
8.4. Receipts from issued share capital - (751,070)
8.5. (Dividends paid) (262,321) (41,890)
8.6. Other receipts/(payments) from financial activities - -
8. Net cash flow from financial activities (1,103,818) (1,270,188)
9. Net increase/(decrease) in cash and cash equivalents (411,641) (624,998)
10. Effects from foreign exchange rates changes on cash and cash equivalents (31,578) 54,742
11. Net increase/(decrease) in cash and cash equivalents (443,219) (570,256)
12. Cash and cash equivalents at the beginning of the year 2,606,530 3,176,786
13. Cash and cash equivalents at the end of the year 2,163,311 2,606,530
HRK ’000
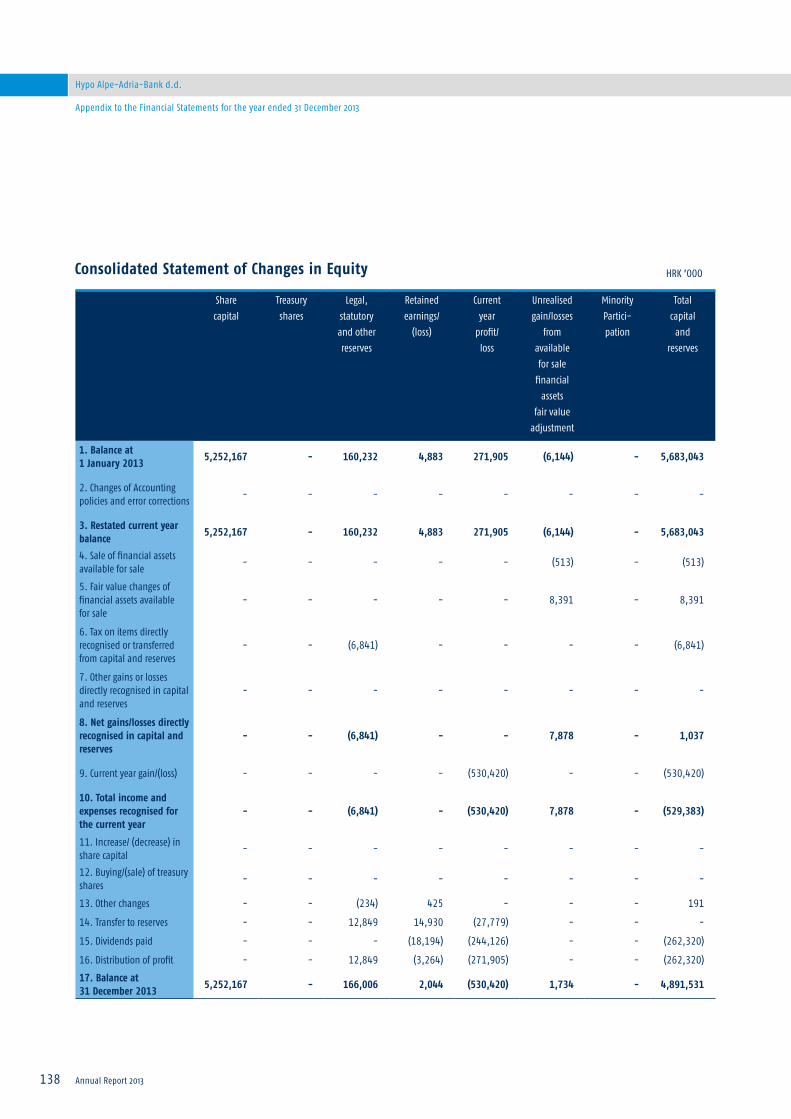
138
Hypo Alpe-Adria-Bank d.d.
Annual Report 2013
Appendix to the Financial Statements for the year ended 31 December 2013
Sharecapital
Treasuryshares
Legal,statutoryand otherreserves
Retained earnings/
(loss)
Currentyear
profit/loss
Unrealisedgain/losses
fromavailable for sale
financialassets
fair value adjustment
MinorityPartici-pation
Totalcapital
andreserves
1. Balance at 1 January 2013
5,252,167 - 160,232 4,883 271,905 (6,144) - 5,683,043
2. Changes of Accounting policies and error corrections
- - - - - - - -
3. Restated current year balance
5,252,167 - 160,232 4,883 271,905 (6,144) - 5,683,043
4. Sale of financial assets available for sale
- - - - - (513) - (513)
5. Fair value changes of financial assets available for sale
- - - - - 8,391 - 8,391
6. Tax on items directly recognised or transferred from capital and reserves
- - (6,841) - - - - (6,841)
7. Other gains or losses directly recognised in capital and reserves
- - - - - - - -
8. Net gains/losses directly recognised in capital and reserves
- - (6,841) - - 7,878 - 1,037
9. Current year gain/(loss) - - - - (530,420) - - (530,420)
10. Total income and expenses recognised for the current year
- - (6,841) - (530,420) 7,878 - (529,383)
11. Increase/ (decrease) in share capital
- - - - - - - -
12. Buying/(sale) of treasury shares
- - - - - - - -
13. Other changes - - (234) 425 - - - 191
14. Transfer to reserves - - 12,849 14,930 (27,779) - - -
15. Dividends paid - - - (18,194) (244,126) - - (262,320)
16. Distribution of profit - - 12,849 (3,264) (271,905) - - (262,320)
17. Balance at 31 December 2013
5,252,167 - 166,006 2,044 (530,420) 1,734 - 4,891,531
HRK ’000

Hypo Alpe-Adria-Bank d.d.
139Annual Report 2013
Appendix to the Financial Statements for the year ended 31 December 2013
Sharecapital
Treasuryshares
Legal,statutoryand otherreserves
Retained earnings/
(loss)
Currentyear
profit/loss
Unrealisedgain/losses
fromavailable for sale
financialassets
fair value adjustment
MinorityPartici-pation
Totalcapital
andreserves
1. Balance at 1 January 2012
5,252,167 - 168,010 (14,985) 45,682 (9,446) - 5,441,428
2. Changes of Accounting policies and error corrections
- - - - - - - -
3. Restated current year balance
5,252,167 - 168,010 (14,985) 45,682 (9,446) - 5,441,428
4. Sale of financial assets available for sale
- - - - - (2,032) - (2,032)
5. Fair value changes of financial assets available for sale
- - - - - 5,334 - 5,334
6. Tax on items directly recognised or transferred from capital and reserves
- - (637) - - - - (637)
7. Other gains or losses directly recognised in capital and reserves
- - - - - - - -
8. Net gains/losses directly recognised in capital and reserves
- - (637) - - 3,302 - 2,665
9. Current year gain/(loss) - - - - 271,905 - - 271,905
10. Total income and expenses recognised for the current year
- - (637) - 271,905 3,302 - 274,570
11. Increase/ (decrease) in share capital
- - - - - - - -
12. Buying/(sale) of treasury shares
- - - - - - - -
13. Other changes - - (9,259) 18,194 - - - 8,935
14. Transfer to reserves - - 2,118 3,321 (5,439) - - -
15. Dividends paid - - - (1,647) (40,243) - - (41,890)
16. Distribution of profit - - 2,118 1,674 (45,682) - - (41,890)
17. Balance at 31 December 2012
5,252,167 - 160,232 4,883 271,905 (6,144) - 5,683,043
HRK ’000
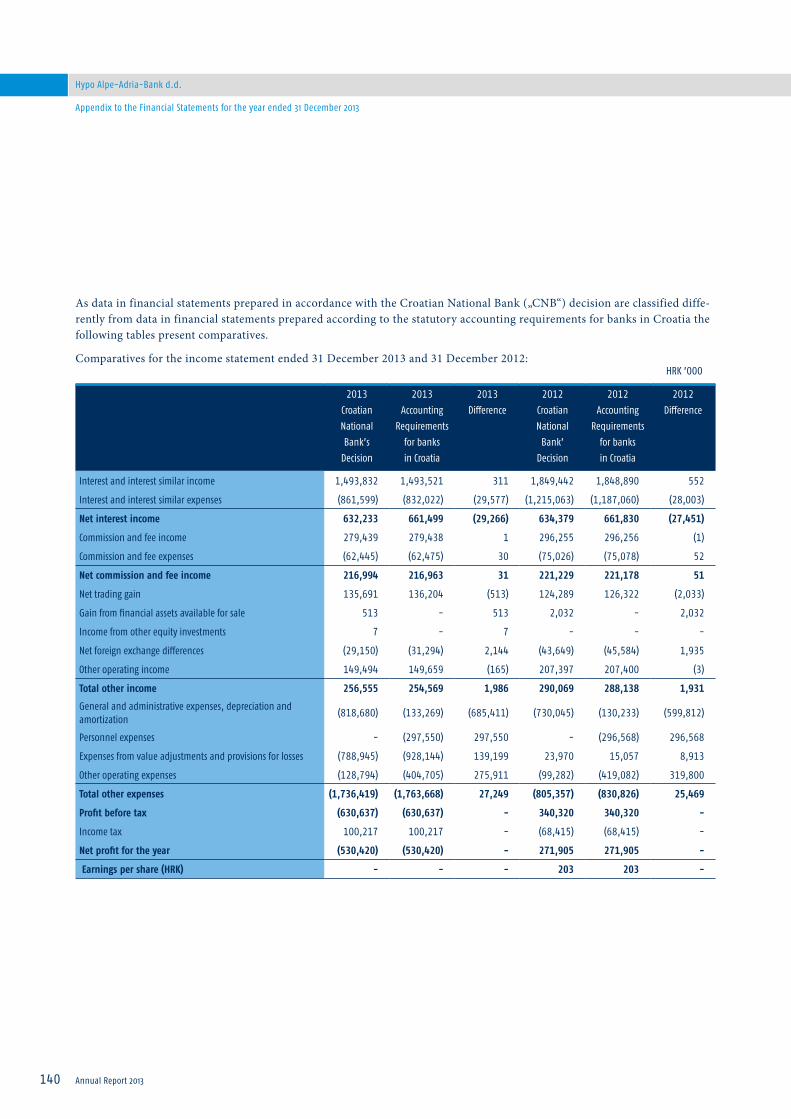
140
Hypo Alpe-Adria-Bank d.d.
Annual Report 2013
Appendix to the Financial Statements for the year ended 31 December 2013
As data in financial statements prepared in accordance with the Croatian National Bank („CNB“) decision are classified diffe-rently from data in financial statements prepared according to the statutory accounting requirements for banks in Croatia the following tables present comparatives.
Comparatives for the income statement ended 31 December 2013 and 31 December 2012:
2013CroatianNationalBank’s
Decision
2013Accounting
Requirementsfor banksin Croatia
2013Difference
2012CroatianNational
Bank’Decision
2012Accounting
Requirementsfor banksin Croatia
2012Difference
Interest and interest similar income 1,493,832 1,493,521 311 1,849,442 1,848,890 552
Interest and interest similar expenses (861,599) (832,022) (29,577) (1,215,063) (1,187,060) (28,003)
Net interest income 632,233 661,499 (29,266) 634,379 661,830 (27,451)
Commission and fee income 279,439 279,438 1 296,255 296,256 (1)
Commission and fee expenses (62,445) (62,475) 30 (75,026) (75,078) 52
Net commission and fee income 216,994 216,963 31 221,229 221,178 51
Net trading gain 135,691 136,204 (513) 124,289 126,322 (2,033)
Gain from financial assets available for sale 513 - 513 2,032 - 2,032
Income from other equity investments 7 - 7 - - -
Net foreign exchange differences (29,150) (31,294) 2,144 (43,649) (45,584) 1,935
Other operating income 149,494 149,659 (165) 207,397 207,400 (3)
Total other income 256,555 254,569 1,986 290,069 288,138 1,931
General and administrative expenses, depreciation and amortization
(818,680) (133,269) (685,411) (730,045) (130,233) (599,812)
Personnel expenses - (297,550) 297,550 - (296,568) 296,568
Expenses from value adjustments and provisions for losses (788,945) (928,144) 139,199 23,970 15,057 8,913
Other operating expenses (128,794) (404,705) 275,911 (99,282) (419,082) 319,800
Total other expenses (1,736,419) (1,763,668) 27,249 (805,357) (830,826) 25,469
Profit before tax (630,637) (630,637) - 340,320 340,320 -
Income tax 100,217 100,217 - (68,415) (68,415) -
Net profit for the year (530,420) (530,420) - 271,905 271,905 -
Earnings per share (HRK) - - - 203 203 -
HRK ’000

Hypo Alpe-Adria-Bank d.d.
141Annual Report 2013
Appendix to the Financial Statements for the year ended 31 December 2013
The difference in position „Interest and interest similar income“ of HRK 311 thousand relates to foreign exchange differences disclosed in „Net foreign exchange differences“ in the income statement in accordance with statutory accounting requirements for banks in Croatia.
The difference in position „Interest and interest similar expenses“ of HRK 29,565 thousand relates to savings deposits in-surance premium expenses disclosed in „Other operating expenses“ in accordance with statutory accounting requirements for banks in Croatia. The difference of HRK 12 thousand relates to foreign exchange differences disclosed in „Net foreign exchange differences“ in the income statement in accordance with statutory accounting requirements for banks in Croatia.
The difference in position „Commission and fee income“ of HRK 1 thousand relates to foreign exchange differences on non-interest receivables disclosed in „Net foreign exchange differences“ in financial statements in accordance with statutory accounting requirements for banks in Croatia.
The difference in position „Commission and fee expenses“ of HRK 30 thousand relates to foreign exchange differences on non-interest payables disclosed in „Net foreign exchange differences“ in financial statements in accordance with statutory accounting requirements for banks in Croatia.
The difference in position „Gain from financial assets available for sale“ of HRK 513 thousand relates to income from trading in assets available for sale disclosed in „Net trading gain“ in financial statements in accordance with statutory accounting requirements for banks in Croatia.
The difference in position „Income from other equity investments“ of HRK 7 thousand relates to dividends received disclosed in „Other operating income“ in financial statements in accordance with statutory accounting requirements for banks in Croa-tia.
The difference in position „Net foreign exchange differences“ of HRK 2,473 thousand relates to foreign exchange differences on impairment items disclosed in „Expenses from value adjustments and provisions for losses“ in accordance with CNB deci-sion. The difference of HRK 330 relates to above listed foreign exchange differences on interest and non-interest receivables and payables.
The difference in position „Other operating income“ of HRK 158 thousand relates to income from collected written-off recei-vables disclosed in „Expenses from value adjustments and provisions for losses“ in accordance with CNB decision. The dif-ference of HRK 7 thousand relates to dividends received disclosed in „Income from other equity investments“ in accordance with CNB decision.
142
Hypo Alpe-Adria-Bank d.d.
Annual Report 2013
Appendix to the Financial Statements for the year ended 31 December 2013
The difference in position „General and administrative expenses, depreciation and amortization“ of HRK 141,514 thousand relates to property impairment losses disclosed in „Expenses from value adjustments and provisions for losses“ in financi-al statements in accordance with statutory accounting requirements for banks in Croatia. The difference of HRK 294,339 thousand relates to personnel expenses disclosed in „Personnel expenses“ in financial statements in accordance with statu-tory accounting requirements for banks in Croatia. The difference of HRK 249,557 thousand relates to material and services expenses and other expenses disclosed in „Other operating expenses“ in financial statements in accordance with statutory accounting requirements for banks in Croatia.
The difference in position „Expenses from value adjustments and provisions for losses“ of HRK 141,514 thousand relates to property impairment losses disclosed in „General and administrative expenses, depreciation and amortization“ in accordance with CNB decision. The difference of HRK 2,473 thousand relates to foreign exchange differences on impairment items disc-losed in „Net foreign exchange differences“ in financial statements in accordance with statutory accounting requirements for banks in Croatia. The difference of HRK 158 thousand relates to income from collected written-off receivables disclosed in „Other operating income“ in financial statements in accordance with statutory accounting requirements for banks in Croatia.
The difference in position „Other operating expenses“ of HRK 29,565 thousand relates to savings deposits insurance premium expenses disclosed in „Interest and interest similar expenses“ in accordance with CNB decision. The difference of HRK 3,211 thousand relates to personnel provisions disclosed in „Personnel expenses“ in financial statements in accordance with statuto-ry accounting requirements for banks in Croatia. The difference of HRK 249,557 relates to material and services expenses and other expenses disclosed in „General and administrative expenses, depreciation and amortization“ in accordance with CNB decision.
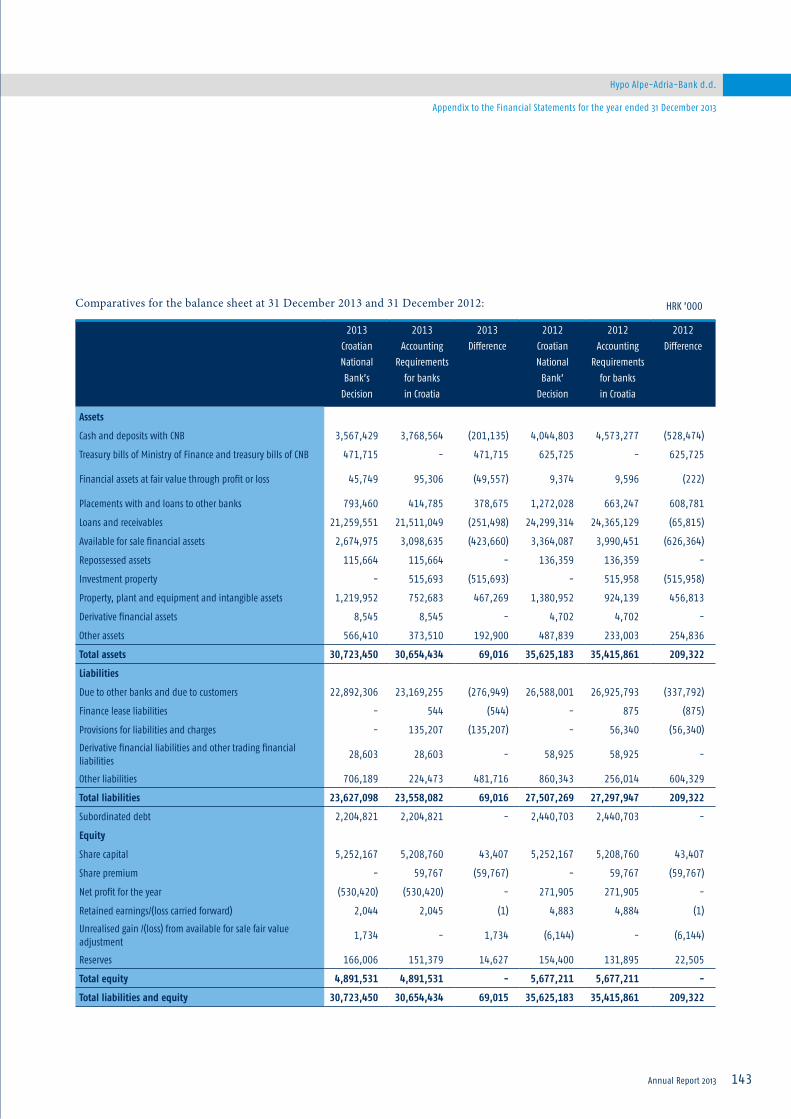
Hypo Alpe-Adria-Bank d.d.
143Annual Report 2013
Appendix to the Financial Statements for the year ended 31 December 2013
2013CroatianNationalBank’s
Decision
2013Accounting
Requirementsfor banksin Croatia
2013Difference
2012CroatianNational
Bank’Decision
2012Accounting
Requirementsfor banksin Croatia
2012Difference
Assets
Cash and deposits with CNB 3,567,429 3,768,564 (201,135) 4,044,803 4,573,277 (528,474)
Treasury bills of Ministry of Finance and treasury bills of CNB 471,715 - 471,715 625,725 - 625,725
Financial assets at fair value through profit or loss 45,749 95,306 (49,557) 9,374 9,596 (222)
Placements with and loans to other banks 793,460 414,785 378,675 1,272,028 663,247 608,781
Loans and receivables 21,259,551 21,511,049 (251,498) 24,299,314 24,365,129 (65,815)
Available for sale financial assets 2,674,975 3,098,635 (423,660) 3,364,087 3,990,451 (626,364)
Repossessed assets 115,664 115,664 - 136,359 136,359 -
Investment property - 515,693 (515,693) - 515,958 (515,958)
Property, plant and equipment and intangible assets 1,219,952 752,683 467,269 1,380,952 924,139 456,813
Derivative financial assets 8,545 8,545 - 4,702 4,702 -
Other assets 566,410 373,510 192,900 487,839 233,003 254,836
Total assets 30,723,450 30,654,434 69,016 35,625,183 35,415,861 209,322
Liabilities
Due to other banks and due to customers 22,892,306 23,169,255 (276,949) 26,588,001 26,925,793 (337,792)
Finance lease liabilities - 544 (544) - 875 (875)
Provisions for liabilities and charges - 135,207 (135,207) - 56,340 (56,340)
Derivative financial liabilities and other trading financial liabilities
28,603 28,603 - 58,925 58,925 -
Other liabilities 706,189 224,473 481,716 860,343 256,014 604,329
Total liabilities 23,627,098 23,558,082 69,016 27,507,269 27,297,947 209,322
Subordinated debt 2,204,821 2,204,821 - 2,440,703 2,440,703 -
Equity
Share capital 5,252,167 5,208,760 43,407 5,252,167 5,208,760 43,407
Share premium - 59,767 (59,767) - 59,767 (59,767)
Net profit for the year (530,420) (530,420) - 271,905 271,905 -
Retained earnings/(loss carried forward) 2,044 2,045 (1) 4,883 4,884 (1)
Unrealised gain /(loss) from available for sale fair value adjustment
1,734 - 1,734 (6,144) - (6,144)
Reserves 166,006 151,379 14,627 154,400 131,895 22,505
Total equity 4,891,531 4,891,531 - 5,677,211 5,677,211 -
Total liabilities and equity 30,723,450 30,654,434 69,015 35,625,183 35,415,861 209,322
HRK ’000Comparatives for the balance sheet at 31 December 2013 and 31 December 2012:

144
Hypo Alpe-Adria-Bank d.d.
Annual Report 2013
Appendix to the Financial Statements for the year ended 31 December 2013
The difference in total assets and total liabilities of HRK 69,016 thousand between the balance sheet disclosed according to the CNB decision and the balance sheet disclosed in accordance with statutory accounting requirements for banks in Croatia ari-ses from different classification liabilities for early repayment of loans and deferred prepaid interest on term deposits as well as netting of current tax assets and current tax liabilities.
In statements according to CNB decision liabilities based on the early repayment of loans, are included in the position „Inte-rests, fees and other liabilities“ in „Total liabilities“, while in the financial statements according to the statutory accounting re-quirements for banks in Croatia they are recognized as an adjustment in the position „Loans and receivables“ in „Total assets“.
Deferred prepaid interest on term deposits is recognised in position „Other assets“ in „Total assets“ in statements according to CNB decision whereas in the financial statements according to the statutory accounting requirements for banks in Croatia it is recognized as an adjustment in position „Due to customers“ in „Total liabilities“.
Current tax liabilities are recognised in position „Other liabilities“ in „Total liabilities“ in statements according to CNB decisi-on whereas in the financial statements according to the statutory accounting requirements for banks in Croatia they are netted with current tax assets in the position “Current tax assets” in „Total assets“.
Differences in other positions arise from different classification of interest receivables and interest payables. In statements according to CNB decision interest receivables and interest payables are disclosed in „Other assets“ and „Other liabilities“ respectively, while in the financial statements according to the statutory accounting requirements for banks in Croatia they are disclosed in assets or liabilities positions on which they are related to, as an adjustment to their amortized cost.
Cash and Deposits with the Croatian National Bank are disclosed as separate positions according to CNB decision, while in the financial statements according to the statutory accounting requirements for banks in Croatia they are included in „Cash and current accounts with other banks“ and „Balances with the Croatian National Bank“.
Ministry of Finance treasury bills are separately disclosed according to the CNB decision whereas in the financial statements according to the statutory accounting requirements for banks in Croatia these securities are part of „Financial assets at fair value through profit or loss“ and „Financial assets available for sale“.

Hypo Alpe-Adria-Bank d.d.
145Annual Report 2013
Branch offices in Croatia
Hypo Alpe-Adria-Bank d.d.
Headquarters ZagrebSlavonska avenija 6, HR - 10000 ZagrebTel.: (01) 603 0000, fax: (01) 6035 130e-mail: [email protected]
Zagreb – Cvjetni trgTrg Petra Preradovića 3, HR - 10000 ZagrebTel.: (072) 101 102, fax: (01) 4831 599
Zagreb – ČrnomerecIlica 251, HR - 10000 ZagrebTel.: (072) 101 102, fax: (01) 3907 170
Zagreb – DubravaAvenija Dubrava 43, HR - 10000 ZagrebTel.: (072) 101 102, fax: (01) 2958 980
Zagreb – HeinzelovaHeinzelova 9, HR – 10000 ZagrebTel.: (072) 101 102, fax: (01) 2311 100
Zagreb – JankomirŠkorpikova 11, HR - 10000 ZagrebTel.: (072) 101 102, fax: (01) 3794 888
Zagreb – MaksimirMaksimirska 123, HR - 10000 ZagrebTel.: (072) 101 102, fax: (01) 2444 170
Zagreb – OzaljskaOzaljska 85, HR - 10000 ZagrebTel.: (072) 101 102, fax: (01) 3833 636
Zagreb – PrečkoPetrovaradinska 7, HR - 10000 ZagrebTel.: (072) 101 102, fax: (01) 3877 800
Zagreb – TrakošćanskaTrakošćanska 6, HR - 10000 ZagrebTel.: (072) 101 102, fax: (01) 3680 333
Zagreb – TravnoSarajevska 6, HR - 10000 ZagrebTel.: (072) 101 102, fax: (01) 6606 333
Zagreb – TrgTrg bana J. Jelačića 3, HR - 10000 ZagrebTel.: (072) 101 102, fax: (01) 4891 740
Zagreb – VelesajamAvenija Dubrovnik 15, HR - 10000 ZagrebTel.: (072) 101 102, fax: (01) 6593 095
Zagreb – VrbaniRudeška cesta 169 a, HR - 10000 ZagrebTel.: (072) 101 102, fax: (01) 3891 362
Zagreb – VukovarskaVukovarska 269D, HR - 10000 ZagrebTel.: (072) 101 102, fax: (01) 6192 220
Beli ManastirKralja Zvonimira 1, HR - 31300 Beli ManastirTel.: (072) 101 102, fax: (031) 710 287
ČakovecMatice Hrvatske 6, HR - 40000 ČakovecTel.: (072) 101 102, fax: (040) 379 200
ČepinKralja Zvonimira 5, HR - 31431 ČepinTel.: (072) 101 102, fax: (031) 382 622
Donji MiholjacTrg A. Starčevića 8, HR - 31540 Donji MiholjacTel.: (072) 101 102, fax: (031) 632 225
DubrovnikVukovarska 15, HR - 20000 DubrovnikTel.: (072) 101 102, fax: (020) 322 400
Branch offices in Croatia
146
Hypo Alpe-Adria-Bank d.d.
Annual Report 2013
Branch offices in Croatia
ĐakovoAnte Starčevića 5, HR - 31400 ĐakovoTel.: (072) 101 102, fax: (031) 813 645
KarlovacVladka Mačeka 12, HR - 47000 Karlovac Tel.: (072) 101 102, fax: (047) 614 911
KoprivnicaZrinski trg 7, HR - 48000 KoprivnicaTel.: (072) 101 102, fax: (048) 621 333
Krk Vela placa 1, HR - 51500 Krk Tel.: (072) 101 102, fax: (051) 667 120
MakarskaMarineta 2, HR - 21300 Makarska Tel.: (072) 101 102, fax: (021) 616 088
MetkovićIvana Gundulića 20/2, HR - 20350 MetkovićTel.: (072) 101 102, fax: (020) 690 500
NašiceTrg dr. Franje Tuđmana 12, HR - 31500 NašiceTel.: (072) 101 102, fax: (031) 617 911
Nova GradiškaTrg kralja Tomislava 3, HR - 35400 Nova GradiškaTel.: (072) 101 102, fax: (035) 364 955
NovaljaTrg Brišćića 1, HR - 53291 NovaljaTel.: (072) 101 102, fax: (053) 663 822
OpatijaMaršala Tita 108, HR - 51410 OpatijaTel.: (072) 101 102, fax: (051) 718 455
OrahovicaKralja Zvonimira 5, HR - 33515 OrahovicaTel.: (072) 101 102, fax: (033) 673 738
Osijek - Regional centre for Slavonia and BaranjaBranch OsijekKapucinska 29, HR - 31000 OsijekTel.: (072) 101 102, fax: (031) 231 226
Osijek – Donji gradTrg bana Jelačića 25, HR - 31000 OsijekTel.: (072) 101 102, fax: (031) 504 200
Osijek – Jug 2Opatijska 26F, HR - 31000 OsijekTel.: (072) 101 102, fax: (031) 565 130
Osijek - RetfalaJ. J. Strossmayera 203, HR - 31000 OsijekTel.: (072) 101 102, fax: (031) 305 122
Osijek - SjenjakSjenjak 133, HR - 31000 OsijekTel.: (072) 101 102, fax: (031) 574 100
Osijek – Trg slobodeTrg slobode 5, HR - 31000 OsijekTel.: (072) 101 102, fax: (031) 231 303
PleternicaIvana Šveara 1, HR - 34310 PleternicaTel.: (072) 101 102, fax: (034) 251 551
PorečVukovarska 19, HR - 52440 PorečTel.: (072) 101 102, fax: (052) 428 511
PožegaSv. Florijana 10, HR - 34000 PožegaTel.: (072) 101 102, fax: (034) 313 233
Pula Flanatička 25, HR - 52100 PulaTel.: (072) 101 102, fax: (052) 384 500
Hypo Alpe-Adria-Bank d.d.
147Annual Report 2013
Branch offices in Croatia
Rijeka – ZagradRegional centre for Istria and KvarnerBranch RijekaProlaz Marije Krucifiksa Kozulić 1, HR - 51000 RijekaTel.: (072) 101 102, fax: (051) 501 207
Rijeka – Jadranski trgJadranski trg 3, HR - 51000 RijekaTel.: (072) 101 102, fax: (051) 211 612
Rijeka - KorzoAnte Starčevića 2, HR - 51000 RijekaTel.: (072) 101 102, fax: (051) 317 497
Rijeka - ZametPetra Jurčića 2a, HR - 51000 RijekaTel.: (072) 101 102, fax: (051) 261 491
RovinjNello Quarantotto bb, HR - 52210 RovinjTel.: (072) 101 102, fax: (052) 841 100
SamoborLivadićeva 20, HR - 10430 SamoborTel.: (072) 101 102, fax: (01) 3360 600
SesveteZagrebačka 16, HR - 10360 SesveteTel.: (072) 101 102, fax: (01) 2015 844
Sisak S.S.Kranjčevića 11, HR - 44000 Sisak Tel.: (072) 101 102, fax: (044) 540 411
SinjSplitska 37, HR – 21230 SinjTel.: (072) 101 102, fax: (021) 824 955
SlatinaTrg sv. Josipa 2, HR - 33520 SlatinaTel.: (072) 101 102, fax: (033) 550 988
Slavonski BrodKralja P. Krešimira IV. 3, HR - 35000 Slavonski BrodTel.: (072) 101 102, fax: (035) 830 355
SolinKralja Zvonimira 87b, HR – 21210 SolinTel.: (072) 101 102, fax: (021) 211 200
Split – BrodaricaRegional centre DalmatiaBranch SplitDomovinskog rata 49, HR - 21000 SplitTel.: (072) 101 102, fax: (021) 308 666
Split – FiruleSpinčićeva 2b, HR – 21000 SplitTel.: (072) 101 102, fax: (021) 388 775
Split – PoljičkaPoljička cesta 39, HR - 21000 SplitTel.: (072) 101 102, fax: (021) 466 111
Split - RivaObala Hrvatskog narodnog preporoda 6, HR - 21000 SplitTel.: (072) 101 102, fax: (021) 355 344
ŠibenikStjepana Radića 77a, HR - 22000 ŠibenikTel.: (072) 101 102, fax: (022) 311 970
UmagTrgovačka 1b, HR - 52470 UmagTel.: (072) 101 102, Fax: (052) 722 344
ValpovoTrg kralja Tomislava 11a, HR – 31550 ValpovoTel.: (072) 101 102, Fax: (031) 654 145
Varaždin IGundulićeva 6, HR - 42000 VaraždinTel.: (072) 101 102, fax: (042) 320 799
Varaždin IIZagrebačka 61, HR - 42000 VaraždinTel.: (072) 101 102, fax: (042) 321 044
Velika GoricaTrg kralja Petra Krešimira IV br. 3, HR - 10410 Velika GoricaTel.: (072) 101 102, fax:. (01) 6379 616

148
Hypo Alpe-Adria-Bank d.d.
Annual Report 2013
Branch offices in Croatia
VinkovciDuga 40, HR - 32100 VinkovciTel.: (072) 101 102, fax: (032) 331 411
ViroviticaFerde Rusana 1, HR - 33000 ViroviticaTel.: (072) 101 102, fax: (033) 726 111
ViškovoVozišće 5, HR - 51216 Viškovo Tel.: (072) 101 102, fax: (051) 650 900
VišnjevacJosipa Kozarca 105, HR - 31220 VišnjevacTel.: (072) 101 102, fax: (031) 352 681
VukovarFranje Tuđmana 4, HR - 32000 VukovarTel.: (072) 101 102, fax: (032) 450 127
Zadar I Jurja Barakovića 4, HR - 23000 ZadarTel.: (072) 101 102, fax: (023) 316 544
Zadar IIZrinsko Frankopanska 40, HR - 23000 ZadarTel.: (072) 101 102, fax: (023) 316 944
ZaprešićMihovila Krušlina 22, HR - 10290 ZaprešićTel.: (072) 101 102, fax: (01) 3398 629
ŽupanjaVeliki kraj 64, HR - 32270 ŽupanjaTel.: (072) 101 102, fax: (032) 830 355
Hypo Alpe-Adria-Leasing d.o.o.Slavonska avenija 6a, HR - 10000 ZagrebTel.: (01) 6036 000, fax: (01) 6036 001, 002e-mail: [email protected]
Hypo Alpe-Adria-Invest d.d.Slavonska avenija 6, HR - 10000 ZagrebTel.: 00385/1/6032 160, fax: 00385/1/6036 850e-mail: [email protected]
Hypo Alpe-Adria-Nekretnine d.o.o.Slavonska avenija 6, HR - 10000 ZagrebTel.: 00385/1/603 1413, fax: 00385/1/603 6750e-mail: [email protected] www.hypo-alpe-adria.hr
Hypo-Leasing Kroatien d.o.o.Slavonska avenija 6a, HR - 10000 ZagrebTel.: (01) 6036 000, fax: (01) 6036 001, 002e-mail: [email protected]

Hypo Alpe-Adria-Bank d.d.
149Annual Report 2013
Annual Report for the year ended 31 December 2013
Responsible for contents:
Hypo Alpe-Adria-Bank d.d.
Slavonska avenija 6, HR-10000 Zagreb
tel. +385/1/603 000
fax +385/1/600 7000
Customers Service: 0800 HYPO HR (0800 14 14)
e-mail: [email protected]
www.hypo-alpe-adria.hr
wap.hypo-alpe-adria.hr
Important notice:This annual report has been prepared with great care and the information it contains has been checked. The possible occur-rence of rounding errors, typesetting and printing errors, and errors in expression can however not be precluded. The English language report is a translation; the Croatian is the authentic language version.


