85
Annual Report 2013
Annual Report 2013
RO
GER
S A
ND
CO
MPA
NY
LIM
ITED
A
NN
UA
L R
EPO
RT
20
13

Dear Shareholder,
Your Board of Directors is pleased to present the Annual Report of Rogers and Company Limited for the year ended 30 June 2013. This report was approved by the Board on 04 September 2013.
Jean-Pierre Montocchio Philippe Espitalier-NoëlChairman Director & CEO
04 Rogers at a glance
06 Brand Structure
08 Corporate Information
10 Board of Directors’ Report
12 Presentation of Board of Directors
14 Profile of Directors
18 Interview with the CEO
22 Profile of Chief Executive Officers
24 Group Financial Highlights
26 Share Price Information
27 Consolidated Value Added Statement
28 Aviation
34 Financial Services
40 Hospitality
46 Logistics
52 Property
58 Real Estate & Agribusiness
64 Technology
70 Focus on Sustainability
71 Strategy for Profitable Growth
72 Governance at Rogers
81 Our People
82 Corporate Office
83 Corporate Social Responsibility
85 Internal Control and Risk Management
89 Other Statutory Disclosures
90 Directors’ Report
91 Independent Auditors‘ Report
93 Approval of Financial Statements
94 Statements of Profit or Loss
95 Statements of Profit or Loss and Other Comprehensive Income
96 Statements of Financial Position
97 Statements of Changes in Equity
98 Statements of Cash Flows
99 Explanatory Notes
152 Secretary’s Certificate
153 Directors of Subsidiary Companies
159 Frequently Asked Questions
Contents

Annual Report 20132
Focused Energy, Every Day
A diversity of people focused on customer satisfaction with a shared spirit of:
LeadershipBuilding on Rogers pioneering culture
Agility Our ability to evolve in an ever changing environment
Dynamism The focused energy of our people to drive Rogers forward
Rogers and Company Limited 3
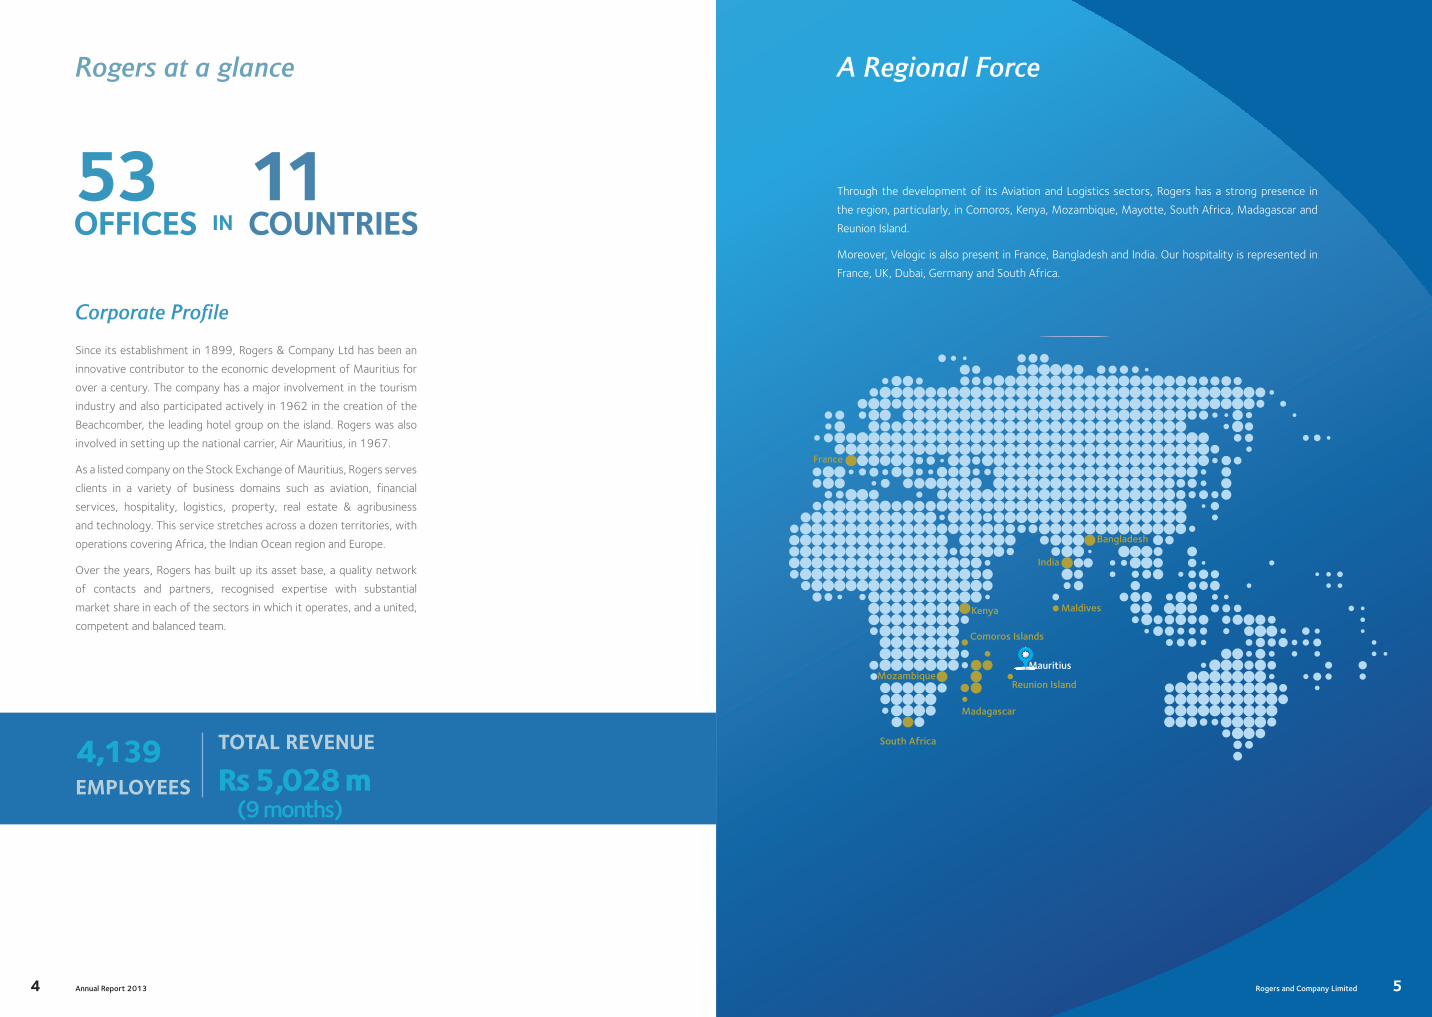
Corporate Profile
Since its establishment in 1899, Rogers & Company Ltd has been an
innovative contributor to the economic development of Mauritius for
over a century. The company has a major involvement in the tourism
industry and also participated actively in 1962 in the creation of the
Beachcomber, the leading hotel group on the island. Rogers was also
involved in setting up the national carrier, Air Mauritius, in 1967.
As a listed company on the Stock Exchange of Mauritius, Rogers serves
clients in a variety of business domains such as aviation, financial
services, hospitality, logistics, property, real estate & agribusiness
and technology. This service stretches across a dozen territories, with
operations covering Africa, the Indian Ocean region and Europe.
Over the years, Rogers has built up its asset base, a quality network
of contacts and partners, recognised expertise with substantial
market share in each of the sectors in which it operates, and a united,
competent and balanced team.
Rogers at a glance
INOFFICES53
COUNTRIES11
4,139EMPLOYEES Rs 5,028 m
(9 months)
TOTAL REVENUE
Annual Report 20134
Mauritius
Reunion Island
Maldives
India
Bangladesh
France
Kenya
Comoros Islands
Madagascar
South Africa
Mozambique
A Regional Force
Through the development of its Aviation and Logistics sectors, Rogers has a strong presence in
the region, particularly, in Comoros, Kenya, Mozambique, Mayotte, South Africa, Madagascar and
Reunion Island.
Moreover, Velogic is also present in France, Bangladesh and India. Our hospitality is represented in
France, UK, Dubai, Germany and South Africa.
5Rogers and Company Limited

BlueSky
Croisières Australes
PATS
Transcontinents Madagascar
MozambiqueAirport Handling Services
Sabre Travel Network
Air France
Air Mauritius
Air Seychelles
South African Airways
Saudi Arabian Airlines
Kenya Airways
Delta Airline Cargo
Malaysian Airlines
Airlink
Air Madagascar
Jet Airways
Olympic Airlines
Emirates Airlines
Dubai Visa Services(South Africa & Mauritius)
Air Mauritius Ltd
BlueConnect Ltd
Mautourco Ltd
White Palm Ltd
Villas Valriche
Terre de 7 Couleurs
Frédérica Nature Reserve
Café de Chamarel
Le Chamarel Restaurant
Swan Insurance Company Limited The Anglo-Mauritius Assurance Society Limited
Anglo-Mauritius Financial Solutions Limited
New Mauritius Hotels Ltd SWTD (South West Tourism Development)
Veranda Paul & Virginie Hotel & Spa
Veranda Grand Baie Hotel & Spa
Veranda Pointe aux Biches Hotel
Veranda Palmar Beach Hotel
Heritage Awali Golf & Spa Resort
Heritage Le Telfair Golf & Spa Resort
Heritage Golf Club
Heritage The Villas
C Beach Club
Le Château de Bel Ombre
Seven Colours Spa
FOM
Sukpak
PAPOL
R’Frigo
TNT
Ascencia
Reliance
AXA Customer Services Ltd
EIS-IORGA
Aviation
SER
VIC
E B
RA
ND
SIN
VES
TMEN
TS
Brand Structure
AVIATION FINANCIAL SERVICES HOSPITALITY TECHNOLOGYREAL ESTATE & AGRIBUSINESSPROPERTYLOGISTICS
Annual Report 20136
BlueSky
Croisières Australes
PATS
Transcontinents Madagascar
MozambiqueAirport Handling Services
Sabre Travel Network
Air France
Air Mauritius
Air Seychelles
South African Airways
Saudi Arabian Airlines
Kenya Airways
Delta Airline Cargo
Malaysian Airlines
Airlink
Air Madagascar
Jet Airways
Olympic Airlines
Emirates Airlines
Dubai Visa Services(South Africa & Mauritius)
Air Mauritius Ltd
BlueConnect Ltd
Mautourco Ltd
White Palm Ltd
Villas Valriche
Terre de 7 Couleurs
Frédérica Nature Reserve
Café de Chamarel
Le Chamarel Restaurant
Swan Insurance Company Limited The Anglo-Mauritius Assurance Society Limited
Anglo-Mauritius Financial Solutions Limited
New Mauritius Hotels Ltd SWTD (South West Tourism Development)
Veranda Paul & Virginie Hotel & Spa
Veranda Grand Baie Hotel & Spa
Veranda Pointe aux Biches Hotel
Veranda Palmar Beach Hotel
Heritage Awali Golf & Spa Resort
Heritage Le Telfair Golf & Spa Resort
Heritage Golf Club
Heritage The Villas
C Beach Club
Le Château de Bel Ombre
Seven Colours Spa
FOM
Sukpak
PAPOL
R’Frigo
TNT
Ascencia
Reliance
AXA Customer Services Ltd
EIS-IORGA
Aviation
SER
VIC
E B
RA
ND
SIN
VES
TMEN
TS
Brand Structure
AVIATION FINANCIAL SERVICES HOSPITALITY TECHNOLOGYREAL ESTATE & AGRIBUSINESSPROPERTYLOGISTICS
Rogers and Company Limited 7

Corporate InformationRogers and Company Limited
BOARd OF dIRECTORS Montocchio Jean PierreChairman of the Board and the Corporate Governance Committee
Adam Guy (Dr)
Bundhun Ziyad
Collendavelloo Aruna
Couacaud Herbert Maingard
De Labauve d’Arifat Patrick
Espitalier-Noël Eric
Espitalier-Noël Gilbert
Espitalier-Noël Hector
Espitalier-Noël PhilippeChief Executive Officer
Rey Alfred Joseph Gérard Robert AlainChairman Risk Management and Audit Committee
Veerasamy Pillay Naderasen
COMPANY SECRETARY Maharahaje Tioumitra1
Collendavelloo Aruna2
FUNCTION ExECUTIVES - CORPORATE OFFICE
Bundhun Manish Chief Human Resources Executive
Bundhun Ziyad Chief Finance and Investment Executive
Collendavelloo ArunaChief Legal Executive
Ramlackhan Angelucci Kaushall Chief Communication Executive
1 Resigned on 5 February 2013
2 Re-appointed on 5 February 2013
Annual Report 20138
SECTORS - ChIEF ExECUTIVE OFFICERS
Bundhun ZiyadChief Finance and Investment Executive of Rogers & Co Ltd - Financial Services (Rogers Capital)
Eynaud FrançoisChief Executive Officer - Hospitality (Veranda Leisure & Hospitality)
Fayd’herbe de Maudave AlexandreChief Executive Officer - Aviation (Rogers Aviation)
Koenig RichardChief Executive Officer - Real Estate and Agribusiness (Domaine de Bel Ombre)
Mihdidin SanjivChief Executive Officer - Property (Foresite)
Nunkoo VishalChief Executive Officer - Logistics (Velogic)
Ruhee Ashley CoomarChief Executive Officer - Technology (EIS)
Rogers and Company Limited 9

Dear Shareholders,
We are pleased to present the Annual Report of
the Group for the financial period ended 30 June
2013. This Report covers a nine-month period,
starting 01 October 2012 to 30 June 2013, as
a result of the change in the Group’s financial
reporting date.
Over this period, the world economy navigated
through troubled and unpredictable waters,
struggling to return to its pre-crisis growth level.
Strong headwinds persisted in the USA in spite
of recovery signs. Countries of the Eurozone
remained mired in recession while emerging
countries, notably in Asia, expressed more and
more difficulties to sustain their growth pace.
Amidst this weak economic environment, main
equity markets in the USA, Europe and Asia
witnessed a relatively steady increase from
November 2012 through May 2013, bolstered
by stimulus programmes in key economies
around the globe. A dip was however observed
in June 2013 with the intention of the US Federal
Reserve to put a halt to its easing efforts in the
near future. Such a decision would eventually
result in an increase in yields offered by the US
treasury notes and trigger a capital flight to safer
markets and assets.
Growth remained subdued in Mauritius given
the difficulties endured by its principal economic
partners. The SEMDEX, the main index of the
Stock Exchange of Mauritius, reflected, more or
less, the upward trend line observed on foreign
equity markets albeit some disturbances were
noted from April 2013 to June 2013.
Over the period under review, Rogers demonstrated
its corporate adaptability, maintaining a solid
performance, underpinned by a consistent and
focused strategy driven towards value-creation
for its customers, employees and shareholders.
Group revenue for the nine-months ended June
2013 increased to Rs 5bn whilst Profit After Tax,
excluding exceptional items, reached Rs 547m
compared to Rs 70m in the corresponding period
last year. Earnings per share, excluding exceptional
items, significantly increased from Rs 2.16 to
Rs 15.00. The Group’s Net Asset Value per share,
as at 30 June 2013, stood at Rs 332 compared to
Rs 266 at 30 September 2012.
In respect of the spin-off of Cim Financial
Services Limited (CFSL), a dividend in specie was
declared in September 2012 and distributed to
the shareholders of Rogers. The shares of Rogers
were traded ex-dividend as from 15 October
2012. Between 15 October 2012 and 30 June
2013, Rogers’ share price gained 8% compared
to 13% and 15% for the SEMDEX and SEM7
respectively.
Board of Directors’ Report
Annual Report 201310
As from October 2012, the Group consolidated
as associate company its 17.7% holding in New
Mauritius Hotels Ltd (NMH).
On 04 December 2012, ENL, through its
subsidiary ENL Investment Ltd, increased its
shareholding in the Company to 59.7%. This
parental support will open up new opportunities
for strategic developments for both entities and
unlock value for shareholders over the mid-to-
long term.
In addition, during the course of the period
under review, Rogers strengthened its position
in the financial services sector. The shareholding
of the Company in Intendance Holding Ltd, the
controlling entity of the Swan Group, was lifted
from 24.4% to 37.8%,
Alain Rey was appointed Chairman of the
Risk Management and Audit Committee on
07 December 2012 in replacement of Marcel
Descroizilles. We would like to express our thanks
to Marcel for his contributions and wish him well
in his future endeavours.
The outlook for the global economy remains
uncertain with fears growing over a possible
tappering of the bond-buying programme in the
USA and the slowing growth pace in emerging
Asian economies. In the face of this challenging
environment, the Group will maintain its strategy
towards the consolidation of its existing sectors
and the expansion of its regional presence.
The Board will continue to act in the interests
of the shareholders towards a profitable and
sustainable growth that delivers value for all
stakeholders.
Sincerely yours,
The Board of Directors
Rogers and Company Limited 11

Presentation of Board of Directors
Standing from left to right: Standing from left to right:
REYAlainIndependent Director
DE LABAUVE D’ARIFAT, PatrickIndependent Director
ESPITALIER-NOËL, GilbertNon-Executive Director
MONTOCCHIO Jean-PierreIndependent Director
COUACAUDHerbert MaingardIndependent Director
ESPITALIER-NOËLEricNon-Executive Director
VEERASAMYNaderasen (Jim) PillayIndependent Director since 2012
Seated from left to right: Seated from left to right:
ESPITALIER-NOËLHector Non-Executive Director
ESPITALIER-NOËLPhilippeChief Executive Officer
COLLENDAVELLOO ArunaExecutive Director
Dr ADAMGuy (MD FRCS)Independent Director
BUNDHUNZiyadExecutive Director
Annual Report 201312
Standing from left to right: Standing from left to right:
REYAlainIndependent Director
DE LABAUVE D’ARIFAT, PatrickIndependent Director
ESPITALIER-NOËL, GilbertNon-Executive Director
MONTOCCHIO Jean-PierreIndependent Director
COUACAUDHerbert MaingardIndependent Director
ESPITALIER-NOËLEricNon-Executive Director
VEERASAMYNaderasen (Jim) PillayIndependent Director since 2012
Seated from left to right: Seated from left to right:
ESPITALIER-NOËLHector Non-Executive Director
ESPITALIER-NOËLPhilippeChief Executive Officer
COLLENDAVELLOO ArunaExecutive Director
Dr ADAMGuy (MD FRCS)Independent Director
BUNDHUNZiyadExecutive Director
Rogers and Company Limited 13

Profile of Directors
,
Born in 1964, he is a member of the Institute of Chartered Accountants in England and Wales. He started his career with Deloitte & Touche in the Middle-East and moved to Ernst & Young in Mauritius in 1993. He joined the international trust services of Mutual Trust Group in 1995 and founded the Mauritius office of international audit and consulting group, Mazars in 2002. He joined the Corporate Banking division of The Mauritius Commercial Bank in 2005 and held the post of Managing Director of MCB Capital Partners Ltd, the private equity arm of the MCB Group. He was appointed Chief Finance and Investment Executive of Rogers in October 2011.
Other directorships in listed companies: Ascencia Limited
BUNDHUN, Ziyad
Chief Finance and Investment Executive Executive Director since 2012
Dr ADAM, Guy (MD FRCS)
Independent Director since 1994
Born in 1950, he was appointed Fellow of the Association of Surgeons of Great Britain and Ireland and practised as a consultant General Surgeon in Mauritius since 1988. He is the Medical Adviser to Swan Health Insurance, where he had in 1998 set up a new health-care product. He is a member of the board of directors of the Medical and Surgical Centre.
Other directorships in listed companies: none
COLLENDAVELLOO, Aruna
Chief Legal Executive Executive Director since 2012
Born in 1970, she is a practising Attorney-at-Law. She holds a BA (Honours) degree in Jurisprudence from Balliol College, Oxford University. She is admitted to practise as a Solicitor of England and Wales. She served her articleship for two years with Sinclair, Roche and Temperley, a Solicitors’ firm based in the City of London. Upon her return to Mauritius, she qualified as an Attorney-at-Law and practised for three years before joining Rogers in January 2001 as Project Analyst. In July 2001, she was appointed Group Company Secretary and headed the Company Secretarial department of Rogers. Over the years, she added an in-house legal competency to the department and was appointed Chief Legal Executive in 2007. She is currently the Vice Chairman of the Central Depository & Settlement Co. Ltd and director of a number of companies. She is a fellow of the Mauritius Institute of Directors.
Other directorships in listed companies: Mauritius Development Investment Trust Company Ltd
Annual Report 201314
DE LABAUVE D’ARIFAT, Patrick
Independent Director since 2012
Born in 1958, he holds a BSC degree in Economics and Accountancy from City University, London. He started his career with the Mauritius Chamber of Agriculture in 1982 and was appointed Director of the Mauritius Sugar Producers Association in 1991. He had chaired the said association for three years and that of the Mauritius Sugar Syndicate for two years. He later joined CIEL Agro-industry as Chief Executive Officer in July 2001. He has throughout those years, been closely associated with the policy formulation and implementation of the modernization process of the sugar industry in Mauritius and in the region. He is currently the Chief Executive Officer of Alteo Ltd and was appointed as Executive Director on the Board of Alteo Ltd in July 2012.
Other directorships in listed companies: Alteo Ltd
Born in 1948, he holds a BSc in Economics and Mathematics from the University of Cape Town in 1971. He is currently the Chief Executive of New Mauritius Hotels Ltd. He has actively contributed to the development of the tourism industry in Mauritius.
Other directorships in listed companies: Fincorp Investment Ltd and New Mauritius Hotels Ltd.
COUACAUD, Herbert Maingard
Independent Director since 2000
ESPITALIER-NOËL, Eric
Non-Executive Director since 1994
Born in 1959, he holds a Bachelor’s degree in Social Sciences from the University of Natal in South Africa and a Masters degree in Business Administration from the University of Surrey (UK). He joined ENL Ltd in1986 and was appointed Executive Director in 1987. He is currently the Chief Executive of ENL Commercial.
Other directorships in listed companies: Automatic Systems Ltd, ENL Commercial Limited, ENL Investment Limited, ENL Limited, Les Moulins de la Concorde Ltée, Livestock Feed Limited, ENL Land Ltd and Tropical Paradise Co. Ltd.
Rogers and Company Limited 15

Profile of Directors
,
Born in 1958, he is a member of the Institute of Chartered Accountants in England and Wales. He worked with Coopers and Lybrand in London and with De Chazal du Mée in Mauritius. He is presently the Chief Executive of ENL Limited. He is also Chairman of New Mauritius Hotels and Bel Ombre Sugar Estate Ltd. He is also a past President of Rogers and Company Limited, the Mauritius Chamber of Agriculture, the Mauritius Sugar Producers Association and the Mauritius Sugar Syndicate.
Other directorships in listed companies: ENL Commercial Limited, ENL Land Ltd, ENL Investment Limited, New Mauritius Hotels Ltd, Tropical Paradise Co. Ltd, Swan Insurance Company Ltd and The Anglo Mauritius Assurance Society Ltd.
ESPITALIER-NOËL, Hector
Non-Executive Director since 1999
ESPITALIER-NOËL, Gilbert
Non-Executive Director since 1999
Born in 1964, he holds a BSc from the University of Cape Town, a BSc in Food Technology from the Louisiana State University and an MBA from INSEAD in Fontainebleau. He joined the Food and Allied Group in 1990 and was appointed Group Operations Director in 2000. He left the Food and Allied Group in February 2007 to join ENL Limited as executive director with special responsibilities in the property development sector. He was President of the Mauritius Chamber of Commerce and Industry in 2001, the Joint Economic Council in 2002 and 2003 and The Mauritius Sugar Producers Association in January 2008. He is currently the Chief Executive of ENL Property.
Other directorships in listed companies: ENL Limited, ENL Commercial Limited, ENL Investment Limited, ENL Land Ltd, Ascencia Ltd and Livestock Feed Limited.
ESPITALIER-NOËL, Philippe
Chief Executive Officer Executive Director since 2004
Born in 1965, he holds a BSc in Agricultural Economics from the University of Natal in South Africa and an MBA from the London Business School. He worked for CSC Index in London as a management consultant from 1994 to 1997. He joined Rogers in 1997 and was appointed Chief Executive Officer in 2007.
Other directorships in listed companies: Air Mauritius Ltd, Ascencia Limited, ENL Limited, Swan Insurance Company Ltd and The Anglo Mauritius Assurance Society Ltd.
Annual Report 201316
REY, Alfred Joseph Gerard Robert Alain
Independent Director since 2012
Born in 1959, he is a member of the Institute of Chartered Accountants in England and Wales. He graduated in Economics from the London School of Economics. He is currently the Chief Executive Officer of the Compagnie de Mont Choisy Ltée group of companies as well as a director of various companies. He has wide financial experience having served as Senior Vice President and Chief Financial Officer of a NASDAQ listed company as well as Regional Corporate Director of a leading bank in Mauritius.
Other directorships in listed companies: State Bank of Mauritius Ltd and Ciel Textile Ltd.
Born in 1963, he was appointed notary public in Mauritius in 1990. He participated in the National Committee on Corporate Governance as a member of the Board of Directors’ Sub-Committee.
Other directorships in listed companies: Caudan Development Ltd, Fincorp Investment Ltd, New Mauritius Hotels Ltd, Promotion and Development Ltd, The Mauritius Commercial Bank Ltd, Les Moulins de la Concorde Ltée and ENL Land Ltd.
MONTOCCHIO, Jean Pierre
Independent Director since 2002 and Chairman since 2012
VEERASAMY, Naderasen Pillay
Independent Director since 2012
Born in 1957, he holds an LLB degree from the University of Buckingham in the United Kingdom. He was called to the Bar at Middle Temple in 1982. In 1989 he completed his Masters in Private Law at Universite de Paris II (Assas). He thereafter sat for examinations for attestation as Barrister at la Cour d’Appel de Paris in 1990. He practised as Barrister-at-Law in Mauritius from 1982 to 1987. He joined SCP J.C.Goldsmith & Associates, as well as SCP Azéma Sells. In 1995 he created his own Chambers in Paris exercising mainly in Business Law. He created the Chambers Fourmentin Le Quintrec Veerasamy et Associés, comprising 6 associates and dealing with arbitration in Business Law. He is appointed as independent director on the Board of Directors of several companies in the financial sector. He is also a member on the Comité Français d’Arbitrage.
Other directorships in listed companies: none
Rogers and Company Limited 17
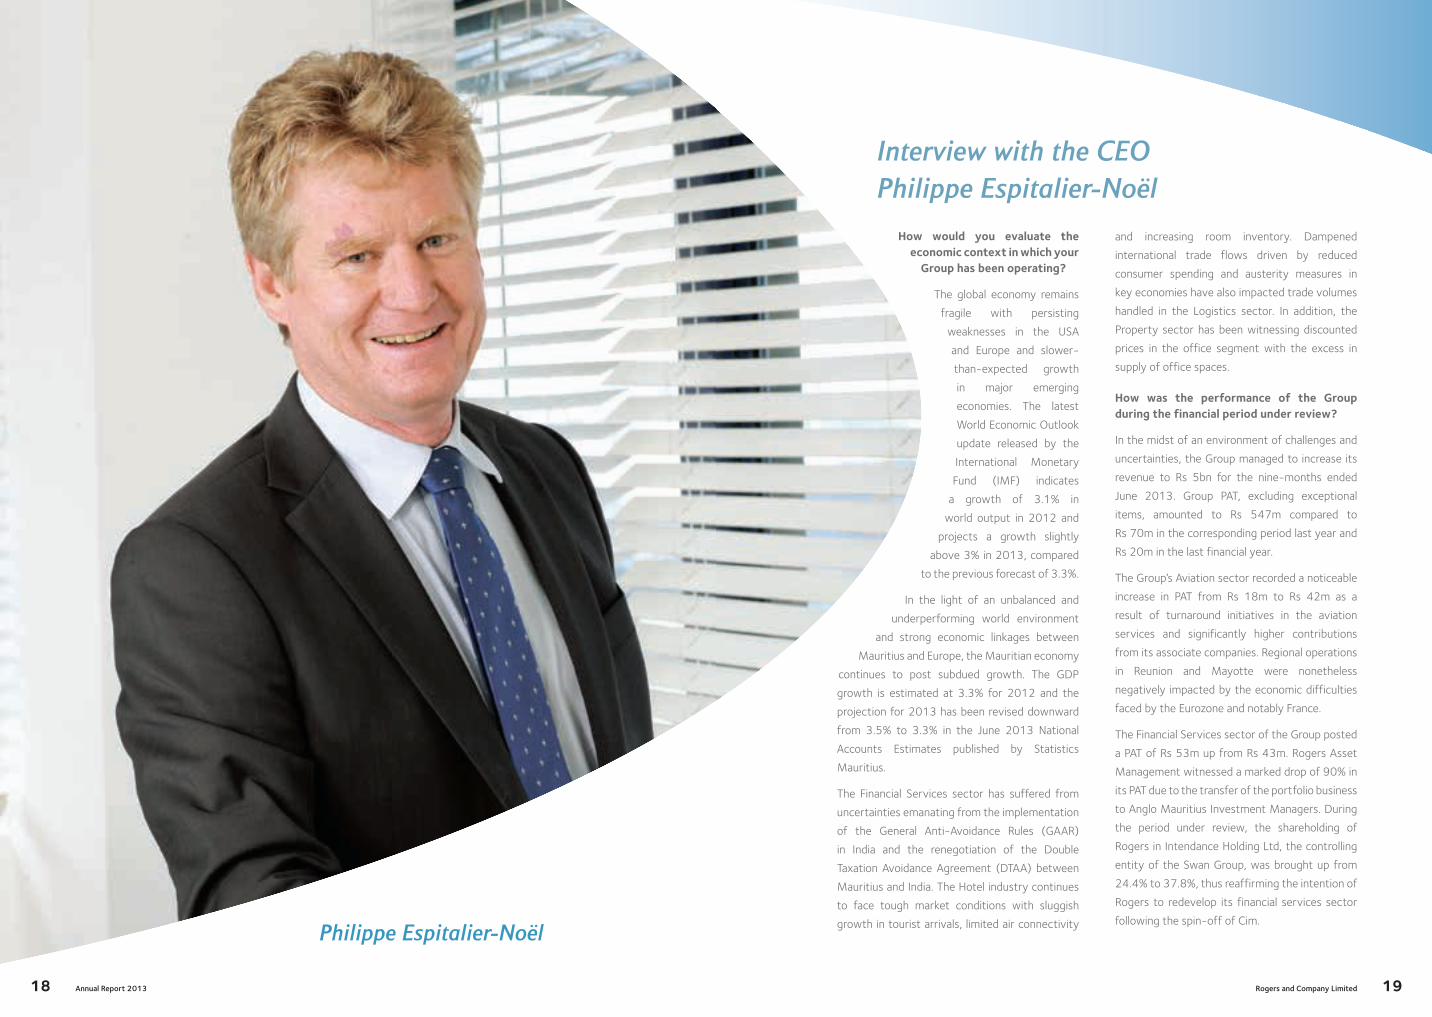
Philippe Espitalier-Noël
Annual Report 201318
Interview with the CEOPhilippe Espitalier-Noël
how would you evaluate the economic context in which your
Group has been operating?
The global economy remains
fragile with persisting
weaknesses in the USA
and Europe and slower-
than-expected growth
in major emerging
economies. The latest
World Economic Outlook
update released by the
International Monetary
Fund (IMF) indicates
a growth of 3.1% in
world output in 2012 and
projects a growth slightly
above 3% in 2013, compared
to the previous forecast of 3.3%.
In the light of an unbalanced and
underperforming world environment
and strong economic linkages between
Mauritius and Europe, the Mauritian economy
continues to post subdued growth. The GDP
growth is estimated at 3.3% for 2012 and the
projection for 2013 has been revised downward
from 3.5% to 3.3% in the June 2013 National
Accounts Estimates published by Statistics
Mauritius.
The Financial Services sector has suffered from
uncertainties emanating from the implementation
of the General Anti-Avoidance Rules (GAAR)
in India and the renegotiation of the Double
Taxation Avoidance Agreement (DTAA) between
Mauritius and India. The Hotel industry continues
to face tough market conditions with sluggish
growth in tourist arrivals, limited air connectivity
and increasing room inventory. Dampened
international trade flows driven by reduced
consumer spending and austerity measures in
key economies have also impacted trade volumes
handled in the Logistics sector. In addition, the
Property sector has been witnessing discounted
prices in the office segment with the excess in
supply of office spaces.
how was the performance of the Group during the financial period under review?
In the midst of an environment of challenges and
uncertainties, the Group managed to increase its
revenue to Rs 5bn for the nine-months ended
June 2013. Group PAT, excluding exceptional
items, amounted to Rs 547m compared to
Rs 70m in the corresponding period last year and
Rs 20m in the last financial year.
The Group’s Aviation sector recorded a noticeable
increase in PAT from Rs 18m to Rs 42m as a
result of turnaround initiatives in the aviation
services and significantly higher contributions
from its associate companies. Regional operations
in Reunion and Mayotte were nonetheless
negatively impacted by the economic difficulties
faced by the Eurozone and notably France.
The Financial Services sector of the Group posted
a PAT of Rs 53m up from Rs 43m. Rogers Asset
Management witnessed a marked drop of 90% in
its PAT due to the transfer of the portfolio business
to Anglo Mauritius Investment Managers. During
the period under review, the shareholding of
Rogers in Intendance Holding Ltd, the controlling
entity of the Swan Group, was brought up from
24.4% to 37.8%, thus reaffirming the intention of
Rogers to redevelop its financial services sector
following the spin-off of Cim.
Rogers and Company Limited 19

Interview with the CEOPhilippe Espitalier-Noël
Furthermore, the insurance and investment
businesses were reported as associates for the
first time.
A more effective marketing strategy and cost
containment initiatives coupled with favourable
exchange rates sustained the performance of
Veranda Leisure & Hospitality (VLH), in spite of
the prevailing market stiffness. VLH recorded an
increase of 10% in revenue and its PAT reached
Rs 172m compared to losses of Rs 33m. In
addition, the interest in New Mauritius Hotels was
included as associate in the results of the Group’s
Hospitality sector.
Velogic, the logistics arm of Rogers, achieved
remarkable results given the wavering economic
climate. PAT surged from Rs 18m to Rs 54m as a
consequence of the successful turnaround of its
overseas freight forwarding activities and higher
volumes recorded in its shipping activities. In
May 2013, Mechanical Transport Limited (MTL)
was acquired. This acquisition will yield appreciable
economies of scale and provide new capabilities to
further develop the project cargo activities.
During the period under review, Foresite Property
initiated the extension and redevelopment
of Centre Commercial Phoenix and Centre
Commercial Riche Terre, rebranded Riche Terre
Mall. Once completed, the revamped commercial
centres will offer unique shopping experiences
and infrastructure of world class standards to
its visitors. Despite disruptions caused by the
refurbishment projects and the flat market
context, Foresite reported increased results
both in terms of revenue and PAT. The shares
of G4S International in the Security and Facility
Services joint venture companies were acquired
by Foresite Property in November 2012. The
companies were restructured and rebranded
as Reliance Security Services Ltd and Reliance
Facilities Ltd.
Improved results from the Group’s Real Estate
& Agribusiness sector were primarily driven
by fair value gains recorded and exceptional
profits accounted for the swap of lands with the
Government. Marketing review exercises and
operational efficiency measures are currently
underway and they are expected to deliver positive
results in the course of the next financial year.
The new Technology sector substantiated
its growth potential within the Group with
encouraging results. Revenue increased by 13%
and PAT amounted to Rs 9m compared to a loss of
Rs 2m for the same period last year. Its continued
diversification strategy has enabled EIS to reduce
its dependency on income streams derived
from the Group and to capture new business
opportunities, notably in the public sector. During
the period under review, the management of
AXA CS was also secured. A restructuring plan
is currently under implementation. The plan is
expected to boost the company’s performance in
the future.
What are your strategic priorities for the future?
A four-year strategic plan has recently been
finalised on the basis of the growth potential
and challenges of each and every sector we are
engaged in. Our aim will remain to position Rogers
as the first service-focused conglomerate in
Mauritius through the consolidation of its existing
sectors.
The Group’s Financial Services sector will be
reinforced with new investment products and
services targeted at institutional, corporate
and high net worth clients. Ascencia, our listed
property fund, will look upon opportunities to
grow its asset base with the support of ENL
Property. Discussions between Ascencia and
Foresite on the one hand and ENL property
(ENLP), with regards to the proposed acquisitions
Annual Report 201320
by Ascencia and Foresite of a number of
commercial properties from ENLP, have reached
an advanced stage. The proposed acquisitions will
be subject to a number of ‘conditions suspensives’
and to the approval of the regularity bodies, the
board of Rogers and Ascencia and those of the
shareholders of Rogers and Ascencia. In the
Technology sector, EIS will further consolidate
its portfolio of products and offerings through
internal growth and acquisitions.
In addition, burgeoning business opportunities
across the region have also been identified
and assessed. We will build upon our internal
competencies and valuable network of partners
and clients to extend our presence on the
emerging African continent.
Why Africa?
Africa remains a diverse and complex environment
that poses major challenges and risks to the
setting-up and growth of businesses but many
African countries have now embraced more
effective economic policies which are driving
the continent on the path to sustained growth
and development. There are clear signs of a
more promising future in an environment craving
for new sources of growth. Between 2005 and
2012, the African economy, as a whole, grew
at a Compounded Annual Growth Rate (CAGR)
of 5.1% compared to only 3.7% for the world
economy. And this trend is expected to continue.
Projections based on latest statistics by the IMF
suggest that, between 2013 and 2018, Africa
will grow at a CAGR of 6% in real terms. The
continent will comprise 12 of the top-20 fastest
growing economies in the world over the next
five years.
Rogers is already present in 7 African territories
excluding Mauritius. We will pursue the expansion
of our presence. We will identify and invest in
ventures that offer value-creation prospects and
fit our growth strategy.
What is your outlook for the next financial year ending 30 June 2014?
We are evolving in an environment where the
fundamentals in key advanced economies remain
fragile and fears over growth prospects in major
emerging economies are growing. Downside risks
still persist notably with possible scale-back of
the quantitative easing programme in the USA
and the continued difficulties in the Eurozone.
Over the coming financial year, the Group
will therefore continue to face testing market
conditions. Appropriate strategic and operational
initiatives will be devised and implemented
at sectoral and group levels to shield our
performance against these adverse effects and
move towards the achievements of our strategic
objectives.
do you have any final message?
There have been major challenges and downturns
since the establishment of Rogers. However,
the Group has successfully ensured its growth
and development and built a solid reputation as
one of the principal conglomerates in Mauritius.
These achievements have been possible with
the valuable support of our customers and
partners and the dedication and hard work of all
employees. I take this opportunity to thank them
for their contributions.
Rogers and Company Limited 21
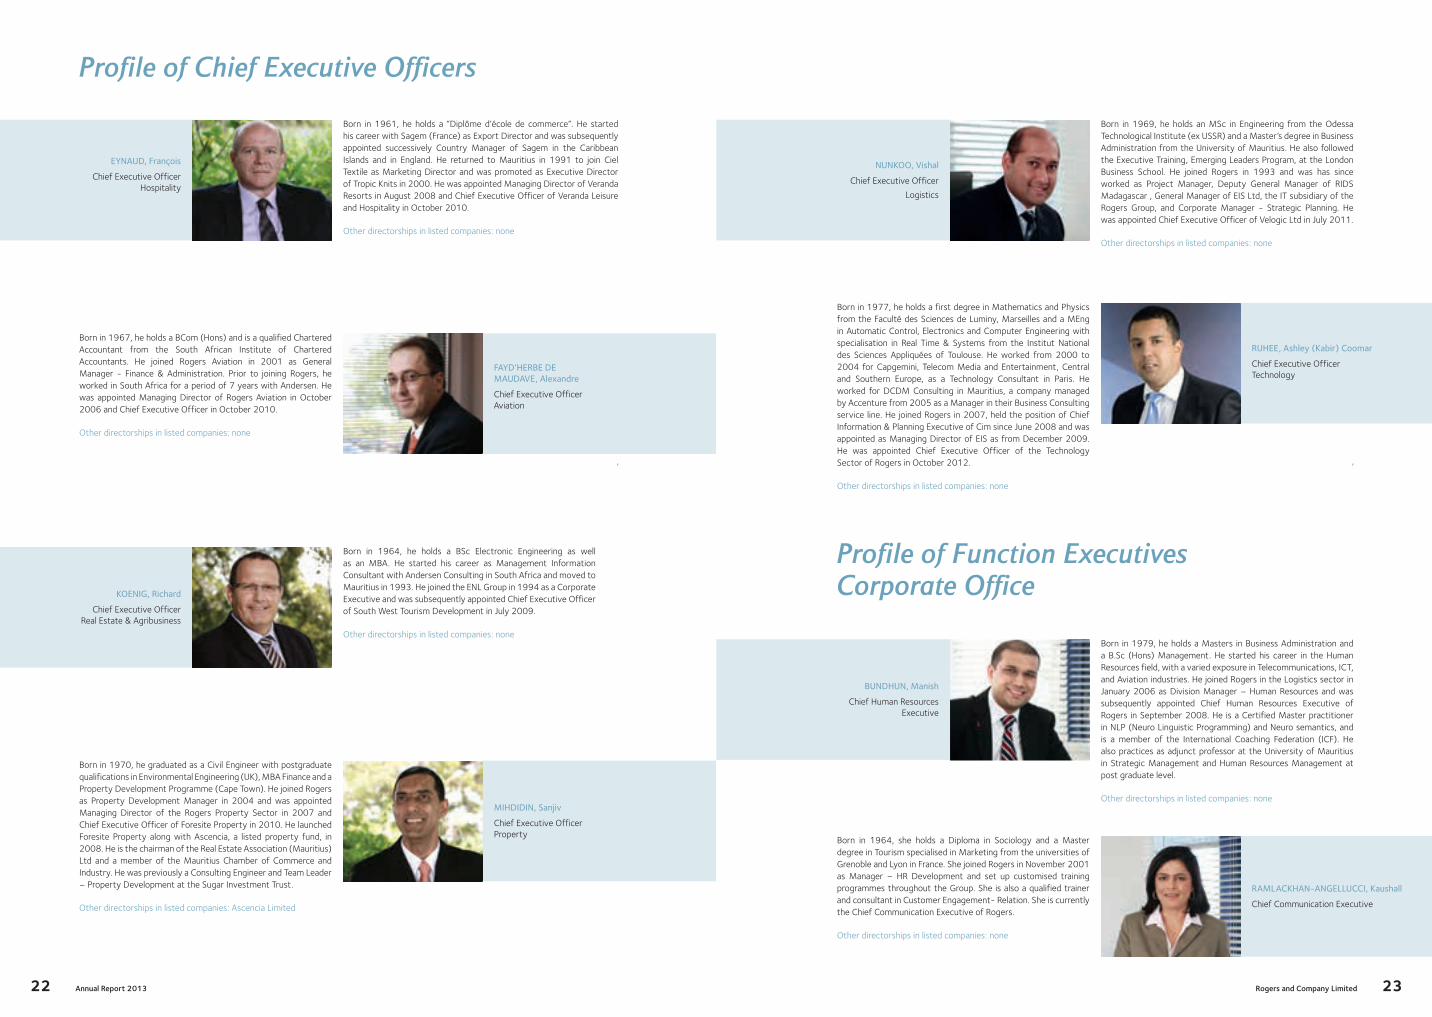
Profile of Chief Executive Officers
,
Born in 1961, he holds a “Diplôme d’école de commerce”. He started his career with Sagem (France) as Export Director and was subsequently appointed successively Country Manager of Sagem in the Caribbean Islands and in England. He returned to Mauritius in 1991 to join Ciel Textile as Marketing Director and was promoted as Executive Director of Tropic Knits in 2000. He was appointed Managing Director of Veranda Resorts in August 2008 and Chief Executive Officer of Veranda Leisure and Hospitality in October 2010.
Other directorships in listed companies: none
EYNAUD, François
Chief Executive Officer Hospitality
FAYD’HERBE DE MAUDAVE, Alexandre
Chief Executive Officer Aviation
Born in 1967, he holds a BCom (Hons) and is a qualified Chartered Accountant from the South African Institute of Chartered Accountants. He joined Rogers Aviation in 2001 as General Manager - Finance & Administration. Prior to joining Rogers, he worked in South Africa for a period of 7 years with Andersen. He was appointed Managing Director of Rogers Aviation in October 2006 and Chief Executive Officer in October 2010.
Other directorships in listed companies: none
Born in 1964, he holds a BSc Electronic Engineering as well as an MBA. He started his career as Management Information Consultant with Andersen Consulting in South Africa and moved to Mauritius in 1993. He joined the ENL Group in 1994 as a Corporate Executive and was subsequently appointed Chief Executive Officer of South West Tourism Development in July 2009.
Other directorships in listed companies: none
KOENIG, Richard
Chief Executive Officer Real Estate & Agribusiness
MIHDIDIN, Sanjiv
Chief Executive Officer Property
Born in 1970, he graduated as a Civil Engineer with postgraduate qualifications in Environmental Engineering (UK), MBA Finance and a Property Development Programme (Cape Town). He joined Rogers as Property Development Manager in 2004 and was appointed Managing Director of the Rogers Property Sector in 2007 and Chief Executive Officer of Foresite Property in 2010. He launched Foresite Property along with Ascencia, a listed property fund, in 2008. He is the chairman of the Real Estate Association (Mauritius) Ltd and a member of the Mauritius Chamber of Commerce and Industry. He was previously a Consulting Engineer and Team Leader – Property Development at the Sugar Investment Trust.
Other directorships in listed companies: Ascencia Limited
Annual Report 201322
,
RUHEE, Ashley (Kabir) Coomar
Chief Executive Officer Technology
Born in 1977, he holds a first degree in Mathematics and Physics from the Faculté des Sciences de Luminy, Marseilles and a MEng in Automatic Control, Electronics and Computer Engineering with specialisation in Real Time & Systems from the Institut National des Sciences Appliquées of Toulouse. He worked from 2000 to 2004 for Capgemini, Telecom Media and Entertainment, Central and Southern Europe, as a Technology Consultant in Paris. He worked for DCDM Consulting in Mauritius, a company managed by Accenture from 2005 as a Manager in their Business Consulting service line. He joined Rogers in 2007, held the position of Chief Information & Planning Executive of Cim since June 2008 and was appointed as Managing Director of EIS as from December 2009. He was appointed Chief Executive Officer of the Technology Sector of Rogers in October 2012.
Other directorships in listed companies: none
Born in 1969, he holds an MSc in Engineering from the Odessa Technological Institute (ex USSR) and a Master’s degree in Business Administration from the University of Mauritius. He also followed the Executive Training, Emerging Leaders Program, at the London Business School. He joined Rogers in 1993 and was has since worked as Project Manager, Deputy General Manager of RIDS Madagascar , General Manager of EIS Ltd, the IT subsidiary of the Rogers Group, and Corporate Manager - Strategic Planning. He was appointed Chief Executive Officer of Velogic Ltd in July 2011.
Other directorships in listed companies: none
NUNKOO, Vishal
Chief Executive Officer
Logistics
Profile of Function ExecutivesCorporate Office
Born in 1979, he holds a Masters in Business Administration and a B.Sc (Hons) Management. He started his career in the Human Resources field, with a varied exposure in Telecommunications, ICT, and Aviation industries. He joined Rogers in the Logistics sector in January 2006 as Division Manager – Human Resources and was subsequently appointed Chief Human Resources Executive of Rogers in September 2008. He is a Certified Master practitioner in NLP (Neuro Linguistic Programming) and Neuro semantics, and is a member of the International Coaching Federation (ICF). He also practices as adjunct professor at the University of Mauritius in Strategic Management and Human Resources Management at post graduate level.
Other directorships in listed companies: none
BUNDHUN, Manish
Chief Human Resources Executive
Born in 1964, she holds a Diploma in Sociology and a Master degree in Tourism specialised in Marketing from the universities of Grenoble and Lyon in France. She joined Rogers in November 2001 as Manager – HR Development and set up customised training programmes throughout the Group. She is also a qualified trainer and consultant in Customer Engagement- Relation. She is currently the Chief Communication Executive of Rogers.
Other directorships in listed companies: none
RAMLACKHAN-ANGELLUCCI, Kaushall
Chief Communication Executive
Rogers and Company Limited 23
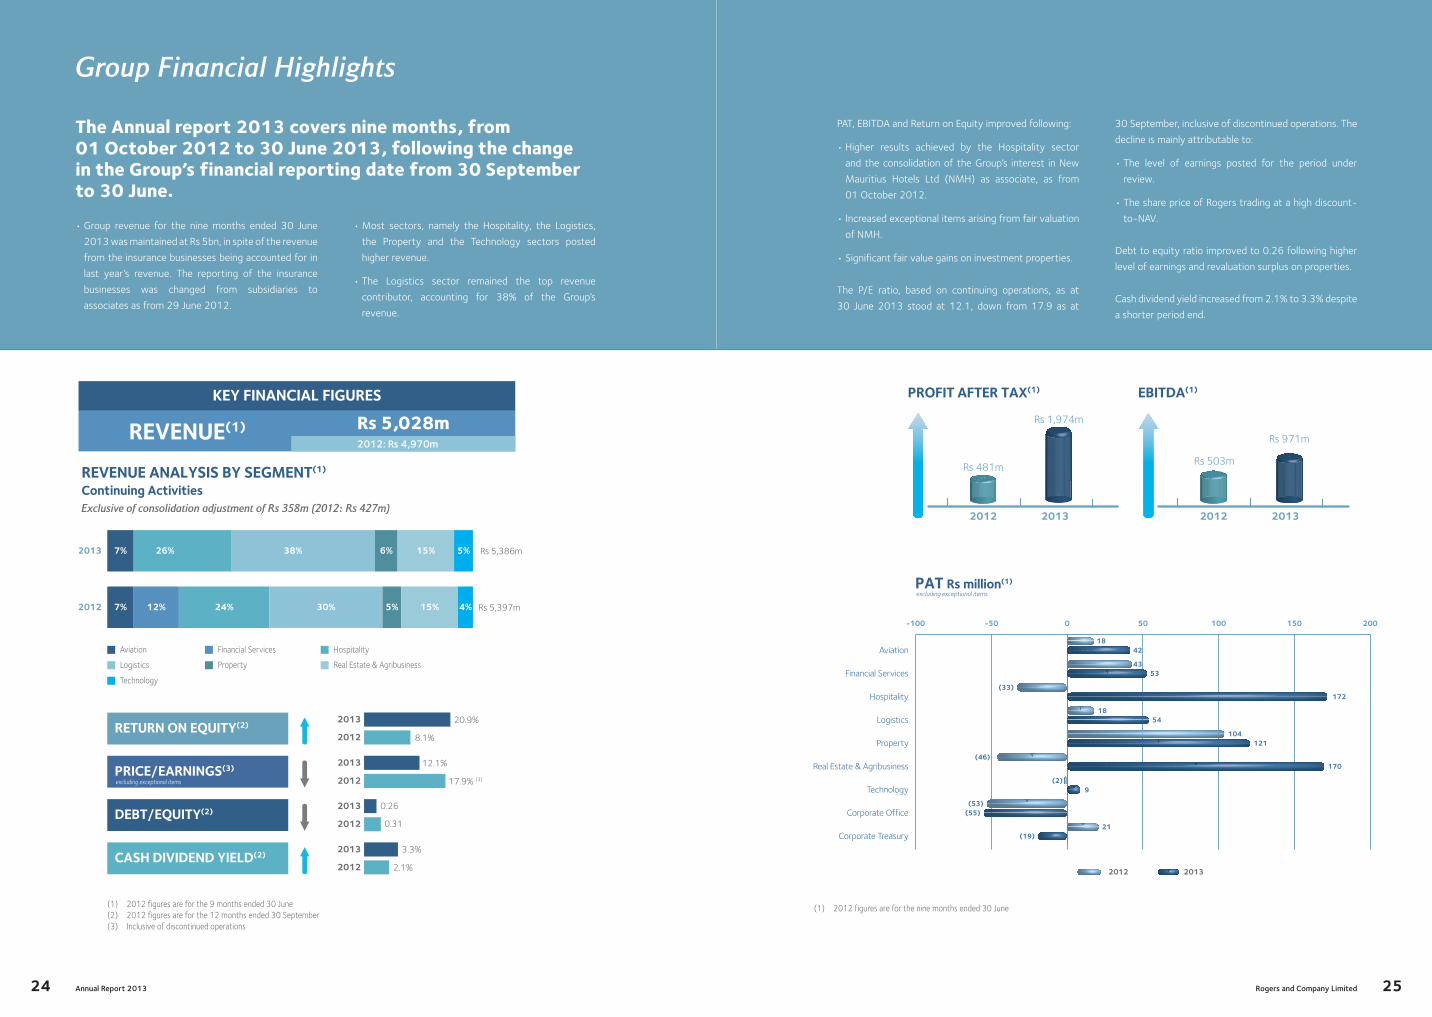
Group Financial Highlights
The Annual report 2013 covers nine months, from 01 October 2012 to 30 June 2013, following the change in the Group’s financial reporting date from 30 September to 30 June.
• Group revenue for the nine months ended 30 June
2013 was maintained at Rs 5bn, in spite of the revenue
from the insurance businesses being accounted for in
last year’s revenue. The reporting of the insurance
businesses was changed from subsidiaries to
associates as from 29 June 2012.
• Most sectors, namely the Hospitality, the Logistics,
the Property and the Technology sectors posted
higher revenue.
• The Logistics sector remained the top revenue
contributor, accounting for 38% of the Group’s
revenue.
RETURN ON EQUITY(2)2013 20.9%
2012 8.1%
PRICE/EARNINGS(3)2013 12.1%
2012 17.9% (3)
DEBT/EQUITY(2)2013 0.26
2012 0.31
CASH DIVIDEND YIELD(2)2013 3.3%
2012 2.1%
Financial Services HospitalityAviation
(1) 2012 figures are for the 9 months ended 30 June(2) 2012 figures are for the 12 months ended 30 September(3) Inclusive of discontinued operations
Property Real Estate & AgribusinessLogistics
Technology
excluding exceptional items
2012
REVENUE ANALYSIS BY SEGMENT(1)
Continuing ActivitiesExclusive of consolidation adjustment of Rs 358m (2012: Rs 427m)
7% 12% 24% 30% 5% 15% 4% Rs 5,397m
2013 7% 26% 38% 6% 15% 5% Rs 5,386m
2012: Rs 4,970mREVENUE(1) Rs 5,028m
KEY FINANCIAL FIGURES
Annual Report 201324
PAT, EBITDA and Return on Equity improved following:
• Higher results achieved by the Hospitality sector
and the consolidation of the Group’s interest in New
Mauritius Hotels Ltd (NMH) as associate, as from
01 October 2012.
• Increased exceptional items arising from fair valuation
of NMH.
• Significant fair value gains on investment properties.
The P/E ratio, based on continuing operations, as at
30 June 2013 stood at 12.1, down from 17.9 as at
30 September, inclusive of discontinued operations. The
decline is mainly attributable to:
• The level of earnings posted for the period under
review.
• The share price of Rogers trading at a high discount-
to-NAV.
Debt to equity ratio improved to 0.26 following higher
level of earnings and revaluation surplus on properties.
Cash dividend yield increased from 2.1% to 3.3% despite
a shorter period end.
2012 2013
-100 -50 0 50 100 150 200
Corporate Treasury
Corporate Office
Technology
Real Estate & Agribusiness
Property
Logistics
Hospitality
Financial Services
Aviation18
42
4353
172
1854
104121
170
9
21
(46)
(33)
(2)
(19)
(53)(55)
PAT Rs million(1)
PROFIT AFTER TAX(1)
2012 2013
Rs 481m
Rs 1,974m
EBITDA(1)
2012 2013
Rs 503m
Rs 971m
(1) 2012 figures are for the nine months ended 30 June
excluding exceptional items
Rogers and Company Limited 25
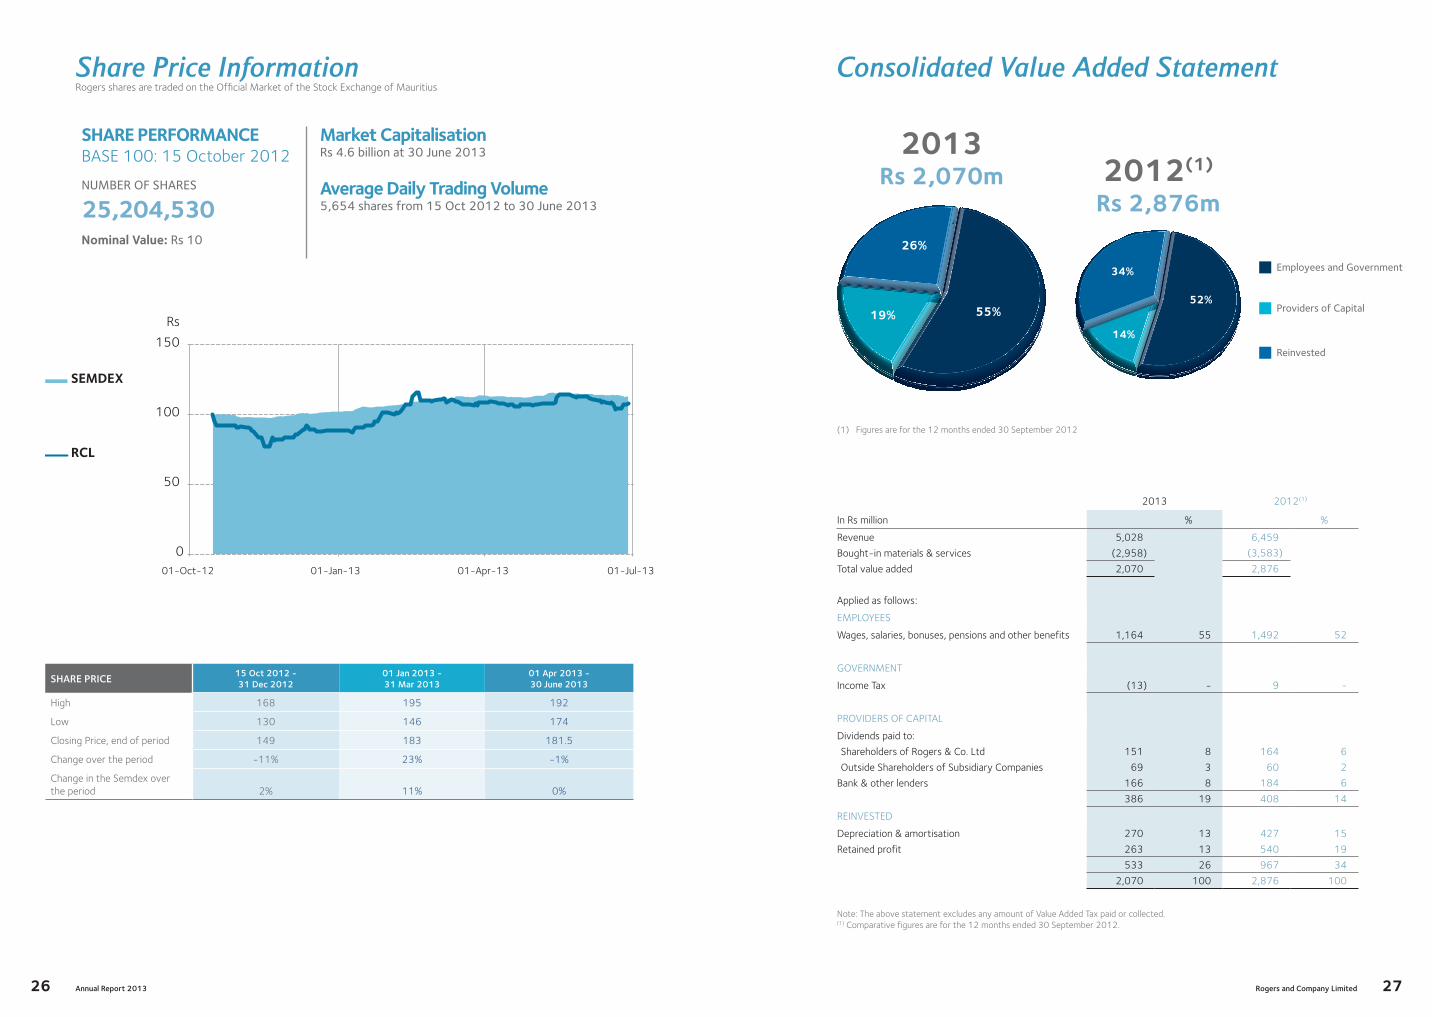
Share Price Information
SHARE PRICE 15 Oct 2012 - 31 Dec 2012
01 Jan 2013 - 31 Mar 2013
01 Apr 2013 - 30 June 2013
High 168 195 192
Low 130 146 174
Closing Price, end of period 149 183 181.5
Change over the period -11% 23% -1%
Change in the Semdex over the period 2% 11% 0%
0
50
100
150
Rs
01-Oct-12 01-Jan-13 01-Apr-13 01-Jul-13
SEMDEX
RCL
ShARE PERFORMANCEBASE 100: 15 October 2012
Market Capitalisation Rs 4.6 billion at 30 June 2013
Average daily Trading Volume 5,654 shares from 15 Oct 2012 to 30 June 2013
NUMBER OF SHARES
25,204,530Nominal Value: Rs 10
Rogers shares are traded on the Official Market of the Stock Exchange of Mauritius
Annual Report 201326
Consolidated Value Added Statement
2013Rs 2,070m 2012(1)
Rs 2,876m
26%
55%19%52%
14%
34% Employees and Government
Providers of Capital
Reinvested
(1) Figures are for the 12 months ended 30 September 2012
2013 2012(1)
In Rs million % %
Revenue 5,028 6,459
Bought-in materials & services (2,958) (3,583)
Total value added 2,070 2,876
Applied as follows:
EMPLOYEES
Wages, salaries, bonuses, pensions and other benefits 1,164 55 1,492 52
GOVERNMENT
Income Tax (13) - 9 -
PROVIDERS OF CAPITAL
Dividends paid to:
Shareholders of Rogers & Co. Ltd 151 8 164 6
Outside Shareholders of Subsidiary Companies 69 3 60 2
Bank & other lenders 166 8 184 6
386 19 408 14
REINVESTED
Depreciation & amortisation 270 13 427 15
Retained profit 263 13 540 19
533 26 967 34
2,070 100 2,876 100
Note: The above statement excludes any amount of Value Added Tax paid or collected.(1) Comparative figures are for the 12 months ended 30 September 2012.
Rogers and Company Limited 27

AviationFinancial Services
HospitalityLogisticsProperty
Real Estate & AgribusinessTechnology

Aviation Focus on actions to turnaround the underperforming operations of Aviation Services contributed to the good performance of the sector.
Overview
Confidence for both the global economy and the airline
industry increased during the period under review. Airline
share prices were up and outperformed equity markets.
Structural changes and efficiency gains by airlines coupled
with improvements in the business environment and solid
economic growth in emerging regions contributed in keeping
the industry afloat.
October 2012 was a turning point for air travel markets.
Seasonally-adjusted passenger volumes grew at an
accelerated pace in line with the pick-up recorded in
global business confidence indicators. Revenue Passenger
Kilometers (actual passenger traffic) grew at an annualised
rate of 8% between October 2012 and June 2013.
The sector’s regional operations faced mixed results. Reunion
and Mayotte were directly impacted by the Eurozone crisis
and in particular the French economic woes. Their passenger
traffic was down by 4%. On the other hand, Mozambique,
being one of the fastest growing economies in the world,
experienced sustained demand for air transport services
with an increase of 14%.
PERFORMANCE REVIEW
The strategy of the sector this year was focused
on consolidating the existing business lines and
our main achievements were:
• The turnaround of our Visa processing operation
in South Africa;
• The deployment of the global distribution
system SABRE to our travel agency network in
the region;
• The gain of market share in Mauritius and
Mozambique for our travel services segment;
• The recapture of lost markets for the incoming
segment in Madagascar;
The airline representation activities benefitted
from the termination of non- performing activities
in South Africa and the contribution of the SABRE
representation in Mauritius. However, such positive
contribution was dampened by the suspension of
operation of an airline representation in Kenya
while the related committed costs remained in
place. The profitability of this segment was also
reduced with the decision of another carrier
in Mayotte to review its flight frequencies. In
addition, the performance of activities in Reunion
was negatively impacted by the advent of the
zero-commission model from our main airline
representation.
Despite high operational costs in South Africa, the
cargo activity improved its performance on the
back of more favourable yields.
The ground handling cargo activity in Mauritius
recorded an exceptional increase in the first
quarter with the launch of new shopping malls in
the north of the island.
BlueSky, the travel agency activity, strengthened
its market leadership in Mauritius while the
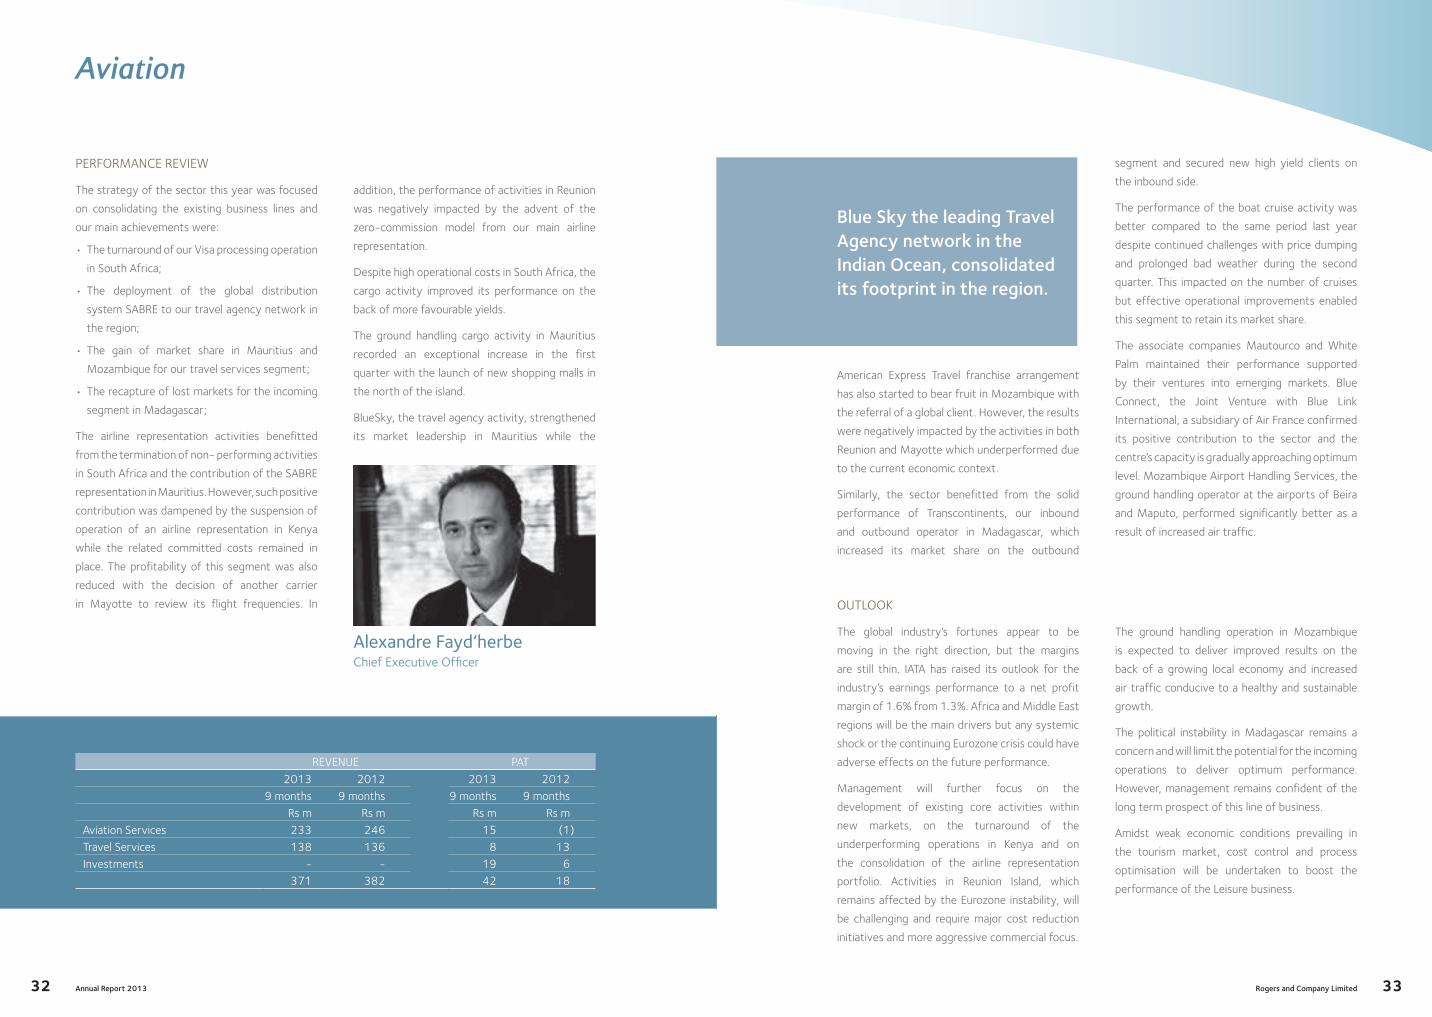
Aviation
Alexandre Fayd’herbeChief Executive Officer
REVENUE PAT
2013 2012 2013 20129 months 9 months 9 months 9 months
Rs m Rs m Rs m Rs mAviation Services 233 246 15 (1)Travel Services 138 136 8 13Investments - - 19 6
371 382 42 18
Annual Report 201332
American Express Travel franchise arrangement
has also started to bear fruit in Mozambique with
the referral of a global client. However, the results
were negatively impacted by the activities in both
Reunion and Mayotte which underperformed due
to the current economic context.
Similarly, the sector benefitted from the solid
performance of Transcontinents, our inbound
and outbound operator in Madagascar, which
increased its market share on the outbound
OUTLOOK
The global industry’s fortunes appear to be
moving in the right direction, but the margins
are still thin. IATA has raised its outlook for the
industry’s earnings performance to a net profit
margin of 1.6% from 1.3%. Africa and Middle East
regions will be the main drivers but any systemic
shock or the continuing Eurozone crisis could have
adverse effects on the future performance.
Management will further focus on the
development of existing core activities within
new markets, on the turnaround of the
underperforming operations in Kenya and on
the consolidation of the airline representation
portfolio. Activities in Reunion Island, which
remains affected by the Eurozone instability, will
be challenging and require major cost reduction
initiatives and more aggressive commercial focus.
The ground handling operation in Mozambique
is expected to deliver improved results on the
back of a growing local economy and increased
air traffic conducive to a healthy and sustainable
growth.
The political instability in Madagascar remains a
concern and will limit the potential for the incoming
operations to deliver optimum performance.
However, management remains confident of the
long term prospect of this line of business.
Amidst weak economic conditions prevailing in
the tourism market, cost control and process
optimisation will be undertaken to boost the
performance of the Leisure business.
Blue Sky the leading Travel Agency network in the Indian Ocean, consolidated its footprint in the region.
segment and secured new high yield clients on
the inbound side.
The performance of the boat cruise activity was
better compared to the same period last year
despite continued challenges with price dumping
and prolonged bad weather during the second
quarter. This impacted on the number of cruises
but effective operational improvements enabled
this segment to retain its market share.
The associate companies Mautourco and White
Palm maintained their performance supported
by their ventures into emerging markets. Blue
Connect, the Joint Venture with Blue Link
International, a subsidiary of Air France confirmed
its positive contribution to the sector and the
centre’s capacity is gradually approaching optimum
level. Mozambique Airport Handling Services, the
ground handling operator at the airports of Beira
and Maputo, performed significantly better as a
result of increased air traffic.
Rogers and Company Limited 33
Financial ServicesAviation
HospitalityLogisticsProperty
Real Estate & AgribusinessTechnology
Financial Services Diversifying further into asset management amidst changes and uncertainties in India.
Overview
The investment climate in India was somewhat doused by
the uncertainties lingering from Government’s decision to
implement the General Anti Avoidance Rules. As a result,
foreign direct investment in India took a hit in 2012 but
a slow recovery was noted by the end of the year. India’s
investment inflows through Mauritius also witnessed a fall
as the Double Taxation Agreement (DTA) between the two
countries was brought back on the table for negotiations.
Amidst these uncertainties, the focus of Rogers Asset
Management has been to consolidate the FII business and
to develop the asset management segment. With the Indian
Government giving more clarity on the tax benefits under
the DTA, Mauritius is expected to remain the preferred
jurisdiction for investment in India.
During the period under review, Rogers increased its
shareholding in its associate company Intendance Holding
Ltd, the holding company of the Swan Group, a market
leader in the insurance industry in Mauritius.

PERFORMANCE REVIEW
For the nine-months ended June 2013, Rogers
Asset Management posted a PAT of Rs 1m, down
by 90% compared to the same period last year
due to the transfer of the portfolio business to
Anglo Mauritius Investment Managers.
Income from the FII business remained fairly
similar compared to the corresponding period last
year. Asset under administration increased from
Rs 10.3 bn as at September 2012 to Rs 10.5 bn
as at June 2013. Assets under management for
CIS business fell from Rs 977.8 m as at
30 September 2012 to Rs 799 m as at June
2013 owing to the transfer of one domestic CIS
fund to Anglo Mauritius Investment Managers.
During the period under review, the shareholding
of Rogers in its associate company Intendance
Holding Ltd, which controls both Swan Insurance
Company Ltd and the Anglo-Mauritius Assurance
Society Ltd, was brought up from 24.4% to
37.8%. The insurance and investment businesses
were reported as subsidiaries prior to their merger
on 29 June 2012. Satisfactory operational results
were recorded for the insurance activities while
the performance of the investment businesses
was sustained by the recovery observed on both
local and foreign equity markets during the first
semester of 2013.
Financial Services
Ziyad BundhunChief Finance and Investment Executive- Rogers & Co. Ltd.
REVENUE PAT
2013 2012 2013 20129 months 9 months 9 months 9 months
Rs m Rs m Rs m Rs mRogers Asset Management 9 25 1 10Insurance and stockbroking businesses - 624 - 33
9 649 1 43Anglo-Mauritius Financial Solutions Ltd (Associated Company) - - 10 -Intendance Holding Ltd (Associated Company) - - 42 -
9 649 53 43
Annual Report 201338
OUTLOOK
Despite signs of a healing global economy, the
outlook for investment activities remains clouded
with uncertainty as the past years have been
marked by short seasonal cycles and persisting
fears over the European economy.
India’s economy is expected to grow by 5.7%
and 6.2% in 2013 and 2014 respectively, with
inflation being significantly higher at around
10.8%. Foreign Direct Investment is expected to
remain low due to the General Elections in 2014.
Increasing competition from other jurisdictions
such as Singapore and Dubai which are more
sophisticated financial centres, is also anticipated.
In FY 2013-14, Rogers Asset Management
will focus on developing further the asset
management business by launching new
investment funds for institutional and high net
worth investors. Effective cost control measures
will be maintained whilst putting strong emphasis
on business development and marketing.
The stake of Rogers in its associate company Intendance Holding Ltd, which controls both Swan Insurance Company Ltd and the Anglo-Mauritius Assurance Society Ltd, was brought up from 24.4% to 37.8%.
Rogers and Company Limited 39

HospitalityAviation
Financial ServicesLogisticsProperty
Real Estate & AgribusinessTechnology

Hospitality After a successful recovery and financial restructuring, VLH is well-equipped to continue improving efficiency and enhancing its brands’ reputation despite the difficult economic conditions.
Overview
The Mauritian tourism industry continues to evolve in a
challenging environment with stagnating tourist arrivals,
limited airline seats and increasing hotel room inventory. In
addition, Mauritius is facing stiffer competition from other
short and long haul destinations. These factors are exerting
more pressures on prices and the reputation of the country
as an exclusive destination is being threatened.
Despite these challenges and a slight drop in average
occupancy from 79% to 78% for the nine-month period
ended 30 June 2013, Veranda Leisure and Hospitality (VLH)
increased its revenue by 10% compared to the same period
last year. The adopted diversification strategy towards
emerging markets is in place but will take time to bear fruit.
VLH also confirmed its commitment to responsible tourism
through environmentally-friendly operational practices.
Several Non-Governmental Organisations (NGOs) were also
supported for the protection of lagoons and the development
of the community..
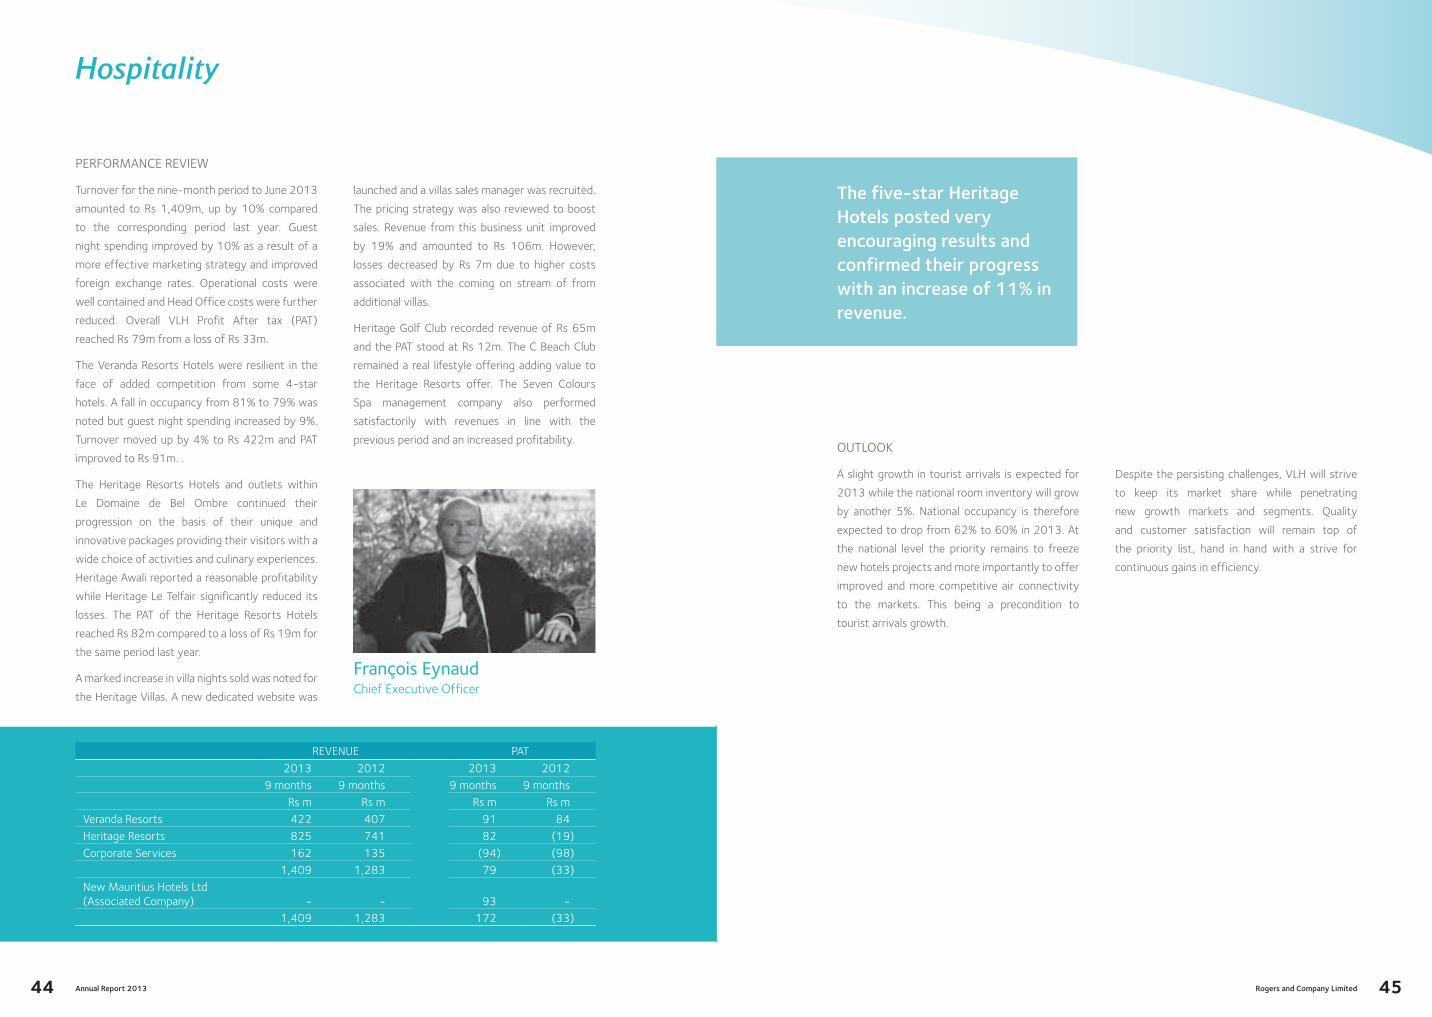
PERFORMANCE REVIEW
Turnover for the nine-month period to June 2013
amounted to Rs 1,409m, up by 10% compared
to the corresponding period last year. Guest
night spending improved by 10% as a result of a
more effective marketing strategy and improved
foreign exchange rates. Operational costs were
well contained and Head Office costs were further
reduced. Overall VLH Profit After tax (PAT)
reached Rs 79m from a loss of Rs 33m.
The Veranda Resorts Hotels were resilient in the
face of added competition from some 4-star
hotels. A fall in occupancy from 81% to 79% was
noted but guest night spending increased by 9%.
Turnover moved up by 4% to Rs 422m and PAT
improved to Rs 91m. .
The Heritage Resorts Hotels and outlets within
Le Domaine de Bel Ombre continued their
progression on the basis of their unique and
innovative packages providing their visitors with a
wide choice of activities and culinary experiences.
Heritage Awali reported a reasonable profitability
while Heritage Le Telfair significantly reduced its
losses. The PAT of the Heritage Resorts Hotels
reached Rs 82m compared to a loss of Rs 19m for
the same period last year.
A marked increase in villa nights sold was noted for
the Heritage Villas. A new dedicated website was
launched and a villas sales manager was recruited.
The pricing strategy was also reviewed to boost
sales. Revenue from this business unit improved
by 19% and amounted to Rs 106m. However,
losses decreased by Rs 7m due to higher costs
associated with the coming on stream of from
additional villas.
Heritage Golf Club recorded revenue of Rs 65m
and the PAT stood at Rs 12m. The C Beach Club
remained a real lifestyle offering adding value to
the Heritage Resorts offer. The Seven Colours
Spa management company also performed
satisfactorily with revenues in line with the
previous period and an increased profitability.
Hospitality
REVENUE PAT
2013 2012 2013 20129 months 9 months 9 months 9 months
Rs m Rs m Rs m Rs mVeranda Resorts 422 407 91 84Heritage Resorts 825 741 82 (19)Corporate Services 162 135 (94) (98)
1,409 1,283 79 (33)New Mauritius Hotels Ltd (Associated Company) - - 93 -
1,409 1,283 172 (33)
François EynaudChief Executive Officer
Annual Report 201344
OUTLOOK
A slight growth in tourist arrivals is expected for
2013 while the national room inventory will grow
by another 5%. National occupancy is therefore
expected to drop from 62% to 60% in 2013. At
the national level the priority remains to freeze
new hotels projects and more importantly to offer
improved and more competitive air connectivity
to the markets. This being a precondition to
tourist arrivals growth.
Despite the persisting challenges, VLH will strive
to keep its market share while penetrating
new growth markets and segments. Quality
and customer satisfaction will remain top of
the priority list, hand in hand with a strive for
continuous gains in efficiency.
The five-star Heritage Hotels posted very encouraging results and confirmed their progress with an increase of 11% in revenue.
Rogers and Company Limited 45
LogisticsAviation
Financial ServicesHospitality
PropertyReal Estate & Agribusiness
Technology

Logistics Despite the difficult economic context and continuous pressures on margins, freight forwarding activities in France, Madagascar, India and Reunion improved. Mauritius Freight Forwarding and courier businesses also performed well in a highly competitive and flat market.
Overview
The global economic situation improved to some extent
during the first semester of the period under review
compared to the corresponding period last year. However,
uncertainties persisted within the Euro zone, a mitigated
recovery in the U.S. and slower-than-expected growth were
noticed in China and India. Austerity measures taken in several
major economies to reduce the high level of sovereign debts
dampened consumer spending and the level of global trade.
Despite this difficult economic environment and continuous
pressures on margins, freight forwarding activities in France,
Madagascar, India and Reunion posted better results.
Freight forwarding and courier businesses in Mauritius also
performed well in a highly competitive and flat market.
The Freeport sector remained challenged with alternative
platforms such as Dubai and Singapore offering more
attractive vessel frequencies and freight rates to key
destinations in Africa, Asia and Europe.
Towards the end of the financial period, Mechanical
Transport Limited (MTL) was acquired. This will allow Velogic
to penetrate another segment of the transport market and
benefit from economies of scale.

PERFORMANCE REVIEW
Profit after tax (PAT) for the Logistics sector
over the nine-month financial period to June
2013 increased from Rs 18m to Rs 54m. This
was primarily driven by the France Freight
Forwarding arm returning to profitability after
incurring significant losses last year as a result
of the economic downturn, but also improved
performance across most businesses of the
company
Sustained by the depot and transport activities,
Port services recorded an increase of 6% in
revenue and generated profits for the first time
since the Logistics sector was put under single
management in 2008. Effective cost containment
initiatives enabled the transport business to
improve its performance in a highly fragmented
and competitive market. However our operations
in Rodrigues were impacted by a reduced number
of containers dispatched compared to last year.
Mechanical Transport Limited (MTL) was acquired
in May 2013. As part of this deal, a 10% holding
in Freight and Transit Ltd (FTL) was also secured.
Only post-acquisition results of MTL were
therefore taken into account in the results. This
strategic move will enable Velogic to diversify
into the transport of agricultural products and
will also further the development of project cargo
activities. In addition, economies of scale are
expected on the procurement side.
After a sluggish year 2012, our sugar packing
operations showed a rise in PAT on the back of
higher volumes and a stronger pound sterling
(GBP).
Logistics
REVENUE PAT
2013 2012 2013 20129 months 9 months 9 months 9 months
Rs m Rs m Rs m Rs m Port Services 300 284 3 (2) Sugar Packaging 66 57 12 10 Shipping 43 37 14 8 Freight Forwarding Services 1,618 1,228 29 3 Corporate 25 26 (4) (1)
2,052 1,632 54 18
Vishal NunkooChief Executive Officer
Annual Report 201350
The performance of the shipping operations in
Singapore was significantly better, supported
primarily by higher volumes. However, this
increase was partly offset by a fall in profitability
of the Mauritius-based activity due to a drop
in ship surveys as well as additional expenses
incurred at the beginning of the financial period to
enhance its efficiency and marketability.
The performance of freight forwarding activities
improved significantly with a 32% increase in
revenue, attributed to upsides in France, India,
Mauritius Mozambique and Reunion compared
to the same period last year. PAT increased from
OUTLOOK
As growth in the U.S. and China are unlikely to
compensate the persisting weaknesses in Europe,
the global economic environment will remain
challenging.
Despite this blurred economic back drop, the
company will aim to expand the business next
year by tapping into growth opportunities in
India, Reunion, Mozambique and bulk shipping.
The container depot is expected to make an
important contribution to the profitability of the
Port Services business and the transport activity
should offer good prospects for growth.
The profit after tax (PAT) for the Logistics sector over the nine-months financial period 2013 increased to Rs 54m from Rs 18m in the same period in 2012.
Rs 3m as of June 2012 to Rs 29m this year, with
France contributing Rs 17m of this increase.
The French platform re-acquired lost traffic
and experienced an increase in volumes. The
improvement in France also benefitted the Indian
entity and efforts to develop incremental business
into new geographies such as Asia and Africa
have started to bring positive results. Despite
an intensely competitive market, activities in
Mauritius grew with increases achieved on the
key European and Asian trade lanes. Madagascar
and Reunion also improved their profitability on
the basis of a broadened customer base.
Rogers and Company Limited 51

PropertyAviation
Financial ServicesHospitality
LogisticsReal Estate & Agribusiness
Technology

Property Centre Commercial Riche Terre has been rebranded as Riche Terre Mall, with a new logo and a new visual identity in order to complement the fresh and modern architecture and vibrant landscaping of the shopping mall.
Overview
Foresite Property has been very active and maintained a successful delivery for the period ended 30 June 2013. Despite challenging market conditions and the extension and re-development projects at Centre Commercial Riche Terre and Centre Commercial Phoenix, Foresite Property has had satisfactory financial results and has further consolidated its market position.
In line with the resilient market context, the property market remained on a moderate 2.6% growth trend.
While some new shopping malls are already struggling and having difficulties to maintain foot traffic, Centre Commercial Phoenix has confirmed its remarkable performance with a stable footfall and a near to 100% occupancy rate. Already renowned for its creative digital marketing approach, Centre Commercial Phoenix was the first Mauritian Shopping Centre to launch its Mobile Application in December 2012. The future extension of the shopping centre has been designed to strengthen its positioning as one of the best shopping malls of the region in terms of foot traffic and tenant mix. The extension will offer a new extended foodcourt experience, new shops, a new fashion anchor, prominent restaurants, a high-end gym and extra parking facilities. In line with the sustainability values of Foresite Property, emphasis has been laid on the implementation of cost-efficient measures for instance the use of LED lights, rain water harvesting for irrigation, planting of endemic plants and enhanced day light use for the mall.
After ten years of operation, Centre Commercial Riche Terre was in need of a major facelift, calling for an infusion of fresh energy and renewed vibrancy. The revamped commercial centre will be a modern shopping destination of world class standards. Much effort has been concentrated to improve the retail environment by increasing leisure and food offerings to attract more shoppers whilst implementing various eco-friendly measures.
Centre Commercial Riche Terre has been rebranded as Riche Terre Mall, with a new logo and a new visual identity in order to complement the fresh and modern architecture and vibrant landscaping of the shopping mall. Riche Terre Mall will open around October 2013 offering a completely new shopping experience to its visitors.
On the other hand, the office portfolio experienced difficulties with the excess in supply of office space nationally. Rentals in the Central Business District of Port Louis continued to fall representing a discount of 40% in extreme cases.
In addition to providing the obvious benefit of growth with sustainable profits, Foresite Property also seeks to contribute to the continued development of society. To this end, the company has been engaged in several CSR projects, namely with the Mauritian Wildlife Foundation for the protection and breeding of Pink pigeon endemic bird and with the Child Family Centre in Vacoas.

PERFORMANCE REVIEW
Foresite Property performed well during the nine-
month period ended 30 June 2013 with a PAT of
Rs 121m. The period was marked by the progress
within schedule of the refurbishment project at
Centre Commercial Riche Terre together with
the start of works, end of January 2013, for the
extension phase of Centre Commercial Phoenix.
The property portfolio achieved an overall
occupancy rate of 90% as at 30 June 2013,
lower than the 95% level achieved last year. The
decrease was due to the temporary closure of
the Centre Commercial Riche Terre line shops for
the re-development project and the vacating of
tenants in the office segment.
In addition, a fair value gain of Rs 34m was
accounted for in the results following the property
revaluation exercise carried out in 2013.
Ascencia, our listed Property Fund, continued its
good performance for the current financial period.
PAT stood at Rs 77m. The refurbishment works at
Centre Commercial Riche Terre had an impact on
the total rental revenue due to line shop tenants
having vacated temporarily. The management
companies also delivered operating profits, closing
their accounts with a PAT of Rs 29m. The leasing
assignments for Riche Terre Mall and Centre
Commercial Phoenix were successfully completed
and the team progressed well for the leasing of
the additional shops and food court operators
in the extension of Centre Commercial Phoenix.
Moreover, project management and development
services were provided for both projects at the
commercial centres during the period under
review.
Property
REVENUE PAT
2013 2012 2013 20129 months 9 months 9 months 9 months
Rs m Rs m Rs m Rs mForesite properties 74 69 8 8Foresite Fund Management Ltd 22 13 13 7Foresite Ltd 58 50 16 18Edith Cavell Properties (JV share) 4 7 3 4Ascencia 110 114 77 70Reliance services 80 28 4 (3)
348 281 121 104
Sanjiv MihdidinChief Executive Officer
Annual Report 201356
Foresite Property acquired the shares of G4S
International in the Security and Facility Services
joint venture companies in November 2012.
The companies’ structures were reviewed and
a rebranding exercise was undertaken. The two
entities are now known as Reliance Security
Services Ltd and Reliance Facilities Ltd. A strategic
plan with business development as a key focus
area is in progress. The Reliance entities reported
a total PAT of Rs 4m on the basis of an accounting
treatment in respect of waived dues owed by
Reliance to G4S International, leading to a positive
impact of Rs 8m.
OUTLOOK
Foresite Property has again reinforced its solid,
trusted and reliable status as one of the leading
operators in the Mauritian Property sector
boasting a solid track record and consistently
delivering results.
Upon completion of the refurbishment project
at Centre Commercial Riche Terre and the
extension of Centre Commercial Phoenix, the
revenue base of Foresite Property is expected to
grow in the next financial year. Furthermore, the
listed Investment vehicle, Ascencia, is currently
exploring new opportunities of collaboration
with ENL Property to grow its asset base. The
aim is to offer attractive investment returns to
its shareholders with access to long term capital
gain on high quality real estate. We expect this will
open up new avenues of business at regional level.
Ascencia is currently exploring new opportunities of collaboration and aims to offer attractive investment returns to its shareholders with access to long term capital gain on high quality real estate.
Rogers and Company Limited 57

Real Estate & Agribusiness Aviation
Financial ServicesHospitality
LogisticsProperty
Technology

Overview
With profits boosted by fair value gains, the Real Estate and
Agribusiness sector achieved an exceptionally high Profit
After Tax (PAT) for the period under review.
Les Villas de Bel Ombre saw the close-out of phase 1 of
its development and the transition to a sustainable lower
intensity of business operations in the current global
economic climate. As at June 2013, it had sold 134
properties and built 125 villas, exceeding its target for the
year and making Villas Valriche the largest free standing villa
development in Mauritius.
The operational performance of the Agribusiness activities
improved significantly during the period reaping the benefits
of cost cutting initiatives and a higher sugar price for the
2012 crop.
During the year under review, the Real Estate and
Agribusiness sector also extended further its commitment to
the well-being of the inhabitants of the Bel Ombre region by
contributing an amount of Rs 2.5m to support the initiatives
of the Bel Ombre Foundation for Empowerment (BOFE).
Real Estate & Agribusiness
Agribusiness activities are expected to continue improving in view of further benefits to be derived from business process efficiencies and enhanced marketing initiatives.
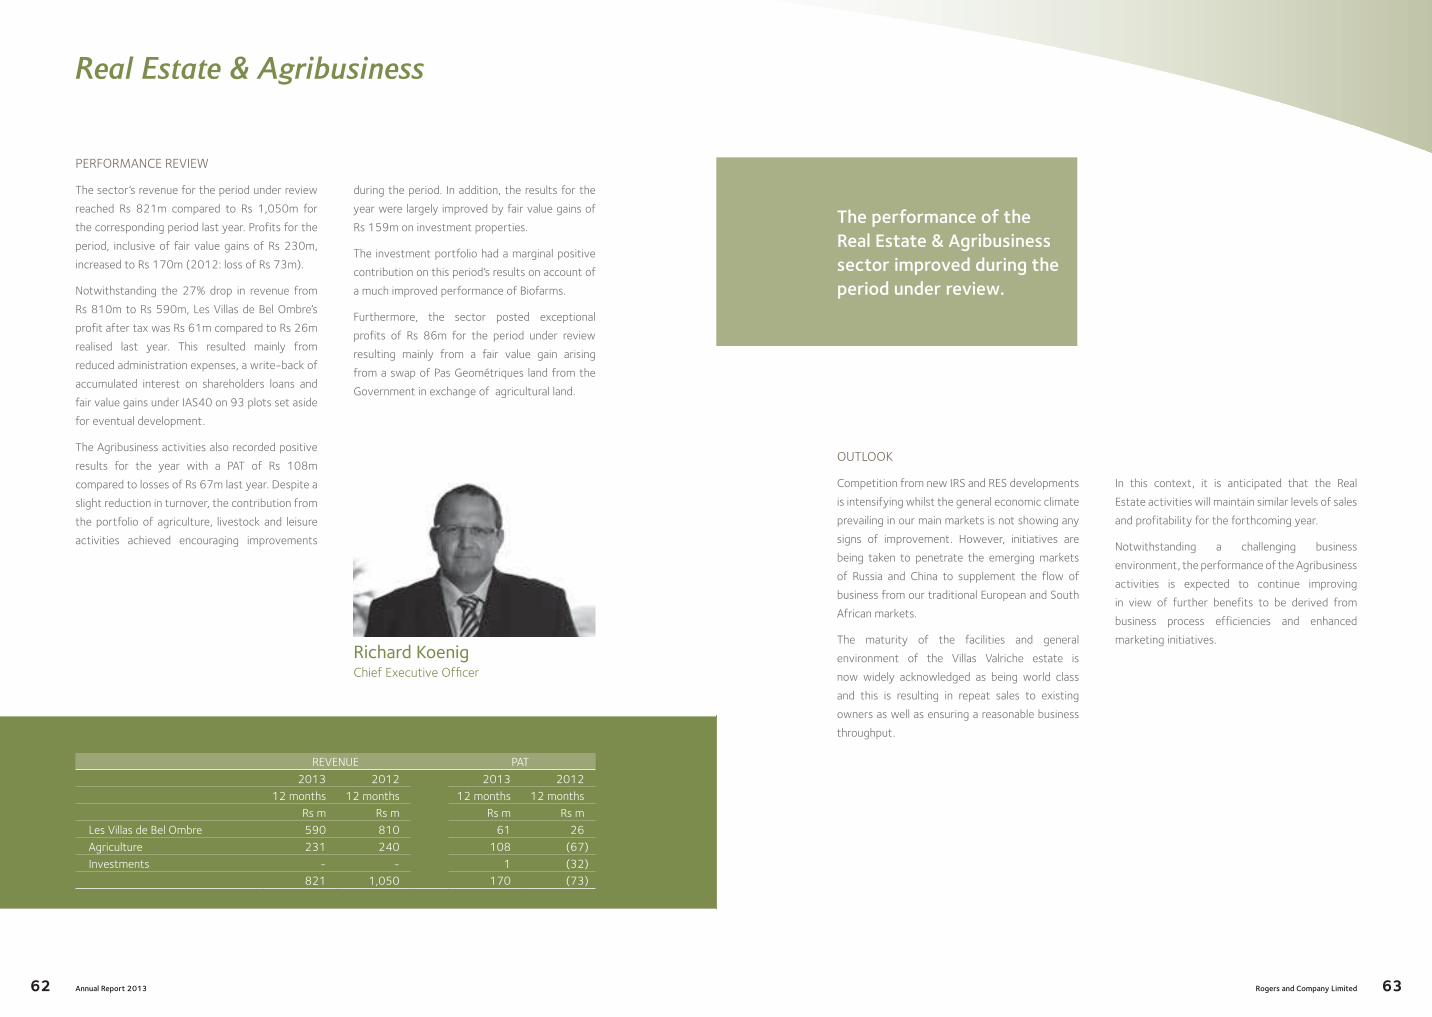
PERFORMANCE REVIEW
The sector’s revenue for the period under review
reached Rs 821m compared to Rs 1,050m for
the corresponding period last year. Profits for the
period, inclusive of fair value gains of Rs 230m,
increased to Rs 170m (2012: loss of Rs 73m).
Notwithstanding the 27% drop in revenue from
Rs 810m to Rs 590m, Les Villas de Bel Ombre’s
profit after tax was Rs 61m compared to Rs 26m
realised last year. This resulted mainly from
reduced administration expenses, a write-back of
accumulated interest on shareholders loans and
fair value gains under IAS40 on 93 plots set aside
for eventual development.
The Agribusiness activities also recorded positive
results for the year with a PAT of Rs 108m
compared to losses of Rs 67m last year. Despite a
slight reduction in turnover, the contribution from
the portfolio of agriculture, livestock and leisure
activities achieved encouraging improvements
during the period. In addition, the results for the
year were largely improved by fair value gains of
Rs 159m on investment properties.
The investment portfolio had a marginal positive
contribution on this period’s results on account of
a much improved performance of Biofarms.
Furthermore, the sector posted exceptional
profits of Rs 86m for the period under review
resulting mainly from a fair value gain arising
from a swap of Pas Geométriques land from the
Government in exchange of agricultural land.
Real Estate & Agribusiness
Richard KoenigChief Executive Officer
REVENUE PAT
2013 2012 2013 201212 months 12 months 12 months 12 months
Rs m Rs m Rs m Rs m Les Villas de Bel Ombre 590 810 61 26 Agriculture 231 240 108 (67) Investments - - 1 (32)
821 1,050 170 (73)
Annual Report 201362
OUTLOOK
Competition from new IRS and RES developments
is intensifying whilst the general economic climate
prevailing in our main markets is not showing any
signs of improvement. However, initiatives are
being taken to penetrate the emerging markets
of Russia and China to supplement the flow of
business from our traditional European and South
African markets.
The maturity of the facilities and general
environment of the Villas Valriche estate is
now widely acknowledged as being world class
and this is resulting in repeat sales to existing
owners as well as ensuring a reasonable business
throughput.
In this context, it is anticipated that the Real
Estate activities will maintain similar levels of sales
and profitability for the forthcoming year.
Notwithstanding a challenging business
environment, the performance of the Agribusiness
activities is expected to continue improving
in view of further benefits to be derived from
business process efficiencies and enhanced
marketing initiatives.
The performance of the Real Estate & Agribusiness sector improved during the period under review.
Rogers and Company Limited 63

TechnologyAviation
Financial ServicesHospitality
LogisticsProperty
Real Estate & Agribusiness
Technology The Technology sector is positioned as an emerging development engine of the Group with ambitious expansion targets in the next few years.
Overview
The Technology sector is positioned as an emerging
development engine of the Group with ambitious expansion
targets in the next few years.
Through Enterprise Information Solutions (“EIS”) and
AXA Customer Services (“AXA CS”), Rogers is uniquely
equipped to offer a comprehensive and complementary
portfolio of ITES and BPO services ranging from information
systems integration, infrastructure design, deployment
and optimisation, hosting and managed services, disaster
recovery to contact center services, back office processing
and customer relationship management.
Demand for technology products and services remained
subdued on the domestic market on account of sluggish
economic conditions and was mainly fuelled by public sector
initiatives albeit at significantly reduced margins.
The Eurozone, our main market for niche outsourcing
services, continues to be challenged by structural economic
issues. Social and political pressure, especially in France, is
likely to constitute an impediment towards the development
of BPO activities in the short to medium term.
Our 5-year development plan starting in 2013 provides for
distribution channel enhancement in the Indian Ocean region
as well as the introduction of some innovative products and
offerings in the areas of web technologies, mobile computing,
business analytics and private cloud services whilst further
enhancing AXA CS’ visibility as a shared services center
within the Global AXA network.

PERFORMANCE REVIEW
For the period under review, the Technology
sector performed steadily with revenue inflows of
Rs 253m, a 13% increase compared to the same
period last year, and a PAT of Rs 9m.
EIS benefited from two large-scale contracts
in the ERP and infrastructure segments whilst
maintaining tight costs control mechanisms. It also
confirmed its leadership position as the only non-
inherited Microsoft Dynamics ERP Gold partner
in the Indian Ocean Islands and the sole Hewlett
Packard Tier 1 partner in Mauritius for Enterprise
Storage, Servers and Networking (ESSN).
Our continued diversification efforts initiated
during our last strategic cycle (2010-13)
combined with a more structured business
development approach have enabled us to
capture a more sizeable market share in Mauritius,
notably in the public sector, and have resulted in a
substantial decrease of our dependency towards
the Group. Revenue derived from Rogers, its
subsidiaries and associates contributed to [13 %]
of EIS’ overall inflows.
Despite the volatile economic conditions in
Europe, AXA CS reported Profits after Tax of
Rs 3m, a marked improvement as compared to
the performance of the corresponding period
last year. Those results were predominantly
achieved on account of more stringent cost
control initiatives whilst focusing on higher value
contracts. Moreover, a restructuring plan aimed
at significantly boosting the productivity of the
Company combined with ambitious business
transformation targets was finalised. This plan
is currently under way and is expected to yield
positive results as from January 2014.
Technology
REVENUE PAT
2013 2012 2013 20129 months 9 months 9 months 9 months
Rs m Rs m Rs m Rs mAxa (JV share) 56 62 3 (5)EIS 197 161 6 3 253 223 9 (2)
Ashley Coomar (Kabir) RuheeChief Executive Officer
Annual Report 201368
OUTLOOK
Scarcity of experienced professionals and
relatively high bandwidth costs on the domestic
market remain a daunting challenge in so far as the
long term development of the ITES/BPO sector
in Mauritius is concerned. If left unaddressed, an
erosion of the industry’s competitiveness vis-à-
vis other outsourcing destinations is very likely to
hamper our value proposition.
On the Technology front, EIS will further
consolidate its position in providing end-to-end
and affordable enterprise technology solutions
through the mastery of the whole ITES supply
chain from connectivity to the application layer.
Besides, our long-term commitment towards
global and state-of-the-art technology players
such as Microsoft, HP, Cisco and Intermec is
increasingly attracting interests from the Indian
Ocean Islands and some African territories as
well. Furthermore, EIS is exploring acquisition
avenues that would significantly reduce its time to
market on a number of innovative offerings whilst
accelerating its growth in the years to come.
A new operating model was defined and
agreed upon with our joint venture partner
AXA Assistance to substantially enhance the
positioning of AXA Customer Services within the
global AXA network. We are confident that our
newly defined operating model will, in the years to
come, position the Company as one of the largest
BPO employers in Mauritius and the Indian Ocean
region.
EIS is exploring acquisition avenues that would significantly reduce its time to market on a number of innovative offerings whilst accelerating its growth in the years to come.
Rogers and Company Limited 69

Annual Report 201370
Focus on SustainabilityFocus on Sustainability
Strategy for Profitable Growth
Governance at Rogers
Our People
Corporate Social Responsibility
Internal Control & Risk Management
Throughout its over-a-century existence, Rogers has been firmly committed to sustainable practices; striving for performance that delivers value for its people, shareholders and the community in general.
Annual Report 201370 Rogers and Company Limited 71
Since its incorporation in 1899, Rogers has successfully devised and steered its strategic moves to position itself as a major conglomerate in Mauritius.
Its innovative and pioneering spirit has been key in unlocking new economic opportunities for the country, especially through its active participation in founding the national carrier, Air Mauritius, and via the setting-up of the leading hotel group on the island, Beachcomber Hotels.
The footprint of the company now stretches across a wide range of sectors and 11 territories that hold valuable growth prospects. During the period under review, the Group’s shareholding in Intendance Holding Ltd, the controlling entity of the Swan Group, was increased to 37.8%, Mechanical Transport Ltd was acquired by Velogic and Foresite Property initiated the redevelopment of Centre Commercial Phoenix and Riche Terre Mall.
Furthermore, strategic reviews were successfully implemented in the Hospitality and Real Estate & Agribusiness sectors. These initiatives are vibrant proofs of the ambitions of the Group to reinforce its capabilities and set the foundations for a profitable and sustainable growth following the spin-off of the Cim Group in September 2012. The momentum will be maintained with thought and focused strategic initiatives. The Group will further leverage on its internal capabilities, its vast network of partners and clients and burgeoning business opportunities in the region to consolidate its existing sectors and expand into new markets.
CONSOLIdATE ExISTING SECTORS
It is the intention of the Group to further reinforce its position in existing sectors. The Financial Services sector, for instance, will be redeveloped with new investment products and distribution channels. Opportunities to grow the assets of Ascencia, the investment property vehicle, will be explored with the support of the parent company, ENL. The Logistics sector will leverage on its recent investments to build new capabilities and tap into attractive growth opportunities. The product offering, in the Hospitality sector, will also be reviewed and enhanced to offer unique and authentic experiences to guests.
ExPANd INTO NEW MARKETS
Amidst an environment craving for new sources for growth, the rapidly-changing business landscape in Africa now offers attractive opportunities that cannot be overlooked. Rogers is already present in 7 overseas African territories through its Aviation and Logistics sectors and will look to further expand its presence on the continent in the forthcoming years.
Aviation
INDIAN OCEAN SUB-SAHARAN AFRICA
EXPANDINTO NEW MARKETS
AVIATIONFINANCIAL SERVICESHOSPITALITYLOGISTICSPROPERTYREAL ESTATE & AGRIBUSINESSTECHNOLOGY
CONSOLIDATE EXISTING SECTORS1
2
Strategy for Profitable Growth

Annual Report 201372
Focus on Sustainability
Governance at Rogers
1. COMPLIANCE STATEMENT
For the year under review, the Board of Rogers complied with the Code of Corporate Governance for Mauritius (the ‘Code’) in most respects save that no Board or director evaluation was conducted on account of the financial year being shorter than previous financial years.
2. GOVERNANCE STRUCTURE
The governance framework and committee structure set up by the Board of the Company to help it fulfill its obligations are as follows:
Rogers and Company Limited
Board of directors
Corporate Governance Committed (CGC)
Risk Management and Audit Committee (RMAC)
Delegated authorities:
Recommends to the Board:
• Corporate governance provisions to be adopted
• Executive remuneration and individual directors’ remuneration
• Board and senior management appointments
Delegated authorities:
• Assist the Board in its duties relating to risk management, safeguarding of asset, the operation of adequate systems, control processes and the preparation of accurate financial reporting and statements in compliance with legal requirements and accounting standards.
With a view to improve the decision making process and accountability within the Group, Rogers has adopted the following governance framework with regards to its subsidiaries:
a) Separate sub-holding Boards have been set up at sectorial level;
b) Separate corporate governance and risk management and audit committees have also been set up at the level of the Real Estate Sector and Ascencia Limited due to the nature and specificity of their business; and
c) The governance, risk and audit issues relating to the business activities of the subsidiaries of the Company operating in the hospitality, logistics, property (excluding Ascencia Limited), aviation, financial services and technology sectors are overseen by the CGC and the RMAC.
Rogers and Company Limited 73
Governance at Rogers
3. BOARD
3.1. Composition of the Board
During the year, the Company was headed by a unitary board comprised of twelve directors under the chairmanship of Mr. Jean Pierre Montocchio who had no executive responsibilities. There were nine non-executive directors, six of whom satisfied the requirements of the Code for ‘independent’ directors and three executive directors.
The Chairman of the Board is elected by his fellow directors and is responsible for effectively leading the Board.
The functions and responsibilities of the Chairman and Chief Executive are separate.
The Chief Executive is contractually responsible for:
a) Developing and recommending the long-term vision and strategy of the Company;
b) Generating shareholder value;
c) Maintaining positive, reciprocal relations with relevant stakeholders;
d) Creating the appropriate HR Framework to identify the right resources, train them, make them excel in performance and maintain a positive team spirit;
e) Formulating and monitoring budgets and financials of the Company; and
f) Establishing the optimum internal control and risk management framework to safeguard the assets of the Company.
The current directors have a broad range of skills, expertise and experience ranging from accounting, banking, commercial, tourism, logistics, financial and legal matters.
In line with the Code, all directors stand for re-election on a yearly basis. The names of all current directors, their profile and categories as well as their directorships in other listed companies are set out from page 153 to page 158.
3.2. Role of the Board
The Board is accountable and responsible for the performance and affairs of the Company. Its role includes the determination, review and monitoring of the Company’s strategic plan, approval of key acquisitions/disposals and capital expenditure. The Board is also responsible for the Group’s risk management and internal control processes.
The Board promotes, encourages and expects open and frank discussions at meetings. Board meetings provide a forum for challenging and constructive debate. Directors are expected to attend each Board Meeting and each meeting of the Committees of which they are members, unless there are exceptional circumstances that prevent them from so doing. The Chairman and the Chief Executive, in collaboration with the Company Secretary, agree the meeting agendas to ensure adequate coverage of key issues during the year.
For the year under review, the Board allocated its time at the four scheduled board meetings as follows:
a) Recommended directors for appointment at the Annual Meeting of Shareholders;
b) Considered and approved the Annual Report 2012 of the Company;
c) Reviewed the performance of the Company and its Sectors against budgets;
d) Approved the four year strategic plan of the Company;
e) Approved the new composition of sub-committees of the Board;
f) Approved the change in balance sheet date of the Group;
g) Approved the unaudited quarterly results of the Group for publication;
h) Considered and approved a declaration of dividend;

Annual Report 201374
Focus on Sustainability
Governance at Rogers
i) Received regular reports from the chairmen of the RMAC and CGC;
j) Approved the external audit fees recommended by the RMAC; and
k) Approved the budget for the financial year 2013 - 2014.
In addition, an informative meeting of the non-interested directors of Rogers was held on 29 May 2013 where the directors had the opportunity to query the independent valuer and management on the proposed acquisition of some real estate of ENL group by Ascencia. A sub-committee of the Board also met on 19 June 2013 to deliberate on the four year strategic plan of the Group.
3.3. Board charter
The Board is of the view that the responsibilities of the directors should not be confined in a board charter and has consequently resolved not to adopt a charter.
3.4. Director Induction and Board access to information and advice
On appointment to the Board and/or its Committees, directors receive a comprehensive induction pack from the Company Secretary and an induction programme is organised to introduce the newly elected directors to the Group’s businesses and Senior Executives.
All directors have access to the Company Secretary and to the Senior Management team to discuss issues or to obtain information on specific areas or items to be considered at board meetings or any other area they consider appropriate.
Furthermore, the directors have access to the records of the Company and they have the right to request independent professional advice at the expense of the Company. The Board and its Committees also have the authority to secure the attendance at meetings of third parties with relevant experience and expertise as and when required.
3.5. Board performance review
A review of the performance of the Board as well as individual directors was exceptionally not carried out for the year under review as the group changed its financial year and consequently the financial year was a shorter one, that is nine months as opposed to twelve months.
3.6. Interests of directors
All directors, including the Chairman, declare their direct and indirect interests in the shares of the Company. They, moreover, follow the Model Code for Securities Transactions as detailed in Appendix 6 of the Stock Exchange of Mauritius Listing Rules whenever they deal in the shares of the Company.
For the year under review, the following directors dealt in the shares of the Company (1) Mr Guy Adam; (2) Mr Ziyad Bundhun and (3) Messrs Gilbert Espitalier-Noël, Philippe Espitalier-Noël and Jean-Pierre Montocchio through Société Helvetia Investments, as follows:
Name of Directors No. of shares acquired No. of shares disposed of
Guy Adam 123,500 nil
Ziyad Bundhun 1,000 nil
Société Helvetia Investments 100 nil
As at 30 June 2013, the following directors were directly and/or indirectly interested in the shares of the Company.
Rogers and Company Limited 75
Governance at Rogers
Table 1: Interests of directors in shares of the Company
DIRECTORS : Messrs SHARES
DIRECT INTEREST
No. of shares
INDIRECT INTEREST
%*
Guy Adam 223,500 Nil
Ziyad Bundhun 1,000 Nil
Aruna Collendavelloo 2,650 0.00
Herbert Maingard Couacaud Nil Nil
Patrick de Labauve d’Arifat Nil Nil
Eric Espitalier-Noël Nil 3.96
Hector Espitalier-Noël 10,987 4.12
Gilbert Espitalier-Noël 1,832 3.92
Philippe Espitalier-Noël 3,300 3.95
Jean Pierre Montocchio 5,259 0.00
Alain Alfred Joseph Gérard Robert Rey Nil Nil
Naderasen Pillay Veerasamy Nil Nil
*figures rounded up to 2 decimal places
3.7. Indemnities and Insurance
A directors’ and officers’ liability insurance policy has been subscribed to by the Company. The policy provides cover for the risks arising out of the acts or omissions of the directors and officers of the Company. The cover does not provide insurance against fraudulent, malicious or willful acts or omissions.
4. BOARD COMMITTEES
The Board has set up a Corporate Governance Committee and a Risk Management and Audit Committee to assist in the discharge of its duties.
The functions and responsibilities of each committee are outlined in the committee’s written terms of reference which have been approved by the Board. These terms of reference meet the requirements of the Code and are reviewed each year. They are available on the website of the Company.
The chairmen of the committees report orally on the proceedings of their committees at the board meetings of the Company and the minutes of the meetings of the RMAC are included in the Board pack distributed to Board members in advance of board meetings.
A summary of the key responsibilities of these committees as well as their composition are set out overleaf.

Annual Report 201376
Focus on Sustainability
Governance at Rogers
Table 2: Key responsibilities of committees and their composition
Committee Key responsibilities
Corporate Governance Committee (also serves as Remuneration and Nomination Committees)
a) Make recommendations to the Board on all corporate governance provisions to be adopted so that the Board remains effective and complies with prevailing corporate principles and practices.
b) Ensure that the disclosure requirements with regard to corporate governance, whether in the annual report or other reports on an ongoing basis, are in accordance with the principles of the applicable Code of Corporate Governance.
c) Make recommendations to the Board on all new Board appointments.
d) Review through a formal process the balance and effectiveness of the Board.
e) Develop a policy on executive remuneration and for fixing the remuneration and benefit packages of individual directors, within agreed terms of reference, to avoid potential conflicts of interest.
f) In relation to the remuneration of non-executives, make recommendations to the full Board.
Members: g) Up to 30 June 2013: Jean Pierre Montocchio (Chairman), Dr Guy Adam, Eric Espitalier-Noël and Philippe Espitalier-Noël
Risk Management and Audit Committee
a) Ensure that:
• All risks are reviewed and managed to an acceptable level in the business.
• All internal accounting, administrative and risk control procedures are designed to provide ongoing assurance that assets are safeguarded.
• Transactions are executed and recorded in accordance with the Company’s policy.
b) Review:
• Important accounting issues.
• Changes in legislation that will give rise to changes in practice.
• Compliance with regard to specific disclosures in the financial statements.
• Quarterly, preliminary and annual reports as well as any other financial reports.
Members: Up to 30 June 2013: Alain Rey (Chairman), Gilbert Espitalier-Noël and Patrick D’Arifat.
NB: Marcel Descroizilles was a member and Chairman of RMAC until 4 December 2012 whereupon he resigned from the Board.
Rogers and Company Limited 77
Governance at Rogers
5. SHAREHOLDERS
5.1. Holding structure and common directors
As at 30 June 2013, the substantial shareholders of the Company were Rogers Consolidated Shareholding Limited (‘RCSL’), ENL Investment Ltd (‘ENLIL’), National Pension Fund each holding respectively 53%, 6.7%, and 5.5% of the issued share capital of the Company. RCSL is wholly owned by ENLIL which is itself a subsidiary of ENL Ltd.
The common directors at each level are set out below:
Table 3: Common directors at each level
directors ENL Ltd ENLIL RCSL
Eric Espitalier-Noël * * *
Gilbert Espitalier-Noël * * *
Hector Espitalier-Noël * * *
Philippe Espitalier-Noël * - *
5.2. Share ownership
As at 30 June 2013, the Company had 2,163 shareholders.
A breakdown of the category of shareholders and the share ownership as at 30 June 2013 are set out below.
CategoryNumber of
shareholdersNumber of shares
owned % of total issued
shares
Individuals 1847 3,532,899 14.02
Insurance and assurance companies 20 1,723,585 6.84
Pensions and provident funds 35 2,356,416 9.35
Investment and trust companies 23 1,972,955 7.83
Other corporate bodies 238 15,618,675 61.97
2,163* 25,204,530 100.00
Number of sharesNumber of
shareholdersNumber of shares
owned % of total issued
shares 1- 500 1,222 186,179 0.74501 - 1000 304 233,934 0.931,001 - 5,000 445 906,360 3.605,001 - 10,000 72 507,464 2.0110,001 - 50,000 80 1,632,459 6.4850,001 - 100,000 19 1,318,711 5.23100,001 - 250,000 14 2,176,272 8.63250,001 - 500,000 3 1,119,074 4.44over 500,000 4 17,124,077 67.94
TOTAL 2,163* 25,204,530 100.00
* The above number of shareholders is indicative, due to consolidation of multi portfolios for reporting purposes. The total number of active shareholders as at 30 June 2013 is 2,287.
Annual Report 201378
Focus on Sustainability
Governance at Rogers
5.3. Ownership restrictions
The constitution of the Company provides that no shareholder, other than those existing before its adoption, shall hold more than ten per cent of the issued share capital of the Company without the prior authorisation of the Board.
5.4. Shareholder communication and events
The Company communicates to its shareholders through its Annual Report, Investors’ news, publication of unaudited quarterly results, dividend declarations and its yearly annual meeting of shareholders. The Senior Management Team of the Company meets the investor community twice yearly to share information on the Company’s strategy, financial performance, investments and disinvestments.
For the year under review, the Board approved a change in the balance sheet date of the Company from 30 September to 30 June. As a result, there have been and will be changes in the key events and shareholder communication of the Company in the manner set out below:
Month Event Month Event
September Preliminary results and Annual Report February 2nd quarter results
October Annual Meeting of Shareholders May 3rd quarter results
November 1st quarter results June
July
Dividends (declaration)
Dividends (payment)
5.5. Dividend policy
The Company has no formal dividend policy. Payment of dividends is subject to the profitability of the Company, its foreseeable investment, capital expenditure and its working capital requirements.
For the year under review, there was only one dividend declaration of Rs6/- per share (as compared to Rs4.50/- per share as interim dividend and Rs2.00/- per share as final dividend for the previous year).
5.6. Share price information
For more information on the share price of the Company, please refer to page 26.
6. STATEMENT OF REMUNERATION PHILOSOPHY
6.1. Non executive directors’ remuneration
The fees paid to non-executive directors have been recommended to the Board by the CGC (acting as the Remuneration Committee) based on a survey carried out by an independent consultant in 2004. Such fees have since been reviewed in 2007 and again in December 2012.
The fees paid to non-executive directors are calculated in the following manner: (a) a basic monthly fee; and (b) an attendance fee. Committee members are paid a monthly fee only. The Chairman of the Board and the Chairmen of the Board Committees are paid a higher monthly fee.
The fees paid to the directors of the Company for the year under review are set out in table 4 below.
6.2. Executive director’s remuneration
The executive directors are not remunerated for serving on the Board and its Committees. Their remuneration package as employees of the Company, including their performance bonus, which are in accordance with market rates, are disclosed in the table below.
Rogers and Company Limited 79
Governance at Rogers
Table 4: Attendance at board and committee meetings, annual meeting of shareholders and directors’ remuneration.
directors Board Board Corporate
Governance Committee
Board Risk Management
& Audit Committee
Annual Meeting of
Shareholders
Remuneration and benefits
(Rs)
Dr Guy Adam 4/4 3/3 n/a 1/1 430,000
Ziyad Bundhun2 4/4 n/a n/a 1/1 5,212,026
Aruna Collendavelloo2 4/4 n/a n/a 1/1 4,541,339
Herbert Couacaud 4/4 n/a n/a 1/1 295,000
Patrick D’Arifat 3/4 3 n/a 2/2 4 1/1 335,000
Eric Espitalier-Noël 4/4 3/3 n/a 1/1 430,000
Gilbert Espitalier-Noël 4/4 n/a 4/4 1/1 460,000
Hector Espitalier-Noël 4/4 n/a n/a 1/1 295,000
Philippe Espitalier-Noël 4/4 3/3 n/a 1/1 10,492,193
Jean Pierre Montocchio 4/4 3/3 n/a 1/1 735,000
Alain Rey 4/4 2 n/a 2/2 4 1/1 420,000
Naderasen Pillay Veerasamy3 4/4 n/a n/a 0/1 287,500
Marcel Descroizilles1 n/a n/a 2/2 n/a 160,000
1. resigned on 4 December 2012
2. appointed on 4 December 2012
3. appointed on 18 October 2012
4. appointed on 23 January 2013
7. HUMAN RESOURCES
7.1. Remuneration policy
Salaries are generally determined by a combination of internal equity, external competitiveness and performance of the employee.
Every two years, remuneration surveys are carried out so as benchmark with practices in the industry. This is used to review and update internal salary scales and benefits bands across the Company.
There are no reward schemes in the form of share options schemes at the level of the Company.
7.2. Profile of Function Executives and Chief Executive Officers
For the profile of the Function Executives and Chief Executive Officers, please refer to page 22.
7.3. Statement of interests of Senior Officers (excluding directors)
The table overleaf sets out the direct and indirect interests of senior officers (excluding directors) as at 30 June 2013 as required by the Securities Act 2005.
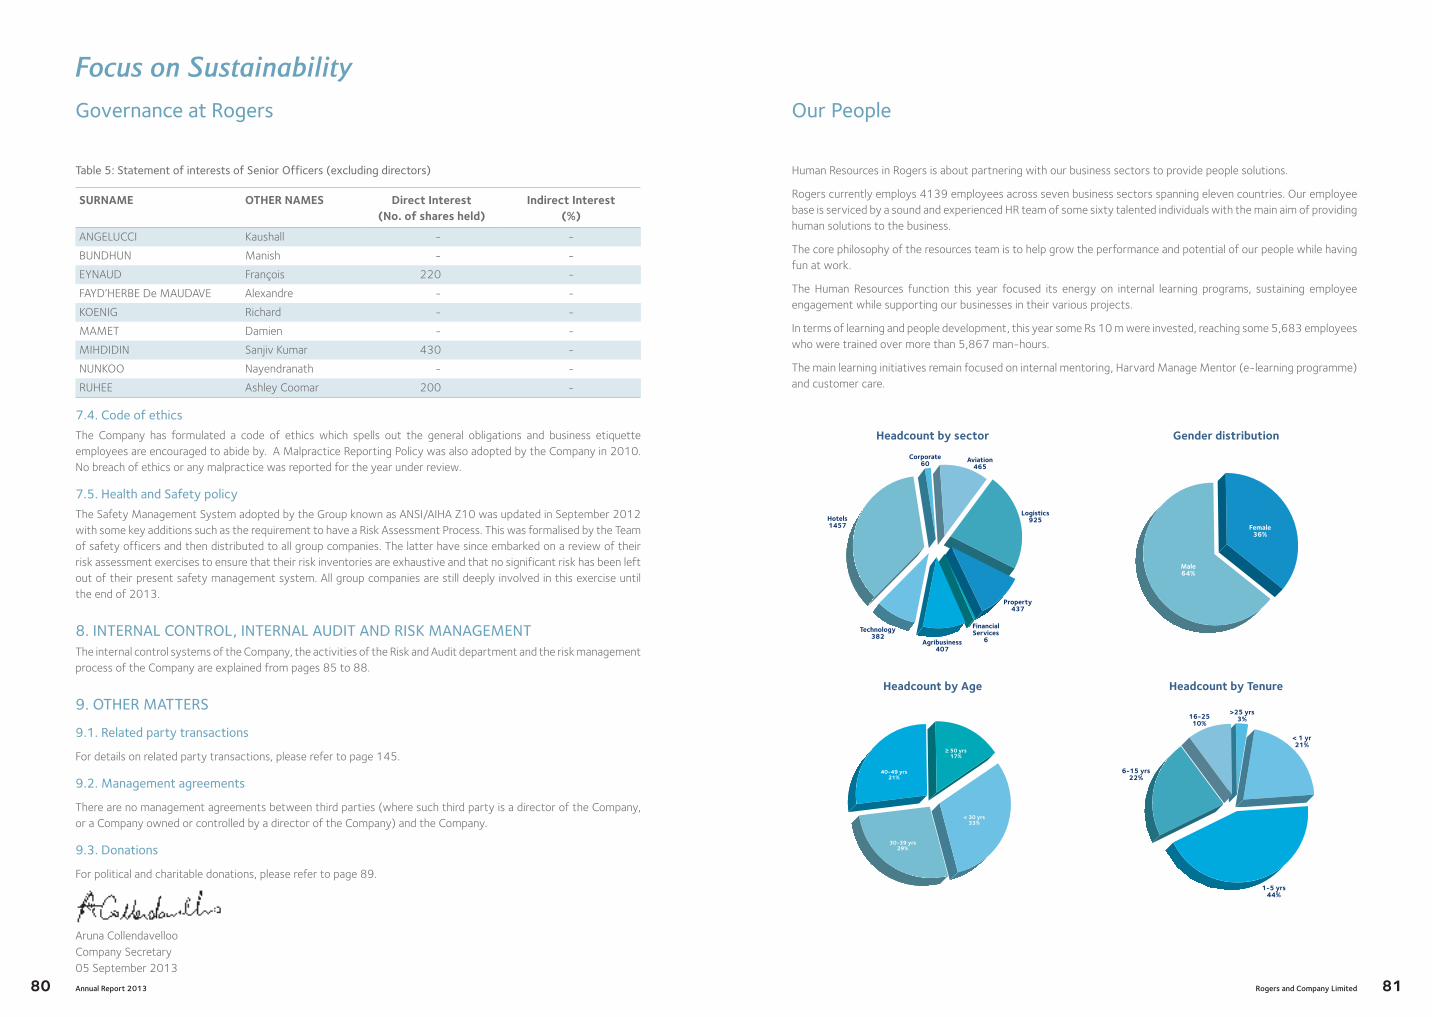
Annual Report 201380
Focus on Sustainability
Governance at Rogers
Table 5: Statement of interests of Senior Officers (excluding directors)
SURNAME OThER NAMES direct Interest (No. of shares held)
Indirect Interest (%)
ANGELUCCI Kaushall - -
BUNDHUN Manish - -
EYNAUD François 220 -
FAYD’HERBE De MAUDAVE Alexandre - -
KOENIG Richard - -
MAMET Damien - -
MIHDIDIN Sanjiv Kumar 430 -
NUNKOO Nayendranath - -
RUHEE Ashley Coomar 200 -
7.4. Code of ethics
The Company has formulated a code of ethics which spells out the general obligations and business etiquette employees are encouraged to abide by. A Malpractice Reporting Policy was also adopted by the Company in 2010. No breach of ethics or any malpractice was reported for the year under review.
7.5. Health and Safety policy
The Safety Management System adopted by the Group known as ANSI/AIHA Z10 was updated in September 2012 with some key additions such as the requirement to have a Risk Assessment Process. This was formalised by the Team of safety officers and then distributed to all group companies. The latter have since embarked on a review of their risk assessment exercises to ensure that their risk inventories are exhaustive and that no significant risk has been left out of their present safety management system. All group companies are still deeply involved in this exercise until the end of 2013.
8. INTERNAL CONTROL, INTERNAL AUDIT AND RISK MANAGEMENTThe internal control systems of the Company, the activities of the Risk and Audit department and the risk management process of the Company are explained from pages 85 to 88.
9. OTHER MATTERS
9.1. Related party transactions
For details on related party transactions, please refer to page 145.
9.2. Management agreements
There are no management agreements between third parties (where such third party is a director of the Company, or a Company owned or controlled by a director of the Company) and the Company.
9.3. Donations
For political and charitable donations, please refer to page 89.
Aruna CollendavellooCompany Secretary05 September 2013
Rogers and Company Limited 81
Our People
Human Resources in Rogers is about partnering with our business sectors to provide people solutions.
Rogers currently employs 4139 employees across seven business sectors spanning eleven countries. Our employee base is serviced by a sound and experienced HR team of some sixty talented individuals with the main aim of providing human solutions to the business.
The core philosophy of the resources team is to help grow the performance and potential of our people while having fun at work.
The Human Resources function this year focused its energy on internal learning programs, sustaining employee engagement while supporting our businesses in their various projects.
In terms of learning and people development, this year some Rs 10 m were invested, reaching some 5,683 employees who were trained over more than 5,867 man-hours.
The main learning initiatives remain focused on internal mentoring, Harvard Manage Mentor (e-learning programme) and customer care.
headcount by sector Gender distribution
Hotels1457
Technology382
Agribusiness407
FinancialServices
6
Property437
Logistics925
Aviation465
Corporate60
Male64%
Female36%
headcount by Age headcount by Tenure
40-49 yrs21%
30-39 yrs29%
< 30 yrs33%
≥ 50 yrs17%
16-2510%
6-15 yrs22%
1-5 yrs44%
< 1 yr21%
>25 yrs3%

Annual Report 201382
Focus on Sustainability
Corporate Office
The Rogers Corporate Office comprises essential functions namely: human resources, finance and investment, communication, legal, secretarial and risk and audit. Its main responsibility is to assist the various entities of the Group in the formulation, implementation and monitoring of their strategic development.
During the financial period under review, the focus of the Corporate Office was driven towards the consolidation of the Group’s current activities and the definition of new strategic development routes in the face of a changing business landscape.
The main projects steered were the formulation of a four-year strategic plan (2013-2017) together with each and every sector of the Group, the restructuring of the Group’s financing and the reinforcement of the collaboration between ENL and Rogers in the property sector.
COMMUNICATION
The Communication department is responsible for the development and execution of internal and external communication objectives with all the stakeholders of Rogers. This includes business and trade journalists, industry and financial analysts, investors, shareholders, customers, employees, and the community at large.
FINANCE AND INVESTMENT
The Finance and Investment department ensures that the Group’s financial reporting and compliance are in accordance with the requirements of International Financial Reporting Standards (IFRS) and all relevant legislations. In addition, it provides support both to the Corporate Office and to the Group’s subsidiaries in accounting, taxation, treasury management, investment appraisal, project finance and strategic initiatives.
HUMAN RESOURCES
Rogers employs 4,139 employees over eleven countries. Having a skilled and motivated employee base is key to delivering successful business strategies. The Human Resources (HR) department focuses on providing human solutions to the businesses of the Group by ensuring recruitment of talented individuals, developing vital skills, sustaining engagement at work and helping to improve performance on the job.
LEGAL
In January 2013, the activities and personnel of the Legal department were transferred to a new legal entity namely Rogers Consulting Services Ltd with a new trade name ‘Rogers Consulting’.
Rogers Consulting acts as the backbone of the Group with regards to legal, regulatory and compliance matters. It assists the Group on all strategic projects including advising on investments and disinvestments, drafting and vetting of contractual documents and registration and renewal of brands. In concert with external lawyers, it ensures that the legal interests of the Group are safeguarded.
RISK AND AUDIT
The Risk and Audit department helps the Group to accomplish its objectives by bringing a systematic, disciplined approach to evaluate and improve the effectiveness of risk management, control and governance processes. A risk-based internal auditing approach with up-to date tools and techniques is used with a view to safeguard the income and assets of the Group. Moreover, the department acts as a facilitator and assists management in identifying, evaluating, reporting and monitoring risks.
Rogers and Company Limited 83
Corporate Social Responsibility
The 2012–2013 financial year has seen a reduction in CSR and IRS villas contributions to the two group’s
foundations: i.e. Rogers Foundation and the Bel Ombre Foundation for Empowerment. The decision was taken to
right size both administrative structures in order to maximise donations to the supported projects and NGOs. Hence,
the administration of both foundations was contracted to Rogers Corporate. The nine month financial year largely
focused on concluding the HIV/AIDS engagement and ensuring the continuation of our main projects in the Bel
Ombre region.
HIV/AIDS
Six years of engagement of the Rogers Group in the fight against HIV/AIDS through prevention activities among the
15 to 24 years old, has not only had a significant impact on the spread of the virus but has also positively influenced
attitudes towards this affliction. The engagement of the Rogers Group towards this cause has demonstrated the
effectiveness of collaborative partnerships i.e. government, civil society and private sector, in a national endeavour.
Such collaboration has received the recognition of regional and international organisations such as the Global Fund,
the U.N. Global Compact, the IOC and SADC. The Group is satisfied that the resources invested have delivered the
intended results, and that time has now come to redirect Rogers’ group CSR on a new focus “The Preservation of our
Coastal Resources”.
SUSTAINING NGOs
This past year the priority for funding was set towards ensuring the sustainability of associations and projects
supporting the country’s vulnerable population. Primacy was given to ensure the running costs of social services
such as schools, old age care, handicapped, and health care as well as ensuring the sustenance of a few local artists
and environmental projects.
In the HIV/AIDs and related fields, PILS’ psycho-social support programme, Centre de Solidarité, Collectif Arc-en-
Ciel, Chrysalide and Groupe Elan were supported as well as the book Pozitif, a local recount of experiences of living
with HIV in Mauritius.
Association for the Welfare of Orphans and Handicapped, SOS Children’s village, SOS Femmes, Cheshire Home,
Transparency Mauritius, “La Ravanne” de Menwar, College Technique St Gabriel, Péreybère Sporting Club, Safire,
Caritas Solitude, Nou Nouvo Baz, Junior Achievements Mascareignes and Mouvement Autosuffisance Alimentaire
were also encouraged in their respective social and artistic activities.
Morever, a special effort was given in collaboration with the Joint Economic Council to the victims of the March
floods. Rogers’ efforts were particularly focused on coordinating and supporting the medical and psycho-social help
together with the sponsorship of house repairs for a family of Port-Louis.
Aviation – Children: Our Future
Rogers Aviation has committed itself to improving the quality of life of impoverished, abandoned and troublesome
children. As such, Centre D’Amitié of Bambous has received Rogers’ support to provide a meal day for 100 school
children a day for a period of one year and ANFEN schools network were provided running costs to continue the
Annual Report 201384
Focus on Sustainability
Corporate Social Responsibility
education of out-of-school youth. Special effort was also provided by the staff of Rogers Aviation to rehabilitate the
lodgings of 4 elderly tenants of La Rue La Poudrière damaged by the floods.
Property – supporting vulnerable groups and protecting endangered species
The property sector collaborated with the Ministry of Gender Equality, Child development and Family Welfare to set
up the first national Child Friendly Service Centre in Vacoas. Caritas Rivière Noire received funds for a Dance Academy
and a Technical school project to take care of idle adolescents in the region and Link to Life was funded for a large
scale breast cancer test campaign.
The sector also provided funds to the Mauritius Wildlife Foundation for the protection of the endangered endemic
Pink Pigeon.
Hotels – promoting a sustainable development for all
VLH is committed towards the socioeconomic development of the surrounding communities of its hotels. Veranda
Resorts’ hotels supported the ANFEN schools in northern coastal villages while Heritage Resorts continued to support
Plankton, the community recycling Plant set up through the Bel Ombre Foundation for Empowerment. The hotels,
golf and villas of the area can now recycle their plastics, cans and glass bottles, while supporting the surrounding
community with the creation of local green jobs in the south.
Logistics – supporting the Roche Bois community
Velogic has not only supported various NGOs by providing reduced price renovated containers for various projects
but has started to manufacture a new model of social house. The Polymer model Social House was constructed and
donated to a widow with two children of Cité La Cure. In addition, the Velogic staff organised a fund raising drive to
support the house relocation of the family.
Information & Technology – EIS chose to support the Association Rêve et Espoir, a school for handicapped
children located in Black River.
Real Estate & Agribusiness – support the Empowerment of Bel Ombre inhabitants
Three main projects were supported by the BOFE, namely: the Coquille Bonheur crèche, the Plankton Community
Recycling Plant and the Centre de Lecture et d’Animation Culturel of Bel Ombre. In addition, this transitional year for
BOFE has seen numerous local NGOs receiving support through the donation of equipment and assets used for the
foundation’s projects, for example, Caritas received a computer system to teach adult literacy, the MFR de Bel Ombre
received equipment and furniture for a fully functioning school and other varied donations.
Rogers and Company Limited 85
Internal Control and Risk Management
The Board has overall responsibility for the Group’s system of internal control and risk management and for reviewing their effectiveness. Through the risk management structure, the Board is able to receive assurance from the Risk Management and Audit Committee (RMAC) that the fundamental areas of risk recognition and mitigation are covered in a responsible manner. Specific companies and divisions have established their respective sub-RMAC and their respective Chairpersons report to the RMAC of Rogers.
The Risk and Audit department in turn reports to the RMAC on a quarterly basis and applies a risk based methodology to ensure that the internal audit function operates in line with internationally-recognised professional standards.
Management has the responsibility to implement and monitor risk management procedures and integrating them in the day to day operations of the entities within the Group.
Internal control
The Group’s system of internal control is designed to provide the Board with reasonable assurance that assets are safeguarded, that transactions are properly authorised and recorded, and that material frauds and other irregularities are either prevented or detected within a reasonable time.
Internal auditors monitor the operations of the internal control systems, report findings and make recommendations to Management, the RMAC and the Board. Preventive and corrective actions are taken to address internal control deficiencies and opportunities for improving the systems.
The RMAC of Rogers consists of three independent non-executive directors and attendees include the internal and external auditors, the Chief Finance and Investment Executive and the Corporate Manager – Financial Reporting. Over the period 1st October 2012 to 30th June 2013, the Committee met four times to review the Group quarterly reporting and to carry out its primary responsibility to assist the Board in carrying out its duties relating to the Group’s accounting policies, internal control, financial reporting practices, identification of and exposures to significant risks.
The broad terms of reference of the RMAC include the monitoring of the following to ensure compliance with the terms of the RMAC Charter:
• The effectiveness and performance of the external auditors and their continuing independence with regards to audit and non- audit services supplied.
• The quarterly and annual financial statements and recommend their adoption to the Board of Directors prior to filing and publication.
• The effectiveness of the internal audit function in ensuring that the roles and functions of the external audit and internal audit are sufficiently clarified and co-ordinated to provide an objective overview of the operational effectiveness of the Group systems of internal control and reporting.
• That the highest standards of behaviour are observed within the Rogers Group in all its undertakings and among all its stakeholders.
• The health, safety and environmental risk identification processes leading to sound risk management strategies within the Group’s various field of activities.
• The effectiveness of the Group internal control and risk management systems.
The Group makes use of the Rogers Guidelines and Policies Manual which embraces financial and non-financial guidelines to be followed by all Companies.
Internal Audit
The Risk and Audit department is an independent and objective function reporting to the Risk Management and Audit Committee.
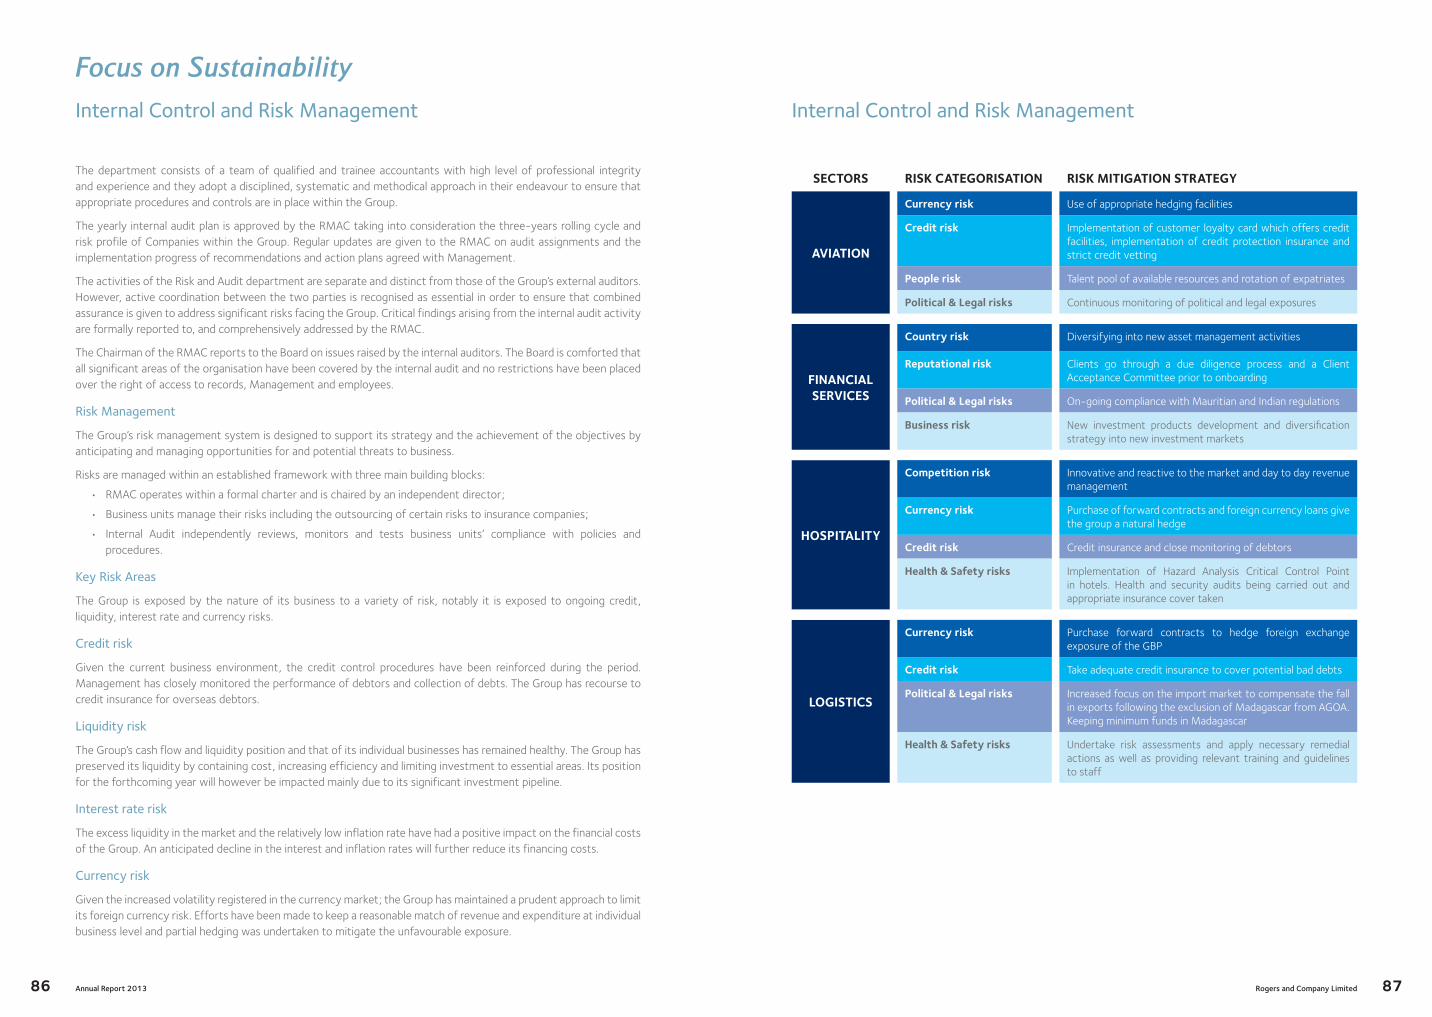
Annual Report 201386
Focus on Sustainability
Internal Control and Risk Management
The department consists of a team of qualified and trainee accountants with high level of professional integrity and experience and they adopt a disciplined, systematic and methodical approach in their endeavour to ensure that appropriate procedures and controls are in place within the Group.
The yearly internal audit plan is approved by the RMAC taking into consideration the three-years rolling cycle and risk profile of Companies within the Group. Regular updates are given to the RMAC on audit assignments and the implementation progress of recommendations and action plans agreed with Management.
The activities of the Risk and Audit department are separate and distinct from those of the Group’s external auditors. However, active coordination between the two parties is recognised as essential in order to ensure that combined assurance is given to address significant risks facing the Group. Critical findings arising from the internal audit activity are formally reported to, and comprehensively addressed by the RMAC.
The Chairman of the RMAC reports to the Board on issues raised by the internal auditors. The Board is comforted that all significant areas of the organisation have been covered by the internal audit and no restrictions have been placed over the right of access to records, Management and employees.
Risk Management
The Group’s risk management system is designed to support its strategy and the achievement of the objectives by anticipating and managing opportunities for and potential threats to business.
Risks are managed within an established framework with three main building blocks:
• RMAC operates within a formal charter and is chaired by an independent director;
• Business units manage their risks including the outsourcing of certain risks to insurance companies;
• Internal Audit independently reviews, monitors and tests business units’ compliance with policies and procedures.
Key Risk Areas
The Group is exposed by the nature of its business to a variety of risk, notably it is exposed to ongoing credit, liquidity, interest rate and currency risks.
Credit risk
Given the current business environment, the credit control procedures have been reinforced during the period. Management has closely monitored the performance of debtors and collection of debts. The Group has recourse to credit insurance for overseas debtors.
Liquidity risk
The Group’s cash flow and liquidity position and that of its individual businesses has remained healthy. The Group has preserved its liquidity by containing cost, increasing efficiency and limiting investment to essential areas. Its position for the forthcoming year will however be impacted mainly due to its significant investment pipeline.
Interest rate risk
The excess liquidity in the market and the relatively low inflation rate have had a positive impact on the financial costs of the Group. An anticipated decline in the interest and inflation rates will further reduce its financing costs.
Currency risk
Given the increased volatility registered in the currency market; the Group has maintained a prudent approach to limit its foreign currency risk. Efforts have been made to keep a reasonable match of revenue and expenditure at individual business level and partial hedging was undertaken to mitigate the unfavourable exposure.
Rogers and Company Limited 87
Internal Control and Risk Management
SECTORS RISK CATEGORISATION RISK MITIGATION STRATEGY
AVIATION
Currency risk Use of appropriate hedging facilities
Credit risk Implementation of customer loyalty card which offers credit facilities, implementation of credit protection insurance and strict credit vetting
People risk Talent pool of available resources and rotation of expatriates
Political & Legal risks Continuous monitoring of political and legal exposures
FINANCIAL SERVICES
Country risk Diversifying into new asset management activities
Reputational risk Clients go through a due diligence process and a Client Acceptance Committee prior to onboarding
Political & Legal risks On-going compliance with Mauritian and Indian regulations
Business risk New investment products development and diversification strategy into new investment markets
hOSPITALITY
Competition risk Innovative and reactive to the market and day to day revenue management
Currency risk Purchase of forward contracts and foreign currency loans give the group a natural hedge
Credit risk Credit insurance and close monitoring of debtors
health & Safety risks Implementation of Hazard Analysis Critical Control Point in hotels. Health and security audits being carried out and appropriate insurance cover taken
LOGISTICS
Currency risk Purchase forward contracts to hedge foreign exchange exposure of the GBP
Credit risk Take adequate credit insurance to cover potential bad debts
Political & Legal risks Increased focus on the import market to compensate the fall in exports following the exclusion of Madagascar from AGOA. Keeping minimum funds in Madagascar
health & Safety risks Undertake risk assessments and apply necessary remedial actions as well as providing relevant training and guidelines to staff
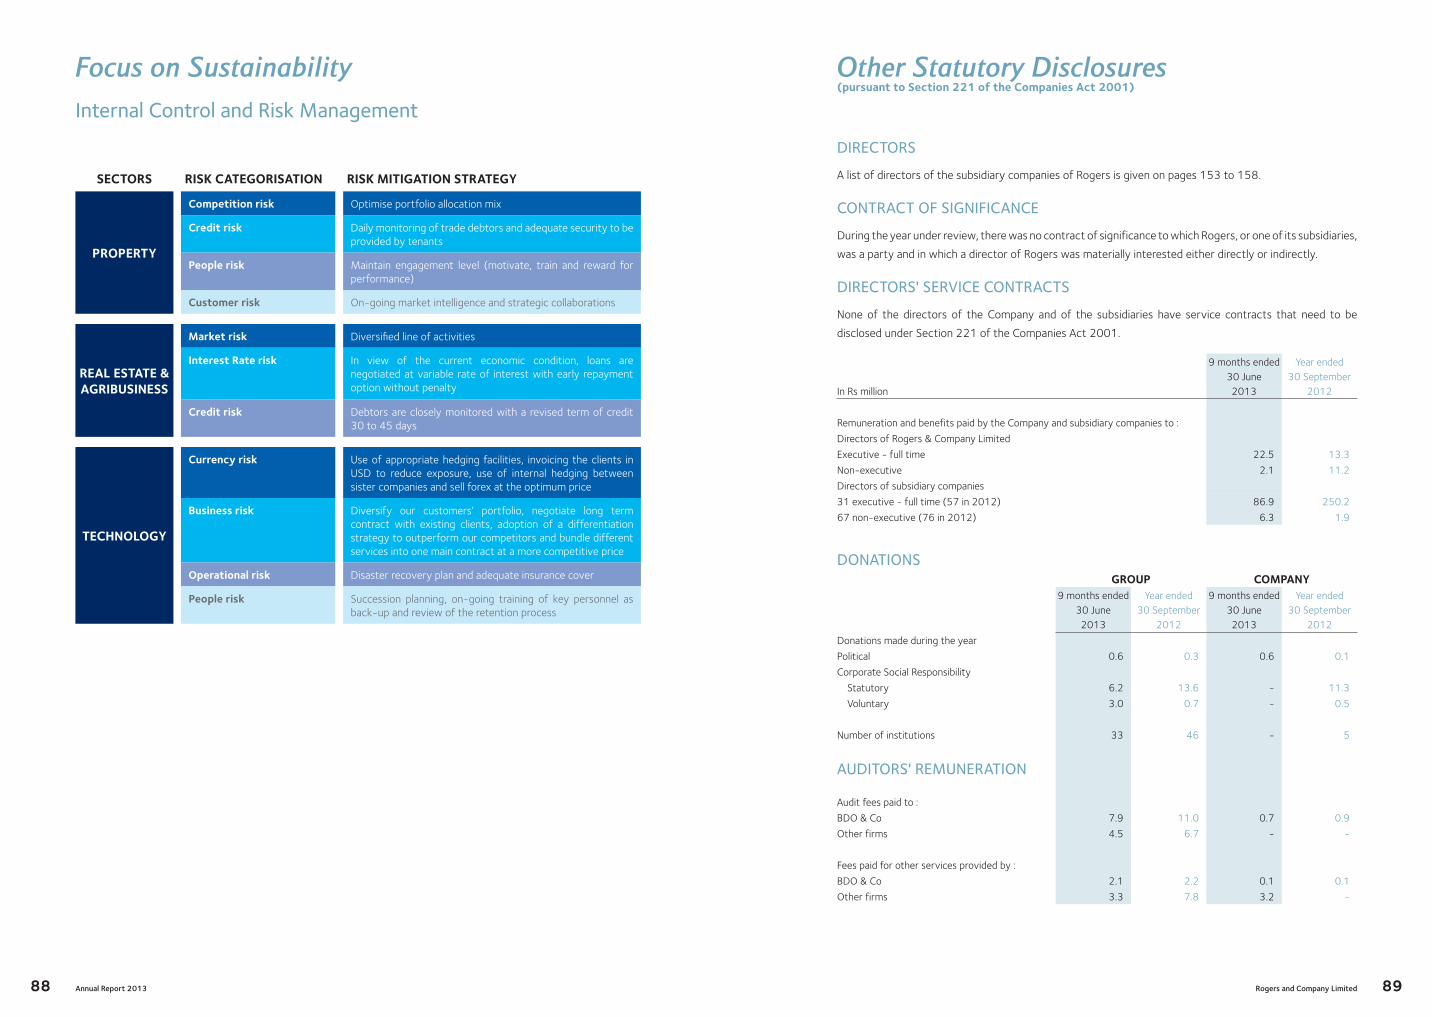
Annual Report 201388
Focus on Sustainability
Internal Control and Risk Management
SECTORS RISK CATEGORISATION RISK MITIGATION STRATEGY
PROPERTY
Competition risk Optimise portfolio allocation mix
Credit risk Daily monitoring of trade debtors and adequate security to be provided by tenants
People risk Maintain engagement level (motivate, train and reward for performance)
Customer risk On-going market intelligence and strategic collaborations
REAL ESTATE & AGRIBUSINESS
Market risk Diversified line of activities
Interest Rate risk In view of the current economic condition, loans are negotiated at variable rate of interest with early repayment option without penalty
Credit risk Debtors are closely monitored with a revised term of credit 30 to 45 days
TEChNOLOGY
Currency risk Use of appropriate hedging facilities, invoicing the clients in USD to reduce exposure, use of internal hedging between sister companies and sell forex at the optimum price
Business risk Diversify our customers’ portfolio, negotiate long term contract with existing clients, adoption of a differentiation strategy to outperform our competitors and bundle different services into one main contract at a more competitive price
Operational risk Disaster recovery plan and adequate insurance cover
People risk Succession planning, on-going training of key personnel as back-up and review of the retention process
DIRECTORS
A list of directors of the subsidiary companies of Rogers is given on pages 153 to 158.
CONTRACT OF SIGNIFICANCE
During the year under review, there was no contract of significance to which Rogers, or one of its subsidiaries,
was a party and in which a director of Rogers was materially interested either directly or indirectly.
DIRECTORS' SERVICE CONTRACTS
None of the directors of the Company and of the subsidiaries have service contracts that need to be
disclosed under Section 221 of the Companies Act 2001.
In Rs million
9 months ended30 June 2013
Year ended30 September
2012
Remuneration and benefits paid by the Company and subsidiary companies to :
Directors of Rogers & Company Limited
Executive - full time 22.5 13.3
Non-executive 2.1 11.2
Directors of subsidiary companies
31 executive - full time (57 in 2012) 86.9 250.2
67 non-executive (76 in 2012) 6.3 1.9
DONATIONSGROUP COMPANY
9 months ended30 June 2013
Year ended30 September
2012
9 months ended30 June 2013
Year ended30 September
2012
Donations made during the year
Political 0.6 0.3 0.6 0.1
Corporate Social Responsibility
Statutory 6.2 13.6 - 11.3
Voluntary 3.0 0.7 - 0.5
Number of institutions 33 46 - 5
AUDITORS' REMUNERATION
Audit fees paid to :
BDO & Co 7.9 11.0 0.7 0.9
Other firms 4.5 6.7 - -
Fees paid for other services provided by :
BDO & Co 2.1 2.2 0.1 0.1
Other firms 3.3 7.8 3.2 -
Other Statutory Disclosures(pursuant to Section 221 of the Companies Act 2001)
Rogers and Company Limited 89
FINANCIAL STATEMENTS
The directors of Rogers are responsible for the integrity of the audited financial statements of the Group
and the Company and the objectivity of the other information presented in these statements.
The Board confirms that, in preparing the audited financial statements, it has:
(i) selected suitable accounting policies and applied them consistently;
(ii) made judgements and estimates that are reasonable and prudent;
(iii) stated whether applicable accounting standards have been followed, subject to any material departures
explained in the financial statements;
(iv) kept proper accounting records which disclose with reasonable accuracy at any time the financial
position of the Company;
(v) safeguarded the assets of the Company by maintaining internal accounting and administrative control
systems and procedures; and
(vi) taken reasonable steps for the prevention and detection of fraud and other irregularities.
GOING CONCERN STATEMENT
On the basis of current projections, we are confident that the Group and the Company have adequate
resources to continue operating for the foreseeable future and consider that it is appropriate that the going
concern basis in preparing the financial statements be adopted.
INTERNAL CONTROL AND RISK MANAGEMENT
The Board is responsible for the system of Internal Control and Risk Management for the Company and its
subsidiaries. The Group is committed to continuously maintain a sound system of risk management and
adequate control procedures with a view to safeguarding the assets of the Group. The Board believes that
the Group’s systems of internal control and risk management provide reasonable assurance that control and
risk issues are identified, reported on and dealt with appropriately.
DONATIONS
For details on political and charitable donations made by the Company, please refer to page 89.
GOVERNANCE
The Board strives to apply principles of good governance within the Company and its subsidiaries.
AUDITED FINANCIAL STATEMENTS
The audited financial statements of the Group and the Company which appear on pages 93 to 151 were
approved by the Board on 05 September 2013 and are signed on their behalf by:
Jean Pierre Montocchio Philippe Espitalier-Noël Chairman Director and CEO
Directors’ Report
Annual Report 201390
This report is made solely to the members of Rogers and Company Limited (the “Company”), as a body, in accordance with Section 205 of the Companies Act 2001. Our audit work has been undertaken so that we might state to the Company’s members those matters we are required to state to them in an auditors’ report and for no other purpose. To the fullest extent permitted by law, we do not accept or assume responsibility to anyone other than the Company and the Company’s members as a body, for our audit work, for this report, or for the opinions we have formed.
Report on the Financial Statements
We have audited the financial statements of Rogers and Company Limited and its subsidiaries (the “Group”) and the Company’s separate financial statements on pages 93 to 151 which comprise the statements of financial position at June 30, 2013, and the statements of profit or loss and other comprehensive income, statements of changes in equity and cash flow statements for the period then ended, and a summary of significant accounting policies and other explanatory notes.
directors’ Responsibility for the Financial Statements
The directors are responsible for the preparation and fair presentation of these financial statements in accordance with International Financial Reporting Standards and in compliance with the requirements of the Companies Act 2001, and for such internal control as the directors determine is necessary to enable the preparation of financial statements that are free from material misstatement, whether due to fraud or error.
Auditors’ Responsibility
Our responsibility is to express an opinion on these financial statements based on our audit. We conducted our audit in accordance with International Standards on Auditing. Those Standards require that we comply with ethical requirements and plan and perform the audit to obtain reasonable assurance whether the financial statements are free from material misstatement.
An audit involves performing procedures to obtain audit evidence about the amounts and disclosures in the financial statements. The procedures selected depend on the auditors’ judgement, including the assessment of the risks of material misstatement of the financial statements, whether due to fraud or error. In making those risk assessments, the auditors consider internal control relevant to the Company’s preparation and fair presentation of the financial statements in order to design audit procedures that are appropriate in the circumstances, but not for the purpose of expressing an opinion on the effectiveness of the Company’s internal control. An audit also includes evaluating the appropriateness of accounting policies used and the reasonableness of accounting estimates made by the directors, as well as evaluating the overall presentation of the financial statements.
We believe that the audit evidence we have obtained is sufficient and appropriate to provide a basis for our audit opinion.
Opinion
In our opinion, the financial statements on pages 93 to 151 give a true and fair view of the financial position of the Group and of the Company at June 30, 2013, and their financial performance and their cash flows for the period then ended in accordance with International Financial Reporting Standards and comply with the Companies Act 2001.
Independent Auditors’ Report
Rogers and Company Limited 91
Report on Other Legal and Regulatory Requirements
Companies Act 2001
We have no relationship with, or interests in, the Company or any of its subsidiaries, other than in our capacity as auditors, tax and business advisers and dealings in the ordinary course of business.
We have obtained all information and explanations we have required.
In our opinion, proper accounting records have been kept by the Company as far as it appears from our examination of those records.
Financial Reporting Act 2004
The Directors are responsible for preparing the corporate governance report. Our responsibility is to report on the extent of compliance with the Code of Corporate Governance as disclosed in the annual report and on whether the disclosure is consistent with the requirements of the Code.
In our opinion, the disclosure in the annual report is consistent with the requirements of the Code.
BdO & Co Ameenah Ramdin FCCA, ACA
Chartered Accountants Licensed by FRC
Port Louis,
Mauritius.
05 September 2013
Independent Auditors’ Report
Annual Report 201392
Financial Statements
These financial statements have been approved for issue by the Board of Directors on 05 September 2013.
Jean Pierre Montocchio Philippe Espitalier-Noël
Chairman Director & CEO
94 Statements of Profit or Loss
95 Statements of Profit or Loss and Other Comprehensive Income
96 Statements of Financial Position
97 Statements of Changes in Equity
98 Statements of Cash Flows
99 Explanatory Notes
Contents
Rogers and Company Limited 93
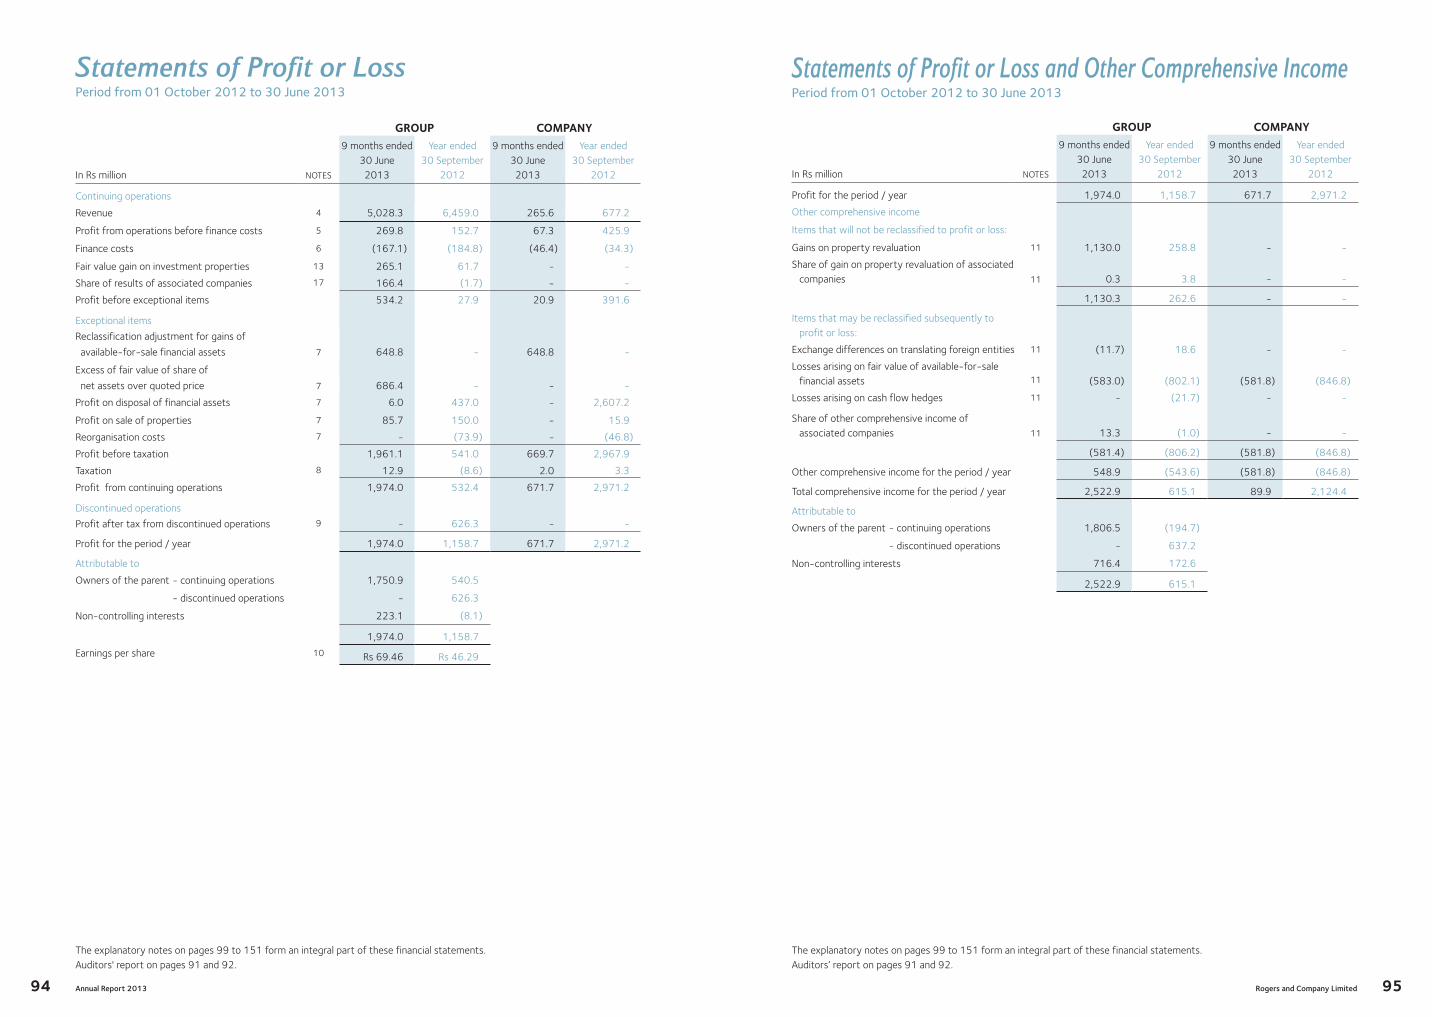
Statements of Profit or LossPeriod from 01 October 2012 to 30 June 2013
GROUP COMPANY
In Rs million NOTES
9 months ended 30 June 2013
Year ended 30 September
2012
9 months ended 30 June 2013
Year ended 30 September
2012
Continuing operations
Revenue 4 5,028.3 6,459.0 265.6 677.2
Profit from operations before finance costs 5 269.8 152.7 67.3 425.9
Finance costs 6 (167.1) (184.8) (46.4) (34.3)
Fair value gain on investment properties 13 265.1 61.7 - -
Share of results of associated companies 17 166.4 (1.7) - -
Profit before exceptional items 534.2 27.9 20.9 391.6
Exceptional items
Reclassification adjustment for gains of
available-for-sale financial assets 7 648.8 - 648.8 -
Excess of fair value of share of
net assets over quoted price 7 686.4 - - -
Profit on disposal of financial assets 7 6.0 437.0 - 2,607.2
Profit on sale of properties 7 85.7 150.0 - 15.9
Reorganisation costs 7 - (73.9) - (46.8)
Profit before taxation 1,961.1 541.0 669.7 2,967.9
Taxation 8 12.9 (8.6) 2.0 3.3
Profit from continuing operations 1,974.0 532.4 671.7 2,971.2
Discontinued operations
Profit after tax from discontinued operations 9 - 626.3 - -
Profit for the period / year 1,974.0 1,158.7 671.7 2,971.2
Attributable to
Owners of the parent - continuing operations 1,750.9 540.5
- discontinued operations - 626.3
Non-controlling interests 223.1 (8.1)
1,974.0 1,158.7
Earnings per share 10 Rs 69.46 Rs 46.29
The explanatory notes on pages 99 to 151 form an integral part of these financial statements. Auditors' report on pages 91 and 92.
Annual Report 201394
Statements of Profit or Loss and Other Comprehensive IncomePeriod from 01 October 2012 to 30 June 2013
GROUP COMPANY
In Rs million NOTES
9 months ended 30 June 2013
Year ended 30 September
2012
9 months ended 30 June 2013
Year ended 30 September
2012
Profit for the period / year 1,974.0 1,158.7 671.7 2,971.2
Other comprehensive income
Items that will not be reclassified to profit or loss:
Gains on property revaluation 11 1,130.0 258.8 - -
Share of gain on property revaluation of associated companies 11 0.3 3.8 - -
1,130.3 262.6 - -
Items that may be reclassified subsequently to profit or loss:
Exchange differences on translating foreign entities 11 (11.7) 18.6 - -
Losses arising on fair value of available-for-sale financial assets 11 (583.0) (802.1) (581.8) (846.8)
Losses arising on cash flow hedges 11 - (21.7) - -
Share of other comprehensive income of associated companies 11 13.3 (1.0) - -
(581.4) (806.2) (581.8) (846.8)
Other comprehensive income for the period / year 548.9 (543.6) (581.8) (846.8)
Total comprehensive income for the period / year 2,522.9 615.1 89.9 2,124.4
Attributable to
Owners of the parent - continuing operations 1,806.5 (194.7)
- discontinued operations - 637.2
Non-controlling interests 716.4 172.6
2,522.9 615.1
The explanatory notes on pages 99 to 151 form an integral part of these financial statements. Auditors’ report on pages 91 and 92.
Rogers and Company Limited 95
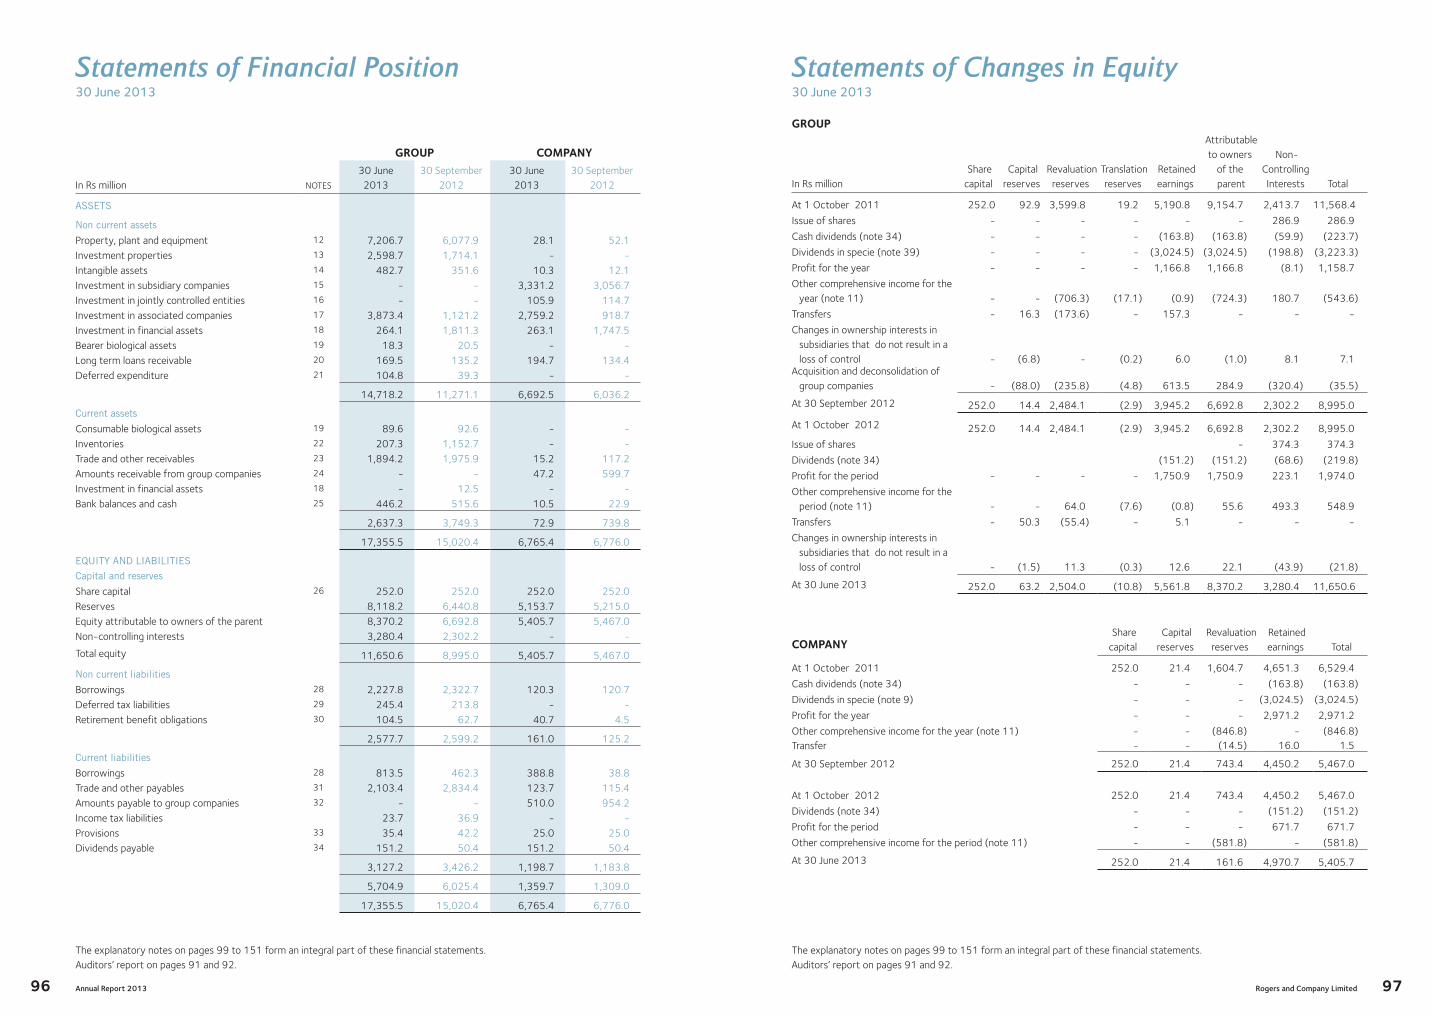
Statements of Financial Position 30 June 2013
GROUP COMPANY
In Rs million NOTES
30 June 2013
30 September 2012
30 June 2013
30 September 2012
ASSETS
Non current assets
Property, plant and equipment 12 7,206.7 6,077.9 28.1 52.1 Investment properties 13 2,598.7 1,714.1 - - Intangible assets 14 482.7 351.6 10.3 12.1 Investment in subsidiary companies 15 - - 3,331.2 3,056.7 Investment in jointly controlled entities 16 - - 105.9 114.7 Investment in associated companies 17 3,873.4 1,121.2 2,759.2 918.7 Investment in financial assets 18 264.1 1,811.3 263.1 1,747.5 Bearer biological assets 19 18.3 20.5 - - Long term loans receivable 20 169.5 135.2 194.7 134.4 Deferred expenditure 21 104.8 39.3 - -
14,718.2 11,271.1 6,692.5 6,036.2
Current assets
Consumable biological assets 19 89.6 92.6 - - Inventories 22 207.3 1,152.7 - - Trade and other receivables 23 1,894.2 1,975.9 15.2 117.2 Amounts receivable from group companies 24 - - 47.2 599.7 Investment in financial assets 18 - 12.5 - -Bank balances and cash 25 446.2 515.6 10.5 22.9
2,637.3 3,749.3 72.9 739.8
17,355.5 15,020.4 6,765.4 6,776.0
EQUITY AND LIABILITIES
Capital and reserves
Share capital 26 252.0 252.0 252.0 252.0 Reserves 8,118.2 6,440.8 5,153.7 5,215.0 Equity attributable to owners of the parent 8,370.2 6,692.8 5,405.7 5,467.0 Non-controlling interests 3,280.4 2,302.2 - -
Total equity 11,650.6 8,995.0 5,405.7 5,467.0
Non current liabilities
Borrowings 28 2,227.8 2,322.7 120.3 120.7 Deferred tax liabilities 29 245.4 213.8 - - Retirement benefit obligations 30 104.5 62.7 40.7 4.5
2,577.7 2,599.2 161.0 125.2
Current liabilities
Borrowings 28 813.5 462.3 388.8 38.8 Trade and other payables 31 2,103.4 2,834.4 123.7 115.4 Amounts payable to group companies 32 - - 510.0 954.2 Income tax liabilities 23.7 36.9 - -Provisions 33 35.4 42.2 25.0 25.0 Dividends payable 34 151.2 50.4 151.2 50.4
3,127.2 3,426.2 1,198.7 1,183.8
5,704.9 6,025.4 1,359.7 1,309.0
17,355.5 15,020.4 6,765.4 6,776.0
The explanatory notes on pages 99 to 151 form an integral part of these financial statements. Auditors’ report on pages 91 and 92.
Annual Report 201396
Statements of Changes in Equity 30 June 2013
GROUP
In Rs million Share capital
Capital reserves
Revaluation reserves
Translation reserves
Retained earnings
Attributable to owners
of the parent
Non-Controlling Interests Total
At 1 October 2011 252.0 92.9 3,599.8 19.2 5,190.8 9,154.7 2,413.7 11,568.4
Issue of shares - - - - - - 286.9 286.9
Cash dividends (note 34) - - - - (163.8) (163.8) (59.9) (223.7)
Dividends in specie (note 39) - - - - (3,024.5) (3,024.5) (198.8) (3,223.3)
Profit for the year - - - - 1,166.8 1,166.8 (8.1) 1,158.7
Other comprehensive income for the year (note 11) - - (706.3) (17.1) (0.9) (724.3) 180.7 (543.6)
Transfers - 16.3 (173.6) - 157.3 - - -
Changes in ownership interests in subsidiaries that do not result in a loss of control - (6.8) - (0.2) 6.0 (1.0) 8.1 7.1
Acquisition and deconsolidation of group companies - (88.0) (235.8) (4.8) 613.5 284.9 (320.4) (35.5)
At 30 September 2012 252.0 14.4 2,484.1 (2.9) 3,945.2 6,692.8 2,302.2 8,995.0
At 1 October 2012 252.0 14.4 2,484.1 (2.9) 3,945.2 6,692.8 2,302.2 8,995.0
Issue of shares - 374.3 374.3
Dividends (note 34) (151.2) (151.2) (68.6) (219.8)
Profit for the period - - - - 1,750.9 1,750.9 223.1 1,974.0
Other comprehensive income for the period (note 11) - - 64.0 (7.6) (0.8) 55.6 493.3 548.9
Transfers - 50.3 (55.4) - 5.1 - - -
Changes in ownership interests in subsidiaries that do not result in a loss of control - (1.5) 11.3 (0.3) 12.6 22.1 (43.9) (21.8)
At 30 June 2013 252.0 63.2 2,504.0 (10.8) 5,561.8 8,370.2 3,280.4 11,650.6
COMPANY Share capital
Capital reserves
Revaluation reserves
Retained earnings Total
At 1 October 2011 252.0 21.4 1,604.7 4,651.3 6,529.4
Cash dividends (note 34) - - - (163.8) (163.8)
Dividends in specie (note 9) - - - (3,024.5) (3,024.5)
Profit for the year - - - 2,971.2 2,971.2
Other comprehensive income for the year (note 11) - - (846.8) - (846.8)Transfer - - (14.5) 16.0 1.5
At 30 September 2012 252.0 21.4 743.4 4,450.2 5,467.0
At 1 October 2012 252.0 21.4 743.4 4,450.2 5,467.0
Dividends (note 34) - - - (151.2) (151.2)
Profit for the period - - - 671.7 671.7
Other comprehensive income for the period (note 11) - - (581.8) - (581.8)
At 30 June 2013 252.0 21.4 161.6 4,970.7 5,405.7
The explanatory notes on pages 99 to 151 form an integral part of these financial statements. Auditors’ report on pages 91 and 92.
Rogers and Company Limited 97
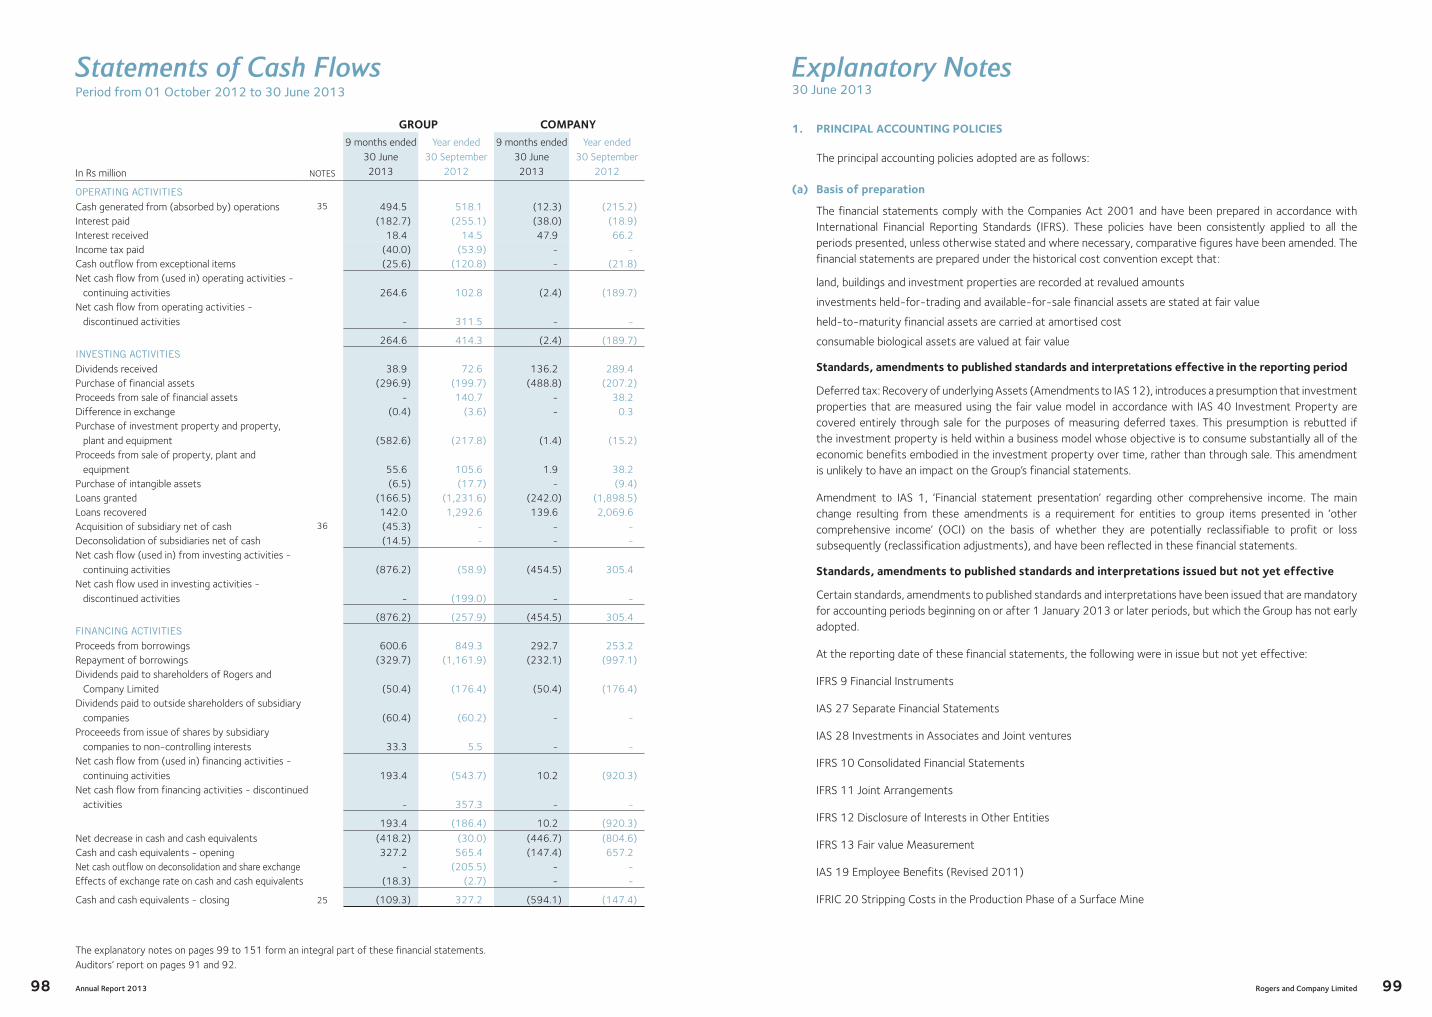
Statements of Cash Flows Period from 01 October 2012 to 30 June 2013
GROUP COMPANY
In Rs million NOTES
9 months ended 30 June 2013
Year ended 30 September
2012
9 months ended 30 June 2013
Year ended 30 September
2012
OPERATING ACTIVITIES
Cash generated from (absorbed by) operations 35 494.5 518.1 (12.3) (215.2)Interest paid (182.7) (255.1) (38.0) (18.9)Interest received 18.4 14.5 47.9 66.2 Income tax paid (40.0) (53.9) - -Cash outflow from exceptional items (25.6) (120.8) - (21.8)Net cash flow from (used in) operating activities -
continuing activities 264.6 102.8 (2.4) (189.7)Net cash flow from operating activities -
discontinued activities - 311.5 - -
264.6 414.3 (2.4) (189.7)INVESTING ACTIVITIES
Dividends received 38.9 72.6 136.2 289.4 Purchase of financial assets (296.9) (199.7) (488.8) (207.2)Proceeds from sale of financial assets - 140.7 - 38.2 Difference in exchange (0.4) (3.6) - 0.3 Purchase of investment property and property,
plant and equipment (582.6) (217.8) (1.4) (15.2)Proceeds from sale of property, plant and
equipment 55.6 105.6 1.9 38.2 Purchase of intangible assets (6.5) (17.7) - (9.4)Loans granted (166.5) (1,231.6) (242.0) (1,898.5)Loans recovered 142.0 1,292.6 139.6 2,069.6 Acquisition of subsidiary net of cash 36 (45.3) - - - Deconsolidation of subsidiaries net of cash (14.5) - - - Net cash flow (used in) from investing activities -
continuing activities (876.2) (58.9) (454.5) 305.4 Net cash flow used in investing activities -
discontinued activities - (199.0) - -
(876.2) (257.9) (454.5) 305.4 FINANCING ACTIVITIES
Proceeds from borrowings 600.6 849.3 292.7 253.2 Repayment of borrowings (329.7) (1,161.9) (232.1) (997.1)Dividends paid to shareholders of Rogers and
Company Limited (50.4) (176.4) (50.4) (176.4)Dividends paid to outside shareholders of subsidiary
companies (60.4) (60.2) - - Proceeeds from issue of shares by subsidiary
companies to non-controlling interests 33.3 5.5 - - Net cash flow from (used in) financing activities -
continuing activities 193.4 (543.7) 10.2 (920.3)Net cash flow from financing activities - discontinued
activities - 357.3 - -
193.4 (186.4) 10.2 (920.3)Net decrease in cash and cash equivalents (418.2) (30.0) (446.7) (804.6)Cash and cash equivalents - opening 327.2 565.4 (147.4) 657.2 Net cash outflow on deconsolidation and share exchange - (205.5) - -Effects of exchange rate on cash and cash equivalents (18.3) (2.7) - -
Cash and cash equivalents - closing 25 (109.3) 327.2 (594.1) (147.4)
The explanatory notes on pages 99 to 151 form an integral part of these financial statements. Auditors’ report on pages 91 and 92.
Annual Report 201398
Explanatory Notes30 June 2013
Rogers and Company Limited 99
1. PRINCIPAL ACCOUNTING POLICIES
The principal accounting policies adopted are as follows:
(a) Basis of preparation
The financial statements comply with the Companies Act 2001 and have been prepared in accordance with International Financial Reporting Standards (IFRS). These policies have been consistently applied to all the periods presented, unless otherwise stated and where necessary, comparative figures have been amended. The financial statements are prepared under the historical cost convention except that:
land, buildings and investment properties are recorded at revalued amounts
investments held-for-trading and available-for-sale financial assets are stated at fair value
held-to-maturity financial assets are carried at amortised cost
consumable biological assets are valued at fair value
Standards, amendments to published standards and interpretations effective in the reporting period
Deferred tax: Recovery of underlying Assets (Amendments to IAS 12), introduces a presumption that investment properties that are measured using the fair value model in accordance with IAS 40 Investment Property are covered entirely through sale for the purposes of measuring deferred taxes. This presumption is rebutted if the investment property is held within a business model whose objective is to consume substantially all of the economic benefits embodied in the investment property over time, rather than through sale. This amendment is unlikely to have an impact on the Group’s financial statements.
Amendment to IAS 1, ‘Financial statement presentation’ regarding other comprehensive income. The main change resulting from these amendments is a requirement for entities to group items presented in ‘other comprehensive income’ (OCI) on the basis of whether they are potentially reclassifiable to profit or loss subsequently (reclassification adjustments), and have been reflected in these financial statements.
Standards, amendments to published standards and interpretations issued but not yet effective
Certain standards, amendments to published standards and interpretations have been issued that are mandatory for accounting periods beginning on or after 1 January 2013 or later periods, but which the Group has not early adopted.
At the reporting date of these financial statements, the following were in issue but not yet effective:
IFRS 9 Financial Instruments
IAS 27 Separate Financial Statements
IAS 28 Investments in Associates and Joint ventures
IFRS 10 Consolidated Financial Statements
IFRS 11 Joint Arrangements
IFRS 12 Disclosure of Interests in Other Entities
IFRS 13 Fair value Measurement
IAS 19 Employee Benefits (Revised 2011)
IFRIC 20 Stripping Costs in the Production Phase of a Surface Mine

Explanatory Notes30 June 2013
Annual Report 2013100
1. PRINCIPAL ACCOUNTING POLICIES (CONTd)
(a) Basis of preparation (contd)
Standards, amendments to published standards and interpretations issued but not yet effective (contd)
Disclosures – Offsetting Financial Assets and Financial Liabilities (Amendments to IFRS 7)
IAS 32 Offsetting Financial Assets and Financial Liabilities (Amendments to IAS 32)
Amendment to IFRS 1 (Government Loans)
Annual Improvements 2009-2011 Cycle
Consolidated Financial Statements, Joint Arrangements and Disclosure of Interests in Other Entities: Transition Guidance Investment Entities (Amendments to IFRS 10, IFRS 12 and IAS 27)
IFRIC 21: Levies
Recoverable Amount Disclosures for Non-financial Assets (Amendments to IAS 36)
Novation of Derivatives and Continuation of Hedge Accounting (Amendments to IAS 39)
Where relevant, the Group and the Company are still evaluating the effect of these standards, amendments to published and interpretations issued but not yet effective on the presentation of its financial statements.
(b) Principles of consolidation
The consolidated financial statements include the company, its subsidiaries, jointly controlled entities and associated companies. The results of subsidiaries, jointly controlled entities and associated companies acquired or disposed of during the period are included in the consolidated Statement of Profit or Loss and Statement of Profit or Loss and Other Comprehensive Income from the date of their acquisition or up to the date of their disposal. The consolidated financial statements have been prepared in accordance with the acquisition method. The cost of an acquisition is measured as the fair value of the assets given, equity instruments issued and liabilities incurred plus costs directly attributable to the acquisition. The excess of the cost of acquisition over the fair value of the net assets acquired is recorded as goodwill. If the cost of acquisition is less than the fair value of the net assets acquired, the difference is recognised in the Statement of Profit or Loss of the current year. The consideration for the acquisition includes contingent consideration arrangement. The results of subsidiaries which are not consolidated are brought into the financial statements to the extent of dividends received. Where a business combination is achieved in stages, the Group’s previously held interests in the acquired entity are remeasured to fair value,with the resulting gain or loss recognised in Statement of Profit or Loss. Amounts previously recognised in Other Comprehensive Income are reclassified to profit or loss, where such treatment would be appropriate if that interest were disposed. Changes in the Group’s interests in subsidiaries that do not result in a loss of control are accounted for as equity transactions. The carrying amounts of the Group’s interests and the non controlling interests are adjusted to reflect the changes in their relative interests in the subsidiaries. Any difference between the amount by which the non controlling interests are adjusted and the fair value of the consideration paid or received is recognised in equity attrbutable to owners of the company. When the Group disposes or loses control of a subsidiary, the profit or loss is calculated as the difference between the consideration received, grossed up for any non controlling interest, and the fair value of assets (including goodwill) and liabilities. Amounts previously recognised in Other Comprehensive Income are reclassified to profit or loss.
Rogers and Company Limited 101
1. PRINCIPAL ACCOUNTING POLICIES (CONTd)
(b) Principles of consolidation (contd)
In preparing consolidated financial statements, the Group combines the financial statements of the parent and its subsidiaries on a line by line by adding together like items of assets, liabilities, equity, income and expenses. Intragroup balances and transactions, including income, expenses and dividends are eliminated in full.
Interest in jointly controlled entities is consolidated on a line-by-line basis using proportionate consolidation. Under this method, the appropriate share of the income, expenses, assets and liabilities of the jointly controlled entities is included in the relevant components of the financial statements.
Investments in associated companies are accounted for under the equity method. Under this method, the investment in an associate is initially recognised at cost and the carrying amount is increased or decreased to recognise the Group’s share of the profit or loss of the associate after the date of acquisition. The Group’s share of its associates’ post acquisition profits or losses is recognised in the Statement of profit or loss and its share of post acquisition movements in reserves in Other Comprehensive Income.
Goodwill arising on the acquisition of an associate is included with the carrying amount of the associate and tested annually for impairment. When the Group’s share of losses exceeds the carrying amount of the investment, the latter is reported at nil value. Recognition of the Group’s share of losses is discontinued except to the extent of the Group’s legal and constructive obligations contracted on behalf of the associate. If the associate subsequently reports profits, the Group resumes recognising its share of those profits after accounting for its share of unrecognised past losses. Unrealised profits and losses are eliminated to the extent of the Group’s interest in the associate.
The Group discontinues the use of the equity method from the date when it ceases to have significant influence over an associate and the investment will then be measured at fair value. The Group recognises in the Statement of profit or loss the difference between the fair value of retained investment including any proceeds from disposal and the carrying amount of the investment at the date when significant influence is lost.
In the separate financial statements of the Company, investments in subsidiary companies, jointly controlled entities and associated companies are carried at cost. The carrying amount is reduced to recognise any impairment in the value of individual investments.
(c) Property, plant and equipment
Property, plant and equipment is stated at cost, except for land and buildings, net of accumulated depreciation and accumulated impairment losses, if any.
Such cost includes the cost of replacing part of the property, plant and equipment and borrowing costs for long term construction projects if the recognition criteria are met. When significant parts of property, plant and equipment are required to be replaced at intervals, the Group recognises such parts as individual assets with specific useful lives and depreciation, respectively. Likewise, when a major inspection is performed, its cost is recognised in the carrying amount of the plant and equipment as a replacement if the recognition criteria are satisfied. All other repair and maintenance costs are recognised in the Statement of profit or loss as incurred.

Explanatory Notes30 June 2013
Annual Report 2013102
1. PRINCIPAL ACCOUNTING POLICIES (CONTd)
(c) Property, plant and equipment (contd)
An item of property, plant and equipment and any significant part initially recognised is derecognised upon disposal or when no future economic benefits are expected from its use or disposal. Any gain or loss arising on derecognition of the asset (calculated as the difference between the net disposal proceeds and the carrying amount of the asset) is included in the Statement of profit or loss when the asset is derecognised.
Land and buildings held for use in the production or supply of goods or services or for administrative purposes, are stated in the Statement of Financial Position at fair value based on valuation performed every three years.
Increases in the carrying amount arising on revaluation of land and buildings are credited to Other Comprehensive Income and shown as revaluation surplus in shareholders’ equity. Decreases that offset previous increases of the same asset are charged in Other Comprehensive Income and debited against revaluation reserves directly in equity; all other decreases are charged to profit or loss.
An asset’s carrying amount is written down immediately to its recoverable amount if the asset’s carrying amount is greater than its estimated recoverable amount.
Gains and losses on disposal are determined by comparing the proceeds with the carrying amount and are recognised in the Statement of profit or loss.
When revalued assets are sold, the amounts included in revaluation reserves are transferred to retained earnings.
Depreciation
Depreciation on property, plant and equipment is calculated on the straight line method to write off the cost or revalued amounts of the assets to their residual values as follows:
%
Buildings 2 - 4
Plant & equipment 15 - 100
Vehicles 15 - 25
Hotel buildings 3 - 4
Land is not depreciated.
The asset’s residual values and useful lives are reviewed and adjusted if appropriate, at the end of each reporting period.
Borrowing costs
Interest costs on borrowings to finance the construction of property, plant and equipment are capitalised during the period of time that is required to complete and prepare the asset for its intended use, as part of the cost of the asset.
All other borrowing costs are expensed in the period they occur. Borrowing costs consist of interest and other costs that an entity incurs in connection with the borrowing of funds.
Rogers and Company Limited 103
1. PRINCIPAL ACCOUNTING POLICIES (CONTd)
(d) Investment properties
Investment properties which are held for rental outside the Group, capital appreciation or both are stated at fair value at the end of each reporting period. Gains or losses arising from changes in fair value are included in Statement of profit or loss in the period in which they arise.
Investment properties are derecognised when they are disposed of or when the investment property is permanently withdrawn from use and no future economic benefit is expected from its disposal. The difference between the net disposal proceeds and the carrying amount of the asset is recognised in the Statement of profit or loss in the period of derecognition.
(e) Intangible assets
Goodwill
Goodwill on acquisition of subsidiaries and jointly controlled entities is included in intangible assets. Goodwill is measured as the excess of the sum of the consideration transferred, the amount of any non controlling interest in the acquiree and the fair value of previously held equity interest in the acquiree over the amounts of identifiable assets acquired and liabilities assumed. If, after reassessment, the Group’s interest in the fair value of the acquiree’s identifiable net assets exceeds the sum of consideration transferred, the amount of any non-controlling interests in the acquiree and the fair value of the acquirer’s previously held equity interest in the acquiree the excess is recognised immediately in the Statement of Profit or Loss. Differences from non-controlling interests acquired after control has been obtained, are set-off against equity. Goodwill is carried at cost less accumulated impairment losses.
Goodwill on acquisitions of associates is included in investments in associates.
Annual impairment tests applied to goodwill are carried out using discounted cash flow methods This is done on the basis of expected future cash flows from the latest management planning, which are extrapolated on the basis of long-term revenue growth rates and assumptions with regard to margin development, and discounted for the capital costs of the business unit. Tests are performed at the cash generating unit (CGU) level. This test is applicable to all goodwill, except for one investment where fair value less cost to sell is used.
On disposal of a subsidiary, associate or jointly controlled entity, the attributable amount of goodwill is included in the determination of the gains and losses on disposal.
Other purchased goodwill consists mainly of premium paid by certain subsidiaries for acquiring agencies. Impairment tests are carried out at the end of the year to determine the amount of impairment.
Computer software
Costs that are directly associated with identifiable software which will generate economic benefits beyond one year are recognised as intangible assets and are amortised over their estimated useful lives using straight line method.
Amortisation rates: 12 % - 50%

Explanatory Notes30 June 2013
Annual Report 2013104
1. PRINCIPAL ACCOUNTING POLICIES (CONTd)
(f) Impairment of non-financial assets
If the recoverable amount of an asset is estimated to be less than the carrying amount, the carrying amount of the asset is reduced to its recoverable amount. An impairment loss is recognised as an expense immediately, unless the relevant asset is carried at a revalued amount in which case the impairment loss is treated as a revaluation decrease to the extent of the corresponding revaluation surplus.
Where an impairment loss subsequently reverses, the carrying amount of the asset is increased to the revised estimate of its recoverable amount, provided that the increased carrying amount does not exceed the carrying amount that would have been determined had no impairment loss been recognised for the asset in prior years. A reversal of an impairment loss is recognised as income immediately, unless the relevant asset is carried at a revalued amount, in which case the reversal of the impairment loss is treated as a revaluation increase.
(g) Financial instruments
Financial assets and financial liabilities are recognised in the Group’s Statement of Financial Position when the Group has become a party to the contractual provisions of the instrument.
The Group’s accounting policies in respect of the financial instruments are as follows:
(i) Investment in financial assets
Purchases and sales of financial assets are recognised on trade-date, the date on which the Group commits to purchase or sell the asset. Investments are initially measured on fair value plus transaction costs for all financial assets except those that are carried at fair value through profit or loss.
Held-to-maturity financial assets
Financial assets that the Group intends to hold to maturity are measured at amortised cost, less impairment loss recognised to reflect irrecoverable amounts.
Held-for-trading financial assets
Financial assets held-for-trading are measured at fair value. Unrealised gains and losses are recognised in the Statement of profit or loss. On disposal the profit or loss recognised in the Statement of profit or loss is the difference between the proceeds and the carrying amount of the asset.
Available-for-sale financial assets
Available-for-sale financial assets are those financial assets that are not held-for-trading or held-to-maturity. They are carried at fair value. Unrealised gains and losses arising from change in fair value are recognised in Other Comprehensive Income. On disposal of available-for-sale financial assets, the gain or loss arising from the difference between the sale proceeds and the previous carrying amount adjusted for any prior adjustment that had been reported in Other Comprehensive Income to reflect the fair value of that asset, is recognised in the Statement of profit or loss.
Rogers and Company Limited 105
1. PRINCIPAL ACCOUNTING POLICIES (CONTd)
(g) Financial instruments (contd)
(i) Investment in financial assets (contd)
Fair value for quoted financial assets is based on market quotation. If the market for a financial asset is not active, and for unquoted financial assets the Group establishes fair value by using recognised and acceptable valuation techniques. Financial assets are categorised according to a fair value hierarchy as follows:
Level 1 financial assets are those with unadjusted quoted prices in active markets for identical investments.
Level 2 financial assets include quoted prices for similar investments in active markets, quoted prices for identical or similar assets in markets that are not active, inputs other than quoted prices that are observable for the asset (ie, interest rates or yields) and inputs that are derived from or corroborated by observable market data.
Level 3 includes unobservable inputs that reflect directors’ assumptions about what factors market participants would use in pricing such investments. These inputs are based on the best information available including the Group’s own information.
(ii) Long term receivables
Long term receivables with fixed maturity terms are measured at amortised cost using the effective interest rate method, less provision for impairment. The amount of loss is recognised in the Statement of profit or loss. Long term receivables without fixed maturity terms are measured at cost.
(iii) Trade and other receivables
Trade and other receivables are recognised initially at fair value and subsequently measured at amortised cost, less provision for impairment. A provision for trade receivables is established when there is objective evidence that the Group will not be able to collect all amounts due according to the original terms of receivables.
The amount of provision is recognised in the Statement of profit or loss.
(iv) Cash and cash equivalents
Cash and cash equivalents include cash at bank, cash in hand, deposits with original maturities of three months or less, and bank overdrafts. Bank overdrafts are shown within borrowings in current liabilities on the Statements of Financial Position.
(v) Bank borrowings
Interest bearing bank loans and overdrafts are recorded at the proceeds received. Finance charges are accounted for on an accrual basis.
(vi) Trade and other payables
Trade and other payables are stated at fair value and subsequently measured at amortised cost using the effective interest method.
Explanatory Notes30 June 2013
Annual Report 2013106
1. PRINCIPAL ACCOUNTING POLICIES (CONTd)
(h) Biological assets
Bearer biological assets relate to the cost of preparation and planting of virgin canes less amortisation over a period equivalent to the re-plantation cycle using a straight line method. Consumable biological assets are valued at their fair value less costs to sell.
(i) deferred expenditure
Voluntary Retirement Scheme (VRS)
VRS costs (net of receipts from Sugar Reform Trust), together with the costs of land and provision for infrastructure costs have been capitalised and amortised over a maximum period of five years. Any profit realised on sale of land under VRS is credited to the deferred expenditure account up to the total standing on this account. Any surplus is credited to the Statement of Profit or Loss.
Premium on Leasehold Land
Premium paid on leasehold land is accounted for as deferred expenditure and is debited to the Statement of Profit or Loss over the number of years remaining on those leases.
Others
In order to match cost and revenue of providing services over the period of the contract, certain expenditure related thereto is deferred.
(j) Inventories
Inventories are valued at lower of cost and net realisable value.
Cost is determined at the weighted average method. The cost of finished goods and work in progress comprises raw materials, direct labour, other direct costs and related production overheads, but excludes interest expenses. Net realisable value is the estimate of the selling price in the ordinary course of business, less the costs of completion and selling expenses.
(k) Share capital
Ordinary shares are classified as equity. Incremental costs directly attributable to the issue of new shares are shown in equity as deduction, net of tax, from proceeds. Where any group company purchases its equity share capital (treasury shares), the consideration paid, including any directly attributable incremental costs (net of income taxes) is deducted from equity attributable to the Company’s equity holders until the shares are cancelled or reissued. When such shares are subsequently reissued, any net consideration received, is included in equity attributable to the Company’s equity holders.
(l) Leases (lessee)
Finance leases are capitalised at the lease’s inception at the lower of the fair value of the leased property and the present value of the minimum lease payments. Each lease payment is allocated between the liability and finance charges so as to achieve a constant rate of interest on the remaining balance of the liability. Finance charges are charged to the Statement of Profit or Loss unless they are attributable to qualifying assets in which case, they are capitalised in accordance with the policy of borrowing costs.
Rogers and Company Limited 107
1. PRINCIPAL ACCOUNTING POLICIES (CONTd)
(m) deferred taxation
Deferred tax liabilities are provided in respect of taxable temporary differences, using tax rates that have been enacted or substantively enacted at the reporting date and are expected to apply in the period when the related deferred income tax asset is realised or the deferred income tax liability is settled. Deferred tax assets arising from unused tax losses are recognised only to the extent that realisation of the related tax benefit is probable.
For the purposes of measuring deferred tax liabilities and deferred tax assets for investment properties that are measured using the fair value model, the carrying amounts of such properties are presumed to be recovered entirely through sale, unless the presumption is rebutted. The presumption is rebutted when the investment property is depreciable and is held within a business model whose objective is to consume substantially all of the economic benefits embodied in the investment property over time, rather than through sale.
(n) Retirement benefits
Defined benefit pension plans and other retirement benefits
The present value of retirement benefit obligations is recognised in the Statement of Financial Position as a non-current liability after adjusting for the fair value of plan assets, any unrecognised actuarial gains and losses and any unrecognised past service cost. The assessment of these obligations is carried out annually by an independent firm of consulting actuaries.
The current service cost and any past service cost are included as an expense together with the associated interest cost,net of expected return on plan assets. A portion of the actuarial gains and losses is recognised as income or expense if the net cumulative unrecognised actuarial gains and losses at the end of the previous accounting period exceed the greater of:
(i) 10% of the present value of the defined benefit obligation at that date
(ii) 10% of the fair value of plan assets at that date.
State plan and defined contribution pension plans
Contributions to the National Pension Scheme and the Group’s defined contribution pension plan are expensed to the Statement of Profit or Loss in the period in which they fall due.
(o) Provisions
Provisions are recognised when the Group has a present or constructive obligation as a result of past events and when it is probable that this obligation will result in an outflow of economic benefits that can be reasonably estimated. Provisions for restructuring costs are recognised when the Group has a detailed formal plan for the restructuring which has been notified to affected parties and comprise lease termination penalties and employee termination payments. Provisions are not recognised for future operating losses.
Explanatory Notes30 June 2013
Annual Report 2013108
1. PRINCIPAL ACCOUNTING POLICIES (CONTd)
(p) Revenue recognition
Revenue comprises the fair value of the consideration received or receivable for the sale of goods and services in the ordinary course of the group’s activities. Revenue is shown net of value added tax, returns, rebates and discounts after eliminating sales within the group.
The Group recognises revenue when it can reliably be measured, it is probable that future economic benefits will flow to the entity and when specific criteria described below are met.
Sales of goods are recognised on the transfer to the customer of the significant risks and rewards of ownership of the goods which generally coincides with delivery date.
Sales of services are recognised when the services have been performed and title have passed.
Management fees are recognised as the services are provided.
Interest income is accrued on a time proportion basis using the effective interest method.
Dividend income accrues when the shareholders’ right to receive payment is established.
Rental income is recognised in accordance with the substance of the relevant agreement.
Revenue from sale of villas is recognised using the percentage of completion method as construction progresses. Sale of villas is net of rebates and discounts and is acccounted for as follows:
30% on signature of sales deed;
5% on completion of foundation stage;
35% on completion of building envelope;
25% on completion of testing of mechanical and electrical works; and
5% on submission of key.
(q) Foreign currency translation
Items included in the financial statements of each of the group’s entities are measured using the currency of the primary economic environment in which the entity operates (functional currency). The consolidated financial statements are presented in Mauritian rupees, which is the Group’s functional and presentation currency.
Foreign currency transactions are translated into Mauritian Rupees using exchange rates prevailing at the dates of the transactions. Foreign exchange gains and losses resulting from the settlement of such transactions and from the translation at period-end exchange rates of monetary assets and liabilities denominated in foreign currencies are recognised in the Statement of Profit or Loss, except when deferred in Other Comprehensive Income as qualifying cash flow hedges. Translation differences on non-monetary financial assets and liabilities such as equities held at fair value through profit or loss are recognised in profit or loss as part of the fair value gain or loss. Translation differences on non-monetary financial assets, such as equities classified as available for sale, are included in Other Comprehensive Income.
Rogers and Company Limited 109
1. PRINCIPAL ACCOUNTING POLICIES (CONTd)
(q) Foreign currency translation (contd)
The results and financial position of the group entities that have a functional currency different from Mauritian Rupee are translated into the presentation currency as follows:
Assets and liabilities for each Statement of Financial Position presented are translated at the closing rate at the reporting date.
Income and expenses for each Statement of Profit or Loss are translated at average exchange rates.
All resulting exchange differences are recognised in Other Comprehensive Income.
On disposal of foreign entities, such translation differences are recognised in the Statement of Profit or Loss as part of the gain or loss.
(r) Related parties
Parties are considered to be related to the Group if they have the ability to, directly and indirectly, control the Group or exercise significant influence over the Group’s financial and operating decisions, or vice versa, or if they and the Group are subject to common control. Goods and services are sold at market related prices in force and terms that would be available to third parties.
(s) Operating segments
Operating segments are components of the Group about which separate financial information is available. They are reported in a manner consistent with the internal reporting provided to the Chief Executive Officers, for both performance measuring and resource allocation.
Operating segments that do not meet any of the quantitative thresholds of 10 percent reported revenue or profit or assets are included if management believes that information about these segments would be useful to users to better appraise financial information.
(t) Exceptional items
Exceptional items are material items of income or expense that have been disclosed separetely in the Statement of Profit or Loss to clarify understanding of financial performance.
(u) Change in reporting date
The Group changed its reporting date from 30 September to 30 June. As a result, the current financial period covers a period of nine months starting 01 October 2012 to 30 June 2013. Comparatives are for the year ended 30 September 2012.
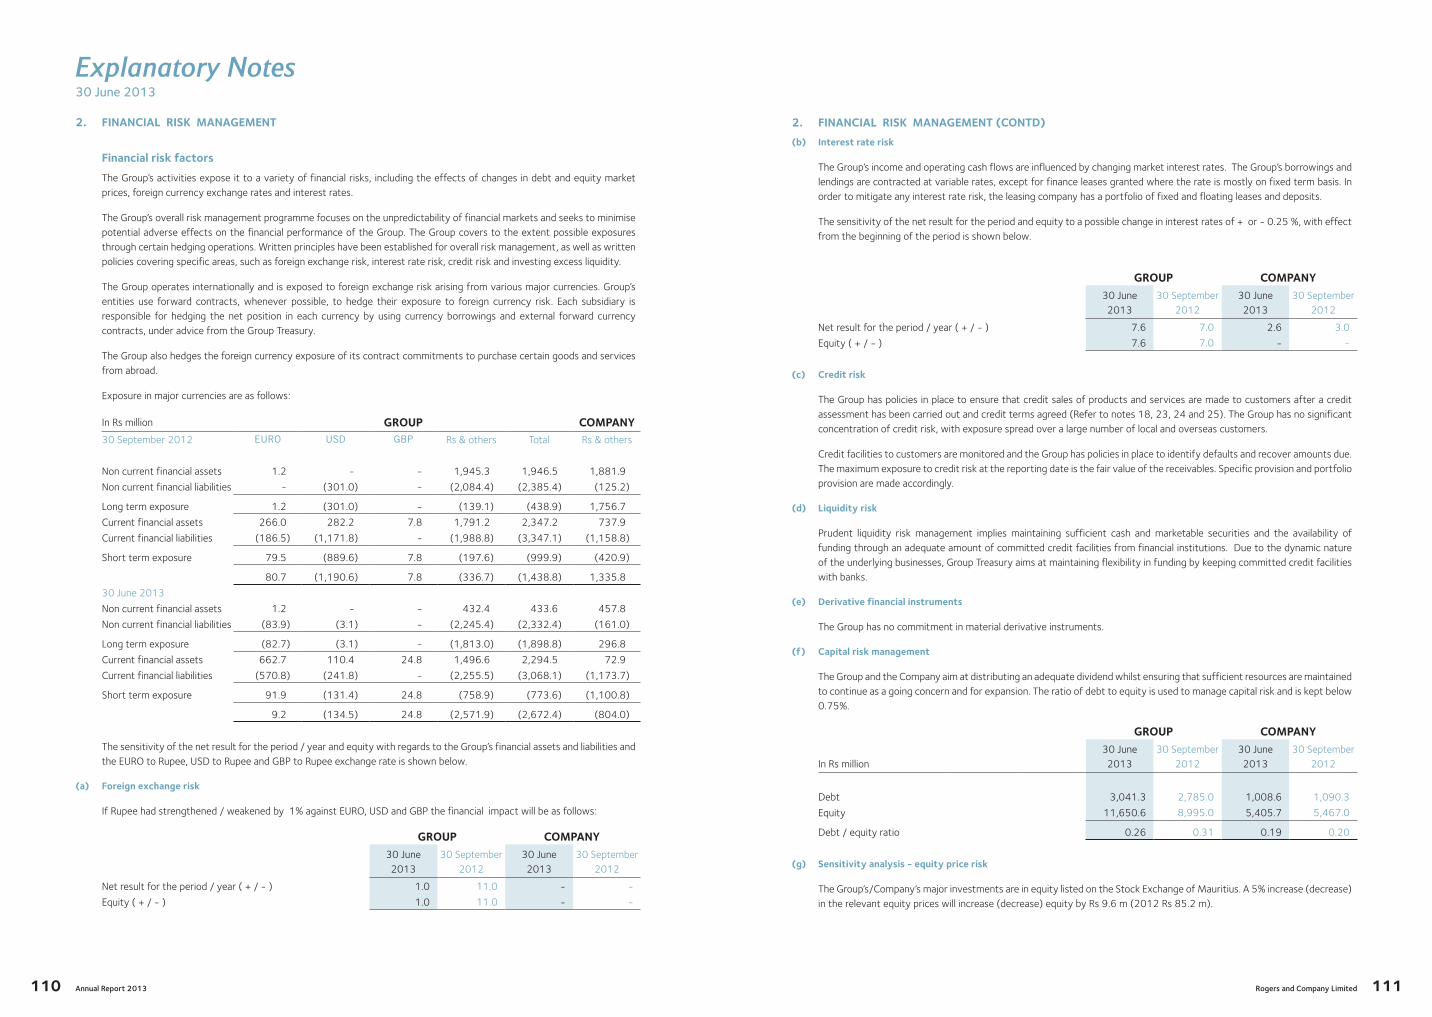
Explanatory Notes30 June 2013
2. FINANCIAL RISK MANAGEMENT
Financial risk factors
The Group’s activities expose it to a variety of financial risks, including the effects of changes in debt and equity market prices, foreign currency exchange rates and interest rates.
The Group’s overall risk management programme focuses on the unpredictability of financial markets and seeks to minimise potential adverse effects on the financial performance of the Group. The Group covers to the extent possible exposures through certain hedging operations. Written principles have been established for overall risk management, as well as written policies covering specific areas, such as foreign exchange risk, interest rate risk, credit risk and investing excess liquidity.
The Group operates internationally and is exposed to foreign exchange risk arising from various major currencies. Group’s entities use forward contracts, whenever possible, to hedge their exposure to foreign currency risk. Each subsidiary is responsible for hedging the net position in each currency by using currency borrowings and external forward currency contracts, under advice from the Group Treasury.
The Group also hedges the foreign currency exposure of its contract commitments to purchase certain goods and services from abroad.
Exposure in major currencies are as follows:
In Rs million GROUP COMPANY30 September 2012 EURO USD GBP Rs & others Total Rs & others
Non current financial assets 1.2 - - 1,945.3 1,946.5 1,881.9
Non current financial liabilities - (301.0) - (2,084.4) (2,385.4) (125.2)
Long term exposure 1.2 (301.0) - (139.1) (438.9) 1,756.7
Current financial assets 266.0 282.2 7.8 1,791.2 2,347.2 737.9
Current financial liabilities (186.5) (1,171.8) - (1,988.8) (3,347.1) (1,158.8)
Short term exposure 79.5 (889.6) 7.8 (197.6) (999.9) (420.9)
80.7 (1,190.6) 7.8 (336.7) (1,438.8) 1,335.8
30 June 2013
Non current financial assets 1.2 - - 432.4 433.6 457.8
Non current financial liabilities (83.9) (3.1) - (2,245.4) (2,332.4) (161.0)
Long term exposure (82.7) (3.1) - (1,813.0) (1,898.8) 296.8
Current financial assets 662.7 110.4 24.8 1,496.6 2,294.5 72.9
Current financial liabilities (570.8) (241.8) - (2,255.5) (3,068.1) (1,173.7)
Short term exposure 91.9 (131.4) 24.8 (758.9) (773.6) (1,100.8)
9.2 (134.5) 24.8 (2,571.9) (2,672.4) (804.0)
The sensitivity of the net result for the period / year and equity with regards to the Group’s financial assets and liabilities and the EURO to Rupee, USD to Rupee and GBP to Rupee exchange rate is shown below.
(a) Foreign exchange risk
If Rupee had strengthened / weakened by 1% against EURO, USD and GBP the financial impact will be as follows:
GROUP COMPANY30 June 2013
30 September 2012
30 June 2013
30 September 2012
Net result for the period / year ( + / - ) 1.0 11.0 - -
Equity ( + / - ) 1.0 11.0 - -
Annual Report 2013110
2. FINANCIAL RISK MANAGEMENT (CONTd)
(b) Interest rate risk
The Group’s income and operating cash flows are influenced by changing market interest rates. The Group’s borrowings and lendings are contracted at variable rates, except for finance leases granted where the rate is mostly on fixed term basis. In order to mitigate any interest rate risk, the leasing company has a portfolio of fixed and floating leases and deposits.
The sensitivity of the net result for the period and equity to a possible change in interest rates of + or - 0.25 %, with effect from the beginning of the period is shown below.
GROUP COMPANY30 June 2013
30 September 2012
30 June 2013
30 September 2012
Net result for the period / year ( + / - ) 7.6 7.0 2.6 3.0
Equity ( + / - ) 7.6 7.0 - -
(c) Credit risk
The Group has policies in place to ensure that credit sales of products and services are made to customers after a credit assessment has been carried out and credit terms agreed (Refer to notes 18, 23, 24 and 25). The Group has no significant concentration of credit risk, with exposure spread over a large number of local and overseas customers.
Credit facilities to customers are monitored and the Group has policies in place to identify defaults and recover amounts due. The maximum exposure to credit risk at the reporting date is the fair value of the receivables. Specific provision and portfolio provision are made accordingly.
(d) Liquidity risk
Prudent liquidity risk management implies maintaining sufficient cash and marketable securities and the availability of funding through an adequate amount of committed credit facilities from financial institutions. Due to the dynamic nature of the underlying businesses, Group Treasury aims at maintaining flexibility in funding by keeping committed credit facilities with banks.
(e) derivative financial instruments
The Group has no commitment in material derivative instruments.
(f) Capital risk management
The Group and the Company aim at distributing an adequate dividend whilst ensuring that sufficient resources are maintained to continue as a going concern and for expansion. The ratio of debt to equity is used to manage capital risk and is kept below 0.75%.
GROUP COMPANY
In Rs million30 June 2013
30 September 2012
30 June 2013
30 September 2012
Debt 3,041.3 2,785.0 1,008.6 1,090.3
Equity 11,650.6 8,995.0 5,405.7 5,467.0
Debt / equity ratio 0.26 0.31 0.19 0.20
(g) Sensitivity analysis - equity price risk
The Group’s/Company’s major investments are in equity listed on the Stock Exchange of Mauritius. A 5% increase (decrease) in the relevant equity prices will increase (decrease) equity by Rs 9.6 m (2012 Rs 85.2 m).
Rogers and Company Limited 111
Explanatory Notes30 June 2013
3. SIGNIFICANT ACCOUNTING JUdGEMENTS ANd ESTIMATES
In applying the Group’s accounting policies the following judgements and estimates have been used, with significant impacts on amounts recognised in the financial statements:
Property, plant and equipment
All property, plant and equipment is initially recorded at cost.
Land and buildings held for use in the production or supply of goods or services or for administrative purposes, are stated in the Statement of Financial Position at revalued amounts, revaluation is performed every three years.
Revaluation of freehold land, buildings and investment properties
As part of the process of revaluation above the use of judgement to:
Determine the fair value of properties is necessary. Latest valuation reports of qualified external valuers are used, except for land under cultivation, bare land and land with buildings of no economic value, where 75% of the value is being used to account for uncertainty and unavailability of property market indices.
Land is valued on the basis of recently transacted properties in that specific region.
For the developed sites, the depreciated replacement cost methodology has been used and consists of the depreciated replacement cost of the building, plus the market value of the land.
For the unimproved sites, the basis of valuation is the market value, which is the value for which such asset could be exchanged between knowledgeable willing parties in an arm’s length transaction.
The direct comparison method has been used for small service sites found in a “règlement de co-propriété”.
Estimate of useful lives and residual value
The depreciation and amortisation charge calculation requires an estimate of the economic useful lives of the respective assets. The Group uses historical experience and comparable market available data to determine useful lives.
Impairment of Goodwill
Goodwill is tested annually for impairment and carried at cost less accumulated impairment losses. For acquired goodwill the value of the investment is based on a ten year discounted cashflow method. The discount rate is estimated by management using currently available rate of interest and an estimate of the risk premium. This test is applicable to all goodwill, except for one investment where fair value less cost to sell is used.
Annual Report 2013112
3. SIGNIFICANT ACCOUNTING JUdGEMENTS ANd ESTIMATES (CONTd)
Retirement benefit obligations
The present value of retirement benefit obligations is recognised in the Statement of Financial Position as a non-current liability after adjusting for the fair value of plan assets, any unrecognised actuarial gains and losses and any unrecognised past service cost. The assessment of these obligations is carried out annually by an independent firm of consulting actuaries. The actuarial valuation involves making assumptions on discount rates, future pension increases, mortality rates, salary increases and expected rates of return on plan assets.
Fair value estimation
In assessing the fair value of financial instruments, the Group uses a variety of methods and makes assumptions that are based on market conditions existing at the end of each reporting date. The carrying value less any estimated credit adjustments for financial assets and financial liabilities with a maturity of less than one year are assumed to approximate their fair values. The fair values of those assets and liabilities not presented in the Group’s and the Company’s Statements of Financial Position at their fair values are not materially different from their carrying amounts.
Fair value of securities not quoted in active market
The fair value of securities not quoted in active market is determined by using valuation techniques including third party transaction values, earnings, net asset value or discounted cash flows, whichever is appropriate.
Rogers and Company Limited 113
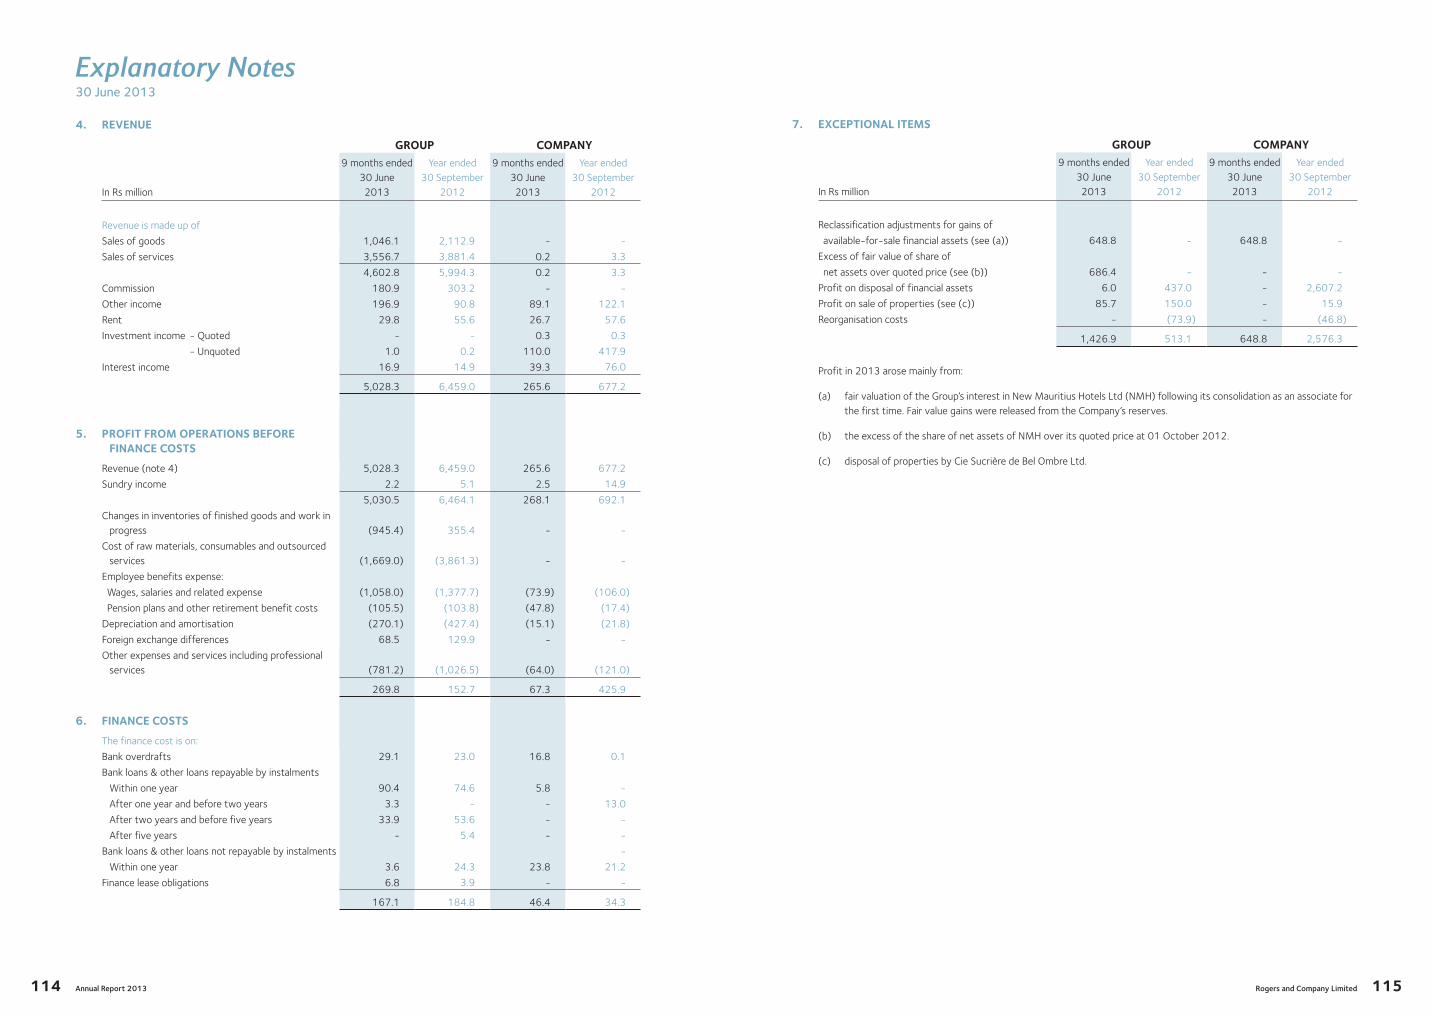
Explanatory Notes30 June 2013
4. REVENUE
GROUP COMPANY
In Rs million
9 months ended 30 June 2013
Year ended 30 September
2012
9 months ended 30 June 2013
Year ended 30 September
2012
Revenue is made up of
Sales of goods 1,046.1 2,112.9 - -
Sales of services 3,556.7 3,881.4 0.2 3.3
4,602.8 5,994.3 0.2 3.3
Commission 180.9 303.2 - -
Other income 196.9 90.8 89.1 122.1
Rent 29.8 55.6 26.7 57.6
Investment income - Quoted - - 0.3 0.3
- Unquoted 1.0 0.2 110.0 417.9
Interest income 16.9 14.9 39.3 76.0
5,028.3 6,459.0 265.6 677.2
5. PROFIT FROM OPERATIONS BEFORE FINANCE COSTS
Revenue (note 4) 5,028.3 6,459.0 265.6 677.2
Sundry income 2.2 5.1 2.5 14.9
5,030.5 6,464.1 268.1 692.1
Changes in inventories of finished goods and work in progress (945.4) 355.4 - -
Cost of raw materials, consumables and outsourced services (1,669.0) (3,861.3) - -
Employee benefits expense:
Wages, salaries and related expense (1,058.0) (1,377.7) (73.9) (106.0)
Pension plans and other retirement benefit costs (105.5) (103.8) (47.8) (17.4)
Depreciation and amortisation (270.1) (427.4) (15.1) (21.8)
Foreign exchange differences 68.5 129.9 - -
Other expenses and services including professional services (781.2) (1,026.5) (64.0) (121.0)
269.8 152.7 67.3 425.9
6. FINANCE COSTS
The finance cost is on:
Bank overdrafts 29.1 23.0 16.8 0.1
Bank loans & other loans repayable by instalments
Within one year 90.4 74.6 5.8 -
After one year and before two years 3.3 - - 13.0
After two years and before five years 33.9 53.6 - -
After five years - 5.4 - -
Bank loans & other loans not repayable by instalments -
Within one year 3.6 24.3 23.8 21.2
Finance lease obligations 6.8 3.9 - -
167.1 184.8 46.4 34.3
Annual Report 2013114
7. ExCEPTIONAL ITEMS
GROUP COMPANY
In Rs million
9 months ended 30 June 2013
Year ended 30 September
2012
9 months ended 30 June 2013
Year ended 30 September
2012
Reclassification adjustments for gains of
available-for-sale financial assets (see (a)) 648.8 - 648.8 -
Excess of fair value of share of
net assets over quoted price (see (b)) 686.4 - - -
Profit on disposal of financial assets 6.0 437.0 - 2,607.2
Profit on sale of properties (see (c)) 85.7 150.0 - 15.9
Reorganisation costs - (73.9) - (46.8)
1,426.9 513.1 648.8 2,576.3
Profit in 2013 arose mainly from:
(a) fair valuation of the Group’s interest in New Mauritius Hotels Ltd (NMH) following its consolidation as an associate for the first time. Fair value gains were released from the Company’s reserves.
(b) the excess of the share of net assets of NMH over its quoted price at 01 October 2012.
(c) disposal of properties by Cie Sucrière de Bel Ombre Ltd.
Rogers and Company Limited 115

Explanatory Notes30 June 2013
8. TAxATION
GROUP COMPANY9 months ended
30 June 2013
Year ended 30 September
2012
9 months ended 30 June 2013
Year ended 30 September
2012
Provision for the period / year
(15% - 35%) - (2012: 15% - 35%) 32.4 64.2 - -
Over provision in previous years (0.3) (3.7) (2.0) (3.3)
Movement in deferred taxation (note 29) (45.0) (51.9) - -
(12.9) 8.6 (2.0) (3.3)
The effective tax rate differs from that determined by applying the statutory income tax rate to profit before taxation. This is due primarily to different tax rates, investment allowance, non-deductible expenses, tax exempt income, tax credit income and unused tax losses.
GROUP COMPANY9 months ended
30 June 2013
Year ended 30 September
2012
9 months ended 30 June 2013
Year ended 30 September
2012
% % % %
Reconciliation of effective tax rate is as follows
Tax rate applicable 15.0 15.0 15.0 15.0
Tax free income and allowances net of balancing charges (10.8) 1.3 (1.3) (20.5)
Non allowable tax income (expense) 6.4 4.0 (14.5) 6.7
Recognised tax losses (7.3) (2.2) - -
Unrecognised tax losses 2.6 (5.3) 0.8 (1.2)
Difference between local tax rate and other rates 2.9 2.7 - -
Deferred tax impact (12.2) (9.6) - -
Effective tax rate (3.4) 5.9 - -
9. dISCONTINUEd OPERATIONS RELATING TO ThE UNBUNdLING OF INVESTMENTS
On 28 September 2012, the Board of Rogers and Company Limited declared a dividend in specie following which shareholders of Rogers received 27 shares of Cim Financial Services Ltd at Rs 4.45 for every 1 share of Rogers held. The dividend in specie was accounted for at fair value. This unbundling transaction resulted in the deconsolidation of the CIM group of companies, shown as discontinued activities in the comparative figures of these financial statements.
Annual Report 2013116
11. OThER COMPREhENSIVE INCOME
GROUPRevaluation
reservesTranslation reserves
Retained Earnings
Attributable to owners
of the parent
Non- controlling Interests Total
30 September 2012
Items that will not be reclassified to profit or loss:Gains on property revaluationGains arising during the year 26.2 - - 26.2 46.1 72.3 Deferred tax on revaluation of properties 98.3 - - 98.3 88.2 186.5
124.5 - - 124.5 134.3 258.8 Share of Other Comprehensive Income of
associated companies 3.8 - - 3.8 - 3.8
128.3 - - 128.3 134.3 262.6 Items that may be reclassified subsequently to
profit or loss:Exchange differences on translating foreign entities - 4.7 - 4.7 13.9 18.6 Losses arising on fair value of available-for-sale
financial assetsLosses arising during the year (828.7) - - (828.7) 32.5 (796.2)Reclassification adjustments in Statements of
Profit or Loss (5.9) - - (5.9) - (5.9)
(834.6) - - (834.6) 32.5 (802.1)
Losses arising on cash flow hedgesLosses arising during the year - (20.5) - (20.5) - (20.5)Reclassification adjustments in Statements of
Profit or Loss - (1.2) - (1.2) - (1.2)
- (21.7) - (21.7) - (21.7)
Share of Other Comprehensive Income of associated companies - (0.1) (0.9) (1.0) - (1.0)
(834.6) (17.1) (0.9) (852.6) 46.4 (806.2)
Other Comprehensive Income for the year ended 30 September 2012 (706.3) (17.1) (0.9) (724.3) 180.7 (543.6)
10. EARNINGS PER ShARE
GROUP
In Rs million
9 months ended 30 June 2013
Year ended 30 September
2012
From continuing and discontinued operations
Profit attributable to owners of the parent 1,750.9 1,166.8
Adjustments for exceptional items (1,372.9) (732.8)
378.0 434.0
Number of shares in issue 25,204,530 25,204,530
Earnings per share (in Rs) 69.46 46.29
Earnings per share (excluding exceptional items) (in Rs) 15.00 17.23
From continuing operations
Profit attributable to owners of the parent 1,750.9 540.5
Adjustments for exceptional items (1,372.9) (508.6)
378.0 31.9
Earnings per share (in Rs) 69.46 21.44
Earnings per share (excluding exceptional items) (in Rs) 15.00 1.27
Rogers and Company Limited 117

Explanatory Notes30 June 2013
11. OThER COMPREhENSIVE INCOME (CONTd)
GROUPRevaluation
reservesTranslation reserves
Retained earnings
Attributable to owners
of the parent
Non- controlling interests TotalIn Rs million
30 June 2013
Items that will not be reclassified to profit or loss:
Gains on property revaluationGains arising during the period 697.0 - - 697.0 512.8 1,209.8 Deferred tax on revaluation of properties (63.4) - - (63.4) (16.4) (79.8)
633.6 - - 633.6 496.4 1,130.0 Share of Other Comprehensive Income of
associated companies 0.3 - - 0.3 - 0.3
633.9 - - 633.9 496.4 1,130.3Items that may be reclassified subsequently to
profit or loss:Exchange differences on translating foreign
entities - (9.3) - (9.3) (2.4) (11.7)Losses arising on fair value of available-for-sale
financial assetsGains arising during the period 66.5 - - 66.5 (0.7) 65.8 Reclassification adjustments in Statements of
Profit or Loss (648.8) - - (648.8) - (648.8)
(582.3) - - (582.3) (0.7) (583.0)
Share of Other Comprehensive Income of associated companies 12.4 1.7 (0.8) 13.3 - 13.3
(569.9) (7.6) (0.8) (578.3) (3.1) (581.4)
Other Comprehensive Income for the period ended 30 June 2013 64.0 (7.6) (0.8) 55.6 493.3 548.9
There is no income tax impact on items of Other Comprehensive Income.
COMPANY
Revaluation reserves
30 September 2012
Items that may be reclassified subsequently to profit or loss
Losses arising on fair value of available-for-sale financial assets (846.8)
Other comprehensive income for the year ended 30 September 2012 (846.8)
30 June 2013
Items that may be reclassified subsequently to profit or loss
Gains arising on fair value of available-for-sale financial assets 67.0
Reclassification adjustments in Statements of Profit or Loss (648.8)
Other comprehensive income for the period ended 30 June 2013 (581.8)
Annual Report 2013118
12. PROPERTY, PLANT ANd EQUIPMENT
GROUP
In Rs millionLand and Buildings
Plant and Equipment Vehicles Total
Cost or valuationAt 1 October 2011 6,934.9 2,324.9 489.2 9,749.0 Additions 1.3 162.2 120.6 284.1 Impairment - (96.1) - (96.1)Disposals (112.7) (23.6) (68.6) (204.9)Revaluation adjustment 72.3 - - 72.3 Exchange differences - (0.3) (0.2) (0.5)Transfers (278.0) (0.1) (0.6) (278.7)Deconsolidation of group companies - (49.0) (9.6) (58.6)Deconsolidation due to dividend in specie (663.2) (374.8) (271.0) (1,309.0)
At 30 September 2012 5,954.6 1,943.2 259.8 8,157.6 Additions 18.4 71.5 34.1 124.0 Impairment 23.5 (59.1) (1.8) (37.4)Disposals - (25.8) (14.9) (40.7)Revaluation adjustment 742.7 - - 742.7Transfers 47.8 (5.5) - 42.3Acquisition of subsidiaries - 114.5 8.2 122.7
At 30 June 2013 6,787.0 2,038.8 285.4 9,111.2
Depreciation and impairmentAt 1 October 2011 436.4 1,535.4 261.9 2,233.7 Charge for the year 140.7 245.8 80.8 467.3 Disposal adjustment (20.7) (10.3) (54.6) (85.6)Exchange differences - (0.2) (0.3) (0.5)Impairment loss - (98.0) (1.2) (99.2)Deconsolidation of group companies - (41.1) (6.6) (47.7)
Deconsolidation due to dividend in specie (0.3) (274.0) (114.0) (388.3)At 30 September 2012 556.1 1,357.6 166.0 2,079.7 Charge for the period 69.7 139.3 30.2 239.2 Disposal adjustment - - (10.9) (10.9)Revaluation adjustment (467.1) - - (467.1)Impairment loss - (34.1) (2.5) (36.6)Acquisition of subsidiaries - 93.3 6.9 100.2
At 30 June 2013 158.7 1,556.1 189.7 1,904.5
Carrying value
At 30 June 2013 6,628.3 482.7 95.7 7,206.7
At 30 September 2012 5,398.5 585.6 93.8 6,077.9
Carrying value of assets pledged
At 30 June 2013 6,478.4 368.0 76.5 6,922.9
At 30 September 2012 5,231.3 459.3 70.0 5,760.6
The Group accounts for land and buildings at revalued amounts derived from revaluation exercise carried out by qualified independent valuers in June 2013, except for land under cultivation, bare land and land with buildings of no economic value, where 75% of the value is being used.
Additions include Rs 32.1 m (2012 - Rs 44.4 m) of assets held under finance leases.
Rogers and Company Limited 119
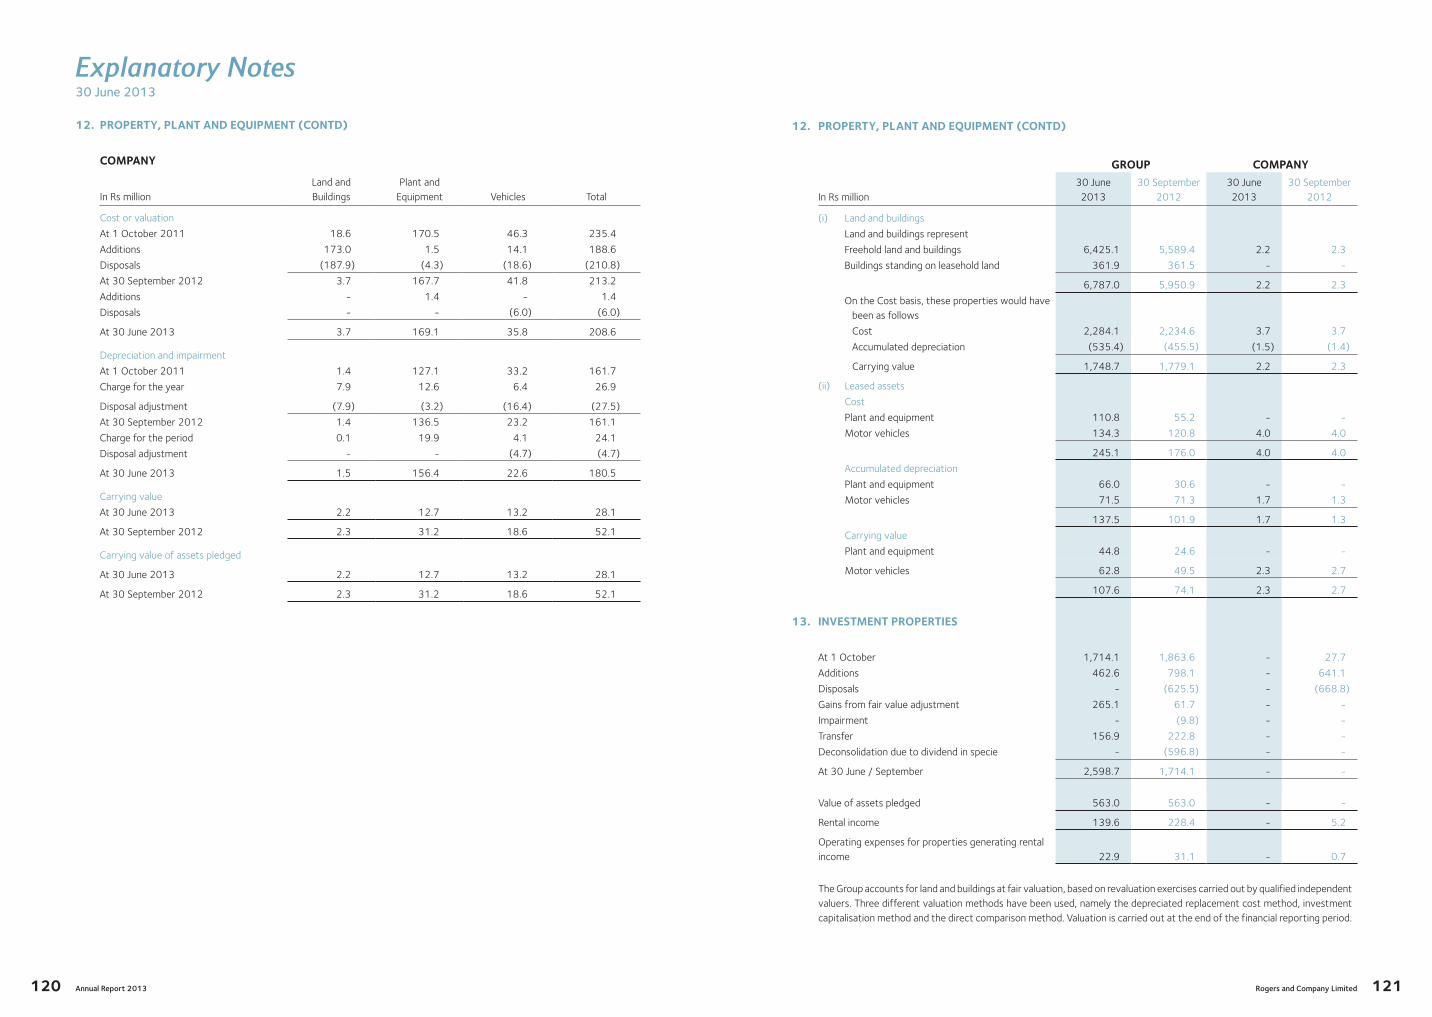
Explanatory Notes30 June 2013
12. PROPERTY, PLANT ANd EQUIPMENT (CONTd)
COMPANY
In Rs millionLand and Buildings
Plant and Equipment Vehicles Total
Cost or valuation
At 1 October 2011 18.6 170.5 46.3 235.4
Additions 173.0 1.5 14.1 188.6
Disposals (187.9) (4.3) (18.6) (210.8)
At 30 September 2012 3.7 167.7 41.8 213.2
Additions - 1.4 - 1.4
Disposals - - (6.0) (6.0)
At 30 June 2013 3.7 169.1 35.8 208.6
Depreciation and impairment
At 1 October 2011 1.4 127.1 33.2 161.7
Charge for the year 7.9 12.6 6.4 26.9
Disposal adjustment (7.9) (3.2) (16.4) (27.5)
At 30 September 2012 1.4 136.5 23.2 161.1
Charge for the period 0.1 19.9 4.1 24.1
Disposal adjustment - - (4.7) (4.7)
At 30 June 2013 1.5 156.4 22.6 180.5
Carrying value
At 30 June 2013 2.2 12.7 13.2 28.1
At 30 September 2012 2.3 31.2 18.6 52.1
Carrying value of assets pledged
At 30 June 2013 2.2 12.7 13.2 28.1
At 30 September 2012 2.3 31.2 18.6 52.1
Annual Report 2013120
12. PROPERTY, PLANT ANd EQUIPMENT (CONTd)
GROUP COMPANY
In Rs million30 June 2013
30 September 2012
30 June 2013
30 September 2012
(i) Land and buildings
Land and buildings represent
Freehold land and buildings 6,425.1 5,589.4 2.2 2.3
Buildings standing on leasehold land 361.9 361.5 - -
6,787.0 5,950.9 2.2 2.3
On the Cost basis, these properties would have been as follows
Cost 2,284.1 2,234.6 3.7 3.7
Accumulated depreciation (535.4) (455.5) (1.5) (1.4)
Carrying value 1,748.7 1,779.1 2.2 2.3
(ii) Leased assets
Cost
Plant and equipment 110.8 55.2 - -
Motor vehicles 134.3 120.8 4.0 4.0
245.1 176.0 4.0 4.0
Accumulated depreciation
Plant and equipment 66.0 30.6 - -
Motor vehicles 71.5 71.3 1.7 1.3
137.5 101.9 1.7 1.3
Carrying value
Plant and equipment 44.8 24.6 - -
Motor vehicles 62.8 49.5 2.3 2.7
107.6 74.1 2.3 2.7
13. INVESTMENT PROPERTIES
At 1 October 1,714.1 1,863.6 - 27.7
Additions 462.6 798.1 - 641.1
Disposals - (625.5) - (668.8)
Gains from fair value adjustment 265.1 61.7 - -
Impairment - (9.8) - -
Transfer 156.9 222.8 - -
Deconsolidation due to dividend in specie - (596.8) - -
At 30 June / September 2,598.7 1,714.1 - -
Value of assets pledged 563.0 563.0 - -
Rental income 139.6 228.4 - 5.2
Operating expenses for properties generating rental income 22.9 31.1 - 0.7
The Group accounts for land and buildings at fair valuation, based on revaluation exercises carried out by qualified independent valuers. Three different valuation methods have been used, namely the depreciated replacement cost method, investment capitalisation method and the direct comparison method. Valuation is carried out at the end of the financial reporting period.
Rogers and Company Limited 121

Explanatory Notes30 June 2013
14. INTANGIBLE ASSETS
GROUP
In Rs millionGoodwill on Acquisition Software Others Total
Cost
At 1 October 2011 1,357.2 345.1 10.3 1,712.6
Additions - 29.0 11.8 40.8
Disposals - (0.1) (2.8) (2.9)
Transfer - 1.9 (8.8) (6.9)
Deconsolidation of group companies (31.6) (12.3) - (43.9)
Deconsolidation due to dividend in specie (1,289.5) (190.4) (3.2) (1,483.1)
At 30 September 2012 36.1 173.2 7.3 216.6
Additions - 6.8 90.0 96.8
Disposals - (0.3) - (0.3)
Impairment - (3.5) (0.1) (3.6)
Transfer - (6.5) 2.9 (3.6)
Acquisition of subsidiaries 49.5 - - 49.5
Deconsolidation of group companies 32.7 - - 32.7
At 30 June 2013 118.3 169.7 100.1 388.1
Amortisation
At 1 October 2011 (240.8) 215.1 (7.9) (33.6)
Charge for the year - 43.2 2.9 46.1
Disposals - (0.6) - (0.6)
Impairment - - (3.4) (3.4)
Transfer - (0.8) 2.9 2.1
Deconsolidation of group companies 0.5 (11.4) - (10.9)
Deconsolidation due to dividend in specie (27.1) (116.4) 8.8 (134.7)
At 30 September 2012 (267.4) 129.1 3.3 (135.0)
Charge for the period - 14.0 1.0 15.0
Disposals - (0.1) - (0.1)
Impairment - (1.6) - (1.6)
Transfer - (8.9) 3.3 (5.6)
Deconsolidation of group companies 32.7 - - 32.7
At 30 June 2013 (234.7) 132.5 7.6 (94.6)
Carrying value
At 30 June 2013 353.0 37.2 92.5 482.7
At 30 September 2012 303.5 44.1 4.0 351.6
At the end of the reporting period, the Group assessed the recoverable amount of goodwill and determined that there is no impairment to goodwill. The valuation takes into account an interest free rate of 7.25% and a risk premium of 8.25%. Changes in the Group’s interest in subsidiaries that do not result in a loss of control are accounted through equity.
Annual Report 2013122
14. INTANGIBLE ASSETS (CONTd)
COMPANY
In Rs million Software Others Total
Cost
At 1 October 2011 13.8 2.8 16.6
Additions 8.4 3.1 11.5
Disposals - (2.2) (2.2)
At 30 September 2012 22.2 3.7 25.9
Additions - - -
At 30 June 2013 22.2 3.7 25.9
Amortisation
At 1 October 2011 11.1 - 11.1
Charge for the year 2.7 - 2.7
At 30 September 2012 13.8 - 13.8
Charge for the period 1.8 1.8
At 30 June 2013 15.6 - 15.6
Carrying value
At 30 June 2013 6.6 3.7 10.3
At 30 September 2012 8.4 3.7 12.1
15. INVESTMENT IN SUBSIdIARY COMPANIES
COMPANY
30 June 2013
30 September 2012
(a) At 1 October 3,056.7 3,456.9
Additions 588.5 1,300.3
Disposals (356.0) (900.9)
Movement in shareholders’ loans 49.7 2.7
Impairment (0.4) (3.3)
Transfers (7.3) (799.0)
At 30 June / September 3,331.2 3,056.7
Rogers and Company Limited 123

Explanatory Notes30 June 2013
15. INVESTMENT IN SUBSIdIARY COMPANIES (CONTd)
(b) The financial statements of the following subsidiaries have been included in the consolidated financial statements.
Rogers and Company Limited Other Group Issued Principal activity
Class of Nominal Companies Capital
shares value of % %
held investment Holding Holding
Rs 000 Rs 000AVIATIONArio (Seychelles) Ordinary - - 100.0 47 GSA of airlinesB S Travel Management Ltd. Ordinary - - 100.0 25,000 Travel agencyBS Travel Management Limitada Ordinary - - 100.0 216 GSA of airlinesBS Travel Mayotte Ordinary - - 100.0 325 Travel agencyBEAVIA Kenya Limited Ordinary - - 70.0 - Travel AgencyBlue Alize Ltd. Ordinary - - 60.5 7,475 Catamaran sightseeing toursBlue Sky Réunion SAS. Ordinary - - 100.0 2,813 Travel agencyCroisières Australes Ltée. Ordinary - - 75.7 3,225 Catamaran sightseeing toursGSAfrica Airline Services (Pty) Ltd. Ordinary - - 100.0 6,509 GSA of airlinesPlaisance Air Transport Services Ltd. Ordinary - - 100.0 1,500 WarehousingRogers Aviation Comores S.A.R.L. Ordinary - - 100.0 824 GSA of airlinesRogers Aviation France S.A.R.L Ordinary 100.0 400 InvestmentRogers Aviation Holding Company Ltd. Ordinary 79,969 100.0 - 79,969 InvestmentRogers Aviation International Ltd. Ordinary - - - 10,207 GSA of airlinesRogers Aviation Kenya Ltd. Ordinary - - 100.0 396 GSA of airlinesRogers Aviation Madagascar S.A.R.L. Ordinary - - 100.0 1,910 GSA of airlinesRogers Aviation (Mauritius) Ltd. Ordinary - - 100.0 2,525 GSA of airlinesRogers Aviation Mayotte S.A.R.L. Ordinary - - 100.0 490 GSA of airlinesRogers Aviation Mozambique Limitada Ordinary - - 100.0 54 GSA of airlinesRogers Aviation Reunion Ordinary - - 100.0 20,001 GSA of airlinesRogers Aviation Senegal S.A.R.L. Ordinary - - 100.0 56 GSA of airlines, Travel agency and
tour operatorRogers Aviation South Africa (PTY) Ltd. Ordinary - - 100.0 1 GSA of airlinesTranscontinent S.A.R.L. Ordinary - - 66.6 617 Travel agencyFINANCIAL SERVICESRogers Asset Management Ltd. Ordinary - - 100.0 1,000 Asset managementRogers Capital Ltd. Ordinary 1 100.0 - 40,227 InvestmentRogers Wealth Management Ltd. Ordinary - - 100.0 601 InvestmentHOSPITALITYAdnarev Ltd. Ordinary - - 100.0 76,463 HotelHeritage Golf Club Ltd. Ordinary - - 100.0 310,350 Golf courseJoint Offices Ltd. Ordinary - - 100.0 100 InvestmentSeven Colours Spa Ltd. Ordinary - - 100.0 20,025 Management servicesSociété Dow Jones Ordinary - - 100.0 3,617 PropertySociété Zone Finance Ordinary - - 100.0 14,000 PropertyVLH Holding Ltd. Ordinary 324,501 74.2 4.8 437,265 PropertyVLH Ltd. Ordinary - - 100.0 325,277 HotelVLH Management Ltd. Ordinary 27,313 87.1 - 31,347 Management servicesVLH Training Ltd. Ordinary - - 100.0 1,015 Management servicesLOGISTICSAssociated Container Services Ltd. Ordinary - - 100.0 18,850 Port related servicesCargo Express Madagascar S.A.R.L. Ordinary - - 100.0 168 Freight forwardingFOM Warehouse Ltd. Ordinary 50 45.7 4.0 100 Port related servicesFreeport Operations ( Mtius ) Ltd. Ordinary - - 100.0 133,447 Port related servicesLogistics Holding Company Ltd. Ordinary 619,353 100.0 - 619,338 Investment
Logistics Solution Ltd. Ordinary - - 98.5 360,483 Investment
*Mechanical Transport Ltd Ordinary - - 100.0 18,301 Transport company
P.A.P.O.L.C.S. Ltd. Ordinary - - 80.0 100 Stevedoring
Papol Holding Limited Ordinary - - 60.0 100 Investment
R & C Logistics Ltd. Ordinary - - 100.0 300 Dormant
RIDS Coreiro International Lda. Ordinary - - 100.0 2,000 Courrier services
Rogers International Distribution Services Limitada Ordinary - - 100.0 63 Freight forwarding
Rogers International Distribution Services S.A. Ordinary - - 100.0 7,679 Freight forwarding
Rogers International Distribution Services S.A.R.L. Ordinary - - 100.0 8 Freight forwarding
* Subsidiary companies consolidated in 2013
Annual Report 2013124
LOGISTICS (CONTD)
Rogers Logistics International Ltd. Ordinary - - 100.0 2,358 Freight forwarding
Rogers Logistics Services Company Ltd. Ordinary - - 100.0 100 Freight forwarding
Rogers Shipping Ltd. Ordinary - - 51.0 721 Freight forwarding
Rogers Shipping Pte Ltd. Ordinary - - 51.0 3 Shipping agency
Société du Port 101,455 45.7 4.0 207,223 Investment
Sukpak Ltd. Ordinary - - 70.0 1,200 Packing of special sugars
Thermoil Company Ltd. Ordinary 78 78.0 - 100 Bitumen agency
Transworld International Ltd. Ordinary - - 100.0 25 Dormant
Velogic Ltd. Ordinary - - 100.0 83,985 Management services
Velogic India Private Ltd. Ordinary - - 100.0 11,156 Freight forwarding
Velogic Sea Frigo R’Frigo S.A. Ordinary - - 100.0 4,085 Freight forwarding
PROPERTY
Ascencia Limited Ordinary - - 65.9 1,514,609 Property
Desbro International Ltd. Ordinary - - 94.0 16,800 Property
Foresite Ltd. Ordinary 600 90.0 - 667 Property
*FPHL INFRA Ltd Ordinary - - 100.0 13,780 Investment
Foresite Fund Management Ltd. Ordinary 900 90.0 - 1,000 Investment
Foresite Property Holding Ltd. Ordinary 1,020,029 100.0 - 1,020,029 Property
Motor Traders Ltd. Ordinary - - 100.0 500 Property
Reliance Facility Services (Mauritius) Ltd Ordinary - - 100.0 25,000 Facility management services
Reliance Security Services (Mauritius) Ltd Ordinary - - 100.0 34,098 Security services
Steelco Industry Ltd. Ordinary - - 94.0 1,000 Property
Société de la Crécerelle Ordinary 1 100.0 - 1 Property
Société du Bengali Ordinary 1 100.0 - 1 Property
Société du Katover Ordinary 1 100.0 - 1 Property
REAL ESTATE AND AGRIBUSINESS
Case Noyale Ltée. Ordinary 1 1.3 52.3 7 Investment
Cie. Sucrière de Bel Ombre Ltd. Ordinary 407 1.2 52.3 33,300 Agriculture & investment
Les Villas de Bel Ombre Ltée. Ordinary - - 60.0 291,134 Construction and sale of villas
South West Tourism Development Co. Ltd. Ordinary 3,408 68.9 2.0 4,950 Investment
Villas Valriche Resorts Ltd. Ordinary - - 100.0 1 Rental pool management company
TECHNOLOGY
EIS IORGA Ltd. Ordinary - - 90.0 13,500 IT services
Enterprise Information Solutions Ltd. Ordinary 6,977 100.0 - 6,977 IT services
Enterprise Information Systems Ltd. (Kenya) Ordinary - - 100.0 47 IT services
CORPORATE OFFICE
Cerena Ltd. Ordinary 50 100.0 - 50 Dormant
Fleet Investment Supply and Husbandry Ltd. Ordinary - - 100.0 1 Dormant
Granary Co. Ltd. Ordinary 100 100.0 - 100 Dormant
Rogers Consulting Services Ltd. Ordinary 1 100.0 - 1 Consultancy
Rogers Corporate Services Ltd. Ordinary 50 100.0 - 50 Dormant
IHL SPV Ltd Ordinary 1 100.0 - 1 Investment
* Subsidiary companies consolidated in 2013
15. INVESTMENT IN SUBSIdIARY COMPANIES (CONTd)
Rogers and Company Limited Other Group Issued Principal activity
Class of Nominal Companies Capital
shares value of % %
held investment Holding Holding
Rs 000 Rs 000
Rogers and Company Limited 125

Explanatory Notes30 June 2013
15. INVESTMENT IN SUBSIdIARY COMPANIES (CONTd)
(c) The above subsidiaries are incorporated and operate in Mauritius except for:
COUNTRY OF INCORPORATION
Ario (Seychelles) Republic of Seychelles
B S Travel Management Limitada Republic of Mozambique
B S Travel Mayotte Réunion Island
BEAVIA Kenya Limited Republic of Kenya
Blue Sky Réunion SAS Réunion Island
Cargo Express Madagascar S.A.R.L. Republic of Malagasy
Enterprise Information Systems Ltd. (Kenya) Republic of Kenya
GSAfrica Airline Services (Pty) Ltd. Republic of South Africa
RIDS Coreiro International Lda. Republic of Mozambique
Rogers Aviation Comores S.A.R.L. Republic of Comores
Rogers Aviation France S.A.R.L. Réunion Island
Rogers Aviation Kenya Ltd. Republic of Kenya
Rogers Aviation Madagascar S.A.R.L. Republic of Malagasy
Rogers Aviation Mayotte S.A.R.L. Mayotte
Rogers Aviation Mozambique Limitada Republic of Mozambique
Rogers Aviation Senegal S.A.R.L. Republic of Senegal
Rogers Aviation South Africa (Pty) Ltd. Republic of South Africa
Rogers International Distribution Services Limitada Republic of Mozambique
Rogers International Distribution Services S.A. French Republic
Rogers International Distribution Services S.A.R.L. Republic of Malagasy
Rogers Shipping Pte Ltd. Republic of Singapore
Transcontinent S.A.R.L. Republic of Malagasy
Velogic Sea Frigo R’Frigo SA Réunion Island
Annual Report 2013126
16. INVESTMENT IN JOINTLY CONTROLLEd ENTITIES
GROUP
The financial statements of the following jointly controlled entities for the period ended 30 June 2013 have been included in the consolidated financial statements:
% Direct Holding Principal activity
Axa Customer Services Ltd 50.0 Business process outsourcing
Edith Cavell Properties Ltd 50.0 Property
Tractor and Equipment (Mauritius) Ltd 49.9 Dealer in machineries
Transglobal Logistics (Mauritius) Ltd 49.0 Freight forwarding
R’Frigo S.A.S 50.0 Freight forwarding
Summarised financial information of the Group’s share of the above jointly controlled entities:
In Rs million30 June 2013
30 September 2012
Statement of Financial Position
Non current assets 75.7 79.2
Current assets 77.3 101.2
Current liabilities (36.1) (61.9)
116.9 118.5
Capital and reserves 112.8 111.6
Long term liabilities 4.1 6.9
116.9 118.5
Statement of Profit or Loss and Other Comprehensive Income
Revenue 117.2 207.3
Profit (loss) from operations 2.7 (5.0)
Finance costs (0.7) (1.1)
Profit (loss) before taxation 2.0 (6.1)
Taxation 0.4 (1.1)
Profit (loss) for the period / year 2.4 (7.2)
Other Comprehensive Income for the period / year - -
Total comprehensive income for the period / year 2.4 (7.2)
COMPANY
At 1 October 114.7 42.6
Additions - 6.3
Disposals (23.5) -
Impairment 14.7 (3.7)
Transfer - 69.5
At 30 June / September 105.9 114.7
Rogers and Company Limited 127

Explanatory Notes30 June 2013
17. INVESTMENT IN ASSOCIATEd COMPANIES
GROUP
In Rs million30 June 2013
30 September 2012
(a) Cost of investment in associated companies 2,872.5 954.3
Share of reserves 1,000.9 166.9
3,873.4 1,121.2
(b) Summarised financial information in respect of the Group's associated companies is set out below:
Assets 20,012.2 6,018.2
Liabilities (2,846.9) (2,496.9)
Net assets 17,165.3 3,521.3
Revenue 8,464.0 1,508.3
Profit for the period / year 832.9 100.3
Other Comprehensive Income for the period / year 64.8 20.7
Total Comprehensive Income for the period / year 897.7 121.0
Share of profit (loss) of associated companies for the period / year 166.4 (1.7)
Share of Other Comprehensive Income for the period / year 13.5 2.8
179.9 1.1
COMPANY
At 1 October 918.7 15.6
Additions 273.9 306.9
Disposals - (16.3)
Transfers 1,566.6 612.5
At 30 June / September 2,759.2 918.7
The following associated companies have been included in the consolidated financial statements:
Statutory % of effectivereporting holding
period Principal activity
Anglo Mauritius Financial Solutions Ltd 31.12.12 37.0 Insurance*Biofarms Ltd. 30.06.13 18.3 Breeding and selling of primatesBlue Connect Ltd 30.09.12 30.0 Business process outsourcing *ESP Landscapers 30.06.13 7.5 Landscaping services*Espral Co Ltd 30.06.13 7.5 Property developmentIntendance Holding Ltd 31.12.12 37.8 InsuranceIsland Bulk Carriers 31.12.12 20.0 Shipping activitiesLe Morne Development Corporation Ltd 30.09.12 20.0 PropertyMauritian Coal and Allied Services Company Ltd. 30.09.12 25.6 Coal supplierMautourco Ltd 30.09.12 49.0 Vehicle rental and tours Mozambique Airport Handling Services Limitada 30.09.12 29.0 Ground handling services**New Mauritius Hotels Limited 30.09.12 17.7 Hospitality
*Sainte Marie Crushing Plant Ltd. 30.06.13 8.8 Manufacture and Sale of Building materials
Ship Management Services Ltd. 30.09.12 50.0 Port related servicesSociété Grande Castagnole 30.09.12 49.0 InvestmentSociété Pur Blanca 30.09.12 49.0 InvestmentWhite Palm Ltd 30.09.12 49.0 Vehicle rental and tours **Lagoona Cruise Ltd 30.06.13 33.3 Boat Cruises activities
*Significant influence obtained through subsidiaries**Associate consolidated in 2013.For the associated companies having different reporting date, management accounts have been prepared at 30 June 2013.
Annual Report 2013128
18. INVESTMENT IN FINANCIAL ASSETS
(i) GROUP 30 June 2013
30 September 2012
In Rs million Level 1 Level 3 Total Total
Non-current
Available-for-sale investments
At 1 October 1,623.4 187.9 1,811.3 2,680.0
Additions - 7.8 7.8 26.1
Disposals - (62.7) (62.7) (7.4)
Change in fair value 18.6 47.2 65.8 (796.2)
Fair value released - - - (13.7)
Transfer (1,566.6) 8.5 (1,558.1) 0.2
Deconsolidation of group companies - - - (67.0)
Deconsolidation due to dividend in specie - - - (10.7)
At 30 June / September 75.4 188.7 264.1 1,811.3
Current
Loans and receivables originated by the enterprises
At 1 October - 12.5 12.5 72.7
Loans granted - 107.5 107.5 1,231.3
Loans repaid - (120.0) (120.0) (1,291.5)
At 30 June / September - - - 12.5
Level 1 financial assets are those with unadjusted quoted prices in active markets for identical investments.
Level 3 includes unobservable inputs that reflect directors assumptions about what factors market participants would use in pricing such investments. These inputs are based on the best information available including the Group’s own information.
(ii) COMPANY 30 June 2013
30 September 2012
Level 1 Level 3 Total Total
Non-current
Available for sale investments
At 1 October 1,622.0 125.5 1,747.5 2,589.7
Additions - 7.8 7.8 4.6
Change in fair value 18.6 48.5 67.1 (846.8)
Transfer (1,566.6) 7.3 (1,559.3) -
At 30 June / September 74.0 189.1 263.1 1,747.5
Current
Loans and receivables originated by the enterprises
At 1 October - - - 62.2
Loans granted - 107.5 107.5 1,229.3
Loans repaid - (107.5) (107.5) (1,291.5)
At 30 June / September - - - -
Total 74.0 189.1 263.1 1,747.5
Rogers and Company Limited 129

Explanatory Notes30 June 2013
19. BIOLOGICAL ASSETS
GROUP
In Rs million30 June 2013
30 September 2012
Bearer Biological Assets
Cost
At 1 October 76.9 84.7
Expenditure during the period 3.1 3.8
Disposals - (11.6)
At 30 June / September 80.0 76.9
Amortisation
At 1 October 56.4 62.1
Charge for the period / year 5.3 5.9
Disposal adjustments - (11.6)
At 30 June / September 61.7 56.4
Carrying value
At 30 June / September 18.3 20.5
Consumable Biological Assets 89.6 92.6
Bearer biological assets relate to the cost of land preparation and planting of virgin canes.
Consumable biological assets are stated at their fair values and relate to the value of standing crop, deer farming and palm trees.
The fair value of consumable biological assets has been arrived at by discounting the present value of expected net cash flows from standing canes at the relevant market determined pre-tax rate.
The expected cash flows have been computed by estimating the expected crop and the sugar extraction rate and the forecasts of sugar prices which will prevail in the coming year. The harvesting costs and other direct expenses are based on the yearly budgets of the subsidiaries.
20. LONG TERM LOANS RECEIVABLE
GROUP COMPANY30 June 2013
30 September 2012
30 June 2013
30 September 2012
Receivable from subsidiary companies - - - 14.8
Receivable from other companies 169.5 135.2 194.7 119.6
169.5 135.2 194.7 134.4
The carrying amount of long term loans receivable approximate their fair values, are unsecured and are repayable by instalments after more than one year.
Annual Report 2013130
21. dEFERREd ExPENdITURE
GROUP Sugar Industry
Voluntary Retirement
Scheme
Premium on leasehold
land Others TotalIn Rs million
Cost
At 1 October 2012 50.4 29.9 85.1 165.4
Additions - - 11.9 11.9
Transfer - - 66.9 66.9
At 30 June 2013 50.4 29.9 163.9 244.2
Amortisation
At 1 October 2012 49.1 7.3 69.7 126.1
Charge for the period 1.3 0.3 11.7 13.3
At 30 June 2013 50.4 7.6 81.4 139.4
Carrying value
At 30 June 2013 - 22.3 82.5 104.8
At 30 September 2012 1.3 22.6 15.4 39.3
Professional fees are included in Other deferred expenditure and will be released over the contract period.
22. INVENTORIES
GROUP30 June 2013
30 September 2012
Raw Materials and consumables 86.4 99.1
Goods for resale 117.0 27.6
Work in progress 3.9 1,026.0
207.3 1,152.7
Carrying value of inventories pledged 207.3 1,152.7
Value of inventories at cost 207.3 1,152.7
Rogers and Company Limited 131

Explanatory Notes30 June 2013
23. TRAdE ANd OThER RECEIVABLES
GROUP COMPANY
In Rs million30 June 2013
30 September 2012
30 June 2013
30 September 2012
Trade receivables 1,575.0 1,511.9 6.0 11.7 Less impairment (110.3) (183.6) (4.3) (4.9)
1,464.7 1,328.3 1.7 6.8 Prepayments 45.9 156.8 1.0 1.9 Receivable from associated companies 17.9 0.3 - -Other receivables 365.7 490.5 12.5 108.5
1,894.2 1,975.9 15.2 117.2 The carrying amount of the receivables is considered as a
reasonable approximation of fair value.
Ageing of trade receivablesLess than 3 months 1,288.6 1,075.6 1.4 6.1 Impairment (0.1) (0.3) - -
1,288.5 1,075.3 1.4 6.1 More than 3 months 121.3 234.3 0.3 0.4 Impairment (0.5) (6.6) - -
120.8 227.7 0.3 0.4 More than 6 months 165.1 202.0 4.3 5.2 Impairment (109.7) (176.7) (4.3) (4.9)
55.4 25.3 - 0.3
1,464.7 1,328.3 1.7 6.8
Impairment of trade receivablesAt 1 October (183.6) (337.7) (4.9) (3.3)Provision made during the period / year (18.5) (34.9) - (1.6)Written off during the period / year (1.3) (0.9) - - Release of provision 15.6 - 0.6 - Transfer 61.5 - - -Deconsolidation of group companies 16.0 11.9 - - Deconsolidation due to dividend in specie - 178.0 - -
At 30 June / September (110.3) (183.6) (4.3) (4.9)
24. AMOUNTS RECEIVABLE FROM GROUP COMPANIES
Subsidiary companies - - 47.2 599.7
25. CASh ANd CASh EQUIVALENTS
Short term loans receivable and deposits - 105.1 - 580.0 Bank balances and cash 446.2 515.6 10.5 22.9 Short term loans payable - - (315.2) (750.3)Bank overdrafts (555.5) (293.5) (289.4) -
(109.3) 327.2 (594.1) (147.4)
The bank overdrafts are secured by floating charges on the assets of the borrowing companies. The rate of interest varies between 6.9% and 9.4%, inclusive of foreign denominated overdrafts.
Non cash transactions 16.6 56.2 - -
Non cash transactions relate to the purchase of equipment and motor vehicles by means of finance leases.
Annual Report 2013132
26. ShARE CAPITAL
Authorised Issued and Fully Paid
In Rs million
30 June 2013
30 September 2012
30 June 2013
30 September 2012
Ordinary shares of Rs 10 each 500.0 500.0 252.0 252.0
The total number of ordinary shares in issue amounted to 25,204,530.
27. FINANCIAL ASSETS/LIABILITIES BY CATEGORY
(a) Financial assets by category
GROUP
Available for sale
Loans and receivables
Other financial assets Total
Per Statement of Financial Position
At 30 September 2012
Investment in financial assets (note 18) 1,811.3 12.5 - 1,823.8
Long term loans receivable (note 20) - 135.2 - 135.2
Trade and other receivables (note 23) - 1,819.1 - 1,819.1
Cash and cash equivalents (note 25) - - 515.6 515.6
1,811.3 1,966.8 515.6 4,293.7
At 30 June 2013
Investment in financial assets (note 18) 264.1 - - 264.1
Long term loans receivable (note 20) - 169.5 - 169.5
Trade and other receivables (note 23) - 1,848.3 - 1,848.3
Cash and cash equivalents (note 25) - - 446.2 446.2
264.1 2,017.8 446.2 2,728.1
COMPANY
Available for sale
Loans and receivables
Other financial assets Total
Per Statement of Financial Position
At 30 September 2012
Investment in financial assets (note 18) 1,747.5 - - 1,747.5
Long term loans receivable (note 20) - 134.4 - 134.4
Trade and other receivables (note 23) - 115.3 - 115.3
Amounts receivable from group companies (note 24) - 599.7 - 599.7
Cash and cash equivalents (note 25) - - 22.9 22.9
1,747.5 849.4 22.9 2,619.8
At 30 June 2013
Investment in financial assets (note 18) 263.1 - - 263.1
Long term loans receivable (note 20) - 194.7 - 194.7
Trade and other receivables (note 23) - 15.2 - 15.2
Amounts receivable from group companies (note 24) - 47.2 - 47.2
Cash and cash equivalents (note 25) - - 10.5 10.5
263.1 257.1 10.5 530.7
Rogers and Company Limited 133
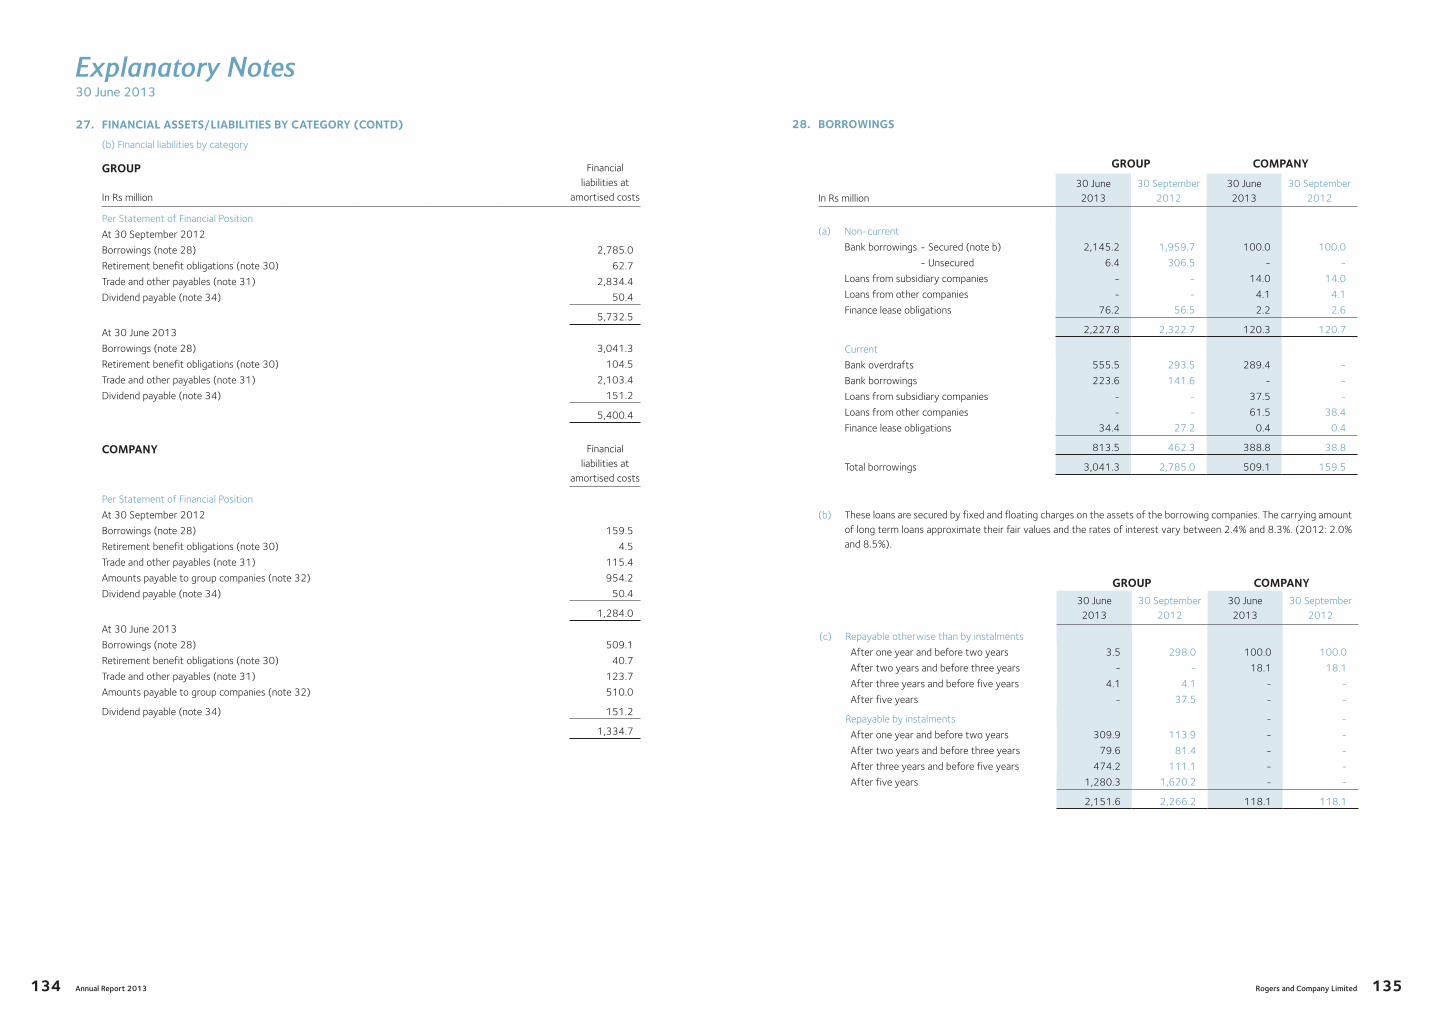
Explanatory Notes30 June 2013
27. FINANCIAL ASSETS/LIABILITIES BY CATEGORY (CONTd)
(b) Financial liabilities by category
GROUP Financial liabilities at
amortised costs In Rs million
Per Statement of Financial Position
At 30 September 2012
Borrowings (note 28) 2,785.0
Retirement benefit obligations (note 30) 62.7
Trade and other payables (note 31) 2,834.4
Dividend payable (note 34) 50.4
5,732.5
At 30 June 2013
Borrowings (note 28) 3,041.3
Retirement benefit obligations (note 30) 104.5
Trade and other payables (note 31) 2,103.4
Dividend payable (note 34) 151.2
5,400.4
COMPANY Financial liabilities at
amortised costs
Per Statement of Financial Position
At 30 September 2012
Borrowings (note 28) 159.5
Retirement benefit obligations (note 30) 4.5
Trade and other payables (note 31) 115.4
Amounts payable to group companies (note 32) 954.2
Dividend payable (note 34) 50.4
1,284.0
At 30 June 2013
Borrowings (note 28) 509.1
Retirement benefit obligations (note 30) 40.7
Trade and other payables (note 31) 123.7
Amounts payable to group companies (note 32) 510.0
Dividend payable (note 34) 151.2
1,334.7
Annual Report 2013134
28. BORROWINGS
GROUP COMPANY
In Rs million30 June 2013
30 September 2012
30 June 2013
30 September 2012
(a) Non-current
Bank borrowings - Secured (note b) 2,145.2 1,959.7 100.0 100.0
- Unsecured 6.4 306.5 - -
Loans from subsidiary companies - - 14.0 14.0
Loans from other companies - - 4.1 4.1
Finance lease obligations 76.2 56.5 2.2 2.6
2,227.8 2,322.7 120.3 120.7
Current
Bank overdrafts 555.5 293.5 289.4 -
Bank borrowings 223.6 141.6 - -
Loans from subsidiary companies - - 37.5 -
Loans from other companies - - 61.5 38.4
Finance lease obligations 34.4 27.2 0.4 0.4
813.5 462.3 388.8 38.8
Total borrowings 3,041.3 2,785.0 509.1 159.5
(b) These loans are secured by fixed and floating charges on the assets of the borrowing companies. The carrying amount of long term loans approximate their fair values and the rates of interest vary between 2.4% and 8.3%. (2012: 2.0% and 8.5%).
GROUP COMPANY30 June 2013
30 September 2012
30 June 2013
30 September 2012
(c) Repayable otherwise than by instalments
After one year and before two years 3.5 298.0 100.0 100.0
After two years and before three years - - 18.1 18.1
After three years and before five years 4.1 4.1 - -
After five years - 37.5 - -
Repayable by instalments - -
After one year and before two years 309.9 113.9 - -
After two years and before three years 79.6 81.4 - -
After three years and before five years 474.2 111.1 - -
After five years 1,280.3 1,620.2 - -
2,151.6 2,266.2 118.1 118.1
Rogers and Company Limited 135

Explanatory Notes30 June 2013
28. BORROWINGS (CONTd)
GROUP COMPANY
In Rs million30 June 2013
30 September 2012
30 June 2013
30 September 2012
(d) Finance lease obligations
Finance lease liabilities - minimum lease payments
Within one year 54.5 35.0 0.4 0.4
After one year and before two years 20.4 4.1 0.4 0.4
After two years and before three years 15.5 3.6 0.5 0.5
After three years and before five years 20.5 41.3 1.3 1.0
After five years - - - 0.7
110.9 84.0 2.6 3.0
Future finance charges (0.3) (0.3) - -
Present value of finance lease obligations 110.6 83.7 2.6 3.0
Within one year 34.4 27.2 0.4 0.4
After one year and before two years 23.5 4.5 0.4 0.4
After two years and before three years 19.8 3.0 0.5 0.5
After three years and before five years 32.9 49.0 1.3 1.0
After five years - - - 0.7
110.6 83.7 2.6 3.0
29. dEFERREd TAx LIABILITIES
(a) At 1 October 213.8 463.1 - 5.7
Released to Statement of Profit or Loss (45.0) (51.9) - (5.7)
Released to Statement of Profit or loss and Other Comprehensive Income 79.8 (186.5) - -
Acquisition of group companies (4.5) - - -
Deconsolidation of group companies 1.3 (3.9) - -
Deconsolidation due to dividend in specie - (7.0) - -
At 30 June / September 245.4 213.8 - -
Annual Report 2013136
29. dEFERREd TAx LIABILITIES (CONTd)
(b) The movement in deferred tax liabilities during the year is as follows:
GROUP
In Rs million
Accelerated Capital
Allowance
Retirement Benefit
Obligation
Impairment Loss / Fair
Value Total
At 1 October 2011 468.5 (0.4) (5.0) 463.1
Released to Statement of Profit or Loss (55.3) - 3.4 (51.9)
Released to Statement of Profit or Loss and Other Comprehensive Income (186.5) - - (186.5)
Deconsolidation of group companies (3.9) - - (3.9)Deconsolidation due to dividend in specie (7.5) - 0.5 (7.0)
At 30 September 2012 215.3 (0.4) (1.1) 213.8
Released to Statement of Profit or Loss (45.0) - - (45.0)
Released to Statement of Profit or Loss and Other Comprehensive Income 24.4 - 55.4 79.8
Acquisition of group companies (4.5) - - (4.5)
Deconsolidation of group companies 1.3 - - 1.3
At 30 June 2013 191.5 (0.4) 54.3 245.4
30. RETIREMENT BENEFIT OBLIGATIONS
GROUP COMPANY30 June 2013
30 September 2012
30 June 2013
30 September 2012
Amounts recognised in the Statements of Financial Position
Pension plan (Note(a)) 29.2 (10.2) 13.9 (23.0)
Other retirement benefits (Note (b)) 75.3 72.9 26.8 27.5
104.5 62.7 40.7 4.5
(a) Pension plan
The Group runs a defined contribution plan, the Rogers Money Purchase Retirement Fund (RMPRF), to which have been transferred the pension benefits of all employees who were members of a self-administered defined benefit superannuation fund (DBSF). These employees, subject to them contributing regularly to the RMPRF, have been given the guarantee by their respective employers that their benefits at the age of sixty, under the RMPRF would not be less than the benefits provided under the ex DBSF. The potential liability under the above guarantee is funded by additional employers’ contributions and has been included in the provision made for retirement benefit obligations.
In addition to the above, three companies have defined benefit plans which are funded and where the plan assets are held by The Anglo Mauritius Assurance Society Ltd and The Sugar Industry Pension Fund.
Rogers and Company Limited 137
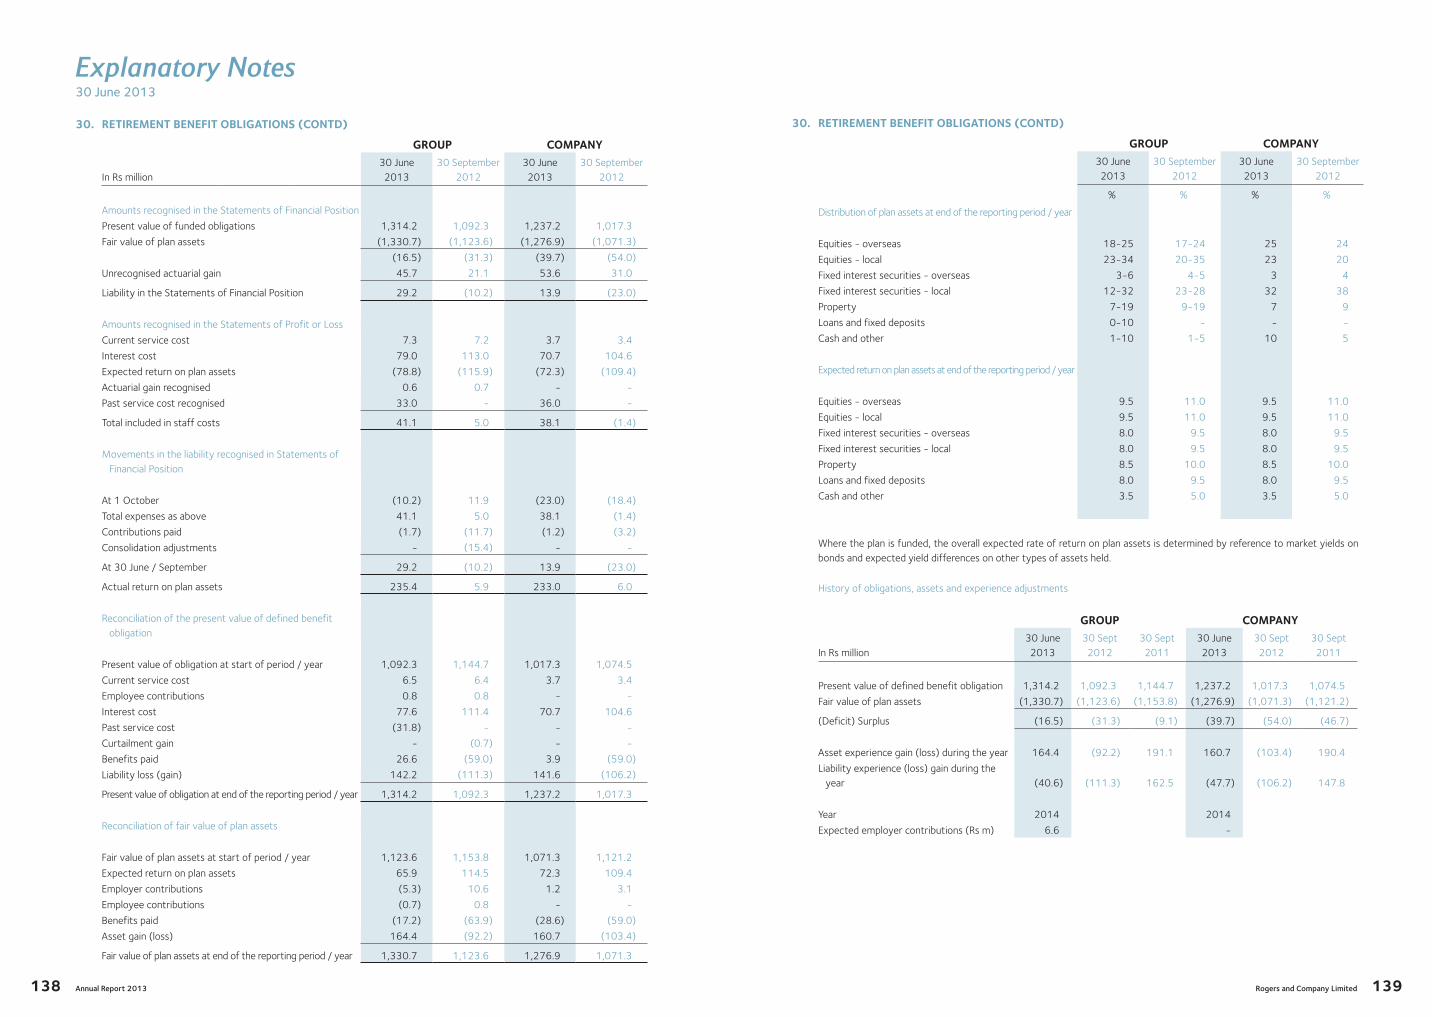
Explanatory Notes30 June 2013
30. RETIREMENT BENEFIT OBLIGATIONS (CONTd)
GROUP COMPANY
In Rs million30 June 2013
30 September 2012
30 June 2013
30 September 2012
Amounts recognised in the Statements of Financial Position
Present value of funded obligations 1,314.2 1,092.3 1,237.2 1,017.3
Fair value of plan assets (1,330.7) (1,123.6) (1,276.9) (1,071.3)
(16.5) (31.3) (39.7) (54.0)
Unrecognised actuarial gain 45.7 21.1 53.6 31.0
Liability in the Statements of Financial Position 29.2 (10.2) 13.9 (23.0)
Amounts recognised in the Statements of Profit or Loss
Current service cost 7.3 7.2 3.7 3.4
Interest cost 79.0 113.0 70.7 104.6
Expected return on plan assets (78.8) (115.9) (72.3) (109.4)
Actuarial gain recognised 0.6 0.7 - -
Past service cost recognised 33.0 - 36.0 -
Total included in staff costs 41.1 5.0 38.1 (1.4)
Movements in the liability recognised in Statements of Financial Position
At 1 October (10.2) 11.9 (23.0) (18.4)
Total expenses as above 41.1 5.0 38.1 (1.4)
Contributions paid (1.7) (11.7) (1.2) (3.2)
Consolidation adjustments - (15.4) - -
At 30 June / September 29.2 (10.2) 13.9 (23.0)
Actual return on plan assets 235.4 5.9 233.0 6.0
Reconciliation of the present value of defined benefit obligation
Present value of obligation at start of period / year 1,092.3 1,144.7 1,017.3 1,074.5
Current service cost 6.5 6.4 3.7 3.4
Employee contributions 0.8 0.8 - -
Interest cost 77.6 111.4 70.7 104.6
Past service cost (31.8) - - -
Curtailment gain - (0.7) - -
Benefits paid 26.6 (59.0) 3.9 (59.0)
Liability loss (gain) 142.2 (111.3) 141.6 (106.2)
Present value of obligation at end of the reporting period / year 1,314.2 1,092.3 1,237.2 1,017.3
Reconciliation of fair value of plan assets
Fair value of plan assets at start of period / year 1,123.6 1,153.8 1,071.3 1,121.2
Expected return on plan assets 65.9 114.5 72.3 109.4
Employer contributions (5.3) 10.6 1.2 3.1
Employee contributions (0.7) 0.8 - -
Benefits paid (17.2) (63.9) (28.6) (59.0)
Asset gain (loss) 164.4 (92.2) 160.7 (103.4)
Fair value of plan assets at end of the reporting period / year 1,330.7 1,123.6 1,276.9 1,071.3
Annual Report 2013138
30. RETIREMENT BENEFIT OBLIGATIONS (CONTd)
GROUP COMPANY30 June 2013
30 September 2012
30 June 2013
30 September 2012
% % % %
Distribution of plan assets at end of the reporting period / year
Equities - overseas 18-25 17-24 25 24
Equities - local 23-34 20-35 23 20
Fixed interest securities - overseas 3-6 4-5 3 4
Fixed interest securities - local 12-32 23-28 32 38
Property 7-19 9-19 7 9
Loans and fixed deposits 0-10 - - -
Cash and other 1-10 1-5 10 5
Expected return on plan assets at end of the reporting period / year
Equities - overseas 9.5 11.0 9.5 11.0
Equities - local 9.5 11.0 9.5 11.0
Fixed interest securities - overseas 8.0 9.5 8.0 9.5
Fixed interest securities - local 8.0 9.5 8.0 9.5
Property 8.5 10.0 8.5 10.0
Loans and fixed deposits 8.0 9.5 8.0 9.5
Cash and other 3.5 5.0 3.5 5.0
Where the plan is funded, the overall expected rate of return on plan assets is determined by reference to market yields on bonds and expected yield differences on other types of assets held.
History of obligations, assets and experience adjustments
GROUP COMPANY
In Rs million30 June 2013
30 Sept 2012
30 Sept 2011
30 June 2013
30 Sept 2012
30 Sept 2011
Present value of defined benefit obligation 1,314.2 1,092.3 1,144.7 1,237.2 1,017.3 1,074.5
Fair value of plan assets (1,330.7) (1,123.6) (1,153.8) (1,276.9) (1,071.3) (1,121.2)
(Deficit) Surplus (16.5) (31.3) (9.1) (39.7) (54.0) (46.7)
Asset experience gain (loss) during the year 164.4 (92.2) 191.1 160.7 (103.4) 190.4
Liability experience (loss) gain during the year (40.6) (111.3) 162.5 (47.7) (106.2) 147.8
Year 2014 2014
Expected employer contributions (Rs m) 6.6 -
Rogers and Company Limited 139
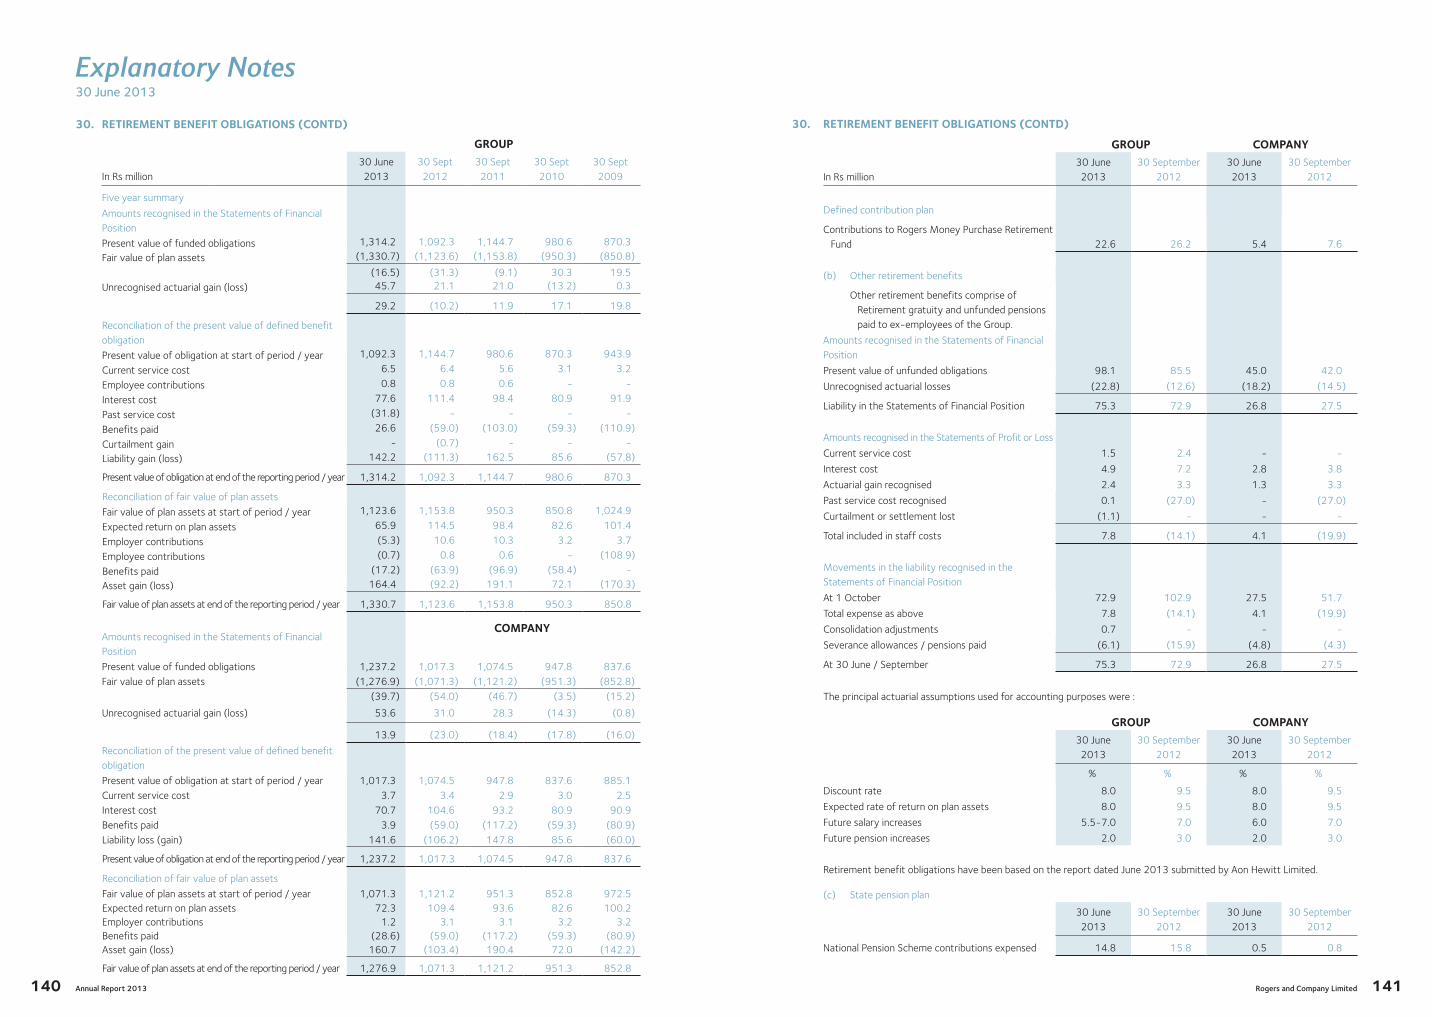
Explanatory Notes30 June 2013
30. RETIREMENT BENEFIT OBLIGATIONS (CONTd)
GROUP
In Rs million30 June 2013
30 Sept 2012
30 Sept 2011
30 Sept 2010
30 Sept 2009
Five year summary
Amounts recognised in the Statements of Financial Position
Present value of funded obligations 1,314.2 1,092.3 1,144.7 980.6 870.3
Fair value of plan assets (1,330.7) (1,123.6) (1,153.8) (950.3) (850.8)
(16.5) (31.3) (9.1) 30.3 19.5 Unrecognised actuarial gain (loss) 45.7 21.1 21.0 (13.2) 0.3
29.2 (10.2) 11.9 17.1 19.8
Reconciliation of the present value of defined benefit obligation
Present value of obligation at start of period / year 1,092.3 1,144.7 980.6 870.3 943.9
Current service cost 6.5 6.4 5.6 3.1 3.2
Employee contributions 0.8 0.8 0.6 - -
Interest cost 77.6 111.4 98.4 80.9 91.9
Past service cost (31.8) - - - -
Benefits paid 26.6 (59.0) (103.0) (59.3) (110.9)
Curtailment gain - (0.7) - - -
Liability gain (loss) 142.2 (111.3) 162.5 85.6 (57.8)
Present value of obligation at end of the reporting period / year 1,314.2 1,092.3 1,144.7 980.6 870.3
Reconciliation of fair value of plan assets
Fair value of plan assets at start of period / year 1,123.6 1,153.8 950.3 850.8 1,024.9
Expected return on plan assets 65.9 114.5 98.4 82.6 101.4
Employer contributions (5.3) 10.6 10.3 3.2 3.7
Employee contributions (0.7) 0.8 0.6 - (108.9)
Benefits paid (17.2) (63.9) (96.9) (58.4) -
Asset gain (loss) 164.4 (92.2) 191.1 72.1 (170.3)
Fair value of plan assets at end of the reporting period / year 1,330.7 1,123.6 1,153.8 950.3 850.8
COMPANYAmounts recognised in the Statements of Financial Position
Present value of funded obligations 1,237.2 1,017.3 1,074.5 947.8 837.6 Fair value of plan assets (1,276.9) (1,071.3) (1,121.2) (951.3) (852.8)
(39.7) (54.0) (46.7) (3.5) (15.2)
Unrecognised actuarial gain (loss) 53.6 31.0 28.3 (14.3) (0.8)
13.9 (23.0) (18.4) (17.8) (16.0)
Reconciliation of the present value of defined benefit obligation
Present value of obligation at start of period / year 1,017.3 1,074.5 947.8 837.6 885.1 Current service cost 3.7 3.4 2.9 3.0 2.5 Interest cost 70.7 104.6 93.2 80.9 90.9 Benefits paid 3.9 (59.0) (117.2) (59.3) (80.9)Liability loss (gain) 141.6 (106.2) 147.8 85.6 (60.0)
Present value of obligation at end of the reporting period / year 1,237.2 1,017.3 1,074.5 947.8 837.6
Reconciliation of fair value of plan assets
Fair value of plan assets at start of period / year 1,071.3 1,121.2 951.3 852.8 972.5 Expected return on plan assets 72.3 109.4 93.6 82.6 100.2 Employer contributions 1.2 3.1 3.1 3.2 3.2 Benefits paid (28.6) (59.0) (117.2) (59.3) (80.9)Asset gain (loss) 160.7 (103.4) 190.4 72.0 (142.2)
Fair value of plan assets at end of the reporting period / year 1,276.9 1,071.3 1,121.2 951.3 852.8
Annual Report 2013140
30. RETIREMENT BENEFIT OBLIGATIONS (CONTd)
GROUP COMPANY
In Rs million30 June 2013
30 September 2012
30 June 2013
30 September 2012
Defined contribution plan
Contributions to Rogers Money Purchase Retirement Fund 22.6 26.2 5.4 7.6
(b) Other retirement benefits
Other retirement benefits comprise of Retirement gratuity and unfunded pensions paid to ex-employees of the Group.
Amounts recognised in the Statements of Financial Position
Present value of unfunded obligations 98.1 85.5 45.0 42.0
Unrecognised actuarial losses (22.8) (12.6) (18.2) (14.5)
Liability in the Statements of Financial Position 75.3 72.9 26.8 27.5
Amounts recognised in the Statements of Profit or Loss
Current service cost 1.5 2.4 - -
Interest cost 4.9 7.2 2.8 3.8
Actuarial gain recognised 2.4 3.3 1.3 3.3
Past service cost recognised 0.1 (27.0) - (27.0)
Curtailment or settlement lost (1.1) - - -
Total included in staff costs 7.8 (14.1) 4.1 (19.9)
Movements in the liability recognised in the Statements of Financial Position
At 1 October 72.9 102.9 27.5 51.7
Total expense as above 7.8 (14.1) 4.1 (19.9)
Consolidation adjustments 0.7 - - -
Severance allowances / pensions paid (6.1) (15.9) (4.8) (4.3)
At 30 June / September 75.3 72.9 26.8 27.5
The principal actuarial assumptions used for accounting purposes were :
GROUP COMPANY30 June 2013
30 September 2012
30 June 2013
30 September 2012
% % % %
Discount rate 8.0 9.5 8.0 9.5
Expected rate of return on plan assets 8.0 9.5 8.0 9.5
Future salary increases 5.5-7.0 7.0 6.0 7.0
Future pension increases 2.0 3.0 2.0 3.0
Retirement benefit obligations have been based on the report dated June 2013 submitted by Aon Hewitt Limited.
(c) State pension plan
30 June 2013
30 September 2012
30 June 2013
30 September 2012
National Pension Scheme contributions expensed 14.8 15.8 0.5 0.8
Rogers and Company Limited 141
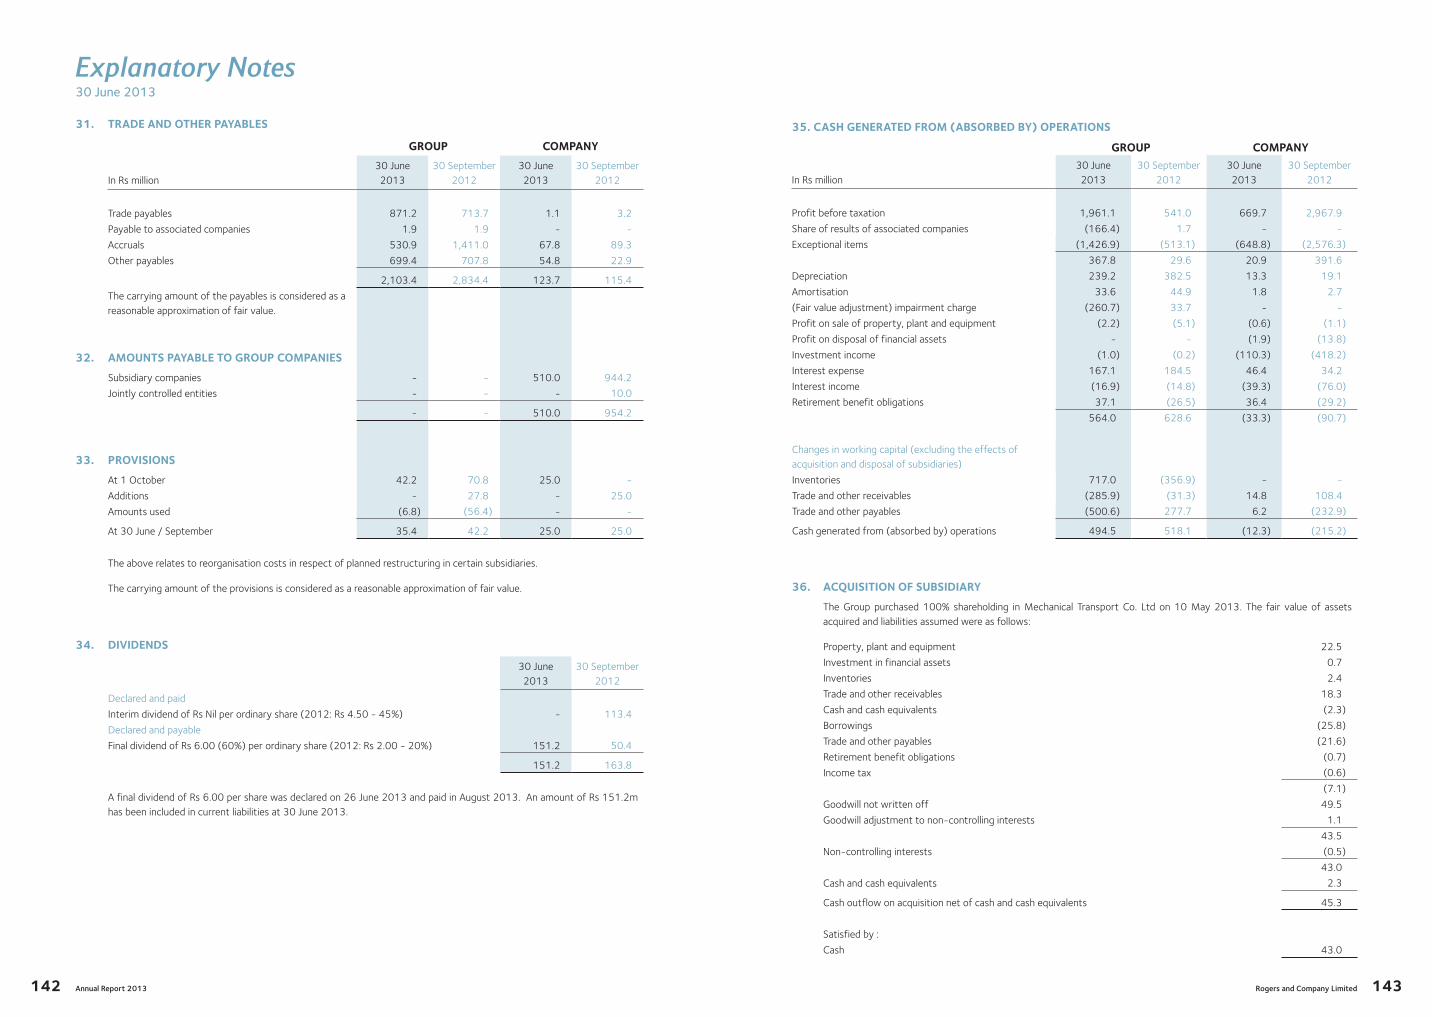
Explanatory Notes30 June 2013
31. TRAdE ANd OThER PAYABLES
GROUP COMPANY
In Rs million30 June 2013
30 September 2012
30 June 2013
30 September 2012
Trade payables 871.2 713.7 1.1 3.2
Payable to associated companies 1.9 1.9 - -
Accruals 530.9 1,411.0 67.8 89.3
Other payables 699.4 707.8 54.8 22.9
2,103.4 2,834.4 123.7 115.4
The carrying amount of the payables is considered as a reasonable approximation of fair value.
32. AMOUNTS PAYABLE TO GROUP COMPANIES
Subsidiary companies - - 510.0 944.2
Jointly controlled entities - - - 10.0
- - 510.0 954.2
33. PROVISIONS
At 1 October 42.2 70.8 25.0 -
Additions - 27.8 - 25.0
Amounts used (6.8) (56.4) - -
At 30 June / September 35.4 42.2 25.0 25.0
The above relates to reorganisation costs in respect of planned restructuring in certain subsidiaries.
The carrying amount of the provisions is considered as a reasonable approximation of fair value.
34. dIVIdENdS
30 June 2013
30 September 2012
Declared and paid
Interim dividend of Rs Nil per ordinary share (2012: Rs 4.50 - 45%) - 113.4
Declared and payable
Final dividend of Rs 6.00 (60%) per ordinary share (2012: Rs 2.00 - 20%) 151.2 50.4
151.2 163.8
A final dividend of Rs 6.00 per share was declared on 26 June 2013 and paid in August 2013. An amount of Rs 151.2m has been included in current liabilities at 30 June 2013.
Annual Report 2013142
35. CASh GENERATEd FROM (ABSORBEd BY) OPERATIONS
GROUP COMPANY
In Rs million30 June 2013
30 September 2012
30 June 2013
30 September 2012
Profit before taxation 1,961.1 541.0 669.7 2,967.9
Share of results of associated companies (166.4) 1.7 - -
Exceptional items (1,426.9) (513.1) (648.8) (2,576.3)
367.8 29.6 20.9 391.6
Depreciation 239.2 382.5 13.3 19.1
Amortisation 33.6 44.9 1.8 2.7
(Fair value adjustment) impairment charge (260.7) 33.7 - -
Profit on sale of property, plant and equipment (2.2) (5.1) (0.6) (1.1)
Profit on disposal of financial assets - - (1.9) (13.8)
Investment income (1.0) (0.2) (110.3) (418.2)
Interest expense 167.1 184.5 46.4 34.2
Interest income (16.9) (14.8) (39.3) (76.0)
Retirement benefit obligations 37.1 (26.5) 36.4 (29.2)
564.0 628.6 (33.3) (90.7)
Changes in working capital (excluding the effects of acquisition and disposal of subsidiaries)
Inventories 717.0 (356.9) - -
Trade and other receivables (285.9) (31.3) 14.8 108.4
Trade and other payables (500.6) 277.7 6.2 (232.9)
Cash generated from (absorbed by) operations 494.5 518.1 (12.3) (215.2)
36. ACQUISITION OF SUBSIdIARY
The Group purchased 100% shareholding in Mechanical Transport Co. Ltd on 10 May 2013. The fair value of assets acquired and liabilities assumed were as follows:
Property, plant and equipment 22.5
Investment in financial assets 0.7
Inventories 2.4
Trade and other receivables 18.3
Cash and cash equivalents (2.3)
Borrowings (25.8)
Trade and other payables (21.6)
Retirement benefit obligations (0.7)
Income tax (0.6)
(7.1)
Goodwill not written off 49.5
Goodwill adjustment to non-controlling interests 1.1
43.5
Non-controlling interests (0.5)
43.0
Cash and cash equivalents 2.3
Cash outflow on acquisition net of cash and cash equivalents 45.3
Satisfied by :
Cash 43.0
Rogers and Company Limited 143
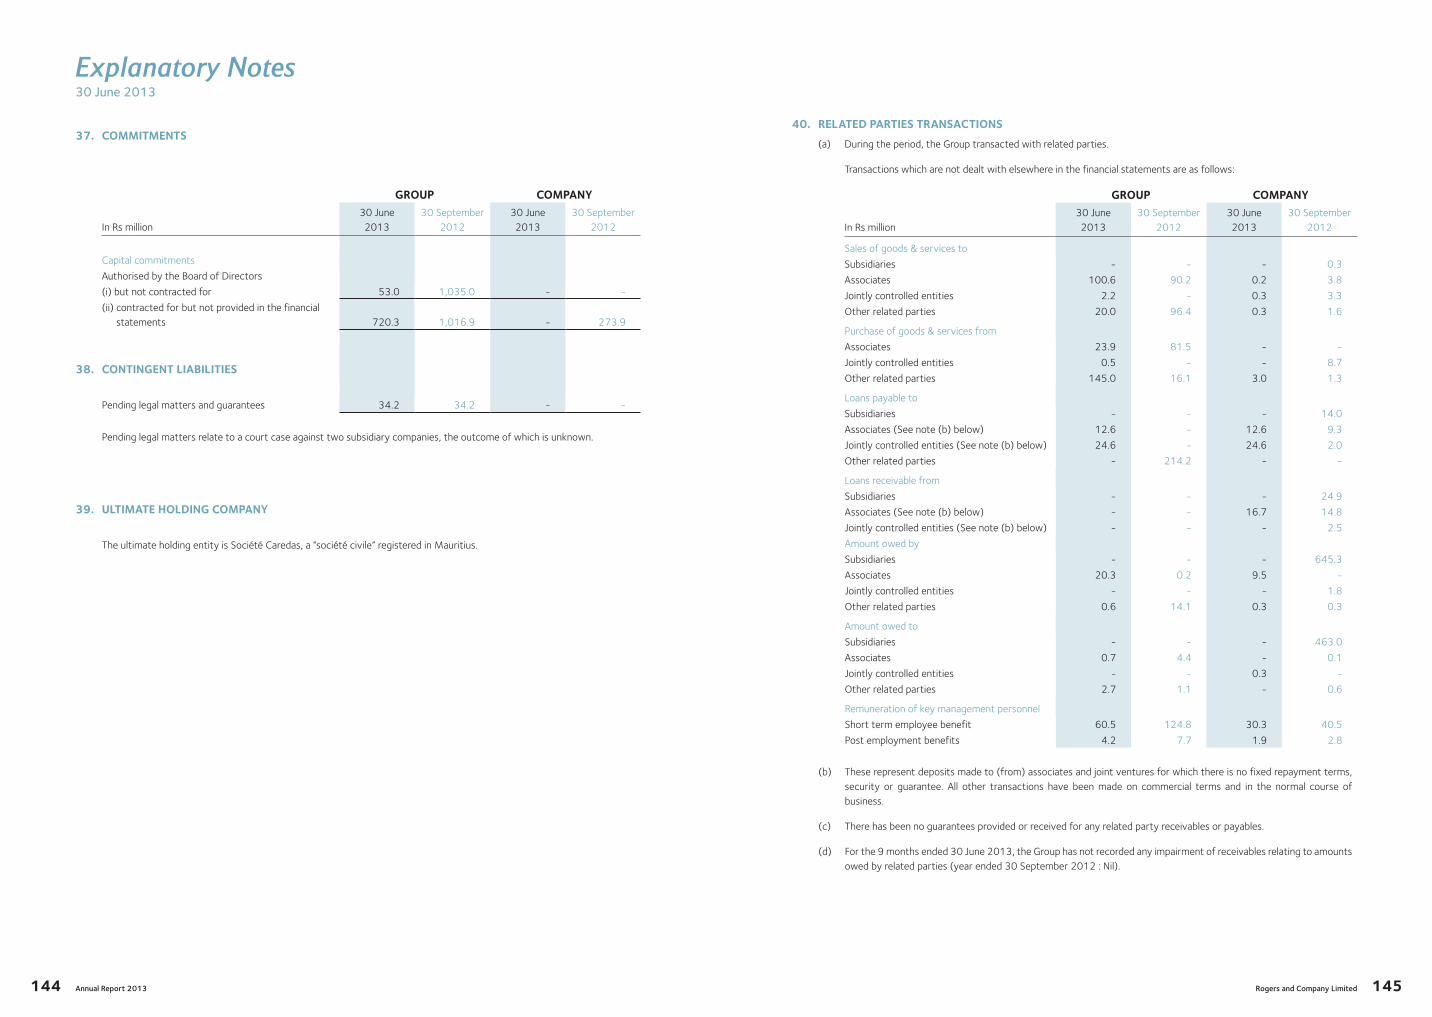
Explanatory Notes30 June 2013
37. COMMITMENTS
GROUP COMPANY
In Rs million30 June 2013
30 September 2012
30 June 2013
30 September 2012
Capital commitments
Authorised by the Board of Directors
(i) but not contracted for 53.0 1,035.0 - -
(ii) contracted for but not provided in the financial statements 720.3 1,016.9 - 273.9
38. CONTINGENT LIABILITIES
Pending legal matters and guarantees 34.2 34.2 - -
Pending legal matters relate to a court case against two subsidiary companies, the outcome of which is unknown.
39. ULTIMATE hOLdING COMPANY
The ultimate holding entity is Société Caredas, a “société civile” registered in Mauritius.
Annual Report 2013144
40. RELATEd PARTIES TRANSACTIONS
(a) During the period, the Group transacted with related parties.
Transactions which are not dealt with elsewhere in the financial statements are as follows:
GROUP COMPANY
In Rs million30 June 2013
30 September 2012
30 June 2013
30 September 2012
Sales of goods & services to
Subsidiaries - - - 0.3
Associates 100.6 90.2 0.2 3.8
Jointly controlled entities 2.2 - 0.3 3.3
Other related parties 20.0 96.4 0.3 1.6
Purchase of goods & services from
Associates 23.9 81.5 - -
Jointly controlled entities 0.5 - - 8.7
Other related parties 145.0 16.1 3.0 1.3
Loans payable to
Subsidiaries - - - 14.0
Associates (See note (b) below) 12.6 - 12.6 9.3
Jointly controlled entities (See note (b) below) 24.6 - 24.6 2.0
Other related parties - 214.2 - -
Loans receivable from
Subsidiaries - - - 24.9
Associates (See note (b) below) - - 16.7 14.8
Jointly controlled entities (See note (b) below) - - - 2.5
Amount owed by
Subsidiaries - - - 645.3
Associates 20.3 0.2 9.5 -
Jointly controlled entities - - - 1.8
Other related parties 0.6 14.1 0.3 0.3
Amount owed to
Subsidiaries - - - 463.0
Associates 0.7 4.4 - 0.1
Jointly controlled entities - - 0.3 -
Other related parties 2.7 1.1 - 0.6
Remuneration of key management personnel
Short term employee benefit 60.5 124.8 30.3 40.5
Post employment benefits 4.2 7.7 1.9 2.8
(b) These represent deposits made to (from) associates and joint ventures for which there is no fixed repayment terms, security or guarantee. All other transactions have been made on commercial terms and in the normal course of business.
(c) There has been no guarantees provided or received for any related party receivables or payables.
(d) For the 9 months ended 30 June 2013, the Group has not recorded any impairment of receivables relating to amounts owed by related parties (year ended 30 September 2012 : Nil).
Rogers and Company Limited 145

Explanatory Notes30 June 2013
41. BUSINESS SEGMENTS
9 months ended 30 June 2013
AviationFinancial Services Hospitality Logistics Property
Real Estate and
Agribusiness TechnologyCorporate
OfficeCorporateTreasury
GroupElimination TOTALIn Rs million
Revenue 371 9 1,409 2,052 348 821 253 123 - (358) 5,028
Segment profit (loss) from operations before finance costs 36 1 124 87 137 (45) 9 (56) 2 (25) 270
Finance costs (2) - (92) (25) (28) (23) (1) - (21) 25 (167)
Fair value gain on investment properties - - - - 34 231 - - - - 265
Share of results of associated companies 19 52 93 - - 1 - 1 - - 166
Profit (loss) before exceptional items 53 53 125 62 143 164 8 (55) (19) - 534
Exceptional Items 6 - - - - 86 - 1,335 - - 1,427
Profit (loss) before taxation 59 53 125 62 143 250 8 1,280 (19) - 1,961
Taxation (11) - 47 (8) (22) 6 1 - - - 13
Profit (loss) for the period 48 53 172 54 121 256 9 1,280 (19) - 1,974
Impairment of assets included in segment profit (1) - (6) (8) - (5) (1) 3 - - (18)
Assets 1,219 77 6,126 2,185 3,238 3,680 144 1,054 3,149 (3,516) 17,356
Liabilities 876 4 3,670 1,301 911 643 78 63 1,675 (3,516) 5,705
Capital expenditure (8) - (28) (40) (472) (24) (10) (2) - - (584)
Depreciation & amortisation (14) (1) (138) (42) (12) (42) (10) (11) - - (270)
(a) Operating segments are reported in a manner consistent with the internal reporting provided to the Chief Executive Officers.
(b) Product description of above segments:
Aviation - GSA of airlines, travel agency and catamaran tours.
Financial Services – Asset management, investment in Intendance Holding Ltd and Anglo-Mauritius Financial Solutions Ltd.
Hospitality - Hotel and Spa services, golf course and investment in New Mauritius Hotels Ltd.
Logistics - Freight forwarding, warehousing, courrier services, packing of special sugars, shipping agency and port related services.
Property - Property management and rentals.
Real Estate and Agribusiness - Construction and sale of villas and agriculture.
Technology - Information Solution providers and business process outsourcing.
Corporate Office - Strategy monitoring, support to SBUs, performance monitoring and statutory reporting.
Corporate Treasury - Net financing costs.
Annual Report 2013146
41. BUSINESS SEGMENTS
9 months ended 30 June 2013
AviationFinancial Services Hospitality Logistics Property
Real Estate and
Agribusiness TechnologyCorporate
OfficeCorporateTreasury
GroupElimination TOTALIn Rs million
Revenue 371 9 1,409 2,052 348 821 253 123 - (358) 5,028
Segment profit (loss) from operations before finance costs 36 1 124 87 137 (45) 9 (56) 2 (25) 270
Finance costs (2) - (92) (25) (28) (23) (1) - (21) 25 (167)
Fair value gain on investment properties - - - - 34 231 - - - - 265
Share of results of associated companies 19 52 93 - - 1 - 1 - - 166
Profit (loss) before exceptional items 53 53 125 62 143 164 8 (55) (19) - 534
Exceptional Items 6 - - - - 86 - 1,335 - - 1,427
Profit (loss) before taxation 59 53 125 62 143 250 8 1,280 (19) - 1,961
Taxation (11) - 47 (8) (22) 6 1 - - - 13
Profit (loss) for the period 48 53 172 54 121 256 9 1,280 (19) - 1,974
Impairment of assets included in segment profit (1) - (6) (8) - (5) (1) 3 - - (18)
Assets 1,219 77 6,126 2,185 3,238 3,680 144 1,054 3,149 (3,516) 17,356
Liabilities 876 4 3,670 1,301 911 643 78 63 1,675 (3,516) 5,705
Capital expenditure (8) - (28) (40) (472) (24) (10) (2) - - (584)
Depreciation & amortisation (14) (1) (138) (42) (12) (42) (10) (11) - - (270)
(a) Operating segments are reported in a manner consistent with the internal reporting provided to the Chief Executive Officers.
(b) Product description of above segments:
Aviation - GSA of airlines, travel agency and catamaran tours.
Financial Services – Asset management, investment in Intendance Holding Ltd and Anglo-Mauritius Financial Solutions Ltd.
Hospitality - Hotel and Spa services, golf course and investment in New Mauritius Hotels Ltd.
Logistics - Freight forwarding, warehousing, courrier services, packing of special sugars, shipping agency and port related services.
Property - Property management and rentals.
Real Estate and Agribusiness - Construction and sale of villas and agriculture.
Technology - Information Solution providers and business process outsourcing.
Corporate Office - Strategy monitoring, support to SBUs, performance monitoring and statutory reporting.
Corporate Treasury - Net financing costs.
Rogers and Company Limited 147

Explanatory Notes30 June 2013
41. BUSINESS SEGMENTS (CONTd)
Year ended 30 September 2012
AviationFinancial Services Hospitality Logistics Property
Real Estate and
Agribusiness TechnologyCorporate
OfficeCorporateTreasury
GroupElimination
Continuing Operations
Discontinued Operations TOTALIn Rs million
Revenue 502 654 1,604 2,336 396 1,050 303 171 9 (566) 6,459 2,986 9,445
Segment profit (loss) from operations before finance costs 51 55 (17) 77 148 (1) 2 (84) (23) (55) 153 726 879
Finance costs (9) (2) (151) (37) (50) (35) (1) - 45 55 (185) (291) (476)
Fair value gain on investment properties - - - - 60 2 - - - - 62 - 62
Share of results of associated companies 11 15 - - - (32) - 4 - - (2) 45 43
Profit (loss) before exceptional items 53 68 (168) 40 158 (66) 1 (80) 22 - 28 480 508
Exceptional Items - - - - (7) (17) - 537 - - 513 224 737
Profit (loss) before taxation 53 68 (168) 40 151 (83) 1 457 22 - 541 704 1,245
Taxation (19) (8) 21 (6) 9 (7) - 2 - - (8) (78) (86)
Profit (loss) for the year 34 60 (147) 34 160 (90) 1 459 22 - 533 626 1,159
Impairment of assets included in segment profit (13) 12 (4) (10) (10) - - (1) (21) - (47) - (47)
Assets 1,095 24 5,722 1,713 2,982 4,344 135 642 3,470 (5,107) 15,020
Liabilities 824 9 3,899 1,215 881 2,480 72 145 1,607 (5,107) 6,025
Capital expenditure (30) - (48) (38) (15) (44) - (31) - - (206)
Depreciation & amortisation (20) (6) (255) (50) (19) (49) (13) (15) - - (427)
Annual Report 2013148
41. BUSINESS SEGMENTS (CONTd)
Year ended 30 September 2012
AviationFinancial Services Hospitality Logistics Property
Real Estate and
Agribusiness TechnologyCorporate
OfficeCorporateTreasury
GroupElimination
Continuing Operations
Discontinued Operations TOTALIn Rs million
Revenue 502 654 1,604 2,336 396 1,050 303 171 9 (566) 6,459 2,986 9,445
Segment profit (loss) from operations before finance costs 51 55 (17) 77 148 (1) 2 (84) (23) (55) 153 726 879
Finance costs (9) (2) (151) (37) (50) (35) (1) - 45 55 (185) (291) (476)
Fair value gain on investment properties - - - - 60 2 - - - - 62 - 62
Share of results of associated companies 11 15 - - - (32) - 4 - - (2) 45 43
Profit (loss) before exceptional items 53 68 (168) 40 158 (66) 1 (80) 22 - 28 480 508
Exceptional Items - - - - (7) (17) - 537 - - 513 224 737
Profit (loss) before taxation 53 68 (168) 40 151 (83) 1 457 22 - 541 704 1,245
Taxation (19) (8) 21 (6) 9 (7) - 2 - - (8) (78) (86)
Profit (loss) for the year 34 60 (147) 34 160 (90) 1 459 22 - 533 626 1,159
Impairment of assets included in segment profit (13) 12 (4) (10) (10) - - (1) (21) - (47) - (47)
Assets 1,095 24 5,722 1,713 2,982 4,344 135 642 3,470 (5,107) 15,020
Liabilities 824 9 3,899 1,215 881 2,480 72 145 1,607 (5,107) 6,025
Capital expenditure (30) - (48) (38) (15) (44) - (31) - - (206)
Depreciation & amortisation (20) (6) (255) (50) (19) (49) (13) (15) - - (427)
Rogers and Company Limited 149

Explanatory Notes30 June 2013
42. FINANCIAL SUMMARY
In Rs million
9 months ended 30 June 2013
Year ended 30 September
2012
Year ended 30 September
2011
Statements of Profit or Loss and Other Comprehensive Income
Continuing operations
Revenue 5,028.3 6,459.0 7,436.0
Profit from operations before finance costs 269.8 152.7 300.4
Finance costs (167.1) (184.8) (216.6)
Fair value gain on investment properties 265.1 61.7 50.8
Share of results of associated companies 166.4 (1.7) 15.8
Profit before exceptional items 534.2 27.9 150.4
Exceptional items 1,426.9 513.1 63.5
Profit before taxation 1,961.1 541.0 213.9
Taxation 12.9 (8.6) (100.3)
Profit from continuing operations 1,974.0 532.4 113.6
Profit after tax from discontinued operations - 626.3 393.2
Profit for the period / year 1,974.0 1,158.7 506.8
Attributable to
Owners of the parent - continuing operations 1,750.9 540.5 0.2
- discontinued operations - 626.3 392.9
1,750.9 1,166.8 393.1
Non-controlling interests 223.1 (8.1) 113.7
1,974.0 1,158.7 506.8
Number of shares in issue 25,204,530 25,204,530 25,204,530
Earnings per ordinary share (Eps)
- continuing and discontinued operations Rs 69.46 46.29 15.60
- continuing operations Rs 69.46 21.44 0.01
Profit attributable to owners of the parent from continuing operations (excluding exceptional items)
- continuing operations 378.0 31.9 (36.3)
- discontinued operations - 402.1 392.9
378.0 434.0 356.6
Number of shares in issue 25,204,530 25,204,530 25,204,530
Eps (excluding exceptional items)
- continuing and discontinued operations Rs 15.00 17.23 14.15
- continuing operations Rs 15.00 1.27 (1.44)
Other comprehensive income for the period / year 548.9 (543.6) (509.5)
Cash dividends per ordinary share Rs 6.00 6.50 7.00
Dividends in specie per ordinary share Rs - 120.00 -
Annual Report 2013150
42. FINANCIAL SUMMARY (CONTd)
In Rs million
30 June 2013
30 September 2012
30 September 2011
Assets and Liabilities
Non current assets 14,718.2 11,271.1 15,137.7
Current assets 2,637.3 3,749.3 7,929.9
Life business assets - - 1,787.3
17,355.5 15,020.4 24,854.9
Share capital 252.0 252.0 252.0
Reserves 8,118.2 6,440.8 8,902.7
Non-controlling interests 3,280.4 2,302.2 2,413.7
Non current liabilities 2,577.7 2,599.2 4,736.8
Current liabilities 3,127.2 3,426.2 6,762.4
Life assurance fund - - 1,787.3
17,355.5 15,020.4 24,854.9
Share Capital
Authorised
Number of ordinary shares 50,000,000 50,000,000 50,000,000
Ordinary shares of Rs 10 each 500.0 500.0 500.0
Issued and fully paid
Number of ordinary shares 25,204,530 25,204,530 25,204,530
Ordinary shares of Rs 10 each 252.0 252.0 252.0
Rogers and Company Limited 151
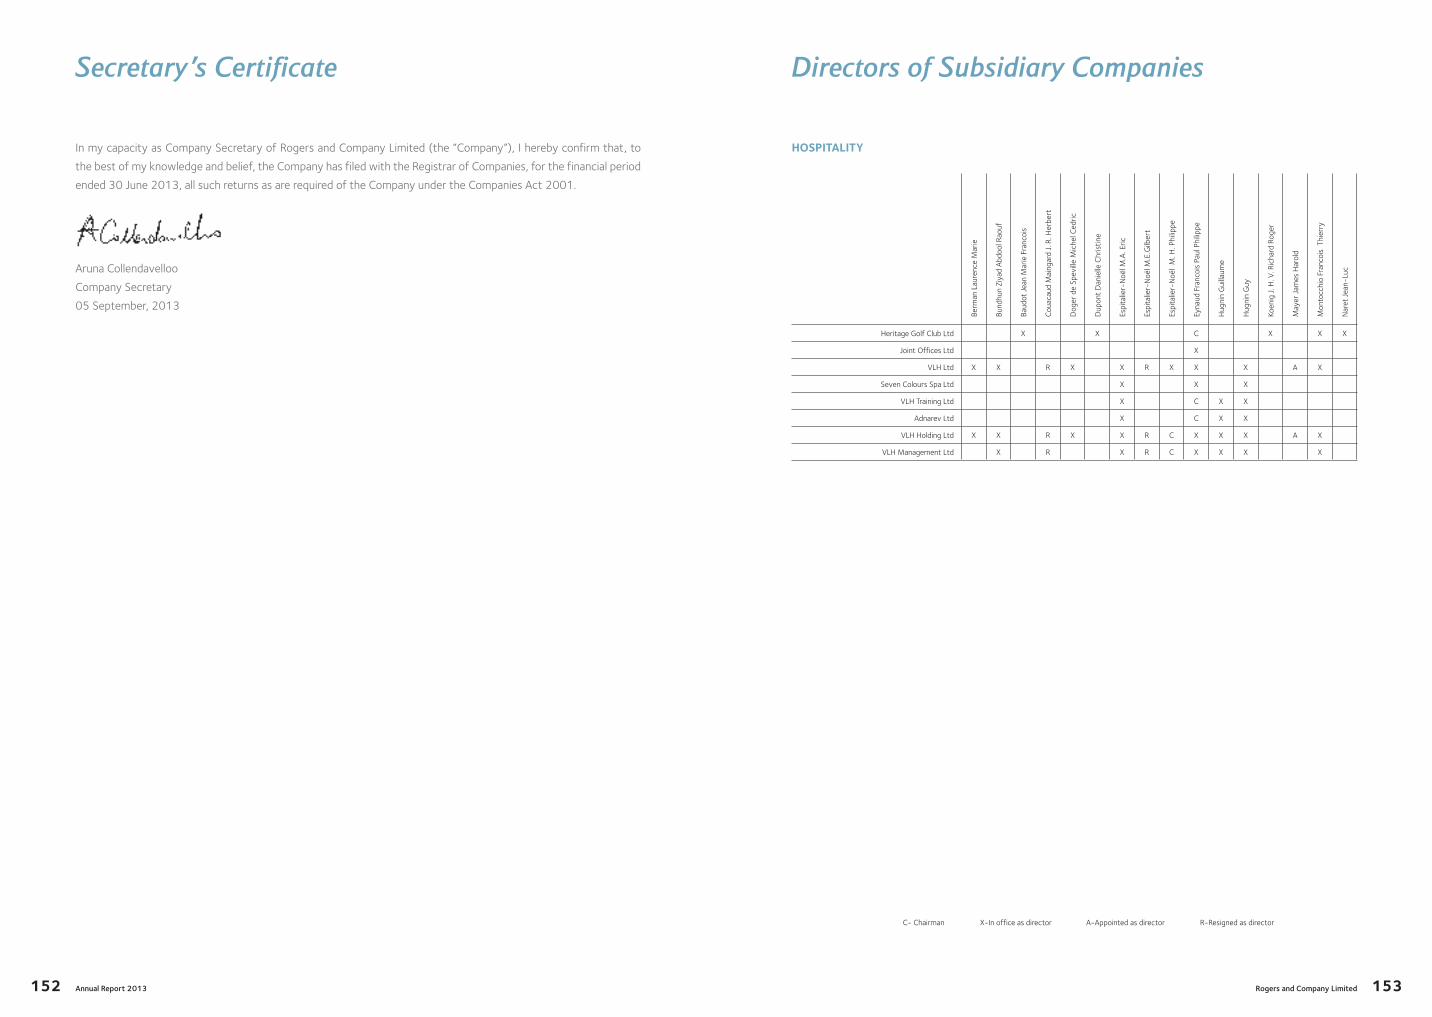
Secretary’s Certificate
In my capacity as Company Secretary of Rogers and Company Limited (the “Company”), I hereby confirm that, to
the best of my knowledge and belief, the Company has filed with the Registrar of Companies, for the financial period
ended 30 June 2013, all such returns as are required of the Company under the Companies Act 2001.
Aruna Collendavelloo
Company Secretary
05 September, 2013
Annual Report 2013152
Directors of Subsidiary Companies
C- Chairman X-In office as director A-Appointed as director R-Resigned as director
hOSPITALITY
Berm
an L
aure
nce
Mar
ie
Bund
hun
Ziya
d A
bdoo
l Rao
uf
Baud
ot J
ean
Mar
ie F
ranc
ois
Cou
acau
d M
aing
ard
J. R
. Her
bert
Dog
er d
e Sp
evill
e M
iche
l Ced
ric
Dup
ont
Dan
ielle
Chr
istin
e
Espi
talie
r-N
oël M
.A. E
ric
Espi
talie
r-N
oël M
.E.G
ilber
t
Espi
talie
r-N
oël
M. H
. Phi
lippe
Eyna
ud F
ranc
ois
Paul
Phi
lippe
Hug
nin
Gui
llaum
e
Hug
nin
Guy
Koen
ig J
. H. V
. Ric
hard
Rog
er
May
er J
ames
Har
old
Mon
tocc
hio
Fran
cois
Thi
erry
Nar
et J
ean-
Luc
Heritage Golf Club Ltd X X C X X X
Joint Offices Ltd X
VLH Ltd X X R X X R X X X A X
Seven Colours Spa Ltd X X X
VLH Training Ltd X C X X
Adnarev Ltd X C X X
VLH Holding Ltd X X R X X R C X X X A X
VLH Management Ltd X R X R C X X X X
Rogers and Company Limited 153

Directors of Subsidiary Companies
LOGISTICS
Abr
aham
Ber
tran
d D
enis
Arr
owsm
ith S
arah
Car
men
Avril
lon
Fran
cis
Vin
cent
Bath
field
P R
Syd
ney
Bhoy
roo
Moh
amm
ad Y
ashi
nn
Bola
nd C
hris
tope
r Fr
anci
s
Bund
hun
Ziya
d A
bdoo
l Rao
uf
Che
ngan
na R
enga
nath
en (
Vis
hen)
De
Com
arm
ond
Mar
ie M
auric
e A
ndré
Driv
er H
. W. A
ntho
ny
Elys
ee D
avid
Elys
ee L
ouis
Jac
quel
in
Espi
talie
r-N
oël M
.E. G
ilber
t
Espi
talie
r-N
oël M
. H. P
hilip
pe
Gal
ea M
arie
Hen
ri D
omin
ique
Har
el A
ntoi
ne L
ouis
Hun
g H
an Y
un D
enis
Jugr
oo D
hann
ylal
l
Kaba
Gill
es
Lutc
hmun
Ale
xand
er Y
edic
k
Mer
rick
Raym
ond
Mer
ven
Jean
Did
ier
Noë
l C.
J. R
aoul
Nun
koo
Nay
endr
anat
h
Oliv
ier
Viv
ian
Peer
aulle
e Yu
suf
Piat
Jea
n Ev
enor
Riva
lland
Lou
is J
osep
h M
iche
l
Rono
owah
Ris
hi K
apoo
r
Sang
eele
e N
avee
n
Tayl
or T
imot
hy
Woo
Chu
ng L
ien
Don
ald
Yue
Chi
Min
g To
ny
Associated Container Services Limited
X X X C X
Cargo Express Madagascar S.A.R.L.
X X
F.O.M Warehouses Ltd X X X X X
Freeport Operations (Mauritius) Ltd
X X X X X
Granary Company Limited X X
Logistics Solutions Ltd (ex Integrated Logistics Ltd)
X X C X X
Velogic Ltd X X X C X X X
Logistics Holding Company Ltd
X X C X X
P.A.P.O.L.C.S. Ltd. X X X X X X X
Papol Holding Ltd X X X X X
R & C Logistics Ltd. R X X
Rogers IDS - Correio Internacional LDA
X X
Rogers IDS France SA X
Rogers IDS Madagascar SA X X
Rogers IDS Limitada Mozambique
X X
VSR X X X
Velogic Reunion SARL X
Velogic India Private Limited X X X
Rogers Logistics International Ltd
X X
Rogers Logistics Services Company Ltd
X X X X X
Rogers Shipping Ltd X X X X
Shipmanagement Services Ltd
C X X X
Sukpak Ltd X C X X X
Trans Global Logisitcs Ltd X X X
Transworld International Ltd. R X X
Thermoil Company Limited X X C
Societe Du Port X X C X X X X X
C- Chairman X-In office as director A-Appointed as director R-Resigned as director
Annual Report 2013154
Directors of Subsidiary Companies
AVIATION
Alm
eida
Jam
es
Bhoy
roo
Moh
amm
ad Y
ashi
nn
Brei
ner
Mar
c Fr
anco
is S
teph
ane
Boui
c Jo
seph
Gui
llaum
e Ka
rl
Bund
hun
Ziya
d A
bdoo
l Rao
uf
Cas
sam
Raf
icq
Col
lend
avel
loo
Aru
na L
ata
Vid
ia
Cor
roy
Mar
ie S
ybil
Ani
ck
De
Laub
ier
Tang
uy H
uber
t Jo
achi
m
Espi
talie
r-N
oël P
hilip
pe
Fayd
'her
be d
e M
auda
ve A
lexa
ndre
Gar
cin
Dan
iel A
brah
am
Gira
ud P
aul F
ranc
e
Laul
loo
Moh
amm
ad F
aiz
Haf
iz
Leal
Ste
phan
e G
P
Mas
rani
Has
u
Nde
ve L
ucre
cia
Om
arje
e Za
karia
Pate
l Kira
n
Ram
chur
n -
Oog
arah
Soo
rya
Dev
i
Riva
lland
Rob
ert
Roge
rs F
ranc
ois
Mic
hel
Ruhe
e A
shle
y C
oom
ar
Scha
ub D
imitr
i
Tcha
mo
Jere
mia
s
Rogers Aviation Comores S.A.R.L X
Ario Seychelles Ltd X X
Rogers Aviation France S.A.R.L X R
Rogers Aviation Reunion SARL X X
Rogers Aviation Kenya Ltd X X X
Beavia Kenya Limited X X X X X
Rogers Aviation International Ltd (ex Ario Ltd)
X X X X
Rogers Aviation Madagascar S.A.R.L X X X X
Rogers Aviation Mayotte SARL X X
Rogers Aviation Mozambique LTA. X
Rogers Aviation (Mauritius) Ltd X X C X X
Blue Connect Ltd X C X X X
BlueAlizé Ltd X X C X X
BS Travel Management Ltd X X X X X
BS REUNION (Run Tourisme) X X
BS Travel Management Limitada X
Bluesky Mayotte SARL X R
Croisières Australes Ltée X X X X X
GS Africa Airline Services Ltd X X
Mozambique Airport Handling Services Lta(MAHS)
X X X X
Plaisance Air Transport Services Ltd. X C X X
Rogers Aviation South Africa (Proprietary) Limited
X X
Rogers Aviation Holding Co Ltd X X X C X X X
Transcontinent S.A.R.L. X X
C- Chairman X-In office as director A-Appointed as director R-Resigned as director
Rogers and Company Limited 155

Directors of Subsidiary Companies
PROPERTY
Abr
aham
se B
rett
Ah
Chi
ng C
heon
g Sh
aow
Woo
Bund
hun
Man
ish
Bund
hun
Ziya
d A
bdoo
l Rao
uf
Col
lend
avel
loo
Aru
na L
ata
Vid
ia
Cyp
rich
Mar
ian
Dab
ysin
g N
ilesh
Don
at L
ouis
Jea
n Re
x V
icto
r
Espi
talie
r N
oël
M. E
. Gilb
ert
Espi
talie
r N
oël M
.H. P
hilip
pe
Gal
ea M
arie
Hen
ri D
omin
ique
Lim
Kon
g Je
an P
ierr
e C
laud
io
Mam
et J
. E. D
amie
n
Mey
er K
.W.J
acob
us
Mih
didi
n Sa
njiv
Kum
ar
Riva
lland
Jea
n M
iche
l Lou
is
Tayl
or C
olin
Geo
ffre
y
Desbro International Ltd. X X
Foresite Property Holding Ltd A C X X
Foresite Fund Management Ltd A C X X X
Ascencia Limited X X A C X X
Motor Traders Ltd. X X
Foresite Ltd A C X X X
Steelco Industries Ltd. X X
Reliance Facilities Ltd X R R C R X
Reliance Security Services Ltd X R R C R X
Edith Cavell Properties Ltd A X A A
C- Chairman X-In office as director A-Appointed as director R-Resigned as director
Annual Report 2013156
Directors of Subsidiary Companies
REAL ESTATE & AGRIBUSINESS
Ant
elm
e G
.Rob
ert
Bund
hun
Ziya
d A
bdoo
l Rao
uf
De
Waa
l Ant
on
Cou
acau
d M
aing
ard
Her
bert
Des
croi
zille
s M
arce
l Viv
ian
D'H
otm
an D
e V
illie
rs A
udre
y
Dog
er D
e Sp
evill
e Ro
bert
Espi
talie
r-N
oël P
. J. P
. Edo
uard
Espi
talie
r-N
oël M
.A. E
ric
Espi
talie
r-N
oël M
.E. G
ilber
t
Espi
talie
r-N
oël M
.M.H
ecto
r
Espi
talie
r-N
oël M
. H. P
hilip
pe
Koen
ig J
. H. V
. R. R
icha
rd
Lan
Hin
g Po
Hee
Foo
n
Lasr
y, S
ydne
y
Leno
ir G
usta
ve E
. Jea
n Pi
erre
Nar
et J
ean-
Luc
Pear
son
-Tay
lor,
Jus
tin
Roui
llard
J L
Edo
uard
Sted
man
Ric
hard
Soh
rab
Tayl
or T
imot
hy
Thom
en L
ouis
Gae
tan
Lind
ley
Tyac
k Fr
eder
ic G
.
Vig
er J
acqu
es T
rista
n Jo
cely
n
Wie
he L
. H. G
eorg
es
South West Tourism Development Company Limited
X X X X X
Le Marche Du Moulin Ltd A R R A
Bel Ombre Foundation For Empowerment X X C X X X
Case Noyale Limitée R X A X X C X A X
Code Limitée X X
Compagnie Sucrière De Bel Ombre Limited
R X X A X X C X A X
Les Villas De Bel Ombre Ltee X X X X X X X X X
Villas Valriche Resort Ltd X X A C A X
C- Chairman X-In office as director A-Appointed as director R-Resigned as director
Rogers and Company Limited 157

Directors of Subsidiary Companies
OThER INVESTMENTS
Alla
gape
n G
ary
Dev
a
Ass
oulin
e A
nnie
Bhoy
roo
Moh
amm
ad Y
ashi
nn
Bund
hun
Ziya
d A
bdoo
l Rao
uf
Bund
hun
Man
ish
Britt
er D
onal
d
Butt
ery
How
ard
Col
lend
avel
loo,
Aru
na L
ata
Vid
ia
D'H
otm
an D
e V
illie
rs A
udre
y
De
Cor
iolis
Ben
oit
Des
mar
ais
Gas
ton
Fran
cois
Espi
talie
r-N
oël M
.H.P
hilip
pe
Gun
ness
Lill
adhu
r
Jant
et B
runo
Ber
nard
Ren
é
Koen
ig J
. H. V
. Ric
hard
Lan
Hun
Kue
n, J
ean
Mar
ie G
aeta
n
Lecl
ézio
J. M
. Ren
é
Mai
grot
, Nic
olas
Mar
ie E
doua
rd
Mam
et D
amie
n
Mor
elli
Serg
e H
enri
René
Nun
koo
Nay
endr
anat
h
Patr
ux E
ric G
ino
Mar
ie
Rey
Pier
re S
imon
Ruhe
e A
shle
y C
oom
ar
Tseu
ng S
um F
oi E
ddy
Wei
ntz
Mar
tin A
.
Rogers Foundation Ltd X X C X
Cerena Ltd X X
Mauritian Coal & Allied Services Co. Ltd X R X C A X A R
Tractor & Equipment (Mauritius)Ltd X C X X
Fleet Investment Supply and Husbandry Ltd X
Rogers Corporate Services Ltd X
Rogers Consulting Services Ltd X X X C
Rogers Asset Management Ltd X R C X
Rogers Capital Ltd X A A
Rogers Wealth Management Ltd A X
EIS IORGA Ltd C X X
Enterprise Information Solutions Ltd A X X C A X
IHL SPV Ltd X
AXA Customer Services Ltd A X C X X A R
C- Chairman X-In office as director A-Appointed as director R-Resigned as director
Annual Report 2013158
Frequently Asked Questions
1. What is an Annual Meeting of Shareholders (AMS)?
An AMS is a meeting of the shareholders of a company. The law provides that it should be held not more than
once in each calendar year and not later than 6 months after the financial reporting date of a company. Please
note that the balance sheet date of Rogers has changed from 30 September to 30 June. As a result, the current
financial year of Rogers covers a period of 9 months starting from 1 October 2012 ending on 30 June 2013.
2. Who may attend the AMS?
In compliance with S120(3) of the Companies Act, the Board has resolved that only the shareholders of the
Company registered in the share register of the Company as at 25 September 2013 are entitled to attend the
AMS.
3. Why should a shareholder attend the AMS?
Shareholders are encouraged to attend the AMS as it:
• provides them with a direct contact with the Board and Management of the Company;
• enables them to have more insight in the operations, strategy and performance of the Company;
• provides them with reasonable opportunity to discuss and comment on the management of the Company;
and
• allows them to participate in the election of the directors of the Company.
4. What matters are discussed at the AMS?
Usually, the following business is transacted at the AMS:
• the approval of the audited accounts of the Company;
• the receiving of the auditor’s report;
• the consideration of the annual report; and
• the appointment of directors.
5. What if a shareholder cannot attend the AMS?
An individual shareholder who cannot attend the meeting may appoint a proxy.
A corporate shareholder may, on the other hand, appoint a representative to attend the AMS and to act on its
behalf.
6. What is a proxy?
A proxy is the person appointed by an individual shareholder to represent him/her at the AMS. Such person,
who need not necessarily be a shareholder of the Company, may be heard at the meeting as if he/she were the
shareholder.
7. how does a shareholder appoint a proxy/representative?
Individual shareholders are requested to fill in the Proxy Form sent to them with the notice convening the
meeting. Corporate shareholders are requested to fill in the Corporate Resolution form to appoint their
representative.
Should a shareholder wish his/her proxy/representative to vote at the meeting in a particular manner, he/she is
requested to fill in the resolution boxes featuring on the appropriate forms.
The appropriate forms should reach the Company Secretary no later than 24 hours before the start of the
meeting.
Rogers and Company Limited 159
8. Once a proxy/representative has been appointed, can another proxy/representative be appointed?
A shareholder can change the proxy/representative appointed by him/her, provided such amended Proxy Form/
Corporate Resolution reaches the Company Secretary no later than 24 hours before the start of the meeting.
Shareholders are advised to attach an explanatory note to such amended Proxy Form/Corporate Resolution
to explain the purpose of the amended document and expressly revoke the Proxy Form/Corporate Resolution
previously signed by them.
9. After appointing a proxy, can a shareholder still attend the AMS?
Yes, but he/she is requested to make himself/herself known to the Company Secretary as soon as he/she
attends the meeting. The proxy will consequently have no right to be heard and to vote at the meeting.
10. how many votes does a shareholder have?
Every shareholder, present in person or by proxy/representative, shall have one vote on a show of hands.
Where a poll is taken, each shareholder shall have the number of votes that corresponds to the number of
shares held by him/ her in the Company.
11. What is the voting procedure?
Voting at the AMS is generally by show of hands. However, if a poll is demanded for a particular resolution, then
ballot papers shall be distributed and shareholders will be requested to cast their votes thereon.
12. how are the votes counted?
On a show of hands, the Chairman shall count the votes. However, if a poll is demanded, the counting will be
done by management under the supervision of the auditor of the company who will be acting as scrutineer.
13. how to obtain a copy of the minutes of proceedings of the last AMS of the Company?
A shareholder may make such a request to the Company Secretary prior to the AMS.
14. how to put questions to the Board and/or Management at the AMS?
Before each resolution is put to the vote, the Chairman may invite shareholders to put questions on that
particular resolution. When all the items on the Agenda of the AMS have been tackled, there will be a question
time when the Chairman shall invite shareholders to put questions to the Board and/or to Management if they
so wish.
15. What should a shareholder do if he/she would like to propose a candidate for appointment to the board of directors of the Company?
Shareholders are encouraged to forward their request in writing to the Chairman of the Rogers Board Nomination
Committee via the Company Secretary as early as the first week of June.
Annual Report 2013160
Notes
Notes Notes

Notes

Rogers and Company LimitedNo.5, President John Kennedy Street, PO Box 60,Port Louis, MauritiusTel : (230) 202 6666 Fax : (230) 208 3646
www.rogers.mu
RO
GER
S A
ND
CO
MPA
NY
LIM
ITED
A
NN
UA
L R
EPO
RT
20
13


