168
ANNUAL REPORT 2016

ANNUAL REPORT
2016
TODAY’S CHALLENGEPeople want food and
drink that taste delicious, have an appealing
texture and appearance, are healthy and also convenient.
OUR SOLUTIONWith our deep food
expertise and passion, we work with customers to make food healthier
and tastier, creating extraordinary food
for consumers around the world.

Financial HighlightsA year of solid performance and delivery
STATUTORY RESULTS2016 2015
Sales2 £2 355m £2 341mProfit before tax2 £126m £25mProfit for the year (on total operations) £163m £30mDiluted earnings per share (on total operations) 34.8p 6.5p
1 Restated for equity accounting for joint ventures.2 For continuing operations only.
Use of adjusted performance measuresThe results for the year ended 31 March 2016 have been adjusted to exclude exceptional items, net retirement benefit interest and amortisation of acquired intangible assets and any tax on those items. As announced in October 2015, the Group has adopted equity accounting for joint ventures and associates in the presentation of its adjusted performance measures and accordingly no longer adjusts these results to include the proportionate consolidation of joint ventures and associates (see Note 1 of the consolidated financial statements for more details). The Group’s statutory results are presented in accordance with International Financial Reporting Standards as adopted by the European Union. Except where specifically stated to the contrary, this commentary relates only to the adjusted results of continuing operations. A reconciliation between statutory and adjusted information is included in Note 4 of the consolidated financial statements.
Unless otherwise stated in this Annual Report, adjusted operating profit excludes discontinued operations and is stated before exceptional items and amortisation of acquired intangible assets. Adjusted profit before tax is also before net retirement benefit interest. Adjusted diluted earnings per share is before all the aforementioned items and the tax effect of all adjusted items.
TrademarksSPLENDA® and the SPLENDA® logo are trademarks of Heartland Consumer Products LLC.
Definitions/cautionary statementPlease see the explanatory notes on page 164.
Strategic Report01 Financial Highlights02 Business Overview04 Chairman’s Statement 06 Chief Executive’s Review09 Investment Case10 Marketplace12 Business Model14 Key Performance Indicators16 Executive Committee17 Speciality Food Ingredients 20 Bulk Ingredients 22 Innovation and Commercial
Development24 Global Operations 25 Group Financial Results 31 Risks 34 Corporate Responsibility
Governance42 Board of Directors 44 Statement from the Chairman 45 Corporate Governance55 Audit Committee Report 59 Nominations Committee Report 60 Corporate Responsibility
Committee Report 62 Directors’ Remuneration Report 80 Directors’ Report 81 Directors’ Statement of Responsibilities
Financial Statements82 Independent Auditors’ Report
to the Members of Tate & Lyle PLC88 Consolidated Income Statement89 Consolidated Statement of
Comprehensive Income 90 Consolidated Statement
of Financial Position 91 Consolidated Statement of Cash Flows 92 Consolidated Statement of
Changes in Equity 93 Notes to the Consolidated Financial
Statements 150 Parent Company Financial Statements
Useful Information159 Group Five-year Summary161 Information for Investors162 Glossary 164 Definitions/explanatory notes
ADJUSTED PROFIT BEFORE TAX 1, 2 (£m)
£193m
2016
193
2015
184
2014
269
DIVIDEND PER SHARE (pence)
28.0p
2016
28.0
2015
28.0
2014
27.6
ADJUSTED DILUTED EARNINGS PER SHARE 1, 2 (pence)
34.5p
2016
34.5
2015
32.0
2014
47.3
NET DEBT 1 (£m)
£434m
2016
434
2015
555
2014
385
01 Tate & Lyle PLC Annual Report 2016
Strategic ReportG
overnanceFinancial Statem
entsU
seful Information
Strategic Report

Innovation and Commercial Development Creating a world class innovation capability is a key part of our growth strategy. Innovation and Commercial Development (ICD) connects consumer needs with leading-edge science to provide innovative ingredients and solutions for our customers.
ICD brings together research and development, open innovation, platform management and global marketing into one fully integrated global team.
We develop a deep understanding of the consumer, the markets and categories we operate in, and the customers we serve…
Consumer insightsIdentifying opportunities for growth from consumers’ changing behaviours and demands
Customer collaborationClose interaction with customers to build a deeper understanding of their needs
Category understandingIncreasing our expertise and knowledge in categories such as dairy and beverage
We serve these markets and our customers through two business divisions, each with a clear remit and focus...
These business divisions are supported by two global teams…
Speciality Food IngredientsGrowth engine of the GroupDevelops innovative ingredients and solutions for food and beverage customers globally. It is well positioned to benefit from global consumer demand for healthier food and drink.
Main categories of expertise• Dairy, beverage, bakery and convenience
Strategic positioning• Leading positions in attractive markets• Broad product and geographic diversification• Strong focus on innovation• Growing customer base
Bulk IngredientsSteady earnings and cash generationProvides high-volume food ingredients and industrial products primarily for customers in the North American market.
Main product lines• Bulk sweeteners for food and beverage customers• Industrial starches for paper and construction industries
Strategic positioning• Focus on relatively more stable North American market• Strong market positions• Integrated, scale and efficient assets• Long-standing customer relationships
Business OverviewHow our business works
17 Speciality Food Ingredients 10 Marketplace 10 Marketplace20 Bulk Ingredients
Global OperationsThe role of Global Operations is to deliver high quality products to our customers across the world. It is responsible for running our manufacturing facilities, like our integrated corn wet mills in the US and Europe, and for making our ingredients. Global Operations is also responsible for supply and demand planning, raw material sourcing, customer service and logistics, safety, sustainability, and continuous improvement.
12 Business Model
22 Innovation and Commercial Development 24 Global Operations
Strategic Report
02 Tate & Lyle PLC Annual Report 2016

Our business is driven by some key enablers…
Our ingredients help our customers address increasing global demand for healthier food and drink.
Our innovation pipeline develops new products and solutions focused on three platforms – sweeteners, texturants and health and wellness.
Our teams work in application and technical service centres around the world to solve our customers’ local taste and formulation challenges.
Our scale and efficient manufacturing facilities provide a cost effective supply of ingredients for distribution through our global supply chain.
Supported by the talent and expertise of our people...Our employees are central to the delivery of our strategy. We invest in training and developing our employees and also recruit high calibre talent to ensure we have the right people, teams and skills to grow our business.
22 Innovation and Commercial Development
34 Corporate Responsibility
12 Business Model 24 Global Operations
People safetyWe have no higher priority than the safety of our people and we have an extensive safety management programme in place. We measure safety performance at every site monthly.
EnvironmentWe work to address environmental considerations across the life-cycle of our products. We have targets in areas such as reducing CO2e emissions, reducing product packaging, and improving transport efficiency.
SustainabilityWe are implementing sustainable agricultural sourcing programmes for 25 agricultural raw materials/ingredients.
Product quality Our products adhere to the highest standards of food safety, quality and traceability. Our manufacturing facilities are externally certified to the Global Food Safety Initiative.
STRONG TECHNICAL EXPERTISE
RELEVANT PRODUCT
PORTFOLIO
ROBUST INNOVATION
PIPELINE
COST EFFECTIVE SUPPLY CHAIN
Board oversightThe Board of Directors oversees the activities of the Group through regular meetings of the Board and its four Committees.
Risk managementA Group-wide risk management and reporting process helps us identify, prioritise and mitigate risk.
ValuesOur Values define what we stand for and how we behave with our customers, suppliers, investors, partners, the communities we operate in and each other.
45 Corporate Governance 34 Corporate Responsibility31 Risks
Underpinned by a commitment to safe and sustainable business practices…
Our business is supported by a strong governance framework and our Values…
34 Corporate Responsibility
03 Tate & Lyle PLC Annual Report 2016
Strategic ReportG
overnanceFinancial Statem
entsU
seful Information
Strategic Report | Business Overview
Strategic progressThe global consumer trends driving growth in the speciality food ingredients market are an increasing demand for convenience food, a much greater focus on health and wellness, particularly in light of the rising incidence of obesity and diabetes worldwide, and an increasing preference for ‘natural’ and ‘clean-label’ foods. Our aim is to help consumers make healthier and tastier choices. Our strategy to focus on growth in Speciality Food Ingredients means that we can benefit from these trends as our speciality ingredients help to reduce sugar and calories, and add fibre, in consumer products.
During the year, we re-aligned our interest in our Eaststarch joint venture in Europe. We now fully own the corn wet mill in Slovakia which serves as an excellent base from which to meet growing demand for speciality food ingredients. At the same time we exited from the joint venture’s bulk focused plants, further reducing our exposure to more regulated commodity markets in Europe.
We have added capacity for our Speciality Food Ingredients business in the year, providing greater manufacturing flexibility and also potential for future growth.
Finally, we restructured our SPLENDA® Sucralose business to lower the cost base, which led to the closure of our facility in Singapore at the end of the year.
SummaryI am pleased to report that Tate & Lyle made solid progress during the year, delivering a more consistent and stable financial performance after a very difficult period in our 2015 financial year. We also took the necessary actions to drive forward our strategy of delivering long term sustainable growth in Speciality Food Ingredients.
SafetyTate & Lyle has no higher priority than safety. I am pleased to report that, in the 2015 calendar year, our safety performance indicators improved. However, one accident is still one too many, and our ultimate goal remains to have no accidents and no injuries.
During the year, we enhanced our safety programme with a number of new initiatives to improve our safety management, controls and performance. Safety audits were undertaken at our manufacturing facilities, using both external and internal auditors. These found that good progress had been made in implementing corrective and preventative actions from previous audits as well as in overall safety management and control standards. Our obligation to provide safe and healthy working conditions for all those that work in and visit our facilities remains foremost in our mind.
Together these actions have been efficiently executed, and as a result the Group is now more focused and in a stronger position to deliver long-term growth.
Bulk Ingredients, which is now focused on the relatively more stable North American market, remains a profitable business, generating cash for investment in the wider business.
During the year we announced our 2020 Ambition, setting out how we expect the business will grow over the coming years. It shows how, through the actions we have taken and the investments we have made to strengthen the business, the Group will become a materially re-shaped Speciality Food Ingredients focused business over time. The 2020 Ambition, and how we expect it to be delivered, are explained in more detail later in this Annual Report.
Group performanceAdjusted operating profit before tax for continuing operations was £193 million, an increase of 5%. This was achieved despite challenging conditions in some of the commodity markets in which we operate. Adjusted diluted earnings per share for continuing operations was 34.5p, an increase of 8%.
Adjusted operating cash flow was 2% lower at £122 million, principally reflecting increased capital expenditure as we expanded production capacity.
Sir Peter Gershon, Chairman
Chairman’s StatementThe complex structural change initiatives completed during the year were very well delivered and significantly strengthened the Group for the longer term
Strategic Report
04 Tate & Lyle PLC Annual Report 2016

It is pleasing that the performance of our business has benefited from the further improvements made to the global demand, supply and performance management processes, together with the availability of increased capacity as new assets have come on line. The Board has taken a keen interest in this project following the supply chain challenges experienced in the previous year and, while progress is encouraging, there is more to do to optimise process, improve efficiency of decision-making and ensure that our service to customers is of the highest standard.
“Our business has benefited from the further improvements made to the global demand, supply and performance management processes”
Governance and Board compositionIn July 2015 Virginia (Ginny) Kamsky stepped down as a Non-Executive Director, owing to the increased demands of her executive responsibilities meaning that she would no longer be able to commit the required time to attend Board meetings. I would like to thank Ginny for her commitment during her tenure.
On 1 April 2016, Lars Frederiksen and Sybella Stanley joined the Board as Non-Executive Directors. Lars brings considerable knowledge of the global food ingredients industry having, as CEO, led Chr. Hansen Holding A/S from 2005 until his retirement in March 2013. Sybella serves as Director of Corporate Finance at RELX Group plc (formerly Reed Elsevier Group plc), where she is responsible for global mergers and acquisitions, having joined in 1997. Sybella’s extensive commercial and financial experience will be of great benefit to the Board as we execute our strategy. Lars has joined the Remuneration, Corporate Responsibility and Nominations Committees while Sybella has joined the Audit and Nominations Committees.
These two new appointments further strengthen the Board and enhance its overall diversity.
As set out on page 59, as part of its review process, the Nominations Committee regularly considers the succession needs of the Board. I have chaired the Company since July 2009 and, therefore, the Committee and I have jointly agreed that it would be appropriate to start the process to identify my successor. This is in the early stages and an announcement will be made at the appropriate time.
Corporate responsibility and risk managementWe continually look to improve the way that we manage, perform in and report on corporate responsibility matters. During the year, the Group has invested in and received accreditations for its work in this area. We are a member of the 2015 FTSE 350 Climate Disclosure Leadership Index (CDLI), scoring 99 out of 100 and ranked in the top 10% of FTSE 350 companies responding to CDP’s climate change programme (www.cdp.net). We continue to work hard to improve our performance across the business on corporate responsibility matters.
In September 2015, the new United Nations (UN) Sustainable Development Goals (SDGs) were launched. We believe that the strategy of the Company is particularly aligned with a number of the goals and, going forward, we will seek to contribute to the achievement of the UN SDGs through our activities.
In the area of risk management and internal control, the Board has again undertaken its Group-wide risk management and reporting process to help identify, assess, prioritise and mitigate risk. An example of an area of topical and special focus this year has been work completed in the area of cyber security risks, where we have worked at some length to review and test our policies, procedures and broader defences.
DividendThe Board recognises the importance of dividends to shareholders and remains committed to the progressive dividend policy it implemented in 2009 under which it aims to grow the dividend over time taking into account the earnings prospects of the business.
As previously communicated, underpinned by the confidence it has in the strategy of the business, the Board intends to recommend an unchanged final dividend for the year ended 31 March 2016 of 19.8p to make an unchanged total for the year of 28.0p.
Annual Report 2016We committed in last year’s Annual Report to reviewing how we communicate with our investors. With this in mind, we have made some changes to the structure and content of our Annual Report to help us communicate our business investment proposition, our performance, and plans more clearly. We have set out our Ambition for the next five years in support of our strategic objective to become a leading global provider of speciality food ingredients and solutions. This is supported by key priorities for each of our two divisions. You can read about these on pages 17 and 20.
PeopleI would like to thank all of our employees who have contributed so much to the changes delivered in the Group this year, but especially thank the employees of our Eaststarch joint venture who recently left the Group and our employees at the recently-closed Singapore facility who are leaving the Group. Following the announcement in April 2015, the team in Singapore have worked with pride, precision, and a commitment to safety in bringing the facility to closure and transferring certain assets to McIntosh, Alabama. We thank them for their efforts and I wish them well for the future.
Sir Peter GershonChairman25 May 2016
05 Tate & Lyle PLC Annual Report 2016
Strategic ReportG
overnanceFinancial Statem
entsU
seful Information
Strategic Report | Chairman’s Statement
Javed Ahmed, Chief Executive
1% lower at £1,458 million (6% lower in constant currency). Margins grew strongly before the impact of Commodities, and adjusted operating profit was 2% higher at £188 million (4% lower in constant currency). Adjusted operating profit in Speciality Food Ingredients grew 10% to £150 million (5% higher in constant currency), and in Bulk Ingredients was 1% higher at £84 million (3% lower in constant currency). Central costs increased by £11 million to £46 million primarily reflecting the re-instatement of Group-wide employee incentive awards.
Adjusted profit before tax for continuing operations at £193 million was 5% higher (1% higher in constant currency) and included the Group’s share of profits from joint ventures at £28 million, £5 million higher. Adjusted profit before tax was £67 million higher than the statutory reported profit before tax of £126 million, largely as a result of net exceptional costs in the year of £50 million. Exceptional items include costs relating to the restructuring of the SPLENDA® Sucralose and European businesses totalling £48 million (2015 – £118 million), US litigation costs of £15 million, and a net gain of £7 million in the Tate & Lyle Ventures fund. While we expect to recognise further modest exceptional costs in relation to the completion of the Group’s restructuring in the 2017 financial year, we now expect the total cost to be below the level of £185 million announced in April 2015. The effect of exchange translation was to increase adjusted profit before tax by £8 million.
Speciality Food Ingredients performed well, benefiting from improved mix, good volume growth in the Asia Pacific and Europe, Middle East and Africa (EMEA) regions, and improved SPLENDA® Sucralose performance. Sales of New Products launched from the innovation pipeline continued to grow strongly.
Bulk Ingredients core business delivered strong performance. Margins improved significantly as US corn wet milling industry dynamics remained well-balanced, and we also delivered manufacturing efficiency improvements. This strength in the core business largely offset the performance of Commodities which deteriorated sharply in the face of extremely challenging market conditions, especially in US ethanol.
During the year, we successfully completed a number of major structural change initiatives including the re-alignment of the Eaststarch joint venture in Europe, the restructuring of the SPLENDA® Sucralose business, and the expansion of capacity for Speciality Food Ingredients. Taken together, these initiatives further re-shape and significantly strengthen the business in support of our 2020 Ambition.
Financial summary Group sales were £2,355 million, 1% higher than the prior year (3% lower in constant currency reflecting the pass through of lower corn prices). Speciality Food Ingredients sales were up 4% at £897 million (2% higher in constant currency) and Bulk Ingredients sales were
Overview of Group performanceThe Group made solid progress during the year delivering improved earnings. A number of major structural change initiatives were also completed to further strengthen the business, drive higher quality earnings, and position the Group for long-term growth.
Chief Executive’s Review We delivered improved quality of earnings and executed an extensive programme to strengthen the business
KEY HEADLINES1
• Group performed solidly with adjusted profit before tax up 5% (1% in constant currency), in line with expectations
• Major structural change initiatives successfully executed, significantly strengthening the business
− Eaststarch joint venture re-aligned to increase speciality focus and reduce exposure to regulated markets
− SPLENDA® Sucralose restructured and repositioned as a more focused, low cost and sustainable business
− Capacity expansion projects for Speciality Food Ingredients completed as planned
• Stronger supply chain performance as operational disciplines continue to strengthen
• Early progress against each element of 2020 Ambition
1 Changes in constant currency calculated by retranslating comparative period results at current period exchange rates.
Strategic Report
06 Tate & Lyle PLC Annual Report 2016
Adjusted diluted earnings per share for continuing operations were 2.5p higher at 34.5p, also benefiting from a lower effective tax rate of 16.5% (2015 – 18.4%).
Net debt at 31 March 2016 was £434 million, a reduction of £121 million. Adjusted free cash flow was slightly lower than the prior year at £53 million (2015 – £54 million). The reduction in net debt was primarily driven by the receipt of £254 million with respect to the Eaststarch re-alignment (comprising €240 million (£173 million) in cash proceeds, dividends from Eaststarch of €94 million (£68 million) as well as £13 million in respect of completion adjustments). Together these exceeded the Group’s dividend payments of £130 million. Net debt increased by £15 million driven by the increase in the value of dollar-denominated debt as a result of the strengthening of the US dollar against sterling.
As announced in October 2015, following the re-alignment of the Eaststarch joint venture, the Group adopted equity accounting for joint ventures in the presentation of its adjusted performance measures, having previously used proportionate consolidation (see Note 1). The commentary in respect of the adjusted full-year results is therefore based on equity accounting for joint ventures. However, for comparison, using proportionate consolidation for the continuing operations, adjusted operating profit for the year to 31 March 2016 would have been £226 million (2015 – £214 million) an increase of 6% (2% in constant currency) and adjusted profit before tax would have been £203 million (2015 – £191 million) an increase of 6% (3% in constant currency). For more information see Note 4.
The results for the year ended 31 March 2016 have been adjusted to exclude exceptional items, net retirement benefit interest and amortisation of acquired intangible assets and any tax on those items. The Group’s statutory results are presented in accordance with International Financial Reporting Standards as adopted by the European Union. Except where specifically stated to the contrary, this commentary relates only to the adjusted results of continuing operations. A reconciliation between statutory and adjusted information is included in Note 4.
Completion of major structural change initiativesA number of major structural change initiatives were successfully completed to further re-shape and significantly strengthen the business in support of the Group’s 2020 Ambition.
Re-positioning SPLENDA® Sucralose as a more focused, low-cost and sustainable businessIn April 2015, we announced our decision to re-focus the SPLENDA® Sucralose business in two ways to maximise returns. Firstly, by implementing a rigorous value-based approach to secure volume by focusing on those customers who fully value the benefits of our SPLENDA® Sucralose product including its quality, provenance, food safety and responsible manufacturing and environmental practices. Secondly, by lowering the manufacturing cost base of the business by consolidating production into a single facility in the US, and closing the facility in Singapore in Spring 2016.
Customers responded positively with volume ahead of the prior year, and the customer transition was efficiently managed. Production at the facility in Singapore was gradually reduced over the course of the year as certain assets were transferred to our facility in McIntosh, Alabama. Then, as scheduled, the Singapore facility was closed on 31 March 2016, having generated strong returns over its life-cycle well in excess of the Group’s cost of capital. McIntosh now operating at a higher scale and utilisation levels, provides a materially lower-cost manufacturing position.
The fundamental changes we have made to how we approach this market and to our manufacturing footprint have been very efficiently executed. SPLENDA® Sucralose is now a more focused, low-cost and sustainable business, and generated higher profitability in the year than we anticipated.
Re-shaping our European business to strengthen our speciality focusOn 31 October 2015, we completed the re-alignment of our Eaststarch joint venture corn wet milling business in Europe with Archer Daniels Midland (ADM).
Under the re-alignment, we strengthened our Speciality Food Ingredients business by acquiring full ownership of the more speciality-focused facility in Slovakia, and substantially reduced our European Bulk Ingredients footprint by exiting the predominantly Bulk Ingredients facilities in Bulgaria, Turkey and Hungary. Two long-term distribution agreements were also established, under which Tate & Lyle distributes crystalline fructose, a speciality sweetener, produced in Turkey, and ADM acts as exclusive distributor for bulk ingredients produced at our two corn wet mills in Europe.
The separation of the integrated Eaststarch business has been a complex process including IS/IT infrastructure, sales, supply chain and other support functions. This has been achieved while maintaining high levels of customer service.
Following the re-alignment, our business in Europe is now predominantly focused on Speciality Food Ingredients. The facility in Slovakia provides a solid base from which to grow our speciality business in Europe and our intention is to increase production of speciality food ingredients at the facility over time. Concurrently, the re-alignment has reduced our exposure to more regulated European commodity markets, and focused the Bulk Ingredients division on the North American market where we have strong market positions and efficient, scale assets. Around 90% of our bulk sweetener and industrial starch business is now in the larger and relatively more stable North American market, supporting our ambition for steady earnings from the core business of Bulk Ingredients.
In February 2016, we also signed an agreement with ADM to sell our small, wholly-owned and predominantly bulk ingredients corn wet mill in Casablanca, Morocco. Completion is expected to occur in the first half of the 2017 financial year.
Following the completion of the Eaststarch re-alignment, we commenced a restructuring of our European operations to reset the cost base and improve operating margins over time.
Our vision is to become a leading global provider of speciality food ingredients and solutions.
Our strategy is to deliver this vision through:
• A disciplined focus on growing our Speciality Food Ingredients business
− deeper customer understanding − continuous innovation − stronger positions in higher
growth markets
• Driving Bulk Ingredients for sustained cash generation to fuel this growth.
OUR VISION AND STRATEGY REMAIN UNCHANGED
07 Tate & Lyle PLC Annual Report 2016
Strategic ReportG
overnanceFinancial Statem
entsU
seful Information
Strategic Report | Chief Executive’s Review

Building a stronger business Execution of these important and complex structural initiatives has been a major undertaking. As a result, the business is now significantly stronger and more able to progress towards its 2020 Ambition.
Progress against 2020 AmbitionIn November 2015, we announced our ambition to further strengthen the business by 2020 with three key outcomes. During the year, early progress has been made in relation to each element of our 2020 Ambition.
1. Generate 70% of Group profits1 from Speciality Food Ingredients: increased in the year by 50 bps to 60%.
2. Broaden the geographic mix of Speciality Food Ingredients’ sales2 with 30% coming from Asia Pacific and Latin America: increased in the year by 60 bps to 21%. Sales in Asia Pacific grew strongly but weaker economic conditions and softer consumer demand in Latin America held back growth in the combined region. Our belief in the longer-term growth potential of these markets remains unchanged.
3. Generate sales of US$200 million from New Products: sales grew by 34% in constant currency to $86 million (£57 million). The momentum of previous years continued with volume growth across each of our three platforms. We continue to build strong customer interest across our new product portfolio and to strengthen the quality of our pipeline.
Increasing capacity for Speciality Food Ingredients During the year, we completed the projects we announced in May 2014 to expand capacity for Speciality Food Ingredients, with the incremental capacity coming on stream over the course of the second half of the year. We have expanded capacity for Speciality Food Ingredients at our corn wet mills in Europe and the US, at our PromOat® Beta Glucan plant in Sweden, and added capacity to support growth in New Products.
Operational and supply chain process enhancementsWe have continued to enhance the Group’s operational and supply chain processes, capabilities and disciplines. Global Operations, which is responsible for all manufacturing and supply chain aspects of the business, implemented improvements to the demand and supply planning process by establishing a common process embedded in each region. Global Operations remains focused on cost and productivity improvements with major projects such as the new combined heat and power plant at our Loudon facility. During the year, it also established a new, dedicated Continuous Improvement team to enhance efficiency in our plant network over time.
We have also made improvements to the monthly performance management cycle, driving improved forecasting and decision-making. These actions and the utilisation of the Group’s new common IS/IT infrastructure are materially improving the effectiveness of our operational decision-making.
Chief Executive’s Review continued
1 Speciality Food Ingredients (SFI) profit includes SFI share of profit after tax of joint ventures and associates, Group profit is before Central costs and interest, but includes share of profit after tax of joint ventures and associates.
2 Percentage of sales excluding SPLENDA® Sucralose and Food Systems.3 New Products are products in the first seven years after launch. Figures are denominated in US dollar.4 Year ended 31 March 2015.
Delivering our 2020 Ambition will result in a materially re-shaped Speciality Food Ingredients focused business.
Key performance indicators (KPIs)Our KPIs for the year ended 31 March 2016 are detailed on pages 14 and 15.
Looking forward, the Group will continue to review whether its current key performance indicators remain the most appropriate in light of the 2020 Ambition, changes to management incentive structures and other changes the Group has made in presenting its financial performance.
PeopleI would like to thank all our employees across Tate & Lyle for their continued hard work and dedication over the last year and I look forward to working alongside them in the next financial year as we continue to deliver on our objectives.
SummaryThis has been a year of solid financial performance and strong project delivery. Both business divisions delivered margin expansion and we completed the major structural change initiatives needed to further strengthen the business and drive higher quality earnings. We also made good progress against the 2020 Ambition we outlined in November 2015.
OutlookFor the 2017 financial year, subject to currency movements, we are confident the Group will continue to make progress in line with our plan and towards our 2020 Ambition.
Javed AhmedChief Executive25 May 2016
Mix of Group profits Contribution from New Products
Geographic spread of Speciality Food Ingredients sales
ADJUSTED OPERATING PROFIT1
70% FROM SFI
1
2
1 Speciality Food Ingredients 70%
2 Bulk Ingredients 30%
NEW PRODUCTS SALES3
$200mFROM NEW PRODUCTS
$200m
$69m
20154 2020
SPECIALITY FOOD INGREDIENTS SALES2
Broaden geographical sales mix
1
2
3
1 North America 50%2 Europe, Middle East and Africa 20%3 Asia Pacific and Latin America 30%
2020 AMBITION
Strategic Report
08 Tate & Lyle PLC Annual Report 2016
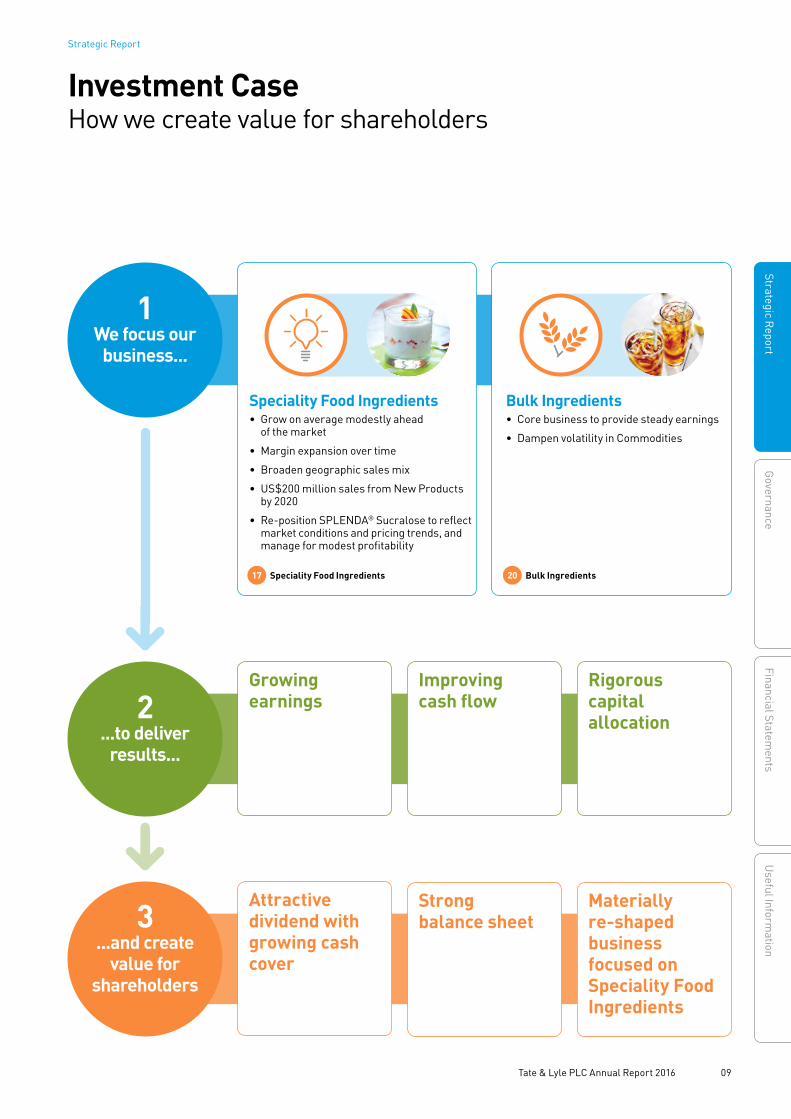
Investment CaseHow we create value for shareholders
1We focus our
business...
Speciality Food Ingredients• Grow on average modestly ahead
of the market
• Margin expansion over time
• Broaden geographic sales mix
• US$200 million sales from New Products by 2020
• Re-position SPLENDA® Sucralose to reflect market conditions and pricing trends, and manage for modest profitability
Bulk Ingredients• Core business to provide steady earnings
• Dampen volatility in Commodities
Attractive dividend with growing cash cover
Strong balance sheet
Materially re-shaped business focused on Speciality Food Ingredients
Growing earnings
Improving cash flow
Rigorous capital allocation2
...to deliver results...
3...and create
value for shareholders
17 Speciality Food Ingredients 20 Bulk Ingredients
09 Tate & Lyle PLC Annual Report 2016
Strategic ReportG
overnanceFinancial Statem
entsU
seful Information
Strategic Report
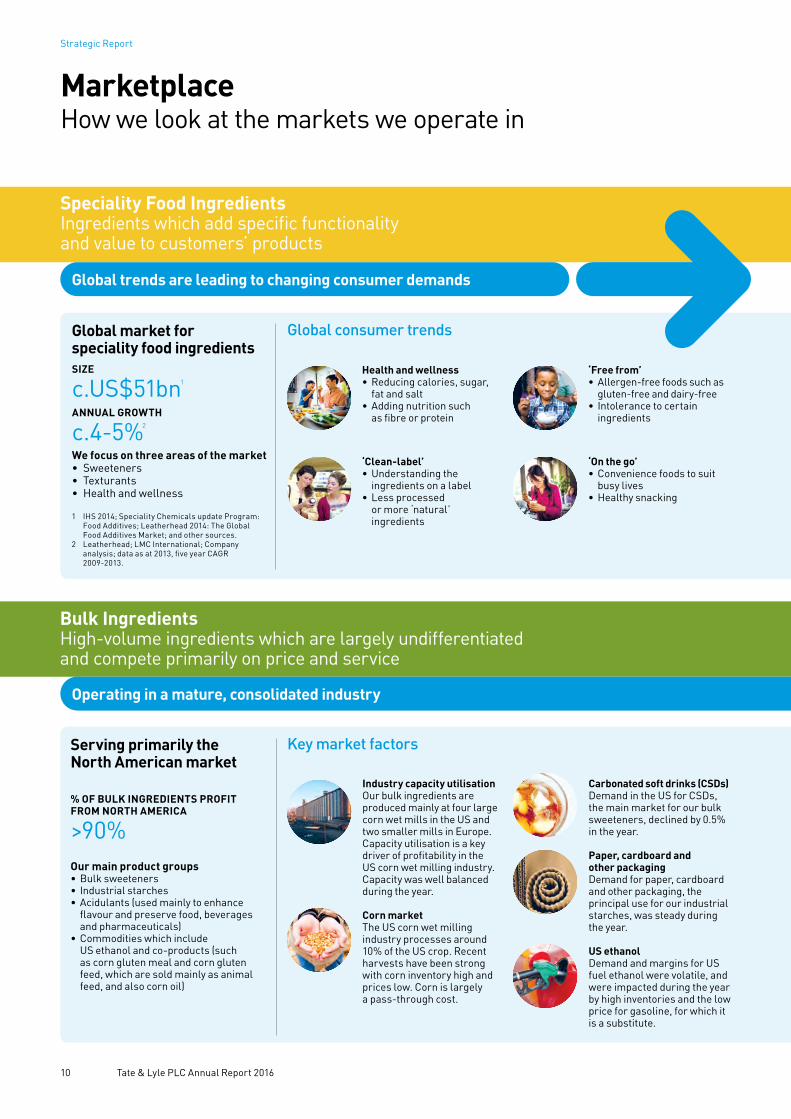
Speciality Food IngredientsIngredients which add specific functionality and value to customers’ products
Bulk IngredientsHigh-volume ingredients which are largely undifferentiated and compete primarily on price and service
Global market for speciality food ingredients
Serving primarily the North American market
% OF BULK INGREDIENTS PROFIT FROM NORTH AMERICA
>90%Our main product groups• Bulk sweeteners • Industrial starches• Acidulants (used mainly to enhance
flavour and preserve food, beverages and pharmaceuticals)
• Commodities which include US ethanol and co-products (such as corn gluten meal and corn gluten feed, which are sold mainly as animal feed, and also corn oil)
SIZE
c.US$51bn1
ANNUAL GROWTH
c.4-5%2
We focus on three areas of the market• Sweeteners• Texturants• Health and wellness
Industry capacity utilisation Our bulk ingredients are produced mainly at four large corn wet mills in the US and two smaller mills in Europe. Capacity utilisation is a key driver of profitability in the US corn wet milling industry. Capacity was well balanced during the year.
Corn market The US corn wet milling industry processes around 10% of the US crop. Recent harvests have been strong with corn inventory high and prices low. Corn is largely a pass-through cost.
Carbonated soft drinks (CSDs)Demand in the US for CSDs, the main market for our bulk sweeteners, declined by 0.5% in the year.
Paper, cardboard and other packaging Demand for paper, cardboard and other packaging, the principal use for our industrial starches, was steady during the year.
US ethanol Demand and margins for US fuel ethanol were volatile, and were impacted during the year by high inventories and the low price for gasoline, for which it is a substitute.
Global consumer trends
Key market factors
Operating in a mature, consolidated industry
1 IHS 2014; Speciality Chemicals update Program: Food Additives; Leatherhead 2014: The Global Food Additives Market; and other sources.
2 Leatherhead; LMC International; Company analysis; data as at 2013, five year CAGR 2009-2013.
Marketplace How we look at the markets we operate in
Health and wellness • Reducing calories, sugar,
fat and salt• Adding nutrition such
as fibre or protein
‘Free from’• Allergen-free foods such as
gluten-free and dairy-free• Intolerance to certain
ingredients
‘Clean-label’• Understanding the
ingredients on a label• Less processed
or more ‘natural’ ingredients
‘On the go’• Convenience foods to suit
busy lives• Healthy snacking
Global trends are leading to changing consumer demands
Strategic Report
10 Tate & Lyle PLC Annual Report 2016
Re-deploying grind to Speciality Food IngredientsThe long-term gradual decline in demand for our bulk ingredients is managed mainly by steadily re-deploying primary capacity to grow our Speciality Food Ingredients business. We also look to find alternative uses for grind, such as substrate for bio-ingredients like our Bio-PDOTM joint venture with DuPont.
Efficient operationsOur objective is to manage the Bulk Ingredients business for efficiency and steady earnings. In the mature markets this business operates in, these are delivered by:
• optimising product mix and margins• maintaining capital expenditure discipline• continuous operational improvements to drive productivity
and efficiency• reducing exposure to commodity markets where we can, by
dampening volatility by using conservative hedging strategies; maintaining a mix of tolling and non-tolling contracts; actively managing co-product sales; and investing in the corn elevator storage network to secure raw material supply.
3 FoodMinds (US), 2014.4 Tate & Lyle multi-country Consumer
Research 2015.5 Nielsen and Mintel Consulting (US)
for Corn Refiners Association ‘Sweetener360’, 2013.
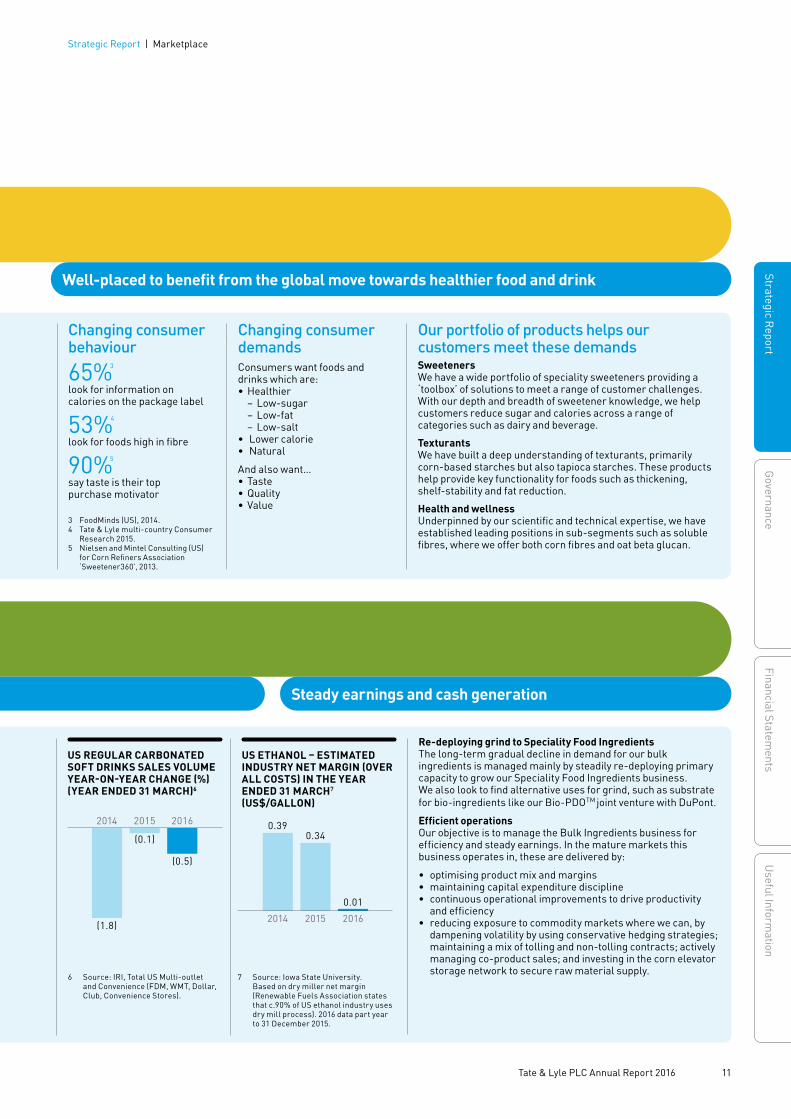
Well-placed to benefit from the global move towards healthier food and drink
Steady earnings and cash generation
Our portfolio of products helps our customers meet these demandsSweetenersWe have a wide portfolio of speciality sweeteners providing a ‘toolbox’ of solutions to meet a range of customer challenges. With our depth and breadth of sweetener knowledge, we help customers reduce sugar and calories across a range of categories such as dairy and beverage.
TexturantsWe have built a deep understanding of texturants, primarily corn-based starches but also tapioca starches. These products help provide key functionality for foods such as thickening, shelf-stability and fat reduction.
Health and wellnessUnderpinned by our scientific and technical expertise, we have established leading positions in sub-segments such as soluble fibres, where we offer both corn fibres and oat beta glucan.
Changing consumer behaviour
65%3
look for information on calories on the package label
53%4
look for foods high in fibre
90%5
say taste is their top purchase motivator
Changing consumer demandsConsumers want foods and drinks which are:• Healthier
− Low-sugar − Low-fat − Low-salt
• Lower calorie• Natural
And also want…• Taste• Quality• Value
US REGULAR CARBONATED SOFT DRINKS SALES VOLUME YEAR-ON-YEAR CHANGE (%) (YEAR ENDED 31 MARCH)6
US ETHANOL – ESTIMATED INDUSTRY NET MARGIN (OVER ALL COSTS) IN THE YEAR ENDED 31 MARCH7
(US$/GALLON)
(0.1)
(0.5)
2014 2015 2016
(1.8)2015
0.34
2016
0.01
2014
0.39
6 Source: IRI, Total US Multi-outlet and Convenience (FDM, WMT, Dollar, Club, Convenience Stores).
7 Source: Iowa State University. Based on dry miller net margin (Renewable Fuels Association states that c.90% of US ethanol industry uses dry mill process). 2016 data part year to 31 December 2015.
11 Tate & Lyle PLC Annual Report 2016
Strategic ReportG
overnanceFinancial Statem
entsU
seful Information
Strategic Report | Marketplace
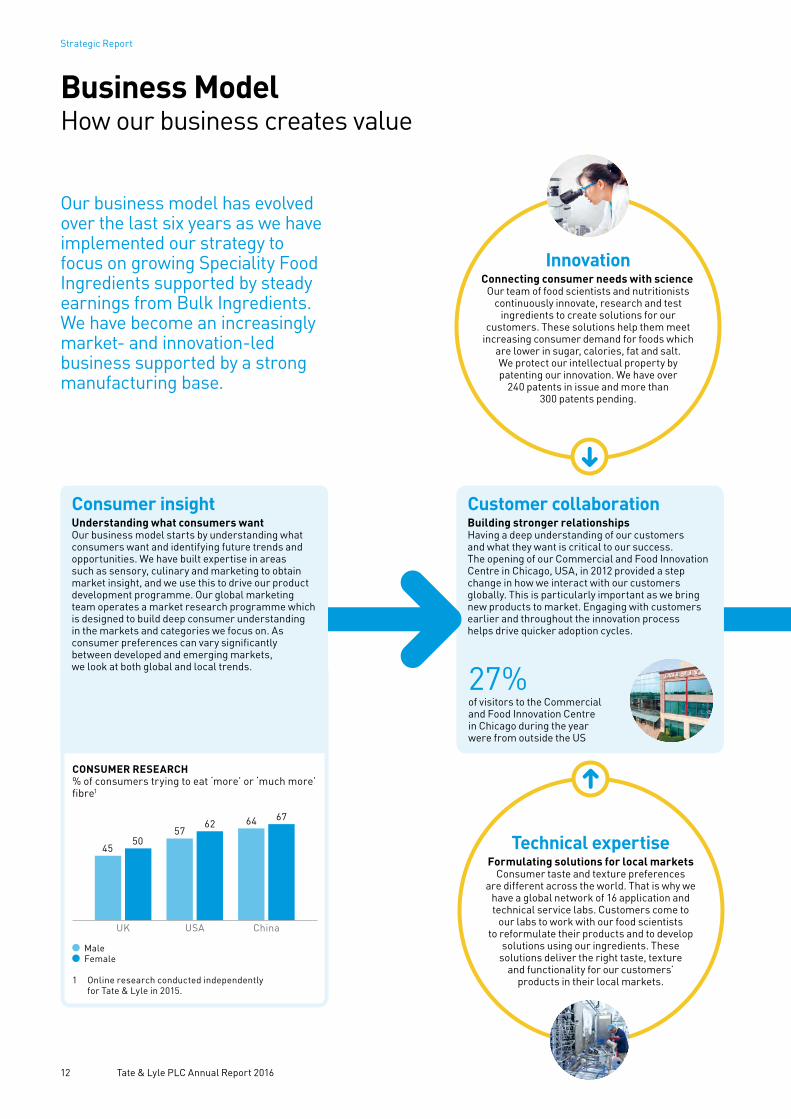
CONSUMER RESEARCH% of consumers trying to eat ‘more’ or ‘much more’ fibre1
China
64 67
USA
6257
UK
5045
Male Female
1 Online research conducted independently for Tate & Lyle in 2015.
Consumer insightUnderstanding what consumers wantOur business model starts by understanding what consumers want and identifying future trends and opportunities. We have built expertise in areas such as sensory, culinary and marketing to obtain market insight, and we use this to drive our product development programme. Our global marketing team operates a market research programme which is designed to build deep consumer understanding in the markets and categories we focus on. As consumer preferences can vary significantly between developed and emerging markets, we look at both global and local trends.
InnovationConnecting consumer needs with science
Our team of food scientists and nutritionists continuously innovate, research and test
ingredients to create solutions for our customers. These solutions help them meet
increasing consumer demand for foods which are lower in sugar, calories, fat and salt. We protect our intellectual property by patenting our innovation. We have over
240 patents in issue and more than 300 patents pending.
Technical expertiseFormulating solutions for local markets
Consumer taste and texture preferences are different across the world. That is why we
have a global network of 16 application and technical service labs. Customers come to
our labs to work with our food scientists to reformulate their products and to develop
solutions using our ingredients. These solutions deliver the right taste, texture
and functionality for our customers’ products in their local markets.
Customer collaborationBuilding stronger relationships Having a deep understanding of our customers and what they want is critical to our success. The opening of our Commercial and Food Innovation Centre in Chicago, USA, in 2012 provided a step change in how we interact with our customers globally. This is particularly important as we bring new products to market. Engaging with customers earlier and throughout the innovation process helps drive quicker adoption cycles.
27%of visitors to the Commercial and Food Innovation Centre in Chicago during the year were from outside the US
Business Model How our business creates value
Our business model has evolved over the last six years as we have implemented our strategy to focus on growing Speciality Food Ingredients supported by steady earnings from Bulk Ingredients. We have become an increasingly market- and innovation-led business supported by a strong manufacturing base.
Strategic Report
12 Tate & Lyle PLC Annual Report 2016

Financial returns Generating cashRevenue from the sale of our ingredients and solutions generates cash flow which, after meeting our costs, helps us fund business investments, meet our debt obligations and provide returns to shareholders through dividends.
Logistics and transportationMoving products from plants to customersGlobal Operations ensures our ingredients are delivered to our customers on time, in full and to the right specification. For Speciality Food Ingredients, this is a complex process with multiple ingredients, formulations (powders and liquids) and different types of packaging travelling around the world. For Bulk Ingredients, volumes are larger but there are fewer products travelling relatively shorter distances to customers.
Raw material sourcingSecuring supply of raw materials
Most of our ingredients are produced from agricultural crops, predominantly corn.
We have a dedicated corn procurement team which works closely with farmers and other commercial partners to ensure we have a
reliable and secure supply of corn. We also operate a network of corn elevator facilities across the US Midwest where we can store
corn throughout the year.
ManufacturingProducing high quality ingredients Our ingredients and solutions are manufactured at more than 25 facilities worldwide. These include large volume plants, such as corn wet mills, and smaller blending facilities. Food safety, quality and traceability are high priorities, and our manufacturing facilities are externally certified to the Global Food Safety Initiative. We also work to address environmental considerations across the life-cycle of our products, continually seeking to use resources such as energy and water more efficiently, and reduce waste. 60+
Warehouses and transfer stations across the world where we keep products close to the end-market to serve our customers
10.4% reduction in CO2e emissions per tonne of production since 2008
Delivery of ingredients or solutions to customersGo-to-market expertiseOur ingredients and solutions are used by our customers to add taste, texture, nutrition and functionality to products consumed by millions of people every day. Serving our customers and being their preferred partner is core to everything we do. We have strengthened our customer-facing capabilities across the business, in areas such as applications, technical service, sales and marketing. We have also implemented a programme to enhance the way we plan and manage customer accounts in both our business divisions.
WHAT MAKES US DIFFERENT
Our core strengthsOur business has a range of core strengths which differentiates us in the market. Our approach is to focus and build deep expertise in those areas where we have an advantage. Our deep functional and technical expertise in delivering sweetness, texture and fibre enrichment enables us to deliver tailored solutions for our customers in key categories such as beverage and dairy. We have a leading portfolio of sweeteners, a wide range of highly functional speciality starches, and soluble fibres offering nutritional and health benefits. Our scale manufacturing base and know-how also drive operational efficiency and a high level of product quality.
13 Tate & Lyle PLC Annual Report 2016
Strategic ReportG
overnanceFinancial Statem
entsU
seful Information
Strategic Report | Business Model
Key Performance IndicatorsHow we measure our progress
Performance
How we measure performance What we measure Why we measure it How we performed Comments
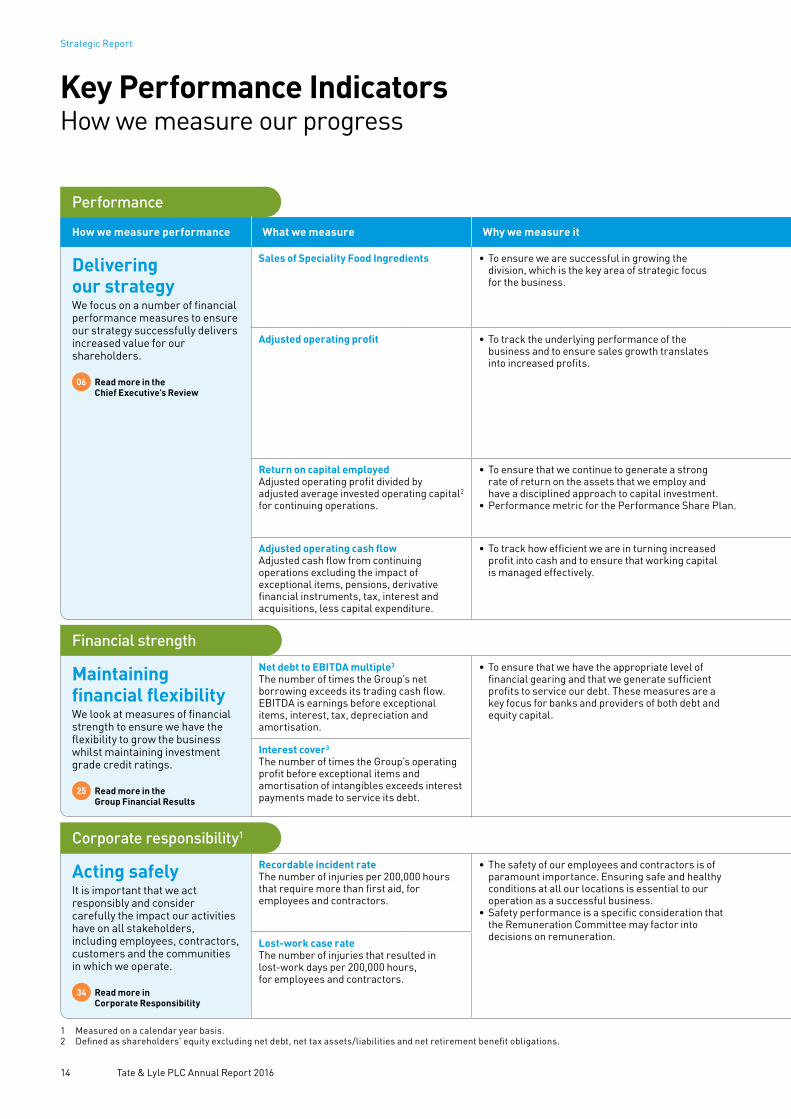
Delivering our strategyWe focus on a number of financial performance measures to ensure our strategy successfully delivers increased value for our shareholders.
06 Read more in the Chief Executive’s Review
Sales of Speciality Food Ingredients • To ensure we are successful in growing the division, which is the key area of strategic focus for the business.
CHANGE
+2%(constant currency)
2016
20154
20144
£897m
£865m
£951m
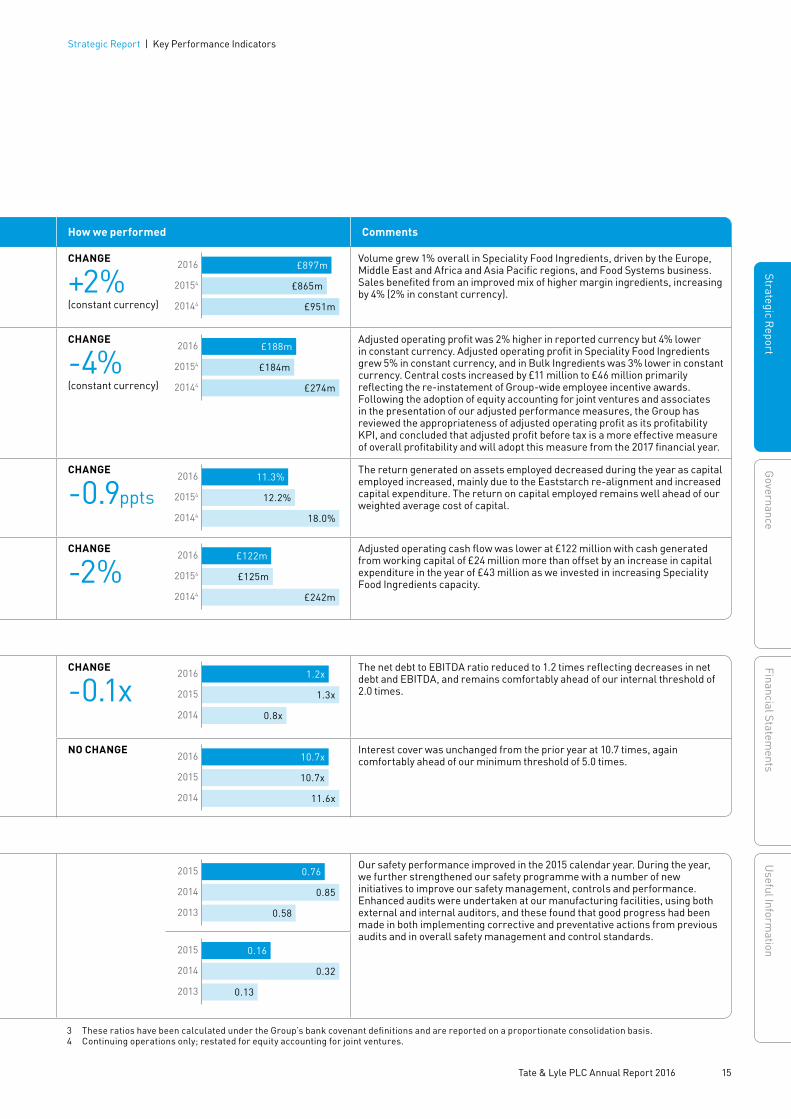
Volume grew 1% overall in Speciality Food Ingredients, driven by the Europe, Middle East and Africa and Asia Pacific regions, and Food Systems business. Sales benefited from an improved mix of higher margin ingredients, increasing by 4% (2% in constant currency).
Adjusted operating profit • To track the underlying performance of the business and to ensure sales growth translates into increased profits.
CHANGE
-4%(constant currency)
2016
20154
20144
£188m
£184m
£274m
Adjusted operating profit was 2% higher in reported currency but 4% lower in constant currency. Adjusted operating profit in Speciality Food Ingredients grew 5% in constant currency, and in Bulk Ingredients was 3% lower in constant currency. Central costs increased by £11 million to £46 million primarily reflecting the re-instatement of Group-wide employee incentive awards. Following the adoption of equity accounting for joint ventures and associates in the presentation of our adjusted performance measures, the Group has reviewed the appropriateness of adjusted operating profit as its profitability KPI, and concluded that adjusted profit before tax is a more effective measure of overall profitability and will adopt this measure from the 2017 financial year.
Return on capital employed Adjusted operating profit divided by adjusted average invested operating capital2 for continuing operations.
• To ensure that we continue to generate a strong rate of return on the assets that we employ and have a disciplined approach to capital investment.
• Performance metric for the Performance Share Plan.
CHANGE
-0.9ppts 2016
20154
20144
11.3%
12.2%
18.0%
The return generated on assets employed decreased during the year as capital employed increased, mainly due to the Eaststarch re-alignment and increased capital expenditure. The return on capital employed remains well ahead of our weighted average cost of capital.
Adjusted operating cash flowAdjusted cash flow from continuing operations excluding the impact of exceptional items, pensions, derivative financial instruments, tax, interest and acquisitions, less capital expenditure.
• To track how efficient we are in turning increased profit into cash and to ensure that working capital is managed effectively.
CHANGE
-2%2016
20154
20144
£122m
£125m
£242m
Adjusted operating cash flow was lower at £122 million with cash generated from working capital of £24 million more than offset by an increase in capital expenditure in the year of £43 million as we invested in increasing Speciality Food Ingredients capacity.
Financial strength
Maintaining financial flexibilityWe look at measures of financial strength to ensure we have the flexibility to grow the business whilst maintaining investment grade credit ratings.
25 Read more in the Group Financial Results
Net debt to EBITDA multiple3 The number of times the Group’s netborrowing exceeds its trading cash flow.EBITDA is earnings before exceptionalitems, interest, tax, depreciation andamortisation.
• To ensure that we have the appropriate level of financial gearing and that we generate sufficient profits to service our debt. These measures are a key focus for banks and providers of both debt and equity capital.
CHANGE
-0.1x2016
2015
2014
1.2x
1.3x
0.8x
The net debt to EBITDA ratio reduced to 1.2 times reflecting decreases in net debt and EBITDA, and remains comfortably ahead of our internal threshold of 2.0 times.
Interest cover3 The number of times the Group’s operating profit before exceptional items and amortisation of intangibles exceeds interest payments made to service its debt.
NO CHANGE2016
2015
2014
10.7x
10.7x
11.6x
Interest cover was unchanged from the prior year at 10.7 times, again comfortably ahead of our minimum threshold of 5.0 times.
Corporate responsibility1
Acting safelyIt is important that we act responsibly and consider carefully the impact our activities have on all stakeholders, including employees, contractors, customers and the communities in which we operate.
34 Read more in Corporate Responsibility
Recordable incident rate The number of injuries per 200,000 hours that require more than first aid, for employees and contractors.
• The safety of our employees and contractors is of paramount importance. Ensuring safe and healthy conditions at all our locations is essential to our operation as a successful business.
• Safety performance is a specific consideration that the Remuneration Committee may factor into decisions on remuneration.
2015
2014
2013
0.76
0.85
0.58
Our safety performance improved in the 2015 calendar year. During the year, we further strengthened our safety programme with a number of new initiatives to improve our safety management, controls and performance. Enhanced audits were undertaken at our manufacturing facilities, using both external and internal auditors, and these found that good progress had been made in both implementing corrective and preventative actions from previous audits and in overall safety management and control standards. Lost-work case rate
The number of injuries that resulted inlost-work days per 200,000 hours,for employees and contractors.
2015
2014
2013
0.16
0.32
0.13
1 Measured on a calendar year basis.2 Defined as shareholders’ equity excluding net debt, net tax assets/liabilities and net retirement benefit obligations.
Strategic Report
14 Tate & Lyle PLC Annual Report 2016
Performance
How we measure performance What we measure Why we measure it How we performed Comments
Delivering our strategyWe focus on a number of financial performance measures to ensure our strategy successfully delivers increased value for our shareholders.
06 Read more in the Chief Executive’s Review
Sales of Speciality Food Ingredients • To ensure we are successful in growing the division, which is the key area of strategic focus for the business.
CHANGE
+2%(constant currency)
2016
20154
20144
£897m
£865m
£951m
Volume grew 1% overall in Speciality Food Ingredients, driven by the Europe, Middle East and Africa and Asia Pacific regions, and Food Systems business. Sales benefited from an improved mix of higher margin ingredients, increasing by 4% (2% in constant currency).
Adjusted operating profit • To track the underlying performance of the business and to ensure sales growth translates into increased profits.
CHANGE
-4%(constant currency)
2016
20154
20144
£188m
£184m
£274m
Adjusted operating profit was 2% higher in reported currency but 4% lower in constant currency. Adjusted operating profit in Speciality Food Ingredients grew 5% in constant currency, and in Bulk Ingredients was 3% lower in constant currency. Central costs increased by £11 million to £46 million primarily reflecting the re-instatement of Group-wide employee incentive awards. Following the adoption of equity accounting for joint ventures and associates in the presentation of our adjusted performance measures, the Group has reviewed the appropriateness of adjusted operating profit as its profitability KPI, and concluded that adjusted profit before tax is a more effective measure of overall profitability and will adopt this measure from the 2017 financial year.
Return on capital employed Adjusted operating profit divided by adjusted average invested operating capital2 for continuing operations.
• To ensure that we continue to generate a strong rate of return on the assets that we employ and have a disciplined approach to capital investment.
• Performance metric for the Performance Share Plan.
CHANGE
-0.9ppts 2016
20154
20144
11.3%
12.2%
18.0%
The return generated on assets employed decreased during the year as capital employed increased, mainly due to the Eaststarch re-alignment and increased capital expenditure. The return on capital employed remains well ahead of our weighted average cost of capital.
Adjusted operating cash flowAdjusted cash flow from continuing operations excluding the impact of exceptional items, pensions, derivative financial instruments, tax, interest and acquisitions, less capital expenditure.
• To track how efficient we are in turning increased profit into cash and to ensure that working capital is managed effectively.
CHANGE
-2%2016
20154
20144
£122m
£125m
£242m
Adjusted operating cash flow was lower at £122 million with cash generated from working capital of £24 million more than offset by an increase in capital expenditure in the year of £43 million as we invested in increasing Speciality Food Ingredients capacity.
Financial strength
Maintaining financial flexibilityWe look at measures of financial strength to ensure we have the flexibility to grow the business whilst maintaining investment grade credit ratings.
25 Read more in the Group Financial Results
Net debt to EBITDA multiple3 The number of times the Group’s netborrowing exceeds its trading cash flow.EBITDA is earnings before exceptionalitems, interest, tax, depreciation andamortisation.
• To ensure that we have the appropriate level of financial gearing and that we generate sufficient profits to service our debt. These measures are a key focus for banks and providers of both debt and equity capital.
CHANGE
-0.1x2016
2015
2014
1.2x
1.3x
0.8x
The net debt to EBITDA ratio reduced to 1.2 times reflecting decreases in net debt and EBITDA, and remains comfortably ahead of our internal threshold of 2.0 times.
Interest cover3 The number of times the Group’s operating profit before exceptional items and amortisation of intangibles exceeds interest payments made to service its debt.
NO CHANGE2016
2015
2014
10.7x
10.7x
11.6x
Interest cover was unchanged from the prior year at 10.7 times, again comfortably ahead of our minimum threshold of 5.0 times.
Corporate responsibility1
Acting safelyIt is important that we act responsibly and consider carefully the impact our activities have on all stakeholders, including employees, contractors, customers and the communities in which we operate.
34 Read more in Corporate Responsibility
Recordable incident rate The number of injuries per 200,000 hours that require more than first aid, for employees and contractors.
• The safety of our employees and contractors is of paramount importance. Ensuring safe and healthy conditions at all our locations is essential to our operation as a successful business.
• Safety performance is a specific consideration that the Remuneration Committee may factor into decisions on remuneration.
2015
2014
2013
0.76
0.85
0.58
Our safety performance improved in the 2015 calendar year. During the year, we further strengthened our safety programme with a number of new initiatives to improve our safety management, controls and performance. Enhanced audits were undertaken at our manufacturing facilities, using both external and internal auditors, and these found that good progress had been made in both implementing corrective and preventative actions from previous audits and in overall safety management and control standards. Lost-work case rate
The number of injuries that resulted inlost-work days per 200,000 hours,for employees and contractors.
2015
2014
2013
0.16
0.32
0.13
3 These ratios have been calculated under the Group’s bank covenant definitions and are reported on a proportionate consolidation basis. 4 Continuing operations only; restated for equity accounting for joint ventures.
15 Tate & Lyle PLC Annual Report 2016
Strategic ReportG
overnanceFinancial Statem
entsU
seful Information
Strategic Report | Key Performance Indicators

Gabriella ParissePresident, Innovation and Commercial DevelopmentGabriella joined Tate & Lyle in 2012 as Senior Vice President, Global Marketing, having previously spent 25 years at Johnson & Johnson. She was appointed President, Innovation and Commercial Development from May 2014.
Nick HamptonChief Financial OfficerNick joined Tate & Lyle as Chief Financial Officer in September 2014. He held a number of senior roles over a 20-year career at PepsiCo, including as PepsiCo’s CFO Europe; President, West Europe Region; and Senior Vice President Commercial, Europe.
Joan BracaPresident, Speciality Food IngredientsJoan joined Tate & Lyle in 2013 as Senior Vice President and General Manager, Asia Pacific. She was then appointed as President, Speciality Food Ingredients from November 2014. Prior to joining Tate & Lyle, Joan spent nearly 20 years with Rohm and Haas Company.
Robert Gibber Executive Vice President, General CounselRob joined Tate & Lyle in 1990 as a commercial lawyer. He previously worked for City law firms Wilde Sapte and Herbert Oppenheimer. He was appointed General Counsel in 1997 and was Company Secretary between 2001 and 2012. Rob has global responsibility for legal affairs, regulatory and quality.
Jim StutelbergPresident, Bulk IngredientsJim joined Tate & Lyle in 2014 from Pennsylvania-based PPG Industries Inc. where he led its Automotive Coatings business in the Americas. Prior to that, he spent 16 years with Dow Corning Corporation in a variety of senior marketing and sales roles, including five years working in Shanghai, China.
Rob LuijtenExecutive Vice President, Human ResourcesRob joined Tate & Lyle as Executive Vice President, Human Resources in 2010. Prior to joining Tate & Lyle, Rob was Human Resources Director for Africa, Middle East and Asia for BG Group PLC. He also spent ten years with GE Plastics in a number of senior human resources roles in both Europe and Asia.
Rowan AdamsExecutive Vice President, Corporate AffairsRowan joined Tate & Lyle in 2001 from National Westminster Bank. During his career at Tate & Lyle he has held a number of senior roles and was appointed Executive Vice President, Corporate Affairs from November 2014 with global responsibility for public affairs, communications and risk.
Javed AhmedChief ExecutiveJaved joined Tate & Lyle as Chief Executive in October 2009. He has extensive international experience from a wide variety of senior management roles mainly at Reckitt Benckiser plc in North America, Europe, Australia and New Zealand.
Pierre SchoumacherPresident, Global OperationsPierre joined Tate & Lyle in 2000 from Procter & Gamble. During his career at Tate & Lyle he has held a number of senior operational and commercial roles, and was appointed President, Global Operations from November 2014.
Executive Committee Responsible for delivering our strategy and achieving business results
Strategic Report
16 Tate & Lyle PLC Annual Report 2016

We look to Speciality Food Ingredients to be the engine of growth for the Group. Over time, we expect the market for Speciality Food Ingredients to grow at mid-single digits and our objective is to grow modestly ahead of the market and to drive margin expansion.
CONTINUING OPERATIONS
Year ended 31 March 2016
Restated1
Year ended 31 March 2015
Volume change
Sales £m
Adjustedoperating
profit£m
Volume change
Sales £m
Adjustedoperating
profit£m
North America (2)% 327 (2)% 313 Asia Pacific and Latin America (4)% 119 7% 109 Europe, Middle East and Africa 12% 109 6% 104 Total excluding SPLENDA® Sucralose and Food Systems 0% 555 105 1% 526 93 Food Systems 12% 186 23 15% 190 27 SPLENDA® Sucralose 7% 156 22 1% 149 16 Total Speciality Food Ingredients 1% 897 150 2% 865 136
1 For continuing operations only with prior year measures restated to exclude discontinued operations. Adjusted metrics restated for the adoption of equity accounting (see Note 1).
Speciality Food Ingredients We are well-placed to benefit from increasing global consumer trends for healthier food and drink
Joan Braca, President
KEY PRIORITIES
SALES
£897mADJUSTED OPERATING PROFIT
£150m
Drive growth in North America
Build on growth in Asia Pacific and Latin America
Restructure Europe to enhance margins
Top line growth in Food Systems
Continue to drive growth in New Products
Selective bolt-on acquisitions
17 Tate & Lyle PLC Annual Report 2016
Strategic ReportG
overnanceFinancial Statem
entsU
seful Information
Strategic Report

Speciality Food Ingredients continued
In Speciality Food Ingredients, volumes were up 1%, driven by growth in EMEA, Asia Pacific and in Food Systems. Sales increased by 4% to £897 million (2% in constant currency), benefiting from improved mix of higher margin products.
The division delivered 100 bps operating margin improvement and adjusted operating profit increased by 10% to £150 million (5% in constant currency) reflecting a strong focus on the mix of sales as we actively managed capacity through most of the year, strengthened supply chain performance and improved performance from SPLENDA® Sucralose. The effect of exchange translation was to increase sales by £11 million and adjusted operating profit by £7 million.
Speciality Food Ingredients excluding SPLENDA® Sucralose and Food SystemsVolume was in line with the prior year and benefited from the acquisition of the Slovakian corn wet mill as part of the re-alignment of the Eaststarch joint venture. Sales grew by 6% (3% in constant currency) as we actively managed capacity for improved customer service and product mix.
Adjusted operating profit increased by 12% to £105 million (7% in constant currency). Improved year-on-year profitability was driven by the focus on sales mix to higher margin products and stronger supply chain performance. The additional capacity brought on line towards the end of the financial year creates additional growth headroom for the core business, but also increases the depreciation charge in the division by around £12 million for the 2017 financial year.
In North America, volume was 2% lower as we managed available capacity through most of the year ahead of the new capacity coming online for the 2016 calendar year contracting season and, in the third quarter of the year, also experienced softer demand from some larger customers. Volume increased in speciality fibres and speciality sweeteners, with offsetting reductions in some lower margin starch products. Sales increased by 4% (2% decrease in constant currency) to £327 million. Volume momentum improved in the fourth quarter and we continue to focus on the acceleration of volume growth in this region.
In Asia Pacific and Latin America, volume was 4% lower reflecting a sharp decline in Latin America partially offset by double digit growth in Asia Pacific. In Latin America weaker economic conditions and softer consumer demand for products utilising our speciality sweeteners led to the decline in volume. In Asia Pacific, volume growth, which accelerated in the second half, was driven by speciality fibres and speciality starches, as we continued to build our business strongly in China. Sales for the combined region increased by 9% (10% in constant currency) to £119 million as a result of a stronger mix of higher value products and the benefit, in the first half, of the termination of crystalline fructose distribution rights previously held by a third party.
In EMEA, volume increased by 12% benefiting from good growth outside Western Europe driven by speciality starches and the benefit in the second half of the year of the full ownership of the facility in Slovakia. Sales increased by 5% on a reported basis (13% growth in constant currency) to £109 million.
Food SystemsIn our global blending business, volumes were 12% ahead of the prior year benefitting from the full year impact of the acquisition of Gemacom Tech in Brazil in December 2014. While sales decreased by 2% in reported currency to £186 million, they grew by 2% in constant currency mainly driven by the Gemacom acquisition and the expansion into new territories and customers, primarily in Middle East, Africa and Asia Pacific. Adjusted operating profit was 13% lower (11% lower in constant currency) at £23 million largely driven by the sharp increase in the cost of egg powder, a key blending ingredient, following an outbreak of avian flu.
SPLENDA® Sucralose Volume increased by 7% and sales increased by 4% (flat in constant currency) to £156 million. The rate of decline of our selling prices for SPLENDA® Sucralose slowed during the year as we pursued a rigorous value-based approach by focusing on those customers who fully value the benefits of our product.
NORTH AMERICAFOCUSING ON SUB-CATEGORIES WHICH ARE GROWING ABOVE THE OVERALL FOOD AND BEVERAGE MARKET
NUTRITION BARSPROMITOR® Soluble Fibre is increasingly being used in the nutritional bars sub-category in North America as it can provide customers with solutions to many different challenges. It not only removes sugar and calories, but also helps to maintain bar texture, and deliver a ‘high in fibre’ claim.
53%of global
consumers look for foods which are high in fibre1
1 Tate & Lyle multi-country Consumer Research 2015.
Strategic Report
18 Tate & Lyle PLC Annual Report 2016
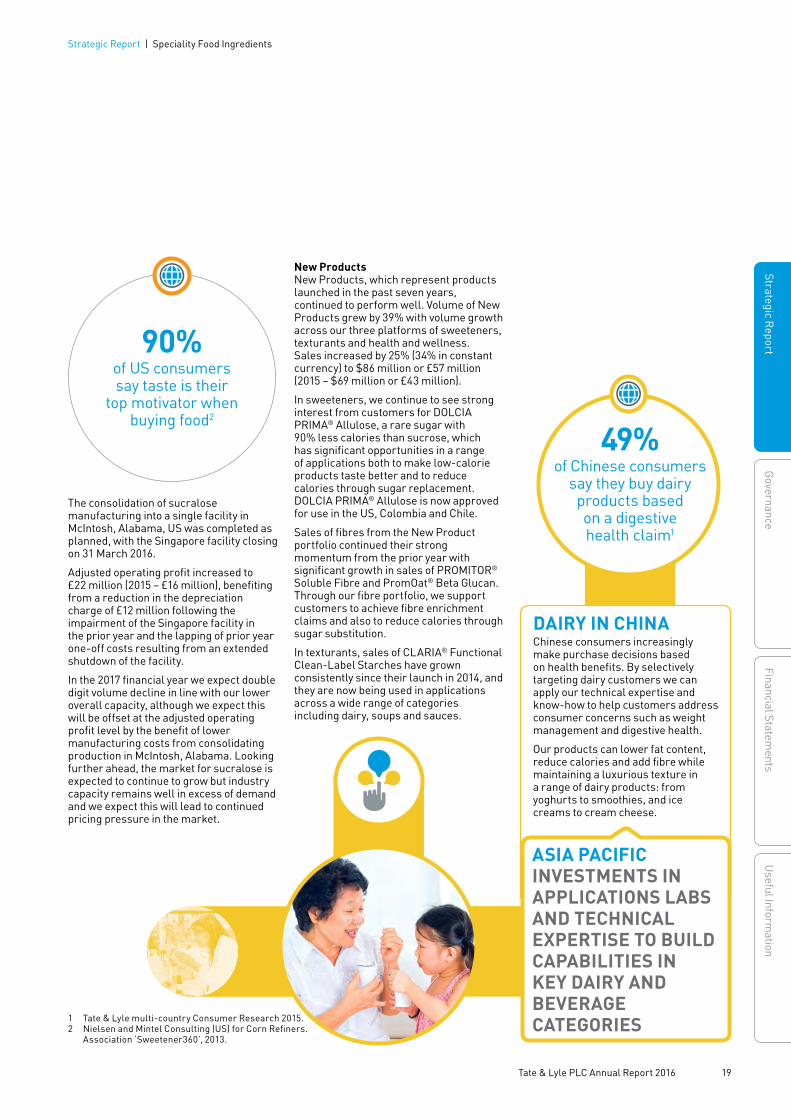
The consolidation of sucralose manufacturing into a single facility in McIntosh, Alabama, US was completed as planned, with the Singapore facility closing on 31 March 2016.
Adjusted operating profit increased to £22 million (2015 – £16 million), benefiting from a reduction in the depreciation charge of £12 million following the impairment of the Singapore facility in the prior year and the lapping of prior year one-off costs resulting from an extended shutdown of the facility.
In the 2017 financial year we expect double digit volume decline in line with our lower overall capacity, although we expect this will be offset at the adjusted operating profit level by the benefit of lower manufacturing costs from consolidating production in McIntosh, Alabama. Looking further ahead, the market for sucralose is expected to continue to grow but industry capacity remains well in excess of demand and we expect this will lead to continued pricing pressure in the market.
90%of US consumers say taste is their
top motivator when buying food2
49%of Chinese consumers
say they buy dairy products based on a digestive health claim1
ASIA PACIFICINVESTMENTS IN APPLICATIONS LABS AND TECHNICAL EXPERTISE TO BUILD CAPABILITIES IN KEY DAIRY AND BEVERAGE CATEGORIES
DAIRY IN CHINAChinese consumers increasingly make purchase decisions based on health benefits. By selectively targeting dairy customers we can apply our technical expertise and know-how to help customers address consumer concerns such as weight management and digestive health.
Our products can lower fat content, reduce calories and add fibre while maintaining a luxurious texture in a range of dairy products: from yoghurts to smoothies, and ice creams to cream cheese.
1 Tate & Lyle multi-country Consumer Research 2015.2 Nielsen and Mintel Consulting (US) for Corn Refiners.
Association ‘Sweetener360’, 2013.
New ProductsNew Products, which represent products launched in the past seven years, continued to perform well. Volume of New Products grew by 39% with volume growth across our three platforms of sweeteners, texturants and health and wellness. Sales increased by 25% (34% in constant currency) to $86 million or £57 million (2015 – $69 million or £43 million).
In sweeteners, we continue to see strong interest from customers for DOLCIA PRIMA® Allulose, a rare sugar with 90% less calories than sucrose, which has significant opportunities in a range of applications both to make low-calorie products taste better and to reduce calories through sugar replacement. DOLCIA PRIMA® Allulose is now approved for use in the US, Colombia and Chile.
Sales of fibres from the New Product portfolio continued their strong momentum from the prior year with significant growth in sales of PROMITOR® Soluble Fibre and PromOat® Beta Glucan. Through our fibre portfolio, we support customers to achieve fibre enrichment claims and also to reduce calories through sugar substitution.
In texturants, sales of CLARIA® Functional Clean-Label Starches have grown consistently since their launch in 2014, and they are now being used in applications across a wide range of categories including dairy, soups and sauces.
19 Tate & Lyle PLC Annual Report 2016
Strategic ReportG
overnanceFinancial Statem
entsU
seful Information
Strategic Report | Speciality Food Ingredients
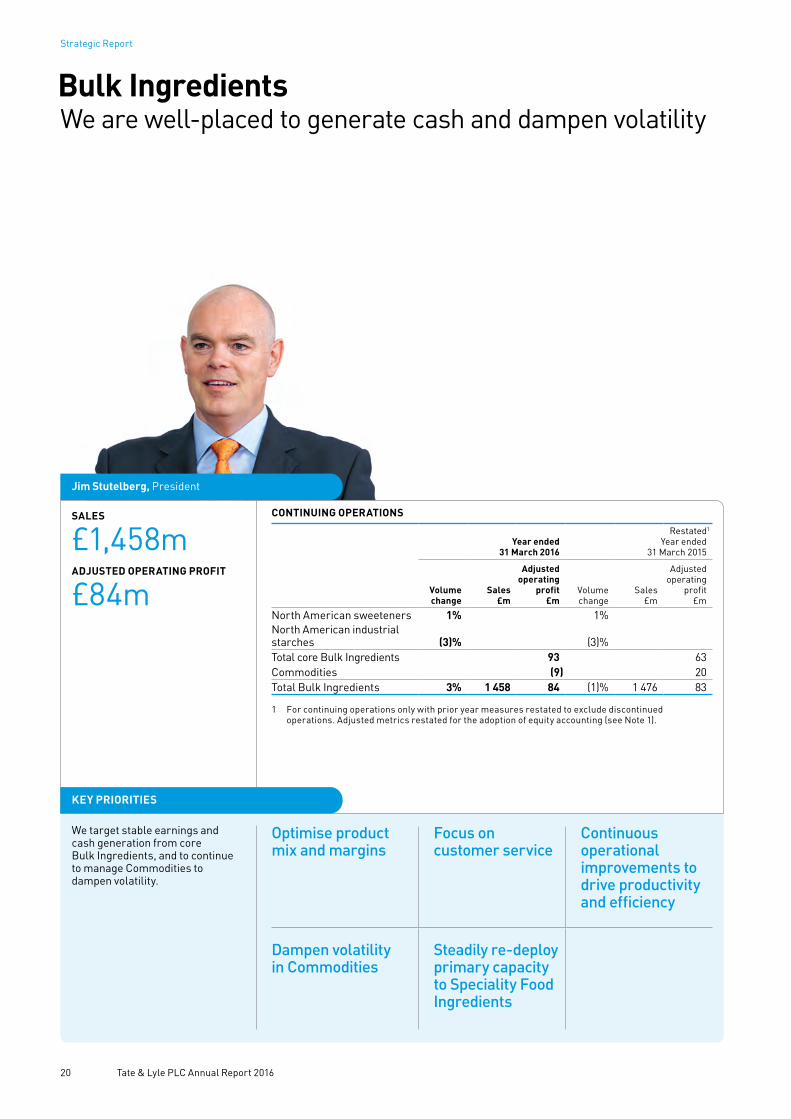
Bulk Ingredients We are well-placed to generate cash and dampen volatility
Jim Stutelberg, President
We target stable earnings and cash generation from core Bulk Ingredients, and to continue to manage Commodities to dampen volatility.
CONTINUING OPERATIONS
Year ended 31 March 2016
Restated1
Year ended 31 March 2015
Volume change
Sales £m
Adjustedoperating
profit£m
Volume change
Sales £m
Adjustedoperating
profit£m
North American sweeteners 1% 1% North American industrial starches (3)% (3)%Total core Bulk Ingredients 93 63 Commodities (9) 20 Total Bulk Ingredients 3% 1 458 84 (1)% 1 476 83
1 For continuing operations only with prior year measures restated to exclude discontinued operations. Adjusted metrics restated for the adoption of equity accounting (see Note 1).
KEY PRIORITIES
SALES
£1,458mADJUSTED OPERATING PROFIT
£84m
Optimise product mix and margins
Focus on customer service
Continuous operational improvements to drive productivity and efficiency
Dampen volatility in Commodities
Steadily re-deploy primary capacity to Speciality Food Ingredients
Strategic Report
20 Tate & Lyle PLC Annual Report 2016
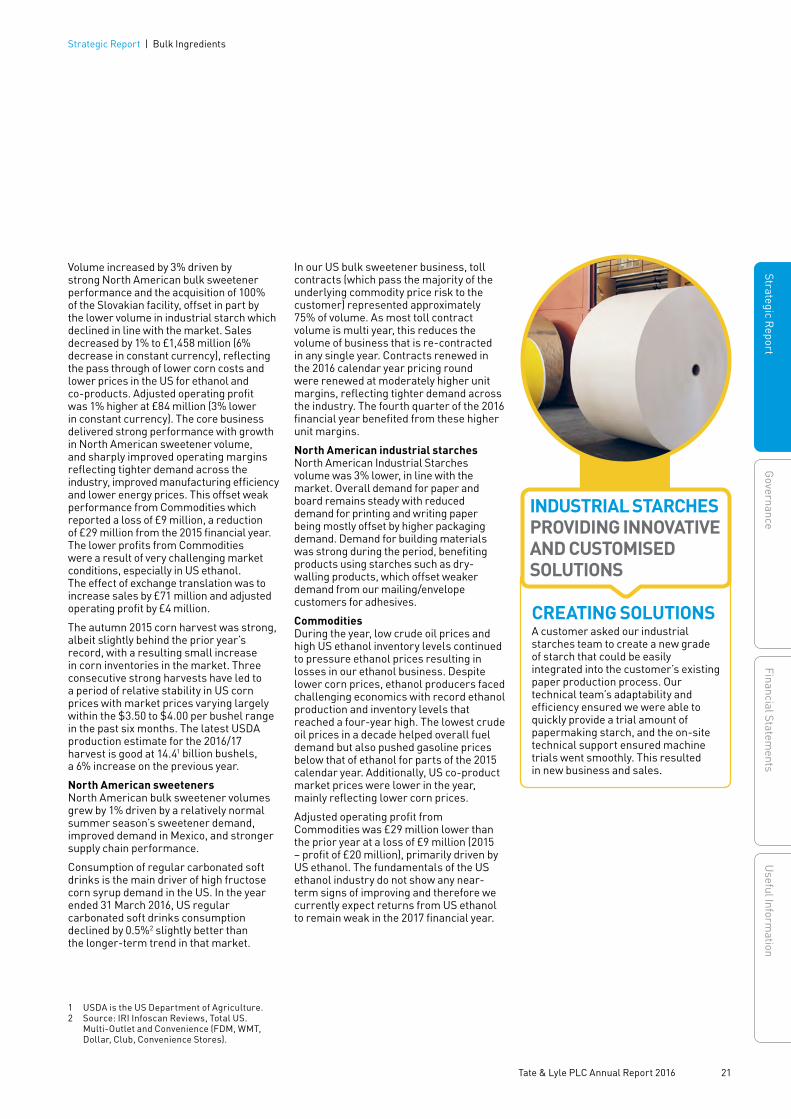
CREATING SOLUTIONSA customer asked our industrial starches team to create a new grade of starch that could be easily integrated into the customer’s existing paper production process. Our technical team’s adaptability and efficiency ensured we were able to quickly provide a trial amount of papermaking starch, and the on-site technical support ensured machine trials went smoothly. This resulted in new business and sales.
In our US bulk sweetener business, toll contracts (which pass the majority of the underlying commodity price risk to the customer) represented approximately 75% of volume. As most toll contract volume is multi year, this reduces the volume of business that is re-contracted in any single year. Contracts renewed in the 2016 calendar year pricing round were renewed at moderately higher unit margins, reflecting tighter demand across the industry. The fourth quarter of the 2016 financial year benefited from these higher unit margins.
North American industrial starches North American Industrial Starches volume was 3% lower, in line with the market. Overall demand for paper and board remains steady with reduced demand for printing and writing paper being mostly offset by higher packaging demand. Demand for building materials was strong during the period, benefiting products using starches such as dry-walling products, which offset weaker demand from our mailing/envelope customers for adhesives.
CommoditiesDuring the year, low crude oil prices and high US ethanol inventory levels continued to pressure ethanol prices resulting in losses in our ethanol business. Despite lower corn prices, ethanol producers faced challenging economics with record ethanol production and inventory levels that reached a four-year high. The lowest crude oil prices in a decade helped overall fuel demand but also pushed gasoline prices below that of ethanol for parts of the 2015 calendar year. Additionally, US co-product market prices were lower in the year, mainly reflecting lower corn prices.
Adjusted operating profit from Commodities was £29 million lower than the prior year at a loss of £9 million (2015 – profit of £20 million), primarily driven by US ethanol. The fundamentals of the US ethanol industry do not show any near-term signs of improving and therefore we currently expect returns from US ethanol to remain weak in the 2017 financial year.
Volume increased by 3% driven by strong North American bulk sweetener performance and the acquisition of 100% of the Slovakian facility, offset in part by the lower volume in industrial starch which declined in line with the market. Sales decreased by 1% to £1,458 million (6% decrease in constant currency), reflecting the pass through of lower corn costs and lower prices in the US for ethanol and co-products. Adjusted operating profit was 1% higher at £84 million (3% lower in constant currency). The core business delivered strong performance with growth in North American sweetener volume, and sharply improved operating margins reflecting tighter demand across the industry, improved manufacturing efficiency and lower energy prices. This offset weak performance from Commodities which reported a loss of £9 million, a reduction of £29 million from the 2015 financial year. The lower profits from Commodities were a result of very challenging market conditions, especially in US ethanol. The effect of exchange translation was to increase sales by £71 million and adjusted operating profit by £4 million.
The autumn 2015 corn harvest was strong, albeit slightly behind the prior year’s record, with a resulting small increase in corn inventories in the market. Three consecutive strong harvests have led to a period of relative stability in US corn prices with market prices varying largely within the $3.50 to $4.00 per bushel range in the past six months. The latest USDA production estimate for the 2016/17 harvest is good at 14.41 billion bushels, a 6% increase on the previous year.
North American sweetenersNorth American bulk sweetener volumes grew by 1% driven by a relatively normal summer season’s sweetener demand, improved demand in Mexico, and stronger supply chain performance.
Consumption of regular carbonated soft drinks is the main driver of high fructose corn syrup demand in the US. In the year ended 31 March 2016, US regular carbonated soft drinks consumption declined by 0.5%2 slightly better than the longer-term trend in that market.
INDUSTRIAL STARCHESPROVIDING INNOVATIVE AND CUSTOMISED SOLUTIONS
1 USDA is the US Department of Agriculture.2 Source: IRI Infoscan Reviews, Total US.
Multi-Outlet and Convenience (FDM, WMT, Dollar, Club, Convenience Stores).
21 Tate & Lyle PLC Annual Report 2016
Strategic ReportG
overnanceFinancial Statem
entsU
seful Information
Strategic Report | Bulk Ingredients
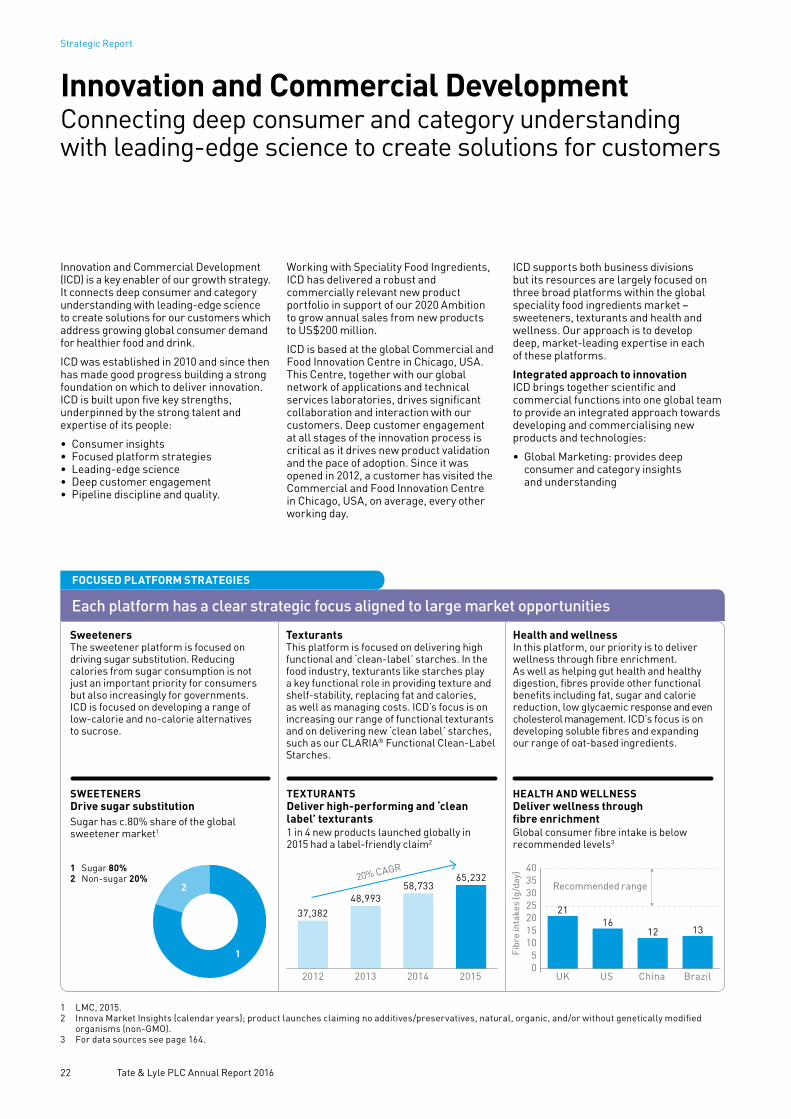
Innovation and Commercial Development Connecting deep consumer and category understanding with leading-edge science to create solutions for customers
Innovation and Commercial Development (ICD) is a key enabler of our growth strategy. It connects deep consumer and category understanding with leading-edge science to create solutions for our customers which address growing global consumer demand for healthier food and drink.
ICD was established in 2010 and since then has made good progress building a strong foundation on which to deliver innovation. ICD is built upon five key strengths, underpinned by the strong talent and expertise of its people:
• Consumer insights• Focused platform strategies• Leading-edge science• Deep customer engagement• Pipeline discipline and quality.
Working with Speciality Food Ingredients, ICD has delivered a robust and commercially relevant new product portfolio in support of our 2020 Ambition to grow annual sales from new products to US$200 million.
ICD is based at the global Commercial and Food Innovation Centre in Chicago, USA. This Centre, together with our global network of applications and technical services laboratories, drives significant collaboration and interaction with our customers. Deep customer engagement at all stages of the innovation process is critical as it drives new product validation and the pace of adoption. Since it was opened in 2012, a customer has visited the Commercial and Food Innovation Centre in Chicago, USA, on average, every other working day.
ICD supports both business divisions but its resources are largely focused on three broad platforms within the global speciality food ingredients market – sweeteners, texturants and health and wellness. Our approach is to develop deep, market-leading expertise in each of these platforms.
Integrated approach to innovationICD brings together scientific and commercial functions into one global team to provide an integrated approach towards developing and commercialising new products and technologies:
• Global Marketing: provides deep consumer and category insights and understanding
Each platform has a clear strategic focus aligned to large market opportunities
SweetenersThe sweetener platform is focused on driving sugar substitution. Reducing calories from sugar consumption is not just an important priority for consumers but also increasingly for governments. ICD is focused on developing a range of low-calorie and no-calorie alternatives to sucrose.
TexturantsThis platform is focused on delivering high functional and ‘clean-label’ starches. In the food industry, texturants like starches play a key functional role in providing texture and shelf-stability, replacing fat and calories, as well as managing costs. ICD’s focus is on increasing our range of functional texturants and on delivering new ‘clean label’ starches, such as our CLARIA® Functional Clean-Label Starches.
Health and wellnessIn this platform, our priority is to deliver wellness through fibre enrichment. As well as helping gut health and healthy digestion, fibres provide other functional benefits including fat, sugar and calorie reduction, low glycaemic response and even cholesterol management. ICD’s focus is on developing soluble fibres and expanding our range of oat-based ingredients.
SWEETENERSDrive sugar substitutionSugar has c.80% share of the global sweetener market1
TEXTURANTSDeliver high-performing and ‘clean label’ texturants1 in 4 new products launched globally in 2015 had a label-friendly claim2
HEALTH AND WELLNESSDeliver wellness through fibre enrichmentGlobal consumer fibre intake is below recommended levels3
65,232
48,99358,733
2012 2013 2014 2015
37,382
20% CAGR
2
1
1 Sugar 80% 2 Non-sugar 20%
1316
12
UK
40353025201510
50
US China Brazil
21
Recommended range
Fibr
e in
take
s (g
/day
)
1 LMC, 2015.2 Innova Market Insights (calendar years); product launches claiming no additives/preservatives, natural, organic, and/or without genetically modified
organisms (non-GMO).3 For data sources see page 164.
FOCUSED PLATFORM STRATEGIES
Strategic Report
22 Tate & Lyle PLC Annual Report 2016
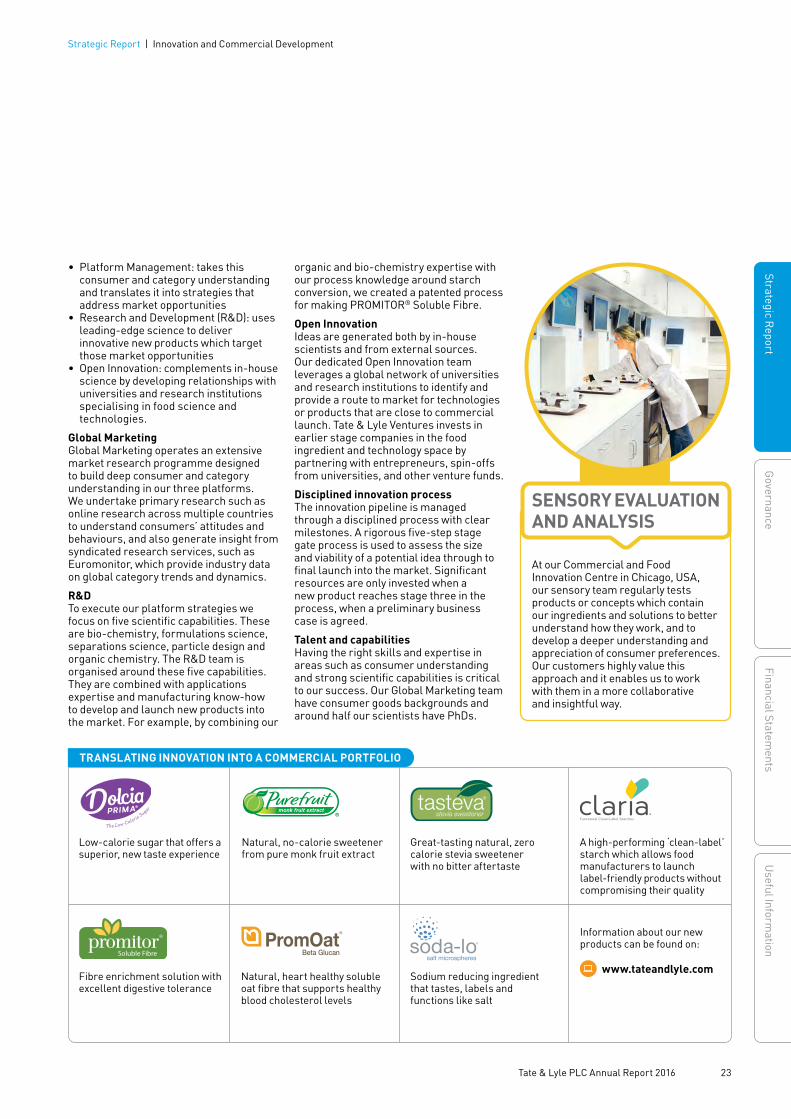
organic and bio-chemistry expertise with our process knowledge around starch conversion, we created a patented process for making PROMITOR® Soluble Fibre.
Open InnovationIdeas are generated both by in-house scientists and from external sources. Our dedicated Open Innovation team leverages a global network of universities and research institutions to identify and provide a route to market for technologies or products that are close to commercial launch. Tate & Lyle Ventures invests in earlier stage companies in the food ingredient and technology space by partnering with entrepreneurs, spin-offs from universities, and other venture funds.
Disciplined innovation processThe innovation pipeline is managed through a disciplined process with clear milestones. A rigorous five-step stage gate process is used to assess the size and viability of a potential idea through to final launch into the market. Significant resources are only invested when a new product reaches stage three in the process, when a preliminary business case is agreed.
Talent and capabilitiesHaving the right skills and expertise in areas such as consumer understanding and strong scientific capabilities is critical to our success. Our Global Marketing team have consumer goods backgrounds and around half our scientists have PhDs.
• Platform Management: takes this consumer and category understanding and translates it into strategies that address market opportunities
• Research and Development (R&D): uses leading-edge science to deliver innovative new products which target those market opportunities
• Open Innovation: complements in-house science by developing relationships with universities and research institutions specialising in food science and technologies.
Global MarketingGlobal Marketing operates an extensive market research programme designed to build deep consumer and category understanding in our three platforms. We undertake primary research such as online research across multiple countries to understand consumers’ attitudes and behaviours, and also generate insight from syndicated research services, such as Euromonitor, which provide industry data on global category trends and dynamics.
R&DTo execute our platform strategies we focus on five scientific capabilities. These are bio-chemistry, formulations science, separations science, particle design and organic chemistry. The R&D team is organised around these five capabilities. They are combined with applications expertise and manufacturing know-how to develop and launch new products into the market. For example, by combining our
SENSORY EVALUATION AND ANALYSIS
At our Commercial and Food Innovation Centre in Chicago, USA, our sensory team regularly tests products or concepts which contain our ingredients and solutions to better understand how they work, and to develop a deeper understanding and appreciation of consumer preferences. Our customers highly value this approach and it enables us to work with them in a more collaborative and insightful way.
®
Soluble Fibre
®
Low-calorie sugar that offers a superior, new taste experience
Natural, no-calorie sweetener from pure monk fruit extract
Great-tasting natural, zero calorie stevia sweetener with no bitter aftertaste
Fibre enrichment solution with excellent digestive tolerance
Natural, heart healthy soluble oat fibre that supports healthy blood cholesterol levels
Sodium reducing ingredient that tastes, labels and functions like salt
A high-performing ‘clean-label’ starch which allows food manufacturers to launch label-friendly products without compromising their quality
Information about our new products can be found on:
www.tateandlyle.com
TRANSLATING INNOVATION INTO A COMMERCIAL PORTFOLIO
23 Tate & Lyle PLC Annual Report 2016
Strategic ReportG
overnanceFinancial Statem
entsU
seful Information
Strategic Report | Innovation and Commercial Development

Global OperationsDelivering operational and supply chain excellence
Operational and supply chain excellence ensures the delivery of high quality products to our customers across the world. Global Operations is responsible for making this happen and includes supply and demand planning, raw material sourcing, manufacturing, customer service and logistics, safety, sustainability and continuous improvement.
The Global Operations team is committed to the efficient and cost effective operation of our production assets, and ensuring that our ingredients reach customers with the timeliness and quality that our customers expect. Over time, through the application of process technologies and continuous improvement, Global Operations seeks to identify cost and production efficiencies to remain cost competitive in the markets we operate in.
SafetyTate & Lyle has no higher priority than the safety of its employees, contractors and everyone who comes to its sites. Global Operations is responsible for the global safety programme, details of which can be found on pages 35 to 37.
Global manufacturing operationsGlobal Operations manage our principal manufacturing assets. In the US these include four major corn wet mills of which three are located in the Midwest and one in Tennessee. In Europe, we operate two corn wet mills, one in the Netherlands and one in Slovakia. Each of these corn wet mills is an integrated asset making both speciality food ingredients and bulk ingredients.
Other key sites managed by Global Operations include our SPLENDA® Sucralose facility in Alabama, USA, and our citric acid plants in Ohio, USA, and Brazil. Smaller manufacturing sites
managed by Global Operations include our oat-based fibres facility in Sweden and the polydextrose fibre facility plant in China.
Transforming the global supply chainThe creation of Global Operations in November 2014 represented an important step towards simplifying our global structure and allowing the different parts of the business to focus on what they do best – our commercial divisions on serving customers, and Global Operations on delivering operational and supply chain excellence.
During the year, Global Operations led three of the Group’s main change projects.
Global supply chain managementWe have been implementing significant enhancements to our global supply and demand planning processes. These improvements have been supported by the availability of higher quality data from the deployment of our new global IS/IT system.
Global Operations has implemented a common process for gathering a robust demand signal from the global business. Demand planning resources have been added in each region which Speciality Food Ingredients operate with a common process. The regional output, in a common format, is assessed against our supply capability, allowing us to make faster, better-quality decisions.
These changes are driving a significant improvement in the effectiveness of our demand and supply planning process. For example, through these improvements and the use of storage facilities in emerging markets, we can hold inventory closer to customers, better manage transportation lead times, and therefore better serve our customers.
Speciality Food Ingredients capacity expansion programmeDuring the second half of the year, Global Operations brought on line the incremental capacity expansion projects originally announced in May 2014 to increase the Group’s speciality food ingredients production capacity. These expansions were at our corn wet mills in the US and Europe, and at our oat-based facility in Sweden.
Consolidate SPLENDA® Sucralose productionDuring the year, Global Operations led the process of transferring production from the SPLENDA® Sucralose facility in Singapore to the facility in Alabama, US. The Singapore facility closed on 31 March 2016 as planned.
Customer service, raw material sourcing and sustainability Global Operations supports the efficient operation of manufacturing, supply chain and customer service for both divisions. The group operates regional customer service functions with dedicated teams managing customer communications from order receipt to delivery.
Corn is our largest raw material input. Global Operations manages corn procurement and the elevator network of storage facilities in the US to manage the cost effectiveness and security of our corn supply.
While operating the production facilities as efficiently as we can, we are also focused on managing our impact on the environment and the communities in which we operate.
GLOBAL OPERATIONS
Safety Sustainability Continuous Improvement
RAW MATERIAL SOURCING MANUFACTURING
SALES AND OPERATIONS
PLANNING
CUSTOMER SERVICE AND
LOGISTICS
Strategic Report
24 Tate & Lyle PLC Annual Report 2016
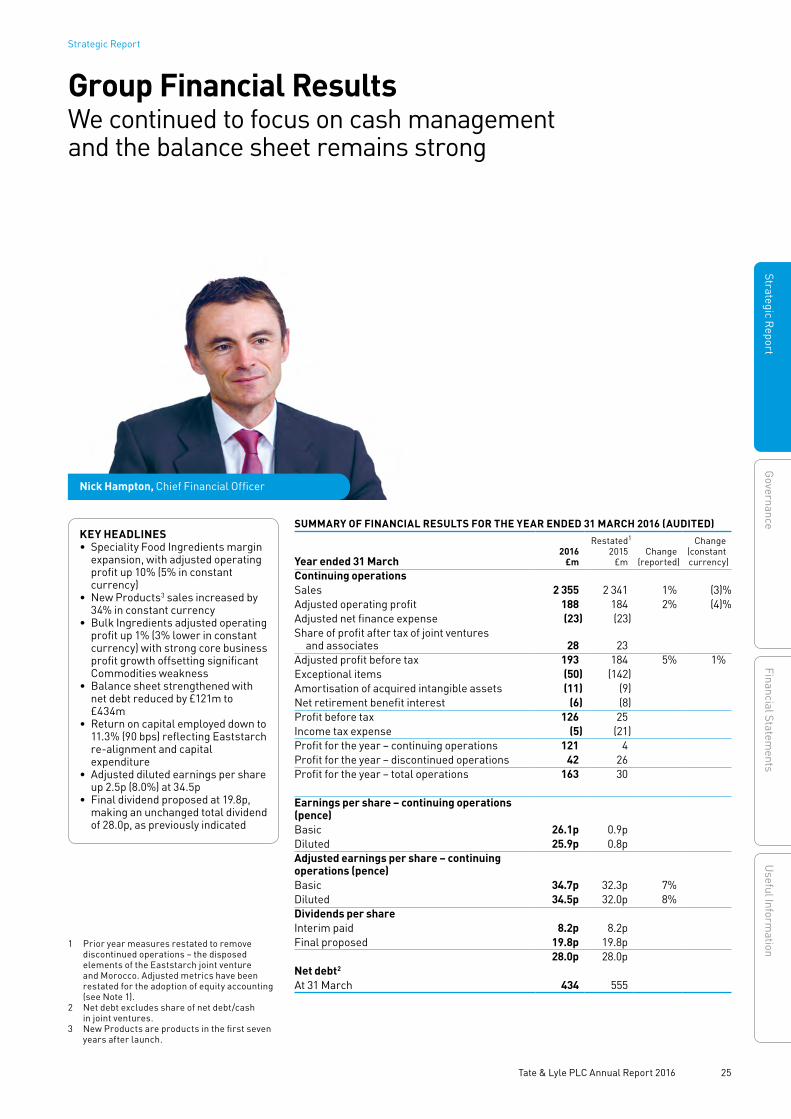
Group Financial Results We continued to focus on cash management and the balance sheet remains strong
Nick Hampton, Chief Financial Officer
KEY HEADLINES• Speciality Food Ingredients margin
expansion, with adjusted operating profit up 10% (5% in constant currency)
• New Products3 sales increased by 34% in constant currency
• Bulk Ingredients adjusted operating profit up 1% (3% lower in constant currency) with strong core business profit growth offsetting significant Commodities weakness
• Balance sheet strengthened with net debt reduced by £121m to £434m
• Return on capital employed down to 11.3% (90 bps) reflecting Eaststarch re-alignment and capital expenditure
• Adjusted diluted earnings per share up 2.5p (8.0%) at 34.5p
• Final dividend proposed at 19.8p, making an unchanged total dividend of 28.0p, as previously indicated
SUMMARY OF FINANCIAL RESULTS FOR THE YEAR ENDED 31 MARCH 2016 (AUDITED)
Year ended 31 March 2016
£m
Restated1
2015£m
Change(reported)
Change(constantcurrency)
Continuing operationsSales 2 355 2 341 1% (3)%Adjusted operating profit 188 184 2% (4)%Adjusted net finance expense (23) (23)Share of profit after tax of joint ventures
and associates 28 23 Adjusted profit before tax 193 184 5% 1%Exceptional items (50) (142)Amortisation of acquired intangible assets (11) (9)Net retirement benefit interest (6) (8)Profit before tax 126 25 Income tax expense (5) (21)Profit for the year – continuing operations 121 4 Profit for the year – discontinued operations 42 26 Profit for the year – total operations 163 30
Earnings per share – continuing operations (pence)Basic 26.1p 0.9pDiluted 25.9p 0.8pAdjusted earnings per share – continuing operations (pence)Basic 34.7p 32.3p 7%Diluted 34.5p 32.0p 8%Dividends per shareInterim paid 8.2p 8.2pFinal proposed 19.8p 19.8p
28.0p 28.0pNet debt2
At 31 March 434 555
1 Prior year measures restated to remove discontinued operations – the disposed elements of the Eaststarch joint venture and Morocco. Adjusted metrics have been restated for the adoption of equity accounting (see Note 1).
2 Net debt excludes share of net debt/cash in joint ventures.
3 New Products are products in the first seven years after launch.
25 Tate & Lyle PLC Annual Report 2016
Strategic ReportG
overnanceFinancial Statem
entsU
seful Information
Strategic Report
Group Financial Results continued
increased by £11 million to £46 million primarily reflecting the re-instatement of Group-wide employee incentive awards.
Litigation Two legal actions involving the Group were concluded in the year.
Sale of EU Sugars: As disclosed in September 2015, Judgement was handed down in the case brought by American Sugar Refining, Inc. (‘ASR’) in which it made a number of claims totalling around £40 million in relation to its acquisition of the Group’s EU Sugars business in September 2010. The Court found in favour of ASR on two elements of its claims, whilst rejecting all other aspects. The Court awarded damages of £18 million to ASR. In October, the Group settled the damages together with interest and costs totalling £5 million. At 31 March 2015, the Group held a provision totalling £5 million in respect of this claim. The excess over this provision, amounting to £18 million, has been reported as an exceptional charge within discontinued operations. The matter is now concluded and there are no contingent liabilities remaining in respect of these claims.
American Sugar Association (‘ASA’) claim: In 2011, ASA and a number of sugar companies brought a suit against a number of HFCS manufacturers, including Tate & Lyle, claiming false advertising around the sale of HFCS in the period 2008 to 2012. The matter came to trial in November 2015, but the parties jointly reached a settlement of the lawsuit. Included in exceptional items within continuing operations is a cash charge of £9 million. The matter is now concluded and there are no contingent liabilities remaining in respect of these claims.
Further, the Group received information in respect of the Passaic River litigation which allowed a reliable estimate of the Group’s expected loss in respect of the lower part of the river to be made and accordingly a £6 million provision has been recognised in respect of this issue at 31 March 2016 in continuing operations. As set out in Note 32, the Group is one of many defendants in this environmental case which dates back to the 1970s.
Exceptional items from continuing operationsNet exceptional costs in the year totalled £50 million (2015 – £142 million).
The Group incurred £48 million (2015 – £118 million) of net exceptional costs
Sales from continuing operations of £2,355 million were 1% higher than the prior year (3% lower in constant currency). Sales in Speciality Food Ingredients increased by 4% to £897 million (2% in constant currency), with volumes increasing by 1%. Sales in Bulk Ingredients decreased by 1% to £1,458 million (6% in constant currency), with volumes 3% higher.
Adjusted operating profit from continuing operations increased by 2% to £188 million (decreased by 4% in constant currency) with strong performance in the core business, more than offsetting weakness in Commodities. In Speciality Food Ingredients, adjusted operating profit was 10% higher than the prior year at £150 million (up 5% in constant currency). Bulk Ingredients adjusted operating profit increased by 1% to £84 million (decreased 3% in constant currency) despite a £9 million loss in Commodities (2015 – profit of £20 million), primarily as a result of weakness in US ethanol.
Adjusted profit before tax from continuing operations was 5% higher than last year, increasing to £193 million (1% higher in constant currency). Adjusted diluted earnings per share from continuing operations increased by 2.5p to 34.5p.
On a statutory basis, profit before tax from continuing operations increased by £101 million to £126 million. Statutory profit before tax is after exceptional items, amortisation of acquired intangibles and net retirement benefit interest. The largest driver of the year-on-year difference was a £50 million net exceptional charge, £92 million lower than the £142 million in the prior year. The tax charge for the year decreased by £16 million to £5 million, mainly as a result of the impact of the taxation of exceptional items, which arose mainly in the US. Profit for the year from total operations increased to £163 million (2015 – £30 million) with the current year benefiting from a £68 million exceptional profit in discontinued operations related to the disposed elements of the Eaststarch joint venture.
Overall, in the 2016 financial year we experienced some difficult market conditions, but we delivered improved quality of earnings and executed an extensive programme of change initiatives to strengthen the business.
Central costs Central costs, which include head office costs, treasury and reinsurance activities,
in continuing operations related to its re-structuring of the SPLENDA® Sucralose and European businesses. Of these, net costs of £33 million related to the Singapore facility (2015 – £113 million) which ceased production on 31 March 2016, with related site clearance activities to follow in the 2017 financial year. The Group also incurred exceptional costs related to the restructuring of the Group’s European operations of £15 million. This restructuring will complete in the 2017 financial year.
Taking the SPLENDA® Sucralose and European restructuring together, total exceptional costs to date are £166 million, of which £55 million are cash exceptional costs and £111 million are non-cash (principally the impairment of the Singapore facility in the prior year). Of total cash exceptional costs of £50 million in the 2016 financial year, £29 million were settled in the year, with the remaining £21 million expected to be settled in the 2017 financial year.
Whilst we expect to recognise further modest exceptional costs in relation to the completion of the Group’s restructuring in the 2017 year, we now expect the total cost to be below the level of £185 million disclosed in April 2015.
Included in exceptional items from continuing operations are costs related to litigation and legal claims in the US totalling £15 million. The Group settled litigation related to claims brought by the American Sugar Association for £9 million and a provision of £6 million was made for the Passaic River litigation.
Exceptional items in the year also include: a net exceptional profit of £7 million relating to the Tate & Lyle Venture fund, principally reflecting the disposal of investments (for which cash consideration of £18 million was received in the year); an exceptional gain of £5 million arising on acquiring full ownership of the Slovakian facility (see Note 34); a net charge of £2 million related to the renegotiation of our commercial agreements for our table top SPLENDA® Sucralose business following the sale of the SPLENDA® Brand by McNeil Nutritionals, LLC. (the cash impact of this in the period was an inflow of £5 million); and a credit of £3 million related to the reversal of certain previously impaired assets in the US.
Strategic Report
26 Tate & Lyle PLC Annual Report 2016

Share of profit after tax of joint ventures and associatesThe Group’s share of profit after tax of our joint ventures and associates of £28 million was £5 million higher than in the prior year, reflecting strong performance at Almex in Mexico, where volumes and unit margins were higher for bulk sweeteners.
Net finance expenseAfter excluding net retirement benefit interest, adjusted net finance expense from continuing operations remained flat at £23 million. In November 2014 the Group repaid a maturing US$500 million bond. In October 2015, the Group refinanced this with a US$400 million US private debt placement with fixed rate notes having a blended coupon of around 4%.
TaxationThe Group’s tax rate is sensitive to the geographic mix of profits and reflects a combination of higher rates in certain jurisdictions such as the US, nil effective rates in the UK due to available tax losses and rates that lie somewhere in between. In addition, the Group benefits from tax efficient internal financing structures, notably relating to its US business. The adjusted effective tax rate for the year reduced to 16.5% (2015 – 18.4%), with benefit in the current year from the positive settlement of some outstanding tax issues more than offsetting the overall trend in the mix of profits moving towards higher tax jurisdictions, notably the US. As a result of the continued shift in geographic mix of our profits, we anticipate that the
adjusted effective tax rate in the 2017 financial year will be similar to the 2015 reported rate.
Our UK earnings continue to be relatively small following the sale of our legacy sugars and molasses businesses in 2010. Less than 1% of our total Group sales (2016 – £19 million) are derived from UK operations which are more than offset by our corporate costs, including the interest we pay on our borrowings. As a result, we pay no corporation tax in the UK.
We understand our corporate responsibility to pay the appropriate amount of tax. While meeting this obligation, the Group also has a responsibility to its shareholders to plan, manage and control tax costs. Tate & Lyle operates in many locations worldwide and, as a result, is subject to differing tax laws and obligations in each territory. We seek to manage our worldwide tax obligations in compliance with all relevant tax laws, disclosure requirements and regulations. Each subsidiary company’s profits are subject to various tax adjustments in accordance with local tax law to arrive at its local tax liability. We seek to ensure that our approach to tax and the tax payments we make in all territories in which we have operations is fully compliant with local requirements, and takes into account available tax incentives and allowances, as well as being consistent with the Group’s wider business strategy and tolerance for risk.
The Group seeks to develop good, open working relationships with tax authorities and to engage with them in a co-operative and proactive manner, recognising that tax legislation can be complex and may be subject to differing interpretations. In instances where this might arise, the Group seeks to engage with the relevant tax authorities in open discussion of any such differences as early as possible to remove uncertainty and obtain resolution.
The key factors that are expected to influence the sustainability of the Group’s effective tax rate in the future are: our ability to continue to operate efficient internal financing arrangements; the ability to, and timing of, recognising the benefit from brought forward losses in the UK; material changes in the geographic mix of profits; changes in tax rates; and the resolution of tax judgments arising from current or future tax challenges. We continue to review the Group’s exposure to these factors, in conjunction with our external tax advisors.
The three key uncertainties impacting taxation arise from potential changes to legislation. Firstly, the OECD’s Base Erosion and Profit Shifting (BEPS) project is one of the most significant multilateral initiatives in recent years for modifying international tax rules. As these recommendations are introduced into local tax legislation over the coming years, this may impact the Group effective tax rate. Secondly, the UK government announced
Continuing operationsYear to
31 March2016
£m
Restated1
Year to 31 March
2015 £m1
Reconciliation of adjusted to statutory profit before tax on continuing operations
Adjusted profit before tax 193 184 Adjusted for: SPLENDA® Sucralose and European business re-alignment costs (net) (48) (118) Re-measurement gain: Slovakian acquisition 5 – Asset impairment reversal 3 – SPLENDA® Sucralose – revised table top commercial arrangement (net) (2) – Tate & Lyle Ventures – investment disposal (net) 7 – US litigation costs (15) – Business transformation costs – (12) Termination of distribution rights agreement – (12)Net exceptional charge (50) (142)Amortisation of acquired intangible assets (11) (9)Net retirement benefit interest (6) (8)Statutory profit before tax 126 25
1 Prior year restated to reflect discontinued operations. Adjusted metrics have been restated for the adoption of equity accounting (see Note 1).
27 Tate & Lyle PLC Annual Report 2016
Strategic ReportG
overnanceFinancial Statem
entsU
seful Information
Strategic Report | Group Financial Results

Group Financial Results continued
Discontinued operations Year ended 31 March 2016 Year ended 31 March 2015
Eaststarch/Morocco
£m
Sugars/ EU Starch
£m
Total discontinued
£m
Eaststarch/ Morocco
£m
Total discontinued
£mSales 13 – 13 15 15 Operating profit/(loss) including exceptional items 65 (20) 45 – – Share of profit after tax of joint ventures and associates 2 – 2 26 26 Profit/(loss) before tax 67 (20) 47 26 26 Income tax charge (5) – (5) – – Profit/(loss) for the year 62 (20) 42 26 26 Diluted earnings per share 8.9p 5.7p
in March 2016 draft changes to UK tax legislation. Whilst this legislation has yet to be finalised, these changes could impact our ability to utilise brought forward losses in the UK in the future. Lastly, the new US Related Party Debt Regulations issued in draft in early April 2016 may, if finalised, impact the Group’s financing of its US operations and the Group’s effective tax rate.
The Group’s tax strategy and risk appetite is reviewed and approved by the Board on an annual basis. Primary responsibility for the implementation of this strategy and management of tax risk is held by the Chief Financial Officer and the Vice President, Group Tax, with oversight provided by both the Board and the Audit Committee.
Discontinued operations Profit for the year from discontinued operations totalled £42 million.
On 31 October 2015, the Group completed the re-alignment of the Eaststarch joint venture with ADM and received €240 million (£173 million) in cash proceeds at completion, dividends from Eaststarch of €94 million (£68 million) as well as £13 million (net) under the purchase price adjustment process.
Profit for the year from Eaststarch and Morocco totalled £62 million. Included in this is an exceptional profit on disposal of £68 million (see Note 34). The profit on disposal includes an amount of £17 million representing the share of profit after tax attributable to the Group whilst the investments were classified as held for sale. The profit on disposal remains subject to change as a result of the finalisation of outstanding adjustments for closing working capital. The Group recognised £2 million in respect of its share of profit after tax of the Eaststarch joint venture relating to the period before the joint venture was held for sale. Also included in the profit for the year was a
net charge of £8 million related to the disposal of its bulk ingredients facility in Morocco, comprising an operating loss of £3 million (including an exceptional impairment charge of £4 million) and an exceptional tax charge of £5 million in respect of historical Moroccan tax matters.
Further, the Group recognised a charge of £20 million in relation to settlement of certain legacy issues, comprising an exceptional legal settlement of £18 million relating to the sale of the Group’s former EU Sugars business in September 2010 and a charge of £2 million arising from the transfer of all remaining obligations under a legacy pension scheme related to the Group’s discontinued European Wheat Starch business.
Earnings per share Adjusted diluted earnings per share from continuing operations at 34.5p were 8% higher. Adjusted basic earnings per share from continuing operations also increased by 7% to 34.7p. Total diluted earnings per share increased to 34.8p (2015 – 6.5p).
Dividend The Board intends to recommend an unchanged final dividend for the year ended 31 March 2016 of 19.8p to make an unchanged total for the year of 28.0p.
Subject to shareholder approval at the Group’s AGM on 21 July 2016, the proposed final dividend will be payable on 29 July 2016 to all shareholders on the Register of Members on 1 July 2016. In addition to the cash dividend option, shareholders will continue to be offered a Dividend Reinvestment Plan (DRIP) alternative.
Assets Gross assets of £2,554 million at 31 March 2016 were £131 million higher than the prior year on a statutory basis, reflecting capital expenditure above depreciation and the positive impact of the strengthening US dollar. Net assets increased by £93 million to £1,029 million.
Retirement benefits We maintain pension plans for our employees in a number of countries. Some of these arrangements are defined pension schemes and, although we have closed the main UK scheme and the US salaried and hourly paid schemes to future accrual at most locations, certain obligations remain. In the US, we also provide medical benefits as part of the retirement package.
The net deficit on our retirement benefit plans decreased by £19 million to £208 million. The deficit improvement was driven by the reduction in the defined benefit obligations, in both the UK and the US plans, reflecting an increase in the UK discount rate, favourable claims experience and favourable US mortality assumptions. The funding contributions made by the Company, which totalled £42 million (2015 – £52 million), further reduced the net deficit. Losses on the plans’ asset portfolios, valued at 31 March, partially offset this improvement.
Net debtNet debt at 31 March 2016 decreased by £121 million to £434 million. Adjusted free cash flow generated from operations (which is for continuing operations and before cash flows from exceptional items) was £53 million (2015 – £54 million). The net cash outflow in respect of exceptional items was £33 million. The reduction in net debt was driven by these factors, offset by cash proceeds in respect of the Eaststarch re-alignment of £254 million (comprising the receipt of €240 million (£173 million) in cash proceeds, dividends from Eaststarch of €94 million (£68 million) and £13 million in respect of completion adjustments) which well exceeded the dividend payments of £130 million. An adverse exchange rate impact increased net debt by £15 million principally as a result of the stronger US dollar.
Strategic Report
28 Tate & Lyle PLC Annual Report 2016
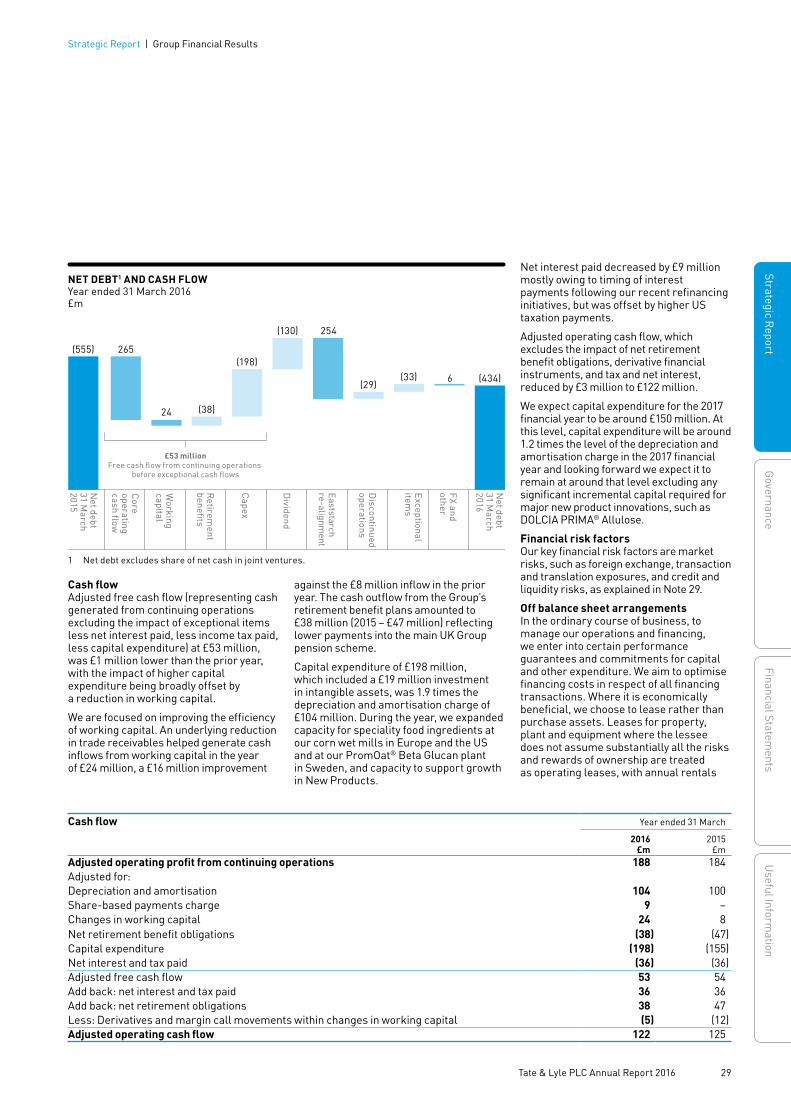
Cash flowAdjusted free cash flow (representing cash generated from continuing operations excluding the impact of exceptional items less net interest paid, less income tax paid, less capital expenditure) at £53 million, was £1 million lower than the prior year, with the impact of higher capital expenditure being broadly offset by a reduction in working capital.
We are focused on improving the efficiency of working capital. An underlying reduction in trade receivables helped generate cash inflows from working capital in the year of £24 million, a £16 million improvement
against the £8 million inflow in the prior year. The cash outflow from the Group’s retirement benefit plans amounted to £38 million (2015 – £47 million) reflecting lower payments into the main UK Group pension scheme.
Capital expenditure of £198 million, which included a £19 million investment in intangible assets, was 1.9 times the depreciation and amortisation charge of £104 million. During the year, we expanded capacity for speciality food ingredients at our corn wet mills in Europe and the US and at our PromOat® Beta Glucan plant in Sweden, and capacity to support growth in New Products.
Net interest paid decreased by £9 million mostly owing to timing of interest payments following our recent refinancing initiatives, but was offset by higher US taxation payments.
Adjusted operating cash flow, which excludes the impact of net retirement benefit obligations, derivative financial instruments, and tax and net interest, reduced by £3 million to £122 million.
We expect capital expenditure for the 2017 financial year to be around £150 million. At this level, capital expenditure will be around 1.2 times the level of the depreciation and amortisation charge in the 2017 financial year and looking forward we expect it to remain at around that level excluding any significant incremental capital required for major new product innovations, such as DOLCIA PRIMA® Allulose.
Financial risk factors Our key financial risk factors are market risks, such as foreign exchange, transaction and translation exposures, and credit and liquidity risks, as explained in Note 29.
Off balance sheet arrangements In the ordinary course of business, to manage our operations and financing, we enter into certain performance guarantees and commitments for capital and other expenditure. We aim to optimise financing costs in respect of all financing transactions. Where it is economically beneficial, we choose to lease rather than purchase assets. Leases for property, plant and equipment where the lessee does not assume substantially all the risks and rewards of ownership are treated as operating leases, with annual rentals
NET DEBT1 AND CASH FLOW Year ended 31 March 2016 £m
(555) 265
Net debt
31 March
2015
Core
operating cash flow
Working
capital
Capex
Retirem
entbenefits
Dividend
Eaststarchre-alignm
ent
Exceptional
items
Discontinued
operations
FX and other
Net debt
31 March
2016
24
£53 millionFree cash flow from continuing operations
before exceptional cash flows
(38)
(198)
254(130)
(29)(33) 6 (434)
1 Net debt excludes share of net cash in joint ventures.
Cash flow Year ended 31 March
2016£m
2015£m
Adjusted operating profit from continuing operations 188 184 Adjusted for:Depreciation and amortisation 104 100 Share-based payments charge 9 – Changes in working capital 24 8 Net retirement benefit obligations (38) (47)Capital expenditure (198) (155)Net interest and tax paid (36) (36)Adjusted free cash flow 53 54 Add back: net interest and tax paid 36 36 Add back: net retirement obligations 38 47 Less: Derivatives and margin call movements within changes in working capital (5) (12)Adjusted operating cash flow 122 125
29 Tate & Lyle PLC Annual Report 2016
Strategic ReportG
overnanceFinancial Statem
entsU
seful Information
Strategic Report | Group Financial Results

charged to the income statement over the term of the lease. Commitments under operating leases to pay rentals in future years totalled £303 million (2015 – £194 million) and related primarily to railcar leases in the US and a new commitment for a gas pipeline to supply our Loudon facility. Rental charges for the year ended 31 March 2016 in respect of continuing operations were £24 million (2015 – £18 million).
Use and fair value of financial instruments In the normal course of business we use both derivative and non-derivative financial instruments. The fair value of Group net borrowings at the year end was £453 million against a book value of £434 million (2015 – fair value £579 million book value £555 million). Derivative financial instruments used to manage the interest rate and currency of borrowings had a fair value of £5 million asset (2015 – £18 million asset). The main types of instrument used are interest rate swaps, interest rate options (caps or floors), and cross-currency interest rate swaps. The fair value of other derivative financial instruments hedging future currency and commodity transactions was £4 million liabilities (2015 – £4 million liabilities). When managing currency exposure, we use spot and forward purchases and sales, and options. The fair value of other derivative financial instruments accounted for as held for trading was a £22 million asset (2015 – £38 million asset).
Fair value estimation The fair value of derivative financial instruments is based on the market price of comparable instruments at the balance sheet date if they are publicly traded. The fair value of the forward currency contracts was determined based on market forward exchange rates at the balance sheet date. The fair values of short-term deposits, receivables, payables, loans and overdrafts with a maturity of less than one year are assumed to approximate their book values. The fair values of bonds, bank and other loans, including finance lease liabilities due
in more than one year, are estimated by discounting the future contractual cash flows at the current market interest rate available to the Group for similar financial instruments, adjusted for the fair valuation effects of currency and interest rate risk exposures, where those instruments form part of related hedging relationship agreements, financial and commodity forward contracts and options, and commodity futures. The values of certain items of merchandisable agricultural commodities that are included in inventories are based on market prices.
Going concernThe Directors are satisfied that the Group has adequate resources to continue to operate for a period not less than 12 months from the date of approval of the financial statements and that there are no material uncertainties around their assessment. Accordingly, the Directors continue to adopt the going concern basis of accounting.
Basis of preparationThe Group’s principal accounting policies are unchanged compared with the year ended 31 March 2015. A number of minor changes to accounting policies have been adopted during the year, although they have had no material effect on the Group’s financial statements. As announced in October 2015, the Group has also changed the way it prepares and presents certain adjusted performance metrics.
Details of the basis of preparation, including the revised methodology used to calculate the Group’s adjusted performance metrics, can be found in Note 1.
Impact of changes in exchange ratesIn contrast to the prior year, the Group’s reported financial performance at average rates of exchange for the year was favourably affected by currency translation. The effect of exchange translation was to increase adjusted profit before tax by £8 million compared with the prior year principally as a result of a strengthening of the US dollar against
sterling, although, this impact was partially offset by movements in other currencies, principally the weakening of both the Mexican peso and Brazilian real currencies, which devalued by 13% and 36% respectively on average against sterling. The movement in closing exchange rates, particularly the strengthening US dollar, led to an increase in net debt as a result of the translation of dollar-denominated debt. The average and closing exchange rates used to translate reported results were as follows:
Average rates Closing rates2016 2015 2016 2015
US dollar:sterling 1.51 1.61 1.44 1.49Euro:sterling 1.37 1.28 1.26 1.38
For the year to 31 March 2016, the sensitivity of the Group’s results to changes in the US dollar, the currency with the largest impact on earnings, estimated as the annual movement caused by a one cent movement on the translation of continuing profits from operations, is as follows: Speciality Food Ingredients – an increase in adjusted operating profit of £0.8 million; Bulk Ingredients – an increase in adjusted operating profit of £0.6 million; and adjusted net finance costs – an increase by £0.1 million in costs. As a result, each one cent movement in the US dollar caused adjusted profit before tax to increase by £1.3 million.
Nick HamptonChief Financial Officer
Group Financial Results continued
Strategic Report
30 Tate & Lyle PLC Annual Report 2016
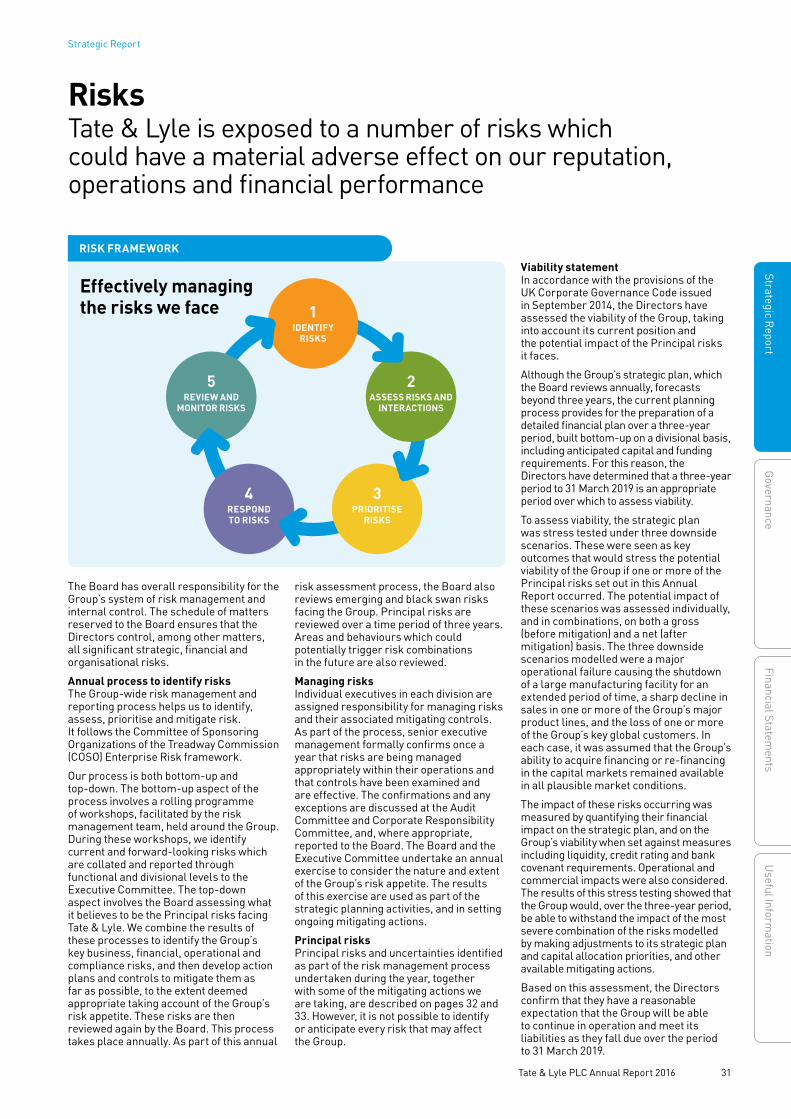
3PRIORITISE
RISKS
Sustainability
The Board has overall responsibility for the Group’s system of risk management and internal control. The schedule of matters reserved to the Board ensures that the Directors control, among other matters, all significant strategic, financial and organisational risks.
Annual process to identify risksThe Group-wide risk management and reporting process helps us to identify, assess, prioritise and mitigate risk. It follows the Committee of Sponsoring Organizations of the Treadway Commission (COSO) Enterprise Risk framework.
Our process is both bottom-up and top-down. The bottom-up aspect of the process involves a rolling programme of workshops, facilitated by the risk management team, held around the Group. During these workshops, we identify current and forward-looking risks which are collated and reported through functional and divisional levels to the Executive Committee. The top-down aspect involves the Board assessing what it believes to be the Principal risks facing Tate & Lyle. We combine the results of these processes to identify the Group’s key business, financial, operational and compliance risks, and then develop action plans and controls to mitigate them as far as possible, to the extent deemed appropriate taking account of the Group’s risk appetite. These risks are then reviewed again by the Board. This process takes place annually. As part of this annual
risk assessment process, the Board also reviews emerging and black swan risks facing the Group. Principal risks are reviewed over a time period of three years. Areas and behaviours which could potentially trigger risk combinations in the future are also reviewed.
Managing risksIndividual executives in each division are assigned responsibility for managing risks and their associated mitigating controls. As part of the process, senior executive management formally confirms once a year that risks are being managed appropriately within their operations and that controls have been examined and are effective. The confirmations and any exceptions are discussed at the Audit Committee and Corporate Responsibility Committee, and, where appropriate, reported to the Board. The Board and the Executive Committee undertake an annual exercise to consider the nature and extent of the Group’s risk appetite. The results of this exercise are used as part of the strategic planning activities, and in setting ongoing mitigating actions.
Principal risksPrincipal risks and uncertainties identified as part of the risk management process undertaken during the year, together with some of the mitigating actions we are taking, are described on pages 32 and 33. However, it is not possible to identify or anticipate every risk that may affect the Group.
Viability statementIn accordance with the provisions of the UK Corporate Governance Code issued in September 2014, the Directors have assessed the viability of the Group, taking into account its current position and the potential impact of the Principal risks it faces.
Although the Group’s strategic plan, which the Board reviews annually, forecasts beyond three years, the current planning process provides for the preparation of a detailed financial plan over a three-year period, built bottom-up on a divisional basis, including anticipated capital and funding requirements. For this reason, the Directors have determined that a three-year period to 31 March 2019 is an appropriate period over which to assess viability.
To assess viability, the strategic plan was stress tested under three downside scenarios. These were seen as key outcomes that would stress the potential viability of the Group if one or more of the Principal risks set out in this Annual Report occurred. The potential impact of these scenarios was assessed individually, and in combinations, on both a gross (before mitigation) and a net (after mitigation) basis. The three downside scenarios modelled were a major operational failure causing the shutdown of a large manufacturing facility for an extended period of time, a sharp decline in sales in one or more of the Group’s major product lines, and the loss of one or more of the Group’s key global customers. In each case, it was assumed that the Group’s ability to acquire financing or re-financing in the capital markets remained available in all plausible market conditions.
The impact of these risks occurring was measured by quantifying their financial impact on the strategic plan, and on the Group’s viability when set against measures including liquidity, credit rating and bank covenant requirements. Operational and commercial impacts were also considered. The results of this stress testing showed that the Group would, over the three-year period, be able to withstand the impact of the most severe combination of the risks modelled by making adjustments to its strategic plan and capital allocation priorities, and other available mitigating actions.
Based on this assessment, the Directors confirm that they have a reasonable expectation that the Group will be able to continue in operation and meet its liabilities as they fall due over the period to 31 March 2019.
RisksTate & Lyle is exposed to a number of risks which could have a material adverse effect on our reputation, operations and financial performance
RISK FRAMEWORK
1IDENTIFY
RISKS
2 ASSESS RISKS AND
INTERACTIONS
3PRIORITISE
RISKS
4RESPOND TO RISKS
5REVIEW AND
MONITOR RISKS
Effectively managing the risks we face
31 Tate & Lyle PLC Annual Report 2016
Strategic ReportG
overnanceFinancial Statem
entsU
seful Information
Strategic Report
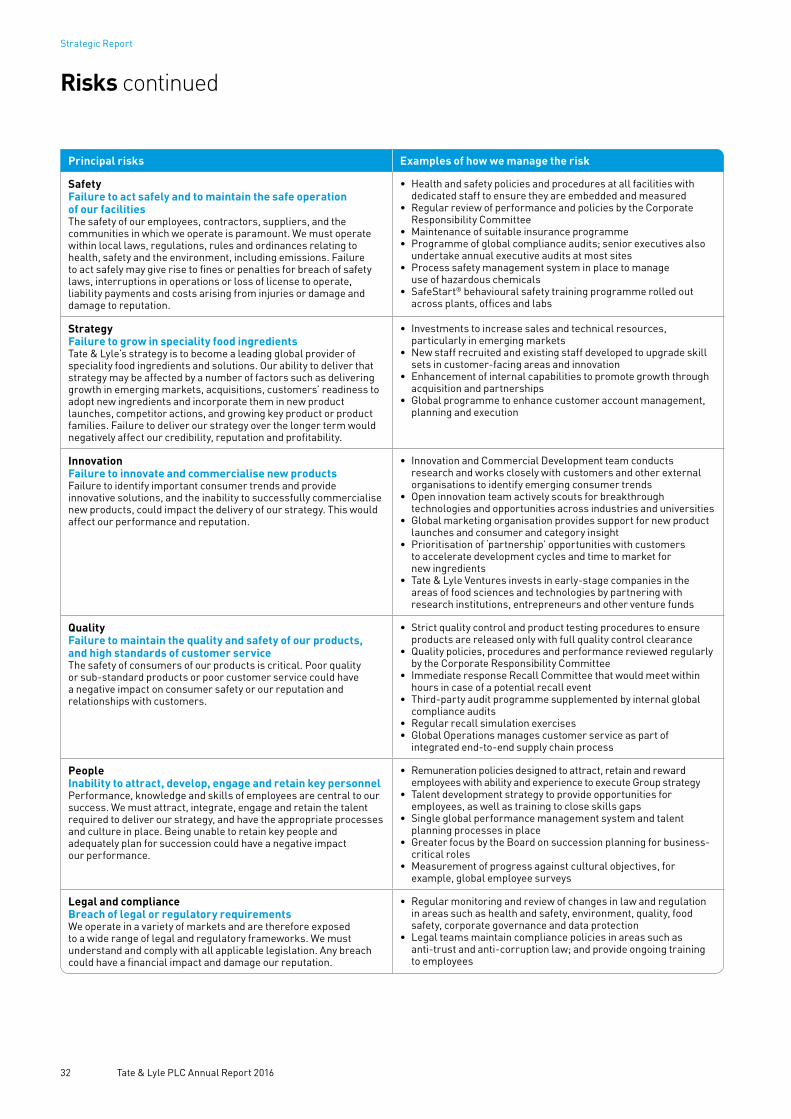
Principal risks Examples of how we manage the risk
SafetyFailure to act safely and to maintain the safe operation of our facilitiesThe safety of our employees, contractors, suppliers, and the communities in which we operate is paramount. We must operate within local laws, regulations, rules and ordinances relating to health, safety and the environment, including emissions. Failure to act safely may give rise to fines or penalties for breach of safety laws, interruptions in operations or loss of license to operate, liability payments and costs arising from injuries or damage and damage to reputation.
• Health and safety policies and procedures at all facilities with dedicated staff to ensure they are embedded and measured
• Regular review of performance and policies by the Corporate Responsibility Committee
• Maintenance of suitable insurance programme• Programme of global compliance audits; senior executives also
undertake annual executive audits at most sites• Process safety management system in place to manage
use of hazardous chemicals• SafeStart® behavioural safety training programme rolled out
across plants, offices and labs
StrategyFailure to grow in speciality food ingredientsTate & Lyle’s strategy is to become a leading global provider of speciality food ingredients and solutions. Our ability to deliver that strategy may be affected by a number of factors such as delivering growth in emerging markets, acquisitions, customers’ readiness to adopt new ingredients and incorporate them in new product launches, competitor actions, and growing key product or product families. Failure to deliver our strategy over the longer term would negatively affect our credibility, reputation and profitability.
• Investments to increase sales and technical resources, particularly in emerging markets
• New staff recruited and existing staff developed to upgrade skill sets in customer-facing areas and innovation
• Enhancement of internal capabilities to promote growth through acquisition and partnerships
• Global programme to enhance customer account management, planning and execution
InnovationFailure to innovate and commercialise new productsFailure to identify important consumer trends and provide innovative solutions, and the inability to successfully commercialise new products, could impact the delivery of our strategy. This would affect our performance and reputation.
• Innovation and Commercial Development team conducts research and works closely with customers and other external organisations to identify emerging consumer trends
• Open innovation team actively scouts for breakthrough technologies and opportunities across industries and universities
• Global marketing organisation provides support for new product launches and consumer and category insight
• Prioritisation of ‘partnership’ opportunities with customers to accelerate development cycles and time to market for new ingredients
• Tate & Lyle Ventures invests in early-stage companies in the areas of food sciences and technologies by partnering with research institutions, entrepreneurs and other venture funds
QualityFailure to maintain the quality and safety of our products, and high standards of customer serviceThe safety of consumers of our products is critical. Poor quality or sub-standard products or poor customer service could have a negative impact on consumer safety or our reputation and relationships with customers.
• Strict quality control and product testing procedures to ensure products are released only with full quality control clearance
• Quality policies, procedures and performance reviewed regularly by the Corporate Responsibility Committee
• Immediate response Recall Committee that would meet within hours in case of a potential recall event
• Third-party audit programme supplemented by internal global compliance audits
• Regular recall simulation exercises • Global Operations manages customer service as part of
integrated end-to-end supply chain process
PeopleInability to attract, develop, engage and retain key personnelPerformance, knowledge and skills of employees are central to our success. We must attract, integrate, engage and retain the talent required to deliver our strategy, and have the appropriate processes and culture in place. Being unable to retain key people and adequately plan for succession could have a negative impact our performance.
• Remuneration policies designed to attract, retain and reward employees with ability and experience to execute Group strategy
• Talent development strategy to provide opportunities for employees, as well as training to close skills gaps
• Single global performance management system and talent planning processes in place
• Greater focus by the Board on succession planning for business-critical roles
• Measurement of progress against cultural objectives, for example, global employee surveys
Legal and complianceBreach of legal or regulatory requirementsWe operate in a variety of markets and are therefore exposed to a wide range of legal and regulatory frameworks. We must understand and comply with all applicable legislation. Any breach could have a financial impact and damage our reputation.
• Regular monitoring and review of changes in law and regulation in areas such as health and safety, environment, quality, food safety, corporate governance and data protection
• Legal teams maintain compliance policies in areas such as anti-trust and anti-corruption law; and provide ongoing training to employees
Risks continued
Strategic Report
32 Tate & Lyle PLC Annual Report 2016
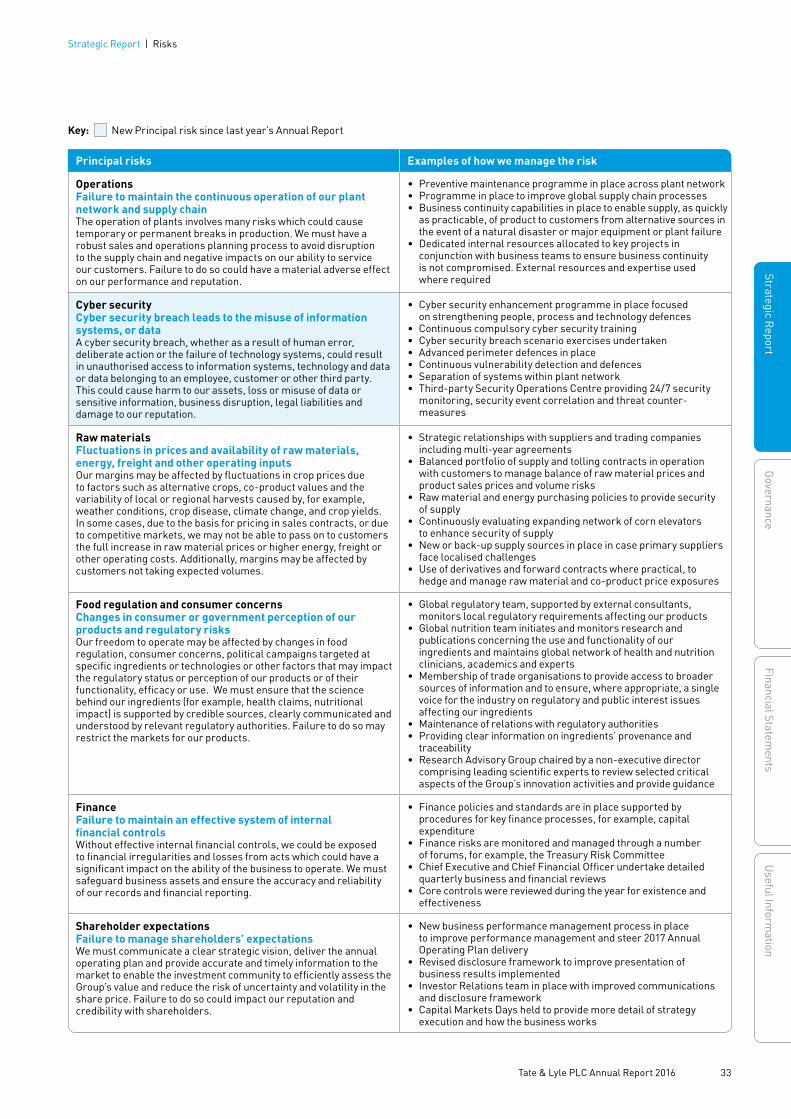
Principal risks Examples of how we manage the risk
OperationsFailure to maintain the continuous operation of our plant network and supply chainThe operation of plants involves many risks which could cause temporary or permanent breaks in production. We must have a robust sales and operations planning process to avoid disruption to the supply chain and negative impacts on our ability to service our customers. Failure to do so could have a material adverse effect on our performance and reputation.
• Preventive maintenance programme in place across plant network• Programme in place to improve global supply chain processes• Business continuity capabilities in place to enable supply, as quickly
as practicable, of product to customers from alternative sources in the event of a natural disaster or major equipment or plant failure
• Dedicated internal resources allocated to key projects in conjunction with business teams to ensure business continuity is not compromised. External resources and expertise used where required
Cyber securityCyber security breach leads to the misuse of information systems, or data A cyber security breach, whether as a result of human error, deliberate action or the failure of technology systems, could result in unauthorised access to information systems, technology and data or data belonging to an employee, customer or other third party. This could cause harm to our assets, loss or misuse of data or sensitive information, business disruption, legal liabilities and damage to our reputation.
• Cyber security enhancement programme in place focused on strengthening people, process and technology defences
• Continuous compulsory cyber security training• Cyber security breach scenario exercises undertaken• Advanced perimeter defences in place• Continuous vulnerability detection and defences• Separation of systems within plant network• Third-party Security Operations Centre providing 24/7 security
monitoring, security event correlation and threat counter-measures
Raw materialsFluctuations in prices and availability of raw materials, energy, freight and other operating inputsOur margins may be affected by fluctuations in crop prices due to factors such as alternative crops, co-product values and the variability of local or regional harvests caused by, for example, weather conditions, crop disease, climate change, and crop yields. In some cases, due to the basis for pricing in sales contracts, or due to competitive markets, we may not be able to pass on to customers the full increase in raw material prices or higher energy, freight or other operating costs. Additionally, margins may be affected by customers not taking expected volumes.
• Strategic relationships with suppliers and trading companies including multi-year agreements
• Balanced portfolio of supply and tolling contracts in operation with customers to manage balance of raw material prices and product sales prices and volume risks
• Raw material and energy purchasing policies to provide security of supply
• Continuously evaluating expanding network of corn elevators to enhance security of supply
• New or back-up supply sources in place in case primary suppliers face localised challenges
• Use of derivatives and forward contracts where practical, to hedge and manage raw material and co-product price exposures
Food regulation and consumer concernsChanges in consumer or government perception of our products and regulatory risksOur freedom to operate may be affected by changes in food regulation, consumer concerns, political campaigns targeted at specific ingredients or technologies or other factors that may impact the regulatory status or perception of our products or of their functionality, efficacy or use. We must ensure that the science behind our ingredients (for example, health claims, nutritional impact) is supported by credible sources, clearly communicated and understood by relevant regulatory authorities. Failure to do so may restrict the markets for our products.
• Global regulatory team, supported by external consultants, monitors local regulatory requirements affecting our products
• Global nutrition team initiates and monitors research and publications concerning the use and functionality of our ingredients and maintains global network of health and nutrition clinicians, academics and experts
• Membership of trade organisations to provide access to broader sources of information and to ensure, where appropriate, a single voice for the industry on regulatory and public interest issues affecting our ingredients
• Maintenance of relations with regulatory authorities• Providing clear information on ingredients’ provenance and
traceability• Research Advisory Group chaired by a non-executive director
comprising leading scientific experts to review selected critical aspects of the Group’s innovation activities and provide guidance
FinanceFailure to maintain an effective system of internal financial controlsWithout effective internal financial controls, we could be exposed to financial irregularities and losses from acts which could have a significant impact on the ability of the business to operate. We must safeguard business assets and ensure the accuracy and reliability of our records and financial reporting.
• Finance policies and standards are in place supported by procedures for key finance processes, for example, capital expenditure
• Finance risks are monitored and managed through a number of forums, for example, the Treasury Risk Committee
• Chief Executive and Chief Financial Officer undertake detailed quarterly business and financial reviews
• Core controls were reviewed during the year for existence and effectiveness
Shareholder expectationsFailure to manage shareholders’ expectationsWe must communicate a clear strategic vision, deliver the annual operating plan and provide accurate and timely information to the market to enable the investment community to efficiently assess the Group’s value and reduce the risk of uncertainty and volatility in the share price. Failure to do so could impact our reputation and credibility with shareholders.
• New business performance management process in place to improve performance management and steer 2017 Annual Operating Plan delivery
• Revised disclosure framework to improve presentation of business results implemented
• Investor Relations team in place with improved communications and disclosure framework
• Capital Markets Days held to provide more detail of strategy execution and how the business works
Key: New Principal risk since last year’s Annual Report
33 Tate & Lyle PLC Annual Report 2016
Strategic ReportG
overnanceFinancial Statem
entsU
seful Information
Strategic Report | Risks

Our ValuesOur Values define what we stand for and how we behave with our customers, suppliers, investors, the communities we operate in and with each other.We have a combined team of Values and Ethics ‘Ambassadors’ who promote our Values and the right way of doing business to colleagues across the Group.
GovernanceGovernance of Corporate Responsibility (CR) is overseen by the Board’s Corporate Responsibility Committee (see page 60).
The Chief Executive is the Board director with specific responsibility for CR.
CR matters are considered within the Group’s risk management and reporting processes (see page 31).
In line with the requirements of the Modern Slavery Act 2015, we have begun reporting on the steps we have taken that seek to ensure that slavery and human trafficking is not taking place in our business or our supply chains at:
www.tateandlyle.com/ modernslaveryactstatement2016
Management and performanceWorkplaceWe have implemented initiatives including Prevention through Design (PtD) and SafeStart® training to further improve our safety management, controls and performance (see page 35).
We won the 2015 Global Corporate Challenge (GCC) Outstanding Achievement Award for the level of participation and teamwork displayed by our employees (see page 37).
EnvironmentWe are constructing a £40 million combined heat and power (CHP) energy system for our Loudon, US facility that will:
• Reduce our global CO2e emissions by around 10%
• Improve operational efficiency• Support our Speciality Food Ingredients
growth strategy (see page 17).
MarketplaceWe are on track to surpass our sustainable agriculture target, with programmes being implemented for 25 agricultural raw materials (see page 40).
CommunityWe support communities locally and globally in the areas of well-being, education and environment (see page 41).
Engagement and reportingEngagementWe use stakeholder engagement and feedback to inform our approach to and reporting on CR. We have engaged principally with customers, investors and community involvement partners during the year.
Climate Disclosure LeadershipWe are a member of the 2015 FTSE 350 Climate Disclosure Leadership Index (CDLI), scoring 99 out of 100 and ranked in the top 10% of FTSE 350 companies responding to CDP’s climate change programme (www.cdp.net).
ReportingThe scope, principles and methodologies we use in reporting CR performance are provided in ‘CR Reporting Criteria Annual Report 2016’ at:
www.tateandlyle.com/CR2016
Our internal audit function has reviewed the CR information and data in this Annual Report to confirm its accuracy.
We gained independent externalassurance over selected environmental data on page 39 in this Annual Report from Bureau Veritas UK Ltd. Their assurance statement is at:
www.tateandlyle.com/CR2016
Corporate ResponsibilityWe approach corporate responsibility from a stakeholder perspective; in terms of our workplace, the environment, our marketplace and the communities of which we are a part
Core Values
Safety
IntegrityRespect
CoreValues
Performance Values
AchievementAc
coun
tabi
lity
Teamw
ork
Speed
Creativity
34 Tate & Lyle PLC Annual Report 2016
Strategic Report

WORKPLACE
Our employees are central to the Group and to delivering our strategy. In line with our Values, we believe that everyone should be safe at work and be treated fairly and with respect.
Our policies and control arrangements addressing ethical conduct and human rights include:
• Our Code of Ethics, and the internal and external communication and training around it
• The Group’s global human resources policies and our position and practices on equal opportunities and diversity
• The Group’s Speak Up (whistleblowing) arrangements
• Our controls for managing standards in the supply chain (see page 40).
Employee profileAt 31 March 2016, Tate & Lyle employed 4,3261 people (2015 – 4,0402 ). During the year we have added staff in the global Shared Service Centre in Poland and expanded the commercial team in Asia. We have also hired incremental staff in our plant operations in Sweden, US, Brazil and China. At the same time we have seen some staff reductions in Italy, Germany and France.
EMPLOYEES BY DIVISIONas at 31 March 2016
1 Speciality Food Ingredients 49%
2 Bulk Ingredients 40%3 Central functions 11%
11
2
3
EMPLOYEES BY GEOGRAPHYas at 31 March 2016
1 North America 46%2 Europe, Middle East
and Africa 31%3 Latin America 13%4 Asia Pacific 10%
1
2
34
SafetyWe have no higher priority than safety, for our employees and for everyone who comes to our sites. Our Executive Safety Steering Committee, chaired by our Chief Executive, meets throughout the year to review our safety performance and improvement programmes. Our senior executives undertake executive safety audits at most of our sites around the world each year.
Our ultimate goal is to have no accidents and no injuries.
We have continued to undertake a thorough review of our safety management programme during the year, using external and internal auditors to review safety management and controls at all our major sites. We found that good progress had been made in terms of corrective actions from previous audits and in overall safety management and control standards.
PerformanceThe safety performance indicators of recordable incident rate and lost-work case rate (defined on page 36) – for employees and contractors combined – saw decreases of 11% and 50% respectively during calendar year 2015.
The majority of incidents requiring treatment beyond first aid were the result of being struck by or struck against an object and therefore, during calendar year 2016, we are implementing a campaign to prevent these types of incidents.
SAFETY PERFORMANCEby calendar year
Recordableincident rate
Lost-workcase rate
2015
Changeversus
2014 2015
Changeversus
2014
Employees 0.46 -37% 0.12 -59%Contractors 1.47 30% 0.26 -33%Combined 0.76 -11% 0.16 -50%
In 2015, five of our US plants each won two US Corn Refiners Association (CRA) Safety Awards. Our annual global safety week saw many employees and their families, alongside contractors, taking part in activities across our sites worldwide. Our annual children’s safety calendar drawing contest, for employees’ families, encourages the next generation to be safe.
No fatalities occurred during calendar year 2015 (2014 – three).
External benchmarkingTo put our safety performance in context and because the majority of our employees are located in the US, we compare our results with US industry averages, as shown in the graphs on page 36.
We also compare ourselves against other companies to review and understand how they manage safety. We work to apply the learnings gained in further improving our own safety controls and practices.
Safety improvementWe work hard to continuously improve our safety programmes, controls and performance. Initiatives that we implemented during 2015 included:
Prevention through Design (PtD) In the design phase of capital projects, before submitting projects for approval, project managers and engineers use process hazard analyses and PtD to ‘design out’ hazards and risks. Later, we then use task risk assessments and safety reviews before the installation phase of new capital equipment. This PtD approach extends into ongoing hazard identification and avoidance during the operational phase of equipment. We look for ways to eliminate and engineer out hazards; seeking to only use administrative controls or personal protective equipment as the ‘last resort’. For example, in terms of ergonomics, by installing vacuum lifters we have avoided or reduced the need for manual handling of raw materials and finished product sacks, therefore reducing the risk of injury from lifting.
Our technical safety standards are subject to regular review and update to ensure that we are consistently taking the best approach across our global facilities.
1 Reported on an equity basis for continuing operations.
2 Restated for the adoption of reporting on an equity basis for continuing operations.
35 Tate & Lyle PLC Annual Report 2016
Strategic Report | Corporate Responsibility
Strategic ReportG
overnanceFinancial Statem
entsU
seful Information

1 We report safety performance by calendar year and for all employees at both Tate & Lyle owned operations and at joint ventures.
2 Tate & Lyle employees and contractors combined.3 Source: US Department of Labor, October 2015.
Safety performance1
1.47
2015
2014
2013
2012
Tate & Lyle employeesContractors
0.46
0.73
1.13
0.43
0.94
1.43
0.63
2015
2014
2013
2012
Tate & Lyle employeesContractors
0.12
0.26
0.29
0.39
0.09
0.22
0.19
0.43
Safe design and condition of tall structures and process storageIn 2015 we completed a programme of integrity checks by external structural engineers of tall buildings and process storage structures and equipment at our major manufacturing locations globally, to confirm that they were of a safe design and condition. We also:
• Audited our preventative maintenance programmes at those facilities. We seek to ensure that all equipment is routinely checked and maintained to be reliable and safe
• Had external experts conduct explosion risk assessments of combustible dust in process equipment and facilities.
Additional safety resourcesWe operate a work permit system at our manufacturing facilities globally, to ensure effective hazard assessment and safety control arrangements for a variety of non-routine activities performed by our employees and contractors. At sites where we have seen an increased workload – due to production expansion projects for example – we hired additional engineers to ensure that this process is always correctly conducted and managed.
In 2015 our manufacturing sites also audited their completed work permits for adequacy; and, in our safety audits by corporate staff and outside experts, we checked to see that this had been done and was effective.
SafeStart® behavioural safety training During 2015 we completed the training of staff at our global manufacturing facilities in the SafeStart® behavioural safety programme. SafeStart® training contributes to our strong safety culture and also encourages employees’ behavioural safety practices outside of work, including at home with their families. We are also providing SafeStart® training for employees at our offices.
‘Let’s Stay Safe’ bookletDuring 2015 we created and distributed globally a ‘Let’s Stay Safe’ booklet to increase awareness and focus on programmes that prevent serious injuries and fatalities, such as our work permit system.
0.12
1.6
1.3
1.3
1.0
0.7
0.7
0.5
Beverage and tobacco
Food manufacturing
Construction
Private industry
Chemical manufacturing
Wet corn milling
Energy manufacturing
Tate & Lyle0.46
Beverage and tobacco
Food manufacturing
Construction
Private industry
Chemical manufacturing
Wet corn milling
Energy manufacturing
Tate & Lyle
6.0
5.1
3.6
3.2
2.3
2.3
1.7
RECORDABLE INCIDENT RATE Number of injuries requiring treatment beyond first aid per 200,000 hours
US INDUSTRY SECTOR EMPLOYEE RECORDABLE INCIDENT RATE 20143 AND TATE & LYLE EMPLOYEES 2015
LOST-WORK CASE RATE Number of injuries that resulted in lost-work days per 200,000 hours
US INDUSTRY SECTOR EMPLOYEE LOST-WORK CASE RATE 20143 AND TATE & LYLE EMPLOYEES 2015
NUMBER OF INCIDENTS COMBINED2 (2015)
60 (2014: 67)
NUMBER OF CASES COMBINED2 (2015)
13 (2014: 25)
36 Tate & Lyle PLC Annual Report 2016
Strategic Report
Corporate Responsibility continued
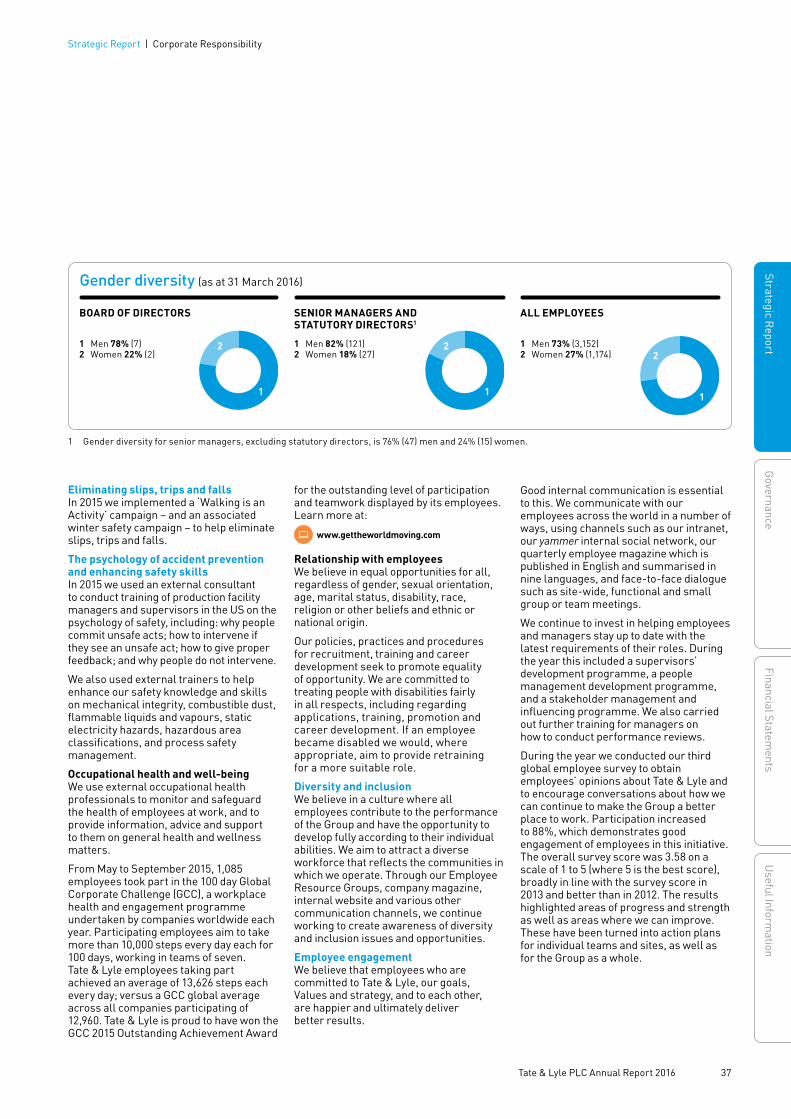
Eliminating slips, trips and fallsIn 2015 we implemented a ‘Walking is an Activity’ campaign – and an associated winter safety campaign – to help eliminate slips, trips and falls.
The psychology of accident prevention and enhancing safety skillsIn 2015 we used an external consultant to conduct training of production facility managers and supervisors in the US on the psychology of safety, including: why people commit unsafe acts; how to intervene if they see an unsafe act; how to give proper feedback; and why people do not intervene.
We also used external trainers to help enhance our safety knowledge and skills on mechanical integrity, combustible dust, flammable liquids and vapours, static electricity hazards, hazardous area classifications, and process safety management.
Occupational health and well-beingWe use external occupational health professionals to monitor and safeguard the health of employees at work, and to provide information, advice and support to them on general health and wellness matters.
From May to September 2015, 1,085 employees took part in the 100 day Global Corporate Challenge (GCC), a workplace health and engagement programme undertaken by companies worldwide each year. Participating employees aim to take more than 10,000 steps every day each for 100 days, working in teams of seven. Tate & Lyle employees taking part achieved an average of 13,626 steps each every day; versus a GCC global average across all companies participating of 12,960. Tate & Lyle is proud to have won the GCC 2015 Outstanding Achievement Award
for the outstanding level of participation and teamwork displayed by its employees. Learn more at:
www.gettheworldmoving.com
Relationship with employeesWe believe in equal opportunities for all, regardless of gender, sexual orientation, age, marital status, disability, race, religion or other beliefs and ethnic or national origin.
Our policies, practices and procedures for recruitment, training and career development seek to promote equality of opportunity. We are committed to treating people with disabilities fairly in all respects, including regarding applications, training, promotion and career development. If an employee became disabled we would, where appropriate, aim to provide retraining for a more suitable role.
Diversity and inclusionWe believe in a culture where all employees contribute to the performance of the Group and have the opportunity to develop fully according to their individual abilities. We aim to attract a diverse workforce that reflects the communities in which we operate. Through our Employee Resource Groups, company magazine, internal website and various other communication channels, we continue working to create awareness of diversity and inclusion issues and opportunities.
Employee engagementWe believe that employees who are committed to Tate & Lyle, our goals, Values and strategy, and to each other, are happier and ultimately deliver better results.
1 Gender diversity for senior managers, excluding statutory directors, is 76% (47) men and 24% (15) women.
Good internal communication is essential to this. We communicate with our employees across the world in a number of ways, using channels such as our intranet, our yammer internal social network, our quarterly employee magazine which is published in English and summarised in nine languages, and face-to-face dialogue such as site-wide, functional and small group or team meetings.
We continue to invest in helping employees and managers stay up to date with the latest requirements of their roles. During the year this included a supervisors’ development programme, a people management development programme, and a stakeholder management and influencing programme. We also carried out further training for managers on how to conduct performance reviews.
During the year we conducted our third global employee survey to obtain employees’ opinions about Tate & Lyle and to encourage conversations about how we can continue to make the Group a better place to work. Participation increased to 88%, which demonstrates good engagement of employees in this initiative. The overall survey score was 3.58 on a scale of 1 to 5 (where 5 is the best score), broadly in line with the survey score in 2013 and better than in 2012. The results highlighted areas of progress and strength as well as areas where we can improve. These have been turned into action plans for individual teams and sites, as well as for the Group as a whole.
Gender diversity (as at 31 March 2016)
BOARD OF DIRECTORS
1 Men 78% (7)2 Women 22% (2)
1
2
SENIOR MANAGERS AND STATUTORY DIRECTORS1
1 Men 82% (121)2 Women 18% (27)
1
2
ALL EMPLOYEES
1 Men 73% (3,152)2 Women 27% (1,174)
1
2
37 Tate & Lyle PLC Annual Report 2016
Strategic Report | Corporate Responsibility
Strategic ReportG
overnanceFinancial Statem
entsU
seful Information

ENVIRONMENT
We aim to operate our business with a strong regard for environmental sustainability. By using resources such as energy and water more efficiently, and reducing waste, we seek to improve our environmental sustainability while also controlling operating costs. We work to address environmental considerations across the life-cycle of our products, from our agricultural supply chain to how our products are packaged and transported.
Implementing our strategy, by growing our Speciality Food Ingredients business, is gradually changing the shape of our manufacturing operations: we are producing more speciality products which typically involve additional manufacturing steps compared with Bulk Ingredients products, and this can mean using more energy and/or water resources, and/or producing more waste. It is also the case that by improving overall operational efficiency in a manufacturing process,
or improving in one area of environmental performance, there can be negative impacts on our performance in other areas: for example, an overall more efficient manufacturing process at our Decatur, US facility is generating more (inert) waste; and reducing air emissions can sometimes require more energy (to power air emissions control technology). We are working to mitigate such consequences through continual improvements in resource and operational efficiency, and waste reduction programmes.
Policy and standardsOur environmental policy and standards apply to all our activities globally and we aim to integrate environmental considerations into all major decisions. We undertake environmental communication and awareness across the Group, including through induction and other training at our manufacturing facilities. Our policy is available on our corporate website, www.tateandlyle.com.
Our facilities operate under local environmental authorisations and permits and we require strict compliance with these at all times. If a site breaches an operating limit, we seek to take steps immediately to resolve the issue and prevent reoccurrence.
Our internal environmental audit programmes confirm conformity with our management standards. Our rolling programme of external, independent environmental compliance audits assures compliance with regulatory requirements.
Within our own operations and joint ventures, we focus on those aspects of our activities that have the greatest potential impact on the environment, namely the use of energy (and consequent air emissions and carbon footprint), water use, and waste management.
Beyond our own operations we focus our attention on our agricultural raw material and ingredient supply chain, the transportation of our products to our customers, and our product packaging.
Medium-term environmental sustainability targets
Target by end of 2016 Calendar year 2015 status Examples
Reduce CO2e emissions from energy use by 12.5% per tonne of production (baseline year 2008)1
10.4% reduction1 in CO2e emissions per tonne of production versus 2008
In 2015, our Lafayette South, Indiana, US corn wet mill was awarded Energy Star certification by the US Environmental Protection Agency (EPA) for its superior energy efficiency performance. Lafayette South is the only corn processing plant in the US to have achieved the EPA’s Energy Star certification in 2015. By increasing energy efficiency we reduce our CO2e emissions.
Implement packagingreduction programmes with customers representing > 50% of sales (£)
Programmes initiated with customers representing > 35% of sales (£)
Recent projects include reducing tertiary packaging in Europe and the US, and rationalising packaging sizes to use less packaging per unit of product.
Implement transportefficiency programmes with customers representing > 50% of sales (£)
Programmes initiated withcustomers representing > 35% of sales (£)
In 2015 we developed projects with two major customers at our Westboro and Cocoa bulk trans-shipment stations in the US, where we transfer bulk product from rail tanker cars to trucks. By optimising product-type shipments we are reducing the volume of hot washwater used: achieving water use, wastewater and energy use reductions through transport efficiency.
Implement sustainable agricultural sourcing programmes for our top 20 agricultural raw materials and ingredients by volume
We are on track to surpass our sustainable agriculture target, with programmes currently being implemented for 25 agricultural raw materials/ingredients (see Marketplace section page 39 for more details)
Corn is by far our largest agricultural raw material by volume. We buy corn from the ‘corn belts’ of the US and Europe. We are engaging on sustainable agriculture directly with corn growers, through grower cooperatives and other grower representatives such as the US National Corn Growers Association (NCGA), and via specific projects as part of our membership of the US Field to Market programme (www.fieldtomarket.org).
1 We recognise that installing new air emissions control equipment, and the manufacture of more speciality products, makes it more challenging to reduce our energy use and CO2e emissions in the medium term.
38 Tate & Lyle PLC Annual Report 2016
Strategic Report
Corporate Responsibility continued
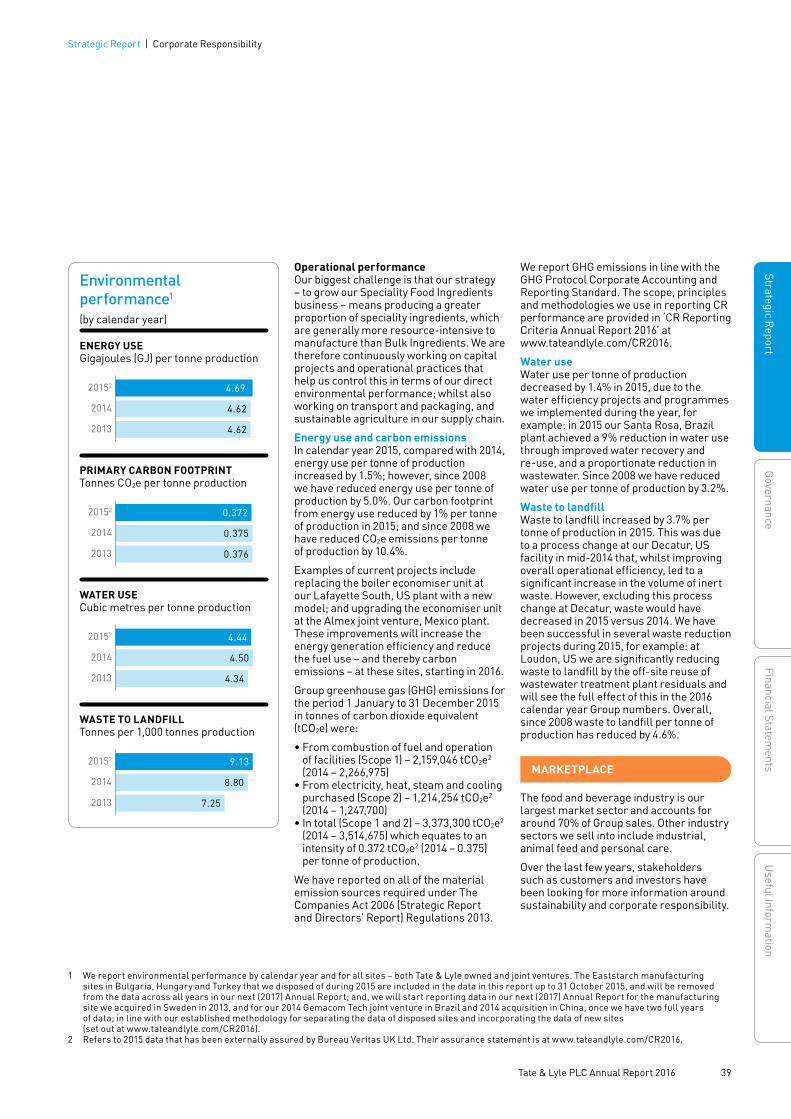
Operational performanceOur biggest challenge is that our strategy – to grow our Speciality Food Ingredients business – means producing a greater proportion of speciality ingredients, which are generally more resource-intensive to manufacture than Bulk Ingredients. We are therefore continuously working on capital projects and operational practices that help us control this in terms of our direct environmental performance; whilst also working on transport and packaging, and sustainable agriculture in our supply chain.
Energy use and carbon emissionsIn calendar year 2015, compared with 2014, energy use per tonne of production increased by 1.5%; however, since 2008 we have reduced energy use per tonne of production by 5.0%. Our carbon footprint from energy use reduced by 1% per tonne of production in 2015; and since 2008 we have reduced CO2e emissions per tonne of production by 10.4%.
Examples of current projects include replacing the boiler economiser unit at our Lafayette South, US plant with a new model; and upgrading the economiser unit at the Almex joint venture, Mexico plant. These improvements will increase the energy generation efficiency and reduce the fuel use – and thereby carbon emissions – at these sites, starting in 2016.
Group greenhouse gas (GHG) emissions for the period 1 January to 31 December 2015 in tonnes of carbon dioxide equivalent (tCO2e) were:
• From combustion of fuel and operation of facilities (Scope 1) – 2,159,046 tCO2e2 (2014 – 2,266,975)
• From electricity, heat, steam and cooling purchased (Scope 2) – 1,214,254 tCO2e2 (2014 – 1,247,700)
• In total (Scope 1 and 2) – 3,373,300 tCO2e2 (2014 – 3,514,675) which equates to an intensity of 0.372 tCO2e2 (2014 – 0.375) per tonne of production.
We have reported on all of the material emission sources required under The Companies Act 2006 (Strategic Report and Directors’ Report) Regulations 2013.
We report GHG emissions in line with the GHG Protocol Corporate Accounting and Reporting Standard. The scope, principles and methodologies we use in reporting CR performance are provided in ‘CR Reporting Criteria Annual Report 2016’ at www.tateandlyle.com/CR2016.
Water useWater use per tonne of production decreased by 1.4% in 2015, due to the water efficiency projects and programmes we implemented during the year, for example: in 2015 our Santa Rosa, Brazil plant achieved a 9% reduction in water use through improved water recovery and re-use, and a proportionate reduction in wastewater. Since 2008 we have reduced water use per tonne of production by 3.2%.
Waste to landfillWaste to landfill increased by 3.7% per tonne of production in 2015. This was due to a process change at our Decatur, US facility in mid-2014 that, whilst improving overall operational efficiency, led to a significant increase in the volume of inert waste. However, excluding this process change at Decatur, waste would have decreased in 2015 versus 2014. We have been successful in several waste reduction projects during 2015, for example: at Loudon, US we are significantly reducing waste to landfill by the off-site reuse of wastewater treatment plant residuals and will see the full effect of this in the 2016 calendar year Group numbers. Overall, since 2008 waste to landfill per tonne of production has reduced by 4.6%.
MARKETPLACE
The food and beverage industry is our largest market sector and accounts for around 70% of Group sales. Other industry sectors we sell into include industrial, animal feed and personal care.
Over the last few years, stakeholders such as customers and investors have been looking for more information around sustainability and corporate responsibility.
1 We report environmental performance by calendar year and for all sites – both Tate & Lyle owned and joint ventures. The Eaststarch manufacturing sites in Bulgaria, Hungary and Turkey that we disposed of during 2015 are included in the data in this report up to 31 October 2015, and will be removed from the data across all years in our next (2017) Annual Report; and, we will start reporting data in our next (2017) Annual Report for the manufacturing site we acquired in Sweden in 2013, and for our 2014 Gemacom Tech joint venture in Brazil and 2014 acquisition in China, once we have two full years of data; in line with our established methodology for separating the data of disposed sites and incorporating the data of new sites (set out at www.tateandlyle.com/CR2016).
2 Refers to 2015 data that has been externally assured by Bureau Veritas UK Ltd. Their assurance statement is at www.tateandlyle.com/CR2016.
Environmental performance1
(by calendar year)
ENERGY USEGigajoules (GJ) per tonne production
20152
2014
2013
4.69
4.62
4.62
PRIMARY CARBON FOOTPRINTTonnes CO2e per tonne production
20152
2014
2013
0.372
0.375
0.376
WATER USECubic metres per tonne production
20152
2014
2013
4.44
4.50
4.34
WASTE TO LANDFILLTonnes per 1,000 tonnes production
20152
2014
2013
9.13
8.80
7.25
39 Tate & Lyle PLC Annual Report 2016
Strategic Report | Corporate Responsibility
Strategic ReportG
overnanceFinancial Statem
entsU
seful Information
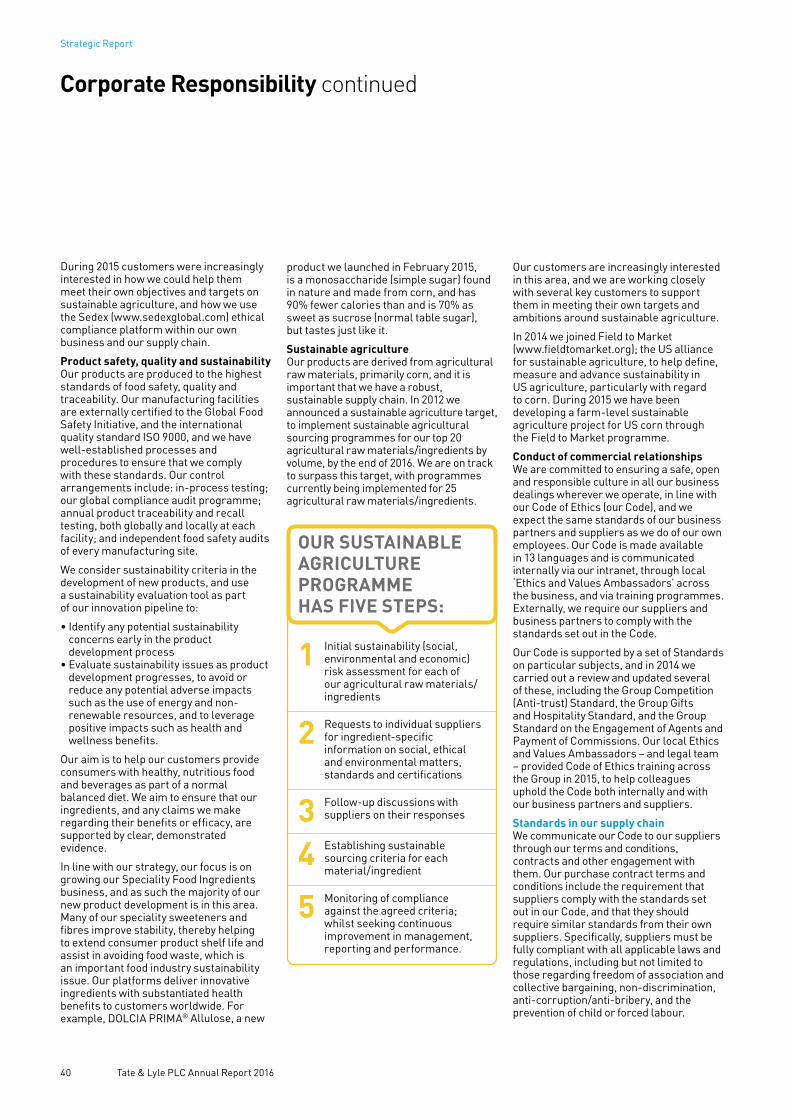
product we launched in February 2015, is a monosaccharide (simple sugar) found in nature and made from corn, and has 90% fewer calories than and is 70% as sweet as sucrose (normal table sugar), but tastes just like it.
Sustainable agricultureOur products are derived from agricultural raw materials, primarily corn, and it is important that we have a robust, sustainable supply chain. In 2012 we announced a sustainable agriculture target, to implement sustainable agricultural sourcing programmes for our top 20 agricultural raw materials/ingredients by volume, by the end of 2016. We are on track to surpass this target, with programmes currently being implemented for 25 agricultural raw materials/ingredients.
During 2015 customers were increasingly interested in how we could help them meet their own objectives and targets on sustainable agriculture, and how we use the Sedex (www.sedexglobal.com) ethical compliance platform within our own business and our supply chain.
Product safety, quality and sustainabilityOur products are produced to the highest standards of food safety, quality and traceability. Our manufacturing facilities are externally certified to the Global Food Safety Initiative, and the international quality standard ISO 9000, and we have well-established processes and procedures to ensure that we comply with these standards. Our control arrangements include: in-process testing; our global compliance audit programme; annual product traceability and recall testing, both globally and locally at each facility; and independent food safety audits of every manufacturing site.
We consider sustainability criteria in the development of new products, and use a sustainability evaluation tool as part of our innovation pipeline to:
• Identify any potential sustainability concerns early in the product development process
• Evaluate sustainability issues as product development progresses, to avoid or reduce any potential adverse impacts such as the use of energy and non-renewable resources, and to leverage positive impacts such as health and wellness benefits.
Our aim is to help our customers provide consumers with healthy, nutritious food and beverages as part of a normal balanced diet. We aim to ensure that our ingredients, and any claims we make regarding their benefits or efficacy, are supported by clear, demonstrated evidence.
In line with our strategy, our focus is on growing our Speciality Food Ingredients business, and as such the majority of our new product development is in this area. Many of our speciality sweeteners and fibres improve stability, thereby helping to extend consumer product shelf life and assist in avoiding food waste, which is an important food industry sustainability issue. Our platforms deliver innovative ingredients with substantiated health benefits to customers worldwide. For example, DOLCIA PRIMA® Allulose, a new
Our customers are increasingly interested in this area, and we are working closely with several key customers to support them in meeting their own targets and ambitions around sustainable agriculture.
In 2014 we joined Field to Market (www.fieldtomarket.org); the US alliance for sustainable agriculture, to help define, measure and advance sustainability in US agriculture, particularly with regard to corn. During 2015 we have been developing a farm-level sustainable agriculture project for US corn through the Field to Market programme.
Conduct of commercial relationshipsWe are committed to ensuring a safe, open and responsible culture in all our business dealings wherever we operate, in line with our Code of Ethics (our Code), and we expect the same standards of our business partners and suppliers as we do of our own employees. Our Code is made available in 13 languages and is communicated internally via our intranet, through local ‘Ethics and Values Ambassadors’ across the business, and via training programmes. Externally, we require our suppliers and business partners to comply with the standards set out in the Code.
Our Code is supported by a set of Standards on particular subjects, and in 2014 we carried out a review and updated several of these, including the Group Competition (Anti-trust) Standard, the Group Gifts and Hospitality Standard, and the Group Standard on the Engagement of Agents and Payment of Commissions. Our local Ethics and Values Ambassadors – and legal team – provided Code of Ethics training across the Group in 2015, to help colleagues uphold the Code both internally and with our business partners and suppliers.
Standards in our supply chainWe communicate our Code to our suppliers through our terms and conditions, contracts and other engagement with them. Our purchase contract terms and conditions include the requirement that suppliers comply with the standards set out in our Code, and that they should require similar standards from their own suppliers. Specifically, suppliers must be fully compliant with all applicable laws and regulations, including but not limited to those regarding freedom of association and collective bargaining, non-discrimination, anti-corruption/anti-bribery, and the prevention of child or forced labour.
1 Initial sustainability (social, environmental and economic) risk assessment for each of our agricultural raw materials/ingredients
2 Requests to individual suppliers for ingredient-specific information on social, ethical and environmental matters, standards and certifications
3 Follow-up discussions with suppliers on their responses
4 Establishing sustainable sourcing criteria for each material/ingredient
5 Monitoring of compliance against the agreed criteria; whilst seeking continuous improvement in management, reporting and performance.
OUR SUSTAINABLE AGRICULTURE PROGRAMME HAS FIVE STEPS:
40 Tate & Lyle PLC Annual Report 2016
Strategic Report
Corporate Responsibility continued

• Education: this year we provided an additional six fellowships to University leaders in Vietnam, building capacity in higher education by increasing skills in educational leadership and governance. We also provided bursaries/scholarships to the University of Illinois, Purdue University and Richland Community College, US; and ran a US National Merit scholarship programme.
• Environment: we are entering our fourth year as a corporate partner of the environmental research and engagement charity Earthwatch (www.eu.earthwatch.org), with whom we have recently launched a four-year research project on the ecology, conservation and sustainable harvesting of seaweed in Asia. We use ingredients derived from seaweed in our Food Systems business.
The feedback received from our partnerships with external bodies on community involvement contributes to the ongoing development of our stakeholder engagement in this area.
COMMUNITY SPEND BY AREAYear ended 31 March 2016
1 Education 36%2 Well-being 36%3 Environment 26%4 Other 2%
The Strategic Report from page 1 to page 41 of this Annual Report was approved by the Board on 25 May 2016.
By order of the Board
Lucie GilbertCompany Secretary25 May 2016
Our procurement function has a process to assess the environmental and social risks of suppliers based on their source country (where independent ratings of human rights risk are applied), and the item itself being supplied (with reference to an external sustainability risk assessment of our agricultural raw materials/ingredients). As set out above, our sustainable agriculture programme specifically addresses these issues in our agricultural raw materials/ingredient supply chain (see page 40).
In 2015, having used the Sedex social and ethical compliance system (www.sedexglobal.com) across our own manufacturing facilities for more than ten years, we started using it with our agricultural suppliers to promote and assure good practices.
Reporting concernsWe encourage our employees and business partners to come forward with any information concerning actual or alleged breaches of our Code. We provide an independent, anonymous third-party reporting service through free phone numbers in 47 countries and by email. We promote this ‘Speak Up’ service across the Group, and externally via our corporate website. Any issues reported are investigated by members of our Speak Up Committee.
COMMUNITY
We have a strong history of community involvement and during the year we continued to support communities both local to our operations and globally.
Our approachFor Tate & Lyle, community involvement is about having a positive and lasting relationship with the community: changing lives for the better. For the last five years we have focused on three specific areas:
• Well-being: to provide practical assistance in the area of well-being from health issues including nutrition through to general welfare, such as supporting food banks
• Education: to develop young people’s knowledge and understanding of science, technology, engineering and mathematics (STEM subjects), and their preparedness for a career in a STEM-based discipline, either academically or vocationally
• Environment: to promote environmental sustainability and good environmental management, addressing issues of climate change, natural resources and conservation.
Overview of the yearIn the year ended 31 March 2016, charitable donations were £529,0001 (2014 – £423,0002).
Local programmes/partnershipsWe seek to engage with local communities where our principal facilities are located. Employees at each location can make their own decisions as to the specific projects they support and the partnerships that they develop. As a result, we support a range of initiatives and organisations in our local communities worldwide.
• Well-being: we supported a wide variety of well-being initiatives this year, including: child community care centres in Johannesburg, South Africa; and local hospices, healthcare and food aid charities in Europe and the US.
• Education: this year, support provided included enhanced maths and science delivery in the Decatur, Lafayette, Loudon and McIntosh school districts in the US; road safety events for children near Mold, UK for the third year running; and bursary/scholarship funds to help students access higher education.
• Environment: this year we supported a number of environmental initiatives, including improvement works to local park and conservation areas.
Global partnershipsWe have further developed our global partnership programmes during the year.
• Well-being: for the fourth year running, we have supported the homeless charity Crisis (www.crisis.org.uk) in the UK and the Northern Illinois Food Bank (www.solvehungertoday.org) in the US. Both organisations provide immediate, practical assistance to those in need.
1 Reported on an equity basis.2 Restated for the adoption of reporting on an equity basis.
1
2
3
4
41 Tate & Lyle PLC Annual Report 2016
Strategic Report | Corporate Responsibility
Strategic ReportG
overnanceFinancial Statem
entsU
seful Information

Board of Directors
Sir Peter Gershon CBE N CR
Chairman and Chairman of the Nominations CommitteeJoined the Board in February 2009. Appointed Chairman in July 2009. Aged 69. British.
Skills and experienceSir Peter has broad business experience gained in large and complex international organisations and has held various leadership roles in the UK private and public sector. He was formerly Chairman of Premier Farnell plc; Chief Executive of the Office of Government Commerce; Managing Director of Marconi Electronic Systems; and a member of the UK Defence Academy Advisory Board.
Other directorships• Chairman of National Grid plc• Chairman of the Aircraft Carrier Alliance• Member of the advisory board and
Trustee of The Sutton Trust
Lars Frederiksen R N CR
Non-Executive Director Joined the Board on 1 April 2016. Aged 57. Danish.
Skills and experienceLars was CEO of Chr. Hansen Holding A/S from 2005 until his retirement in March 2013, leading a transformation of the business and a successful listing on the Copenhagen stock exchange during that period. Prior to his appointment as CEO, Lars held various management positions at Chr. Hansen.
Other directorships• Chairman of Matas A/S• Non-executive director of Falck A/S• Non-executive director of Rockwool A/S• Chairman of the Danish Committee for
Good Corporate Governance
Javed Ahmed N
Chief ExecutiveJoined the Board as Chief Executive in October 2009. Aged 56. Pakistani/American.
Skills and experienceJaved has extensive international experience from a wide variety of senior management roles. He started his career with Procter & Gamble and then spent five years with Bain & Co. before joining Benckiser (later Reckitt Benckiser plc) in 1992 where he gained significant experience of international consumer goods markets and held positions including Senior Vice President, Northern Europe; President, North America; Executive Vice President, North America, Australia and New Zealand; and Executive Vice President, Europe.
Other directorshipsNone
Douglas Hurt A N CR
Non-Executive Director and Chairman of the Audit CommitteeJoined the Board in March 2010. Aged 59. British.
Skills and experienceDouglas is a Chartered Accountant. He held a number of financial and operational roles, including US and European senior management positions, at GlaxoSmithKline and was Finance Director of IMI plc between 2006 and 2015.
Other directorships• Senior Independent Director of
Vesuvius plc• Non-executive director of BSI Group
Nick Hampton Chief Financial Officer Joined the Board on 1 September 2014 as Chief Financial Officer. Aged 49. British.
Skills and experiencePrior to joining Tate & Lyle, Nick held a number of senior roles over his 20-year career at PepsiCo, most recently as Senior Vice President and Chief Financial Officer, Europe in 2008, a position he held until 2013 when he was appointed PepsiCo’s President, West Europe Region and Senior Vice President Commercial, Europe.
Other directorshipsNone
Anne Minto OBE A R N Non-Executive Director and Chairman of the Remuneration CommitteeJoined the Board in December 2012. Aged 62. British.
Skills and experienceAnne was Group Director of Human Resources at Centrica plc from 2002 until her retirement in 2011. She previously held senior management roles at Shell UK and Smiths Group plc and was Deputy Director-General of the Engineering Employers’ Federation.
Other directorships• Non-executive director of Shire PLC• Non-executive director of ExlService
Holdings, Inc.• Vice Chairman of the University of
Aberdeen Development Trust • Non-executive director of the Court
of the University of Aberdeen
Governance
42 Tate & Lyle PLC Annual Report 2016
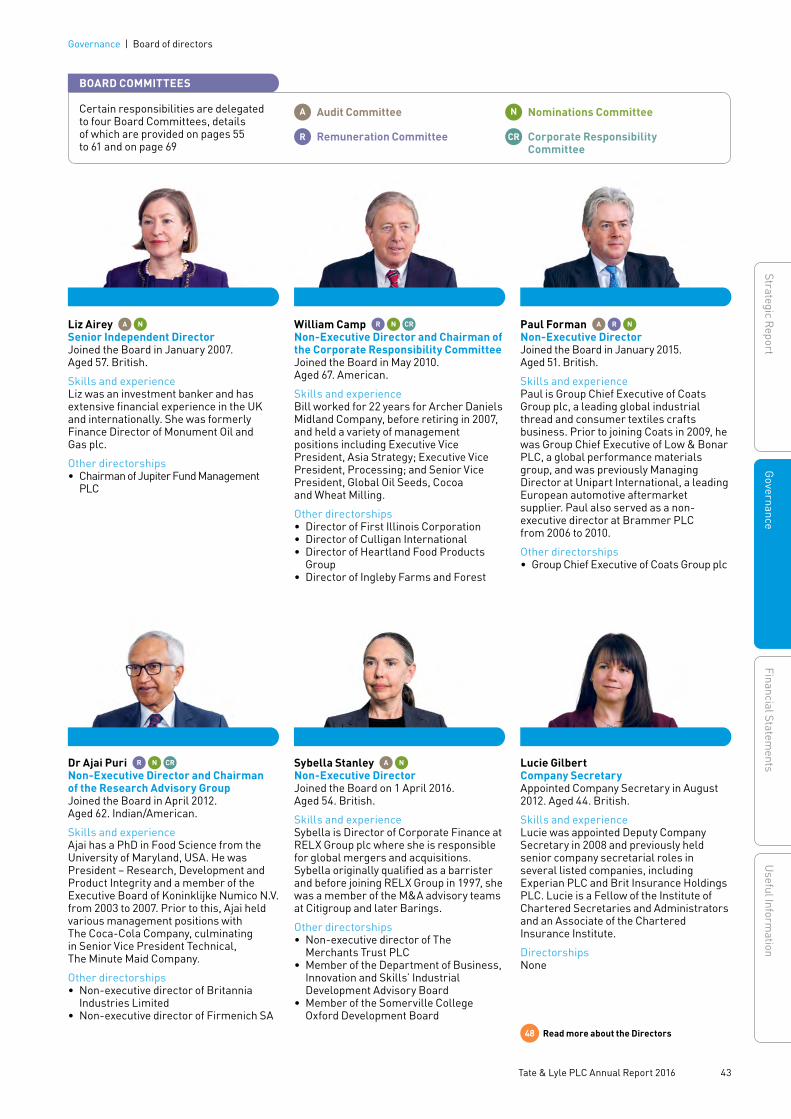
Certain responsibilities are delegated to four Board Committees, details of which are provided on pages 55 to 61 and on page 69
A Audit Committee N Nominations Committee
R Remuneration Committee CR Corporate Responsibility Committee
BOARD COMMITTEES
Liz Airey A N
Senior Independent Director Joined the Board in January 2007. Aged 57. British.
Skills and experienceLiz was an investment banker and has extensive financial experience in the UK and internationally. She was formerly Finance Director of Monument Oil and Gas plc.
Other directorships• Chairman of Jupiter Fund Management
PLC
Dr Ajai Puri R N CR
Non-Executive Director and Chairman of the Research Advisory GroupJoined the Board in April 2012. Aged 62. Indian/American.
Skills and experienceAjai has a PhD in Food Science from the University of Maryland, USA. He was President – Research, Development and Product Integrity and a member of the Executive Board of Koninklijke Numico N.V. from 2003 to 2007. Prior to this, Ajai held various management positions with The Coca-Cola Company, culminating in Senior Vice President Technical, The Minute Maid Company.
Other directorships• Non-executive director of Britannia
Industries Limited• Non-executive director of Firmenich SA
William Camp R N CR
Non-Executive Director and Chairman of the Corporate Responsibility CommitteeJoined the Board in May 2010. Aged 67. American.
Skills and experienceBill worked for 22 years for Archer Daniels Midland Company, before retiring in 2007, and held a variety of management positions including Executive Vice President, Asia Strategy; Executive Vice President, Processing; and Senior Vice President, Global Oil Seeds, Cocoa and Wheat Milling.
Other directorships• Director of First Illinois Corporation• Director of Culligan International• Director of Heartland Food Products
Group• Director of Ingleby Farms and Forest
Sybella Stanley A N
Non-Executive DirectorJoined the Board on 1 April 2016. Aged 54. British.
Skills and experienceSybella is Director of Corporate Finance at RELX Group plc where she is responsible for global mergers and acquisitions. Sybella originally qualified as a barrister and before joining RELX Group in 1997, she was a member of the M&A advisory teams at Citigroup and later Barings.
Other directorships• Non-executive director of The
Merchants Trust PLC • Member of the Department of Business,
Innovation and Skills’ Industrial Development Advisory Board
• Member of the Somerville College Oxford Development Board
Paul Forman A R N
Non-Executive DirectorJoined the Board in January 2015. Aged 51. British.
Skills and experiencePaul is Group Chief Executive of Coats Group plc, a leading global industrial thread and consumer textiles crafts business. Prior to joining Coats in 2009, he was Group Chief Executive of Low & Bonar PLC, a global performance materials group, and was previously Managing Director at Unipart International, a leading European automotive aftermarket supplier. Paul also served as a non-executive director at Brammer PLC from 2006 to 2010.
Other directorships• Group Chief Executive of Coats Group plc
Lucie Gilbert Company Secretary Appointed Company Secretary in August 2012. Aged 44. British.
Skills and experienceLucie was appointed Deputy Company Secretary in 2008 and previously held senior company secretarial roles in several listed companies, including Experian PLC and Brit Insurance Holdings PLC. Lucie is a Fellow of the Institute of Chartered Secretaries and Administrators and an Associate of the Chartered Insurance Institute.
DirectorshipsNone
48 Read more about the Directors
43 Tate & Lyle PLC Annual Report 2016
Strategic ReportG
overnanceFinancial Statem
entsU
seful Information
Governance | Board of directors

Dear shareholderAs Chairman, I am responsible for ensuring that the Board operates effectively with well-informed directors asking the right questions and setting the right tone from the top. Throughout the year, my colleagues and I have focused on learning from the challenging experiences of the 2015 financial year. We have revisited how we use our time together and changed the focus of certain of our activities outside Board meetings. This has enabled us to increase the time we spend discussing longer-term strategic or industry issues.
Board compositionIn my statement at the start of this Annual Report, I have set out the key changes to the Board during the year: Virginia Kamsky resigned to focus on her executive commitments and the Nominations Committee undertook a search process which culminated in the appointment of two new non-executive directors, Lars Frederiksen and Sybella Stanley, with effect from 1 April 2016. I am very pleased that we continue to attract strong and diverse talent to the Board. Female representation now equates to 27% of the Board.
We are working with each new director to develop a tailored induction programme to enable them to contribute effectively as soon as possible after joining the Board. More information on the recruitment process and the induction programmes is set out on page 48.
Board effectivenessFollowing on from the reviews of Board effectiveness conducted by an external facilitator in 2014 and the Senior Independent Director in 2015, I led the review process this year. The review leveraged the output of a number of actions that we as a Board had undertaken throughout the financial year to improve our effectiveness and details of the review are set out on page 50.
Focus for the 2017 financial yearThe key areas to which we will continue to devote significant time at Board and Committee level are as follows:
• Safety• The performance of the Speciality Food Ingredients business• Strategic initiatives, including acquisition opportunities• Customer engagement• Employee engagement• Innovation pipeline• Talent management and succession planning.
Sir Peter Gershon Chairman
UK Corporate Governance CodeThe UK Corporate Governance Code issued by the Financial Reporting Council in September 2014 (the Code) is the standard against which we are required to measure ourselves for the year ended 31 March 2016. Throughout the year, from 1 April 2015 to 31 March 2016, the Company has complied fully with the Code.
We use the Code’s key themes to structure how we apply the provisions of the Code:
45 Leadership
48 Effectiveness
52 Accountability
54 Engagement with shareholders and others
62 Remuneration is covered in the Directors’ Remuneration Report
Statement from the Chairman We continue to attract strong and diverse talent to the Board
Sir Peter Gershon, Chairman
Governance
44 Tate & Lyle PLC Annual Report 2016
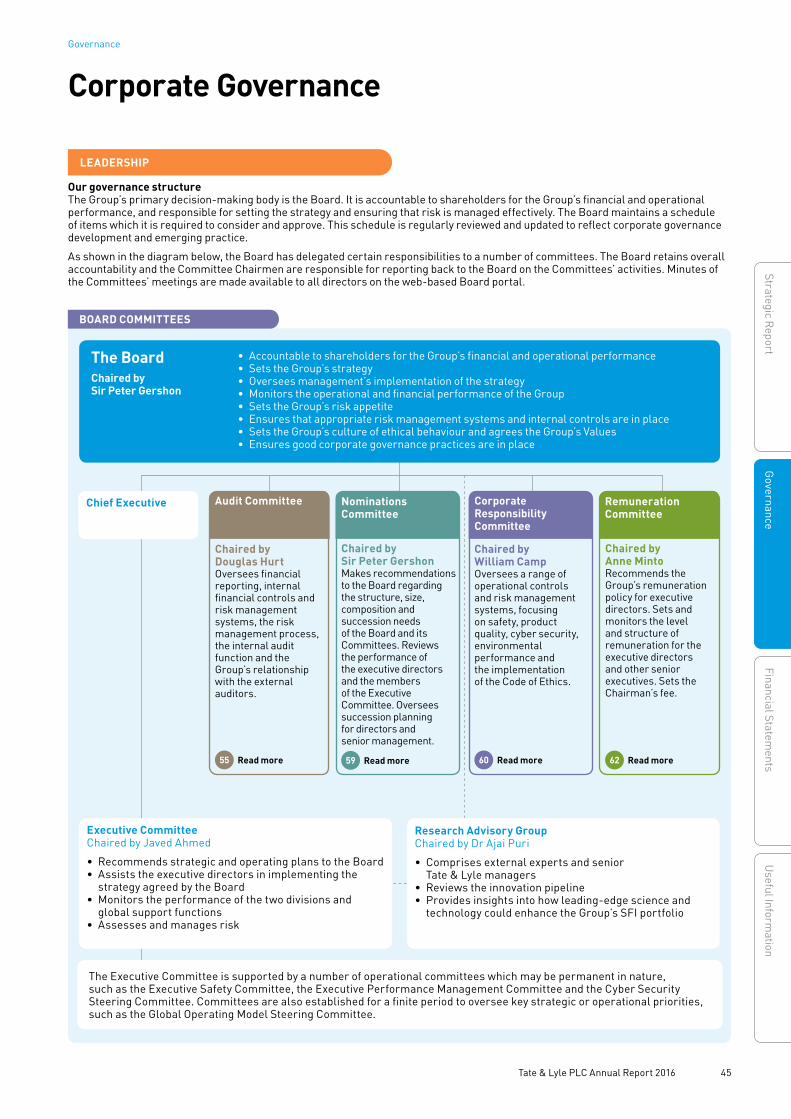
Our governance structureThe Group’s primary decision-making body is the Board. It is accountable to shareholders for the Group’s financial and operational performance, and responsible for setting the strategy and ensuring that risk is managed effectively. The Board maintains a schedule of items which it is required to consider and approve. This schedule is regularly reviewed and updated to reflect corporate governance development and emerging practice.
As shown in the diagram below, the Board has delegated certain responsibilities to a number of committees. The Board retains overall accountability and the Committee Chairmen are responsible for reporting back to the Board on the Committees’ activities. Minutes of the Committees’ meetings are made available to all directors on the web-based Board portal.
Corporate Governance
LEADERSHIP
The Executive Committee is supported by a number of operational committees which may be permanent in nature, such as the Executive Safety Committee, the Executive Performance Management Committee and the Cyber Security Steering Committee. Committees are also established for a finite period to oversee key strategic or operational priorities, such as the Global Operating Model Steering Committee.
• Accountable to shareholders for the Group’s financial and operational performance• Sets the Group’s strategy• Oversees management’s implementation of the strategy• Monitors the operational and financial performance of the Group • Sets the Group’s risk appetite• Ensures that appropriate risk management systems and internal controls are in place• Sets the Group’s culture of ethical behaviour and agrees the Group’s Values • Ensures good corporate governance practices are in place
The BoardChaired by Sir Peter Gershon
Research Advisory GroupChaired by Dr Ajai Puri
• Comprises external experts and senior Tate & Lyle managers
• Reviews the innovation pipeline• Provides insights into how leading-edge science and
technology could enhance the Group’s SFI portfolio
Chief Executive
BOARD COMMITTEES
Audit Committee
Chaired by Anne MintoRecommends the Group’s remuneration policy for executive directors. Sets and monitors the level and structure of remuneration for the executive directors and other senior executives. Sets the Chairman’s fee.
62 Read more
Chaired by Sir Peter GershonMakes recommendations to the Board regarding the structure, size, composition and succession needs of the Board and its Committees. Reviews the performance of the executive directors and the members of the Executive Committee. Oversees succession planning for directors and senior management.
59 Read more
Corporate Responsibility Committee
Chaired by Douglas Hurt Oversees financial reporting, internal financial controls and risk management systems, the risk management process, the internal audit function and the Group’s relationship with the external auditors.
55 Read more
Chaired by William CampOversees a range of operational controls and risk management systems, focusing on safety, product quality, cyber security, environmental performance and the implementation of the Code of Ethics.
60 Read more
Nominations Committee
Remuneration Committee
Executive CommitteeChaired by Javed Ahmed
• Recommends strategic and operating plans to the Board• Assists the executive directors in implementing the
strategy agreed by the Board• Monitors the performance of the two divisions and
global support functions• Assesses and manages risk
45 Tate & Lyle PLC Annual Report 2016
Strategic ReportG
overnanceFinancial Statem
entsU
seful Information
Governance

Board meetings and activities during the yearThe Board holds six scheduled meetings each year. In the few instances where a director is unable to attend a meeting, he or she provides comments in advance to the Chariman. Meetings were held in London, at the Commercial and Food Innovation Centre in Chicago, USA, and at the manufacturing facility in Loudon, Tennessee to enable Directors to engage with a wider management and employee base. The Board also met twice to discuss strategy. In addition to the scheduled meetings, three Board meetings were arranged at shorter notice to consider matters requiring review and decision before the next scheduled meeting. The Board also met once between the end of the financial year and prior to the date of the approval of this report.
DIRECTORS’ ATTENDANCE AT BOARD MEETINGS DURING THE YEAR
Directors as at 31 March 2016
Number ofmeetingsattended
Number of meetings
eligible to attend
Sir Peter Gershon 9 9Javed Ahmed 9 9Nick Hampton 9 9Liz Airey1 8 9William Camp 9 9Paul Forman 9 9Douglas Hurt 9 9Anne Minto 9 9Dr Ajai Puri 9 9Former Director Virginia Kamsky2 3 3
1 Unable to attend one meeting called at short notice due to an existing commitment.
2 Ceased to be a director on 1 July 2015.
Lars Frederiksen and Sybella Stanley joined the Board on 1 April 2016.
BOARD VISIT TO MANUFACTURING FACILITY IN LOUDON, TENNESSEE
Key responsibilitiesThe Board comprises the Chairman, two executive directors and eight non-executive directors. Their responsibilities are summarised below. There is a clear division of responsibilities: the Chairman is responsible for leading the Board and the Chief Executive leads the business.
Chairman, Sir Peter GershonResponsible for the effective operation, leadership and governance of the Board• Chairs Board meetings, Nominations Committee meetings
and the Annual General Meeting• Sets the Board agenda with the Chief Executive and
Company Secretary• Facilitates active engagement by all directors• Sets the style and tone of Board discussions• Ensures the directors receive accurate, timely and
clear information
Chief Executive, Javed AhmedResponsible for proposing strategy to the Board and delivering it• Runs the business• Communicates the Board’s expectations with regard to culture,
Values and behaviours• Ensures the Board is aware of the executive directors’ views
on business issues
Chief Financial Officer, Nick HamptonResponsible for the Group’s financial affairs• Contributes to the management of the Group’s business• Supports the Chief Executive with the development and
implementation of the strategy
Non-executive directors: Liz Airey, William Camp, Lars Frederiksen, Paul Forman, Douglas Hurt, Anne Minto, Dr Ajai Puri and Sybella StanleyResponsible for overseeing the delivery of the strategy within the risk appetite set by the Board• Constructively challenge and advise the executive directors
Senior Independent Director, Liz AireyResponsible for ensuring that the Chairman’s performance is evaluated• Acts as a sounding board for the Chairman and supports him
in the delivery of his objectives• Serves as an intermediary for other directors if necessary• Maintains a comprehensive understanding of the major issues
of shareholders and is available if shareholders have any concerns that they have been unable to resolve through the normal channels
Company Secretary, Lucie GilbertResponsible for maintaining the governance and listing rules compliance framework • Supports the Chairman, Chief Executive and Committee
Chairmen in setting agenda items for Board and Committee meetings
• Advises the Board on corporate governance, legislative and regulatory developments
• Assists the Chairman and the Chief Executive in ensuring that the directors are provided with relevant information in a timely manner
• Organises new director induction and ongoing director training
In September 2015, the Board visited the Group’s manufacturing facility in Loudon, Tennessee. The Board toured the plant, inspecting the progress of and plans for capital investment at the site, including the construction of a combined heat and power plant. Directors gained a fuller insight into the operation of the facility and its interactions with the local community and celebrated a safety milestone over a lunch with staff.
Corporate Governance continued
Governance
46 Tate & Lyle PLC Annual Report 2016
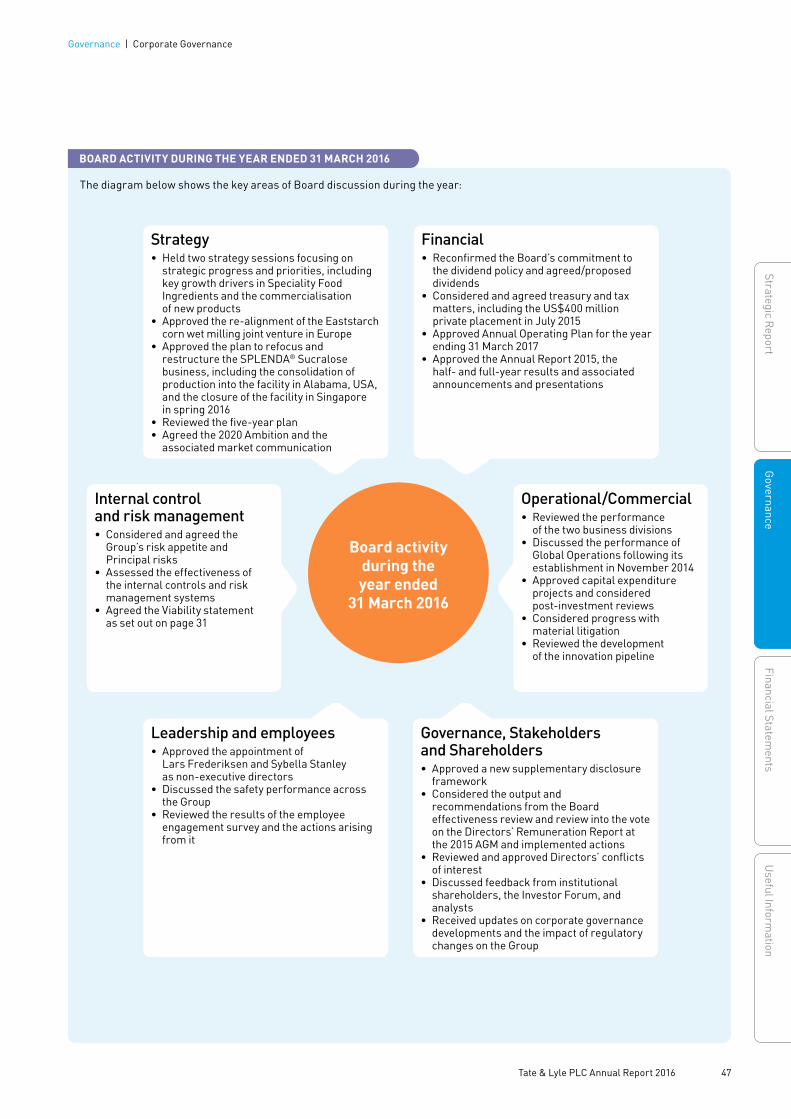
BOARD ACTIVITY DURING THE YEAR ENDED 31 MARCH 2016
The diagram below shows the key areas of Board discussion during the year:
Board activity during the year ended
31 March 2016
Internal control and risk management• Considered and agreed the
Group’s risk appetite and Principal risks
• Assessed the effectiveness of the internal controls and risk management systems
• Agreed the Viability statement as set out on page 31
Operational/Commercial• Reviewed the performance
of the two business divisions• Discussed the performance of
Global Operations following its establishment in November 2014
• Approved capital expenditure projects and considered post-investment reviews
• Considered progress with material litigation
• Reviewed the development of the innovation pipeline
Governance, Stakeholders and Shareholders• Approved a new supplementary disclosure
framework• Considered the output and
recommendations from the Board effectiveness review and review into the vote on the Directors’ Remuneration Report at the 2015 AGM and implemented actions
• Reviewed and approved Directors’ conflicts of interest
• Discussed feedback from institutional shareholders, the Investor Forum, and analysts
• Received updates on corporate governance developments and the impact of regulatory changes on the Group
Strategy• Held two strategy sessions focusing on
strategic progress and priorities, including key growth drivers in Speciality Food Ingredients and the commercialisation of new products
• Approved the re-alignment of the Eaststarch corn wet milling joint venture in Europe
• Approved the plan to refocus and restructure the SPLENDA® Sucralose business, including the consolidation of production into the facility in Alabama, USA, and the closure of the facility in Singapore in spring 2016
• Reviewed the five-year plan• Agreed the 2020 Ambition and the
associated market communication
Financial• Reconfirmed the Board’s commitment to
the dividend policy and agreed/proposed dividends
• Considered and agreed treasury and tax matters, including the US$400 million private placement in July 2015
• Approved Annual Operating Plan for the year ending 31 March 2017
• Approved the Annual Report 2015, the half- and full-year results and associated announcements and presentations
Leadership and employees• Approved the appointment of
Lars Frederiksen and Sybella Stanley as non-executive directors
• Discussed the safety performance across the Group
• Reviewed the results of the employee engagement survey and the actions arising from it
Governance | Corporate Governance
47 Tate & Lyle PLC Annual Report 2016
Strategic ReportG
overnanceFinancial Statem
entsU
seful Information

Corporate Governance continued
Appointments to the BoardThe Nominations Committee has responsibility for the appointment of non-executive and executive directors and recommends new appointments to the Board. During the year, the Nominations Committee undertook a search exercise for two additional non-executive directors. The Board approved the Nominations Committee’s recommendations and Lars Frederiksen and Sybella Stanley joined the Board on 1 April 2016. Further details about the appointment process are set out in the Nominations Committee report pages 59 and 60.
Directors’ induction programmeOn appointment, Lars Frederiksen and Sybella Stanley received background reading about the Group and details of Board procedures and other governance matters. The Company Secretary then worked with each director to tailor the general non-executive director induction programme, which covers strategy, operations (including safety and environ mental performance), risk management and internal control. An overview of their programmes to date is set out on page 49.
Re-election of directorsThe Code provides that all directors should seek re-election on an annual basis and all directors will seek re-election at the forthcoming AGM. The directors standing for re-election, with the exception of Javed Ahmed and Nick Hampton, do not have service contracts. Each director goes through a formal performance review process as part of the annual Board effectiveness review. All directors completed this process during the year and, in line with the Code, Sir Peter Gershon, Liz Airey, William Camp and Douglas Hurt, who have served for over six years, have been subject to a particularly rigorous review.
The balance of experience, skills, gender and diversity of thinking styles around the boardroom table is regularly reviewed to ensure that the composition of the Board and its Committees is appropriate for the Group as it continues to evolve and implement its agreed strategy. The Board and its Committees undergo a formal effectiveness review process once a year which provides new insights into the operation of the Board and areas for development or particular focus.
Board compositionAt the date of this Annual Report, the Board comprised 11 directors with deep knowledge and experience in diverse business sectors within global markets: the Chairman, who has no executive responsibilities; two executive directors; and eight non-executive directors. The names, skills and experience of the directors are set out below and on page 49.
CHART OF TENURE OF NON-EXECUTIVE DIRECTORS AT 25 MAY 2016
1 Less than 3 years (3 directors)2 4 to 6 years (4 directors)3 Over 7 years (1 director) 1
2
3
EFFECTIVENESS
Sir Peter GershonSir Peter’s significant business and board level experience gained in multiple international industries provides the Board with valuable contributions when considering strategy, business performance, new opportunities and engineering matters. He has significant experience of chairing FTSE 100 and 250 companies and a detailed understanding of UK governance requirements.
Javed AhmedJaved has extensive experience of global consumer goods markets. The depth and breadth of his experience as a global business leader in multi-national companies and tenure with a major strategy consulting group provides the skillset required to drive and transform an organisation, inspire its workforce and show leadership in the Company’s culture and values.
Nick HamptonNick brings a wealth of food industry insights to the Board, leveraging his general management, financial and operational experience in senior management roles in a major multi-national food and beverage business, making him a versatile operational CFO. His experience in leading transformational projects is particularly important as the Group continues its transformation.
Douglas HurtDouglas has extensive experience as a former FD of a global manufacturing and business-to-business engineering group and also in senior management roles in the US and Europe which provides the Board with valuable perspectives and insights into financial and operational issues. In addition, his understanding of the London investment community and pension matters supports the Board in its oversight and decision-making roles. As Chairman of the Audit Committee, Douglas also serves on the Corporate Responsibility Committee which further supports the coordination of the oversight role of both committees.
Lars FrederiksenAs the former CEO of a global speciality food ingredients business, Lars led a highly successful business transformation and his insights will be invaluable to the Board as Tate & Lyle continues to evolve. He brings operational expertise and insights to the Corporate Responsibility Committee and an understanding of how to attract and retain talent in a global business to the Remuneration Committee.
Anne MintoAnne’s extensive career in general management and human resources is particularly useful to the Board when considering succession planning, talent management, executive remuneration and other employee-related activities. She has a detailed understanding of how to attract and retain global talent and her roles on the boards of companies listed in both London and New York provide her with a detailed understanding of global executive remuneration practices and UK and US remuneration governance requirements. As Chairman of the Remuneration Committee, Anne also serves on the Audit Committee which further supports the coordination of the oversight role of both committees.
A BALANCED AND DIVERSE BOARD
Governance
48 Tate & Lyle PLC Annual Report 2016
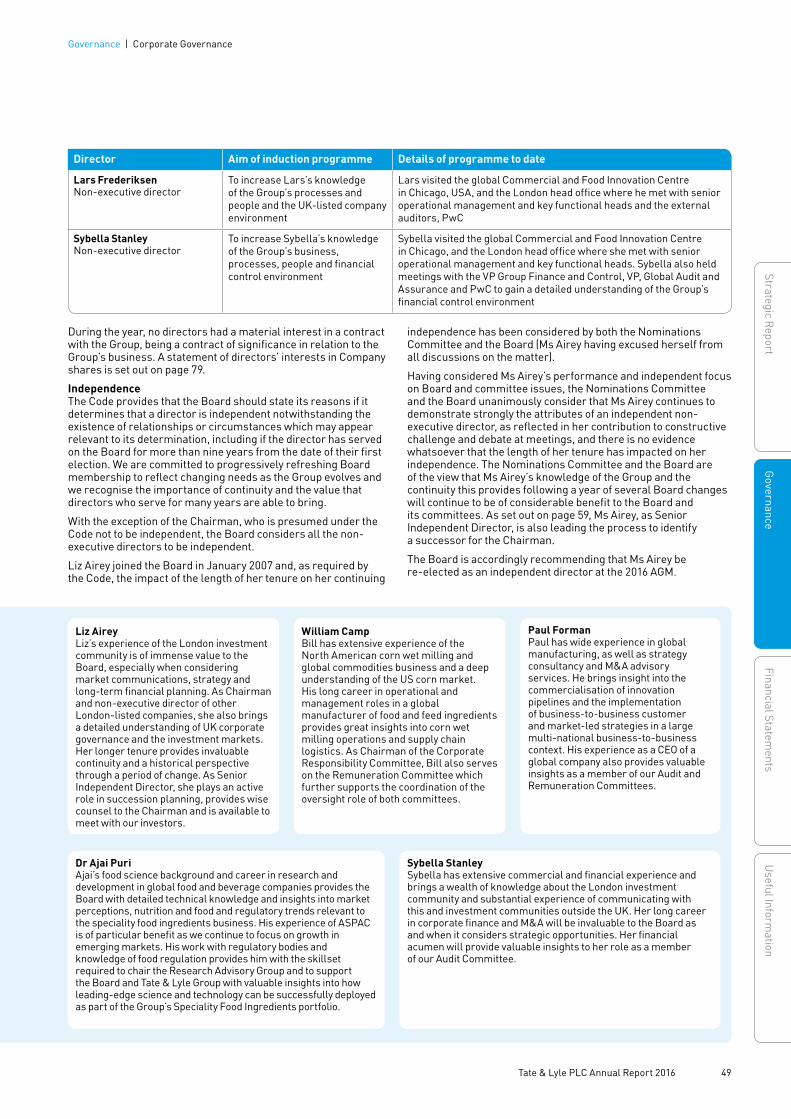
During the year, no directors had a material interest in a contract with the Group, being a contract of significance in relation to the Group’s business. A statement of directors’ interests in Company shares is set out on page 79.
IndependenceThe Code provides that the Board should state its reasons if it determines that a director is independent notwithstanding the existence of relationships or circumstances which may appear relevant to its determination, including if the director has served on the Board for more than nine years from the date of their first election. We are committed to progressively refreshing Board membership to reflect changing needs as the Group evolves and we recognise the importance of continuity and the value that directors who serve for many years are able to bring.
With the exception of the Chairman, who is presumed under the Code not to be independent, the Board considers all the non-executive directors to be independent.
Liz Airey joined the Board in January 2007 and, as required by the Code, the impact of the length of her tenure on her continuing
Director Aim of induction programme Details of programme to date
Lars FrederiksenNon-executive director
To increase Lars’s knowledge of the Group’s processes and people and the UK-listed company environment
Lars visited the global Commercial and Food Innovation Centre in Chicago, USA, and the London head office where he met with senior operational management and key functional heads and the external auditors, PwC
Sybella StanleyNon-executive director
To increase Sybella’s knowledge of the Group’s business, processes, people and financial control environment
Sybella visited the global Commercial and Food Innovation Centre in Chicago, and the London head office where she met with senior operational management and key functional heads. Sybella also held meetings with the VP Group Finance and Control, VP, Global Audit and Assurance and PwC to gain a detailed understanding of the Group’s financial control environment
Sybella StanleySybella has extensive commercial and financial experience and brings a wealth of knowledge about the London investment community and substantial experience of communicating with this and investment communities outside the UK. Her long career in corporate finance and M&A will be invaluable to the Board as and when it considers strategic opportunities. Her financial acumen will provide valuable insights to her role as a member of our Audit Committee.
Liz AireyLiz’s experience of the London investment community is of immense value to the Board, especially when considering market communications, strategy and long-term financial planning. As Chairman and non-executive director of other London-listed companies, she also brings a detailed understanding of UK corporate governance and the investment markets. Her longer tenure provides invaluable continuity and a historical perspective through a period of change. As Senior Independent Director, she plays an active role in succession planning, provides wise counsel to the Chairman and is available to meet with our investors.
William CampBill has extensive experience of the North American corn wet milling and global commodities business and a deep understanding of the US corn market. His long career in operational and management roles in a global manufacturer of food and feed ingredients provides great insights into corn wet milling operations and supply chain logistics. As Chairman of the Corporate Responsibility Committee, Bill also serves on the Remuneration Committee which further supports the coordination of the oversight role of both committees.
Paul FormanPaul has wide experience in global manufacturing, as well as strategy consultancy and M&A advisory services. He brings insight into the commercialisation of innovation pipelines and the implementation of business-to-business customer and market-led strategies in a large multi-national business-to-business context. His experience as a CEO of a global company also provides valuable insights as a member of our Audit and Remuneration Committees.
Dr Ajai PuriAjai’s food science background and career in research and development in global food and beverage companies provides the Board with detailed technical knowledge and insights into market perceptions, nutrition and food and regulatory trends relevant to the speciality food ingredients business. His experience of ASPAC is of particular benefit as we continue to focus on growth in emerging markets. His work with regulatory bodies and knowledge of food regulation provides him with the skillset required to chair the Research Advisory Group and to support the Board and Tate & Lyle Group with valuable insights into how leading-edge science and technology can be successfully deployed as part of the Group’s Speciality Food Ingredients portfolio.
independence has been considered by both the Nominations Committee and the Board (Ms Airey having excused herself from all discussions on the matter).
Having considered Ms Airey’s performance and independent focus on Board and committee issues, the Nominations Committee and the Board unanimously consider that Ms Airey continues to demonstrate strongly the attributes of an independent non-executive director, as reflected in her contribution to constructive challenge and debate at meetings, and there is no evidence whatsoever that the length of her tenure has impacted on her independence. The Nominations Committee and the Board are of the view that Ms Airey’s knowledge of the Group and the continuity this provides following a year of several Board changes will continue to be of considerable benefit to the Board and its committees. As set out on page 59, Ms Airey, as Senior Independent Director, is also leading the process to identify a successor for the Chairman.
The Board is accordingly recommending that Ms Airey be re-elected as an independent director at the 2016 AGM.
Governance | Corporate Governance
49 Tate & Lyle PLC Annual Report 2016
Strategic ReportG
overnanceFinancial Statem
entsU
seful Information
Key action Progress
Enhancing the Board’s knowledge and understanding of the engagement practices of the Company’s major shareholders
As part of this, the Board participated in a dedicated information session, led by the Company’s advisers, on the operations and engagement practices of the Company’s major investors and the role of proxy advisers
Extending the Group’s communication policy document on shareholder engagement
Our internal Investor Relations guidelines were extended to include remuneration consultations
Increased involvement of the Company’s external advisers
The remit of the Remuneration Committee’s external advisers has been reinforced and formally extended; with greater involvement by our brokers and Investor Relations advisers
Committee composition and governance
Lars Frederiksen, who has extensive remuneration and investor experience, joined the Remuneration Committee, and Sybella Stanley, who has extensive investor relations experience, joined the Audit Committee on their appointment to the Board
Board and committee evaluationThe Code provides that the review of Board effectiveness should be facilitated by an independent party at least once every three years. The diagram below sets out the Board’s approach to this process:
The Directors discussed Mr Edis-Bates’s findings and recommendations, which principally focused on the Company’s shareholder engagement practices and then set up a working party to develop a plan to address his recommendations.
The major priority areas that are being actioned are as follows:
2015 Board effectiveness reviewThis review was led by Liz Airey, the Senior Independent Director, and identified a number of individual and collective actions which are set out below:
• Improving the robustness of our investor communications and processes
The Board approved an enhanced disclosure framework that is now in place for investor communications.
• Improving the way information is presented to the Board and ensuring issues are fully surfaced in Board presentations
Work continues to be undertaken to enhance papers submitted to the Board. All major papers are sponsored by a Director who is responsible for obtaining input into the scope of the paper to ensure issues are identified and addressed in the paper.
• Applying additional disciplines to operational or strategic proposals that are submitted to the Board
Proposals that are submitted to the Board are subject to a detailed review process, which includes input from independent experts where appropriate.
• Driving forward succession planning and talent development The Nominations Committee undertook a review of the
succession planning and talent development processes and continues to keep this as a key area of focus.
Independent review following 2015 Annual General MeetingFollowing the July 2015 AGM where the Directors’ Remuneration Report was passed with 58.77% votes cast in favour, we commissioned an independent review to better understand the reasons for this outcome. This was led by Jon Edis-Bates who runs an independent corporate governance consultancy. He reviewed a range of key documents, met with a number of investors, advisers and a number of Tate & Lyle directors and senior executives and produced a detailed report for the full Board.
2016 Board effectiveness reviewThis year, the Chairman worked with the Company Secretary to develop a questionnaire which was designed to build on actions that had already been identified to improve Board effectiveness, including those actions agreed following Mr Edis-Bates’s review. The output from this questionnaire was then summarised in a report that was discussed by the Board. The Directors concluded that they are satisfied that the Board and its Committees continued to operate effectively and a number of action points were agreed, including the following:
• Carve out more opportunities for Directors to discuss broad strategic/industry issues
We have changed the focus for Board dinners held when the Board is in London; these will generally be private sessions for Directors to explore broader longer-term issues.
• Diversity of thinking styles Following the 2015 session on leveraging the diverse nature
of Directors’ thinking styles, we will set up an additional session to ensure continued focus on this area.
• Innovation pipeline Additional detail will be provided to the Directors for each
scheduled meeting setting out the progress of projects within the innovation pipeline.
Review of the committeesIn addition to the Board effectiveness review, the chairman of each of the Committees facilitated a review of his or her own committee’s effectiveness. These reviews confirmed that all committees continue to provide effective support to the Board. Areas for further focus are noted in the individual committee reports.
Corporate Governance continued
Year 2 (year ended 31 March 2015)Internally-facilitated review undertaken by the Senior Independent Director
Year 1 (year ended 31 March 2014)Externally-facilitated review undertaken by independent third party
Year 3 (year ended 31 March 2016)Internally-facilitated review undertaken by the Chairman
BOARD AND COMMITTEE REVIEW CYCLE
Governance
50 Tate & Lyle PLC Annual Report 2016
Review of individual directors Liz Airey led the review of the Chairman’s performance again this year. As part of this process, she sought the individual views of each of the executive and non-executive directors, led a meeting of the non-executive directors to discuss the feedback and then provided feedback to the Chairman.
The Chairman led performance reviews of the non-executive directors and the performance of the Chief Executive and Chief Financial Officer was considered by the Nominations Committee, in line with its terms of reference. These reviews confirmed that each director continues to make an effective contribution to the Board’s work and is well-prepared and informed about issues they needed to consider. In each case, their commitment remains strong.
Professional development and independent site visit programmeDirectors receive ongoing training and updates on relevant issues as appropriate, taking into account their individual qualifications and experience. The Company Secretary helps directors undertake any other professional development they consider necessary to assist them in carrying out their duties. In November 2015, Directors participated in an education session on cyber risk, facilitated by an independent adviser. This provided Directors with insights into market and leading-edge practices. Visits to external events are also arranged to help non-executive directors in particular to gain a deeper insight into the Group’s operating environment. During the year, in addition to the Board’s visits to the Commercial and Food Innovation Centre in Chicago, USA, and the manufacturing facility in Loudon, Tennessee, the Chairman and the non-executive directors visited three of the Group’s sites in Europe and the US as part of their independent site visit programme. These visits provide directors with the opportunity to interact with local management and gain in-depth knowledge about the challenges being faced by the Group’s operations across the world. Over the past three years, the Chairman and non-executive directors have visited 20 of the Group’s principal locations as part of this programme.
Advice and supportAll directors have access to the advice and services of the Company Secretary, Lucie Gilbert, who is responsible for ensuring that Board processes are followed and that applicable rules and regulations are complied with.
There is also a formal procedure whereby directors can obtain independent professional advice, if necessary, at the Company’s expense.
Directors’ conflicts of interestDirectors have a statutory duty to avoid situations in which they may have interests that conflict with those of the Company, unless that conflict is first authorised by the Board. As permitted under the Companies Act 2006, the Company’s Articles of Association allow directors to authorise conflicts of interest and the Board has an established policy and set of procedures for managing and, where appropriate, authorising, actual or potential conflicts of interest.
The key elements of those procedures are as follows:
• Directors are required to disclose proposed new appointments to the Chairman before taking them on, to ensure that any potential conflicts of interest can be identified and addressed appropriately, for instance through the agreement and implementation of guidelines and protective measures regarding the ongoing management of any situational conflict
• Directors are required to declare other situations which could result in a potential conflict of interest
• Any potential conflicts of interest in relation to proposed directors are considered by the Board prior to their appointment
• The Board reviews directors’ actual or potential conflicts of interest at least annually.
During the year, potential conflicts were considered and assessed by the Board and approved, together with guidelines and protective measures as appropriate.
Directors’ indemnities and insurance coverAs at the date of this Annual Report, indemnities are in force under which the Company has agreed to indemnify the directors, to the extent permitted by the Companies Act 2006, against claims from third parties in respect of certain liabilities arising out of, or in connection with, the execution of their powers, duties and responsibilities as directors of the Company or any of its subsidiaries. The directors are also indemnified against the cost of defending a criminal prosecution or a claim by the Company, its subsidiaries or a regulator, provided that where the defence is unsuccessful the director must repay those defence costs. These indemnities are qualifying indemnity provisions for the purposes of Sections 232 to 234 of the Companies Act 2006 and copies are available for inspection at the registered office of the Company during business hours on any weekday except UK public holidays. Equivalent indemnities remain in force for Virginia Kamsky who ceased to be a director on 1 July 2015.
The Company also maintains directors’ and officers’ liability insurance cover, the level of which is reviewed annually.
Governance | Corporate Governance
51 Tate & Lyle PLC Annual Report 2016
Strategic ReportG
overnanceFinancial Statem
entsU
seful Information

Values and behaviours
Financial controls Compliance controls
Operational controls Risk management process
Responses to questionnaires reviewed by Global Director of Ethics and internal audit function
Output discussed by Audit Committee in March and May
Output discussed by Corporate Responsibility Committee in
March and May
Follow-up work undertaken by the Global Director of Ethics and internal audit function, as appropriate
2016 review of the effectiveness of the system of internal controlThe effectiveness of the Group’s systems of internal control and risk management is monitored throughout the year. Once a year, the Board, with the assistance of the Audit and Corporate Responsibility Committees, conducts its own review of the effectiveness of the systems of risk management and internal control. In 2016, this review was once again facilitated by Group Audit and Assurance and covered the period from the start of the financial year to the date of this Annual Report. The process included a two-stage review to facilitate discussion, with the Audit and Corporate Responsibility Committees discussing the results of the review at their meetings in March and May 2016. The Board then discussed the output at its meeting in May 2016.
ACCOUNTABILITY
The Board is responsible for determining the nature and extent of the principal risks we are willing to take in achieving the Group’s strategic objectives and for maintaining sound risk management and internal control systems.
Risk management and internal controlThe Board has overall responsibility for the Group’s system of internal control and risk management and for reviewing its effectiveness. A formal process is in place which aims to identify and evaluate risks and how they are managed, further details of which are set out on page 31.
The objective of our internal control system is to protect the Group’s assets and reputation and to ensure the reliability of financial information for both internal use and external publication. The Group’s system of internal control and risk management can, however, only seek to identify and manage, rather than eliminate, the risk of failure to achieve business objectives, and can only provide reasonable, not absolute, assurance against material misstatement or loss.
An overview of our internal control system is set out below and key responsibilities are set out on page 53.
Tone from the top and business environment controls• The Values framework (see page 34) • The Group policies framework • Business performance management
processes, covering planning, budgeting and performance
• Schedule of matters reserved to the Board and terms of reference for Board Committees
• A clear organisational structure with responsibility and accountability clearly defined and limits of authority
• Segregation of duties
System of internal
control
Monitoring controls• Controls monitoring by dedicated teams
covering, for instance, finance, safety, product quality, intellectual property and cyber security
• Framework of reviews by appropriately qualified people
Information and communication controls• Board and Executive Committee
reporting framework• Communication protocols for
external communications• Whistleblowing process
Risk assessment• Risk assessments are undertaken as
part of ‘business as usual’ as well as through a more formalised Enterprise Risk Management process
Our system of internal control can be grouped into four broad areas:
KEY FEATURES OF THE INTERNAL CONTROL SYSTEM
Corporate Governance continued
Governance
52 Tate & Lyle PLC Annual Report 2016
action plans to deliver them, were identified. Delivery of these enhancements is being monitored by the Audit Committee or Corporate Responsibility Committee as appropriate.
The Board considers that no areas identified for enhancement constituted a significant weakness.
The 2016 review covered financial, operational and compliance controls, Values and behaviours, and the risk management process, and included questionnaires and representation letters completed by management. Group Audit and Assurance monitored and selectively checked the results of the review, ensuring that the responses from management were consistent with the results of its work during the year. As part of this process, areas for enhancements to internal controls, and associated
Financial reporting internal controls systemThis system covers the financial reporting process and the Group’s process for preparing consolidated accounts, and includes policies and procedures which provide for:
• The maintenance of records that, in reasonable detail, accurately and fairly reflect transactions including the acquisition and disposal of assets
• Reasonable assurance that transactions are recorded as necessary to permit preparation of financial statements in accordance with International Financial Reporting Standards
• Reasonable assurance regarding the prevention or timely detection of unauthorised use of the Group’s assets.
In addition, specific disclosure controls and procedures are in place to support the approval of the Group’s financial statements. Twice a year, representatives from the business units certify that they have complied with the minimum control standards and that their reported information provides a true and fair view of the state of the financial affairs of their division and its results for the period. The results of this financial disclosure process are reported to the Audit Committee.
Body Responsibilities
The Board • Determines the level of risk that it is prepared to accept in the business (risk appetite) • Agrees the Group’s Principal risks for disclosure in the Annual Report• Oversees the strategies for managing significant risks
Audit and Corporate Responsibility Committees
• Review aspects of the risk management and internal control systems and report to the Board• Discuss regular reports from the VP, Group Audit and Assurance (internal audit)• Undertake a formal review of the effectiveness of the internal control and risk management systems
and report to the Board on the output of that review at least once a year
Executive management • Works within the risk appetite and develops the mechanisms and processes to direct the organisation, through setting the tone and expectations from the top, delegating authority and monitoring compliance
Line management • Manages risk and ensures that mitigation is operated across the business which is appropriate and in accordance with the accountability framework
• Has primary responsibility for compliance with Group policies, Values and compliance requirements• Within certain functions, notably safety and product quality, separate assurance teams oversee the
effective operation of controls
Employees • Manage risks within their predefined accountabilities• Undertake tailored, mandatory training covering, for example, safety, cyber security, competition law
and anti-bribery and corruption to increase their awareness of risks
Risk management function • Works with executive and line management to help identify, measure, mitigate, monitor and report significant risks
Risk management committees
• Review certain risks and controls and monitor initiatives to strengthen controls• Comprise senior management and functional specialists• Examples include the Cyber Security Steering Committee which considers cyber security risks and the
Treasury Risk Committee which focuses on financial risks
Global Audit and Assurance (internal audit)
• Provides objective assessment of the appropriateness and effectiveness of the Group’s internal control systems to the Audit and Corporate Responsibility Committees, and to the Board
• Has the authority to review any relevant aspect of the business and a duty to report on any material weaknesses
• Develops and works to a risk-based internal audit plan which is approved by the Audit and Corporate Responsibility Committees and which is regularly updated
External specialists • Commissioned by the Board from time to time to supplement internal processes as appropriate
INTERNAL CONTROL SYSTEM
Governance | Corporate Governance
53 Tate & Lyle PLC Annual Report 2016
Strategic ReportG
overnanceFinancial Statem
entsU
seful Information

ENGAGEMENT WITH SHAREHOLDERS AND OTHERS
We are committed to maintaining an open dialogue with shareholders, debt investors and potential investors and recognise the importance of that relationship in the governance process.
We have a focused investor relations programme that aims to help existing and potential investors understand the Group. Feedback from the investment community is provided to all Directors on a regular basis to ensure they understand the views of major investors.
Institutional investorsThe Chief Executive, Chief Financial Officer and Group VP Investor and Media Relations maintain a regular programme of meetings with institutional shareholders in the UK, Europe and North America.
The Chairman held meetings with institutional shareholders during the year and the Senior Independent Director, Liz Airey, also met with a number of institutional shareholders. The Chairman, Liz Airey and Nick Hampton also met with the Investor Forum. Anne Minto, Chairman of the Remuneration Committee, met with governance representatives at a number of the Company’s principal investors to discuss remuneration issues and explain the proposed changes to the performance conditions attached to the Performance Share Plan (see page 74 for more information). All Directors were briefed on the content of these meetings.
AnalystsIn addition to presentations to investors and analysts on the day of the Group’s full-year and half-year results announcements, conference calls were hosted after each trading update and other major announcements to provide investors and analysts with the opportunity to ask questions. Any presentations, together with the associated announcements, are available on our website and we also make any audio recordings which are available for a short period after each event. The Chief Executive, Chief Financial Officer and Group VP, Investor and Media Relations also continued to meet regularly with analysts.
Independent feedback on our investor relations programmeEach year, an external investor relations adviser, Makinson Cowell, undertakes a comprehensive review of investor perceptions of the Group, management, strategy and communications. The output from this review was presented to the Board in November 2015 and actions taken forward by management. Recommendations included introducing divisional management to the investor community and providing more information on the commercialisation of new products and the new product pipeline.
Capital markets eventIn January 2016, we held a half-day event in London for institutional investors and analysts. The aim of this event was to provide greater exposure to our Speciality Food Ingredients growth model and our innovation capabilities, and access to the broader senior leadership team. Joan Braca (President, Speciality Food Ingredients), Gabriella Parisse (President, Innovation and Commercial Development) and members of their teams presented at the event.
Other capital providersWe value the contribution of our committed lending banks and bond holders and the Chief Financial Officer and Group Treasurer also met with this investor base and the ratings agencies (Standard & Poor’s and Moody’s) on a regular basis.
Private (retail) shareholdersPrivate shareholders are encouraged to provide feedback via the Company Secretary and we also include a questions card with the AGM documentation that is sent to shareholders so that those shareholders who are unable to attend the meeting have the opportunity to raise questions.
Annual General MeetingThe AGM provides all shareholders with the opportunity to question the Board on matters put to the meeting, including this Annual Report. Shareholders who attended last year’s AGM received a presentation from the Chief Executive on the Group’s activities and performance and also had the opportunity to sample some of our ingredients after the meeting.
The 2016 AGM will be held at The QEII Centre in London on Thursday 21 July 2016 at 11.00 am. Full details are set out in the Notice of Meeting. Resolutions are decided by means of a poll and the votes received in respect of each Resolution, together with the level of abstentions, are notified to the London Stock Exchange and published on our website. Shareholders can choose to receive shareholder documentation, including the Annual Report, electronically or in paper format, and may submit proxy votes and any questions either electronically or by post.
April 2015 • Trading update issued• Major business realignment announced
May 2015 • Full-year results issued• Investor meetings in the UK
June 2015 • Annual Report published• Investor roadshow meetings in the UK, Europe
and US• Investor conference in Paris
July 2015 • Chairman’s meeting with investors• Meetings with potential debt investors regarding
US private placement• Trading update issued• Annual General Meeting in London
October 2015
• Trading update issued
November 2015
• Half-year results issued• Investor roadshow meetings in the UK, US, France
and Canada
January 2016
• Capital Markets event in London
February 2016
• Trading update issued• Remuneration Committee Chairman consultation
programme
March 2016
• Investor meetings in Italy and Germany• Remuneration Committee Chairman
consultation programme
INVESTOR CALENDARSet out below is a summary of our major investor activity during the year
Corporate Governance continued
Governance
54 Tate & Lyle PLC Annual Report 2016
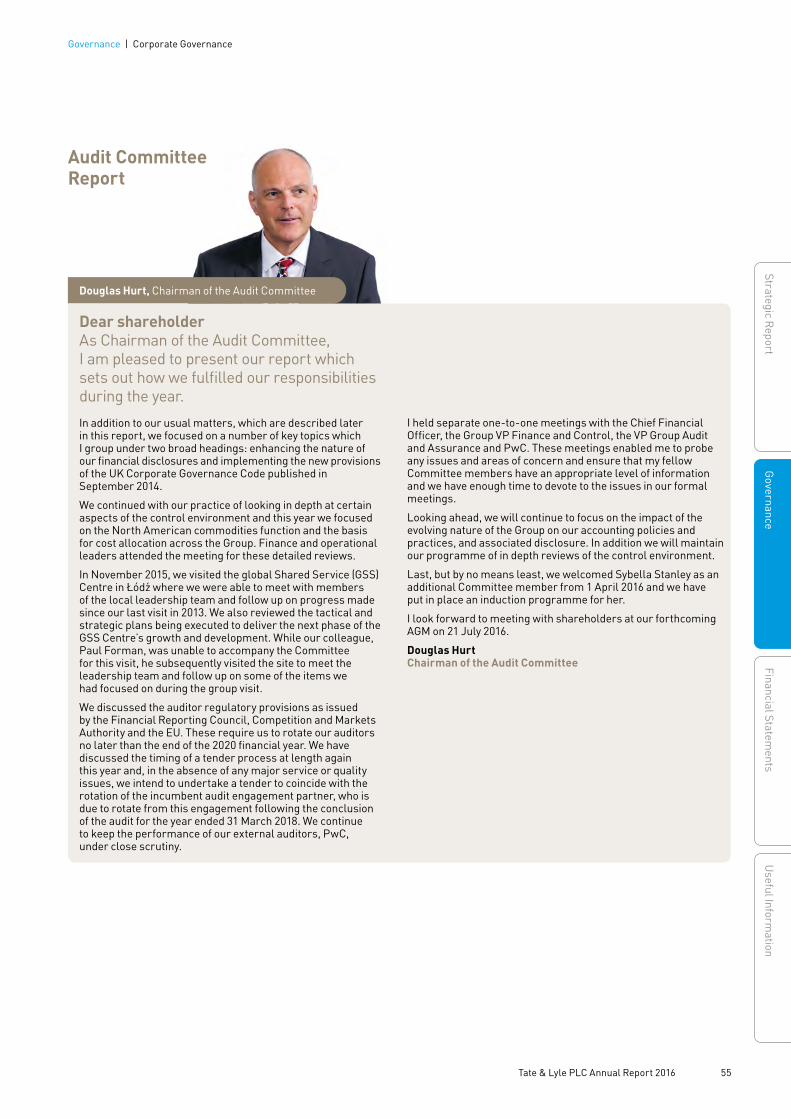
I held separate one-to-one meetings with the Chief Financial Officer, the Group VP Finance and Control, the VP Group Audit and Assurance and PwC. These meetings enabled me to probe any issues and areas of concern and ensure that my fellow Committee members have an appropriate level of information and we have enough time to devote to the issues in our formal meetings.
Looking ahead, we will continue to focus on the impact of the evolving nature of the Group on our accounting policies and practices, and associated disclosure. In addition we will maintain our programme of in depth reviews of the control environment.
Last, but by no means least, we welcomed Sybella Stanley as an additional Committee member from 1 April 2016 and we have put in place an induction programme for her.
I look forward to meeting with shareholders at our forthcoming AGM on 21 July 2016.
Douglas HurtChairman of the Audit Committee
Douglas Hurt, Chairman of the Audit Committee
Audit Committee Report
Dear shareholderAs Chairman of the Audit Committee, I am pleased to present our report which sets out how we fulfilled our responsibilities during the year.In addition to our usual matters, which are described later in this report, we focused on a number of key topics which I group under two broad headings: enhancing the nature of our financial disclosures and implementing the new provisions of the UK Corporate Governance Code published in September 2014.
We continued with our practice of looking in depth at certain aspects of the control environment and this year we focused on the North American commodities function and the basis for cost allocation across the Group. Finance and operational leaders attended the meeting for these detailed reviews.
In November 2015, we visited the global Shared Service (GSS) Centre in Łódz where we were able to meet with members of the local leadership team and follow up on progress made since our last visit in 2013. We also reviewed the tactical and strategic plans being executed to deliver the next phase of the GSS Centre’s growth and development. While our colleague, Paul Forman, was unable to accompany the Committee for this visit, he subsequently visited the site to meet the leadership team and follow up on some of the items we had focused on during the group visit.
We discussed the auditor regulatory provisions as issued by the Financial Reporting Council, Competition and Markets Authority and the EU. These require us to rotate our auditors no later than the end of the 2020 financial year. We have discussed the timing of a tender process at length again this year and, in the absence of any major service or quality issues, we intend to undertake a tender to coincide with the rotation of the incumbent audit engagement partner, who is due to rotate from this engagement following the conclusion of the audit for the year ended 31 March 2018. We continue to keep the performance of our external auditors, PwC, under close scrutiny.
Governance | Corporate Governance
55 Tate & Lyle PLC Annual Report 2016
Strategic ReportG
overnanceFinancial Statem
entsU
seful Information

This Audit Committee report is structured as follows:
1. Committee governance2. Work undertaken during the year, including in respect
of financial reporting; oversight of the external auditors; oversight of the internal audit function; and internal control and risk management.
1. Committee governanceResponsibilitiesThe Committee assists the Board by overseeing financial reporting, internal controls, the risk management process, the internal audit function (Group Audit and Assurance) and the relationship with the external auditors. Further details on its responsibilities are in the Committee’s terms of reference, on the Company’s website, www.tateandlyle.com.
CompositionDuring the financial year under review, the Committee comprised four independent directors. All the Committee members have extensive management experience in large international organisations and bring a wide range of financial and commercial experience from various industries. The Code stipulates that at least one Committee member should have recent and relevant financial experience. Two members meet this requirement: Douglas Hurt was Finance Director at IMI plc and is a member of the Institute of Chartered Accountants in England and Wales, and Liz Airey was an investment banker and former finance director of Monument Oil and Gas plc. The Company Secretary, Lucie Gilbert, is the secretary to the Committee.
Meetings during the yearMeetings are generally scheduled in line with key times in the Group’s financial reporting calendar. The Committee held six scheduled meetings during the year and also met on one additional occasion early in the financial year to review the impact of the decision to close the SPLENDA® Sucralose facility in Singapore. Attendance during the year was as follows:
Directors as at 31 March 2016
Date of appointment to the Committee
Number of meetings attended
Number of meetings
Douglas Hurt (Chr) 9 March 2010 7 7Liz Airey 1 January 2007 7 7Paul Forman 1 January 2015 7 7Anne Minto 1 December 2012 7 7
Sybella Stanley joined the Committee on 1 April 2016.
The Committee has also met once since the end of the financial year and prior to the signing of this Annual Report.
The Chief Financial Officer; VP Group Audit and Assurance; Group VP Finance and Control; Executive VP General Counsel; and representatives of the external auditors are normally invited and attend each meeting. The Chairman of the Board and Chief Executive are also invited to attend Committee meetings. In addition, senior finance and operational leaders attend and present to the Committee on an ad hoc basis, depending on the issues being discussed.
EffectivenessThe Committee Chairman and Company Secretary led a review of the Committee’s effectiveness and the output was discussed by the Committee. This concluded that the Committee continued to operate effectively and identified a number of areas for increased focus as part of the in-depth review programme during the 2017 financial year, including financial risk management and further aspects of our commodities operations.
2. Work undertaken during the yearThe Committee maintains a calendar of items for consideration at each meeting. This is regularly reviewed and updated. In addition to the activities outlined in the statement from the Committee Chairman, during the year and up to the date of this Annual Report, the work undertaken by the Committee fell under four main areas: financial reporting; oversight of the external auditors; oversight of the internal audit function; and internal control and risk management.
Financial reportingAt each of its meetings, the Audit Committee reviewed accounting papers prepared by management and determined, with the perspective of the external auditors, the appropriateness of key accounting policies, estimates and judgements. The significant issues considered by the Committee in relation to the financial statements for the year ended 31 March 2016 are listed on page 57.
The Committee also considered management’s review of reported and adjusted earnings, and satisfied itself that significant one-off items of income and expense had been correctly classified and that external disclosure of these items was appropriate.
In addition, the Committee reviewed management’s annual goodwill impairment assessment paper, considering future performance of the underlying businesses, including discussion of the discount rates used and forecast assumptions and sensitivities. The Committee was satisfied that no impairment charges were required. Papers on the Group’s existing and emerging litigation risks were also considered.
Corporate Governance continued
Governance
56 Tate & Lyle PLC Annual Report 2016

SIGNIFICANT ACCOUNTING AND GOVERNANCE ISSUES CONSIDERED BY THE COMMITTEE
Issue Background Committee’s activities and conclusions
Accounting for the re-alignment of the Eaststarch joint venture
The transaction to re-align the Eaststarch joint venture had complex accounting and reporting implications, including the allocation of the consideration between the disposed interests and the acquired interest, the valuation of acquired intangibles and the calculation of the gain on disposal.
The Committee discussed the basis for the Group’s accounting and reporting of the re-alignment and agreed that the disclosures were appropriate.
Reporting joint ventures in adjusted measures
In 2015 and prior, the Group reported its adjusted and segmental performance using proportional consolidation for its joint ventures. The completion of re-alignment of the Eaststarch joint venture was considered to be a trigger to adopt equity accounting for joint ventures in reporting adjusted and segmental performance.
To assist stakeholders ahead of the publication of the half-year results, the Committee reviewed and recommended the publication in October 2015 of comparative adjusted financial information on a continuing and discontinued basis, and equity accounting for joint ventures and associates for the six months ended 30 September 2014 and the year ended 31 March 2015.
Accounting for sucralose assets
Early in the financial year, the Board agreed to re-focus the SPLENDA® Sucralose business by taking a rigorous value-based approach to securing volume, and by materially lowering the manufacturing cost base of the business by consolidating all production into the McIntosh, Alabama facility and closing the facility in Singapore, which ceased production on 31 March 2016.
The Committee considered the carrying value of the Group’s SPLENDA® Sucralose assets and determined that the carrying value of the Singapore facility (totalling £113 million) should be written off as at 31 March 2015. The Committee further determined that, based on the analysis of the business and future cost base, no impairment was required in respect of the McIntosh assets. Finally, the Committee reviewed the £33 million of non-recurring costs arising from the closure of the Singapore plant and determined the treatment to be appropriate.
Commodity risk The Group uses commodity contracts to manage and hedge its corn and co-product positions in the US. The valuation of the corn book and the co-products produced as part of the corn wet milling process, which are both underpinned by a number of judgements, have a material impact on the reported results of the Group.
The Committee received regular updates on the key commodity risks and the risk management framework in place to mitigate these risks. This included a detailed review of the valuation methodology for meal contracts for which no external published values are available. In addition, the Committee considered the work performed by the external auditors before concluding that the judgements made in determining the valuation were appropriate. This will continue to be a key area of focus for the Committee going forward.
Viability statement
The Code provides that the directors should explain in the Annual Report how they have assessed the prospects of the Group, including the appropriateness of the period used in this assessment.
The Committee discussed preliminary work to determine an appropriate assessment period and the scenarios to stress-test the business model ahead of consideration of a full assessment by the Board. The Directors subsequently concluded that they have a reasonable expectation that the Group will be able to continue in operation and meet its liabilities as they fall due over the three-year period of their detailed assessment. See page 31 for further details.
Disclosure of financial information in the Annual Report
The Group has undertaken an exercise to refresh its external disclosures, including the content and presentation of financial statements in the Annual Report 2016.
The Committee considered the output of management’s review of the structure and content of the ‘Financial Statements’ section of the Annual Report and agreed, inter alia, the following enhancements:
• Increasing the prominence of areas of key judgement in the accounting policies section
• Simplifying the presentation and reducing technical jargon• Removing disclosures considered to be superfluous
or immaterial.
Taxation The Group operates and pays taxes in a number of jurisdictions, which requires the interpretation of complex tax laws in these jurisdictions. As such, provision for potential direct tax exposures with local tax authorities is made and reassessed as necessary at the half-year and year-end, underpinned by a range of judgements from tax professionals and external advisors.
The Committee reviewed the Group’s principles and processes for managing tax risks during the year and reviewed the key judgements made in estimating the Group’s tax charge along with the key disclosures, including a statement of tax principles, set out on page 27 and in Note 12. The Committee was satisfied that the judgements made in estimating the Group’s tax charge were reasonable, and that the disclosures were appropriate.
The key factors likely to impact the future tax charge as well as the key risks and uncertainties were considered and the Committee agreed the disclosure of these factors in this Annual Report.
Retirement obligations
The Group has significant retirement benefit obligations in the UK and the US, including unfunded retirement medical plans in the US, and a number of judgements have to be made when calculating the fair value of the Group’s legacy retirement obligations.
The Committee discussed the assumptions proposed by management (reflecting advice from the Group’s external actuary) which have driven a reduction in the pension and healthcare net liability (see Note 30) and considered reports from the external auditors before agreeing that the assumptions were reasonable.
Governance | Corporate Governance
57 Tate & Lyle PLC Annual Report 2016
Strategic ReportG
overnanceFinancial Statem
entsU
seful Information
the external audit process was operating effectively and that PwC continued to provide effective and independent challenge to management. The review identified a number of areas for process enhancements which were implemented and incorporated into the criteria set for the audit in respect of the year ended 31 March 2016. The Committee discussed progress against these criteria on a regular basis.
Tenure of the external auditorsThe Competition and Markets Authority’s order issued in October 2014 requires FTSE 350 companies to tender their statutory audit engagement at least every ten years. In addition to this, the EU regulations require that audit firms of all EU companies listed on a regulated market rotate off after 20 years.
Under the transitional provisions attached to the EU rules, the Group would be required to change auditors for the next audit appointment after 17 June 2020. As set out in the introduction from the Committee Chairman, the Committee discussed the timing of a tender on a regular basis during the financial year ended 31 March 2016. The current intention is that, in the absence of any major service or quality issues, a tender would be undertaken to coincide with the rotation of John Waters, the incumbent Audit engagement partner. This means that new auditors would be in place for the financial year ending 31 March 2019.
The Committee has recommended to the Board that PwC continues to act as auditors to the Group. PwC has indicated its willingness to continue in office; resolutions on the reappointment of PwC and authorising the Audit Committee on behalf of the Board to determine PwC’s remuneration will be proposed at the AGM.
Internal audit – Group Audit and Assurance Group Audit and Assurance is an internal review function that services the Board and all levels of management. It provides objective assurance to add value and improve the organisation’s operations. Its responsibilities include assessing the key risks of the organisation and examining, evaluating and reporting on the adequacy and effectiveness of the systems of risk management and internal control as operated by management. Management remains responsible for identifying risks and for the design and operation of controls to manage risk. The audit function was externally assessed by Independent Audit, a third party, between October and November 2013. During the year, the Committee reviewed the remit, organisation, annual plan, resources and effectiveness of Group Audit and Assurance and concluded that the function continued to operate effectively.
Internal control and risk management The Committee continued to receive and consider regular reports from management and the VP Group Audit and Assurance on the effectiveness of the Group’s risk management system. The reports from the latter included the findings from reviews of internal financial controls and actions to address any weaknesses in those controls. The Committee also reviewed the operation of the independent confidential reporting line. Throughout the year, the Committee focused in particular on the strengthening of the financial control environment and the impact of this on the financial reporting processes. It also reviewed controls to mitigate fraud risk and the Group assurance map, outlining the key risks and associated assurance processes. In addition, the Committee reviewed the output from the annual review of the effectiveness of internal financial reporting controls and then reported to the Board on that review. Further details about this review are on page 52.
External auditorsPwC (or its predecessor firms) have been the Company’s auditors since 1989. The lead audit partner is rotated on a five-yearly basis. The current lead audit partner, John Waters, has been in place since the audit for the year ended 31 March 2014. Accordingly, he is due to rotate off at the conclusion of the audit for the year ending 31 March 2018.
In accordance with the Competition and Markets Authority Order and the Committee’s terms of reference, the Committee Chairman, on behalf of the Committee, negotiated and agreed the fee and scope of the statutory audit for the year ended 31 March 2016.
Safeguarding the auditors’ independenceThe Committee operates a policy to safeguard the objectivity and independence of the external auditors. This policy sets out certain disclosure requirements by the external auditors to the Committee; restrictions on the employment of the external auditors’ former employees; and partner rotation.
During the year, the Committee reviewed the processes that the external auditors have in place to safeguard their independence, and received a letter from the external auditors confirming that, in their opinion, they remained independent.
Provision of non-audit servicesThe policy also sets out the circumstances in which the external auditors may be permitted to undertake non-audit services. The Chief Financial Officer and Chairman of the Committee have authority to approve the provision of certain services up to £100,000 or £250,000 respectively. The Committee must approve any proposed non-audit services that exceed those thresholds. Such proposals must be justified and, if appropriate, be subject to tender. In addition, the policy specifies the services which are not permitted under any circumstances, such as the provision of remuneration advice and internal audit outsourcing. During the year, a competitive tender process was led by the procurement function to identify a supplier to perform a business case and feasibility assessment for the implementation of a transportation management system in the US. As a result of this process, PwC was identified as the most appropriate supplier for this work. The Committee considered this proposal at length and accepted management’s recommendation. The fee for this work accounts for substantially all of the fees charged for non-audit services during the year.
The Committee reviews the policy on an annual basis and considers quarterly reports which set out the ongoing non-audit services provided by the auditors and the fees incurred.
A breakdown of the fees paid to the external auditors in respect of audit- and non-audit related work is included in Note 9. The total amount paid in respect of the Group audit, audit of subsidiaries and the half-year review was £2.0 million, and £0.2 million was paid in respect of non-audit-related services. Fees paid in respect of non-audit-related services therefore comprised 9% of the total fees paid to PwC.
Effectiveness of the external auditorsFollowing the conclusion of the audit for the year ended 31 March 2015, the Committee conducted an internal review of the effectiveness of the external auditors. As part of the process, the Committee reviewed the auditors’ performance against criteria set at the start of the audit, together with feedback from management at Group level and at divisional level. It also considered the most recent public report on the inspection of PwC, which was issued by the Financial Reporting Council (FRC) in May 2015, together with the output from the review undertaken by the FRC’s Audit Quality Review team. The Committee concluded that
Corporate Governance continued
Governance
58 Tate & Lyle PLC Annual Report 2016
Nominations Committee Report
Dear shareholderA key area of focus for the Nominations Committee during the year was building on the skills and experience of the Board as we progress the delivery of the Group’s strategy.Following Virginia Kamsky’s decision to step down to focus on the requirements of her increased executive responsibilities, we undertook a review of the current and future needs of the Board and its Committees, considering the balance of skills, experience, independence and knowledge on the Board and identified areas that we felt were essential or highly desirable in potential candidates, including a detailed understanding of the global food ingredients industry and also general commercial and financial experience. We recognised the considerable benefits of gender, age and cultural diversity and agreed that any new directors would need to fit with the culture of the Group and further supplement the range of thinking styles around the boardroom table. Once we had established our needs, we concluded that it would be necessary to search for two additional non-executive directors. Our process is set out in more detail in this report and Lars Frederiksen and Sybella Stanley were appointed as non-executive directors with effect from 1 April 2016.
We also reviewed the succession needs of the full Board. I have been Chairman since July 2009 and the Nominations Committee has commenced the process for identifying my successor. This search process is being led by the Senior Independent Director, Liz Airey, and the exact timing of the appointment of my successor will depend on identifying the appropriate candidate.
As part of the annual review process, we also considered the effectiveness of the Committee. It was noted that the new process changes we had identified last year were appropriate and that the Committee was operating effectively.
Sir Peter GershonChairman of the Nominations Committee
This Committee report is structured as follows:
1. Committee governance2. Work undertaken during the year
1. Committee governanceResponsibilitiesThe Committee assists the Board by reviewing the size and composition of the Board, including succession planning, and the leadership needs of the Group generally, recommending candidates for appointment as directors and as Company Secretary and reviewing annually the performance of each member of the Executive Committee. Further details on its responsibilities are in the Committee’s terms of reference, on the Company’s website, www.tateandlyle.com.
CompositionDuring the financial year under review, the Committee comprised the Chairman of the Company, the Chief Executive and all independent directors. The Company Secretary, Lucie Gilbert, is the secretary to the Committee.
Meetings during the yearMeetings are generally held around the time of scheduled Board meetings. The Committee held five scheduled meetings during the year and also met on one additional occasion to discuss the progress of the search for additional non-executive directors.
The Committee has also met once since the end of the financial year and prior to the signing of this Annual Report.
Attendance during the year was as follows:
Directors as at 31 March 2016
Date of appointment to the Committee
Number of meetings attended
Number of meetings
heldSir Peter Gershon (Chr) 1 February 2009 6 6Javed Ahmed 1 October 2009 6 6Liz Airey 1 January 2007 6 6William Camp 1 May 2010 6 6Douglas Hurt 9 March 2010 6 6Paul Forman 1 January 2015 6 6Anne Minto1 1 December 2012 5 6Dr Ajai Puri 1 April 2012 6 6Former Committee memberVirginia Kamsky2 1 December 2012 1 1
1 Unable to attend one meeting called at short notice due to an existing board commitment.
2 Ceased to be a director on 1 July 2015.
Lars Frederiksen and Sybella Stanley joined the Committee on 1 April 2016.
The Executive VP Human Resources and the VP Global Talent are invited to attend and present to the Committee on an ad hoc basis, depending on the issues being discussed.
EffectivenessThe Committee Chairman and Company Secretary led a review of the Committee’s effectiveness and the output was discussed by the Committee. This concluded that the Committee continued to operate effectively.
2. Work undertaken during the yearThe Committee maintains a calendar of items for consideration at each meeting. This is regularly reviewed and updated.
Board composition – appointments of Lars Frederiksen and Sybella StanleyThe introduction from the Committee Chairman set out the circumstances in which the Committee agreed to search for two additional non-executive directors during the year. The Committee retained Spencer Stuart to assist them with the search. Spencer Stuart is a signatory to the Voluntary Code of Conduct for Executive Search Firms and has a good understanding of the Group’s business as it has previously assisted in the identification of individuals to fill a non-executive director role and other senior executive roles.
Sir Peter Gershon, Chairman of the Nominations Committee
Governance | Corporate Governance
59 Tate & Lyle PLC Annual Report 2016
Strategic ReportG
overnanceFinancial Statem
entsU
seful Information
Dear shareholderThe Group has no higher priority than safety and we continued to review the Group’s safety performance at each meeting.We also focused significant time on the implementation of initiatives to improve safety performance. These are set out in the Corporate Responsibility section on pages 35 to 37.
One of the areas for in-depth review this year was our approach to assuring product quality and food safety. The newly-appointed VP Global Quality presented her priorities for enhancing the Group’s approach to product quality, and we reviewed the effectiveness of the Group’s quality assurance processes. This will remain a key area of focus for the Committee.
The Board has identified that the risk of breaches in our cyber security defences is a Principal risk and we have increased the amount of time we spend on oversight of management’s actions to protect the Group in this regard. In addition, an independent expert provided us with an overview of market and leading-edge practice during a separate education session for the Board.
I also continued to hold separate meetings with the President Global Operations, VP Safety, the VP Group Audit and Assurance, the Global Director of Ethics, and other senior operational leaders in advance of the Committee meetings. These meetings provide me with an invaluable opportunity to discuss any risk areas and help me to ensure that the Committee has the appropriate information to discharge its responsibilities effectively.
We also welcomed Lars Frederikson to the Committee on 1 April 2016. Lars has considerable experience of food ingredients operations and we are working on a tailored induction programme for him. Virginia Kamsky ceased to be a director and a member of the Committee on 1 July 2015. On behalf of the Committee, I would like to thank her for her contributions during her tenure.
Looking ahead, we will continue to focus on safety and food quality. We will also continue to devote significant time to cyber security.
William CampChairman of the Corporate Responsibility Committee
Corporate Responsibility Committee Report
William Camp, Chairman of the CR Committee
Corporate Governance continued
Spencer Stuart prepared a ‘long list’ comprising a diverse range of potential candidates meeting the specifications. The search consultants and the Chairman then identified a subset of this long list to meet face-to-face with the Chairman. Following these initial interviews, the Chairman recommended a shortlist of candidates and the Committee set up two working parties to interview the candidates.
The Committee subsequently discussed the results of these interviews and also reviewed the candidates’ anticipated ability to provide the necessary time commitment to Tate & Lyle. The Committee recommended that Lars Frederiksen and Sybella Stanley be appointed as additional non-executive directors. These recommendations, together with the proposed Committee memberships, were approved by the Board and they both joined the Board on 1 April 2016.
Director independenceThe Committee is responsible for making recommendations to the Board concerning the independence of non-executive directors. The Code provides that the Board should determine whether there are relationships or circumstances which are likely to affect, or could appear to affect, a director’s judgement and lists tenures in excess of nine years as a circumstance which may appear relevant to its determination. Liz Airey was appointed to the Board on 1 January 2007 and the Committee, excluding Ms Airey, considered the matter of her independence in light of the Code provision. The Committee concluded that Ms Airey continues to demonstrate the attributes of an independent non-executive director and there is no evidence whatsoever that the length of her tenure has impacted on her independence. Accordingly, the Committee recommended to the Board that it should continue to consider Ms Airey to be independent. This recommendation was unanimously agreed by the other members of the Board.
Board diversityThe Board believes that a diverse and inclusive culture is a driver of superior business performance, growth and innovation. The Board has a clear policy on diversity that acknowledges that the Board’s perspective and approach can be greatly enhanced through gender, age and cultural diversity, notwithstanding the overriding principle that each member, and potential member, of the Board must be able to demonstrate the skills, experience and knowledge required to contribute to the effectiveness of the Board. Wherever feasible, the Committee uses search firms who are signatories to the Voluntary Code of Conduct for Executive Search Firms which seeks to address gender diversity on boards and best practice for the related search processes.
As set out elsewhere in this report, when considering the candidates for the two non-executive directorships, the Committee looked at a number of different criteria, including gender, age and cultural diversity and personal attributes such as thinking style. This was reflected in the long lists and shortlists of possible candidates which included individuals from a wide pool, including those with little listed company board experience.
With regard to the specific issue of gender diversity, the Board welcomes the decision not to impose in the UK quotas regarding gender balance. As at the date of this report, the Board comprises the Chairman, two executive directors and eight non-executive directors. Female representation (three directors) equates to 27% of the Board.
Succession planningThe Committee reviewed succession plans for senior executive roles and the progress of action plans to address any gaps. The Committee continues to review progress on a regular basis.
Performance evaluationThe Committee undertook a performance evaluation of each member of the Executive Committee and reported its conclusions to the Remuneration Committee.
Governance
60 Tate & Lyle PLC Annual Report 2016
This Corporate Responsibility Committee report is structured as follows:
1. Committee governance2. Work undertaken during the year
1. Committee governanceResponsibilitiesThe Committee assists the Board by overseeing the Group’s approach to corporate responsibility, including the effectiveness of policies and procedures relating to a safe working environment, product quality, environmental performance, employee relations, equal opportunities, legal and ethical matters, and cyber security. Further details on its responsibilities are in the Committee’s terms of reference, on the Company’s website, www.tateandlyle.com.
CompositionFor the majority of the financial year under review, the Committee comprised four directors. Virginia Kamsky resigned from the Board and the Committee with effect from 1 July 2015. The Company Secretary, Lucie Gilbert, is the secretary to the Committee.
Meetings during the yearMeetings generally take place around the time of scheduled Board meetings. The Committee held four scheduled meetings during the year and attendance during the year was as follows:
Directors as at 31 March 2016
Date of appointment to the Committee
Number of meetings attended
Number of meetings eligible to
attendWilliam Camp (Chr) 1 July 2011 4 4Sir Peter Gershon 1 July 2011 4 4Douglas Hurt 1 March 2015 4 4Dr Ajai Puri 1 April 2012 4 4Former Committee memberVirginia Kamsky1 1 January 2014 1 1
1 Ceased to be a director on 1 July 2015.
Lars Frederiksen joined the Committee on 1 April 2016.
The Committee has also met once since the end of the financial year and prior to the signing of this Annual Report.
The Chief Executive and VP Group Audit and Assurance are normally invited and attend each meeting. In addition, senior finance and operational leaders attend and present to the Committee on an ad hoc basis, depending on the issues being discussed.
EffectivenessThe Committee Chairman and Company Secretary led a review of the Committee’s effectiveness and the output was discussed by the Committee. This concluded that the Committee continued to operate effectively and identified a number of areas for increased focus during the forthcoming financial year.
2. Work undertaken during the yearThe Committee maintains a calendar of items for consideration at each meeting. This is regularly reviewed and updated. In addition to the activities outlined in the statement from the Committee Chairman, during the year and up to the date of this Annual Report, the work undertaken by the Committee fell under the following main areas: safety; protecting the Group’s assets; diversity and inclusion; business practices; environment; community, and internal control and risk management.
SafetyAt each of its meetings, the Committee discussed an update from the VP Safety covering matters such as the development and implementation of initiatives to refresh the Group’s approach to personal safety. In addition, the newly appointed VP Global Quality presented her priorities for enhancing the Group’s approach to product quality, and the Committee reviewed the effectiveness of the Group’s quality assurance processes.
Protecting the Group’s assetsThe Committee is responsible for overseeing the policies and processes in place to safeguard the Group’s physical assets and intellectual property. Following the Committee’s detailed review of the Group’s approach to managing intellectual property, as set out in last year’s report, it continued to monitor the Group’s ongoing initiatives in this regard. As reported in the statement from the Committee Chairman, the Group’s efforts to tackle cyber security were reviewed more frequently and the Committee also participated in a cyber security training session which was facilitated by an independent third party.
Diversity and inclusionThe Committee received an update on the actions taken to embed the Group’s diversity and inclusion initiatives, and the priorities of management for the next 12 months.
Business practices The Global Director of Ethics provided updates to the Committee on the progress of the ethics programme. In addition the Committee considered the effectiveness of the independent confidential reporting line. The Committee also discussed the Modern Slavery Act and in particular the requirements to publish a statement on the Company’s website. The draft statement was considered by the Committee and subsequently approved by the Board.
EnvironmentThe VP Sustainability provided the Committee with updates on the Group’s environmental performance and initiatives on a regular basis.
CommunityThe Committee discussed the delivery of the annual charitable and community involvement programme and the proposed programme for the year ending 31 March 2017.
Internal control and risk managementThe Committee received regular reports from management and the VP Group Audit and Assurance in respect of the policies, systems and controls in place in respect of the risks falling within the Committee’s remit. The Committee reviewed the output from the annual review of the effectiveness of controls falling within its terms of reference and then reported to the Board on this review.
Governance | Corporate Governance
61 Tate & Lyle PLC Annual Report 2016
Strategic ReportG
overnanceFinancial Statem
entsU
seful Information

Anne Minto, Chairman of the Remuneration Committee
Dear shareholderAs Chairman of the Remuneration Committee, I am pleased to present our Remuneration Report for the financial year ended 31 March 2016. This introduction provides context for the Committee’s decision-making during the year, and summarises key points from the Report, including those relating to performance and incentive plan outcomes, and Committee activities.
Business performance contextWe made good progress this year with solid financial performance and strong project delivery. We generated improved earnings, despite some very challenging market conditions; and successfully executed the major structural change initiatives needed to strengthen the business and increase our focus on Speciality Food Ingredients (SFI).
Incentive outcomes reflect short- and long-term performance and resulted in total executive remuneration less than 80% of target levels, which the Committee considers to be consistent with the underlying financial health and performance of the business.
Some of the key financial highlights include:
• Group adjusted profit before tax increased by 5% • SFI adjusted operating profit increased by 10%• New Products sales increased by 34% in constant currency
Overview of our remuneration frameworkComponent of remuneration
Key features
Base salary and employment benefits
Market competitive elements to attract the right calibre of executives (including health cover, car and defined contribution retirement benefits)
Annual bonus Group financial performance:• Profit• Sales • Cash flow
Rewards achievement against annual performance objectives:• Max cash bonus is 100% of salary• Max opportunity is 175% of salary
(Any award over 100% is paid in shares, deferred for two years)
• CFO target: 50% of salary• CEO target: 75% of salary
Performance Share Plan: • EPS (50%)• ROCE (50%)
Supports the Group’s strategic aims to create shareholder value from efficient profitable growth and to motivate and retain senior talent: • Max award is 300% of salary• 15% vesting at ‘threshold’
Shareholding requirements
Chief Executive – 4x salary Chief Financial Officer – 3x salary
Claw back and malus provisions
Apply for two years after the determination of a bonus or vesting of PSP awards
Safety and broader corporate responsibility matters are specifically factored into the Committee‘s decisions on pay and annual incentive plan outcomes.
Performance highlights and incentive outcomes1
Annual bonus Target Actual Achieved(% of target)Metric
Group adjusted profit before tax (PBTEA)
£200.1m £209.6m +£9.5m (+4.7%)
Net sales less cost of raw materials
£1 352.9m £1 326.2m -£26.7m (-2.0%)
Operating cash flow £63.2m £86.0m +£22.8m (+36.1%)
• Bonus award to Chief Executive: 77% of maximum• Bonus award to Chief Financial Officer: 77% of maximum
See page 72 for more detail.
Performance Share Plan (2013 Award)
Targets (threshold-stretch)
Actual (2013-2016)
EPS (50%) 6% – 15% compound annual growth over three years
-10.5% (below threshold)
ROCE (50%) 12.6% – 15.6% at the end of the performance period
12.8% (above threshold)
• 10.9% of the award made in 2013 will vest, based on the combination of EPS and ROCE performance
See page 73 for more detail.
1 Targets for these awards were established and performance is assessed under proportionate consolidation of joint ventures, adjusted to reflect the impact of the disposal of joint-venture business during the period to enable a like-for-like assessment of performance. Annual Bonus targets are at budgeted exchange rates. Annual Bonus targets for the financial year ending 31 March 2017, and Performance Share Plan targets for awards made in 2016 have been established under equity accounting for joint ventures, consistent with the changes to our financial reporting made during the year.
2016 REMUNERATION REPORT AT A GLANCE
62 Tate & Lyle PLC Annual Report 2016
Governance
Directors’ Remuneration Report
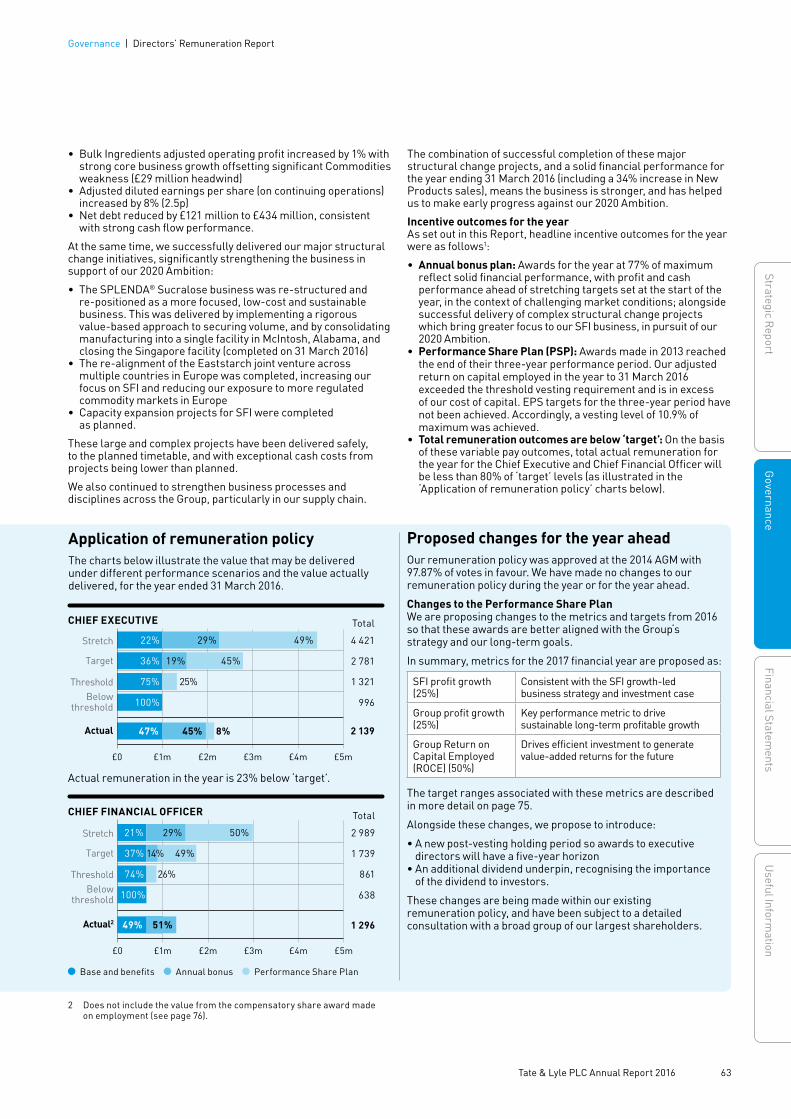
• Bulk Ingredients adjusted operating profit increased by 1% with strong core business growth offsetting significant Commodities weakness (£29 million headwind)
• Adjusted diluted earnings per share (on continuing operations) increased by 8% (2.5p)
• Net debt reduced by £121 million to £434 million, consistent with strong cash flow performance.
At the same time, we successfully delivered our major structural change initiatives, significantly strengthening the business in support of our 2020 Ambition:
• The SPLENDA® Sucralose business was re-structured and re-positioned as a more focused, low-cost and sustainable business. This was delivered by implementing a rigorous value-based approach to securing volume, and by consolidating manufacturing into a single facility in McIntosh, Alabama, and closing the Singapore facility (completed on 31 March 2016)
• The re-alignment of the Eaststarch joint venture across multiple countries in Europe was completed, increasing our focus on SFI and reducing our exposure to more regulated commodity markets in Europe
• Capacity expansion projects for SFI were completed as planned.
These large and complex projects have been delivered safely, to the planned timetable, and with exceptional cash costs from projects being lower than planned.
We also continued to strengthen business processes and disciplines across the Group, particularly in our supply chain.
The combination of successful completion of these major structural change projects, and a solid financial performance for the year ending 31 March 2016 (including a 34% increase in New Products sales), means the business is stronger, and has helped us to make early progress against our 2020 Ambition.
Incentive outcomes for the yearAs set out in this Report, headline incentive outcomes for the year were as follows1:
• Annual bonus plan: Awards for the year at 77% of maximum reflect solid financial performance, with profit and cash performance ahead of stretching targets set at the start of the year, in the context of challenging market conditions; alongside successful delivery of complex structural change projects which bring greater focus to our SFI business, in pursuit of our 2020 Ambition.
• Performance Share Plan (PSP): Awards made in 2013 reached the end of their three-year performance period. Our adjusted return on capital employed in the year to 31 March 2016 exceeded the threshold vesting requirement and is in excess of our cost of capital. EPS targets for the three-year period have not been achieved. Accordingly, a vesting level of 10.9% of maximum was achieved.
• Total remuneration outcomes are below ‘target’: On the basis of these variable pay outcomes, total actual remuneration for the year for the Chief Executive and Chief Financial Officer will be less than 80% of ‘target’ levels (as illustrated in the ‘Application of remuneration policy’ charts below).
Proposed changes for the year aheadOur remuneration policy was approved at the 2014 AGM with 97.87% of votes in favour. We have made no changes to our remuneration policy during the year or for the year ahead.
Changes to the Performance Share Plan We are proposing changes to the metrics and targets from 2016 so that these awards are better aligned with the Group‘s strategy and our long-term goals.
In summary, metrics for the 2017 financial year are proposed as:
SFI profit growth (25%)
Consistent with the SFI growth-led business strategy and investment case
Group profit growth (25%)
Key performance metric to drive sustainable long-term profitable growth
Group Return on Capital Employed (ROCE) (50%)
Drives efficient investment to generate value-added returns for the future
The target ranges associated with these metrics are described in more detail on page 75.
Alongside these changes, we propose to introduce:
• A new post-vesting holding period so awards to executive directors will have a five-year horizon
• An additional dividend underpin, recognising the importance of the dividend to investors.
These changes are being made within our existing remuneration policy, and have been subject to a detailed consultation with a broad group of our largest shareholders.
2 Does not include the value from the compensatory share award made on employment (see page 76).
Application of remuneration policyThe charts below illustrate the value that may be delivered under different performance scenarios and the value actually delivered, for the year ended 31 March 2016.
CHIEF EXECUTIVE
£1m £2m £3m £4m £5m
Belowthreshold
Threshold
Target
Stretch
£0
22% 29%
45%
49%
8%
4 421
Total
2 781
1 321
996
2 139
36% 19% 45%
75% 25%
100%
Actual 47%
Actual remuneration in the year is 23% below ‘target’.
CHIEF FINANCIAL OFFICER
£1m £2m £3m £4m £5m
Belowthreshold
Threshold
Target
Actual2
Stretch
£0
21% 29% 50%
49% 51%
2 989
Total
1 739
861
638
1 296
37% 14% 49%
74% 26%
100%
Base and benefits Annual bonus Performance Share Plan
63 Tate & Lyle PLC Annual Report 2016
Governance | Directors’ Remuneration Report
Strategic ReportG
overnanceFinancial Statem
entsU
seful Information
Key Committee activities during the yearIn addition to the responsibilities of the Committee (which are described in summary on page 69), the Committee spent significant time on the following key matters during the year:
• Reviewing the effectiveness of remuneration arrangements: Continuing the work referenced in my introductory statement last year, the Committee reviewed the effectiveness of current remuneration arrangements.
• Review of the Annual Bonus Plan: We made changes to ensure stronger links between our annual planning process and the establishment of bonus targets; and adopted a simpler operating cash flow metric that will have a greater impact on promoting effective cash management in the business.
• Review of the Performance Share Plan (PSP): We anticipated the need for a review of the PSP in the 2015 Annual Report, driven by a number of factors including the very significant changes in the business since 2010, when the current metrics were originally adopted. The proposals (discussed on pages 74 and 75) have been carefully developed and align with our strategic priorities to deliver long-term value by growing the total value of the Group, focusing on above market growth in our ‘higher value’ SFI business, and maintaining a strong balance sheet.
• Shareholder engagement activity following the 2015 AGM: The particular actions we have taken during the year are discussed below. As Chairman of the Committee I would like to thank our shareholders for both their engagement with us and their support during the year.
In January 2016, I led the annual review of the Committee’s effectiveness. The review concluded that the Committee appropriately fulfilled its role and carried out its duties against the responsibilities described in its terms of reference.
2015 AGMThe resolution to approve the Directors’ Remuneration Report received majority support at the 2015 AGM, but at lower than historical levels. We commissioned an independent review to better understand the reasons for this outcome, and the review identified a number of recommendations and actions which have now been implemented. Further information is provided in the Board Effectiveness review on page 50.
Shareholder consultation regarding 2016 PSP awardsIn keeping with our existing shareholder-approved remuneration policy, we are proposing changes to metrics for our PSP programme for 2016, so that these awards are better aligned with strategy and priorities in the business, and our longer term outlook set out in the 2020 Ambition (described on page 8).
In summary, we propose to:
• Retain the existing ROCE metric to incentivise efficient investment for the future
• Replace the current EPS metric with the combination of a Group profit metric to drive sustainable long-term profitable growth, and introduce an element directly related to SFI profit growth, in support of our strategy and 2020 Ambition that SFI generates c.70% of Group profit by 2020.
Alongside these changes we propose to introduce a new post-vesting holding period so awards to executive directors will have a five-year horizon; and awards will be subject to an additional dividend underpin, recognising the importance of the dividend to investors.
The Committee has considered these changes carefully and believes that they are necessary and appropriate, in the context of the changes in the business since the PSP was originally adopted, and the ambition we have for the business. We have consulted with a significant number of our largest shareholders in relation to these proposals, and are pleased to note that the proposals have met with high levels of stated support during that consultation process.
These specific proposals are described in more detail on pages 74 and 75.
Remuneration Report and implementation of policy for the year ahead Our remuneration policy was approved by shareholders at the 2014 AGM with 97.87% of votes in favour.
The Committee is satisfied that this policy provides for a strong alignment between Group performance and the remuneration of executive directors and, as stated in this Report, we intend to continue to operate within this approved remuneration policy, incorporating the changes to the PSP described above, during the financial year ending 31 March 2017.
Anne MintoChairman of the Remuneration Committee
About this Report This Report has been prepared in accordance with the requirements of the Companies Act 2006 (the Act) and Schedule 8 of the Large and Medium Sized Companies and Groups (Accounts and Reports) (Amendment) Regulations 2013 (the Regulations), the Listing Rules of the UK Listing Authority and the UK Corporate Governance Code. PricewaterhouseCoopers LLP have audited such content as required by the Act (the information on pages 72 to 79 marked as ‘(audited)’).
We have structured the rest of this Report as follows:
65 Context and overview of the remuneration policy
67 Key components of Directors’ remuneration
Annual Report on Remuneration:
69 The Remuneration Committee
70 Executive directors’ remuneration
71 Chairman’s and non-executive directors’ fees
71 Annual Bonus
73 Long-term incentive – Performance Share Plan (PSP)
76 Other audited disclosures
Directors’ Remuneration Report continued
64 Tate & Lyle PLC Annual Report 2016
Governance
Remuneration strategy and key principles The Group’s remuneration strategy, and supporting principles which apply consistently across employee, management and executive populations, is summarised in the table below.
Remuneration strategy Key principles
The Group’s remuneration strategy is to provide packages that enable the Group to recruit, retain and motivate high-calibre individuals in the markets in which we operate to deliver superior operational performance and outstanding financial results
• Base pay and benefits are referenced to the comparative local market, taking account of company size and operations
• For all employees, our pay for performance framework provides for meaningful differentiation in salary progression and opportunities for career progression, based on each individual’s contribution
• The total package opportunity should provide meaningful reward for superior performance and encourage the achievement of genuinely stretching short-term and long-term objectives
• Below executive level, key individuals who have a specific accountability for driving annual and longer-term performance may be selected to participate variously in our sales incentive plan, the annual bonus plan, and/or the Performance Share Plan
• Alignment with shareholders’ long-term interests is carefully preserved, for example, through: a significant proportion of pay being based on performance; effective governance around remuneration decisions; a considered approach to setting performance targets; the adoption of shareholding guidelines at senior executive levels; and malus and claw back provisions on incentive awards
• All aspects of remuneration are designed to encourage a focus on long-term, sustained performance and risk management
• Our approach is intended to be equitable and transparent and operate across the Group, recognising that we recruit talented individuals and operate in an international market
• Outcomes must be achieved in a way that is consistent with the Group’s Values and Code of Ethics, and that fosters sustainable, profitable growth
CONTEXT AND OVERVIEW OF THE REMUNERATION POLICY
Directors’ remuneration policyThe Directors’ Remuneration Policy Report was formally approved by shareholders at the AGM on 24 July 2014 (with 97.87% of votes cast to support the resolution) and it remains our intention that the policy will apply for a period of three years from the date of that AGM.
No changes have been made to the remuneration policy since it was approved by our shareholders at the 2014 AGM and we intend to operate within this policy during the financial year ending 31 March 2017. The policy is published on pages 53 to 63 of our Annual Report 2014, and also available on our website www.tateandlyle.com/annualreport2014.
The Committee retains discretion on specific aspects of policy and implementation, as described in the remuneration policy, along with an overriding discretion to determine bonus outcomes and judge the level at which share awards vest, to ensure that payments are consistent with the underlying financial health and performance of the business, within the maximum opportunity stated in the policy tables.
The Committee may make minor changes to the policy without seeking shareholder approval, for example, to benefit the administration arrangements, or to take account of changes in legislation. Any such changes would be disclosed in the relevant Annual Report.
65 Tate & Lyle PLC Annual Report 2016
Governance | Directors’ Remuneration Report
Strategic ReportG
overnanceFinancial Statem
entsU
seful Information

The charts below illustrate the international nature of our business – although we are UK-listed and headquartered in London, a very significant proportion of our people, our shareholders, and our customers are based outside the UK. Accordingly, it is important that our remuneration arrangements are appropriately competitive in that international context.
OUR SALES1 1
2
3
4OUR SHAREHOLDERS2 OUR EMPLOYEES
1 UK 1%2 US 69% 3 Other European
countries 9%4 Rest of world 21%
1 UK 55%2 US 22% 3 Other European
countries 19%4 Rest of world 4%
12
34
1 UK 5%2 US 48% 3 Other European
countries 27%4 Rest of world 20%
1
23
4
1 Sales by destination (from continuing operations) as per Note 5. 2 Analysis of shareholder register as at 30 March 2016.
A clear link between our strategy and directors’ remuneration The Group’s remuneration arrangements place a clear emphasis on driving Group performance, through incentives that are directly linked to key performance indicators (KPIs) which come from our business strategy. In this way, we maintain a keen focus on delivering long-term growth, thereby enhancing long-term value for shareholders.
The table below summarises the KPIs that we use to measure the Group’s success against our strategy. The right-hand column describes how these KPIs link directly to remuneration arrangements.
Key performance indicators Link to directors’ remuneration
Adjusted operating profit Underlying profit performance is a key determinant of awards under the Annual Bonus Plan
Adjusted diluted EPS growth Awards under the Performance Share Plan depend on this metric
Dividend per share The dividend has a direct impact through individual executive share ownership and dividend equivalents on deferred bonus awards
Net debt Objectives are reflected in incentive plan target setting, but this metric does not directly impact remuneration
Speciality Food Ingredients sales growth Informs the sales target in the Annual Bonus Plan that is set by the Committee each year
Return on capital employed Awards under the Performance Share Plan depend on this metric
Group operating cash flow This is a performance metric in the Annual Bonus Plan
Net debt to EBITDA and interest cover Objectives are reflected in Annual Bonus Plan targets, but this metric does not directly impact remuneration
Safety metrics Safety and broader corporate responsibility matters are specific factors that the Committee may factor into decisions on pay and annual incentive plan outcomes
14 Key Performance Indicators
Directors’ Remuneration Report continued
66 Tate & Lyle PLC Annual Report 2016
Governance
KEY COMPONENTS OF DIRECTORS’ REMUNERATION
As a Committee, we believe that our approach to remuneration provides a relatively simple but effective overall framework that is aligned with long-term success and returns to shareholders.
The executive directors’ remuneration consists of base salary, annual bonus, long-term incentives, and retirement and other benefits as described in the table below. Malus and claw back provisions apply to incentive awards following release, and a strong alignment with shareholders’ interests is maintained through significant personal shareholding requirements imposed on each director.
The shareholder-approved remuneration policy is published on pages 53 to 63 of our Annual Report 2014, which is available on our corporate website www.tateandlyle.com/annualreport2014.
The summary below highlights the key components of the remuneration framework for executive directors, their link to strategy, and how the remuneration policy has been implemented in 2015. It is not intended to act as a substitute for the approved policy referred to above.
Providing market competitive fixed remuneration to attract the right calibre of executive
Supporting near-term growth goals by rewarding strong annual financial performance
Supporting the Group’s strategy by incentivising sustained profit growth and capital efficiency over successive three-year performance periods, and retaining senior executive talent
Base salary and employment benefits
Each component has a clear purpose, and the variable elements are driven by KPIs which have a clear link to strategy
Annual bonusKey drivers:• Profit• Sales• Cash flow
Performance Share Plan:Key drivers:• EPS • ROCE
• Base salary decisions are referenced to the comparative local market taking account of company size and operations and personal performance. Increases are typically limited to the general increase for Group employees in the same local market
• Retirement benefits are provided by way of defined contribution, or equivalent cash arrangements.• Other benefits may include car (or allowance), health insurance and life cover
To focus on sustainable value creation over time and to strengthen long-term alignment of interests between senior executives and the Group’s shareholders
• Shareholding requirements
• Claw back/ malus
• Overriding factors
• Executive directors are subject to individual minimum share ownership requirements which must be retained for the duration of employment: Chief Executive (4x salary); Chief Financial Officer (3x salary)
• Share ownership requirements extend to Executive Committee members (at three times base salary), and to a broader group of executives in senior leadership roles (at a level equal to their base salary)
• Claw back and malus provisions apply for two years following bonus awards or the vesting of PSP awards • Safety and broader corporate responsibility matters are specific factors that the Committee may factor into
decisions on pay and annual incentive plan outcomes
71 For more
71 For more
73 For more
• Target bonus is 50% of salary for the CFO and 75% of salary for the CEO• Maximum cash bonus is 100% of salary. Maximum total bonus opportunity is 175% of salary, with any award
over 100% paid in shares, which are deferred for two years• Metrics relate to profitability, sales and cash flow. Profit performance is the most important of these
metrics: no bonus is payable if performance is below ‘threshold’, regardless of performance against other metrics; and profit performance has the greatest impact on overall bonus outcomes
Current awards• Metrics applicable to current awards were adopted in 2010 as they represent key determinants of
shareholder value creation: − 50% relates to EPS growth over the three-year performance period: the threshold requirement is 6% compound growth p.a. and full vesting of that element requires 15% compound growth p.a.
− 50% relates to the ROCE performance achieved in the final year of the performance period: with the technical adjustments described on page 73, the threshold requirement for ROCE performance is 12.6% and full vesting requires ROCE performance of 15.6%, both being in excess of our weighted average cost of capital
• The maximum award that may be made to executive directors is 300% of salary; if the threshold level of performance is achieved across both metrics, 15% of the award will vest
Changes for 2016• For 2016, changes to the metrics are proposed so that these awards are better aligned with the Group
strategy and our long-term goals (as described in detail on pages 74 and 75)• Alongside these changes for 2016, we propose to introduce:
− A new post-vesting holding period so awards to executive directors will have a five-year horizon − An additional dividend underpin, recognising the importance of the dividend to investors
These changes are being made within our existing remuneration policy, and have been subject to a detailed consultation with a broad group of our largest shareholders
REMUNERATION FRAMEWORK (SUMMARY)
67 Tate & Lyle PLC Annual Report 2016
Governance | Directors’ Remuneration Report
Strategic ReportG
overnanceFinancial Statem
entsU
seful Information

Service contractsThe Group’s policy regarding executive directors’ service contracts and appointment terms is to take account of market practice, and to ensure that provisions in relation to notice periods or termination payments are not excessive, as well as to ensure that contracts provide appropriate protection for the Group, for example, in relation to restrictions on competition, solicitation of customers or employees, and the protection of intellectual property.
Executive directors are employed under service contracts commencing on dates as follows: Javed Ahmed (Chief Executive) – 10 October 2009; Nick Hampton (Chief Financial Officer) – 1 September 2014. The contracts provide for six months’ notice from the executive and 12 months’ notice from the Group.
The Chairman and non-executive directors have letters of appointment and do not have service contracts or notice periods. Under the terms of their appointment, they are usually expected to serve on the Board for between three and nine years, subject to their re-election by shareholders. The Chairman and non-executive directors receive a fee for their services, and do not participate in the Group’s incentive or pension schemes, do not receive any other benefits, and have no right to compensation if their appointment is terminated.
Service contracts for executive directors and letters of appointment for the Chairman and non-executive directors are available for inspection at the Company’s registered office.
Executive directors’ external appointments The Board believes that the Group can benefit from executive directors holding external non-executive directorships. Such appointments are subject to approval by the Board and are normally restricted to one position for each executive director. Fees may be retained by the executive director concerned. No executive holds a disclosable appointment.
Consideration of shareholder views The remuneration strategy described here was established in 2010 following a review and extensive consultation with major shareholders. Shareholders approved the continuing use of the Performance Share Plan as our long-term incentive at the AGM in 2012, and formally approved the remuneration policy at the AGM in 2014.
The Committee (led by the Committee Chairman) engages with our major institutional shareholders each year specifically on remuneration topics, alongside the Board’s wider-ranging shareholder engagement programme.
An independent review was commissioned following the 2015 AGM, to ensure the Board and Remuneration Committee had a clear understanding of shareholders’ views.
The Committee also receives regular updates on investors’ views and corporate governance matters. These lines of communication ensure that emerging best practice principles are factored into the Committee’s decision making during the year.
Statement of consideration of employment conditions elsewhere in the GroupThe principles on which we base remuneration decisions for executives (as described on page 65) are broadly consistent with those on which we base remuneration decisions for all employees. In particular, the Committee takes into account the general pay and employment conditions of other employees of the Group when making decisions on executive directors’ remuneration. This includes considering the levels of base salary increase for employees below executive level, and ensuring that the same principles apply in setting performance targets for executives’ incentives as for other employees of the Group. The Committee also reviews information on bonus payments and share awards made to the broader management of the Group when determining awards and outcomes at executive director level.
Directors’ Remuneration Report continued
68 Tate & Lyle PLC Annual Report 2016
Governance
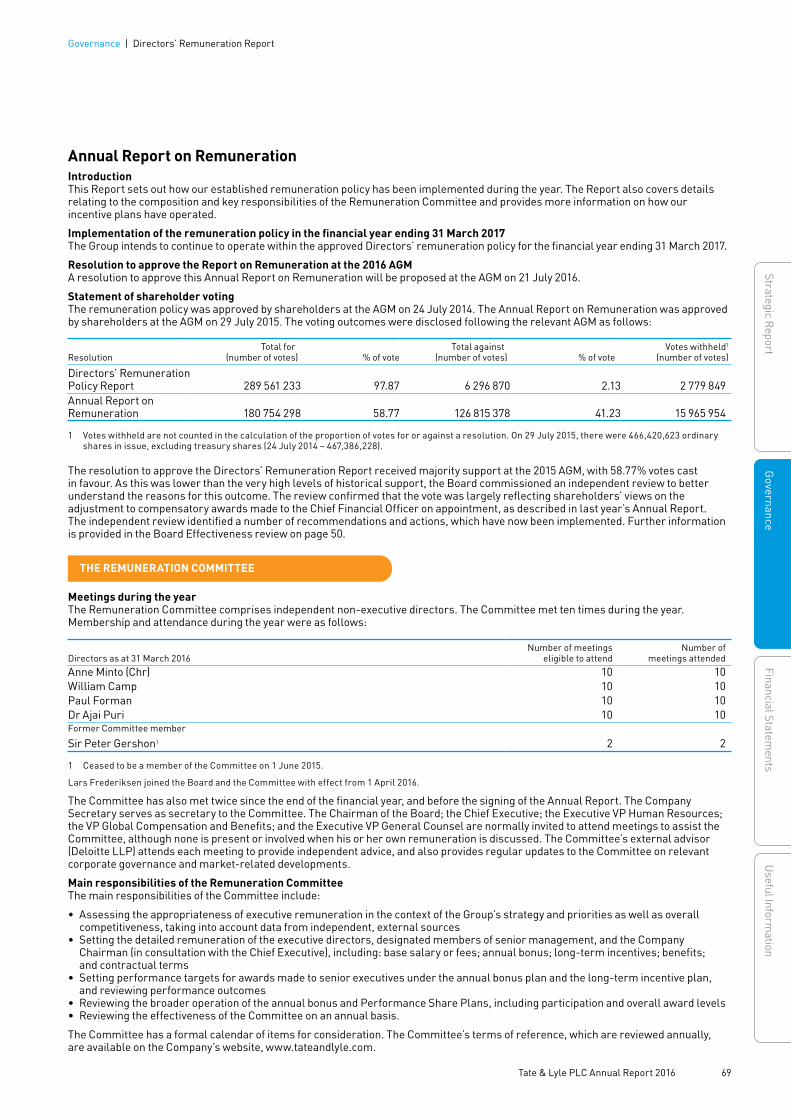
Annual Report on RemunerationIntroductionThis Report sets out how our established remuneration policy has been implemented during the year. The Report also covers details relating to the composition and key responsibilities of the Remuneration Committee and provides more information on how our incentive plans have operated.
Implementation of the remuneration policy in the financial year ending 31 March 2017The Group intends to continue to operate within the approved Directors’ remuneration policy for the financial year ending 31 March 2017.
Resolution to approve the Report on Remuneration at the 2016 AGMA resolution to approve this Annual Report on Remuneration will be proposed at the AGM on 21 July 2016.
Statement of shareholder voting The remuneration policy was approved by shareholders at the AGM on 24 July 2014. The Annual Report on Remuneration was approved by shareholders at the AGM on 29 July 2015. The voting outcomes were disclosed following the relevant AGM as follows:
Resolution Total for
(number of votes) % of voteTotal against
(number of votes) % of voteVotes withheld1
(number of votes)
Directors’ Remuneration Policy Report 289 561 233 97.87 6 296 870 2.13 2 779 849Annual Report on Remuneration 180 754 298 58.77 126 815 378 41.23 15 965 954
1 Votes withheld are not counted in the calculation of the proportion of votes for or against a resolution. On 29 July 2015, there were 466,420,623 ordinary shares in issue, excluding treasury shares (24 July 2014 – 467,386,228).
The resolution to approve the Directors’ Remuneration Report received majority support at the 2015 AGM, with 58.77% votes cast in favour. As this was lower than the very high levels of historical support, the Board commissioned an independent review to better understand the reasons for this outcome. The review confirmed that the vote was largely reflecting shareholders’ views on the adjustment to compensatory awards made to the Chief Financial Officer on appointment, as described in last year’s Annual Report. The independent review identified a number of recommendations and actions, which have now been implemented. Further information is provided in the Board Effectiveness review on page 50.
THE REMUNERATION COMMITTEE
Meetings during the yearThe Remuneration Committee comprises independent non-executive directors. The Committee met ten times during the year. Membership and attendance during the year were as follows:
Directors as at 31 March 2016Number of meetings
eligible to attendNumber of
meetings attendedAnne Minto (Chr) 10 10William Camp 10 10Paul Forman 10 10Dr Ajai Puri 10 10Former Committee member
Sir Peter Gershon1 2 2
1 Ceased to be a member of the Committee on 1 June 2015.
Lars Frederiksen joined the Board and the Committee with effect from 1 April 2016.
The Committee has also met twice since the end of the financial year, and before the signing of the Annual Report. The Company Secretary serves as secretary to the Committee. The Chairman of the Board; the Chief Executive; the Executive VP Human Resources; the VP Global Compensation and Benefits; and the Executive VP General Counsel are normally invited to attend meetings to assist the Committee, although none is present or involved when his or her own remuneration is discussed. The Committee’s external advisor (Deloitte LLP) attends each meeting to provide independent advice, and also provides regular updates to the Committee on relevant corporate governance and market-related developments.
Main responsibilities of the Remuneration Committee The main responsibilities of the Committee include:
• Assessing the appropriateness of executive remuneration in the context of the Group’s strategy and priorities as well as overall competitiveness, taking into account data from independent, external sources
• Setting the detailed remuneration of the executive directors, designated members of senior management, and the Company Chairman (in consultation with the Chief Executive), including: base salary or fees; annual bonus; long-term incentives; benefits; and contractual terms
• Setting performance targets for awards made to senior executives under the annual bonus plan and the long-term incentive plan, and reviewing performance outcomes
• Reviewing the broader operation of the annual bonus and Performance Share Plans, including participation and overall award levels• Reviewing the effectiveness of the Committee on an annual basis.
The Committee has a formal calendar of items for consideration. The Committee’s terms of reference, which are reviewed annually, are available on the Company’s website, www.tateandlyle.com.
69 Tate & Lyle PLC Annual Report 2016
Governance | Directors’ Remuneration Report
Strategic ReportG
overnanceFinancial Statem
entsU
seful Information
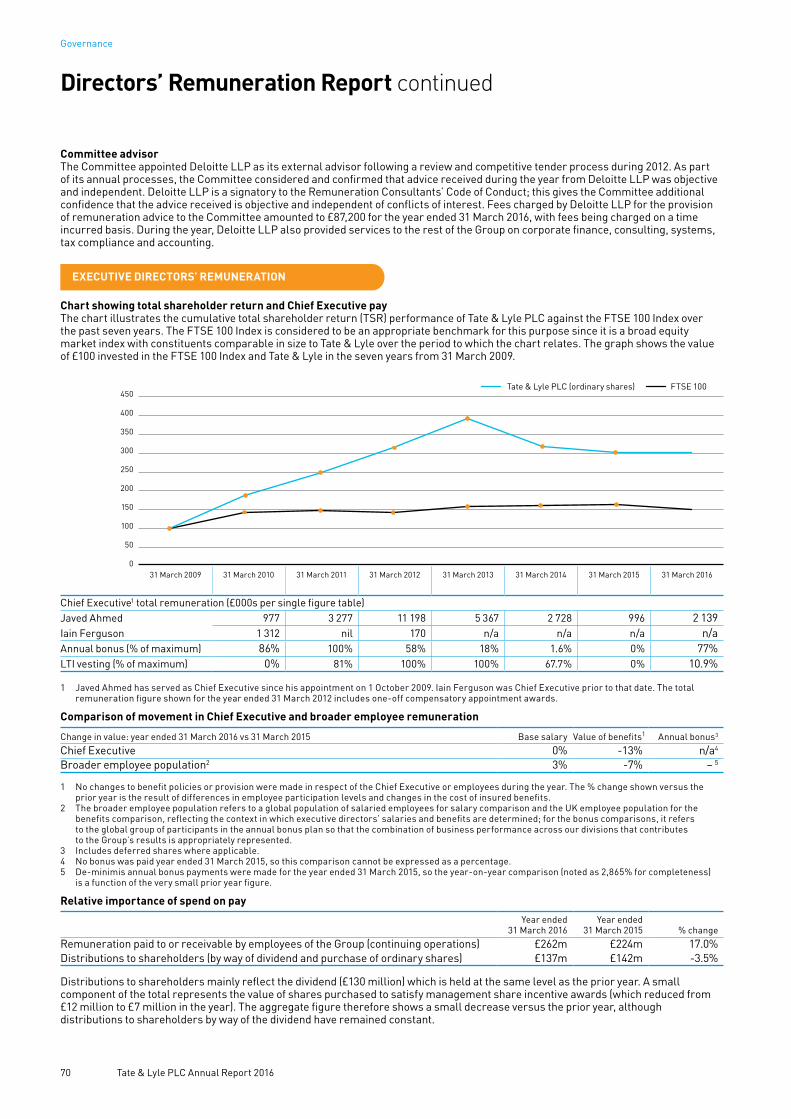
Committee advisorThe Committee appointed Deloitte LLP as its external advisor following a review and competitive tender process during 2012. As part of its annual processes, the Committee considered and confirmed that advice received during the year from Deloitte LLP was objective and independent. Deloitte LLP is a signatory to the Remuneration Consultants’ Code of Conduct; this gives the Committee additional confidence that the advice received is objective and independent of conflicts of interest. Fees charged by Deloitte LLP for the provision of remuneration advice to the Committee amounted to £87,200 for the year ended 31 March 2016, with fees being charged on a time incurred basis. During the year, Deloitte LLP also provided services to the rest of the Group on corporate finance, consulting, systems, tax compliance and accounting.
EXECUTIVE DIRECTORS’ REMUNERATION
Chart showing total shareholder return and Chief Executive payThe chart illustrates the cumulative total shareholder return (TSR) performance of Tate & Lyle PLC against the FTSE 100 Index over the past seven years. The FTSE 100 Index is considered to be an appropriate benchmark for this purpose since it is a broad equity market index with constituents comparable in size to Tate & Lyle over the period to which the chart relates. The graph shows the value of £100 invested in the FTSE 100 Index and Tate & Lyle in the seven years from 31 March 2009.
31 March 201031 March 2009 31 March 2011 31 March 2012 31 March 2013 31 March 2014 31 March 2015 31 March 20160
50
Tate & Lyle PLC (ordinary shares) FTSE 100
100
150
200
250
300
350
400
450
Chief Executive1 total remuneration (£000s per single figure table)Javed Ahmed 977 3 277 11 198 5 367 2 728 996 2 139Iain Ferguson 1 312 nil 170 n/a n/a n/a n/aAnnual bonus (% of maximum) 86% 100% 58% 18% 1.6% 0% 77%LTI vesting (% of maximum) 0% 81% 100% 100% 67.7% 0% 10.9%
1 Javed Ahmed has served as Chief Executive since his appointment on 1 October 2009. Iain Ferguson was Chief Executive prior to that date. The total remuneration figure shown for the year ended 31 March 2012 includes one-off compensatory appointment awards.
Comparison of movement in Chief Executive and broader employee remuneration
Change in value: year ended 31 March 2016 vs 31 March 2015 Base salary Value of benefits1 Annual bonus3
Chief Executive 0% -13% n/a4
Broader employee population2 3% -7% – 5
1 No changes to benefit policies or provision were made in respect of the Chief Executive or employees during the year. The % change shown versus the prior year is the result of differences in employee participation levels and changes in the cost of insured benefits.
2 The broader employee population refers to a global population of salaried employees for salary comparison and the UK employee population for the benefits comparison, reflecting the context in which executive directors’ salaries and benefits are determined; for the bonus comparisons, it refers to the global group of participants in the annual bonus plan so that the combination of business performance across our divisions that contributes to the Group’s results is appropriately represented.
3 Includes deferred shares where applicable.4 No bonus was paid year ended 31 March 2015, so this comparison cannot be expressed as a percentage.5 De-minimis annual bonus payments were made for the year ended 31 March 2015, so the year-on-year comparison (noted as 2,865% for completeness)
is a function of the very small prior year figure.
Relative importance of spend on pay
Year ended31 March 2016
Year ended 31 March 2015 % change
Remuneration paid to or receivable by employees of the Group (continuing operations) £262m £224m 17.0%Distributions to shareholders (by way of dividend and purchase of ordinary shares) £137m £142m -3.5%
Distributions to shareholders mainly reflect the dividend (£130 million) which is held at the same level as the prior year. A small component of the total represents the value of shares purchased to satisfy management share incentive awards (which reduced from £12 million to £7 million in the year). The aggregate figure therefore shows a small decrease versus the prior year, although distributions to shareholders by way of the dividend have remained constant.
Directors’ Remuneration Report continued
70 Tate & Lyle PLC Annual Report 2016
Governance
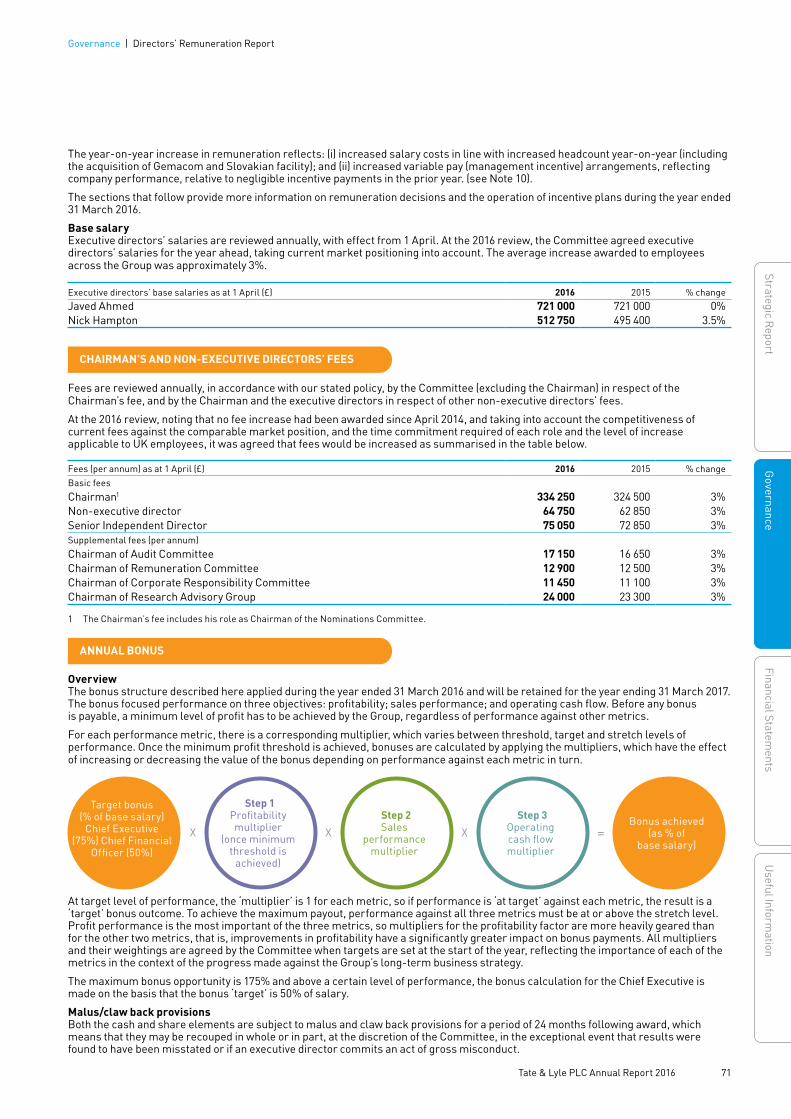
The year-on-year increase in remuneration reflects: (i) increased salary costs in line with increased headcount year-on-year (including the acquisition of Gemacom and Slovakian facility); and (ii) increased variable pay (management incentive) arrangements, reflecting company performance, relative to negligible incentive payments in the prior year. (see Note 10).
The sections that follow provide more information on remuneration decisions and the operation of incentive plans during the year ended 31 March 2016.
Base salaryExecutive directors’ salaries are reviewed annually, with effect from 1 April. At the 2016 review, the Committee agreed executive directors’ salaries for the year ahead, taking current market positioning into account. The average increase awarded to employees across the Group was approximately 3%.
Executive directors’ base salaries as at 1 April (£) 2016 2015 % changeJaved Ahmed 721 000 721 000 0%Nick Hampton 512 750 495 400 3.5%
CHAIRMAN’S AND NON-EXECUTIVE DIRECTORS’ FEES
Fees are reviewed annually, in accordance with our stated policy, by the Committee (excluding the Chairman) in respect of the Chairman’s fee, and by the Chairman and the executive directors in respect of other non-executive directors’ fees.
At the 2016 review, noting that no fee increase had been awarded since April 2014, and taking into account the competitiveness of current fees against the comparable market position, and the time commitment required of each role and the level of increase applicable to UK employees, it was agreed that fees would be increased as summarised in the table below.
Fees (per annum) as at 1 April (£) 2016 2015 % changeBasic feesChairman1 334 250 324 500 3%Non-executive director 64 750 62 850 3%Senior Independent Director 75 050 72 850 3%Supplemental fees (per annum)Chairman of Audit Committee 17 150 16 650 3%Chairman of Remuneration Committee 12 900 12 500 3%Chairman of Corporate Responsibility Committee 11 450 11 100 3%Chairman of Research Advisory Group 24 000 23 300 3%
1 The Chairman’s fee includes his role as Chairman of the Nominations Committee.
ANNUAL BONUS
OverviewThe bonus structure described here applied during the year ended 31 March 2016 and will be retained for the year ending 31 March 2017. The bonus focused performance on three objectives: profitability; sales performance; and operating cash flow. Before any bonus is payable, a minimum level of profit has to be achieved by the Group, regardless of performance against other metrics.
For each performance metric, there is a corresponding multiplier, which varies between threshold, target and stretch levels of performance. Once the minimum profit threshold is achieved, bonuses are calculated by applying the multipliers, which have the effect of increasing or decreasing the value of the bonus depending on performance against each metric in turn.
Target bonus (% of base salary)
Chief Executive (75%) Chief Financial
Officer (50%)
Bonus achieved (as % of
base salary)
Step 1Profitability multiplier
(once minimum threshold is
achieved)
Step 2Sales
performance multiplier
Step 3Operating cash flow multiplier
X X X =
At target level of performance, the ‘multiplier’ is 1 for each metric, so if performance is ‘at target’ against each metric, the result is a ‘target’ bonus outcome. To achieve the maximum payout, performance against all three metrics must be at or above the stretch level. Profit performance is the most important of the three metrics, so multipliers for the profitability factor are more heavily geared than for the other two metrics, that is, improvements in profitability have a significantly greater impact on bonus payments. All multipliers and their weightings are agreed by the Committee when targets are set at the start of the year, reflecting the importance of each of the metrics in the context of the progress made against the Group’s long-term business strategy.
The maximum bonus opportunity is 175% and above a certain level of performance, the bonus calculation for the Chief Executive is made on the basis that the bonus ‘target’ is 50% of salary.
Malus/claw back provisionsBoth the cash and share elements are subject to malus and claw back provisions for a period of 24 months following award, which means that they may be recouped in whole or in part, at the discretion of the Committee, in the exceptional event that results were found to have been misstated or if an executive director commits an act of gross misconduct.
71 Tate & Lyle PLC Annual Report 2016
Governance | Directors’ Remuneration Report
Strategic ReportG
overnanceFinancial Statem
entsU
seful Information
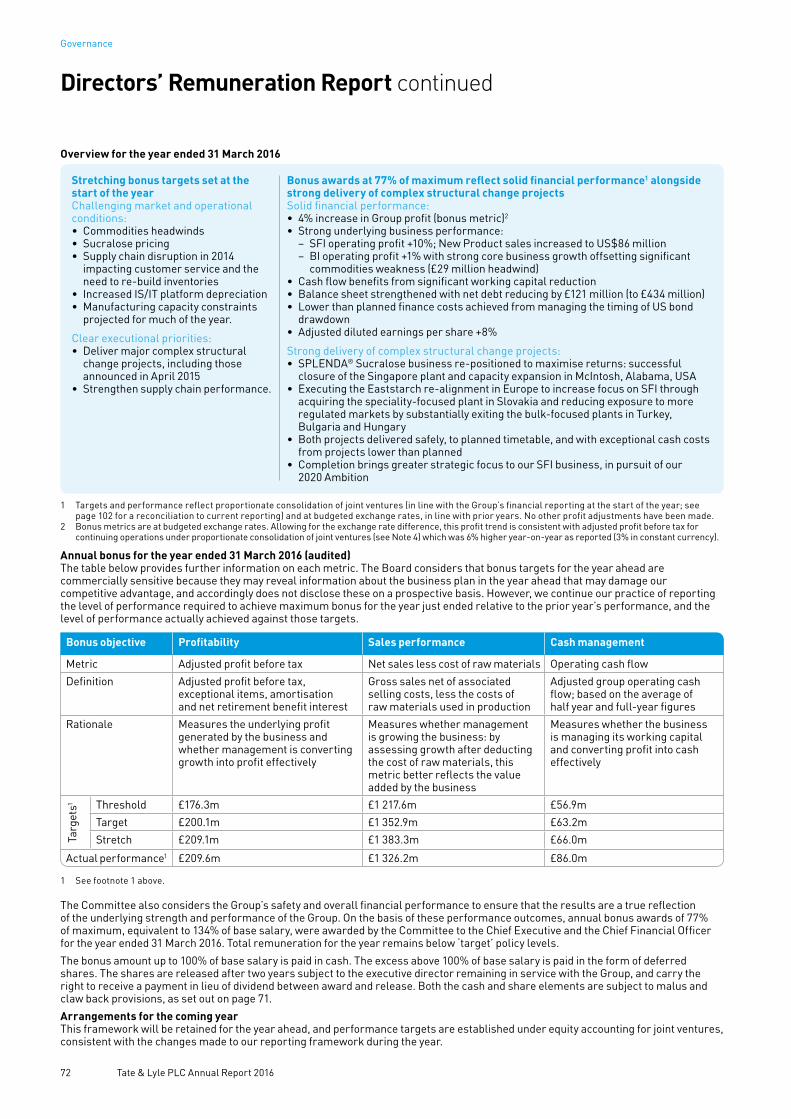
Stretching bonus targets set at the start of the yearChallenging market and operational conditions:• Commodities headwinds • Sucralose pricing• Supply chain disruption in 2014
impacting customer service and the need to re-build inventories
• Increased IS/IT platform depreciation • Manufacturing capacity constraints
projected for much of the year.
Clear executional priorities: • Deliver major complex structural
change projects, including those announced in April 2015
• Strengthen supply chain performance.
Bonus awards at 77% of maximum reflect solid financial performance1 alongside strong delivery of complex structural change projects Solid financial performance:• 4% increase in Group profit (bonus metric)2
• Strong underlying business performance: − SFI operating profit +10%; New Product sales increased to US$86 million − BI operating profit +1% with strong core business growth offsetting significant
commodities weakness (£29 million headwind)• Cash flow benefits from significant working capital reduction• Balance sheet strengthened with net debt reducing by £121 million (to £434 million)• Lower than planned finance costs achieved from managing the timing of US bond
drawdown• Adjusted diluted earnings per share +8%
Strong delivery of complex structural change projects:• SPLENDA® Sucralose business re-positioned to maximise returns: successful
closure of the Singapore plant and capacity expansion in McIntosh, Alabama, USA• Executing the Eaststarch re-alignment in Europe to increase focus on SFI through
acquiring the speciality-focused plant in Slovakia and reducing exposure to more regulated markets by substantially exiting the bulk-focused plants in Turkey, Bulgaria and Hungary
• Both projects delivered safely, to planned timetable, and with exceptional cash costs from projects lower than planned
• Completion brings greater strategic focus to our SFI business, in pursuit of our 2020 Ambition
1 Targets and performance reflect proportionate consolidation of joint ventures (in line with the Group’s financial reporting at the start of the year; see page 102 for a reconciliation to current reporting) and at budgeted exchange rates, in line with prior years. No other profit adjustments have been made.
2 Bonus metrics are at budgeted exchange rates. Allowing for the exchange rate difference, this profit trend is consistent with adjusted profit before tax for continuing operations under proportionate consolidation of joint ventures (see Note 4) which was 6% higher year-on-year as reported (3% in constant currency).
Annual bonus for the year ended 31 March 2016 (audited)The table below provides further information on each metric. The Board considers that bonus targets for the year ahead are commercially sensitive because they may reveal information about the business plan in the year ahead that may damage our competitive advantage, and accordingly does not disclose these on a prospective basis. However, we continue our practice of reporting the level of performance required to achieve maximum bonus for the year just ended relative to the prior year’s performance, and the level of performance actually achieved against those targets.
Bonus objective Profitability Sales performance Cash management
Metric Adjusted profit before tax Net sales less cost of raw materials Operating cash flowDefinition Adjusted profit before tax,
exceptional items, amortisation and net retirement benefit interest
Gross sales net of associated selling costs, less the costs of raw materials used in production
Adjusted group operating cash flow; based on the average of half year and full-year figures
Rationale Measures the underlying profit generated by the business and whether management is converting growth into profit effectively
Measures whether management is growing the business: by assessing growth after deducting the cost of raw materials, this metric better reflects the value added by the business
Measures whether the business is managing its working capital and converting profit into cash effectively
Targ
ets1 Threshold £176.3m £1 217.6m £56.9m
Target £200.1m £1 352.9m £63.2mStretch £209.1m £1 383.3m £66.0m
Actual performance1 £209.6m £1 326.2m £86.0m
1 See footnote 1 above.
The Committee also considers the Group’s safety and overall financial performance to ensure that the results are a true reflection of the underlying strength and performance of the Group. On the basis of these performance outcomes, annual bonus awards of 77% of maximum, equivalent to 134% of base salary, were awarded by the Committee to the Chief Executive and the Chief Financial Officer for the year ended 31 March 2016. Total remuneration for the year remains below ‘target’ policy levels.The bonus amount up to 100% of base salary is paid in cash. The excess above 100% of base salary is paid in the form of deferred shares. The shares are released after two years subject to the executive director remaining in service with the Group, and carry the right to receive a payment in lieu of dividend between award and release. Both the cash and share elements are subject to malus and claw back provisions, as set out on page 71.Arrangements for the coming year This framework will be retained for the year ahead, and performance targets are established under equity accounting for joint ventures, consistent with the changes made to our reporting framework during the year.
Overview for the year ended 31 March 2016
Directors’ Remuneration Report continued
72 Tate & Lyle PLC Annual Report 2016
Governance

LONG-TERM INCENTIVE – PERFORMANCE SHARE PLAN (PSP)
OverviewThe PSP provides a share-based incentive to closely align executive directors’ and senior executives’ interests with the strategy and with the interests of shareholders over the long term, and is therefore an important component of the overall package. At the 2012 AGM, 98% of shareholder votes cast supported the resolution to approve the PSP.
Maximum award levelSince the 2010 AGM, awards to executive directors and other senior executives have been granted at the discretion of the Committee, with flexibility for the Committee to make awards of up to 300% of base salary where necessary to ensure market competitiveness, while taking into account Group performance. Actual awards are considered by the Committee on a case-by-case basis. The actual award to the Chief Executive in 2015 was below the maximum, at 250% of salary.
Performance conditionsThe release of awards depends on the Group’s performance during the three-year performance period beginning on 1 April in the year of the award. For awards made since 2010, the performance conditions comprised two elements, explained in the table below, consistent with the principles established following the review and consultation with shareholders at that time.
Metric Adjusted diluted earnings per share (EPS) Adjusted return on capital employed (ROCE)
Definition Performance is measured by comparing the compound annual growth rate (CAGR) of the Group’s adjusted diluted EPS from continuing operations over the performance period against pre-determined targets
Performance is measured by the adjusted ROCE on continuing operations achieved at the end of the three-year performance period against the pre-determined targets1, 2
Weighting 50% of the award depends on this metric 50% of the award depends on this metric
Rationale The Committee selected this metric as it is a key determinant of shareholder value creation
The Committee selected this metric as it is a good indicator of the effectiveness of strategic investment decisions and of the quality of earnings generated
Vesting schedule (2012, 2013, 2014 and 2015 awards)
EPS performance (CAGR)
Vesting outcome (% of maximum)
ROCE performance Vesting outcome(% of maximum)
Below 6% Nil Below 12.6% Nil
6% 15% 12.6% 15%
Between 6% and 15% On a straight line between 15% and 100%
Between 12.6% and 15.6% On a straight line between 15% and 100%
At or above 15% 100% At or above 15.6% 100%
1 The ROCE outcome may be adjusted downward in the event of an asset impairment (adding this back into capital employed); this is to encourage a prudent investment strategy. For this reason, in the event of there being an impairment of assets during the performance period, the ROCE figure for PSP purposes can be significantly lower than the unadjusted ROCE number reported in the Group’s accounts.
2 ROCE performance is assessed on the basis of proportionate consolidation of joint ventures, consistent with the basis on which targets were set for awards made in 2013, 2014, and 2015. Targets for awards to be made in 2016 will be established under equity accounting for joint ventures, consistent with the changes to our reporting made during the year. The Board approved Eaststarch business re-alignment in the accounting period ending 31 March 2016 will impact reported ROCE performance for awards that were made prior to this date. The pro-forma impact of these items amounts to a 0.8% reduction on reported performance and accordingly the ROCE targets applicable to outstanding awards (previously disclosed as 13.4% – 16.4%) have been adjusted by the same amount. The ROCE target range of 12.6% to 15.6% remains significantly above our weighted average cost of capital. The Committee noted that the sale of joint-venture businesses was approved by the Board in the context of our Group strategy and that this adjustment is necessary to enable a like-for-like comparison of actual ROCE performance (which is assessed in the final year of the performance period) with the targets as they were originally intended to apply.
The Committee reviews the appropriateness of metrics and targets ahead of the grant of awards in any year to ensure these remain sufficiently stretching. In practice, no changes to the performance targets have been made since they were established in 2010, and accordingly shares awarded under the PSP in 2013, 2014 and 2015 are subject to the same conditions. Changes proposed for 2016 are discussed on pages 74 and 75.
Before any shares are released, the Committee must also be satisfied that the level of vesting determined by performance against these targets is justified by the broader underlying financial performance of the Group.
2013 PSP awards vesting by reference to the period ended 31 March 2016 (audited)PSP awards made in 2013 were dependent on EPS growth and ROCE targets as described above, with each condition applicable to half of the award. Performance against these conditions and the vesting outcome is indicated in the table below.
Performance condition
Weighting Performance outcome
Vesting outcome for this element
Combined vesting outcome
EPS growth 50% -10.5% nil Based on the combination of EPS and ROCE performance, the Committee has confirmed that 10.9% of the PSP awards made in 2013 are capable of vesting.
ROCE 50% 12.8%1 Above threshold
1 ROCE performance is shown under proportionate accounting consistent with the basis on which the targets for the 2013 award were established.
73 Tate & Lyle PLC Annual Report 2016
Governance | Directors’ Remuneration Report
Strategic ReportG
overnanceFinancial Statem
entsU
seful Information

The performance period applicable to 2013 awards is 1 April 2013 to 31 March 2016. Over this period, earnings per share declined, and accordingly the 50% of the award which relates to that performance metric will lapse. Over the same period, the business has maintained clear principles in relation to the disciplined use of capital, and ROCE performance of 12.8% (under proportionate accounting) will result in a moderate proportion of the PSP award that was made in 2013, i.e. 10.9% of the total award, being permitted to vest.
In confirming the vesting outcome, the Committee also considered the broader underlying financial performance of Tate & Lyle over the performance period, to ensure that vesting results based on these performance outcomes are consistent with a broader view of the financial health and performance of the business.
Future awards – changes to the metrics, introduction of post-vesting holding periodAs noted in the Chairman’s introduction, we anticipated the need for a review of PSP metrics and targets in the 2015 Annual Report, and completed the review during the course of the year.
The Committee has considered the proposals set out below carefully and believes these changes – which are within the scope of our existing shareholder–approved remuneration policy are necessary and appropriate, in the context of the changes in the business since the PSP was originally adopted (in 2010), and the long-term ambition we have for the business.
In keeping with the commitment we made in our policy, we have consulted with a broad group of our largest shareholders in relation to these proposals, and are pleased to note that the proposals have met with high levels of stated support during that consultation process.
Changes to metrics for 2016 PSP awards In summary the changes to metrics and targets for 2016 are as summarised below:
• ROCE performance will continue to apply to half of the award, as we continue to believe very strongly in the efficient deployment of Group capital
• The other half of the award will be focused on profit growth: to best reflect our business mix and growth priorities, we intend that half of this element will relate to growth in Group operating profit (PBTEA), while half will relate to growth in SFI operating profit (PBITEA) excluding SPLENDA® Sucralose.
Speciality Food Ingredients• Grow on average modestly ahead
of the market• Margin expansion over time• Broaden geographic sales mix
(e.g. 30% sales from Asia Pacific and Latin America by 2020)
• US$200 million sales from New Products by 2020
• Re-position SPLENDA® Sucralose to reflect market conditions and pricing trends, and manage for modest profitability
Business context for the reviewThis review has been driven by a number of factors, including:
• There have been very significant changes in the business since 2010, when the current PSP metrics were originally adopted• The new financial disclosure framework we have adopted brings greater insight to our performance against key strategic
growth drivers. Following the re-alignment of our Eaststarch joint venture in Europe, we have adopted equity accounting for joint ventures for our adjusted reporting, which brings additional clarity to our financial performance measures but has a dilutive like-for-like impact on reported ROCE
• The clear articulation of our 2020 Ambition (see the Chief Executive’s Review on page 8 for further details) has provided further impetus to review the operation of our long-term incentive plan to ensure it is aligned with strategy, and effective in driving performance.
There have been significant changes to the business since 2010, when the current PSP metrics were introduced:
• Material changes in the structure and operations of the business since 2010, including the sale of the European Sugars business (completed in 2011), and disposing of the manufacturing facility at Fort Dodge, Iowa, to limit our exposure to bio-ethanol
• The major business re-alignment we announced in April 2015 to substantially exit our European Bulk Ingredients business which operated through our Eaststarch joint venture
• The significant restructuring of our SPLENDA® Sucralose business (also announced in April 2015) to maximise returns and reposition it as a more focused, low-cost and sustainable business.
The following business priorities form the basis of the Group’s investment proposition to create value for shareholders through a materially re-shaped business focused on Speciality Food Ingredients:
Bulk Ingredients• Core business to provide steady
earnings• Dampen volatility in Commodities
Mix of Group profits by 2020
ADJUSTED OPERATING PROFIT
70% FROM SFI
1
2
1 Speciality Food Ingredients 70%2 Bulk Ingredients 30%
Directors’ Remuneration Report continued
74 Tate & Lyle PLC Annual Report 2016
Governance
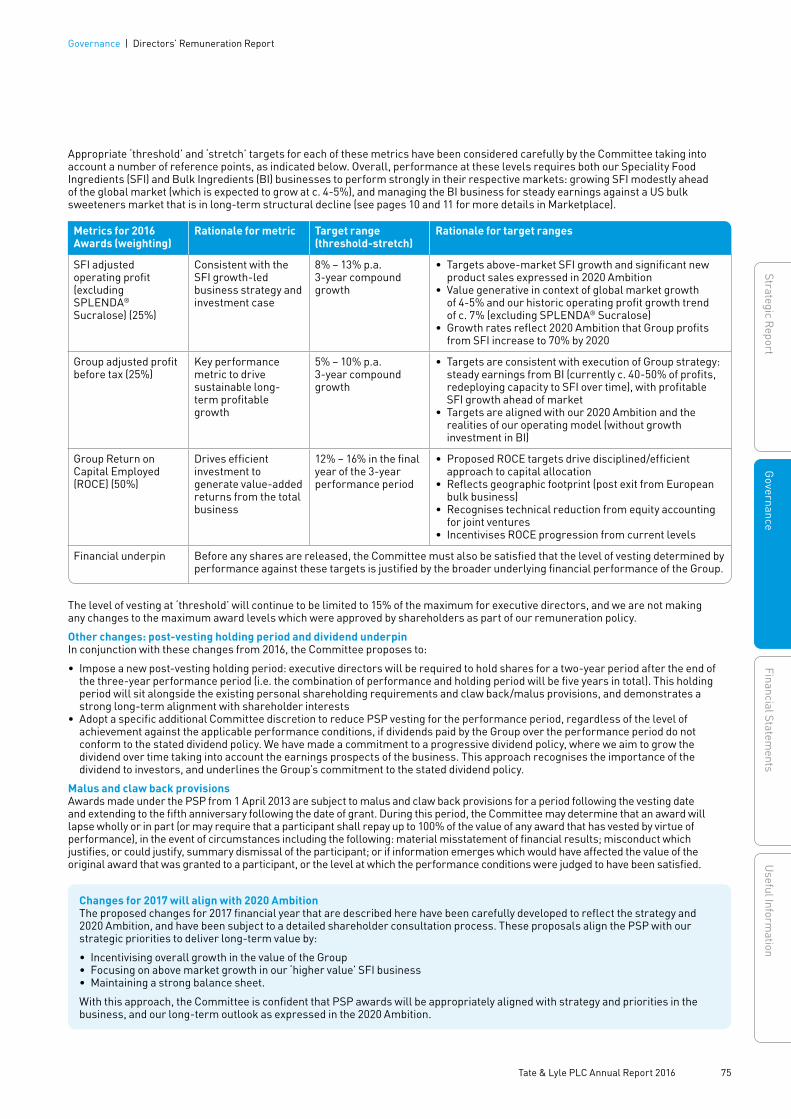
Appropriate ‘threshold’ and ‘stretch’ targets for each of these metrics have been considered carefully by the Committee taking into account a number of reference points, as indicated below. Overall, performance at these levels requires both our Speciality Food Ingredients (SFI) and Bulk Ingredients (BI) businesses to perform strongly in their respective markets: growing SFI modestly ahead of the global market (which is expected to grow at c. 4-5%), and managing the BI business for steady earnings against a US bulk sweeteners market that is in long-term structural decline (see pages 10 and 11 for more details in Marketplace).
Metrics for 2016 Awards (weighting)
Rationale for metric Target range (threshold-stretch)
Rationale for target ranges
SFI adjusted operating profit (excludingSPLENDA® Sucralose) (25%)
Consistent with the SFI growth-led business strategy and investment case
8% – 13% p.a. 3-year compound growth
• Targets above-market SFI growth and significant new product sales expressed in 2020 Ambition
• Value generative in context of global market growth of 4-5% and our historic operating profit growth trend of c. 7% (excluding SPLENDA® Sucralose)
• Growth rates reflect 2020 Ambition that Group profits from SFI increase to 70% by 2020
Group adjusted profit before tax (25%)
Key performance metric to drive sustainable long-term profitable growth
5% – 10% p.a.3-year compound growth
• Targets are consistent with execution of Group strategy: steady earnings from BI (currently c. 40-50% of profits, redeploying capacity to SFI over time), with profitable SFI growth ahead of market
• Targets are aligned with our 2020 Ambition and the realities of our operating model (without growth investment in BI)
Group Return on Capital Employed (ROCE) (50%)
Drives efficient investment to generate value-added returns from the total business
12% – 16% in the final year of the 3-year performance period
• Proposed ROCE targets drive disciplined/efficient approach to capital allocation
• Reflects geographic footprint (post exit from European bulk business)
• Recognises technical reduction from equity accounting for joint ventures
• Incentivises ROCE progression from current levels
Financial underpin Before any shares are released, the Committee must also be satisfied that the level of vesting determined by performance against these targets is justified by the broader underlying financial performance of the Group.
The level of vesting at ‘threshold’ will continue to be limited to 15% of the maximum for executive directors, and we are not making any changes to the maximum award levels which were approved by shareholders as part of our remuneration policy.
Other changes: post-vesting holding period and dividend underpinIn conjunction with these changes from 2016, the Committee proposes to:
• Impose a new post-vesting holding period: executive directors will be required to hold shares for a two-year period after the end of the three-year performance period (i.e. the combination of performance and holding period will be five years in total). This holding period will sit alongside the existing personal shareholding requirements and claw back/malus provisions, and demonstrates a strong long-term alignment with shareholder interests
• Adopt a specific additional Committee discretion to reduce PSP vesting for the performance period, regardless of the level of achievement against the applicable performance conditions, if dividends paid by the Group over the performance period do not conform to the stated dividend policy. We have made a commitment to a progressive dividend policy, where we aim to grow the dividend over time taking into account the earnings prospects of the business. This approach recognises the importance of the dividend to investors, and underlines the Group’s commitment to the stated dividend policy.
Malus and claw back provisionsAwards made under the PSP from 1 April 2013 are subject to malus and claw back provisions for a period following the vesting date and extending to the fifth anniversary following the date of grant. During this period, the Committee may determine that an award will lapse wholly or in part (or may require that a participant shall repay up to 100% of the value of any award that has vested by virtue of performance), in the event of circumstances including the following: material misstatement of financial results; misconduct which justifies, or could justify, summary dismissal of the participant; or if information emerges which would have affected the value of the original award that was granted to a participant, or the level at which the performance conditions were judged to have been satisfied.
Changes for 2017 will align with 2020 AmbitionThe proposed changes for 2017 financial year that are described here have been carefully developed to reflect the strategy and 2020 Ambition, and have been subject to a detailed shareholder consultation process. These proposals align the PSP with our strategic priorities to deliver long-term value by:
• Incentivising overall growth in the value of the Group • Focusing on above market growth in our ‘higher value’ SFI business• Maintaining a strong balance sheet.
With this approach, the Committee is confident that PSP awards will be appropriately aligned with strategy and priorities in the business, and our long-term outlook as expressed in the 2020 Ambition.
75 Tate & Lyle PLC Annual Report 2016
Governance | Directors’ Remuneration Report
Strategic ReportG
overnanceFinancial Statem
entsU
seful Information
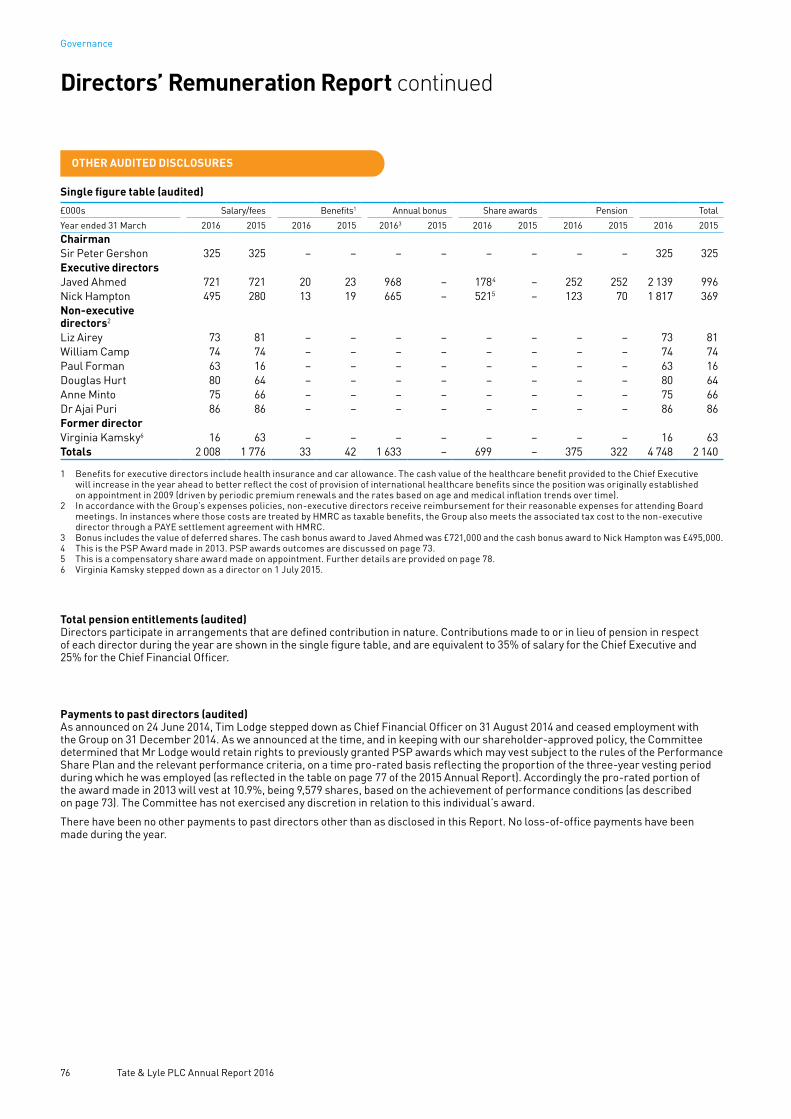
OTHER AUDITED DISCLOSURES
Single figure table (audited)
£000s Salary/fees Benefits1 Annual bonus Share awards Pension Total
Year ended 31 March 2016 2015 2016 2015 20163 2015 2016 2015 2016 2015 2016 2015ChairmanSir Peter Gershon 325 325 – – – – – – – – 325 325Executive directorsJaved Ahmed 721 721 20 23 968 – 178 – 252 252 2 139 996 Nick Hampton 495 280 13 19 665 – 521 – 123 70 1 817 369 Non-executive directors2
Liz Airey 73 81 – – – – – – – – 73 81William Camp 74 74 – – – – – – – – 74 74Paul Forman 63 16 – – – – – – – – 63 16Douglas Hurt 80 64 – – – – – – – – 80 64Anne Minto 75 66 – – – – – – – – 75 66Dr Ajai Puri 86 86 – – – – – – – – 86 86Former directorVirginia Kamsky6 16 63 – – – – – – – – 16 63Totals 2 008 1 776 33 42 1 633 – 699 – 375 322 4 748 2 140
1 Benefits for executive directors include health insurance and car allowance. The cash value of the healthcare benefit provided to the Chief Executive will increase in the year ahead to better reflect the cost of provision of international healthcare benefits since the position was originally established on appointment in 2009 (driven by periodic premium renewals and the rates based on age and medical inflation trends over time).
2 In accordance with the Group’s expenses policies, non-executive directors receive reimbursement for their reasonable expenses for attending Board meetings. In instances where those costs are treated by HMRC as taxable benefits, the Group also meets the associated tax cost to the non-executive director through a PAYE settlement agreement with HMRC.
3 Bonus includes the value of deferred shares. The cash bonus award to Javed Ahmed was £721,000 and the cash bonus award to Nick Hampton was £495,000.4 This is the PSP Award made in 2013. PSP awards outcomes are discussed on page 73.5 This is a compensatory share award made on appointment. Further details are provided on page 78.6 Virginia Kamsky stepped down as a director on 1 July 2015.
Total pension entitlements (audited)Directors participate in arrangements that are defined contribution in nature. Contributions made to or in lieu of pension in respect of each director during the year are shown in the single figure table, and are equivalent to 35% of salary for the Chief Executive and 25% for the Chief Financial Officer.
Payments to past directors (audited)As announced on 24 June 2014, Tim Lodge stepped down as Chief Financial Officer on 31 August 2014 and ceased employment with the Group on 31 December 2014. As we announced at the time, and in keeping with our shareholder-approved policy, the Committee determined that Mr Lodge would retain rights to previously granted PSP awards which may vest subject to the rules of the Performance Share Plan and the relevant performance criteria, on a time pro-rated basis reflecting the proportion of the three-year vesting period during which he was employed (as reflected in the table on page 77 of the 2015 Annual Report). Accordingly the pro-rated portion of the award made in 2013 will vest at 10.9%, being 9,579 shares, based on the achievement of performance conditions (as described on page 73). The Committee has not exercised any discretion in relation to this individual’s award.
There have been no other payments to past directors other than as disclosed in this Report. No loss-of-office payments have been made during the year.
45
Directors’ Remuneration Report continued
76 Tate & Lyle PLC Annual Report 2016
Governance

Share awards made during the year (audited)
Award Type of award Date of grantNumber ofshares
Face valueof award
Performanceconditions
Performanceperiod
% of vestingat threshold
Javed Ahmed PerformanceShare Plan
Nil cost option 10 December 2015
292 595 £1 802 5001 50% adjusted diluted EPSgrowth;50% adjustedROCE2
Threefinancialyears ending31 March2018
15%
Nick Hampton
PerformanceShare Plan
Nil cost option 10 December 2015
241 251 £1 485 0001 50% adjusted diluted EPSgrowth;50% adjustedROCE2
Threefinancialyears ending31 March2018
15%
Appointment-related RestrictedShare Award3
Nil cost option 7 July 2015 121 781 £700 0004 Continued employmentand satisfactory personal performance
Threefinancialyears ending31 March2017
0%
1 Under the terms of the Plan approved by shareholders, the number of shares comprising an award in any year is calculated based on the average share price over the last three months of the preceding financial year, being 616.04 pence per share for the 2015 award. During the year, the Committee approved awards of 250% of salary for the Chief Executive and 300% of salary for the Chief Financial Officer, which is within our approved remuneration policy.
2 Performance conditions applicable to Performance Share Plan awards made in 2015 are described on page 73.3 As set out in the 2015 Directors’ Remuneration Report (page 71 of Annual Report 2015). The 2015 Directors’ Remuneration Report was subject to an
advisory vote at the 2015 AGM.4 This award was made by reference to the average share price over the five dealing days from 28 May 2015, being 574.80 pence.
Historic awards under all-employee schemes (audited) The table below sets out the current position of options to subscribe for ordinary shares of the Company that were granted to current and former executive directors in the years prior to the current reporting year.
Savings-related share options are options granted under the HMRC-approved Sharesave Plan. Options are granted on the same terms to all participating employees, are not subject to performance conditions, and are normally exercisable during the six-month period following the end of the relevant three- or five-year savings contract. The exercise price reflects a 20% discount to market value as permitted under HMRC rules, and is applicable to all participants.
As at 1 April 2015
(number)
Optionsvested
during year(number)
Optionsexercised
during year(number)
Options lapsed
during year (number)
As at 31 March
2016(number)
Exercise price
(pence)Exercise
periodJaved Ahmed 01/03/15 to
31/08/15Savings-related options 2009 3 720 – 3 720 – 0 418.00Javed Ahmed 01/03/20 to
31/08/20Savings-related options 2014 5 941 – – – 5 941 510.00Nick Hampton 01/03/20 to
31/08/20Savings-related options 2014 3 529 – – – 3 529 510.00
77 Tate & Lyle PLC Annual Report 2016
Governance | Directors’ Remuneration Report
Strategic ReportG
overnanceFinancial Statem
entsU
seful Information
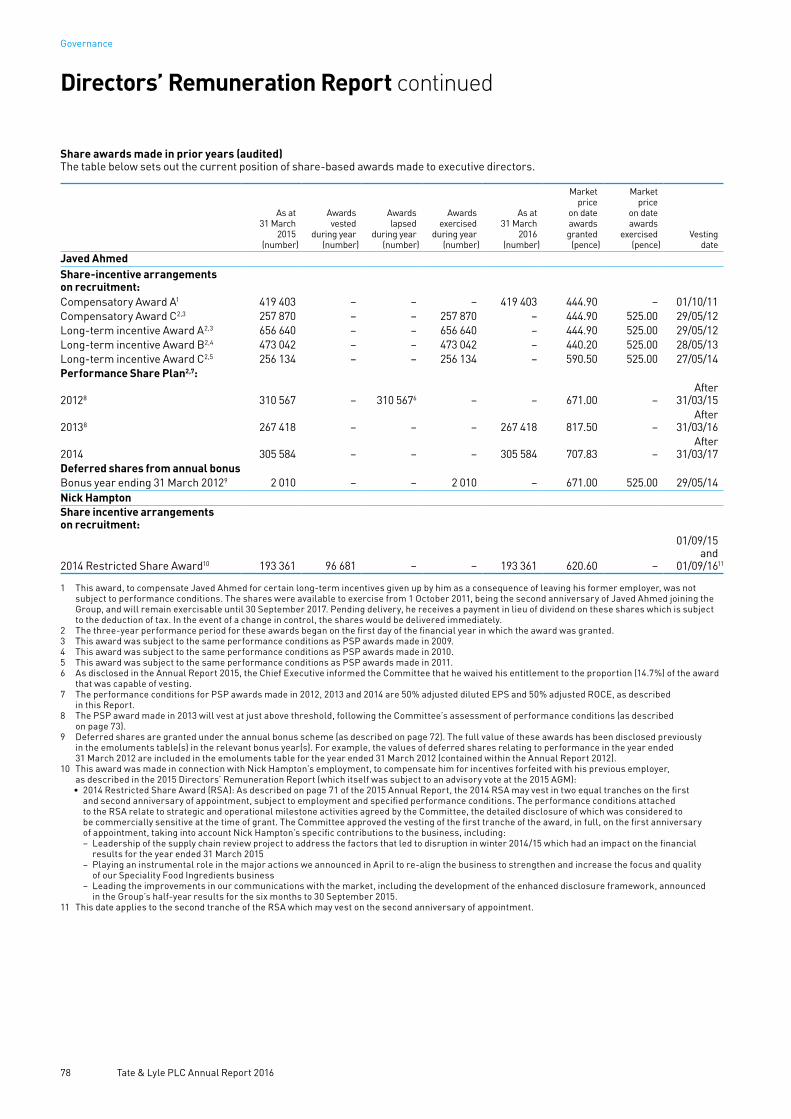
Share awards made in prior years (audited) The table below sets out the current position of share-based awards made to executive directors.
As at 31 March
2015(number)
Awardsvested
during year(number)
Awards lapsed
during year(number)
Awardsexercised
during year (number)
As at 31 March
2016(number)
Marketprice
on dateawardsgranted
(pence)
Marketprice
on dateawards
exercised(pence)
Vesting date
Javed Ahmed Share-incentive arrangementson recruitment:
Compensatory Award A1 419 403 – – – 419 403 444.90 – 01/10/11Compensatory Award C2,3 257 870 – – 257 870 – 444.90 525.00 29/05/12Long-term incentive Award A2,3 656 640 – – 656 640 – 444.90 525.00 29/05/12Long-term incentive Award B2,4 473 042 – – 473 042 – 440.20 525.00 28/05/13Long-term incentive Award C2,5 256 134 – – 256 134 – 590.50 525.00 27/05/14Performance Share Plan2,7:
20128 310 567 – 310 5676 – – 671.00 –After
31/03/15
20138 267 418 – – – 267 418 817.50 –After
31/03/16
2014 305 584 – – – 305 584 707.83 –After
31/03/17Deferred shares from annual bonusBonus year ending 31 March 20129 2 010 – – 2 010 – 671.00 525.00 29/05/14Nick HamptonShare incentive arrangementson recruitment:
2014 Restricted Share Award10 193 361 96 681 – – 193 361 620.60 –
01/09/15and
01/09/16 11
1 This award, to compensate Javed Ahmed for certain long-term incentives given up by him as a consequence of leaving his former employer, was not subject to performance conditions. The shares were available to exercise from 1 October 2011, being the second anniversary of Javed Ahmed joining the Group, and will remain exercisable until 30 September 2017. Pending delivery, he receives a payment in lieu of dividend on these shares which is subject to the deduction of tax. In the event of a change in control, the shares would be delivered immediately.
2 The three-year performance period for these awards began on the first day of the financial year in which the award was granted.3 This award was subject to the same performance conditions as PSP awards made in 2009.4 This award was subject to the same performance conditions as PSP awards made in 2010.5 This award was subject to the same performance conditions as PSP awards made in 2011.6 As disclosed in the Annual Report 2015, the Chief Executive informed the Committee that he waived his entitlement to the proportion (14.7%) of the award
that was capable of vesting.7 The performance conditions for PSP awards made in 2012, 2013 and 2014 are 50% adjusted diluted EPS and 50% adjusted ROCE, as described
in this Report.8 The PSP award made in 2013 will vest at just above threshold, following the Committee’s assessment of performance conditions (as described
on page 73). 9 Deferred shares are granted under the annual bonus scheme (as described on page 72). The full value of these awards has been disclosed previously
in the emoluments table(s) in the relevant bonus year(s). For example, the values of deferred shares relating to performance in the year ended 31 March 2012 are included in the emoluments table for the year ended 31 March 2012 (contained within the Annual Report 2012).
10 This award was made in connection with Nick Hampton’s employment, to compensate him for incentives forfeited with his previous employer, as described in the 2015 Directors’ Remuneration Report (which itself was subject to an advisory vote at the 2015 AGM):• 2014 Restricted Share Award (RSA): As described on page 71 of the 2015 Annual Report, the 2014 RSA may vest in two equal tranches on the first
and second anniversary of appointment, subject to employment and specified performance conditions. The performance conditions attached to the RSA relate to strategic and operational milestone activities agreed by the Committee, the detailed disclosure of which was considered to be commercially sensitive at the time of grant. The Committee approved the vesting of the first tranche of the award, in full, on the first anniversary of appointment, taking into account Nick Hampton’s specific contributions to the business, including:
− Leadership of the supply chain review project to address the factors that led to disruption in winter 2014/15 which had an impact on the financial results for the year ended 31 March 2015
− Playing an instrumental role in the major actions we announced in April to re-align the business to strengthen and increase the focus and quality of our Speciality Food Ingredients business
− Leading the improvements in our communications with the market, including the development of the enhanced disclosure framework, announced in the Group’s half-year results for the six months to 30 September 2015.
11 This date applies to the second tranche of the RSA which may vest on the second anniversary of appointment.
Directors’ Remuneration Report continued
78 Tate & Lyle PLC Annual Report 2016
Governance

Statement of directors’ shareholding and share interests (audited) Personal share ownership requirements (policy on executive share ownership)The Committee and executive management believe that personal investment in Company shares is an important part of our overall remuneration framework. Material personal investment in Company shares serves to strengthen the long-term alignment of interests between senior executives and shareholders.
Our executive shareholding requirements are more demanding and extend to a greater number of senior executives in the Group when compared with similar UK-listed companies.
• The Chief Executive has a target share ownership requirement of four times base salary, and his current shareholding significantly exceeds this target.
• The Chief Financial Officer has a target shareholding of three times base salary, to be achieved within five years of appointment. Nick Hampton joined Tate & Lyle in September 2014, and therefore has until September 2019 to meet this target.
• Other Executive Committee members are subject to the share ownership policy, with target holdings at three times salary. • This policy extends to a broader group of executives who have senior leadership roles within the Group. The shareholding target
for this group is equal to their base salary.
Under the shareholding policy, the value of shareholdings is assessed net of tax, at the prevailing share price, and executives are expected to reach the required level of shareholding within five years of appointment.
The Committee monitors progress against the share ownership requirements annually.
Directors’ interests (audited) The interests held by each person who was a director during the financial year in the ordinary shares of 25 pence each in the Company are shown below. All of the interests set out in the table are beneficially held and no director had interests in any class of shares other than ordinary shares. The table also summarises the interests in shares held through the Company’s various share plans.
Interest inshares1
Shares –conditional onperformance2
Shares – notconditional onperformance3
Options – not conditional onperformance4
Total as at31 March 2016
Total as at31 March 2015
ChairmanSir Peter Gershon 149 729 – – – 149 729 106 006Executive directorsJaved Ahmed 3 028 692 865 597 419 403 5 941 4 319 633 4 246 736Nick Hampton 20 000 337 931 218 462 3 529 579 922 438 923Non-executive directorsLiz Airey 26 000 – – – 26 000 26 000William Camp 6 800 – – – 6 800 4 800Paul Forman 10 000 – – – 10 000 –Douglas Hurt 10 000 – – – 10 000 10 000Anne Minto 8 600 – – – 8 600 8 600Dr Ajai Puri 6 018 – – – 6 018 6 018Former directorVirginia Kamsky 10 000 – – – 10 0005 10 000
1 Includes shares owned by connected persons.2 Includes awards under the Performance Share Plan and the special arrangements that were put in place to facilitate Javed Ahmed’s and Nick Hampton’s
recruitment which are subject to performance conditions (as described on page 78). These awards were made as options with a nil exercise price.3 Includes vested but unexercised awards granted to Javed Ahmed and Nick Hampton, and unvested awards made to Nick Hampton in connection with their
respective appointments. These awards were made as options with a nil exercise price.4 These are HMRC-approved Sharesave Plan awards.5 As at cessation of directorship on 1 July 2015.
There were no changes in directors’ interests in the period from 1 April 2016 to 25 May 2016.
The market price of the Company’s ordinary shares at the close of business on 31 March 2016 was 578.00 pence, and the range during the year ended 31 March 2016 was 502.00 pence to 654.50 pence.
On behalf of the Board
Anne MintoChairman of the Remuneration Committee25 May 2016
79 Tate & Lyle PLC Annual Report 2016
Governance | Directors’ Remuneration Report
Strategic ReportG
overnanceFinancial Statem
entsU
seful Information

About the Directors’ ReportThe Directors’ Report comprises the Governance section from pages 42 to 61, the Directors’ Report on pages 80 and 81, and the Useful Information section from pages 159 to 164. Other information that is relevant to the Directors’ Report, and which is incorporated by reference into the Directors’ Report, is disclosed as follows:
• Likely future developments of the Company (throughout the Strategic Report)
• Human rights (page 35)• Greenhouse gas emissions
(pages 38 and 39)• Relationship with employees
(page 37)• Financial instruments (Note 29)• Post balance sheet events (Note 35).
Results and dividendA review of the results can be found on pages 1 to 41.
An interim dividend of 8.2 pence per ordinary share was paid on 4 January 2016. The Directors recommend a final dividend of 19.8 pence per ordinary share to be paid on 29 July 2016 to shareholders on the register on 1 July 2016, subject to approval at the 2016 Annual General Meeting (AGM). The total dividend for the year is 28.0 pence per ordinary share (2015 – 28.0 pence).
The Trustees of the Tate & Lyle PLC Employee Benefit Trust have waived their right to receive dividends over their total holding of 2,358,470 ordinary shares as at 31 March 2016.
Research and developmentThe Group spent £29 million (2015 – £32 million) on research and development during the year.
Articles of AssociationThe Articles of Association set out the internal regulation of the Company and cover such matters as the rights of shareholders, the appointment or removal of directors, and the conduct of the Board and general meetings. Copies are available on request and are displayed on the Company’s website, www.tateandlyle.com.
In accordance with the Articles of Association, directors can be appointed or removed by the Board or by shareholders in general meeting. Amendments to the Articles of Association have to be approved by at least 75% of those voting in person or by proxy at a general meeting of the Company. Subject to UK company law and the Articles of Association, the Directors may exercise all the powers of the Company, and may delegate authorities to committees, and may delegate day-to-day
management and decision making to individual executive directors. Details of the Board Committees can be found on pages 55 to 61 and on page 69.
Share capitalAs at 31 March 2016, the Company had nominal issued ordinary and preference share capital of £119 million comprising £117 million in ordinary shares, including £0.5 million in treasury shares, and £2 million in preference shares.
To satisfy obligations under employee share plans, the Company issued 11,696 ordinary shares during the year and reissued 325,950 ordinary shares from treasury. The Company did not issue any shares during the period from 1 April 2016 to 25 May 2016. Further information about share capital is in Note 22. Information about options granted under the Company’s employee share plans is in Note 31.
The Company was given authority at the 2015 AGM to make market purchases of up to 46,609,616 of its own ordinary shares. The Company made no purchases of its own ordinary shares during the year ended 31 March 2016. This authority will expire at the 2016 AGM and approval will be sought from shareholders for a similar authority to be given for a further year.
Restrictions on holding sharesThere are no restrictions on the transfer of shares and prior approval is not required from the Company nor from other holders for such a transfer. No limitations are placed on the holding of shares and no share class carries special rights of control of the Company. There are no restrictions on voting rights other than those outlined below on preference shares. The Company is not aware of any agreements between shareholders that may restrict the transfer or exercise of voting rights.
Shareholders’ rightsHolders of ordinary shares have the rights accorded to them under UK company law, including the rights to receive the Company’s Annual Report and Accounts, attend and speak at general meetings, appoint proxies and exercise voting rights.
Holders of preference shares have limited voting rights and may not vote on: the disposal of surplus profits after the dividend on the preference shares has been provided for; the election of directors or their remuneration; any agreement between the directors and the Company; or the alteration of the Articles of Association dealing with any such matters. Further details regarding the rights and obligations attached to share classes are contained in the Articles of Association which are available on the Company’s website, www.tateandlyle.com.
DTR Rule 5 disclosureAs at 25 May 2016 the Company had been notified under Rule 5 of the Disclosure and Transparency Rules of the following holdings of voting rights in its shares:
Numberof shares2 % held2
Black Rock, Inc1 46 514 801 9.97The Capital Group
Companies, Inc. 28 452 377 6.10Ameriprise
Financial, Inc. 23 767 456 5.10Artemis Investment
Management LLP1 23 308 606 5.00AXA S.A. 22 890 148 4.98Invesco Limited1 23 111 061 4.95Schroders plc 23 098 654 4.59Barclays Global
Investors1 17 568 133 3.59
1 Notification was made over 12 months ago; as permitted under Rule 5, shareholders may not be required to notify us of subsequent changes within certain ranges.
2 As at the date in the notification to the Company.
Disclosure table pursuant to Listing Rule LR9.8.4CIn accordance with LR 9.8.4C, the table below sets out the location of the information required to be disclosed, where applicable.
Applicable sub-paragraph within LR 9.8.4 Page(s)(1) Interest capitalised by the Group 111(2) Unaudited financial information None(4) Long-term incentive scheme only involving a director 77(5) Directors’ waivers of emoluments 78(6) Directors’ waivers of future emoluments Not applicable(7) Non pro-rata allotments for cash (issuer) 80(8) Non pro-rata allotments for cash (major subsidiaries) None(9) Listed company is a subsidiary of another company Not applicable(10) Contracts of significance involving a director None(11) Contracts of significance involving a controlling shareholder Not applicable(12) Waivers of dividends 80(13) Waivers of future dividends 80(14) Agreement with a controlling shareholder Not applicable
80 Tate & Lyle PLC Annual Report 2016
Governance
Directors’ ReportDirectors’ Report

Change of controlThe Company has a committed bank facility of US$800 million, which matures in July 2020. Under the terms of this facility, the banks can give notice to Tate & Lyle to prepay outstanding amounts and cancel the commitments where there is a change of control of the Company. The Company is the guarantor of a £200 million bond issued by its subsidiary, Tate & Lyle International Finance PLC, dated 25 November 2009, which is repayable in 2019. Under the terms of the bond issue, noteholders have the option to request an early repayment where there is a change of control of the Company. The Company is the guarantor of US$400 million US Private Placement Notes issued by its subsidiary, Tate & Lyle International
Finance PLC, in July 2015 which are repayable in 2023, 2025 and 2027. Under the terms of these Notes, the Company is required to offer to prepay the outstanding amounts following a change of control of the Company.
All of the Company’s share plans contain provisions relating to a change of control. Further information is set out in the Directors’ remuneration policy.
Political donationsAgain this year, in line with the Group’s policy, no political donations were made in the European Union (EU). Outside the EU, the Group’s US business made contributions during the year totalling US$13,000; (£9,000) (2015 – US$26,700; £17,000) to state political party committees
and to the campaign committees of state candidates affiliated to the major parties. In all, seven separate donations were made, the largest being of US$5,000 and the smallest US$300.
US$10,500; (£7,000) (2015 – US$11,500; £7,000) was also contributed by the Tate & Lyle Political Action Committee (PAC). Seven separate donations were made, the largest being of US$2,500 and the smallest US$1,000. The PAC is funded entirely by US employees. Employee contributions are entirely voluntary and no pressure is placed on US employees to participate. No funds are provided to the PAC by Tate & Lyle but under US law, an employee-funded PAC must bear the name of the employing company.
Directors’ Statement of Responsibilities
The Directors are responsible for preparing the Annual Report, the Directors’ Remuneration Report and the Financial Statements in accordance with applicable law and regulations.
Company law requires the Directors to prepare financial statements for each financial year. Under that law the directors have prepared the Group Financial Statements in accordance with International Financial Reporting Standards (IFRSs) as adopted by the EU, and the Parent Company Financial Statements in accordance with United Kingdom Generally Accepted Accounting Practice including FRS101 ‘Reduced Disclosure Framework’ (UK GAAP) and applicable law. Under company law the Directors must not approve the financial statements unless they are satisfied that they give a true and fair view of the state of affairs of the Company and the Group and of the profit or loss of the Group for that period.
In preparing these financial statements, the Directors are required to:
• Select suitable accounting policies and then apply them consistently
• Make judgements and accounting estimates that are reasonable and prudent
• State whether IFRSs as adopted by the EU and, with regard to the Parent Company Financial Statements, applicable UK Accounting Standards have been followed, subject to any material departures disclosed and explained in the Group and Parent Company Financial Statements respectively the going concern basis unless it is inappropriate to presume that the Company will continue in business.
The Directors are responsible for keeping adequate accounting records that are sufficient to show and explain the Company’s transactions and disclose with reasonable accuracy at any time the financial position of the Company and the Group and enable them to ensure that the financial statements and the Directors’ Remuneration Report comply with the Companies Act 2006 and, as regards the Group Financial Statements, Article 4 of the IAS Regulation. They are also responsible for safeguarding the assets of the Company and the Group and hence for taking reasonable steps for the prevention and detection of fraud and other irregularities.
The Directors are responsible for the maintenance and integrity of the Company’s website. Legislation in the UK governing the preparation and dissemination of financial statements may differ from legislation in other jurisdictions.
Each of the directors, whose names and functions are listed on pages 42 and 43, confirm that, to the best of his or her knowledge:
• The Annual Report, taken as a whole, is fair, balanced and understandable and provides the information necessary for shareholders to assess the Company’s and the Group’s performance, business model and strategy
• The Group Financial Statements, which have been prepared in accordance with IFRSs as adopted by the EU, and the Parent Company Financial Statements in accordance with UK Accounting Standards, give a true and fair view of the assets, liabilities, financial position of the Group and Parent Company and of the profit of the Group
• The Strategic Report and the Directors’ Report include a fair review of the development and performance of the business and the position of the Group, together with a description of the principal risks and uncertainties that it faces.
Disclosure of information to auditorsSo far as each director is aware, there is no relevant audit information of which the Company’s auditors are unaware; and he or she has taken all the steps that he or she ought to have taken as a director in order to make himself or herself aware of any relevant audit information and to establish that the Company’s auditors are aware of that information.
The Directors’ Report on pages 42 to 61, pages 80 and 81 and pages 159 to the inside back cover and the Directors’ Remuneration Report from pages 62 to 79 of this Annual Report were approved by the Directors on 25 May 2016.
By order of the Board
Lucie GilbertCompany Secretary25 May 2016
81 Tate & Lyle PLC Annual Report 2016
Governance | Directors’ Report
Strategic ReportG
overnanceFinancial Statem
entsU
seful Information
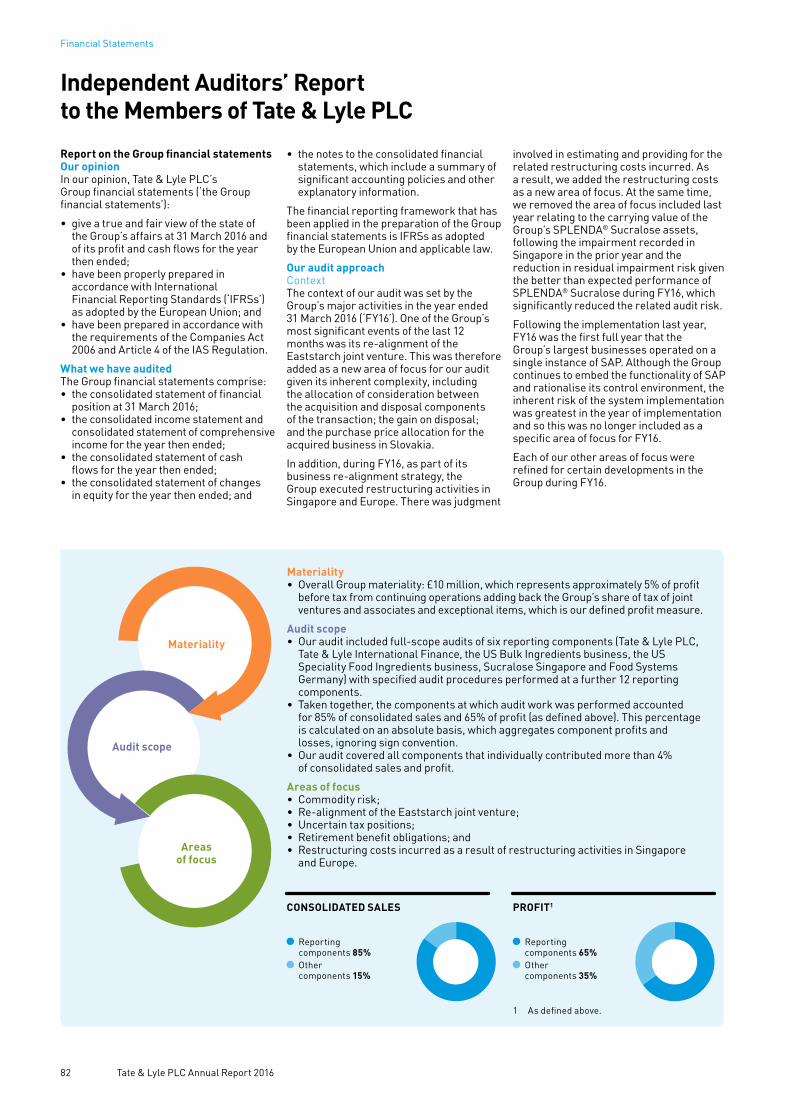
Report on the Group financial statementsOur opinionIn our opinion, Tate & Lyle PLC’s Group financial statements (‘the Group financial statements’):
• give a true and fair view of the state of the Group’s affairs at 31 March 2016 and of its profit and cash flows for the year then ended;
• have been properly prepared in accordance with International Financial Reporting Standards (‘IFRSs’) as adopted by the European Union; and
• have been prepared in accordance with the requirements of the Companies Act 2006 and Article 4 of the IAS Regulation.
What we have auditedThe Group financial statements comprise:• the consolidated statement of financial
position at 31 March 2016;• the consolidated income statement and
consolidated statement of comprehensive income for the year then ended;
• the consolidated statement of cash flows for the year then ended;
• the consolidated statement of changes in equity for the year then ended; and
• the notes to the consolidated financial statements, which include a summary of significant accounting policies and other explanatory information.
The financial reporting framework that has been applied in the preparation of the Group financial statements is IFRSs as adopted by the European Union and applicable law.
Our audit approachContextThe context of our audit was set by the Group’s major activities in the year ended 31 March 2016 (‘FY16’). One of the Group’s most significant events of the last 12 months was its re-alignment of the Eaststarch joint venture. This was therefore added as a new area of focus for our audit given its inherent complexity, including the allocation of consideration between the acquisition and disposal components of the transaction; the gain on disposal; and the purchase price allocation for the acquired business in Slovakia.
In addition, during FY16, as part of its business re-alignment strategy, the Group executed restructuring activities in Singapore and Europe. There was judgment
involved in estimating and providing for the related restructuring costs incurred. As a result, we added the restructuring costs as a new area of focus. At the same time, we removed the area of focus included last year relating to the carrying value of the Group’s SPLENDA® Sucralose assets, following the impairment recorded in Singapore in the prior year and the reduction in residual impairment risk given the better than expected performance of SPLENDA® Sucralose during FY16, which significantly reduced the related audit risk.
Following the implementation last year, FY16 was the first full year that the Group’s largest businesses operated on a single instance of SAP. Although the Group continues to embed the functionality of SAP and rationalise its control environment, the inherent risk of the system implementation was greatest in the year of implementation and so this was no longer included as a specific area of focus for FY16.
Each of our other areas of focus were refined for certain developments in the Group during FY16.
Materiality• Overall Group materiality: £10 million, which represents approximately 5% of profit
before tax from continuing operations adding back the Group’s share of tax of joint ventures and associates and exceptional items, which is our defined profit measure.
Audit scope• Our audit included full-scope audits of six reporting components (Tate & Lyle PLC,
Tate & Lyle International Finance, the US Bulk Ingredients business, the US Speciality Food Ingredients business, Sucralose Singapore and Food Systems Germany) with specified audit procedures performed at a further 12 reporting components.
• Taken together, the components at which audit work was performed accounted for 85% of consolidated sales and 65% of profit (as defined above). This percentage is calculated on an absolute basis, which aggregates component profits and losses, ignoring sign convention.
• Our audit covered all components that individually contributed more than 4% of consolidated sales and profit.
Areas of focus• Commodity risk;• Re-alignment of the Eaststarch joint venture;• Uncertain tax positions;• Retirement benefit obligations; and• Restructuring costs incurred as a result of restructuring activities in Singapore
and Europe.
Materiality
Audit scope
Areas of focus
CONSOLIDATED SALES
Reporting components 85%
Other components 15%
PROFIT1
Reporting components 65%
Other components 35%
1 As defined above.
82 Tate & Lyle PLC Annual Report 2016
Financial Statements
Independent Auditors’ Report to the Members of Tate & Lyle PLC
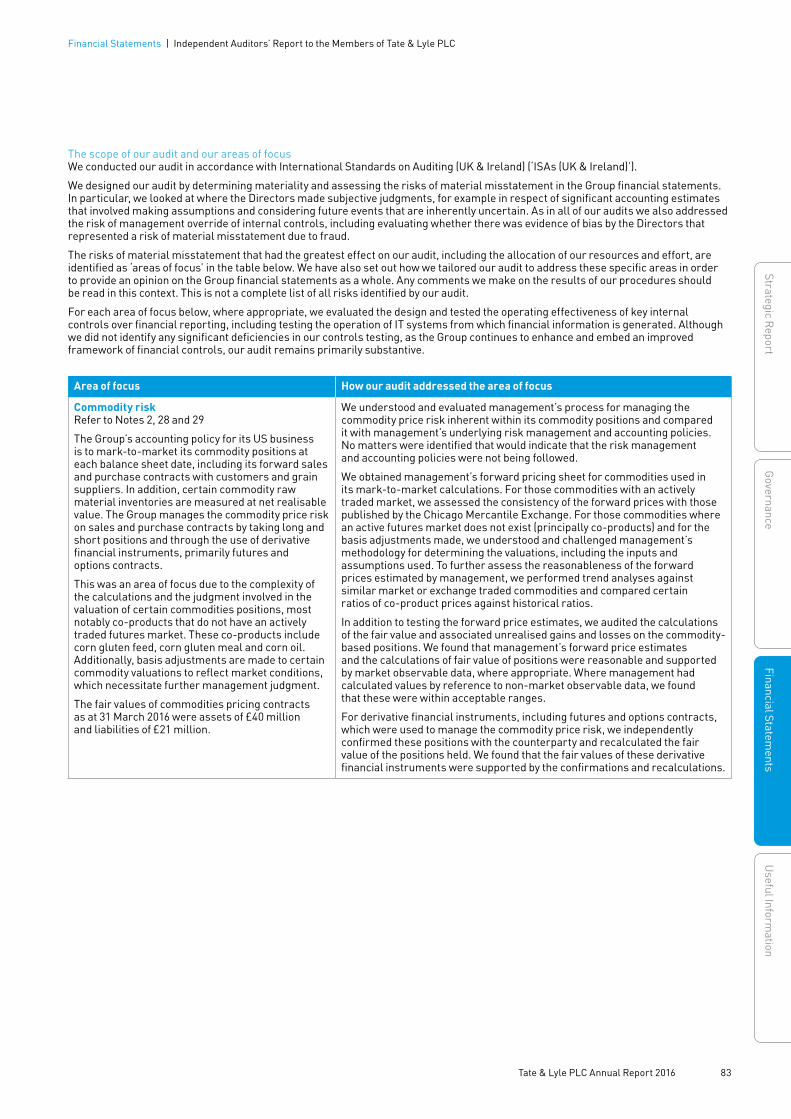
The scope of our audit and our areas of focusWe conducted our audit in accordance with International Standards on Auditing (UK & Ireland) (‘ISAs (UK & Ireland)’).
We designed our audit by determining materiality and assessing the risks of material misstatement in the Group financial statements. In particular, we looked at where the Directors made subjective judgments, for example in respect of significant accounting estimates that involved making assumptions and considering future events that are inherently uncertain. As in all of our audits we also addressed the risk of management override of internal controls, including evaluating whether there was evidence of bias by the Directors that represented a risk of material misstatement due to fraud.
The risks of material misstatement that had the greatest effect on our audit, including the allocation of our resources and effort, are identified as ‘areas of focus’ in the table below. We have also set out how we tailored our audit to address these specific areas in order to provide an opinion on the Group financial statements as a whole. Any comments we make on the results of our procedures should be read in this context. This is not a complete list of all risks identified by our audit.
For each area of focus below, where appropriate, we evaluated the design and tested the operating effectiveness of key internal controls over financial reporting, including testing the operation of IT systems from which financial information is generated. Although we did not identify any significant deficiencies in our controls testing, as the Group continues to enhance and embed an improved framework of financial controls, our audit remains primarily substantive.
Area of focus How our audit addressed the area of focus
Commodity riskRefer to Notes 2, 28 and 29
The Group’s accounting policy for its US business is to mark-to-market its commodity positions at each balance sheet date, including its forward sales and purchase contracts with customers and grain suppliers. In addition, certain commodity raw material inventories are measured at net realisable value. The Group manages the commodity price risk on sales and purchase contracts by taking long and short positions and through the use of derivative financial instruments, primarily futures and options contracts.
This was an area of focus due to the complexity of the calculations and the judgment involved in the valuation of certain commodities positions, most notably co-products that do not have an actively traded futures market. These co-products include corn gluten feed, corn gluten meal and corn oil. Additionally, basis adjustments are made to certain commodity valuations to reflect market conditions, which necessitate further management judgment.
The fair values of commodities pricing contracts as at 31 March 2016 were assets of £40 million and liabilities of £21 million.
We understood and evaluated management’s process for managing the commodity price risk inherent within its commodity positions and compared it with management’s underlying risk management and accounting policies. No matters were identified that would indicate that the risk management and accounting policies were not being followed.
We obtained management’s forward pricing sheet for commodities used in its mark-to-market calculations. For those commodities with an actively traded market, we assessed the consistency of the forward prices with those published by the Chicago Mercantile Exchange. For those commodities where an active futures market does not exist (principally co-products) and for the basis adjustments made, we understood and challenged management’s methodology for determining the valuations, including the inputs and assumptions used. To further assess the reasonableness of the forward prices estimated by management, we performed trend analyses against similar market or exchange traded commodities and compared certain ratios of co-product prices against historical ratios.
In addition to testing the forward price estimates, we audited the calculations of the fair value and associated unrealised gains and losses on the commodity-based positions. We found that management’s forward price estimates and the calculations of fair value of positions were reasonable and supported by market observable data, where appropriate. Where management had calculated values by reference to non-market observable data, we found that these were within acceptable ranges.
For derivative financial instruments, including futures and options contracts, which were used to manage the commodity price risk, we independently confirmed these positions with the counterparty and recalculated the fair value of the positions held. We found that the fair values of these derivative financial instruments were supported by the confirmations and recalculations.
83 Tate & Lyle PLC Annual Report 2016
Strategic ReportG
overnanceFinancial Statem
entsU
seful Information
Financial Statements | Independent Auditors’ Report to the Members of Tate & Lyle PLC
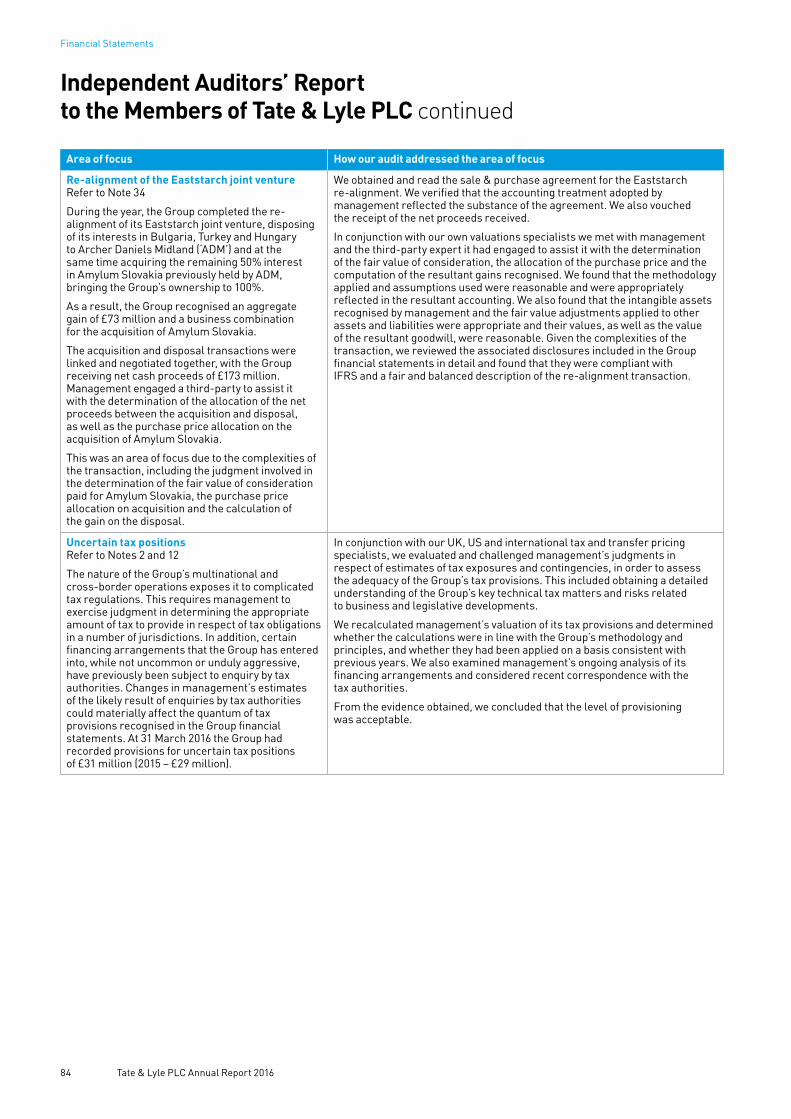
Area of focus How our audit addressed the area of focus
Re-alignment of the Eaststarch joint ventureRefer to Note 34
During the year, the Group completed the re-alignment of its Eaststarch joint venture, disposing of its interests in Bulgaria, Turkey and Hungary to Archer Daniels Midland (‘ADM’) and at the same time acquiring the remaining 50% interest in Amylum Slovakia previously held by ADM, bringing the Group’s ownership to 100%.
As a result, the Group recognised an aggregate gain of £73 million and a business combination for the acquisition of Amylum Slovakia.
The acquisition and disposal transactions were linked and negotiated together, with the Group receiving net cash proceeds of £173 million. Management engaged a third-party to assist it with the determination of the allocation of the net proceeds between the acquisition and disposal, as well as the purchase price allocation on the acquisition of Amylum Slovakia.
This was an area of focus due to the complexities of the transaction, including the judgment involved in the determination of the fair value of consideration paid for Amylum Slovakia, the purchase price allocation on acquisition and the calculation of the gain on the disposal.
We obtained and read the sale & purchase agreement for the Eaststarch re-alignment. We verified that the accounting treatment adopted by management reflected the substance of the agreement. We also vouched the receipt of the net proceeds received.
In conjunction with our own valuations specialists we met with management and the third-party expert it had engaged to assist it with the determination of the fair value of consideration, the allocation of the purchase price and the computation of the resultant gains recognised. We found that the methodology applied and assumptions used were reasonable and were appropriately reflected in the resultant accounting. We also found that the intangible assets recognised by management and the fair value adjustments applied to other assets and liabilities were appropriate and their values, as well as the value of the resultant goodwill, were reasonable. Given the complexities of the transaction, we reviewed the associated disclosures included in the Group financial statements in detail and found that they were compliant with IFRS and a fair and balanced description of the re-alignment transaction.
Uncertain tax positionsRefer to Notes 2 and 12
The nature of the Group’s multinational and cross-border operations exposes it to complicated tax regulations. This requires management to exercise judgment in determining the appropriate amount of tax to provide in respect of tax obligations in a number of jurisdictions. In addition, certain financing arrangements that the Group has entered into, while not uncommon or unduly aggressive, have previously been subject to enquiry by tax authorities. Changes in management’s estimates of the likely result of enquiries by tax authorities could materially affect the quantum of tax provisions recognised in the Group financial statements. At 31 March 2016 the Group had recorded provisions for uncertain tax positions of £31 million (2015 – £29 million).
In conjunction with our UK, US and international tax and transfer pricing specialists, we evaluated and challenged management’s judgments in respect of estimates of tax exposures and contingencies, in order to assess the adequacy of the Group’s tax provisions. This included obtaining a detailed understanding of the Group’s key technical tax matters and risks related to business and legislative developments.
We recalculated management’s valuation of its tax provisions and determined whether the calculations were in line with the Group’s methodology and principles, and whether they had been applied on a basis consistent with previous years. We also examined management’s ongoing analysis of its financing arrangements and considered recent correspondence with the tax authorities.
From the evidence obtained, we concluded that the level of provisioning was acceptable.
84 Tate & Lyle PLC Annual Report 2016
Financial Statements
Independent Auditors’ Report to the Members of Tate & Lyle PLC continued
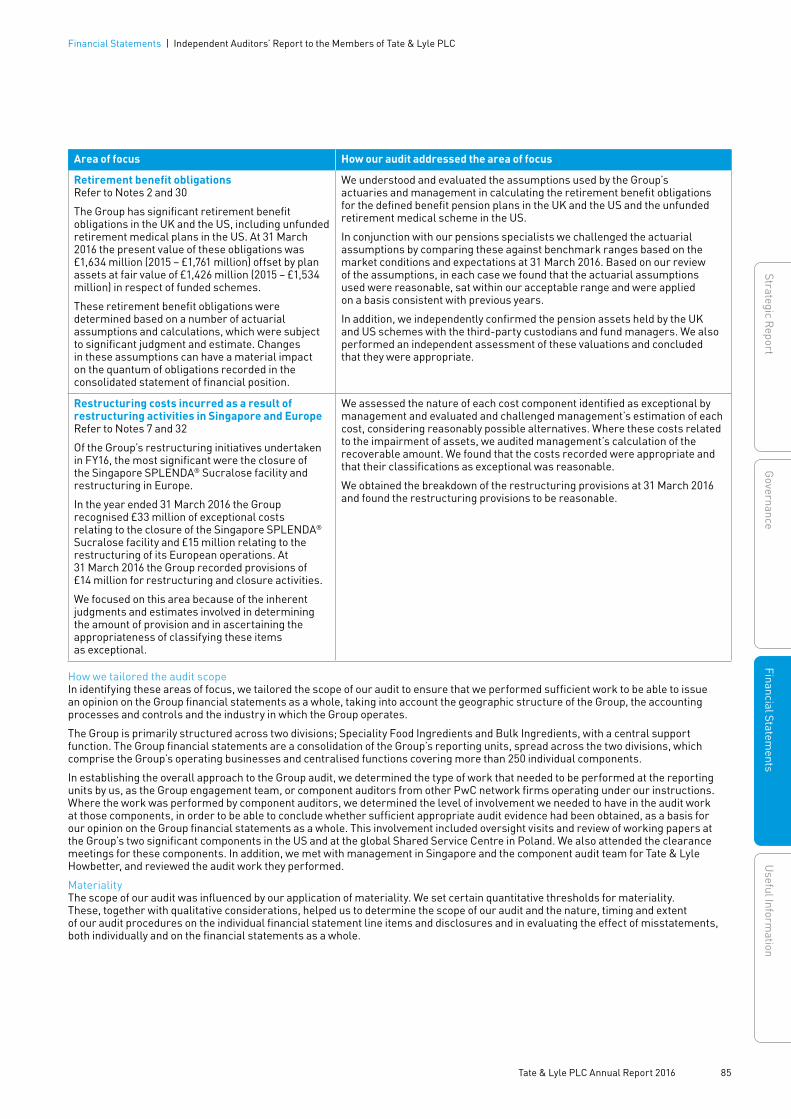
Area of focus How our audit addressed the area of focus
Retirement benefit obligationsRefer to Notes 2 and 30
The Group has significant retirement benefit obligations in the UK and the US, including unfunded retirement medical plans in the US. At 31 March 2016 the present value of these obligations was £1,634 million (2015 – £1,761 million) offset by plan assets at fair value of £1,426 million (2015 – £1,534 million) in respect of funded schemes.
These retirement benefit obligations were determined based on a number of actuarial assumptions and calculations, which were subject to significant judgment and estimate. Changes in these assumptions can have a material impact on the quantum of obligations recorded in the consolidated statement of financial position.
We understood and evaluated the assumptions used by the Group’s actuaries and management in calculating the retirement benefit obligations for the defined benefit pension plans in the UK and the US and the unfunded retirement medical scheme in the US.
In conjunction with our pensions specialists we challenged the actuarial assumptions by comparing these against benchmark ranges based on the market conditions and expectations at 31 March 2016. Based on our review of the assumptions, in each case we found that the actuarial assumptions used were reasonable, sat within our acceptable range and were applied on a basis consistent with previous years.
In addition, we independently confirmed the pension assets held by the UK and US schemes with the third-party custodians and fund managers. We also performed an independent assessment of these valuations and concluded that they were appropriate.
Restructuring costs incurred as a result of restructuring activities in Singapore and Europe Refer to Notes 7 and 32
Of the Group’s restructuring initiatives undertaken in FY16, the most significant were the closure of the Singapore SPLENDA® Sucralose facility and restructuring in Europe.
In the year ended 31 March 2016 the Group recognised £33 million of exceptional costs relating to the closure of the Singapore SPLENDA® Sucralose facility and £15 million relating to the restructuring of its European operations. At 31 March 2016 the Group recorded provisions of £14 million for restructuring and closure activities.
We focused on this area because of the inherent judgments and estimates involved in determining the amount of provision and in ascertaining the appropriateness of classifying these items as exceptional.
We assessed the nature of each cost component identified as exceptional by management and evaluated and challenged management’s estimation of each cost, considering reasonably possible alternatives. Where these costs related to the impairment of assets, we audited management’s calculation of the recoverable amount. We found that the costs recorded were appropriate and that their classifications as exceptional was reasonable.
We obtained the breakdown of the restructuring provisions at 31 March 2016 and found the restructuring provisions to be reasonable.
How we tailored the audit scopeIn identifying these areas of focus, we tailored the scope of our audit to ensure that we performed sufficient work to be able to issue an opinion on the Group financial statements as a whole, taking into account the geographic structure of the Group, the accounting processes and controls and the industry in which the Group operates.
The Group is primarily structured across two divisions; Speciality Food Ingredients and Bulk Ingredients, with a central support function. The Group financial statements are a consolidation of the Group’s reporting units, spread across the two divisions, which comprise the Group’s operating businesses and centralised functions covering more than 250 individual components.
In establishing the overall approach to the Group audit, we determined the type of work that needed to be performed at the reporting units by us, as the Group engagement team, or component auditors from other PwC network firms operating under our instructions. Where the work was performed by component auditors, we determined the level of involvement we needed to have in the audit work at those components, in order to be able to conclude whether sufficient appropriate audit evidence had been obtained, as a basis for our opinion on the Group financial statements as a whole. This involvement included oversight visits and review of working papers at the Group’s two significant components in the US and at the global Shared Service Centre in Poland. We also attended the clearance meetings for these components. In addition, we met with management in Singapore and the component audit team for Tate & Lyle Howbetter, and reviewed the audit work they performed.
MaterialityThe scope of our audit was influenced by our application of materiality. We set certain quantitative thresholds for materiality. These, together with qualitative considerations, helped us to determine the scope of our audit and the nature, timing and extent of our audit procedures on the individual financial statement line items and disclosures and in evaluating the effect of misstatements, both individually and on the financial statements as a whole.
85 Tate & Lyle PLC Annual Report 2016
Strategic ReportG
overnanceFinancial Statem
entsU
seful Information
Financial Statements | Independent Auditors’ Report to the Members of Tate & Lyle PLC

Based on our professional judgment, we determined materiality for the financial statements as a whole as follows:
Overall Group materiality £10 million (2015 – £10 million).
How we determined it Approximately 5% of profit before tax from continuing operations (£126 million) adding back the Group’s share of tax of joint ventures and associates (£11 million) and exceptional items (£50 million), as defined in Note 3 to the Group financial statements.
Rationale for benchmark applied The Group’s principal measure of earnings is adjusted profit before tax from continuing operations, which excludes exceptional items, amortisation of acquired intangible assets and net retirement benefit interest from profit before tax (‘PBTEA’). The Group adjusts for exceptional items as it believes that doing so is necessary to provide an understanding of financial performance. We have not used PBTEA, as defined above, as our benchmark since the amortisation of acquired intangible assets and net retirement benefit interest are recurring items.
We agreed with the Audit Committee that we would report to them misstatements identified during our audit above £500,000 (2015– £750,000) as well as misstatements below that amount that, in our view, warranted reporting for qualitative reasons.
Going concernUnder the Listing Rules we are required to review the Directors’ statement, set out on page 30, in relation to going concern. We have nothing to report having performed our review.
Under ISAs (UK & Ireland) we are required to report to you if we have anything material to add or to draw attention to in relation to the Directors’ statement about whether they considered it appropriate to adopt the going concern basis in preparing the financial statements. We have nothing material to add or to draw attention to.
As noted in the Directors’ statement, the Directors have concluded that it is appropriate to adopt the going concern basis in preparing the financial statements. The going concern basis presumes that the Group has adequate resources to remain in operation, and that the Directors intend it to do so, for at least one year from the date the financial statements were signed. As part of our audit we have concluded that the Directors’ use of the going concern basis is appropriate.
However, because not all future events or conditions can be predicted, these statements are not a guarantee as to the Group’s ability to continue as a going concern.
Other required reportingConsistency of other informationCompanies Act 2006 opinionIn our opinion, the information given in the Strategic Report and the Directors’ Report for the financial year for which the financial statements are prepared is consistent with the financial statements.
ISAs (UK & Ireland) reporting
Under ISAs (UK & Ireland) we are required to report to you if, in our opinion:
• Information in the Annual Report is: − materially inconsistent with the information in the audited financial statements; or − apparently materially incorrect based on, or materially inconsistent with, our
knowledge of the Group acquired in the course of performing our audit; or − otherwise misleading.
We have no exceptions to report.
• The statement given by the Directors on page 81, in accordance with provision C.1.1 of the UK Corporate Governance Code (the ‘Code’), that they consider the Annual Report taken as a whole to be fair, balanced and understandable and provides the information necessary for members to assess the Group’s position and performance, business model and strategy is materially inconsistent with our knowledge of the Group acquired in the course of performing our audit.
We have no exceptions to report.
• The section of the Annual Report on page 55, as required by provision C.3.8 of the Code, describing the work of the Audit Committee does not appropriately address matters communicated by us to the Audit Committee.
We have no exceptions to report.
86 Tate & Lyle PLC Annual Report 2016
Financial Statements
Independent Auditors’ Report to the Members of Tate & Lyle PLC continued

The Directors’ assessment of the prospects of the Group and of the principal risks that would threaten the solvency or liquidity of the Group
Under ISAs (UK & Ireland) we are required to report to you if we have anything material to add or to draw attention to in relation to:
• The Directors’ confirmation on page 31 of the Annual Report, in accordance with provision C.2.1 of the Code, that they have carried out a robust assessment of the principal risks facing the Group, including those that would threaten its business model, future performance, solvency or liquidity.
We have nothing material to add or to draw attention to.
• The disclosures in the Annual Report that describe those risks and explain how they are being managed or mitigated.
We have nothing material to add or to draw attention to.
• The Directors’ explanation on page 31 of the Annual Report, in accordance with provision C.2.2 of the Code, as to how they have assessed the prospects of the Group, over what period they have done so and why they consider that period to be appropriate, and their statement as to whether they have a reasonable expectation that the Group will be able to continue in operation and meet its liabilities as they fall due over the period of their assessment, including any related disclosures drawing attention to any necessary qualifications or assumptions.
We have nothing material to add or to draw attention to.
Under the Listing Rules we are required to review the Directors’ statement that they have carried out a robust assessment of the principal risks facing the Group and the Directors’ statement in relation to the longer-term viability of the Group. Our review was substantially less in scope than an audit and only consisted of making inquiries and considering the Directors’ process supporting their statements; checking that the statements are in alignment with the relevant provisions of the Code; and considering whether the statements are consistent with the knowledge acquired by us in the course of performing our audit. We have nothing to report having performed our review.
Adequacy of information and explanations receivedUnder the Companies Act 2006 we are required to report to you if, in our opinion, we have not received all the information and explanations we require for our audit. We have no exceptions to report arising from this responsibility.
Directors’ remunerationUnder the Companies Act 2006 we are required to report to you if, in our opinion, certain disclosures of Directors’ remuneration specified by law are not made. We have no exceptions to report arising from this responsibility.
Corporate governance statementUnder the Listing Rules we are required to review the part of the Corporate Governance Statement relating to the Parent Company’s compliance with ten provisions of the UK Corporate Governance Code. We have nothing to report having performed our review.
Responsibilities for the financial statements and the auditOur responsibilities and those of the DirectorsAs explained more fully in the Directors’ Statement of Responsibilities set out on page 81, the Directors are responsible for the preparation of the financial statements and for being satisfied that they give a true and fair view.
Our responsibility is to audit and express an opinion on the Group financial statements in accordance with applicable law and ISAs (UK & Ireland). Those standards require us to comply with the Auditing Practices Board’s Ethical Standards for Auditors.
This report, including the opinions, has been prepared for and only for the parent company’s members as a body in accordance with Chapter 3 of Part 16 of the Companies Act 2006 and for no other purpose. We do not, in giving these opinions, accept or assume responsibility for any other purpose or to any other person to whom this report is shown or into whose hands it may come save where expressly agreed by our prior consent in writing.
What an audit of financial statements involvesAn audit involves obtaining evidence about the amounts and disclosures in the financial statements sufficient to give reasonable assurance that the financial statements are free from material misstatement, whether caused by fraud or error. This includes an assessment of:
• whether the accounting policies are appropriate to the Group’s circumstances and have been consistently applied and adequately disclosed;
• the reasonableness of significant accounting estimates made by the Directors; and
• the overall presentation of the financial statements.
We primarily focus our work in these areas by assessing the Directors’ judgments against available evidence, forming our own judgments, and evaluating the disclosures in the financial statements.
We test and examine information, using sampling and other auditing techniques, to the extent we consider necessary to provide a reasonable basis for us to draw conclusions. We obtain audit evidence
through testing the effectiveness of controls, substantive procedures or a combination of both.
In addition, we read all the financial and non-financial information in the Annual Report to identify material inconsistencies with the audited financial statements and to identify any information that is apparently materially incorrect based on, or materially inconsistent with, the knowledge acquired by us in the course of performing the audit. If we become aware of any apparent material misstatements or inconsistencies we consider the implications for our report.
Other matterWe have reported separately on the Parent Company financial statements of Tate & Lyle PLC for the year ended 31 March 2016 and on the information in the Directors’ Remuneration Report that is described as having been audited.
John Waters (Senior Statutory Auditor)for and on behalf of PricewaterhouseCoopers LLP Chartered Accountants and Statutory Auditors London
25 May 2016
87 Tate & Lyle PLC Annual Report 2016
Strategic ReportG
overnanceFinancial Statem
entsU
seful Information
Financial Statements | Independent Auditors’ Report to the Members of Tate & Lyle PLC

Notes
Year ended 31 March
2016£m
Restated*2015
£mContinuing operationsSales 5 2 355 2 341Operating profit 6 127 33 Finance income 11 1 1 Finance expense 11 (30) (32)Share of profit after tax of joint ventures and associates 21 28 23 Profit before tax 126 25 Income tax expense 12 (5) (21)Profit for the year – continuing operations 121 4 Profit for the year – discontinued operations 8 42 26 Profit for the year – total operations 163 30
Profit for the year attributable to:– owners of the Company 163 30 – non-controlling interests – – Profit for the year 163 30
Earnings per share Pence Pence Continuing operations: 13– basic 26.1p 0.9p – diluted 25.9p 0.8p Total operations: 13– basic 35.1p 6.6p – diluted 34.8p 6.5p
Analysis of adjusted profit for the year from continuing operations £m £mProfit before tax – continuing operations 126 25 Adjusted for:Exceptional items 7 50 142 Amortisation of acquired intangible assets 19 11 9 Net retirement benefit interest 11, 30 6 8 Adjusted profit before tax – continuing operations 4 193 184 Adjusted income tax expense – continuing operations 4, 12 (32) (34)Adjusted profit for the year – continuing operations 4 161 150
* Prior year restated to reflect discontinued operations (see Note 3). Where adjusted metrics are presented, these have been further restated for the adoption of equity accounting (see Note 1).
88 Tate & Lyle PLC Annual Report 2016
Financial Statements
Consolidated Income Statement
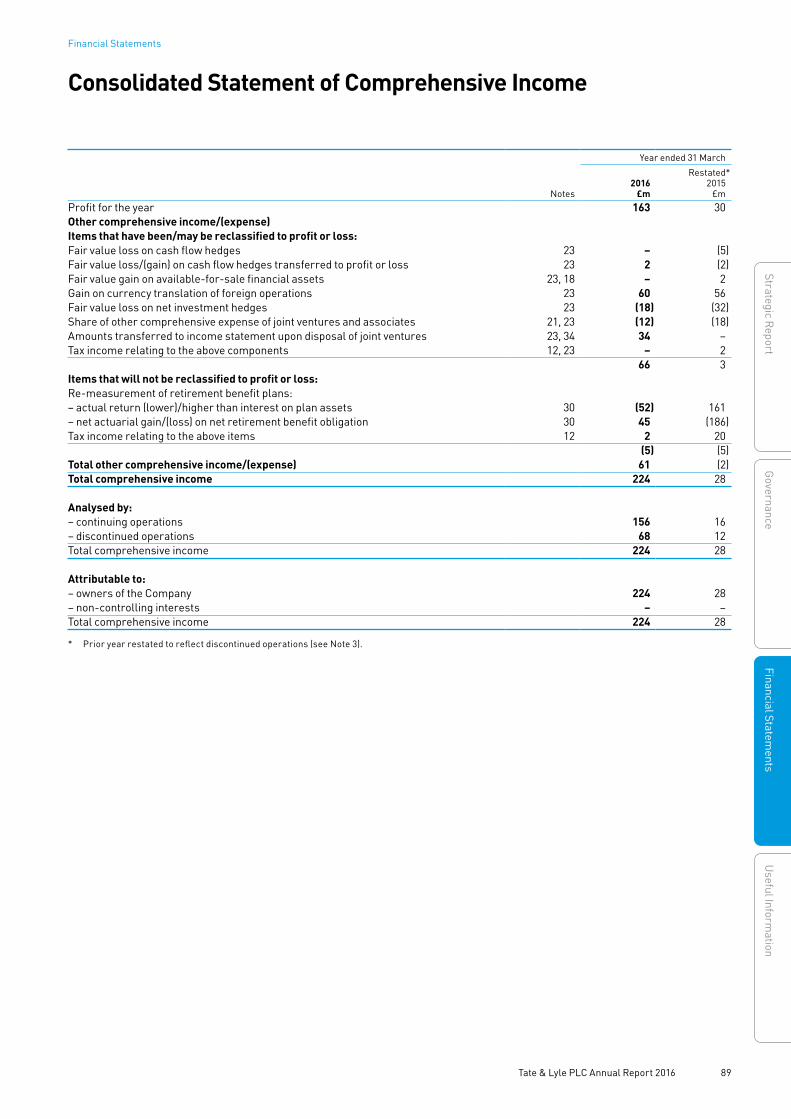
Notes
Year ended 31 March
2016£m
Restated*2015
£mProfit for the year 163 30Other comprehensive income/(expense)Items that have been/may be reclassified to profit or loss:Fair value loss on cash flow hedges 23 – (5)Fair value loss/(gain) on cash flow hedges transferred to profit or loss 23 2 (2)Fair value gain on available-for-sale financial assets 23, 18 – 2 Gain on currency translation of foreign operations 23 60 56 Fair value loss on net investment hedges 23 (18) (32)Share of other comprehensive expense of joint ventures and associates 21, 23 (12) (18)Amounts transferred to income statement upon disposal of joint ventures 23, 34 34 –Tax income relating to the above components 12, 23 – 2
66 3 Items that will not be reclassified to profit or loss:Re-measurement of retirement benefit plans:– actual return (lower)/higher than interest on plan assets 30 (52) 161 – net actuarial gain/(loss) on net retirement benefit obligation 30 45 (186)Tax income relating to the above items 12 2 20
(5) (5)Total other comprehensive income/(expense) 61 (2)Total comprehensive income 224 28
Analysed by:– continuing operations 156 16 – discontinued operations 68 12 Total comprehensive income 224 28
Attributable to:– owners of the Company 224 28 – non-controlling interests – – Total comprehensive income 224 28
* Prior year restated to reflect discontinued operations (see Note 3).
89 Tate & Lyle PLC Annual Report 2016
Financial Statements
Strategic ReportG
overnanceFinancial Statem
entsU
seful Information
Consolidated Statement of Comprehensive Income
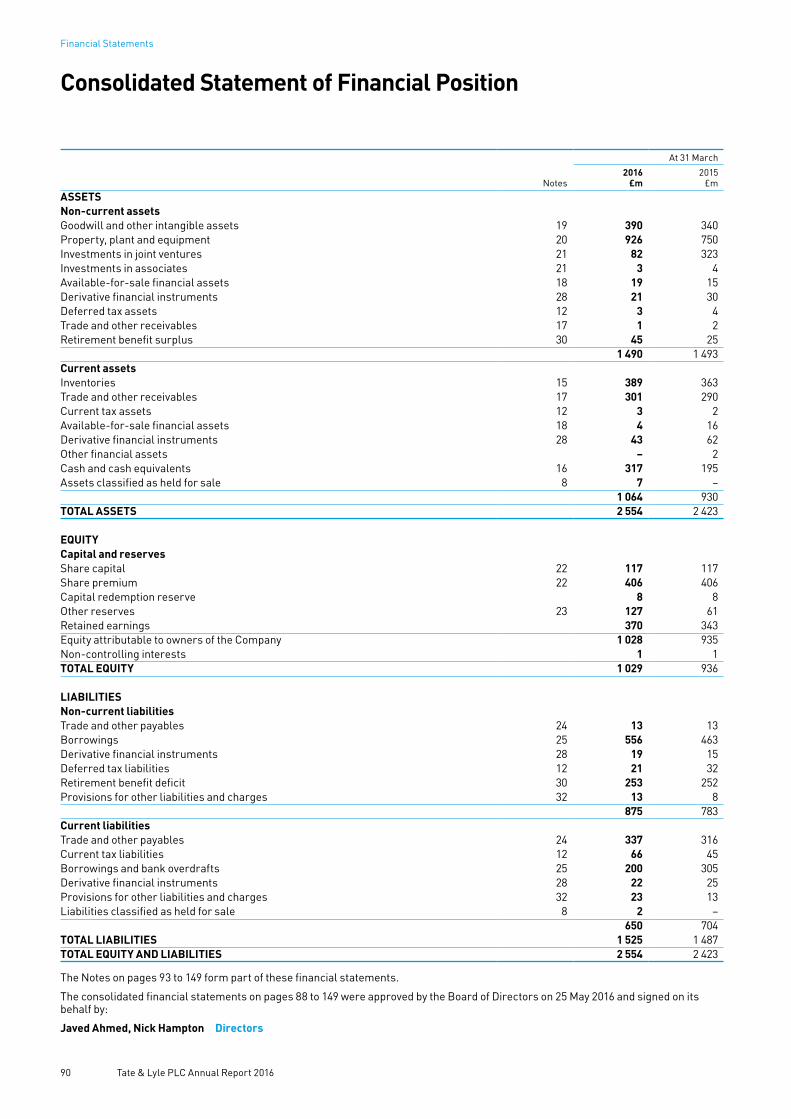
Notes
At 31 March
2016£m
2015£m
ASSETSNon-current assetsGoodwill and other intangible assets 19 390 340 Property, plant and equipment 20 926 750 Investments in joint ventures 21 82 323 Investments in associates 21 3 4 Available-for-sale financial assets 18 19 15 Derivative financial instruments 28 21 30 Deferred tax assets 12 3 4 Trade and other receivables 17 1 2 Retirement benefit surplus 30 45 25
1 490 1 493 Current assetsInventories 15 389 363 Trade and other receivables 17 301 290 Current tax assets 12 3 2 Available-for-sale financial assets 18 4 16 Derivative financial instruments 28 43 62 Other financial assets – 2 Cash and cash equivalents 16 317 195 Assets classified as held for sale 8 7 –
1 064 930 TOTAL ASSETS 2 554 2 423
EQUITY Capital and reservesShare capital 22 117 117 Share premium 22 406 406 Capital redemption reserve 8 8 Other reserves 23 127 61 Retained earnings 370 343 Equity attributable to owners of the Company 1 028 935 Non-controlling interests 1 1 TOTAL EQUITY 1 029 936
LIABILITIESNon-current liabilitiesTrade and other payables 24 13 13 Borrowings 25 556 463 Derivative financial instruments 28 19 15 Deferred tax liabilities 12 21 32 Retirement benefit deficit 30 253 252 Provisions for other liabilities and charges 32 13 8
875 783 Current liabilitiesTrade and other payables 24 337 316 Current tax liabilities 12 66 45 Borrowings and bank overdrafts 25 200 305 Derivative financial instruments 28 22 25 Provisions for other liabilities and charges 32 23 13 Liabilities classified as held for sale 8 2 –
650 704 TOTAL LIABILITIES 1 525 1 487 TOTAL EQUITY AND LIABILITIES 2 554 2 423
The Notes on pages 93 to 149 form part of these financial statements.
The consolidated financial statements on pages 88 to 149 were approved by the Board of Directors on 25 May 2016 and signed on its behalf by:
Javed Ahmed, Nick Hampton Directors
90 Tate & Lyle PLC Annual Report 2016
Financial Statements
Consolidated Statement of Financial Position

Notes
Year ended 31 March
2016£m
Restated*2015
£mCash flows from operating activitiesProfit before tax from continuing operations 126 25 Adjustments for:– depreciation of property, plant and equipment 20 80 85 – amortisation of intangible assets 19 35 24 – share-based payments 31 9 – – exceptional items 7 17 113 – finance income 11 (1) (1)– finance expense 11 30 32 – share of profit after tax of joint ventures and associates 21 (28) (23)Changes in working capital 26 24 8 Net retirement benefit obligations (38) (47)Cash generated from continuing operations 254 216 Interest paid (21) (30)Net income tax paid (16) (7)Cash used in discontinued operations 8 (29) – Net cash generated from operating activities 188 179
Cash flows from investing activities Purchase of property, plant and equipment (179) (121)Purchase of intangible assets (19) (34)Acquisition of businesses, net of cash acquired 34 (54) (26)Disposal of joint ventures 34 240 – Purchase of available-for-sale financial assets 18 (4) (2)Disposal of available-for-sale financial assets# 18 18 2 Interest received 1 1 Dividends received from joint ventures and associates 21 83 16 Net cash from/(used) in investing activities 86 (164)
Cash flows from financing activitiesPurchase of own shares (treasury/trust shares) (7) (12)Cash inflow from additional borrowings 261 278 Cash outflow from repayment of borrowings (286) (319)Repayment of capital element of finance leases (4) (2)Dividends paid to the owners of the Company 14 (130) (130)Net cash used in financing activities (166) (185)
Net increase/(decrease) in cash and cash equivalents 27 108 (170)
Cash and cash equivalentsBalance at beginning of year 195 346 Net increase/(decrease) in cash and cash equivalents 27 108 (170)Currency translation differences 14 19 Balance at end of year 16 317 195
A reconciliation of the movement in cash and cash equivalents to the movement in net debt is presented in Note 27.* Prior year restated to reflect discontinued operations (see Note 3).# The cash flow associated with exceptional profit on disposal of part of the Group’s ventures portfolio (see Note 7).
91 Tate & Lyle PLC Annual Report 2016
Financial Statements
Strategic ReportG
overnanceFinancial Statem
entsU
seful Information
Consolidated Statement of Cash Flows
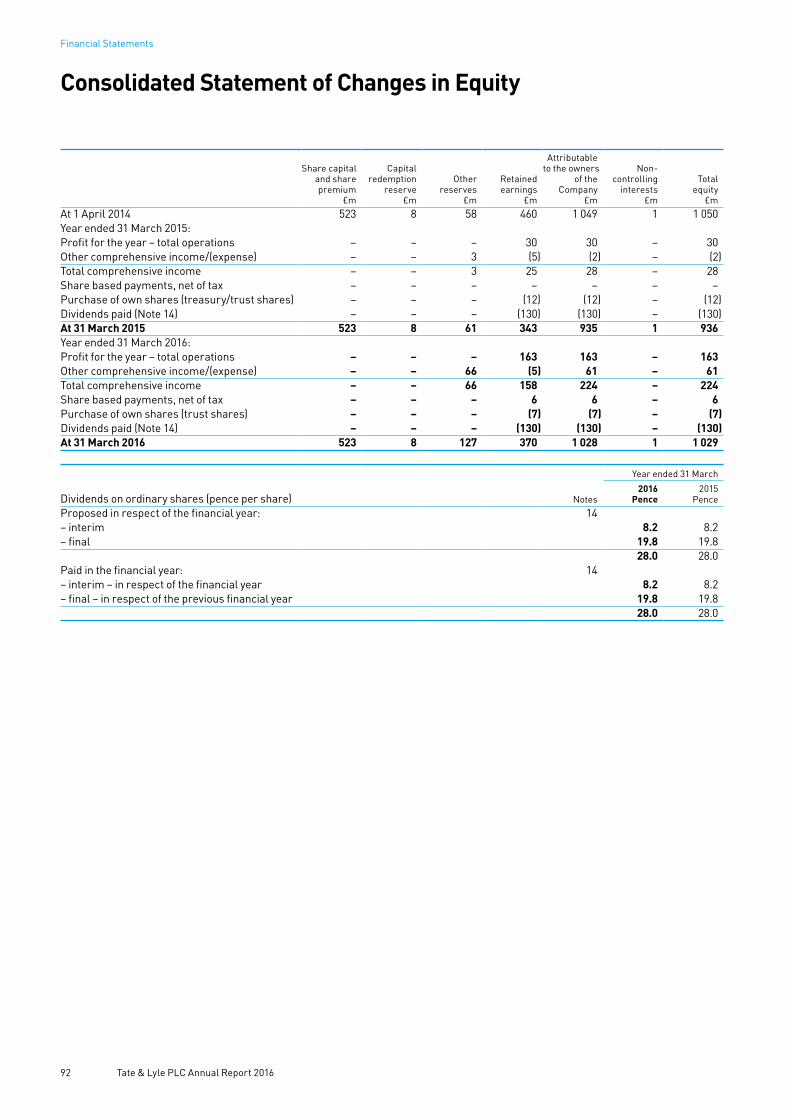
Share capital and share premium
£m
Capital redemption
reserve£m
Other reserves
£m
Retained earnings
£m
Attributable to the owners
of theCompany
£m
Non-controlling
interests£m
Total equity
£mAt 1 April 2014 523 8 58 460 1 049 1 1 050 Year ended 31 March 2015:Profit for the year – total operations – – – 30 30 – 30 Other comprehensive income/(expense) – – 3 (5) (2) – (2)Total comprehensive income – – 3 25 28 – 28 Share based payments, net of tax – – – – – – – Purchase of own shares (treasury/trust shares) – – – (12) (12) – (12)Dividends paid (Note 14) – – – (130) (130) – (130)At 31 March 2015 523 8 61 343 935 1 936 Year ended 31 March 2016:Profit for the year – total operations – – – 163 163 – 163 Other comprehensive income/(expense) – – 66 (5) 61 – 61 Total comprehensive income – – 66 158 224 – 224 Share based payments, net of tax – – – 6 6 – 6 Purchase of own shares (trust shares) – – – (7) (7) – (7)Dividends paid (Note 14) – – – (130) (130) – (130)At 31 March 2016 523 8 127 370 1 028 1 1 029
Year ended 31 March
Dividends on ordinary shares (pence per share) Notes2016
Pence2015
PenceProposed in respect of the financial year: 14 – interim 8.2 8.2 – final 19.8 19.8
28.0 28.0Paid in the financial year: 14– interim – in respect of the financial year 8.2 8.2 – final – in respect of the previous financial year 19.8 19.8
28.0 28.0
92 Tate & Lyle PLC Annual Report 2016
Financial Statements
Consolidated Statement of Changes in Equity
1. Basis of preparationDescription of businessTate & Lyle PLC (the Company) is a public limited company incorporated and domiciled in the United Kingdom. The Company’s ordinary shares are listed on the London Stock Exchange.
The Company and its subsidiaries (together ‘the Group’) provides ingredients and solutions to the food, beverage and other industries. The Group operates from numerous production facilities around the world.
The Group’s continuing operations comprise two operating segments: Speciality Food Ingredients (SFI) and Bulk Ingredients (BI). Segment information is presented in Note 5.
Accounting periodThe Group’s annual financial statements are drawn up to 31 March. These financial statements cover the year ended 31 March 2016 with comparative financials for the year ended 31 March 2015.
Basis of accountingThe consolidated financial statements on pages 88 to 149 have been prepared in accordance with International Financial Reporting Standards (IFRS) and related interpretations as adopted for use in the European Union and those parts of the Companies Act 2006 that are applicable to companies reporting under IFRS.
The directors are satisfied that the Group has adequate resources to continue to operate for a period not less than 12 months from the date of approval of the financial statements and that there are no material uncertainties around their assessment. Accordingly, the directors continue to adopt the going concern basis of accounting.
The Group’s principal accounting policies are set out in Note 2 and Note 3 and have been consistently applied throughout the year.
Functional and presentation currencyThe consolidated financial statements are presented in pounds sterling, which is also the Company’s functional currency. All amounts are rounded to the nearest million, unless otherwise indicated.
Accounting standards adopted during the yearIn the current year, the Group has adopted the Defined Benefit Plans: Employee Contributions – Amendments to IAS 19, as well as the Annual Improvements to IFRS – 2010-12 and 2011-13 Cycles. These amendments have had no material effect on the Group’s financial statements.
Use of adjusted measuresThe Group also presents adjusted performance measures, including adjusted operating profit, adjusted
profit before tax, adjusted earnings per share and adjusted free cash flow, which are used for internal performance analysis and incentive compensation arrangements for employees. These measures are presented because they provide investors with valuable additional information about the performance of the business. For the periods presented, adjusted performance measures exclude, where relevant, exceptional items, the amortisation of acquired intangible assets, net retirement benefit interest and the tax on those items.
Adjusted measures were previously presented on a proportionately consolidated basis (whereby the Group’s share of the income and expenses, assets and liabilities and cash flows of joint ventures was combined on a line-by-line basis with those of Tate & Lyle PLC and its subsidiaries) reflecting the Group’s previous management of its joint ventures on an integrated basis with its subsidiaries. Following re-alignment of the Group’s Eaststarch joint venture on 31 October 2015, adjusted performance measures are now presented on an equity accounted basis with restated comparatives. Under the equity method of accounting, the Group’s share of the after tax profits and losses of joint ventures are shown as one line of the consolidated income statement, its share of their net assets are shown as one line of the consolidated statement of financial position and the consolidated statement of cash flows reflects cash flows between the Group and the joint ventures (investments in and dividends received from joint ventures) within cash flows from investing activities.
Adjusted performance measures reported by the Group are not defined terms under IFRS and may therefore not be comparable with similarly-titled measures reported by other companies.
Reconciliations of the adjusted performance measures to the most directly comparable IFRS measures are presented in Note 4.
2. Principal accounting policies requiring significant judgements and estimatesIn preparing these consolidated financial statements, management has made judgements and used estimates and assumptions in establishing the reported amounts of assets, liabilities, income and expense under the Group’s accounting policies. Judgements are based on the best evidence available to management. Estimates are based on factors including historical experience and expectations of future events, corroborated with external information where possible. Judgements and estimates and their underlying assumptions are reviewed and updated on an ongoing basis, with any revisions being
recognised prospectively. However, given the inherent uncertainty of such estimates, the actual results might differ significantly from the anticipated ones.
The accounting policies and information about the accounting estimates and judgements made in applying these accounting policies that have the most significant effect on the amounts recognised in the consolidated financial statements are set out below.
Fair value measurement(this accounting policy applies principally to Available-for-sale assets; Derivatives and hedge accounting; Financial instruments – fair value and risk management; and Retirement benefit obligations;– see Notes 18, 28, 29, and 30)
A number of the Group’s accounting policies and disclosures require the measurement of fair value for either financial or non-financial assets and liabilities. Examples of the former include loans, interest rate swaps, and commodity contracts; examples of the latter include intangibles and property, plant and equipment acquired in a business combination.
Fair value is the amount of money, or other consideration, expected to be exchanged for an asset or a liability in an arm’s length transaction. When measuring fair value, the Group takes into account the characteristics of the asset or liability and uses observable market data, such as prices quoted on a recognised exchange, to the greatest extent possible. Where such data is not available, the Group has an established framework in place that deals with setting, monitoring and evaluating non-observable inputs, including the respective classification of the fair value measurements. Such unobservable inputs are based on management’s own assessment of market and other conditions currently prevailing or expected to prevail.
Fair value measurements are categorised into three different levels based on the degree to which the inputs used to arrive at the fair value of the assets and liabilities are observable and the significance of the inputs to the fair value measurement in its entirety, as follows:
• Level 1 inputs are quoted prices (unadjusted) in active markets for identical assets or liabilities that the entity can assess at the measurement date. The prices of equity shares or bonds quoted on the London Stock Exchange are examples of Level 1 inputs
• Level 2 inputs are inputs, other than quoted prices included in Level 1, that are observable either directly or indirectly. Most interest rate swaps fall in this category as their prices are referenced to a published rate curve, but it is not price specific to the swap itself
93 Tate & Lyle PLC Annual Report 2016
Strategic ReportG
overnanceFinancial Statem
entsU
seful Information
Financial Statements
Notes to the Consolidated Financial Statements
2. Principal accounting policies requiring significant judgements and estimates continued • Level 3 inputs are unobservable inputs.
The Group generally classifies assets or liabilities as Level 3 when their fair value is determined using unobservable inputs that individually, or when aggregated with other unobservable inputs, represent more than 10% of the fair value of the observable inputs of the assets or liabilities. This would include expected future cash flows from budgets and forecasts the entity has made. Certain elements of the Group’s commodity contract portfolio also fall into this category, as their values include significant management-derived assumptions.
Judgements and estimates in respect of corn and co-product positionsCorn and co-product inventories held in the US business are measured at net realisable value since they are considered to be agricultural produce after harvest. The Group uses financial instruments (mainly forward contracts) to manage price risk within its US business, by hedging the contracted amount of corn when either business division (Bulk Ingredients or Speciality Food Ingredients) enters into a finished good sales contract.
The elements of the Group’s US net corn position are accounted for as follows:
• Contracts for the physical purchase of corn in respect of corresponding committed sales of finished goods are marked to market in accordance with IAS 39 with any gains or losses recognised in the income statement
• Corn inventories are measured at net realisable value in accordance with IAS 2.3, with any gains or losses recognised in the income statement
• Financial instruments (futures and options) are carried at fair value with any gains or losses recognised immediately in the income statement.
Although the Group manages corn price risk by entering into offsetting ‘back-to-back’ corn positions, there is still underlying price risk on the basis cost that must be paid to get delivery of the corn to its plants. This basis is the difference in price between that at which a farmer will sell and the price on the Chicago Mercantile Exchange (CME), and is typically driven by local supply, demand and logistics factors, requiring estimation for valuation purposes.
The production of finished goods from corn also results in the production of three co-products (corn gluten feed, corn gluten meal, and corn oil). The price risk associated with these co-products cannot readily be hedged as there are no actively traded markets for these commodities. Whilst the Group actively manages its overall co-product positions in the US, the Group can hold either a net long or short position for each co-product based on the volume of co-products made, bought (or short sold) and forward sold at any point in time. These positions are measured at fair value at each reporting date, with gains and losses recognised in the income statement.
Management exercises significant judgement in deriving these fair values, which involves estimating the price at which the Group will purchase or sell these co-product positions in the future. These inputs are classified as unobservable, and are derived by in-house experts, with reference to sources such as: the expected supply and demand for corn and substitute products, expectations of weather conditions, and historical published co-product pricing levels over a period of up to three months from the balance sheet date.
Whilst it is possible to model the sensitivity of profit to changes in any one of the key assumptions, it is important to note that, due to the complexity and interdependence of related assumptions, the overall (net) impact in reality is likely to be different.
The accounting for corn and co-product positions can create significant volatility in the Group’s income statement, although the use of such contracts is critical to the business as it effectively limits the Group’s exposure to fluctuating market prices.
Full details of the valuation technique are included in Note 29.
Taxation(this accounting policy principally applies to Income taxes – see Note 12)
Taxable profit differs from accounting profit because it excludes certain items of income and expense that are recognised in the financial statements but are treated differently for tax purposes.
Current tax is the amount of tax expected to be payable or receivable on the taxable profit or loss for the current period. This amount is then amended for any adjustments in respect of prior periods. Current tax is calculated using tax rates that have been written into law (‘enacted’) or irrevocably announced/committed by the respective government (‘substantively enacted’) at the period-end date.
Current tax receivable (assets) and payable (liabilities) are offset only when there is a legal right to settle them net and the entity intends to do so. This is generally true when the taxes are levied by the same tax authority.
Because of the differences between accounting and taxable profits and losses reported in each period, temporary differences arise on the amount certain assets and liabilities are carried at for accounting purposes and their respective tax values. Deferred tax is the amount of tax payable or recoverable on these temporary differences.
Deferred tax liabilities arise where the carrying amount of an asset is higher than the tax value (more tax deduction has been taken). This can happen where the Group invests in capital assets, as governments often encourage investment by allowing tax depreciation to be recognised faster than accounting depreciation. This reduces the tax value of the asset relative to its accounting carrying amount. Deferred tax liabilities are generally provided on all taxable temporary differences. The periods over which such temporary differences reverse will vary depending on the life of the related asset or liability.
Deferred tax assets arise where the carrying amount of an asset is lower than the tax value (less tax benefit has been taken). This can happen where the Group has trading losses, which cannot be offset in the current period but can be carried forward. Deferred tax assets are recognised only where the Group considers it probable that it will be able to use such losses by offsetting them against future taxable profits.
Taxable temporary differences can also arise on investments in foreign subsidiaries and associates, and interests in joint ventures. Where the Group is able to control the reversal of these differences and it is probable that these will not reverse in the foreseeable future, then no deferred tax is provided.
Deferred tax is calculated using the enacted or substantively enacted rates that are expected to apply when the asset is realised or the liability is settled.
Similarly to current taxes, deferred tax assets and liabilities are offset only when there is a legal right to settle them net and the entity intends to do so. This normally requires both assets and liabilities to have arisen in the same country.
Notes to the Consolidated Financial Statements continued
94 Tate & Lyle PLC Annual Report 2016
Financial Statements

2. Principal accounting policies requiring significant judgements and estimates continued Income tax expense reported in the financial statements comprises current tax as well as the effects of changes in deferred tax assets and liabilities. Tax expense/credits are generally recognised in the same place as the items to which they relate. For example, the tax associated with a gain on disposal is recognised in the income statement, in line with the gain on disposal. Equally, the tax associated with pension obligation actuarial gains and losses is recognised in other comprehensive income, in line with the actuarial gains and losses.
Judgements and estimatesThe Group operates in a large number of countries around the world. Uncertainties exist in relation to the interpretation of complex tax legislation, changes in tax laws, and the amount and timing of future taxable income. In some jurisdictions agreeing tax liabilities with local tax authorities can take several years. This could necessitate future adjustments to taxable income and expense already recorded.
At the period-end date, tax liabilities and assets are based on management’s best judgements around the application of the tax regulations and management’s estimate of the future amounts that will be settled. Management considers tax exposures individually, and arrives at judgements with support from experienced tax professionals and external advisors. There is, however, a risk that the Group’s judgements are challenged by the tax authorities, resulting in a different tax payable or recoverable from the amounts that have been provided.
As described in Note 12, the Group has internal funding structures that favourably affect the amount of tax payable. In management’s view, these structures are compliant with the relevant tax regulations.
Deferred tax assets are recognised for unused tax losses only to the extent that it is probable that taxable profit will be available against which the losses can be utilised. Management judgement is required to determine the amount of deferred tax that should be recognised, dependent on the anticipated timing and quantum of future taxable profit.
The three key uncertainties impacting taxation arise from potential changes to legislation. Firstly, the OECD’s Base Erosion and Profit Shifting (BEPS) project is one of the most significant multilateral initiatives in recent years for modifying international tax rules. As these recommendations are introduced into local tax legislation over the coming years, this may impact the Group’s effective tax rate. Secondly, the UK government announced in March 2016 draft changes to UK tax legislation. Whilst this legislation has yet to be finalised, these changes could impact our ability to utilise brought forward losses in the UK in the future. Lastly, the new US Related Party Debt Regulations issued in draft in early April 2016 may, if finalised, impact the Group’s financing of its US operations and the Group’s effective tax rate.
The Group’s operating model involves significant volumes of cross-border supply of goods into numerous end markets, and the provision of services from one jurisdiction to another. There is a risk that different tax authorities could seek to assess higher profits (or lower costs) to activities being undertaken in their jurisdiction, potentially leading to higher total tax payable by the Group.
The amount provided at 31 March 2016 in respect of uncertain tax positions totalled £31 million (2015 – £29 million). Based on all substantively enacted legislation, the Group believes that no reasonably possible change in assumptions would lead to a material change in this number.
Retirement benefit plans(this accounting policy principally applies to retirement benefit obligations – see Note 30)
The Group operates both defined contribution and defined benefit pension plans principally in the UK and the US and unfunded retirement medical plans in the US.
a) Defined benefit plansFor accounting purposes a valuation of each of the defined benefit plans is carried out annually at 31 March using independent qualified actuaries. Benefit obligations are measured using the projected unit credit method and are discounted using the market yields on high quality corporate bonds denominated in the same currency as, and of similar duration to, the benefit obligations. Plan assets are measured at their fair value at the period-end date. Where a plan holds a qualifying insurance policy, the fair value of the policy is deemed to be equivalent to the present value of the related benefit obligations.
A deficit or surplus is recognised on each plan, representing the difference between the present value of the benefit obligation and the fair value of the plan assets. Where a plan is in surplus, the surplus recognised is limited to the present value of any amounts that the Group expects to recover by way of refunds or a reduction in future contributions.
The costs of the defined benefit plan that are recognised in the income statement include the current service cost, any past service cost and the interest on the net deficit or surplus. Gains or losses on curtailments or settlements of the plans are recognised in the income statement in the period in which the curtailment or settlement occurs. Plan administration costs incurred by the Group are also recognised in the income statement.
Current service cost represents the increase in the present value of the benefit obligation due to benefits accrued during the period, less employee contributions. Past service cost represents the change in the present value of the benefit obligation that arises from benefit changes that are applied retrospectively to benefits accrued in previous years. Any past service cost is recognised in full in the period in which the benefit changes are made.
Interest on the net deficit or surplus is calculated by applying the discount rate that is used in measuring the present value of the benefit obligation to the deficit or surplus.
Remeasurements of the deficit or surplus are recognised in other comprehensive income. Remeasurements comprise differences between the actual return on plan assets (less asset management expenses) and the interest on the plan assets and actuarial gains and losses. Actuarial gains and losses represent the effect of changes in the actuarial assumptions made in measuring the present value of the benefit obligation and experience differences between those assumptions and actual outcomes. Actuarial gains and losses are recognised in full in the period in which they occur.
b) Defined contribution plans Contributions made by the Group to defined contribution pension schemes are recognised in the income statement in the period in which they fall due.
95 Tate & Lyle PLC Annual Report 2016
Financial Statements | Notes to the Consolidated Financial Statements
Strategic ReportG
overnanceFinancial Statem
entsU
seful Information
2. Principal accounting policies requiring significant judgements and estimates continued Judgements and estimatesAt 31 March 2016, the present value of the benefit obligations on the plans was £1,634 million (2015 – £1,761 million), including £66 million (2015 – £69 million) in respect of the unfunded medical plans. The present value of the benefit obligations is based on actuarial estimates of the future benefits that will be payable to the members of the plans. As such, the benefit obligations are based on a number of assumptions, changes to which could have a material impact on the reported amounts.
The present value of the benefit obligations is most sensitive to the discount rate applied to the benefit obligations, assumed life expectancies, and expected future price inflation rates. Whilst the Group establishes the assumptions on a consistent basis reflecting advice from qualified actuaries, based on published indices and other actuarial data, management must apply judgement in selecting the most appropriate value from within an acceptable range.
Changes in the assumptions used in determining the present value of the benefit obligations will have an impact on the Group’s income statement through their effect on the service cost and the interest on the net deficit or surplus in the plans. However, most of the impact of such changes, together with fluctuations in the actual return on the plan assets, will be reflected in other comprehensive income.
Impairment of non-financial assets(this accounting policy principally applies to Goodwill and other intangibles; and Property, plant and equipment – see Notes 19 and 20)
Property, plant and equipment and intangible assets are reviewed for impairment whenever any events or changes in circumstances indicate that their carrying amounts may not be recoverable.
If such an indication exists, then the recoverable amount of the asset is estimated. In addition, goodwill is tested for impairment annually.
An asset is impaired to the extent that its carrying amount exceeds its recoverable amount. An asset’s recoverable amount represents the higher of the benefit which the entity expects to derive from the asset over its life, discounted to present value (value in use) and the net price for which the entity can sell the asset in the open market (fair value less costs of disposal). The discount rate used for the value in use calculation is a pre-tax rate that reflects the risks specific to the asset or groups of assets tested.
For the purpose of impairment testing, assets are grouped together into the smallest group of assets which has cash inflows that are largely independent of the cash inflows from other assets or groups of assets. This could also be a single asset. Goodwill does not generate cash inflows independently and is, therefore, tested for impairment at the level of the Cash Generating Unit (‘CGU’) or group of CGUs to which it is allocated. Note 19 shows the allocation of goodwill to CGUs for impairment testing purposes.
When goodwill is tested for impairment and the carrying amount of the CGU or group of CGUs to which it is allocated exceeds its recoverable amount, the impairment is allocated first to reduce the carrying amount of the goodwill and then pro-rata to the other non-financial assets belonging to the CGU or group of CGUs on the basis of their respective carrying amounts.
Impairment losses are recognised in the income statement. Impairment losses recognised in previous periods for assets other than goodwill are reversed if there has been a change in the estimates used to determine the asset’s recoverable amount. Such reversals are limited to the carrying amount of the asset had no impairment been recognised in previous periods. Impairment losses recognised in respect of goodwill cannot be reversed.
Asset impairments have the potential to significantly impact operating profit. In order to determine whether impairments are required, the Group estimates the recoverable amount of the asset. This calculation is usually based on projecting future cash flows over a five-year period and using a terminal value to incorporate expectations of growth thereafter. A discount factor is applied to obtain a present value (‘value in use’). The ‘fair value less costs of disposal’ of an asset may be used where this results in an amount in excess of ‘value in use’.
Judgements and estimatesEstimated future cash flows for impairment calculations are based on management’s expectations of future volumes and margins based on plans and best estimates of the productivity of the assets in their current condition. Future cash flows therefore exclude benefits from major expansion projects requiring future capital expenditure where that expenditure has not been approved and committed on the dates the assets are tested.
Future cash flows are discounted using a discount rate appropriate for the cash generating unit being tested. The discount rate is impacted by estimates of interest rates, equity returns and market and country-related risks. The Group’s weighted average cost of capital, which is used as the initial reference point for the discount rate before any asset specific adjustments are made, is reviewed on a regular basis. If the cash flow or discount rate assumptions were to change because of market conditions, the level of impairment could be different and could result in the asset impairment being increased or reversed, in part or in full, at a future date.
Provisions and contingent liabilities(see Note 32)
A provision is a liability of uncertain timing or amount that is recognised when: 1) the Group has a present obligation (legal or constructive) as a result of a past event; 2) it is more likely than not that a payment will be required to settle the obligation; and 3) the amount can be reliably estimated.
Where a payment is not probable, or the amount of the obligation cannot be measured with sufficient certainty, a contingent liability is disclosed.
Contingent liabilities are also disclosed if a possible obligation arises from past events, but its existence will be confirmed only by the occurrence or non-occurrence of uncertain future events.
Provisions are determined by discounting the expected future payments using a pre-tax discount rate that reflects current market assessments of the time value of money and, where appropriate, the risks specific to the liability. The unwinding of any discount is recognised in the income statement within finance expense. The impact of any discounting is not material to the Group.
Notes to the Consolidated Financial Statements continued
96 Tate & Lyle PLC Annual Report 2016
Financial Statements

2. Principal accounting policies requiring significant judgements and estimates continued Provision is made for restructuring costs when a detailed formal plan for the restructuring has been determined and the plan has been communicated to those affected by it. Gains from the expected disposal of assets are not taken into account in measuring restructuring provisions. Future operating losses are not provided for.
Provisions are recognised for onerous contracts to the extent that the benefits expected to be derived from a contract are lower than the unavoidable cost to the Group of meeting its obligations under the contract. Before establishing the amount of the provision, any impairment losses on assets associated with the contract are recognised.
Judgements and estimatesThe Group is subject to claims and litigation generally arising in the ordinary course of its business, some of which are for substantial amounts. All such actions are strenuously defended but provision is made for liabilities that are considered likely to arise on the basis of current information and legal advice and after taking into account the Group’s insurance arrangements. Whilst there is always uncertainty as to the outcome of any claim or litigation, it is not expected that claims and litigation existing at 31 March 2016 will have a material adverse effect on the Group’s financial position.
At 31 March 2016, provisions included amounts for insurance claims payable by the Group’s reinsurance company, legal matters, employee termination and other restructuring costs. These have been based on management’s judgement as to whether any obligation, legal or otherwise, existed at the balance sheet date and if so management’s estimate of the likelihood, magnitude and timing of future payments related to the obligation.
3. Other principal accounting policies The consolidated financial statements have been prepared under the historical cost convention, modified in respect of the revaluation to fair value of available-for-sale financial assets, derivative financial instruments, assets classified as held for sale, assets held by defined benefit pension plans and intangible and tangible assets acquired in a business combination.
Basis of consolidationa) Business combinationsA business combination is a transaction or other event in which the Group obtains
control over a business. Business combinations are accounted for using the acquisition method, the key elements of which are below.
Identifiable assets and liabilities of the acquired business are generally measured at their fair value at the acquisition date. Retirement benefit obligations and deferred tax assets and liabilities are measured in accordance with the Group’s accounting policies.
Consideration transferred represents the sum of the fair values at the acquisition date of the assets given, liabilities incurred or assumed and equity instruments issued by the Group in exchange for control over the acquired business. Acquisition-related costs are charged to the income statement in the period in which they are incurred.
Any non-controlling interest in the acquired business is measured either at fair value or at the non-controlling interest’s proportionate share of the identifiable assets and liabilities of the business.
Put options written by the Group over non-controlling interests are initially recognised as a liability measured at the present value of the exercise price with a corresponding charge directly to equity. Subsequently, the liability is measured at the present value of the expected redemption amount and re-measured in accordance with IAS 39 (at amortised cost), with changes recognised in the income statement.
Goodwill arising in a business combination represents the excess of the sum of the consideration transferred, the amount of any non-controlling interest in the acquired business and, where a business combination is achieved in stages, the fair value at the acquisition date of the Group’s previously held equity interest, over the net total of the identifiable assets and liabilities of the acquired business at the acquisition date. Any re-measurement gain or loss on the previously held equity interest is recognised in the income statement. Any shortfall, or negative goodwill, is recognised immediately as a gain in the income statement.
Changes in the Group’s ownership interest in a subsidiary that do not result in a loss of control are accounted for within equity. Any gain or loss upon loss of control is recognised in the income statement.
b) SubsidiariesSubsidiaries are all entities (including structured entities) over which the Group has control. The Group controls an entity when the Group is exposed to, or has rights to, variable returns from its involvement with the entity and has the ability to affect those returns through its power over the entity. Subsidiaries are consolidated from the date on which the Group obtains
control. They are deconsolidated from the date that control ceases.
A non-controlling interest in a subsidiary represents the share of the net assets of the subsidiary that is attributable to the equity interest in the subsidiary that is not owned by the Group.
The Group’s income and expenses, assets and liabilities and cash flows include those of each of its subsidiaries from the date on which the Company obtains control until such time as control is lost. Inter-company transactions, balances and unrealised gains or losses on transactions between group companies are eliminated.
c) Equity accounted investmentsAn associate is an entity over which the Group has significant influence. Significant influence is the power to participate in financial and operating policy decisions but not to control or jointly control them.
A joint venture is an entity or a contractual arrangement under which the Group and other parties undertake activities that are subject to joint control, whereby the Group has rights to the net assets of the arrangement rather than to the arrangement’s assets or obligations for its liabilities.
Interests in associates and joint ventures (together ‘Equity accounted investments’) are accounted for under the equity method. They are initially recognised at cost, which includes transaction costs. Subsequently, the Group’s share of the profit or loss, other comprehensive income and net assets are shown on one line of the relevant primary financial statements, until the date on which significant influence or joint control ceases.
Losses of an equity accounted investment in excess of the Group’s interest in the entity are not recognised, except to the extent that the Group has incurred obligations or made payments on behalf of the investment.
Unrealised profits or losses on transactions between the Group and its equity accounted investments are eliminated to the extent of the Group’s interest. Losses are, however, recognised in full where they represent a reduction in the net realisable value of a current asset or an impairment loss.
97 Tate & Lyle PLC Annual Report 2016
Financial Statements | Notes to the Consolidated Financial Statements
Strategic ReportG
overnanceFinancial Statem
entsU
seful Information
3. Other principal accounting policies continuedDiscontinued operations(see Note 8)
An operation is classified as discontinued if it is a component of the Group that: (i) has been disposed of, or meets the criteria to be classified as held for sale; and (ii) represents a separate major line of business or geographic area of operations; and (iii) will be disposed of as part of a single co-ordinated plan to dispose of a separate major line of business or geographic area of operations.
The results, assets and liabilities and cash flows of discontinued operations are presented separately from those of continuing operations.
Discontinued operations are comprised of the following activities:
• Eaststarch/Morocco
On the 31 October 2015, the Group completed the re-alignment of its Eaststarch joint venture leading to the disposal of the majority of the Group’s European bulk ingredients business. In a related agreement, the Group also agreed to sell its corn wet mill in Casablanca, Morocco to Archer Daniels Midland Company Inc. (ADM) and the assets and liabilities to be disposed of as part of the transaction were classified as held for sale at 31 March 2016.
Comparative financial information for the year ended 31 March 2015 has been restated to reflect the disclosure of the financial performance of these operations as discontinued operations. There is no overall effect on the Group’s prior year profit for the period from total operations.
• ASR and European Starch Pensions settlements
The Group announced on 29 September 2015 that the Commercial Court in London had handed down a decision in a case brought by American Sugar Refining, Inc. (ASR) in which it made a number of claims in relation to its acquisition of the Group’s European Sugars business in 2010. The European Sugars business formed part of the Group’s discontinued Sugars segment, and accordingly the costs associated with those claims are recognised within discontinued operations.
During the year, the Group made a settlement payment of £2 million to transfer all remaining obligations under a legacy pension scheme related to the Group’s discontinued European Starch business, which was disposed of in the 2008 financial year.
Foreign currency translation(this accounting policy applies to all transactions and net assets in foreign currencies)
At entity level, transactions in foreign currencies are translated into the entity’s functional currency at the exchange rate ruling at the date of the transaction. Monetary assets and liabilities denominated in foreign currencies are translated at the exchange rate ruling at the period-end date. Currency translation differences arising at entity level are recognised in the income statement.
The consolidated financial statements are presented in pounds sterling. On consolidation, the results of foreign operations are translated into pounds sterling at the average rate of exchange for the period and their assets and liabilities are translated into pounds sterling at the exchange rate ruling at the period-end date. Currency translation differences arising on consolidation are recognised in other comprehensive income and taken to the currency translation reserve.
Goodwill and fair value adjustments arising on the acquisition of a foreign operation are treated as assets and liabilities of the foreign operation and translated accordingly.
When a foreign operation is sold, the gain or loss on disposal recognised in the income statement is determined after taking into account the recycling of cumulative currency translation differences arising on consolidation of the operation subsequent to the adoption of IFRS.
In the cash flow statement, the cash flows of foreign operations are translated into pounds sterling at the average exchange rate for the period.
Revenue recognition(this accounting policy relates to Notes 5 and 6)
a) Sales of goods and servicesRevenue comprises the fair value of consideration receivable in the ordinary course of business, net of value added and sales taxes, rebates and discounts and after eliminating sales within the Group. Sales are recognised at the point or points at which the Group has performed its obligations in connection with the contractual terms of the sales agreement, primarily at the point of delivering to the customer, and in exchange obtains the right to consideration. Discounts mainly comprise volume driven rebates. The Group accrues for discounts against agreed customer terms reflecting latest expectations of amounts likely to fall due under the terms of the customer contract, subsequently adjusted for actual performance.
b) Interest incomeInterest income is recognised on a time- proportion basis using the effective interest rate method.
c) Dividend incomeDividend income is recognised when the right to receive payment is established.
Exceptional items(this accounting policy principally relates to Note 7)
Exceptional items comprise items of income and expense, including tax items, that are material in amount, relate to events which are unlikely to recur, are outside the normal course of business and therefore merit separate disclosure in order to provide a better understanding of the Group’s underlying financial performance. Examples of events that give rise to the disclosure of material items of income and expense as exceptional items include, but are not limited to, impairment events, significant business transformation activities, disposals of operations or significant individual assets, litigation claims by or against the Group and restructuring of components of the Group’s operations.
All material amounts relating to exceptional items in the Group’s financial statements are classified on a consistent basis across accounting periods.
Goodwill and other intangible assets(see Note 19)
a) GoodwillGoodwill arising in a business combination is recognised as an intangible asset and is allocated to the Cash Generating Unit (‘CGU’) or group of CGUs that is expected to benefit from the synergies of the business combination. Goodwill is not amortised but is tested for impairment annually.
Goodwill is carried at cost less any recognised impairment losses.
b) Intangible assets other than goodwill Intangible assets other than goodwill are stated at cost less accumulated amortisation and any recognised impairment losses.
c) Acquired in business combinationsAn intangible resource acquired in a business combination is recognised as an intangible asset at its fair value at the date of acquisition, if it is separable from the acquired business or arises from contractual or legal rights. Acquired intangible assets, for example, patents and customer relationships, are amortised on a straight-line basis over the periods of their expected benefit to the Group, which range from three to 15 years.
Notes to the Consolidated Financial Statements continued
98 Tate & Lyle PLC Annual Report 2016
Financial Statements
3. Other principal accounting policies continuedd) Other intangiblesOther intangible assets mainly comprise certain capitalised costs relating to product development, marketing, computer software and the global IS/IT system.
Costs incurred on the development, design and testing of new or improved products are capitalised only when the technical and commercial feasibility of the product has been proven and prior to the product going into full production. Research and other development expenditures are charged to the income statement in the period in which they are incurred.
Other intangible assets are amortised on a straight-line basis over the periods of their expected benefit to the Group, which are in the range of three to ten years. Capitalised costs in respect of the global IS/IT system are being amortised over seven years.
Property, plant and equipment(see Note 20)
Land and buildings mainly comprise manufacturing sites and administrative facilities. Plant and machinery mainly comprise equipment used in the manufacturing and operating process. Assets under the course of construction comprise property, plant and equipment which is in the process of being completed and not ready for use.
Property, plant and equipment is stated at historical cost less accumulated depreciation and impairment. Historical cost includes expenditure that is directly attributable to the acquisition of the items. Subsequent costs are included in the asset’s carrying amount or recognised as a separate asset, as appropriate, only when it is probable that future economic benefits associated with the expenditure will flow to the Group and the cost of the item can be measured reliably. All repairs and maintenance expenditures are charged to the income statement during the period in which they are incurred.
Depreciation is calculated using the straight-line method to allocate the cost of each asset to its residual value over its useful economic life as follows:
Freehold land No depreciation Freehold buildings 20 to 50 years Leasehold property Period of the lease Plant and machinery 3 to 28 years
Residual values and useful lives are reviewed at each period-end date and adjusted as appropriate, with any resulting changes recognised in the income statement prospectively.
Gains and losses on disposals are determined by comparing the disposal proceeds with the carrying amount and are included in the income statement.
Leased assets(see Notes 20, 25, 29 and 33)
Leases of property, plant and equipment where the Group assumes substantially all the risks and rewards of ownership are classified as finance leases. Assets held under finance leases are capitalised at the lower of the fair value of the leased asset and the present value of the minimum lease payments. The corresponding lease commitments, net of finance charges, are included in liabilities. Leasing payments are analysed between capital and interest components so that the interest element is charged to the income statement over the period of the lease at a constant rate of interest.
Depreciation on assets held under finance leases is charged to the income statement, on a straight-line basis over the shorter of the lease term and its useful life.
All other leases are treated as operating leases. The total amount payable under the operating lease, including lease incentives and guaranteed lease increases, is spread over the lease period on a straight-line basis. Where termination or extension options are available to the Group, management considers the likelihood of exercising these options in determining the lease period.
Inventories(see Note 15)
Corn and co-product inventories held in the US business are measured at net realisable value since they are considered to be agricultural produce after harvest, in accordance with IAS 2.3. Gains and losses are recognised in the income statement.
All other inventories are carried at the lower of cost and net realisable value. Cost comprises direct materials and, where applicable, direct labour costs and those overheads that have been incurred in bringing the inventories to their present location and condition and is calculated using the ‘first in/first out’ or ‘weighted average’ methods, appropriate to the materials and production processes involved. Net realisable value represents the estimated selling price less all estimated costs to completion and costs to be incurred in marketing, selling and distribution.
Provisions are made for any slow moving, obsolete or defective inventories.
Financial instruments(see Notes 16, 17, 18, 24, 25, 28 and 29)
a) Trade receivablesTrade receivables are initially recognised at fair value, which is generally the same as the invoiced amount, and subsequently measured at amortised cost, or their recoverable amount. Trade receivables are predominantly short-term and the effects of time-value of money are not considered material.
Where there is objective evidence that the Group will not be able to collect all amounts due according to the original terms of the receivable, the receivable is considered to be impaired. Significant financial difficulties of the debtor, probability that the debtor will enter bankruptcy or financial reorganisation, and default or delinquency in payments are considered to be objective evidence of impairment. The amount of the impairment, and related provision, is the difference between the receivable’s original value and the present value of the estimated future cash flows, discounted at the original effective interest rate. The impairment is recognised in the income statement immediately, and the provision is netted against the value of the receivable. When a trade receivable is deemed uncollectable, it is written off against the related provision.
Subsequent recoveries of amounts previously written off are credited against operating expenses in the income statement in the period in which they are recovered.
b) Trade payablesTrade payables are predominantly short-term and are initially recognised at fair value, which is generally the invoice amount. The effects of time-value of money are not considered material.
c) Cash and cash equivalentsCash and cash equivalents include cash in hand, deposits held at call with banks and other short-term highly liquid investments with original maturities of three months or less and, for the purposes of the cash flow statement only, bank overdrafts where the legal right of offset exists.
99 Tate & Lyle PLC Annual Report 2016
Financial Statements | Notes to the Consolidated Financial Statements
Strategic ReportG
overnanceFinancial Statem
entsU
seful Information

3. Other principal accounting policies continuedd) Available-for-sale financial assetsEquity instruments held by the Group are generally available-for-sale and are carried at fair value, with movements in fair value recognised in other comprehensive income. The Group does not trade with equity instruments and does not manage them on a fair value basis. Where fair value cannot be reliably measured, the assets are carried at cost.
Cumulative fair value gains or losses on an asset are recycled through the income statement when the asset is disposed or impaired. A significant or prolonged decline in the fair value of a security below its cost is considered as an indicator that the securities are impaired. Impairments are recognised in the income statement. Impairment losses recognised in profit or loss for an investment in an available-for-sale equity instrument are not reversed through profit or loss. However, if the fair value of an impaired available-for-sale debt security subsequently increases and the increase can be related objectively to an event occurring after the impairment loss was recognised, then the impairment is reversed through profit or loss.
Other financial assets represent cash held in an escrow account and are carried at fair value.
e) BorrowingsBorrowings are initially measured at fair value, net of transaction costs incurred, which is generally the amount of proceeds received. Borrowings are subsequently measured at amortised cost using the effective interest rate method, whereby the net proceeds are gradually increased to the amount that will be ultimately settled using a constant rate of interest. This constant rate of return is used to calculate the amount recognised as interest expense in the income statement.
As explained under ‘Hedge accounting’ (see below), the carrying amount of a borrowing may be adjusted where it is a hedged liability in a fair value hedge.
Borrowings are classified as current liabilities unless the Group has an unconditional right to defer settlement of the liability for at least 12 months after the period-end date.
Dividends on preference shares that are classified as a liability are recognised in the income statement as interest expense.
f) Derivative financial instrumentsThe Group uses derivative financial instruments to reduce its exposure to commodity price, currency exchange rate and interest rate movements. The Group does not hold or issue derivatives for speculative purposes.
All derivative financial instruments held by the Group are recognised as assets or liabilities measured at their fair values at the period-end date. As explained under ‘Hedge accounting’ below, unless and to the extent that a derivative is in a designated and effective cash flow or net investment hedging relationship, fair value gains and losses on derivatives are recognised in the income statement.
Derivative financial instruments that are not in a designated hedging relationship are classified as held for trading.
g) Embedded derivativesSome contracts may include features that are similar to and expose the Group to the same risks as standalone derivatives. Where such an embedded derivative is not closely related to the host contract and where the host contract itself is not already recognised at fair value, the embedded derivative is separated from the host contract and accounted as a standalone derivative. The hedge accounting principles described below equally apply to embedded derivatives.
h) Offsetting financial instrumentsFinancial assets and financial liabilities are offset and the net amount presented in the statement of financial position only where there is a legally enforceable right to offset them and the Group intends to either settle them on a net basis or realise the asset and settle the liability simultaneously.
Hedge accounting(see Notes 28 and 29)
As described in Note 29, the Group uses derivatives to mitigate risk. In many cases, the changes in the fair value of the derivatives are recognised before the hedged risk affects the Group income statement. For example, when the Group takes out a forward foreign currency contract to fix the exchange rate on committed or highly probable future sales in a foreign currency, changes in the fair value of the forward foreign exchange contract will be recognised in the income statement immediately, whereas the future sale will not affect the income statement until it is made. This creates a mismatch in the timing of recognition for compensating gains and losses. Hedge accounting seeks to mitigate this mismatch by applying specific accounting rules, if strict criteria are met, to the items that create the exposure to risk and the items used to manage that risk.
A hedging relationship principally consists of two items: the hedged item and the hedging instrument. The hedged item is the transaction or balance that exposes the Group to a risk that can be identified and the hedging instrument is the transaction or balance that is used to manage the risk. In the above example, the contract to sell goods at a future date in a foreign currency gives rise to foreign currency transaction exposure for the Group. As exchange rates change, the eventual proceeds from the future sale when expressed in the entity’s functional currency will also change, creating risk. This is the hedged item. In this example, the foreign currency exchange contract the Group takes out locks in a known functional currency value for its foreign currency cash receipt and therefore eliminates the volatility in cash flows on the sale. The forward currency exchange contract is the hedging instrument.
For a hedging relationship to qualify for hedge accounting, it must be documented at inception together with the Group’s risk management objective and strategy for initiating the hedge. The hedge must both be expected to be highly effective in offsetting the changes in cash flows or fair value attributed to the hedged risk and actually be highly effective in doing so. This relationship is demonstrated by matching the terms of hedging instruments very closely to the hedged items, or where the Group uses more complex arrangements, by the use of statistical methods that show the relationship between the hedging pairs.
There are three hedging models that apply to different types of transactions.
a) Cash flow hedgesHedging relationships are classified as cash flow hedges where the hedging instrument hedges exposure to variability in cash flows that are attributable either to a particular risk associated with a recognised asset or liability (such as interest payments on variable rate debt), a highly probable forecast transaction (such as commodity purchases) or the foreign currency risk in a firm commitment (such as the purchase of an item of equipment).
Notes to the Consolidated Financial Statements continued
100 Tate & Lyle PLC Annual Report 2016
Financial Statements

3. Other principal accounting policies continuedWhere a hedging relationship is classified as a cash flow hedge, to the extent that the hedge is effective, changes in the fair value of the hedging instrument are recognised in other comprehensive income rather than in the income statement. When the hedged item affects the income statement, the cumulative fair value gain or loss recognised in other comprehensive income is transferred to the income statement. When a hedged firm commitment results in the recognition of a non-current asset, the initial carrying amount of the asset is adjusted for the cumulative fair value gain or loss.
If the hedging instrument expires or is sold, or if the hedging relationship no longer meets the conditions for hedge accounting, the cumulative fair value gain or loss remains in equity until the forecast transaction is recognised in the income statement. If a hedged forecast transaction is no longer expected to occur, the cumulative fair value gain or loss is immediately transferred to the income statement.
b) Net investment hedges A net investment hedge is the hedge of the currency exposure on the retranslation of the Group’s net investment in a foreign operation.
Net investment hedges are accounted for similarly to cash flow hedges. Changes in the fair value of the hedging instrument are, to the extent that the hedge is effective, recognised in other comprehensive income.
In the event that the foreign operation is disposed of, the cumulative fair value gain or loss recognised in other comprehensive income is transferred to the income statement where it is included in the gain or loss on disposal of the foreign operation.
c) Fair value hedgesHedging relationships are classified as fair value hedges where the hedging instrument hedges the exposure to changes in the fair value of a recognised asset or liability that is attributable to a particular risk (such as the fair value of fixed rate debt).
Where the hedging relationship is classified as a fair value hedge, the carrying amount of the hedged asset or liability is adjusted by the change in its fair value attributable to the hedged risk only and the resulting gain or loss is recognised in the income statement where, to the extent that the hedge is effective, it offsets the fair value gain or loss on the hedging instrument.
Share-based payments(see Note 31)
The Company operates share-based compensation plans under which it grants awards over its ordinary shares to its own employees and to those of its subsidiaries. All of the awards granted under the existing plans are classified as equity-settled awards. The Group recognises a compensation expense that is based on the fair value of the awards measured at the grant date using the Black-Scholes option pricing model. Fair value is not subsequently remeasured unless relevant conditions attaching to the award are modified.
Fair value reflects any market performance conditions and all non-vesting conditions. Adjustments are made to the compensation expense to reflect actual and expected forfeitures due to failure to satisfy service conditions or non-market performance conditions.
The resulting compensation expense is recognised in the income statement on a straight-line basis over the vesting period and a corresponding credit is recognised in equity. In the event of the cancellation of an award, whether by the Group or a participating employee, the compensation expense that would have been recognised over the remainder of the vesting period is recognised immediately in the income statement.
Assets held for sale(see Note 8)
An asset or group of assets is classified as held for sale if its carrying amount will be principally recovered through a sale transaction rather than through continuing use in the business and the following conditions are met:
• it is available for immediate sale in its present condition;
• management has committed to, and has initiated, a plan to sell the asset; and
• the sale is expected to complete within 12 months of the balance sheet date.
Assets that are classified as held for sale are measured at the lower of their carrying amount when they were classified as held for sale and their fair value less costs to sell. Any impairment loss on a disposal group is allocated first to goodwill and then, on a pro-rata basis, to the remaining assets and liabilities other than inventories, financial instruments, investment property, employee benefits and deferred tax assets, which continue to be measured in accordance with the relevant Group accounting policies.
Impairment on the initial recognition of held for sale assets, and gains or losses on subsequent remeasurement, are recognised in the income statement.
Once classified as held for sale, property, plant and equipment and intangible assets are no longer depreciated or amortised. Equity accounted investments are no longer equity accounted when classified as held for sale.
Accounting standards issued but not yet adoptedThe following new standards, new interpretations and amendments to standards and interpretations have been issued and are potentially relevant to the Group but are not effective for the financial year beginning 1 April 2015 and have not been adopted early:
• IFRS 9 Financial instruments (effective 1 January 2018)
• IFRS 15 Revenue from Contracts with Customers (effective 1 January 2018)
• IFRS 16 Leases (effective 1 January 2019)• Various minor improvements to
accounting standards arising from the IASB’s 2012-2014 review cycle.
While the directors do not expect that the adoption of the standards listed above will have a material impact on the financial statements of the Group in future periods, the Group has not yet undertaken a detailed impact assessment of their effect.
101 Tate & Lyle PLC Annual Report 2016
Financial Statements | Notes to the Consolidated Financial Statements
Strategic ReportG
overnanceFinancial Statem
entsU
seful Information
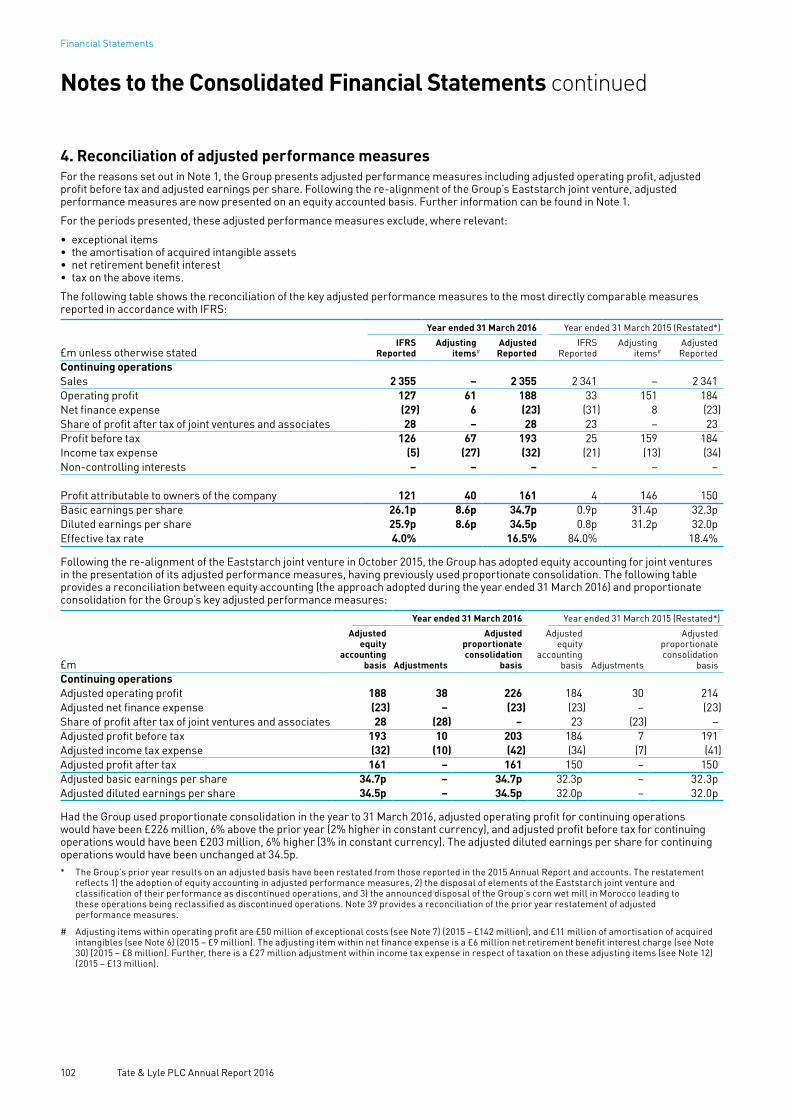
4. Reconciliation of adjusted performance measuresFor the reasons set out in Note 1, the Group presents adjusted performance measures including adjusted operating profit, adjusted profit before tax and adjusted earnings per share. Following the re-alignment of the Group’s Eaststarch joint venture, adjusted performance measures are now presented on an equity accounted basis. Further information can be found in Note 1.
For the periods presented, these adjusted performance measures exclude, where relevant:
• exceptional items • the amortisation of acquired intangible assets• net retirement benefit interest• tax on the above items.
The following table shows the reconciliation of the key adjusted performance measures to the most directly comparable measures reported in accordance with IFRS:
Year ended 31 March 2016 Year ended 31 March 2015 (Restated*)
£m unless otherwise statedIFRS
ReportedAdjusting
items#AdjustedReported
IFRSReported
Adjustingitems#
AdjustedReported
Continuing operationsSales 2 355 – 2 355 2 341 – 2 341Operating profit 127 61 188 33 151 184 Net finance expense (29) 6 (23) (31) 8 (23)Share of profit after tax of joint ventures and associates 28 – 28 23 – 23Profit before tax 126 67 193 25 159 184 Income tax expense (5) (27) (32) (21) (13) (34)Non-controlling interests – – – – – –
Profit attributable to owners of the company 121 40 161 4 146 150Basic earnings per share 26.1p 8.6p 34.7p 0.9p 31.4p 32.3p Diluted earnings per share 25.9p 8.6p 34.5p 0.8p 31.2p 32.0p Effective tax rate 4.0% 16.5% 84.0% 18.4%
Following the re-alignment of the Eaststarch joint venture in October 2015, the Group has adopted equity accounting for joint ventures in the presentation of its adjusted performance measures, having previously used proportionate consolidation. The following table provides a reconciliation between equity accounting (the approach adopted during the year ended 31 March 2016) and proportionate consolidation for the Group’s key adjusted performance measures:
Year ended 31 March 2016 Year ended 31 March 2015 (Restated*)
£m
Adjustedequity
accountingbasis Adjustments
Adjustedproportionateconsolidation
basis
Adjustedequity
accountingbasis Adjustments
Adjustedproportionateconsolidation
basisContinuing operationsAdjusted operating profit 188 38 226 184 30 214 Adjusted net finance expense (23) – (23) (23) – (23)Share of profit after tax of joint ventures and associates 28 (28) – 23 (23) – Adjusted profit before tax 193 10 203 184 7 191 Adjusted income tax expense (32) (10) (42) (34) (7) (41)Adjusted profit after tax 161 – 161 150 – 150Adjusted basic earnings per share 34.7p – 34.7p 32.3p – 32.3p Adjusted diluted earnings per share 34.5p – 34.5p 32.0p – 32.0p
Had the Group used proportionate consolidation in the year to 31 March 2016, adjusted operating profit for continuing operations would have been £226 million, 6% above the prior year (2% higher in constant currency), and adjusted profit before tax for continuing operations would have been £203 million, 6% higher (3% in constant currency). The adjusted diluted earnings per share for continuing operations would have been unchanged at 34.5p.* The Group’s prior year results on an adjusted basis have been restated from those reported in the 2015 Annual Report and accounts. The restatement
reflects 1) the adoption of equity accounting in adjusted performance measures, 2) the disposal of elements of the Eaststarch joint venture and classification of their performance as discontinued operations, and 3) the announced disposal of the Group’s corn wet mill in Morocco leading to these operations being reclassified as discontinued operations. Note 39 provides a reconciliation of the prior year restatement of adjusted performance measures.
# Adjusting items within operating profit are £50 million of exceptional costs (see Note 7) (2015 – £142 million), and £11 million of amortisation of acquired intangibles (see Note 6) (2015 – £9 million). The adjusting item within net finance expense is a £6 million net retirement benefit interest charge (see Note 30) (2015 – £8 million). Further, there is a £27 million adjustment within income tax expense in respect of taxation on these adjusting items (see Note 12) (2015 – £13 million).
Notes to the Consolidated Financial Statements continued
102 Tate & Lyle PLC Annual Report 2016
Financial Statements
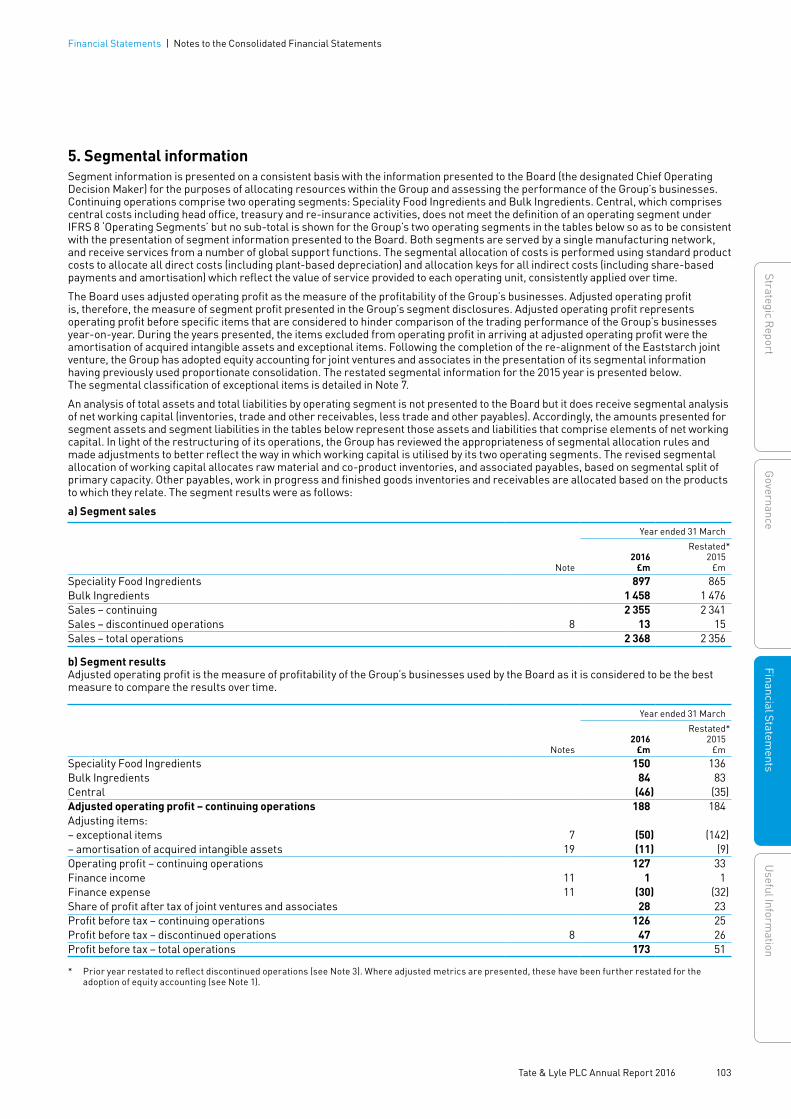
5. Segmental informationSegment information is presented on a consistent basis with the information presented to the Board (the designated Chief Operating Decision Maker) for the purposes of allocating resources within the Group and assessing the performance of the Group’s businesses. Continuing operations comprise two operating segments: Speciality Food Ingredients and Bulk Ingredients. Central, which comprises central costs including head office, treasury and re-insurance activities, does not meet the definition of an operating segment under IFRS 8 ‘Operating Segments’ but no sub-total is shown for the Group’s two operating segments in the tables below so as to be consistent with the presentation of segment information presented to the Board. Both segments are served by a single manufacturing network, and receive services from a number of global support functions. The segmental allocation of costs is performed using standard product costs to allocate all direct costs (including plant-based depreciation) and allocation keys for all indirect costs (including share-based payments and amortisation) which reflect the value of service provided to each operating unit, consistently applied over time.
The Board uses adjusted operating profit as the measure of the profitability of the Group’s businesses. Adjusted operating profit is, therefore, the measure of segment profit presented in the Group’s segment disclosures. Adjusted operating profit represents operating profit before specific items that are considered to hinder comparison of the trading performance of the Group’s businesses year-on-year. During the years presented, the items excluded from operating profit in arriving at adjusted operating profit were the amortisation of acquired intangible assets and exceptional items. Following the completion of the re-alignment of the Eaststarch joint venture, the Group has adopted equity accounting for joint ventures and associates in the presentation of its segmental information having previously used proportionate consolidation. The restated segmental information for the 2015 year is presented below. The segmental classification of exceptional items is detailed in Note 7.
An analysis of total assets and total liabilities by operating segment is not presented to the Board but it does receive segmental analysis of net working capital (inventories, trade and other receivables, less trade and other payables). Accordingly, the amounts presented for segment assets and segment liabilities in the tables below represent those assets and liabilities that comprise elements of net working capital. In light of the restructuring of its operations, the Group has reviewed the appropriateness of segmental allocation rules and made adjustments to better reflect the way in which working capital is utilised by its two operating segments. The revised segmental allocation of working capital allocates raw material and co-product inventories, and associated payables, based on segmental split of primary capacity. Other payables, work in progress and finished goods inventories and receivables are allocated based on the products to which they relate. The segment results were as follows:
a) Segment sales
Year ended 31 March
Note2016
£m
Restated*2015
£mSpeciality Food Ingredients 897 865 Bulk Ingredients 1 458 1 476 Sales – continuing 2 355 2 341 Sales – discontinued operations 8 13 15 Sales – total operations 2 368 2 356
b) Segment resultsAdjusted operating profit is the measure of profitability of the Group’s businesses used by the Board as it is considered to be the best measure to compare the results over time.
Year ended 31 March
Notes2016
£m
Restated*2015
£mSpeciality Food Ingredients 150 136 Bulk Ingredients 84 83 Central (46) (35)Adjusted operating profit – continuing operations 188 184 Adjusting items:– exceptional items 7 (50) (142)– amortisation of acquired intangible assets 19 (11) (9)Operating profit – continuing operations 127 33 Finance income 11 1 1 Finance expense 11 (30) (32)Share of profit after tax of joint ventures and associates 28 23 Profit before tax – continuing operations 126 25 Profit before tax – discontinued operations 8 47 26 Profit before tax – total operations 173 51
* Prior year restated to reflect discontinued operations (see Note 3). Where adjusted metrics are presented, these have been further restated for the adoption of equity accounting (see Note 1).
103 Tate & Lyle PLC Annual Report 2016
Financial Statements | Notes to the Consolidated Financial Statements
Strategic ReportG
overnanceFinancial Statem
entsU
seful Information

5. Segmental information continuedYear ended 31 March
2016Percentage
Restated*2015
PercentageAdjusted operating marginSpeciality Food Ingredients 16.7% 15.7%Bulk Ingredients 5.8% 5.6%Central n/a n/a Total continuing operations 8.0% 7.9%
c) Segment assets/(liabilities) Segment assets and segment liabilities include net working capital (inventories, trade and other receivables, less trade and other payables). An analysis of total assets and total liabilities by operating segment is not presented to the Board.
At 31 March 2016
Assets£m
Liabilities£m
Net£m
Net working capitalSpeciality Food Ingredients 339 (150) 189Bulk Ingredients 341 (146) 195 Central 11 (54) (43)Group working capital – continuing operations 691 (350) 341Group working capital – discontinued operations 5 (2) 3Group working capital – total operations 696 (352) 344Other assets/(liabilities) 1 858 (1 173) 685Group assets/(liabilities) 2 554 (1 525) 1 029
At 31 March 2015 (Restated*)
Assets£m
Liabilities£m
Net£m
Net working capitalSpeciality Food Ingredients 329 (140) 189Bulk Ingredients 312 (153) 159Central 8 (36) (28)Group working capital – continuing operations 649 (329) 320Group working capital – discontinued operations 6 – 6Group working capital – total operations 655 (329) 326Other assets/(liabilities) 1 768 (1 158) 610Group assets/(liabilities) 2 423 (1 487) 936
d) Other information – Depreciation
Year ended 31 March
2016£m
Restated*2015
£mSpeciality Food Ingredients 33 39Bulk Ingredients 46 44Central 1 2Depreciation – continuing operations 80 85Depreciation – discontinued operations 1 –Depreciation – total operations 81 85
* Prior year restated to reflect discontinued operations (see Note 3) and, where appropriate, to reflect segmental allocation rules updated in light of the Group’s restructuring (see narrative on page 103).
Notes to the Consolidated Financial Statements continued
104 Tate & Lyle PLC Annual Report 2016
Financial Statements

5. Segmental information continuede) Other information – Amortisation
Year ended 31 March
2016£m
Restated*2015
£mSpeciality Food Ingredients 27 20Bulk Ingredients 7 3Central 1 1Amortisation – continuing operations 35 24Amortisation – discontinued operations – –Amortisation – total operations 35 24
f) Other information – Share-based payments
Year ended 31 March
2016£m
Restated*2015
£mSpeciality Food Ingredients 3 (1)Bulk Ingredients 3 –Central 3 1Share-based payments – continuing operations 9 –Share-based payments – discontinued operations – –Share-based payments – total operations 9 –
g) Other information – Capital investmentCapital investment comprises the cost of acquisition of businesses and capital expenditure on property, plant and equipment, intangible assets (including amounts accrued) and investments. Capital investment is allocated based on the product(s) to which the investment relates. Where capital expenditure relates to plant sustaining or cost reduction projects, the cost is allocated based on the segmental split of the product mix by plant.
Year ended 31 March
2016£m
Restated*2015
£mSpeciality Food Ingredients 162 105Bulk Ingredients 75 72Central 15 17Capital investment – continuing operations 252 194Capital investment – discontinued operations – 1Capital investment – total operations 252 195
h) Geographical information – Sales by destination
Year ended 31 March
Note2016
£m
Restated*2015
£mUnited Kingdom 31 39United States 1 736 1 694Other European countries 288 296Rest of the world 300 312Sales – continuing operations 2 355 2 341Sales – discontinued operations 8 13 15Sales – total operations 2 368 2 356
* Prior year restated to reflect discontinued operations (see Note 3) and, where appropriate, to reflect segmental allocation rules updated in light of the Group’s restructuring (see narrative on page 103).
105 Tate & Lyle PLC Annual Report 2016
Financial Statements | Notes to the Consolidated Financial Statements
Strategic ReportG
overnanceFinancial Statem
entsU
seful Information
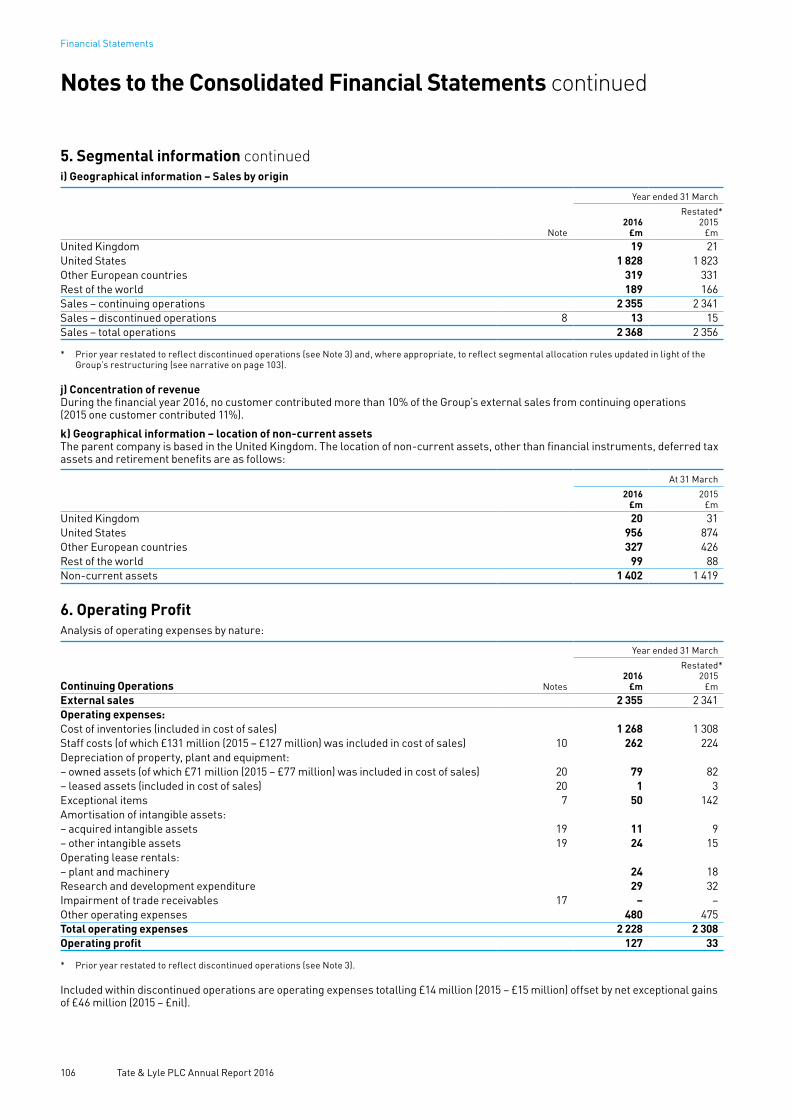
5. Segmental information continuedi) Geographical information – Sales by origin
Year ended 31 March
Note2016
£m
Restated*2015
£mUnited Kingdom 19 21United States 1 828 1 823Other European countries 319 331Rest of the world 189 166Sales – continuing operations 2 355 2 341Sales – discontinued operations 8 13 15Sales – total operations 2 368 2 356
* Prior year restated to reflect discontinued operations (see Note 3) and, where appropriate, to reflect segmental allocation rules updated in light of the Group’s restructuring (see narrative on page 103).
j) Concentration of revenueDuring the financial year 2016, no customer contributed more than 10% of the Group’s external sales from continuing operations (2015 one customer contributed 11%).
k) Geographical information – location of non-current assetsThe parent company is based in the United Kingdom. The location of non-current assets, other than financial instruments, deferred tax assets and retirement benefits are as follows:
At 31 March
2016£m
2015£m
United Kingdom 20 31United States 956 874Other European countries 327 426Rest of the world 99 88Non-current assets 1 402 1 419
6. Operating ProfitAnalysis of operating expenses by nature:
Year ended 31 March
Continuing Operations Notes2016
£m
Restated*2015
£mExternal sales 2 355 2 341Operating expenses:Cost of inventories (included in cost of sales) 1 268 1 308Staff costs (of which £131 million (2015 – £127 million) was included in cost of sales) 10 262 224Depreciation of property, plant and equipment:– owned assets (of which £71 million (2015 – £77 million) was included in cost of sales) 20 79 82– leased assets (included in cost of sales) 20 1 3Exceptional items 7 50 142Amortisation of intangible assets:– acquired intangible assets 19 11 9– other intangible assets 19 24 15Operating lease rentals:– plant and machinery 24 18Research and development expenditure 29 32Impairment of trade receivables 17 – –Other operating expenses 480 475Total operating expenses 2 228 2 308Operating profit 127 33
* Prior year restated to reflect discontinued operations (see Note 3).
Included within discontinued operations are operating expenses totalling £14 million (2015 – £15 million) offset by net exceptional gains of £46 million (2015 – £nil).
Notes to the Consolidated Financial Statements continued
106 Tate & Lyle PLC Annual Report 2016
Financial Statements

7. Exceptional itemsExceptional items recognised in arriving at operating profit were as follows:
Year ended 31 March
Footnotes2016
£m2015
£mContinuing operationsBusiness re-alignment – impairment, restructuring and other net costs (a) (48) (118)Asset impairment reversal (b) 3 – SPLENDA® Sucralose – revised table top commercial agreement (c) (2) – Tate & Lyle Ventures – investment disposal profit net of impairment (d) 7 – US litigation (e) (15) – Slovakia re-measurement gain (f) 5 –Business transformation costs (g) – (12)Termination of distribution rights agreement (g) – (12)Exceptional items – continuing operations (50) (142)
Discontinued operationsBusiness re-alignment – Eaststarch and Morocco disposal (h) 64 – ASR litigation settlement (i) (18) – Exceptional items – discontinued operations 46 –
Exceptional items – total operations (4) (142)
Continuing operations(a) In the year ended 31 March 2016, the Group recognised exceptional costs relating to business re-alignment totalling £48 million.
The Group recognised a net charge of £33 million in the year representing costs arising from the closure of the Singapore sucralose facility. Included in the net charge was a £5 million gain relating to the write back of certain assets previously utilised in Singapore that will be redeployed elsewhere within the Group as part of the business re-alignment. The Group also recognised a charge of £15 million in the year arising from the restructuring of its European operations. Of the total charge, £29 million was paid in cash in the year. Of the £48 million total costs, £43 million were recognised within the Speciality Food Ingredients segment, and £5 million were classified as Central costs.
In the year ended 31 March 2015, the Group recognised a charge of £113 million within the Speciality Food Ingredients segment, comprising an impairment of the property, plant and equipment (£108 million) and associated intangible assets (£5 million) at Singapore. In addition, the Group incurred £5 million of one-off costs associated with the European business re-alignment (primarily consultancy and redundancy costs) which were classified as Central costs.
(b) In the year ended 31 March 2016, the Group has recognised a non-cash exceptional credit of £3 million in respect of the recognition of a partial reversal of an impairment of plant and equipment assets which were previously impaired through an exceptional charge. This exceptional credit was classified within Bulk Ingredients.
(c) In the year ended 31 March 2016, the Group received cash compensation of £5 million related to SPLENDA® Sucralose and the renegotiation of our commercial agreements for the SPLENDA® Sucralose brand table top business following the sale of the SPLENDA® brand by McNeil Nutritionals, LLC. The Group also wrote off a marketing related intangible asset (loss of £9 million) and wrote back an associated payable (gain of £2 million) relating to the former alliance with McNeil. These amounts were all classified within the Speciality Food Ingredients segment.
(d) In the year ended 31 March 2016, the Group realised a £9 million profit on the disposal of part of its venture fund portfolio which was classified as an available-for-sale financial asset within the Group’s consolidated statement of financial position. The Group also recognised £2 million of impairment charges in respect of this portfolio, leaving a net gain in the year of £7 million. Cash proceeds in respect of venture asset disposals totalled £18 million (classified within cash flows from investing activities in the consolidated statement of cash flow) in the year ended 31 March 2016. This net profit was classified within Central costs.
(e) In the year ended 31 March 2016, the Group recognised a £15 million exceptional charge in respect of two US litigation claims.
In November 2015, the Group reached settlement in respect of the claim brought by the American Sugar Association and others relating to alleged false advertising involving high fructose corn syrup (HFCS). The settlement together with associated costs totalled £9 million. These costs were classified within the Bulk Ingredients segment.
107 Tate & Lyle PLC Annual Report 2016
Financial Statements | Notes to the Consolidated Financial Statements
Strategic ReportG
overnanceFinancial Statem
entsU
seful Information

7. Exceptional items continued In addition, the Group has recognised a provision of £6 million in respect of the Passaic River environmental litigation.
In 2007 the Group was notified by the U.S. Environmental Protection Agency (‘USEPA’) that it, along with approximately 70+ others, was a potentially responsible party (‘PRP’) for a 17 mile section of the northern New Jersey Passaic River, which is a major ‘Superfund’ Site. Our involvement in this case derives from a former Staley Chemical Company plant in Kearny, New Jersey (owned by A E Staley until 1978, around ten years prior to the acquisition of A E Staley by Tate & Lyle), which is alleged to have generated hazardous waste which made its way to the Passaic River. In March 2016, the USEPA issued its Record of Decision (‘ROD’) on the likely cost for the remediation that it believes will be required. Prior to this decision, given the status of the litigation, it was not possible to estimate reasonably a possible range of loss and no provision was held in the financial statements. The ROD addresses the clean-up for the (most contaminated) lower 8.3 miles of the river section in question and sets a total assessment of expected costs at $1.38 billion. Based on the current status of the group of PRPs, the Group’s potential share of this cost, should it ultimately be held responsible, is around 0.6%. The Group will continue to defend itself vigorously in this matter, but in light of the publication of the ROD, has recognised a provision as an exceptional expense in the year to 31 March 2016. These costs were classified within Central costs.
(f) In the year ended 31 March 2016, as part of the re-alignment of the Eaststarch joint venture, the Group recognised an exceptional gain of £5 million within continuing operations reflecting the re-measurement to fair value of its existing investment in Slovakia (see Note 34). These costs were classified within the Speciality Food Ingredients segment.
(g) In the year ended 31 March 2015, the Group completed the implementation of a common global IS/IT system, with £12 million recognised as an exceptional cost in the prior period. These costs were classified within Central costs.
In December 2014, the Group made a payment of £12 million to terminate distribution rights previously awarded to a third party to sell our crystalline fructose principally in Asia Pacific. The expense was recognised within the Speciality Food Ingredients segment.
As detailed in Note 12, the tax impact of exceptional items within continuing operations was a £21 million credit (year ended 31 March 2015 – £8 million credit). Tax credits on exceptional costs are only recognised to the extent that losses incurred will result in tax recoverable in the future.
Discontinued operations(h) In the year ended 31 March 2016, the Group recognised a net exceptional gain of £64 million in relation to the exit from a substantial
part of its European bulk ingredients business.
The Group recognised an exceptional profit on disposal of £68 million in respect of the disposal of its share in the Eaststarch joint venture (see Note 8). The profit on disposal includes an amount of £17 million representing the share of profit after tax attributable to the Group whilst the investments were classified as held for sale.
The Group also recognised a £4 million non-cash impairment charge in respect of its bulk ingredients facility in Morocco with an agreement reached with Archer Daniels Midland Inc. (ADM) to purchase this facility. The impairment represents the excess of its net book value over the expected proceeds.
(i) As previously announced, Judgement was handed down on 29 September 2015 in the case brought by American Sugar Refining, Inc. (‘ASR’) in which it made a number of claims totalling around £40 million in relation to its acquisition of the Group’s EU Sugars business in September 2010 for a consideration of £211 million. The Court found in favour of ASR on two elements of its claims, whilst rejecting all other aspects. Accordingly, in the Judgement, the Court has awarded damages of £18 million to ASR. Neither party has appealed the decision and the full amount of damages awarded was paid to ASR at the end of October 2015, together with agreed interest and costs totalling £5 million. At 31 March 2015, the Group held a provision totalling £5 million in respect of this claim. The excess over this provision, amounting to £18 million, is reported as an exceptional item within discontinued operations.
The tax impact on exceptional items within discontinued operations was £nil (2015 – £nil). Tax credits on exceptional costs are only recognised to the extent that losses incurred will result in tax recoverable in the future.
During the year ended 31 March 2016, the Group recognised an exceptional tax charge of £5 million in discontinued operations in respect of historic tax matters relating to the Moroccan facility which the Group has agreed to sell to ADM.
Cash flowsNet cash outflow on exceptional items is as follows:
Year ended 31 March
Footnotes2016
£m2015
£mContinuing operationsBusiness re-alignment – impairment, restructuring and other net costs (a) (29) (5)SPLENDA® Sucralose – revised table top commercial agreement (c) 5 – US litigation (e) (9) –Business transformation costs and termination of distribution rights agreement (g) – (24)Net cash outflow – exceptional items (33) (29)Income statement charge – included in profit before tax 50 142 Add back of non-cash exceptional items – within reconciliation of cash generated from
continuing operating activities 17
113
In addition, there were exceptional cash flows relating to the sale of assets from the Group’s venture fund portfolio totalling £18 million within cash from investing activities.
Notes to the Consolidated Financial Statements continued
108 Tate & Lyle PLC Annual Report 2016
Financial Statements

8. Discontinued operations and assets classified as held for saleOn 31 October 2015, the Group completed the re-alignment of its Eaststarch joint venture. As a result, the Group has substantially exited its European bulk ingredients business by disposing of its share of the plants in Bulgaria, Turkey and Hungary, whilst strengthening its Speciality Food Ingredients business by acquiring full ownership of the plant in Slovakia. In a related agreement, the Group also recently agreed to sell its corn wet mill in Casablanca, Morocco to Archer Daniels Midland Inc. (ADM) and the assets and liabilities of that facility (totalling net £5 million asset) are classified as held for sale at 31 March 2016. The results of the disposed operations in both current and comparative periods have been restated within discontinued operations.
The Group also announced on 29 September 2015 that the Commercial Court in London had handed down a decision in a case brought by American Sugar Refining, Inc. (ASR) in which it made a number of claims in relation to its acquisition of our European Sugars business. The European Sugars business formed part of the Group’s discontinued Sugars segment, and accordingly an exceptional charge of £18 million was recognised within discontinued operations.
In addition, subsequent to the buy-in initiated in 2014 whereby the Group took steps to reduce pensions risks, the Group also made a £2 million payment in order to transfer all remaining obligations under a legacy pension scheme (the Amylum UK Pension Scheme) to a third party provider. The Amylum business formed part of the Group’s discontinued European Starch facilities and accordingly these costs were also recognised within discontinued operations.
The results of the discontinued operations which have been included in the consolidated income statement were as follows:
Discontinued operations Note
Year ended 31 March 2016
Eaststarch/ Morocco
£m
Sugars/ EU Starch
£m
Total Discontinued
£mSales 13 – 13 Operating profit/(loss) including exceptional items 65 (20) 45 Share of profit after tax of joint ventures and associates 2 – 2 Profit/(loss) before tax 67 (20) 47 Income tax charge including exceptional items (5) – (5)Profit/(loss) for the year – discontinued operations 62 (20) 42Basic earnings per share – discontinued operations 13 9.0pDiluted earnings per share – discontinued operations 13 8.9p
Sales of £13 million were recognised by the Group’s corn wet mill in Casablanca, Morocco. The Group realised an exceptional profit on disposal of £68 million in respect of the disposal of the Hungarian, Bulgarian and Turkish Eaststarch plants. The profit on disposal includes an amount of £17 million representing the share of profit after tax attributable to the Group whilst the investments were classified as held for sale, £15 million of which was incorrectly recognised in the Statement of Half Year Results for the six months to 30 September 2015. Under IAS 28 guidance, the profit attributable to a joint venture business whilst held for sale should have been deferred and recognised as part of the profit on disposal. Whilst this has no impact on the Group’s full year results, restatement will be made in the comparative amounts reported in the Group’s statement of half year results for 2017. This exceptional profit was partially offset by a £3 million operating loss in relation to the Group’s corn wet mill in Casablanca, Morocco which included an exceptional impairment charge of £4 million (see Note 7). As noted above, the £20 million loss relating to Sugars and EU Starch is in respect of the £18 million ASR charge and £2 million Amylum UK Pension Scheme payment.
Discontinued operations Note
Year ended 31 March 2015
Eaststarch/Morocco
£m
Sugars/ EU Starch
£m
TotalDiscontinued
£mSales 15 – 15Share of profit after tax of joint ventures and associates 26 – 26Profit before tax and profit for the year – discontinued operations 26 – 26Basic and diluted earnings per share – discontinued operations 13 5.7p
The results of the discontinued operations which have been included in the consolidated cash flow statement were as follows:
Year ended 31 March 2016
Discontinued operations
Eaststarch/ Morocco
£m
Sugars/ EU Starch
£m
Total Discontinued
£mProfit/(loss) before tax from discontinued operations 67 (20) 47 Adjustments for:Exceptional items and changes in working capital (69) (5) (74)Share of profit after tax of joint ventures and associates (2) – (2)Cash used in discontinued operations (4) (25) (29)
There were no cash flows from discontinued operations in the year ended 31 March 2015.
Assets held for saleThe major classes of assets and liabilities of Tate & Lyle Morocco SA are classified as held for sale to ADM as at 31 March 2016. The carrying amounts of assets and liabilities totalled £5 million (consisting of assets totalling £7 million and liabilities totalling £2 million) after recognition of a £4 million impairment charge (see Note 7).
109 Tate & Lyle PLC Annual Report 2016
Financial Statements | Notes to the Consolidated Financial Statements
Strategic ReportG
overnanceFinancial Statem
entsU
seful Information

9. Auditors’ remunerationFees payable to the Company’s external auditors, PricewaterhouseCoopers LLP, and its associates were as follows:
Year ended 31 March
2016£m
2015£m
Fees payable for the audit of the Company and consolidated financial statements 0.7 0.7Fees payable for other services:– the audit of the Company’s subsidiaries 1.2 1.2– audit-related services 0.1 0.1– other non-audit services 0.2 0.2
2.2 2.2Fees in respect of the audit of the Group’s pension schemes 0.1 0.1Total 2.3 2.3
The audit and non-audit fees related to joint ventures payable to PricewaterhouseCoopers LLP and its associates, excluded from the table above, were £nil million (2015 – £0.1 million) and £nil (2015 – £nil) respectively.
10. Staff costsStaff costs were as follows:
Year ended 31 March 2016Restated*
Year ended 31 March 2015
Continuing operations
£m
Discontinued operations
£m
Continuing operations
£m
Discontinued operations
£mWages and salaries 233 1 202 1Social security costs 17 – 14 –Other pension costs:– defined benefit pension schemes 2 – 4 –– defined contribution pension schemes 4 – 5 –Retirement medical benefits (3) – (1) –Share-based payments 9 – – –Total 262 1 224 1
The average number of people employed by the Company and its subsidiaries, including part-time employees, is set out below:
Year ended 31 March
By operating segment 2016Restated*
2015Continuing operationsSpeciality Food Ingredients 2 092 1 948Bulk Ingredients 1 621 1 606Central 448 414Total 4 161 3 968
* Prior year restated to reflect discontinued operations (see Note 3), reclassification between wages, salaries and social security costs, and updated segmental allocation rules in light of the Group’s restructuring.
In addition, the average number of people employed relating to discontinued operations was 93 (2015 – 96). At 31 March 2016, the Group employed 4,326 (2015 – 4,040) people within continuing operations. The number of people employed by the Group relating to discontinued operations at 31 March 2016 was 91 (2015 – 96). The Group’s two operating segments are supported by Global Operations, which is responsible for running the Group’s manufacturing facilities. The Group allocates the headcount of the Global Operations team to segments based on the split of primary capacity at each location. Central includes shared service employees who perform activities for the whole Group, including the Speciality Food Ingredients and Bulk Ingredients segments.Key management compensation
Year ended 31 March
2016£m
2015£m
Salaries and short-term employee benefits 10 6Retirement benefits 1 1Share-based payments 2 –Total 13 7
Key management is represented by the Executive Committee and the Company’s Directors. Remuneration details of the Company’s Directors are given in the Directors’ Remuneration Report on pages 62 to 79. Members of the Executive Committee are identified on page 16. The aggregate gains made by the directors on the exercise of share options were £9 million (2015 – £5 million).
Notes to the Consolidated Financial Statements continued
110 Tate & Lyle PLC Annual Report 2016
Financial Statements

11. Finance income and expenseFinance income in the period was £1 million (2015 – £1 million), mostly related to interest on cash placed on deposit.
Year ended 31 March
Continuing operations2016
£m2015
£mFinance expenseInterest payable on bank and other borrowings (22) (23)Fair value hedges: – fair value loss on interest rate derivatives (4) (3) – fair value adjustment of hedged borrowings 4 3 Finance lease interest (1) (1)Net retirement benefit interest (6) (8)Unwinding of discount on liabilities (1) –Total finance expense (30) (32)
Reconciliation to adjusted net finance expense Notes £m £m Net finance expense (includes £1 million of finance income) (29) (31)Net retirement benefit interest 30 6 8 Adjusted net finance expense – continuing operations 4 (23) (23)
Finance expense is shown net of borrowing costs of £2 million (2015 – £1 million) capitalised within property, plant and equipment (2015 – capitalised within intangible assets) at a capitalisation rate of 3.3% (2015 – 3.4%).
Interest payable on other borrowings includes £0.2 million (2015 – £0.2 million) of dividends in respect of the Group’s 6.5% cumulative preference shares. Finance income and finance expense relate wholly to continuing operations.
12. Income taxesAnalysis of charge for the year – continuing operations
Year ended 31 March
2016£m
Restated*2015
£mIn respect of current year:– United Kingdom (UK) – –– Overseas (32) (15)Adjustments in respect of prior years 2 2
(30) (13)Deferred tax:Credit/(charge) for the year 24 (8)Adjustments in respect of prior years 1 –Income tax expense – continuing operations (5) (21)
Reconciliation to adjusted income tax expense Note £m £m Income tax expense (5) (21)Taxation on exceptional items, amortisation of acquired intangibles and
net retirement benefit interest (27) (13) Adjusted income tax expense – continuing operations 4 (32) (34)
* Prior year restated to reflect discontinued operations (see Note 3). Where adjusted metrics are presented, these have been further restated for the adoption of equity accounting (see Note 1).
Profit for the year from continuing operations reflected an income tax expense of £5 million (2015 – expense of £21 million), including an income tax credit of £27 million (2015 – credit of £13 million) in respect of exceptional items, amortisation of acquired intangibles and net retirement benefit interest (see Note 4).
As at 31 March 2016, the carrying value of current tax assets totalled £3 million (2015 – £2 million) and the carrying value of current tax liabilities totalled £66 million (2015 – £45 million).
The Group’s adjusted effective tax rate on continuing operations, calculated on the basis of the adjusted income tax expense of £32 million (2015 – £34 million) as a proportion of adjusted profit before tax of £193 million (2015 – £184 million), was 16.5% (2015 – 18.4%). This includes non-recurring tax credits relating to tax audit settlements in several European jurisdictions.
In respect of joint ventures, a tax charge of £10 million (2015 – £7 million) was recognised on profit before tax of £38 million for continuing operations (2015 – £30 million). For its adjusted metrics the Group adopted equity accounting for joint ventures in the year to 31 March 2016 having previously used a proportionate consolidation basis. The Group adjusted effective tax rate for the continuing operations on a proportionate consolidation basis would have been 20.7% (2015 – 21.5%), being a tax charge of £42 million (2015 – £41 million) on adjusted profit before tax of £203 million (2015 – £191 million).
111 Tate & Lyle PLC Annual Report 2016
Financial Statements | Notes to the Consolidated Financial Statements
Strategic ReportG
overnanceFinancial Statem
entsU
seful Information
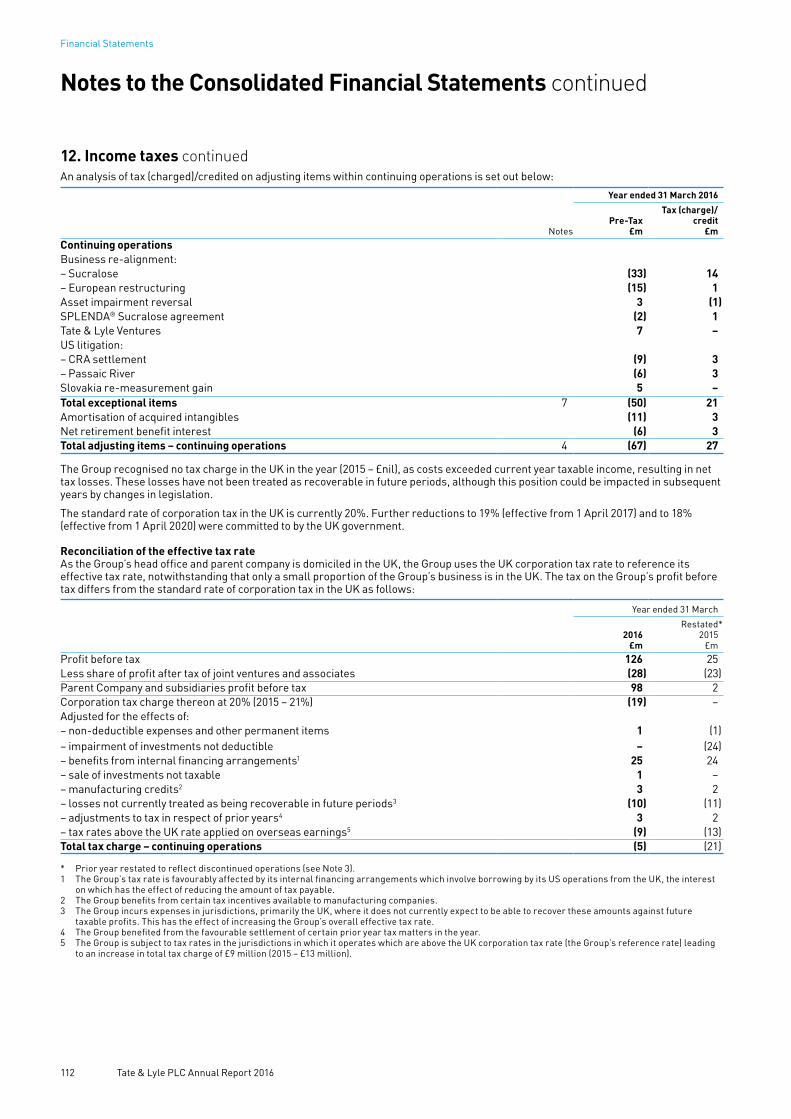
12. Income taxes continuedAn analysis of tax (charged)/credited on adjusting items within continuing operations is set out below:
Notes
Year ended 31 March 2016
Pre-Tax£m
Tax (charge)/credit
£mContinuing operationsBusiness re-alignment:– Sucralose (33) 14– European restructuring (15) 1Asset impairment reversal 3 (1)SPLENDA® Sucralose agreement (2) 1Tate & Lyle Ventures 7 –US litigation:– CRA settlement (9) 3– Passaic River (6) 3Slovakia re-measurement gain 5 –Total exceptional items 7 (50) 21Amortisation of acquired intangibles (11) 3Net retirement benefit interest (6) 3Total adjusting items – continuing operations 4 (67) 27
The Group recognised no tax charge in the UK in the year (2015 – £nil), as costs exceeded current year taxable income, resulting in net tax losses. These losses have not been treated as recoverable in future periods, although this position could be impacted in subsequent years by changes in legislation.
The standard rate of corporation tax in the UK is currently 20%. Further reductions to 19% (effective from 1 April 2017) and to 18% (effective from 1 April 2020) were committed to by the UK government.
Reconciliation of the effective tax rateAs the Group’s head office and parent company is domiciled in the UK, the Group uses the UK corporation tax rate to reference its effective tax rate, notwithstanding that only a small proportion of the Group’s business is in the UK. The tax on the Group’s profit before tax differs from the standard rate of corporation tax in the UK as follows:
Year ended 31 March
2016£m
Restated*2015
£mProfit before tax 126 25Less share of profit after tax of joint ventures and associates (28) (23)Parent Company and subsidiaries profit before tax 98 2Corporation tax charge thereon at 20% (2015 – 21%) (19) –Adjusted for the effects of:– non-deductible expenses and other permanent items 1 (1)– impairment of investments not deductible – (24)– benefits from internal financing arrangements1 25 24– sale of investments not taxable 1 –– manufacturing credits2 3 2– losses not currently treated as being recoverable in future periods3 (10) (11)– adjustments to tax in respect of prior years4 3 2– tax rates above the UK rate applied on overseas earnings5 (9) (13)Total tax charge – continuing operations (5) (21)
* Prior year restated to reflect discontinued operations (see Note 3). 1 The Group’s tax rate is favourably affected by its internal financing arrangements which involve borrowing by its US operations from the UK, the interest
on which has the effect of reducing the amount of tax payable. 2 The Group benefits from certain tax incentives available to manufacturing companies.3 The Group incurs expenses in jurisdictions, primarily the UK, where it does not currently expect to be able to recover these amounts against future
taxable profits. This has the effect of increasing the Group’s overall effective tax rate.4 The Group benefited from the favourable settlement of certain prior year tax matters in the year.5 The Group is subject to tax rates in the jurisdictions in which it operates which are above the UK corporation tax rate (the Group’s reference rate) leading
to an increase in total tax charge of £9 million (2015 – £13 million).
Notes to the Consolidated Financial Statements continued
112 Tate & Lyle PLC Annual Report 2016
Financial Statements

12. Income taxes continued Key factors impacting the sustainability of the effective tax rate are as follows:1. Our ability to continue to operate an efficient internal financing arrangement
One of our internal financing arrangements involves borrowing by our US operations from the UK, the interest on which has the effect of reducing the amount of tax payable. This delivered a benefit of £25 million in the 2016 financial year (2015 – £24 million). If we were unable to operate this arrangement in future, due to legislative change or other factors, our tax rate could increase materially.
2. The timing of recognising tax benefits from brought forward losses in the UK
If, due to legislative changes in the UK, the Group were to become subject to higher levels of profit chargeable to tax in the UK, we would seek to recognise historical losses in the form of deferred tax assets to reduce cash tax payable in the UK. The timing of recognition of these assets could increase volatility in the effective tax rate in the Group’s income statement, particularly in the year they were first recognised. In addition, in March 2016, the UK government announced draft changes to UK loss utilisation rules which could impact our ability to utilise brought forward losses in the future.
3. Material changes in the geographic mix of profits
The Group’s effective tax rate is sensitive to the geographic mix of profits and reflects a combination of higher rates in certain jurisdictions such as the US, nil effective rates in the UK due to the availability of losses and rates that lie somewhere in between. If the geographic mix of profits were to change materially, through changes in the composition of the Group’s business or changes in performance, our tax rate could change materially.
4. Changes in tax rates
Changes in tax rates in the jurisdictions in which the Group operates, principally the US, could have a material effect on the Group’s effective tax rate.
5. Resolution of tax judgements arising from current or future tax issues
At any one time, the Group can be subject to a number of challenges by tax authorities in the jurisdictions in which it operates. The outcome of these challenges is inherently uncertain, potentially resulting in a different tax charge from the amounts initially provided.
Deferred taxDeferred tax is calculated on differences between the accounting value of assets and liabilities and their respective tax values.
The movements in deferred tax assets and liabilities during the year were as follows:
Capitalallowances in excess of
depreciation£m
Retirementbenefit
obligations£m
Share-basedpayments
£mTax losses
£mOther
£mTotal
£mAt 1 April 2014 (121) 64 5 16 (2) (38)Credited/(charged) to the income statement 1 (5) (1) (5) 2 (8)Credited to other comprehensive income – 20 – – 2 22Charged directly to equity – – – – – –Currency translation differences (12) 8 – 2 (2) (4)At 31 March 2015 (132) 87 4 13 – (28)Credited/(charged) to the income statement 4 (6) 1 (8) 34 25Credited to other comprehensive income – 2 – – – 2Charged directly to equity – – (3) – – (3)Acquisitions/disposals – – – – (7) (7)Currency translation differences (6) – – 1 (2) (7)At 31 March 2016 (134) 83 2 6 25 (18)
Other deferred tax items include temporary differences arising from accounting provisions, where the timing of the tax deduction is different from the timing of accounting recognition, and business combinations.
Deferred tax assets and liabilities are offset where there is a legally enforceable right of offset and there is an intention to settle the balances net. After taking these offsets into account, the net position of £18 million liability (2015 – £28 million liability) is presented as a £3 million deferred tax asset (2015 – £4 million asset) and a £21 million deferred tax liability (2015 – £32 million liability) in the Group’s statement of financial position.
Changes in enacted tax rates had no effect on the amount of deferred tax charged to the income statement and other comprehensive income or equity. There was no impact from the imposition of new taxes.
No deferred tax assets have been recognised in respect of tax losses of £753 million (2015 – £664 million) as there is uncertainty as to whether taxable profits against which these assets may be recovered will be available. No unrelieved tax losses expired under current tax legislation in the year ended 31 March 2016.
The total deferred tax on unremitted earnings is £4 million (2015 – £3 million) of which £nil (2015 – £nil) has been recognised. The Group has not recognised the amount as it is able to control the timing of the reversal of these temporary differences and it is probable that they will not reverse in the foreseeable future.
113 Tate & Lyle PLC Annual Report 2016
Financial Statements | Notes to the Consolidated Financial Statements
Strategic ReportG
overnanceFinancial Statem
entsU
seful Information
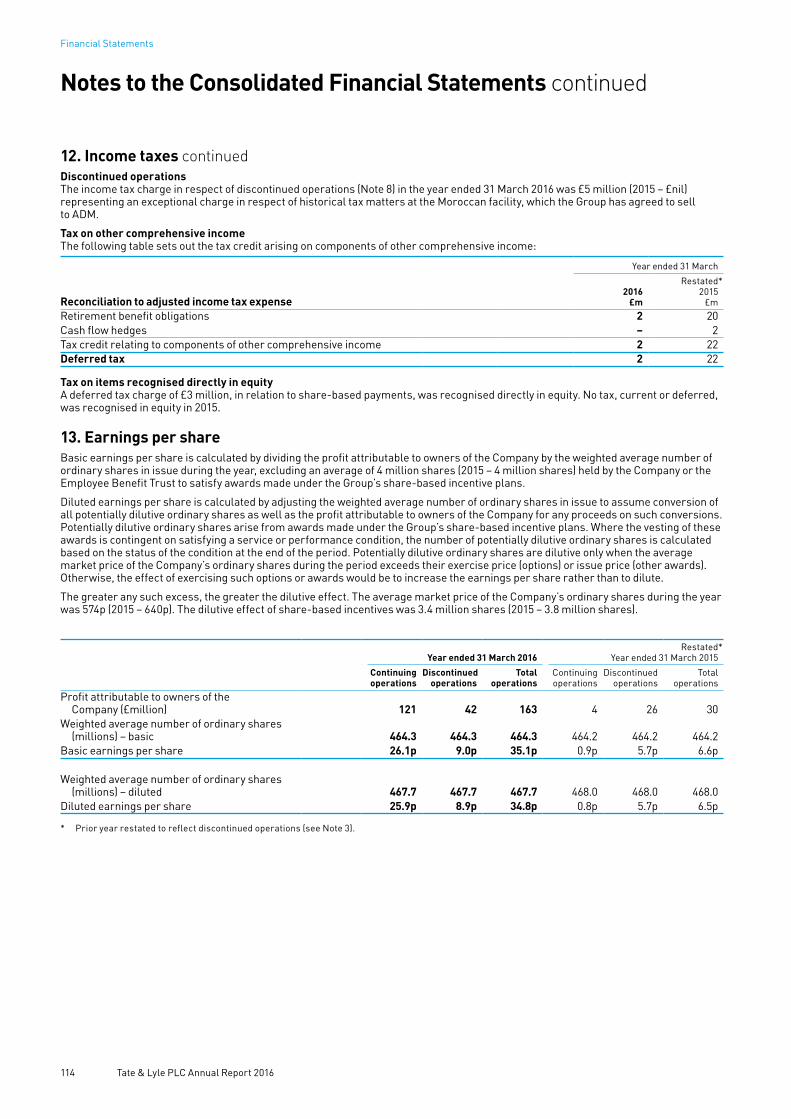
12. Income taxes continuedDiscontinued operationsThe income tax charge in respect of discontinued operations (Note 8) in the year ended 31 March 2016 was £5 million (2015 – £nil) representing an exceptional charge in respect of historical tax matters at the Moroccan facility, which the Group has agreed to sell to ADM.
Tax on other comprehensive incomeThe following table sets out the tax credit arising on components of other comprehensive income:
Year ended 31 March
Reconciliation to adjusted income tax expense2016
£m
Restated*2015
£m Retirement benefit obligations 2 20Cash flow hedges – 2 Tax credit relating to components of other comprehensive income 2 22Deferred tax 2 22
Tax on items recognised directly in equityA deferred tax charge of £3 million, in relation to share-based payments, was recognised directly in equity. No tax, current or deferred, was recognised in equity in 2015.
13. Earnings per shareBasic earnings per share is calculated by dividing the profit attributable to owners of the Company by the weighted average number of ordinary shares in issue during the year, excluding an average of 4 million shares (2015 – 4 million shares) held by the Company or the Employee Benefit Trust to satisfy awards made under the Group’s share-based incentive plans.
Diluted earnings per share is calculated by adjusting the weighted average number of ordinary shares in issue to assume conversion of all potentially dilutive ordinary shares as well as the profit attributable to owners of the Company for any proceeds on such conversions. Potentially dilutive ordinary shares arise from awards made under the Group’s share-based incentive plans. Where the vesting of these awards is contingent on satisfying a service or performance condition, the number of potentially dilutive ordinary shares is calculated based on the status of the condition at the end of the period. Potentially dilutive ordinary shares are dilutive only when the average market price of the Company’s ordinary shares during the period exceeds their exercise price (options) or issue price (other awards). Otherwise, the effect of exercising such options or awards would be to increase the earnings per share rather than to dilute.
The greater any such excess, the greater the dilutive effect. The average market price of the Company’s ordinary shares during the year was 574p (2015 – 640p). The dilutive effect of share-based incentives was 3.4 million shares (2015 – 3.8 million shares).
Year ended 31 March 2016Restated*
Year ended 31 March 2015
Continuing operations
Discontinuedoperations
Totaloperations
Continuing operations
Discontinued operations
Totaloperations
Profit attributable to owners of the Company (£million) 121 42 163 4 26 30
Weighted average number of ordinary shares (millions) – basic 464.3 464.3 464.3 464.2 464.2 464.2
Basic earnings per share 26.1p 9.0p 35.1p 0.9p 5.7p 6.6p
Weighted average number of ordinary shares (millions) – diluted 467.7 467.7 467.7 468.0 468.0 468.0
Diluted earnings per share 25.9p 8.9p 34.8p 0.8p 5.7p 6.5p
* Prior year restated to reflect discontinued operations (see Note 3).
Notes to the Consolidated Financial Statements continued
114 Tate & Lyle PLC Annual Report 2016
Financial Statements
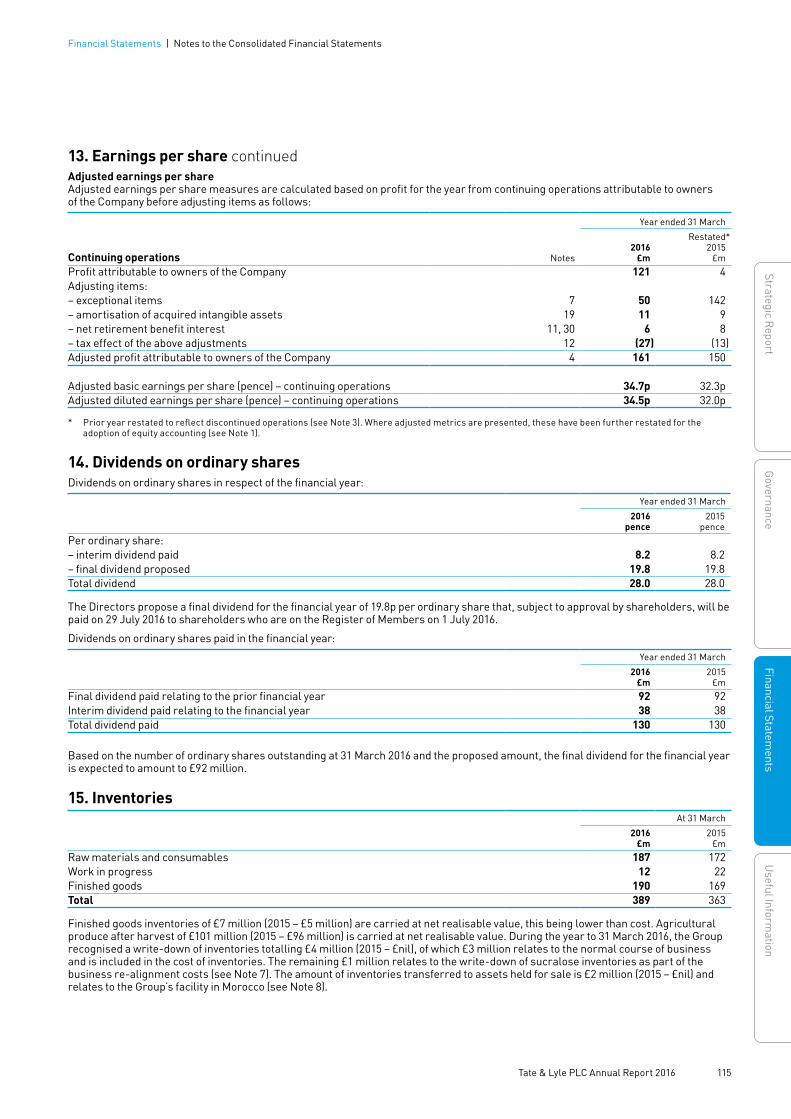
13. Earnings per share continuedAdjusted earnings per shareAdjusted earnings per share measures are calculated based on profit for the year from continuing operations attributable to owners of the Company before adjusting items as follows:
Year ended 31 March
Continuing operations Notes2016
£m
Restated*2015
£mProfit attributable to owners of the Company 121 4 Adjusting items:– exceptional items 7 50 142 – amortisation of acquired intangible assets 19 11 9 – net retirement benefit interest 11, 30 6 8 – tax effect of the above adjustments 12 (27) (13)Adjusted profit attributable to owners of the Company 4 161 150
Adjusted basic earnings per share (pence) – continuing operations 34.7p 32.3pAdjusted diluted earnings per share (pence) – continuing operations 34.5p 32.0p
* Prior year restated to reflect discontinued operations (see Note 3). Where adjusted metrics are presented, these have been further restated for the adoption of equity accounting (see Note 1).
14. Dividends on ordinary sharesDividends on ordinary shares in respect of the financial year:
Year ended 31 March
2016pence
2015pence
Per ordinary share:– interim dividend paid 8.2 8.2– final dividend proposed 19.8 19.8Total dividend 28.0 28.0
The Directors propose a final dividend for the financial year of 19.8p per ordinary share that, subject to approval by shareholders, will be paid on 29 July 2016 to shareholders who are on the Register of Members on 1 July 2016.
Dividends on ordinary shares paid in the financial year:
Year ended 31 March
2016£m
2015£m
Final dividend paid relating to the prior financial year 92 92Interim dividend paid relating to the financial year 38 38Total dividend paid 130 130
Based on the number of ordinary shares outstanding at 31 March 2016 and the proposed amount, the final dividend for the financial year is expected to amount to £92 million.
15. InventoriesAt 31 March
2016£m
2015£m
Raw materials and consumables 187 172Work in progress 12 22Finished goods 190 169Total 389 363
Finished goods inventories of £7 million (2015 – £5 million) are carried at net realisable value, this being lower than cost. Agricultural produce after harvest of £101 million (2015 – £96 million) is carried at net realisable value. During the year to 31 March 2016, the Group recognised a write-down of inventories totalling £4 million (2015 – £nil), of which £3 million relates to the normal course of business and is included in the cost of inventories. The remaining £1 million relates to the write-down of sucralose inventories as part of the business re-alignment costs (see Note 7). The amount of inventories transferred to assets held for sale is £2 million (2015 – £nil) and relates to the Group’s facility in Morocco (see Note 8).
115 Tate & Lyle PLC Annual Report 2016
Financial Statements | Notes to the Consolidated Financial Statements
Strategic ReportG
overnanceFinancial Statem
entsU
seful Information
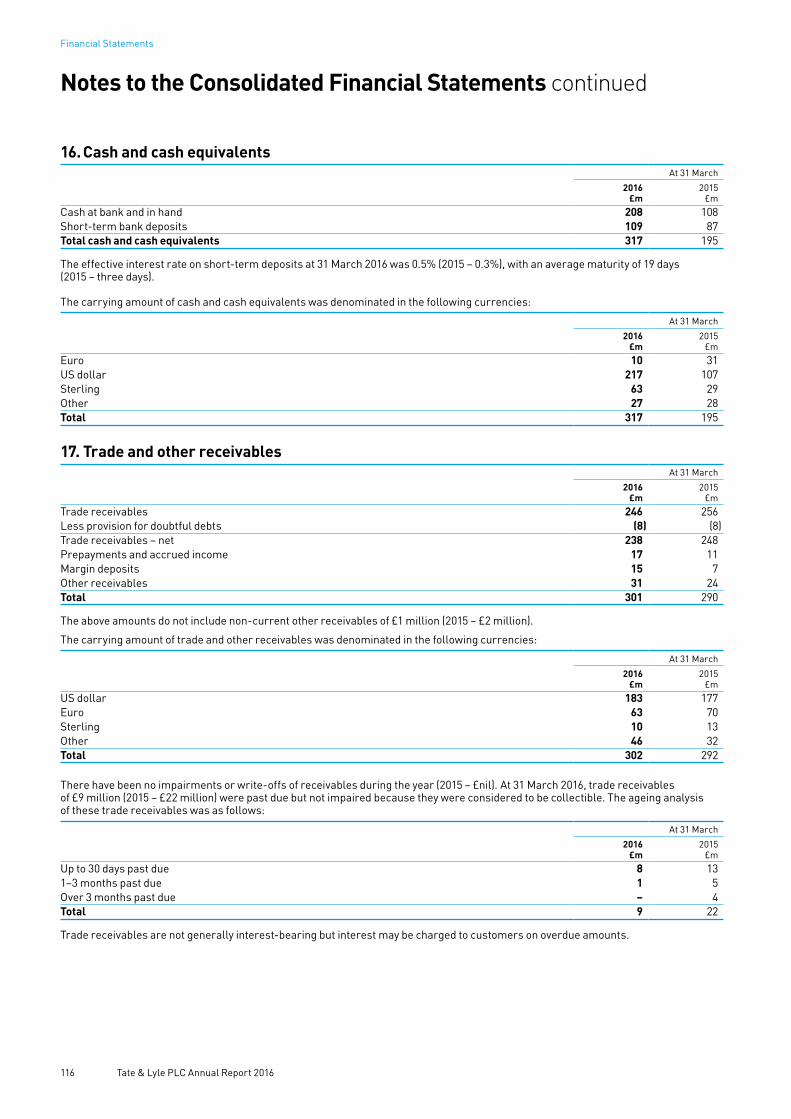
16. Cash and cash equivalentsAt 31 March
2016£m
2015£m
Cash at bank and in hand 208 108Short-term bank deposits 109 87Total cash and cash equivalents 317 195
The effective interest rate on short-term deposits at 31 March 2016 was 0.5% (2015 – 0.3%), with an average maturity of 19 days (2015 – three days).
The carrying amount of cash and cash equivalents was denominated in the following currencies:
At 31 March
2016£m
2015£m
Euro 10 31US dollar 217 107Sterling 63 29Other 27 28Total 317 195
17. Trade and other receivablesAt 31 March
2016£m
2015£m
Trade receivables 246 256Less provision for doubtful debts (8) (8)Trade receivables – net 238 248Prepayments and accrued income 17 11Margin deposits 15 7Other receivables 31 24Total 301 290
The above amounts do not include non-current other receivables of £1 million (2015 – £2 million).
The carrying amount of trade and other receivables was denominated in the following currencies:
At 31 March
2016£m
2015£m
US dollar 183 177Euro 63 70Sterling 10 13Other 46 32Total 302 292
There have been no impairments or write-offs of receivables during the year (2015 – £nil). At 31 March 2016, trade receivables of £9 million (2015 – £22 million) were past due but not impaired because they were considered to be collectible. The ageing analysis of these trade receivables was as follows:
At 31 March
2016£m
2015£m
Up to 30 days past due 8 131–3 months past due 1 5Over 3 months past due – 4Total 9 22
Trade receivables are not generally interest-bearing but interest may be charged to customers on overdue amounts.
Notes to the Consolidated Financial Statements continued
116 Tate & Lyle PLC Annual Report 2016
Financial Statements
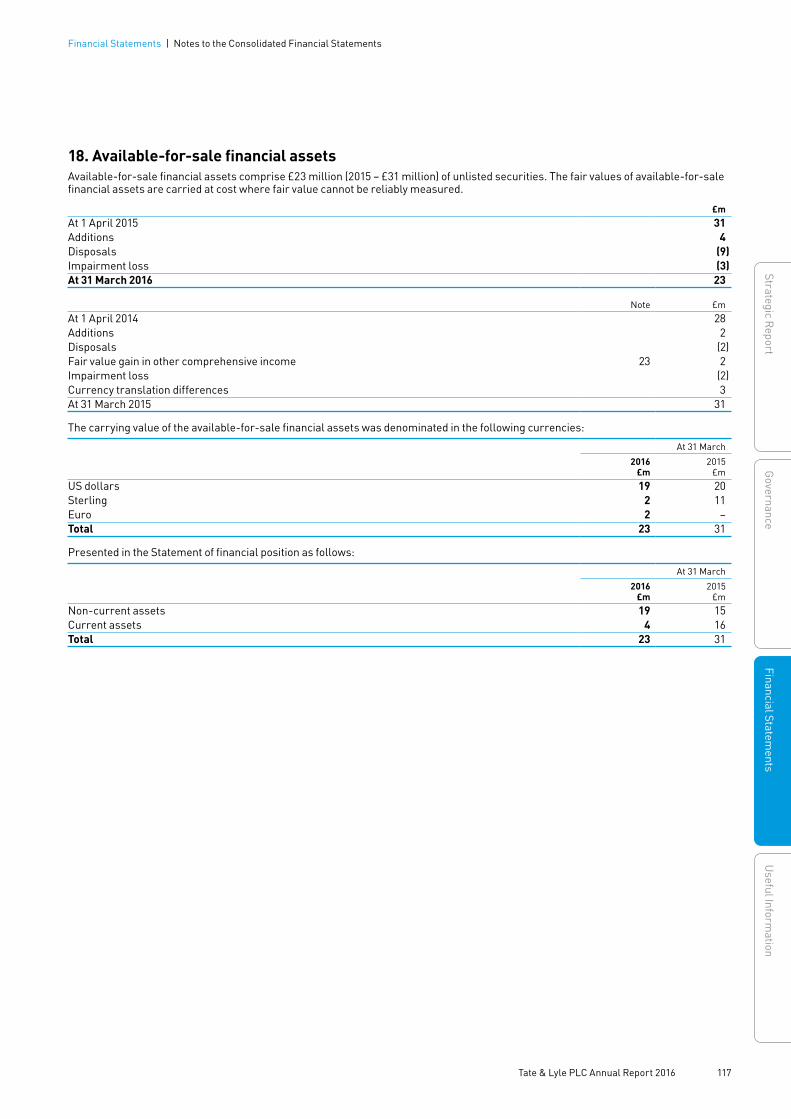
18. Available-for-sale financial assetsAvailable-for-sale financial assets comprise £23 million (2015 – £31 million) of unlisted securities. The fair values of available-for-sale financial assets are carried at cost where fair value cannot be reliably measured.
£mAt 1 April 2015 31Additions 4Disposals (9)Impairment loss (3)At 31 March 2016 23
Note £mAt 1 April 2014 28Additions 2Disposals (2)Fair value gain in other comprehensive income 23 2Impairment loss (2)Currency translation differences 3At 31 March 2015 31
The carrying value of the available-for-sale financial assets was denominated in the following currencies:
At 31 March
2016£m
2015£m
US dollars 19 20Sterling 2 11Euro 2 –Total 23 31
Presented in the Statement of financial position as follows:
At 31 March
2016£m
2015£m
Non-current assets 19 15Current assets 4 16Total 23 31
117 Tate & Lyle PLC Annual Report 2016
Financial Statements | Notes to the Consolidated Financial Statements
Strategic ReportG
overnanceFinancial Statem
entsU
seful Information
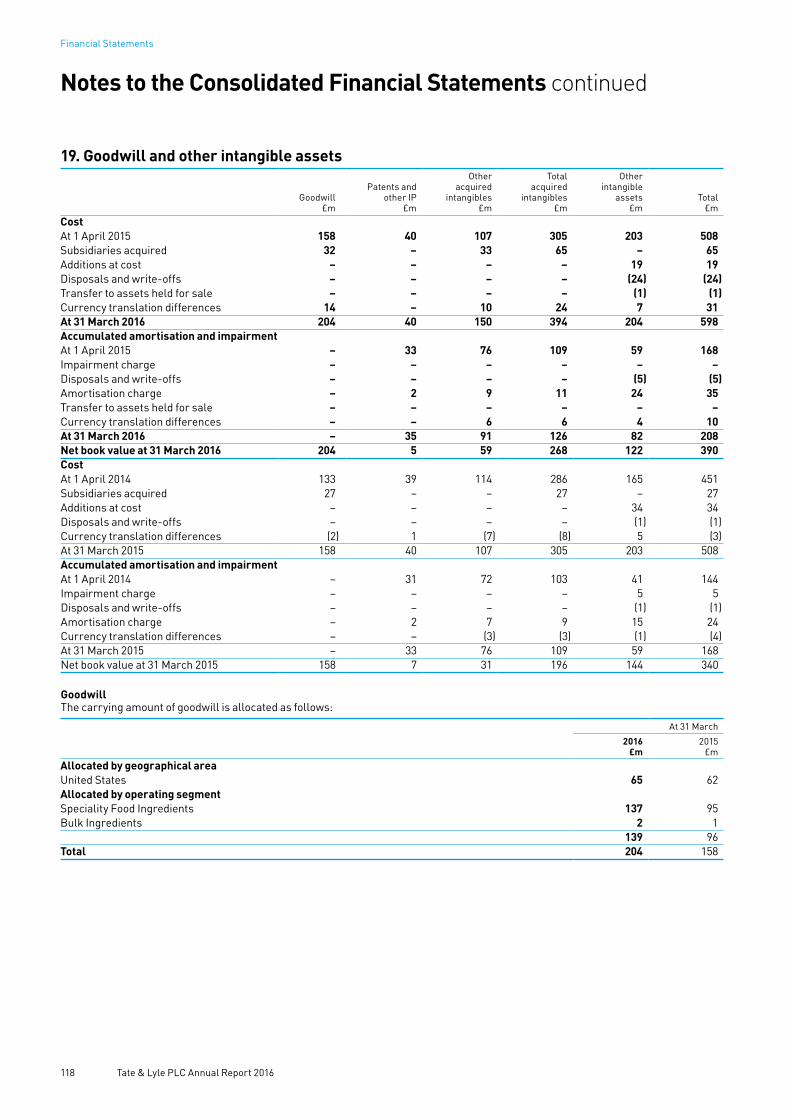
19. Goodwill and other intangible assets
Goodwill£m
Patents and other IP
£m
Other acquired
intangibles£m
Total acquired
intangibles£m
Other intangible
assets£m
Total£m
CostAt 1 April 2015 158 40 107 305 203 508Subsidiaries acquired 32 – 33 65 – 65Additions at cost – – – – 19 19Disposals and write-offs – – – – (24) (24)Transfer to assets held for sale – – – – (1) (1)Currency translation differences 14 – 10 24 7 31At 31 March 2016 204 40 150 394 204 598Accumulated amortisation and impairmentAt 1 April 2015 – 33 76 109 59 168Impairment charge – – – – – –Disposals and write-offs – – – – (5) (5)Amortisation charge – 2 9 11 24 35Transfer to assets held for sale – – – – – –Currency translation differences – – 6 6 4 10At 31 March 2016 – 35 91 126 82 208Net book value at 31 March 2016 204 5 59 268 122 390CostAt 1 April 2014 133 39 114 286 165 451Subsidiaries acquired 27 – – 27 – 27Additions at cost – – – – 34 34Disposals and write-offs – – – – (1) (1)Currency translation differences (2) 1 (7) (8) 5 (3)At 31 March 2015 158 40 107 305 203 508Accumulated amortisation and impairmentAt 1 April 2014 – 31 72 103 41 144Impairment charge – – – – 5 5Disposals and write-offs – – – – (1) (1)Amortisation charge – 2 7 9 15 24Currency translation differences – – (3) (3) (1) (4)At 31 March 2015 – 33 76 109 59 168Net book value at 31 March 2015 158 7 31 196 144 340
GoodwillThe carrying amount of goodwill is allocated as follows:
At 31 March
2016£m
2015£m
Allocated by geographical areaUnited States 65 62Allocated by operating segmentSpeciality Food Ingredients 137 95Bulk Ingredients 2 1
139 96Total 204 158
Notes to the Consolidated Financial Statements continued
118 Tate & Lyle PLC Annual Report 2016
Financial Statements

19. Goodwill and other intangible assets continued(i) Impairment tests carried out during the yearThe Group is principally operated as an integrated network in the United States and Europe, with a large amount of interdependency between plants servicing both the Speciality Food Ingredients and Bulk Ingredients segments. Goodwill is therefore tested for impairment on a geographical basis, except where it can be allocated to a specific CGU.
A description of the impairment tests conducted in relation to the most significant goodwill amounts are set out below. In each case, the recoverable amount was calculated based on value in use, with the exception of Brazilian Food Systems business Tate & Lyle Gemacom Tech Indústria e Comércio S.A. (’Gemacom’) and the acquisition of Amylum Slovakia s.r.o. Value in use was calculated based on budgets and plans covering the next five years that have been approved by the Board. Cash flows were projected during the five-year period based on budgeted operating profit and management’s expectations of market developments. Beyond the five-year plan, cash flows were generally assumed to grow at the long-term growth rate for the relevant geographical markets based on forecasts included in industry reports. Cash flows were discounted using pre-tax rates that are based on the Group’s weighted average cost of capital adjusted, where appropriate, to reflect differences between the risk profile of the geographical areas or CGUs concerned and that of the Group as a whole.
Goodwill allocated by geographical areaUnited StatesGoodwill allocated to the US single ingredients operations of £65 million (2015 – £62 million) relates to the Staley acquisition in 1988. The key assumptions in the model are derived from the Group’s Annual Operating Plan for 2017, which includes mid-single digit volume growth in Speciality Food Ingredients and flat volumes in Bulk Ingredients. From 2018 onwards, volumes are projected to grow broadly in line with 2017 expectations, and operating profit is assumed to increase by single digits for both Speciality Food Ingredients and Bulk Ingredients thereafter, based on management’s long-term industry expectations. Based on the risk profile of the assets tested, cash flows were discounted using a pre-tax rate of 9.6% (2015 – 10.0%). Significant headroom exists and management concluded that no impairment is required.
Goodwill allocated by operating segmentSpeciality Food IngredientsGoodwill allocated to the Speciality Food Ingredients segment includes £58 million (2015 – £53 million) that relates to the European Food Systems acquisitions of G.C. Hahn and Company in June 2007 and that of Cesalpinia Foods in December 2005. As these businesses are operationally integrated, they are tested for impairment as one CGU. The key assumptions in the model are derived from the Group’s Annual Operating Plan for 2017, with mid-single digit operating profit growth assumed over a five year period. Cash flows were discounted using a pre-tax rate of 9.6% (2015 – 10.0%). Management concluded that no impairment is required.
During the year, the Group completed the re-alignment of the Eaststarch joint venture whereby the remaining 50% of Amylum Slovakia s.r.o was purchased (subsequently renamed Tate & Lyle Boleraz s.r.o.). This entity has individually material goodwill provisionally recorded as £35 million at the acquisition date (see Note 34). The Group considered whether or not this goodwill was impaired as at 31 March 2016 and concluded that it was not.
The only other CGU within the Speciality Food Ingredients operating segment with individually material goodwill is Gemacom, with goodwill of £18 million. As this entity was acquired in the prior financial year, the acquisition business case continues to form the basis of the operating plan. As such, the recoverable amount was calculated based on fair value less costs of disposal. The fair value was determined based on a discounted cash flow model using a post-tax discount rate and cash inflows and outflows from future expansion. Cash flows from 2017 onwards are expected to grow at a compound annual rate of around 40% over the subsequent four years, and at 5% thereafter, reflecting the long-term growth expectations for this market. Cash flows were discounted using a post-tax rate of 14% (2015 – 16.7% pre-tax). The fair value less costs of disposal of this CGU exceeds its carrying value, and management concluded that no impairment is required. However, this calculation resulted in a low level of headroom compared with the carrying value. The amount of headroom was particularly sensitive to the short-term growth rate, the terminal growth rate and discount rate. Reasonably possible changes in each of these assumptions, being changes in excess of an increase in the discount rate of 110bps, a reduction in compound annual growth rate of 400bps or a reduction in terminal growth rate of 150bps, could lead to an impairment.
There are no other individually material elements of goodwill allocated to either the Speciality Food Ingredients or Bulk Ingredients operating segments.
(ii) Possibility of impairment in the near futureManagement considers that, with the exception of Gemacom, there is no reasonably possible change in one or more of the key assumptions used in the impairment tests for goodwill and other intangible assets that would give rise to an impairment loss during the coming year.
119 Tate & Lyle PLC Annual Report 2016
Financial Statements | Notes to the Consolidated Financial Statements
Strategic ReportG
overnanceFinancial Statem
entsU
seful Information
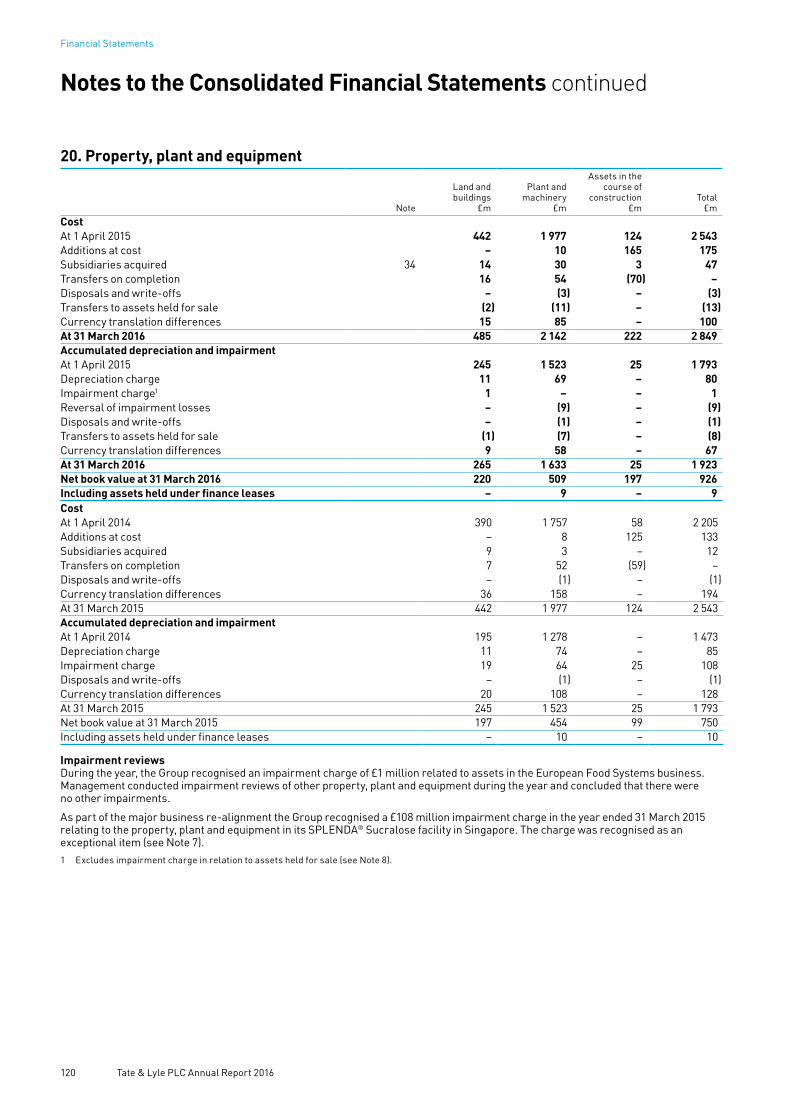
20. Property, plant and equipment
Note
Land andbuildings
£m
Plant andmachinery
£m
Assets in thecourse of
construction £m
Total £m
CostAt 1 April 2015 442 1 977 124 2 543Additions at cost – 10 165 175Subsidiaries acquired 34 14 30 3 47Transfers on completion 16 54 (70) –Disposals and write-offs – (3) – (3)Transfers to assets held for sale (2) (11) – (13)Currency translation differences 15 85 – 100At 31 March 2016 485 2 142 222 2 849Accumulated depreciation and impairmentAt 1 April 2015 245 1 523 25 1 793Depreciation charge 11 69 – 80Impairment charge1 1 – – 1Reversal of impairment losses – (9) – (9)Disposals and write-offs – (1) – (1)Transfers to assets held for sale (1) (7) – (8)Currency translation differences 9 58 – 67At 31 March 2016 265 1 633 25 1 923Net book value at 31 March 2016 220 509 197 926Including assets held under finance leases – 9 – 9CostAt 1 April 2014 390 1 757 58 2 205Additions at cost – 8 125 133Subsidiaries acquired 9 3 – 12Transfers on completion 7 52 (59) –Disposals and write-offs – (1) – (1)Currency translation differences 36 158 – 194At 31 March 2015 442 1 977 124 2 543Accumulated depreciation and impairmentAt 1 April 2014 195 1 278 – 1 473Depreciation charge 11 74 – 85Impairment charge 19 64 25 108Disposals and write-offs – (1) – (1)Currency translation differences 20 108 – 128At 31 March 2015 245 1 523 25 1 793Net book value at 31 March 2015 197 454 99 750Including assets held under finance leases – 10 – 10
Impairment reviewsDuring the year, the Group recognised an impairment charge of £1 million related to assets in the European Food Systems business. Management conducted impairment reviews of other property, plant and equipment during the year and concluded that there were no other impairments.
As part of the major business re-alignment the Group recognised a £108 million impairment charge in the year ended 31 March 2015 relating to the property, plant and equipment in its SPLENDA® Sucralose facility in Singapore. The charge was recognised as an exceptional item (see Note 7).1 Excludes impairment charge in relation to assets held for sale (see Note 8).
Notes to the Consolidated Financial Statements continued
120 Tate & Lyle PLC Annual Report 2016
Financial Statements

21. Equity accounted investmentsThe amounts recognised in the Group consolidated income statement are as follows:
Year ended 31 March
Note 2016
£m
Restated*2015
£mAssociates – continuing operations – – Joint ventures – continuing operations 28 23Joint ventures – discontinued operations 8 2 26Total operations 30 49
* Prior year restated to reflect discontinued operations (see Note 3).
The amounts recognised in the Group consolidated statement of financial position are as follows:
At 31 March
2016£m
2015£m
Associates 3 4Joint ventures 82 323
AssociatesThe Group’s only associate, which is accounted for under the equity method, is Tapioca Development Corporation (see Note 38). The associate has share capital consisting solely of ordinary shares, which are held directly by the Group and the country of incorporation or registration is also its principal place of business. Tapioca Development Corporation is a private company and there is no quoted market price available for its shares.
In the opinion of the Directors, this associate is not considered to be material to the Group and there are no contingent liabilities relating to the Group’s interest in the associate.
The investment in the associate as at 31 March 2016 was £3 million (2015 – £4 million). The Group recognised £nil net profit (2015 – £nil) in its Consolidated income statement. During the year ended 31 March 2016, the Group received a dividend of £1 million (2015 – £nil) from its associate.
Joint venturesIn the opinion of the Directors, the Group’s material joint ventures, which are accounted for under the equity method, are Almidones Mexicanos SA (Almex) and DuPont Tate & Lyle Bio Products Company, LLC (Bio-PDO) (see Note 38). The joint ventures have share capital consisting solely of ordinary shares, which are held directly by the Group (and its joint venture partners) and are private companies. No quoted market price is available for their shares. There are no contingent liabilities relating to the Group’s interest in the joint ventures.
On 31 October 2015, the Group disposed of its investment in Eaststarch C.V. As a result, the Group no longer has any guarantees in respect of banking facilities of Eaststarch (2015 – £8 million). The Group received pre-disposal dividends from Eaststarch joint venture totalling €94 million (£68 million).
The movements in the carrying value of the Group’s investment in joint ventures are summarised as follows:
Investments in joint ventures Note £mAt 1 April 2015 323Share of profit after tax of joint ventures – total operations 30Disposal (including goodwill) (177)Other comprehensive expense (including exchange) 23 (12) Dividends (82)At 31 March 2016 82
£mAt 1 April 2014 308Share of profit after tax of joint ventures – total operations 49Other comprehensive expense (including exchange) 23 (18)Dividends (16)At 31 March 2015 323
121 Tate & Lyle PLC Annual Report 2016
Financial Statements | Notes to the Consolidated Financial Statements
Strategic ReportG
overnanceFinancial Statem
entsU
seful Information
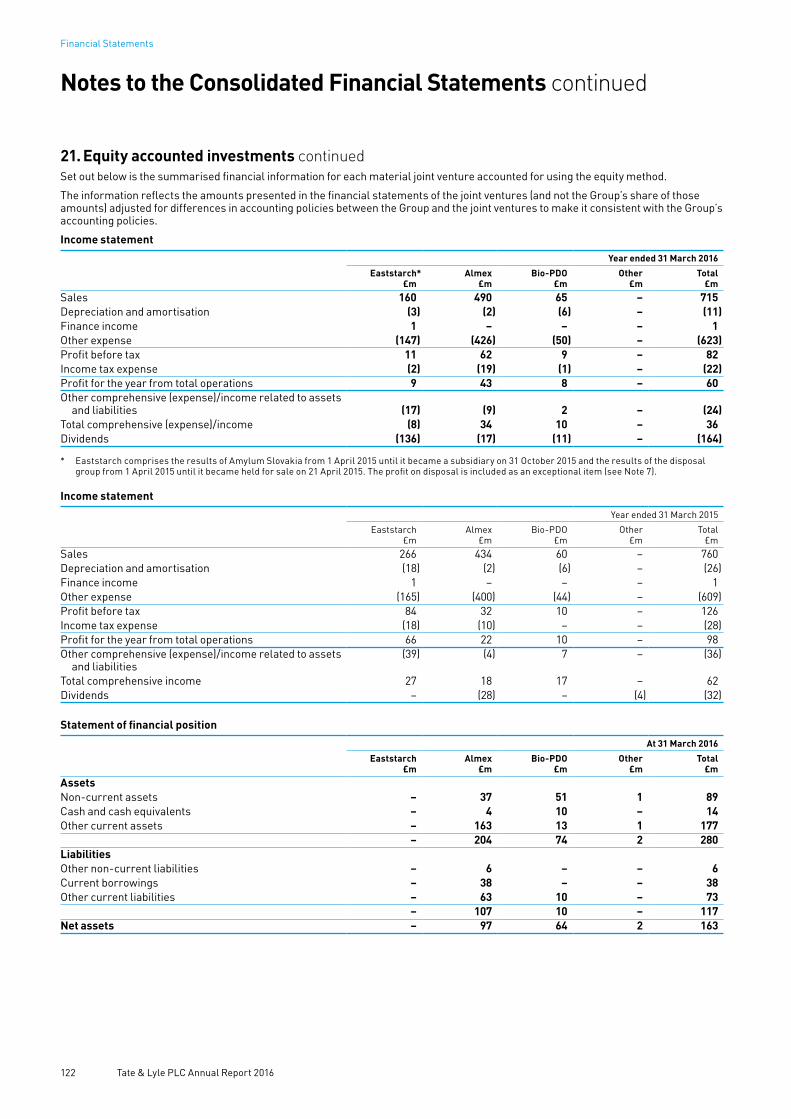
21. Equity accounted investments continuedSet out below is the summarised financial information for each material joint venture accounted for using the equity method.
The information reflects the amounts presented in the financial statements of the joint ventures (and not the Group’s share of those amounts) adjusted for differences in accounting policies between the Group and the joint ventures to make it consistent with the Group’s accounting policies.
Income statement
Year ended 31 March 2016
Eaststarch*£m
Almex£m
Bio-PDO£m
Other£m
Total£m
Sales 160 490 65 – 715Depreciation and amortisation (3) (2) (6) – (11)Finance income 1 – – – 1Other expense (147) (426) (50) – (623)Profit before tax 11 62 9 – 82Income tax expense (2) (19) (1) – (22)Profit for the year from total operations 9 43 8 – 60Other comprehensive (expense)/income related to assets
and liabilities (17) (9) 2 – (24)Total comprehensive (expense)/income (8) 34 10 – 36Dividends (136) (17) (11) – (164)
* Eaststarch comprises the results of Amylum Slovakia from 1 April 2015 until it became a subsidiary on 31 October 2015 and the results of the disposal group from 1 April 2015 until it became held for sale on 21 April 2015. The profit on disposal is included as an exceptional item (see Note 7).
Income statement
Year ended 31 March 2015
Eaststarch£m
Almex£m
Bio-PDO£m
Other£m
Total£m
Sales 266 434 60 – 760Depreciation and amortisation (18) (2) (6) – (26)Finance income 1 – – – 1Other expense (165) (400) (44) – (609)Profit before tax 84 32 10 – 126Income tax expense (18) (10) – – (28)Profit for the year from total operations 66 22 10 – 98Other comprehensive (expense)/income related to assets
and liabilities(39) (4) 7 – (36)
Total comprehensive income 27 18 17 – 62Dividends – (28) – (4) (32)
Statement of financial position
At 31 March 2016
Eaststarch£m
Almex£m
Bio-PDO£m
Other£m
Total£m
AssetsNon-current assets – 37 51 1 89Cash and cash equivalents – 4 10 – 14Other current assets – 163 13 1 177
– 204 74 2 280LiabilitiesOther non-current liabilities – 6 – – 6Current borrowings – 38 – – 38Other current liabilities – 63 10 – 73
– 107 10 – 117Net assets – 97 64 2 163
Notes to the Consolidated Financial Statements continued
122 Tate & Lyle PLC Annual Report 2016
Financial Statements

21. Equity accounted investments continuedStatement of financial position
At 31 March 2015
Eaststarch£m
Almex£m
Bio-PDO£m
Other£m
Total£m
AssetsNon-current assets 156 38 54 1 249Cash and cash equivalents 146 2 15 – 163Other current assets 88 164 11 1 264
390 204 80 2 676LiabilitiesOther non-current liabilities 10 7 – – 17Current borrowings 8 54 – – 62Other current liabilities 38 63 15 – 116
56 124 15 – 195Net assets 334 80 65 2 481
Reconciliation of the summarised financial information presented to the carrying amount of the Group’s interest in joint ventures.
Reconciliation of summarised financial information
Eaststarch£m
Almex£m
Bio-PDO£m
Other£m
Total£m
Opening net assets at 1 April 2015 334 80 65 2 481Profit for the year from total operations 9 43 8 – 60Disposal (190) – – – (190)Other comprehensive (expense)/income related to assets
and liabilities (excluding goodwill) (17) (9) 2 – (24)Dividends (136) (17) (11) – (164)Closing net assets at 31 March 2016 – 97 64 2 163Interest in joint venture (%) 50% 50% 50% 50%Interest in joint venture at share – 49 32 1 82Goodwill at 1 April 2015 82 – – – 82Goodwill disposed (82) – – – (82)Goodwill at 31 March 2016 – – – – –Carrying value at 31 March 2016 – 49 32 1 82
Reconciliation of summarised financial information
Eaststarch£m
Almex£m
Bio-PDO£m
Other£m
Total£m
Opening net assets at 1 April 2014 307 90 48 6 451Profit for the year from total operations 66 22 10 – 98Other comprehensive (expense)/income related to assets
and liabilities (excluding goodwill) (39) (4) 7 – (36)Dividends – (28) – (4) (32)Closing net assets at 31 March 2015 334 80 65 2 481Interest in joint venture (%) 50% 50% 50% 50%Interest in joint venture at share 167 40 33 1 241Goodwill at 1 April 2014 82 – – – 82Goodwill at 31 March 2015 82 – – – 82Carrying value at 31 March 2015 249 40 33 1 323
123 Tate & Lyle PLC Annual Report 2016
Financial Statements | Notes to the Consolidated Financial Statements
Strategic ReportG
overnanceFinancial Statem
entsU
seful Information
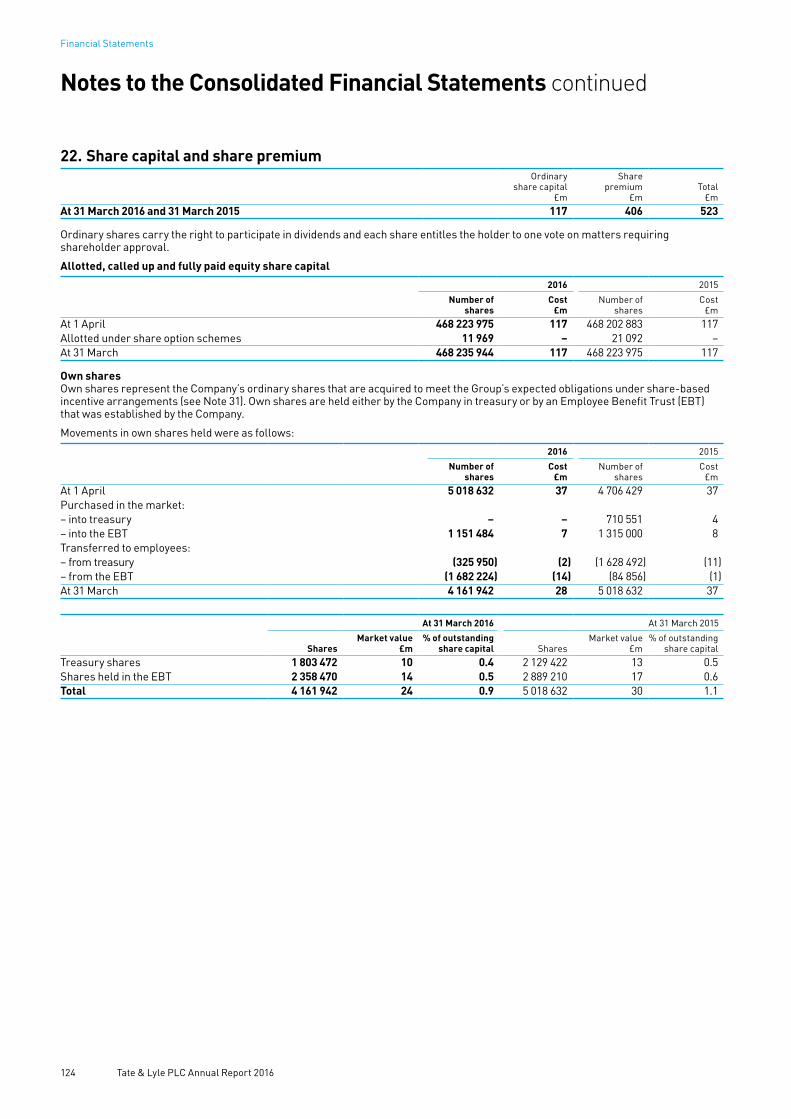
22. Share capital and share premiumOrdinary
share capital£m
Share premium
£mTotal
£mAt 31 March 2016 and 31 March 2015 117 406 523
Ordinary shares carry the right to participate in dividends and each share entitles the holder to one vote on matters requiring shareholder approval.
Allotted, called up and fully paid equity share capital
2016 2015
Number ofshares
Cost£m
Number of shares
Cost£m
At 1 April 468 223 975 117 468 202 883 117Allotted under share option schemes 11 969 – 21 092 –At 31 March 468 235 944 117 468 223 975 117
Own sharesOwn shares represent the Company’s ordinary shares that are acquired to meet the Group’s expected obligations under share-based incentive arrangements (see Note 31). Own shares are held either by the Company in treasury or by an Employee Benefit Trust (EBT)that was established by the Company.
Movements in own shares held were as follows:
2016 2015
Number ofshares
Cost£m
Number of shares
Cost£m
At 1 April 5 018 632 37 4 706 429 37Purchased in the market:– into treasury – – 710 551 4– into the EBT 1 151 484 7 1 315 000 8Transferred to employees:– from treasury (325 950) (2) (1 628 492) (11)– from the EBT (1 682 224) (14) (84 856) (1)At 31 March 4 161 942 28 5 018 632 37
At 31 March 2016 At 31 March 2015
SharesMarket value
£m% of outstanding
share capital SharesMarket value
£m% of outstanding
share capitalTreasury shares 1 803 472 10 0.4 2 129 422 13 0.5Shares held in the EBT 2 358 470 14 0.5 2 889 210 17 0.6Total 4 161 942 24 0.9 5 018 632 30 1.1
Notes to the Consolidated Financial Statements continued
124 Tate & Lyle PLC Annual Report 2016
Financial Statements

23. Other reserves
Hedging reserve
£m
Currencytranslation
reserve£m
Other reserves
£mTotal
£mAt 31 March 2014 1 (40) 97 58Other comprehensive income:Cash flow hedges:– fair value losses in the year (5) – – (5)– reclassified and reported in the income statement in the year (2) – – (2)– tax effect of the above movements 2 – – 2Fair value gain on revaluation of available-for-sale financial assets – – 2 2Currency translation differences:– gain on currency translation of foreign operations – 56 – 56– fair value loss on net investment hedges – (32) – (32)Share of other comprehensive expenses of joint ventures – (18) – (18)At 31 March 2015 (4) (34) 99 61Other comprehensive income:Cash flow hedges:– fair value losses in the year – – – –– reclassified and reported in the income statement in the year 2 – – 2– tax effect of the above movements – – – –Loss on revaluation of available-for-sale financial assets – – – –Currency translation differences:– gain on currency translation of foreign operations – 60 – 60– fair value loss on net investment hedges – (18) – (18)Share of other comprehensive expenses of joint ventures – (12) – (12)Items transferred to income upon disposal of joint ventures – 34 – 34At 31 March 2016 (2) 30 99 127
24. Trade and other payablesAt 31 March
2016£m
2015£m
Current payablesTrade payables 218 228Social security 5 2Accruals and deferred income 98 73Other payables 16 13Total 337 316
The above amounts do not include non-current other payables of £13 million (2015 – £13 million).
25. BorrowingsNon-current borrowings
At 31 March
2016£m
2015£m
2,394,000 6.5% cumulative preference shares of £1 each 2 2Industrial Revenue Bonds 2016–2036 (US$77,655,000) 49 52US Private Placement 2023–2027 (US$400,000,000) 277 –6.625% Guaranteed Notes 2016 (US$250,000,000) – 1736.75% Guaranteed Notes 2019 (£200,000,000) 215 218Total 543 445Other bank loans 2 2Total 2 2Other borrowingsObligations under finance leases 11 16Total 11 16Total non-current borrowings 556 463
125 Tate & Lyle PLC Annual Report 2016
Financial Statements | Notes to the Consolidated Financial Statements
Strategic ReportG
overnanceFinancial Statem
entsU
seful Information
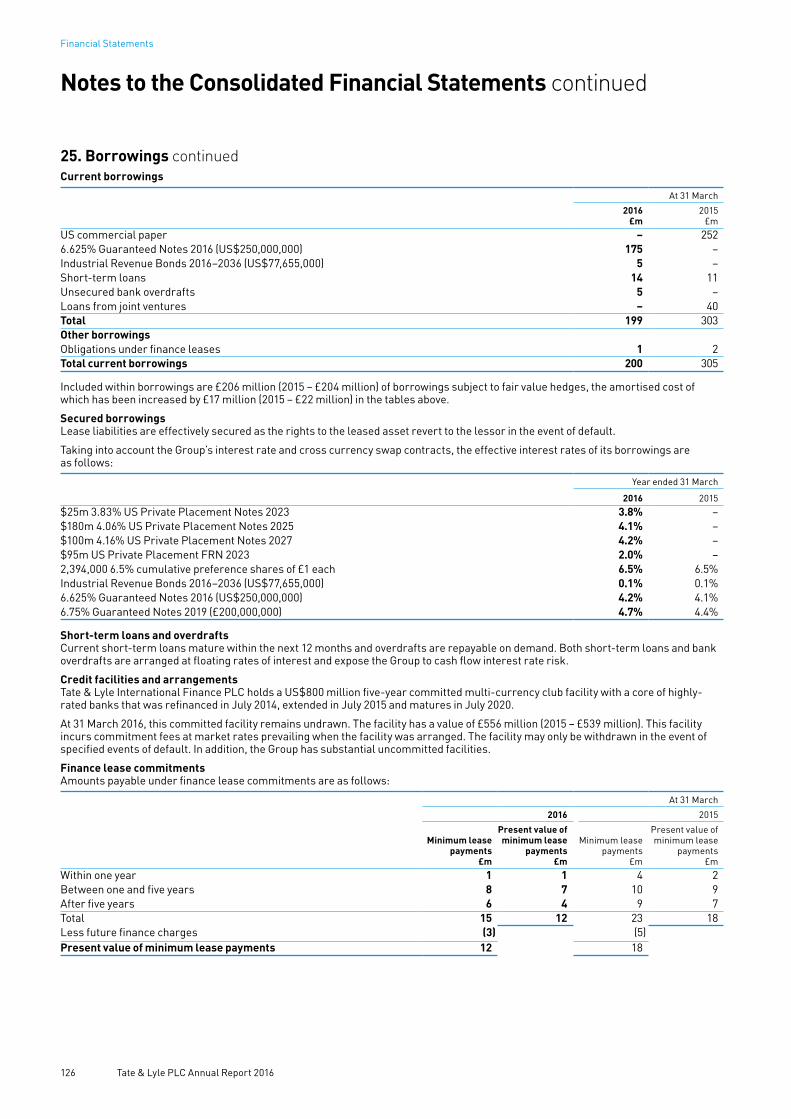
25. Borrowings continuedCurrent borrowings
At 31 March
2016£m
2015£m
US commercial paper – 2526.625% Guaranteed Notes 2016 (US$250,000,000) 175 –Industrial Revenue Bonds 2016–2036 (US$77,655,000) 5 –Short-term loans 14 11Unsecured bank overdrafts 5 –Loans from joint ventures – 40Total 199 303Other borrowingsObligations under finance leases 1 2Total current borrowings 200 305
Included within borrowings are £206 million (2015 – £204 million) of borrowings subject to fair value hedges, the amortised cost of which has been increased by £17 million (2015 – £22 million) in the tables above.
Secured borrowingsLease liabilities are effectively secured as the rights to the leased asset revert to the lessor in the event of default.
Taking into account the Group’s interest rate and cross currency swap contracts, the effective interest rates of its borrowings are as follows:
Year ended 31 March
2016 2015$25m 3.83% US Private Placement Notes 2023 3.8% –$180m 4.06% US Private Placement Notes 2025 4.1% –$100m 4.16% US Private Placement Notes 2027 4.2% –$95m US Private Placement FRN 2023 2.0% –2,394,000 6.5% cumulative preference shares of £1 each 6.5% 6.5%Industrial Revenue Bonds 2016–2036 (US$77,655,000) 0.1% 0.1%6.625% Guaranteed Notes 2016 (US$250,000,000) 4.2% 4.1%6.75% Guaranteed Notes 2019 (£200,000,000) 4.7% 4.4%
Short-term loans and overdraftsCurrent short-term loans mature within the next 12 months and overdrafts are repayable on demand. Both short-term loans and bank overdrafts are arranged at floating rates of interest and expose the Group to cash flow interest rate risk.
Credit facilities and arrangementsTate & Lyle International Finance PLC holds a US$800 million five-year committed multi-currency club facility with a core of highly-rated banks that was refinanced in July 2014, extended in July 2015 and matures in July 2020.
At 31 March 2016, this committed facility remains undrawn. The facility has a value of £556 million (2015 – £539 million). This facility incurs commitment fees at market rates prevailing when the facility was arranged. The facility may only be withdrawn in the event of specified events of default. In addition, the Group has substantial uncommitted facilities.
Finance lease commitmentsAmounts payable under finance lease commitments are as follows:
At 31 March
2016 2015
Minimum leasepayments
£m
Present value ofminimum lease
payments£m
Minimum leasepayments
£m
Present value ofminimum lease
payments£m
Within one year 1 1 4 2Between one and five years 8 7 10 9After five years 6 4 9 7Total 15 12 23 18Less future finance charges (3) (5)Present value of minimum lease payments 12 18
Notes to the Consolidated Financial Statements continued
126 Tate & Lyle PLC Annual Report 2016
Financial Statements

26. Change in working capitalContinuing operations
Year ended 31 March
2016£m
Restated#
2015 £m
(Increase)/decrease in inventories (8) 6Decrease/(increase) in receivables 14 (9)Increase in payables 1 1Decrease in derivative financial instruments (excluding debt-related derivatives) 13 13Increase/(decrease) in provisions for other liabilities and charges 4 (3)Change in working capital 24 8
# Prior year restated to reflect discontinued operations (see Note 3).
27. Net debtReconciliation of the increase/(decrease) in cash and cash equivalents to the movement in net debt:
Year ended 31 March
2016£m
Restated* 2015
£m)Net increase/(decrease) in cash and cash equivalents 108 (170)Net decrease in borrowings 29 43Decrease/(increase) in net debt resulting from cash flows 137 (127)Fair value and other movements (1) 1Debt acquired on acquisition of subsidiaries – (5)Currency translation differences (15) (39)Decrease/(increase) in net debt in the year 121 (170)Net debt at beginning of year (555) (385)Net debt at end of year (434) (555)
Movements in the Group’s net debt are as follows:
Cash and cash equivalents
£m
Borrowings and finance leases
Current£m
Non-current£m
Debt related derivatives
£mTotal
£mAt 1 April 2014 (Restated*) 346 (323) (437) 29 (385)(Increase)/decrease resulting from cash flows (170) 40 3 – (127)Fair value and other movements – 6 (1) (4) 1Debt acquired on acquisition of subsidiaries – (4) (1) – (5)Currency translation differences 19 (24) (27) (7) (39)At 31 March 2015 (Restated*) 195 (305) (463) 18 (555)Decrease/(increase) resulting from cash flows 108 282 (253) – 137Fair value and other movements – – 2 (3) (1)Reclassification – (169) 169 – –Currency translation differences 14 (8) (11) (10) (15)At 31 March 2016 317 (200) (556) 5 (434)
Net debt is denominated in the following currencies:
At 31 March
2016£m
Restated*2015
£mEuro (41) (55)US dollar (442) (512)Sterling 56 (5)Other (7) 17Total (434) (555)
* Prior year adjusted measures restated for the adoption of equity accounting (see Note 1).
127 Tate & Lyle PLC Annual Report 2016
Financial Statements | Notes to the Consolidated Financial Statements
Strategic ReportG
overnanceFinancial Statem
entsU
seful Information
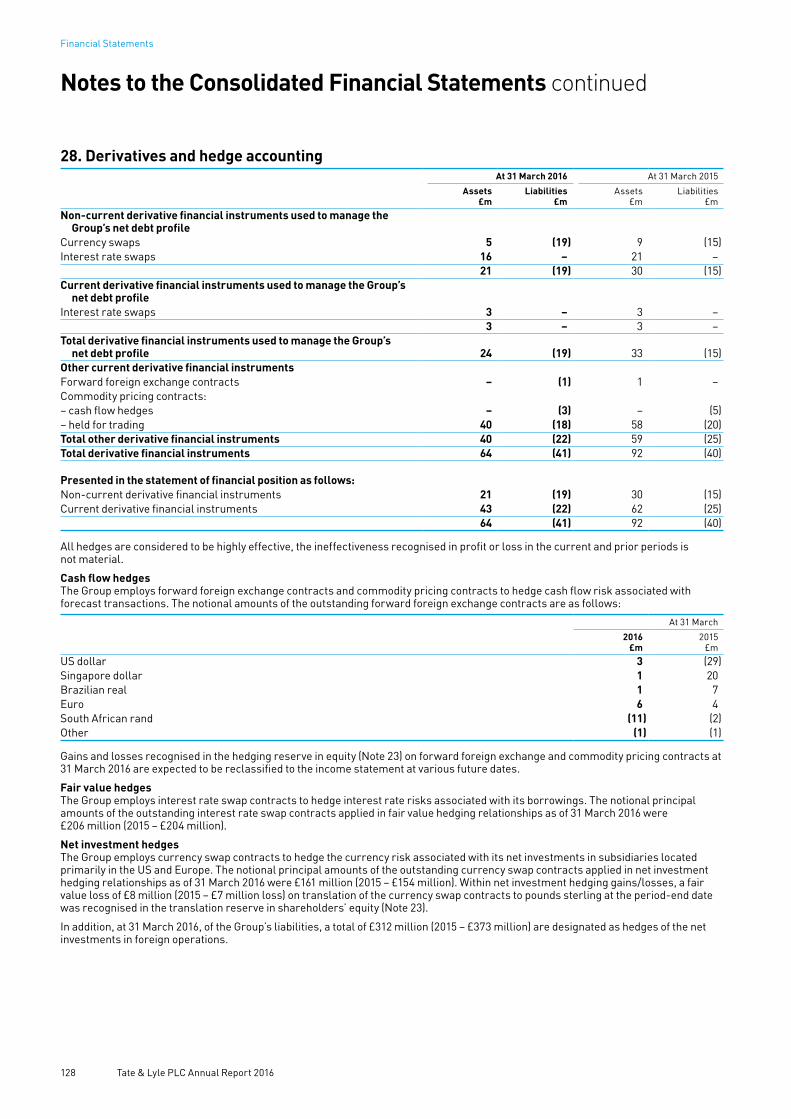
28. Derivatives and hedge accountingAt 31 March 2016 At 31 March 2015
Assets£m
Liabilities£m
Assets£m
Liabilities£m
Non-current derivative financial instruments used to manage the Group’s net debt profile
Currency swaps 5 (19) 9 (15)Interest rate swaps 16 – 21 –
21 (19) 30 (15)Current derivative financial instruments used to manage the Group’s
net debt profileInterest rate swaps 3 – 3 –
3 – 3 –Total derivative financial instruments used to manage the Group’s
net debt profile 24 (19) 33 (15)Other current derivative financial instrumentsForward foreign exchange contracts – (1) 1 –Commodity pricing contracts:– cash flow hedges – (3) – (5)– held for trading 40 (18) 58 (20)Total other derivative financial instruments 40 (22) 59 (25)Total derivative financial instruments 64 (41) 92 (40)
Presented in the statement of financial position as follows:Non-current derivative financial instruments 21 (19) 30 (15)Current derivative financial instruments 43 (22) 62 (25)
64 (41) 92 (40)
All hedges are considered to be highly effective, the ineffectiveness recognised in profit or loss in the current and prior periods is not material.
Cash flow hedgesThe Group employs forward foreign exchange contracts and commodity pricing contracts to hedge cash flow risk associated with forecast transactions. The notional amounts of the outstanding forward foreign exchange contracts are as follows:
At 31 March
2016£m
2015£m
US dollar 3 (29)Singapore dollar 1 20Brazilian real 1 7Euro 6 4South African rand (11) (2)Other (1) (1)
Gains and losses recognised in the hedging reserve in equity (Note 23) on forward foreign exchange and commodity pricing contracts at 31 March 2016 are expected to be reclassified to the income statement at various future dates.
Fair value hedgesThe Group employs interest rate swap contracts to hedge interest rate risks associated with its borrowings. The notional principal amounts of the outstanding interest rate swap contracts applied in fair value hedging relationships as of 31 March 2016 were £206 million (2015 – £204 million).
Net investment hedgesThe Group employs currency swap contracts to hedge the currency risk associated with its net investments in subsidiaries located primarily in the US and Europe. The notional principal amounts of the outstanding currency swap contracts applied in net investment hedging relationships as of 31 March 2016 were £161 million (2015 – £154 million). Within net investment hedging gains/losses, a fair value loss of £8 million (2015 – £7 million loss) on translation of the currency swap contracts to pounds sterling at the period-end date was recognised in the translation reserve in shareholders’ equity (Note 23).
In addition, at 31 March 2016, of the Group’s liabilities, a total of £312 million (2015 – £373 million) are designated as hedges of the net investments in foreign operations.
Notes to the Consolidated Financial Statements continued
128 Tate & Lyle PLC Annual Report 2016
Financial Statements
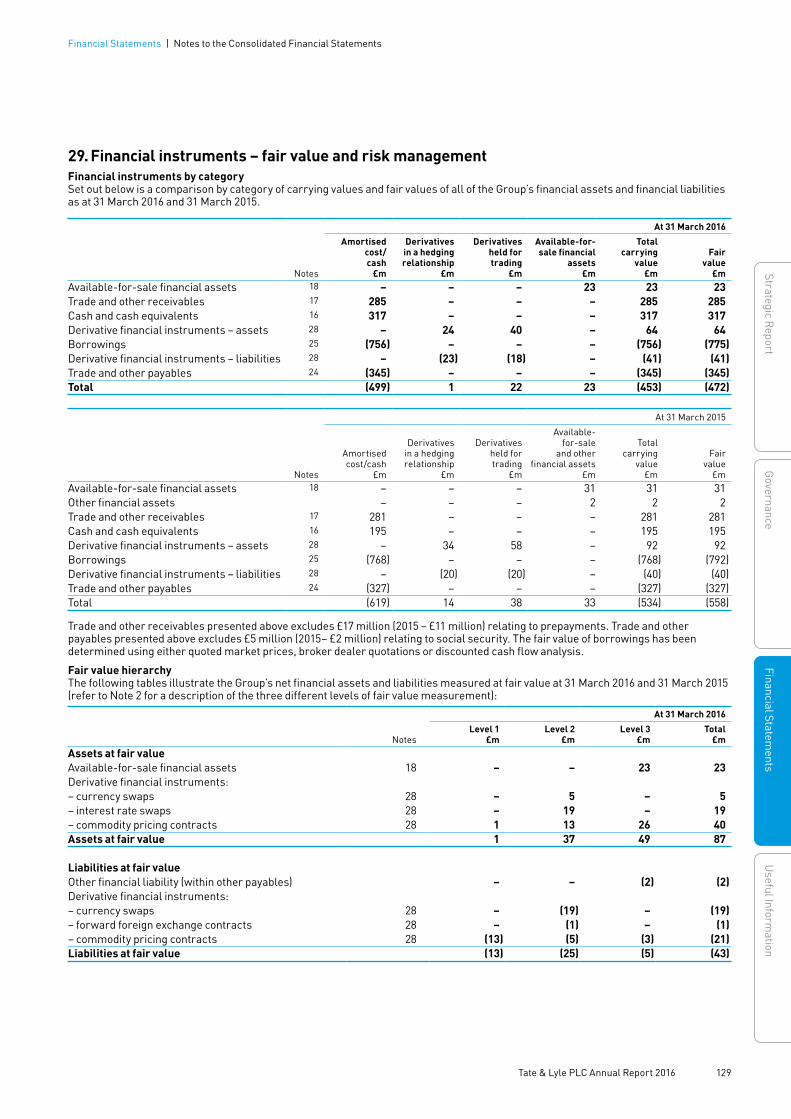
29. Financial instruments – fair value and risk management Financial instruments by categorySet out below is a comparison by category of carrying values and fair values of all of the Group’s financial assets and financial liabilities as at 31 March 2016 and 31 March 2015.
At 31 March 2016
Notes
Amortised cost/cash
£m
Derivatives in a hedging relationship
£m
Derivatives held for trading
£m
Available-for-sale financial
assets£m
Total carrying
value£m
Fair value
£mAvailable-for-sale financial assets 18 – – – 23 23 23Trade and other receivables 17 285 – – – 285 285Cash and cash equivalents 16 317 – – – 317 317Derivative financial instruments – assets 28 – 24 40 – 64 64Borrowings 25 (756) – – – (756) (775)Derivative financial instruments – liabilities 28 – (23) (18) – (41) (41)Trade and other payables 24 (345) – – – (345) (345)Total (499) 1 22 23 (453) (472)
At 31 March 2015
Notes
Amortised cost/cash
£m
Derivatives in a hedging relationship
£m
Derivativesheld for trading
£m
Available-for-sale
and other financial assets
£m
Total carrying
value£m
Fair value
£mAvailable-for-sale financial assets 18 – – – 31 31 31Other financial assets – – – 2 2 2Trade and other receivables 17 281 – – – 281 281Cash and cash equivalents 16 195 – – – 195 195Derivative financial instruments – assets 28 – 34 58 – 92 92Borrowings 25 (768) – – – (768) (792)Derivative financial instruments – liabilities 28 – (20) (20) – (40) (40)Trade and other payables 24 (327) – – – (327) (327)Total (619) 14 38 33 (534) (558)
Trade and other receivables presented above excludes £17 million (2015 – £11 million) relating to prepayments. Trade and other payables presented above excludes £5 million (2015– £2 million) relating to social security. The fair value of borrowings has been determined using either quoted market prices, broker dealer quotations or discounted cash flow analysis.
Fair value hierarchyThe following tables illustrate the Group’s net financial assets and liabilities measured at fair value at 31 March 2016 and 31 March 2015 (refer to Note 2 for a description of the three different levels of fair value measurement):
Notes
At 31 March 2016
Level 1£m
Level 2£m
Level 3£m
Total£m
Assets at fair valueAvailable-for-sale financial assets 18 – – 23 23Derivative financial instruments:– currency swaps 28 – 5 – 5– interest rate swaps 28 – 19 – 19– commodity pricing contracts 28 1 13 26 40Assets at fair value 1 37 49 87
Liabilities at fair valueOther financial liability (within other payables) – – (2) (2)Derivative financial instruments:– currency swaps 28 – (19) – (19)– forward foreign exchange contracts 28 – (1) – (1)– commodity pricing contracts 28 (13) (5) (3) (21)Liabilities at fair value (13) (25) (5) (43)
129 Tate & Lyle PLC Annual Report 2016
Financial Statements | Notes to the Consolidated Financial Statements
Strategic ReportG
overnanceFinancial Statem
entsU
seful Information

29. Financial instruments – fair value and risk management continued
Notes
At 31 March 2015
Level 1£m
Level 2£m
Level 3£m
Total£m
Assets at fair valueAvailable-for-sale financial assets 18 – – 31 31Other financial assets 2 – – 2Derivative financial instruments:– currency swaps 28 – 9 – 9– interest rate swaps 28 – 24 – 24– forward foreign exchange contracts 28 – 1 – 1– commodity pricing contracts 28 2 19 37 58Assets at fair value 4 53 68 125
Liabilities at fair valueOther financial liability (within other payables) 24 – – (2) (2)Derivative financial instruments:– currency swaps 28 – (15) – (15)– interest rate swaps 28 – – – –– commodity pricing contracts 28 (12) (7) (6) (25)Liabilities at fair value (12) (22) (8) (42)
The following table shows the methodology used to measure Level 3 fair values:
Financial instruments measured at fair value
Type Valuation technique Significant unobservable inputs
Sensitivity of the fair value measurement in reasonable changes to inputs
Written commodity contract Based on the Group’s own assessment of the commodity, supply and demand, as well as expected pricing.
Price of co-product positions (refer to fair value measurement section in Note 2).
10% increase/(decrease) in the price of the co-products and commodity contracts would result in a net increase/(decrease) in fair value of £15 million in respect of Level 3 financial instruments. (The full impact on the Group’s income statement is described within the price risk management section).
In addition to the above, the Group’s available-for-sale financial assets are sensitive to a number of market and non-market factors.
The following table reconciles the movement in the Group’s net financial instruments classified in ‘Level 3’ of the fair value hierarchy:Commodity
pricing contracts
– assets£m
Commodity pricing
contracts – liabilities
£m
Available-for-sale assets
£m
Other financial liability
£mTotal
£mAt 1 April 2014 42 (21) 28 – 49Total gains/(losses):– in operating profit 37 (6) (2) – 29– in other comprehensive income – – 5 – 5Purchases – – 2 (2) –Settlements (42) 21 (2) – (23)At 31 March 2015 37 (6) 31 (2) 60Total gains/(losses):– in operating profit 21 (3) 6 – 24Purchases – – 4 – 4Settlements (32) 6 (18) – (44)At 31 March 2016 26 (3) 23 (2) 44
Notes to the Consolidated Financial Statements continued
130 Tate & Lyle PLC Annual Report 2016
Financial Statements

29. Financial instruments – fair value and risk management continuedManagement of financial riskThe key financial risks faced by the Group are credit risk, liquidity risk, and market risks, which include interest rate risk, foreign exchange risk and certain commodity price risks. The Board regularly reviews these risks and approves written policies covering the use of financial instruments to manage these risks and sets overall risk limits. The derivative financial instruments approved by the Board of Tate & Lyle PLC to manage financial risks include swaps, both interest rate and currency, swaptions, caps, forward rate agreements, foreign exchange and commodity forward contracts and options, and commodity futures.
The Chief Financial Officer retains the overall responsibility for management of financial risk for the Group. Most of the Group’s financing, interest rate and foreign exchange risk are managed through the Group treasury company, Tate & Lyle International Finance PLC, whose operations are directed by its board. Group interest rate and currency exposures are concentrated either in the treasury company or in appropriate holding companies through market-related transactions with Group subsidiaries. Tate & Lyle International Finance PLC arranges funding and manages interest rate, foreign exchange and bank counterparty risks within limits approved by the Board of Tate & Lyle PLC.
Commodity price risks are managed through divisional commodity trading functions in the US and Europe. These functions are controlled by divisional management who are responsible for ratifying general strategy and overseeing performance on a monthly basis. The performance of the commodity trading function is monitored against its ability to match the Group’s needs for raw materials with purchase contracts, as well as the Group’s output of co-products with sales contracts.
Commodity price contracts are categorised as being held either for trading or for hedging price exposures. The Group applies a limited level of hedge accounting to its economic price exposure hedges.
Market risksForeign exchange managementThe Group operates internationally and is exposed to foreign exchange risks arising from commercial transactions (transaction exposure), and from recognised assets, liabilities and investments in foreign operations (translation exposure).
Transaction exposure The Group’s policy requires subsidiaries to hedge transactional currency exposures against their functional currency once the transaction is committed or highly probable, mainly through the use of forward foreign exchange contracts. The amounts deferred in equity from derivative financial instruments designated as cash flow hedges are released to the income statement and offset against the movement in underlying transactions only when the forecast transactions affect the income statement.
Translation exposureThe Group manages the foreign exchange exposure to net investments in overseas operations, particularly in the US and Europe, by borrowing principally in US dollars, which provide a partial match for the Group’s major foreign currency assets. The Group also manages some of its foreign exchange exposure to net investments in foreign operations through the use of currency swap contracts and other liabilities. The amount deferred in equity from the hedging instruments designated as net investment hedges is offset against the foreign currency translation effect of the net investment in foreign operations, and is released to the income statement upon disposal of those investments.
The following table illustrates only the Group’s sensitivity to the fluctuation of the major currencies on its income statement and financial assets and liabilities:
At 31 March 2016 At 31 March 2015
Income statement -/+
£mEquity -/+
£m
Income statement -/+
£mEquity -/+
£mSterling/US dollar 10% change 1 42 1 47Sterling/euro 10% change – 5 3 5
Interest rate managementThe Group has an exposure to interest rate risk, arising principally from changes in US dollar, sterling and euro interest rates. This risk is managed by fixing or capping portions of debt using interest rate derivatives to achieve a target level of fixed/floating rate net debt, which aims to optimise net finance expense and reduce volatility in reported earnings. The Group’s policy is that between 30% and 75% of Group net debt is fixed for more than one year and that no interest rates are fixed for more than 12 years. At 31 March 2016, the longest term of any fixed rate debt held by the Group was until October 2027 (2015 – November 2019). The proportion of net debt managed by the Group’s treasury function at 31 March 2016 that was fixed or capped for more than one year was 60% (2015 – 31%).
The Group considers a 100 basis point change in interest rates a reasonably possible change except where rates are less than 100 basis points. In these instances it is assumed that the interest rates increase by 100 basis points and decrease to zero for the purpose of performing the sensitivity analysis. The impact is calculated with reference to the gross debt and cash held as at 31 March 2016 assuming that other variables remain unchanged.
As at 31 March 2016, if interest rates increase by 100 basis points, Group profit before tax will decrease by £1 million (2015 – £3 million). If interest rates decrease by 100 basis points, or less where applicable, Group profit before tax will increase by £1 million (2015 – £2 million increase).
131 Tate & Lyle PLC Annual Report 2016
Financial Statements | Notes to the Consolidated Financial Statements
Strategic ReportG
overnanceFinancial Statem
entsU
seful Information
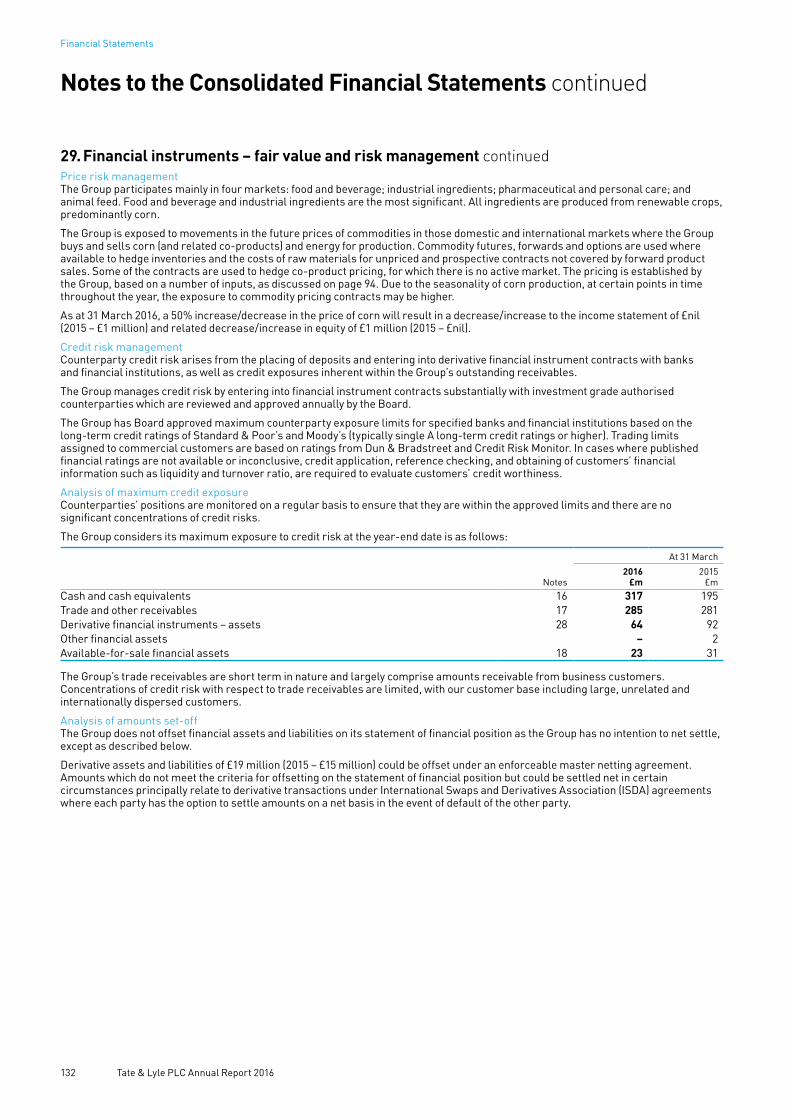
29. Financial instruments – fair value and risk management continuedPrice risk managementThe Group participates mainly in four markets: food and beverage; industrial ingredients; pharmaceutical and personal care; and animal feed. Food and beverage and industrial ingredients are the most significant. All ingredients are produced from renewable crops, predominantly corn.
The Group is exposed to movements in the future prices of commodities in those domestic and international markets where the Group buys and sells corn (and related co-products) and energy for production. Commodity futures, forwards and options are used where available to hedge inventories and the costs of raw materials for unpriced and prospective contracts not covered by forward product sales. Some of the contracts are used to hedge co-product pricing, for which there is no active market. The pricing is established by the Group, based on a number of inputs, as discussed on page 94. Due to the seasonality of corn production, at certain points in time throughout the year, the exposure to commodity pricing contracts may be higher.
As at 31 March 2016, a 50% increase/decrease in the price of corn will result in a decrease/increase to the income statement of £nil (2015 – £1 million) and related decrease/increase in equity of £1 million (2015 – £nil).
Credit risk managementCounterparty credit risk arises from the placing of deposits and entering into derivative financial instrument contracts with banks and financial institutions, as well as credit exposures inherent within the Group’s outstanding receivables.
The Group manages credit risk by entering into financial instrument contracts substantially with investment grade authorised counterparties which are reviewed and approved annually by the Board.
The Group has Board approved maximum counterparty exposure limits for specified banks and financial institutions based on the long-term credit ratings of Standard & Poor’s and Moody’s (typically single A long-term credit ratings or higher). Trading limits assigned to commercial customers are based on ratings from Dun & Bradstreet and Credit Risk Monitor. In cases where published financial ratings are not available or inconclusive, credit application, reference checking, and obtaining of customers’ financial information such as liquidity and turnover ratio, are required to evaluate customers’ credit worthiness.
Analysis of maximum credit exposureCounterparties’ positions are monitored on a regular basis to ensure that they are within the approved limits and there are no significant concentrations of credit risks.
The Group considers its maximum exposure to credit risk at the year-end date is as follows:
At 31 March
Notes2016
£m2015
£mCash and cash equivalents 16 317 195Trade and other receivables 17 285 281Derivative financial instruments – assets 28 64 92Other financial assets – 2Available-for-sale financial assets 18 23 31
The Group’s trade receivables are short term in nature and largely comprise amounts receivable from business customers. Concentrations of credit risk with respect to trade receivables are limited, with our customer base including large, unrelated and internationally dispersed customers.
Analysis of amounts set-offThe Group does not offset financial assets and liabilities on its statement of financial position as the Group has no intention to net settle, except as described below.
Derivative assets and liabilities of £19 million (2015 – £15 million) could be offset under an enforceable master netting agreement. Amounts which do not meet the criteria for offsetting on the statement of financial position but could be settled net in certain circumstances principally relate to derivative transactions under International Swaps and Derivatives Association (ISDA) agreements where each party has the option to settle amounts on a net basis in the event of default of the other party.
Notes to the Consolidated Financial Statements continued
132 Tate & Lyle PLC Annual Report 2016
Financial Statements

29. Financial instruments – fair value and risk management continuedLiquidity risk managementThe Group manages its exposure to liquidity risk and ensures maximum flexibility in meeting changing business needs, by maintaining access to a wide range of funding sources, including capital markets and bank borrowings. Capital market issues outstanding at 31 March 2016 are listed in Note 25.
The Group ensures that it has sufficient undrawn committed bank facilities to provide liquidity back-up for the Group’s working capital requirements. The Group has a core committed bank facility of US$800 million which was refinanced in July 2014 and extended in July 2015 until July 2020. This facility is unsecured and contains common financial covenants for the Group and its subsidiary companies that the pre-exceptional and amortisation interest cover ratio should not be less than 2.5 times and the multiple of net debt to EBITDA, as defined in our financial covenants, should not be greater than 3.5 times. The Group intends to refinance the core committed bank facility no later than 12 months prior to the facility’s maturity in July 2020. The Group monitors compliance against all its financial obligations and it is Group policy to manage the consolidated statement of financial position so as to operate well within these covenanted restrictions. In both the current and comparative reporting period, the Group complied with its financial covenants at all measurement points. The majority of the Group’s borrowings are raised through the Group treasury company, Tate & Lyle International Finance PLC, and are then on-lent to the business units on an arm’s length basis.
Current Group policy is to ensure that, after subtracting the total of undrawn committed facilities, no more than 10% of gross debt matures within 12 months and at least 35% matures in more than 2.5 years. At 31 March 2016, after subtracting total undrawn committed facilities, there was no debt maturing within 12 months (2015 – none) and none maturing within 2.5 years (2015 – 24%). The average maturity of the Group’s gross debt was 6.6 years (2015 – 4.2 years).
At the year end, the Group held cash and cash equivalents of £317 million (2015 – £195 million) and had committed undrawn facilities of £556 million (2015 – £539 million). These resources are maintained to provide liquidity back-up and to meet the projected maximum cash outflow from debt repayment, capital expenditure and seasonal working capital needs foreseen for at least a year into the future at any one time.
The table below analyses the undiscounted cash flows related to the Group’s non-derivative financial liabilities and derivative assets and liabilities.
Liquidity analysis
At 31 March 2016
< 1 year£m
1 – 5 years£m
> 5 years£m
Borrowings including finance leases (200) (208) (334)Interest on borrowings (29) (82) (55)Trade and other payables (337) (13) –Derivative contracts:– receipts 77 197 –– payments (71) (198) –Commodity contracts (15) (1) –
Liquidity analysis
At 31 March 2015
< 1 year£m
1 – 5 years£m
> 5 years£m
Borrowings including finance leases (307) (385) (57)Interest on borrowings (25) (60) (1)Trade and other payables (316) (13) –Derivative contracts:– receipts 67 217 –– payments (60) (206) –Commodity contracts (8) – –
Included in borrowings are £2,394,000 of 6.5% cumulative preference shares. Only one year’s worth of interest payable on these shares is included in the less than one year category.
Derivative contracts include currency swaps, forward exchange contracts and interest rate swaps. Commodity pricing contracts included above represent options and futures.
Financial assets and liabilities denominated in currencies other than pounds sterling are translated to pounds sterling using year-end exchange rates.
133 Tate & Lyle PLC Annual Report 2016
Financial Statements | Notes to the Consolidated Financial Statements
Strategic ReportG
overnanceFinancial Statem
entsU
seful Information
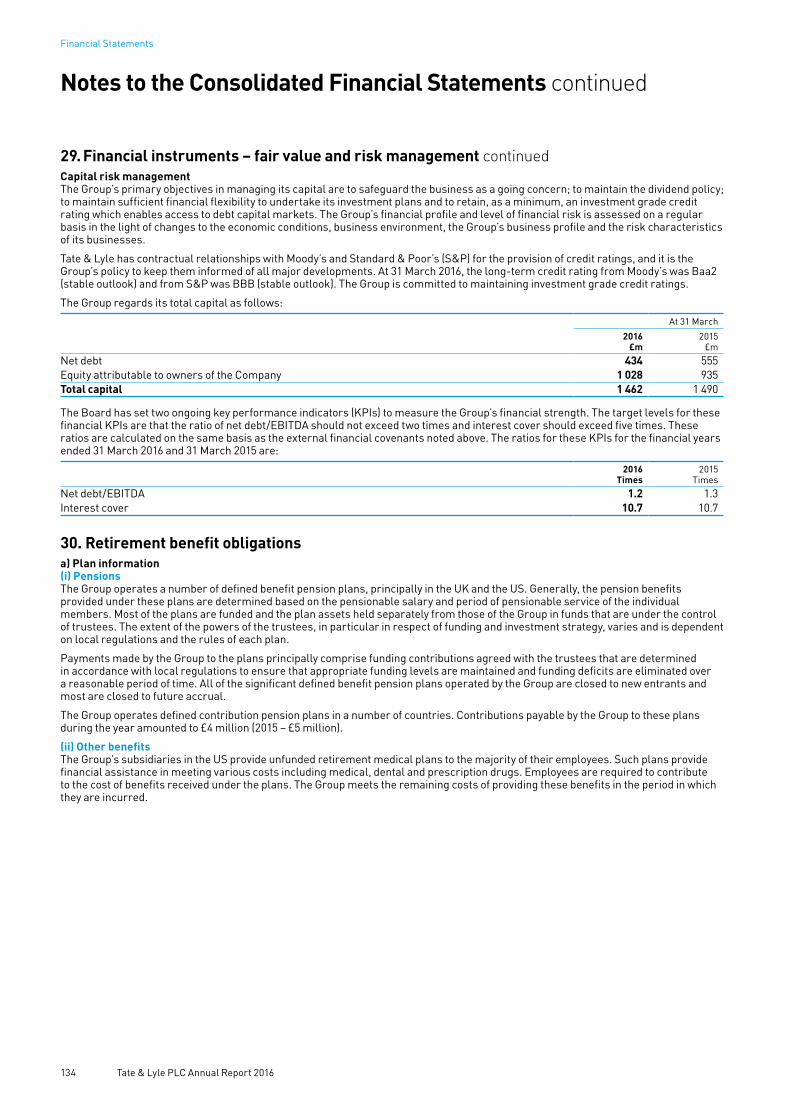
29. Financial instruments – fair value and risk management continuedCapital risk managementThe Group’s primary objectives in managing its capital are to safeguard the business as a going concern; to maintain the dividend policy; to maintain sufficient financial flexibility to undertake its investment plans and to retain, as a minimum, an investment grade credit rating which enables access to debt capital markets. The Group’s financial profile and level of financial risk is assessed on a regular basis in the light of changes to the economic conditions, business environment, the Group’s business profile and the risk characteristics of its businesses.
Tate & Lyle has contractual relationships with Moody’s and Standard & Poor’s (S&P) for the provision of credit ratings, and it is the Group’s policy to keep them informed of all major developments. At 31 March 2016, the long-term credit rating from Moody’s was Baa2 (stable outlook) and from S&P was BBB (stable outlook). The Group is committed to maintaining investment grade credit ratings.
The Group regards its total capital as follows:
At 31 March
2016£m
2015£m
Net debt 434 555Equity attributable to owners of the Company 1 028 935Total capital 1 462 1 490
The Board has set two ongoing key performance indicators (KPIs) to measure the Group’s financial strength. The target levels for these financial KPIs are that the ratio of net debt/EBITDA should not exceed two times and interest cover should exceed five times. These ratios are calculated on the same basis as the external financial covenants noted above. The ratios for these KPIs for the financial years ended 31 March 2016 and 31 March 2015 are:
2016Times
2015Times
Net debt/EBITDA 1.2 1.3Interest cover 10.7 10.7
30. Retirement benefit obligationsa) Plan information(i) PensionsThe Group operates a number of defined benefit pension plans, principally in the UK and the US. Generally, the pension benefits provided under these plans are determined based on the pensionable salary and period of pensionable service of the individual members. Most of the plans are funded and the plan assets held separately from those of the Group in funds that are under the control of trustees. The extent of the powers of the trustees, in particular in respect of funding and investment strategy, varies and is dependent on local regulations and the rules of each plan.
Payments made by the Group to the plans principally comprise funding contributions agreed with the trustees that are determined in accordance with local regulations to ensure that appropriate funding levels are maintained and funding deficits are eliminated over a reasonable period of time. All of the significant defined benefit pension plans operated by the Group are closed to new entrants and most are closed to future accrual.
The Group operates defined contribution pension plans in a number of countries. Contributions payable by the Group to these plans during the year amounted to £4 million (2015 – £5 million).
(ii) Other benefitsThe Group’s subsidiaries in the US provide unfunded retirement medical plans to the majority of their employees. Such plans provide financial assistance in meeting various costs including medical, dental and prescription drugs. Employees are required to contribute to the cost of benefits received under the plans. The Group meets the remaining costs of providing these benefits in the period in which they are incurred.
Notes to the Consolidated Financial Statements continued
134 Tate & Lyle PLC Annual Report 2016
Financial Statements

30. Retirement benefit obligations continuedb) Movement in net defined benefit (liability)/asset(i) Analysis of net defined benefit liability
At 31 March 2016 At 31 March 2015
Pensions£m
Medical benefits
£mTotal
£mPensions
£m
Medical benefits
£mTotal
£mBenefit obligations:Funded plans (1 513) – (1 513) (1 636) – (1 636)Unfunded plans (55) (66) (121) (56) (69) (125)
(1 568) (66) (1 634) (1 692) (69) (1 761)Fair value of plan assets 1 426 – 1 426 1 534 – 1 534Net deficit (142) (66) (208) (158) (69) (227)
Presented in the statement of financial position:
Retirement benefit surplus 45 – 45 25 – 25Retirement benefit deficit (187) (66) (253) (183) (69) (252)
(142) (66) (208) (158) (69) (227)
Net defined benefit liability reconciliation:
Pensions£m
Medical benefits
£mTotal
£mAt 1 April 2014 (166) (54) (220)Year ended 31 March 2015– net increase in the benefit obligation (221) (15) (236)– net increase in the fair value of plan assets 229 – 229At 31 March 2015 (158) (69) (227)Year ended 31 March 2016– net decrease in the benefit obligation 124 3 127– net decrease in the fair value of plan assets (108) – (108)At 31 March 2016 (142) (66) (208)
135 Tate & Lyle PLC Annual Report 2016
Financial Statements | Notes to the Consolidated Financial Statements
Strategic ReportG
overnanceFinancial Statem
entsU
seful Information

30. Retirement benefit obligations continued(ii) Analysis of movements in the benefit obligation
Pension benefits
UK£m
US£m
Other£m
Total£m
Medical benefits
£mTotal
£mAt 1 April 2014 (1 013) (445) (13) (1 471) (54) (1 525)Year ended 31 March 2015Service cost – current – (1) (2) (3) (1) (4)Service (cost)/credit – past – (1) – (1) 2 1Plan administration costs (3) – – (3) – (3)Interest on benefit obligation (41) (19) – (60) (2) (62)Actuarial (losses)/gains:– changes in financial assumptions (115) (35) – (150) (5) (155)– changes in demographic assumptions (1) (41) – (42) (4) (46)– experience against assumptions 15 3 – 18 (3) 15Net actuarial loss (101) (73) – (174) (12) (186)Employees’ contributions – – – – – –Benefits paid 51 25 – 76 4 80Currency translation differences (2) (54) – (56) (6) (62)Increase in the benefit obligation (96) (123) (2) (221) (15) (236)At 31 March 2015 (1 109) (568) (15) (1 692) (69) (1 761)Year ended 31 March 2016Service cost – current – (1) – (1) (1) (2)Service credit – past – – – – 3 3Plan administration costs (3) – – (3) – (3)Interest on benefit obligation (36) (20) – (56) (2) (58)Actuarial gains:– changes in financial assumptions 21 – – 21 1 22– changes in demographic assumptions – 7 – 7 1 8– experience against assumptions 13 2 – 15 – 15Net actuarial gain 34 9 – 43 2 45Employees’ contributions – – – – – –Benefits paid 50 28 – 78 4 82Settlement loss (buy-out transaction) (2) – – (2) – (2)Settlements 81 – – 81 – 81Currency translation differences – (16) – (16) (3) (19)Decrease in the benefit obligation 124 – – 124 3 127At 31 March 2016 (985) (568) (15) (1 568) (66) (1 634)
At 31 March 2016, the benefits expected to be paid by the plans over the next ten years were as follows:
Pensions benefits
UK£m
US£m
Other£m
Total£m
Medical benefits
£mTotal
£mBenefit payments:– within 12 months 46 29 – 75 4 79– between 1 to 2 years 47 30 – 77 4 81– between 3 to 5 years 144 94 – 238 13 251– between 6 to 10 years 254 165 – 419 21 440Total expected benefit payments for
the next ten years 491 318 – 809 42 851
At 31 March 2016, the weighted average duration of the significant defined benefit obligations was as follows:
DurationPension plans:– UK 18 years– US 13 yearsMedical benefits 10 years
Notes to the Consolidated Financial Statements continued
136 Tate & Lyle PLC Annual Report 2016
Financial Statements
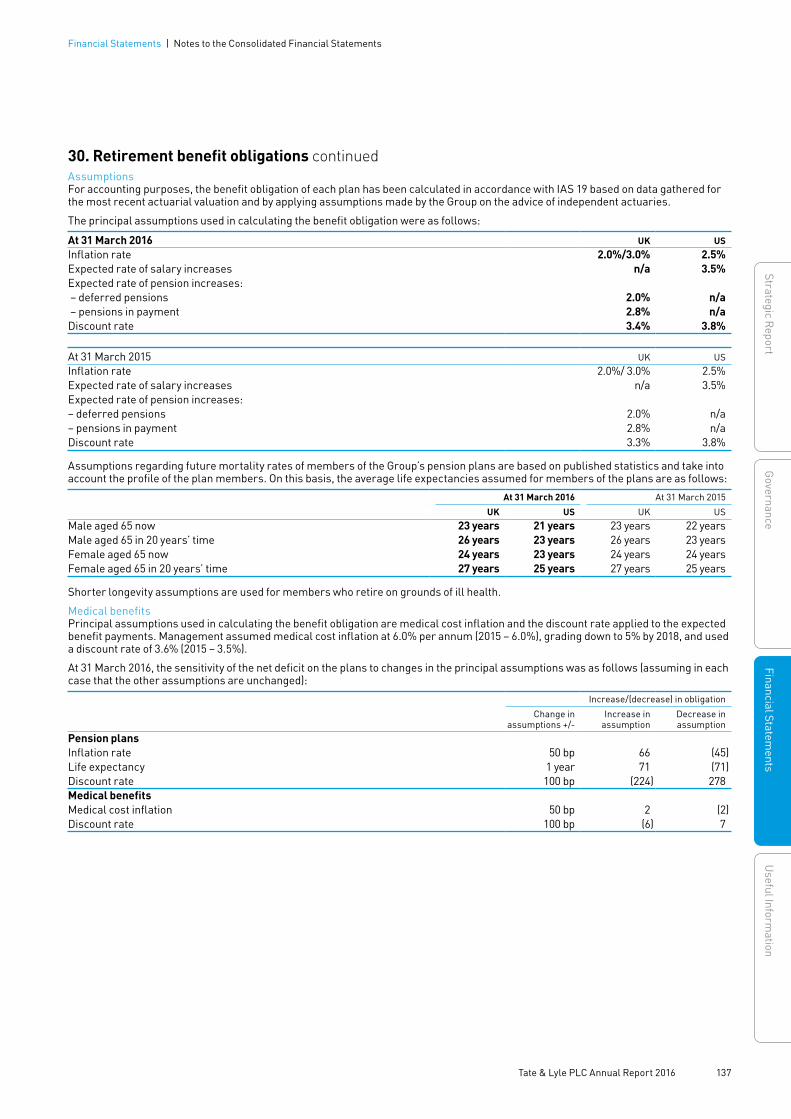
30. Retirement benefit obligations continuedAssumptionsFor accounting purposes, the benefit obligation of each plan has been calculated in accordance with IAS 19 based on data gathered for the most recent actuarial valuation and by applying assumptions made by the Group on the advice of independent actuaries.
The principal assumptions used in calculating the benefit obligation were as follows:
At 31 March 2016 UK USInflation rate 2.0%/3.0% 2.5%Expected rate of salary increases n/a 3.5%Expected rate of pension increases: – deferred pensions 2.0% n/a – pensions in payment 2.8% n/aDiscount rate 3.4% 3.8%
At 31 March 2015 UK USInflation rate 2.0%/ 3.0% 2.5%Expected rate of salary increases n/a 3.5%Expected rate of pension increases:– deferred pensions 2.0% n/a– pensions in payment 2.8% n/aDiscount rate 3.3% 3.8%
Assumptions regarding future mortality rates of members of the Group’s pension plans are based on published statistics and take into account the profile of the plan members. On this basis, the average life expectancies assumed for members of the plans are as follows:
At 31 March 2016 At 31 March 2015
UK US UK USMale aged 65 now 23 years 21 years 23 years 22 yearsMale aged 65 in 20 years’ time 26 years 23 years 26 years 23 yearsFemale aged 65 now 24 years 23 years 24 years 24 yearsFemale aged 65 in 20 years’ time 27 years 25 years 27 years 25 years
Shorter longevity assumptions are used for members who retire on grounds of ill health.
Medical benefitsPrincipal assumptions used in calculating the benefit obligation are medical cost inflation and the discount rate applied to the expected benefit payments. Management assumed medical cost inflation at 6.0% per annum (2015 – 6.0%), grading down to 5% by 2018, and used a discount rate of 3.6% (2015 – 3.5%).
At 31 March 2016, the sensitivity of the net deficit on the plans to changes in the principal assumptions was as follows (assuming in each case that the other assumptions are unchanged):
Increase/(decrease) in obligation
Change in assumptions +/-
Increase in assumption
Decrease inassumption
Pension plansInflation rate 50 bp 66 (45)Life expectancy 1 year 71 (71)Discount rate 100 bp (224) 278Medical benefitsMedical cost inflation 50 bp 2 (2)Discount rate 100 bp (6) 7
137 Tate & Lyle PLC Annual Report 2016
Financial Statements | Notes to the Consolidated Financial Statements
Strategic ReportG
overnanceFinancial Statem
entsU
seful Information

30. Retirement benefit obligations continued(iii) Analysis of movements in the plan assets
UK£m
US£m
Total£m
At 1 April 2014 974 331 1 305Year ended 31 March 2015Interest on plan assets 40 14 54Actual return higher than interest on plan assets 129 32 161Employer’s contributions 29 19 48Employees’ contributions – – –Benefits paid (51) (25) (76)Currency translation differences 1 41 42Increase in fair value of plan assets 148 81 229At 31 March 2015 1 122 412 1 534Year ended 31 March 2016Interest on plan assets 37 15 52Actual return lower than interest on plan assets (35) (17) (52)Employer’s contributions (including £2 million related to buy-out transaction) 25 13 38Benefits paid (50) (28) (78)Settlements (81) – (81)Currency translation differences – 13 13Decrease in fair value of plan assets (104) (4) (108)At 31 March 2016 1 018 408 1 426
Analysis of plan assets
At 31 March 2016
UK£m
US£m
Total£m
Equities – quoted 285 101 386Corporate bonds – quoted 124 234 358Government bonds – quoted 312 49 361Property – unquoted – 20 20Insurance policies – unquoted 266 4 270Other assets – unquoted 31 – 31
1 018 408 1 426At 31 March 2015
UK£m
US£m
Total£m
Equities – quoted 291 101 392Corporate bonds – quoted 125 230 355Government bonds – quoted 250 57 307Property – unquoted 26 21 47Insurance policies – unquoted 364 3 367Other assets – unquoted 66 – 66
1 122 412 1 534
The Group also paid an additional £4 million (2015 – £4 million) to the US unfunded retirement medical plans to meet the cost of providing the benefits in the financial year.
Plan assets do not include any direct investments in securities issued by the Group or any property occupied by or other assets used by the Group. Assets are classified as quoted only if they have a quoted market price in an active market as defined by IFRS 13 ‘Fair Value Measurement’.
All other assets are classified as unquoted.
Notes to the Consolidated Financial Statements continued
138 Tate & Lyle PLC Annual Report 2016
Financial Statements
30. Retirement benefit obligations continuedc) Mitigation of riskThe defined benefit pension plans expose the Group to actuarial risks such as interest rate, longevity, inflation and investment risk.
The Group encourages the trustees of the plans to adopt an investment policy that seeks to mitigate these risks, which involves investing a significant proportion of the plan assets in liability-driven investment portfolios that mitigate interest rate, inflation and investment risks. The Group seeks to ensure that, as far as is practicable, the investment portfolios of the funded plans are invested in long-term fixed interest securities with maturities and in currencies that match the expected future benefit payments as they fall due. In the UK, interest rate derivatives are used to achieve close matching where matching fixed-interest securities are not available in the market. Most of the inflation risk for the Group arises in the UK since deferred pensions and pensions in payment in the US do not attract inflation increases. Inflation risk is mitigated by holding index-linked government bonds and corporate bonds and, in the UK, inflation derivatives. At 31 March 2016, £270 million (2015 – £367 million) of the benefit obligation was matched by qualifying insurance policies that also mitigate longevity risk. The decrease reflects the payment made to a third party provider in relation to the Amylum UK Pension Scheme to buy out the Group’s obligations (see Note 8). The plans also maintain a portfolio of return-seeking investments, principally in the form of equities and property.
d) Funding of the plansAs required by local regulations, actuarial valuations of the US pension plans are carried out each year and those of the UK pension plans are carried out at least every three years. Following the actuarial valuation at 31 March 2013 of the Tate & Lyle Group Pension Scheme (Scheme), core funding contributions remain at £12 million per year. In 2014, a new secured funding account was established where supplementary contributions of £6 million per year will be made up until March 2019, payable to the Trustee on certain triggering events such as under performance of the Scheme’s investments or a deterioration in the strength of the Group’s financial covenant.
The first two annual payments amounting to £12 million were credited to the secured funding account upon its establishment in October 2014 and were accounted for as additional contributions to the Scheme that year. An actuarial valuation of the Amylum UK Pension Scheme was last carried out at 30 June 2011. The buy-out of the Amylum UK pension scheme was concluded in the year with a final settlement charge of £2 million included in discontinued operations. Total payments to UK Schemes of £25 million also comprised investment and administration fees of £4 million and contributions to a small legacy pension scheme totalling £1 million.
During the year ending 31 March 2017, the Group expects to contribute approximately £37 million to its defined benefit pension plans and to pay approximately £4 million in relation to retirement medical benefits.
31. Share-based paymentsThe Company operates share-based incentive arrangements for the executive directors, senior executives and other eligible employees under which awards and options are granted over the Company’s ordinary shares. All of the arrangements under which awards and options were outstanding during the 2016 and 2015 financial years are classified as equity-settled. During the year, the compensation expense recognised in profit or loss in respect of share-based incentives was £9 million (2015 – £nil). The following arrangements existed during the period:
a) Performance Share PlanThe Group’s principal ongoing share-based incentive arrangement is the Performance Share Plan (PSP). Participation in the PSP is restricted to the executive directors and other senior executives. Awards made under the PSP normally vest provided the participant remains in the Group’s employment during the performance period and the Group achieves earnings per share (EPS) and return on capital employed (ROCE) targets. Up to 50% of each award vests dependent on the compound annual growth rate of the Group’s adjusted diluted EPS from continuing operations reaching specified levels over the performance period. Up to 50% of each award vests dependent on the Group’s adjusted ROCE from continuing operations reaching specified levels at the end of the performance period. The performance period is the period of three financial years beginning with the financial year in which the award is granted.
b) Group Bonus Plan – Deferred ElementBonuses earned under the Group Bonus Plan are normally paid in cash up to 100% of the base salary of the participating executive. Any excess above 100% of base salary is paid in the form of deferred shares that are released after two years subject to the executive remaining in the Group’s employment. During the vesting period, payments in lieu of dividends are made in relation to the deferred shares.
c) Sharesave PlanOptions are granted from time to time under the Company’s Sharesave Plan, which is open to all employees in the UK. It offers eligible employees the option to buy shares in the Company after a period of three or five years funded from the proceeds of a savings contract to which they contribute on a monthly basis.
d) Restricted Share AwardsThe Company has made restricted share awards to a number of eligible employees. Awards made normally vest provided the participant remains in the Group’s employment during the performance period and other conditions, specific to the individual awards, are met.
e) Conditional Share AwardThe Company, during the year, has made a Conditional Share Award (CSA) to eligible employees. Up to 50% of each award vests dependent on an adjusted Group profit after tax on continuing operations for the year ended 31 March 2016. Up to 50% of each award vests dependent on the Group’s adjusted ROCE from continuing operations as at 31 March 2016. The award vests as soon as practicable after 31 March 2016, however, some employees are subject to an additional retention period ending 31 March 2017.
Further information for these awards made in relation to executive directors are set out in the Directors’ Remuneration Report on pages 62 to 79.
139 Tate & Lyle PLC Annual Report 2016
Financial Statements | Notes to the Consolidated Financial Statements
Strategic ReportG
overnanceFinancial Statem
entsU
seful Information
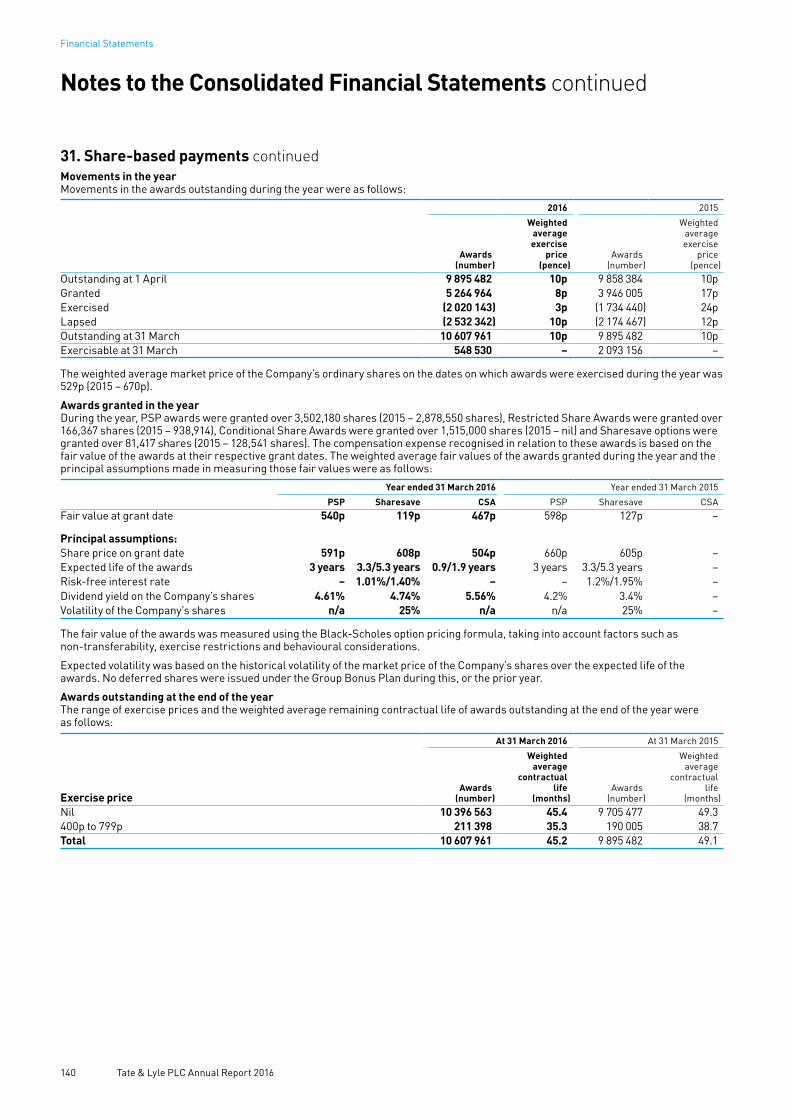
31. Share-based payments continuedMovements in the yearMovements in the awards outstanding during the year were as follows:
2016 2015
Awards (number)
Weighted average exercise
price (pence)
Awards (number)
Weighted average exercise
price (pence)
Outstanding at 1 April 9 895 482 10p 9 858 384 10pGranted 5 264 964 8p 3 946 005 17pExercised (2 020 143) 3p (1 734 440) 24pLapsed (2 532 342) 10p (2 174 467) 12pOutstanding at 31 March 10 607 961 10p 9 895 482 10pExercisable at 31 March 548 530 – 2 093 156 –
The weighted average market price of the Company’s ordinary shares on the dates on which awards were exercised during the year was 529p (2015 – 670p).
Awards granted in the yearDuring the year, PSP awards were granted over 3,502,180 shares (2015 – 2,878,550 shares), Restricted Share Awards were granted over 166,367 shares (2015 – 938,914), Conditional Share Awards were granted over 1,515,000 shares (2015 – nil) and Sharesave options were granted over 81,417 shares (2015 – 128,541 shares). The compensation expense recognised in relation to these awards is based on the fair value of the awards at their respective grant dates. The weighted average fair values of the awards granted during the year and the principal assumptions made in measuring those fair values were as follows:
Year ended 31 March 2016 Year ended 31 March 2015
PSP Sharesave CSA PSP Sharesave CSAFair value at grant date 540p 119p 467p 598p 127p –
Principal assumptions:Share price on grant date 591p 608p 504p 660p 605p –Expected life of the awards 3 years 3.3/5.3 years 0.9/1.9 years 3 years 3.3/5.3 years –Risk-free interest rate – 1.01%/1.40% – – 1.2%/1.95% –Dividend yield on the Company’s shares 4.61% 4.74% 5.56% 4.2% 3.4% –Volatility of the Company’s shares n/a 25% n/a n/a 25% –
The fair value of the awards was measured using the Black-Scholes option pricing formula, taking into account factors such as non-transferability, exercise restrictions and behavioural considerations.
Expected volatility was based on the historical volatility of the market price of the Company’s shares over the expected life of the awards. No deferred shares were issued under the Group Bonus Plan during this, or the prior year.
Awards outstanding at the end of the yearThe range of exercise prices and the weighted average remaining contractual life of awards outstanding at the end of the year were as follows:
Exercise price
At 31 March 2016 At 31 March 2015
Awards (number)
Weighted average
contractual life
(months)Awards
(number)
Weighted average
contractual life
(months)Nil 10 396 563 45.4 9 705 477 49.3400p to 799p 211 398 35.3 190 005 38.7Total 10 607 961 45.2 9 895 482 49.1
Notes to the Consolidated Financial Statements continued
140 Tate & Lyle PLC Annual Report 2016
Financial Statements

32. Provisions and contingent liabilitiesProvisions
Insurance provisions
and reserves£m
Restructuring and closure
provisions£m
Other provisions
£mTotal
£mAt 1 April 2015 7 1 13 21Provided in the year 3 13 6 22Released in the year – – (1) (1)Utilised in the year – – (9) (9)Exchange and other movements 2 – 1 3At 31 March 2016 12 14 10 36
At 31 March
2016
£m2015
£mProvisions are expected to be utilised as follows: – within one year 23 13– after more than one year 13 8Total 36 21
Provisions primarily relate to Group legal matters and previously disposed businesses, restructuring and closure provisions relating to restructuring within the Group and insurance funds representing amounts provided by the Group’s captive insurance subsidiary in respect of the expected level of insurance claims. All provisions are expected to be utilised within five years.
Contingent liabilitiesPassaic RiverAs noted in the Statement of Half Year Results released on 5 November 2015, the Group is subject to a legal case arising from the notification in 2007 by the U.S. Environmental Protection Agency (‘USEPA’) that Tate & Lyle, along with approximately 70+ others, is a potentially responsible party (‘PRP’) for a 17-mile section of the northern New Jersey Passaic River, a major ‘Superfund’ Site. The Group’s involvement derives from a former Staley Chemical Company plant in Kearny, New Jersey (owned by A E Staley until 1978, around ten years prior to the acquisition of Staley by Tate & Lyle), which is alleged to have generated hazardous waste which made its way to the Passaic River. At 5 November 2015, since the USEPA had not issued its final record of decision, the Group could not estimate a reasonably possible range of loss in relation to this case. In March 2016, the USEPA issued its Record of Decision (‘ROD’) on the likely cost for the remediation that it believes will be required. The ROD addresses the clean-up for the lower 8.3 miles of the river section in question and sets a total assessment of expected costs at $1.38 billion. Based on the current status of the group of PRPs, Tate & Lyle’s potential share of this cost, should it ultimately be held responsible, is around 0.6%. Whilst Tate & Lyle will continue to vigorously defend itself in this matter, in light of the publication of the ROD, the Group has taken an exceptional charge of £6 million in its financial statements for the year ended 31 March 2016 in respect of this matter included in other provisions. Since it cannot estimate a reasonably possible range of loss in respect of the remaining nine-mile section of the river, the Group has not recognised a provision in this regard.
Other claimsThe Group is subject to claims and litigation generally arising in the ordinary course of its business, some of which are for substantial amounts. All such actions are strenuously defended but provision is made for liabilities that are considered likely to arise on the basis of current information and legal advice. While there is always uncertainty as to the outcome of any claim or litigation, it is not expected that claims and litigation existing at 31 March 2016 will have a material adverse effect on the Group’s financial position.
Sale of EU Sugars and American Sugar Association ClaimThe contingent liabilities previously reported relating to both the sale of EU Sugars and the American Sugar Association claim were settled in the year at £18 million and £9 million respectively. For more information, see Note 7.
141 Tate & Lyle PLC Annual Report 2016
Financial Statements | Notes to the Consolidated Financial Statements
Strategic ReportG
overnanceFinancial Statem
entsU
seful Information

33. CommitmentsCapital commitments
At 31 March
2016
£m2015
£mCommitments for the purchase of intangible assets 1 4Commitments for the purchase of property, plant and equipment 47 71Total 48 75
Operating lease arrangementsOperating lease payments represent rentals payable by the Group for certain of its land, buildings, plant and equipment. Certain operating lease agreements allow for renewal at the end of the original term at the option of the Group.
At the period-end date, the Group has outstanding commitments under non-cancellable operating leases which fall due as follows:
At 31 March
2016
£m2015
£mWithin one year 28 20Between one year and five years 106 70After five years 169 104Total 303 194
34. Acquisitions and disposalsEaststarch re-alignmentOn 31 October 2015, the Group completed the re-alignment of its Eaststarch joint venture with Archer Daniels Midland Inc. (ADM). Under the re-alignment, the Group disposed of the predominantly bulk ingredients plants in Bulgaria, Turkey and Hungary and the acquisition of the remaining 50% interest in the more speciality food ingredients focused plant in Slovakia not already owned by the Group. The Group received net cash consideration of £173 million (€240 million) at closing.
Although the cash consideration was received as a single net amount, IFRS requires this consideration to be grossed-up to determine the cash effectively paid to acquire the 50% interest in the Slovakia business and the cash received for the disposal of the plants in Bulgaria, Turkey and Hungary. In addition, as the acquisition of the Slovakian business is a step acquisition, the Group’s existing interest in this plant is required to be re-measured to its fair value, which is then included as a component of the consideration paid for the acquisition. This gross-up of the net cash consideration was done at fair value. The result was that consideration of £112 million (€156 million) was paid for the acquired business, comprising £56 million (€78 million) of cash consideration and £56 million (€78 million) for the fair value of the Group’s existing interest in Slovakia. Each of the components of the Eaststarch re-alignment, comprising the acquisition accounting for the Slovakia business, the gain on re-measurement of the Group’s existing interest in that plant and the disposal of the plants in Bulgaria, Turkey and Hungary are outlined below.
Acquisition of Amylum Slovakia s.r.o. As noted above, as part of the re-alignment of the Eaststarch joint venture, the Group acquired the remaining 50% of the more speciality focused plant in Slovakia, Amylum Slovakia s.r.o., and subsequently renamed it Tate & Lyle Boleraz s.r.o. As explained above, total consideration in respect of the Slovakian acquisition was £115 million. The fair value of identifiable net assets acquired was £80 million, resulting in provisional goodwill of £35 million (which will not be deductible for tax purposes). The goodwill of £35 million remains provisional subject to finalisation of the working capital adjustment.
The plant in Slovakia provides a solid base from which to grow the Group’s Speciality Food Ingredients business in Europe and an opportunity to increase production at the plant over time. Provisional goodwill of £35 million primarily represents the premium paid to acquire an established business with a proven workforce and growth potential in the Speciality Food Ingredients market.
At the same time, two long-term distribution agreements have also been put in place under which the Group will distribute crystalline fructose, a speciality sweetener, produced by ADM in Turkey and ADM will act as exclusive distributor for bulk ingredients, produced in the Group’s Slovakia and Netherlands facilities.
The acquired business in Slovakia contributed sales of £52 million and an operating profit of £2 million for the period from acquisition on 31 October 2015 (including the amortisation of acquired intangibles recognised from the acquisition). Had the business been acquired at the beginning of the financial year, it would have contributed sales of £130 million and an operating profit of £5 million. Acquisition related costs were recognised as part of the overall Eaststarch re-alignment transaction costs (within exceptional items) and in cash flows from operating activities in the consolidated statement of cash flows.
Notes to the Consolidated Financial Statements continued
142 Tate & Lyle PLC Annual Report 2016
Financial Statements

34. Acquisitions and disposals continuedThe following tables provide a summary of the acquisition accounting:
2016£m
Cash consideration 56 Non cash consideration (fair value of existing interest in Slovakian joint venture) 56Purchase price adjustments 3 Total consideration 115 Less: fair value of net assets acquired (80)Provisional goodwill 35
Cash flows: Total cash consideration (including purchase price adjustments) (59)Less: net cash and working capital adjustments 5Acquisition of business, net of cash acquired (54)
The fair value of net assets acquired is comprised as follows:
Book value on acquisition
£m
Fair value adjustments
£m2016
£mIntangible assets (customer relationships £20m, distribution agreement £9m) – 29 29 Property, plant and equipment 48 (1) 47 Inventories 9 – 9 Trade and other receivables 9 – 9 Cash and cash equivalents 6 – 6 Trade and other payables (10) – (10)Tax liabilities (deferred tax liability £6m) (4) (6) (10)Net assets on acquisition 58 22 80
DisposalsAs a result of the Eaststarch re-alignment, the Group exited the predominantly bulk ingredient plants in Bulgaria, Turkey and Hungary resulting in an exceptional gain on disposal of £68 million within discontinued operations. The profit on disposal includes an amount of £17 million representing the share of profit after tax attributable to the Group whilst the investments were classified as held for sale.
Note
50% Interest in
Slovakia£m
Other Eaststarch
plants£m
2016Total
£mConsideration 56 229 285 Purchase price adjustments 2 11 13 Total consideration 58 240 298 Total assets disposed (52) (133) (185) Foreign exchange recycled from other comprehensive income
to profit or loss – (34) (34)Disposal cost (1) (5) (6) Gain on re-measurement/disposal – reported within exceptional items 7 5 68 73
Cash flows:Disposal of joint ventures 240 Transaction costs (within exceptional cash outflow) (4)Net cash inflow on disposal 236
143 Tate & Lyle PLC Annual Report 2016
Financial Statements | Notes to the Consolidated Financial Statements
Strategic ReportG
overnanceFinancial Statem
entsU
seful Information
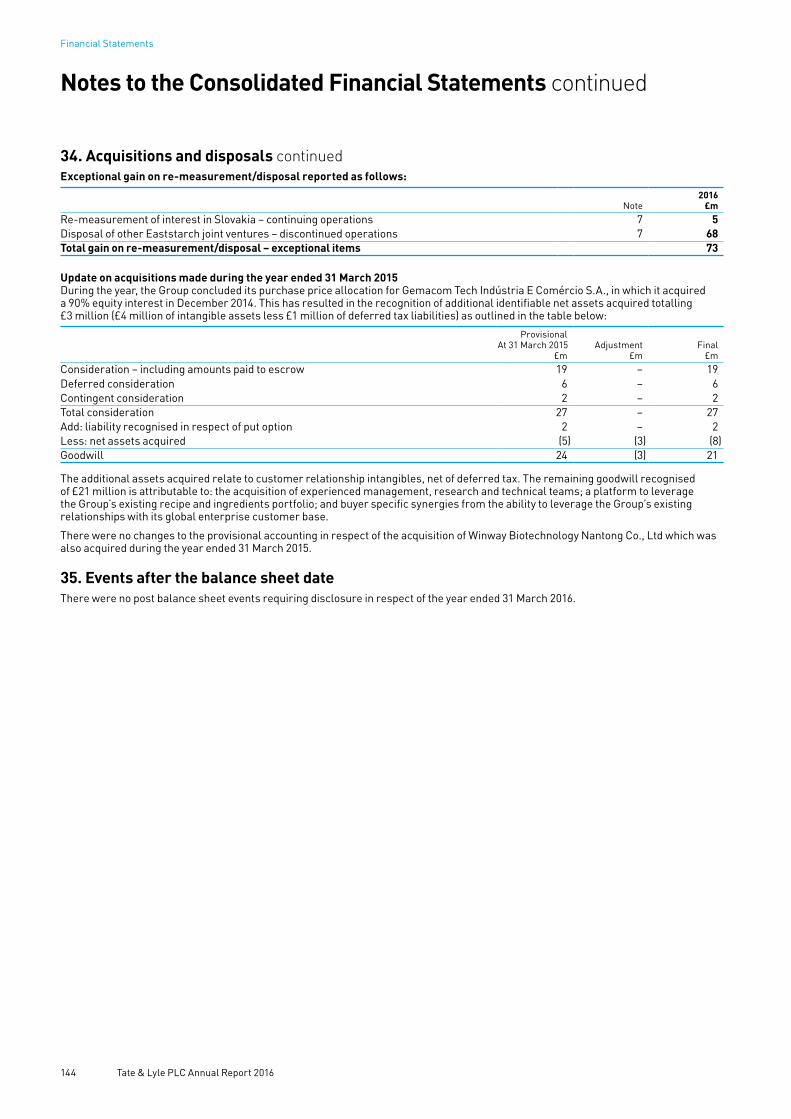
34. Acquisitions and disposals continuedExceptional gain on re-measurement/disposal reported as follows:
Note2016
£mRe-measurement of interest in Slovakia – continuing operations 7 5 Disposal of other Eaststarch joint ventures – discontinued operations 7 68Total gain on re-measurement/disposal – exceptional items 73
Update on acquisitions made during the year ended 31 March 2015During the year, the Group concluded its purchase price allocation for Gemacom Tech Indústria E Comércio S.A., in which it acquired a 90% equity interest in December 2014. This has resulted in the recognition of additional identifiable net assets acquired totalling £3 million (£4 million of intangible assets less £1 million of deferred tax liabilities) as outlined in the table below:
ProvisionalAt 31 March 2015
£mAdjustment
£mFinal
£mConsideration – including amounts paid to escrow 19 – 19 Deferred consideration 6 – 6 Contingent consideration 2 – 2 Total consideration 27 – 27 Add: liability recognised in respect of put option 2 – 2 Less: net assets acquired (5) (3) (8)Goodwill 24 (3) 21
The additional assets acquired relate to customer relationship intangibles, net of deferred tax. The remaining goodwill recognised of £21 million is attributable to: the acquisition of experienced management, research and technical teams; a platform to leverage the Group’s existing recipe and ingredients portfolio; and buyer specific synergies from the ability to leverage the Group’s existing relationships with its global enterprise customer base.
There were no changes to the provisional accounting in respect of the acquisition of Winway Biotechnology Nantong Co., Ltd which was also acquired during the year ended 31 March 2015.
35. Events after the balance sheet dateThere were no post balance sheet events requiring disclosure in respect of the year ended 31 March 2016.
Notes to the Consolidated Financial Statements continued
144 Tate & Lyle PLC Annual Report 2016
Financial Statements

36. Related party disclosureIdentity of related partiesThe Group has related party relationships with its joint ventures and associates, the Group’s pension schemes and with keymanagement being its directors and executive officers. No related party transactions with close family members of the Group’s key management occurred in the current or comparative year.
Subsidiaries, joint ventures and associatesTransactions entered into by the Company with subsidiaries and between subsidiaries as well as the resultant balances of receivables and payables are eliminated on consolidation and are not required to be disclosed. Transactions and balances with and between joint ventures are as shown below. There are no such transactions with associates.
Year ended 31 March
2016
£m2015
£mSales of goods and services– to joint ventures 137 142Purchases of goods and services– from joint ventures 132 265
At 31 March
2016£m
2015£m
Receivables– due from joint ventures 12 24Payables– due to joint ventures – 16Financing– deposits from joint ventures – 40
The Group had no material related party transactions containing unusual commercial termsIn 2015, the Group provided guarantees in respect of banking facilities of the Eaststarch joint venture totalling £8 million. There were no such arrangements in the current year as the joint venture had been disposed of.
Key management compensationKey management compensation is disclosed in Note 10.
37. Currency exchange ratesThe principal exchange rates used to translate the results, assets and liabilities and cash flows of the Group’s foreign operations into pounds sterling were as follows:
Year ended 31 March
Average rate2016
£1=2015
£1=US dollar 1.51 1.61Euro 1.37 1.28
At 31 March
Year-end rate2016
£1=2015
£1=US dollar 1.44 1.49Euro 1.26 1.38
145 Tate & Lyle PLC Annual Report 2016
Financial Statements | Notes to the Consolidated Financial Statements
Strategic ReportG
overnanceFinancial Statem
entsU
seful Information

38. Full listing of subsidiaries, joint ventures and associatesSubsidiaries based in the United Kingdom1
Type of business
Percentage of ordinary sharesattributable to
Tate & Lyle PLC
Percentage ofpreference shares
attributable toTate & Lyle PLC
Astaxanthin Manufacturing Limited Dormant 100 –Cesalpinia (UK) Limited Dormant 100 –G.C. Hahn and Company Limited Blending 100 –Hahntech International Limited Dormant 100 –Harvey Steel Sugars Limited2 Dormant 100 –Histonpark Limited Dormant 100 –Robinson Milling Systems (Tewkesbury) Limited Dormant 100 100T.L.S.S. Pension Nominees Limited Dormant 100 –Tate & Lyle Export Holdings Limited2 Holding company 100 –Tate & Lyle Group Services Limited Holding company 100 –Tate & Lyle Holdings Americas Limited Holding company 100 –Tate & Lyle Holdings Limited2 Dormant 100 –Tate & Lyle Industrial Holdings Limited2 Dormant 100 –Tate & Lyle Industries Limited Holding company 100 –Tate & Lyle International Finance PLC2 In-house treasury company 100 –Tate & Lyle Investments (Gulf States) Limited Dormant 100 –Tate & Lyle Investments Brazil Limited Holding company 100 –Tate & Lyle Investments Limited2 Holding company 100 100Tate & Lyle Overseas Limited Dormant 100 –Tate & Lyle Pension Trust Limited2 Pension company 100 –Tate & Lyle Share Shop Limited2 Dormant 100 –Tate & Lyle Technology Limited2 Holding company 100 –Tate & Lyle Trading & Developments Limited2 Dormant 100 –Tate & Lyle UK Limited2 Holding company 100 –Tate & Lyle Ventures II LP Holding company 100 –Tate & Lyle Ventures Limited2 Holding company 100 –Tate & Lyle Ventures LP Holding company 100 –Tate & Lyle LLC Holding company 100 –
1 Registered in England and Wales, except Tate & Lyle LLC which is registered in Delaware, USA.2 Direct subsidiaries of Tate & Lyle PLC.
Notes to the Consolidated Financial Statements continued
146 Tate & Lyle PLC Annual Report 2016
Financial Statements

38. Full listing of subsidiaries, joint ventures and associates continuedSubsidiaries operating overseas
Country of incorporation or registration Company Type of business
Percentage ofordinary shares
attributable toTate & Lyle PLC
Percentage ofpreference shares
attributable toTate & Lyle PLC
Argentina Tate & Lyle Argentina SA SFI distribution and sales support 100 –Australia Tate & Lyle ANZ Pty Limited Food systems production and SFI
distribution 100 –Belgium Tate & Lyle Services (Belgium) N.V.2 Internal service provider 100 –Bermuda Tate & Lyle Management & Finance
LimitedReinsurance
100 –Brazil Tate & Lyle Brasil S.A.1 Citric acid production and SFI
distribution 100 –G.C. Hahn & Co. do Estabilizantes e Tecnologia para Alimentos Ltda.
Dormant100 –
Tate & Lyle Holdings Brasil LTDA Holding company 100 –Tate & Lyle Gemacom Tech Indústria e Comércio S.A.
Food systems production and support 90 –
Canada Tate & Lyle Ingredients Canada Limited SFI sales support 100 –Chile Tate & Lyle Chile Commercial Ltda SFI distribution and sales support 100 –China Tate & Lyle Trading (Shanghai) Co. Ltd1 SFI distribution and sales support 100 –
G.C. Hahn & Co. Food Stabilizer Business (Shanghai) Ltd1
Food systems sales100 –
Tate & Lyle Howbetter Co. Ltd1 Food systems production 51 –Tate & Lyle Food Ingredients (Nantong) Company Limited
Polydextrose production100 –
Columbia Tate & Lyle Colombia S.A.S. SFI distribution and sales support 100 –Croatia G.C. Hahn & Co. d.o.o. Za distribuciju
stabilizacionihsistemaFood systems sales
100 –Czech Republic G.C. Hahn & Co. Stabilizacni technika,
s.r.o.Food systems sales
100 –Egypt Tate & Lyle Egypt LLC Dormant 100 –France G.C. Hahn & Cie. S.A.R.L. Food systems sales 100 – Tate & Lyle Ingredients France S.A.S. Research and development centre 100 –Germany G.C. Hahn & Co. Stabilisierungstechnik
GmbHFood systems production
100 –G.C. Hahn & Co. Cooperationsgeschaft mbH
Holding company 100 –
HAHN International GmbH Dormant 100 –HL Handelskontor GmbH Dormant 100 –Tate & Lyle Germany GmbH SFI sales support 100 –
Gibraltar Tate & Lyle Insurance (Gibraltar) Limited
Reinsurance100 –
Greece Tate & Lyle Greece S.A. SFI sales support 95 –India Tate & Lyle Investments (India) Private
LtdDormant
100 –Israel
Tate & Lyle Israel Limited Dormant 100 –Gamtal Foods Ltd Dormant 65 –
Italy Tate & Lyle Italia S.P.A. Food systems production and SFI sales support 100 –
Japan Tate & Lyle Japan KK SFI distribution 100 –Lithuania UAB G.C. Hahn & Co. Food systems sales 100 –Mexico
Tate & Lyle Mexico, S. de R.L.de C.V. SFI distribution and sales support 100 –Mexama, S.A. de C.V. Dormant 65 –Talo Services Internal service provider 100 –
Morocco Tate & Lyle Morocco SA BI and SFI production 100 –Netherlands Nederlandse Glucose Industrie B.V. Holding company 100 – Tate & Lyle Netherlands B.V. BI and SFI production 100 –Poland G.C. Hahn & Co. Technika
stabilizowania Sp.z.o.o.Dormant
100 – Tate & Lyle Global Shared Services
Sp.z.o.o.Internal service provider
100 – Tate & Lyle Poland Sp.z.o.o. SFI sales support 100 –
147 Tate & Lyle PLC Annual Report 2016
Financial Statements | Notes to the Consolidated Financial Statements
Strategic ReportG
overnanceFinancial Statem
entsU
seful Information

38. Full listing of subsidiaries, joint ventures and associates continuedSubsidiaries operating overseas continued
Country of incorporation or registration Company Type of business
Percentage ofordinary shares
attributable toTate & Lyle PLC
Percentage ofpreference shares
attributable toTate & Lyle PLC
Russian Federation
OOO Hahntech Service1 Food systems sales 100 –
Singapore Tate & Lyle Asia Pacific Pte. Ltd. SFI sales and ASPAC regional head office 100 –
Tate & Lyle Singapore Pte Ltd Sucralose production (now decommissioned) 100 –
Tate & Lyle Singapore Holdings Pte Ltd Holding company 100 – Tate & Lyle Singapore WWT Pte. Ltd. Internal service provider 100 –Slovakia Tate & Lyle Boleraz s.r.o. BI and SFI production 100 –
Tate & Lyle Slovakia, s.r.o. Internal service provider 100 –South Africa Tate and Lyle South Africa Proprietary
LimitedFood systems production and SFI distribution 100 –
Spain G.C. Hahn Estabilizantes y Tecnologia para Alimentos
Food systems sales100 –
Ebromyl S.L. Dormant 100 – Talan Iberica SA Dormant 100 –Sweden Tate & Lyle Sweden AB Oat protein and Beta Glucan
production
100 –Turkey Tate and Lyle Turkey Gıda Hizmetleri
Anonim �SirketiSFI Sales support
100 –Ukraine PII G.C. Hahn & Co. Kiev1 Food systems sales 100 –United Arab Emirates
Tate & Lyle DMCC Food systems and SFI sales support 100 –
USA Staley Holdings LLC Holding company 100 – Tate & Lyle Custom Ingredients LLC Food systems production 100 – Tate & Lyle Finance LLC In-house finance 100 – TLHUS, Inc. Holding company 100 – Tate & Lyle Ingredients Americas LLC BI and SFI production 100 – Tate & Lyle Sucralose LLC Sucralose production 100 – TLI Holding LLC In-house finance 100 – Tate & Lyle Domestic International
Sales CorporationInternal service provider
100 – Tate & Lyle Grain, Inc. Grain products 100 – Tate & Lyle Malic Acid LLC Dormant 100 – Tate & Lyle Sugar Holdings, Inc. Holding company 100 – Tate & Lyle Americas LLC Internal service provider 100 – Tate & Lyle Citric Acid LLC Citric acid production 100 – Staley International Inc. Cereal sweeteners and starches 100 – G. C. Hahn USA LLC Dormant 100 –
1 Non-coterminous year-end.2 Direct subsidiaries of Tate & Lyle PLC.
Joint ventures
Country of incorporation or registration Company Type of business
Percentage ofordinary shares
attributable toTate & Lyle PLC
Percentage ofpreference shares
attributable toTate & Lyle PLC
Mexico Almidones Mexicanos SA1 BI and SFI production 50 –Promotora de Productos y Mercados Mexicanos, S.A. de C.V.
BI and SFI production50 –
Netherlands Eastern Sugar B.V. Holding company 50 –Slovakia Eastern Sugar s.r.o. Dormant 50 –USA DuPont Tate & Lyle Bio Products
Company, LLCIndustrial ingredients
50 –
1 Non-coterminous year-end.
Notes to the Consolidated Financial Statements continued
148 Tate & Lyle PLC Annual Report 2016
Financial Statements
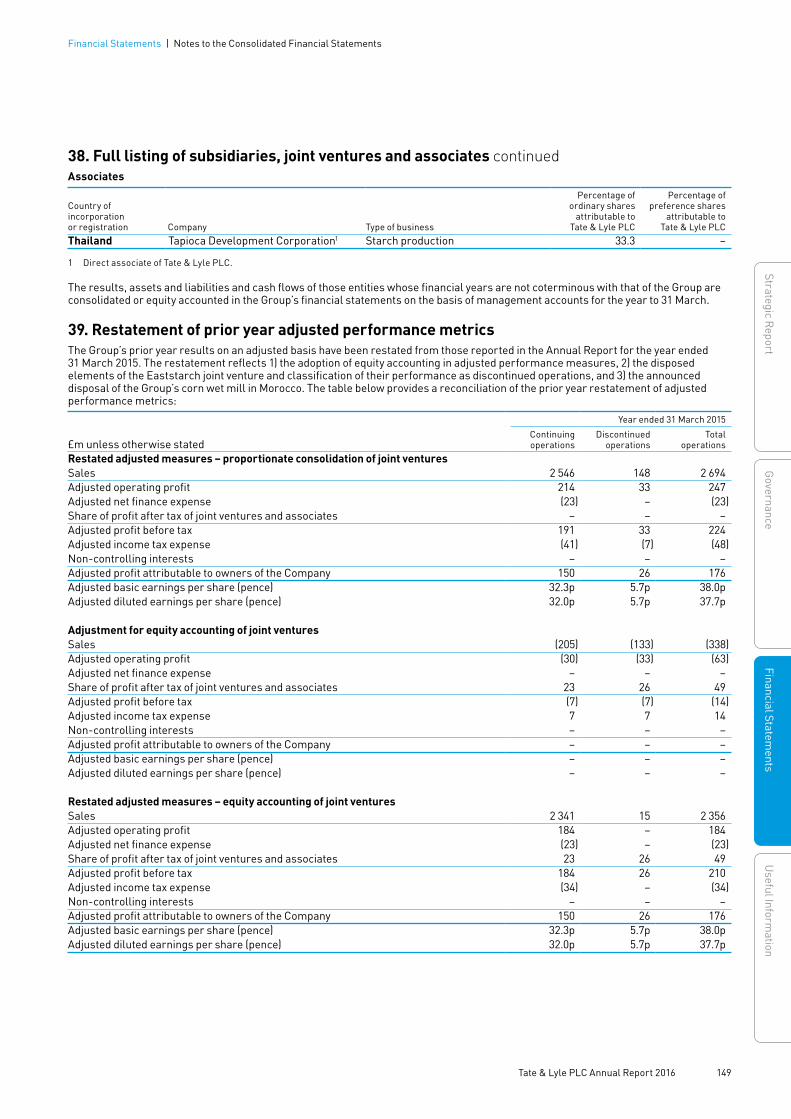
38. Full listing of subsidiaries, joint ventures and associates continuedAssociates
Country of incorporation or registration Company Type of business
Percentage ofordinary shares
attributable toTate & Lyle PLC
Percentage ofpreference shares
attributable toTate & Lyle PLC
Thailand Tapioca Development Corporation1 Starch production 33.3 –
1 Direct associate of Tate & Lyle PLC.
The results, assets and liabilities and cash flows of those entities whose financial years are not coterminous with that of the Group are consolidated or equity accounted in the Group’s financial statements on the basis of management accounts for the year to 31 March.
39. Restatement of prior year adjusted performance metricsThe Group’s prior year results on an adjusted basis have been restated from those reported in the Annual Report for the year ended 31 March 2015. The restatement reflects 1) the adoption of equity accounting in adjusted performance measures, 2) the disposed elements of the Eaststarch joint venture and classification of their performance as discontinued operations, and 3) the announced disposal of the Group’s corn wet mill in Morocco. The table below provides a reconciliation of the prior year restatement of adjusted performance metrics:
£m unless otherwise stated
Year ended 31 March 2015
Continuingoperations
Discontinued operations
Total operations
Restated adjusted measures – proportionate consolidation of joint venturesSales 2 546 148 2 694Adjusted operating profit 214 33 247 Adjusted net finance expense (23) – (23)Share of profit after tax of joint ventures and associates – – – Adjusted profit before tax 191 33 224 Adjusted income tax expense (41) (7) (48)Non-controlling interests – – – Adjusted profit attributable to owners of the Company 150 26 176 Adjusted basic earnings per share (pence) 32.3p 5.7p 38.0p Adjusted diluted earnings per share (pence) 32.0p 5.7p 37.7p
Adjustment for equity accounting of joint venturesSales (205) (133) (338)Adjusted operating profit (30) (33) (63)Adjusted net finance expense – – – Share of profit after tax of joint ventures and associates 23 26 49 Adjusted profit before tax (7) (7) (14)Adjusted income tax expense 7 7 14 Non-controlling interests – – – Adjusted profit attributable to owners of the Company – – – Adjusted basic earnings per share (pence) – – – Adjusted diluted earnings per share (pence) – – –
Restated adjusted measures – equity accounting of joint venturesSales 2 341 15 2 356Adjusted operating profit 184 – 184 Adjusted net finance expense (23) – (23)Share of profit after tax of joint ventures and associates 23 26 49 Adjusted profit before tax 184 26 210 Adjusted income tax expense (34) – (34)Non-controlling interests – – – Adjusted profit attributable to owners of the Company 150 26 176 Adjusted basic earnings per share (pence) 32.3p 5.7p 38.0p Adjusted diluted earnings per share (pence) 32.0p 5.7p 37.7p
149 Tate & Lyle PLC Annual Report 2016
Financial Statements | Notes to the Consolidated Financial Statements
Strategic ReportG
overnanceFinancial Statem
entsU
seful Information
Report on the Parent Company financial statementsOur opinionIn our opinion, Tate & Lyle PLC’s Parent Company financial statements (the ‘financial statements’):• give a true and fair view of the state
of the Parent Company’s affairs as at 31 March 2016;
• have been properly prepared in accordance with United Kingdom Generally Accepted Accounting Practice; and
• have been prepared in accordance with the requirements of the Companies Act 2006.
What we have auditedThe financial statements, included within the Annual Report, comprise:
• the Parent Company Balance Sheet as at 31 March 2016;
• the Parent Company Statement of Changes in Equity for the year then ended; and
• the notes to the financial statements, which include a summary of significant accounting policies and other explanatory information.
Certain required disclosures have been presented elsewhere in the Annual Report, rather than in the notes to the financial statements. These are cross-referenced from the financial statements and are identified as audited. The financial reporting framework that has been applied in the preparation of the financial statements is United Kingdom Accounting Standards, comprising FRS 101 ‘Reduced Disclosure Framework’, and applicable law (United Kingdom Generally Accepted Accounting Practice).Other required reportingConsistency of other information and compliance with applicable requirementsCompanies Act 2006 opinionIn our opinion, based on the work undertaken in the course of the audit:• the information given in the Strategic
Report and the Directors’ Report for the financial year for which the financial statements are prepared is consistent with the financial statements; and
• the Strategic Report and the Directors’ Report have been prepared in accordance with applicable legal requirements.
In addition, in light of the knowledge and understanding of the company and its environment obtained in the course of the audit, we are required to report if we have identified any material misstatements in the Strategic Report and the Directors’ Report. We have nothing to report in this respect.ISAs (UK & Ireland) reportingUnder International Standards on Auditing (UK and Ireland) (‘ISAs (UK & Ireland)’) we are required to report to you if, in our opinion, information in the Annual Report is:
• materially inconsistent with the information in the audited financial statements; or
• apparently materially incorrect based on, or materially inconsistent with, our knowledge of the Parent Company acquired in the course of performing our audit; or
• otherwise misleading.We have no exceptions to report arising from this responsibility.Adequacy of accounting records and information and explanations receivedUnder the Companies Act 2006 we are required to report to you if, in our opinion:• we have not received all the information
and explanations we require for our audit; or
• adequate accounting records have not been kept by the Parent Company, or returns adequate for our audit have not been received from branches not visited by us; or
• the financial statements and the part of the Directors’ Remuneration Report to be audited are not in agreement with the accounting records and returns.
We have no exceptions to report arising from this responsibility.Directors’ remunerationDirectors’ remuneration report – Companies Act 2006 opinionIn our opinion, the part of the Directors’ Remuneration Report to be audited has been properly prepared in accordance with the Companies Act 2006.Other Companies Act 2006 reportingUnder the Companies Act 2006 we are required to report to you if, in our opinion, certain disclosures of Directors’ remuneration specified by law are not made. We have no exceptions to report arising from this responsibility.Responsibilities for the financial statements and the auditOur responsibilities and those of the DirectorsAs explained more fully in the Directors’ Statement of Responsibilities set out on page 81, the Directors are responsible for the preparation of the financial statements and for being satisfied that they give a true and fair view.Our responsibility is to audit and express an opinion on the financial statements in accordance with applicable law and ISAs (UK & Ireland). Those standards require us to comply with the Auditing Practices Board’s Ethical Standards for Auditors.This report, including the opinions, has been prepared for and only for the Parent Company’s members as a body in accordance with Chapter 3 of Part 16 of the Companies Act 2006 and for no other purpose. We do not, in giving these opinions, accept or assume responsibility for any other purpose or to any other person to whom this report is shown or into whose hands it may come save where expressly agreed by our prior consent in writing.
What an audit of financial statements involvesWe conducted our audit in accordance with ISAs (UK & Ireland). An audit involves obtaining evidence about the amounts and disclosures in the financial statements sufficient to give reasonable assurance that the financial statements are free from material misstatement, whether caused by fraud or error. This includes an assessment of: • whether the accounting policies are
appropriate to the Parent Company’s circumstances and have been consistently applied and adequately disclosed;
• the reasonableness of significant accounting estimates made by the Directors; and
• the overall presentation of the financial statements.
We primarily focus our work in these areas by assessing the Directors’ judgments against available evidence, forming our own judgments, and evaluating the disclosures in the financial statements.We test and examine information, using sampling and other auditing techniques, to the extent we consider necessary to provide a reasonable basis for us to draw conclusions. We obtain audit evidence through testing the effectiveness of controls, substantive procedures or a combination of both. In addition, we read all the financial and non-financial information in the Annual Report to identify material inconsistencies with the audited financial statements and to identify any information that is apparently materially incorrect based on, or materially inconsistent with, the knowledge acquired by us in the course of performing the audit. If we become aware of any apparent material misstatements or inconsistencies we consider the implications for our report. With respect to the Strategic Report and Directors’ Report, we consider whether those reports include the disclosures required by applicable legal requirements.Other matterWe have reported separately on the Group financial statements of Tate & Lyle PLC for the year ended 31 March 2016.John Waters (Senior Statutory Auditor)for and on behalf of PricewaterhouseCoopers LLP Chartered Accountants and Statutory AuditorsLondon 25 May 2016• The maintenance and integrity of the
Tate & Lyle PLC website (www.tateandlyle.com) is the responsibility of the Directors; the work carried out by the auditors does not involve consideration of these matters and, accordingly, the auditors accept no responsibility for any changes that may have occurred to the financial statements since they were initially presented on the website.
• Legislation in the United Kingdom governing the preparation and dissemination of financial statements may differ from legislation in other jurisdictions.
150 Tate & Lyle PLC Annual Report 2016
Financial Statements
Independent Auditors’ Report to the Members of Tate & Lyle PLC

Notes
At 31 March
2016
£m
Restated* 2015
£mASSETSFixed AssetsTangible fixed assets 2 3 4Intangible assets 3 3 14Investments in subsidiary undertakings 4 1 018 1 008Investments in associates 5 2 1Total 1 026 1 027Current assetsDebtors 6 1 617 1 586Cash at bank – 1
1 617 1 587Creditors – amounts falling due within one year 7 (1 531) (1 635)Net current assets/(liabilities) 86 (48)Total assets less current liabilities 1 112 979Creditors – amounts falling due after more than one year 8 (2) (2)Net assets 1 110 977
Capital and reservesCalled up share capital 11 117 117Share premium account 406 406Capital redemption reserve 8 8Retained earnings 579 446Total shareholders’ funds 1 110 977
* Restated as a result of adoption of FRS 101 (see Note 15).
The Parent Company’s financial statements on pages 151 to 158 were approved by the Board of Directors on 25 May 2016 and signed on its behalf by:
Javed Ahmed, Nick Hampton Directors The Notes on pages 153 to 158 form part of these financial statements.
Tate & Lyle PLC Registered number: 76535
151 Tate & Lyle PLC Annual Report 2016
Strategic ReportG
overnanceFinancial Statem
entsU
seful Information
Parent Company Balance Sheet
Financial Statements

Called up share capital
£m
Share premium account
£m
Capital redemption
reserves£m
Retained earnings
£m
Total equity
£mAt 1 April 2014 (Restated*) 117 406 8 449 980Year ended 31 March 2015:Profit for the year – – – 128 128Purchase of own shares – – – (12) (12)Share-based payments – – – 11 11Ordinary dividends paid – – – (130) (130)At 31 March 2015 (Restated*) 117 406 8 446 977Year ended 31 March 2016:Profit for the year – – – 260 260Purchase of own shares – – – (7) (7)Share-based payments – – – 10 10Ordinary dividends paid – – – (130) (130)At 31 March 2016 117 406 8 579 1 110
* Restated as a result of adoption of FRS 101 (see Note 15).
152 Tate & Lyle PLC Annual Report 2016
Financial Statements
Parent Company Statement of Changes in Equity

1. Principal accounting policiesBasis of preparationTate & Lyle PLC (the Company) is a public limited company incorporated and domiciled in the United Kingdom. The Company’s ordinary shares are listed on the London Stock Exchange.
The Company’s financial statements are prepared under the historical cost convention in accordance with Financial Reporting Standard 101 ‘Reduced Disclosure Framework’ (‘FRS 101’) and with UK accounting presentation as at 31 March 2016, with comparative figures as at 31 March 2015. The impact on comparative figures as a result of the current year adoption of FRS 101 is shown in Note 15.
For the reasons set out on page 30, the Company’s financial statements are prepared on a going concern basis.
As permitted by Section 408 of the Companies Act 2006, the Company’s profit and loss account is not presented in these financial statements. Profit and loss account disclosures are presented in Note 13.
The results of the Company are included in the preceding Group financial statements.
The following exemptions from the requirements of IFRS have been applied in the preparation of these financial statements, in accordance with FRS 101:
• the requirements of IAS 7 Statement of Cash Flows
• the requirements of paragraph 17 and 18(a) of IAS 24 Related Party Disclosures
• the requirements in IAS 24 Related Party Disclosures to disclose related party transactions entered into between two or more members of a group, provided that any subsidiary which is a party to the transaction is wholly owned by such a member
• the requirement in paragraph 38 of IAS 1 Presentation of Financial Statements to present comparative information in respect of paragraph 79(a)(iv) of IAS 1
• the requirements of IFRS 7 Financial Instruments: Disclosures
• the requirements of paragraphs 30 and 31 of IAS 8 Accounting Policies, Changes in Accounting Estimates and Errors
• the requirements of IFRS 2 Share Based Payments
• the requirements of paragraphs 91 to 99 of IFRS 13 Fair Value Measurement
• the requirements of paragraphs 10(d) (statement of cash flows), 10(f) (statement of financial position as at the beginning of the proceeding period when an entity applies an accounting policy retrospectively), 38(A to D) (comparative information), 40(A to D) (presentation of third balance sheet), 111 (statement of cash flows) and 134 to 136 (capital management) of IAS 1 Presentation of Financial Statements
• the requirements of IFRS 1 First-time Adoption of Financial Reporting Standards paragraphs 6 to 21 to present an opening statement of financial position at transition.
The Company intends to maintain these disclosure exemptions in future years.
Judgements and key sources of uncertaintyEstimating fair value for share-based transactions requires determination of the most appropriate valuation model which depends on the terms and conditions of the grant. This estimation also requires determination of the most appropriate inputs to the valuation model.
Tangible fixed assets Tangible fixed assets are stated at historical cost less accumulated depreciation and impairment. Historical cost includes expenditure that is directly attributable to the acquisition of the items. Subsequent costs are included in the asset’s carrying amount or recognised as a separate asset, as appropriate, only when it is probable that future economic benefits associated with the expenditure will flow to the Group and the cost of the item can be measured reliably. All repairs and maintenance expenditures are charged to the income statement during the period in which they are incurred.
Depreciation is calculated using the straight-line method to allocate the cost of each asset to its residual value over its useful economic life.
Residual values and useful lives are reviewed at each period-end date and adjusted as appropriate, with any resulting changes recognised in the income statement prospectively.
Gains and losses on disposals are determined by comparing the disposal proceeds with the carrying amount and are included in the income statement.
Intangible assets Other intangible assets comprise certain computer software and the global IS/IT system. Costs incurred on the development, design and testing of the software and systems are capitalised only when their technical feasibility has been proven. Costs associated with maintenance are charged to the income statement in the period in which they are incurred. Other intangible assets are amortised on a straight-line basis over the periods of their
expected benefit to the Company, which are in the range of three to seven years.
Investments Subsidiaries are all entities over which the Company has control. The Company controls an entity when it is exposed to, or has rights to, variable returns from its involvement with the entity and has the ability to affect those returns through its power over the entity.
An associate is an entity over which the Company has significant influence. Significant influence is the power to participate in financial and operating policy decisions but not to control or jointly control them.
Investments in subsidiary undertakings and in associates represent interests that are directly owned by the Company and are stated at cost less amounts written-off for any permanent diminution in value.
Amounts owed by or to subsidiary undertakings Amounts owed by or to subsidiary undertakings are stated at amortised cost using the effective interest method. Amounts owed by subsidiary undertakings are written-off where deemed unrecoverable.
Research and development All expenditure on research and development is charged to the profit and loss account when incurred.
Leases Operating lease payments are charged to the profit and loss account on a straight-line basis over the lease term.
Retirement benefits The Company participates in a defined benefit pension scheme in which certain of its subsidiaries also participate. The Company, which is not the principal employer, cannot identify its share of the underlying assets and liabilities of the scheme. Accordingly, as permitted by IAS 19 Employee Benefits, the Company accounts for the scheme as a defined contribution scheme and charges its contributions to the scheme to the profit and loss account in the periods in which they fall due.
Deferred taxDeferred tax is recognised in respect of all temporary differences that have originated but which have not reversed at the balance sheet date where transactions or events have occurred at that date that will result in an obligation to pay more, or a right to pay less, or to receive more tax. Deferred tax assets are recognised to the extent that they are regarded as recoverable. Assets are regarded as recoverable when it is regarded as more likely than not there will be suitable taxable profits from which the future reversal of the underlying timing differences can be deducted.
153 Tate & Lyle PLC Annual Report 2016
Strategic ReportG
overnanceFinancial Statem
entsU
seful Information
Financial Statements
Notes to the Parent Company Financial Statements

1. Principal accounting policies continuedForeign currency translationTransactions denominated in foreign currencies are translated into pounds sterling at the exchange rate ruling on the date of the transaction. Monetary assets and liabilities denominated in foreign currencies are retranslated into pounds sterling at the exchange rate ruling on the balance sheet date. Currency translation differences are credited or charged to the profit and loss account. Non-monetary assets denominated in foreign currencies and carried at historical cost are translated using the exchange rate ruling on the date of transaction.
Share-based paymentsAs described in Note 31 to the consolidated financial statements, the Company operates share-based incentive plans under which it grants awards over its ordinary shares to its own employees and to those of its subsidiary undertakings. All of the awards granted under the existing plans are classified as equity-settled awards.
For awards granted to its own employees, the Company recognises an expense that is based on the fair value of the awards measured at the grant date using the Black-Scholes option pricing formula. Fair value reflects any market performance conditions and all non-vesting conditions. Adjustments are made to the compensation expense to reflect actual and expected forfeitures due to failure to satisfy service conditions or non-market performance conditions. Generally, the expense is recognised in the profit and loss account on a straight-line basis over the vesting period and a corresponding credit is recognised in the profit and loss account reserve. For awards granted to employees of its subsidiary undertakings, the Company recognises a capital contribution to the subsidiary and a corresponding credit to equity calculated on the same basis as the expense that it recognises for awards to its own employees.
ProvisionsProvisions are recognised when the Company has a present obligation as a result of a past event, it is probable that a transfer of economic benefits will be required to settle the obligation, and a reliable estimate can be made of the amount of the obligation.
Guarantees From time to time, the Company provides guarantees to third parties in respect of the indebtedness of its subsidiary undertakings and joint ventures. The Directors consider these guarantees to be insurance arrangements and, therefore, the Company recognises a liability in respect of such guarantees only in the event that it becomes probable that the guarantee will be called upon and the Company will be required to make a payment to the third party.
Own sharesOwn shares represent the Company’s ordinary shares that are held by the Company in treasury or by a sponsored Employee Benefit Trust that are used to satisfy awards made under the Company’s share-based incentive plans. When own shares are acquired, the cost of purchase in the market is deducted from the profit and loss account reserve. Gains or losses on the subsequent transfer or sale of own shares are also recognised in the profit and loss account reserve.
Dividends Dividends on the Company’s ordinary shares are recognised when they have been appropriately authorised and are no longer at the Company’s discretion. Accordingly, interim dividends are recognised when they are paid and final dividends are recognised when they are declared following approval by shareholders at the Company’s AGM. Dividends are recognised as an appropriation of shareholders’ funds. Details of dividends paid and proposed are set out in Note 12.
Dividend income received from subsidiary companies is recognised when the right to receive the payment is established.
154 Tate & Lyle PLC Annual Report 2016
Financial Statements
Notes to the Parent Company Financial Statements continued
2. Tangible fixed assetsPlant and
machinery£m
CostAt 1 April 2015 (Restated*) 7At 31 March 2016 7Accumulated depreciationAt 1 April 2015 (Restated*) 3Depreciation charge 1At 31 March 2016 4Net book value at 31 March 2015 (Restated*) 4Net book value at 31 March 2016 3
3. Intangible assetsOther intangible
assets£m
CostAt 1 April 2015 (Restated*) 16Disposals (12)At 31 March 2016 4Accumulated amortisationAt 1 April 2015 (Restated*) 2Amortisation charge 1Disposals (2)At 31 March 2016 1Net book value at 31 March 2015 (Restated*) 14Net book value at 31 March 2016 3
4. Investments in subsidiary undertakings£m
CostAt 1 April 2015 (Restated*) 1 573Additions 7At 31 March 2016 1 580ImpairmentAt 1 April 2015 (Restated*) 565Reversal of impairment (3)At 31 March 2016 562Net book value at 31 March 2015 (Restated*) 1 008Net book value at 31 March 2016 1 018
A list of the Company’s principal subsidiaries is presented in Note 38 of the consolidated financial statements.
5. Investments in associatesThe Company has increased its interest of ordinary shares in Tapioca Development Corporation, a company incorporated in Thailand, by 16.6% to 33.3% (2015 – 16.6%). These additional shares were acquired from a subsidiary company.
6. DebtorsAt 31 March
2016£m
2015£m
Due within one yearAmounts owed by subsidiary undertakings 1 614 1 584Other debtors 3 2Total 1 617 1 586
The effective interest rate applicable to amounts owed by subsidiary undertakings at 31 March 2016 is 2.3% (2015 – 2.2%). Amounts owed by subsidiary undertakings are receivable on demand. There is no security for non-trading amounts.
* Restated as a result of adoption of FRS 101 (see Note 15).
155 Tate & Lyle PLC Annual Report 2016
Strategic ReportG
overnanceFinancial Statem
entsU
seful Information
Financial Statements | Notes to the Parent Company Financial Statements
7. Creditors – amounts falling due within one yearAt 31 March
2016£m
2015£m
Amounts owed to subsidiary undertakings 1 509 1 623Other creditors 4 4Accruals and deferred income 18 8Total 1 531 1 635
The effective interest rate applicable to amounts owed to subsidiary undertakings at 31 March 2016 was 2.7% (2015 – 2.3%). Amounts owed to subsidiary undertakings are repayable on demand. There is no security for non-trading amounts.
8. Creditors – amounts falling due after more than one yearAt 31 March
2016£m
2015£m
Total 2 2
On a return of capital on a winding-up, the holders of 6.5% cumulative preference shares shall be entitled to £1 per share, in preference to all other classes of shareholders. Holders of these shares are entitled to vote at meetings, except on the following matters: any question as to the disposal of the surplus profits after the dividend on these shares has been provided for; the election of directors; their remuneration; any agreement between the directors and the Company; or the alteration of the Articles of Association dealing with any such matters.
9. Contingent liabilitiesAt 31 March 2016, the Company had given guarantees in respect of loans and overdraft facilities of certain of its subsidiaries and joint ventures totalling £2,227 million (2015 – £1,965 million (restated)), against which amounts drawn totalled £730 million (2015 – £705 million (restated)). The Company had given guarantees in respect of operating lease commitments of certain of its subsidiaries and joint ventures totalling £270 million (2015 – £142 million). Other trade guarantees have been given in the normal course of business by Tate & Lyle PLC in respect of Revenue and Customs, ECGD recourse agreements, letters of credit, and tender and performance bonds.
10. Financial commitmentsOperating lease rentals payable during the year were £1 million (2015 – £1 million), all in respect of land and buildings. At 31 March 2016, the Company has outstanding commitments under non-cancellable operating leases which fall due as follows:
At 31 March
2016£m
2015£m
Within one year 1 1Between one year and five years 6 6After five years 8 9Total 15 16
At 31 March 2016, the Company had outstanding capital commitments of £nil (2015 – £nil).
11. Share capital and share premiumAllotted, called up and fully paid equity share capital
2016 2015
Number ofshares
Cost£m
Number of shares
Cost£m
At 1 April 468 223 975 117 468 202 883 117Allotted under share option schemes 11 969 – 21 092 –At 31 March 468 235 944 117 468 223 975 117
See Note 22 in the consolidated financial statements for details of treasury shares and shares held in the Employee Benefit Trust.
156 Tate & Lyle PLC Annual Report 2016
Financial Statements
Notes to the Parent Company Financial Statements continued

12. Dividends on ordinary sharesDividends on ordinary shares in respect of the financial year:
Year ended 31 March
2016pence
2015pence
Per ordinary share:– interim dividend paid 8.2 8.2– final dividend proposed 19.8 19.8Total dividend 28.0 28.0
The Directors propose a final dividend for the financial year of 19.8p per ordinary share that, subject to approval by shareholders, will be paid on 29 July 2016 to shareholders who are on the Register of Members on 1 July 2016.
Dividends on ordinary shares paid in the year:
Year ended 31 March
2016£m
2015£m
Final dividend paid relating to the prior year 92 92Interim dividend paid relating to the year 38 38Total dividend paid 130 130
Based on the number of ordinary shares outstanding at 31 March 2016 and the proposed amount, the final dividend for the financial year is expected to amount to £92 million.
13. Profit and loss account disclosuresThe Company recognised a profit for the year of £260 million (2015 – £128 million).
Fees payable to the Company’s external auditors, PricewaterhouseCoopers LLP, for the audit of the Company’s financial statements amounted to £0.1 million (2015 – £0.1 million).
The Company employed an average of 133 people (including Directors) during the year (2015 – 132). Staff costs are shown below:
Year ended 31 March
2016£m
2015£m
Wages and salaries 21 11Social security costs 3 1Other pension costs 1 1Share-based incentives 3 –Total 28 13
Directors’ emoluments disclosures are provided in the Directors’ Remuneration Report on pages 62 to 79 and in Note 10 of the consolidated financial statements.
No deferred tax assets have been recognised in respect of tax losses of £349 million as there is uncertainty as to whether taxable profits against which these assets may be recovered will be available.
14. Employee benefitsPlan informationThe Company participates in a defined benefit plan together with another subsidiary company, Tate & Lyle Industries Ltd. Payments made by contributing companies principally comprise funding contributions agreed with the trustees that are determined to ensure that appropriate funding levels are maintained and funding deficits are eliminated over a reasonable period of time. The plan is closed to new entrants. The Company has 345 pensioners and deferred pensioners out of a total membership of circa 6,000.
The Company also operates a defined contribution pension plan. Contributions payable by the Company to the plan during the year amounted to £1 million (2015 – £1 million).
The Company has provided a full liability guarantee in respect of the pension obligations of the other participating employer. Whilst there is no agreed allocation of deficit or surplus, the Trustees have discretion to distribute any surplus on winding up as they consider appropriate, after increase of benefits consistent with Inland Revenue Limits.
Funding of the planAs required by UK regulations, actuarial valuations are carried out at least every three years. Core funding contributions are £12 million per annum (2015 – £12 million). In addition, supplementary contributions of £6 million (2015 – £6 million) will be made into a secured funding account until March 2019. The deficit or surplus in the plan impacts the future contributions which are determined with reference to the triennial actuarial valuations.
For further details on the defined benefit plan see Note 30 in the consolidated financial statements.
157 Tate & Lyle PLC Annual Report 2016
Strategic ReportG
overnanceFinancial Statem
entsU
seful Information
Financial Statements | Notes to the Parent Company Financial Statements

15. Explanation for transition to FRS 101 from UK GAAPThis is the first year that the Company has presented its financial statements in accordance with FRS 101. The last financial statements were prepared under UK Generally Accepted Accounting Practice (UK GAAP) for the year ended 31 March 2015. This note explains the principal adjustment made by the Company in restating its balance sheet as at 1 April 2014 and 31 March 2015. On transition to FRS 101, the Company has applied the requirements of paragraphs 6-33 of IFRS 1 First time adoption of International Reporting Standards.
As previouslystated
1 April 2014£m
Effect on transition
1 April 2014 £m
As restatedunder FRS 101
1 April 2014 £m
As previouslystated
31 March 2015 £m
Effect ontransition
31 March 2015£m
As restated under FRS 101 31 March 2015
£mFixed assets Tangible assets 13 (9) 4 18 (14) 4Intangible assets – 9 9 – 14 14Investments in subsidiary undertakings 999 – 999 1 003 5 1 008Investment in associate 1 – 1 1 – 1Total 1 013 – 1 013 1 022 5 1 027
Current assetsDebtorsCash at bank
1 5011
––
1 5011
1 5861
––
1 5861
1 502 – 1 502 1 587 – 1 587Creditors – amounts falling due within
one year (1 533) – (1 533) (1 635) – (1 635)Net current assets (31) – (31) (48) – (48)Total assets less current liabilities 982 – 982 974 5 979Creditors – amounts falling due after
more than one year (2) – (2) (2) – (2)Net assets 980 – 980 972 5 977
Capital and reservesCalled up share capital 117 – 117 117 – 117Share premium account 406 – 406 406 – 406Capital redemption reserve 8 – 8 8 – 8Profit and loss account 449 – 449 441 5 446Total shareholders’ funds 980 – 980 972 5 977
Under its previous UK GAAP accounting policy, an investment in an overseas subsidiary undertaking or associate was retranslated if it was financed by foreign currency borrowings and the borrowings were designated as a hedging instrument in relation to the investment. If this were the case, the resulting translation gain or loss on the investment was recognised directly in reserves where, to the extent that the hedge was effective, it would be offset by the translation gain or loss on the related borrowings. However, under FRS 101 non-monetary items that are measured in terms of historical cost in a foreign currency are translated using the exchange rate at the date of the transaction and translation gains or losses on the related borrowings are recognised in profit and loss. On transition to FRS 101, the deemed cost for the investments has been based on the carrying value as at the transition date. The impact of this GAAP difference is a £5 million gain for the 31 March 2015 balance sheet. The transition to FRS 101 has also resulted in a re-classification of computer software from tangible assets to intangible assets.
158 Tate & Lyle PLC Annual Report 2016
Financial Statements
Notes to the Parent Company Financial Statements continued

Pre IFRS 11* Post IFRS 11#
At 31 March
Employment of capital2012
£m2013
£m2014
£m2015
£m2016
£mGoodwill and intangible assets 325 356 307 340 390Property, plant and equipment 922 958 732 750 926Other assets 28 33 28 33 23Working capital 370 497 351 339 323Net pension deficit (140) (265) (220) (227) (208)Net assets held for sale (excluding cash included in net
debt) 63 1 – – 5Net operating assets 1 568 1 580 1 198 1 235 1 459Investment in joint ventures and associates – – 312 327 85Net debt (476) (479) (385) (555) (434)Net tax liability (34) (65) (75) (71) (81)Total net assets 1 058 1 036 1 050 936 1 029
Capital employed Called up share capital 117 117 117 117 117Reserves 916 919 932 818 911
1 033 1 036 1 049 935 1 028Non-controlling interests 25 – 1 1 1 1 058 1 036 1 050 936 1 029
Pre IFRS 11* Post IFRS 11#
Year ended 31 March
Results summary2012
£m2013
£m
2014
£m
2015
£m2016
£mContinuing operationsSales 3 088 3 256 2 737 2 341 2 355Adjusted operating profit 346 356 274 184 188Amortisation of acquired intangible assets (12) (10) (10) (9) (11)Exceptional items 68 (12) (14) (142) (50)Operating profit 402 334 250 33 127Adjusted net finance expense (30) (29) (27) (23) (23)Net retirement benefit interest expense (4) (4) (8) (8) (6)Net finance expense (34) (33) (35) (31) (29)Share of profit after tax of joint ventures and associates – – 22 23 28Profit before tax 368 301 237 25 126Income tax expense (69) (46) (32) (21) (5)Profit for the year from continuing operations 299 255 205 4 121Profit for the year from discontinued operations 2 18 68 26 42Non-controlling interests (4) (1) – – –Profit for the year attributable to owners of the Company 297 272 273 30 163 Continuing operationsAdjusted profit before tax 316 327 269 184 193Earnings per share: – basic 64.2p 54.9p 44.2p 0.9p 26.1p– diluted 63.0p 53.8p 43.6p 0.8p 25.9p
* Years 2012-2013 presented on a proportionate consolidation basis for both statutory and adjusted metrics. No restatement has been performed in respect of the operations reclassified as discontinued in the 2016 financial year.
# Years 2014-2016 prepared on an equity accounted basis for statutory and adjusted metrics and reflect restatement for operations reclassified as discontinued in the 2016 financial year.
159 Tate & Lyle PLC Annual Report 2016
Useful Information
Strategic ReportG
overnanceFinancial Statem
entsU
seful Information
Group Five-year Summary

Pre IFRS 11* Post IFRS 11#
Year ended 31 March
Per share information 2012 2013 2014 2015 2016Earnings per share: – basic1 63.8p 58.6p 58.8p 6.6p 35.1p– adjusted basic1 55.9p 55.8p 56.5p 38.0p 34.9pEarnings per share: – diluted1 62.7p 57.4p 58.0p 6.5p 34.8p– adjusted diluted1 54.8p 54.7p 55.7p 37.7p 34.7pDividends per ordinary share 24.9p 26.2p 27.6p 28.0p 28.0pClosing share price at 31 March 705.0p 850.0p 667.5p 597.5p 578.0pClosing market capitalisation at 31 March (£million) 3 301 3 980 3 125 2 798 2 706
Business ratios Interest cover (times)2 11.1x 11.1x 11.6x 10.7x 10.7xOperating profit before exceptional items and
amortisation of intangible assets divided by net finance expense
Net debt to EBITDA (times)2 1.1x 1.0x 0.8x 1.3x 1.2xNet debt divided by pre-exceptional EBITDAGearing 45% 46% 37% 59% 42%Net debt as a percentage of total net assets1 Adjusted operating margin 11.1% 10.7% 10.0% 7.8% 7.9%Adjusted operating profit as a percentage of sales1 Return on net operating assets 22.8% 21.5% 21.7% 14.4% 13.1%Profit before interest, tax and exceptional items as a
percentage of average net operating assets1 Dividend cover (times) Basic earnings per share divided by dividends per share1 2.6x 2.2x 2.1x 0.2x 1.3xAdjusted basic earnings per share divided by dividends
per share1 2.2x 2.1x 2.0x 1.4x 1.2x
* Years 2012-2013 presented on a proportionate consolidation basis for both statutory and adjusted metrics. # Years 2014-2016 prepared on an equity accounted basis for statutory and adjusted metrics.1 These metrics have been calculated using the results of both continuing and discontinued operations.2 Interest cover and net debt to EBITDA have been calculated using the same basis as set out in the Group’s external bank covenants.
160 Tate & Lyle PLC Annual Report 2016
Useful Information
Group Five-year Summary continued
Financial calendar
2016 Annual General Meeting 21 July 2016 Announcement of half-year results for the six months to 30 September 2016 3 Nov 2016 1
Announcement of full-year results for the year ending 31 March 2017 25 May 2017 1
2017 Annual General Meeting 27 July 2017 1
Dividends paid on ordinary shares during the year ended 31 March 2016
Payment dateDividend
descriptionDividend per
share
31 July 2015 Final 2015 19.8p4 Jan 2016 Interim 2015 8.2p
Dividend calendar for dividends on ordinary shares
2016 final 2017 interim 2017 final
Announced 25 May 2016 3 Nov 20161 25 May 20171
Payment date 29 July 20162 3 Jan 20171 1 August 20171,2
1 Provisional date.2 Subject to approval of shareholders.
Dividends paid on 6.5% cumulative preference sharesPaid each 31 March and 30 September.
Capital gains taxThe market values on 31 March 1982 for the purposes of indexation up to April 1998 in relation to capital gains tax of Tate & Lyle PLC shares then in issue were:
Ordinary share of £1 each 201.00pEquivalent value per ordinary share of 25p 50.25p6.5% cumulative preference share 43.50p
Tate & Lyle American Depositary Shares (ADSs)The Company’s shares trade in the US on the over-the-counter (OTC) market in the form of ADSs and these are evidenced by American Depositary Receipts (ADRs). The shares are traded under the ticker symbol TATYY. More information can be obtained from the Company’s website at www.tateandlyle.com/investorrelations/shareinformation. All enquiries relating to the Company’s ADRs should be addressed to The Bank of New York Mellon at:
BNY Mellon Shareowner Services PO Box 30170 College Station TX 77842-3170 Tel: +1 888 269 2377 (for US calls)
+1 201 680 6825 (for calls from outside the US)
Electronic communicationsShareholder documents are only sent in paper format to shareholders who have elected to receive documents in this way. This approach enables the Company to reduce printing and distribution costs and its impact on the environment.
Shareholders who have not elected to receive paper copies are sent a notification whenever shareholder documents are published, to advise them how to access the documents via the Tate & Lyle website, www.tateandlyle.com. Shareholders may also choose to receive this notification via email with a link to the relevant page on the website. Shareholders who wish to receive email notification should register online at www.shareview.co.uk, using their shareholder reference number that is either on their share certificate or other correspondence.
Beware of share fraudShareholders should be very wary of any unsolicited calls or correspondence offering to buy or sell shares at a discounted price. These calls are typically from fraudsters operating ‘boiler rooms’. Boiler rooms use increasingly sophisticated means to approach investors and often leave their victims out of pocket. If you are concerned that you may have been targeted by fraudsters please contact the FCA Consumer Helpline on 0800 111 6768.
Dividend reinvestment plan The Company operates a Dividend Reinvestment Plan (DRIP) which enables shareholders to buy additional shares in Tate & Lyle with their dividend payment. Further information can be obtained from Equiniti.
Shareholding enquiriesGeneral enquiriesInformation on how to manage your shareholdings can be found at www.shareview.co.uk. The website also provides answers to commonly asked shareholder questions and has links to downloadable forms, guidance notes and company history fact sheets.
Email enquiries (Equiniti Shareview Enquiry Service)If your question is not answered by the information provided online you can send your enquiry via secure email from the above website. You will be asked to complete a structured form and to provide your shareholder reference number, name and address. You will also need to provide your email address if this is how you would like to receive your response.
Telephone enquiries0371 384 2063 (for UK calls)1 +44 (0)121 415 0235 (for calls from outside the UK).1 Lines open 8.30am to 5.30pm (UK time),
Monday to Friday (excluding public holidays in England and Wales).
Written enquiriesEquiniti Limited, Aspect House, Spencer Road, Lancing, West Sussex BN99 6DA.
Individual Savings Account (ISA)Tate & Lyle’s ordinary shares can be held in an ISA. For information, please call the Equiniti ISA Helpline on 0371 384 2244.
Information for Investors
Tate & Lyle website and share price information
Tate & Lyle’s website provides direct links to other Group company sites and to sites providing financial and other information relevant to the Company. The share price is available on the website with a 20-minute delay.
www.tateandlyle.com
161 Tate & Lyle PLC Annual Report 2016
Strategic ReportG
overnanceFinancial Statem
entsU
seful Information
Useful Information
AAcidulantsIngredients such as citric acid that are used to add a ‘sour’ taste to food and soft drinks and to act as a preservative.
Adjusted operating cash flowAdjusted cash flow from continuing operating activities (excluding pensions, derivative financial instruments, tax, interest and acquisitions) less capital expenditure.
Adjusted operating profit (PBITEA)Operating profit (as defined separately), adjusted for amortisation of acquired intangible assets and net exceptional items.
Adjusted profit before tax (PBTEA)Profit before tax (as defined separately), adjusted for amortisation of acquired intangible assets, net exceptional items and net retirement benefit interest.
BBI Bulk Ingredients division.
Bio-PDOTM Multi-purpose monomer propanediol made from corn sugar (as opposed to being made from a petrochemical source). Used in cosmetics, detergents, carpets and textiles.
CCarbon dioxide equivalent (CO2e) One metric tonne of carbon dioxide or an amount of any other greenhouse gas with an equivalent global warming potential, calculated consistently with international carbon reporting practices.
CDP CDP is an international environmental reporting and benchmarking organisation that holds and publishes the largest collection globally of self-reported climate change, water and forest-risk data from companies and cities worldwide. Through CDP investors, companies and cities are better able to mitigate risk, capitalise on opportunities and make investment decisions that drive action towards a more sustainable world. CDP’s 2015 climate change programme was conducted on behalf of investors with US$95 trillion of assets under management (at that time).
CLARIA® Functional Clean-Label Starches.
‘Clean label’ A term used in the food and beverage industry generally to refer to shorter or simpler ingredient lists that appeal more to some consumers than those containing complex ingredients. Interpretations may vary.
CommoditiesCommodities include US ethanol and co-products.
Constant currency Changes in constant currency are calculated by retranslating comparative period results at current period exchange rates.
Continuing operations Operations of the Group excluding any discontinued operations (as defined separately).
Co-products Corn gluten feed, corn gluten meal and corn oil.
Corn gluten feed The largest Tate & Lyle co-product, used by dairy and beef cattle markets.
DDiscontinued operations An operation is classified as discontinued if it is a component of the Group that: (i) has been disposed of, or meets the criteria to be classified as held for sale; and (ii) represents a separate major line of business or geographic area of operations; and (iii) will be disposed of as part of a single co-ordinated plan to dispose of a separate major line of business or geographic area of operations.
DOLCIA PRIMA® Allulose Low-calorie sugar that offers a superior, new taste experience.
FFood Systems The Tate & Lyle blending business which is part of SFI and which sources ingredients and uses them to develop bespoke combinations of ingredients for customers.
GGreenhouse gas (GHG) Any of the following: carbon dioxide (CO2), methane (CH4), nitrous oxide (N2O), hydrofluorocarbons (HFCs), perfluorocarbons (PFCs), sulphur hexafluoride (SF6).
162 Tate & Lyle PLC Annual Report 2016
Useful Information
Glossary
HHFCS High fructose corn syrup, also called isoglucose in Europe.
IICD Innovation and Commercial Development group, supporting our two business divisions, SFI and BI.
LLabel friendly Denotes ingredients that, when listed on product ingredient labels, may appeal more to some consumers who show a preference for ingredients in food products which they feel are more transparent, authentic, simpler or easier to understand than alternatives which may be perceived by some consumers as being artificial, chemical or in some way less authentic.
NNatural A ‘natural’ description usually refers to a food ingredient that is present in nature and has been minimally processed. However, interpretations vary according to the different legal and regulatory landscape in different countries.
OOperating profit (also referred to as profit before interest and tax (PBIT)) Sales less net operating expense.
PPrimary capacityThe processing capacity, at the first stage of production, in which the agricultural raw material enters the production process.
Profit before tax (PBT) Sales, less net operating expense, less net finance expense and including the Group’s share of profit after tax of joint ventures.
PROMITOR® Soluble Fibre A prebiotic soluble fibre.
PromOat® Beta Glucan A soluble fibre made from wholegrain oats used to bring the health benefits of oat beta glucan to food and beverages.
PUREFRUIT™ Monk Fruit Extract A zero-calorie sweetener made from monk fruit.
SSFI Speciality Food Ingredients division.
SODA-LO® Salt Microspheres A low salt ingredient made from salt.
SPLENDA® Sucralose A zero-calorie sweetener, the manufacturing process for which starts with sugar.
TTASTEVA® Stevia Sweetener A zero-calorie sweetener made from stevia.
UUSDA US Department of Agriculture.
163 Tate & Lyle PLC Annual Report 2016
Strategic ReportG
overnanceFinancial Statem
entsU
seful Information
Useful Information | Glossary

Non-reliance statementThis Annual Report has been prepared solely to provide additional information to shareholders to assess the Group’s strategy and the potential of that strategy to succeed, and should not be relied upon by any other party or for any other purpose.
Cautionary statementThis Annual Report contains certain forward-looking statements with respect to the financial condition, results, operations and businesses of Tate & Lyle PLC. These statements and forecasts involve risk and uncertainty because they relate to events and depend upon circumstances that may occur in the future. There are a number of factors that could cause actual results or developments to differ materially from those expressed or implied by these forward-looking statements and forecasts.
Tate & Lyle PLCTate & Lyle PLC is a public limited company listed on the London Stock Exchange and is registered in England and Wales. More information about Tate & Lyle can be found on the Company’s website, www.tateandlyle.com.
Sources for footnote 3 on page 22• Murphy N, Norat T, Ferrari P, et al.
Dietary fibre intake and risks of cancers of the colon and rectum in the European prospective investigation into cancer and nutrition (EPIC). PLoS One. 2012;7:e39361.
• King DE, Mainous AG, 3rd, Lambourne CA. Trends in dietary fiber intake in the United States, 1999-2008. J Acad of Nutr Diet. 2012;112(5):642-8.
• Stookey, JD. Energy density, energy intake and weight status in a large free-living sample of Chinese adults: Exploring the underlying roles of fat, protein, carbohydrate, and fiber and water intakes. EJCN. 2001;55(5): 349-359.
• Cho SS and Dreher M (eds.) Handbook of Dietary Fiber. Marcel Dekker Inc., NY. 2001.
Basis of preparationUnless stated otherwise, the Group’s financial statements are prepared in accordance with International Financial Reporting Standards (IFRSs) as adopted by the EU.
AmortisationUnless stated otherwise, the use of the word ‘amortisation’ on pages 1 to 81 in this Annual Report relates to the amortisation of intangible assets acquired through business combinations.
Continuing operationsUnless stated otherwise, all comments in this Annual Report refer to the continuing operations adjusted to exclude exceptional items, amortisation of intangible assets acquired through business combinations and net retirement benefit interest. A reconciliation of reported and adjusted information is included in Note 4 of the consolidated financial statements.
DefinitionsIn this Annual Report, ‘Company’ means Tate & Lyle PLC; ‘Tate & Lyle’ or ‘Group’ means Tate & Lyle PLC and its subsidiaries.
Environmental statementThis Annual Report has been printed on UPM Fine offset, a paper produced using wood fibre from fully sustainable forests with Forest Stewardship Council® (FSC®) certification. All pulps used are elemental chlorine free and the manufacturing mill holds the ISO 14001 and the EMAS accreditations for their environmental management systems.
Printed in the UK by Pureprint using vegetable inks and its Alcofree and Pureprint environmental printing technology. Pureprint is a CarbonNeutral® company, is registered to the Environmental Management System Standard ISO 14001 and is FSC® chain-of-custody certified.
If you have finished with this Annual Report and no longer wish to retain it, please pass it on to other interested readers or dispose of it in your recycled paper waste.
The CO2 emissions from the production and distribution of this Annual Report have been offset through the purchase of carbon credits in the Pureprint Gold programme. The offsets are always in Gold Standard accredited projects and currently come from the Basa Magogo project in South Africa. The first Gold Standard project of its kind in the world, this innovative behaviour-change programme teaches local communities in South Africa to burn coal more efficiently, thereby reducing carbon emissions and reducing health risks by producing less smoke.
164 Tate & Lyle PLC Annual Report 2016
Useful Information
Definitions/explanatory notes

Registered officeTate & Lyle PLC 1 KingswayLondon WC2B 6ATTel: +44 (0)20 7257 2100Fax: +44 (0)20 7257 2200Company number: 76535www.tateandlyle.com
CreditsPhotographyDavid Hares
Designed and produced by

www.tateandlyle.com


