43
ANNUAL REPORT 2017
ANNUAL REPORT 2017

1 HIGHLIGHTS
2 MONTREAL: 375 YEARS OF STORIES TO SHARE
4 MESSAGE FROM THE CHAIR OF THE BOARD
5 MESSAGE FROM THE PRESIDENT AND CHIEF EXECUTIVE OFFICER
5 MANAGEMENT COMMITTEE
6 REVIEW OF ACTIVITIES
8 CUSTOMER EXPERIENCE
12 SOUND MANAGEMENT
15 SUSTAINABLE DEVELOPMENT
18 TRENDS
21 FINANCE
22 ACCOUNTABILITY REPORT
23 COMMERCIAL DATA
24 FINANCIAL REVIEW
36 TEN-YEAR HISTORICAL REVIEW
The English-language version of the SAQ Annual Report 2017 does not include the Governance section or parts of the Finance section. For the complete report, please see the French-language version. In the event of discrepancy between the French- and English-language versions of the report, the French-language version shall prevail.

1 SAQ ANNUAL REPORT 2017
2017 2016 Change (%)
FINANCIAL RESULTS
Sales 3,122.6 3,073.6 1.6
Gross margin 1,654.1 1,637.8 1.0
Net expenses1 568.4 570.8 (0.4)
Profit 1,085.7 1,067.0 1.8
Comprehensive income 1,085.4 1,067.1 1.7
FINANCIAL POSITION
Total assets 827.7 779.8 6.1
Property, plant and equipment and intangible assets 222.4 241.5 (7.9)
Net working capital (150.8) (164.1) 8.1
Long-term liabilities 32.4 36.3 (10.7)
Shareholder’s equity 41.2 41.5 (0.7)
SALES BY NETWORK
Stores and specialized centres 2,776.6 2,746.2 1.1
Wholesale grocers 346.0 327.4 5.7
Total 3,122.6 3,073.6 1.6
NET SALES BY PRODUCT CATEGORY
Wines 2,320.1 2,300.9 0.8
163.8 L 162.9 L 0.6
Spirits 726.9 697.7 4.2
23.7 L 23.0 L 3.0
Beers, ciders and coolers2 75.6 75.0 0.8
10.5 L 10.2 L 2.9
3,122.6 3,073.6 1.6
Total 198.0 L 196.1 L 1.0
ADDITIONAL FINANCIAL DATA
Government revenue3 2,132.4 2,093.1 1.9
1. Net expenses consist of selling, marketing, distribution and administrative expenses, from which advertising, promotional and miscellaneous revenues are deducted. They also include financial expenses net of financial income and the share in profit or loss of equity-accounted interests.
2. Also known as RTDs (ready-to-drinks), FABs (flavoured alcoholic beverages) and alcopops.3. Includes the declared dividend, sales taxes, the specific tax on alcoholic beverages, excise taxes and customs duties.
Certain comparative figures have been reclassified to conform to the current year’s presentation.
2017 HIGHLIGHTSFiscal year ended March 25. 2017 (in millions of Canadian dollars and in millions of litres for volume sales)

2 SAQ ANNUAL REPORT 2017
MONTREAL: 375 YEARS OF STORIES TO SHARE
The history of the Société des alcools du Québec is closely tied to that of Montreal. It is a rich, unique history created by people from here and elsewhere and marked by large and small events. And like our beautiful metropolis, the SAQ has evolved over time in pace with people and its architects.
MONTREAL, FESTIVE CITYThe reputation for being a dynamic, festive and food-obsessed city that Montreal has built for itself was surely influenced by the fact that, in the early 20th century, Quebec was the only place in Canada and the United States where alcohol wasn’t totally banned.
In 1919, after holding a referendum, the Quebec government excluded beer, wine and cider from the Prohibition Act of 1918. The government opted for an original solution—temperance instead of abstinence—enacting the Alcoholic Beverages Act and creating the Commission des liqueurs de Québec.
It was in 1921 that the SAQ—then the Commission des liqueurs de Québec—began laying the foundation for its history at the Pied-du-Courant in the shadow of the Jacques Cartier Bridge. It took possession of the building, the former Montreal prison, which had been abandoned for several years, and renovated it to make it its main warehouse.
Meanwhile, Montreal’s nightlife was taking off. Americans and Canadians from far and wide came to the island to celebrate, so much so that the Commission had gross sales of more than $27 million at the height of prohibition in the States. Sales fell to some $11 million in 1934.
MONTREAL, OPEN CITY If Montreal’s soul and the vivacity associated with it were influenced by the Prohibition era, its reputation as a city open to the world is probably attributable to the 1967 World’s Fair. Expo 67 also prompted the Régie des alcools du Québec to offer to Quebecers and tourists an unprecedented range of wines and alcoholic beverages from every corner of the globe. The event marks the true beginning of a wine culture in Quebec.
MONTREAL, FOOD CITY Interest in gastronomy and in wine and food pairings has only grown in the decades since, earning Montreal the status of a food city. The art of eating and drinking well is part of Montrealers’ DNA, and the Société des alcools du Québec continues to feed their passion. In the last 40 years, the government corporation has increased its offer eightfold, from 1,560 to 13,200 products.
Over the years, construction and restoration work at the Pied-du-Courant site allowed the company to maintain its head office in the building. The SAQ warehouse was moved to Montreal's east end in 1977. The following year, the Pied-du-Courant was classified as an historic monument.
Archives Montréal: Pied-du-Courant prison, early 20th century, VM6,R3082-2_2145E-004
Archives Montréal: Aerial view of the Régie des alcools du Québechead office, 1970s, VM6,R3082-2_2145E-012

3 SAQ ANNUAL REPORT 2017
Montrealers’ collective interest in the pleasures of the table has made the metropolis a centre of wine stewardship and fine dining. The world is at our doorstep, you could say: like wines, people now cross oceans to enrich our culture, share their most treasured flavours with us, discover our own flavours and add to the pleasures of diversity.
In the basement of its head office, the SAQ has created an exhibition centre named La Prison des Patriotes. It tells the story of the events of 1837-1838, which marked the history of Montreal and all Quebec. The exhibit reminds us of the sacrifices of those who fought for our democratic rights and freedom.
LET’S CELEBRATE MONTREAL! This year will feature many opportunities to celebrate the 375th anniversary of our beautiful city. Some producers from Quebec and elsewhere have even created special bottlings for toasting Montreal. In 2017, the Société des alcools du Québec raises its glass to Montreal and offers its best wishes for sparkling, magnificent, community-rallying celebrations equal to its history.
Happy anniversary, Montreal!
In honour of Montreal’s 375th anniversary, Quebec poet, writer, singer, screenwriter and director Claude Péloquin, has written a poem illustrating the warm relationship that ties the SAQ and Montrealers together. A celebration of our beautiful city... and of the SAQ!
UN BON TCHIN TCHIN À TOUS PARTOUT Montréal fête sa fête dans les bras de son fleuve Ensemble nous avons grandi et nous fleurissons Nous lui levons notre verre de tous nos crus Bien choisis et perfectionnés dans les temps Nous sommes devenus des spécialistes du goût La nature en personne est notre source d’inspiration Nous trinquons par vous avec la planète… —C’est avec le bonheur dans le cœur que notre oasis S’est ouverte sur le vaste monde des saveurs Chez nous c’est maintenant chez vous Au cours des années nos racines remontent à loin très loin Comme le bon vin… —Avec fierté notre Société vit dans la vôtre là tout près On fait partie des plaisirs de la vie Vous arrivez chez nous par maints chemins Avec votre sourire et vos choix Vous repartez chez vous avec le nôtre Souvent avec des imprévus heureux —Au pied du courant Au cœur de cette ville et de son Saint-Laurent Flamboyants nuits et jours Artères de ce Québec enraciné dans l’histoire sans fin Par tant d’aventures humaines La découverte est toujours partout présente Chez nous c’est Noël tous les jours Par ricochet pour vous aussi… Même nos employés vont de surprises en surprises Nous chérissons ce dialogue accru avec nos clients En personne ou par la panoplie de nos services connexes Bien humains avec des technologies de pointe… Nous sommes de toutes Vos célébrations

4 SAQ ANNUAL REPORT 2017
The SAQ is a government corporation mandated to sell beverage alcohol by offering a broad range of quality products. With the support of its some 7,000 employees and 3,100 suppliers, it makes more than 13,200 products available through its 841 points of sale. For several decades now, the SAQ has fully assumed its role as a structuring entity in the wine industry. More recently, it has gained the status of a leader in Quebec retailing. The evolution of its vision and its approach to its relationship with customers has led it to adopt the best business practices, and it has never stopped striving to remain an inspiration for the industry. Its goal is clearly defined: to remain connected with its customers and continue delivering true value to its shareholder and Quebec society.
Fiscal 2016-2017 was the year in which, more than ever, the Société des alcools du Québec stood out through its performance, as can be seen not only in its ever-improving financial results but also in the customer experience it provides. For while the company works ceaselessly to bring the world’s best beverage alcohol products to its customers, it accords top priority to the quality of the shopping experience and the customer services it provides.
With that in mind, the government corporation’s Board of Directors adopted an updated version of its Purchasing and Merchandising Policy aimed at streamlining the processes involved and bringing new and innovative products to stores faster. The Board also approved the Store and Agency Store Network Development Plan to maintain the SAQ’s presence in the community and the Information Technology Project Plan to ensure the company continues evolving in step with its customers.
I want to take advantage of this opportunity to note the excellent work of Céline Blanchet and Louise Ménard, both of whom left the Board of Directors this year. As a director, Ms. Blanchet contributed to the SAQ’s success through her exceptional understanding of the retail industry, while Ms. Ménard brought discipline and expertise in governance. Following these two departures, to continue properly guiding the SAQ’s business activities, we welcomed Nora Azourmanian and Michael Stephen Pesner to our team, which enabled us to maintain parity between men and women on the Board. In addition, the terms of Danièle Bergeron, Nicole Diamond-Gélinas and Sylvain Lafrance were renewed.
RESOLUTELY TURNED TOWARD THE FUTURE The beginning of fiscal 2017-2018 will be marked by the drafting of the next Strategic Plan in collaboration with the management team. The plan will enable the Société des alcools du Québec to position itself in an environment that is as changeable as it is demanding in order to better address its main challenge: meeting customers’ expectations. For its part, the larger SAQ team will continue carrying out its many projects to fulfill its mandate and achieve its ambitious objectives. In doing so, employees will be able to count on the 13 members of the Board of Directors, who will make their knowledge and skills available to the company. Lastly, I want to thank the members of the Management Committee for their remarkable effort. The SAQ’s success also owes much to the employees who work in the stores, administrative centres and distribution centres and who not only support the SAQ’s objectives but make it a dynamic company admired by Quebecers.
Johanne Brunet Chair of the Board of Directors
MESSAGE FROM THE CHAIR OF THE BOARD OF DIRECTORS

5 SAQ ANNUAL REPORT 2017
Fiscal 2016-2017 was marked by big challenges and impressive achievements at the Société des alcools du Québec. The choices we made, the projects we took on and the results we obtained are paving the way for the SAQ of tomorrow: an agile, high-performing government corporation fully focused on its customers. Strongly inspired by our strategic orientations—in particular the customer experience, sound management and sustainable development—our efforts bore fruit: the company was able to transfer $1.086 billion to the Quebec treasury, sales grew 1.6% to nearly $3.123 billion and the ratio of net expenses to sales was 18.2%.
But our most important achievement was the appreciation expressed by our customers, 94% of whom said they were satisfied with their experience at the SAQ. This satisfaction rate—the highest ever recorded by the company—is intimately linked to the many actions we took to improve our relationship with customers. For example, the personalized offers made available through SAQ Inspire, which are based on the customer’s tastes and purchase history, proved a resounding success. Customers were also encouraged to present their Inspire card to their in-store advisor to obtain suggestions for products aligned with their preferences. Expanding the Click, Purchase, Pick Up service to new points of sale, revamping the mobile app and offering new arrivals of Cellier and Signature products on SAQ.com also contributed to this excellent result. The offer of Origine Québec products was also much appreciated, for the category continued to see strong growth in the annual sales of Quebec products, which now exceed 400,000 litres.
Optimizing how the company does business, a process we have been involved in for several years now, enabled us to make efficiency gains, create some financial manoeuvring room and reinvest some of the savings to the benefit of our customers. Since last November, the SAQ has implemented three rounds of price reductions, allowing customers to save $1.40 a bottle on the most popular still wines and around 15% on the price of coolers.
It was with the goal of simplifying our processes and achieving a level of efficiency comparable to that of the retail industry that we carried out a major administrative rationalization. I want to note the contribution of all who have left us and thank them for having placed their enthusiasm and talent at the service of the company. Combined with the signing of a new five-year collective agreement with the Syndicat des travailleurs et travailleuses de la SAQ (STTSAQ), this restructuring will significantly increase our organizational flexibility.
In closing, I want to offer my heartfelt thanks to the company’s employees and to my Management Committee colleagues who, day after day, demonstrate such passion, commitment and professionalism. Thanks, too, to the members of the Board of Directors for their trust, expertise and support of the SAQ’s aspirations. Lastly, I thank our customers, who are our raison d’être and drive our creativity, and our valued partners, who support us in our projects.
Alain Brunet President and Chief Executive Officer
MANAGEMENT COMMITTEE
Alain Brunet President and Chief Executive Officer
Jean-François Bergeron Vice-PresidentInformation Technology
Catherine Dagenais Vice-PresidentRetail Strategy and Customer Experience
Jacques Farcy Vice-PresidentMarketing, Donations and Sponsorships
Madeleine Gagnon Vice-PresidentHuman Resources
Raymond Paré Vice-President and Chief Financial Officer
Daniel Trottier Vice-PresidentSales Network Operations
MESSAGE OF THE PRESIDENT AND CHIEF EXECUTIVE OFFICER
6 SAQ ANNUAL REPORT 2017
Throughout its 96 years of existence, the Société des alcools du Québec has never stopped evolving. Since its founding in 1921, when it was known as the Commission des liqueurs de Québec, the government corporation has transformed itself from a collection of 64 outlets where products were sold from behind caged counters into a network of hundreds of customer-friendly stores where tastings that lead to discovering new products are a regular occurrence. Over the decades, the SAQ has succeeded in making itself into a company that is both structuring for Quebec and trail-blazing for the retail industry. Today, the entire planet wine recognizes the diversity of the SAQ’s offer, the quality of its management expertise and the relevance of its advisory service. In the last year, the SAQ offered some 13,200 products. The wines, beers and spirits it selected came from 3,100 suppliers in 77 countries and found places on the company’s shelves as well as in the huge selection available on SAQ.com.
REVIEW OF ACTIVITIES
13,200products from 77 countries

7 SAQ ANNUAL REPORT 2017 – REVIEW OF ACTIVITIES
7,033 employees
405 stores
1.9 million customer
members
Profit of
$1.086 billion remitted entirely
to the Quebec government,in the form of a dividend,
for the benefit of all Quebecers
21.4 million cases
delivered

8
The SAQ has made customer satisfaction its priority. Always on the lookout for new trends and the best business practices in order to better please its customers, the government corporation attaches great importance to discovery, product accessibility and product pricing, even as it carries out its role as a responsible company.
STIMULATING DISCOVERYBecause discovering new products matters to its customers, the SAQ makes a point of refreshing around 10% of its product offer each year. In fiscal 2016-2017, no fewer than 70 regular products, 940 specialty products and 660 Signature products were introduced in its store network and on SAQ.com.
ACCESSIBILITY: COMPLEMENTARITY OF STORES AND THE WEB The notion of discovery follows directly from the notion of accessibility. That is why the SAQ is proud to offer Quebecers an extensive network of welcoming stores. In fiscal 2016-2017, the company invested $6.5 million in its retail network, which was comprised of 405 stores. To better serve its customers, a new store was opened at Stoneham-et-Tewkesbury in the Quebec City area and 25 stores were redesigned or relocated, including the SAQ Dépôt store in Gatineau. In addition, the opening hours of 212 stores were extended and adapted to customers’ new shopping habits. For their part, customers who live in lower density municipalities enjoy access to 436 SAQ agency stores.
At the same time and with the aim of providing increased accessibility to the wines, beers and spirits it sells, the SAQ expanded the offer of Signature and specialty products on SAQ.com, turning the website into a true online store. Since September, customers across Quebec have been able to acquire Cellier products and other products available in very small quantities by taking advantage of the pre-sales posted on SAQ.com. Unsurprisingly, visits to the company’s website grew at an annual rate of 14% to more than 28 million in fiscal 2016-2017. The number of online transactions increased more than 26% during the same period, and that was despite a postal strike.
CUSTOMER EXPERIENCE
SAQ ANNUAL REPORT 2017 – REVIEW OF ACTIVITIES

9
Also, to diversify and enrich the in-store experience, the SAQ has made a Wi-Fi network available to customers, who can now continue shopping on SAQ.com while taking advantage of the invaluable advice of their product expert.
Along the same lines, to facilitate access to its expanded online offer, last fall the company extended its Click, Purchase, Pick Up (CPP) service to 94 additional stores. The service allows customers to buy their products online and have them delivered to the store of their choosing. At fiscal year-end, all SAQ stores offered the CPP service with the exception of Express, Dépôt and Cash-and-Carry stores, forming a total of 361 pick-up points. In fiscal 2016-2017, 90% of sales on SAQ.com were delivered to stores.
SAQ INSPIRE: PERSONALIZED AND EXCLUSIVE OFFERSLast September, the company improved the SAQ Inspire experience by personalizing it even further. Based on members’ purchase history and profile, the Inspire newsletter brings them offers geared to their tastes and preferences. In all, 1.5 million customers received a weekly personalized offer that featured one or more of the some 900 target products. In the last six months, more than a third of active Inspire members took advantage of at least one of the offers that had been sent to them, saving an average of $2.10 per bottle purchased.
In addition, the SAQ built on the special relationship it has developed with customers by inviting them, based on their purchase profile, to theme events held in its stores. Customers were able to be part of an experience where they could discover new products in a friendly setting.
The SAQ also upgraded its mobile app by making it possible to download the member’s Inspire card. In the first 10 days following the upgrade’s release, more than 16,000 cards were downloaded onto members’ telephones, a number that grew to 255,000 by March 25, 2017. The company also updated its app to enable customers to see their exclusive offers, points balance and equivalent dollar value.
During the last fiscal year, no fewer than 929,000 unique users downloaded the company’s app onto their mobile device.
At March 25, 2017, SAQ Inspire had more than 1.9 million members. Members earned some 1,500 points a month on average, and 38% of them redeemed their points at least once during the preceding year. Inspire members said they were satisfied with the experience and generally found the exclusive offers they receive to be both adapted to their tastes (88%) and generous (81%).
QUEBEC PRODUCTS: WE LIKE! Because SAQ customers are developing a taste for Quebec products and an interest in buying local, sales of products from the province grew significantly. In terms of volume, Quebec wines experienced growth of 6%, reaching more than 400,000 litres, while cider sales rose 11% to nearly 460,000 litres. For their part, spirits sales increased 20% to end the fiscal year at 755,000 litres. All told, the Origine Québec category recorded sales of nearly 1.8 million litres.
This renewed interest in local products was partly spurred by promoting ready-to-drink ciders, introducing Boréale’s SAQ-exclusive Polaire beer and expanding the availability of Quebec wines to all the company’s stores. Customers’ curiosity was also piqued by holding two in-store Inspire events dedicated to Quebec products, offering local products in tailored SAQ Inspire promotions and organizing a Signature evening in collaboration with two Quebec winemakers.
In 2016-2017, the Société des alcools du Québec continued working closely with the industry to ensure the growth and long-term viability of the Origine Québec catalogue. For example, the company spotlighted Quebec certified wines and the new protected geographical indication (PGI) for ice wines. As a result, customers had access to a broad range of Quebec wines they already enjoy and to sound advice for discovering new ones.
SAQ ANNUAL REPORT 2017 – REVIEW OF ACTIVITIES
1.8 million litres
sold
28 million visits
929,000 unique users
downloaded the app

10
The same desire to help satisfy customers’ curiosity and the same conviction as to the importance of promoting Canadian wines also prompted the SAQ to launch a completely new section devoted to the wines on SAQ.com. Customers can now easily find a wide range of quality products from Quebec, Ontario and British Columbia.
LOWER PRICES The SAQ pays attention to customers’ comments regarding the pricing of its products. Last fiscal year, customers benefited from three successive price reductions totalling $1.40 on 1,600 of the most popular wines as well as a reduction of around 15% on the price of coolers. This was in addition to an earlier round of price reductions on champagnes, coolers and wines sold in 1.5 litre containers.
These reductions are part of a process aimed at improving the customer experience. Another example came in January, when the SAQ featured a super value offer of three 750 ml wines priced at under $7.
Yet another example of the company’s response to customers’ expectations regarding products with an excellent quality-price ratio was the introduction of a Value Picks zone, which features an assortment of quality wines priced under $12. Easily found in stores and online, the new zone clearly identifies the most affordable bottles.
TAILORED ADVISORY SERVICE Customers’ satisfaction and enthusiasm for discovery are closely tied to the relevance of the advice they receive in SAQ stores. To further support its in-store personnel, the SAQ has developed the necessary tools for providing tailored support. Since September, customers have been encouraged to share their Inspire card with their advisor. This enables the employees to make suggestions that are more informed and better geared to the customer’s tastes and to make it easier for customers to find products they have previously purchased and enjoyed.
Because employee training remains the key to its success, the SAQ continued to offer courses to its in-store employees. Taking the form of field trips to Quebec cider mills and wineries, classroom activities and online courses, the training provided by the company enabled its employees to learn more about the wide variety of products sold at its various points of sale. Nearly 3,000 employees received training on Quebec products (wines and ciders) and Spanish wines at five lecture-tastings and on products from New World countries (South Africa, New Zealand and Australia) through online training.
HOW CAN I HELP YOU? Assisting its customers is one of the SAQ’s commitments. Accordingly, it strives to quickly reply to the questions it is asked and the comments it receives. Last fiscal year, its Customer Relations Centre handled more than 213,000 information requests and comments, mostly received by telephone (85%). The subject sparking the largest interaction with customers was undoubtedly SAQ Inspire. Customer Relations Centre employees helped customers register for the program and complete their Inspire profiles and provided them with relevant information.
3,000 employees receiving
product training
213,000 requests
for information
$1.40 in price reductions on1,600 popular wines
SAQ ANNUAL REPORT 2017 – REVIEW OF ACTIVITIES

11
94% customer satisfaction rate
AN APPRECIATED EXPERIENCE Surveys show that the Société des alcools du Québec is much appreciated by its customers. Specifically, during the last fiscal year, more than 200,000 customers answered an ongoing survey on their overall level of satisfaction. The score, which held steady throughout the year, reached a record 94%. This high satisfaction level was corroborated by the Wow Customer Experience Index unveiled by the Leger firm in November. In the survey, 18,000 Quebecers expressed their opinion on product quality, ambience and service at various companies, among other things. The SAQ ranked ninth out of the 173 most appreciated retailers in Quebec.
PROMO CAMPAIGN: REMARKABLE AND REMARKED ONAt the very least, one can say that the promotional campaign to launch the personalization of the SAQ Inspire experience did not pass unnoticed. Comprised of two television commercials and billboard advertisements, it generated considerable buzz. The SAQ received the silver prize in the Direct Engagement – Consumer Products – Food & Beverage category awarded by the Canadian Marketing Association, the gold and silver prizes in the Best Use of Design and Best Launch categories awarded as part of Strategy magazine’s 2016 Promo Awards and the Best B2C Campaign and Public, Telecommunication and IT prizes awarded by the Association du marketing relationnel.
The company also won two prizes in Infopresse’s 2016 Boomerang contest, which recognized and presented awards for the personalization work that now allows the SAQ to deliver targeted content and exclusive offers to its customers.
SAQ ANNUAL REPORT 2017 – REVIEW OF ACTIVITIES

12
The Société des alcools du Québec made fiscal 2016-2017 a turning point in the transformation it had been working on for some time. Building on the multi-year effort to lower its operating expenses, the company implemented a set of measures aimed at improving its business practices and making it an even better performing company.
As a result, the SAQ reported sales of $3.123 billion at fiscal year-end, an increase of more than $49 million or 1.6% from the preceding fiscal year. This generated a profit of $1.086 billion, a 1.8% increase, which will be paid to the Quebec government in the form of a dividend. All told, adding in the amounts collected as sales taxes and the specific tax, the SAQ will remit a total of $1.715 billion to the Quebec government. For its part, the Canadian government will receive $417.2 million. That the SAQ achieved such results was due to the more than 60 million transactions combined with strict control of costs. Expressed as a percentage of sales, net expenses showed improvement, going from 18.6% to 18.2%1, while net earnings as a percentage of sales reached 34.8%. In addition, on December 23, 2016, consumer sales reached $40.5 million, breaking the old record, set on December 23, 2011, by $5.8 million. There results speak volumes about the organization’s constant focus on increasing its efficiency and are not unrelated to the optimization efforts undertaken in recent months.
This goal also led the SAQ to streamline its administrative structure twice in fiscal 2016-2017. Followed by an internal restructuring, the rationalization aimed to achieve a level of efficiency comparable to that found in the retail industry while continuing to provide high-quality service to customers and maintaining the company’s financial commitments to its shareholder.
SOUND MANAGE- MENT
SAQ ANNUAL REPORT 2017 – REVIEW OF ACTIVITIES
18.2% Net expenses as apercentage of sales
1. Excluding restructuring costs and the effect of the price reductions, this figure would have dropped below the 18% threshold to 17.8%.
13
SUPPLY CHAIN: INCREASINGLY EFFICIENT Increased sales also mean increased inventory operations. In fiscal 2016-2017, the SAQ took delivery of more than 21.4 million cases of wines, beers and spirits—up 1.4% from the preceding year—which it distributed throughout its sales networks (SAQ stores, specialized centres and wholesale grocers). Due to the continuous improvement of its processes and procedures, the company succeeded in improving its cases-per-hour ratio by 1.6% even as it limited the cost-per-case increase to 0.3%.
The SAQ also instituted an international standard, instructing its suppliers which type and size of pallet to use. Receiving part of its shipments on this type of pallet and delivering the pallets directly to its distribution centres contributed to its 2.5% improvement in inventory turnover. Besides increasing the productivity of its unloading processes, these procedures make its operations more fluid while maintaining an excellent customer service ratio.
In-store inventory management also improved due to the upgrading of the systems and tools in place. Over the last year, these changes have reduced the inventory weeks by 4.3%.
CATEGORY MANAGEMENTWith an eye to constantly improving performance and continuing to offer its customers products in line with their expectations, the SAQ, in collaboration with the industry, implemented a new approach for fast-tracking the introduction of new high-potential wines. The more flexible approach, which is based on sharing the inventory management risks, involves testing customers’ interest in a product in 40 SAQ stores for about six months before deciding whether to offer the product across the network. The new initiative means that products customers enjoy will find their way into stores faster, while ones that are less appreciated will simply be dropped from the supply chain.
QUALITY CONTROL: A PRIORITY Because the quality and integrity of the products that it sells are of paramount importance, the SAQ replaced the activity management systems used for its laboratory and the beverage alcohol products it receives with an integrated management software package that uses random or targeted sampling. As a result, products become available sooner after receipt, increasing the flexibility of the company’s operations and assuring customers of a high level of quality. In fiscal 2016-2017, the laboratory processed more than 76,000 product samples to certify their quality.
2.5% improvement in
inventory turnover
SAQ ANNUAL REPORT 2017 – REVIEW OF ACTIVITIES
76,000 samples tested

14 SAQ ANNUAL REPORT 2017 – REVIEW OF ACTIVITIES
INSPIRED AND INSPIRING EMPLOYEES Each year, to highlight the work of employees who excel and make a notable contribution to the attainment of the company’s objectives, the SAQ holds the Millésimes recognition activity. In fiscal 2016-2017, 71 individuals and one team were recognized for their enthusiasm, innovative ideas and exceptional contribution.
In addition, to continue developing its employees and rallying them around the company’s objectives, the SAQ offered three leadership paths to 132 managers. Topics related to current challenges, such as team commitment and influence leadership in a context of change, were covered.
A NEW FIVE-YEAR AGREEMENT A new five-year collective agreement between the Syndicat des travailleurs et travailleuses de la SAQ (STTSAQ) and the company was reached in November 2016. The agreement allows for greater organizational flexibility while continuing to provide excellent working conditions to the employees concerned.
SAFETY FIRSTEmployee occupational health and safety (OHS) is a major concern for the SAQ, which is why it has made OHS a priority throughout the organization in recent years. Six key prevention practices were introduced in its sales network in fiscal 2016-2017. Employees received training on the practices and their adoption was encouraged by the OHS representatives in each of the company’s stores. The results of these practices were tracked quarterly by the managers, who concluded they were worthwhile. Among the beneficial effects was the reduction of accident frequency by more than 12% compared with fiscal 2015-2016.
For their part, the employees of the distribution centres and the Real Estate and Maintenance Operations (REMO) Department took part in a large-scale awareness raising project and attended many prevention training courses. In combination with the actions taken in response to accident events and with various OHS observations, the prevention project produced convincing results: no accident-related lost time event has been recorded in the Quebec City REMO department in the last three years and a reduction in lost time events in all other sectors was also noted.
15
The SAQ released its 2016-2018 Sustainable Action Plan in March 2016. Guided by the desire to maintain its leadership in social responsibility, the company committed in the plan to continuing its community-building actions while also paying special attention to energy efficiency and the reduction of greenhouse gas emissions. In publishing the plan, the SAQ ensures that its approach will be consistent with the Quebec government’s sustainable development plan and its actions will be aligned with the issues and goals of the Government Sustainable Development Strategy 2015-2020.
THE IMPORTANCE OF SHARING For the SAQ, sharing remains the best way to build and develop society. That is why the government corporation is actively involved in the community. In fiscal 2016-2017, through its donation and sponsorship program, the SAQ invested the equivalent of $6.5 million in 330 organizations and some 70 fairs and festivals. It also donated $359,000, half of which came from its employees, to Entraide, an umbrella organization that assists people in vulnerable situations in Quebec.
Believing it is important to stimulate enthusiasm, the SAQ takes part in the major events of the Quebec wine industry, including Montréal Passion Vin (for the benefit of the Hôpital Maisonneuve-Rosemont Foundation), the Grande Dégustation de Montréal and the Fête des vins du Québec. The SAQ also believes in the importance of encouraging the next generation of wine stewards, which is why it contributes to their training and ongoing development by supporting the Institut de tourisme et d’hôtellerie du Québec (ITHQ) and the Canadian Association of Professional Sommeliers (CAPS). Along the same lines, the SAQ assisted Élyse Lambert in her preparations for taking part in the 15th edition of the World's Best Sommelier Competition organized by the Association de la sommellerie internationale (ASI) and held in Mendoza, Argentina. At the end of a series of practical and theoretical exams and blind tastings, the Quebec sommelier, who had already earned the title of Best Sommelier of Canada 2015, came in fifth place.
SUSTAINABLE DEVELOP-MENT
$705,456 in assistance
SAQ ANNUAL REPORT 2017 – REVIEW OF ACTIVITIES
16 SAQ ANNUAL REPORT 2017 – REVIEW OF ACTIVITIES
NEARLY $1 MILLION FOR FOOD ASSISTANCE A proud partner of Food Banks of Quebec (FBQ) for six years now, the SAQ held its traditional Generous Wines campaign in its stores from May 27 to 29, 2016. For each bottle of white wine sold during the weekend, the company donated one dollar to the FBQ. Customers’ participation in the campaign, including individual donations made at the checkout counter, enabled the SAQ to give a record $705,456 to the organization in 2016-2017, up nearly 17% from the preceding year.
Intent on being a partner that is truly present for the food bank network, the SAQ supported eight fundraiser evenings organized by Moissons organizations across Quebec and began selling, for their benefit, gift boxes in its stores. These new measures allowed it to donate an additional amount totalling more than $70,000 to the cause.
In fiscal 2016-2017, the SAQ also renewed its support of La Tablée des Chefs by contributing to the Semaine des écoles hôtelières du Québec for the seventh year running. The participation of more than 700 students from 15 hotel schools along with the SAQ’s financial contribution made it possible to distribute 100,000 servings of food through the FBQ network to needy persons across Quebec.
Aiming to make a real difference in its community, the SAQ allowed Y’a Quelqu’un l’Aut’Bord du Mur to use a parcel of land located across from its Montreal distribution centre so the community organization could turn it into a kitchen garden. The organization eventually harvested some 602 kilograms of fruits and vegetables, part of which was sold at low cost to residents of the area, which is considered a food desert. The remainder was donated to the Groupe d’entraide de Mercier-Ouest, which works in food security.
Launched last year, the urban beekeeping project run by the SAQ in cooperation with the Alvéole organization and aimed at countering the decline in bee populations was renewed in 2016-2017.
As part of the project, the SAQ installed hives on the roof of its Pied-du-Courant head office, on land alongside its Tellier Street offices in Montreal and on the roof of its Jean Talon Market store. By season’s end, 200 jars of honey produced by the project’s hives had been collected. The jars were sold to SAQ employees and the funds raised were split, with half being donated to the FBQ and the other half to Entraide.
SALES ETHIC Aware of the special nature of the products it sells and the role of model citizen it is called on to play in the community, the Société des alcools du Québec makes every effort to sell its products responsibly. It has therefore implemented a strict sales ethic and refuses to sell beverage alcohol to minors, the obviously inebriated or persons attempting to purchase products on their behalf. To ensure its employees adhere to this sales ethic, the SAQ provides training to new hires, refresher training to store employees and support to store managers so they can be good guides in the process.
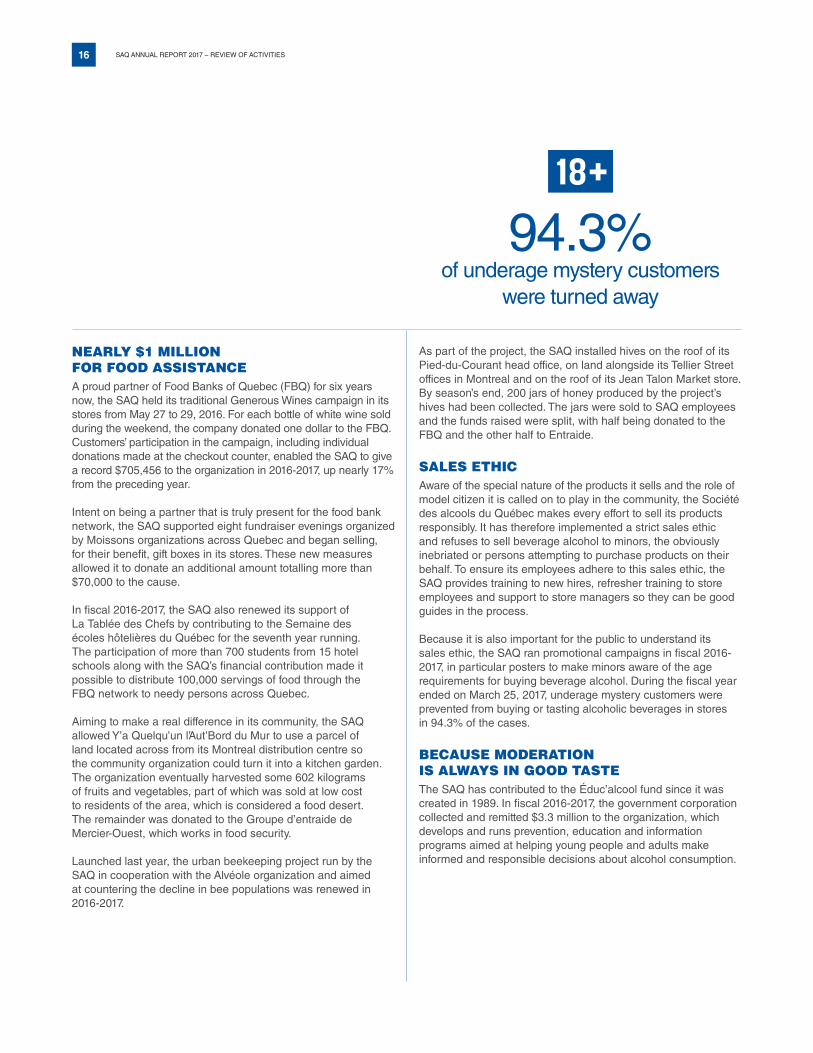
Because it is also important for the public to understand its sales ethic, the SAQ ran promotional campaigns in fiscal 2016-2017, in particular posters to make minors aware of the age requirements for buying beverage alcohol. During the fiscal year ended on March 25, 2017, underage mystery customers were prevented from buying or tasting alcoholic beverages in stores in 94.3% of the cases.
BECAUSE MODERATION IS ALWAYS IN GOOD TASTEThe SAQ has contributed to the Éduc’alcool fund since it was created in 1989. In fiscal 2016-2017, the government corporation collected and remitted $3.3 million to the organization, which develops and runs prevention, education and information programs aimed at helping young people and adults make informed and responsible decisions about alcohol consumption.
94.3% of underage mystery customers
were turned away
17
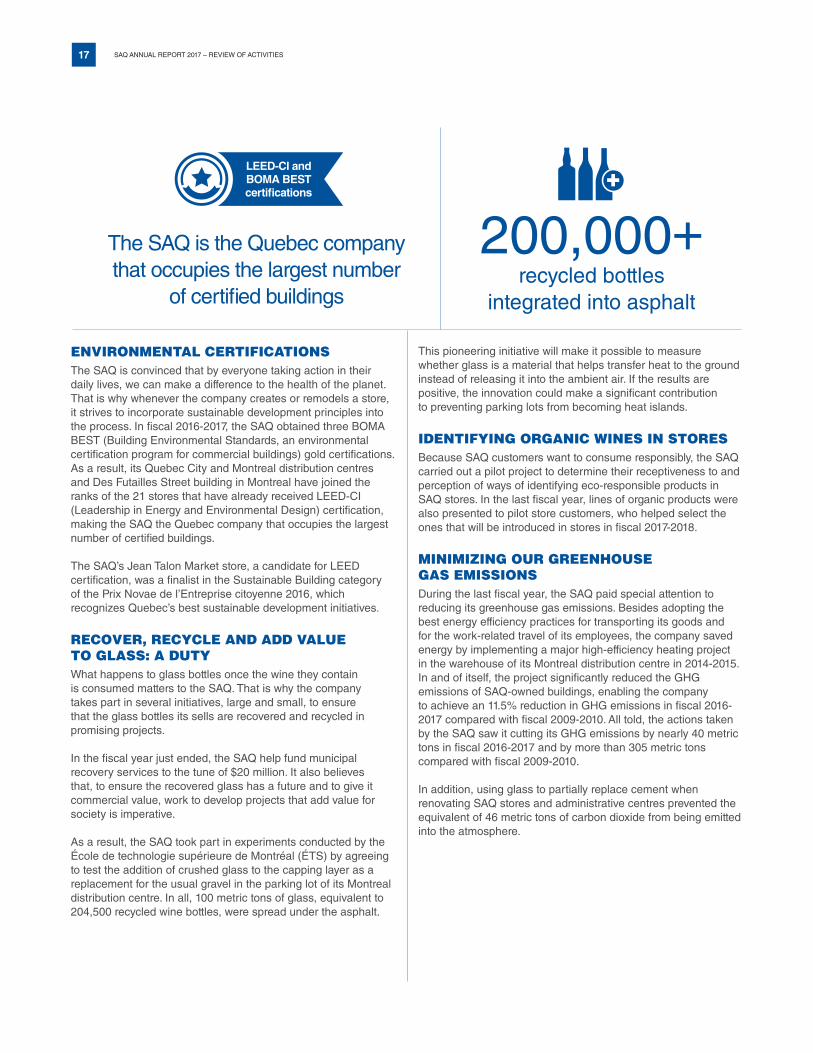
The SAQ is the Quebec company that occupies the largest number
of certified buildings
200,000+ recycled bottles
integrated into asphalt
ENVIRONMENTAL CERTIFICATIONS The SAQ is convinced that by everyone taking action in their daily lives, we can make a difference to the health of the planet. That is why whenever the company creates or remodels a store, it strives to incorporate sustainable development principles into the process. In fiscal 2016-2017, the SAQ obtained three BOMA BEST (Building Environmental Standards, an environmental certification program for commercial buildings) gold certifications. As a result, its Quebec City and Montreal distribution centres and Des Futailles Street building in Montreal have joined the ranks of the 21 stores that have already received LEED-CI (Leadership in Energy and Environmental Design) certification, making the SAQ the Quebec company that occupies the largest number of certified buildings.
The SAQ’s Jean Talon Market store, a candidate for LEED certification, was a finalist in the Sustainable Building category of the Prix Novae de l’Entreprise citoyenne 2016, which recognizes Quebec’s best sustainable development initiatives.
RECOVER, RECYCLE AND ADD VALUE TO GLASS: A DUTYWhat happens to glass bottles once the wine they contain is consumed matters to the SAQ. That is why the company takes part in several initiatives, large and small, to ensure that the glass bottles its sells are recovered and recycled in promising projects.
In the fiscal year just ended, the SAQ help fund municipal recovery services to the tune of $20 million. It also believes that, to ensure the recovered glass has a future and to give it commercial value, work to develop projects that add value for society is imperative.
As a result, the SAQ took part in experiments conducted by the École de technologie supérieure de Montréal (ÉTS) by agreeing to test the addition of crushed glass to the capping layer as a replacement for the usual gravel in the parking lot of its Montreal distribution centre. In all, 100 metric tons of glass, equivalent to 204,500 recycled wine bottles, were spread under the asphalt.
This pioneering initiative will make it possible to measure whether glass is a material that helps transfer heat to the ground instead of releasing it into the ambient air. If the results are positive, the innovation could make a significant contribution to preventing parking lots from becoming heat islands.
IDENTIFYING ORGANIC WINES IN STORESBecause SAQ customers want to consume responsibly, the SAQ carried out a pilot project to determine their receptiveness to and perception of ways of identifying eco-responsible products in SAQ stores. In the last fiscal year, lines of organic products were also presented to pilot store customers, who helped select the ones that will be introduced in stores in fiscal 2017-2018.
MINIMIZING OUR GREENHOUSE GAS EMISSIONSDuring the last fiscal year, the SAQ paid special attention to reducing its greenhouse gas emissions. Besides adopting the best energy efficiency practices for transporting its goods and for the work-related travel of its employees, the company saved energy by implementing a major high-efficiency heating project in the warehouse of its Montreal distribution centre in 2014-2015. In and of itself, the project significantly reduced the GHG emissions of SAQ-owned buildings, enabling the company to achieve an 11.5% reduction in GHG emissions in fiscal 2016-2017 compared with fiscal 2009-2010. All told, the actions taken by the SAQ saw it cutting its GHG emissions by nearly 40 metric tons in fiscal 2016-2017 and by more than 305 metric tons compared with fiscal 2009-2010.
In addition, using glass to partially replace cement when renovating SAQ stores and administrative centres prevented the equivalent of 46 metric tons of carbon dioxide from being emitted into the atmosphere.
SAQ ANNUAL REPORT 2017 – REVIEW OF ACTIVITIES
LEED-CI and BOMA BESTcertifications
18 SAQ ANNUAL REPORT 2017
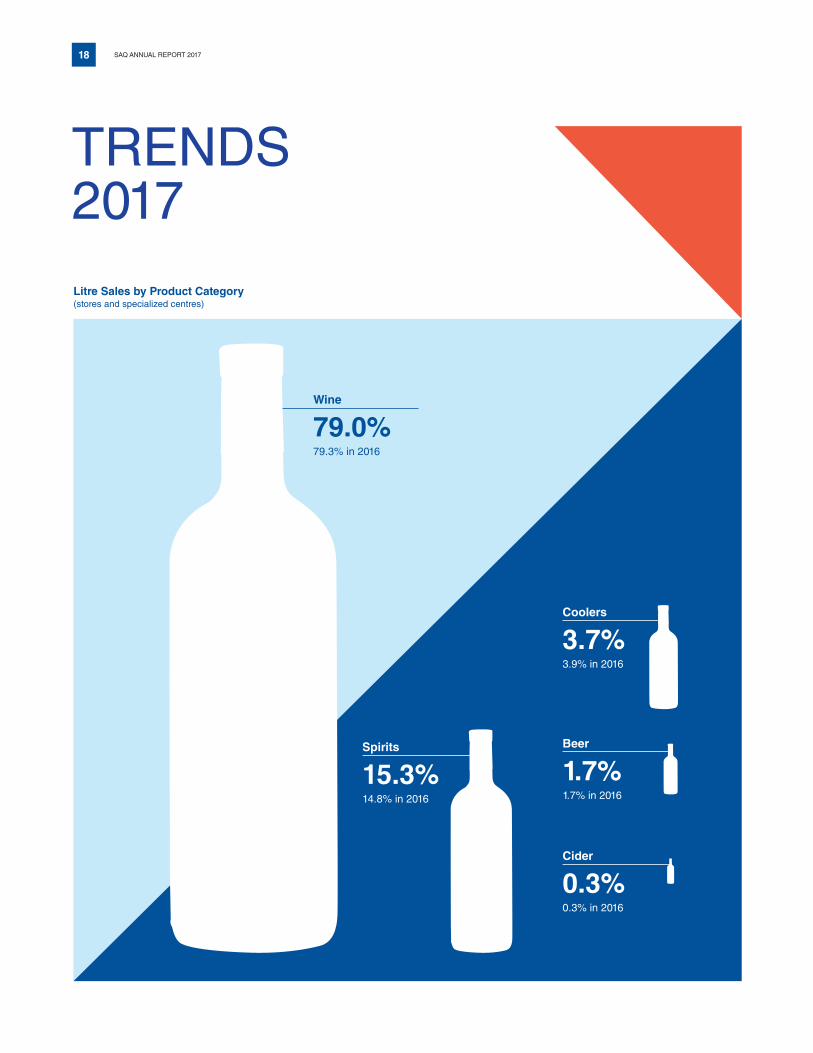
TRENDS 2017
Wine
79.0%79.3% in 2016
Spirits
15.3%14.8% in 2016
Beer
1.7%1.7% in 2016
Litre Sales by Product Category (stores and specialized centres)
Cider
0.3%0.3% in 2016
Coolers
3.7%3.9% in 2016
19 SAQ ANNUAL REPORT 2017 – TRENDS
ENTHUSIASTIC ABOUT WINE, CURIOUS ABOUT SPIRITS Quebecers like wine, be it red, white or rosé. And if proof be needed, during the most recent fiscal year, wine accounted for 79% of the SAQ’s litre sales.
Big fans of the products of the vine, Quebecers continued discovering and exploring the world of wine, especially white wines. In fiscal 2016-2017, litre sales of white wines grew yet again, a trend that has been ongoing for several years now. Fresh and light, white wines continue to seduce!
Litre Sales of Still Wines by Colour (stores and specialized centres)
2017 2016
Red 63.9 % 65.8 %
White 31.6 % 29.6 %
Rosé 4.5 % 4.6 %
Of all product categories, it is spirits—gin, whisky and company—along with champagnes and sparkling wines that experienced the largest sales growth in fiscal 2016-2017. What’s more, customers are increasingly seeking out artisanal products, such as spirits from local microdistilleries.
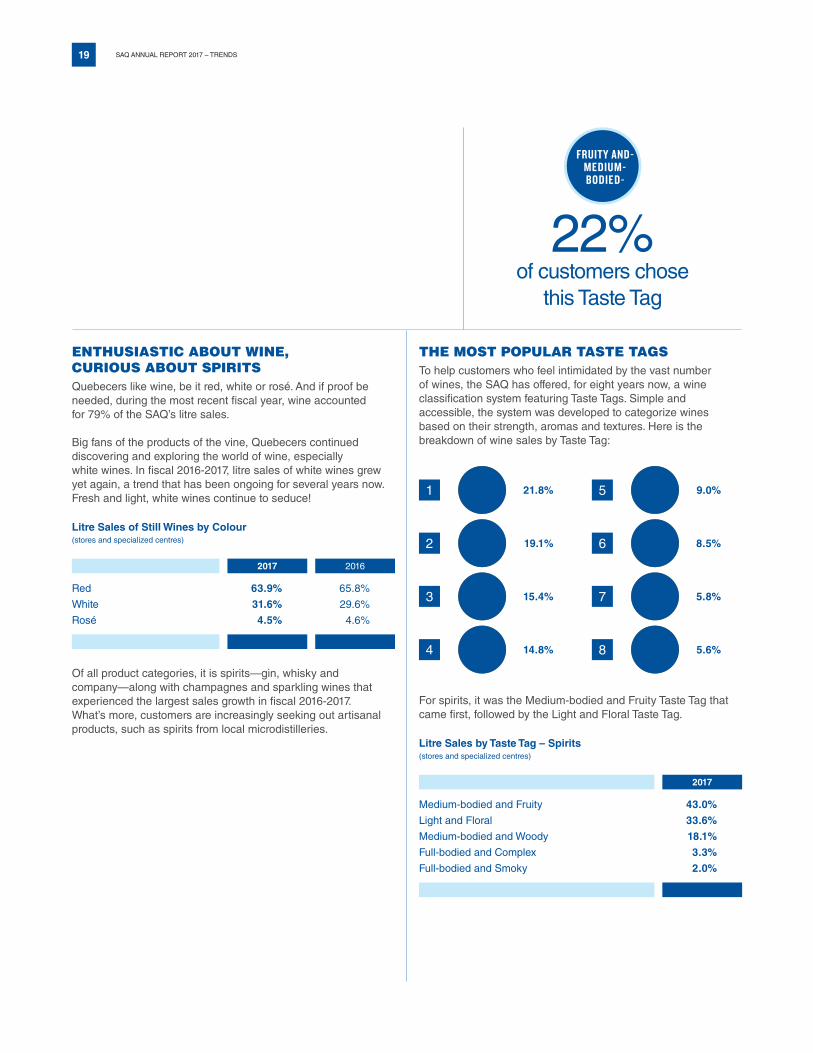
THE MOST POPULAR TASTE TAGSTo help customers who feel intimidated by the vast number of wines, the SAQ has offered, for eight years now, a wine classification system featuring Taste Tags. Simple and accessible, the system was developed to categorize wines based on their strength, aromas and textures. Here is the breakdown of wine sales by Taste Tag:
1 21.8 % 5 9.0 %
2 19.1 % 6 8.5 %
3 15.4 % 7 5.8 %
4 14.8 % 8 5.6 %
For spirits, it was the Medium-bodied and Fruity Taste Tag that came first, followed by the Light and Floral Taste Tag.
Litre Sales by Taste Tag – Spirits(stores and specialized centres)
2017
Medium-bodied and Fruity 43.0 %
Light and Floral 33.6 %
Medium-bodied and Woody 18.1 %
Full-bodied and Complex 3.3 %
Full-bodied and Smoky 2.0 %
22% of customers chose
this Taste Tag

20 SAQ ANNUAL REPORT 2017 – TRENDS
Sales by Type of Spirits(in millions of litres) (stores and specialized centres)
Market Share
2017 2016 Change 2017 2016
Vodka 5.3 5.2 1.9 % 22.4 % 22.6 %
Liqueur 5.0 4.9 2.0 % 21.1 % 21.3 %
Rum 4.9 4.8 2.1 % 20.7 % 20.9 %
Whisky 3.4 3.2 6.3 % 14.3 % 13.9 %
Gin 2.6 2.4 8.3 % 11.0 % 10.4 %
Brandy 1.5 1.6 (6.3) % 6.3 % 7.0 %
Neutral alcohol 0.4 0.4 – % 1.7 % 1.7 %
Other spirits 0.6 0.5 20.0 % 2.5 % 2.2 %
Total 23.7 23.0 3.0 % 100.0 % 100.0 %
France and Italy dominate wine sales and remain Quebecers’ favourite source of fermented grape juice. Together, the two countries hold a 54% share of the province’s market. For its part, Chile is not only continuing the climb it began in 2016 but doing so with white and red wines. Across the Atlantic, South Africa achieved a sizeable increase in its market share, largely due to its white wines, while Portugal maintained its growth due to its red wines, whose quality-price ratio appeals to customers. Lastly, New Zealand also put in a good showing with its offer of white wines, in particular ones made from the Sauvignon Blanc grape variety.
SPIRITS: TOTALLY TRENDYThis year, the spirits category recorded a 3% growth in its volume sales. Customers are exploring the range of spirits on offer at the SAQ—from vodka to gin, not to mention rum and whisky—with great interest. This trend is also confirmed by Quebecers’ enthusiasm for local spirits, which are highly regarded both in Quebec and abroad. Cocktails and fine spirits are definitely hot!
Still Wines by Country of Origin (volume sales) (stores and specialized centres)
Market shareChange
in volume
2017 2017 vs. 2016
France 30 % (1.8) %
Italy 24 % 2.2 %
United States 12 % (9.6) %
Spain 8 % (0.5) %
Australia 6 % 0.4 %
Portugal 5 % 5.4 %
Chile 4 % 14.4 %
Argentina 3 % (8.3) %
South Africa 3 % 11.6 %
New Zealand 2 % 8.8 %
Other 3 % 7.1 %
30% of the wines sold at the SAQ
are French
≈24 million litres
sold
Spirits

21
FINANCE
SAQ ANNUAL REPORT 2017
22 SAQ ANNUAL REPORT 2017 – FINANCE
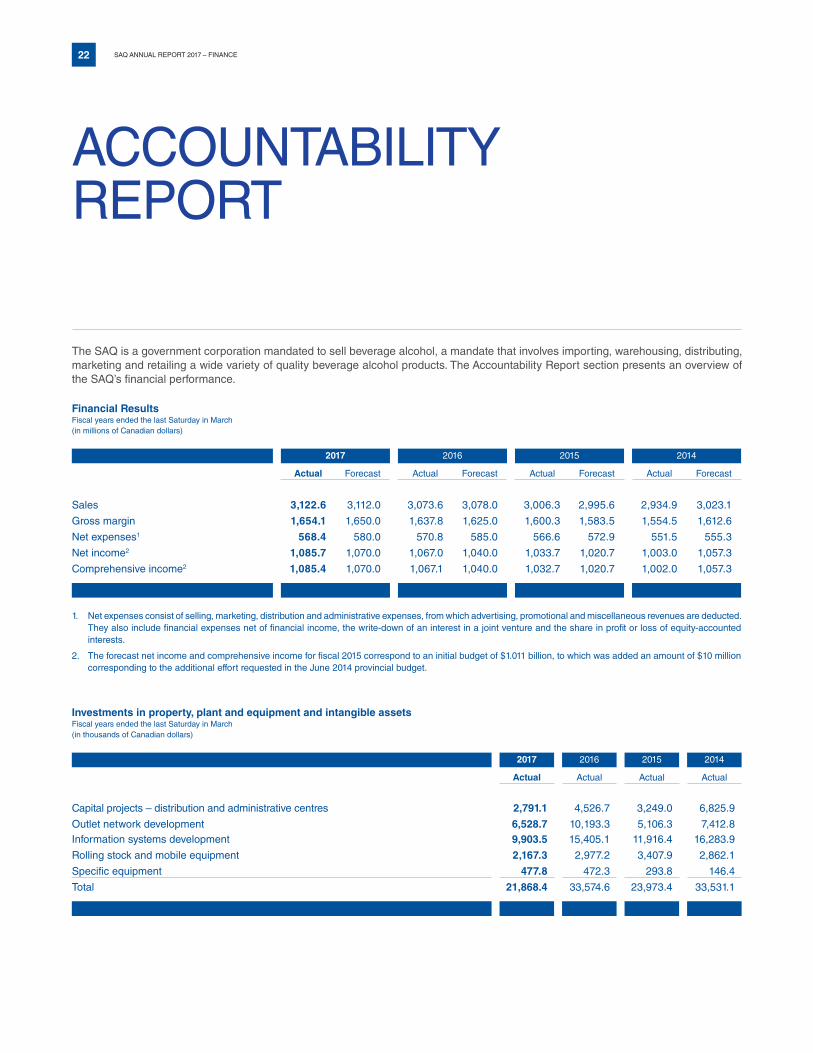
The SAQ is a government corporation mandated to sell beverage alcohol, a mandate that involves importing, warehousing, distributing, marketing and retailing a wide variety of quality beverage alcohol products. The Accountability Report section presents an overview of the SAQ’s financial performance.
Financial Results Fiscal years ended the last Saturday in March (in millions of Canadian dollars)
2017 2016 2015 2014
Actual Forecast Actual Forecast Actual Forecast Actual Forecast
Sales 3,122.6 3,112.0 3,073.6 3,078.0 3,006.3 2,995.6 2,934.9 3,023.1
Gross margin 1,654.1 1,650.0 1,637.8 1,625.0 1,600.3 1,583.5 1,554.5 1,612.6
Net expenses1 568.4 580.0 570.8 585.0 566.6 572.9 551.5 555.3
Net income2 1,085.7 1,070.0 1,067.0 1,040.0 1,033.7 1,020.7 1,003.0 1,057.3
Comprehensive income2 1,085.4 1,070.0 1,067.1 1,040.0 1,032.7 1,020.7 1,002.0 1,057.3
1. Net expenses consist of selling, marketing, distribution and administrative expenses, from which advertising, promotional and miscellaneous revenues are deducted. They also include financial expenses net of financial income, the write-down of an interest in a joint venture and the share in profit or loss of equity-accounted interests.
2. The forecast net income and comprehensive income for fiscal 2015 correspond to an initial budget of $1.011 billion, to which was added an amount of $10 million corresponding to the additional effort requested in the June 2014 provincial budget.
Investments in property, plant and equipment and intangible assets Fiscal years ended the last Saturday in March (in thousands of Canadian dollars)
2017 2016 2015 2014
Actual Actual Actual Actual
Capital projects – distribution and administrative centres 2,791.1 4,526.7 3,249.0 6,825.9
Outlet network development 6,528.7 10,193.3 5,106.3 7,412.8Information systems development 9,903.5 15,405.1 11,916.4 16,283.9
Rolling stock and mobile equipment 2,167.3 2,977.2 3,407.9 2,862.1
Specific equipment 477.8 472.3 293.8 146.4
Total 21,868.4 33,574.6 23,973.4 33,531.1
ACCOUNTABILITY REPORT

23 SAQ ANNUAL REPORT 2017 – FINANCE
Growth in customer traffic in stores2,3
(in thousands of transactions)2013 2014 2015 2016 2017Actual Actual Actual Actual Actual
Change (%) 0.9 (1.9) 0.3 2.1 (0.3)
Growth in average sales price per litre in stores2,4
(en dollars)2013 2014 2015 2016 2017Actual Actual Actual Actual Actual
Change (%) 1.6 3.1 2.0 0.7 0.2
1. Average expenditure by consumers (including sales taxes).
2. Consumers.
3. The decrease is attributable to the Easter holiday not falling in the 2016-2017 fiscal year.
4. Excluding sales taxes.
Certain comparative figures have been reclassified to conform to the current year’s presentation.
Management indicators for the last five fiscal years
COMMERCIAL DATA
Sales growth by volume(in thousands of litres)
2013 2014 2015 2016 2017Actual Actual Actual Actual Actual
Change (%) 1.2 (0.9) 1.7 1.8 1.0
Growth in average in-store purchase1
(in dollars)2013 2014 2015 2016 2017Actual Actual Actual Actual Actual
Change (%) 3.5 4.7 2.9 1.0 0.8
198,000196,100
192,700
189,400191,200
59,40059,600
58,40058,200
59,300
19.8519.8119.67
19.28
18.70
48.3547.9547.48
46.14
44.05
24 SAQ ANNUAL REPORT 2017 – FINANCE
This financial report reviews the operations of the Société des alcools du Québec (SAQ) for the fiscal year ended March 25, 2017, and its financial position at that date. It should be read in conjunction with the consolidated financial states and notes thereto, which will be found in the French-language version of the 2017 annual report. The information contained in this analysis includes all significant events that have occurred up to June 1, 2017.
OVERVIEW OF RESULTSFor the fiscal year ended March 25, 2017, the SAQ declared net income of $1.086 billion, an increase of $18.7 million or 1.8% compared with the preceding fiscal year, the entirety of which was remitted to its sole shareholder, the Quebec Minister of Finance. Government revenues from operations (in the form of federal duties, consumer taxes and dividends) increased $39.3 million to $2.132 billion.
SALESThe SAQ’s sales from all its sales and distribution networks totalled $3.123 billion, up $49 million or 1.6%. The corresponding volume sales rose 1.9 million litres or 1% to reach 198 million litres in fiscal 2016-2017. These results were achieved despite the Easter holiday not falling in the fiscal year—as opposed to the preceding fiscal year, which had two Easter holidays—and price reductions introduced in the third quarter on some 1,600 wines that account for the majority of in-store sales.
By sales networkThe performance achieved during the year was mainly driven by the store and specialized centre network, which recorded sales of $2.777 billion, an increase of $30.4 million or 1.1%. Volume sales for the network totalled 155.7 million litres, compared with 155.1 million litres in fiscal 2015-2016. Various retail initiatives contributed to this increase.
FINANCIAL REVIEW
Net income
$1.086billion 1.8%
25 SAQ ANNUAL REPORT 2017 – FINANCE
The average value of consumers’ in-store shopping cart was $48.35 as opposed to $47.95 in the preceding fiscal year. The average per-litre sales price in the SAQ network rose to $19.85 versus $19.81 in fiscal 2015-2016.
For their part, sales in the wholesale grocer network rose $18.6 million or 5.7% to $346 million. Volume sales in this network increased 1.3 million litres or 3.2% to 42.3 million litres.
By product categoryThe wine category recorded sales of $2.320 billion in fiscal 2016-2017, an increase of $19.2 million or 0.8%. Volume sales for the category grew 0.9 million litres or 0.6% to 163.8 million litres. More specifically, wine sales in the store and specialized centre network rose $3.2 million or 0.2%, doing so despite the reduced prices on some 1,600 wines that began being introduced in the third quarter. Volume sales in the network totalled 123.0 million litres, the same as in the preceding fiscal year.
Sold exclusively in the store and specialized centre network, spirits saw a notable increase of $29.2 million or 4.2% to reach $726.9 million. Volume sales for this category grew 0.7 million litres or 3% to 23.7 million litres. Retail initiatives taken in recent years to encourage consumers to discover and explore cocktails and fine spirits contributed to this category’s growth.
Lastly, sales in the beer, cider and cooler category rose $0.6 million or 0.8% to end the year at $75.6 million. The corresponding volume sales totalled 10.5 million litres, compared with 10.2 million litres for the preceding fiscal year, a 2.9% increase. The introduction of an exclusive, competitively priced beer and a reduction in the price of coolers are the main reasons for these results.
COST OF SALES AND GROSS MARGINCost of sales consists primarily of acquisition costs, the freight costs incurred to ship goods to the SAQ’s distribution centres and various points of sale and the related customs duties and excise taxes. In fiscal 2016-2017, the cost of sales stood at $1.468 billion, compared with $1.436 billion in the preceding fiscal year. The resulting gross margin totalled $1.654 billion versus $1.638 billion in fiscal 2015-2016, an increase of $16.3 million or 1%. In percentage terms, the gross margin was 53% in fiscal 2016-2017 as opposed to 53.3% in the preceding fiscal year. The reductions that began being introduced in the third quarter of the fiscal year on the sales prices of 1,600 wines and on products in the cooler category explain the decrease in the gross margin.
NET EXPENSESNet expenses consist of selling, marketing, distribution and administrative expenses, from which advertising, promotional and miscellaneous revenues are deducted. They also include financial expenses net of financial income, the write-down of an interest in a joint venture and the share in profit or loss of equity-accounted interests. In fiscal 2016-2017, net expenses totalled $568.4 million compared with $570.8 million in the preceding fiscal year, a $2.4 million or 0.4% decrease. Expressed as a percentage of sales, net expenses improved, falling to 18.2% as opposed to 18.6% in fiscal 2015-2016. On a comparative basis and excluding the effects of the price reductions and restructuring costs, this figure would have been 17.8% versus 18.5% in the preceding fiscal year. This result reflects the sustained effort made to improve the organization’s efficiency while continuing to provide its much-appreciated advisory service to customers.
Employee compensation, which is the SAQ’s largest net expense category, totalled $392.3 million versus $388.2 million in fiscal 2015-2016, a 1.1% increase. The difference is due mainly to the restructuring costs resulting from the company’s optimization initiatives and was partly offset by the decrease in the payroll expense achieved in recent years.
Sales
$3.123billion 1.6%

26 SAQ ANNUAL REPORT 2017 – FINANCE
Building occupancy expenses, including the related amortization, constitute the second largest net expense category. In fiscal 2016-2017, these rose 0.8% from $97.8 million to $98.6 million. Retail sector rent increases largely account for this increase. Initiatives taken in recent years to optimize the company’s retail, administrative and distribution spaces have allowed the growth of this expense to be controlled.
The constant effort to improve efficiency enabled the company to reduce advertising and promotion costs by $7.6 million and professional fees by $4.2 million. On the other hand, expenses related to selective collection—which is handled by Éco Entreprises Québec, which sets the rates and collects fees from businesses to fund municipal selective collection services in Quebec—rose $4.8 million or 31.6%.
NET INCOME AND COMPREHENSIVE INCOMEThe SAQ’s net income totalled $1.086 billion in the fiscal year ended March 25, 2017, an $18.7 million or 1.8% increase from the preceding fiscal year. Expressed as a percentage of sales, net income was 34.8% compared with 34.7% in fiscal 2015-2016.
Comprehensive income rose $18.3 million to end the fiscal year at $1.085 billion.
GOVERNMENT REVENUESAs a government corporation, the SAQ pays substantial amounts to both levels of government in the form of consumer taxes, federal taxes and duties and its net income from operations. In fiscal 2016-2017, government revenues from operations totalled $2.132 billion, up $39.3 million or 1.9% from the preceding fiscal year.
The amounts paid to the Quebec Treasury rose by $27.6 million or 1.6% to $1.715 billion. This change is attributable to an $18.7 million increase in the declared dividend and to an $8.9 million rise in consumption taxes (provincial sales taxes and the specific tax on alcoholic beverages), which was related to higher sales.
The amounts remitted to the government of Canada totalled $417.2 million, an $11.7 million increase. This change can be explained by the higher amount of goods and services taxes collected due to higher sales and by the larger remittances of excise taxes and customs duties stemming from the increase in procurement and distribution volumes.
In the last five years, the SAQ’s business activities have generated government revenues of nearly $10.155 billion, $8.163 billion of which was remitted to the Quebec government.
Government revenues from operations(in millions of dollars)
2017 2016
Government of QuebecDeclared dividend 1,085.7 1,067.0 Provincial sales tax 357.2 350.8 Specific tax 245.5 243.5 Specific permit holder tax 26.8 26.3
1,715.2 1,687.6 Government of CanadaExcise taxes and customs duties 238.1 229.6 Goods and services tax 179.1 175.9
417.2 405.5 Total 2,132.4 2,093.1
Government revenues
$2.132
billion 1.9%
Net margin
34.8%

27 SAQ ANNUAL REPORT 2017 – FINANCE
INTEREST IN A JOINT VENTUREThe SAQ holds a 50% interest in Société d’investissement M.-S., Limited Partnership (L.P.). This Quebec-incorporated company was created to establish a business-to-business cybermarket providing an integrated solution for purchasing and selling wine. The SAQ’s share of the joint venture is shown separately in the consolidated statement of financial position.
INVESTMENTSInvestments in capital assets totalled nearly $21.9 million in fiscal 2016-2017. The SAQ invested $9.3 million in the program to modernize its store network and distribution and administrative centres. A total of $9.9 million was committed to developing new information systems in order to increase the operational efficiency of the distribution centres and offer customers a more personalized shopping experience across its store network, SAQ.com and mobility channels. Lastly, replacing and upgrading rolling stock mobile equipment and specific equipment required an investment of $2.7 million.
FINANCIAL POSITIONAs at March 25, 2017, the SAQ had total assets of $827.7 million, compared with $779.8 million as at March 26, 2016, an increase of $47.9 million. The value of inventories increased $33.5 million to $358.9 million; the increase is due mainly to the adoption of a new accounting presentation that includes the pipeline stock at fiscal year-end in the value reported in the statement of financial position. As at March 25, 2017, the SAQ held a $30 million investment compared to none in the preceding fiscal year. Deposits and prepaid expenses as well as accounts receivable and other receivables rose $7.9 million and $7.8 million respectively. Cash and cash equivalents decreased $13.8 million to end the year at $132.2 million. For their part, long-lived assets decreased $17.5 million.
At fiscal year-end, current liabilities totalled $754.1 million, compared with $702.1 million at March 26. 2016, an increase of $52 million. The change is attributable to the $78.1 million increase in accounts payable and other payables, which was partially offset by an $11.3 million decrease in the dividend payable, a $10.9 million reduction in reserves and a $3.9 million decrease in government taxes and duties payable. Long-term liabilities decreased $3.9 million to $32.4 million at fiscal year-end.
As at March 24, 2017, working capital achieved a ratio of 0.80 as opposed to 0.77 at the end of the preceding fiscal year.
The SAQ’s financial position remained solid throughout the fiscal year. The company showed discipline in its management, reporting in its financial statements significant internally generated funds and an improvement in inventory turnover and working capital.
CASH FLOWSThe SAQ’s activities consumed cash and cash equivalents of $13.8 million in fiscal 2016-2017, whereas cash and cash equivalents of $85.7 million were generated in the preceding fiscal year.
The cash flows related to operating activities decreased $19.4 million from the preceding fiscal year to stand at $1.138 billion. This decrease stems mainly from the nearly $35 million decrease in the net change in non-cash working capital items, the $1.5 million in claims paid under the sick leave credits program and the $0.6 million decrease in items not affecting cash, offset by the $18.7 million increase in net income.
Total assets
$827.7
million 6.1%
28 SAQ ANNUAL REPORT 2017 – FINANCE
The company’s investment activities required a cash outflow of $54.6 million during the fiscal year, a $21.8 million increase. This difference is due mainly to the acquisition of a $30 million investment partially offset by an $8.5 million decrease in acquisitions of tangible capital assets.
Financing activities required $1.097 billion in cash in fiscal 2016-2017, compared with $1.039 billion in the preceding fiscal year. This change is explained by the $58.3 million increase in the dividend distributed to the shareholder.
As at March 25, 2017, the SAQ’s consolidated statement of cash flows showed a cash and cash equivalent balance of $132.2 million compared with $146 million at the end of the preceding fiscal year.
FINANCING OF OPERATIONSAs stated in note 19 of its consolidated financial statements, the company manages the financing of its operations within certain limits set by its Board of Directors and the Quebec government. As dividend advances are paid periodically to its shareholder, the Quebec Minister of Finance, the SAQ relies on external sources to finance its operations. In this regard, the company is authorized to take out short-term loans up to a maximum amount outstanding of $400 million. The company had no borrowings outstanding at March 25, 2017, or at March 26, 2016.
At fiscal year-end, the consolidated financial statements showed an investment of $30 million. The company had no investment at March 26, 2016.
Financing of the SAQ’s money market activities resulted in net financial charges of $0.8 million, compared with $0.4 million in the preceding fiscal year. The change is due partly to an increase in the average net surplus and partly to an increase in the average interest rate earned on the positive bank balances and investments in fiscal 2016-2017.
The net interest related to the liabilities and assets arising from employee benefit plans totalled $1.1 million in fiscal 2016-2017, the change from the preceding fiscal year being insignificant.
FUTURE STANDARDS, AMENDMENTS AND INTERPRETATIONSOn the date that publication of these consolidated financial statements was authorized, new standards, amendments and interpretations of existing standards had been published but were not yet in force. The SAQ did not early-adopt them but plans to adopt them as they come into force.
Note 4 to the consolidated financial statements provides information on the new standards, amendments and interpretations that are likely to be relevant to the SAQ’s consolidated financial statements. Other new standards and interpretations have been published but do not apply to the SAQ or will not have a significant impact on its consolidated financial statements.
DISCLOSURE CONTROLS AND PROCEDURESUnder the supervision of the President and Chief Executive Officer and of the Vice-President and Chief Financial Officer, the SAQ’s disclosure controls and procedures (DC&P) are designed to provide reasonable assurance that significant information about the SAQ is communicated to management in a timely manner.
An evaluation of the design and effectiveness of the DC&P was performed as at March 25, 2017, under the supervision and with the participation of management. Based on this evaluation, the President and Chief Executive Officer and the Vice-President and Chief Financial Officer concluded that the DC&P were adequately designed and operating effectively.
29 SAQ ANNUAL REPORT 2017 – FINANCE
INTERNAL CONTROL OVER FINANCIAL REPORTINGThe SAQ’s internal control over financial reporting is designed to provide reasonable assurance that the financial information is reliable and that the consolidated financial statements were prepared, for financial reporting purposes, in accordance with International Financial Reporting Standards (IFRS).
The SAQ’s management, including the President and Chief Executive Officer and the Vice-President and Chief Financial Officer, have evaluated the effectiveness of the internal controls over financial reporting (ICFR) using the framework and criteria set out in the Internal Control – Integrated Framework document issued by the Committee of Sponsoring Organizations (COSO 2013) of the Treadway Commission. Based on this evaluation, management concluded that, as at March 25, 2017, the ICFR are adequately designed and effective to provide reasonable assurance as to the reliability of the financial information and the presentation of the SAQ’s consolidated financial statements in accordance with IFRS.
RISKS AND UNCERTAINTIESIn the normal course of its business operations, the SAQ is exposed to various risks that could have an adverse impact on its net income, financial position or cash flows. The SAQ has implemented risk management governance throughout the organization to detect and rank risks so as to be able to put in place measures to minimize their impact.
Integrated into the SAQ’s day-to-day operations, risk management is a continuous, dynamic process designed to increase the organization’s effectiveness and flexibility with respect to the many challenges related to its business environment.
In addition to the financial risks described in Note 23 to the consolidated financial statements, the SAQ is exposed to business risks, the most significant of which are described below.
Economy, market and performanceBeverage alcohol sales are dependent on the strength of the Quebec economy and on consumers' disposable income, among other things. An extended economic slowdown in Quebec could have an adverse impact on the sale of products offered by the SAQ and, consequently, on its performance. The SAQ must also contend with demographic factors related to the market it serves. Due to the aging population, the growth in beverage alcohol sales could slow in coming years in Quebec. Moreover, the retail sector is constantly changing and consumers are increasingly targeted by a wide variety of offers of products and services.
To ensure its growth, the SAQ is always on the lookout for innovations that will help it optimize its ways of doing business and maintain its operational efficiency. It constantly studies consumer shopping habits and trends in order to adapt its business strategies and provide an integrated shopping experience aligned with customers’ needs.
Product quality controlWith a constantly refreshed catalogue of more than 13,200 products from 3,100 suppliers around the globe, the SAQ must ensure that an irreproachable level of quality is maintained in the products it sells. This it does through its ISO 17025-certified laboratory and ISO 9001 quality management. Several measures have also been implemented to ensure compliance with Health Canada regulations.
Information technologyAs part of its operations, the SAQ has warehouses and a large network of stores and specialized centres that rely on a vast information technology infrastructure. The continuity of the company’s operations could be interrupted in the event its information systems were unavailable for an extended period of time. In addition, the company is aware of the risks related to the security of its information systems.

30 SAQ ANNUAL REPORT 2017 – FINANCE
The SAQ has implemented robust controls and contingency plans to maintain the continuity of its operations and is constantly evaluating its protection measures to ensure the security and integrity of its data.
Social responsibilitySociety’s expectations of the SAQ are high with regard to its environmental, social and economic responsibilities. Failing to meet its obligations could expose the company to criticism, admonishments, demands and even lawsuits.
Social responsibility is one of the SAQ’s key concerns, as can be seen in its three-year strategic planning, which integrates its vision and commitment to sustainable development, in particular its efforts to develop new uses for and adding value to recovered glass.
The SAQ also plays an active role in community life by contributing to the economic and social well-being of Quebec society, be it through its Donation and Sponsorship Program, its Generous Wines campaign for the benefit of Food Banks of Quebec or its contribution—as well as that of its employees— to the Entraide fundraising campaign.
Lastly, the SAQ faces various claims and lawsuits. In management’s opinion, any settlement that might arise from these claims would not have a significant impact on the company’s financial position. Should the company be required to pay any amount as a result of these lawsuits, the amount would be expensed in the period in which it became payable.
OUTLOOKIn the coming fiscal year, to maintain its growth in a constantly changing business environment, the SAQ will continue developing its retail strategies to deliver to consumers an even more personalized shopping experience and an expanded offer across its store network and through its SAQ.com and mobile channels.
Continuous improvement of the organization’s performance and efficiency will remain a priority that, combined with sales growth, will enable the SAQ to move forward with its markup review process.
Management is confident that its business initiatives, personalized advisory service and commitment to maintaining its efficiency improvement efforts will see both sales and net income increase in the coming fiscal year.
31 SAQ ANNUAL REPORT 2017 – FINANCE
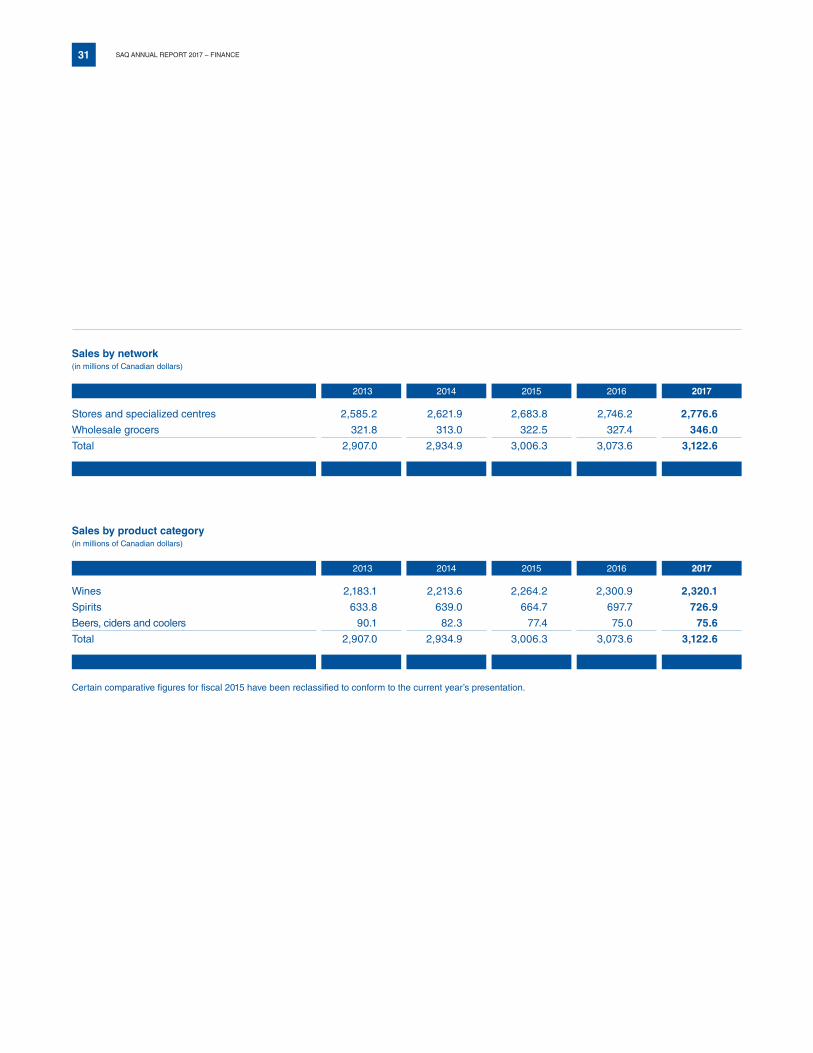
Sales by network(in millions of Canadian dollars)
2013 2014 2015 2016 2017
Stores and specialized centres 2,585.2 2,621.9 2,683.8 2,746.2 2,776.6
Wholesale grocers 321.8 313.0 322.5 327.4 346.0
Total 2,907.0 2,934.9 3,006.3 3,073.6 3,122.6
Sales by product category(in millions of Canadian dollars)
2013 2014 2015 2016 2017
Wines 2,183.1 2,213.6 2,264.2 2,300.9 2,320.1
Spirits 633.8 639.0 664.7 697.7 726.9
Beers, ciders and coolers 90.1 82.3 77.4 75.0 75.6
Total 2,907.0 2,934.9 3,006.3 3,073.6 3,122.6
Certain comparative figures for fiscal 2015 have been reclassified to conform to the current year’s presentation.
32 SAQ ANNUAL REPORT 2017 – FINANCE
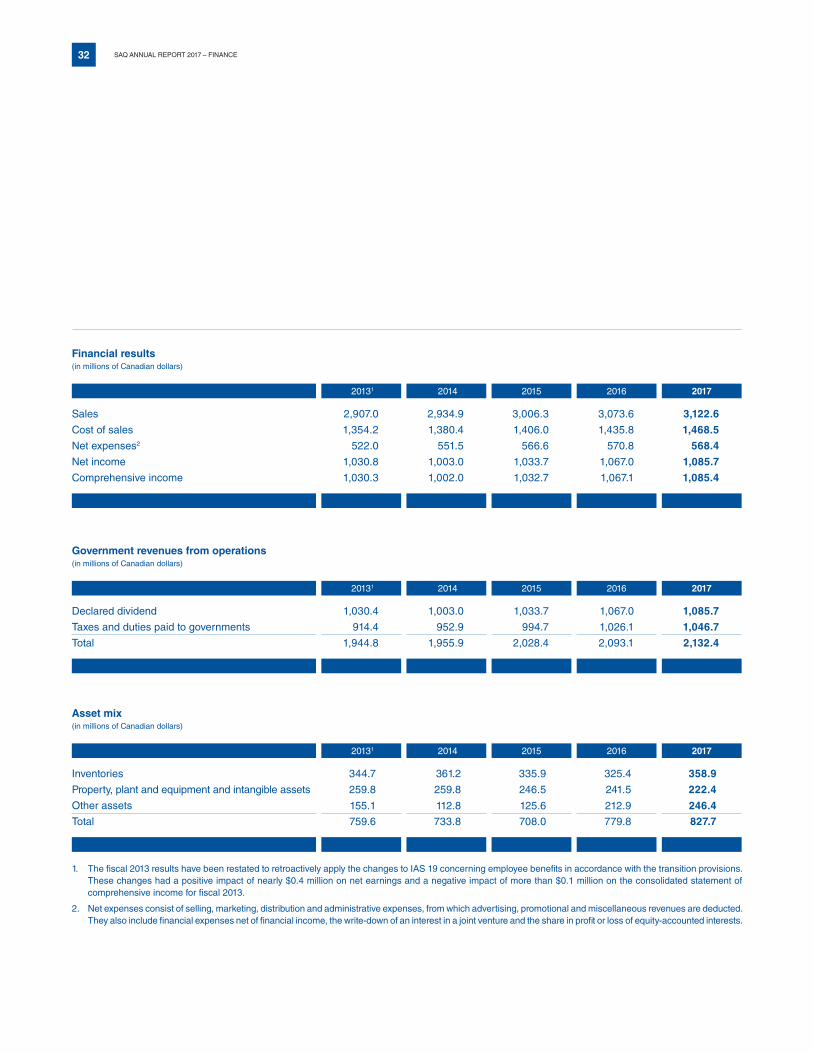
Financial results(in millions of Canadian dollars)
20131 2014 2015 2016 2017
Sales 2,907.0 2,934.9 3,006.3 3,073.6 3,122.6
Cost of sales 1,354.2 1,380.4 1,406.0 1,435.8 1,468.5
Net expenses2 522.0 551.5 566.6 570.8 568.4
Net income 1,030.8 1,003.0 1,033.7 1,067.0 1,085.7
Comprehensive income 1,030.3 1,002.0 1,032.7 1,067.1 1,085.4
Government revenues from operations(in millions of Canadian dollars)
20131 2014 2015 2016 2017
Declared dividend 1,030.4 1,003.0 1,033.7 1,067.0 1,085.7
Taxes and duties paid to governments 914.4 952.9 994.7 1,026.1 1,046.7
Total 1,944.8 1,955.9 2,028.4 2,093.1 2,132.4
Asset mix(in millions of Canadian dollars)
20131 2014 2015 2016 2017
Inventories 344.7 361.2 335.9 325.4 358.9
Property, plant and equipment and intangible assets 259.8 259.8 246.5 241.5 222.4
Other assets 155.1 112.8 125.6 212.9 246.4 Total 759.6 733.8 708.0 779.8 827.7
1. The fiscal 2013 results have been restated to retroactively apply the changes to IAS 19 concerning employee benefits in accordance with the transition provisions. These changes had a positive impact of nearly $0.4 million on net earnings and a negative impact of more than $0.1 million on the consolidated statement of comprehensive income for fiscal 2013.
2. Net expenses consist of selling, marketing, distribution and administrative expenses, from which advertising, promotional and miscellaneous revenues are deducted. They also include financial expenses net of financial income, the write-down of an interest in a joint venture and the share in profit or loss of equity-accounted interests.
33 SAQ ANNUAL REPORT 2017 – FINANCE
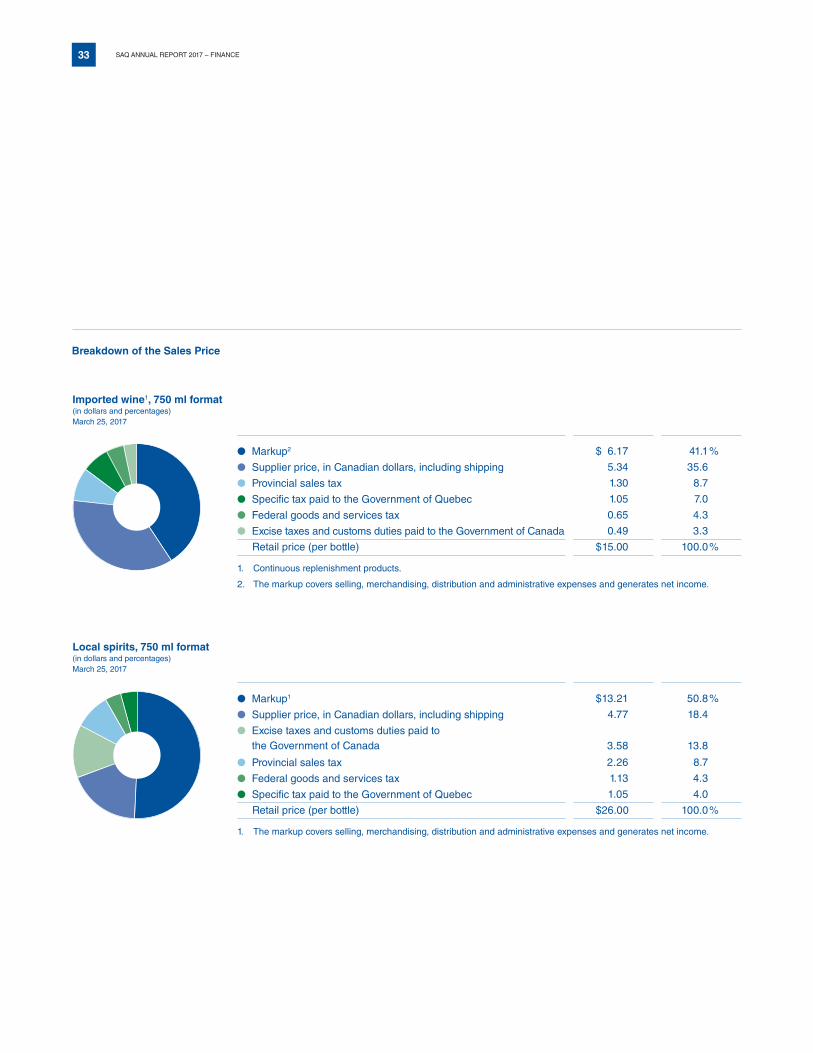
● Markup1 $ 13.21 50.8 %
● Supplier price, in Canadian dollars, including shipping 4.77 18.4
● Excise taxes and customs duties paid to the Government of Canada 3.58 13.8
● Provincial sales tax 2.26 8.7
● Federal goods and services tax 1.13 4.3
● Specific tax paid to the Government of Quebec 1.05 4.0
Retail price (per bottle) $ 26.00 100.0 %
1. The markup covers selling, merchandising, distribution and administrative expenses and generates net income.
● Markup2 $ 6.17 41.1 %
● Supplier price, in Canadian dollars, including shipping 5.34 35.6
● Provincial sales tax 1.30 8.7
● Specific tax paid to the Government of Quebec 1.05 7.0
● Federal goods and services tax 0.65 4.3
● Excise taxes and customs duties paid to the Government of Canada 0.49 3.3
Retail price (per bottle) $ 15.00 100.0 %
1. Continuous replenishment products.
2. The markup covers selling, merchandising, distribution and administrative expenses and generates net income.
Breakdown of the Sales Price
Imported wine1, 750 ml format(in dollars and percentages)March 25, 2017
Local spirits, 750 ml format(in dollars and percentages)March 25, 2017

34 SAQ ANNUAL REPORT 2017 – FINANCE
QUARTERLY RESULTSFiscal years ended March 25, 2017, and March 26, 2016 (unaudited figures)
2017
Number of weeksFiscal year
52Q412
Q316
Q212
Q112
FINANCIAL RESULTS(in millions of Canadian dollars)
Sales 3,122.6 571.4 1,121.1 739.3 690.8 Gross margin 1,654.1 298.6 587.3 399.7 368.5Net expenses1 568.4 142.6 175.8 121.0 129.0Net income 1,085.7 156.0 411.5 278.7 239.5Comprehensive income 1,085.4 155.7 411.5 278.7 239.5Dividend paid 1,097.0 335.0 265.0 197.0 300.0
SALES BY NETWORK (in millions of Canadian dollars)
Stores and specialized centres 2,776.6 509.5 998.4 660.3 608.4Wholesale grocers 346.0 61.9 122.7 79.0 82.4Total 3,122.6 571.4 1,121.1 739.3 690.8
VOLUME SALES BY NETWORK(in millions of litres)
Stores and specialized centres 155.7 29.7 53.3 38.1 34.6Wholesale grocers 42.3 7.9 14.8 9.5 10.1Total 198.0 37.6 68.1 47.6 44.7
VOLUME SALES BY PRODUCT CATEGORY(in millions of litres)
Wines 163.8 31.4 57.0 38.7 36.7Spirits 23.7 4.4 8.6 5.6 5.1Beers, ciders and coolers 10.5 1.8 2.5 3.3 2.9Total 198.0 37.6 68.1 47.6 44.7
1. Net expenses consist of selling, marketing, distribution and administrative expenses, from which advertising, promotional and miscellaneous revenues are deducted. They also include financial expenses net of financial income and the share in profit or loss of equity-accounted interests.
Certain comparative figures have been reclassified to conform to the current year’s presentation.

35 SAQ ANNUAL REPORT 2017 – FINANCE
2016
Number of weeksFiscal year
52Q412
Q316
Q212
Q112
FINANCIAL RESULTS(in millions of Canadian dollars)
Sales 3,073.6 600.1 1,076.7 711.7 685.1Gross margin 1,637.8 322.1 568.1 383.2 364.4Net expenses1 570.8 144.2 175.2 124.0 127.4Net income 1,067.0 177.9 392.9 259.2 237.0Comprehensive income 1,067.1 178.0 392.9 259.2 237.0Dividend paid 1,038.7 310.0 260.0 193.0 275.7
SALES BY NETWORK (in millions of Canadian dollars)
Stores and specialized centres 2,746.2 534.7 962.8 636.6 612.1Wholesale grocers 327.4 65.4 113.9 75.1 73.0Total 3,073.6 600.1 1,076.7 711.7 685.1
VOLUME SALES BY NETWORK(in millions of litres)
Stores and specialized centres 155.1 29.9 52.1 37.6 35.5Wholesale grocers 41.0 8.6 14.1 9.2 9.1Total 196.1 38.5 66.2 46.8 44.6
VOLUME SALES BY PRODUCT CATEGORY(in millions of litres)
Wines 162.9 32.7 55.5 38.1 36.6Spirits 23.0 4.4 8.2 5.3 5.1Beers, ciders and coolers 10.2 1.4 2.5 3.4 2.9Total 196.1 38.5 66.2 46.8 44.6
QUARTERLY RESULTS Fiscal years ended March 25, 2017, and March 26, 2016 (unaudited figures)

36 SAQ ANNUAL REPORT 2017 – FINANCE
TEN-YEAR HISTORICAL REVIEWFiscal years ended the last Saturday in March (unaudited figures)
2017 2016 2015
FINANCIAL RESULTS(in millions of Canadian dollars)
Sales4 3,122.6 3,073.6 3,006.3 Gross margin4 1,654.1 1,637.8 1,600.3 Next expenses4,5 568.4 570.8 566.6 Net income 1,085.7 1,067.0 1,033.7 Comprehensive income 1,085.4 1,067.1 1,032.7
FINANCIAL POSITION(in millions of Canadian dollars)
Total assets 827.7 779.8 708.0 Property, plant and equipment and intangible assets 222.4 241.5 246.5 Net working capital (150.8) (164.1) (169.5)Long-term liabilities 32.4 36.3 36.1 Shareholder’s equity 41.2 41.5 41.4
CASH FLOWS(in millions of Canadian dollars)
Cash flows related to operating activities 1,137.8 1,157.1 1,126.2 Acquisitions of property, plant and equipment and intangible assets 24.7 33.7 26.2 Dividend paid 1,097.0 1,038.7 971.0
1. Due to the adoption of a new accounting standard on inventories in 2009, direct shipping costs are deducted from net expenses and charged to cost of sales. In 2017, direct shipping costs totalled $19.5 million compared with $18.8 million for the preceding fiscal year.
2. The fiscal 2013 results have been restated to retroactively apply the changes to IAS 19 concerning employee benefits in accordance with the transition provisions. These changes had a positive impact of nearly $0.4 million on net earnings and a nagative impact of more than $0.1 million on the consolidated statement of comprehensive income for fiscal 2013.
3. 53-week fiscal year.
4. Due to the adoption of a new presentation method in 2011, the Éduc’alcool Fund and Éco Entreprises Fund deductions are included in net expenses. In 2017, these deductions totalled $23.2 million compared with $18.4 million for the preceding fiscal year.
5. Net expenses consist of selling, marketing, distribution and administrative expenses, from which advertising, promotional and miscellaneous revenues are deducted. They also include financial expenses net of financial income, the write-down of an interest in a joint venture and the share in profit or loss of equity-accounted interests.
The financial information for fiscal years 2011 to 2017 has been prepared in accordance with the International Financial Reporting Standards (IFRS). The figures presented for previous years were prepared in accordance with the Canadian generally accepted accounting principles (GAAP), which were in effect during those fiscal years.
Certain comparative figures have been reclassified to conform to the current year’s presentation.
1 1 1
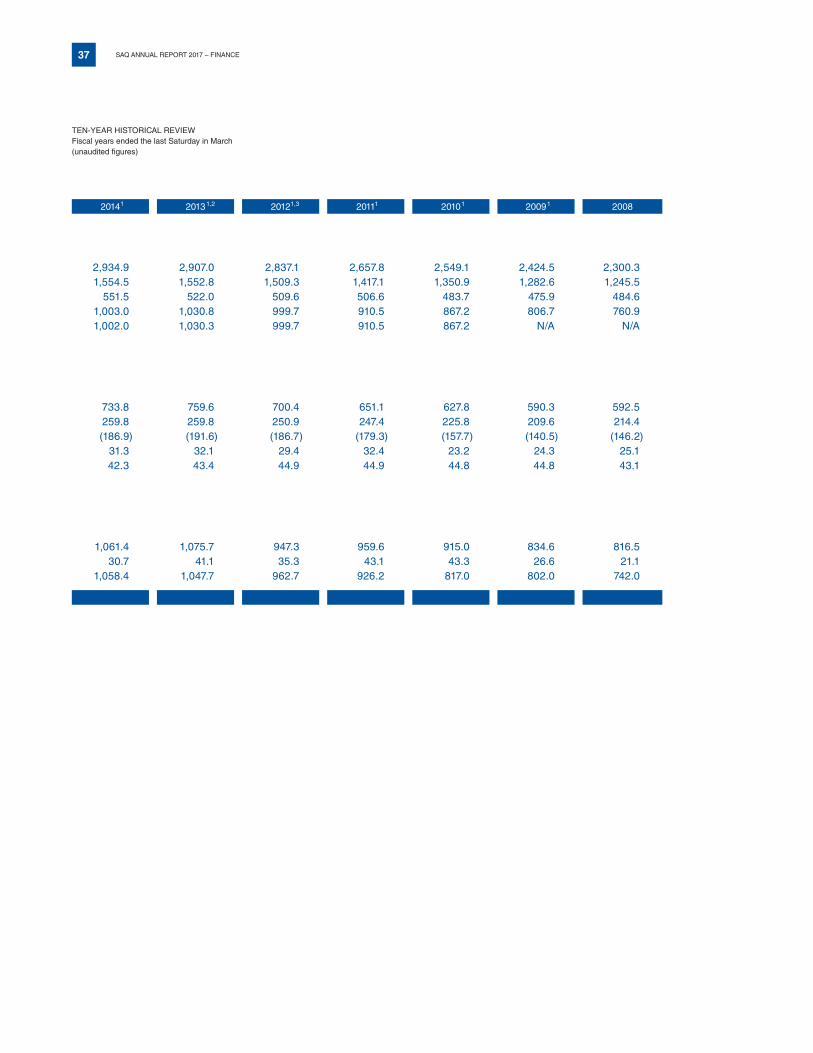
37 SAQ ANNUAL REPORT 2017 – FINANCE
TEN-YEAR HISTORICAL REVIEW Fiscal years ended the last Saturday in March (unaudited figures)
2014 2013 2012 2011 2010 2009 2008
2,934.9 2,907.0 2,837.1 2,657.8 2,549.1 2,424.5 2,300.3 1,554.5 1,552.8 1,509.3 1,417.1 1,350.9 1,282.6 1,245.5
551.5 522.0 509.6 506.6 483.7 475.9 484.6 1,003.0 1,030.8 999.7 910.5 867.2 806.7 760.9 1,002.0 1,030.3 999.7 910.5 867.2 N/A N/A
733.8 759.6 700.4 651.1 627.8 590.3 592.5 259.8 259.8 250.9 247.4 225.8 209.6 214.4 (186.9) (191.6) (186.7) (179.3) (157.7) (140.5) (146.2)
31.3 32.1 29.4 32.4 23.2 24.3 25.1 42.3 43.4 44.9 44.9 44.8 44.8 43.1
1,061.4 1,075.7 947.3 959.6 915.0 834.6 816.5 30.7 41.1 35.3 43.1 43.3 26.6 21.1
1,058.4 1,047.7 962.7 926.2 817.0 802.0 742.0
1 1,2 1,3 1 1 1
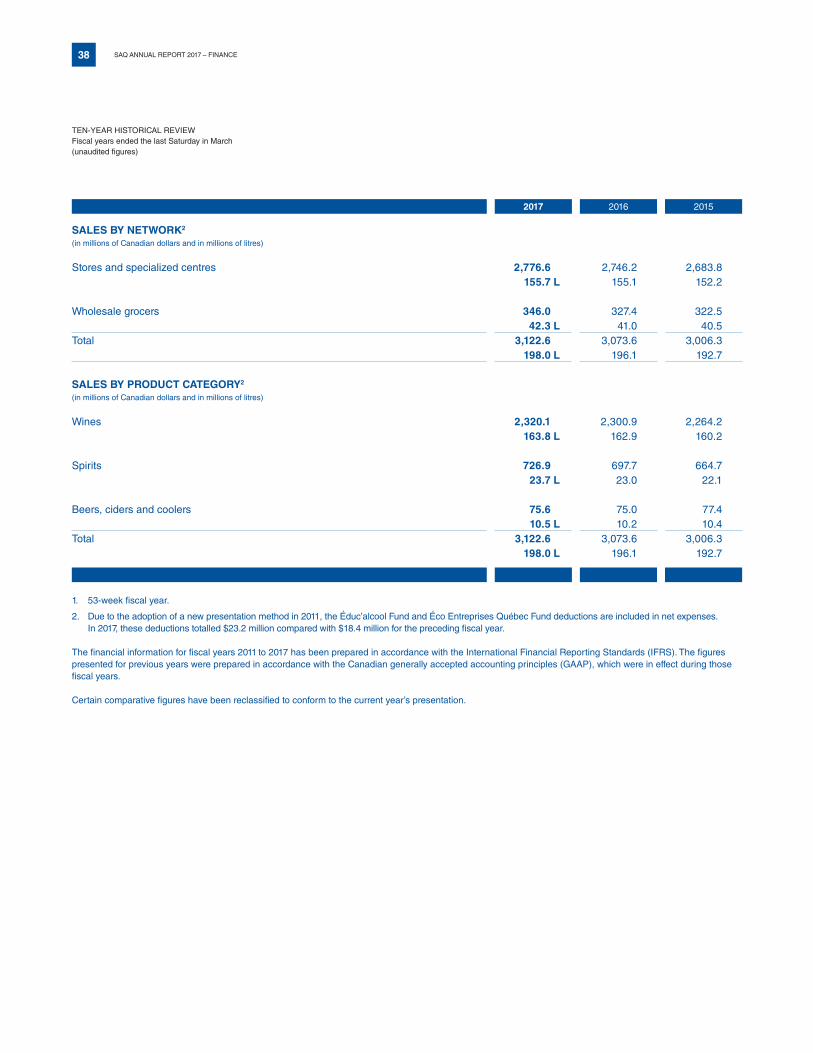
38 SAQ ANNUAL REPORT 2017 – FINANCE
2017 2016 2015
SALES BY NETWORK2
(in millions of Canadian dollars and in millions of litres)
Stores and specialized centres 2,776.6 2,746.2 2,683.8 155.7 L 155.1 152.2
Wholesale grocers 346.0 327.4 322.5 42.3 L 41.0 40.5
Total 3,122.6 3,073.6 3,006.3 198.0 L 196.1 192.7
SALES BY PRODUCT CATEGORY2
(in millions of Canadian dollars and in millions of litres)
Wines 2,320.1 2,300.9 2,264.2 163.8 L 162.9 160.2
Spirits 726.9 697.7 664.7 23.7 L 23.0 22.1
Beers, ciders and coolers 75.6 75.0 77.4 10.5 L 10.2 10.4
Total 3,122.6 3,073.6 3,006.3 198.0 L 196.1 192.7
1. 53-week fiscal year.
2. Due to the adoption of a new presentation method in 2011, the Éduc’alcool Fund and Éco Entreprises Québec Fund deductions are included in net expenses. In 2017, these deductions totalled $23.2 million compared with $18.4 million for the preceding fiscal year.
The financial information for fiscal years 2011 to 2017 has been prepared in accordance with the International Financial Reporting Standards (IFRS). The figures presented for previous years were prepared in accordance with the Canadian generally accepted accounting principles (GAAP), which were in effect during those fiscal years.
Certain comparative figures have been reclassified to conform to the current year’s presentation.
TEN-YEAR HISTORICAL REVIEW Fiscal years ended the last Saturday in March (unaudited figures)

39 SAQ ANNUAL REPORT 2017 – FINANCE
2014 2013 2012 2011 2010 2009 2008
2,621.9 2,585.2 2,524.4 2,362.5 2,260.1 2,146.5 2,034.8150.4 150.8 149.1 142.8 137.4 132.1 127.9
313.0 321.8 312.7 295.3 289.0 278.0 265.539.0 40.4 39.8 37.7 36.6 36.0 34.6
2,934.9 2,907.0 2,837.1 2,657.8 2,549.1 2,424.5 2,300.3189.4 191.2 188.9 180.5 174.0 168.1 162.5
2,213.6 2,183.1 2,124.7 1,987.0 1,905.5 1,804.9 1,705.2156.5 157.3 155.2 148.3 142.3 137.0 131.9
639.0 633.8 621.8 581.8 552.9 530.9 515.021.8 22.0 21.8 20.8 20.3 19.6 19.4
82.3 90.1 90.6 89.0 90.7 88.7 80.111.1 11.9 11.9 11.4 11.4 11.5 11.2
2,934.9 2,907.0 2,837.1 2,657.8 2,549.1 2,424.5 2,300.3189.4 191.2 188.9 180.5 174.0 168.1 162.5
1
TEN-YEAR HISTORICAL REVIEW Fiscal years ended the last Saturday in March (unaudited figures)
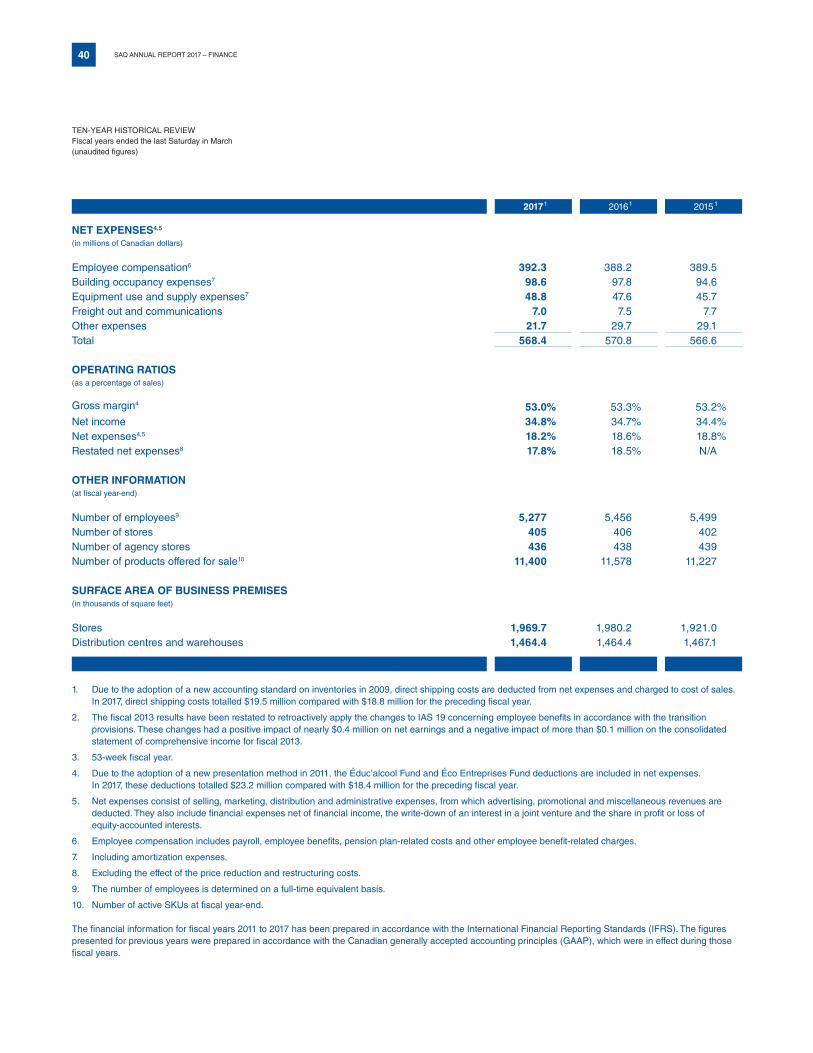
40 SAQ ANNUAL REPORT 2017 – FINANCE
2017 2016 2015
NET EXPENSES4,5
(in millions of Canadian dollars)
Employee compensation6 392.3 388.2 389.5Building occupancy expenses7 98.6 97.8 94.6Equipment use and supply expenses7 48.8 47.6 45.7Freight out and communications 7.0 7.5 7.7Other expenses 21.7 29.7 29.1Total 568.4 570.8 566.6
OPERATING RATIOS(as a percentage of sales)
Gross margin4 53.0 % 53.3 % 53.2 %Net income 34.8 % 34.7 % 34.4 %Net expenses4,5 18.2 % 18.6 % 18.8 %Restated net expenses8 17.8 % 18.5 % N/A
OTHER INFORMATION(at fiscal year-end)
Number of employees9 5,277 5,456 5,499Number of stores 405 406 402Number of agency stores 436 438 439 Number of products offered for sale10 11,400 11,578 11,227
SURFACE AREA OF BUSINESS PREMISES(in thousands of square feet)
Stores 1,969.7 1,980.2 1,921.0Distribution centres and warehouses 1,464.4 1,464.4 1,467.1
1. Due to the adoption of a new accounting standard on inventories in 2009, direct shipping costs are deducted from net expenses and charged to cost of sales. In 2017, direct shipping costs totalled $19.5 million compared with $18.8 million for the preceding fiscal year.
2. The fiscal 2013 results have been restated to retroactively apply the changes to IAS 19 concerning employee benefits in accordance with the transition provisions. These changes had a positive impact of nearly $0.4 million on net earnings and a negative impact of more than $0.1 million on the consolidated statement of comprehensive income for fiscal 2013.
3. 53-week fiscal year.
4. Due to the adoption of a new presentation method in 2011, the Éduc’alcool Fund and Éco Entreprises Fund deductions are included in net expenses. In 2017, these deductions totalled $23.2 million compared with $18.4 million for the preceding fiscal year.
5. Net expenses consist of selling, marketing, distribution and administrative expenses, from which advertising, promotional and miscellaneous revenues are deducted. They also include financial expenses net of financial income, the write-down of an interest in a joint venture and the share in profit or loss of equity-accounted interests.
6. Employee compensation includes payroll, employee benefits, pension plan-related costs and other employee benefit-related charges.
7. Including amortization expenses.
8. Excluding the effect of the price reduction and restructuring costs.
9. The number of employees is determined on a full-time equivalent basis.
10. Number of active SKUs at fiscal year-end.
The financial information for fiscal years 2011 to 2017 has been prepared in accordance with the International Financial Reporting Standards (IFRS). The figures presented for previous years were prepared in accordance with the Canadian generally accepted accounting principles (GAAP), which were in effect during those fiscal years.
1 1 1
TEN-YEAR HISTORICAL REVIEW Fiscal years ended the last Saturday in March (unaudited figures)
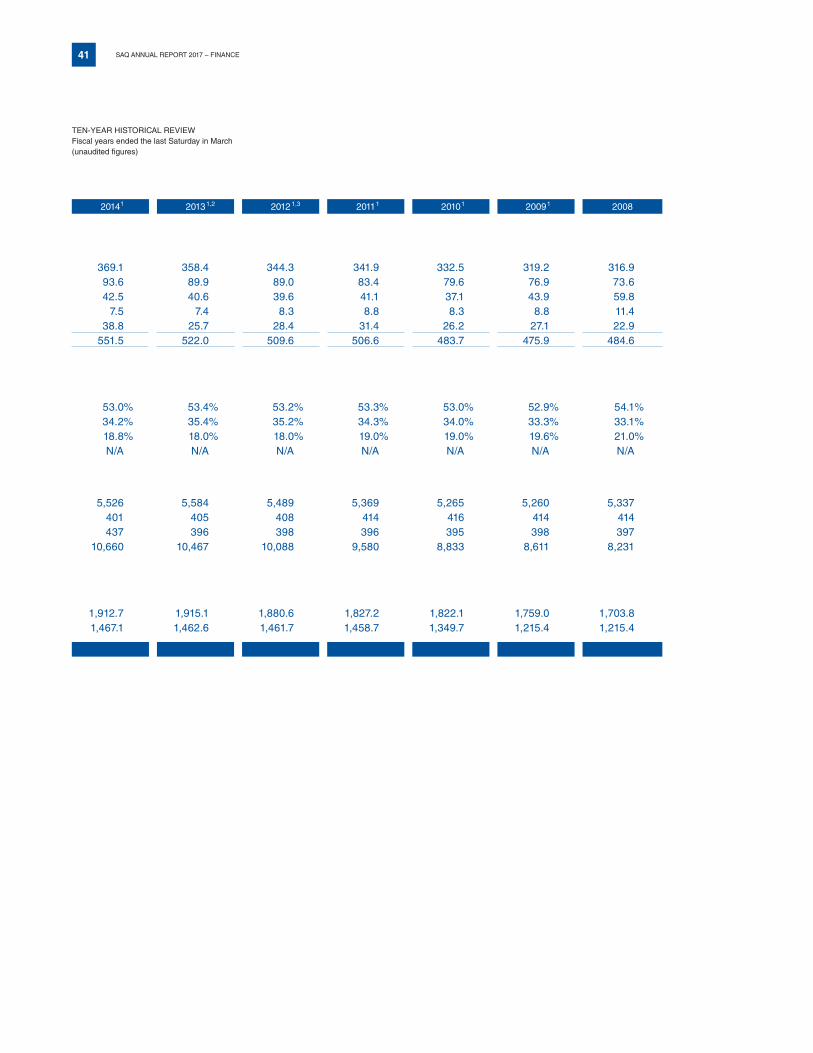
41 SAQ ANNUAL REPORT 2017 – FINANCE
2014 2013 2012 2011 2010 2009 2008
369.1 358.4 344.3 341.9 332.5 319.2 316.993.6 89.9 89.0 83.4 79.6 76.9 73.642.5 40.6 39.6 41.1 37.1 43.9 59.8
7.5 7.4 8.3 8.8 8.3 8.8 11.438.8 25.7 28.4 31.4 26.2 27.1 22.9
551.5 522.0 509.6 506.6 483.7 475.9 484.6
53.0 % 53.4 % 53.2 % 53.3 % 53.0 % 52.9 % 54.1 % 34.2 % 35.4 % 35.2 % 34.3 % 34.0 % 33.3 % 33.1 % 18.8 % 18.0 % 18.0 % 19.0 % 19.0 % 19.6 % 21.0 %
N/A N/A N/A N/A N/A N/A N/A
5,526 5,584 5,489 5,369 5,265 5,260 5,337401 405 408 414 416 414 414437 396 398 396 395 398 397
10,660 10,467 10,088 9,580 8,833 8,611 8,231
1,912.7 1,915.1 1,880.6 1,827.2 1,822.1 1,759.0 1,703.81,467.1 1,462.6 1,461.7 1,458.7 1,349.7 1,215.4 1,215.4
1 1,2 1,3 1 1 1
TEN-YEAR HISTORICAL REVIEW Fiscal years ended the last Saturday in March (unaudited figures)


