122
ANNUAL REPORT 2017
ANNUAL REPORT 2017

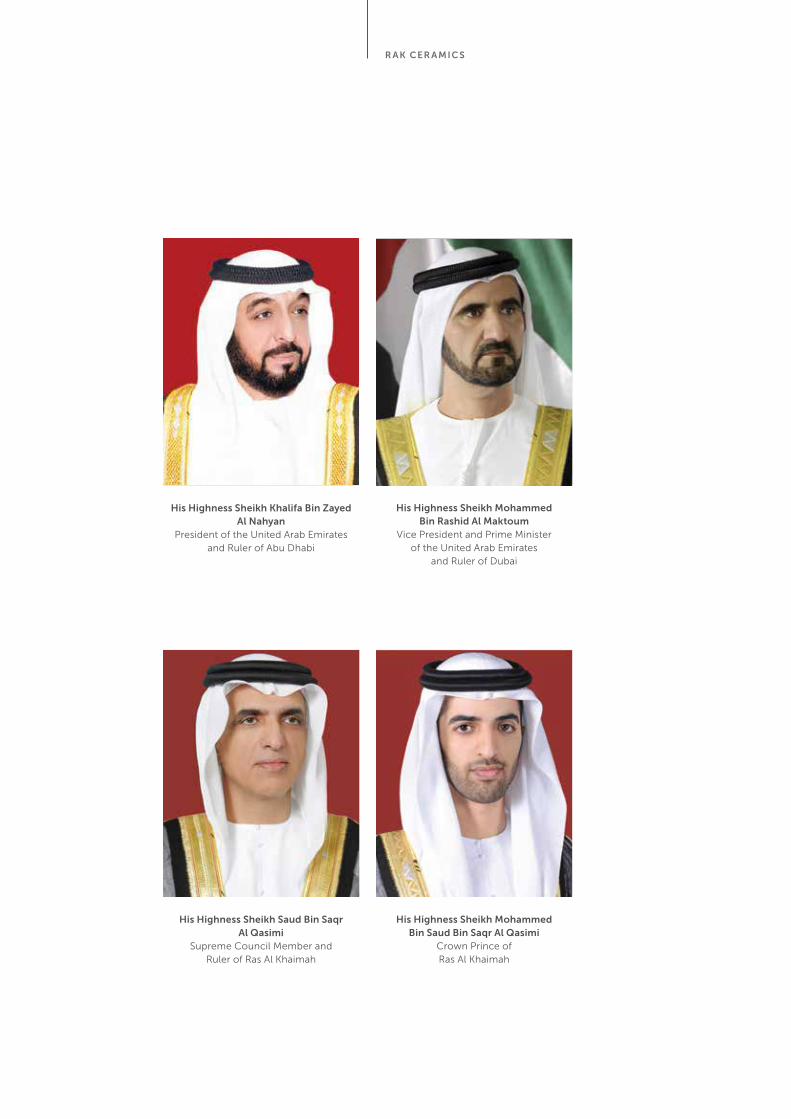
His Highness Sheikh Khalifa Bin Zayed Al Nahyan
President of the United Arab Emirates and Ruler of Abu Dhabi
His Highness Sheikh Mohammed Bin Rashid Al Maktoum
Vice President and Prime Minister of the United Arab Emirates
and Ruler of Dubai
His Highness Sheikh Saud Bin Saqr Al Qasimi
Supreme Council Member and Ruler of Ras Al Khaimah
His Highness Sheikh Mohammed Bin Saud Bin Saqr Al Qasimi
Crown Prince of Ras Al Khaimah
R AK cER A Mic S
23
OPERATIONAL UPDATE
11
CORPORATE UPDATE
05
INTRODUCTION
ANNUAL REP ORT 2017
cONTENT OvERviEw
iNTROdUcTiON 05
Chairman’s Message 06
Group CEO’s Message 09
SEcTiON 1 – cORPORATE UPdATE 11
Performance Overview 12
Core Business Performance 14
Regional Performance 15
Global Operations 16
Board of Directors, Advisers and Leadership 18
SEcTiON 2 – OPERATiONAL UPdATE 23
Tiles 24
Sanitaryware 26
Faucets 28
Tableware 30
Sales and Marketing 32
Corporate Social Responsibility 34
Awards and Sponsorship 35
Health, Safety and the Environment 36
Corporate Governance 37
Training and Development 38
Information Technology 39
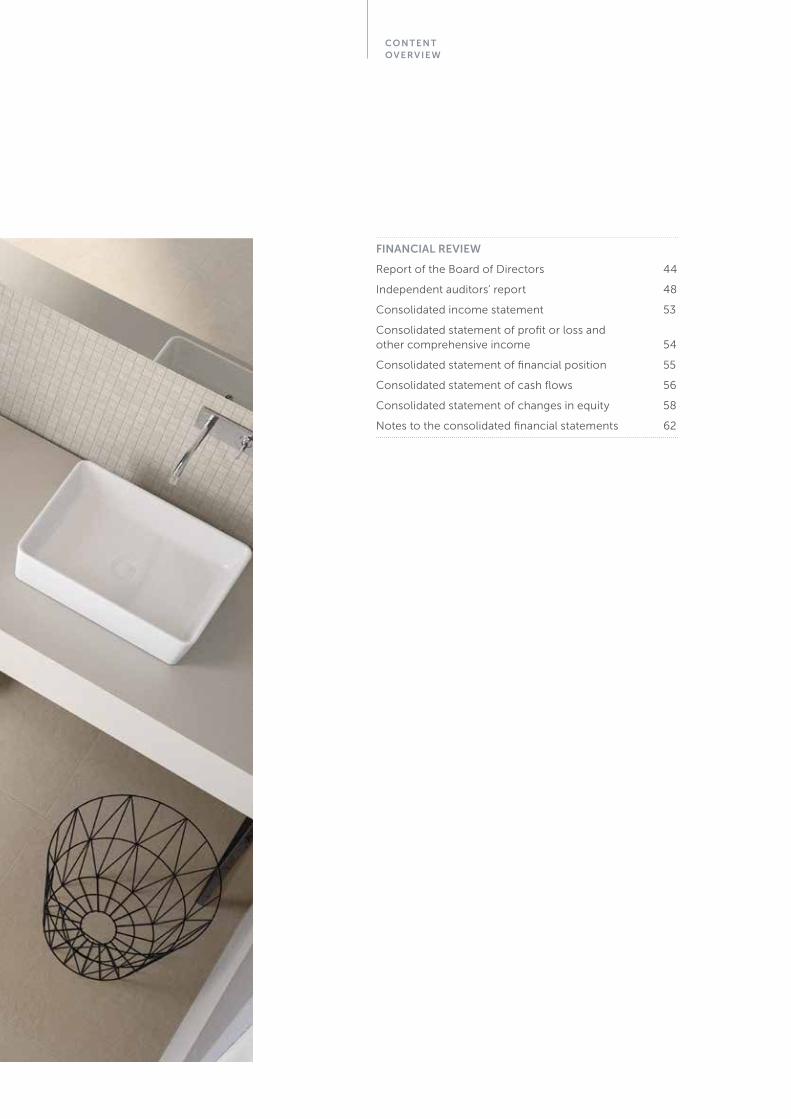
SEcTiON 3 – FiNANciAL REviEw 41
Report of the Board of Directors 44
Independent auditors’ report 48
Consolidated income statement 53
Consolidated statement of profit or loss and other comprehensive income 54
Consolidated statement of financial position 55
Consolidated statement of cash flows 56
Consolidated statement of changes in equity 58
Notes to the consolidated financial statements 6241
FINANCIAL REvIEw
04
05
iNTROdUc TiON
ANNUAL REP ORT 2017
06
Chairman’s Message
iNTROdUc TiON
Dear Shareholders
RAK Ceramics was built on firm foundations. From the beginning we focused on building a solid infrastructure, establishing products and implementing processes that would enable future growth.
It is this solid infrastructure, combined with visionary leadership, that enabled us to grow our international footprint and distribution network, and establish ourselves as the world’s largest ceramics manufacturer in just 20 years - a truly remarkable achievement.
In 2017 we continued to reinforce our position as a world leader in the field of global ceramics, focused on innovation and delivering on our vision to become the world’s leading ceramics lifestyle solutions provider.
We are very proud to be a global brand, but we are also honoured to be recognised as one of the best home-grown brands in the UAE.
With this in mind, it gives me great pleasure to introduce our 2017 Annual Report.
H.H. SHEiKH KHALid BiN SAUd AL QASiMiChairman of the board of directors
07cHAiRM AN ’ S ME SSAg E
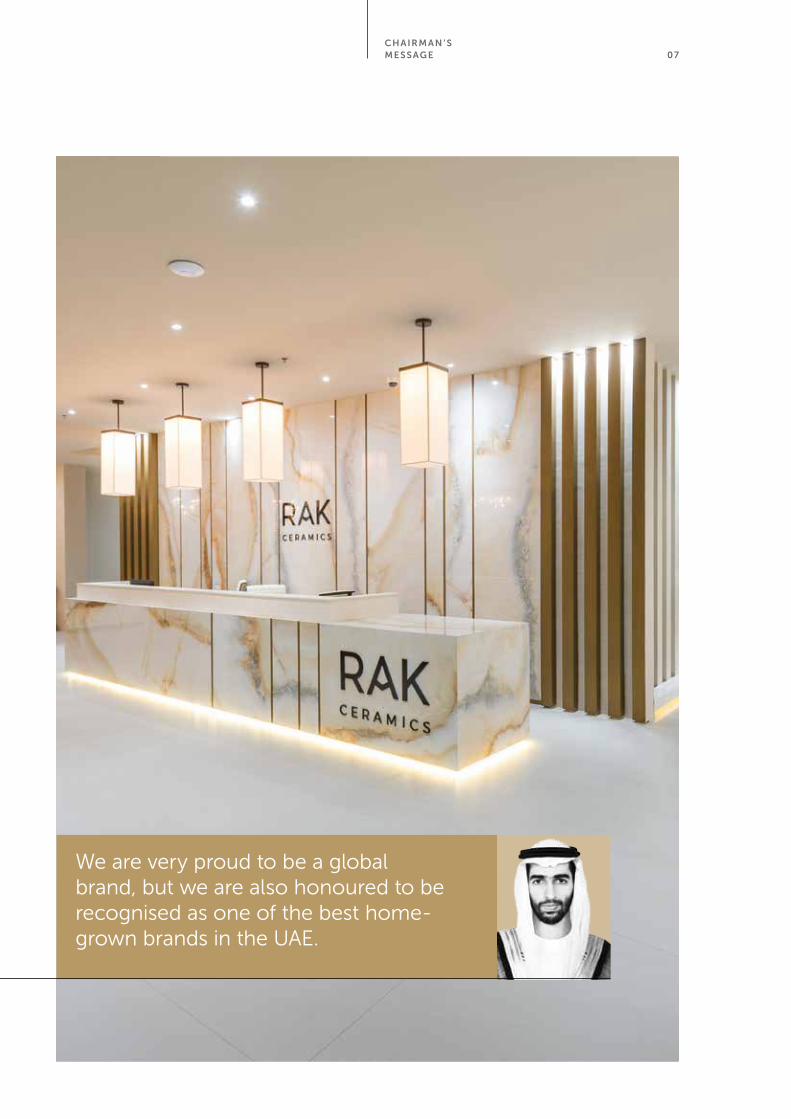
We are very proud to be a global brand, but we are also honoured to be recognised as one of the best home-grown brands in the UAE.

08 iNTROdUc TiON
we have built the foundations and we now stand on a solid platform ready for future growth.
09
Group CEO’s Message
g ROUP cEO ME SSAg E
dear Shareholders
If there is one thing I have learned in business, it is that the only constant is change. Any successful business needs to adapt to its environment to survive. The ability to seek out and capitalise on favourable opportunities and the open-mindedness to shift direction is essential. None of this is truer than with RAK Ceramics.
Despite the very unfavourable conditions and the harsh financial environment we found ourselves operating in at the end of 2016, we began 2017 with a sense of cautious optimism and a strong commitment to stand firm and continue with the implementation of our Value Creation Plan.
We have continued to focus on our core businesses of tiles, sanitaryware, tableware and faucets, and exited from more non-core and non-performing businesses. We rolled out our global corporate brand identity, acquired operations in Europe and KSA and successfully expanded production capacities here in the UAE, and in Bangladesh.
We have also driven increased performance from our tableware division and implemented many cost saving initiatives which has led to margin improvements. I am delighted to say that our 2017 financial performance shows the results of our hard work.
I genuinely feel that as we enter 2018, we enter a new chapter in RAK Ceramics’ history. We have built the foundations and we now stand on a solid platform ready for growth. However we cannot afford to be complacent as there are many macro-economic factors which may continue to challenge our growth.
Increasing competition, more expensive direct material costs and ongoing increases in gas prices are challenges we must try to find ways to navigate. Whilst the oil price has shown some signs of recovery, it is still very unpredictable, and the geo-political situation continues.
There are some positive signals around the region which show that we are entering into a new period. Reports say that we can expect growth in many of our core markets and recently the UAE and Saudi Arabia announced higher government infrastructure budgets, in particular KSA being the highest recorded.
As we enter 2018 with positivity and optimism, I would like to take this opportunity to thank our Board of Directors for their unwavering support, and our management team and all employees for their hard work and dedication.
ABdALLAH MASSAAdGroup CEO
10
1 1SEc TiON 1
PERFORMANcE RE viEw
1 2
Performance Overview
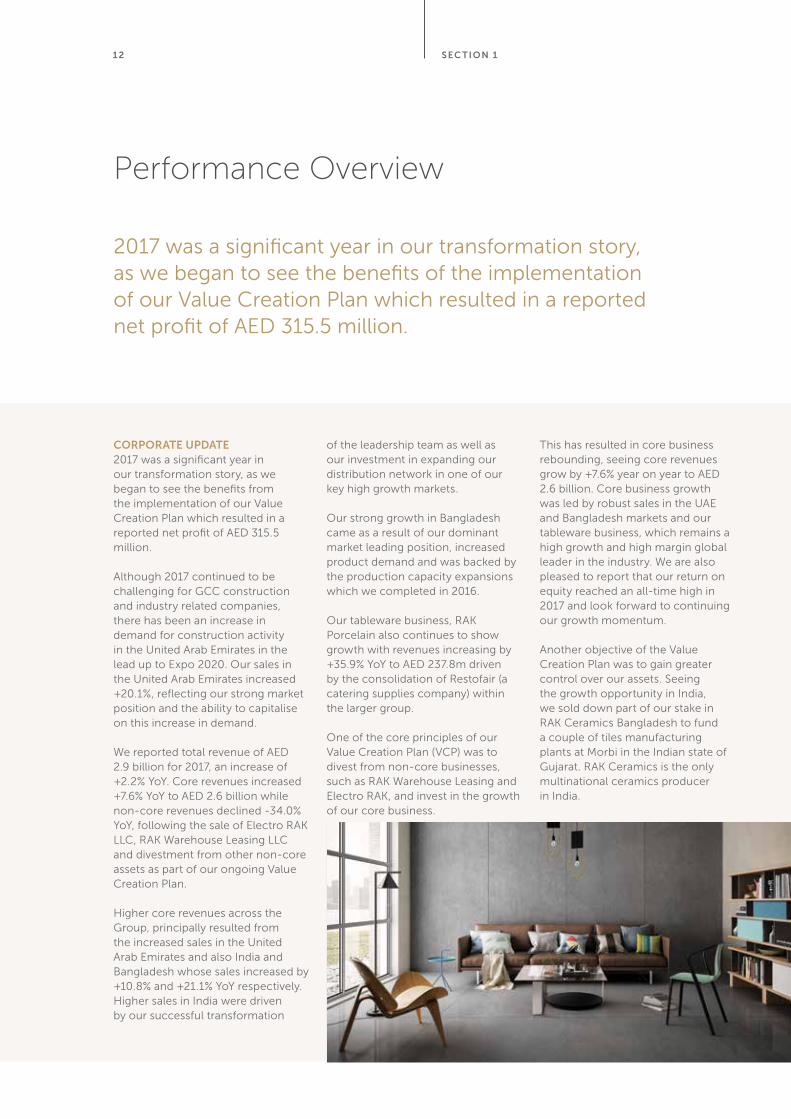
cORPORATE UPdATE 2017 was a significant year in our transformation story, as we began to see the benefits from the implementation of our Value Creation Plan which resulted in a reported net profit of AED 315.5 million.
Although 2017 continued to be challenging for GCC construction and industry related companies, there has been an increase in demand for construction activity in the United Arab Emirates in the lead up to Expo 2020. Our sales in the United Arab Emirates increased +20.1%, reflecting our strong market position and the ability to capitalise on this increase in demand.
We reported total revenue of AED 2.9 billion for 2017, an increase of +2.2% YoY. Core revenues increased +7.6% YoY to AED 2.6 billion while non-core revenues declined -34.0% YoY, following the sale of Electro RAK LLC, RAK Warehouse Leasing LLC and divestment from other non-core assets as part of our ongoing Value Creation Plan.
Higher core revenues across the Group, principally resulted from the increased sales in the United Arab Emirates and also India and Bangladesh whose sales increased by +10.8% and +21.1% YoY respectively. Higher sales in India were driven by our successful transformation
of the leadership team as well as our investment in expanding our distribution network in one of our key high growth markets.
Our strong growth in Bangladesh came as a result of our dominant market leading position, increased product demand and was backed by the production capacity expansions which we completed in 2016.
Our tableware business, RAK Porcelain also continues to show growth with revenues increasing by +35.9% YoY to AED 237.8m driven by the consolidation of Restofair (a catering supplies company) within the larger group.
One of the core principles of our Value Creation Plan (VCP) was to divest from non-core businesses, such as RAK Warehouse Leasing and Electro RAK, and invest in the growth of our core business.
This has resulted in core business rebounding, seeing core revenues grow by +7.6% year on year to AED 2.6 billion. Core business growth was led by robust sales in the UAE and Bangladesh markets and our tableware business, which remains a high growth and high margin global leader in the industry. We are also pleased to report that our return on equity reached an all-time high in 2017 and look forward to continuing our growth momentum.
Another objective of the Value Creation Plan was to gain greater control over our assets. Seeing the growth opportunity in India, we sold down part of our stake in RAK Ceramics Bangladesh to fund a couple of tiles manufacturing plants at Morbi in the Indian state of Gujarat. RAK Ceramics is the only multinational ceramics producer in India.
SEc TiON 1
2017 was a significant year in our transformation story, as we began to see the benefits of the implementation of our Value Creation Plan which resulted in a reported net profit of AED 315.5 million.
1 3cORP OR ATE UPdATE
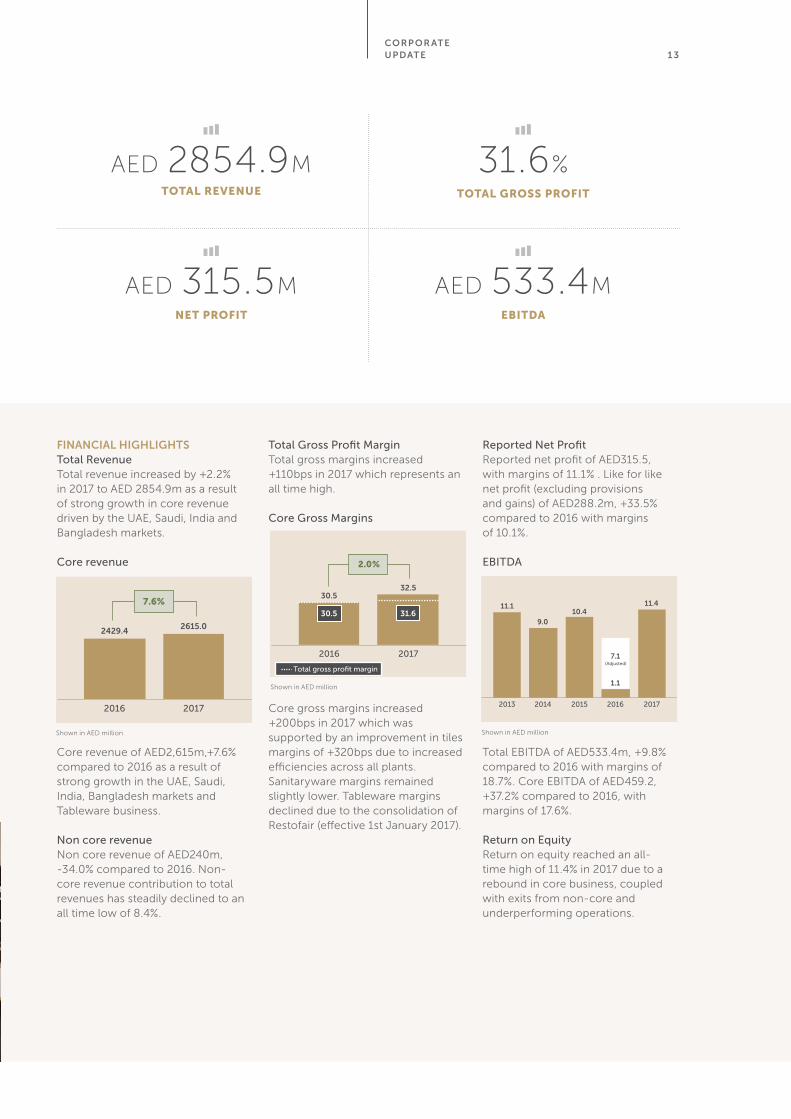
AED 2854.9MTOTAL Revenue
AED 315.5MneT PROFIT
31.6%TOTAL GROSS PROFIT
AED 533.4MeBITDA
FiNANciAL HigHLigHTSTotal RevenueTotal revenue increased by +2.2% in 2017 to AED 2854.9m as a result of strong growth in core revenue driven by the UAE, Saudi, India and Bangladesh markets.
Core revenue
Core revenue of AED2,615m,+7.6% compared to 2016 as a result of strong growth in the UAE, Saudi, India, Bangladesh markets and Tableware business.
Non core revenueNon core revenue of AED240m, -34.0% compared to 2016. Non-core revenue contribution to total revenues has steadily declined to an all time low of 8.4%.
Total Gross Profit MarginTotal gross margins increased +110bps in 2017 which represents an all time high.
Core Gross Margins
Core gross margins increased +200bps in 2017 which was supported by an improvement in tiles margins of +320bps due to increased efficiencies across all plants.Sanitaryware margins remained slightly lower. Tableware margins declined due to the consolidation of Restofair (effective 1st January 2017).
Reported Net ProfitReported net profit of AED315.5, with margins of 11.1% . Like for like net profit (excluding provisions and gains) of AED288.2m, +33.5% compared to 2016 with margins of 10.1%.
EBITDA
Total EBITDA of AED533.4m, +9.8% compared to 2016 with margins of 18.7%. Core EBITDA of AED459.2, +37.2% compared to 2016, with margins of 17.6%.
Return on EquityReturn on equity reached an all-time high of 11.4% in 2017 due to a rebound in core business, coupled with exits from non-core and underperforming operations.
Shown in AED million
Shown in AED millionShown in AED million
Core Business Performance
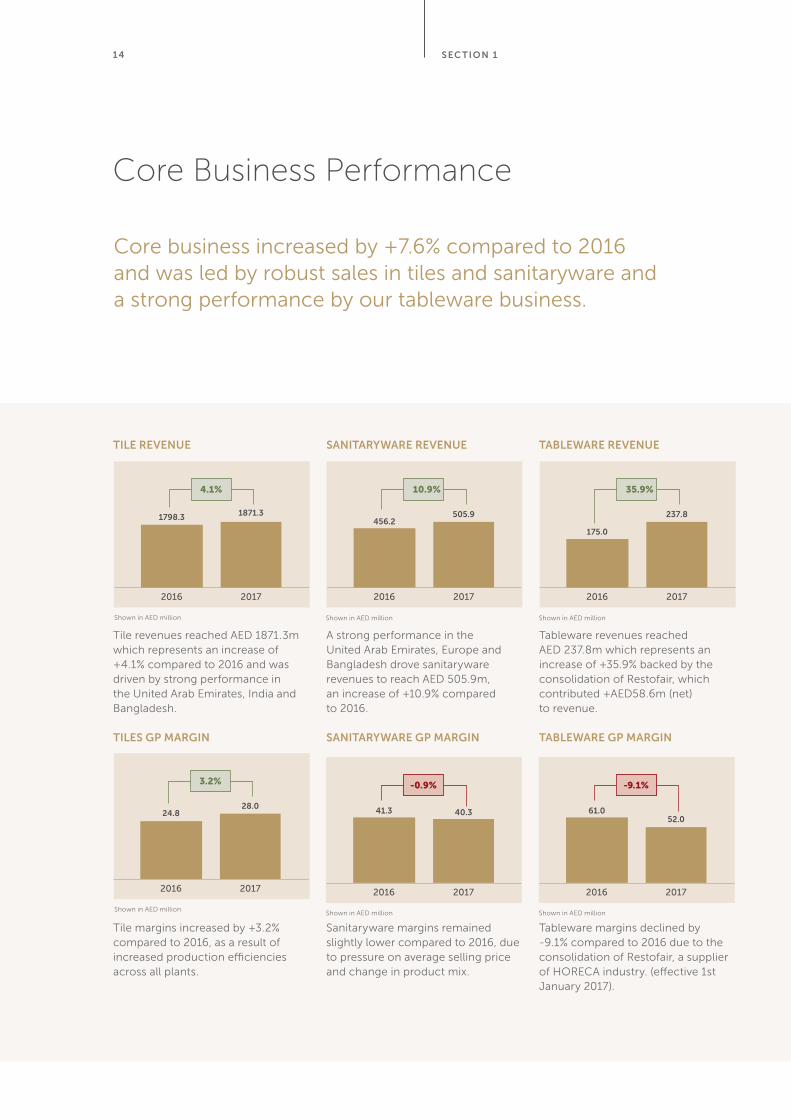
Core business increased by +7.6% compared to 2016 and was led by robust sales in tiles and sanitaryware and a strong performance by our tableware business.
14 SEc TiON 1
TiLE REvENUE
Tile revenues reached AED 1871.3m which represents an increase of +4.1% compared to 2016 and was driven by strong performance in the United Arab Emirates, India and Bangladesh.
TiLES gP MARgiN
Tile margins increased by +3.2% compared to 2016, as a result of increased production efficiencies across all plants.
SANiTARywARE REvENUE
A strong performance in the United Arab Emirates, Europe and Bangladesh drove sanitaryware revenues to reach AED 505.9m, an increase of +10.9% compared to 2016.
SANiTARywARE gP MARgiN
Sanitaryware margins remained slightly lower compared to 2016, due to pressure on average selling price and change in product mix.
TABLEwARE REvENUE
Tableware revenues reached AED 237.8m which represents an increase of +35.9% backed by the consolidation of Restofair, which contributed +AED58.6m (net) to revenue.
TABLEwARE gP MARgiN
Tableware margins declined by -9.1% compared to 2016 due to the consolidation of Restofair, a supplier of HORECA industry. (effective 1st January 2017).
Shown in AED million Shown in AED million Shown in AED million
Shown in AED millionShown in AED million Shown in AED million
Regional Performance
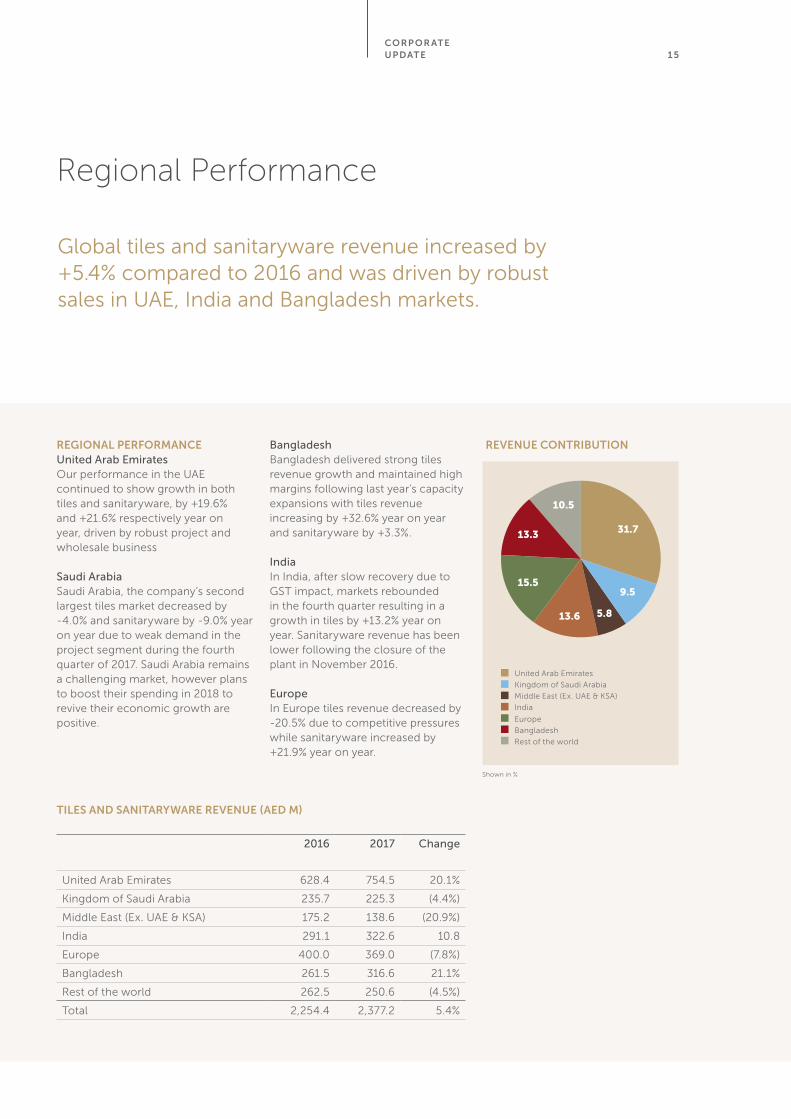
Global tiles and sanitaryware revenue increased by +5.4% compared to 2016 and was driven by robust sales in UAE, India and Bangladesh markets.
1 5cORP OR ATE UPdATE
REgiONAL PERFORMANcEUnited Arab EmiratesOur performance in the UAE continued to show growth in both tiles and sanitaryware, by +19.6% and +21.6% respectively year on year, driven by robust project and wholesale business
Saudi ArabiaSaudi Arabia, the company’s second largest tiles market decreased by -4.0% and sanitaryware by -9.0% year on year due to weak demand in the project segment during the fourth quarter of 2017. Saudi Arabia remains a challenging market, however plans to boost their spending in 2018 to revive their economic growth are positive.
BangladeshBangladesh delivered strong tiles revenue growth and maintained high margins following last year’s capacity expansions with tiles revenue increasing by +32.6% year on year and sanitaryware by +3.3%. IndiaIn India, after slow recovery due to GST impact, markets rebounded in the fourth quarter resulting in a growth in tiles by +13.2% year on year. Sanitaryware revenue has been lower following the closure of the plant in November 2016.
EuropeIn Europe tiles revenue decreased by -20.5% due to competitive pressures while sanitaryware increased by +21.9% year on year.
TiLES ANd SANiTARywARE REvENUE (AEd M)
2016 2017 Change
United Arab Emirates 628.4 754.5 20.1%
Kingdom of Saudi Arabia 235.7 225.3 (4.4%)
Middle East (Ex. UAE & KSA) 175.2 138.6 (20.9%)
India 291.1 322.6 10.8
Europe 400.0 369.0 (7.8%)
Bangladesh 261.5 316.6 21.1%
Rest of the world 262.5 250.6 (4.5%)
Total 2,254.4 2,377.2 5.4%
REvENUE cONTRiBUTiON
United Arab Emirates
Kingdom of Saudi Arabia
Middle East (Ex. UAE & KSA)
India
Europe
Bangladesh
Rest of the world
Shown in %
UNiTEd ARAB EMiRATESOur UAE operation has outgrown the market, enjoying a strong performance through further developing our projects channel. We have expanded geographically and several iconic projects have been signed in Dubai and Abu Dhabi. Corporate deals have also been signed to support the retail channel.
We have also changed our approach to the wholesale channel to improve service to key distributors. We continued with our rebranding activities in our existing and traders’ showrooms to enhance our brand image. We took a new showroom positioned in a prime location on Sheikh Zayed Road, Dubai, which is expected to open in the first quarter of 2018.
KiNgdOM OF SAUdi ARABiATaking control of our distribution in core markets is a key part of our Value Creation Plan. Despite the macro-economic challenges in KSA, we have completed the acquisition of one of our joint ventures in Saudi and post-acquisition efforts are progressing well through distribution network consolidation and overhead cost reduction.
BANgLAdESHFollowing our capacity expansion in 2016, we were able to grow in the local market. We have added several new dealers, and sales and marketing initiatives were taken to target prospective corporate clients and projects. Further brand roll-out activities are in progress to update our brand image.
iNdiAIndia continued focusing on its Value Creation Plan and achieved better results in 2017 despite the impacts of demonetisation and GST. We executed two acquisitions in Morbi, Gujarat which adds approximately 10 million square metres of tile production capacity. One plant is already producing about 3 million square metres with the second expansion of 7 million square metres to be completed by the end of 2018.
Further work was done on reinvigorating the salesforce and building up the brand through rolling out in-shop branding for dealers and in shop-in-shops for smaller traders. We will continue our focus on India in 2018 and develop it as a hub for exports.
16 SEc TiON 1
Global Operations
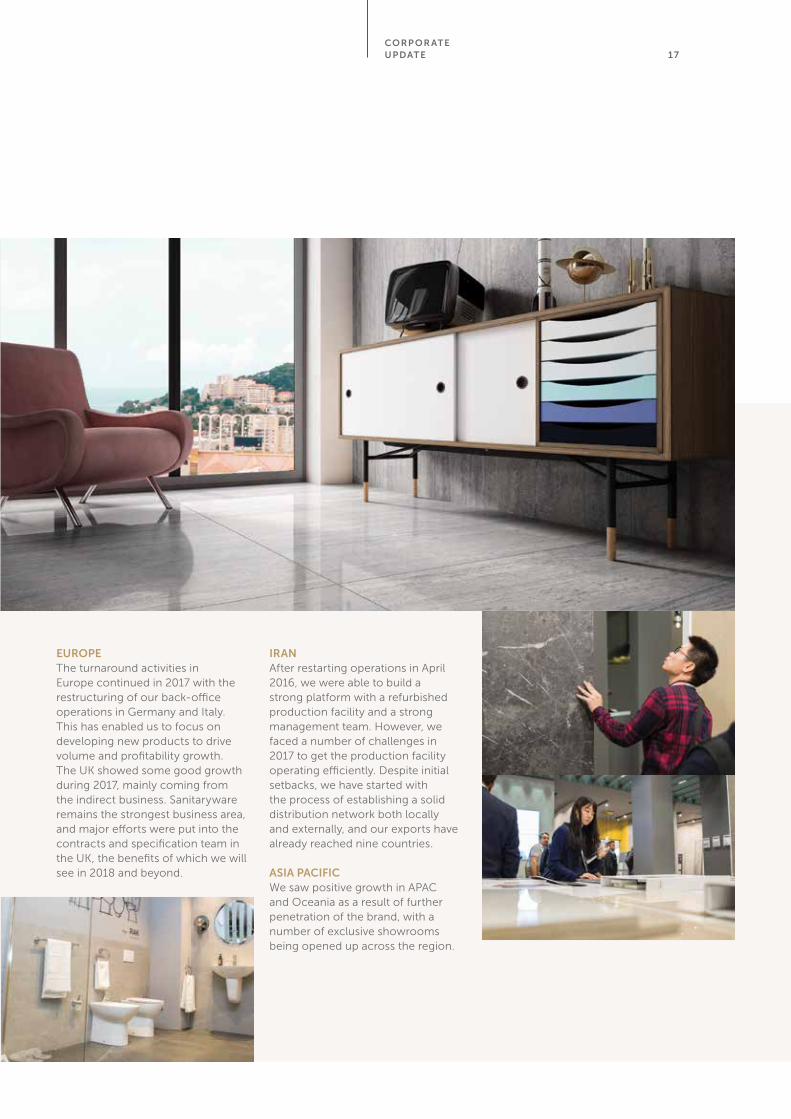
EUROPEThe turnaround activities in Europe continued in 2017 with the restructuring of our back-office operations in Germany and Italy. This has enabled us to focus on developing new products to drive volume and profitability growth. The UK showed some good growth during 2017, mainly coming from the indirect business. Sanitaryware remains the strongest business area, and major efforts were put into the contracts and specification team in the UK, the benefits of which we will see in 2018 and beyond.
iRANAfter restarting operations in April 2016, we were able to build a strong platform with a refurbished production facility and a strong management team. However, we faced a number of challenges in 2017 to get the production facility operating efficiently. Despite initial setbacks, we have started with the process of establishing a solid distribution network both locally and externally, and our exports have already reached nine countries.
ASiA PAciFicWe saw positive growth in APAC and Oceania as a result of further penetration of the brand, with a number of exclusive showrooms being opened up across the region.
17cORP OR ATE UPdATE
18
Board of Directors, Advisers and Leadership
H.H. SHEiKH KHALid BiN SAUd AL QASiMichairman of the Board
Board member since 2015. H.H. Sheikh Khalid Bin Saud Al Qasimi is the Chairman of RAK Ceramics PJSC and is also Chairman of Al Marjan Island LLC, Ras Al Khaimah and Vice Chairman of the Investment and Development Office, Government of Ras Al Khaimah. H.H. Sheikh Khalid Bin Saud Al Qasimi has extensive experience in finance and investment management and holds a business management qualification from New York University, Abu Dhabi Campus.
SHiRiSH SARAFVice Chairman of the Board
Board member since 2014. Shirish Saraf is the Founder and Vice Chairman of Samena Capital and in June 2014, he led the acquisition of a significant stake in RAK Ceramics PJSC. Previously he was co-founder at Abraaj Capital, Dubai UAE; Vice President- Direct Investments and Syndication for TAIB Bank, Bahrain and Vice President of ANZ Merchant Bank. In September 2013, he was listed as one of Asia’s 25 most influential people in Private Equity by Asian Investors. Mr Saraf was educated at Charterhouse (England) and holds a BSc (Economics) from the London School of Economics and Political Science.
SHEiKH AHMEd BiN HUMAid AL QASiMiMember of the Board
Board member since 1996. Sheikh Ahmed Bin Humaid Al Qasimi is also Chairman of RAK White Cement PJSC and RAK Porcelain LLC (a RAK Ceramics Group Company). Sheikh Ahmed holds a Bachelor’s Degree from the Military College in Egypt.
SEc TiON 1
19
FAwAZ ALRAjHi Member of the Board
Board member since 2015. Fawaz AlRajhi is also Chairman of the Board, CEO and Head of Investment Committee for Al Rajhi United, a family-owned investment company with offices in Riyadh, Jeddah, New York and Dubai, focusing on public equity, private equity and real estate. Prior to this, he served as Head of Private Equity Placement as well as Director of Sales and Distribution at Al Rajhi Capital. Mr AlRajhi has also worked with Proctor & Gamble as a systems analyst at their Arabian Peninsula headquarters. Mr AlRajhi holds a Master’s in Business Administration from Stanford University, USA and Bachelors in MIS and Accounting from KFUPM, KSA.
KHALEd ABdULLA yOUSEFMember of the Board
Board member since 2012. Khaled Abdulla Yousef is also an Executive Member of the Board for RAKEZ, and RAK Chamber of Commerce. Mr Yousef has over 23 years’ experience providing fiscal, strategic, and operations leadership with expertise in finance, budgeting and cost management, public relations and media, strategic planning, sales and marketing, profitability and cost analysis and policy and procedures development. Mr Yousef is the founder of KAY Invest, a UAE based Investment Company with a diverse portfolio including finance, properties and trading, he is also the CEO and Member of the Board of Directors at Majan Printing and Packaging Co one of the largest printing and packaging companies in the Middle East. Mr Yousef holds a Bachelor’s Degree in Business Management from the University of Arkansas, USA.
KHALid ALi SAiF AL yAHMAdiMember of the Board
Board member since 2014. Khalid Ali Saif Al Yahmadi is also Investment Director of Oman Investment Fund, leading the resources, manufacturing, and logistics team. Mr Al Yahmadi has more than 13 years’ experience in investment banking, corporate finance, and private equity investments and was previously Chief Investment Officer at Almadina Investments. Mr Al Yahmadi studied at the University of Illinois, USA and has lectured in Economics and Finance at Sultan Qaboos University, Oman.
cORP OR ATE UPdATE
20
PHiLiP gORE-RANdALLExpert Adviser to Audit Committee
Mr Gore-Randall is Expert Adviser to the Audit Committee and is also a Director at Samena Capital. Mr Gore-Randall has extensive experience at a senior level in large private and publicly held international organisations. Previously Mr Gore-Randall was an Audit Partner at Andersen where he ran the firm’s UK practice and subsequently became the Global COO. Mr Gore-Randall is a UK Chartered Accountant and holds an MA from University College, Oxford..
ABdALLAH MASSAAdGroup Chief Executive Officer
Abdallah Massaad is the Group CEO of RAK Ceramics PJSC. He has over 21 years experience in ceramics manufacturing, sales management, product marketing and business leadership. Prior to RAK Ceramics, Abdallah Massaad was GM of ICC SARL, Lebanon. Abdallah Massaad holds post graduate qualifications in Management (DEA in Business Administration) and an undergraduate degree (Maitrise in Business Administration - Marketing) from Université Saint-Esprit de Kaslik, Lebanon.
wASSiM MOUKAHHALExecutive Board Member
Board member since 2016. Mr Moukahhal has more than 11 years’ of experience in private equity investments and is currently serving as Managing Director of Samena Capital Investments Limited in Dubai, focusing on investments within the MENA region. Mr Moukahhal holds an MBA from the Wharton School at the University of Pennsylvania and a Bachelor’s degree in Economics and Finance from McGill University.
Board of Directors, Advisers and Leadership
SEc TiON 1
21
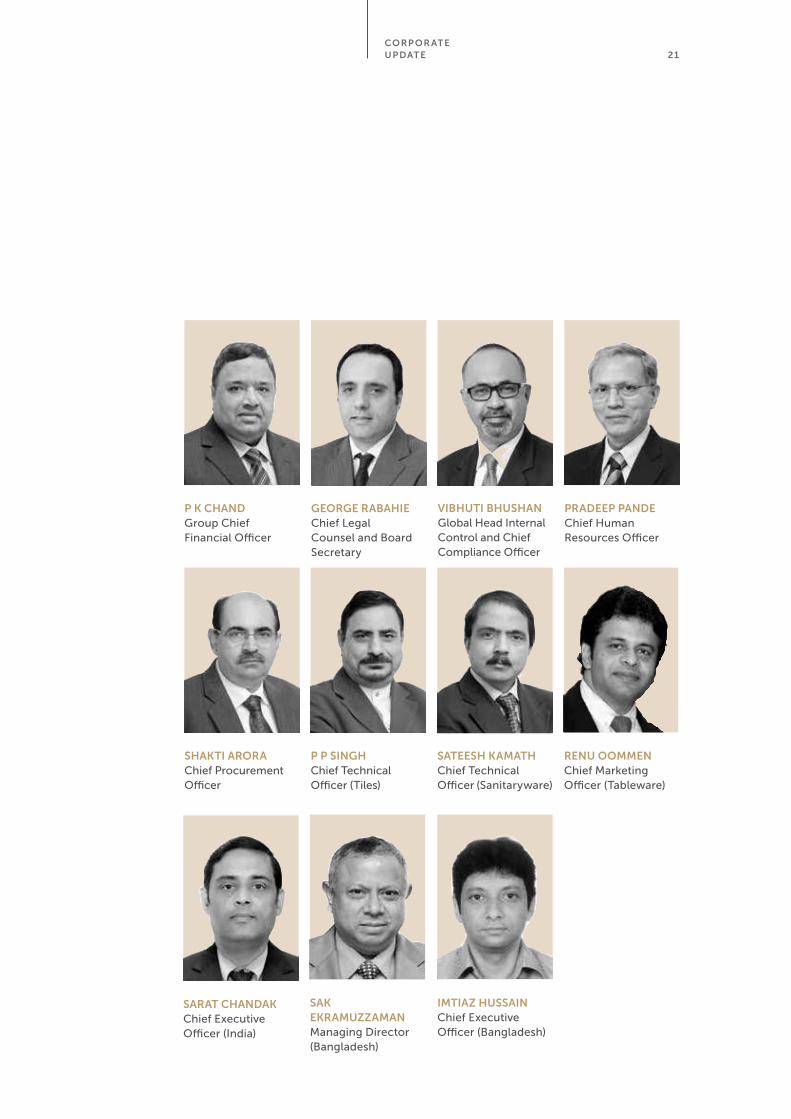
P K cHANdGroup Chief Financial Officer
PRAdEEP PANdEChief Human Resources Officer
gEORgE RABAHiE Chief Legal Counsel and Board Secretary
viBHUTi BHUSHAN Global Head Internal Control and Chief Compliance Officer
SHAKTi ARORAChief Procurement Officer
iMTiAZ HUSSAiN Chief Executive Officer (Bangladesh)
SARAT cHANdAKChief Executive Officer (India)
P P SiNgHChief Technical Officer (Tiles)
SATEESH KAMATH Chief Technical Officer (Sanitaryware)
RENU OOMMENChief Marketing Officer (Tableware)
SAK EKRAMUZZAMAN Managing Director (Bangladesh)
cORP OR ATE UPdATE
22
23SEc TiON 2
OPER ATiONAL UPdATE
24
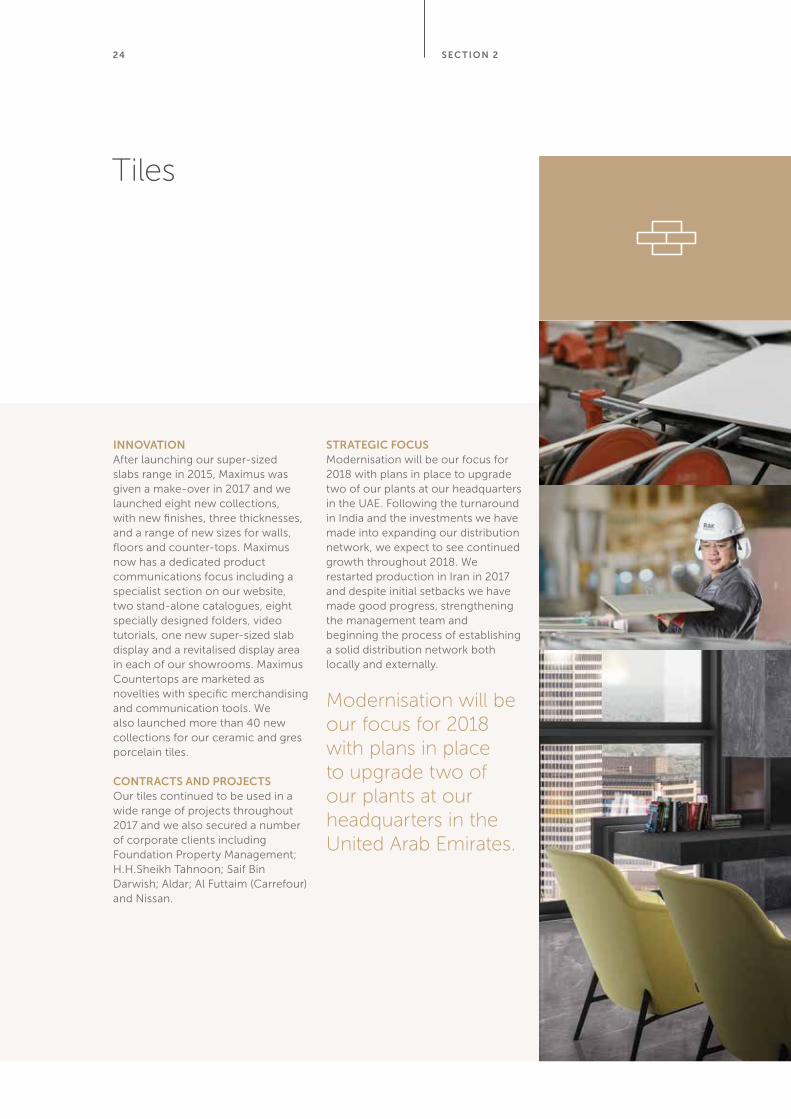
Tiles
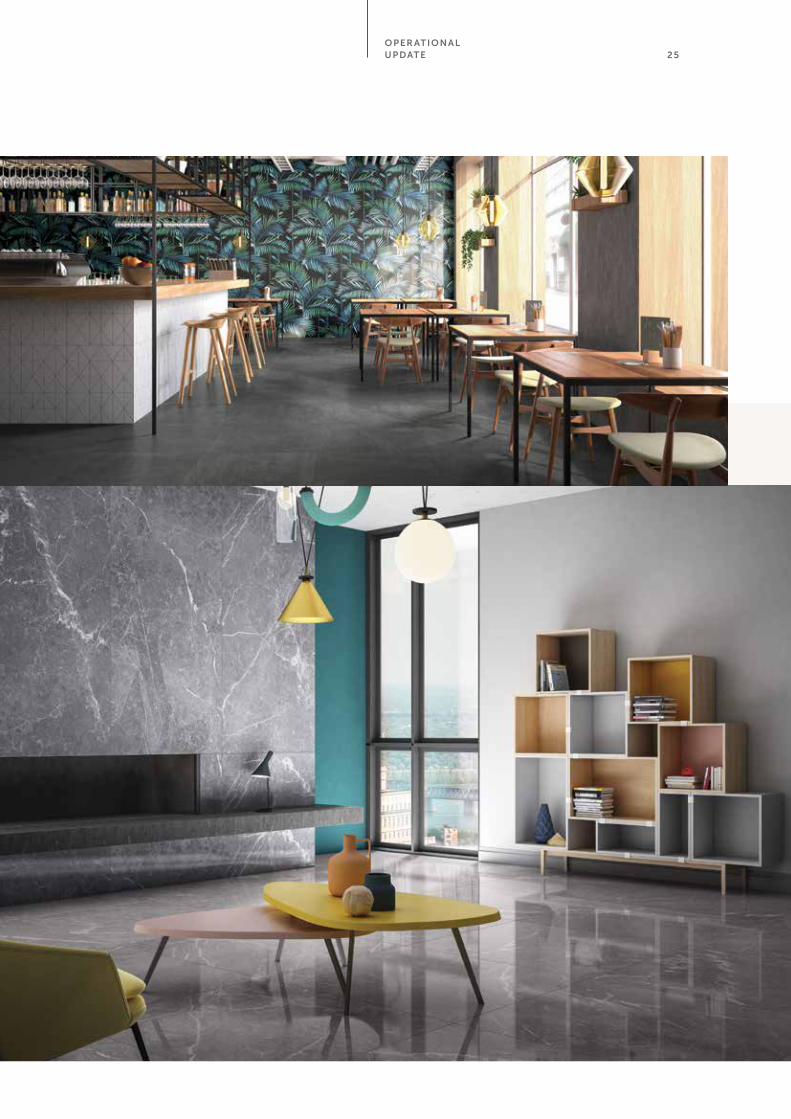
iNNOvATiONAfter launching our super-sized slabs range in 2015, Maximus was given a make-over in 2017 and we launched eight new collections, with new finishes, three thicknesses, and a range of new sizes for walls, floors and counter-tops. Maximus now has a dedicated product communications focus including a specialist section on our website, two stand-alone catalogues, eight specially designed folders, video tutorials, one new super-sized slab display and a revitalised display area in each of our showrooms. Maximus Countertops are marketed as novelties with specific merchandising and communication tools. We also launched more than 40 new collections for our ceramic and gres porcelain tiles.
cONTRAcTS ANd PROjEcTS Our tiles continued to be used in a wide range of projects throughout 2017 and we also secured a number of corporate clients including Foundation Property Management; H.H.Sheikh Tahnoon; Saif Bin Darwish; Aldar; Al Futtaim (Carrefour) and Nissan.
STRATEgic FOcUSModernisation will be our focus for 2018 with plans in place to upgrade two of our plants at our headquarters in the UAE. Following the turnaround in India and the investments we have made into expanding our distribution network, we expect to see continued growth throughout 2018. We restarted production in Iran in 2017 and despite initial setbacks we have made good progress, strengthening the management team and beginning the process of establishing a solid distribution network both locally and externally.
Modernisation will be our focus for 2018 with plans in place to upgrade two of our plants at our headquarters in the United Arab Emirates.
SEc TiON 2
25OPER ATiONAL UPdATE
26
Sanitaryware
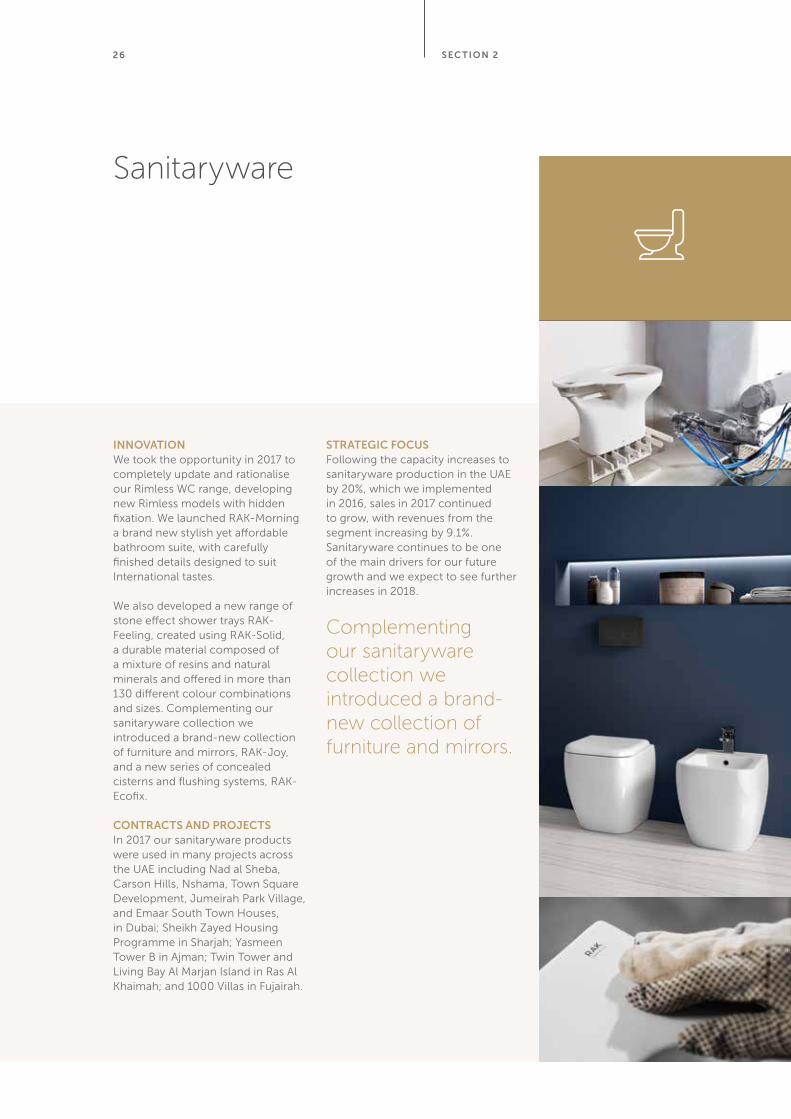
iNNOvATiONWe took the opportunity in 2017 to completely update and rationalise our Rimless WC range, developing new Rimless models with hidden fixation. We launched RAK-Morning a brand new stylish yet affordable bathroom suite, with carefully finished details designed to suit International tastes.
We also developed a new range of stone effect shower trays RAK-Feeling, created using RAK-Solid, a durable material composed of a mixture of resins and natural minerals and offered in more than 130 different colour combinations and sizes. Complementing our sanitaryware collection we introduced a brand-new collection of furniture and mirrors, RAK-Joy, and a new series of concealed cisterns and flushing systems, RAK-Ecofix.
cONTRAcTS ANd PROjEcTSIn 2017 our sanitaryware products were used in many projects across the UAE including Nad al Sheba, Carson Hills, Nshama, Town Square Development, Jumeirah Park Village, and Emaar South Town Houses, in Dubai; Sheikh Zayed Housing Programme in Sharjah; Yasmeen Tower B in Ajman; Twin Tower and Living Bay Al Marjan Island in Ras Al Khaimah; and 1000 Villas in Fujairah.
STRATEgic FOcUSFollowing the capacity increases to sanitaryware production in the UAE by 20%, which we implemented in 2016, sales in 2017 continued to grow, with revenues from the segment increasing by 9.1%. Sanitaryware continues to be one of the main drivers for our future growth and we expect to see further increases in 2018.
Complementing our sanitaryware collection we introduced a brand-new collection of furniture and mirrors.
SEc TiON 2

27OPER ATiONAL UPdATE
28
Faucets
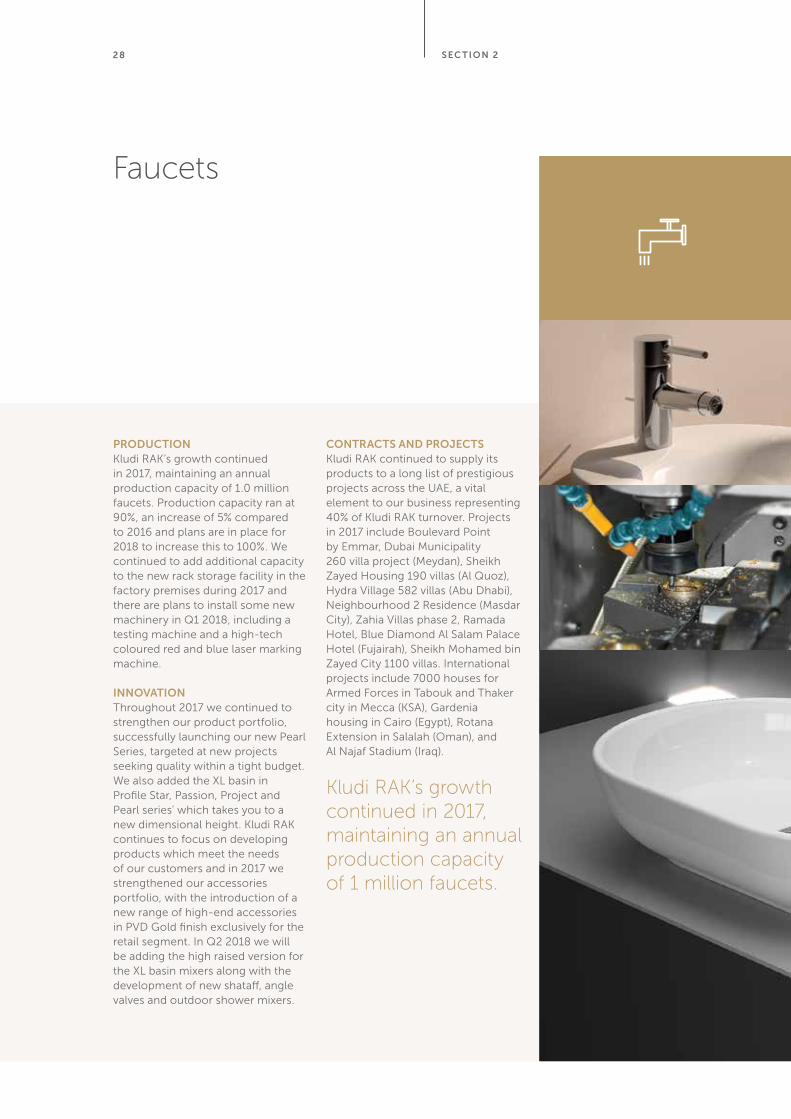
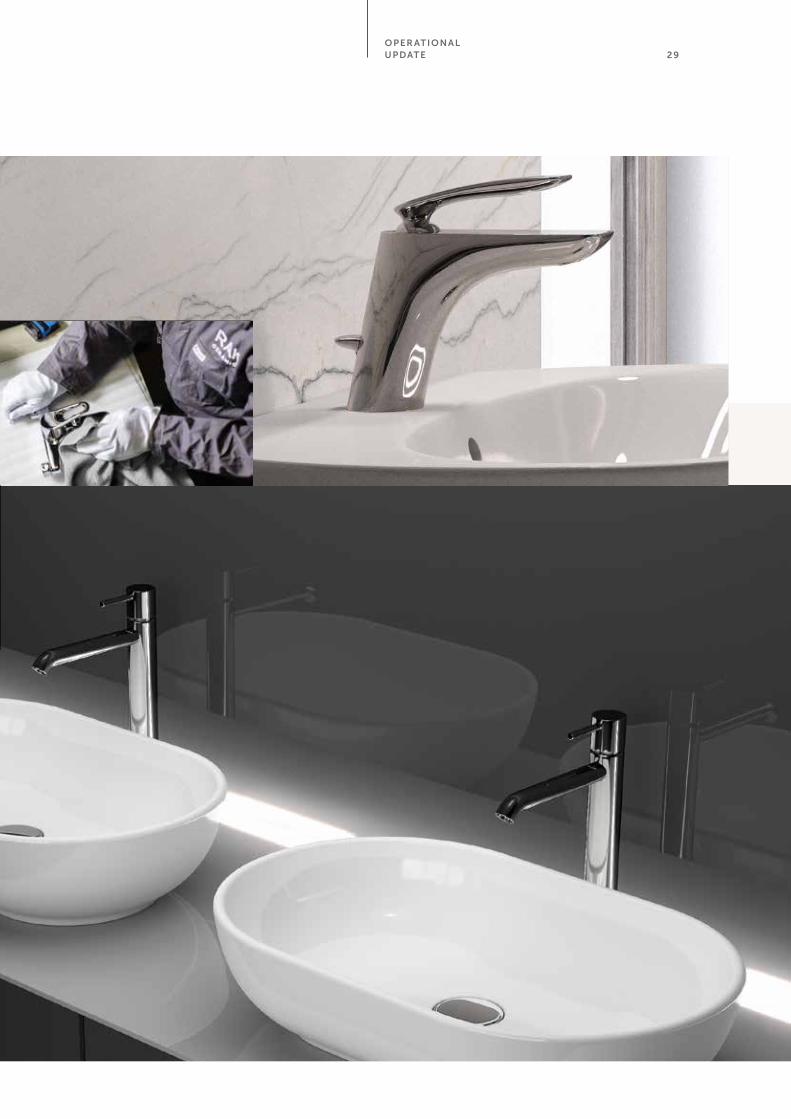
PROdUcTiONKludi RAK’s growth continued in 2017, maintaining an annual production capacity of 1.0 million faucets. Production capacity ran at 90%, an increase of 5% compared to 2016 and plans are in place for 2018 to increase this to 100%. We continued to add additional capacity to the new rack storage facility in the factory premises during 2017 and there are plans to install some new machinery in Q1 2018, including a testing machine and a high-tech coloured red and blue laser marking machine.
iNNOvATiONThroughout 2017 we continued to strengthen our product portfolio, successfully launching our new Pearl Series, targeted at new projects seeking quality within a tight budget. We also added the XL basin in Profile Star, Passion, Project and Pearl series’ which takes you to a new dimensional height. Kludi RAK continues to focus on developing products which meet the needs of our customers and in 2017 we strengthened our accessories portfolio, with the introduction of a new range of high-end accessories in PVD Gold finish exclusively for the retail segment. In Q2 2018 we will be adding the high raised version for the XL basin mixers along with the development of new shataff, angle valves and outdoor shower mixers.
cONTRAcTS ANd PROjEcTSKludi RAK continued to supply its products to a long list of prestigious projects across the UAE, a vital element to our business representing 40% of Kludi RAK turnover. Projects in 2017 include Boulevard Point by Emmar, Dubai Municipality 260 villa project (Meydan), Sheikh Zayed Housing 190 villas (Al Quoz), Hydra Village 582 villas (Abu Dhabi), Neighbourhood 2 Residence (Masdar City), Zahia Villas phase 2, Ramada Hotel, Blue Diamond Al Salam Palace Hotel (Fujairah), Sheikh Mohamed bin Zayed City 1100 villas. International projects include 7000 houses for Armed Forces in Tabouk and Thaker city in Mecca (KSA), Gardenia housing in Cairo (Egypt), Rotana Extension in Salalah (Oman), and Al Najaf Stadium (Iraq).
Kludi RAK’s growth continued in 2017, maintaining an annual production capacity of 1 million faucets.
SEc TiON 2
29
The number of faucets which can be manufactured at Kludi RAK annually
OPER ATiONAL UPdATE
30
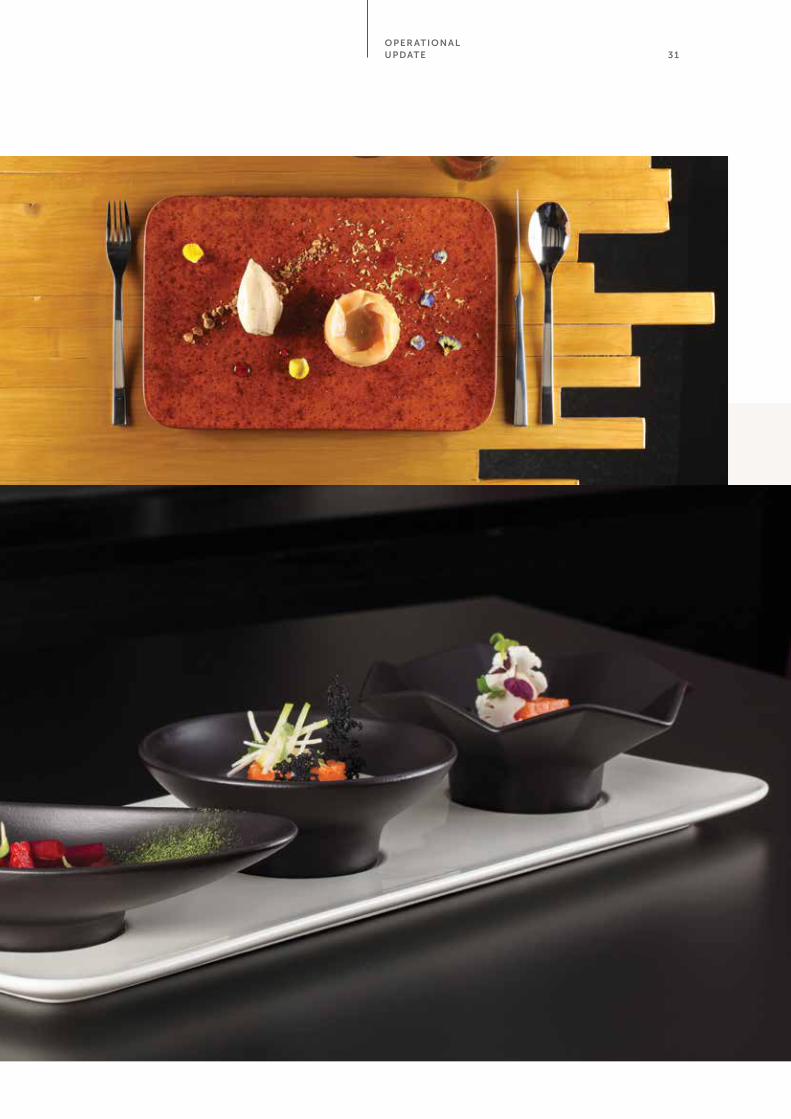
Tableware
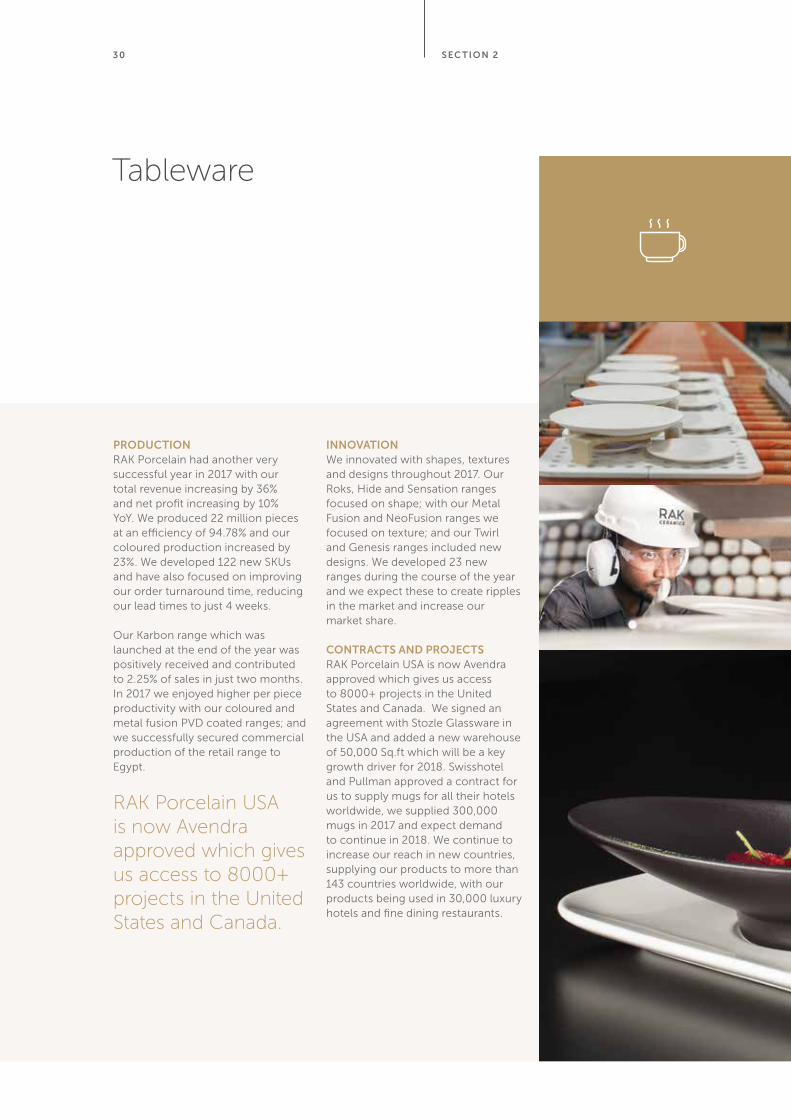
PROdUcTiONRAK Porcelain had another very successful year in 2017 with our total revenue increasing by 36% and net profit increasing by 10% YoY. We produced 22 million pieces at an efficiency of 94.78% and our coloured production increased by 23%. We developed 122 new SKUs and have also focused on improving our order turnaround time, reducing our lead times to just 4 weeks.
Our Karbon range which was launched at the end of the year was positively received and contributed to 2.25% of sales in just two months. In 2017 we enjoyed higher per piece productivity with our coloured and metal fusion PVD coated ranges; and we successfully secured commercial production of the retail range to Egypt.
RAK Porcelain USA is now Avendra approved which gives us access to 8000+ projects in the United States and Canada.
iNNOvATiONWe innovated with shapes, textures and designs throughout 2017. Our Roks, Hide and Sensation ranges focused on shape; with our Metal Fusion and NeoFusion ranges we focused on texture; and our Twirl and Genesis ranges included new designs. We developed 23 new ranges during the course of the year and we expect these to create ripples in the market and increase our market share.
cONTRAcTS ANd PROjEcTSRAK Porcelain USA is now Avendra approved which gives us access to 8000+ projects in the United States and Canada. We signed an agreement with Stozle Glassware in the USA and added a new warehouse of 50,000 Sq.ft which will be a key growth driver for 2018. Swisshotel and Pullman approved a contract for us to supply mugs for all their hotels worldwide, we supplied 300,000 mugs in 2017 and expect demand to continue in 2018. We continue to increase our reach in new countries, supplying our products to more than 143 countries worldwide, with our products being used in 30,000 luxury hotels and fine dining restaurants.
SEc TiON 2
31OPER ATiONAL UPdATE
32
Sales and Marketing
BRANd ROLL OUTFollowing the launch of our new global corporate brand identity in 2016, we shared our new branding guidelines with all our global subsidiaries including India, Bangladesh and Australia. Global brand management is now coordinated by our Marketing and Corporate Communications team centrally, from our headquarters in the UAE.
We also completed and successfully launched our new digital web platform which includes a centralised and shared database, with regional portfolios. Finally phase two of our rebranding was completed with us providing support to traders’ showrooms in the UAE (including displays, signage and marketing collateral).
gLOBAL AdvERTiSiNgWe continued to support our sales and brand development initiatives with a global advertising campaign, focused on magazines across the GCC and internationally. Our advertising campaign included concept artwork as well as many product artworks, and in particular focused on our new collections across tiles, sanitaryware and our super-sized slabs.
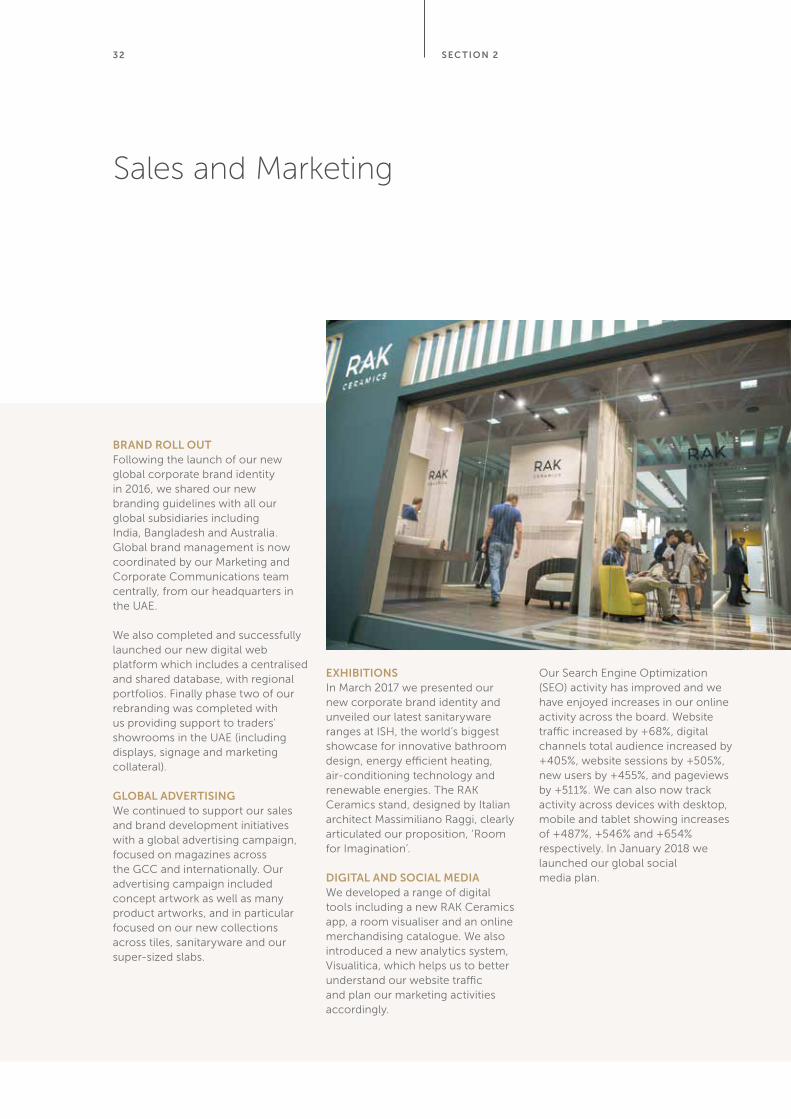
ExHiBiTiONSIn March 2017 we presented our new corporate brand identity and unveiled our latest sanitaryware ranges at ISH, the world’s biggest showcase for innovative bathroom design, energy efficient heating, air-conditioning technology and renewable energies. The RAK Ceramics stand, designed by Italian architect Massimiliano Raggi, clearly articulated our proposition, ‘Room for Imagination’.
digiTAL ANd SOciAL MEdiAWe developed a range of digital tools including a new RAK Ceramics app, a room visualiser and an online merchandising catalogue. We also introduced a new analytics system, Visualitica, which helps us to better understand our website traffic and plan our marketing activities accordingly.
Our Search Engine Optimization (SEO) activity has improved and we have enjoyed increases in our online activity across the board. Website traffic increased by +68%, digital channels total audience increased by +405%, website sessions by +505%, new users by +455%, and pageviews by +511%. We can also now track activity across devices with desktop, mobile and tablet showing increases of +487%, +546% and +654% respectively. In January 2018 we launched our global social media plan.
SEc TiON 2

OPER ATiONAL UPdATE
34
Corporate Social Responsibility
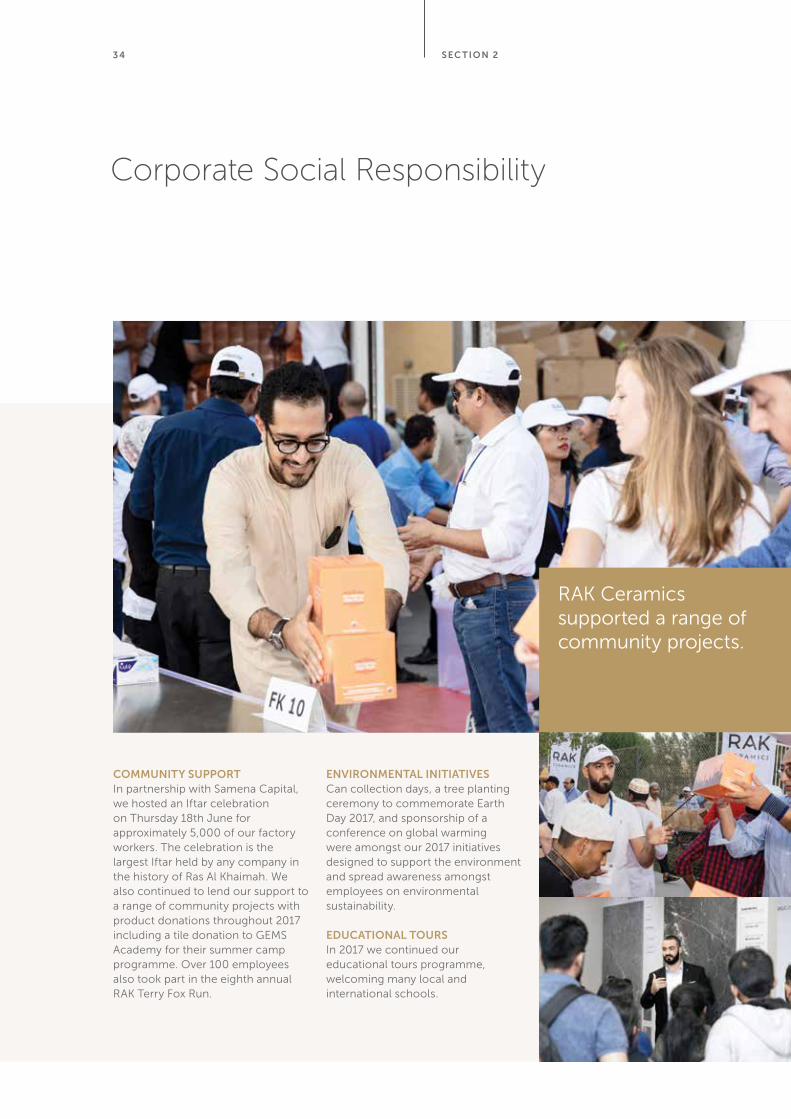
cOMMUNiTy SUPPORTIn partnership with Samena Capital, we hosted an Iftar celebration on Thursday 18th June for approximately 5,000 of our factory workers. The celebration is the largest Iftar held by any company in the history of Ras Al Khaimah. We also continued to lend our support to a range of community projects with product donations throughout 2017 including a tile donation to GEMS Academy for their summer camp programme. Over 100 employees also took part in the eighth annual RAK Terry Fox Run.
ENviRONMENTAL iNiTiATivESCan collection days, a tree planting ceremony to commemorate Earth Day 2017, and sponsorship of a conference on global warming were amongst our 2017 initiatives designed to support the environment and spread awareness amongst employees on environmental sustainability.
EdUcATiONAL TOURSIn 2017 we continued our educational tours programme, welcoming many local and international schools.
RAK Ceramics supported a range of community projects.
SEc TiON 2
35
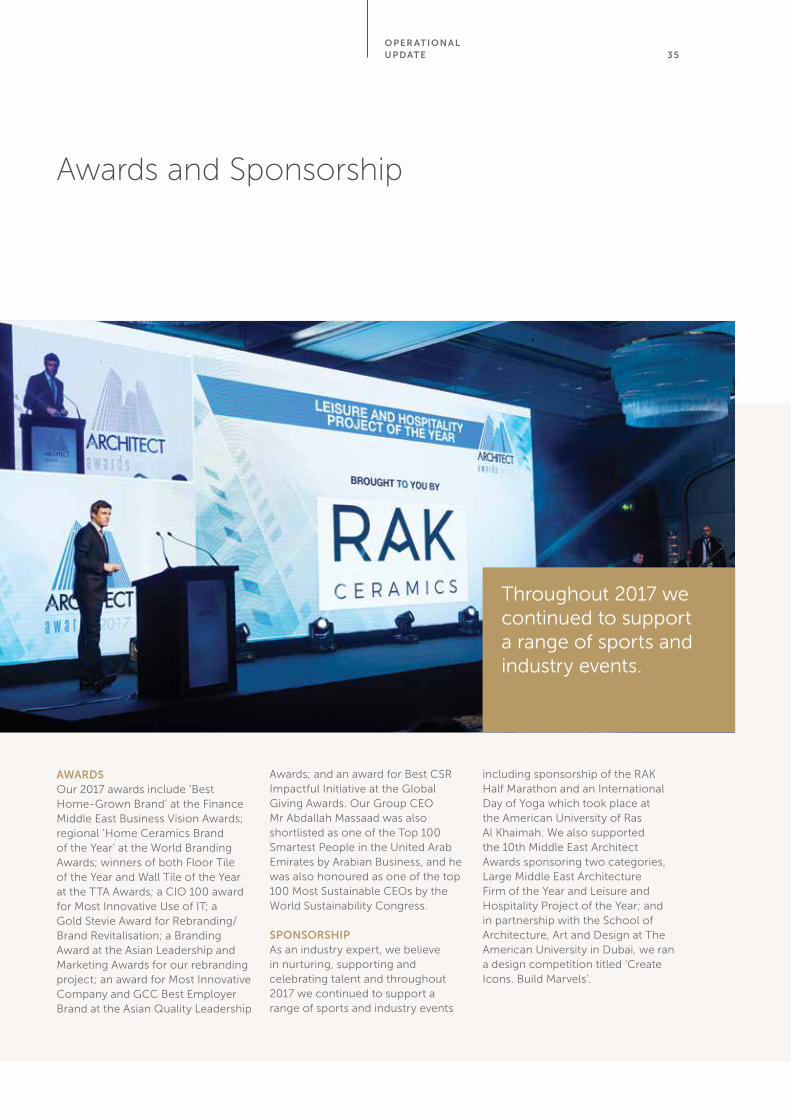
AwARdSOur 2017 awards include ‘Best Home-Grown Brand’ at the Finance Middle East Business Vision Awards; regional ‘Home Ceramics Brand of the Year’ at the World Branding Awards; winners of both Floor Tile of the Year and Wall Tile of the Year at the TTA Awards; a CIO 100 award for Most Innovative Use of IT; a Gold Stevie Award for Rebranding/Brand Revitalisation; a Branding Award at the Asian Leadership and Marketing Awards for our rebranding project; an award for Most Innovative Company and GCC Best Employer Brand at the Asian Quality Leadership
Awards; and an award for Best CSR Impactful Initiative at the Global Giving Awards. Our Group CEO Mr Abdallah Massaad was also shortlisted as one of the Top 100 Smartest People in the United Arab Emirates by Arabian Business, and he was also honoured as one of the top 100 Most Sustainable CEOs by the World Sustainability Congress.
SPONSORSHiPAs an industry expert, we believe in nurturing, supporting and celebrating talent and throughout 2017 we continued to support a range of sports and industry events
including sponsorship of the RAK Half Marathon and an International Day of Yoga which took place at the American University of Ras Al Khaimah. We also supported the 10th Middle East Architect Awards sponsoring two categories, Large Middle East Architecture Firm of the Year and Leisure and Hospitality Project of the Year; and in partnership with the School of Architecture, Art and Design at The American University in Dubai, we ran a design competition titled ‘Create Icons. Build Marvels’.
Awards and Sponsorship
Throughout 2017 we continued to support a range of sports and industry events.
OPER ATiONAL UPdATE
36
Health, Safety, and the Environment
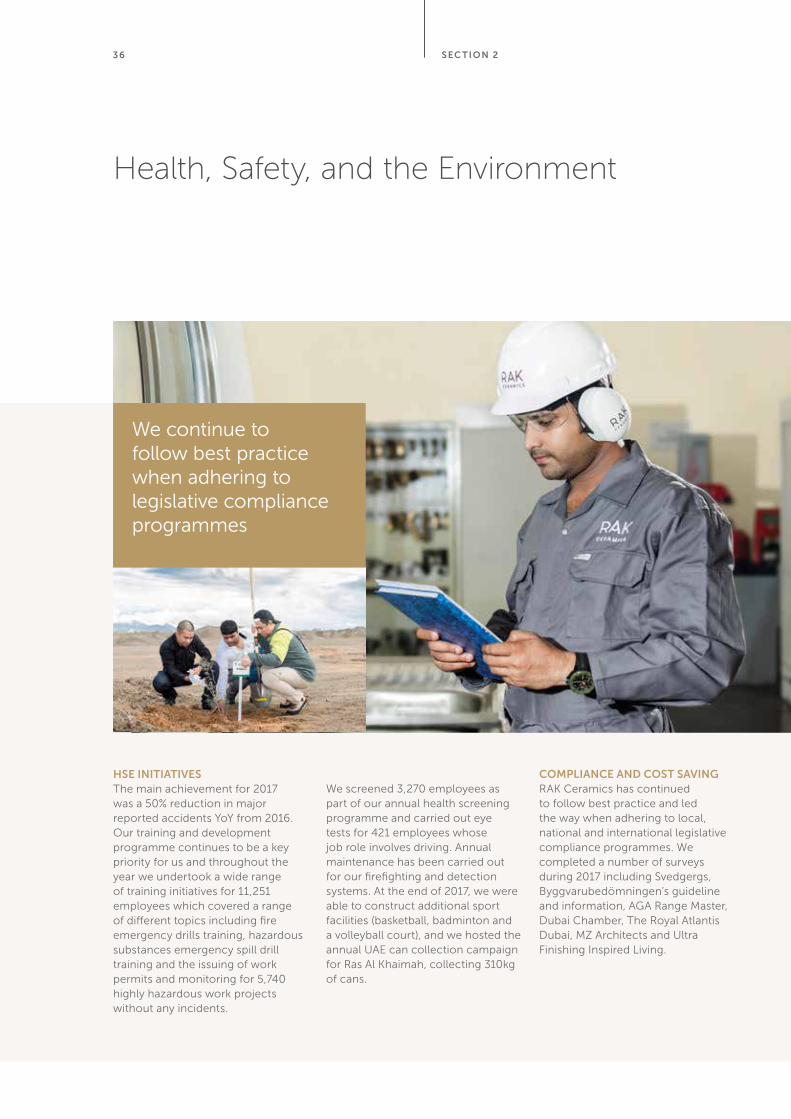
HSE iNiTiATivESThe main achievement for 2017 was a 50% reduction in major reported accidents YoY from 2016. Our training and development programme continues to be a key priority for us and throughout the year we undertook a wide range of training initiatives for 11,251 employees which covered a range of different topics including fire emergency drills training, hazardous substances emergency spill drill training and the issuing of work permits and monitoring for 5,740 highly hazardous work projects without any incidents.
We screened 3,270 employees as part of our annual health screening programme and carried out eye tests for 421 employees whose job role involves driving. Annual maintenance has been carried out for our firefighting and detection systems. At the end of 2017, we were able to construct additional sport facilities (basketball, badminton and a volleyball court), and we hosted the annual UAE can collection campaign for Ras Al Khaimah, collecting 310kg of cans.
cOMPLiANcE ANd cOST SAviNgRAK Ceramics has continued to follow best practice and led the way when adhering to local, national and international legislative compliance programmes. We completed a number of surveys during 2017 including Svedgergs, Byggvarubedömningen’s guideline and information, AGA Range Master, Dubai Chamber, The Royal Atlantis Dubai, MZ Architects and Ultra Finishing Inspired Living.
We continue to follow best practice when adhering to legislative compliance programmes
SEc TiON 2
37
Corporate Governance
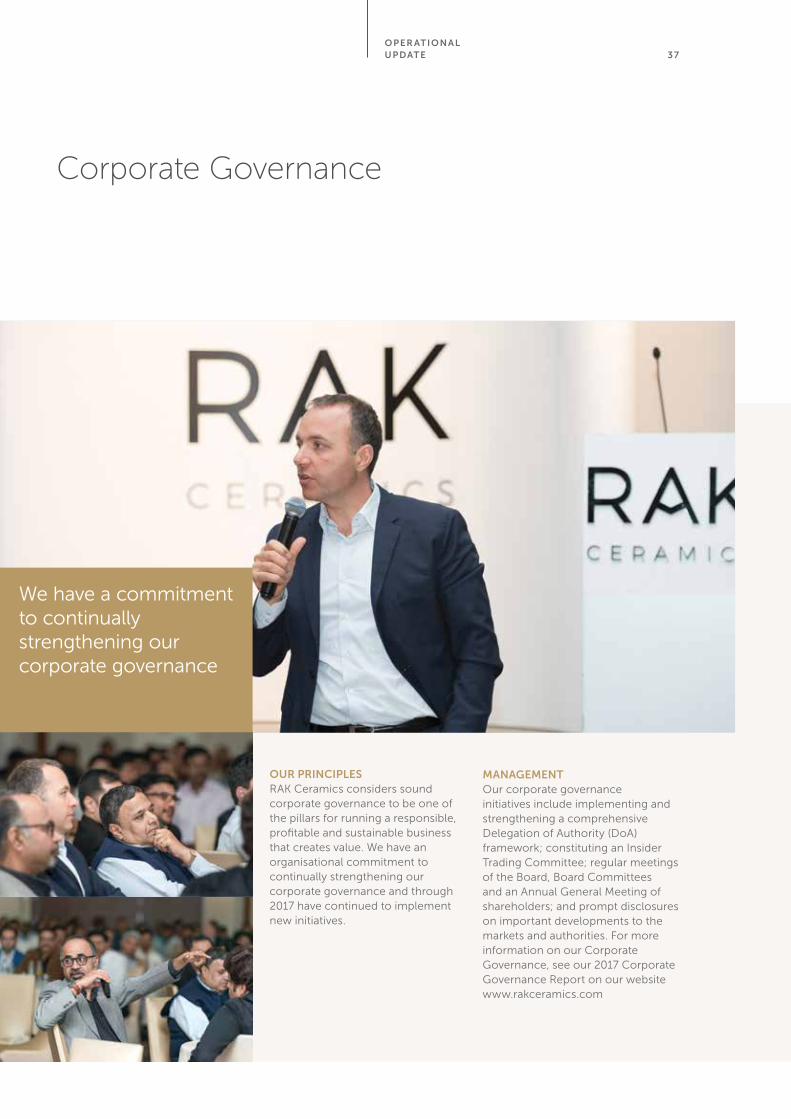
OUR PRiNciPLESRAK Ceramics considers sound corporate governance to be one of the pillars for running a responsible, profitable and sustainable business that creates value. We have an organisational commitment to continually strengthening our corporate governance and through 2017 have continued to implement new initiatives.
MANAgEMENTOur corporate governance initiatives include implementing and strengthening a comprehensive Delegation of Authority (DoA) framework; constituting an Insider Trading Committee; regular meetings of the Board, Board Committees and an Annual General Meeting of shareholders; and prompt disclosures on important developments to the markets and authorities. For more information on our Corporate Governance, see our 2017 Corporate Governance Report on our website www.rakceramics.com
We have a commitment to continually strengthening our corporate governance
OPER ATiONAL UPdATE
38
Training and Development
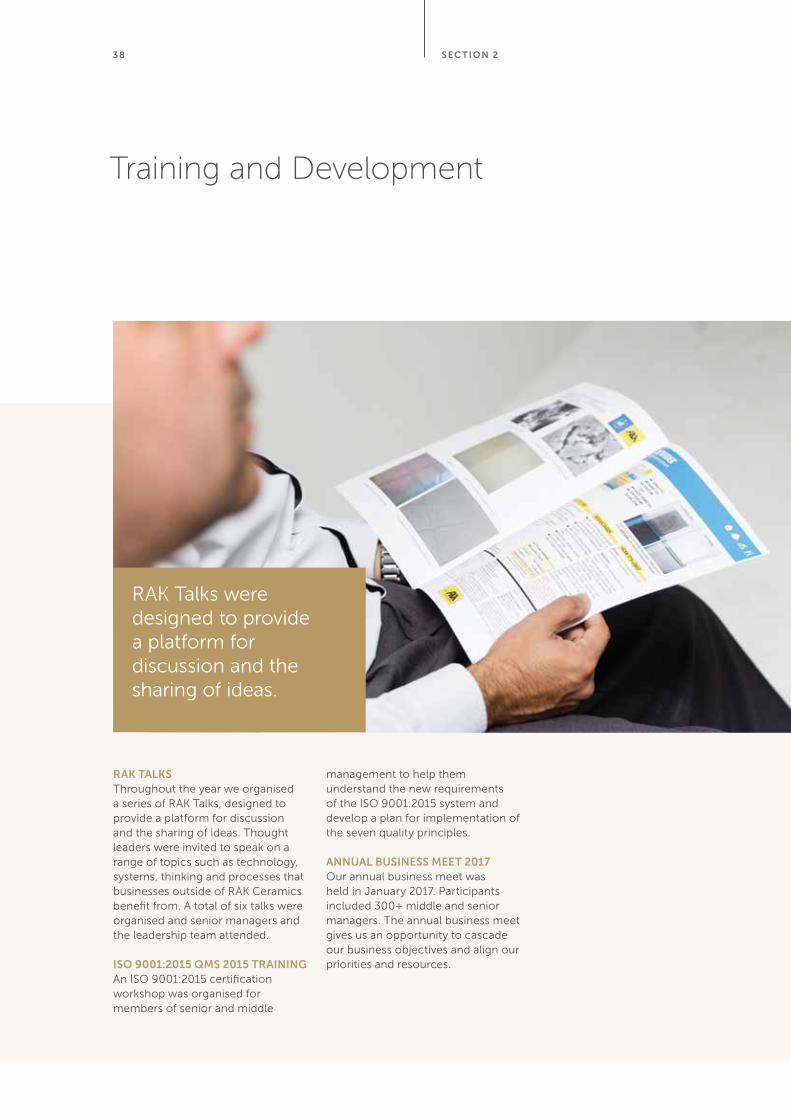
RAK TALKSThroughout the year we organised a series of RAK Talks, designed to provide a platform for discussion and the sharing of ideas. Thought leaders were invited to speak on a range of topics such as technology, systems, thinking and processes that businesses outside of RAK Ceramics benefit from. A total of six talks were organised and senior managers and the leadership team attended.
iSO 9001:2015 QMS 2015 TRAiNiNg An ISO 9001:2015 certification workshop was organised for members of senior and middle
management to help them understand the new requirements of the ISO 9001:2015 system and develop a plan for implementation of the seven quality principles.
ANNUAL BUSiNESS MEET 2017Our annual business meet was held in January 2017. Participants included 300+ middle and senior managers. The annual business meet gives us an opportunity to cascade our business objectives and align our priorities and resources.
RAK Talks were designed to provide a platform for discussion and the sharing of ideas.
SEc TiON 2

39
Information Technology
iT ROAdMAPIn 2017, we continued to build on the strong foundation we set through the move to a global IT operating model. The team successfully supported the strategic priorities in India and KSA through ERP rollouts.
In addition, changes to meet statutory requirements such as Value Added Tax (VAT), Goods and Services Tax (GST) and Revenue Recognition (IFRS) were delivered successfully. Work continued to improve the efficiency and productivity of our IT operation through various automation projects.
Throughout the year, IT security has been our core focus, considering the emerging cyber security threats across the globe in 2017.
The governance processes we established at our IT function level together with key IT strategic projects ensured that we managed the risks proactively.
Throughout the year, IT security has been our core focus, considering the emerging cyber security threats across the globe in 2017.
OPER ATiONAL UPdATE

40
41SEc TiON 3
FiNANciAL RE viEw
financial review
Sec tion 3
Financial Review
Report of the Board of Directors 44
Independent auditors’ report 48
Consolidated income statement 53
Consolidated statement of profit or loss and other comprehensive income 54
Consolidated statement of financial position 55
Consolidated statement of cash flows 56
Consolidated statement of changes in equity 58
Notes to the consolidated financial statements 62
content oveRview
Sec tion 34 4
report of the Board of Directors
On financial performance during the year 2017
06 February 2018
Dear Members,
It is our pleasure to present the business and operations report for the year 2017, along with the Consolidated Financial Statements for the Group as on 31 December 2017.
The Group reported a total revenue of AED 2.9 billion for the year, an increase of 2.2% YoY. Core revenues rose 7.6% YoY to AED 2.6 billion with strong growth from the UAE, Bangladesh, India and the tableware business. Core margins rose 200bps to 32.5% due to improvements in production efficiencies across all plants. Cost reduction initiatives and favourable foreign currency rates also made a positive impact on profitability. The combination of the above has led to an increase in reported net profit for the year to reach AED 315.5 million which also includes gains of AED 61.7 million on disposal of non-core units. Non-core revenues fell 34.0% YoY, following the sale of Electro RAK LLC and downsizing of contracting business. The Value Creation Plan continues to unlock shareholder value by introducing greater efficiencies throughout the business. Progressing on the implementation of the Value Creation Plan, the Group acquired:
• the remaining 50% stake in one of the joint ventures in KSA, ARK International,
• 51% stake in GRIS Ceramics Limited Liability Partnership, India, a unit manufacturing ceramic tiles,
• 51% stake in Gryphon Ceramics Privite Limited, a greenfield to manufacture large format tiles in India, and
• established control over one of its joint ventures, Restofair LLC, trading in kitchen equipment and tableware products.
Financial re view 45
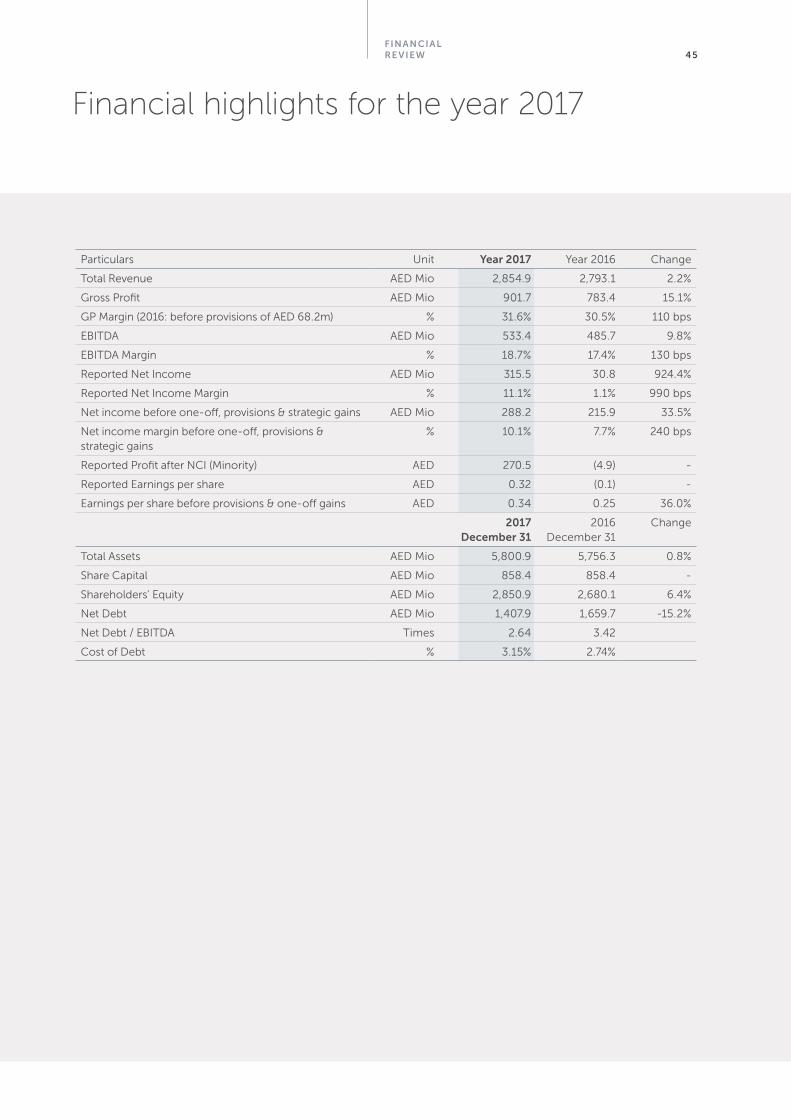
financial highlights for the year 2017
Particulars Unit Year 2017 Year 2016 Change
Total Revenue AED Mio 2,854.9 2,793.1 2.2%
Gross Profit AED Mio 901.7 783.4 15.1%
GP Margin (2016: before provisions of AED 68.2m) % 31.6% 30.5% 110 bps
EBITDA AED Mio 533.4 485.7 9.8%
EBITDA Margin % 18.7% 17.4% 130 bps
Reported Net Income AED Mio 315.5 30.8 924.4%
Reported Net Income Margin % 11.1% 1.1% 990 bps
Net income before one-off, provisions & strategic gains AED Mio 288.2 215.9 33.5%
Net income margin before one-off, provisions & strategic gains
% 10.1% 7.7% 240 bps
Reported Profit after NCI (Minority) AED 270.5 (4.9) -
Reported Earnings per share AED 0.32 (0.1) -
Earnings per share before provisions & one-off gains AED 0.34 0.25 36.0%
2017 December 31
2016 December 31
Change
Total Assets AED Mio 5,800.9 5,756.3 0.8%
Share Capital AED Mio 858.4 858.4 -
Shareholders’ Equity AED Mio 2,850.9 2,680.1 6.4%
Net Debt AED Mio 1,407.9 1,659.7 -15.2%
Net Debt / EBITDA Times 2.64 3.42
Cost of Debt % 3.15% 2.74%
Sec tion 346
cSr, exhibitions, awards and Social activities during the year 2017
Sponsorships:
• Donated and participated in the Terry Fox Run, a consistent drive for funding research on cancer
• Sponsored annual Half Marathon Event in the emirate of RAK
• Sponsored a conference on Global Warming
• Participated in the Earth day Tree Plantations and Can Collection campaign
• International Yoga Day at American University of RAK
• Leisure and Hospitality Project of the Year
• Large Architect Firm of the Year
corporate Social Responsibility activities:
• AUD Design Competition for students of American University in Dubai for contemporary styled interiors
• The largest Iftar celebration in partnership with Samena Capital, was hosted for approximately 5,000 of our factory workers
• Tiles Donation to GEMS Academy – RAK Ceramics donated tiles for a summer camp event, in which school children created art and craft projects
• Can Collection Campaign – Emirates Environmental Group
• Clean Up U.A.E
• Family Fair Sponsorship – DCSN (Dubai Center for Special Needs)
• Birla Institute of Technology – RAK campus (educational tour)
• Students of BITS Mesra (educational tour)
awards:
• CIO 100 award for innovative use of IT to improve business services
• Certificate of Appreciation by Ras Al Khaimah Environment Protection and Development Authority (EPDA-RAK).
• Two ‘The Tiles Association Awards (TTA)’ in the UK - ‘Wall Tile of the Year’ award for Country Brick range, and ‘Floor Tile of the Year’ award for Circle Wood range.
• Best Home-Grown Brand at the recent Finance ME Business Vision Awards across the GCC.
• Stevie International Business Awards - RAK Ceramics won a Gold Stevie Award in the ‘Re-branding/Brand renovation of the year’ category
• Best CSR Initiative (Global Giving Awards) - Iftar Celebration
• Best Employer Brand (Asian Quality Leadership Awards)
• Top 100 Most Sustainable CEO’s (World Sustainability Congress)
• Brand Revitalisation (Asian Leadership and Marketing Awards)
• Most Innovative Company (Asian Quality Leadership Awards)
exhibitions:
• ISH - The world’s leading trade fair for The Bathroom Experience, Building, Energy, Air-conditioning Technology and Renewable Energies
• Cersaie 2017 - RAK Ceramics participated at the Cersaie exhibition in Bologna, Italy in the last week of September 2017. The Company continued to provide its customers with ‘Room for Imagination’ and presented them a complete lifestyle solutions collection of tiles, sanitaryware and complementary bathroom furniture and accessories.
Financial re view 47
investor conferences:
• 2017 South Asia Investor Conference
• 13th EFG Hermes One on One Conference
visits
The UAE facility of the Company was visited by following government officials and business groups during the third quarter. • Ambassadors of India, Singapore, Costa Rica, Belgium
and Somalia
• Spanish and French Business Councils
• Luxembourg Royal Mission including the Prince, Princess and business delegates
• German Business Delegation
• GCC Investors, Traders from Myanmar and Investors
from Turkey.
Future outlook
Looking ahead to 2018, there are a number of external factors that might affect our business with increased competition, gas and oil price volatility and geo-political headwinds. However, we see that GDP is growing in all of our core markets and the UAE and KSA have higher government infrastructure budgets this year: positive trends for growth.
Financial Reporting
Consolidated Financial Statements of the Company, prepared in accordance with International Financial Reporting Standards (IFRSs), fairly present its financial position, the result of its operations, cash flows and changes in equity.
Appropriate accounting policies have been consistently applied and accounting estimates are based on reasonable and prudent judgments. There are no matters which call into question the company’s ability to continue as a going concern.
vote of thanks
The Board would like to take this opportunity to thank government bodies, the shareholders, investors, bankers and employees for their ongoing commitment, co-operation, confidence and continuous support in achieving the company’s objectives.
Chairman Director Chief Executive Officer
Sec tion 348
To the Shareholders RAK Ceramics PJSC
Report on the audit of the consolidated financial statements.
opinion
We have audited the consolidated financial statements of R.A.K Ceramics PJSC (“the Company”) and its subsidiaries (“the Group”), which comprise the consolidated statement of financial position as at 31 December 2017, the consolidated statements of profit or loss and other comprehensive income (comprising a separate consolidated income statement and a consolidated statement of profit or loss and other comprehensive income), changes in equity and cash flows for the year then ended, and notes, comprising significant accounting policies and other explanatory information.
In our opinion, the accompanying consolidated financial statements present fairly, in all material respects, the consolidated financial position of the Group as at 31 December 2017, and its consolidated financial performance and its consolidated cash flows for the year then ended in accordance with International Financial Reporting Standards (IFRS).
Basis for opinion
We conducted our audit in accordance with International Standards on Auditing (ISAs). Our responsibilities under those standards are further described in the Auditors’ Responsibilities for the Audit of the Consolidated Financial Statements section of our report. We are independent of the Group in accordance with International Ethics Standards Board for Accountants Code of Ethics for Professional Accountants (IESBA Code) together with the ethical requirements that are relevant to our audit of the consolidated financial statements in the United Arab Emirates, and we have fulfilled our other ethical responsibilities in accordance with these requirements and the IESBA Code. We believe that the audit evidence we have obtained is sufficient and appropriate to provide a basis for our opinion.
Key audit matters
Key audit matters are those matters that, in our professional judgment, were of the most significance in our audit of the consolidated financial statements of the current period. These matters were addressed in the context of our audit of the consolidated financial statements as a whole, and in forming our opinion thereon, and we do not provide a separate opinion on these matters.
independent auditors’ report
Financial re view 49
Key audit matter
impairment of goodwill
Refer to note 6 to the consolidated financial statements
The Group has recognised goodwill arising from the acquisition of businesses. The Group’s annual impairment testing on goodwill is performed by the Group management using free cash flow projections based on five year future forecasts estimated by the Group management. Due to the inherent uncertainty involved in forecasting and discounting future cash flows, which forms the basis of the assessment of recoverability, this is one of the key judgmental areas that our audit concentrated on.
How our audit addressed the key audit matter• We verified the assessment of Cash Generating
Units (“CGUs”) and considered the operating and management structure with reference to our understanding of the business.
• We considered the Group’s procedures used to develop the forecasts and the principles and integrity of the Group’s discounted cash flow model and reperformed the calculations of the model results to test their accuracy.
• We also assessed the historical accuracy of the Group’s forecasting and corroborated the forecasts with reference to evidence that has been made available during the course of the audit.
• We conducted our own assessments to verify other key inputs, such as the projected growth rate and perpetuity rate.
• We compared the Group’s certain assumptions to externally-derived data where appropriate.
• We assessed the adequacy of the Group’s disclosure in these respects.
Key audit matter
valuation of inventories
Refer to note 18 to the consolidated financial statements
As described in the accounting policies in note 3 to the consolidated financial statements, inventories are carried at the lower of cost and net realisable value. As a result, the management applies judgment in determining the
appropriate provisions for obsolete stock based upon a detailed analysis of old inventory, net realisable value below cost based upon future plans for sale of inventory.
How our audit addressed the key audit matter
We obtained assurance over the appropriateness of the management’s assumptions applied in calculating the value of the inventories and related provisions by:
• verifying the effectiveness of key inventory controls operating over inventories; including sample based physical verification.
• verifying for a sample of individual products that costs have been correctly recorded.
• comparing the net realisable value to the cost price of inventories to check for completeness of the associated provision.
• reviewing the historical accuracy of inventory provisioning, and the level of inventory write-offs during the year.
• recomputing provisions recorded to verify that they are in line with the Group policy.
Key audit matter
credit risk and impairment of trade receivables and due from related parties
Refer to note 33 to the consolidated financial statements
Impairment is a subjective area due to the level of judgement applied by management in determining the impairment allowance. Due to the significance of trade receivables and due from related parties (representing 24.7% of total assets) and the related estimation uncertainty, this is considered a key audit matter.
Judgement is applied by management to determine appropriate parameters and assumptions used to calculate impairment.
How our audit addressed the key audit matter
• Our audit procedures included testing the Group’s credit control procedures, including the controls around credit terms, and reviewing the payment history.
• We tested, on a sample basis, receivable balances that
Sec tion 350
independent auditors’ report (continued)
credit risk and impairment of trade receivables and due from related parties (continued)
• were provided for during the year to determine the accuracy of judgments made by the Group.
• We analysed significant receivables aged over one year which were not provided for by the Group to determine whether there were any indicators of impairment;
• We inspected arrangements and / or correspondences with external and related parties to assess the recoverability of significant long outstanding receivables.
• We assessed the adequacy of the Group’s disclosure in these respects.
Key audit matter
impairment of property, plant and equipment
Refer to note 14 to the consolidated financial statements
The Group has material operational manufacturing units which may be vulnerable to impairment in the event of production and trading performance of these units is below expectations. Management identified separate cash generating units (“CGU”) based on their model and has calculated the recoverable amount of CGU where there were indicators of impairment, as the higher of value in use and fair value less costs of disposal. The value in use is based on discounted future cash flow forecasts over which the management makes judgments on certain key inputs including, for example, discount rates and long term growth rates. In certain instances, the fair value less costs of disposal is estimated by a third party valuer based on their knowledge of each CGU and the markets.
We focused on this area because of the inherent judgment involved in determining key assumptions such as future sales growth, profit margins, discount rates, inflation rates and the magnitude of the assets under consideration.
How our audit addressed the key audit matter
• We obtained, understood and evaluated management’s impairment models. Our audit procedures included a detailed evaluation of the Group’s forecasting procedures and an assessment of the principles of management’s discounted cash flow models. We tested
the mathematical accuracy of the calculations derived from each forecast model and assessed key inputs in the calculations.
• Further, we noted that models used by management are sensitive to changes in key assumptions such as revenue growth and discount rate which, if not achieved, could reasonably be expected to give rise to further impairment charges in the future.
• In cases where the Group has obtained a valuation by an independent third party valuer, our audit procedures included assessment of the competence and independence of the external valuers to determine whether there were any matters that might have affected their objectivity or may have imposed scope limitations on their work. We discussed and challenged the valuation process, methodologies used, determination of sales value of the CGU based on the market conditions prevalent in the country and the significant assumptions and critical judgement areas.
• We assessed the adequacy of the Group’s disclosure in these respects.
Other information
Management is responsible for the other information. The other information comprises the Director’s Report, which we obtained prior to the date of this auditors’ report and the Group’s Annual Report, which is expected to be made available to us after that date.
Our opinion on the consolidated financial statements does not cover the other information and will not express any form of assurance conclusion thereon.
In connection with our audit of the consolidated financial statements, our responsibility is to read the other information identified above and, in doing so, consider whether the other information is materially inconsistent with the consolidated financial statements or our knowledge obtained in the audit, or otherwise appears to be materially misstated.
If, based on the work we have performed on the other information that we obtained prior to the date of this auditors’ report, we conclude that there is a material misstatement of this other information, we are required
Financial re view 51
other information (continued)
to report that fact. We have nothing to report in this regard.
When we read the Group’s Annual Report, if we conclude that there is a material misstatement therein, we are required to communicate the matter to those charged with governance and take appropriate actions in accordance with ISAs.
Responsibilities of management and those charged with governance for the consolidated financial statements
Management is responsible for the preparation and fair presentation of the consolidated financial statements in accordance with IFRS and their preparation in compliance with the applicable provisions of the UAE Federal Law No. (2) of 2015, and for such internal control as management determines is necessary to enable the preparation of consolidated financial statements that are free from material misstatement, whether due to fraud or error.
In preparing the consolidated financial statements, management is responsible for assessing the Group’s ability to continue as a going concern, disclosing, as applicable, matters related to going concern and using the going concern basis of accounting unless management either intends to liquidate the Group or to cease operations, or has no realistic alternative but to do so.
Those charged with governance are responsible for overseeing the Group’s financial reporting process
Auditor’s responsibilities for the audit of the consolidated financial statements
Our objectives are to obtain reasonable assurance about whether the consolidated financial statements as a whole are free from material misstatement, whether due to fraud or error, and to issue an auditor’s report that includes our opinion. Reasonable assurance is a high level of assurance, but is not a guarantee that an audit conducted in accordance with ISAs will always detect a material misstatement when it exists. Misstatements can arise from fraud or error and are considered material if, individually or in the aggregate, they could reasonably be expected to influence the economic decisions of users taken on the basis of these
consolidated financial statementsAs part of an audit in accordance with ISAs, we exercise professional judgment and maintain professional skepticism throughout the audit. We also:
• Identify and assess the risks of material misstatement of the consolidated financial statements, whether due to fraud or error, design and perform audit procedures responsive to those risks, and obtain audit evidence that is sufficient and appropriate to provide a basis for our opinion. The risk of not detecting a material misstatement resulting from fraud is higher than for one resulting from error, as fraud may involve collusion, forgery, intentional omissions, misrepresentations, or the override of internal control.
• Obtain an understanding of internal control relevant to the audit in order to design audit procedures that are appropriate in the circumstances, but not for the purpose of expressing an opinion on the effectiveness of the Group’s internal control.
• Evaluate the appropriateness of accounting policies used and the reasonableness of accounting estimates and related disclosures made by management.
• Conclude on the appropriateness of management’s use of the going concern basis of accounting and, based on the audit evidence obtained, whether a material uncertainty exists related to events or conditions that may cast significant doubt on the Group’s ability to continue as a going concern. If we conclude that a material uncertainty exists, we are required to draw attention in our auditor’s report to the related disclosures in the consolidated financial statements or, if such disclosures are inadequate, to modify our opinion. Our conclusions are based on the audit evidence obtained up to the date of our auditors’ report. However, future events or conditions may cause the Group to cease to continue as a going concern.
• Evaluate the overall presentation, structure and content of the consolidated financial statements, including the disclosures, and whether the consolidated financial statements represent the underlying transactions and events in a manner that achieves fair presentation.
Sec tion 352
independent auditors’ report (continued)
auditor’s Responsibilities for the audit of the consolidated Financial Statements (continued)
• Obtain sufficient appropriate audit evidence regarding the financial information of the entities or business activities within the Group to express an opinion on the consolidated financial statements. We are responsible for the direction, supervision and performance of the group audit. We remain solely responsible for our audit opinion.
We communicate with those charged with governance regarding, among other matters, the planned scope and timing of the audit and significant audit findings, including any significant deficiencies in internal control that we identify during our audit.
We also provide those charged with governance with a statement that we have complied with relevant ethical requirements regarding independence, and communicate with them all relationships and other matters that may reasonably be thought to bear on our independence, and where applicable, related safeguards.
From the matters communicated with those charged with governance, we determine those matters that were of most significance in the audit of the consolidated financial statements of the current period and are therefore the key audit matters. We describe these matters in our auditors’ report unless law or regulation precludes public disclosure about the matter or when, in extremely rare circumstances, we determine that a matter should not be communicated in our report because the adverse consequences of doing so would reasonably be expected to outweigh the public interest benefits of such communication.
Report on other legal and regulatory requirements
Further, as required by the UAE Federal Law No. (2) of 2015, we report that:
i) we have obtained all the information and explanations we considered necessary for the purposes of our audit;
ii) the consolidated financial statements have been prepared and comply, in all material respects, with the applicable provisions of the UAE Federal Law No. (2) of 2015;
iii) the Group has maintained proper books of account;
iv) the financial information included in the Directors’ report, in so far as it relates to these consolidated financial statements, is consistent with the books of account of the Group;
v) as disclosed in note 5 to consolidated financial statements, the Group has purchased shares during the year ended 31 December 2017;
vi) note 28 to the consolidated financial statements discloses material related party transactions and the terms under which they were conducted; and
vii) based on the information that has been made available to us, nothing has come to our attention which causes us to believe that the Group has contravened during the financial year ended 31 December 2017 any of the applicable provisions of the UAE Federal Law No. (2) of 2015 or in respect of the Company, its Articles of Association, which would materially affect its activities or its consolidated financial position as at 31 December 2017.
KPMG Lower Gulf Limited
Fawzi AbuRassRegistration No. 968Dubai, United Arab Emirates
Date: 06 February 2018
Financial re view 53
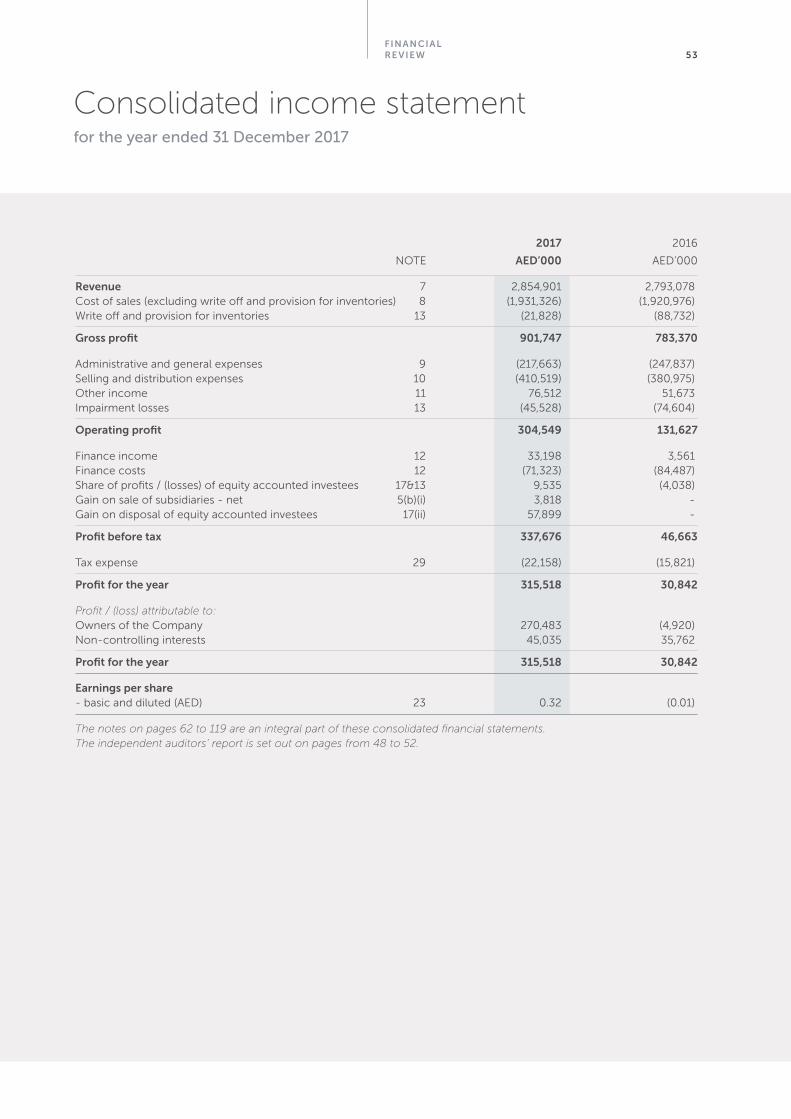
consolidated income statementfor the year ended 31 December 2017
2017 2016
NOTE aeD’000 AED’000
Revenue 7 2,854,901 2,793,078Cost of sales (excluding write off and provision for inventories) 8 (1,931,326) (1,920,976)Write off and provision for inventories 13 (21,828) (88,732)
Gross profit 901,747 783,370
Administrative and general expenses 9 (217,663) (247,837)Selling and distribution expenses 10 (410,519) (380,975)Other income 11 76,512 51,673 Impairment losses 13 (45,528) (74,604)
operating profit 304,549 131,627
Finance income 12 33,198 3,561Finance costs 12 (71,323) (84,487)Share of profits / (losses) of equity accounted investees 17&13 9,535 (4,038)Gain on sale of subsidiaries - net 5(b)(i) 3,818 -Gain on disposal of equity accounted investees 17(ii) 57,899 -
Profit before tax 337,676 46,663
Tax expense 29 (22,158) (15,821)
Profit for the year 315,518 30,842
Profit / (loss) attributable to:Owners of the Company 270,483 (4,920)Non-controlling interests 45,035 35,762
Profit for the year 315,518 30,842
earnings per share - basic and diluted (AED) 23 0.32 (0.01)
The notes on pages 62 to 119 are an integral part of these consolidated financial statements.The independent auditors’ report is set out on pages from 48 to 52.
Sec tion 35 4
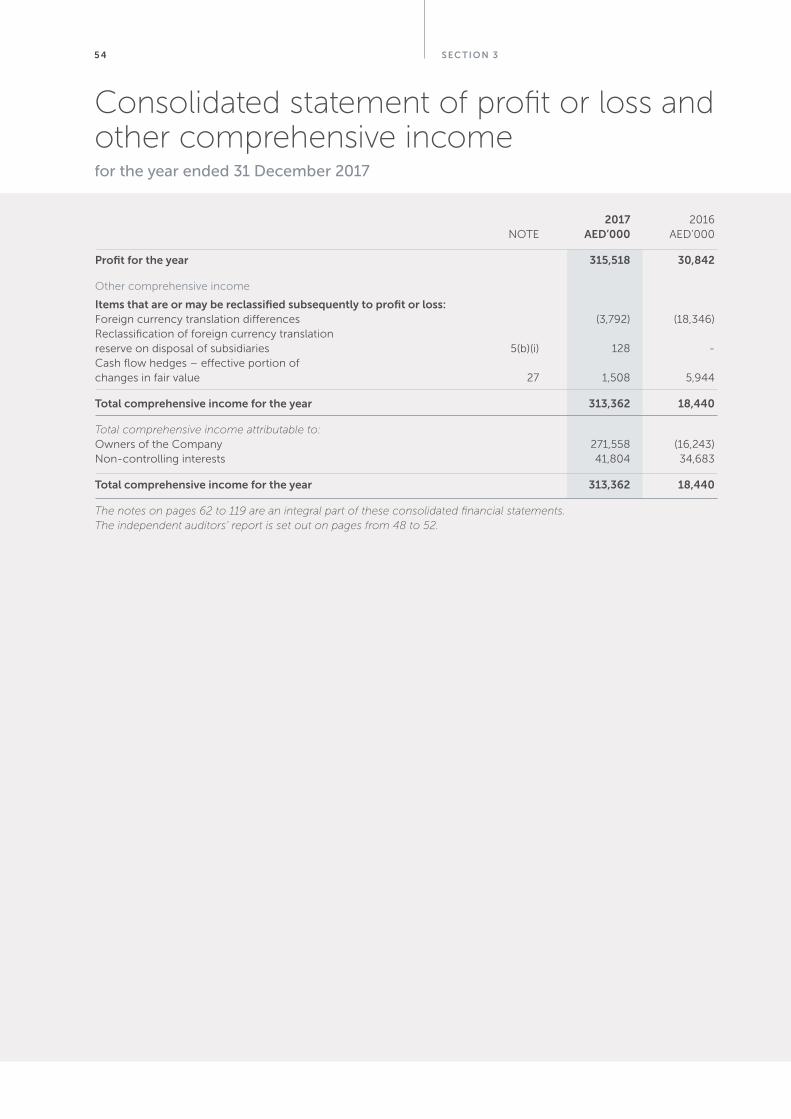
consolidated statement of profit or loss and other comprehensive incomefor the year ended 31 December 2017
2017 2016 NOTE aeD’000 AED’000
Profit for the year 315,518 30,842
Other comprehensive income
items that are or may be reclassified subsequently to profit or loss:Foreign currency translation differences (3,792) (18,346)Reclassification of foreign currency translationreserve on disposal of subsidiaries 5(b)(i) 128 -Cash flow hedges – effective portion ofchanges in fair value 27 1,508 5,944
total comprehensive income for the year 313,362 18,440
Total comprehensive income attributable to:Owners of the Company 271,558 (16,243)Non-controlling interests 41,804 34,683
total comprehensive income for the year 313,362 18,440
The notes on pages 62 to 119 are an integral part of these consolidated financial statements.The independent auditors’ report is set out on pages from 48 to 52.
Financial re view 55
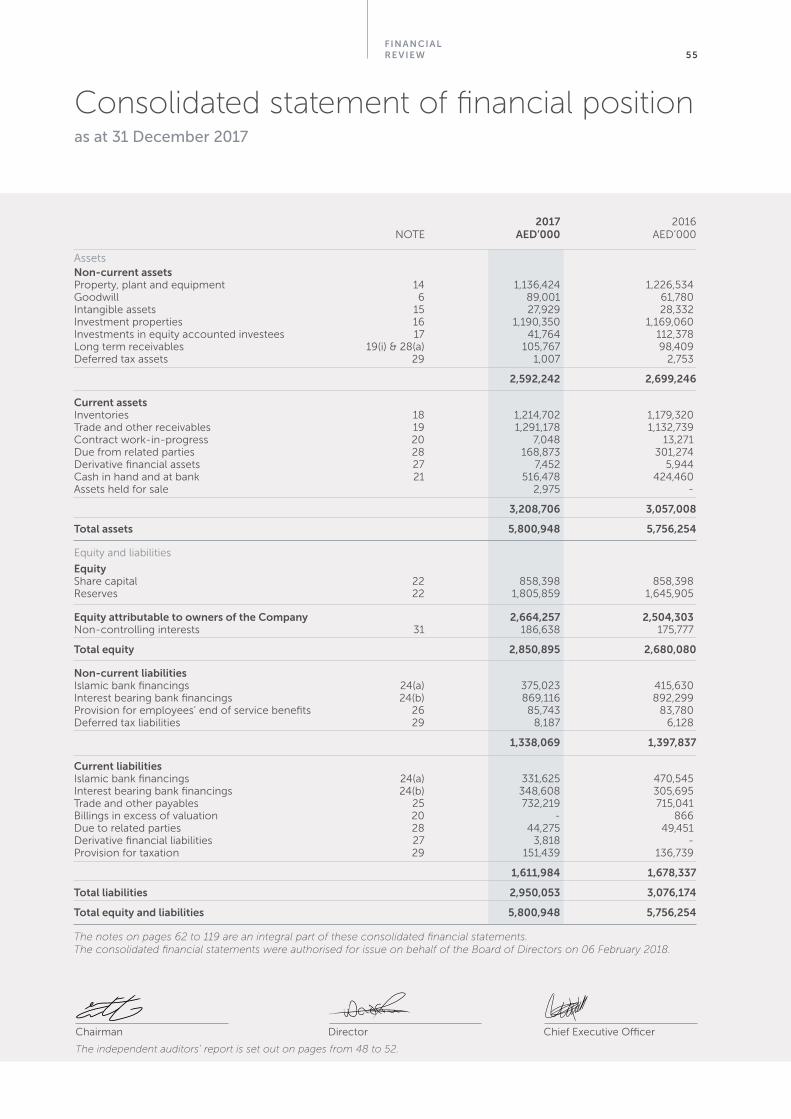
consolidated statement of financial positionas at 31 December 2017
2017 2016 NOTE aeD’000 AED’000
Assetsnon-current assetsProperty, plant and equipment 14 1,136,424 1,226,534Goodwill 6 89,001 61,780Intangible assets 15 27,929 28,332Investment properties 16 1,190,350 1,169,060Investments in equity accounted investees 17 41,764 112,378Long term receivables 19(i) & 28(a) 105,767 98,409Deferred tax assets 29 1,007 2,753
2,592,242 2,699,246
current assetsInventories 18 1,214,702 1,179,320Trade and other receivables 19 1,291,178 1,132,739 Contract work-in-progress 20 7,048 13,271Due from related parties 28 168,873 301,274Derivative financial assets 27 7,452 5,944Cash in hand and at bank 21 516,478 424,460 Assets held for sale 2,975 -
3,208,706 3,057,008
total assets 5,800,948 5,756,254
Equity and liabilities
equityShare capital 22 858,398 858,398Reserves 22 1,805,859 1,645,905
equity attributable to owners of the company 2,664,257 2,504,303Non-controlling interests 31 186,638 175,777
total equity 2,850,895 2,680,080
non-current liabilitiesIslamic bank financings 24(a) 375,023 415,630Interest bearing bank financings 24(b) 869,116 892,299Provision for employees’ end of service benefits 26 85,743 83,780Deferred tax liabilities 29 8,187 6,128
1,338,069 1,397,837
current liabilitiesIslamic bank financings 24(a) 331,625 470,545Interest bearing bank financings 24(b) 348,608 305,695Trade and other payables 25 732,219 715,041 Billings in excess of valuation 20 - 866Due to related parties 28 44,275 49,451 Derivative financial liabilities 27 3,818 -Provision for taxation 29 151,439 136,739
1,611,984 1,678,337
total liabilities 2,950,053 3,076,174
total equity and liabilities 5,800,948 5,756,254
The notes on pages 62 to 119 are an integral part of these consolidated financial statements.The consolidated financial statements were authorised for issue on behalf of the Board of Directors on 06 February 2018.
Chairman Director Chief Executive Officer
The independent auditors’ report is set out on pages from 48 to 52.
Sec tion 356
2017 2016 aeD’000 AED’000
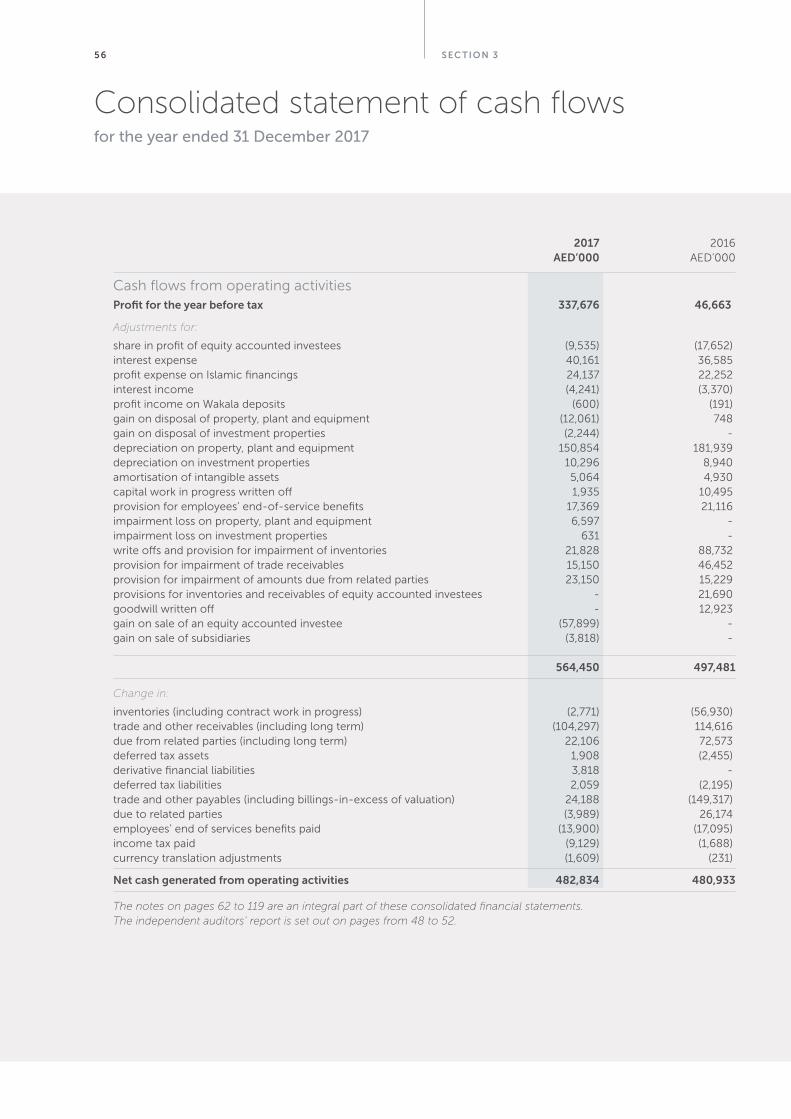
Cash flows from operating activitiesProfit for the year before tax 337,676 46,663
Adjustments for:
share in profit of equity accounted investees (9,535) (17,652)interest expense 40,161 36,585profit expense on Islamic financings 24,137 22,252interest income (4,241) (3,370)profit income on Wakala deposits (600) (191)gain on disposal of property, plant and equipment (12,061) 748gain on disposal of investment properties (2,244) -depreciation on property, plant and equipment 150,854 181,939depreciation on investment properties 10,296 8,940amortisation of intangible assets 5,064 4,930capital work in progress written off 1,935 10,495provision for employees’ end-of-service benefits 17,369 21,116impairment loss on property, plant and equipment 6,597 -impairment loss on investment properties 631 -write offs and provision for impairment of inventories 21,828 88,732 provision for impairment of trade receivables 15,150 46,452provision for impairment of amounts due from related parties 23,150 15,229provisions for inventories and receivables of equity accounted investees - 21,690goodwill written off - 12,923gain on sale of an equity accounted investee (57,899) -gain on sale of subsidiaries (3,818) -
564,450 497,481
Change in:
inventories (including contract work in progress) (2,771) (56,930)trade and other receivables (including long term) (104,297) 114,616due from related parties (including long term) 22,106 72,573deferred tax assets 1,908 (2,455)derivative financial liabilities 3,818 -deferred tax liabilities 2,059 (2,195)trade and other payables (including billings-in-excess of valuation) 24,188 (149,317)due to related parties (3,989) 26,174employees’ end of services benefits paid (13,900) (17,095)income tax paid (9,129) (1,688)currency translation adjustments (1,609) (231)
net cash generated from operating activities 482,834 480,933
The notes on pages 62 to 119 are an integral part of these consolidated financial statements.The independent auditors’ report is set out on pages from 48 to 52.
consolidated statement of cash flowsfor the year ended 31 December 2017
Financial re view 57
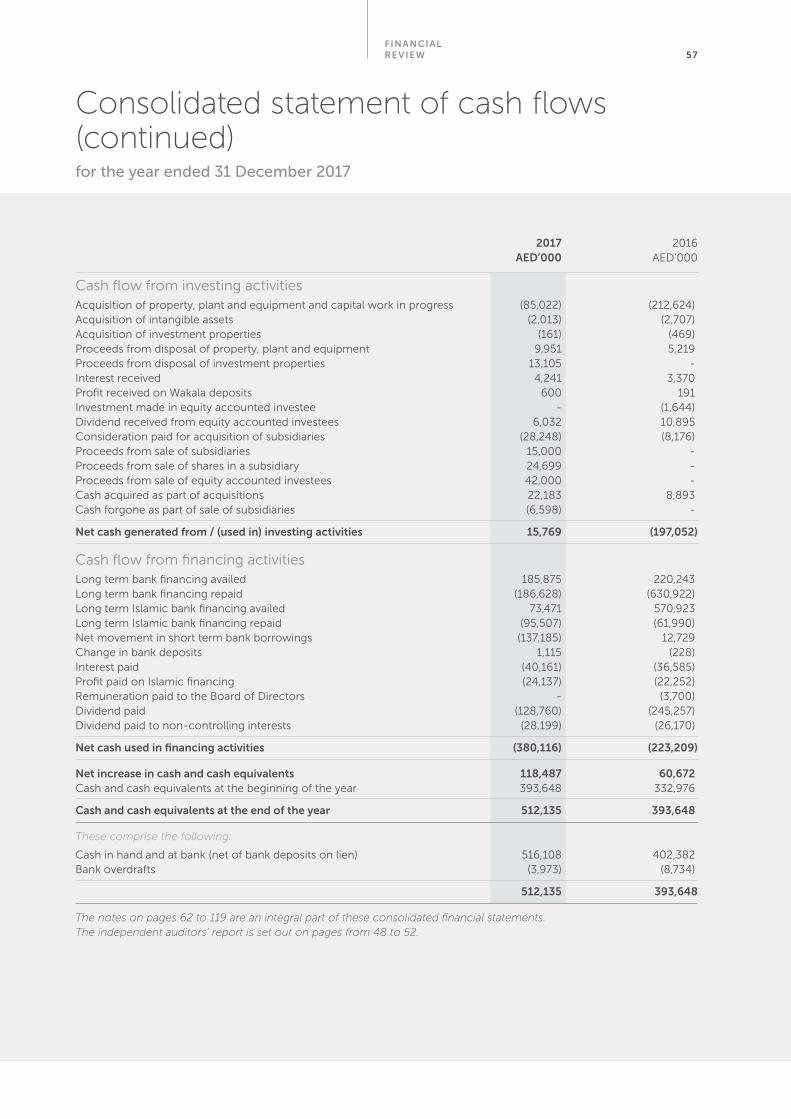
consolidated statement of cash flows (continued)for the year ended 31 December 2017
2017 2016 aeD’000 AED’000
Cash flow from investing activitiesAcquisition of property, plant and equipment and capital work in progress (85,022) (212,624)Acquisition of intangible assets (2,013) (2,707)Acquisition of investment properties (161) (469)Proceeds from disposal of property, plant and equipment 9,951 5,219Proceeds from disposal of investment properties 13,105 -Interest received 4,241 3,370Profit received on Wakala deposits 600 191Investment made in equity accounted investee - (1,644)Dividend received from equity accounted investees 6,032 10,895Consideration paid for acquisition of subsidiaries (28,248) (8,176)Proceeds from sale of subsidiaries 15,000 -Proceeds from sale of shares in a subsidiary 24,699 -Proceeds from sale of equity accounted investees 42,000 -Cash acquired as part of acquisitions 22,183 8,893Cash forgone as part of sale of subsidiaries (6,598) -
net cash generated from / (used in) investing activities 15,769 (197,052)
Cash flow from financing activities Long term bank financing availed 185,875 220,243Long term bank financing repaid (186,628) (630,922)Long term Islamic bank financing availed 73,471 570,923Long term Islamic bank financing repaid (95,507) (61,990)Net movement in short term bank borrowings (137,185) 12,729Change in bank deposits 1,115 (228)Interest paid (40,161) (36,585)Profit paid on Islamic financing (24,137) (22,252)Remuneration paid to the Board of Directors - (3,700)Dividend paid (128,760) (245,257)Dividend paid to non-controlling interests (28,199) (26,170)
net cash used in financing activities (380,116) (223,209)
net increase in cash and cash equivalents 118,487 60,672Cash and cash equivalents at the beginning of the year 393,648 332,976
cash and cash equivalents at the end of the year 512,135 393,648
These comprise the following:
Cash in hand and at bank (net of bank deposits on lien) 516,108 402,382Bank overdrafts (3,973) (8,734)
512,135 393,648
The notes on pages 62 to 119 are an integral part of these consolidated financial statements.The independent auditors’ report is set out on pages from 48 to 52.
Sec tion 358
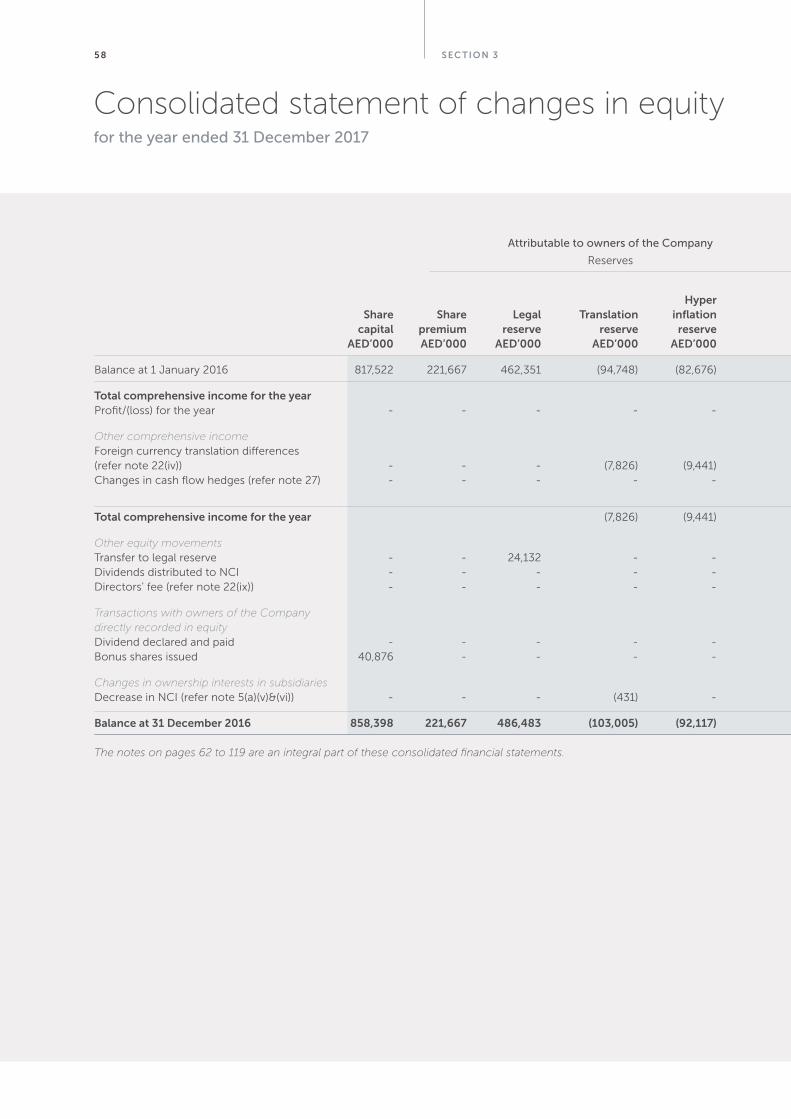
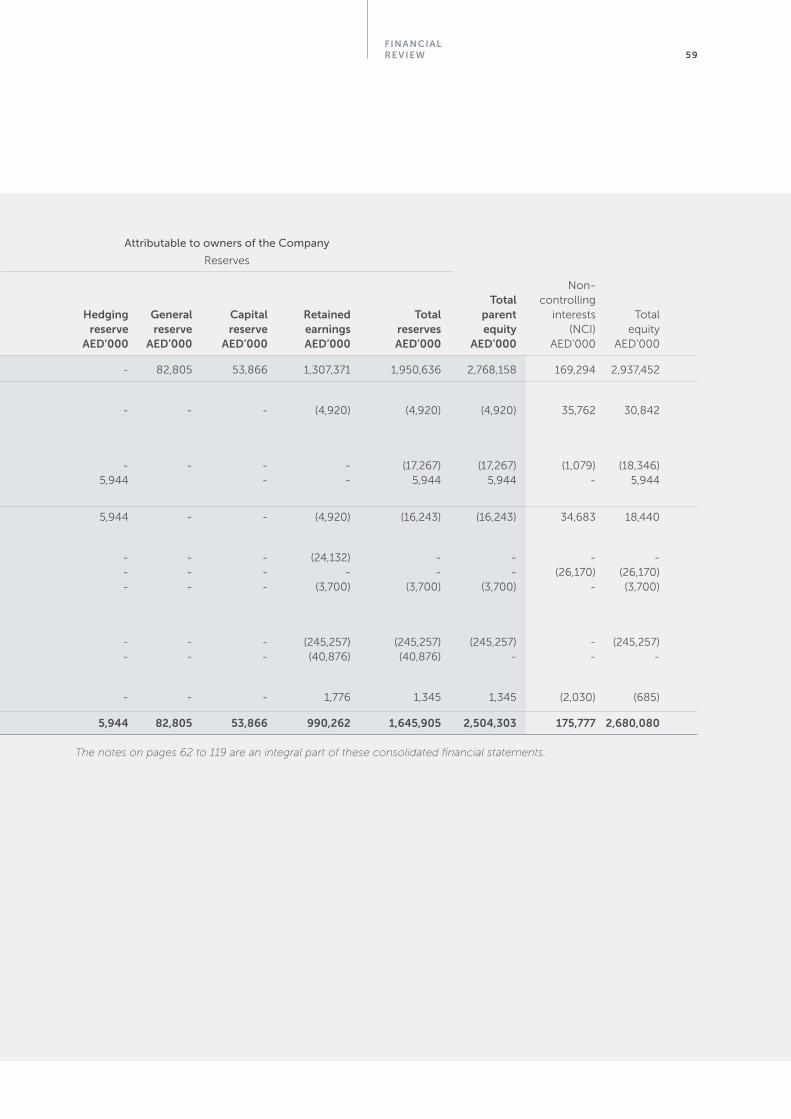
consolidated statement of changes in equityfor the year ended 31 December 2017
Non- Hyper total controlling Share Share legal translation inflation Hedging General capital Retained total parent interests Total capital premium reserve reserve reserve reserve reserve reserve earnings reserves equity (NCI) equity aeD’000 aeD’000 aeD’000 aeD’000 aeD’000 aeD’000 aeD’000 aeD’000 aeD’000 aeD’000 aeD’000 AED’000 AED’000
Balance at 1 January 2016 817,522 221,667 462,351 (94,748) (82,676) - 82,805 53,866 1,307,371 1,950,636 2,768,158 169,294 2,937,452
total comprehensive income for the yearProfit/(loss) for the year - - - - - - - - (4,920) (4,920) (4,920) 35,762 30,842
Other comprehensive incomeForeign currency translation differences(refer note 22(iv)) - - - (7,826) (9,441) - - - - (17,267) (17,267) (1,079) (18,346)Changes in cash flow hedges (refer note 27) - - - - - 5,944 - - 5,944 5,944 - 5,944
total comprehensive income for the year (7,826) (9,441) 5,944 - - (4,920) (16,243) (16,243) 34,683 18,440
Other equity movements Transfer to legal reserve - - 24,132 - - - - - (24,132) - - - -Dividends distributed to NCI - - - - - - - - - - - (26,170) (26,170)Directors’ fee (refer note 22(ix)) - - - - - - - - (3,700) (3,700) (3,700) - (3,700)
Transactions with owners of the Companydirectly recorded in equityDividend declared and paid - - - - - - - - (245,257) (245,257) (245,257) - (245,257) Bonus shares issued 40,876 - - - - - - - (40,876) (40,876) - - -
Changes in ownership interests in subsidiariesDecrease in NCI (refer note 5(a)(v)&(vi)) - - - (431) - - - - 1,776 1,345 1,345 (2,030) (685)
Balance at 31 December 2016 858,398 221,667 486,483 (103,005) (92,117) 5,944 82,805 53,866 990,262 1,645,905 2,504,303 175,777 2,680,080 The notes on pages 62 to 119 are an integral part of these consolidated financial statements.
Attributable to owners of the Company
Reserves
Financial re view 59
Non- Hyper total controlling Share Share legal translation inflation Hedging General capital Retained total parent interests Total capital premium reserve reserve reserve reserve reserve reserve earnings reserves equity (NCI) equity aeD’000 aeD’000 aeD’000 aeD’000 aeD’000 aeD’000 aeD’000 aeD’000 aeD’000 aeD’000 aeD’000 AED’000 AED’000
Balance at 1 January 2016 817,522 221,667 462,351 (94,748) (82,676) - 82,805 53,866 1,307,371 1,950,636 2,768,158 169,294 2,937,452
total comprehensive income for the yearProfit/(loss) for the year - - - - - - - - (4,920) (4,920) (4,920) 35,762 30,842
Other comprehensive incomeForeign currency translation differences(refer note 22(iv)) - - - (7,826) (9,441) - - - - (17,267) (17,267) (1,079) (18,346)Changes in cash flow hedges (refer note 27) - - - - - 5,944 - - 5,944 5,944 - 5,944
total comprehensive income for the year (7,826) (9,441) 5,944 - - (4,920) (16,243) (16,243) 34,683 18,440
Other equity movements Transfer to legal reserve - - 24,132 - - - - - (24,132) - - - -Dividends distributed to NCI - - - - - - - - - - - (26,170) (26,170)Directors’ fee (refer note 22(ix)) - - - - - - - - (3,700) (3,700) (3,700) - (3,700)
Transactions with owners of the Companydirectly recorded in equityDividend declared and paid - - - - - - - - (245,257) (245,257) (245,257) - (245,257) Bonus shares issued 40,876 - - - - - - - (40,876) (40,876) - - -
Changes in ownership interests in subsidiariesDecrease in NCI (refer note 5(a)(v)&(vi)) - - - (431) - - - - 1,776 1,345 1,345 (2,030) (685)
Balance at 31 December 2016 858,398 221,667 486,483 (103,005) (92,117) 5,944 82,805 53,866 990,262 1,645,905 2,504,303 175,777 2,680,080 The notes on pages 62 to 119 are an integral part of these consolidated financial statements.
Attributable to owners of the Company
Reserves
The notes on pages 62 to 119 are an integral part of these consolidated financial statements.
Sec tion 360
consolidated statement of changes in equity (continued)for the year ended 31 December 2017
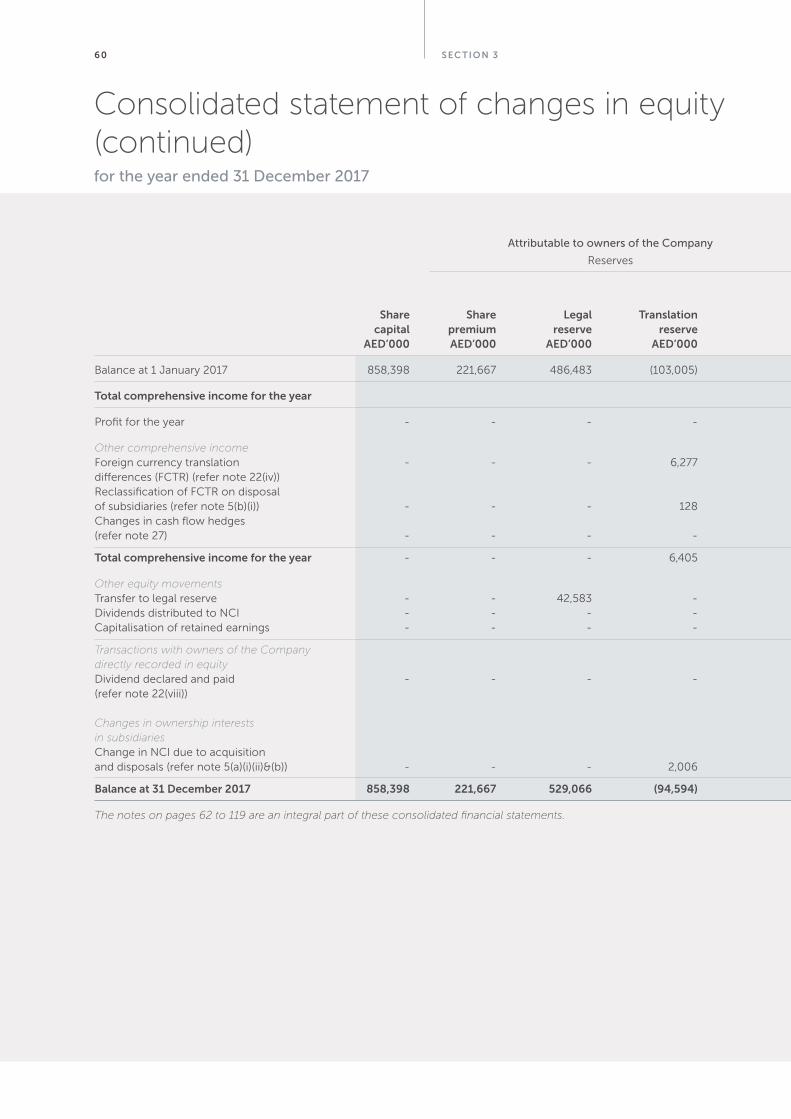
Non- Hyper total controlling Share Share legal translation inflation Hedging General capital Retained total parent interests Total capital premium reserve reserve reserve reserve reserve reserve earnings reserves equity (NCI) equity aeD’000 aeD’000 aeD’000 aeD’000 aeD’000 aeD’000 aeD’000 aeD’000 aeD’000 aeD’000 aeD’000 AED’000 AED’000
Balance at 1 January 2017 858,398 221,667 486,483 (103,005) (92,117) 5,944 82,805 53,866 990,262 1,645,905 2,504,303 175,777 2,680,080
total comprehensive income for the year
Profit for the year - - - - - - - - 270,483 270,483 270,483 45,035 315,518
Other comprehensive incomeForeign currency translation - - - 6,277 (6,838) - - - - (561) (561) (3,231) (3,792)differences (FCTR) (refer note 22(iv)) Reclassification of FCTR on disposalof subsidiaries (refer note 5(b)(i)) - - - 128 - - - - - 128 128 - 128Changes in cash flow hedges (refer note 27) - - - - - 1,508 - - - 1,508 1,508 - 1,508
total comprehensive income for the year - - - 6,405 (6,838) 1,508 - - 270,483 271,558 271,558 41,804 313,362
Other equity movements Transfer to legal reserve - - 42,583 - - - - - (42,583) - - - -Dividends distributed to NCI - - - - - - - - - - - (28,199) (28,199)Capitalisation of retained earnings - - - - - - - 5,570 (5,570) - - - -
Transactions with owners of the Companydirectly recorded in equityDividend declared and paid - - - - - - - - (128,760) (128,760) (128,760) - (128,760)(refer note 22(viii))
Changes in ownership interests in subsidiariesChange in NCI due to acquisition and disposals (refer note 5(a)(i)(ii)&(b)) - - - 2,006 - - - (6,638) 21,788 17,156 17,156 (2,744) 14,412
Balance at 31 December 2017 858,398 221,667 529,066 (94,594) (98,955) 7,452 82,805 52,798 1,105,620 1,805,859 2,664,257 186,638 2,850,895
Attributable to owners of the Company
Reserves
The notes on pages 62 to 119 are an integral part of these consolidated financial statements.
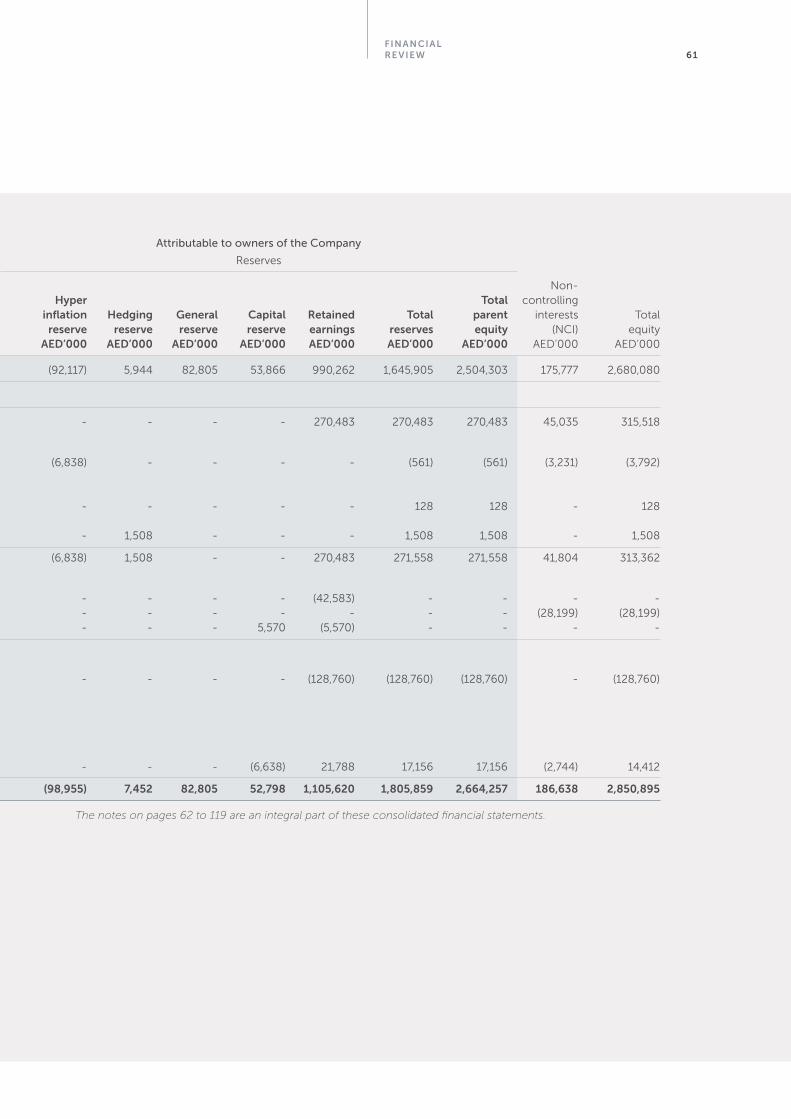
Financial re view 61
Non- Hyper total controlling Share Share legal translation inflation Hedging General capital Retained total parent interests Total capital premium reserve reserve reserve reserve reserve reserve earnings reserves equity (NCI) equity aeD’000 aeD’000 aeD’000 aeD’000 aeD’000 aeD’000 aeD’000 aeD’000 aeD’000 aeD’000 aeD’000 AED’000 AED’000
Balance at 1 January 2017 858,398 221,667 486,483 (103,005) (92,117) 5,944 82,805 53,866 990,262 1,645,905 2,504,303 175,777 2,680,080
total comprehensive income for the year
Profit for the year - - - - - - - - 270,483 270,483 270,483 45,035 315,518
Other comprehensive incomeForeign currency translation - - - 6,277 (6,838) - - - - (561) (561) (3,231) (3,792)differences (FCTR) (refer note 22(iv)) Reclassification of FCTR on disposalof subsidiaries (refer note 5(b)(i)) - - - 128 - - - - - 128 128 - 128Changes in cash flow hedges (refer note 27) - - - - - 1,508 - - - 1,508 1,508 - 1,508
total comprehensive income for the year - - - 6,405 (6,838) 1,508 - - 270,483 271,558 271,558 41,804 313,362
Other equity movements Transfer to legal reserve - - 42,583 - - - - - (42,583) - - - -Dividends distributed to NCI - - - - - - - - - - - (28,199) (28,199)Capitalisation of retained earnings - - - - - - - 5,570 (5,570) - - - -
Transactions with owners of the Companydirectly recorded in equityDividend declared and paid - - - - - - - - (128,760) (128,760) (128,760) - (128,760)(refer note 22(viii))
Changes in ownership interests in subsidiariesChange in NCI due to acquisition and disposals (refer note 5(a)(i)(ii)&(b)) - - - 2,006 - - - (6,638) 21,788 17,156 17,156 (2,744) 14,412
Balance at 31 December 2017 858,398 221,667 529,066 (94,594) (98,955) 7,452 82,805 52,798 1,105,620 1,805,859 2,664,257 186,638 2,850,895
Attributable to owners of the Company
Reserves
The notes on pages 62 to 119 are an integral part of these consolidated financial statements. The notes on pages 62 to 119 are an integral part of these consolidated financial statements.
Sec tion 362
notes to the consolidated financial statements for the year ended 31 December 2017
1 RePoRtinG entitY
R.A.K Ceramics PJSC (“the Company” or “the Holding Company”) was incorporated under Emiri Decree No. 6/89 dated 26 March 1989 as a limited liability company in the Emirate of Ras Al Khaimah, UAE. Subsequently, under Emiri Decree No. 9/91 dated 6 July 1991, the legal status of the Company was changed to Public Shareholding Company. The registered address of the Company is P.O. Box 4714, Al Jazeerah Al Hamra City, Ras Al Khaimah, United Arab Emirates. The Company is listed on Abu Dhabi Securities Exchange, UAE.
These consolidated financial statements as at and for the year ended 31 December 2017 comprise the Company and its subsidiaries (collectively referred to as “the Group” and individually as “Group entities”) and the Group’s interest in associates and joint ventures. The Group’s subsidiaries and equity accounted investees, their principal activities and the Group’s interest have been disclosed in note 36 to these consolidated financial statements.
The principal activities of the Company are manufacturing and sale of a variety of ceramic products including tiles, bathroom sets and sanitaryware. The Company and certain entities in the Group are also engaged in investing in other entities, in the UAE or globally, that undertake similar or ancillary activities. Accordingly, the Company also acts as a Holding Company of the Group entities. The Group is also engaged in contracting and other industrial manufacturing activities.
2 BaSiS oF PRePaRation
(a) Statement of compliance
These consolidated financial statements have been prepared in accordance with International Financial Reporting Standards (“IFRS”) and comply with the relevant Articles of the Company and the UAE Federal Law No. (2) of 2015.
(b) Basis of measurement
These consolidated financial statements have been prepared on a historical cost convention except for the derivative financial instruments which are carried at fair value.
(c) Functional and presentation currency
These consolidated financial statements are presented in United Arab Emirates Dirhams (“AED”), which is the functional currency of the Company. All amounts have been rounded to the nearest thousand, unless otherwise indicated.
(d) Use of estimates and judgments
In preparing these consolidated financial statements, management has made judgments, estimates and assumptions that affect the application of the Group’s accounting policies and the reported amounts of assets, liabilities, income and expenses. Actual results may differ from these estimates.
Estimates and underlying assumptions are reviewed by the management on an ongoing basis. Revisions to estimates are recognised prospectively.
Judgments and estimation uncertainties
Information about significant areas of estimation uncertainty and critical judgments in applying accounting policies that have the most significant effect on the amounts recognised in the consolidated financial statements are described in note 37.
(e) Measurement of fair values
A number of the Group’s accounting policies and disclosures require the measurement of fair values, for both financial and non-financial assets and liabilities. The management have overall responsibility for overseeing all significant fair value measurements, including level 3 fair values. The management regularly reviews significant unobservable inputs and valuation adjustments. If third party information, such as broker quotes or pricing services, is used to measure fair values, then management assesses the evidence obtained from the third parties to support the conclusion that such valuations meet the requirement of IFRS, including the level in the fair value hierarchy in which such valuations should be classified.
Financial re view 63
(e) Measurement of fair values (continued)
When measuring the fair value of an asset or a liability, the Group uses market observable data as far as possible. Fair values are categorised into different levels in a fair value hierarchy based on the inputs used in the valuation techniques as follows:
• Level 1: quoted prices (unadjusted) in active markets for identical assets or liabilities.
• Level 2: inputs other than quoted prices included within Level 1 that are observable for the asset or liability, either directly (eg. as prices) or indirectly (eg. derived from prices).
• Level 3: inputs for the asset or liability that are not based on observable market data (unobservable inputs).
If inputs used to measure the fair value of an asset or liability might be categorised in different levels of the fair value hierarchy, then the fair value measurement is categorised in its entirety in the same level of the fair value hierarchy as the lowest level input which is significant to the entire measurement.
The Group recognises transfers between levels of the fair value hierarchy at the end of the reporting period during which the change has occurred.
Further information about the assumptions made in measuring fair values is included in the following notes:
Note 5 – acquisition of subsidiaries;
Note 14 – property, plant and equipment;
Note 16 – investment properties; and
Note 33 – financial instruments.
3 SiGniFicant accoUntinG PolicieS
The accounting policies set out below have been applied consistently to all periods presented in these consolidated financial statements.
Basis of consolidation
These consolidated financial statements comprise the consolidated statement of financial position and the consolidated results of operations of the Company and its subsidiaries (collectively referred to as “the Group”) on a line-by-line basis together with the Group’s share in the net assets of its equity accounted investees. The principal
subsidiaries, associates and joint ventures are disclosed in note 36 to the consolidated financial statements.
Business combinations
The Group accounts for business combinations using the acquisition method when control is transferred to the Group. The consideration transferred in the acquisition is generally measured at fair value, as are the identifiable net assets acquired. Any goodwill that arises is tested annually for impairment. Any gain on a bargain purchase is recognised as profit for the period immediately. Transaction costs are expensed as incurred, except if related to the issue of debt or equity securities.
The consideration transferred does not include amounts related to the settlement of pre-existing relationships. Such amounts are generally recognised in the profit or loss.
Any contingent consideration is measured at fair value at the date of acquisition. If an obligation to pay contingent consideration that meets the definition of a financial instrument is classified as equity, then it is not remeasured and settlement is accounted for within equity. Otherwise, other contingent consideration is remeasured at fair value at each reporting date and subsequent changes in the fair value of the contingent consideration are recognised in profit or loss.
If share-based payment awards (replacement awards) are required to be exchanged for awards held by the acquiree’s employees (acquiree’s awards), then all or a portion of the amount of the acquirer’s replacement awards is included in measuring the consideration transferred in the business combination. This determination is based on the market-based measure of the replacement awards compared with the market-based measure of the acquiree’s awards and the extent to which the replacement awards relate to pre-combination service.
Subsidiaries
Subsidiaries are entities controlled by the Group. The Group controls an entity when it is exposed to, or has rights to, variable returns from its involvement with the entity and has the ability to affect those returns through its power over the entity. The financial statements of subsidiaries are included in the consolidated financial statements from the date on which control commences until the date on which control ceases.
notes to the consolidated financial statements (continued)for the year ended 31 December 2017
Sec tion 36 4
Basis of consolidation (continued)
Non-controlling interests (“NCI”)
NCI are measured at their proportionate share of the acquiree’s identifiable net assets at the date of acquisition
Changes in the Group’s interest in a subsidiary that do not result in a loss of control are accounted for as equity transactions.
Loss of control
When the Group loses control over a subsidiary, it derecognises the assets and liabilities of the subsidiary, and any related NCI and other components of equity. Any resulting gain or loss is recognised in profit or loss. Any interest retained in the former subsidiary is measured at fair value when control is lost.
Stepped acquisition
When an acquisition is completed by a series of successive transactions, the Group re-measures its previously held equity interest in the aquiree at its acquisition date, fair value and recognises the resulting gain or loss, if any, in the profit or loss.
Any amount recognised in other comprehensive income related to the previously held equity interest is recognised on the same basis as would be required if the Group had disposed of the previously held equity interest directly.
Interests in equity accounted investees
The Group’s interest in equity accounted investees comprises interests in associates and a joint venture.
Associates are those entities in which the Group has significant influence, but not control or joint control, over the financial and operating policies. A joint venture is an arrangement in which the Group has joint control, whereby the Group has rights to the net assets of the arrangement, rather than rights to its assets and obligations for its liabilities.
Interests in associates and joint ventures are accounted for using the equity method. They are initially recognised at cost, which includes transaction costs. Subsequent to initial recognition, the consolidated financial statements include the Group’s share of the profit or loss and other comprehensive income of equity accounted investees,
until the date on which significant influence or joint control ceases.
Transactions eliminated on consolidation
Intra-group balances and transactions, and any unrealised income and expenses arising from intra-group transactions, are eliminated. Unrealised gains arising from transactions with equity accounted investees are eliminated against the investment to the extent of the Group’s interest in the investee. Unrealised losses are eliminated in the same way as unrealised gains, but only to the extent that there is no evidence of impairment.
Hyperinflation
The financial statements of subsidiary companies whose functional currency is the currency of a hyperinflationary economy are adjusted for inflation in accordance with the procedures described prior to their translation to AED. Once restated, all items of the financial statements are converted to AED using the closing exchange rate. Amounts shown for prior years for comparative purposes are not restated at consolidation level as the presentation currency of the Group is not of a hyperinflationary economy. On consolidation, the effect of price changes in the prior periods on the financial statements of the subsidiary has been recognised in other comprehensive income and presented in the hyperinflation reserve in equity.
The financial statements of subsidiaries whose functional currency is the currency of a hyperinflationary economy are adjusted to reflect the changes in purchasing power of the local currency, such that all items in the statement of financial position not expressed in current terms (non-monetary items) are restated by applying a general price index at the reporting date and all income and expenses are restated quarterly by applying appropriate conversion factors. The difference between initial adjusted amounts is taken to the profit or loss.
When a functional currency of a subsidiary ceases to be hyperinflationary, the Group discontinues hyperinflation accounting in accordance with IAS 29 for annual periods ending on or after the date that the economy is identified as being non-hyperinflationary. The amounts expressed in the measuring unit current at the end of the last period in which IAS 29 was applied are used as the basis for the carrying amounts in subsequent financial statements.
3 SiGniFicant accoUntinG PolicieS (continUeD)
notes to the consolidated financial statements (continued)for the year ended 31 December 2017
Financial re view 65
Hyperinflation (continued)
To determine the existence or cessation of hyperinflation, the Group assesses the qualitative characteristics of the economic environment of the country, such as the trends in inflation rates over the previous three years.
Foreign currency
Foreign currency transactions
Transactions in foreign currencies are translated into the respective functional currencies of Group companies at the exchange rates at the dates of the transactions.
Monetary assets and liabilities denominated in foreign currencies are translated into the functional currency at the exchange rate at the reporting date. Non-monetary assets and liabilities that are measured at fair value in a foreign currency are translated into the functional currency at the exchange rate when the fair value was determined. Non-monetary items that are measured based on historical cost in a foreign currency are translated at the exchange rate at the date of the transaction. Foreign currency differences are generally recognised in profit or loss.
However, foreign currency differences arising from the translation of the following items are recognised in other comprehensive income:
• available-for-sale equity investments (except on impairment, in which case foreign currency differences that have been recognised in other comprehensive income are reclassified to profit or loss);
• a financial liability designated as a hedge of the net investment in a foreign operation to the extent that the hedge is effective; and
• qualifying cash flow hedges to the extent that the hedges are effective.
Foreign operations
The assets and liabilities of foreign operations, including goodwill and fair value adjustments arising on acquisition, are translated to AED at exchange rates at the reporting date. The income and expenses of foreign operations are translated to AED at exchange rates at the dates of
the transactions.
Foreign currency differences are recognised in other comprehensive income and accumulated in the translation reserve in the consolidated financial statements, except to the extent that the translation difference is allocated to NCI. Foreign currency translation differences pertaining to hyperinflationary economies are recorded in the hyperinflation reserve in equity.
When a foreign operation is disposed of in its entirety or partially such that control, significant influence or joint control is lost, the cumulative amount in the translation reserve related to that foreign operation is reclassified to profit or loss as part of the gain or loss on disposal. If the Group disposes of part of its interest in a subsidiary but retains control, then the relevant proportion of the cumulative amount is reattributed to NCI. When the Group disposes of only part of an associate or joint venture while retaining significant influence or joint control, the relevant proportion of the cumulative amount is reclassified to profit or loss.
When the settlement of a monetary item receivable from or payable to a foreign operation is neither planned nor likely in the foreseeable future, foreign currency gains and losses arising from such item are considered to form part of a net investment in the foreign operation and are recognised in other comprehensive income, and presented in the translation reserve in equity.
Financial instruments
The Group classifies non-derivative financial assets into the following categories: financial assets at fair value through profit or loss and loans and receivables. The Group classifies non-derivative financial liabilities into the other financial liabilities category.
Non-derivative financial assets and financial liabilities – recognition and derecognition
The Group initially recognises loans and receivables and debt securities issued on the date when they are originated. All other financial assets and financial liabilities are initially recognised on the trade date when the
3 SiGniFicant accoUntinG PolicieS (continUeD)
notes to the consolidated financial statements (continued)for the year ended 31 December 2017
Sec tion 366
Financial instruments (continued)
entity becomes a party to the contractual provisions of the instrument.
The Group derecognises a financial asset when the contractual rights to the cash flows from the asset expire, or it transfers the rights to receive the contractual cash flows in a transaction in which substantially all of the risks and rewards of ownership of the financial asset are transferred, or it neither transfers nor retains substantially all of the risks and rewards of ownership and does not retain control over the transferred asset. Any interest in such derecognised financial assets that is created or retained by the Group is recognised as a separate asset or liability.
The Group derecognises a financial liability when its contractual obligations are discharged or cancelled, or have expired.
Financial assets and financial liabilities are offset and the net amount presented in the consolidated statement of financial position when, and only when, the Group has a legally enforceable right to offset the amounts and intends either to settle them on a net basis or to realise the asset and settle the liability simultaneously.
Non-derivative financial assets – measurement
Financial assets at fair value through profit or loss
A financial asset is classified as fair value through profit or loss if it is classified as held for trading or is designated as such upon initial recognition. Directly attributable transaction costs are recognised in profit and loss as incurred. Financial assets at fair value through profit or loss are measured at fair value and changes therein, including any interest or dividend income, are recognised in profit or loss.
Loans and receivables
These assets are initially recognised at fair value plus any directly attributable transaction costs. Subsequent to initial recognition, loans and receivables are measured at amortised cost using the effective interest method, less any impairment losses.
Cash and cash equivalents
In the consolidated statement of cash flows, cash and cash equivalents includes cash balances and call deposits with original maturities of three month or less from the
acquisition date. Fixed deposits under lien against certain bank facilities are not included as part of cash and cash equivalents.
Non-derivative financial liabilities – measurement
Non-derivative financial liabilities are initially recognised at fair value less any directly attributable transaction costs. Subsequent to initial recognition, these financial liabilities are measured at amortised cost using the effective interest method.
Derivative financial instruments and hedge accounting
The Group holds derivative financial instruments to hedge its interest rate risk exposures. Derivatives are recognised initially at fair value; attributable transaction costs are recognised in profit or loss as incurred. Subsequent to initial recognition, derivatives are measured at fair value, and changes therein are accounted for as described below.
Cash flow hedges
When a derivative is designated as a cash flow hedging instrument, the effective portion of changes in the fair value of the derivative is recognised in other comprehensive income. Any ineffective portion of changes in the fair value of the derivative is recognised immediately in the profit or loss.
The amount accumulated in equity is retained in other comprehensive income and reclassified to profit or loss in the same period or periods during which the hedged forecast cash flows affects profit or loss or the hedged item affects profit or loss.
If the forecast transaction is no longer expected to occur, the hedge no longer meets the criteria for hedge accounting, the hedging instrument expires or is sold, terminated or exercised, or the designation is revoked, then hedge accounting is discontinued prospectively. If the forecast transaction is no longer expected to occur, then the amount accumulated in equity is reclassified to profit or loss.
Other non-trading derivatives
When a derivative financial instrument is not designated in a hedge relationship that qualifies for hedge accounting, all changes in its fair value are recognised immediately in profit or loss.
3 SiGniFicant accoUntinG PolicieS (continUeD)
notes to the consolidated financial statements (continued)for the year ended 31 December 2017
Financial re view 67
Share capital
Ordinary shares are classified as equity. Incremental costs directly attributable to the issue of ordinary shares arerecognised as a deduction from equity, net of any tax effects.
Property, plant and equipment
Recognition and measurement
Items of property plant and equipment are measured at cost less accumulated depreciation and accumulated impairment losses (see accounting policy on impairment), if any.
Cost includes expenditure that is directly attributable to the acquisition of the asset. The cost of self-constructed assets includes the following:
• the cost of materials and direct labour;
• any other costs directly attributable to bringing the assets to a working condition for their intended use; and
• capitalised borrowing costs.
Purchased software that is integral to the functionality of the related equipment is capitalised as part of that equipment.
If significant parts of an item of property, plant and equipment have different useful lives, then they are accounted for as separate items (major components) of property, plant and equipment.
Any gain or loss on disposal of an item of property, plant and equipment is recognised in the profit or loss.
Subsequent expenditure
Subsequent expenditure is capitalised only when it is probable that the future economic benefits associated with the expenditure will flow to the Group. Ongoing repairs and maintenance is expensed as incurred.
Reclassification to investment property
When the use of a property changes from owner-occupied to investment property, the property is reclassified as investment property considering that the accounting policy for investment property is the ‘Cost Model’ in accordance with IAS 40.
Depreciation
Depreciation is calculated to write off the cost of items of property, plant and equipment less their estimated residual values using the straight-line method over their estimated useful lives. Leased assets are depreciated over the shorter of the lease term and their useful lives unless it is reasonably certain that the Group will obtain ownership by the end of the lease term. Land is not depreciated.
The estimated useful lives for the current and comparative years of significant items of property, plant and equipment are as follows: life (years)• Buildings 20-35• Plant and equipment 5-15• Furniture and fixtures 3• Vehicles 3-5• Roads and asphalting 10• Quarry and land development 10• Office equipment 3
Depreciation methods, useful lives and residual values are reviewed at each reporting date and adjusted if appropriate. Refer note 14(iii).
capital work in progress
Capital work in progress is stated at cost less impairment, if any, until the construction is completed. Upon completion of construction, the cost of such assets together with the cost directly attributable to construction, including capitalised borrowing costs are transferred to the respective class of asset. No depreciation is charged on capital work in progress.
intangible assets and goodwill
Recognition and measurement
Goodwill arising on the acquisition of subsidiaries is measured at cost less accumulated impairment losses.
Other intangible asset, which are acquired by the Group and have finite useful lives are measured at cost less accumulated amortisation and accumulated impairment losses, if any.
Subsequent expenditure
Subsequent expenditure is capitalised only when it increases the future economic benefits embodied in the
3 SiGniFicant accoUntinG PolicieS (continUeD)
notes to the consolidated financial statements (continued)for the year ended 31 December 2017
Sec tion 368
intangible assets and goodwill (continued)
specific asset to which it relates. All other expenditure, including expenditure on internally generated goodwill and brands, is recognised in the profit or loss as incurred.and have finite useful lives are measured at cost less accumulated amortisation and accumulated impairment losses, if any.
Amortisation
Amortisation is calculated to write off the cost of intangible assets less their estimated residual values using the straight-line method over their estimated useful lives of 5 to 15 years from the date that they are available for use, and is generally recognised in profit or loss. Goodwill is not amortised.
Amortisation methods, useful lives and residual values are reviewed at each reporting date and adjusted if appropriate.
investment property
Investment property is property held either to earn rental income or for capital appreciation or for both, but not for sale in the ordinary course of business, use in the production or supply of goods or rendering services or for administrative purposes.
Investment property is accounted for using the “Cost Model” under the International Accounting Standard 40 “Investment Property” and is stated at cost less accumulated depreciation and impairment losses, if any. Depreciation on buildings is charged over its estimated useful life of 30 to 35 years.
Cost includes expenditure which is directly attributable to the acquisition of the investment property. The cost of self-constructed investment property includes the cost of materials and direct labour, any other costs directly attributable to bringing the investment property to a working condition for their intended use and capitalised borrowing costs.
The cost of investment property acquired in exchange for a non-monetary asset or assets, or a combination of monetary and non-monetary assets, comprises the fair value of the asset received or asset given up. If the fair
value of the asset received and asset given up can be measured reliably, the fair value of the asset given up is used to measure cost, unless the fair value of the asset received is more clearly evident.
Any gain or loss on disposal of an investment property (calculated as the difference between the net proceeds from disposal and the carrying amount of the item) is recognised in profit or loss.
When the use of a property changes such that it is reclassified as property, plant and equipment or inventory, the transfer is effected at the carrying value of such property at the date of reclassification.
leases
Leased assets
Leases of assets that transfer to the Group substantially all of the risks and rewards of ownership are classified as finance leases. The leased assets are measured initially at an amount equal to the lower of their fair value and the present value of the minimum lease payments. Subsequent to initial recognition, the assets are accounted for in accordance with the accounting policy applicable to that asset.
Assets held under other leases are classified as operating leases and are not recognised in the Group’s consolidated statement of financial position
Lease payments
Payments made under operating leases are recognised in profit or loss on a straight-line basis over the term of the lease. Lease incentives received are recognised as an integral part of the total lease expense, over the term of the lease, if any.
Minimum lease payments made under finance leases are apportioned between the finance expense and the reduction of the outstanding liability. The finance expense is allocated to each period during the lease term so as to produce a constant periodic rate of interest on the remaining balance of the liability.
3 SiGniFicant accoUntinG PolicieS (continUeD)
notes to the consolidated financial statements (continued)for the year ended 31 December 2017
Financial re view 69
inventories
Inventories are measured at the lower of cost and net realisable value. The cost of inventories is based on the weighted average cost principle, and includes expenditure incurred in acquiring the inventories, production or conversion costs, and other costs incurred in bringing them to their existing location and condition. In the case of manufactured inventories and work in progress, cost includes an appropriate share of production overheads based on normal operating capacity.
Net realisable value is the estimated selling price in the ordinary course of business, less the estimated costs of completion and selling expenses.
construction contracts in progress / billings in excess of valuation
Construction contracts in progress represent the gross amount expected to be collected from customers for contract work performed to date. They are measured at costs incurred plus profits recognised to date (refer revenue policy for construction contracts) less progress billings and recognised losses.
In the statement of financial position, construction contracts in progress for which costs incurred plus recognised profits exceed progress billings and recognised losses are presented as contracts work in progress. Contracts for which progress billings and recognised losses exceed costs incurred plus recognised profits are presented as billings in excess of valuation. Advances received from customers are presented as billings in excess of valuation.
impairment
Non-derivative financial assets
Financial assets not classified as at fair value through profit or loss, including an interest in an equity-accounted investee, are assessed at each reporting date to determine whether there is objective evidence that it is impaired.
Objective evidence that financial assets are impaired includes
• default or delinquency by a debtor;
• restructuring of an amount due to the Group on terms which the Group would otherwise not consider;
• indications that a debtor or issuer will enter bankruptcy;
• adverse changes in the payment status of borrowers or issuers;
• the disappearance of an active market for a security; or
• observable data indicating that there is a measurable decrease in the expected cash flows from a group of financial assets.
For an investment in an equity security, objective evidence of impairment includes a significant or prolonged decline in its fair value below its cost. The Group considers a decline of 20% to be significant and a period of nine months to be prolonged.
Financial assets measured at amortised cost
The Group considers evidence of impairment for financial assets measured at amortised cost (loans and receivables) at both an individual asset and a collective level. All individually significant assets are assessed for impairment. Those found not to be specifically impaired are then collectively assessed for any impairment that has been incurred but not yet identified. Assets that are not individually significant are collectively assessed for impairment. Collective assessment is carried out by grouping together assets with similar risk characteristics.
In assessing collective impairment, the Group uses historical information on the timing of recoveries and the amount of loss incurred, and makes an adjustment if current economic and credit conditions are such that the actual losses are likely to be greater or lesser than suggested by historical trends
An impairment loss in respect of a financial asset measured at amortised cost is calculated as the difference between its carrying amount and the present value of the estimated future cash flows discounted at the asset’s original effective interest rate. Losses are recognised in
3 SiGniFicant accoUntinG PolicieS (continUeD)
notes to the consolidated financial statements (continued)for the year ended 31 December 2017
Sec tion 370
3 SiGniFicant accoUntinG PolicieS (continUeD)
impairment (continued)
the profit or loss and reflected in an allowance account against loans and receivables. When the Group considers that there are no realistic prospects of recovery of the asset, the relevant amounts are written off. If the amount of impairment loss subsequently decreases and the decrease can be related objectively to an event occurring after the impairment was recognised, then the previously recognised impairment loss is reversed through profit or loss.
Equity accounted investees
An impairment loss in respect of an equity accounted investee is measured by comparing the recoverable amount of the investment with its carrying amount. An impairment loss is recognised in profit or loss, and is reversed if there has been a favourable change in the estimates used to determine the recoverable amount.
Non financial assets
At each reporting date, the Group reviews the carrying amounts of its non-financial assets (other than investment property, inventories and deferred tax assets) to determine whether there is any indication of impairment. If any such indication exists, then the asset’s recoverable amount is estimated. Goodwill is tested annually for impairment
For impairment testing, assets are grouped together into the smallest group of assets that generates cash inflows from continuing use that are largely independent of the cash inflows of other assets or CGUs. Goodwill arising from a business combination is allocated to CGUs or groups of CGUs that are expected to benefit from the synergies of the combination. The recoverable amount of an asset or CGU is the greater of its value in use and its fair value less costs to sell. In assessing value in use, the estimated future cash flows are discounted to their present value using a pre-tax discount rate that reflects current market assessments of the time value of money and the risks specific to the asset or CGU.
An impairment loss is recognised if the carrying amount of an asset or cash-generating unit (CGU) exceeds its recoverable amount. Impairment losses are recognised in profit or loss. Any impairment losses recognised in respect of CGUs are allocated first to reduce the carrying
amount of any goodwill allocated to the CGU (group of CGUs), and then to reduce the carrying amounts of the other assets in the CGU (group of CGUs) on a pro rata basis.
An impairment loss in respect of goodwill is not reversed. For other assets, an impairment loss is reversed only to the extent that the asset’s carrying amount does not exceed the carrying amount that would have been determined, net of depreciation or amortisation, if no impairment loss had been recognised.
employee benefits
Short-term employee benefits
Short-term employee benefits are expensed as the related service is provided. A liability is recognised for the amount expected to be paid if the Group has a present legal or constructive obligation to pay this amount as a result of past service provided by the employee and the obligation can be estimated reliably
Defined contribution plans
Obligations for contributions to defined contribution plans are expensed as the related services are provided. Prepaid contributions are recognised as an asset to the extent that a cash refund or a reduction in future payments is available.
Other long-term employee benefits
The Group’s net obligation in respect of long-term employee benefits is the amount of future benefit which employees have earned in return for their service in the current and prior periods. That benefit is discounted to determine its present value. Remeasurements are recognised in profit or loss in the period in which they arise.
Defined benefit plans
The Group’s net obligation in respect of defined benefit plans is calculated separately for each plan by estimating the amount of future benefit which employees have earned in the current and prior periods, discounting that amount and deducting the fair value of any plan assets. in the current and prior periods, discounting that amount and deducting the fair value of any plan assets.
notes to the consolidated financial statements (continued)for the year ended 31 December 2017
Financial re view 71
3 SiGniFicant accoUntinG PolicieS (continUeD)
employee benefits (continued)
The calculation of defined benefit obligations is performed annually by a qualified actuary using the projected unit credit method. When the calculation results in a potential asset for the Group, the recognised asset is limited to the present value of economic benefits available in the form of any future refunds from the plan or reductions in future contributions to the plan. To calculate the present value of economic benefits, consideration is given to any applicable minimum funding requirements.
Remeasurements of the net defined benefit liability, which comprise actuarial gains and losses, the return on plan assets (excluding interest) and the effect of the asset ceiling (if any, excluding interest), are recognised immediately in other comprehensive income. The Group determines the net interest expense (income) on the net defined benefit liability (asset) for the period by applying the discount rate used to measure the defined benefit obligation at the beginning of the annual period to the then-net defined benefit liability (asset), taking into account any changes in the net defined benefit liability (asset) during the period as a result of contributions and benefit payments. Net interest expense and other expenses related to defined benefit plans are recognised in profit or loss.
When the benefits of a plan are changed or when a plan is curtailed, the resulting change in benefit which relates to past service or the gain or loss on curtailment is recognised immediately in profit or loss. The Group recognises gains and losses on the settlement of a defined benefit plan when the settlement occurs.
Terminal benefits
The provision for staff terminal benefits is based on the liability which would arise if the employment of all staff was terminated at the reporting date and is calculated in accordance with the provisions of UAE Federal Labour Law and the relevant local laws applicable to overseas subsidiaries. Management considers these as long-term obligations and accordingly they are classified as long-term liabilities.
Provisions
Provisions are determined by discounting the expected future cash flows at a pre-tax rate that reflects current market assessments of the time value of money and the risks specific to the liability. The unwinding of the discount is recognised as finance cost.
warranties
A provision for warranties is recognised when the underlying products or services are sold, based on historical warranty data and a weighting of possible outcomes against their associated probabilities.
assets held for sale
Non-current assets, or disposal groups comprising assets and liabilities, are stated net and classified as held for sale if it is highly probable that they will be recovered primarily through sale rather than through continuing use.
Such assets, or disposal groups, are generally measured at the lower of their carrying amount and fair value less costs to sell. Any impairment loss on a disposal group is allocated first to goodwill, and then to the remaining assets and liabilities on a pro rata basis, except that no loss is allocated to inventories, financial assets, deferred tax assets, employee benefit assets, investment property or biological assets, which continue to be measured in accordance with the Group’s other accounting policies. Impairment losses on initial classification as held-for-sale or held-for distribution and subsequent gains and losses on remeasurement are recognised in profit or loss.
Once classified as held for sale, intangible assets and property, plant and equipment are no longer amortised or depreciated, and any equity accounted investee is no longer equity accounted.
Revenue
Sale of goods
Revenue is recognised when the significant risks and rewards of ownership have been transferred to the customer, recovery of the consideration is probable, the associated costs and possible return of goods can be estimated reliably, there is no continuing management
notes to the consolidated financial statements (continued)for the year ended 31 December 2017
Sec tion 372
3 SiGniFicant accoUntinG PolicieS (continUeD)
Revenue (continued)
involvement with the goods and the amount of revenue can be measured reliably. Revenue from the sale of goods in the course of ordinary activities is measured at the fair value of the consideration received or receivable, net of returns, trade discounts and volume rebates. If it is probable that discounts will be granted and the amount can be measured reliably, then the discount is recognised as a reduction of revenue as the sales are recognised.
Rendering of services
Revenue from services rendered is recognised in profit or loss in proportion to the stage of completion of the transaction at the reporting date. The stage of completion is assessed by reference to surveys of work performed.
Construction contracts
Contract revenue includes the initial amount agreed in the contract plus any variations in contract work, claims and incentive payments, to the extent that it is probable that they will result in revenue and can be measured reliably. If the outcome of the construction contract can be estimated reliably, contract revenue is recognised in profit or loss in proportion to the stage of completion of the contract. Contract expenses are recognised as incurred unless they create an asset related to future contract activity. The percentage of completion is estimated on the basis of proportion that the actual cost bears to the total estimated contract cost. When the outcome of a construction contract cannot be estimated reliably, contract revenue is recognised only to the extent of contract costs incurred that are likely to be recoverable. Any expected loss on a contract is recognised immediately in the profit or loss.
Investment property rental income
Rental income from investment property is recognised as revenue on a straight-line basis over the term of the lease. Lease incentives granted are recognised as an integral part of the total rental income, over the term of the lease. Rental income from investment property is recognised as other income.
Dividend income
Dividend income is recognised in profit or loss on the date that the Group’s right to receive the payment is established.
Finance income and finance costs
Finance income comprises interest income on fixed deposits, wakala deposits and amount due from related parties. Interest income is recognised in profit or loss as it accrues, using the effective interest rate method.
Finance cost comprises interest expense on bank borrowings, profit expense on Islamic financing and bank charges. All finance costs are recognised in profit or loss using the effective interest rate method. However, borrowing costs which are directly attributable to the acquisition or construction of a qualifying asset are capitalised as part of the cost of that asset. A qualifying asset is an asset which necessarily takes a substantial period of time to get ready for its intended use or sale. Capitalisation of borrowing costs ceases when substantially all the activities necessary to prepare the asset for its intended use or sale are complete.
Foreign currency gains and losses are reported on a net basis as either finance income or finance cost depending on whether the foreign currency movements are in a net gain or net loss position.
tax
Tax expense comprises current and deferred tax. Current tax and deferred tax is recognised in profit or loss except to the extent that it relates to a business combination, or items recognised directly in equity or in other comprehensive income.
Current tax
Current tax comprises the expected tax payable or receivable on the taxable income or loss for the year and any adjustment to the tax payable or receivable in respect of previous years. The amount of current tax payable or receivable is the best estimate of the tax amount expected to be paid or received that reflects uncertainty related to income taxes, if any. It is measured using tax rates enacted or substantively enacted at the reporting date.
Current tax assets and liabilities are offset only if certain criteria are met.
Deferred tax
Deferred tax is recognised in respect of temporary differences between the carrying amounts of assets
notes to the consolidated financial statements (continued)for the year ended 31 December 2017
Financial re view 73
3 SiGniFicant accoUntinG PolicieS (continUeD)
tax (continued)
and liabilities for financial reporting purposes and the amounts used for taxation purposes. It is measured at the tax rates that are expected to be applied to temporary differences when they reverse, using tax rates enacted or substantively enacted at the reporting date. The measurement of deferred tax reflects the tax consequences that would follow from the manner in which the Group expects, at the reporting date, to recover or settle the carrying amount of its assets and liabilities.
Deferred tax is not recognised for:
• temporary differences on the initial recognition of assets or liabilities in a transaction that is not a business combination and that affects neither accounting nor taxable profit or loss;
• temporary differences related to investments in subsidiaries, associates and joint arrangements to the extent that the Group is able to control the timing of the reversal of the temporary differences and it is probable that they will not reverse in the foreseeable future; and
• taxable temporary differences arising on the initial recognition of goodwill.
Deferred tax asset is recognised for unused tax losses, tax credits and deductible temporary differences to the extent that it is probable that future taxable profits will be available against which they can be utilised. Deferred tax assets are reviewed at each reporting date and are reduced to the extent that it is no longer probable that the related tax benefit will be realised. Such reductions are reversed when the probability of future taxable profits improves.
Deferred tax assets and liabilities are offset only if certain criteria are met.
Zakat
In respect of operations in certain subsidiaries and equity accounted investees, zakat is provided in accordance with relevant fiscal regulations. Zakat is recognised in profit or loss except to the extent it relates to items recognised directly in equity, in which case it is recognised in equity.
The provision for zakat is charged to profit or loss. Additional amount, if any, that may become due on finalisation of an asset is accounted for in the year in which assessment is finalised.
earnings per share
The Group presents basic and diluted earnings per share data for its ordinary shares. Basic earnings per share is calculated by dividing the profit or loss attributable to ordinary shareholders of the Company by the weighted average number of ordinary shares outstanding during the year, adjusted for own shares held. Diluted earnings per share is determined by adjusting the profit or loss attributable to ordinary shareholders and the weighted average number of ordinary shares outstanding, adjusted for own shares held, for the effects of all dilutive potential ordinary shares.
Government grants
Government grants are recognised at nominal value when there is reasonable assurance that they will be received and the Group will comply with the conditions associated with the grant. Grants which compensate the Group for expenses incurred are recognised in the profit or loss on a systematic basis in the same periods in which the expenses are recognised.
Segment reporting
An operating segment is a component of the Group which engages in business activities from which it may earn revenues and incur expenses, including revenues and expenses that relate to transactions with any of the Group’s other components.
Segment results which are reported to the Company’s CEO (chief operating decision maker) include items directly attributable to a segment as well as those which can be allocated on a reasonable basis. Segment capital expenditure is the total cost incurred during the year to acquire property, plant and equipment, and intangible assets other than goodwill.
operating profit
Operating profit is the result generated from the continuing principal revenue producing activities of Group as well as other income and expenses related to operating activities. Operating profit excludes net finance
notes to the consolidated financial statements (continued)for the year ended 31 December 2017
Sec tion 374
operating profit (continued)costs, share of profit of equity accounted investees and income taxes.
Fair value
Fair value is the price that would be received to sell an asset or paid to transfer a liability in an orderly transaction between market participants at the measurement date in the principal or, in its absence, the most advantageous market to which the Group has access at that date. The fair value of a liability reflects its non-performance risk.
A number of the Group’s accounting policies and disclosures require the measurement of fair values, for both financial and non-financial assets and liabilities.
When one is available, the Group measures the fair value of an instrument using the quoted price in an active market for that instrument. A market is regarded as active if transactions for the asset or liability take place with sufficient frequency and volume to provide pricing information on an ongoing basis.
If there is no quoted price in an active market, then the Group uses valuation techniques that maximise the use of relevant observable inputs and minimise the use of unobservable inputs. The chosen valuation technique incorporates all of the factors that market participants would take into account in pricing a transaction.
If an asset or a liability measured at fair value has a bid price and an ask price, then the Group measures assets and long positions at a bid price and liabilities and short positions at an ask price.
The best evidence of the fair value of a financial instrument on initial recognition is normally the transaction price – i.e. the fair value of the consideration given or received. If the Group determines that the fair value on initial recognition differs from the transaction price and the fair value is evidenced neither by a quoted
price in an active market for an identical asset or liability nor based on a valuation technique for which any unobservable inputs are judged to be insignificant in relation to the measurement, then the financial instrument is initially measured at fair value, adjusted to defer the difference between the fair value on initial recognition and the transaction price. Subsequently, that difference is recognised in profit or loss on an appropriate basis over the life of the instrument but no later than when the valuation is wholly supported by observable market data or the transaction is closed out.
3 SiGniFicant accoUntinG PolicieS (continUeD)
notes to the consolidated financial statements (continued)for the year ended 31 December 2017
Financial re view 75
A number of new standards and amendments to standards are effective for annual periods beginning after 1 January 2018 with earlier application permitted. The Group does not plan to adopt these standards early. The new standards which may be relevant to the Group are set out below.
IFRS 9 Financial instruments
IFRS 9 Financial instruments sets out requirements for recognising and measuring financial assets, financial liabilities and some contracts to buy or sell non-financial items including a new expected credit loss model for calculating impairment of financial assets, and new general hedge accounting requirements. This standard replaces IAS 39 Financial Instruments: Recognition and Measurement. The final version of IFRS 9 is effective for annual periods beginning on or after 1 January 2018, with early application permitted.
i. Classification – financial assets
IFRS 9 contains a new classification and measurement approach for financial assets that reflects the business model in which assets are managed and their cash flow characteristics. IFRS 9 contains three principal classification categories for financial assets: measured at amortised cost, fair value through other comprehensive income (FVOCI) and fair value through profit or loss (FVTPL). The standard eliminates the existing IAS 39 categories of held to maturity, loans and receivables and available for sale.
ii. Impairment
IFRS 9 replaces the ‘incurred loss’ model in IAS 39 with a forward-looking ‘expected credit loss’ (ECL) model. This will require considerable judgement about how changes in economic factors affect ECLs, which will be determined on a probability-weighted basis. The new impairment model will apply to financial assets measured at amortised cost or FVOCI, except for investments in equity instruments, and to contract assets.
Under IFRS 9, loss allowances will be measured on either of the following bases:
• 12-month ECLs: these are ECLs which result from
possible default events within the 12 months after the reporting date; and
• Lifetime ECLs: these are ECLs which result from all possible default events over the expected life of a financial instrument.
Lifetime ECL measurement applies if the credit risk of a financial asset at the reporting date has increased significantly since initial recognition and 12-month ECL measurement applies if it has not. An entity may determine that a financial asset’s credit risk has not increased significantly if the asset has low credit risk at the reporting date. However, lifetime ECL measurement always applies for trade receivables and contract assets without a significant financing component; the Group has a choice to also apply this policy for trade receivables and contract assets with a significant financing component.
The estimated ECL will be calculated based on actual credit loss experience. The Group will perform the calculation of ECL rates separately for different types of customers including related parties.
Actual credit losses will be adjusted to reflect differences between economic conditions during the period over which the historical data will be collected, prevalent conditions and the Group’s view of economic conditions over the expected lives of the receivables and related party balances.
iii. Hedging
IFRS 9 incorporates new hedge accounting rules which intend to align hedge accounting with a Group’s risk management objectives and strategy and to apply a more qualitative and forward looking approach to assessing hedge effectiveness. In accordance with IFRS 9, the Group has an accounting policy choice to defer the adoption of IFRS 9 hedge accounting and to continue with IAS 39 hedge accounting.
The Group will take advantage of the exemption allowing it not to restate comparative information for prior periods with respect to classification and measurement (including impairment) changes.
4 StanDaRDS, aMenDMentS anD inteRPRetationS
notes to the consolidated financial statements (continued)for the year ended 31 December 2017
Sec tion 376
IFRS 9 Financial instruments (continued)
Differences in the carrying amounts of financial assets and financial liabilities resulting from the adoption of IFRS 9 will generally be recognised in equity as at 1 January 2018.
iFRS 15 Revenue from contracts with customers
IFRS 15 establishes a comprehensive framework for determining whether, how much and when revenue is recognised. It replaces existing revenue recognition guidance, including IAS 18 Revenue, IAS 11 Construction Contracts and IFRIC 13 Customer Loyalty Programmes. IFRS 15 is effective for annual reporting periods beginning on or after 1 January 2018, with early adoption permitted.
i. Sales of goods
Under IFRS 15, revenue will be recognised when a customer obtains control of the goods.
Revenue will be recognised for the contracts to the extent that it is probable that a significant reversal in the amount of cumulative revenue recognised will not occur. As a consequence, for those contracts for which the Group is unable to make a reasonable estimate of return, revenue is expected to be recognised sooner than when the return period lapses or a reasonable estimate can be made.
Based on the Group’s assessment, the timing of revenue recognition from sale of goods are broadly similar. Therefore, the Group does not expect the application of IFRS 15 to result in significant differences in the timing of revenue recognition for these sales.
ii. Rendering of services
Under IFRS 15, the total consideration in the service contracts will be allocated to all services based on their stand-alone selling prices. The stand-alone selling prices will be determined based on the list prices at which the Group sells the services in separate transactions.
Based on the Group’s assessment, the fair value and the stand-alone selling prices of the services are broadly similar. Therefore, the Group does not expect the application of IFRS 15 to result in significant differences in the timing of revenue recognition for these services.
iii. Construction contracts
Contract revenue currently includes the initial amount agreed in the contract plus any variations in contract work, claims and incentive payments, to the extent that it is probable that they will result in revenue and can be measured reliably. When a claim or variation is recognised, the measure of contract progress or contract price is revised and the cumulative contract position is reassessed at each reporting date.
Under IFRS 15, claims and variations will be included in the contract accounting when they are approved.
The Group does not expect the application of IFRS 9 and IFRS 15 to have a significant impact on its consolidated financial statements. The actual impacts of adopting these standards at 1 January 2018 may change because:- these standards will require the Group to revise its
accounting policies and internal controls and these changes are not yet complete;
- the Group is also refining and finalising its model for expected credit loss calculations; and
- the new accounting policies, assumptions, judgement and estimation techniques employed are subject to change until the Group finalises its first consolidated financial statements that includes the date of initial application.
iFRS 16 leases
IFRS 16, published in January 2016 replaces the previous guidance in IAS 17 Leases. Under this revised guidance, leases will be brought onto companies’ balance sheets, increasing the visibility of their assets and liabilities. It further removes the classification of leases as either operating leases or finance leases treating all leases as finance leases from the perspective of the lessee, thereby eliminating the requirement for a lease classification test. The revised guidance has an increased focus on who controls the asset and may change which contracts are leases. IFRS 16 is effective for annual periods beginning on or after 1 January 2019.
Other new or amended standards
The following new or amended standards are not expected to have a significant impact of the Group’s consolidated financial statements:
4 StanDaRDS, aMenDMentS anD inteRPRetationS (continUeD)
Financial re view 7 7
iFRS 16 leases (continued
• Transfers of Investment Property (Amendments to IAS
• 40) (effective for annual periods beginning on or after 1 January 2018).
• Annual Improvements to IFRSs 2014-2016 Cycle – various standards (amendments to IFRS 1 and IAS 28) (effective for annual periods beginning on or after 1 January 2018).
• Sale or Contribution of Assets between an Investor and its Associate or Joint Venture (Amendments to IFRS 10 and IAS 28)
The following amendments that are mandatorily effective from the current year:
• Annual Improvements to IFRSs 2014-2016 Cycle (various standard) (Amendments to IFRS 12)
• Recognition of Deferred Tax Assets for Unrealised Losses (Amendments to IAS 12)
• Disclosure Initiative (Amendment to IAS 7)
Application of these standards and amendments would not have a significant impact on the Group’s consolidated financial statements as at 31 December 2017.
Sec tion 378
(a) acquisitions
Acquisition of subsidiaries in 2017
(i) Effective 1 January 2017, due to change in the composition of the Board of Directors of Restofair RAK LLC (a joint venture until 31 December 2016), the Group exercises control over the financial and operating policies of the investee. As the Group has the power to control activities and operations of the investee, acquisition accounting has been based on book values at the date when the Group acquired control. Restofair RAK LLC is engaged mainly in the trading of catering equipment and undertaking turnkey contracting projects.
The fair values, which represent the book values, of the identifiable assets and liabilities of Restofair RAK LLC acquired by the Group, are as follows:
total aeD’000
Property, plant and equipment 663Inventories 7,056 Trade and other receivables 12,817 Cash in hand and at bank 12,701
total assets 33,237
Less: total liabilities (11,369)
net assets acquired 21,868
Fair value of pre-existing interest in Restofair RAK LLC (refer note 17(ii)) 10,278
increase in non-controlling interests 11,590
In the period from acquisition of controlling interests in Restofair RAK LLC up to 31 December 2017, the newly acquired subsidiary contributed revenue of AED 72.05 million and a net profit of AED 13.9 million to the Group’s result.
5 acqUiSition anD DiSPoSal oF SUBSiDiaRieS anD non-contRollinG inteReStS
notes to the consolidated financial statements (continued)for the year ended 31 December 2017
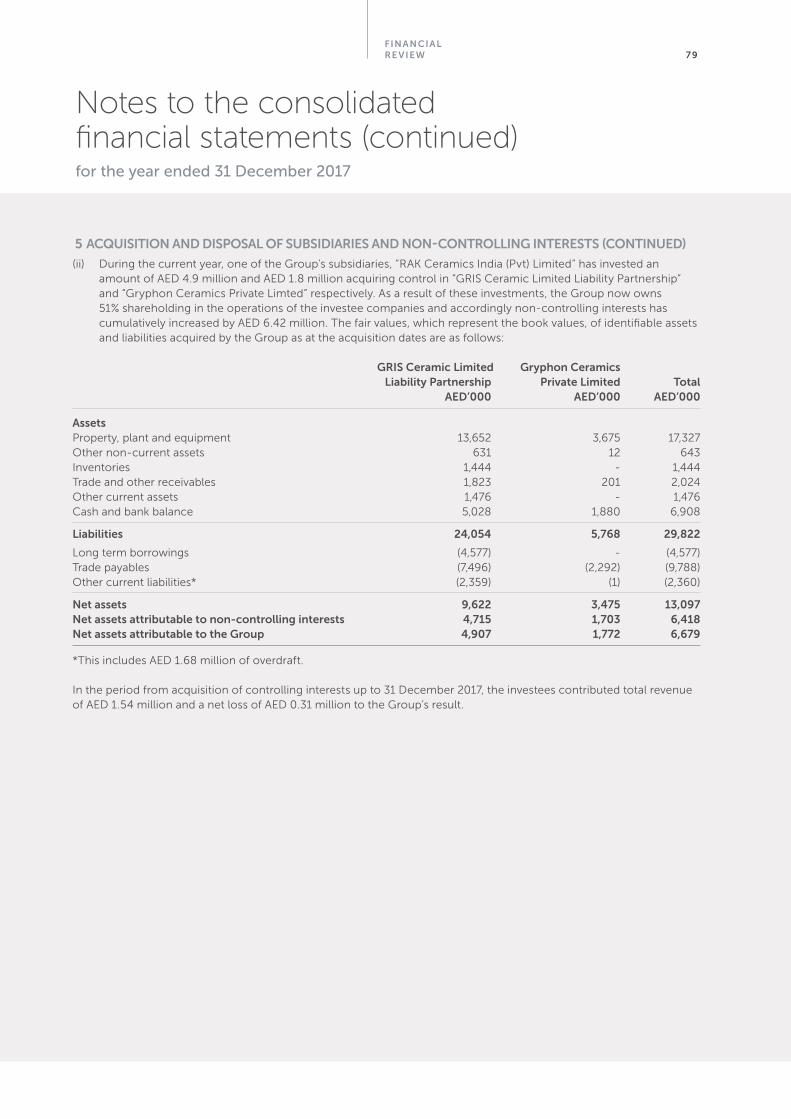
Financial re view 79
(ii) During the current year, one of the Group’s subsidiaries, “RAK Ceramics India (Pvt) Limited” has invested an amount of AED 4.9 million and AED 1.8 million acquiring control in “GRIS Ceramic Limited Liability Partnership” and “Gryphon Ceramics Private Limted” respectively. As a result of these investments, the Group now owns 51% shareholding in the operations of the investee companies and accordingly non-controlling interests has cumulatively increased by AED 6.42 million. The fair values, which represent the book values, of identifiable assets and liabilities acquired by the Group as at the acquisition dates are as follows:
GRiS ceramic limited Gryphon ceramics liability Partnership Private limited total aeD’000 aeD’000 aeD’000
assets Property, plant and equipment 13,652 3,675 17,327Other non-current assets 631 12 643Inventories 1,444 - 1,444Trade and other receivables 1,823 201 2,024 Other current assets 1,476 - 1,476Cash and bank balance 5,028 1,880 6,908
liabilities 24,054 5,768 29,822
Long term borrowings (4,577) - (4,577) Trade payables (7,496) (2,292) (9,788) Other current liabilities* (2,359) (1) (2,360)
net assets 9,622 3,475 13,097 net assets attributable to non-controlling interests 4,715 1,703 6,418 net assets attributable to the Group 4,907 1,772 6,679
*This includes AED 1.68 million of overdraft.
In the period from acquisition of controlling interests up to 31 December 2017, the investees contributed total revenue of AED 1.54 million and a net loss of AED 0.31 million to the Group’s result.
5 acqUiSition anD DiSPoSal oF SUBSiDiaRieS anD non-contRollinG inteReStS (continUeD)
notes to the consolidated financial statements (continued)for the year ended 31 December 2017
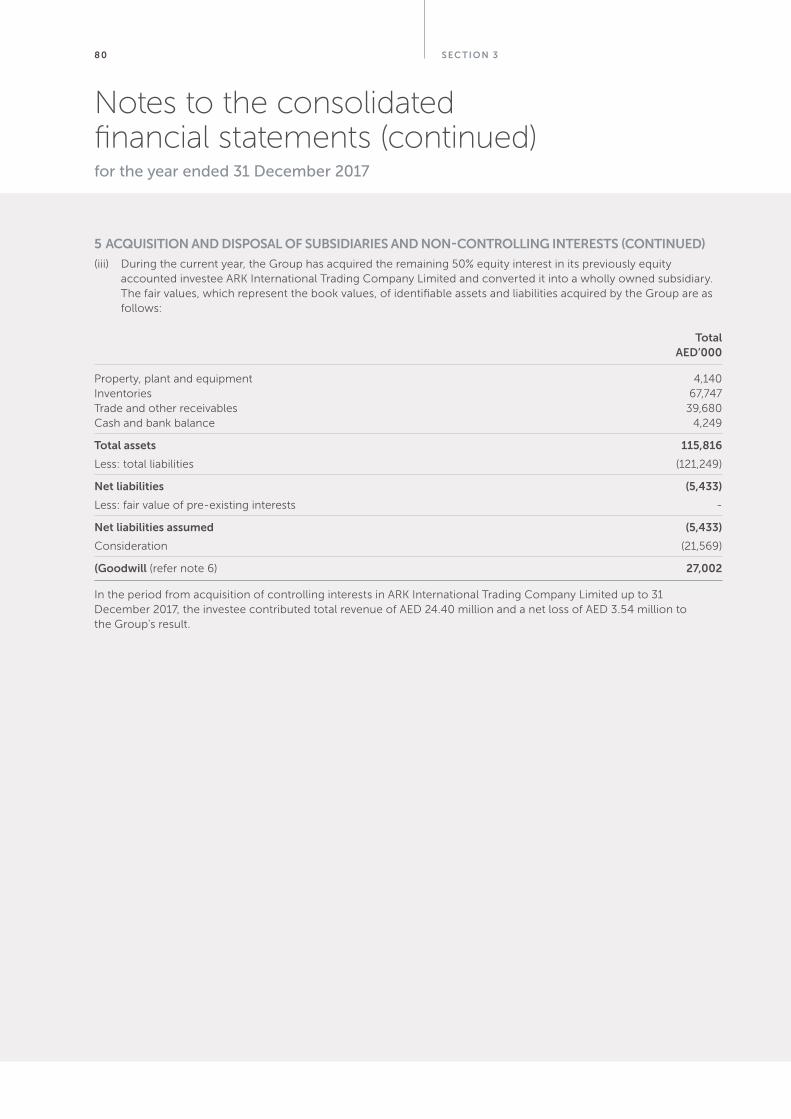
Sec tion 380
5 acqUiSition anD DiSPoSal oF SUBSiDiaRieS anD non-contRollinG inteReStS (continUeD)
notes to the consolidated financial statements (continued)for the year ended 31 December 2017
(iii) During the current year, the Group has acquired the remaining 50% equity interest in its previously equity accounted investee ARK International Trading Company Limited and converted it into a wholly owned subsidiary. The fair values, which represent the book values, of identifiable assets and liabilities acquired by the Group are as follows:
total aeD’000
Property, plant and equipment 4,140Inventories 67,747Trade and other receivables 39,680Cash and bank balance 4,249
total assets 115,816
Less: total liabilities (121,249)
net liabilities (5,433)
Less: fair value of pre-existing interests -
net liabilities assumed (5,433)
Consideration (21,569)
(Goodwill (refer note 6) 27,002
In the period from acquisition of controlling interests in ARK International Trading Company Limited up to 31 December 2017, the investee contributed total revenue of AED 24.40 million and a net loss of AED 3.54 million to the Group’s result.
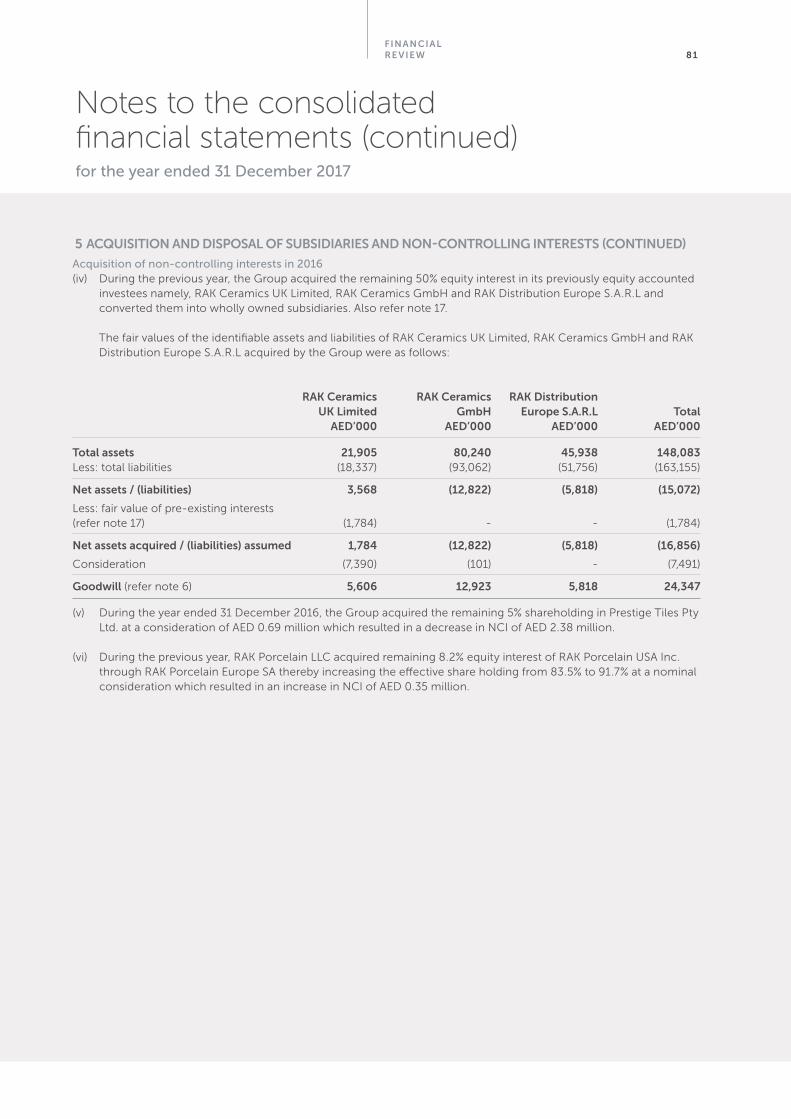
Financial re view 81
5 acqUiSition anD DiSPoSal oF SUBSiDiaRieS anD non-contRollinG inteReStS (continUeD)
notes to the consolidated financial statements (continued)for the year ended 31 December 2017
Acquisition of non-controlling interests in 2016(iv) During the previous year, the Group acquired the remaining 50% equity interest in its previously equity accounted
investees namely, RAK Ceramics UK Limited, RAK Ceramics GmbH and RAK Distribution Europe S.A.R.L and converted them into wholly owned subsidiaries. Also refer note 17.
The fair values of the identifiable assets and liabilities of RAK Ceramics UK Limited, RAK Ceramics GmbH and RAK Distribution Europe S.A.R.L acquired by the Group were as follows:
RaK ceramics RaK ceramics RaK Distribution UK limited GmbH europe S.a.R.l total aeD’000 aeD’000 aeD’000 aeD’000
total assets 21,905 80,240 45,938 148,083 Less: total liabilities (18,337) (93,062) (51,756) (163,155)
net assets / (liabilities) 3,568 (12,822) (5,818) (15,072)
Less: fair value of pre-existing interests (refer note 17) (1,784) - - (1,784)
net assets acquired / (liabilities) assumed 1,784 (12,822) (5,818) (16,856)
Consideration (7,390) (101) - (7,491)
Goodwill (refer note 6) 5,606 12,923 5,818 24,347
(v) During the year ended 31 December 2016, the Group acquired the remaining 5% shareholding in Prestige Tiles Pty Ltd. at a consideration of AED 0.69 million which resulted in a decrease in NCI of AED 2.38 million.
(vi) During the previous year, RAK Porcelain LLC acquired remaining 8.2% equity interest of RAK Porcelain USA Inc. through RAK Porcelain Europe SA thereby increasing the effective share holding from 83.5% to 91.7% at a nominal consideration which resulted in an increase in NCI of AED 0.35 million.
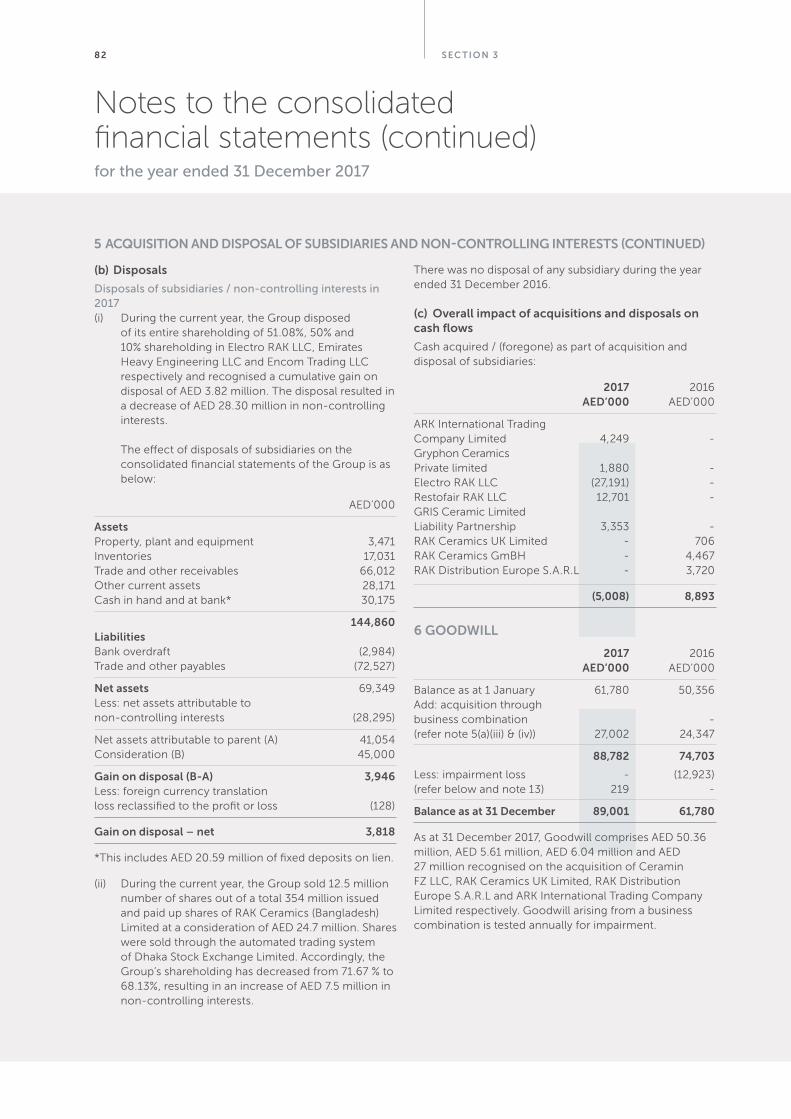
Sec tion 382
notes to the consolidated financial statements (continued)for the year ended 31 December 2017
(b) Disposals
Disposals of subsidiaries / non-controlling interests in 2017(i) During the current year, the Group disposed
of its entire shareholding of 51.08%, 50% and 10% shareholding in Electro RAK LLC, Emirates Heavy Engineering LLC and Encom Trading LLC respectively and recognised a cumulative gain on disposal of AED 3.82 million. The disposal resulted in a decrease of AED 28.30 million in non-controlling interests. The effect of disposals of subsidiaries on the consolidated financial statements of the Group is as below:
AED’000
assets Property, plant and equipment 3,471 Inventories 17,031 Trade and other receivables 66,012 Other current assets 28,171Cash in hand and at bank* 30,175
144,860 liabilities Bank overdraft (2,984)Trade and other payables (72,527)
net assets 69,349Less: net assets attributable to non-controlling interests (28,295)
Net assets attributable to parent (A) 41,054 Consideration (B) 45,000
Gain on disposal (B-a) 3,946 Less: foreign currency translation loss reclassified to the profit or loss (128)
Gain on disposal – net 3,818
*This includes AED 20.59 million of fixed deposits on lien.
(ii) During the current year, the Group sold 12.5 million number of shares out of a total 354 million issued and paid up shares of RAK Ceramics (Bangladesh) Limited at a consideration of AED 24.7 million. Shares were sold through the automated trading system of Dhaka Stock Exchange Limited. Accordingly, the Group’s shareholding has decreased from 71.67 % to 68.13%, resulting in an increase of AED 7.5 million in non-controlling interests.
There was no disposal of any subsidiary during the year ended 31 December 2016.
(c) overall impact of acquisitions and disposals on cash flows
Cash acquired / (foregone) as part of acquisition and disposal of subsidiaries:
2017 2016 aeD’000 AED’000
ARK International Trading Company Limited 4,249 -Gryphon Ceramics Private limited 1,880 -Electro RAK LLC (27,191) -Restofair RAK LLC 12,701 - GRIS Ceramic Limited Liability Partnership 3,353 -RAK Ceramics UK Limited - 706 RAK Ceramics GmBH - 4,467 RAK Distribution Europe S.A.R.L - 3,720
(5,008) 8,893
6 GooDwill
2017 2016 aeD’000 AED’000
Balance as at 1 January 61,780 50,356Add: acquisition through business combination - (refer note 5(a)(iii) & (iv)) 27,002 24,347
88,782 74,703
Less: impairment loss - (12,923) (refer below and note 13) 219 -
Balance as at 31 December 89,001 61,780
As at 31 December 2017, Goodwill comprises AED 50.36 million, AED 5.61 million, AED 6.04 million and AED 27 million recognised on the acquisition of Ceramin FZ LLC, RAK Ceramics UK Limited, RAK Distribution Europe S.A.R.L and ARK International Trading Company Limited respectively. Goodwill arising from a business combination is tested annually for impairment.
5 acqUiSition anD DiSPoSal oF SUBSiDiaRieS anD non-contRollinG inteReStS (continUeD)
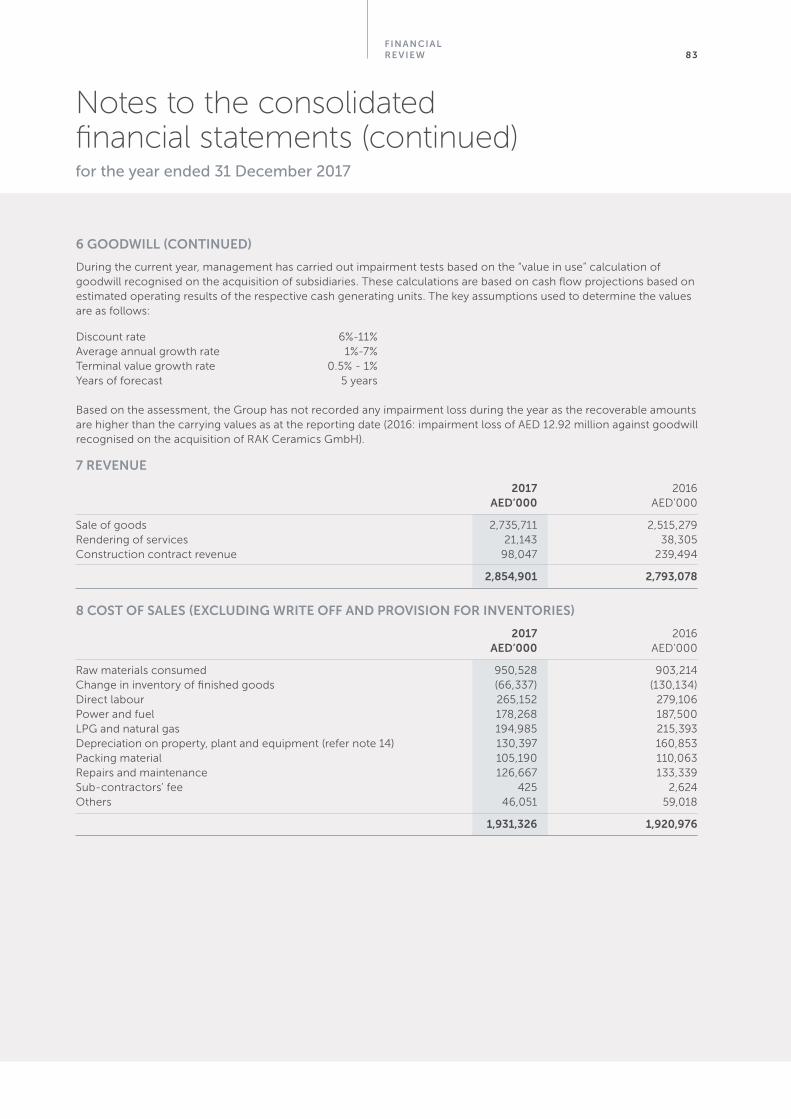
Financial re view 83
6 GooDwill (continUeD)
During the current year, management has carried out impairment tests based on the “value in use” calculation of goodwill recognised on the acquisition of subsidiaries. These calculations are based on cash flow projections based on estimated operating results of the respective cash generating units. The key assumptions used to determine the values are as follows:
Discount rate 6%-11%Average annual growth rate 1%-7%Terminal value growth rate 0.5% - 1% Years of forecast 5 years
Based on the assessment, the Group has not recorded any impairment loss during the year as the recoverable amounts are higher than the carrying values as at the reporting date (2016: impairment loss of AED 12.92 million against goodwill recognised on the acquisition of RAK Ceramics GmbH).
7 RevenUe
2017 2016 aeD’000 AED’000
Sale of goods 2,735,711 2,515,279Rendering of services 21,143 38,305Construction contract revenue 98,047 239,494
2,854,901 2,793,078
8 coSt oF SaleS (exclUDinG wRite oFF anD PRoviSion FoR inventoRieS)
2017 2016 aeD’000 AED’000
Raw materials consumed 950,528 903,214Change in inventory of finished goods (66,337) (130,134)Direct labour 265,152 279,106Power and fuel 178,268 187,500LPG and natural gas 194,985 215,393Depreciation on property, plant and equipment (refer note 14) 130,397 160,853Packing material 105,190 110,063Repairs and maintenance 126,667 133,339Sub-contractors’ fee 425 2,624Others 46,051 59,018
1,931,326 1,920,976
notes to the consolidated financial statements (continued)for the year ended 31 December 2017
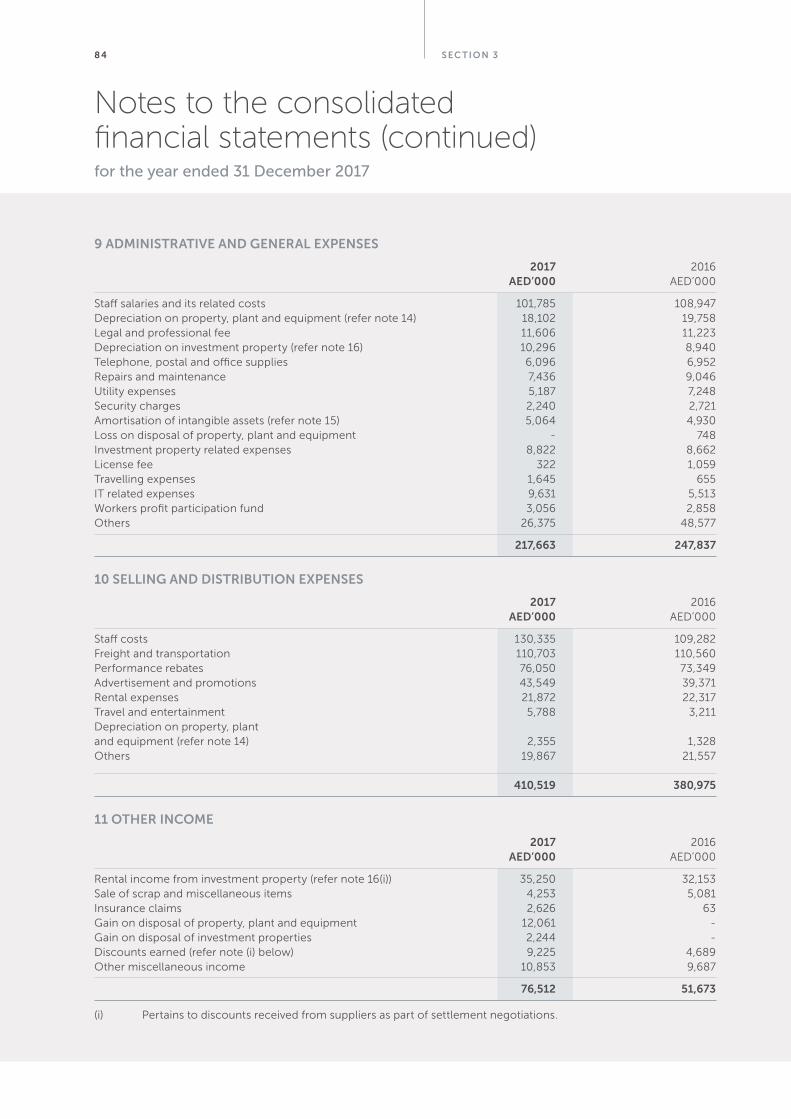
Sec tion 384
9 aDMiniStRative anD GeneRal exPenSeS
2017 2016 aeD’000 AED’000
Staff salaries and its related costs 101,785 108,947Depreciation on property, plant and equipment (refer note 14) 18,102 19,758Legal and professional fee 11,606 11,223Depreciation on investment property (refer note 16) 10,296 8,940Telephone, postal and office supplies 6,096 6,952Repairs and maintenance 7,436 9,046Utility expenses 5,187 7,248Security charges 2,240 2,721Amortisation of intangible assets (refer note 15) 5,064 4,930Loss on disposal of property, plant and equipment - 748Investment property related expenses 8,822 8,662License fee 322 1,059Travelling expenses 1,645 655IT related expenses 9,631 5,513Workers profit participation fund 3,056 2,858Others 26,375 48,577
217,663 247,837
10 SellinG anD DiStRiBUtion exPenSeS
2017 2016 aeD’000 AED’000
Staff costs 130,335 109,282Freight and transportation 110,703 110,560Performance rebates 76,050 73,349Advertisement and promotions 43,549 39,371Rental expenses 21,872 22,317Travel and entertainment 5,788 3,211Depreciation on property, plant and equipment (refer note 14) 2,355 1,328Others 19,867 21,557
410,519 380,975
11 otHeR incoMe
2017 2016 aeD’000 AED’000
Rental income from investment property (refer note 16(i)) 35,250 32,153Sale of scrap and miscellaneous items 4,253 5,081Insurance claims 2,626 63Gain on disposal of property, plant and equipment 12,061 -Gain on disposal of investment properties 2,244 -Discounts earned (refer note (i) below) 9,225 4,689 Other miscellaneous income 10,853 9,687
76,512 51,673
(i) Pertains to discounts received from suppliers as part of settlement negotiations.
notes to the consolidated financial statements (continued)for the year ended 31 December 2017
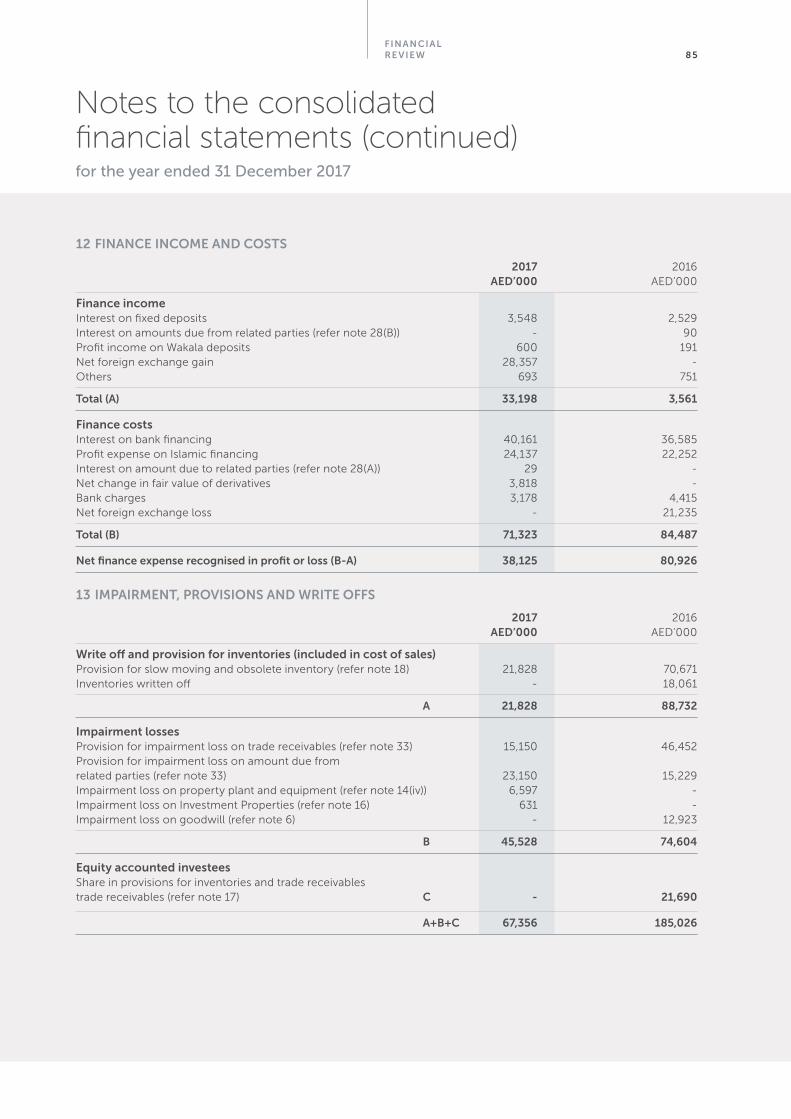
Financial re view 85
12 Finance incoMe anD coStS
2017 2016 aeD’000 AED’000
Finance incomeInterest on fixed deposits 3,548 2,529Interest on amounts due from related parties (refer note 28(B)) - 90Profit income on Wakala deposits 600 191Net foreign exchange gain 28,357 -Others 693 751
total (a) 33,198 3,561
Finance costsInterest on bank financing 40,161 36,585Profit expense on Islamic financing 24,137 22,252Interest on amount due to related parties (refer note 28(A)) 29 -Net change in fair value of derivatives 3,818 - Bank charges 3,178 4,415Net foreign exchange loss - 21,235
total (B) 71,323 84,487
net finance expense recognised in profit or loss (B-a) 38,125 80,926
13 iMPaiRMent, PRoviSionS anD wRite oFFS
2017 2016 aeD’000 AED’000
write off and provision for inventories (included in cost of sales)Provision for slow moving and obsolete inventory (refer note 18) 21,828 70,671Inventories written off - 18,061
a 21,828 88,732
impairment lossesProvision for impairment loss on trade receivables (refer note 33) 15,150 46,452Provision for impairment loss on amount due from related parties (refer note 33) 23,150 15,229Impairment loss on property plant and equipment (refer note 14(iv)) 6,597 - Impairment loss on Investment Properties (refer note 16) 631 - Impairment loss on goodwill (refer note 6) - 12,923
B 45,528 74,604
equity accounted investees Share in provisions for inventories and trade receivables trade receivables (refer note 17) c - 21,690
a+B+c 67,356 185,026
notes to the consolidated financial statements (continued)for the year ended 31 December 2017
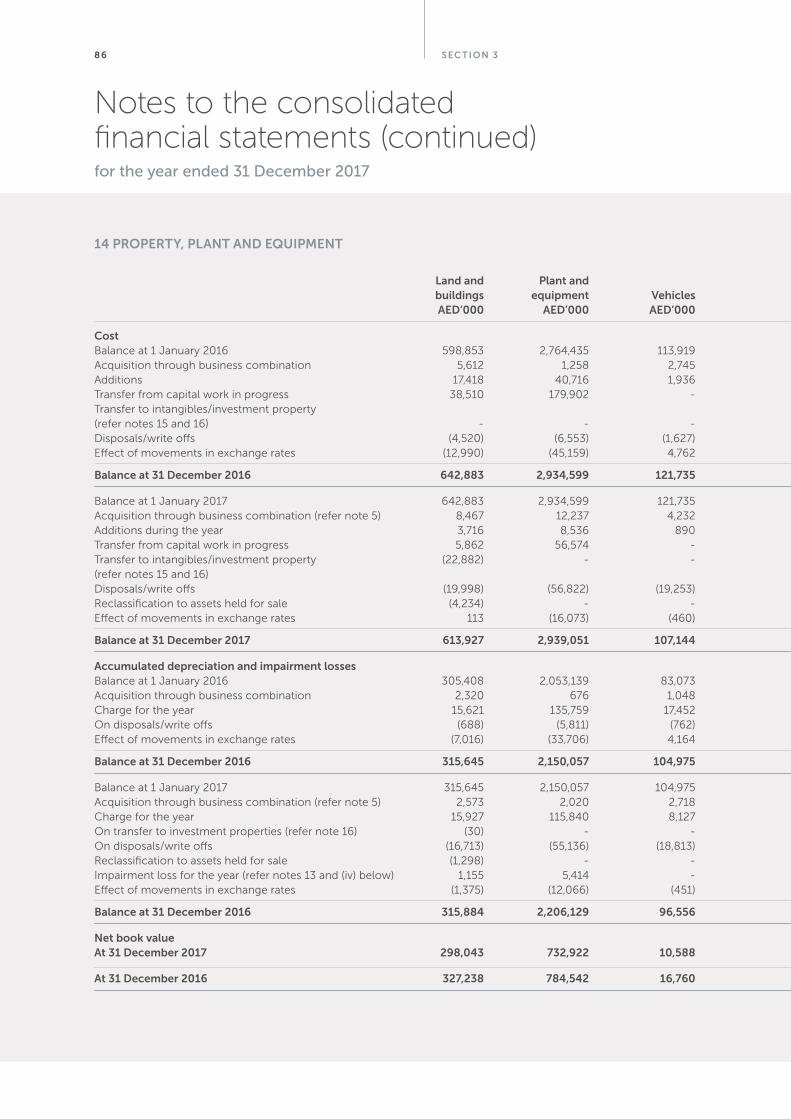
Sec tion 386
14 PRoPeRtY, Plant anD eqUiPMent
quarry and land and Plant and Furniture and office Road and land capital work buildings equipment vehicles fixtures equipment asphalting development in progress total aeD’000 aeD’000 aeD’000 aeD’000 aeD’000 aeD’000 aeD’000 aeD’000 aeD’000
costBalance at 1 January 2016 598,853 2,764,435 113,919 43,326 56,106 21,021 129 182,271 3,780,060Acquisition through business combination 5,612 1,258 2,745 5,357 4,150 - - - 19,122Additions 17,418 40,716 1,936 2,291 1,138 22 - 152,159 215,680Transfer from capital work in progress 38,510 179,902 - 828 7,112 599 - (226,951) - Transfer to intangibles/investment property (refer notes 15 and 16) - - - - - - - (30,245) (30,245)Disposals/write offs (4,520) (6,553) (1,627) (612) (570) - - (10,495) (24,377)Effect of movements in exchange rates (12,990) (45,159) 4,762 (2,003) 60 (210) - 102 (55,438)
Balance at 31 December 2016 642,883 2,934,599 121,735 49,187 67,996 21,432 129 66,841 3,904,802
Balance at 1 January 2017 642,883 2,934,599 121,735 49,187 67,996 21,432 129 66,841 3,904,802Acquisition through business combination (refer note 5) 8,467 12,237 4,232 2,382 820 - - 3,450 31,588Additions during the year 3,716 8,536 890 4,299 2,776 186 - 73,908 94,311Transfer from capital work in progress 5,862 56,574 - 1,389 250 - - (64,075) -Transfer to intangibles/investment property (22,882) - - - - - - (12,215) (35,097) (refer notes 15 and 16) Disposals/write offs (19,998) (56,822) (19,253) (8,860) (4,595) (476) - (1,935) (111,939) Reclassification to assets held for sale (4,234) - - (783) - - - - (5,017)Effect of movements in exchange rates 113 (16,073) (460) 1,201 1,013 (183) - (1,298) (15,687)
Balance at 31 December 2017 613,927 2,939,051 107,144 48,815 68,260 20,959 129 64,676 3,862,961
accumulated depreciation and impairment lossesBalance at 1 January 2016 305,408 2,053,139 83,073 32,589 42,041 15,880 129 - 2,532,259 Acquisition through business combination 2,320 676 1,048 2,247 3,171 - - - 9,462Charge for the year 15,621 135,759 17,452 5,036 7,237 834 - - 181,939On disposals/write offs (688) (5,811) (762) (206) (448) - - - (7,915)Effect of movements in exchange rates (7,016) (33,706) 4,164 (412) (273) (234) - - (37,477)
Balance at 31 December 2016 315,645 2,150,057 104,975 39,254 51,728 16,480 129 - 2,678,268
Balance at 1 January 2017 315,645 2,150,057 104,975 39,254 51,728 16,480 129 - 2,678,268 Acquisition through business combination (refer note 5) 2,573 2,020 2,718 1,593 554 - - - 9,458 Charge for the year 15,927 115,840 8,127 4,216 6,013 731 - - 150,854 On transfer to investment properties (refer note 16) (30) - - - - - - - (30) On disposals/write offs (16,713) (55,136) (18,813) (8,342) (4,547) (444) - - (103,995)Reclassification to assets held for sale (1,298) - - (744) - - - - (2,042)Impairment loss for the year (refer notes 13 and (iv) below) 1,155 5,414 - 2 2 24 - - 6,597Effect of movements in exchange rates (1,375) (12,066) (451) 906 631 (282) - - (12,573)
Balance at 31 December 2016 315,884 2,206,129 96,556 36,885 54,381 16,573 129 - 2,726,537
net book value at 31 December 2017 298,043 732,922 10,588 11,930 13,879 4,386 - 64,676 1,136,424
at 31 December 2016 327,238 784,542 16,760 9,933 16,268 4,952 - 66,841 1,226,534
notes to the consolidated financial statements (continued)for the year ended 31 December 2017
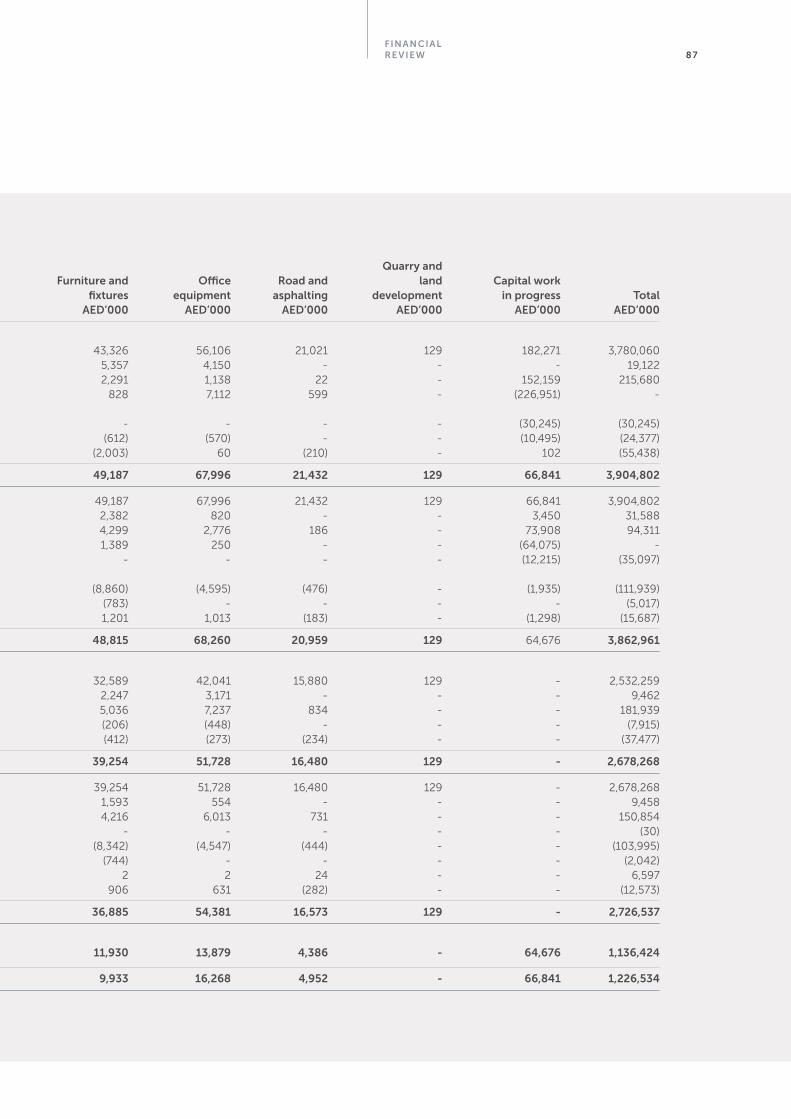
Financial re view 87
quarry and land and Plant and Furniture and office Road and land capital work buildings equipment vehicles fixtures equipment asphalting development in progress total aeD’000 aeD’000 aeD’000 aeD’000 aeD’000 aeD’000 aeD’000 aeD’000 aeD’000
costBalance at 1 January 2016 598,853 2,764,435 113,919 43,326 56,106 21,021 129 182,271 3,780,060Acquisition through business combination 5,612 1,258 2,745 5,357 4,150 - - - 19,122Additions 17,418 40,716 1,936 2,291 1,138 22 - 152,159 215,680Transfer from capital work in progress 38,510 179,902 - 828 7,112 599 - (226,951) - Transfer to intangibles/investment property (refer notes 15 and 16) - - - - - - - (30,245) (30,245)Disposals/write offs (4,520) (6,553) (1,627) (612) (570) - - (10,495) (24,377)Effect of movements in exchange rates (12,990) (45,159) 4,762 (2,003) 60 (210) - 102 (55,438)
Balance at 31 December 2016 642,883 2,934,599 121,735 49,187 67,996 21,432 129 66,841 3,904,802
Balance at 1 January 2017 642,883 2,934,599 121,735 49,187 67,996 21,432 129 66,841 3,904,802Acquisition through business combination (refer note 5) 8,467 12,237 4,232 2,382 820 - - 3,450 31,588Additions during the year 3,716 8,536 890 4,299 2,776 186 - 73,908 94,311Transfer from capital work in progress 5,862 56,574 - 1,389 250 - - (64,075) -Transfer to intangibles/investment property (22,882) - - - - - - (12,215) (35,097) (refer notes 15 and 16) Disposals/write offs (19,998) (56,822) (19,253) (8,860) (4,595) (476) - (1,935) (111,939) Reclassification to assets held for sale (4,234) - - (783) - - - - (5,017)Effect of movements in exchange rates 113 (16,073) (460) 1,201 1,013 (183) - (1,298) (15,687)
Balance at 31 December 2017 613,927 2,939,051 107,144 48,815 68,260 20,959 129 64,676 3,862,961
accumulated depreciation and impairment lossesBalance at 1 January 2016 305,408 2,053,139 83,073 32,589 42,041 15,880 129 - 2,532,259 Acquisition through business combination 2,320 676 1,048 2,247 3,171 - - - 9,462Charge for the year 15,621 135,759 17,452 5,036 7,237 834 - - 181,939On disposals/write offs (688) (5,811) (762) (206) (448) - - - (7,915)Effect of movements in exchange rates (7,016) (33,706) 4,164 (412) (273) (234) - - (37,477)
Balance at 31 December 2016 315,645 2,150,057 104,975 39,254 51,728 16,480 129 - 2,678,268
Balance at 1 January 2017 315,645 2,150,057 104,975 39,254 51,728 16,480 129 - 2,678,268 Acquisition through business combination (refer note 5) 2,573 2,020 2,718 1,593 554 - - - 9,458 Charge for the year 15,927 115,840 8,127 4,216 6,013 731 - - 150,854 On transfer to investment properties (refer note 16) (30) - - - - - - - (30) On disposals/write offs (16,713) (55,136) (18,813) (8,342) (4,547) (444) - - (103,995)Reclassification to assets held for sale (1,298) - - (744) - - - - (2,042)Impairment loss for the year (refer notes 13 and (iv) below) 1,155 5,414 - 2 2 24 - - 6,597Effect of movements in exchange rates (1,375) (12,066) (451) 906 631 (282) - - (12,573)
Balance at 31 December 2016 315,884 2,206,129 96,556 36,885 54,381 16,573 129 - 2,726,537
net book value at 31 December 2017 298,043 732,922 10,588 11,930 13,879 4,386 - 64,676 1,136,424
at 31 December 2016 327,238 784,542 16,760 9,933 16,268 4,952 - 66,841 1,226,534
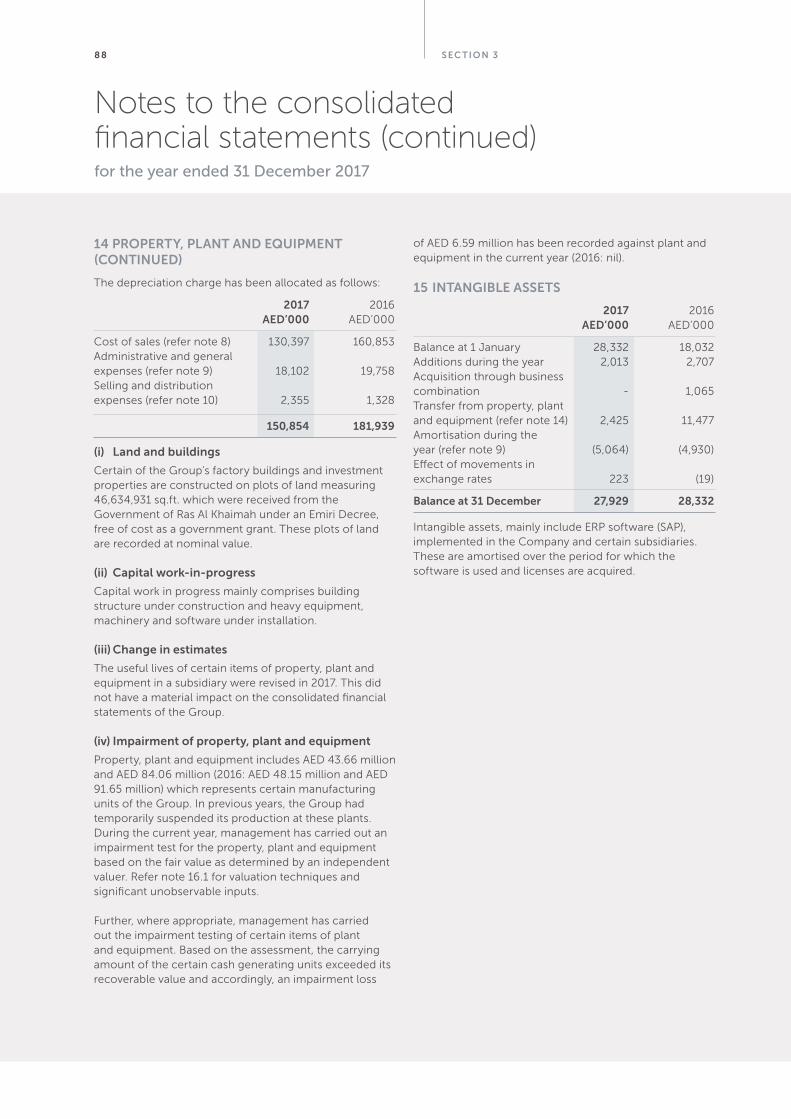
Sec tion 388
14 PRoPeRtY, Plant anD eqUiPMent (continUeD)
The depreciation charge has been allocated as follows:
2017 2016 aeD’000 AED’000
Cost of sales (refer note 8) 130,397 160,853Administrative and general expenses (refer note 9) 18,102 19,758Selling and distribution expenses (refer note 10) 2,355 1,328
150,854 181,939
(i) land and buildings
Certain of the Group’s factory buildings and investment properties are constructed on plots of land measuring 46,634,931 sq.ft. which were received from the Government of Ras Al Khaimah under an Emiri Decree, free of cost as a government grant. These plots of land are recorded at nominal value.
(ii) capital work-in-progress
Capital work in progress mainly comprises building structure under construction and heavy equipment, machinery and software under installation.
(iii) change in estimates
The useful lives of certain items of property, plant and equipment in a subsidiary were revised in 2017. This did not have a material impact on the consolidated financial statements of the Group.
(iv) impairment of property, plant and equipment
Property, plant and equipment includes AED 43.66 million and AED 84.06 million (2016: AED 48.15 million and AED 91.65 million) which represents certain manufacturing units of the Group. In previous years, the Group had temporarily suspended its production at these plants. During the current year, management has carried out an impairment test for the property, plant and equipment based on the fair value as determined by an independent valuer. Refer note 16.1 for valuation techniques and significant unobservable inputs.
Further, where appropriate, management has carried out the impairment testing of certain items of plant and equipment. Based on the assessment, the carrying amount of the certain cash generating units exceeded its recoverable value and accordingly, an impairment loss
of AED 6.59 million has been recorded against plant and equipment in the current year (2016: nil).
15 intanGiBle aSSetS
2017 2016 aeD’000 AED’000
Balance at 1 January 28,332 18,032Additions during the year 2,013 2,707Acquisition through business combination - 1,065Transfer from property, plant and equipment (refer note 14) 2,425 11,477Amortisation during the year (refer note 9) (5,064) (4,930)Effect of movements in exchange rates 223 (19)
Balance at 31 December 27,929 28,332
Intangible assets, mainly include ERP software (SAP), implemented in the Company and certain subsidiaries. These are amortised over the period for which the software is used and licenses are acquired.
notes to the consolidated financial statements (continued)for the year ended 31 December 2017
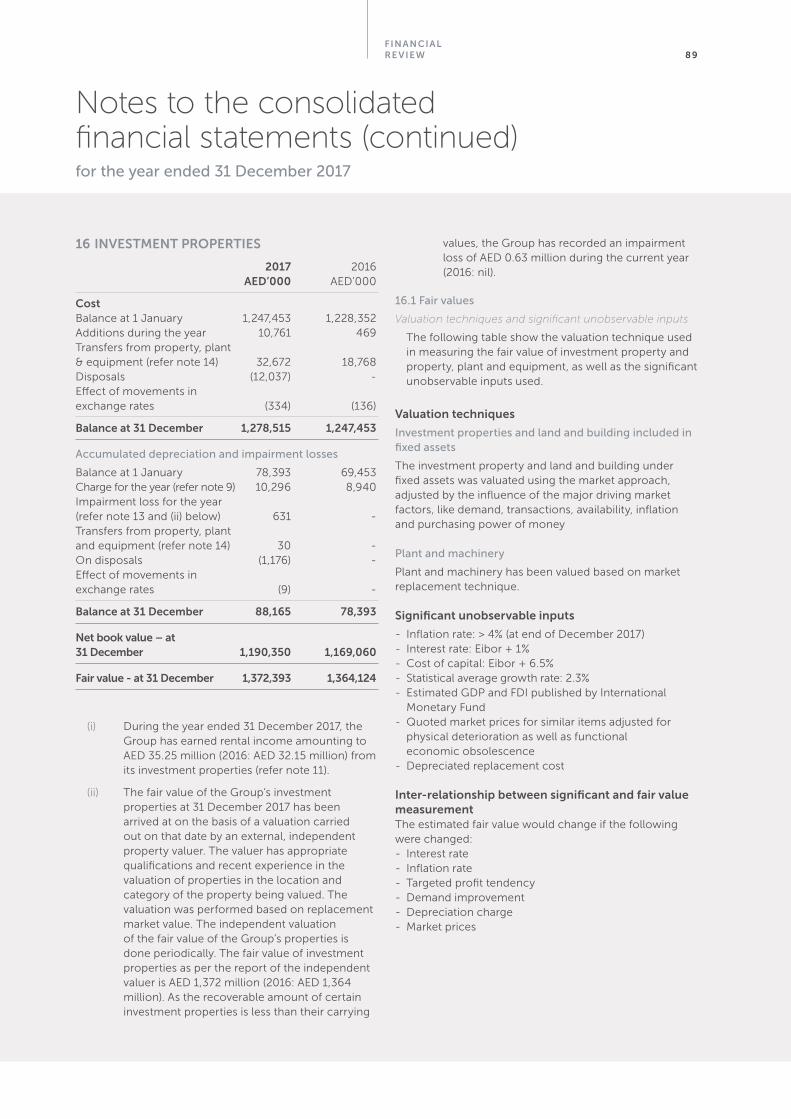
Financial re view 89
16 inveStMent PRoPeRtieS
2017 2016 aeD’000 AED’000
costBalance at 1 January 1,247,453 1,228,352Additions during the year 10,761 469Transfers from property, plant & equipment (refer note 14) 32,672 18,768Disposals (12,037) -Effect of movements in exchange rates (334) (136)
Balance at 31 December 1,278,515 1,247,453
Accumulated depreciation and impairment losses
Balance at 1 January 78,393 69,453Charge for the year (refer note 9) 10,296 8,940Impairment loss for the year (refer note 13 and (ii) below) 631 - Transfers from property, plant and equipment (refer note 14) 30 -On disposals (1,176) - Effect of movements in exchange rates (9) -
Balance at 31 December 88,165 78,393
net book value – at 31 December 1,190,350 1,169,060
Fair value - at 31 December 1,372,393 1,364,124
(i) During the year ended 31 December 2017, the Group has earned rental income amounting to AED 35.25 million (2016: AED 32.15 million) from its investment properties (refer note 11).
(ii) The fair value of the Group’s investment properties at 31 December 2017 has been arrived at on the basis of a valuation carried out on that date by an external, independent property valuer. The valuer has appropriate qualifications and recent experience in the valuation of properties in the location and category of the property being valued. The valuation was performed based on replacement market value. The independent valuation of the fair value of the Group’s properties is done periodically. The fair value of investment properties as per the report of the independent valuer is AED 1,372 million (2016: AED 1,364 million). As the recoverable amount of certain investment properties is less than their carrying
values, the Group has recorded an impairment loss of AED 0.63 million during the current year (2016: nil).
16.1 Fair values
Valuation techniques and significant unobservable inputs
The following table show the valuation technique used in measuring the fair value of investment property and property, plant and equipment, as well as the significant unobservable inputs used.
valuation techniques
Investment properties and land and building included in fixed assets
The investment property and land and building under fixed assets was valuated using the market approach, adjusted by the influence of the major driving market factors, like demand, transactions, availability, inflation and purchasing power of money
Plant and machinery
Plant and machinery has been valued based on market replacement technique.
Significant unobservable inputs
- Inflation rate: > 4% (at end of December 2017)- Interest rate: Eibor + 1%- Cost of capital: Eibor + 6.5%- Statistical average growth rate: 2.3% - Estimated GDP and FDI published by International Monetary Fund- Quoted market prices for similar items adjusted for physical deterioration as well as functional economic obsolescence- Depreciated replacement cost
inter-relationship between significant and fair value measurementThe estimated fair value would change if the following were changed:- Interest rate - Inflation rate - Targeted profit tendency- Demand improvement - Depreciation charge- Market prices
notes to the consolidated financial statements (continued)for the year ended 31 December 2017
Sec tion 390
17 inveStMentS in eqUitY accoUnteD inveSteeS
Movement in investments in equity accounted investees is set out below:
2017 2016 aeD’000 AED’000
At 1 January 112,378 127,563Investments made during the year (refer note (i) below) - 1,644Share of profits / (losses) * 9,535 (4,038)Disposals (refer note (ii) below) (64,461) -Adjustment due to controlling interest in a joint venture (refer notes 5(a)(i) and (iv)) (10,278) (1,784)Dividends received during the year (6,032) (10,895)Effect of movements in exchange rates 622 (112)
at 31 December 41,764 112,378
* This includes share in provisions for inventories and trade receivables of Nil (2016: AED 21.69 million). Refer note 13.
(i) acquisition equity accounted investees
Acquisition of / further investment in equity accounted investees in 2017
There were no acquisitions nor further addition to any of the equity accounted investees during the year ended 31 December 2017.
Acquisition of / further investment in equity accounted investees in 2016
During the previous year, the Group made a further investment of AED 1.6 million in its equity accounted investee “Restofair RAK LLC” thereby increasing a shareholding from 41% to 47%.
(ii) Disposal of equity accounted investees
Disposal / conversion of equity accounted investees in 2017
Conversion from an equity accounted investee to a subsidiary:
Effective 1 January 2017, due to a change in the composition of Board of Directors of Restofair RAK LLC (a jointly controlled entity until 31 December 2016),
the Group can now exercise control over the financial and operating policies of the investee. Accordingly, the conversion from an equity accounted entity to a subsidiary has been accounted for from the date when the Group acquired the control. Also refer note 5(a)(i).
Disposal of an equity accounted investee:
The Group has disposed of its entire 50% equity interest in jointly controlled entity RAK Warehouse Leasing LLC on 13 June 2017. RaK warehouse leasing llc aeD’000
Present value of sale 122,360consideration (refer (*) below) Less: net carrying value (64,461)
net gain on disposal 57,899
* As per the sale and purchase agreement, the sale consideration of AED 125 million is to be paid in 5 equal semi-annual instalments of AED 21 million and one semi-annual instalment of AED 20 million commencing from June 2017 to December 2019. The present value of the sale consideration is stated net of discounting impact of AED 2.64 million.
Disposal / conversion of equity accounted investees in 2016
During the year ended 31 December 2016, the Group acquired remaining 50% shareholding in its equity accounted investees RAK Ceramics UK Limited, RAK Distribution Europe S.A.R.L and RAK Ceramics GmbH at a total consideration of AED 7.49 million. Refer note 5(a)(iv).
notes to the consolidated financial statements (continued)for the year ended 31 December 2017
Financial re view 91
17 inveStMentS in eqUitY accoUnteD inveSteeS (continUeD)
(iii) the following summarises the information relating to each of the Group’s investment in equity accounted investees.
Equity accounted investees
witHin Uae oUtSiDe Uae total
DeceMBeR 2017 2016 2017 2016 2017 2016 aeD’000 AED’000 aeD’000 AED’000 aeD’000 AED’000
Non-current assets 67,278 225,315 30,308 28,407 97,586 253,722Current assets 90,721 131,483 118,332 260,039 209,053 391,522Non-current liabilities 2,497 11,524 15,418 16,411 17,915 27,935Current liabilities 93,741 148,055 100,143 221,719 193,884 369,774Net assets 61,761 197,219 33,079 50,316 94,840 247,535Group’s share of net assets 31,659 98,666 17,148 25,766 48,807 124,432elimination of unrealised profit on downstream sales - 105 (7,043) (12,159) (7,043) (12,054)carrying amount of interest in equity accounted investees 31,659 98,771 10,105 13,607 41,764 112,378
Revenue 120,161 157,071 31,059 149,490 151,220 306,561Profit and total comprehensive income 17,202 31,008 1,261 (35,968) 18,463 (4,960)Group’s share 13,237 18,464 (3,702) (22,607) 9,535 (4,143)Elimination of unrealised profit on downstream sales - 105 - - - 105Group’s share of profit 13,237 18,569 (3,702) (22,607) 9,535 (4,038)
Dividend received by the Group 5,610 10,485 422 410 6,032 10,895
notes to the consolidated financial statements (continued)for the year ended 31 December 2017
Sec tion 392
18 inventoRieS
2017 2016 aeD’000 AED’000
Finished goods (net of NRV adjustment) 893,859 827,522Less: provision for slow moving and obsolete inventories (139,170) (122,357)
754,689 705,165Raw materials 233,312 236,705Goods-in-transit 76,019 59,851Work-in-progress 25,485 25,532Stores and spares 186,928 209,920
1,276,433 1,237,173Less: provision for slow moving raw materials and stores and spares * (61,731) (57,853)
1,214,702 1,179,320
* Critical spares are depreciated based on the useful life of the plant until they are issued to the factory for capitalisation. The depreciation charge is recognised in these consolidated financial statements under provision for inventories.
At 31 December 2017, the Group has recognised a cumulative loss due to write-down of finished goods inventories of AED 75.56 million against cost of AED 271.37 million (2016: AED 56.46 million against cost of AED 189.78 million) to bring them to their net realisable value which was lower than their costs. The difference in write down is included in cost of sales in the consolidated statement of profit or loss (refer note 8).
Inventories amounting to AED 243.43 million (2016: AED 245.49 million) are subject to a charge in favour of banks against facilities obtained by the Group (refer note 24(b)(ii)).
The movement in provision for slow moving inventories is as follows:
2017 2016 aeD’000 AED’000
As at 1 January 180,210 122,018Add: Charge for the year (refer note 13) 21,828 70,671Add: Addition due to acquisition 3,623 339Less: Written off (7,186) (10,645) Effect of movements in exchange rates 2,426 (2,173)
at 31 December 200,901 180,210
19 tRaDe anD otHeR ReceivaBleS
2017 2016 aeD’000 AED’000
Trade receivables 1,129,249 1,022,340Less: allowance for impairment losses (refer note 33) (187,078) (184,017)
942,171 838,323Advances and prepayments 173,227 154,437Deposits 19,795 16,800Other receivables (refer note below (i)) 155,985 123,179
1,291,178 1,132,739
Trade receivables amounting to AED 120.91 million (2016: AED 77.80 million) are subject to a charge in favour of banks against facilities obtained by the Group (refer note 24(b)(ii)).
notes to the consolidated financial statements (continued)for the year ended 31 December 2017
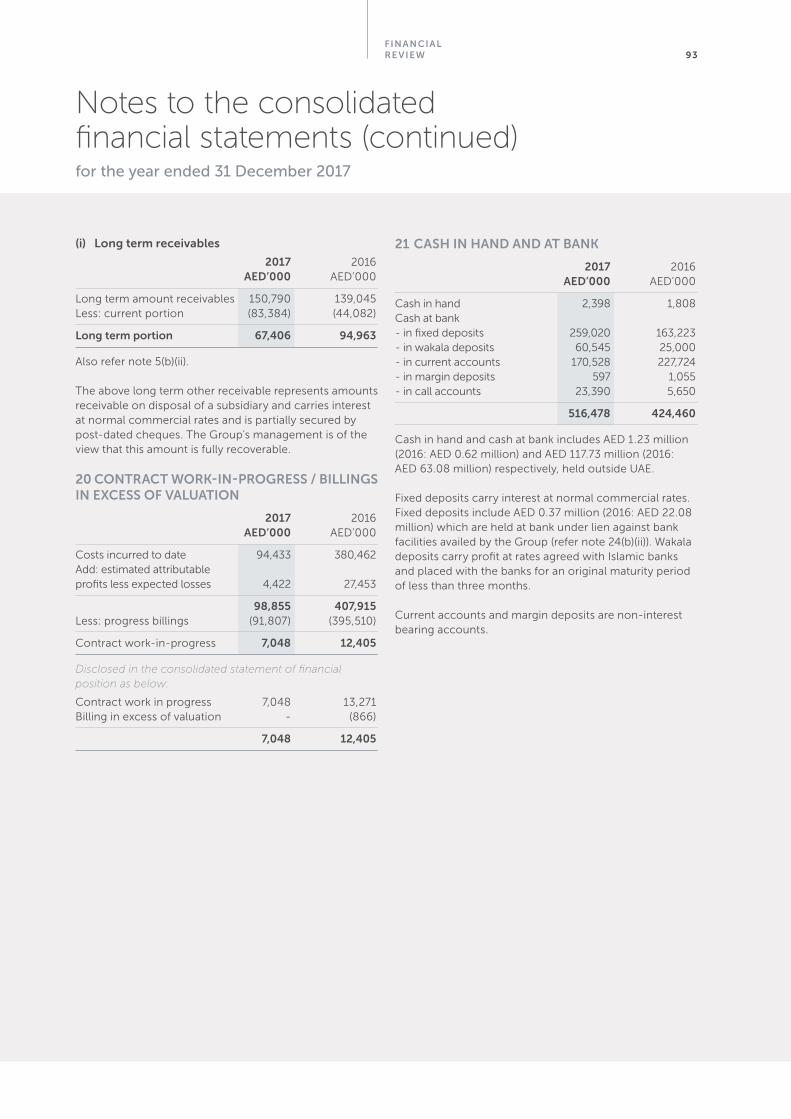
Financial re view 93
notes to the consolidated financial statements (continued)for the year ended 31 December 2017
(i) long term receivables
2017 2016 aeD’000 AED’000
Long term amount receivables 150,790 139,045Less: current portion (83,384) (44,082)
long term portion 67,406 94,963
Also refer note 5(b)(ii).
The above long term other receivable represents amounts receivable on disposal of a subsidiary and carries interest at normal commercial rates and is partially secured by post-dated cheques. The Group’s management is of the view that this amount is fully recoverable.
20 contRact woRK-in-PRoGReSS / BillinGS in exceSS oF valUation
2017 2016 aeD’000 AED’000
Costs incurred to date 94,433 380,462Add: estimated attributable profits less expected losses 4,422 27,453
98,855 407,915Less: progress billings (91,807) (395,510)
Contract work-in-progress 7,048 12,405
Disclosed in the consolidated statement of financial position as below:
Contract work in progress 7,048 13,271Billing in excess of valuation - (866)
7,048 12,405
21 caSH in HanD anD at BanK
2017 2016 aeD’000 AED’000
Cash in hand 2,398 1,808Cash at bank- in fixed deposits 259,020 163,223- in wakala deposits 60,545 25,000- in current accounts 170,528 227,724- in margin deposits 597 1,055- in call accounts 23,390 5,650
516,478 424,460
Cash in hand and cash at bank includes AED 1.23 million (2016: AED 0.62 million) and AED 117.73 million (2016: AED 63.08 million) respectively, held outside UAE.
Fixed deposits carry interest at normal commercial rates. Fixed deposits include AED 0.37 million (2016: AED 22.08 million) which are held at bank under lien against bank facilities availed by the Group (refer note 24(b)(ii)). Wakala deposits carry profit at rates agreed with Islamic banks and placed with the banks for an original maturity period of less than three months.
Current accounts and margin deposits are non-interest bearing accounts.
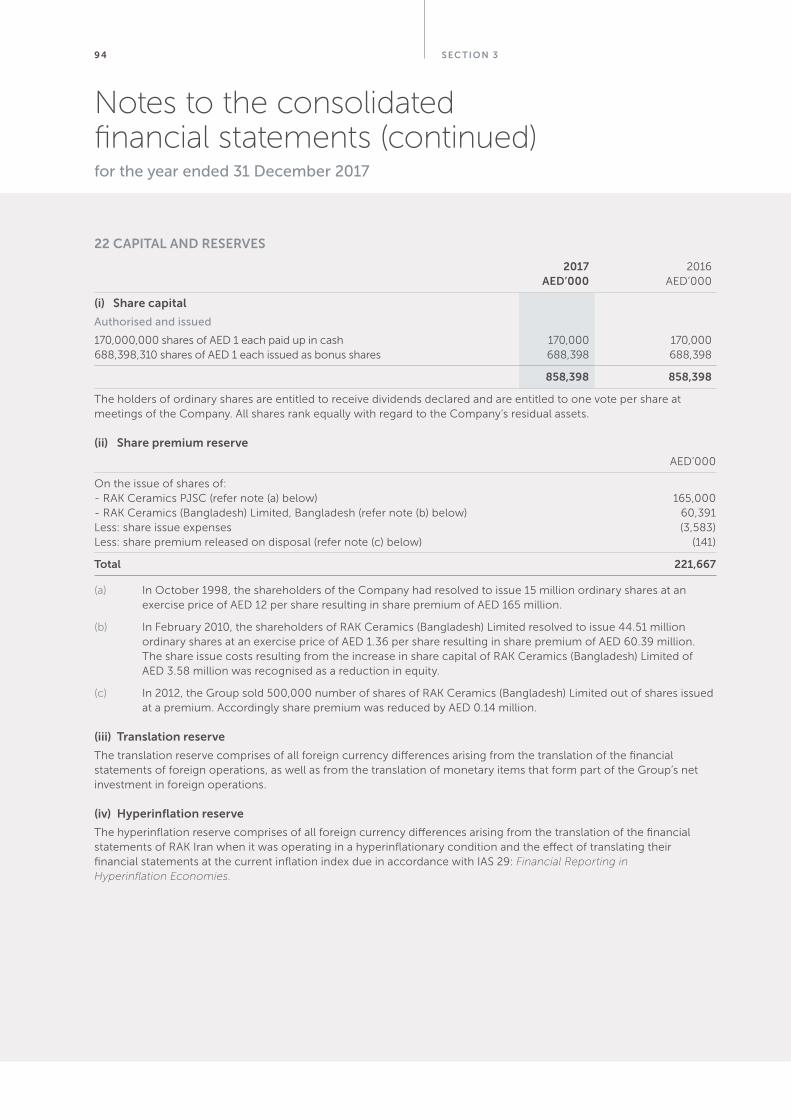
Sec tion 394
22 caPital anD ReSeRveS
2017 2016 aeD’000 AED’000
(i) Share capital
Authorised and issued
170,000,000 shares of AED 1 each paid up in cash 170,000 170,000688,398,310 shares of AED 1 each issued as bonus shares 688,398 688,398
858,398 858,398
The holders of ordinary shares are entitled to receive dividends declared and are entitled to one vote per share at meetings of the Company. All shares rank equally with regard to the Company’s residual assets.
(ii) Share premium reserve
AED’000
On the issue of shares of: - RAK Ceramics PJSC (refer note (a) below) 165,000- RAK Ceramics (Bangladesh) Limited, Bangladesh (refer note (b) below) 60,391Less: share issue expenses (3,583) Less: share premium released on disposal (refer note (c) below) (141)
total 221,667
(a) In October 1998, the shareholders of the Company had resolved to issue 15 million ordinary shares at an exercise price of AED 12 per share resulting in share premium of AED 165 million.
(b) In February 2010, the shareholders of RAK Ceramics (Bangladesh) Limited resolved to issue 44.51 million ordinary shares at an exercise price of AED 1.36 per share resulting in share premium of AED 60.39 million. The share issue costs resulting from the increase in share capital of RAK Ceramics (Bangladesh) Limited of AED 3.58 million was recognised as a reduction in equity.
(c) In 2012, the Group sold 500,000 number of shares of RAK Ceramics (Bangladesh) Limited out of shares issued at a premium. Accordingly share premium was reduced by AED 0.14 million.
(iii) translation reserve
The translation reserve comprises of all foreign currency differences arising from the translation of the financial statements of foreign operations, as well as from the translation of monetary items that form part of the Group’s net investment in foreign operations.
(iv) Hyperinflation reserve
The hyperinflation reserve comprises of all foreign currency differences arising from the translation of the financial statements of RAK Iran when it was operating in a hyperinflationary condition and the effect of translating their financial statements at the current inflation index due in accordance with IAS 29: Financial Reporting in Hyperinflation Economies.
notes to the consolidated financial statements (continued)for the year ended 31 December 2017
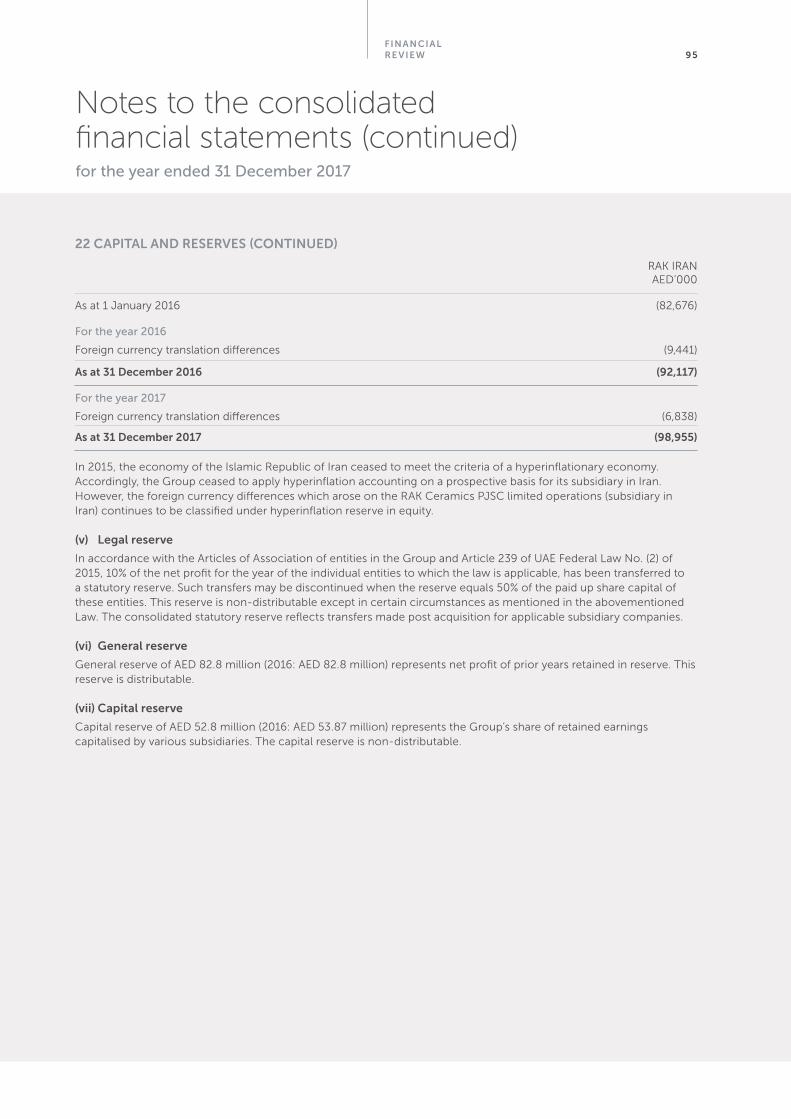
Financial re view 95
22 caPital anD ReSeRveS (continUeD)
In 2015, the economy of the Islamic Republic of Iran ceased to meet the criteria of a hyperinflationary economy. Accordingly, the Group ceased to apply hyperinflation accounting on a prospective basis for its subsidiary in Iran. However, the foreign currency differences which arose on the RAK Ceramics PJSC limited operations (subsidiary in Iran) continues to be classified under hyperinflation reserve in equity.
(v) legal reserve
In accordance with the Articles of Association of entities in the Group and Article 239 of UAE Federal Law No. (2) of 2015, 10% of the net profit for the year of the individual entities to which the law is applicable, has been transferred to a statutory reserve. Such transfers may be discontinued when the reserve equals 50% of the paid up share capital of these entities. This reserve is non-distributable except in certain circumstances as mentioned in the abovementioned Law. The consolidated statutory reserve reflects transfers made post acquisition for applicable subsidiary companies.
(vi) General reserve
General reserve of AED 82.8 million (2016: AED 82.8 million) represents net profit of prior years retained in reserve. This reserve is distributable.
(vii) capital reserve
Capital reserve of AED 52.8 million (2016: AED 53.87 million) represents the Group’s share of retained earnings capitalised by various subsidiaries. The capital reserve is non-distributable.
RAK IRAN AED’000
As at 1 January 2016 (82,676)
For the year 2016
Foreign currency translation differences (9,441)
as at 31 December 2016 (92,117)
For the year 2017
Foreign currency translation differences (6,838)
as at 31 December 2017 (98,955)
notes to the consolidated financial statements (continued)for the year ended 31 December 2017
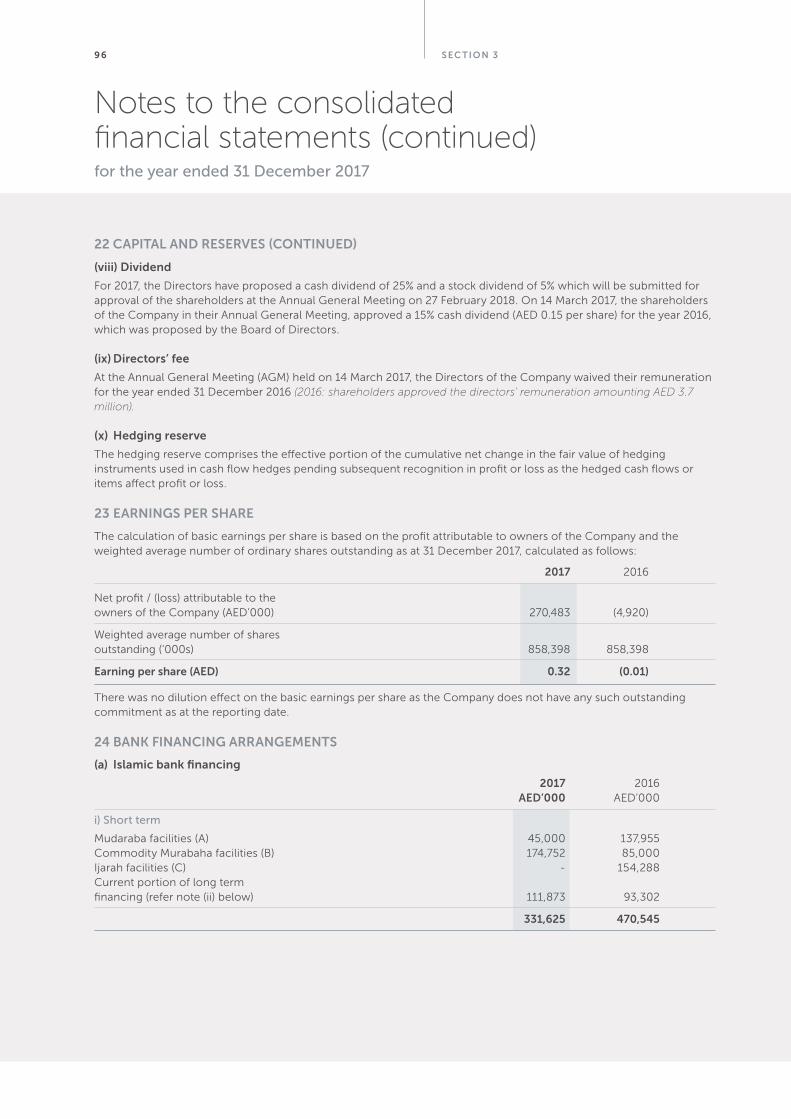
Sec tion 396
22 caPital anD ReSeRveS (continUeD)
(viii) Dividend
For 2017, the Directors have proposed a cash dividend of 25% and a stock dividend of 5% which will be submitted for approval of the shareholders at the Annual General Meeting on 27 February 2018. On 14 March 2017, the shareholders of the Company in their Annual General Meeting, approved a 15% cash dividend (AED 0.15 per share) for the year 2016, which was proposed by the Board of Directors.
(ix) Directors’ fee
At the Annual General Meeting (AGM) held on 14 March 2017, the Directors of the Company waived their remuneration for the year ended 31 December 2016 (2016: shareholders approved the directors’ remuneration amounting AED 3.7 million).
(x) Hedging reserve
The hedging reserve comprises the effective portion of the cumulative net change in the fair value of hedging instruments used in cash flow hedges pending subsequent recognition in profit or loss as the hedged cash flows or items affect profit or loss.
23 eaRninGS PeR SHaRe
The calculation of basic earnings per share is based on the profit attributable to owners of the Company and the weighted average number of ordinary shares outstanding as at 31 December 2017, calculated as follows:
2017 2016
Net profit / (loss) attributable to the owners of the Company (AED’000) 270,483 (4,920)
Weighted average number of shares outstanding (‘000s) 858,398 858,398
earning per share (aeD) 0.32 (0.01)
There was no dilution effect on the basic earnings per share as the Company does not have any such outstanding commitment as at the reporting date.
24 BanK FinancinG aRRanGeMentS
(a) islamic bank financing
2017 2016 aeD’000 AED’000
i) Short term
Mudaraba facilities (A) 45,000 137,955Commodity Murabaha facilities (B) 174,752 85,000Ijarah facilities (C) - 154,288Current portion of long term financing (refer note (ii) below) 111,873 93,302
331,625 470,545
notes to the consolidated financial statements (continued)for the year ended 31 December 2017
Financial re view 97
24 BanK FinancinG aRRanGeMentS (continUeD)
ii) Long term - Commodity Murabaha facilities
2017 2016 aeD’000 AED’000
Commodity Murabaha facilities 486,896 508,932Less: current portion (111,873) (93,302)
375,023 415,630
The terms and conditions of outstanding long-term Commodity Murabaha facilities are as follows:
2017 2016Currency Profit range aeD’000 AED’000
AED 2.5% - 2.6% 64,352 75,000USD 2.4% - 3.7% 422,544 433,932
486,896 508,932
Islamic financings represent facilities such as Mudaraba, Murabaha and Ijarah facilities obtained from Banks. These financings are denominated either in the functional currency of the Company or in USD, a currency against which the functional currency of the Company is currently pegged. The long term Commodity Murabaha facilities mature up to 2022.
These financings are secured by:
- negative pledge over certain assets of the Group;
- pari-passu rights with other unsecured and unsubordinated creditors; and
- promissory note for AED 646 million.
(A) Mudaraba is a mode of Islamic financing where a contract is entered into - between two parties whereby one party (Bank) provides funds to another party (the Group) who then invest in an activity deploying its experience and expertise for a specific pre-agreed share in the resultant profit.
(B) In Murabaha Islamic financing, a contract is entered into between two parties whereby one party (Bank) purchases an asset and sells it to another party (the Group), on a deferred payment basis at a pre-agreed profit.
(C) Ijarah is another mode of Islamic financing where a contract is entered into between two parties whereby one party (Bank) purchases/acquires an asset, either from a third party or from the Group, and leases it to the Group against certain rental payments and for a specific lease period.
(b) interest bearing bank financings
i) Short term
2017 2016 aeD’000 AED’000
Bank overdrafts 3,973 8,734Short-term loans 119,559 99,253Current portion of long-term loans (refer note (ii) below) 225,076 197,708
348,608 305,695
ii) Long term bank loans
Bank loans 1,094,192 1,090,007Less: current portion of long-term loans (225,076) (197,708)
long term portion 869,116 892,299
The terms and conditions of outstanding long-term loans are as follows:
2017 2016Currency Interest range aeD’000 AED’000
AUD 5.0% - 6.0% 10,255 12,780EUR 2.4% - 2.5% 82 125GBP 3.2% - 4.9% 123 385INR 8.8% - 9.2% 7,496 4,509USD 2.4% - 3.7% 1,075,920 1,072,208 SAR 9.4% - 9.6% 316 -
1,094,192 1,090,007
The Group has also obtained long term and short term interest bearing bank facilities from various banks for financing the acquisition of assets, project financing or to meet its working capital requirements. The majority of these bank borrowings are denominated either in the functional currencies of the respective borrowing entities or in USD, a currency against which the functional currency of the Company is currently pegged. Rates of interest on the above bank loans are based on normal commercial rates. The long term bank loans mature up to 2024.
notes to the consolidated financial statements (continued)for the year ended 31 December 2017
Sec tion 398
24 BanK FinancinG aRRanGeMentS (continUeD)
These bank borrowings are secured by:
• negative pledge over certain assets of the Group;• pari passu rights with other unsecured and unsubordinated creditors;• promissory note for AED 887 million;• assignment of insurance over furniture, fixtures and equipment’s of certain Group entities in favour of the bank;• corporate guarantee given by the Company;• hypothecation of inventories and receivables of certain Group entities (refer notes 18 and 19); and • fixed deposits held under lien (refer note 21).
25 tRaDe anD otHeR PaYaBleS
2017 2016 aeD’000 AED’000
Trade payables 354,282 342,954Accrued and other expenses 224,192 241,192Advances from customers 67,671 38,395Commissions and rebates payables 58,505 64,960Other payables 27,569 27,540
732,219 715,041
26 PRoviSion FoR eMPloYeeS’ enD oF SeRvice BeneFitS
2017 2016 aeD’000 AED’000
At 1 January 83,780 78,285On acquisition of subsidiaries 2,853 1,372Charge for the year 17,369 21,116Payments made during the year (13,900) (17,095) On disposal of subsidiaries (4,160) -Effect of movements in exchange rate (199) 102
at 31 December 85,743 83,780
27 DeRivative Financial inStRUMentS
The Group uses derivative financial instruments for risk management purposes. During the previous year, the Group classified interest rate swaps derivatives as cash flow hedges in accordance with the recognition criteria of IAS 39, “Financial instruments: Recognition and measurement”, as it is mitigating the risk of cash flow variations due to movements in interest rates.
Hedging instruments are measured at their fair value at the reporting date and the effective portion of the changes in their fair value is recognised in the consolidated statement of profit or loss and other comprehensive income, as part of the cash flow hedge reserve. Any ineffective portion of changes in the fair value of the derivative is recognised immediately in the consolidated income statement.
The table overleaf shows the positive fair values of derivative financial instruments, which are equivalent to the market values, together with the notional amounts analysed by term to maturity. The notional amount is the amount of a derivative’s underlying asset, reference rate or index and is the basis upon which changes in the value of derivatives are measured. The notional amounts indicate the volume of transactions outstanding at the reporting date and are neither indicative of the market risk nor credit risk.
notes to the consolidated financial statements (continued)for the year ended 31 December 2017
Financial re view 99
27 DeRivative Financial inStRUMentS (continUeD)
Positive/ Maturity Maturity Maturity (negative) notional within within more than fair value amount 1 year 2-5 years 5 years aeD’000 aeD’000 aeD’000 aeD’000 aeD’00031 December 2017
Interest rate swaps used for hedging 7,452 356,080 74,134 265,542 16,404 Forward Exchange Contracts (127) 8,686 8,686 - - Other currency and interest rate swaps (3,691) 221,266 14,694 206,572 -
3,634 586,032 97,514 472,114 16,404
31 December 2016
Interest rate swaps used for hedging 5,944 411,681 55,601 339,676 16,404
5,944 411,681 55,601 339,676 16,404
Fair value hierarchy
All financial instruments for which fair value is recognised or disclosed are categorised within the fair value hierarchy, described as follows, based on the lowest level input that is significant to the fair value measurement as a whole:
Level 1: quoted prices (unadjusted) in active markets for identical assets or liabilities
Level 2: inputs other than quoted prices included within Level 1 that are observable for the asset or liability, either directly (i.e., as prices) or indirectly (i.e. derived from prices).
Level 3: inputs for the asset or liability that are not based on observable market data (unobservable inputs).
For financial instruments which are recognised at fair value on a recurring basis, the Group determines whether transfers have occurred between levels in the hierarchy by re-assessing categorisation (based on the lowest level input that is significant to the fair value measurement as a whole) at the end of each reporting period.
Information about the Group’s exposure to credit and market risks, and the fair value measurement is included in note 33.
During the current and previous year, there were no transfers between level 1 and level 2 fair value measurements, and no transfers into or out of level 3 fair value measurements.
Valuation techniques
Derivative financial assets
Fair value is calculated based on quoted prices or rates available in an active market for the instrument, where there is no active market available to draw quoted prices, a valuation technique is used which includes: • recent market prices or rates, where available, adjusted for relevant subsequent events; • reference to the current fair value of another instrument that is substantially the same; • discounted cash flow analysis; • option pricing models; and • a standard industry valuation technique which provides a reliable estimate of prices obtained in actual market
transactions.
The fair value estimate is subject to a credit risk adjustment that reflects the credit risk of the Group and of the counterparty; this is calculated based on credit spreads derived from current credit default swap or bond prices.
notes to the consolidated financial statements (continued)for the year ended 31 December 2017
Sec tion 310 0
28 RelateD PaRtieS
The Group, in the ordinary course of business, enters into transactions with other business enterprises which fall within the definition of related parties as contained in International Accounting Standard 24 “Related Party Disclosures”. Management approves prices and terms of payment for these transactions and these are carried out at mutually agreed rates. The significant transactions entered into by the Group with related parties during the year, other than those disclosed elsewhere in these consolidated financial statements (in particular notes 5 and 17), are as follows:
transactions with related parties
2017 2016 aeD’000 AED’000
A) Equity accounted investees
Sale of goods and services and construction contracts 48,266 175,049Purchase of goods and services 1,149 1,564Rental income 2,278 4,708 Interest expense (refer note 12) 29 -
B) Other related parties
Sales of goods and services and construction contracts 110,371 131,376Purchase of goods and services 253,239 237,244Interest income (refer note 12) - 90Rental income 4,497 8,632
C) Investments and divestments with related parties
(i) Consideration on sale of subsidiaries / equity accounted investees
2017 2016 aeD’000 AED’000
RAK Warehouse Leasing LLC (refer note 17(ii) and below (a)) 125,000 -
(ii) Consideration on purchase of subsidiaries / equity accounted investees
2017 2016 aeD’000 AED’000
ARK International Trading Company Limited (refer note 5(a)(iii)) 21,569 -GRIS Ceramic Limited Liability Partnership (refer note 5(a)(ii)) 4,907 -Gryphon Ceramics Private Limited (refer note 5(a)(ii)) 1,772 -RAK Ceramics UK Limited (refer note 5(a)(iv)) - 7,390RAK Ceramics GmbH (refer note 5(a)(iv)) - 101
Key management personnel compensation
The remuneration of Directors and other members of key management of the Company during the year were as follows:
2017 2016 aeD’000 AED’000
Short-term benefits 9,689 15,893Staff terminal benefits 252 246Board of Directors’ remuneration - 3,700
Due from related parties
Due from related parties includes receivables from certain entities which are related parties of the Group by virtue of common ultimate ownership and directorship of certain individuals in the Company and these entities. The Board of Directors of the Company, based on their review of these outstanding balances, is of the view that the existing provision is sufficient to cover any likely impairment losses. During the current and previous year, the Group has recognised impairment losses on amount due from related parties primarily domiciled in the UAE and other gulf countries. Also refer note 33.
notes to the consolidated financial statements (continued)for the year ended 31 December 2017
Financial re view 101
28 RelateD PaRtieS (continUeD)
2017 2016 aeD’000 AED’000
Equity accounted investees (refer note 5(a)(i) and (iii)) 179,760 311,636Other related parties 124,552 67,743
304,312 379,379
Less: allowance for impairment losses (refer notes 13 and 33) (97,078) (74,659)Less: long term receivables (refer note (a) below) (38,361) (3,446)
168,873 301,274
Due to related parties Equity accounted investees 3,875 -
Others related parties 40,400 49,451
44,275 49,451
(a) long term receivables
Long term amount receivable 80,361 6,892Less: current portion (42,000) (3,446)
long term portion 38,361 3,446
Also refer note 17(ii).
29 tax exPenSeTax expense relates to corporation tax payable on the profits earned by certain Group entities which operate in taxable jurisdictions, as follows:
2017 2016 aeD’000 AED’000
Current tax
Current year 19,568 19,462
Deferred tax
Originating and reversal of temporary tax differences 2,590 (3,641)
total deferred tax 2,590 (3,641)
tax expense for the year 22,158 15,821
Provision for tax 151,439 136,739
Deferred tax liability 8,187 6,128
Deferred tax asset 1,007 2,753
The Company operates in a tax free jurisdiction. The Group’s consolidated effective tax rate is 6.56% for 2017 (2016: 33.9%) which is primarily due to the effect of tax rates in foreign jurisdictions.
30 continGent liaBilitieS anD coMMitMentS
2017 2016 aeD’000 AED’000
Letters of guarantee 17,479 28,560Letters of credit 44,727 47,037Capital commitments 44,861 3,078VAT and other tax contingencies 51,429 45,279
In some jurisdictions, the tax returns for certain years have not been reviewed by the tax authorities and there are unresolved disputed corporate tax assessments and VAT claims by the authorities. However, the Group’s management is satisfied that adequate provisions have been recognised for potential tax contingencies.
Certain other contingent liabilities may arise during normal course of the Group’s contracting business, which based on the information presently available, cannot be quantified at this stage. However, in the opinion of the management these contingent liabilities are not likely to be material.
The Company has issued corporate guarantees for advances obtained by related parties from commercial banks. Guarantees outstanding as at 31 December 2017 amounts to AED 363.9 million (2016: AED 343.8 million).
notes to the consolidated financial statements (continued)for the year ended 31 December 2017
Sec tion 3102
31 non-contRollinG inteReStS
the following summarises the information relating to the Group’s non-controlling interests.
SUBSiDiaRieS SUBSiDiaRieS intRa GRoUP witHin Uae oUtSiDe Uae eliMinationS total
DeceMBeR 2017 2016 2017 2016 2017 2016 2017 2016 aeD’000 AED’000 aeD’000 AED’000 aeD’000 AED’000 aeD’000 AED’000
Non-current assets 52,714 61,223 212,517 244,281 (14,634) (25,904) 250,597 279,600Current assets 211,500 312,001 352,010 360,380 - - 563,510 672,381Non-current liabilities 12,656 15,006 26,915 34,829 - - 39,571 49,835Current liabilities 51,822 123,188 242,730 246,860 - - 294,552 370,048net assets 199,736 235,030 294,882 322,972 (14,634) (25,904) 479,984 532,098
carrying amount of nci 104,722 121,725 96,550 79,956 (14,634) (25,904) 186,638 175,777
Revenue 246,048 277,724 328,472 265,047 - - 574,520 542,771Profit 54,762 49,008 44,965 42,001 - - 99,727 91,009Other comprehensive income 1,432 (210) (12,809) (2,250) - - (11,377) (2,460)
total comprehensive income 56,194 48,798 32,156 39,751 - - 88,350 88,549
Profit allocated to NCI 30,669 24,087 14,276 11,900 90 (225) 45,035 35,762Other comprehensive income allocated to NCI 784 (441) (4,015) (638) - - (3,231) (1,079)
total 31,453 23,646 10,261 11,262 90 (225) 41,804 34,683
notes to the consolidated financial statements (continued)for the year ended 31 December 2017
Financial re view 103
SUBSiDiaRieS SUBSiDiaRieS intRa GRoUP witHin Uae oUtSiDe Uae eliMinationS total
DeceMBeR 2017 2016 2017 2016 2017 2016 2017 2016 aeD’000 AED’000 aeD’000 AED’000 aeD’000 AED’000 aeD’000 AED’000
Non-current assets 52,714 61,223 212,517 244,281 (14,634) (25,904) 250,597 279,600Current assets 211,500 312,001 352,010 360,380 - - 563,510 672,381Non-current liabilities 12,656 15,006 26,915 34,829 - - 39,571 49,835Current liabilities 51,822 123,188 242,730 246,860 - - 294,552 370,048net assets 199,736 235,030 294,882 322,972 (14,634) (25,904) 479,984 532,098
carrying amount of nci 104,722 121,725 96,550 79,956 (14,634) (25,904) 186,638 175,777
Revenue 246,048 277,724 328,472 265,047 - - 574,520 542,771Profit 54,762 49,008 44,965 42,001 - - 99,727 91,009Other comprehensive income 1,432 (210) (12,809) (2,250) - - (11,377) (2,460)
total comprehensive income 56,194 48,798 32,156 39,751 - - 88,350 88,549
Profit allocated to NCI 30,669 24,087 14,276 11,900 90 (225) 45,035 35,762Other comprehensive income allocated to NCI 784 (441) (4,015) (638) - - (3,231) (1,079)
total 31,453 23,646 10,261 11,262 90 (225) 41,804 34,683
Sec tion 3104
32 oPeRatinG leaSeS
As lessor
Certain Group entities lease out their investment property under operating leases. The leases typically run for a period of more than five years, with an option to renew the lease after that date. Lease rentals are usually reviewed periodically to reflect market rentals.
2017 2016 aeD’000 AED’000
Less than one year 25,789 30,884Between two and five years 36,372 67,226More than five years 81,335 95,000
143,496 193,110
33 Financial inStRUMentS
Risk management framework
The Group has exposure to the following risks from its use of financial instruments:
• Credit risk
• Liquidity risk
• Market risk
This note presents information about the Group’s exposure to each of the above risks, the Group’s objectives, policies and processes for measuring and managing risk, and the Group’s management of capital.
The Board of Directors has overall responsibility for the establishment and oversight of the Group’s risk management framework. The Group’s senior management are responsible for developing and monitoring the Group’s risk management policies and report regularly to the Board of Directors on their activities. The Group’s current financial risk management framework is a combination of formally documented risk management policies in certain areas and informal risk management practices in others.
The Group’s risk management policies (both formal and informal) are established to identify and analyse the risks faced by the Group, to set appropriate risk limits and controls, and to monitor risks and adherence to limits. Risk management policies and systems are reviewed regularly to reflect changes in market conditions and the Group’s activities. The Group, through its training and management
standards and procedures, aims to develop a disciplined and constructive control environment in which all employees understand their roles and obligations.
The Group Audit Committee oversees how management monitors compliance with the Group’s risk management policies and procedures, and reviews the adequacy of the risk management framework in relation to the risks faced by the Group. The Group Audit Committee is assisted in its oversight role by the internal audit department. Internal audit undertakes both regular and adhoc reviews of risk management controls and procedures, the results of which are reported to the Audit Committee.
As part of the application of the risk management policies, senior management is also responsible for development and implementation of controls to address operational risks arising from a wide variety of causes associated with the Group’s processes, personnel, technology and infrastructure, and from external factors arising from legal and regulatory requirements, political and economic stability in the jurisdictions that the Group operates and generally accepted standards of corporate behavior.
The Group’s non-derivative financial liabilities comprise bank borrowings, trade and other payables (excluding advances to suppliers) and amount due to related parties. The Group has various financial assets such as trade and other receivables, cash and cash equivalents and amount due from related parties.
At 31 December 2017, the Group has a subsidiary in Iran, RAK Ceramics PJSC Limited (“RAK Iran”) which is engaged in the manufacturing and sale of ceramic tiles and has net assets amounting to AED 18.91 million (2016: AED 64.54 million) as at that date.
Previously, due to the political situation in Iran and the imposition of stricter financial and trade sanctions and oil embargo, the movement of funds through banking channels from Iran had been exceedingly difficult. Discussions were undertaken for easing of sanctions and releasing the imposition of stricter financial and trade sanctions. The stricter financial and trade sanctions were released and relaxed to an extent. Management continues to assess and monitor the implications of such changes on the business.
notes to the consolidated financial statements (continued)for the year ended 31 December 2017
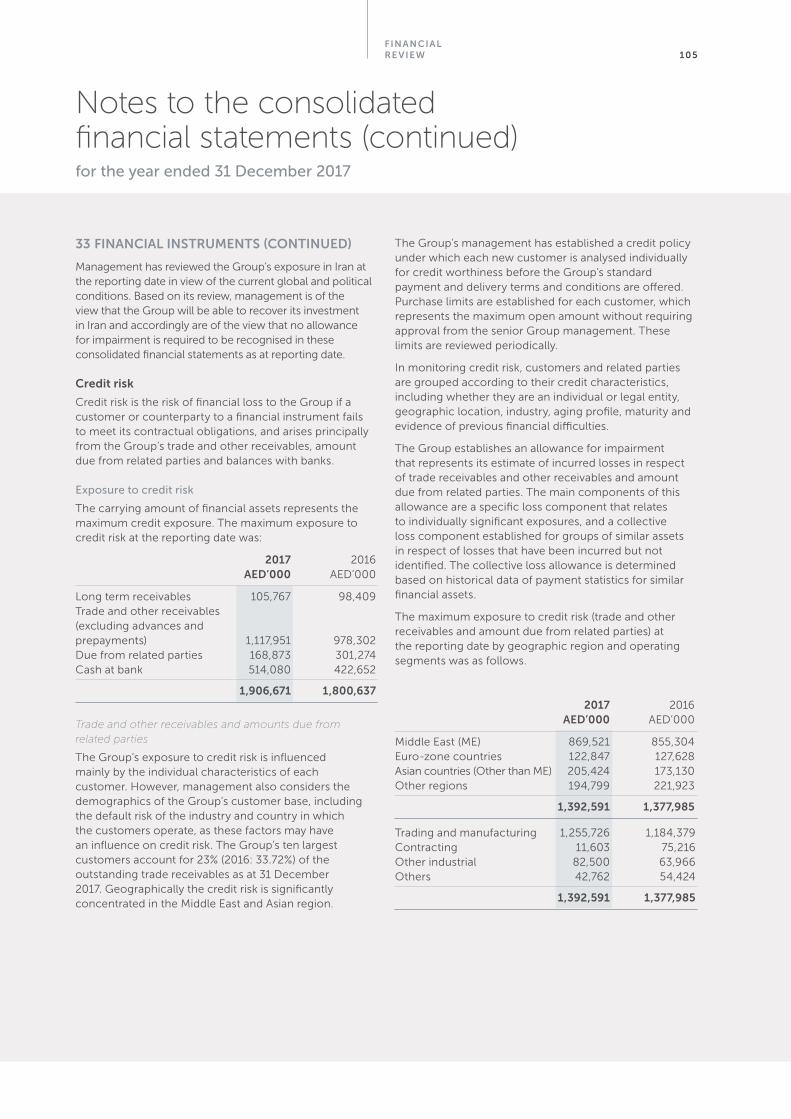
Financial re view 105
33 Financial inStRUMentS (continUeD)
Management has reviewed the Group’s exposure in Iran at the reporting date in view of the current global and political conditions. Based on its review, management is of the view that the Group will be able to recover its investment in Iran and accordingly are of the view that no allowance for impairment is required to be recognised in these consolidated financial statements as at reporting date.
credit risk
Credit risk is the risk of financial loss to the Group if a customer or counterparty to a financial instrument fails to meet its contractual obligations, and arises principally from the Group’s trade and other receivables, amount due from related parties and balances with banks.
Exposure to credit risk
The carrying amount of financial assets represents the maximum credit exposure. The maximum exposure to credit risk at the reporting date was:
2017 2016 aeD’000 AED’000
Long term receivables 105,767 98,409Trade and other receivables (excluding advances and prepayments) 1,117,951 978,302Due from related parties 168,873 301,274Cash at bank 514,080 422,652
1,906,671 1,800,637
Trade and other receivables and amounts due from related parties
The Group’s exposure to credit risk is influenced mainly by the individual characteristics of each customer. However, management also considers the demographics of the Group’s customer base, including the default risk of the industry and country in which the customers operate, as these factors may have an influence on credit risk. The Group’s ten largest customers account for 23% (2016: 33.72%) of the outstanding trade receivables as at 31 December 2017. Geographically the credit risk is significantly concentrated in the Middle East and Asian region.
The Group’s management has established a credit policy under which each new customer is analysed individually for credit worthiness before the Group’s standard payment and delivery terms and conditions are offered. Purchase limits are established for each customer, which represents the maximum open amount without requiring approval from the senior Group management. These limits are reviewed periodically.
In monitoring credit risk, customers and related parties are grouped according to their credit characteristics, including whether they are an individual or legal entity, geographic location, industry, aging profile, maturity and evidence of previous financial difficulties.
The Group establishes an allowance for impairment that represents its estimate of incurred losses in respect of trade receivables and other receivables and amount due from related parties. The main components of this allowance are a specific loss component that relates to individually significant exposures, and a collective loss component established for groups of similar assets in respect of losses that have been incurred but not identified. The collective loss allowance is determined based on historical data of payment statistics for similar financial assets.
The maximum exposure to credit risk (trade and other receivables and amount due from related parties) at the reporting date by geographic region and operating segments was as follows.
2017 2016 aeD’000 AED’000
Middle East (ME) 869,521 855,304 Euro-zone countries 122,847 127,628 Asian countries (Other than ME) 205,424 173,130 Other regions 194,799 221,923
1,392,591 1,377,985
Trading and manufacturing 1,255,726 1,184,379 Contracting 11,603 75,216 Other industrial 82,500 63,966Others 42,762 54,424
1,392,591 1,377,985
notes to the consolidated financial statements (continued)for the year ended 31 December 2017
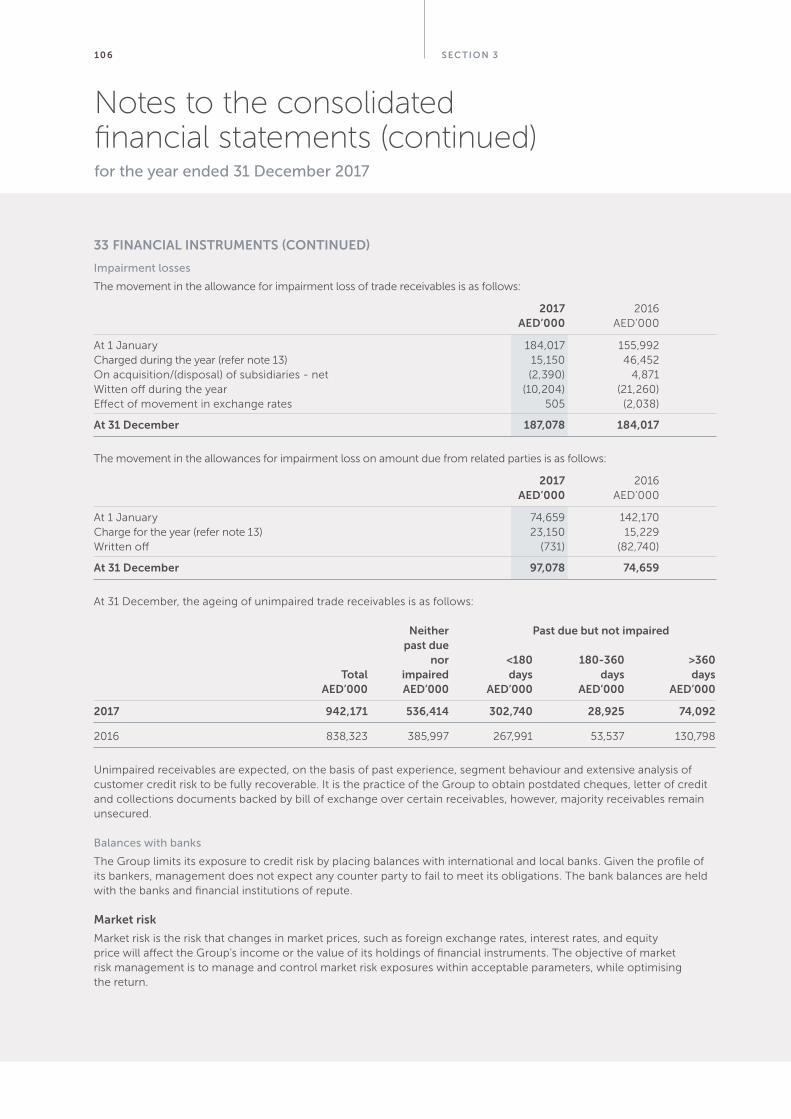
Sec tion 3106
At 31 December, the ageing of unimpaired trade receivables is as follows:
neither Past due but not impaired past due nor <180 180-360 >360 total impaired days days days aeD’000 aeD’000 aeD’000 aeD’000 aeD’000
2017 942,171 536,414 302,740 28,925 74,092
2016 838,323 385,997 267,991 53,537 130,798
Unimpaired receivables are expected, on the basis of past experience, segment behaviour and extensive analysis of customer credit risk to be fully recoverable. It is the practice of the Group to obtain postdated cheques, letter of credit and collections documents backed by bill of exchange over certain receivables, however, majority receivables remain unsecured.
Balances with banks
The Group limits its exposure to credit risk by placing balances with international and local banks. Given the profile of its bankers, management does not expect any counter party to fail to meet its obligations. The bank balances are held with the banks and financial institutions of repute.
Market risk
Market risk is the risk that changes in market prices, such as foreign exchange rates, interest rates, and equity price will affect the Group’s income or the value of its holdings of financial instruments. The objective of market risk management is to manage and control market risk exposures within acceptable parameters, while optimising the return.
33 Financial inStRUMentS (continUeD)
Impairment losses
The movement in the allowance for impairment loss of trade receivables is as follows:
2017 2016 aeD’000 AED’000
At 1 January 184,017 155,992Charged during the year (refer note 13) 15,150 46,452On acquisition/(disposal) of subsidiaries - net (2,390) 4,871 Witten off during the year (10,204) (21,260)Effect of movement in exchange rates 505 (2,038)
at 31 December 187,078 184,017
The movement in the allowances for impairment loss on amount due from related parties is as follows:
2017 2016 aeD’000 AED’000
At 1 January 74,659 142,170Charge for the year (refer note 13) 23,150 15,229Written off (731) (82,740)
at 31 December 97,078 74,659
notes to the consolidated financial statements (continued)for the year ended 31 December 2017
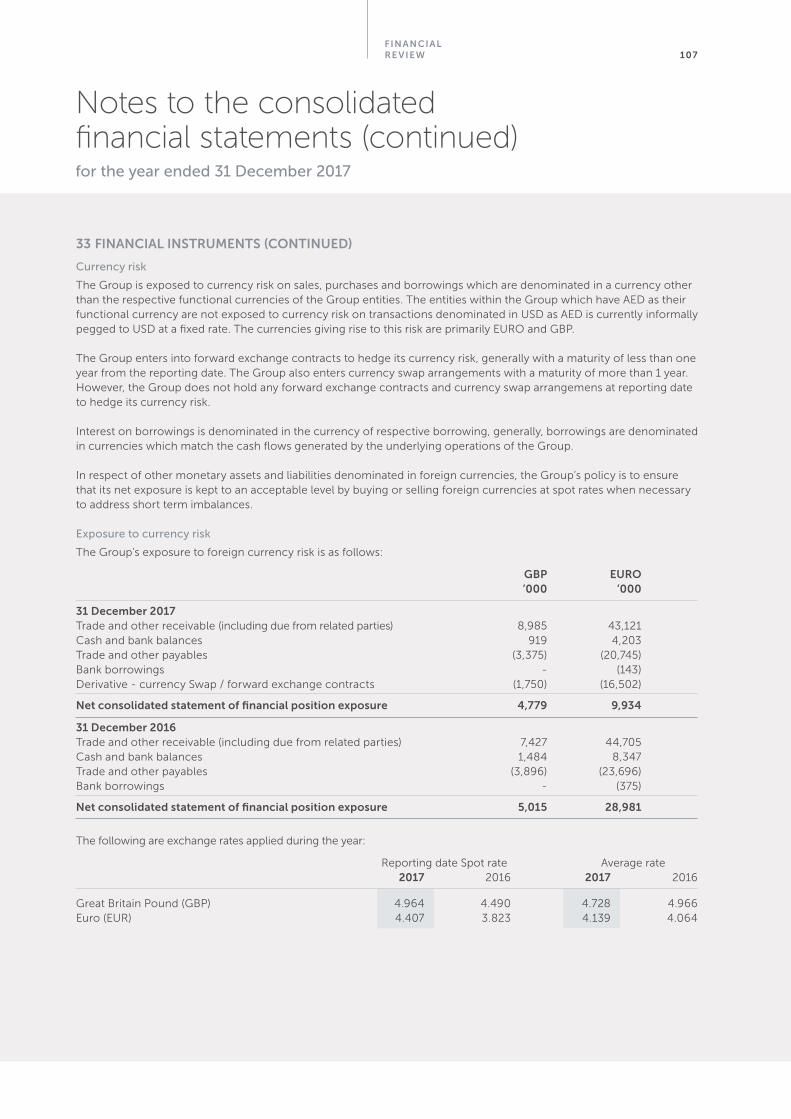
Financial re view 107
33 Financial inStRUMentS (continUeD)
Currency risk
The Group is exposed to currency risk on sales, purchases and borrowings which are denominated in a currency other than the respective functional currencies of the Group entities. The entities within the Group which have AED as their functional currency are not exposed to currency risk on transactions denominated in USD as AED is currently informally pegged to USD at a fixed rate. The currencies giving rise to this risk are primarily EURO and GBP.
The Group enters into forward exchange contracts to hedge its currency risk, generally with a maturity of less than one year from the reporting date. The Group also enters currency swap arrangements with a maturity of more than 1 year. However, the Group does not hold any forward exchange contracts and currency swap arrangemens at reporting date to hedge its currency risk.
Interest on borrowings is denominated in the currency of respective borrowing, generally, borrowings are denominated in currencies which match the cash flows generated by the underlying operations of the Group.
In respect of other monetary assets and liabilities denominated in foreign currencies, the Group’s policy is to ensure that its net exposure is kept to an acceptable level by buying or selling foreign currencies at spot rates when necessary to address short term imbalances.
Exposure to currency risk
The Group’s exposure to foreign currency risk is as follows:
GBP eURo ’000 ’000
31 December 2017Trade and other receivable (including due from related parties) 8,985 43,121 Cash and bank balances 919 4,203 Trade and other payables (3,375) (20,745)Bank borrowings - (143) Derivative - currency Swap / forward exchange contracts (1,750) (16,502)
net consolidated statement of financial position exposure 4,779 9,934
31 December 2016Trade and other receivable (including due from related parties) 7,427 44,705 Cash and bank balances 1,484 8,347 Trade and other payables (3,896) (23,696)Bank borrowings - (375)
net consolidated statement of financial position exposure 5,015 28,981
The following are exchange rates applied during the year:
Reporting date Spot rate Average rate 2017 2016 2017 2016
Great Britain Pound (GBP) 4.964 4.490 4.728 4.966Euro (EUR) 4.407 3.823 4.139 4.064
notes to the consolidated financial statements (continued)for the year ended 31 December 2017
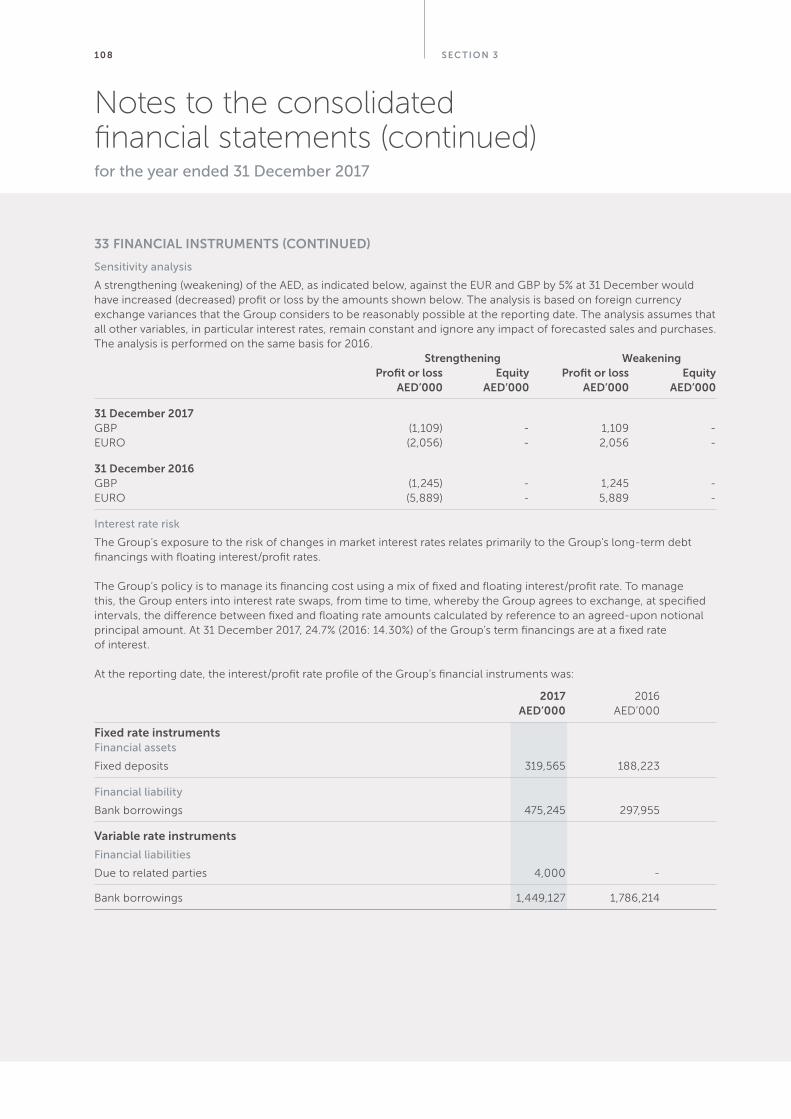
Sec tion 3108
33 Financial inStRUMentS (continUeD)
Sensitivity analysis
A strengthening (weakening) of the AED, as indicated below, against the EUR and GBP by 5% at 31 December would have increased (decreased) profit or loss by the amounts shown below. The analysis is based on foreign currency exchange variances that the Group considers to be reasonably possible at the reporting date. The analysis assumes that all other variables, in particular interest rates, remain constant and ignore any impact of forecasted sales and purchases. The analysis is performed on the same basis for 2016. Strengthening weakening Profit or loss equity Profit or loss equity aeD’000 aeD’000 aeD’000 aeD’000
31 December 2017GBP (1,109) - 1,109 -EURO (2,056) - 2,056 -
31 December 2016 GBP (1,245) - 1,245 -EURO (5,889) - 5,889 -
Interest rate risk
The Group’s exposure to the risk of changes in market interest rates relates primarily to the Group’s long-term debt financings with floating interest/profit rates.
The Group’s policy is to manage its financing cost using a mix of fixed and floating interest/profit rate. To manage this, the Group enters into interest rate swaps, from time to time, whereby the Group agrees to exchange, at specified intervals, the difference between fixed and floating rate amounts calculated by reference to an agreed-upon notional principal amount. At 31 December 2017, 24.7% (2016: 14.30%) of the Group’s term financings are at a fixed rate of interest.
At the reporting date, the interest/profit rate profile of the Group’s financial instruments was:
2017 2016 aeD’000 AED’000
Fixed rate instrumentsFinancial assets
Fixed deposits 319,565 188,223
Financial liability
Bank borrowings 475,245 297,955
variable rate instruments
Financial liabilities
Due to related parties 4,000 -
Bank borrowings 1,449,127 1,786,214
notes to the consolidated financial statements (continued)for the year ended 31 December 2017
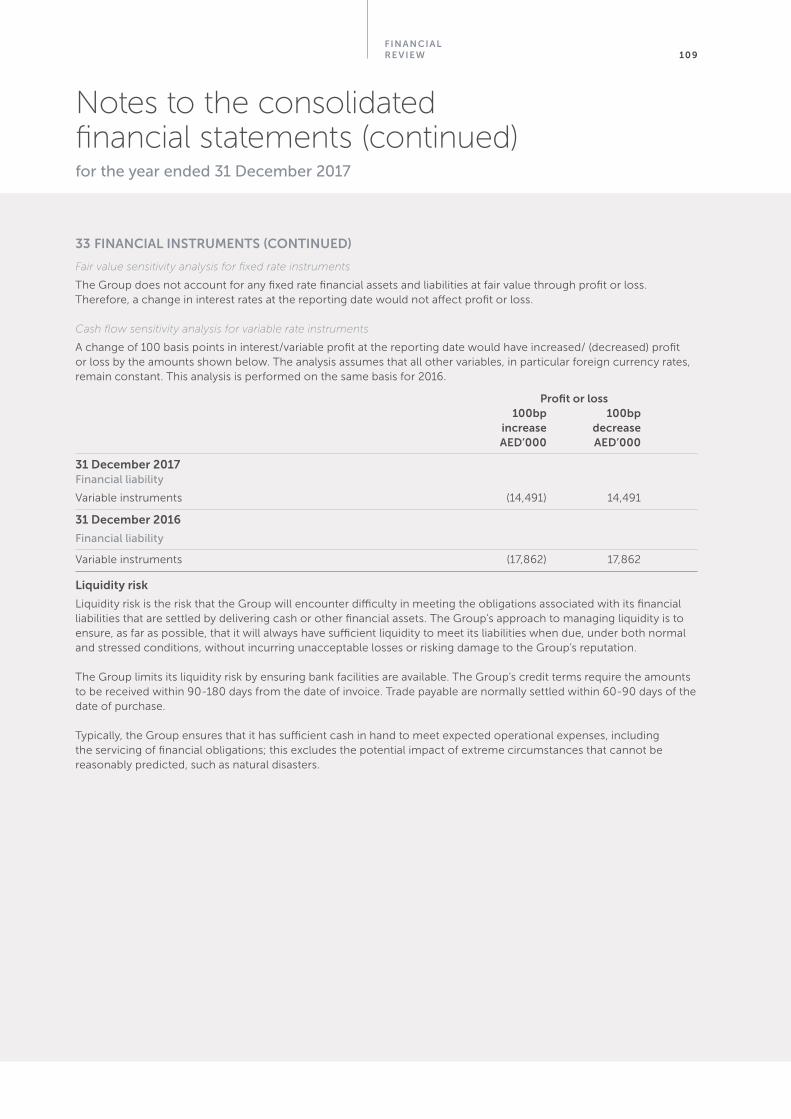
Financial re view 109
33 Financial inStRUMentS (continUeD)
Fair value sensitivity analysis for fixed rate instruments
The Group does not account for any fixed rate financial assets and liabilities at fair value through profit or loss. Therefore, a change in interest rates at the reporting date would not affect profit or loss.
Cash flow sensitivity analysis for variable rate instruments
A change of 100 basis points in interest/variable profit at the reporting date would have increased/ (decreased) profit or loss by the amounts shown below. The analysis assumes that all other variables, in particular foreign currency rates, remain constant. This analysis is performed on the same basis for 2016.
Profit or loss 100bp 100bp increase decrease aeD’000 aeD’000
31 December 2017Financial liability
Variable instruments (14,491) 14,491
31 December 2016
Financial liability
Variable instruments (17,862) 17,862
liquidity risk
Liquidity risk is the risk that the Group will encounter difficulty in meeting the obligations associated with its financial liabilities that are settled by delivering cash or other financial assets. The Group’s approach to managing liquidity is to ensure, as far as possible, that it will always have sufficient liquidity to meet its liabilities when due, under both normal and stressed conditions, without incurring unacceptable losses or risking damage to the Group’s reputation.
The Group limits its liquidity risk by ensuring bank facilities are available. The Group’s credit terms require the amounts to be received within 90-180 days from the date of invoice. Trade payable are normally settled within 60-90 days of the date of purchase.
Typically, the Group ensures that it has sufficient cash in hand to meet expected operational expenses, including the servicing of financial obligations; this excludes the potential impact of extreme circumstances that cannot be reasonably predicted, such as natural disasters.
notes to the consolidated financial statements (continued)for the year ended 31 December 2017
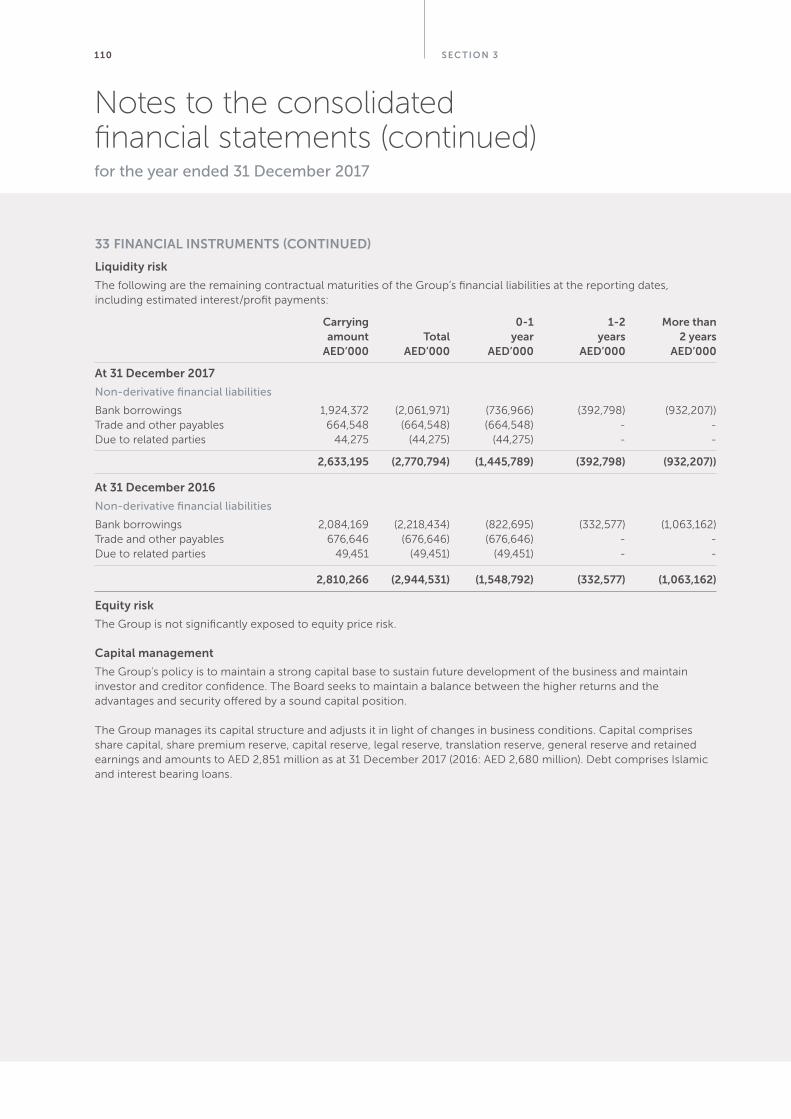
Sec tion 31 10
33 Financial inStRUMentS (continUeD)
liquidity risk
The following are the remaining contractual maturities of the Group’s financial liabilities at the reporting dates, including estimated interest/profit payments:
carrying 0-1 1-2 More than amount total year years 2 years aeD’000 aeD’000 aeD’000 aeD’000 aeD’000
at 31 December 2017
Non-derivative financial liabilities
Bank borrowings 1,924,372 (2,061,971) (736,966) (392,798) (932,207))Trade and other payables 664,548 (664,548) (664,548) - -Due to related parties 44,275 (44,275) (44,275) - -
2,633,195 (2,770,794) (1,445,789) (392,798) (932,207))
at 31 December 2016
Non-derivative financial liabilities
Bank borrowings 2,084,169 (2,218,434) (822,695) (332,577) (1,063,162)Trade and other payables 676,646 (676,646) (676,646) - -Due to related parties 49,451 (49,451) (49,451) - -
2,810,266 (2,944,531) (1,548,792) (332,577) (1,063,162)
equity risk
The Group is not significantly exposed to equity price risk.
capital management
The Group’s policy is to maintain a strong capital base to sustain future development of the business and maintain investor and creditor confidence. The Board seeks to maintain a balance between the higher returns and the advantages and security offered by a sound capital position.
The Group manages its capital structure and adjusts it in light of changes in business conditions. Capital comprises share capital, share premium reserve, capital reserve, legal reserve, translation reserve, general reserve and retained earnings and amounts to AED 2,851 million as at 31 December 2017 (2016: AED 2,680 million). Debt comprises Islamic and interest bearing loans.
notes to the consolidated financial statements (continued)for the year ended 31 December 2017
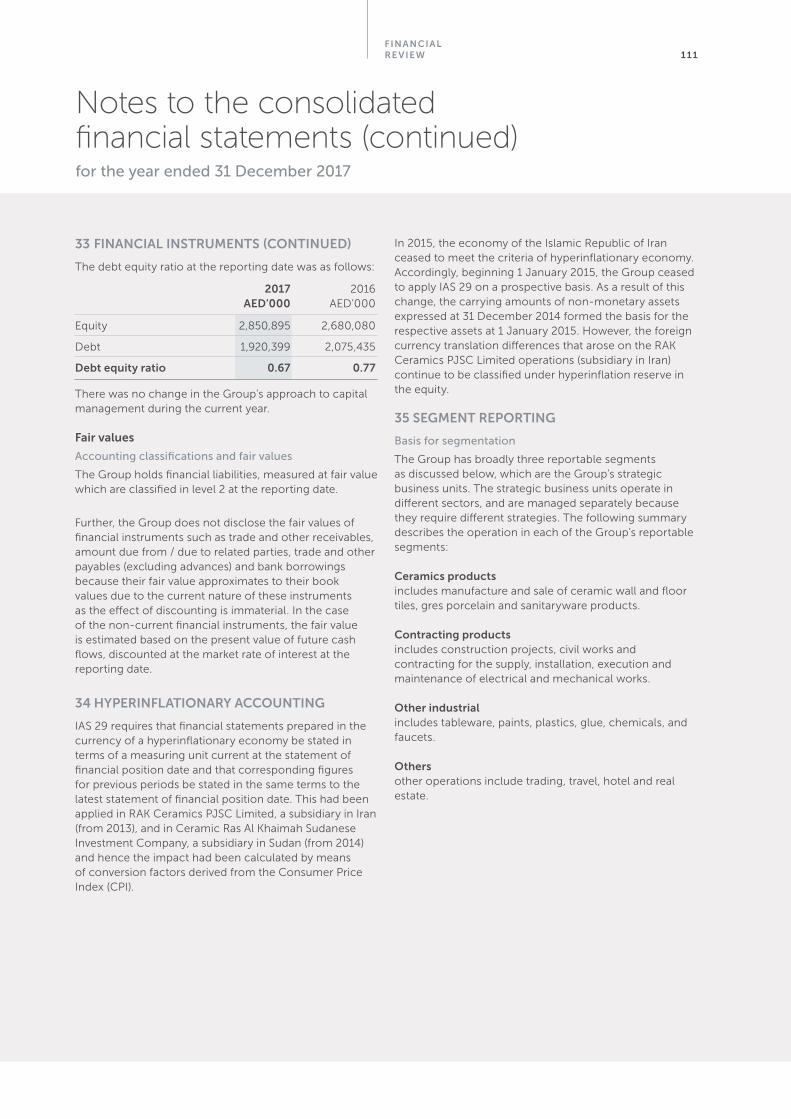
Financial re view 1 1 1
33 Financial inStRUMentS (continUeD)
The debt equity ratio at the reporting date was as follows:
2017 2016 aeD’000 AED’000
Equity 2,850,895 2,680,080
Debt 1,920,399 2,075,435
Debt equity ratio 0.67 0.77
There was no change in the Group’s approach to capital management during the current year.
Fair values
Accounting classifications and fair values
The Group holds financial liabilities, measured at fair value which are classified in level 2 at the reporting date.
Further, the Group does not disclose the fair values of financial instruments such as trade and other receivables, amount due from / due to related parties, trade and other payables (excluding advances) and bank borrowings because their fair value approximates to their book values due to the current nature of these instruments as the effect of discounting is immaterial. In the case of the non-current financial instruments, the fair value is estimated based on the present value of future cash flows, discounted at the market rate of interest at the reporting date.
34 HYPeRinFlationaRY accoUntinG
IAS 29 requires that financial statements prepared in the currency of a hyperinflationary economy be stated in terms of a measuring unit current at the statement of financial position date and that corresponding figures for previous periods be stated in the same terms to the latest statement of financial position date. This had been applied in RAK Ceramics PJSC Limited, a subsidiary in Iran (from 2013), and in Ceramic Ras Al Khaimah Sudanese Investment Company, a subsidiary in Sudan (from 2014) and hence the impact had been calculated by means of conversion factors derived from the Consumer Price Index (CPI).
In 2015, the economy of the Islamic Republic of Iran ceased to meet the criteria of hyperinflationary economy. Accordingly, beginning 1 January 2015, the Group ceased to apply IAS 29 on a prospective basis. As a result of this change, the carrying amounts of non-monetary assets expressed at 31 December 2014 formed the basis for the respective assets at 1 January 2015. However, the foreign currency translation differences that arose on the RAK Ceramics PJSC Limited operations (subsidiary in Iran) continue to be classified under hyperinflation reserve in the equity.
35 SeGMent RePoRtinG
Basis for segmentation
The Group has broadly three reportable segments as discussed below, which are the Group’s strategic business units. The strategic business units operate in different sectors, and are managed separately because they require different strategies. The following summary describes the operation in each of the Group’s reportable segments:
ceramics products includes manufacture and sale of ceramic wall and floor tiles, gres porcelain and sanitaryware products.
contracting products includes construction projects, civil works and contracting for the supply, installation, execution and maintenance of electrical and mechanical works.
other industrial includes tableware, paints, plastics, glue, chemicals, and faucets.
others other operations include trading, travel, hotel and real estate.
notes to the consolidated financial statements (continued)for the year ended 31 December 2017
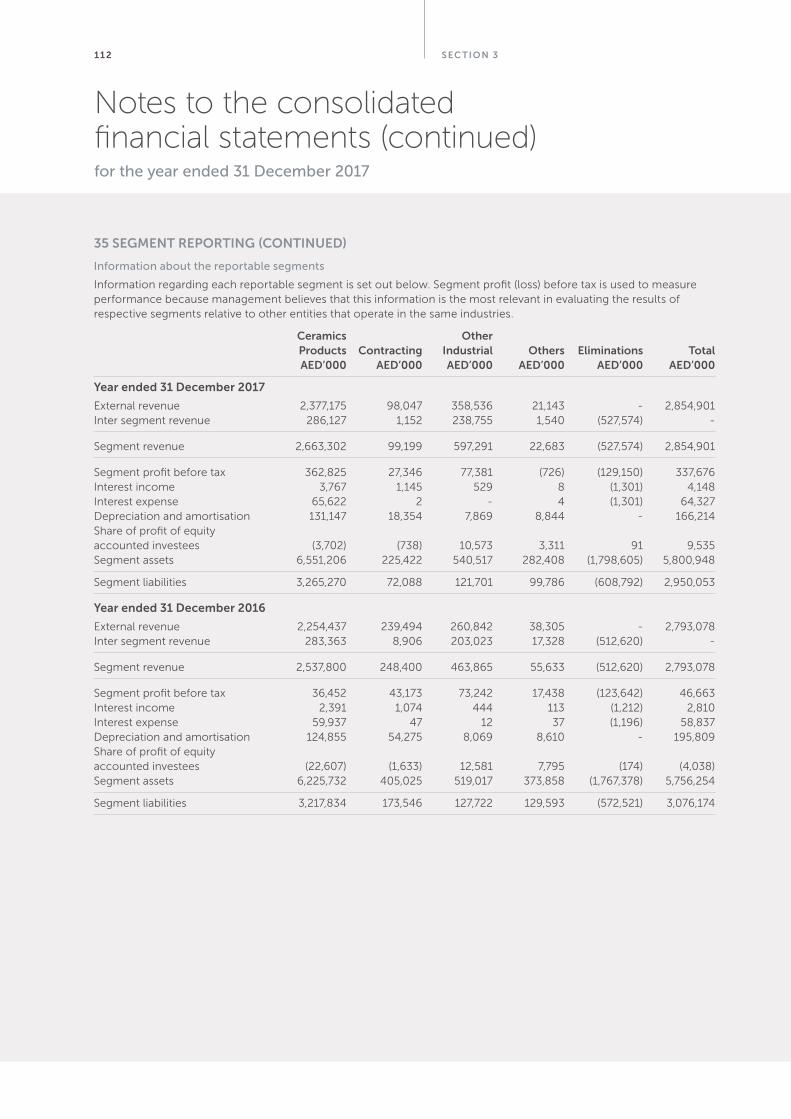
Sec tion 31 1 2
35 SeGMent RePoRtinG (continUeD)
Information about the reportable segments
Information regarding each reportable segment is set out below. Segment profit (loss) before tax is used to measure performance because management believes that this information is the most relevant in evaluating the results of respective segments relative to other entities that operate in the same industries.
ceramics other Products contracting industrial others eliminations total aeD’000 aeD’000 aeD’000 aeD’000 aeD’000 aeD’000
Year ended 31 December 2017
External revenue 2,377,175 98,047 358,536 21,143 - 2,854,901Inter segment revenue 286,127 1,152 238,755 1,540 (527,574) -
Segment revenue 2,663,302 99,199 597,291 22,683 (527,574) 2,854,901
Segment profit before tax 362,825 27,346 77,381 (726) (129,150) 337,676Interest income 3,767 1,145 529 8 (1,301) 4,148Interest expense 65,622 2 - 4 (1,301) 64,327Depreciation and amortisation 131,147 18,354 7,869 8,844 - 166,214Share of profit of equity accounted investees (3,702) (738) 10,573 3,311 91 9,535Segment assets 6,551,206 225,422 540,517 282,408 (1,798,605) 5,800,948
Segment liabilities 3,265,270 72,088 121,701 99,786 (608,792) 2,950,053
Year ended 31 December 2016
External revenue 2,254,437 239,494 260,842 38,305 - 2,793,078Inter segment revenue 283,363 8,906 203,023 17,328 (512,620) -
Segment revenue 2,537,800 248,400 463,865 55,633 (512,620) 2,793,078
Segment profit before tax 36,452 43,173 73,242 17,438 (123,642) 46,663Interest income 2,391 1,074 444 113 (1,212) 2,810Interest expense 59,937 47 12 37 (1,196) 58,837Depreciation and amortisation 124,855 54,275 8,069 8,610 - 195,809Share of profit of equityaccounted investees (22,607) (1,633) 12,581 7,795 (174) (4,038)Segment assets 6,225,732 405,025 519,017 373,858 (1,767,378) 5,756,254
Segment liabilities 3,217,834 173,546 127,722 129,593 (572,521) 3,076,174
notes to the consolidated financial statements (continued)for the year ended 31 December 2017
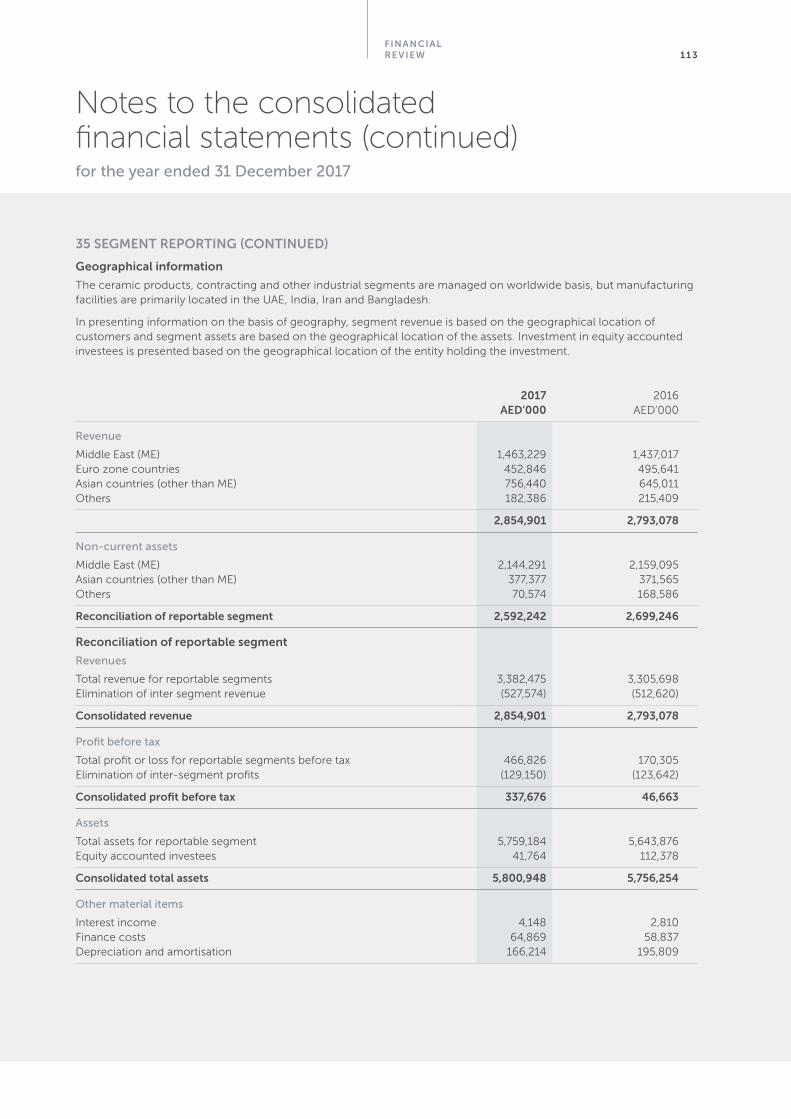
Financial re view 1 1 3
35 SeGMent RePoRtinG (continUeD)
Geographical information
The ceramic products, contracting and other industrial segments are managed on worldwide basis, but manufacturing facilities are primarily located in the UAE, India, Iran and Bangladesh.
In presenting information on the basis of geography, segment revenue is based on the geographical location of customers and segment assets are based on the geographical location of the assets. Investment in equity accounted investees is presented based on the geographical location of the entity holding the investment.
2017 2016 aeD’000 AED’000
Revenue
Middle East (ME) 1,463,229 1,437,017Euro zone countries 452,846 495,641Asian countries (other than ME) 756,440 645,011Others 182,386 215,409
2,854,901 2,793,078
Non-current assets
Middle East (ME) 2,144,291 2,159,095Asian countries (other than ME) 377,377 371,565Others 70,574 168,586
Reconciliation of reportable segment 2,592,242 2,699,246
Reconciliation of reportable segment
Revenues
Total revenue for reportable segments 3,382,475 3,305,698Elimination of inter segment revenue (527,574) (512,620)
consolidated revenue 2,854,901 2,793,078
Profit before tax
Total profit or loss for reportable segments before tax 466,826 170,305Elimination of inter-segment profits (129,150) (123,642)
consolidated profit before tax 337,676 46,663
Assets
Total assets for reportable segment 5,759,184 5,643,876Equity accounted investees 41,764 112,378
consolidated total assets 5,800,948 5,756,254
Other material items
Interest income 4,148 2,810Finance costs 64,869 58,837Depreciation and amortisation 166,214 195,809
notes to the consolidated financial statements (continued)for the year ended 31 December 2017
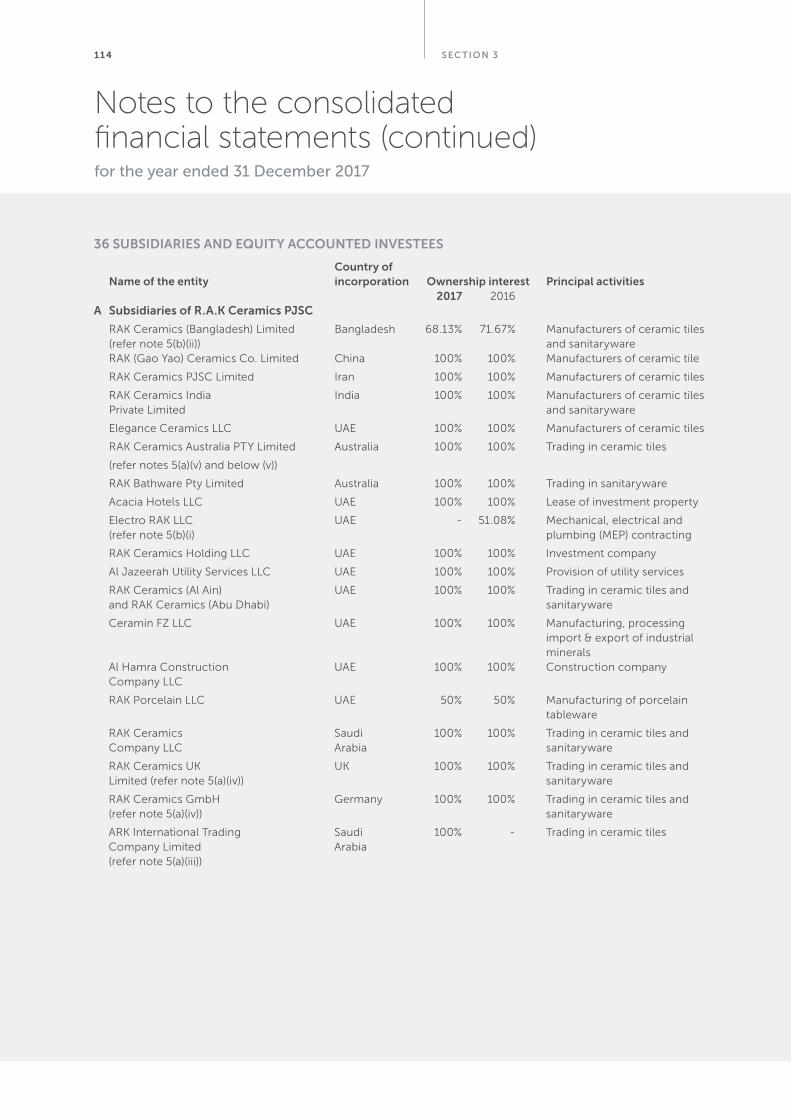
Sec tion 31 14
36 SUBSiDiaRieS anD eqUitY accoUnteD inveSteeS
country of name of the entity incorporation ownership interest Principal activities 2017 2016a Subsidiaries of R.a.K ceramics PJSc
RAK Ceramics (Bangladesh) Limited Bangladesh 68.13% 71.67% Manufacturers of ceramic tiles (refer note 5(b)(ii)) and sanitaryware RAK (Gao Yao) Ceramics Co. Limited China 100% 100% Manufacturers of ceramic tile
RAK Ceramics PJSC Limited Iran 100% 100% Manufacturers of ceramic tiles
RAK Ceramics India India 100% 100% Manufacturers of ceramic tiles Private Limited and sanitaryware
Elegance Ceramics LLC UAE 100% 100% Manufacturers of ceramic tiles
RAK Ceramics Australia PTY Limited Australia 100% 100% Trading in ceramic tiles
(refer notes 5(a)(v) and below (v))
RAK Bathware Pty Limited Australia 100% 100% Trading in sanitaryware
Acacia Hotels LLC UAE 100% 100% Lease of investment property
Electro RAK LLC UAE - 51.08% Mechanical, electrical and (refer note 5(b)(i) plumbing (MEP) contracting
RAK Ceramics Holding LLC UAE 100% 100% Investment company
Al Jazeerah Utility Services LLC UAE 100% 100% Provision of utility services
RAK Ceramics (Al Ain) UAE 100% 100% Trading in ceramic tiles and and RAK Ceramics (Abu Dhabi) sanitaryware
Ceramin FZ LLC UAE 100% 100% Manufacturing, processing import & export of industrial minerals Al Hamra Construction UAE 100% 100% Construction company Company LLC
RAK Porcelain LLC UAE 50% 50% Manufacturing of porcelain tableware
RAK Ceramics Saudi 100% 100% Trading in ceramic tiles and Company LLC Arabia sanitaryware
RAK Ceramics UK UK 100% 100% Trading in ceramic tiles and Limited (refer note 5(a)(iv)) sanitaryware
RAK Ceramics GmbH Germany 100% 100% Trading in ceramic tiles and (refer note 5(a)(iv)) sanitaryware
ARK International Trading Saudi 100% - Trading in ceramic tiles Company Limited Arabia (refer note 5(a)(iii))
notes to the consolidated financial statements (continued)for the year ended 31 December 2017
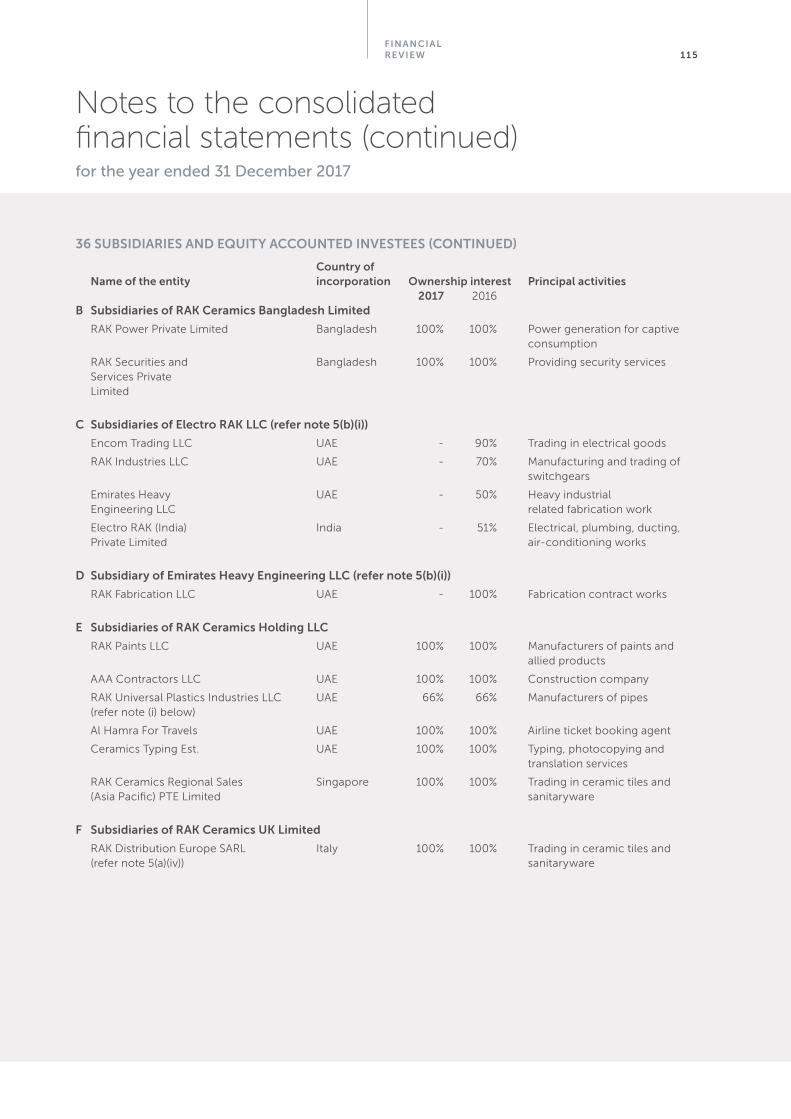
Financial re view 1 1 5
36 SUBSiDiaRieS anD eqUitY accoUnteD inveSteeS (continUeD)
country of name of the entity incorporation ownership interest Principal activities 2017 2016B Subsidiaries of RaK ceramics Bangladesh limited
RAK Power Private Limited Bangladesh 100% 100% Power generation for captive consumption
RAK Securities and Bangladesh 100% 100% Providing security services Services Private Limited
c Subsidiaries of electro RaK llc (refer note 5(b)(i))
Encom Trading LLC UAE - 90% Trading in electrical goods
RAK Industries LLC UAE - 70% Manufacturing and trading of switchgears
Emirates Heavy UAE - 50% Heavy industrial Engineering LLC related fabrication work
Electro RAK (India) India - 51% Electrical, plumbing, ducting, Private Limited air-conditioning works
D Subsidiary of emirates Heavy engineering llc (refer note 5(b)(i))
RAK Fabrication LLC UAE - 100% Fabrication contract works
e Subsidiaries of RaK ceramics Holding llc
RAK Paints LLC UAE 100% 100% Manufacturers of paints and allied products
AAA Contractors LLC UAE 100% 100% Construction company
RAK Universal Plastics Industries LLC UAE 66% 66% Manufacturers of pipes (refer note (i) below)
Al Hamra For Travels UAE 100% 100% Airline ticket booking agent
Ceramics Typing Est. UAE 100% 100% Typing, photocopying and translation services
RAK Ceramics Regional Sales Singapore 100% 100% Trading in ceramic tiles and (Asia Pacific) PTE Limited sanitaryware
F Subsidiaries of RaK ceramics UK limited
RAK Distribution Europe SARL Italy 100% 100% Trading in ceramic tiles and (refer note 5(a)(iv)) sanitaryware
notes to the consolidated financial statements (continued)for the year ended 31 December 2017
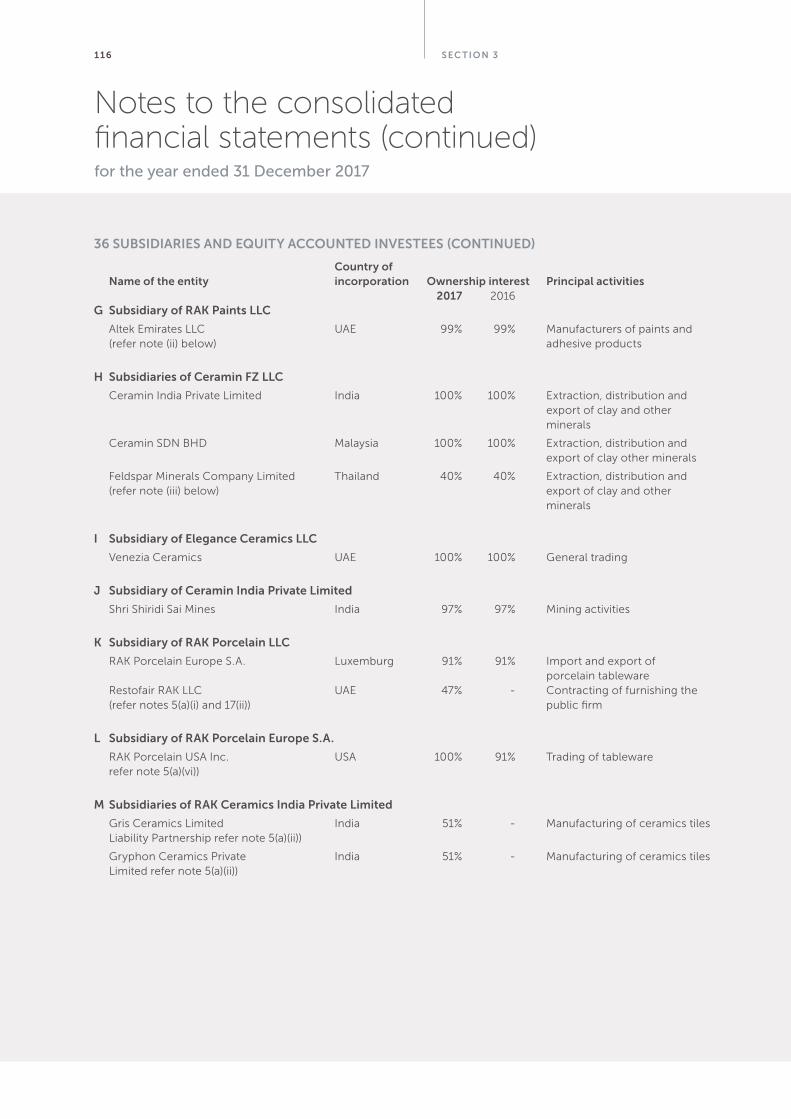
Sec tion 31 16
36 SUBSiDiaRieS anD eqUitY accoUnteD inveSteeS (continUeD)
country of name of the entity incorporation ownership interest Principal activities 2017 2016G Subsidiary of RaK Paints llc
Altek Emirates LLC UAE 99% 99% Manufacturers of paints and (refer note (ii) below) adhesive products
H Subsidiaries of ceramin FZ llc
Ceramin India Private Limited India 100% 100% Extraction, distribution and export of clay and other minerals
Ceramin SDN BHD Malaysia 100% 100% Extraction, distribution and export of clay other minerals
Feldspar Minerals Company Limited Thailand 40% 40% Extraction, distribution and (refer note (iii) below) export of clay and other minerals
i Subsidiary of elegance ceramics llc
Venezia Ceramics UAE 100% 100% General trading
J Subsidiary of ceramin india Private limited
Shri Shiridi Sai Mines India 97% 97% Mining activities
K Subsidiary of RaK Porcelain llc
RAK Porcelain Europe S.A. Luxemburg 91% 91% Import and export of porcelain tableware Restofair RAK LLC UAE 47% - Contracting of furnishing the (refer notes 5(a)(i) and 17(ii)) public firm
l Subsidiary of RaK Porcelain europe S.a.
RAK Porcelain USA Inc. USA 100% 91% Trading of tableware refer note 5(a)(vi))
M Subsidiaries of RaK ceramics india Private limited
Gris Ceramics Limited India 51% - Manufacturing of ceramics tiles Liability Partnership refer note 5(a)(ii))
Gryphon Ceramics Private India 51% - Manufacturing of ceramics tiles Limited refer note 5(a)(ii))
notes to the consolidated financial statements (continued)for the year ended 31 December 2017
Financial re view 1 17
36 SUBSiDiaRieS anD eqUitY accoUnteD inveSteeS (continUeD)
n ventures of R.a.K ceramics PJSc
RAK Saudi LLC Saudi 50% 50% Trading in ceramic tiles and Arabia sanitaryware
RAK Chimica LLC UAE 55.55% 55.55% Manufacturing of chemicals (refer note (iv) below) used in ceramic industries
Kludi RAK LLC UAE 51% 51% Manufacturing of water tap (refer note (iv) below) faucets etc.
RAK Warehouse Leasing UAE - 50% Leasing industrial warehouse LLC (refer note 17(ii)) spaces
ARK International Trading Company Saudi - 50% Trading in ceramic tiles Limited (refer note 5(a)(iii)) Arabia
RAK Ceramics Holding LLC Georgia Georgia 51% 51% Trading in ceramic tiles and (refer note (iv) below) sanitaryware
o associate of RaK ceramics PJSc
Encom Trading LLC UAE - 10% Trading in electrical goods
(refer note 5b(i))
P associate of ceramin FZ llc
Palang Suriya Company Limited Thailand 40% 40% Extraction, distribution and export of clay and other minerals
q Joint ventures of RaK ceramics australia PtY ltD
Massa Imports Pty Limited Australia 50% 50% Trading in ceramic tiles
R Joint ventures of RaK ceramics Holding llc
RAK Watertech LLC UAE 51% 51% Waste-water treatment works Keraben Gulf LLC (refer UAE 51% 51% General trading note (iv) below)
Emirates Heavy Engineering LLC UAE - 50% Heavy industrial engineering (refer note 5(b)(i)) and related fabrication works
S Joint venture of RaK Porcelain llc (refer note 15(i))
Restofair RAK LLC UAE - 47% Trading in catering and turnkey (refer notes 5(a)(i) and 17(ii)) contracting projects
t Subsidiary of Palang Suriya compay limited
Feldspar Minerals Co. Thailand 60% 60% Extraction, distribution and Limited export of clay and other minerals
U associate of encom trading llc
RAK Industries LLC UAE - 30% Manufacturing and trading of (refer note 5(b)(i)) switchgears
notes to the consolidated financial statements (continued)for the year ended 31 December 2017
Sec tion 31 18
36 SUBSiDiaRieS anD eqUitY accoUnteD inveSteeS (continUeD)
(i) The Group holds 66% equity interest in RAK Universal Plastics LLC through RAK Ceramics Holding LLC. In addition to this, RAK Watertech LLC in which RAK Ceramics Holding LLC holds 51% equity interest, also has 24% equity interest in RAK Universal Plastic LLC. Accordingly, the Group effectively holds 78.24% equity interest in RAK Universal Plastics LLC.
(ii) In addition to 99% equity interest in Altek Emirates LLC held by RAK Paints LLC, the Group also holds remaining 1% equity interest that is held by RAK Ceramics Holding LLC, a fully owned subsidiary of the Group. Accordingly, the entity has been treated as fully owned subsidiary of the Group.
(iii) Ceramin FZ LLC holds 40% equity interest in Feldspar Minerals Company Limited. In addition to this, Palang Suriya Company Limited in which Ceramin FZC holds 40% equity interest, also has 60% equity interest in this entity. Accordingly, the Group effectively holds 64% equity interest in Feldspar Minerals Company Limited.
(iv) RAK Watertech LLC, RAK Chimica LLC, Kludi RAK LLC, RAK Ceramics Holding LLC Georgia and Keraben Gulf LLC have been considered as Joint Ventures of the Group since the Group exercise only joint control over the financial and operating policies of these entities with other partners.
(v) During the current year, Prestige Tiles PTY Limited name changed to RAK Ceramics Australia PTY Limited.
37 SiGniFicant accoUntinG eStiMateS anD JUDGeMentS
The Group makes estimates and assumptions which affect the reported amounts of assets and liabilities within the next financial year. Estimates and judgements are continually evaluated and are based on historical experience and other factors, including expectations of future events that are believed to be reasonable under the circumstances. Significant areas of estimation uncertainty and critical judgements in applying accounting policies that have the most significant effect on amounts recognised in the consolidated financial statements are as follows.
Revenue from construction contracts
Revenue from construction contracts is recognised in
profit or loss when the outcome of the contract can be estimated reliably. The measurement of contract revenue is affected by a variety of uncertainties that depend on the outcome of future events. The estimates often need to be revised as events occur and uncertainties are resolved. Therefore, the amount of contract revenue may increase or decrease from period to period.
Project stage of completion and cost to complete estimates
At each date of the consolidated statement of financial position, the Group is required to estimate stage of completion and costs to complete on fixed price and modified fixed price contracts. These estimates require the Group to make estimates of future costs to be incurred, based on work to be performed beyond the reporting date. These estimates also include the cost of potential claim by contractors and the costs of meeting other contractual obligations to the customers. Effects of any revision to these estimates are reflected in the year in which these estimates are revised.
Estimated useful life and residual value of property, plant and equipment and investment property
The Group estimates the useful lives of property, plant and equipment and investment property based on the period over which the assets are expected to be available for use. The estimated useful lives are reviewed periodically and are updated if expectations differ from previous estimates due to physical wear and tear, technical or commercial obsolescence and legal or other limits on the use of the assets. In addition, estimation of the useful lives of property and equipment is based on collective assessment of industry practice, internal technical evaluation and on the historical experience with similar assets. It is possible, however, that future results of operations could be materially affected by changes in estimates brought about by changes in factors mentioned above. The amounts and timing of recorded expenses for any period would be affected by changes in these factors and circumstances. The Group’s management has carried out a review of the residual values and useful lives of property, plant and equipment and investment property and made certain revisions in the current year. Refer notes 14(iii).
Fair valuation of investment property
The Group follows the cost model under IAS 40 whereby investment property are stated at cost less accumulated depreciation and impairment losses, if any. Fair value of investment property are disclosed in note 16 of the consolidated financial statements. The fair values for
notes to the consolidated financial statements (continued)for the year ended 31 December 2017
Financial re view 1 19
notes to the consolidated financial statements (continued)for the year ended 31 December 2017
Fair valuation of investment property (continued)
building have been determined taking into consideration the market replacement cost. Fair values for land have been determined having regard to recent market transactions for similar properties in the same location as the Group’s investment property. Should the key assumptions change, the fair value of investment property may significantly change and result in an impairment of the investment property. Provision for obsolete inventories and net realisable value write down on inventories
The Group reviews its inventory to assess loss on account of obsolescence and any write down for net realisable value adjustment on a regular basis. In determining whether provision for obsolescence should be recorded in profit and loss, the Group makes judgments as to whether there is any observable data indicating that there is any future saleability of the product and the net realisable value for such product. Provision for net realisable value write down is made where the net realisable value is less than cost based on best estimates by management. The provision for obsolescence of inventory is based on its ageing and the past trend of consumption.
Impairment of goodwill
Goodwill is tested annually for impairment and carried at cost less accumulated impairment losses (refer accounting policy on impairment). Testing for impairment requires management to estimate the recoverable amount of the cash generating unit to which the goodwill is allocated.
37 SiGniFicant accoUntinG eStiMateS anD JUDGeMentS (continUeD)
Impairment of property, plant and equipment and intangible assets
Property, plant and equipment and intangibles assets are tested for impairment when there is an indication of impairment. Testing for impairment of these property, plant and equipment and intangible assets requires management to estimate the recoverable amount of the cash generating unit.
Impairment losses on trade and other receivables (including related parties)
The Group reviews its receivables to assess impairment at least on an annual basis. The Group’s credit risk is primarily attributable to its trade receivable, due from related parties and other receivables. In determining
whether impairment losses should be recognised in profit and loss, the Group makes judgements as to whether there is any observable data indicating that there is a measurable decrease in the estimated future cash flows. Accordingly, an allowance for impairment is made where there is an identified loss event or condition which, based on previous experience, is evidence of a reduction in the recoverability of the cash flows.
Identifiable assets and liabilities taken over on acquisition of subsidiaries
The Group separately recognises assets and liabilities on the acquisition of a subsidiary when it is probable that the associated economic benefits will flow to the acquirer or when, in the case of liability, it is probable that an outflow of economic resources will be required to settle the obligation and the fair value of the asset or liability can be measured reliably. Intangible assets and contingent liabilities are separately recognised when they meet the criteria for recognition set out in IFRS 3.
Current and deferred tax
In determining the amount of current and deferred tax, the Group takes into account the impact of uncertain tax positions and whether additional taxes and interest may be due. The Group believes that its accruals for tax liabilities are adequate for all open tax years based on its assessment of many factors, including interpretations of tax law and prior experience. This assessment relies on estimates and assumptions and may involve a series of judgements about future events. New information may become available that causes the Group to change its judgement regarding the adequacy of existing tax liabilities; such changes to tax liabilities will affect tax expense in the period in which a determination is made.
Consolidation – de facto control
As per new control model of IFRS 10, the Group has assessed for all its investees whether it has power over an investee, exposure or right to variable returns from its involvement with the investee and ability to use its power to affect those returns. In determining control, judgements have been exercised on the relationship of the Group with the investees based on which conclusions have been drawn.
38 coMPaRative FiGUReS
Certain comparative figures have been reclassified/regrouped, wherever necessary to conform to the presentation adopted in these consolidated financial statements. These do not materially impact the reported amount of net profits or net assets.

R AKcER A Mic S .cOM
HEAd OFFicERAK Ceramics
P.O. Box: 4714, Ras Al KhaimahUnited Arab Emirates
Tel. +971 (0) 7 246 7000Fax. +971 (0) 7 244 5270
Email. [email protected]


