46
A N N U A L R E P O RT 2 0 1 8

A N N U A L R E P O R T 2 0 1 8
2 Bluefish Annual Report 2018
CEO comments
Continued growth For Bluefish Pharmaceuticals, 2018 was a year of continued growth and stability. We have a competent team that has delivered on the established goals as planned, while effectively managing the challenges we’ve faced. During the last year, Blue-fish has conscientiously and strategically focused on developing the organisation. Stable processes are now in place that will make it easier for us to act on opportunities that are created in the marketplace. One of our success factors is the core group of employees that have been working in our business units for quite some time. Each and every one has contributed with hard
work and dedicated efforts daily. Profitability increased last year compared to the previous
year, this is confirmation of the successful adjustments we’ve made to put the organisation on a path of stability and contin-ued growth. We expect 2019 to be an even more stable and successful year, where we will create higher profitability for the company.
Progress during the yearIn 2018, our third product, Anagrelid, obtained approval in most of the countries where we are planning to launch it and we have high expectations on sales in 2019. Hydroxyzine, which is one of our own developed formulations, was launched in 2017 and its sales increased during the year and it is now one of the company’s ten largest products. It is quite satisfying to witness the excellent sales results for Bluefish’s own developed products and we are optimistic that there will be additional growth in the year ahead.
In total, sales increased by 9 percent and the margin im-proved to more than 50 percent in 2018 due to our success in increasing the margins in several countries. We've kept overhead costs at a stable level, however selling expenses have increased

3Bluefish Annual Report 2018
in line with higher volumes, as expected. During the year, there was a positive impact from currency fluctuations as regards both revenue and expenses.
Sales growth in Sweden has made the country one of our largest markets, together with Germany, Spain and Poland. Strengthening of the sales organisation in both Poland and Sweden have contributed to higher sales. The initiatives that we focused on during the year demonstrate that we are building a successful model for continued growth. Our newly opened sales office in Ireland was up and running later than expected, which has impacted our earnings. However, during the last months of the year, sales in Ireland were in line with expectations, which makes us optimistic about achieving great results in 2019.
All in all, both sales and operating profit in 2018 were higher than the year before, which was also a year of realignment and change.
Bluefish portfolio and investments During the year we have invested efforts in our product port-folio during the year and have identified new opportunities for growth. We also started up two new development projects at our own laboratory, with planned launch in 2021 and 2022. We are continuing to invest in own development and expect to launch Hydroxyzine in more markets during 2019. We also expect sales of Anagrelid to start taking off in the markets where we’ve already obtained approvals and further approvals are pending in more markets during 2019. There are further launch plans of ad-ditional products in selected markets during the year. There are continual strategic efforts underway to supplement and develop our product portfolio so that the company remains competitive in the future.
During the year, we continued making investments to meet the new legal requirements on serialisation in the pharmaceuticals sector, which is aimed at preventing falsified medicines from be-ing sold and distributed in Europe. Bluefish has invested in both IT solutions and processes to ensure that all of our packaging is marked with the right codes, along with having the required tamper evidence on each pack.
Future outlookWe also started this year stronger than the one before and can already see a positive trend of even higher sales in Germany. We continue exploring ways to further supplement our portfolio, while simultaneously strengthening our market position in se-lected areas. We are striving to find new opportunities in existing markets and are well-prepared for the consequences of Brexit.
With all of this in mind, we are very confident about the year ahead and anticipate excellent prospects for the future.
Bluefish has established a successful model and we’re very proud of what we’ve achieved. We all feel that we are well-equipped for continued growth and stability.
Stockholm, May 2019
Berit LindholmCEO

4 Bluefish Annual Report 2018
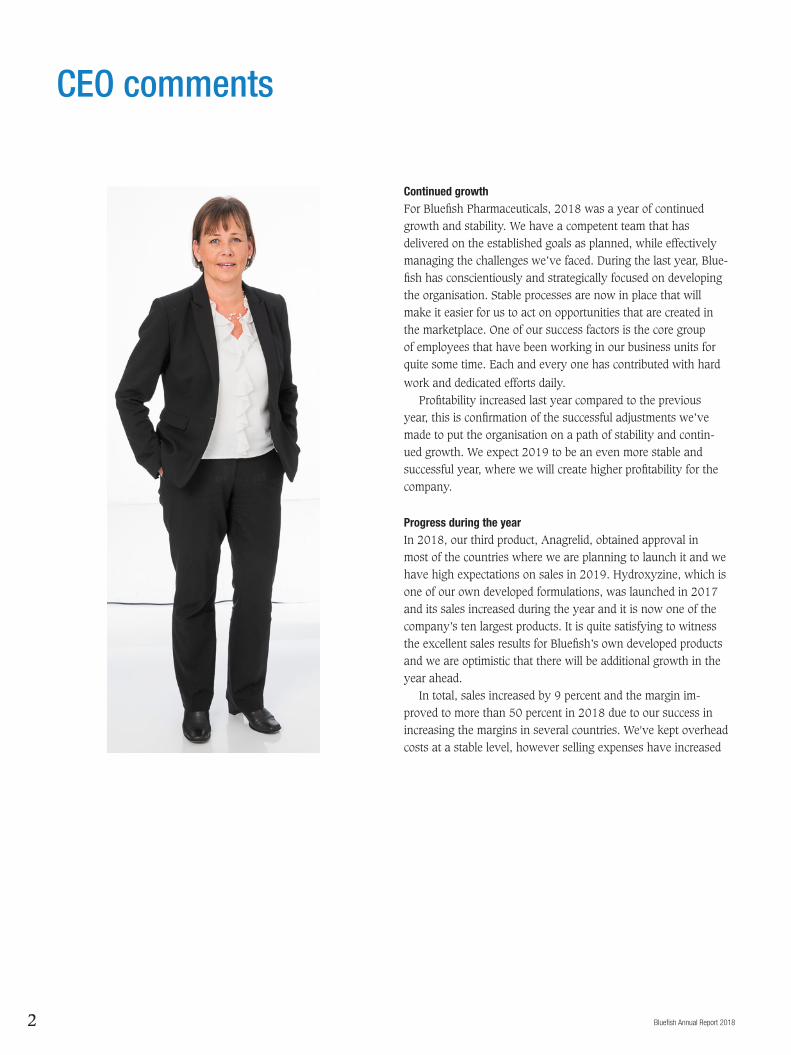
Berit LindholmPresident and CEO since 2017Member of the management group since 2015, employed since 2015Born 1965
Professional experience:Head of Planning, AstraZeneca Sweden Operations, Business Rela-tionship Director Operations IT Astra-Zeneca, Director Global Project and Change Management AstraZeneca, Plant Manager Sterile Solutions Freeze dried products AstraZeneca AB, Manager CMC & Labelling QA/QC Pharmacia & Upjohn Pharma Mälardalen
Education:BSc Pharm, Faculty of Pharmacy Uppsala University, Helsinki University Accounts and Economics Warwick Business School, UK, Uppsala University
Shareholding in Bluefish: –
Anders SvenssonChief Financial Officer since 2017Member of the management group since 2017, employed 2017, left the company in February 2019Born 1963
Professional experience:CEO, Aura Light US Ltd, CFO Aura Light Group AB, Group Controller, Aura Light International AB, Con-sulting Manager, Simple Concepts Scandinavia AB
Education:Master of Business Administration (MBA), Australian Graduate School of Management, Sydney, AustraliaMaster of Laws, Lund University
Shareholding in Bluefish: –
Erik EkmanChief Operating Officer since 2017Member of the management group since 2017, employed since 2017Born 1972
Professional experience:Erik has more than 15 years of experience from the Pharmaceutical Industry, and he has had various leadership roles in Manufacturing, IT, Change Management, and Process Governance at AstraZeneca and earlier Cambrex. Erik has a back-ground as a Management Consultant from CapGemini Ernst&Young.
Education:MSc in Industrial Engineering and Management, Institute of Technology at Linköping University, SwedenLeadership training at Stockholm School of Economics, London Business School, and Warwick University
Shareholding in Bluefish: –
Management
Vlastimir ZemanHead of Business Development since 2017Member of the management group since 2017, employed since 2017Born 1969
Professional experience:Vlastimir has more than 20 years' experience of leadership in phar-maceutical sales and marketing management for internationally known industry leaders. Areas of expertise include Business Strategy & Marketing Management, Business Development, Lifecycle & Portfolio Management and Commercial Excellence Polpharma S.A.
Education:Doctor of Medicine (MD), Charles University Prague, Faculty of Medicine Plzen, Czech Republic
Shareholding in Bluefish: –
Berit Lindholm, Anders Svensson, Vivekanand Sundaramurthy, Erik Ekman, Vlastimir Zeman, Astha Sehgal, Kim Kjornas.
5Bluefish Annual Report 2018
Kim KjornasVP Sales and Marketing since 2016Member of the management group since 2016, employed as consultant since 2016Born 1955
Professional experience:Kim has more than 30 years' experience in the pharmaceutical/biotech industry, working with Sales and Marketing national (Nordic) as well as International (global),Business Development, Portfolio Management, Launch Management and Product Development.
Education:M.Sc. Pharm. University of CopenhagenLean six-sigma (green belt)Bachelor (HH) Accounting and Economics (Koebmandsskolen Copenhagen)Statistics for experimenters (University of Copenhagen)
Shareholding in Bluefish: –
Vivekanand SundaramurthyHead of R&D since 2011Member of the management group since 2017, employed since 2011Born 1977
Professional experience:Headed Formulation R&D team at Shasun Pharmaceuticals, Manager Technology Transfer operations at Dr. Reddy’s Laboratories, Developed formulations for Regulated as well as RoW markets at Medreich Sterilab, Fourrts India
Education:M.Pharm – Annamalai UniversityB.Pharm – Dr.M.G.R. Medical UniversityProject Management Professional (Certified PMP)Ph.D. student in Pharmaceutics from Annamalai University
Shareholding in Bluefish: –
Astha SehgalHead of HR since 2016Member of the management group since 2017, employed since 2016Born 1984
Professional experience:Astha has more than 10 years' experience in the field of Human Resources with industries like Direct Selling and Pharmaceuticals, working with the entire gamut of Human Resource activities in the life cycle of an employee. Officer-Human Resources, Avon Beauty Products; Executive-Human Resources, Avon Beauty Products; Assistant Manager- Human Resources, MSD Wellcome Trust Hilleman Laboratories.
Education:MBA in Human Resources and Finance, Dayalbagh Educational InstituteBBA, Dayalbagh Educational Institute
Shareholding in Bluefish: –

6 Bluefish Annual Report 2018
Shareholder A shares B shares Total no. shares Total no. votes Share of equityShare of
votes
Färna Invest AB – 32,659,410 32,659,410 3,265,941 40.35% 40.35%
Nexttobe AB – 26,539,930 26,539,930 2,653,993 32.80% 32.80%
Karl Karlsson/Newbury HealthCap – 3,796,427 3,796,427 379,643 4.69% 4.69%
Varenne2) – 3,147,020 3,147,020 314,702 3.90% 3.90%
Other – 14,799,709 14,799,709 1,479,971 18.30% 18.30%
Total – 80,942,496 80,942,496 8,094,250 100.00% 100.00%
2) Refers to shares held by Varenne AB (2,397,020 shares) and Varenne Invest I AB (750,000 shares).
List of shareholders as of 2018-12-31
Gerald EngströmChairman of the Board of Directors (since 2011)Born 1948Director (since 2010)
Education:Technical college engineer, studies in economics, Stockholm University
Other Board assignments:Chairman of the Board, Systemair AB Director, Färna Invest AB
Shareholding in Bluefish: 32,659,410¹)
Erika Kjellberg ErikssonDirector since 2013Born 1962Partner, Nexttobe AB
Education:MBA
Other Board assignments:Chairman of the Board, Lokon Pharma ABDirector, Linum AB, Q-linea AB, Zetcity AB, Endovascular Development AB, Lumina Adhesives AB, Capilet Genetics AB, Tanea Medical AB
Shareholding in Bluefish: –
Board of Directors
1) Private holding or holdings via the company as of 31 December 2018
Karl KarlssonDirector (since 2005)Born 1974President and CEO (2005-2017)
Education:Owner/President Management Program at Harvard Business School, Boston, USAMarketing and Business Administration, George Mason University, Virginia, USA
Other Board assignments:
Shareholding in Bluefish: 3,796,427 ¹)

7Bluefish Annual Report 2018
The Board of Directors and CEO of Bluefish Pharmaceuticals AB (publ), registration number 556673-9164, hereby submit the fol-lowing annual report and consolidated financial statements for the 2018 financial year. Unless otherwise stated, all figures pertain to the Group for the 2018 financial year. Comparison figures are for the 2017 financial year, unless otherwise stated.
As of 31 December 2018, the Group consists of 11 (12) companies. The Parent Company for the Group is Bluefish Pharmaceuticals AB. Bluefish Pharma Fz-LLC in Dubai has now been formally discontinued.
Bluefish operationsBluefish strives to make quality pharmaceuticals available to more people. We create value throughout the entire pharmaceuticals value chain, i.e. from product development to manufacturing and marketing of generic pharmaceuticals. We offer a product portfolio that consists of a wide range of high quality generic pharmaceu-ticals. Part of our long-term strategy is to maintain the product range of patent-free volume products. However, we are also con-stantly striving to offer a wider selection of niche products in more specific therapeutical areas. Bluefish products originate from a generic substance with well-documented safety and efficacy. Our strategy of developing products based on well-known substances gives us a product range with substantial market potential.
Bluefish has established an effective marketing organisation that is based on extensive knowledge of the local conditions and market so that we can optimise business opportunities and growth in each market.
Bluefish is established in 13 European countries, along with some export activities to countries outside Europe. We also have a subsidiary in India, with focus on maintaining and developing the Group’s product portfolio.
Bluefish is constantly striving to identify new growth oppor-tunities in both specific, selected market segments as well as in some new markets. In 2018, the company strengthened its sales organisation so that it can optimise the higher potential we iden-tified in our product portfolio. In line with that, we started selling from our own office in Ireland as of last May. New products have been introduced and the expectations on 2019 sales are higher than what was achieved in 2018. The delayed start in Ireland unfortunately had a negative impact on performance in 2018 with high inventory levels due to lower sales. We also registered our own product, Hydroxyzine, in several markets and it has con-tinued to be a sales success. Anagrelid was launched in Sweden during the last few months of the year and now when approval has been obtained, we will start selling the product in several new markets during 2019.
In 2019, we expect to continue strengthening the sales organ-isation.
Directors’ reportGroup earnings and financial position
Net sales and earningsNet sales for the full year 2018 were SEK 357.2 (329.2) million representing an increase of 9% as compared to the same period in 2017. With input costs of SEK 175.9 (182.7) million, the gross profit amounted to SEK 181.3 (146.6) million, corresponding to a gross margin of 50.7 (44.5)% for the period. Throughout the 2018 financial year, currency fluctuations have had a positive effect on net sales equal to SEK 0.5 (0.5) million.
Operating costs for the year amounted to SEK 181.1 (175.5) million, of which SEK 27.9 (32.1) million was amortisation, de-preciation and impairment losses. EBITDA for 2018 was SEK 28.0 (3.1) million. During 2018, currency fluctuations had an effect on EBITDA equal to SEK 2.8 (–4.3) million. The net loss for the period was SEK –17.1 (–42.4) million, which includes currency effects of SEK 3.9 (–3.9) million.
Cash & cash equivalents and financingAt the end of the period, cash and cash equivalents amounted to SEK 51.9 million, compared with SEK 44.7 million at the begin-ning of the year. Cash flow from operating activities amounted to SEK –17.9 (–59.6) million in 2018, of which SEK 30.5 (–50.8) million was the change in working capital. The change in working capital is primarily attributable to lower inventory levels, which is in line with the company’s established targets. Cash flow from investing activities was SEK –13.9 (–21.2) million in 2018, of which investments in intangible assets, such as product devel-opment, licenses and market approval, amounted to SEK –14.3 (–20.2) million.
In 2018, cash flow from financing activities amounted to SEK 1.8 (91.2) million, which is a net effect of not having added any new convertible debt. As of 31 December 2018, utilised bank credit was SEK 101.6 million, compared with SEK 99.4 million at the beginning of the year. Total available bank credit was SEK 112.8 million (SEK 72 million + EUR 3 million).
Net financial income/expense amounted to SEK –13.8 (–10.9) million for the year, which includes interest expense on the con-vertible debt and bank overdraft.
Shareholders’ equity and equity ratioAt the end of the period, equity was SEK 25.3 million compared to SEK 42.0 million at the beginning of the year. That corresponds to SEK 0.31 (0.52) per share. At the end of the period, the equity ratio was 6.1%, compared to 10.0% at the beginning of the year.
8 Bluefish Annual Report 2018
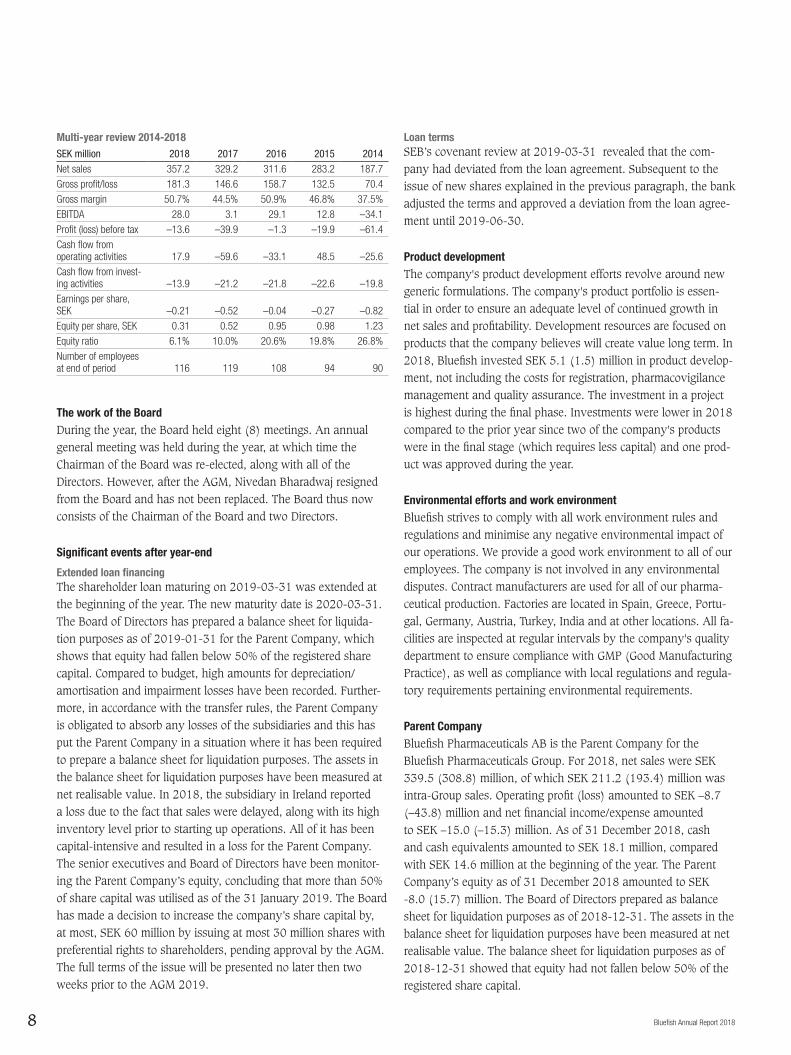
Multi-year review 2014-2018SEK million 2018 2017 2016 2015 2014Net sales 357.2 329.2 311.6 283.2 187.7
Gross profit/loss 181.3 146.6 158.7 132.5 70.4
Gross margin 50.7% 44.5% 50.9% 46.8% 37.5%
EBITDA 28.0 3.1 29.1 12.8 –34.1
Profit (loss) before tax –13.6 –39.9 –1.3 –19.9 –61.4
Cash flow from operating activities 17.9 –59.6 –33.1 48.5 –25.6
Cash flow from invest-ing activities –13.9 –21.2 –21.8 –22.6 –19.8
Earnings per share, SEK –0.21 –0.52 –0.04 –0.27 –0.82
Equity per share, SEK 0.31 0.52 0.95 0.98 1.23
Equity ratio 6.1% 10.0% 20.6% 19.8% 26.8%
Number of employees at end of period 116 119 108 94 90
The work of the BoardDuring the year, the Board held eight (8) meetings. An annual general meeting was held during the year, at which time the Chairman of the Board was re-elected, along with all of the Directors. However, after the AGM, Nivedan Bharadwaj resigned from the Board and has not been replaced. The Board thus now consists of the Chairman of the Board and two Directors.
Significant events after year-end
Extended loan financingThe shareholder loan maturing on 2019-03-31 was extended at the beginning of the year. The new maturity date is 2020-03-31.The Board of Directors has prepared a balance sheet for liquida-tion purposes as of 2019-01-31 for the Parent Company, which shows that equity had fallen below 50% of the registered share capital. Compared to budget, high amounts for depreciation/amortisation and impairment losses have been recorded. Further-more, in accordance with the transfer rules, the Parent Company is obligated to absorb any losses of the subsidiaries and this has put the Parent Company in a situation where it has been required to prepare a balance sheet for liquidation purposes. The assets in the balance sheet for liquidation purposes have been measured at net realisable value. In 2018, the subsidiary in Ireland reported a loss due to the fact that sales were delayed, along with its high inventory level prior to starting up operations. All of it has been capital-intensive and resulted in a loss for the Parent Company. The senior executives and Board of Directors have been monitor-ing the Parent Company’s equity, concluding that more than 50% of share capital was utilised as of the 31 January 2019. The Board has made a decision to increase the company’s share capital by, at most, SEK 60 million by issuing at most 30 million shares with preferential rights to shareholders, pending approval by the AGM. The full terms of the issue will be presented no later then two weeks prior to the AGM 2019.
Loan termsSEB’s covenant review at 2019-03-31 revealed that the com-pany had deviated from the loan agreement. Subsequent to the issue of new shares explained in the previous paragraph, the bank adjusted the terms and approved a deviation from the loan agree-ment until 2019-06-30.
Product developmentThe company's product development efforts revolve around new generic formulations. The company's product portfolio is essen-tial in order to ensure an adequate level of continued growth in net sales and profitability. Development resources are focused on products that the company believes will create value long term. In 2018, Bluefish invested SEK 5.1 (1.5) million in product develop-ment, not including the costs for registration, pharmacovigilance management and quality assurance. The investment in a project is highest during the final phase. Investments were lower in 2018 compared to the prior year since two of the company's products were in the final stage (which requires less capital) and one prod-uct was approved during the year.
Environmental efforts and work environment Bluefish strives to comply with all work environment rules and regulations and minimise any negative environmental impact of our operations. We provide a good work environment to all of our employees. The company is not involved in any environmental disputes. Contract manufacturers are used for all of our pharma-ceutical production. Factories are located in Spain, Greece, Portu-gal, Germany, Austria, Turkey, India and at other locations. All fa-cilities are inspected at regular intervals by the company's quality department to ensure compliance with GMP (Good Manufacturing Practice), as well as compliance with local regulations and regula-tory requirements pertaining environmental requirements.
Parent CompanyBluefish Pharmaceuticals AB is the Parent Company for the Bluefish Pharmaceuticals Group. For 2018, net sales were SEK 339.5 (308.8) million, of which SEK 211.2 (193.4) million was intra-Group sales. Operating profit (loss) amounted to SEK –8.7 (–43.8) million and net financial income/expense amounted to SEK –15.0 (–15.3) million. As of 31 December 2018, cash and cash equivalents amounted to SEK 18.1 million, compared with SEK 14.6 million at the beginning of the year. The Parent Company’s equity as of 31 December 2018 amounted to SEK -8.0 (15.7) million. The Board of Directors prepared as balance sheet for liquidation purposes as of 2018-12-31. The assets in the balance sheet for liquidation purposes have been measured at net realisable value. The balance sheet for liquidation purposes as of 2018-12-31 showed that equity had not fallen below 50% of the registered share capital.

9Bluefish Annual Report 2018
Future outlookIn 2019, the company expects that its growth in sales will be higher than the previous year. Sales growth will primarily be fuelled by the investments that were made in the current year, along with the impact from sales of newly launched products dur-ing the year. It is also expected that sales growth will contribute to higher profitability compared to the 2018 financial year, but the full effect is expected to occur during the next period.
Risks and uncertaintiesBluefish faces many risks and uncertainties that could have a negative impact on the business. The main business risks and financial risks that could have a significant negative impact on the business or its earnings are described below.
Changes in market conditionsThere is very tough price competition in several of the markets where Bluefish operates. With a change in market conditions compared to what was assumed when a business opportunity was evaluated, there is a risk that sales will not be on competitive terms. There is thus a risk of impairment losses on the investment and inventories. In order to manage changed market conditions, it is advantageous to have a flexible organisation that can quickly make decisions.
Bluefish also collaborates with a number of partners. We can-not, however, guarantee that we can maintain and develop these collaborations. A discontinued collaboration could cause delays or lost sales.
Development of generic pharmaceuticals is a complicated, risky, and time-consuming process. Any project could fail or incur a delay at any stage in the process due to a variety of factors. During development, there is a risk that competitors develop the same product or that the market conditions change in some other way. If that happens, it may not be possible to recover the development costs.
Supply chainBluefish does not have any own manufacturing, which is why the company collaborates with contract manufacturers for its pharma-ceutical production. During the manufacturing process of pharma-ceuticals, there could be shortages or delivery delays resulting from changed conditions pertaining to raw material deliveries, resource shortages, priorities etc. or force majeure. Delivery delays could cause a delay or loss in sales, penalty fees for delayed deliv-ery or impairment losses on inventories.
Changes to regulatory decisionsIt cannot be ruled out that the regulatory approval process at the government level could change with respect to requirements regarding the details, scope of documentation or other items. Such
regulatory decisions could lead to higher costs, project delays or even termination of a project. Bluefish is also exposed to regula-tory decisions pertaining to the required permits for commerciali-sation of pharmaceuticals and changes in the rules on pricing and reimbursement of pharmaceuticals, along with changed conditions having to do with the prescription of a particular drug. Changed regulatory decisions could impact the established plans for distri-bution and cause delays or even lost sales. Bluefish employees are well acquainted with the regulations and to prevent any surprises having to do with regulatory changes, Bluefish employees are proactive in collecting information on updates to ongoing investi-gations by the authorities.
Legislation and regulationsFailure to comply with applicable laws and regulations can lead to civil and/or criminal proceedings and sanctions. Primarily, Bluefish has responsibility for product liability as regards quality and safety, competition legislation, environmental issues, employ-ment, work environment/health & safety and tax issues. A nega-tive outcome on disputes and/or government investigations could lead to significant liability claims. To counteract negligence, the company has created a strong culture for ethics and compliance. All employees attend training when they first join the company, which includes knowledge of laws and regulations. All staff par-ticipate in regular training to keep their knowledge up to date.
The risk of product liability claims is limited in part through product liability insurance. However, it can never entirely be eliminated since the insurance cover and amount of compensation are limited.
Dependence on key employeesBluefish is highly dependent on key employees. There is a risk that the company’s projects become delayed or that they cannot be completed if these individuals were to leave the company or, for some other reason, were unable to fulfil their duties. The ability to recruit and retain qualified employees is of utmost importance to ensure that the company has the necessary level of expertise.
Financial risksBluefish regularly provides information on future financial expectations. All such statements are forward-looking and they are based on assumptions and assessments. If we are unable to successfully implement our business strategy, it could prevent us from achieving our financial goals and meeting expectations. That, in turn, could have a negative impact on the business, earn-ings or financial position, including the ability to raise funds and retain existing credit.
10 Bluefish Annual Report 2018
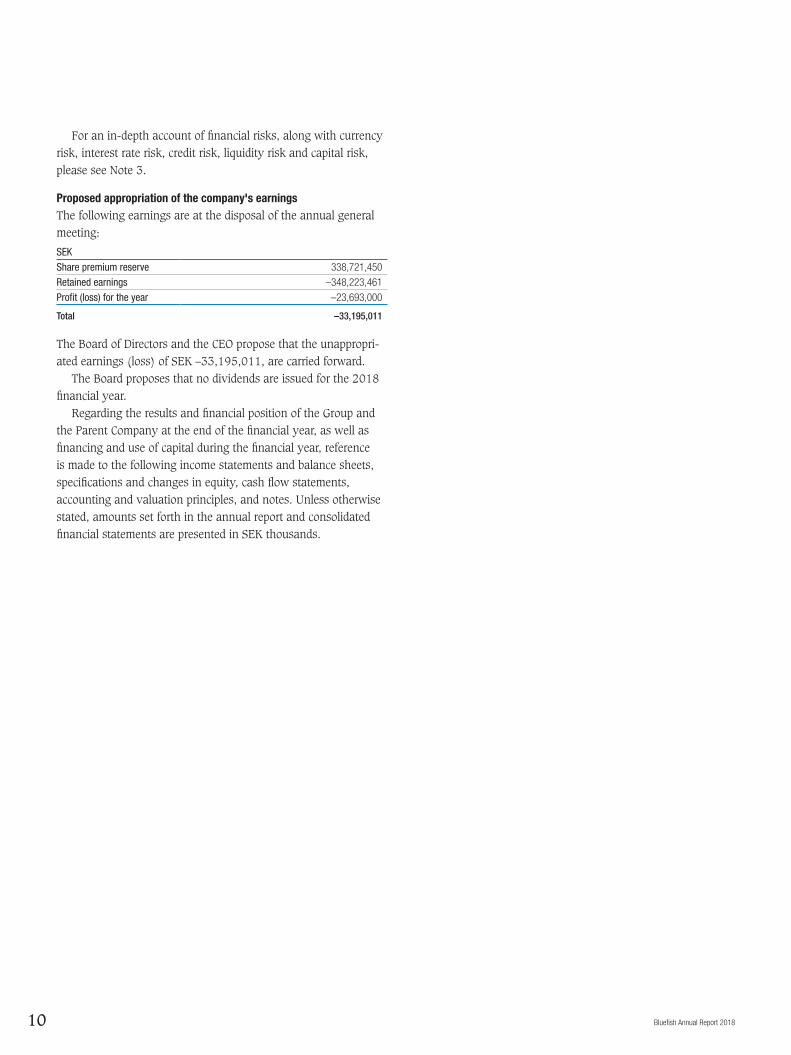
For an in-depth account of financial risks, along with currency risk, interest rate risk, credit risk, liquidity risk and capital risk, please see Note 3.
Proposed appropriation of the company's earningsThe following earnings are at the disposal of the annual general meeting:
SEKShare premium reserve 338,721,450
Retained earnings –348,223,461
Profit (loss) for the year –23,693,000
Total –33,195,011
The Board of Directors and the CEO propose that the unappropri-ated earnings (loss) of SEK –33,195,011, are carried forward.
The Board proposes that no dividends are issued for the 2018 financial year.
Regarding the results and financial position of the Group and the Parent Company at the end of the financial year, as well as financing and use of capital during the financial year, reference is made to the following income statements and balance sheets, specifications and changes in equity, cash flow statements, accounting and valuation principles, and notes. Unless otherwise stated, amounts set forth in the annual report and consolidated financial statements are presented in SEK thousands.

11Bluefish Annual Report 2018
SEK thousands Note 2018 2017
Net sales 2, 4, 5 357,233 329,208
Cost of goods sold –175,944 –182,651
Gross profit/loss 181,289 146,557
Selling expenses –92,125 –77,523
Administration costs –23,035 –24,469
Development costs –66,458 –73,945
Other revenue 511 417
Operating profit (loss) 6-12 182 –28,963
Financial income 13 4,524 600
Financial expenses 14 –18,308 –11,502
Financial items – net –13,784 –10,902
Profit (loss) before tax –13,602 –39,865
Income tax 15 –3,519 –2,530
Net loss for the year, attributable to shareholders of the Parent Company –17,121 –42,395
EARNINGS PER SHARE
Basic earnings per share (SEK) 16 –0.21 –0.52
Diluted earnings per share (SEK) 16 –0.21 –0.52
Income statement Group
Statement of comprehensive incomeSEK thousands 2018 2017
Profit (loss) for the year –17,121 –42,395
Other comprehensive income
Items that may be reclassified to profit or loss
Translations difference 418 261
Total other comprehensive income 418 261
Total comprehensive income for the year –16,703 –42,134
Of the total comprehensive income for the year, the entire amount is attributable to the Parent Company’s shareholders.

12 Bluefish Annual Report 2018
SEK thousands Note 2018-12-31 2017-12-31
ASSETS
29
2, 22
Non-current assets
Intangible assets 10, 17 138,091 153,866
Property, plant and equipment 10.18 5,169 8,283
Financial assets 20 1,465 1,840
Total non-current assets 144,725 163,989
Current assets
Inventories 21 125,754 125,371
Accounts receivable 23 71,843 80,011
Tax receivables 23 754 654
Other receivables 23 14,783 3,907
Prepaid expenses and accrued income 5,639 3,087
Cash and cash equivalents 29 51,898 44,675
Total current assets 270,671 257,705
TOTAL ASSETS 415,396 421,694
EQUITY AND LIABILITIES 2, 3, 22
Equity
Share capital 24 16,188 16,188
Other contributed capital 351,138 351,093
Reserves 2,129 1,711
Retained earnings including loss for the year –344,144 –327,023
Total equity 25,311 41,969
Non-current liabilities
Borrowings 25 93,697 89,870
Other non-current liabilities 26 796 3,647
Total non-current liabilities 94,493 93,517
Current liabilities
Accounts payable 62,013 54,636
Current tax liabilities 757 897
Borrowings 25 116,631 114,346
Other current liabilities 26 9,935 10,661
Current provisions 27 82,801 73,890
Accrued expenses and deferred income 28 23,455 31,778
Total current liabilities and provisions 295,592 286,208
TOTAL EQUITY AND LIABILITIES 415,396 421,694
Balance sheetGroup

13Bluefish Annual Report 2018
Consolidated statement of changes in equity
SHAREHOLDERS OF THE PARENT COMPANY
SEK thousands Share capitalOther
contributed capital Reserves 1Retained earnings
Total equity
Opening equity, 1 January 2017 16,188 343,991 1,450 –284,628 77,001
Profit (loss) for the year – – – –42,395 –42,395
Translations difference – – 261 – 261
Total other comprehensive income, net after tax – – 261 – 261
Total comprehensive income – 1,711 –42,395 –42,134
Transactions with shareholders
Equity portion of convertible debt (25) – 7,466 – – 7,466
Issue costs for convertible debt – –363 – – –363
Total transactions with shareholders – 7,102 – – 7,102
Closing equity, 31 December 2017 16,188 351,093 1,711 –327,023 41,969
Opening equity, 1 January 2018 16,188 351,093 1,711 –327,023 41,969
Profit (loss) for the year – – – –17,121 –17,121
Translations difference – – 418 – 418
Total other comprehensive income, net after tax – – 418 – 418
Total comprehensive income – – 418 –17,121 –16,703
Transactions with shareholders
Premium for warrants (8) – 45 – – 45
Equity portion of convertible debt (25) – – – – –
Issue costs for convertible debt – – – – –
Total transactions with shareholders – 45 – – 45
Closing equity, 31 December 2018 16,188 351,138 2,129 –344,144 25,311

14 Bluefish Annual Report 2018
SEK thousands Note 2018 2017
Operating activities
Operating profit (loss) 182 –28,963
Interest paid –13,189 –11,601
Interest received 943 600
Taxes paid –3,755 –2,369
Adjustment for items not included in cash flow, etc. 30 64,750 55,633
Cash flow from operating activities before changes in working capital 48,348 13,300
Cash flow from changes in working capital
Inventories –12,779 –43,572
Operating receivables –6,224 –14,617
Operating liabilities –11,479 –14,747
Cash flow from operating activities 17,872 –59,636
Investing activities
Acquisition of intangible assets 17 –14,279 –20,152
Acquisition of property, plant and equipment 18 –217 –1,037
Cash flow from investing activities –14,488 –21,189
Financing activities
New convertible debt 25 – 96,972
Repaid convertible debt 25 – –21,601
Other non-current liabilities 26 –55 55
Increase of bank overdraft facility 25 –3,344 9,531
Increase of invoice discounting 25 5,231 6,236
Cash flow from financing activities 1,832 91,193
Cash flow for the year 5,797 10,368
Cash and cash equivalents at beginning of year 44,675 33,607
Exchange rate differences in cash and cash equivalents 1,426 700
Cash and cash equivalents at year-end 51,898 44,675
Consolidated cash flow statement

15Bluefish Annual Report 2018
SEK thousands Note 2018 2017
Net sales 2, 5 339,470 308,781
Cost of goods sold –177,453 –180,629
Gross profit/loss 162,017 128,152
Selling expenses –84,058 –67,980
Administration costs –21,403 –31,856
Development costs –65,743 –72,516
Other revenue 511 417
Operating profit (loss) 6-12 –8,676 –43,783
Financial income 13 3,960 106
Financial expenses 14 –18,977 –15,428
Financial items – net –15,017 –15,322
Profit (loss) before tax –23,693 –59,106
Income tax 15 – –
Profit (loss) for the year –23,693 –59,106
Income statement Parent Company
Statement of comprehensive incomeSEK thousands 2018 2017
Profit (loss) for the year –23,693 –59,106
Other comprehensive income
Items that may be reclassified to profit or loss – –
Total other comprehensive income – –
Total comprehensive income for the year –23,693 –59,106

16 Bluefish Annual Report 2018
SEK thousands Note 2018-12-31 2017-12-31
29
ASSETS 2
Non-current assets
Intangible assets 10, 17 136,064 152,246
Property, plant and equipment 10, 18 1,012 1,622
Participations in Group companies 19 15,648 15,742
Other non-current liabilities 20 94 94
Total non-current assets 152,818 169,705
Current assets
Inventories 21 125,754 125,371
Accounts receivable 23 31,362 30,307
Receivables from Group companies 23 25,877 23,043
Tax receivables 23 754 286
Other receivables 23 1,399 1,735
Prepaid expenses and accrued income 3,354 2,193
Cash and bank 29 18,118 14,647
Total current assets 206,618 197,582
TOTAL ASSETS 359,436 367,287
EQUITY AND LIABILITIES 2, 3
Equity
Restricted equity
Share capital 24 16,188 16,188
Fund for development expenditures 9,008 9,709
Total restricted equity 25,196 25,897
Non-restricted equity 33
Share premium reserve 338,721 338,021
Retained earnings –348,223 –289,118
Profit (loss) for the year –23,693 –59,106
Total non-restricted equity –33,195 –10,203
Total equity –7,999 15,694
Non-current liabilities
Borrowings 25 93,697 89,870
Other non-current liabilities 26 796 3,592
Total non-current liabilities 94,493 93,461
Current liabilities
Accounts payable 31,515 41,354
Liabilities to Group companies 104,724 78,646
Borrowings 25 109,839 105,031
Other current liabilities 26 9,108 8,960
Accrued expenses and deferred income 28 17,756 24,141
Total current liabilities 272,942 258,131
TOTAL EQUITY AND LIABILITIES 359,436 367,287
Balance sheet Parent Company
17Bluefish Annual Report 2018
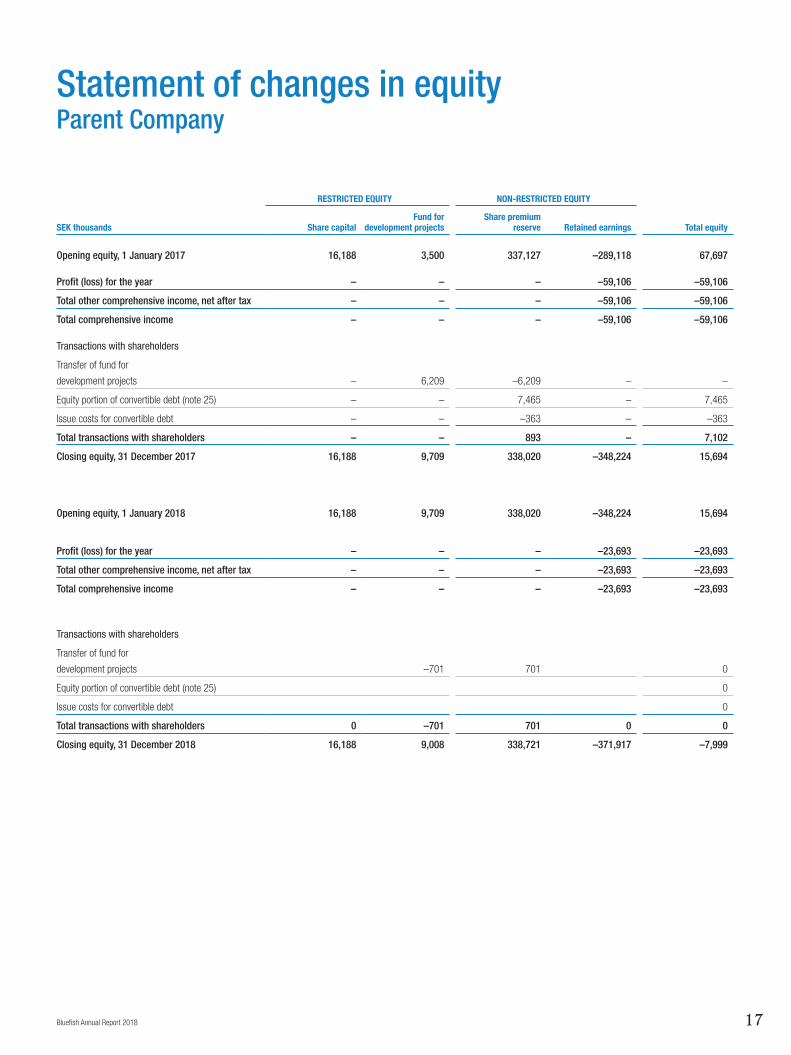
Statement of changes in equityParent Company
RESTRICTED EQUITY NON-RESTRICTED EQUITY
SEK thousands Share capitalFund for
development projectsShare premium
reserve Retained earnings Total equity
Opening equity, 1 January 2017 16,188 3,500 337,127 –289,118 67,697
Profit (loss) for the year – – – –59,106 –59,106
Total other comprehensive income, net after tax – – – –59,106 –59,106
Total comprehensive income – – – –59,106 –59,106
Transactions with shareholders
Transfer of fund for
development projects – 6,209 –6,209 – –
Equity portion of convertible debt (note 25) – – 7,465 – 7,465
Issue costs for convertible debt – – –363 – –363
Total transactions with shareholders – – 893 – 7,102
Closing equity, 31 December 2017 16,188 9,709 338,020 –348,224 15,694
Opening equity, 1 January 2018 16,188 9,709 338,020 –348,224 15,694
Profit (loss) for the year – – – –23,693 –23,693
Total other comprehensive income, net after tax – – – –23,693 –23,693
Total comprehensive income – – – –23,693 –23,693
Transactions with shareholders
Transfer of fund for
development projects –701 701 0
Equity portion of convertible debt (note 25) 0
Issue costs for convertible debt 0
Total transactions with shareholders 0 –701 701 0 0
Closing equity, 31 December 2018 16,188 9,008 338,721 –371,917 –7,999

18 Bluefish Annual Report 2018
Cash flow statement Parent Company
SEK thousands Note 2018 2017
Operating activities
Operating profit (loss) –8,676 –43,783
Interest paid –11,951 –8,629
Interest received 378 106
Taxes paid –468 17
Adjustment for items not included in cash flow 30 52,026 57,357
Cash flow from operating activities before changes in working capital 31,309 5,068
Cash flow from changes in working capital
Inventories –12,779 –43,475
Operating receivables –7,283 –24,679
Operating liabilities 765 13,940
Cash flow from operating activities 12,012 –49,146
Investing activities
Acquisition of intangible assets 17 –13,614 –20,766
Acquisition of property, plant and equipment 18 –13 –463
Other financial assets – –42
Cash flow from investing activities –13,627 –21,271
Financing activities
Increase of bank overdraft facility 25 –3,344 2,530
Increase of invoice discounting 25 8,152 3,921
New convertible debt 25 – 89,870
Repaid convertible debt 25 – –21,601
Cash flow from financing activities 4,808 74,719
Cash flow for the year 3,193 4,302
Cash and cash equivalents at beginning of year 14,647 10,246
Exchange rate differences in cash and cash equivalents 278 99
Cash and cash equivalents at year-end 18,118 14,647

19Bluefish Annual Report 2018
Note1 Accounting policies
General informationBluefish Pharmaceuticals AB (the Parent Company) and its subsidiaries (together, "the Group") develop products and market generic pharmaceuticals via a network of independent whole-salers and pharmacies. The Parent Company is a limited company registered and domiciled in Sweden. The headquarters are located at Gävlegatan 22, 113 30 Stockholm. On 30 April 2019, the Board of Directors approved these consolidated financial statements for publication.
Basis of preparation for the financial statementsThe consolidated financial statements of the Bluefish Pharmaceuticals Group have been prepared in accordance with the International Financial Reporting Standards (IFRS) adopted by the EU. In addition, the standard RFR 1 issued by the Swedish Financial Reporting Board and the Swedish Annual Accounts Act have been applied. Unless otherwise stated, the consol-idated financial statements have been prepared in accordance with the cost method. The financial statements of the Parent Company have been prepared in accordance with the same accounting principles as for the Group, subject to the exceptions described in the section entitled “Parent Company’s accounting principles”.
Prerequisites for preparation of the financial statementsThe Parent Company’s functional currency is SEK, which is also the reporting currency for the Parent Company and the Group. Consequently, the financial statements are presented in SEK. Unless otherwise stated, all amounts are rounded off to the nearest thousand.
Non-current assets and non-current liabilities primarily consist of amounts that are expected to be recovered or paid more than 12 months after the balance sheet date.
The preparation of financial statements in accordance with IFRS requires that group management makes a number of important assessments, estimations and assumptions which affect the application of the accounting principles and of the reported amounts of assets, liabilities, revenues and expenses. The areas which include a high degree of assess-ment, which are complex, or such areas where assumptions and estimations are of material significance for the consolidated financial statements are described in Note 2. Estimations and assessments are reviewed regularly. Changes in estimations are reported in the period in which the change is made if the change only effects that period, or in the period in which the changes are made and future periods, if the change affects both the current period and future periods.
Unless otherwise stated below, the accounting principles below have been applied consist-ently in all presented years. The Group’s accounting principles have been applied consistently to the reporting and consolidation of subsidiaries.
Certain comparison figures have been reclassified to conform with the presentation in the current year's financial statements. Where the reclassification relates to significant amounts, separate information thereon is provided.
New or amended reporting standards during the 2018 financial year.A number of new or updated accounting recommendations and interpretations enter into force for fiscal years commencing 1 January 2018. As of the financial year starting on 1 January 2018, the following standards have been applied: IFRS 15 Revenue from Contracts with Customers and IFRS 9 Financial Instruments. The new standards have not had any significant impact on the Group’s or the Parent Company’s earnings or position.
IFRS 15 Revenue from Contracts with Customers replaces prior issued standards and interpretations on revenue with a single model for revenue recognition. The standard is based on the principle that revenue should be recognised when the promised good or service has been transferred to the customer, i.e. when the customer has obtained control over it, which could occur over time, or at a specific point in time. Revenue shall consist of the amount that the company expects to be reimbursed for in exchange for the delivered goods or services. It has been applied using the retrospective approach by the Group and Parent Company as of 1 January 2019. The standard has not had any significant impact on the Group’s or the Parent Company’s financial statements, other than additional disclosure requirements.
IFRS 9 Financial instruments covers accounting for financial assets and liabilities. It replaces IAS 39. Similar to IAS 39, financial assets are classified in different categories, some of which are measured at amortised cost and others at fair value. To assess how a financial instrument should be reported in accordance with IFRS 9, a company must look at the con-tractual cash flows along with the business model under which the instrument is held. IFRS
9 also introduces a new model for impairment of financial assets. The objective of the new model is to, among others, ensure that credit losses are reported earlier than they were under IAS 39. For financial liabilities, IFRS 9 is essentially the same as IAS 39. Changed criteria for hedge accounting can result in more financial hedging strategies meeting the requirements for hedge accounting under IFRS 9 than in IAS 39.
IFRS 9 has been applied by the Group and Parent Company as of 1 January 2018. IFRS 9 has different classification categories compared to IAS 39. The changed classification has not resulted in any change to the carrying amounts with the transition to IFRS 9, since all of the Group’s and Parent Company’s financial instruments still meet the requirements for being reported at amortised cost. According to IFRS 9, a provision must be made for expected credit losses since credit exposure exists, typically at initial recognition. This change does not, however, result in any significant transition effect, which is why a recognition of such has not been reported in equity either. The Group does not apply hedge accounting and as such, the change in criteria has not had any transition effect.
New and revised accounting standards that are not yet effective and have not been early adopted by the GroupA number of new and amended IFRS have not yet entered into force and have not been early adopted when preparing the financial statements for the Group and Parent Company. Below is a description of the IFRS that could impact the Group’s or the Parent Company’s financial statements. Other new or amended standards or interpretations published by the IASB are not expected to affect the Group or Parent Company's financial statements.
IFRS 16 Leases will replace IAS 17. According to the new standard, the lessee must report the obligation to pay lease fees as a lease liability in the balance sheet. The right to use the leased asset during the lease period is reported as an asset. Depreciation of the asset is reported in the income statement, along with interest on the lease liability. Paid lease fees are reported in part as interest payment and in part as amortisation of the lease liability. The standard allows an exemption whereby lease agreements with a duration of less than 12 months (short-term leases) and leases of assets with a low value do not need to be reported. For the lessor, the standard does not result in any significant changes. IFRS 16 entered into force for financial years starting on 1 January 2019 or later and the Group applies the standard as of 1 January 2019.
In accordance with the standard, most of the rental agreements are reported as operating leases in these financial statements and they will be recognised as assets and liabilities in the balance sheet. Furthermore, the costs associated with these leases will be recognised as amortisation and interest expense. The Parent Company will apply the RFR exception for lease agreements. It means that the Parent Company’s principles for reporting leases will be unchanged. The Group applies the simplified approach to transition, which means that right-of-use assets and the associated financial liability will increase by SEK 17,923 thousand as of 1 January 2019. The liability amount is made up of a non-current liability of SEK 12,753 thousand and a current liability of SEK 5,170 thousand.
Non-applicable standardsAs allowed by IFRIC in respect of unlisted companies, Bluefish does not apply IFRIC 8, Operating Segments.
Consolidation principlesSubsidiaries are companies in which Bluefish Pharmaceuticals AB has a controlling influence. ‘Controlling influence’ entails a right, directly or indirectly, to determine a company's financial and operational strategies, which normally means that the Parent Company owns more than 50 % of the voting rights for all shares and participating interests. When determining whether a controlling influence exists, consideration must be given to whether there are any potential voting shares which are currently possible to utilise or convert. Subsidiaries are included in the consolidated financial statements as of the date on which the Group obtains control. They are excluded from the consolidated financial statements as of the date on which the controlling influence ceases.
The acquisition method is applied to the reporting of the Group’s business acquisitions. Consideration for the acquisition of a subsidiary is comprised of the fair value of the trans-ferred assets and liabilities for which the Group has an obligation to the prior owners of the acquired company. Consideration also includes the fair value of all assets or liabilities result-

20 Bluefish Annual Report 2018
ing from an agreement regarding a contingent consideration. Identifiable acquired assets and assumed liabilities in a business acquisition are initially valued at fair value on the acquisition date. Acquisition-related costs are expensed as incurred.
Goodwill is initially valued at the amount by which the total consideration and fair value for non-controlling interests exceeds the fair value of identifiable assets acquired and liabilities assumed. If the consideration is lower than the fair value of the acquired company's net assets, the difference is reported directly in profit or loss.
Intra-Group receivables and liabilities, revenues and expenses, together with unrealised profits or losses arising from transactions between Group companies, are eliminated in their entirety when preparing the consolidated financial statements. Unrealised losses are eliminated in the same way as unrealised profits, but only to the extent that there is no need for impairment.
Translation of foreign currencyTransactions in foreign currency have been translated to the functional currency at the exchange rate applicable on the date of the transaction. Monetary assets and liabilities in foreign currency have been valued at the closing day rate. Exchange rate differences which arise are reported in the income statement for the period. The consolidated financial statements are prepared in Swedish kronor (SEK), which is the functional currency and presentation currency of the Parent Company.
The balance sheets of foreign subsidiaries have been translated to SEK at the closing day rate. The income statements have been translated at the average rate for the year. The translation difference arising in connection with currency translation is recognised in other comprehensive income.
Non-monetary assets are reported in the functional currency of the business in which they were originally reported. This applies even if the asset is, later on, transferred to a business within the Group that has a different functional currency. Translation to the reporting currency occurs in the corresponding way as for foreign subsidiaries.
Applied exchange rates relative to the Group’s reporting currency (SEK):
Average rate Closing day rate
Country Currency 2018 2017 2018 2017
Denmark DKK 1.3762 1.2949 1.3760 1.3229
EUR countries EUR 10.2567 9.6326 10.2753 9.8497
India INR 0.1271 0.1312 0.1282 0.1286Norway NOK 1.0687 1.0330 1.0245 1.0011
Poland PLN 2.4076 2.2626 2.3904 2.3606United Arab Emirates USD 8.6921 8.5380 8.9710 8.2322
Upon the full or partial divestment of foreign operations, the exchange rate differences which were previously reported in other comprehensive income are recognised in profit or loss for the period as part of the gain or loss on disposal.
Net salesNet sales comprise the fair value of what is received or will be received for goods and ser-vices sold in the course of the Group's business operations. Net sales is reported excluding VAT, returns and discounts, and after the elimination of intra-Group sales. The Group reports net sales when the amount can be measured in a reliable manner, when it is probable that future economic benefits will accrue to the Company, and when special criteria have been fulfilled for each of the Group's operations as described below. Revenue amounts cannot be measured in a reliable manner until all obligations in respect of the sale have been fulfilled or expired. An assessment as to whether any provision is necessary is made for each individual transaction. The Group bases its assessments on historical outcome, and thus takes into account the type of customer, type of transaction and special circumstances in each individual case.
The Group markets and sells a selection of generic pharmaceutical preparations, primarily on the wholesale market. Revenue is recognised upon the sale of goods when a Group company has delivered products to a wholesaler, the wholesaler can exercise its discretion to select a sales channel and price for the product, and there are no unfulfilled obligations which could affect the wholesaler’s approval of the products. Delivery does not occur until the products have been sent to the designated location, the risks of obsolescence and loss have passed to the wholesaler, and either the wholesaler has approved the products in accordance with the sales agreement, the conditions for approval have expired, or the Group has objective proof that all criteria for approval have been met.
Pharmaceutical preparations with quantity discounts are often sold on the wholesale market, and the customers are entitled to return products. Sales revenue is recognised on the basis of the price set forth in the sale agreement, net after estimated quantity discounts and returns on the date of sale. Accumulated experience is used to assess and make provisions for discounts, price adjustments and returns. No financing component is considered to exist, because sales are made with a maximum credit period of 60 days, which conforms to market practice.
See also Note 2, Estimates and Assessments.
TaxesThe Group’s total income tax includes tax which is to be paid or received for the current year, adjustments to previous years' taxes and changes in deferred tax.
The current tax expense is calculated on the basis of the tax rules which, on the balance sheet date, have been issued or in practice have been decided upon in those countries where the Parent Company's subsidiaries operate and generate taxable revenue.
For items which are reported in the income statement, associated tax effects are also reported in the income statement. Tax effects of items recognised directly in equity is recog-nised in equity.
Deferred tax is calculated based on temporary differences which arise between the carrying amount and tax base of assets and liabilities.
The valuation of deferred tax is based on the manner in which underlying assets or liabilities are expected to be realised or settled. Deferred tax is calculated applying the tax rates and tax rules decided upon as of the balance sheet date. If the calculation gives rise to a deferred tax asset, such asset is reported only to the extent it is likely that it will be realised.
Derivative instruments and hedging measuresDerivative instruments are reported in the balance sheet on the contract day and valued at fair value, both initially and in conjunction with subsequent revaluations. The method for reporting the profit or loss which arises in conjunction with revaluation depends upon whether the derivative is identified as a hedging instrument and, where this is the case, the nature of the item to be hedged. Forecast sales in foreign currency that are hedged with currency forward contracts are deemed to be very probable and they are classified as cash flow hedges.
Disclosures on fair value for various derivatives used for hedging purposes are provided in Note 15. Changes in the hedging reserve in equity are shown in the Report of changes in equity. The entire fair value of a derivative hedging instrument is classified as a non-current asset or non-current liability when the remaining term of the hedged item is greater than 12 months and. It is classified as a current asset or current liability when the remaining term of the hedged item is less than 12 months.
The effective portion of the change in fair value of the derivatives identified as cash flow hedges and which qualifies for hedge accounting is recognised in other comprehensive income. Accumulated amounts in equity are reversed and reported in the income statement in those periods during which the hedged item affects earnings, for example when the forecasted sales which are hedged take place. The profit or loss related to the ineffective part is immediately recognised in profit or loss under the item Other gains/losses – net.
Intangible assetsDevelopment costsExpenditures incurred in development projects relating to in-house development of generic products are reported as intangible assets, provided that the likelihood of future economic benefit and useful life is considered to be high. An intangible asset is reported only to the extent the product can be sold on existing markets and resources exist to complete the de-velopment. Only those expenses which relate directly to the development of the new product are capitalised.
Other development expenditures which do not satisfy these conditions are recognised as expenses when incurred. Development expenditures which have previously been reported as an expense are not reported as an asset in a subsequent period. Capitalised development costs are amortised according to plan over the useful life.
Licences and market approvalsAcquired licenses and related market approvals are capitalised. Market approvals consist of fees for registration of licences with authorities and directly related expenditures. Licences and expenses associated with obtaining market approval are reported at cost less accumul-ated amortisation.

21Bluefish Annual Report 2018
Licences and market approvals have a determinable useful life and are depreciated on a straight line basis over that period, which is calculated to be 10-15 years. As of 1 January 2011, the assessment of the useful life changed from 10 years to 10-15 years, in respect of existing licences and market approvals.
Software and trademarksAcquired software licences are capitalised based on acquisition and implementation fees. The fees are amortised on a straight line basis over the useful life, which is 4-10 years.
Impairment of intangible assetsIntangible assets are tested for impairment at least once per year or whenever events or changes in circumstances indicate that the carrying amount is not recoverable.
An impairment loss is recognised for the amount by which the asset’s carrying amount exceeds its recoverable amount. The recoverable amount is the fair value of the asset less selling expenses, or its value-in-use, whichever is higher.
When assessing impairment, assets are grouped at the lowest levels where there are separate, identifiable cash flows (cash-generating units).
Property, plant and equipmentProperty, plant and equipment is mainly comprised of equipment and computers, which are reported at cost less accumulated depreciation. Cost includes expenditures which can be directly attributed to the acquisition of the asset.
Additional expenditures for improvements in the performance of the assets in excess of original level increase the asset’s carrying amount. All other forms of repairs and maintenance are recognised as expenses in profit or loss during the period in which they are incurred.
Property, plant and equipment are depreciated on a straight line basis over the assessed useful life of the assets, which is 3-5 years.
Impairment of non-current assetsOn each balance sheet date, the Group assesses whether there are any indications that a non-current asset has diminished in value. If such is the case, the Group makes an assess-ment regarding the recoverable amount of the asset. Recoverable amount is the fair value of an asset, less any sales costs, or its value-in-use, whichever is higher. The value-in-use is the current value of the assessed future cash flow attributable to the asset. An impairment loss is recognised for the amount by which the carrying amount of the asset exceeds the recoverable amount. Discounting rates reflect the capital cost and other financial parameters in the country or region in which the asset is used.
LeasingA finance lease is a leasing agreement in which the economic risks and advantages associated with ownership of an asset are in all essential respects transferred from the lessor to the lessee. Title may, but need not, ultimately pass to the lessee. Operating leases are all leasing arrangements other than finance leases.
Assets held under finance leases are reported in the balance sheet at the fair value of the leasing object or the present value of minimum leasing fees, whichever is lower, and future leasing fees are reported as a loan. Expenses for the period are comprised of depreciation on the leased asset and interest expenses for the loan.
Non-current assets held under finance leases are depreciated over the useful life of the asset or the leasing period, whichever is shorter.
For operating leases, payments made during the leasing period are expensed in the income statement on a straight-line basis over the leasing period.
InventoriesInventories are valued at the lower of cost and net realisable value. Cost is calculated using the weighted average method and it includes expenses associated with the acquisition, along with transport of inventory assets. The net realisable value is the estimated selling price in the ordinary course of business, less applicable variable selling expenses. Inventory impairment occurs within the scope of normal business operations and is recognised in costs of goods sold.
See also Note 2, Estimates and Assessments.
Financial instrumentsFinancial instruments are recognised in the balance sheet when the Group becomes party to the instrument's contractual terms. A receivable/claim is reported when the company has performed and a contractual obligation to pay exists for the counterparty. A liability is reported
when the counterparty has performed and a contractual obligation to pay exists for the company. The business model upon which the financial asset or liability was obtained, along with the nature of the contractual cash flows are what determines classification. The Group has financial assets and liabilities classified in the categories below:
• Financial assets at amortised cost• Financial liabilities at amortised cost
Purchases and sales of financial assets are recognised on the trade date, which is the date on which the Group commits to purchase or sell the asset. Financial assets are removed from the balance sheet when the right to receive the cash flows generated by the instrument has expired or been transferred and the Group has transferred essentially all of the risks and rewards associated with ownership.
During the financial year and comparison year, the Group did not have any financial instru-ments measured at fair value either through profit or loss or through other comprehensive income. During the comparison year, the Group had financial assets classified as loans and receivables in accordance with IAS 39. They have, in all material respects, been reported in the same way as financial assets at amortised cost in accordance with IFRS 9.
a) Financial assets measured at amortised costFinancial assets classified at amortised cost are initially recognised at fair value plus transac-tion costs. After initial recognition, the assets are measured in accordance with the effective interest method. Assets measured at amortised cost are held in accordance with the business model for the purpose of collecting contractual cash flows that are only comprised of pay-ments of principal and interest on the outstanding amount of capital. Assets in this category are classified as current assets if settlement is expected within twelve months. Otherwise they are classified as non-current assets.
For financial assets measured at amortised cost, a provision is made for expected credit losses. Recognition of bad debt losses is forward-looking and a provision for expected credit losses is made when there is exposure to credit risk, typically upon initial recognition. Expected credit losses reflect the present value of all reductions to anticipated cash flows resulting from default in the next 12 months or during the expected remaining term for the financial instrument, depending on the asset class and deterioration of creditworthiness since initial recognition.
b) Financial liabilities measured at amortised costFinancial liabilities at amortised cost are initially recognised at fair value plus transaction costs. After initial recognition, they are measured at amortised cost in accordance with the effective interest method. Financial liabilities must be divided into current and non-current liabilities. A financial liability must be classified as current if the following apply:
a) it falls due for payment within 12 months of the closing date, or b) it is expected to be paid within the normal term of the company’s operating cycle. All
other financial liabilities must be classified as non-current..
Cash and cash equivalentsCash and cash equivalents include cash, bank balances and other short-term investments maturing within three months from the date of acquisition.
Bank guarantees are restricted cash included in cash and cash equivalents.
Share capitalOrdinary shares are classified as equity. Transaction expenses which are directly attributable to an issue of new shares or options are reported, net after tax, in equity as a deduction from the issue proceeds.
Accounts payableAccounts payables are obligations to pay for goods or services which have been acquired in the ordinary course of business from suppliers. Accounts payable are classified as current liabilities if they fall due for payment within one year or earlier. If not, they are reported as non-current liabilities.
Accounts payables are initially recognised at fair value and subsequently at amortised cost applying the effective interest method.
BorrowingsBorrowing are initially recognised at fair value net after transaction costs. Afterwards, borrow-ing costs are reported at amortised cost and any difference between received amount (net after transaction costs) and the repayment amount is reported in profit or loss allocated over the loan period, applying the effective interest method.

22 Bluefish Annual Report 2018
The fair value of the liability component of convertible debt instruments is determined using the market rate for a equivalent non-convertible debt instrument. This amount is recog-nised as a liability at amortised cost until the debt ceases through conversion or redemption. The remaining part of the amount received is attributed to the option component. This is reported in shareholders’ equity, net after tax.
Bank overdraft and invoice discounting are reported as borrowings among non-current liabilities in the balance sheet.
Other liabilitiesOther liabilities are classified as current liabilities if they fall due for payment within one year or earlier. If not, they are reported as non-current liabilities.
Other liabilities consist primarily of liabilities incurred in connection with purchases of licences. Payment in respect of licences takes place upon agreed milestones, usually depend-ing on the market approval procedure.
Other liabilities are reported initially at fair value and thereafter at amortised cost applying the effective interest method.
Parent CompanyThe Parent Company has compiled its Annual Report in accordance with the Swedish Annual Accounts Act (1995:1554) and the Swedish Financial Reporting Board’s Recommendation RFR 2, Accounting for Legal Entities. RFR 2 entails that the Parent Company, in its annual report of a legal entity, shall apply all of IFRS and interpretations approved by the EU to the extent possible, within the framework of the Swedish Annual Accounts Act, and taking into account the connection between accounting and taxation. The Recommendation sets out the exceptions and additions to be made from/to IFRS. The difference between the Group's and the Parent Company's accounting principles are set forth below.
The stated accounting principles of the Parent Company set forth below have been applied consistently in all periods presented in the Parent Company's financial statements.
SubsidiariesShares and participations in subsidiaries are reported at cost less any impairment. Cost includes any acquisition-related costs and any additional consideration. Received dividends are reported as financial income.
The recoverable amount is calculated when there are indications that shares and partici-pations in subsidiaries have diminished in value. An impairment loss is recognised whenever the recoverable amount is less than the carrying amount. Impairment losses are reported in the items Profit (loss) from participations in Group companies.
Group contributions and shareholder contributionsGroup contributions made or received by the Parent Company, with the aim of minimising the Group’s total tax, are reported as appropriations in accordance with the alternative rule. Shareholder contributions provided by the Parent Company are reported in shares and partici-pations and tested for impairment as set forth above.
Property, plant and equipmentProperty, plant and equipment in the Parent Company are reported at cost less accumulated depreciation and any impairment in the same way as for the Group, but with the addition of any revaluations.
For leased assets, all leasing agreements in the Parent Company are reported in accord-ance with the rules for operating leases.
Fund for development expendituresCompanies that capitalise development expenditures in the balance sheet must reserve the corresponding amount in a restricted fund that is a component of equity. The fund is then gradually dissolved at the rate that the company amortises or recognises impairment on the capitalised development expenditures. The fund is also dissolved in conjunction with disposal of the asset.
Presentation in the annual reportThe income statement and balance sheet in the Parent Company's annual report have been prepared in accordance with the Swedish Annual Accounts Act (1995:1554) and the Swedish Financial Reporting Board's Recommendation, RFR 2.

23Bluefish Annual Report 2018
Note2 Estimates and judgements
The preparation of annual accounts in accordance with generally accepted accounting principles requires that management make assumptions and assessments which affect the reported assets and liabilities at the time of the preparation of the annual accounts and the reported revenues and expenses during the reporting period. Given the uncertainty associated with these estimates, the actual results may deviate from such assumptions and assess-ments, which can affect the Group’s consolidated financial statements.
In the description of accounting principles, the areas where assessments and calculations need to be made are stated. In light of the Group’s business operations, the management of Bluefish Pharmaceuticals believes that the most important of these are revenue recognition, accounting for inventories and assessing impairment of intangible assets.
Net salesThe company's gross sales consist of the number of packaging units delivered during a specific period at the price prevailing on the relevant market.
According to the practice within the pharmaceuticals industry, gross sales are affected by various deductions, which include discounts and deductions for public authorities, wholesalers, and health insurance companies, as well as returns. These deductions represent assessments of the related obligations which, in turn, require the company to make estimates regarding the effect on sales for particular reporting period. Consequently, when reporting net sales, a deduction from gross sales is made for these estimates. The assessment of the need for such deductions is made in conjunction with each individual transaction.
Normally, there is a time delay of several months from the point in time at which the esti-mate of the deduction is made and the final reporting of the obligation. Net sales represents, in turn, our best estimate of the revenue that will be received.
Deductions for discounts, price adjustments and returnsDiscounts arise when the Group has an agreement with an indirect customer, such as a pur-chasing organisation or health insurance company, to sell products at a price which is lower than the price invoiced to the wholesaler. The discount represents the difference between the invoiced price to the wholesaler and the contracted price to the indirect customer. The company reports such discounts by reducing gross sales by an amount which corresponds to our estimate of the discount which is related to a particular sale. Reserves for estimated discounts are calculated by using a combination of factors, including the terms and conditions of each individual contract, historical experience, and expected product growth.
When reducing the price of a product, we offer the customer compensation for the differ-ence in price for the customer’s existing inventory for the product in question. The estimate of such compensation is determined at the time of the price change and is based on estimated inventory levels for the product.
When a product is sold on the wholesale market where the customer is entitled to return products, a reserve is booked for estimated returns which is based on anticipated changes in market conditions and the remaining time until the product’s expiration date.
On certain markets, the company offers cash discounts in order to encourage customers to pay on time. Reserves are made for cash discounts at the time of invoicing and a corre-sponding deduction is made from gross sales.
The company adjusts the reserves for deductions from gross sales on a regular basis in order to reflect the fair values. In order to evaluate the sufficiency of the reserves, the company uses internal and external estimates of inventory levels, actual discount factors received, and the time delay from sales of goods to the time such discount invoices are received.
Inventory obsolescenceThe company’s purchases of new goods are based on anticipated sales volumes and prices. On most markets, the wholesalers require a remaining time until the expiration date of at least six months for all deliveries. Based on historical sales and forecast volumes, the company makes continuous assessment of whether there is a risk of impairment due to short shelf life of the product, or in cases where the market price has changed and the product can no longer be sold at a profit. Such estimates of obsolescence are reported as cost of goods sold. Reconciliation against actual destruction of inventories is carried out on a regular basis.
Intangible assetsThe Group’s intangible assets consist primarily of licensing rights, market approvals, and products under development.
All intangible assets are continuously assessed for impairment. The Group considers in this context whether there is any indication that an asset has decreased in value. Assessment of whether there is an indication of impairment is also based on the asset’s forecasted contribution to earnings. It the asset’s contribution to earnings is low, the Group makes an assessment regarding the recoverable amount of the asset. Recoverable amount is the fair value of an asset, less any sales costs, or its value-in-use, whichever is higher. In most cases, the market information needed to estimate the fair value of the asset is lacking. Consequently, the value-in-use is used in order to assess the asset’s value. This consists of the present value of the estimated future cash flows attributable to the asset. The estimated value-in-use reflects assumptions about market trends, forecast sales and margins, future tax rates, and the discount rate. The discount rate used in the present value calculation of the expected future cash flows is the Group’s current WACC (weighted average cost of capital). Given these extensive assumptions, actual cash flows can deviate significantly from the values obtained from the projected cash flows.
In those cases where the carrying amount of the asset exceeds the recoverable amount, an impairment loss is recognised for the corresponding amount. All impairment losses are immediately recognised in profit or loss. Intangible assets associated with the company's development projects for which development has been discontinued are assessed for impair-ment at that time and written down to their fair value (which is normally zero).
Income taxesDeferred tax assets are calculated on the basis of future utilisation of accumulated Group loss carry-forwards. For the time being, deferred tax assets for loss carry-forwards are not recognised as assets.

24 Bluefish Annual Report 2018
Note3 Financial risk management
In running the business, the Group is exposed to a variety of financial risks: currency risk, interest rate risk in cash flow and fair value, credit risk, liquidity risk and capital risk. The Group’s overall risk management policy focuses on the unpredictability of financial markets and it attempts to minimise potential unfavourable effects on the Group's financial results.
Risk management is conducted by a central treasury department in accordance with policies established by the Board. The treasury function identifies, evaluates and hedges financial risks in close co-operation with the Group's operational units. The Board prepares written policies, both for general risk management and for specific areas, such as currency risk, interest rate risk, credit risk, use of derivatives and non-derivative financial instruments and investment of surplus liquidity.
Currency riskThe Group operates internationally and is exposed to currency risks which arise from various currency exposures, primarily against the EUR. Currency risk arises through future commer-cial transactions, reported assets and liabilities and net investments in foreign operations.
Had the SEK weakened/strengthened by 10 % in relation to the EUR, with all other variables held constant, the effect on the carrying amount of assets and liabilities as of 31 December 2018 would have been SEK 693 (3,621) thousand higher/lower, mainly as a result of gains/losses upon translation of receivables and liabilities in EUR.
As of the balance sheet date, unrealised currency losses of SEK 11,986 (2,835) thousand had been recognised.
Interest rate risk in cash flows and fair valuesBecause the Group has no substantial interest-bearing assets, the Group's revenues and cash flow from operating activities are, in all essential respects, independent of changes in market interest rates.
The Group's interest rate risk arises through long-term borrowing. Borrowing which takes place at variable interest rates exposes the Group to interest rate risk as regards cash flow. Borrowing at fixed interest rates exposes the Group to interest rate risk in respect of fair value.
Credit riskCredit risk is managed at the Group level. Credit risk arises through balances at banks and financial institutions, as well as credit exposure vis-á-vis wholesalers, including outstanding receivables and contracted transactions. Only banks and financial institutions with a credit rating of at least AAA from an independent rating agency are accepted. The Group's main bank is Skandinaviska Enskilda Banken AB (publ). As of 31 December 2018, the Group's balances with SEB amounted to SEK 31,120 (29,839) thousand out of its total bank balances of SEK 51,898 (44,675) thousand. For wholesalers, the Group uses credit ratings from inde-pendent rating agencies whenever such are available. If there is no independent credit rating, a risk assessment is made of the customer's creditworthiness in which its financial position is taken into account, together with previous experience and other factors. Individual risk limits are set based on internal or external credit assessments in accordance with the limits which are established by the Board. Use of credit limits is monitored regularly.
Bluefish entered into an agreement with SEB regarding working capital credit designed to meet the company's increased need for working capital. As of 31 December 2018, working capital credit includes SEK 72 million, for which the Nordic inventories have been used as col-lateral, and an additional SEK 10 million for invoice discounting. The SEB credit is conditional on the Group maintaining a net gearing ratio under 1.2 and available liquidity of at least SEK 5 million. In addition to this, Bluefish GmbH also has a factoring agreement in place with SEB Germany, where the credit limit is EUR 3 million.
Liquidity riskCash flow forecasts are prepared regularly. The Group’s central finance department carefully monitors rolling forecasts regarding the Group’s liquidity reserve in order to ensure that the Group has sufficient cash on hand for operating activities, along with maintaining adequate available amounts from its unused credit facilities.
The table below analyses the Group's financial liabilities broken down by the time remain-ing from the balance sheet date until the contractual due date. The amounts stated in the table are the contracted, undiscounted cash flows regarding all amounts except convertible debt, which has been discounted. These amounts correspond to book values, since the discounting effect is negligible.
Inventory credit and invoice discounting do not take interest rate into consideration, because interest is difficult to assess due to fluctuations in the size of the liability from month to month. The working capital credit with SEB is a running agreement (with a 3-month notice of termination required from each side) that remains in force as long as inventory is held in the Nordic region and there are Nordic accounts receivable that can be pledged. According to the agreement with SEB, the Nordic inventory may be pledged for an amount equal to 65% of AIP (Pharmacy Purchase Price) and Nordic accounts receivable may be pledged for up to 80% of the total invoice amount.
Less than 1 year
Between 1 and 2 years
Between 2 and 5 years
More than 5 years
As of 31 December 2018
Convertible debt – 93,697 – –
Inventory credit 71,645 – – –
Invoice discounting 14,987 – – –
Liabilities to credit institutions 15,155 – – –
Shareholder loan 15,300 – – – Accounts payable and other liabilities 72,705 796 – –
As of 31 December 2017 –
Convertible debt – – 89,870 –
Inventory credit 67,987 – – –
Invoice discounting 16,359 – – –
Liabilities to credit institutions 15,152 – – –
Shareholder loan – 16,200 – – Accounts payable and other liabilities 66,195 3,647 – –
The Board of Directors and CEO continually monitor the company’s forecasts and have concluded that the company’s forecasted cash flows for the next 12 months meet the liquidity needs and allow the company to pursue its business plan.
Capital riskFor capital structure, the goal is to secure the Group’s capacity to continue its activities, so that it can keep generating a return for shareholders and benefits other stakeholders, and to maintain an optimal capital structure in order to keep capital costs down.
In order to maintain or adjust the capital structure, the Group can issue new shares or sell assets to reduce liabilities.
Similarly to other companies in the industry, the Group assesses capital on the basis of the debt/equity ratio. This key ratio is calculated as a net debt divided by shareholders’ equity. Net debt is calculated as total borrowing (including the items Current Borrowings and Non-current Borrowings in the consolidated balance sheet) less cash and cash equivalents.
Debt/equity ratio as of 31 December was as follows:2018 2017
Total borrowings 210,328 204,216
Less cash and cash equivalents –51,898 –44,675
Net debt 158,430 159,541
Total equity 25,311 41,969
Debt/equity ratio 626% 380%

25Bluefish Annual Report 2018
2018Goods for
the period Tenders Direct sales to customers Traditional sales Total revenue
Nordic regionNorthern
EuropeSouthern
Europe Nordic regionNorthern
EuropeSouthern
EuropeRest of the
worldNorthern
EuropeSouthern
Europe
Revenue per geographic market 65,931 56,406 99,099 13,859 28,533 972 4,549 82,962 4,922 357,233Revenue from external customers 65,931 56,406 99,099 13,859 28,533 972 4,549 82,962 4,922 357,233When revenue is recognised
At one point in time 65,931 56,406 99,099 13,859 28,533 972 4,549 82,962 4,922 357,233
Over time – – – – – – – – – –
65,931 56,406 99,099 13,859 28,533 972 4,549 82,962 4,922 357,233
2017Goods for the period Tenders Direct sales to customers Traditional sales Total revenue
Nordic regionNorthern
EuropeSouthern
Europe Nordic regionNorthern
EuropeSouthern
EuropeRest of the
worldNorthern
EuropeSouthern
Europe
Revenue per geographic market 60,499 49,308 105,442 9,965 25,786 3,384 3,365 62,871 8,588 329,208Revenue from external customers 60,499 49,308 105,442 9,965 25,786 3,384 3,365 62,871 8,588 329,208When revenue is recognised –
At one point in time 60,499 49,308 105,442 9,965 25,786 3,384 3,365 62,871 8,588 329,208
Over time – – – – – – – – – –
60,499 49,308 105,442 9,965 25,786 3,384 3,365 62,871 8,588 329,208
Parent Company 2018
Goods for the period Tenders Direct sales to customers Traditional sales Total revenue
Nordic regionNorthern
EuropeSouthern
Europe Nordic regionNorthern
EuropeSouthern
EuropeRest of the
worldNorthern
EuropeSouthern
Europe
Revenue per geographic market 65,931 53,644 85,567 13,859 28,533 972 4,549 67,428 4,515 324,997Revenue from external customers 65,931 53,644 85,567 13,859 28,533 972 4,549 67,428 4,515 324,997When revenue is recognised –
At one point in time 65,931 53,644 85,567 13,859 28,533 972 4,549 67,428 4,515 324,997
Over time – – – – – – – – – –
65,931 53,644 85,567 13,859 28,533 972 4,549 67,428 4,515 324,997
2017Goods for the period Tenders Direct sales to customers Traditional sales Total revenue
Nordic regionNorthern
EuropeSouthern
Europe Nordic regionNorthern
EuropeSouthern
EuropeRest of the
worldNorthern
EuropeSouthern
Europe
Revenue per geographic market 60,499 43,763 96,438 9,965 25,786 3,384 865 60,382 7,700 308,781Revenue from external customers 60,499 43,763 96,438 9,965 25,786 3,384 865 60,382 7,700 308,781When revenue is recognised
At one point in time 60,499 43,763 96,438 9,965 25,786 3,384 865 60,382 7,700 308,781
Over time – – – – – – – – – –
60,499 43,763 96,438 9,965 25,786 3,384 865 60,382 7,700 308,781
Note4 Revenue from contracts with customers
Net sales are distributed across geographic markets as follows:
Significant estimates and assessments Bluefish Pharmaceutical obtains its revenue via the sale of goods in a particular period, tenders, direct sales to customers or through traditional sales.
The company's gross sales consist of the number of packaging units delivered during a specific period at the price prevailing on the relevant market.
According to the practice within the pharmaceuticals industry, gross sales are affected by various deductions, which include discounts and deductions for public authorities, wholesalers, and health insurance companies, as well as returns. These deductions represent
assessments of the related obligations which, in turn, require the company to make esti-mates regarding the effect on sales for particular reporting period. Consequently, when re-porting net sales, a deduction from gross sales is made for these estimates. The assessment of the need for such deductions is made in conjunction with each individual transaction.
Normally, there is a time delay of several months from the point in time at which the esti-mate of the deduction is made and the final reporting of the obligation. Net sales represents, in turn, our best estimate of the revenue that will be received.

26 Bluefish Annual Report 2018
Group 2018 2017
Nordic region 79,790 70,465
Southern Europe 105,547 115,693
Northern Europe 167,347 139,685
Rest of the world 4,549 3,365
Total 357,233 329,208
Parent Company 2018 2017
Nordic region 79,790 70,465
Southern Europe 97,805 107,522
Northern Europe 157,326 129,929
Rest of the world 4,549 865
Total 339,470 308,781
The geographic market of net sales is determined by the location of customers.
Note5 Geographic distribution of net sales
Group 2018 2017
Remuneration to auditors
EY
Audit engagement1) 763 542
Audit services other than audit engagement 206 78
Tax advice 85 34
Total 1,054 654
Other auditors
Audit engagement1) 205 126Auditing work other than audit engagement 34 17
Tax advice 52 103
Total 291 246
Total 1,345 900
Parent Company 2018 2017
Remuneration to auditors
EY
Audit engagement1) 763 476
Audit services other than audit engagement 206 78
Tax advice 85 34
Total 1,054 588
1) Audit engagement refers to fees for the statutory audit, i.e. such work as is necessary for the issuance of an auditor's report, as well as audit advice provided in connection with the audit engagement.
Net sales are distributed across geographic markets as follows:
Deductions for discounts, price adjustments and returnsDiscounts arise when the Group has an agreement with an indirect customer, such as a pur-chasing organisation or health insurance company, to sell products at a price which is lower than the price invoiced to the wholesaler. The discount represents the difference between the invoiced price to the wholesaler and the contracted price to the indirect customer. The company reports such discounts by reducing gross sales by an amount which corresponds to our estimate of the discount which is related to a particular sale. Reserves for estimated discounts are calculated by using a combination of factors, including the terms and conditions of each individual contract, historical experience, and expected product growth.
When reducing the price of a product, we offer the customer compensation for the differ-ence in price for the customer’s existing inventory for the product in question. The estimate of such compensation is determined at the time of the price change and is based on estimated inventory levels for the product.
When a product is sold on the wholesale market where the customer is entitled to return products, a reserve is booked for estimated returns which is based on anticipated changes in market conditions and the remaining time until the product’s expiration date.
On certain markets, the company offers cash discounts in order to encourage customers to pay on time. Reserves are made for cash discounts at the time of invoicing and a corre-sponding deduction is made from gross sales.
The company adjusts the reserves for deductions from gross sales on a regular basis in order to reflect the fair values. In order to evaluate the sufficiency of the reserves, the compa-ny uses internal and external estimates of inventory levels, actual discount factors received, and the time delay from sales of goods to the time such discount invoices are received.
Revenue recognition has not been impacted with the transition to IFRS 15.
Note4 Revenue from contracts with customers (cont.) Note6 Remuneration to auditors

27Bluefish Annual Report 2018
Average number of employees
Group 2018 2017
Average number of employees Of which men
Average number of employees Of which men
Sweden 29 34% 29 38%
France 2 100% 3 100%
Portugal 4 56% 2 57%
Spain 1 0% 3 28%
India 69 65% 71 66%
Germany 4 0% 4 0%
Poland 8 36% 7 48%
Ireland 2 100% 1 100%
Austria 2 50% – 100%United Arab Emirates – – 2 55%
Total 122 54% 121 55%
Parent Com-pany 2018 2017
Average number of employees Of which men
Average number of employees Of which men
Sweden 34 34% 29 38%
France 2 100% 3 100%
Total 36 37% 32 43%
Salaries, other remuneration, and payroll overhead
2018 2017
Salaries and remuneration
Payroll overhead
Salaries and remuneration
Payroll overhead
Parent Company 19,108 9,065 16,886 8,002
(of which pension expenses)1) (2,329) (1,775)
Subsidiaries 22,469 2,242 22,804 1,580
(of which pension expenses)1) (0) (0)
Total Group 41,577 11,307 39,690 9,582
(of which pension expenses)1) (2,329) (1,775)
1) Of the Group’s and Parent Company’s pension expenses, SEK 304 (313) thousand relates to the Group's Board of Directors and CEO. The Group’s outstanding pension obligations to these individuals amounts to SEK 304 (313) thousand.
The Group has only defined contribution pension plans. Pension expenses relate to the cost which affects the earnings for the year.
Salaries and other remuneration by country and between Board members, etc., and other employees
Parent Company 2018 2017
Board of Direc-tors
And CEOOther employ-
ees
Board of Direc-tors
And CEO Other employ-
ees
Sweden 986 17,101 1,791 14,071
Other countries – 1,021 – 1,024
Total Parent Company 986 18,122 1,791 15,095
Subsidiaries 2017 2016
Board of Direc-tors
And CEOOther employ-
ees
Board of Direc-tors
And CEOOther employ-
ees
India 1,757 9,324 1,035 11,230
United Arab Emirates – – 472 2,231
Other countries – 11,388 – 7,836
Total subsidiaries 1,757 20,712 1,507 21,297
Total Group 2,743 38,834 3,298 36,392
Note7 Employees and employee benefit expenses

28 Bluefish Annual Report 2018
Remuneration and other benefits to the Board, CEO and other senior executives
2018Basic salary/ Directors’ fee Other benefits1) Pension expenses Total
Board Chairman, Gerald Engström – – – –
Director, Nivedan Bharadwaj – – – –
Director, Erika Kjellberg Eriksson – – – –
Director, Karl Karlsson – – – –
CEO, Berit Lindholm 1,844 595 304 2,743
Other senior executives 7,549 – 368 7,917
Total 9,393 595 672 10,660
If the company gives notice of termination to the CEO, severance pay of 6 months will be granted. If the CEO gives notice of termination, fixed salary will be paid during the 6-month notice period.No bonuses have been paid to management or the Board of Directors.
1) Other benefits include car, rent and schooling
2017Basic salary/ Directors’ fee Other benefits1) Pension expenses Total
Board Chairman, Gerald Engström – – – –
Director, Nivedan Bharadwaj – – – –
Director, Erika Kjellberg Eriksson – – – –
CEO, Karl Karlsson (through 2017-04-15) 436 35 54 525
CEO, Berit Lindholm (as of 2017-04-16) 2,087 739 245 3,071
Other senior executives 6,594 – 105 6,699
Total 9,117 774 404 10,295
If the company gives notice of termination to the CEO, severance pay of 6 months will be granted. If the CEO gives notice of termination, fixed salary will be paid during the 6-month notice period.No bonuses have been paid to management or the Board of Directors.
1) Other benefits include car, rent and schooling
Shareholdings of the Board and senior executives
2018 B shares Holding, % Votes, %
Board Chairman, Gerald Engström1) 32,659,410 40.4% 40.4%
Director, Nivedan Bharadwaj1) – – –
Director, Erika Kjellberg Eriksson1) – – –
Director, Karl Karlsson1) 3,796,427 4.7% 4.7%
CEO, Berit Lindholm – – –
2017 B shares Holding, % Votes, %
Board Chairman, Gerald Engström1) 28,862,983 35.7% 35.7%
Director, Nivedan Bharadwaj1) – – –
Director, Erika Kjellberg Eriksson1) – – –
CEO, Karl Karlsson (through 2017-04-15)1) 7,592,854 9.4% 9.4%
CEO, Berit Lindholm (as of 2017-04-16)1) – – –
Other senior executives – – –
1) Privately or via the company
Gender breakdown in the Board and management
Group 2018 2017
Board of Directors
Men 2 3
Women 2 2
Total 4 5
CEO and senior executives
Men 5 5
Women 2 2
Total 7 7
Note7 Employees and employee benefit expenses (cont.)

29Bluefish Annual Report 2018
Note8 Options plan
Ever since Bluefish Pharmaceuticals started, it has aspired to allow the employees to participate in the future growth of the business, among other things through the possibility of acquiring shares in the Company. The allocation of options is decided by the Board or a committee appointed by the Board, which takes into account factors such as the employee’s performance, position in the Group, and importance for the Group. The aim of the options plan is to create conditions for retaining and recruiting skilled personnel within the Group.
A resolution was adopted at the annual general meeting held on 21 June 2017 regarding the implementation of an incentive plan through the issuance of warrants. As of 31 Decem-ber 2018, 900,000 options have been allocated. The table below shows the three current options plans in the Group. Outstanding employee options as of 31 December 2018:
Series Date of issue Final exercise date Exercise price options Total plan Outstanding optionsThe number of shares can be
increased by
2018:1 2018-08-20 2021-06-30 7.00 2,000,000 900,000 900,000
Option plan 2018-2021At a General Meeting held on 21 June 2017 it was decided to introduce an international options plan for the Group’s employees. Under the options plan, people closely affiliated with the Group may be allocated options which entitle the holder to acquire shares in Bluefish Pharmaceuticals AB.
The options are allocated with an exercise price equivalent to the assessed market value of Bluefish Pharmaceuticals’ shares at the time of issue. The options may be exercised as of the date of registration with the Swedish Companies Registration Office through 30 June 2021.
As of 31 December 2018, the company’s employees had been allocated 900,000 options, which corresponds to 900,000 Class B shares in accordance with the options plan.
Options 2018 2017
Outstanding as of 1 January – –
Allocated during the period 900,000 –
Exercised during the period – –
Returned during the period – –
Outstanding as of 31 December 900,000 –
Exercisable as of 31 December 900,000 –
Valuation parametersFor employees who have received options in exchange for payment amounting to less than the fair value, the difference (between the amount paid and fair value at the time of alloca-tion) is expensed to the service that entitles employees to allocation of options.
The value of employee service attributable to the fair value of the allocated options has been reported in the income statement for SEK 0 (0).
The fair value of allocated options is assessed on the date of allocation using a binomial model which takes into account the terms of the allocation.
The following table shows the input data used in the model on the issue date for each programme.
Issue date, option plan 2018-2021
Anticipated volatility (%) 30
Weighted risk-free rate (%) –0.4
The option’s exercise price (SEK) 7
Anticipated term of the option (years) 3
Fair value of the option (SEK) 0.05
Group 2018 2017
Costs of goods sold 175,944 182,651
Other external expenses 98,407 89,940
Employee benefit expenses 55,426 54,966 Depreciation/amortisation and impairment loss on property, plant and equipment and intangible assets 27,785 31,030
Total 357,562 358,587
Parent Company 2018 2017
Costs of goods sold 177,453 180,629
Other external expenses 115,586 115,635
Employee benefit expenses 29,366 27,228 Depreciation/amortisation and impairment loss on property, plant and equipment and intangible assets 26,252 29,489
Total 348,657 352,981
Note9 Allocation of costs by by nature of expense

30 Bluefish Annual Report 2018
Group 2018 2017
Depreciation, amortisation and impairment by type of asset:
Licences 3,674 6,283
Pharmaceutical approvals 17,646 21,004
Development projects 2,331 –
Completed development projects 492 –
Other intangible assets 928 984
Equipment and computers 2,716 2,759
Total 27,787 31,030
Depreciation, amortisation and impairment by function:
Selling expenses 624 622
Administration costs 985 578
Development costs 26,178 29,830
Total 27,787 31,030
Parent Company 2018 2017
Depreciation, amortisation and impairment by type of asset:
Licences 3,674 5,198
Pharmaceutical approvals 18,206 22,633
Development projects 2,331 –
Completed development projects 492 –
Other intangible assets 928 984
Equipment and computers 622 674
Total 26,253 29,489
Depreciation, amortisation and impairment by function:
Selling expenses 248 388
Administration costs 728 343
Development costs 25,277 28,758
Total 26,253 29,489
Note10Depreciation/amortisation and impairment loss on property, plant and equipment and intangible assets
Group 2018 2017
Within 1 year 5,439 3,554
Between 2 and 5 years 13,631 14,732
More than 5 years 0 0
Total 19,070 18,286
Parent Company 2018 2017
Within 1 year 1,750 1,750
Between 2 and 5 years 5,104 6,854
More than 5 years 0 0
Total 6,854 8,604
IFRS 16 will be applied as of 1 January 2019. The transition will be implemented with application of the simplified approach. With the transition to IFRS 16, the exemption has been applied, which means that short-term inventory and inventory with a low value have not been recognised.
The Group leases offices as part of an non-cancellable operating lease. The leasing period is 3-7 years. Notice of termination must be made at least 1-9 months before the contractual end date. Otherwise, the agreement is extend for a period of 3 years at a time. The Group also has several leased vehicles, where the lease period is 3 years.
Leasing costs for 2018 amounted to SEK 5,413 (3,224) thousand.Future total minimum lease fees for non-cancellable operating leases are as fol-
lows:
Note11 Leasing
Of the total operating expenses for the financial year, 9 (7)% was purchases from Group companies.
Of the total net sales for the financial year, 62 (63)% was sales to Group companies.
Group 2018 2017
Interest income on current bank deposits 661 494
Exchange gains 282 106
Other financial income 3,581 –
Total 4,524 600
Parent Company 2018 2017
Intra-Group interest income 97 –
Exchange gains 282 106
Other financial income 3,581 –
Total 3,960 106
Note12 Purchases and sales within the Group
Note13 Financial income

31Bluefish Annual Report 2018
Group 2018 2017
Interest expenses
Bank loans 3,512 3,587
Convertible debt (note 22) 9,225 5,503
Discounted interest, convertible debt 3,828 1,913
Other interest expenses 453 407
Other financial expenses 1,384 269
Currency –94 –177
Total 18,308 11,502
Parent Company 2018 2017
Interest expenses
Bank loans 3,512 3,587
Convertible debt (note 22) 9,225 5,503
Discounted interest, convertible debt 3,829 1,913
Intra-group interest expenses 1,308 1,287
Other interest expenses 11 17
Other financial expenses 403 490
Waived Group receivable 689 2,631
Total 18,977 15,428
Note14 Financial expenses
Group 2018 2017
Current tax –3,519 –2,530
Deferred tax – –
Total –3,519 –2,530
Current tax
Profit (loss) before tax –13,602 –39,865
Tax under the prevailing tax rate, 22% 2,992 8,771
Effect of foreign tax –167 1,431
Tax effect of:
Non-deductible expenses –4,078 –3,141
Non-taxable income – 270Unrecognised tax assets for loss carryforwards –2,266 –9,861Tax on profit for the year according to the income statement –3,519 –2,530
Parent Company 2018 2017
Current tax – –
Deferred tax – –
Total – –
Current tax
Profit (loss) before tax –23,693 –59,106
Tax under the prevailing tax rate, 22% 5,212 13,003
Tax effect of:
Non-deductible expenses –3,688 –3,142
Non-taxable income – –Unrecognised tax assets for loss carryforwards –1,524 –9,861Tax on profit for the year according to the income statement – –
Note15 Income tax
Of the Group's total loss carryforward, SEK 0 (0) thousand is blocked Group contribution and merger deficit.
Swedish loss carryforwards can be utilised for an unlimited period. Total loss carry-forwards as of the balance sheet date may be utilised in subsequent years.
Deferred tax assets and tax liabilitiesDeferred tax assets and tax liabilities are offset only if there is a legal right to settle the current tax assets and liabilities on a net basis. There are no deferred tax assets and tax liabilities for the financial year.
Temporary differencesTemporary differences occur when there are differences between the carrying amount of assets and liabilities and their tax base. There are no temporary differences for the financial year or the comparison period.
Loss carryforward
Group 2018 2017
Unlimited in time 402,763 395,834
Total 402,763 395,834
Parent Company 2018 2017
Unlimited in time 389,501 382,573
Total 389,501 382,573

32 Bluefish Annual Report 2018
Note16 Earnings per share
Basic earnings per share are calculated by dividing the net profit/loss for the year attributable to the shareholders of the Parent Company by the weighted average of the number of outstanding ordinary shares during the period. To calculate diluted earnings per share, the weighted average number of outstanding ordinary shares is adjusted for the dilutive effect of all potential ordinary shares. The Parent Company has convertible debt that could result in a dilutive effect.
2018 2017
Profit (loss) for the year attributable to the shareholders of the Parent Company –17,121 –42,395
Earnings per share, SEK
Basic –0.21 –0.52
Diluted 1) –0.21 –0.52
Average number of shares, thousands
Basic 80,942 80,942
Convertible debt – –
Diluted 80,942 80,942
1) No impact on earnings per share from dilution has been allowed because it would result in a higher earnings per share.
Note17 Intangible assets
2018-12-31
Group Goodwill Development projectsCompleted
development projects LicencesPharmaceutical
approvals Other intangible assets Total
Opening cost 624 19,095 – 55,947 155,864 11,994 243,524
Acquisitions – 1,608 239 894 9,220 25 11,986
Adjustment to prior-year acquisitions – – – –2,855 – – –2,855
Sales/disposals – – – – – – –
Exchange difference – 165 – – – – 165
Reclassification – –12,528 12,528 – – – –
Closing cost 624 8,340 12,767 53,986 165,084 12,019 252,820
Opening amortisation and impairment –624 –1,084 – –20,632 –60,330 –6,988 –89,658
Amortisation according to plan – – –492 –3,025 –11,845 –928 –16,290 Impairment – –2,331 – –649 –5,801 – –8,781 Sales/disposals – – – – – – –
Closing amortisation and impairment –624 –3,415 –492 –24,306 –77,976 –7,916 –114,729
Carrying amount at end of period – 4,925 12,275 29,680 87,108 4,103 138,091
As of 31 December
Cost 624 8,340 12,767 53,986 165,084 12,019 252,820
Accumulated amortisation and impairment –624 –3,415 –492 –24,306 –77,976 –7,916 –114,729
Carrying amount at end of period – 4,925 12,275 29,680 87,108 4,103 138,091
During the year, SEK 2,774 (7,266) thousand was capitalised for research and development costs. The amount has been reported in drug approvals and development projects. During the year, SEK 14,271 (21,141) thousand was paid in cash for acquisitions of intangible assets.
Impairment loss has also been recognised in cases where the asset's carrying amount exceeds its recoverable amount. The impairment loss is for the corresponding amount of that differ-ence. All impairment losses are immediately recognised in profit or loss. Intangible assets associated with the company's development projects for which development has been discontinued are assessed for impairment at that time and written down to their fair value (which is normally zero). Total impairment losses for licences, pharmaceutical approvals and development projects during the year amounted to SEK 8,781 (13,207) thousand.

33Bluefish Annual Report 2018
Note17 Intangible assets (cont.)
2017-12-31
Group Goodwill Development projects Licences Pharmaceutical approvals Other intangible assets Total
Opening cost 624 18,443 57,065 156,915 10,939 243,986 Acquisitions – 5,077 4,018 10,002 1,055 20,152
Sales/disposals – –4,859 –5,136 –11,053 – –21,048
Exchange difference – 434 – – – 434
Closing cost 624 19,095 55,947 155,864 11,994 243,524
Opening amortisation and impairment –624 –1,084 –19,485 –55,238 –6,003 –82,434
Amortisation according to plan – – –2,847 –11,233 –985 –15,065 Impairment – –4,859 –3,436 –4,912 – –13,207 Sales/disposals – 4,859 5,136 11,053 – 21,048
Closing amortisation and impairment –624 –1,084 –20,632 –60,330 –6,988 –89,658
Carrying amount at end of period – 18,011 35,315 95,534 5,006 153,866
As of 31 December
Cost 624 19,095 55,947 158,897 11,995 246,558
Accumulated amortisation and impairment –624 –1,084 –20,632 –63,363 –6,989 –92,692
Carrying amount at end of period – 18,011 35,315 95,534 5,006 153,866
2018-12-31
Parent Company Development projectsCompleted
development projects LicencesPharmaceutical
approvals Other intangible assets Total
Opening cost 17,323 – 55,946 157,966 10,032 241,267
Acquisitions 1,608 239 894 9,538 25 12,304
Adjustment to prior-year acquisitions – – –2,855 – – –2,855
Sales/disposals – – – – – –
Reclassification –12,528 12,528 – – – –
Closing cost 6,403 12,767 53,985 167,504 10,057 250,716
Opening amortisation and impairment – – –20,631 –63,363 –5,026 –89,021
Amortisation according to plan – –492 –3,025 –12,405 –928 –16,850 Impairment –2,331 – –649 –5,801 – –8,781 Sales/disposals – – – – – –
Closing amortisation and impairment –2,331 –492 –24,305 –81,569 –5,954 –114,652
Carrying amount at end of period 4,072 12,275 29,680 85,934 4,103 136,064
As of 31 December
Cost 6,403 12,767 53,985 167,504 10,057 250,716
Accumulated amortisation and impairment –2,331 –492 –24,305 –81,569 –5,954 –114,652
Carrying amount at end of period 4,072 12,275 29,680 85,934 4,103 136,064
2017-12-31
Parent Company Development projects Licences Pharmaceutical approvals Other intangible assets Total
Opening cost 17,105 57,065 158,402 8,977 241,549
Acquisitions 5,077 4,018 10,616 1,055 20,766
Sales/disposals –4,859 –5,136 –11,053 – –21,048
Closing cost 17,323 55,946 157,966 10,032 241,267
Opening amortisation and impairment – –19,485 –57,727 –4,042 –81,254
Amortisation according to plan – –2,847 –11,777 –984 –15,608 Impairment –4,859 –3,436 –4,912 – –13,207 Sales/disposals 4,859 5,136 11,053 – 21,048
Closing amortisation and impairment – –20,631 –63,363 –5,026 –89,021
Carrying amount at end of period 17,323 35,315 94,602 5,006 152,246
As of 31 December
Cost 17,323 55,946 157,966 10,032 241,267
Accumulated amortisation and impairment – –20,631 –63,363 –5,026 –89,021
Carrying amount at end of period 17,323 35,315 94,602 5,006 152,246

34 Bluefish Annual Report 2018
Note18 Property, plant and equipment
Group 2018-12-31 2017-12-31
Equipment and computers
Opening cost 23,717 23,505
Acquisitions 217 1,036
Sales/disposals –63 –91
Translation difference for the year –34 –733
Closing cost 23,837 23,717
Opening depreciation –15,434 –12,524
Depreciation according to plan –2,716 –2,758
Sales/disposals 17 38
Translation difference for the year –535 –190
Closing depreciation –18,668 –15,434
Carrying amount at end of period 5,169 8,283
Equipment and computers held under finance lease agreements are included at the following amounts: none none
Parent Company 2018-12-31 2017-12-31
Equipment and computers
Opening cost 4,983 4,520
Acquisitions 13 463
Sales/disposals – –
Closing cost 4,996 4,983
Opening depreciation –3,362 –2,688
Depreciation according to plan –622 –674
Sales/disposals – –
Closing depreciation –3,984 –3,362
Carrying amount at end of period 1,012 1,622
Note19 Participations in Group companies
2018-12-31 2017-12-31
Book value at beginning of the year 15,742 18,374
Impairment of shares in subsidiaries –94 –2,632
Shareholder contributions to subsidiaries – –
Book value at year end 15,648 15,742
Impairment of shares in subsidiaries amounted to SEK 0 for the companies that were liquidated during the year (Bluefish Pharma Srl and Bluefish Pharma Holding Ltd).
Subsidiaries Corporate registration number Registered officeShare of equity/
votes (%) Book value 2018 Book value 2017
Bluefish Pharmaceuticals Pvt Ltd U02423KA2006PTC049950 Bangalore, India 100 14,678 14,678
Bluefish Pharma Incentive AB 556731-3704 Stockholm, Sweden 100 100 100
Bluefish Pharma SL B-64813389 Madrid, Spain 100 29 29
Bluefish Pharma GmbH HRB 9827 Griesheim, Germany 100 232 232
Bluefish Pharma GmbH FN32626a Vienna, Austria 100 375 375
Bluefish Pharma sp z o o 142220504 Warsaw, Poland 100 127 127
BFPH Portugal Unipessoal Lda 509426590 Lisbon, Portugal 100 48 48
Bluefish Pharma Holding Ltd C 50712 Sliema, Malta 100 0 0
Bluefish Pharma France Sarl 529 131 245 R.C.S. Paris Paris, France 100 9 9 Bluefish Pharma AB (previously BMM Pharma AB) 556618-5210 Stockholm, Sweden 100 50 50
Bluefish Pharma FZ-LLC 92341 Dubai, United Arab Emirates 100 0 94
Bluefish Pharma Ltd 608058 Dublin, Ireland 100 0 0
Total book value 15,648 15,742

35Bluefish Annual Report 2018
Note20 Other non-current liabilities
Group 2018-12-31 2017-12-31
Opening amount 1,840 1,861
Net change for receivables –370 51
Exchange rate differences for the year –5 –72
Carrying amount at year-end 1,465 1,840
Other non-current receivables primarily consist of rent deposits.
Parent Company 2018-12-31 2017-12-31
Opening amount 94 53
Net change for receivables – 41
Carrying amount at year-end 94 94
Note21 Inventories
Group/Parent Company 2018-12-31 2017-12-31
Finished products 125,506 116,057
Goods in transit 248 9,320
Total 125,754 125,377
Obsolescence reserve amounts to SEK 13,586 (10,371) thousand. Inventory impairment is primarily related to discontinued products and products with
such a short shelf life that they cannot be sold. Impairment loss for the year is SEK 12,396 (13,146) thousand. See Note 30.
Note22 Financial instruments by category
Group 2018-12-31
Financial assets at amortised cost Total
Assets in the balance sheet
Accounts receivable and other receivables 74,024 74,024
Cash and cash equivalents (Note 29) 51,898 51,898
Total 125,922 125,922
2017-12-31
Assets in the balance sheet
Accounts receivable and other receivables 81,253 81,253
Cash and cash equivalents (Note 29) 44,675 44,675
Total 125,928 125,928
Group 2018-12-31
Financial liabilities at amortised cost Total
Liabilities in the balance sheet
Borrowings 210,328 210,328Accounts payables and other liabilities excluding non-financial liabilities 170,307 170,307
Total 380,635 380,635
2017-12-31
Liabilities in the balance sheet
Borrowings 204,216 204,216Accounts payables and other liabilities excluding non-financial liabilities 153,827 153,827
Total 358,043 358,043
Financial instrumentsFinancial instruments are recognised in the balance sheet when the Group becomes party to the instrument's contractual terms. A receivable/claim is reported when the company has performed and a contractual obligation to pay exists for the counterparty. A liability is reported when the counterparty has performed and a contractual obligation to pay exists for the company. The business model upon which the financial asset or liability was obtained, along with the nature of the contractual cash flows are what determines classification. The Group has financial assets and liabilities classified in the categories below:
• Financial assets at amortised cost• Financial liabilities at amortised cost
Purchases and sales of financial assets are recognised on the trade date, which is the date on which the Group commits to purchase or sell the asset. Financial assets are removed from the balance sheet when the right to receive the cash flows generated by the instrument has expired or been transferred and the Group has transferred essentially all of the risks and rewards associated with ownership.
During the financial year and comparison year, the Group did not have any financial instru-ments measured at fair value either through profit or loss or through other comprehensive income. During the comparison year, the Group had financial assets classified as loans and receivables in accordance with IAS 39. They have, in all material respects, been reported in the same way as financial assets at amortised cost in accordance with IFRS 9.

36 Bluefish Annual Report 2018
Note23 Accounts receivable and other receivables
Group 2018-12-31 2017-12-31
Accounts receivable 74,360 81,052
Less: reserve for expected credit losses –2,517 –1,041
Accounts receivable – net 71,843 80,011
Other receivables 15,537 4,561
Total other receivables 15,537 4,561
Total accounts receivable and other receivables 87,380 84,572
Parent Company 2018-12-31 2017-12-31
Accounts receivable 31,716 30,869
Less: reserve for expected credit losses –354 –562
Accounts receivable – net 31,362 30,307
Receivables from Group companies 25,877 23,043
Other receivables 2,153 2,021
Total other receivables 28,030 25,064
Total accounts receivable and other receivables 59,392 55,371
The confirmed bad debt losses for the company during the year amount to SEK 2,796 (0) thousand.
As of 31 December 2018, overdue accounts receivable amounted to SEK 27,021 (29,540) thousand. Of the overdue accounts receivable, SEK 2,517 (1,041) thousand has been set aside as a provision for doubtful debts. Creditworthiness is assessed as good and it has been concluded that no impairment loss needs to be recognised. The overdue receiva-bles pertain to a number of customers who have not previously had any difficulty making payment.
The age analysis of these accounts receivable is set forth below:
Group 2018-12-31 2017-12-31
Less than 30 days 19,176 22,692Older than 30 days 7,845 6,848
27,021 29,540
Parent Company 2018-12-31 2017-12-31
Less than 30 days 12,959 11,007Older than 30 days 3,881 4,721
16,840 15,728
In the Group, overdue invoices as of 31 December 2018 were SEK 27,021 (29,540) thousand. As of 31 January 2019, invoices for a total of SEK 21,563 (13,772) thousand had been paid. The outstanding amount is SEK 5,458 (15,768) thousand.
In the Parent Company, overdue invoices as of 31 December 2018 were SEK 16,840 (15,728) thousand. As of 31 January 2019, invoices for a total of SEK 15,103 (8,687) thousand had been paid. The outstanding amount is SEK 1,737 (7,040) thousand.
The Group has assessed that the creditworthiness of the outstanding claims is high, which is why no additional provision is required beyond what has already been made for individual claims.
Note24 Share capital
According to the articles of association, the Company’s share capital shall be not less than SEK 9,000 thousand and not more than SEK 36,000 thousand. The minimum number of shares is 45,000,000 and the maximum number is 180,000,000. As of 31 December 2018, the Parent Company's share capital was SEK 16,188 thousand. The total number of shares amounts to 80,942,496. As of 31 December 2018, all shares carry 1/10 vote and a quotient value of SEK 0.20.
A shares B shares Total no. shares
As of 31 December 2017 – 80,942,496 80,942,496
As of 31 December 2018 – 80,942,496 80,942,496
Growth trend, share capital
Number of shares (000s) Share capital
1 January 2017 80,942 16,188
New share issue – –
Repayment of convertible debt – –
31 December 2017 80,942 16,188
1 January 2018 80,942 16,188
New share issue – –
Repayment of convertible debt – –
31 December 2018 80,942 16,188

37Bluefish Annual Report 2018
Group 2018-12-31 2017-12-31
Long-term borrowings
Convertible debt 93,697 89,870
Carrying amount 93,697 89,870
Short-term borrowings
Inventory credit 71,645 67,988
Invoice discounting 14,986 16,359
Bank loans 15,000 15,000
Shareholder loan 15,000 15,000
Carrying amount 116,631 114,346
Total carrying amount of borrowings 210,328 204,216
Parent Company 2018-12-31 2017-12-31
Long-term borrowings
Convertible debt 93,697 89,870
Carrying amount 93,697 89,870
Short-term borrowingsInventory credit 71,645 67,987 Invoice discounting 8,194 7,044 Bank loans 15,000 15,000 Shareholder loan 15,000 15,000 Carrying amount 109,839 105,031
Total carrying amount of borrowings 203,536 194,900 Change in borrowings for the year
Group 2018-12-31 2017-12-31
Opening amount 204,216 120,181
Change in inventory credit 3,657 2,531
Change in invoice discounting –1,373 13,236
New convertible debt, net – 88,055
Discounted interest on convertible debt 2,335 1,068
Dissolution of accrued loan fee 1,493 746
Repayment of prior convertible debt – –21,601
Closing amount 210,328 204,216
Parent Company 2018-12-31 2017-12-31
Opening amount 194,900 120,181
Change in inventory credit 3,657 2,530
Change in invoice discounting 1,150 3,921
New convertible debt, net – 88,055
Discounted interest on convertible debt 2,335 1,068
Dissolution of accrued loan fee 1,493 746
Repayment of prior convertible debt – –21,601
Closing amount 203,535 194,900
(a) Convertible debt instrument Convertible debt 2017-2020At the annual general meeting on 21 June 2017, it was decided to issue convertibles for a total amount of at most SEK 100,000,000. The convertibles will have maturity of three (3) years, with an interest rate of nine (9) percent per year. The conversion rate for convertibles will be SEK 9 per share. The maturity period for convertible debt begins upon registration with the Swedish Companies Registration Office and runs through 30 June 2020. If all of the holders of convertibles demand conversion, share capital will increase by at most SEK 2,222,222.22 upon conversion of all the convertibles.
As of 2018-12-31, the total outstanding amount of convertible debt was SEK 93,697 (89,870) thousand.
Note25 Borrowings
Group/Parent Company 2018-12-31 2017-12-31
Opening amount 89,870 21,601
Convertible debt, nominal value – 95,157
Repayment of convertible debt – –21,601
Equity portion – –7,102
Discounted rate 3,828 1,814
Closing amount 93,697 89,870
The fair value of the liability and equity portion was determined at the time of the issuance of the convertible debt. The fair value of the liability portion, including non-current liabilities, has been calculated applying a market interest rate for comparable non-convertible debt. Remaining amounts, which represent the value of the equity portion, are included under Shareholders’ Equity.
The carrying amount on the balance sheet date for the liability portion of the convertible debt is a good approximation of the fair value. The interest expense for convertible debt is calculated as an effective return through use of the effective interest rate of 10-12 % for similar, non-convertible debt regarding the liability portion of the convertible debt.
Inventory credit and invoice discountingSince November 2011, Bluefish has had an agreement with SEB regarding working capital credit designed to meet the company's increased need for working capital. The working capital credit includes SEK 72 million, for which the Nordic inventories have been used as collateral, and an additional SEK 10 million from invoice discounting.
According to the agreement with SEB, the total value of customer invoices is used to pledge up to 80 % of the total customer invoice value for invoices issued to Nordic customers. Nordic region inventory may be pledged for an amount up to 65 % of AIP (Pharmacy Purchase Price).
Bank credit with SEB, pertaining to inventory financing and invoice discounting was reclassified as a current liability with maturity up to 12 months, since this loan is equivalent to a bank overdraft facility. The working capital credit with SEB is a running agreement (with a 3-month notice of termination required from each side) that remains in force as long as inventory is held in the Nordic region and there are Nordic accounts receivable that can be pledged. Although the loan is classified as a current liability, both Bluefish and SEB regard their collaboration as long-term.
Group/Parent Company 2018-12-31 2017-12-31
Inventory credit
Granted inventory credit 72,000 72,000
Utilised inventory credit –71,645 –67,987
Granted, unutilised inventory credit 355 4,013
Invoice discounting
Granted invoice discounting 40,826 39,549
Utilised invoice discounting –14,986 –16,359
Granted, unutilised invoice discounting 25,840 23,190
Total granted, non-utilised facility 26,195 27,203
(c) Bank loans and other loansIn September 2016, the company received a shareholder loan of SEK 15,000 thousand from the company’s two main owners, Färna and Nexttobe, each of whom has loaned the company SEK 7,500 thousand. The loan matures on 31 March 2019 and carries an annual interest rate of 8%. In February, the maturity date was extended to 2020-03-31. Interest will be paid when the loan is repaid.
The company has a bank loan from Nordea for SEK 15,000 thousand, for which Färna Invest has a guarantee commitment. The loan carries annual interest of STIBOR + 1,5% and contractual interest of 0.5% of the loan amount. Renegotiation of the terms is once per year, on 31 December. Compensation of 1% of the loan amount is paid each year to Färna Invest for its guarantee commitment.
The fair value of short-term borrowing is approximately the same as the carrying amount, since the discount rate is insignificant.
See Note 3.

38 Bluefish Annual Report 2018
Note26 Other liabilities, non-current and current
Group 2018-12-31 2017-12-31
Maturity, within one year of balance sheet date 9,935 10,661Maturity, between 1-5 years from balance sheet date 796 3,647
Total 10,731 14,308
Parent Company 2018-12-31 2017-12-31
Maturity, within one year of balance sheet date 9,108 8,960Maturity, between 1-5 years from balance sheet date 796 3,592
Total 9,904 12,552
Liabilities primarily consist of the fees for purchasing licensing rights. Payment for licensing rights takes place upon agreed milestones, usually depending on the process for drug approval.
Note29 Pledged assets and contingent liabilities
Group 2018-12-31 2017-12-31
Pledged assets
Bank guarantees 1,015 1,735
Inventories 26,769 61,856
Accounts receivable 12,160 18,725
Chattel mortgage 30,000 30,000
Total 69,944 112,316
Contingent liabilities none none
Parent Company 2018-12-31 2017-12-31
Pledged assets
Bank guarantees 1,015 1,110
Inventories 26,769 61,856
Accounts receivable 5,368 8,776
Chattel mortgage 30,000 30,000
Total 63,152 101,742
Contingent liabilities none none
The amount of pledged inventory and accounts receivable is based on utilised credit in relation to the assets book value.
Bank guarantees are restricted cash included in cash and cash equivalents.
Note27 Current provisions
Group 2018-12-31 2017-12-31
Provision for net sales deduction 82,801 73,706
Provision for returns – 184
Total 82,801 73,890
Group 2018-12-31 2017-12-31
Opening balance 73,890 84,434
New provision 172,192 149,176
Amount used during the period –164,328 –150,485
Reversal of unutilised amount –1,954 –11,352
Translation difference for the year 3,192 2,117
Closing balance 82,801 73,890
As of 2018-12-31, there were no current provisions in the Parent Company.The company's gross sales consist of the number of packaging units delivered during a
specific period at the price prevailing on the relevant market.According to the practice within the pharmaceuticals industry, gross sales are affected
by various deductions, which include discounts and deductions for public authorities, wholesalers, and health insurance companies, as well as returns. These deductions represent assessments of the related obligations which, in turn, require the company to make estimates regarding the effect on sales for particular reporting period. Consequently, when reporting net sales, a deduction from gross sales is made for these estimates. The assessment of the need for such deductions is made in conjunction with each individual transaction.
Normally, there is a time delay of several months from the point in time at which the esti-mate of the deduction is made and the final reporting of the obligation. Net sales represents, in turn, our best estimate of the revenue that will be received.
See Note 2.
Note28 Accrued expenses and deferred income
Group 2018-12-31 2017-12-31
Accrued employee benefit expenses 2,944 2,477
Accrued interest expenses 4,888 7,544
Provision for price adjustments and penalty fees 558 674
Other accrued expenses 15,065 21,083
Total 23,455 31,778
Parent Company 2018-12-31 2017-12-31
Accrued employee benefit expenses 2,589 2,477
Accrued interest expenses 4,888 7,544
Provision for price adjustments and penalty fees 476 674
Other accrued expenses 9,803 13,446
Total 17,756 24,141

39Bluefish Annual Report 2018
Note30 Supplementary disclosures to the cash flow statements
Group 2018 2017
Adjustment for items not included in cash flowDepreciation/amortisation and impairment of PPE and intangible assets 27,785 31,643
Inventory impairment 12,396 13,236
Impairment of accounts receivable 2,796 –
Profit (loss) from disposal of fixed assets – 53
Change in net sales deduction 5,910 7,194
Unrealised exchange differences 15,862 3,507
Total 64,750 55,633
Parent Company 2018 2017
Adjustment for items not included in cash flowDepreciation/amortisation and impairment of PPE and intangible assets 26,252 29,489
Impairment of receivables – 11,325
Impairment of accounts receivable 1,114 562
Inventory impairment 12,396 13,146
Unrealised exchange differences 12,264 2,835
Total 52,026 57,357
Note31 Events after the balance-sheet date
Extended loan financingThe shareholder loan that was issued in September 2016 with repayment date of 2019-03-31 was extended at the beginning of the year. The new maturity date is 2020-03-31.
The loan has been subordinated against credit granted by SEB, which involves certain restrictions on such things as repayment. Accordingly, it can be classified as equity when the bank assesses compliance with covenants.
Loan termsSEB’s covenant review at 2019-03-31 revealed that the company had deviated from the loan agreement. Having subordinated the shareholder loan as explained in the previous paragraph, the bank has adjusted the terms and approved a deviation from the loan agreement until 2019-06-30.
Balance sheet for liquidation purposes, Parent CompanyThe Board of Directors has prepared a balance sheet for liquidation purposes as of 2019-01-31 for the Parent Company, which shows that equity had fallen below 50% of the registered share capital. Compared to budget, high amounts for depreciation/amortisation and impairment losses have been recorded. Furthermore, in accordance with the transfer rules, the Parent Company is obligated to absorb any losses of the subsidiaries and this has put the Parent Company in a situation where it has been required to prepare a balance sheet for liquidation purposes. The assets in the balance sheet for liquidation purposes have been measured at net realisable value.
New share issueThe Board has made a decision to increase the company’s share capital by, at most, SEK 60 million by issuing at most 30 million shares with preferential rights to shareholders, pending approval by the AGM. The full terms of the issue will be presented no later then two weeks prior to the AGM 2019.
Note32 Transactions with related parties
Transactions between Bluefish Pharmaceuticals AB and its subsidiaries, which are companies closely related to Bluefish Pharmaceuticals AB, have been eliminated in the consolidated financial statements and are not included in this note.
The company has a bank loan of SEK 15 million from Nordea. Färna Invest has provided a guarantee for this loan.
The company also received a shareholder loan of SEK 15,000 thousand from the com-pany’s two main owners, Färna and Nexttobe, each of whom has loaned the company SEK 7,500 thousand.
See Note 7 regarding remuneration to senior executives.Purchases and sales within the Group, see Note 12.
Note33 Appropriation of earnings
Proposed appropriation of the company's earningsThe following earnings are at the disposal of the annual general meeting:
SEK 2018-12-31
Share premium reserve 338,721,253
Retained earnings –348,223,646
Profit (loss) for the year –23,692,545
Total –33,194,938
The Board of Directors and the CEO propose that the unappropriated earnings (loss), SEK –33,194,938 (–10 203 417) are carried forward.
The Board proposes that no dividends are issued for the 2018 financial year.

40 Bluefish Annual Report 2018
The Board of Directors and CEO affirm that the consolidated accounts have been prepared in accordance with the International Financial Reporting Standards (IFRS) as adopted by the EU and that they provide a true and fair view of the Group’s financial
position and results. The annual report has been prepared in accordance with generally accepted accounting principles and provides a fair and true view of the financial position and earnings of the Parent Company.
The Directors’ report for the Group and Parent Company provides a true and fair overview of the Group’s and the Parent Company’s operations, financial position and results and also describes material risks and uncertainties faced by the Parent Company and the
companies that comprise the Group.
The income statements and balance sheets will be presented to the annual general meeting for adoption.
Stockholm, 30 April 2019
Gerald EngströmChairman of the Board
Erika Kjellberg ErikssonDirector
Karl KarlssonDirector
Berit Lindholm CEO
Our audit report was submitted on 30 April 2019
Ernst & Young AB
Anna SvanbergAuthorised Public Accountant

41Bluefish Annual Report 2018
Auditor's reportTo the general meeting of the shareholders of Bluefish Pharmaceuticals
AB (Publ), corporate identity number 556671–9164
Report on the annual accounts and consolidated accountsOpinionsWe have audited the annual accounts and consolidated accounts of Bluefish Pharmaceuticals AB (Publ) for the year 2018. The annual ac-counts and consolidated accounts of the company are included on pages 7-40 in this document.
In our opinion, the annual accounts have been prepared in accord-ance with the Annual Accounts Act and present fairly, in all material respects, the financial position of the parent company as of 31 Decem-ber 2018 and its financial performance and cash flow for the year then ended in accordance with the Annual Accounts Act. The consolidated accounts have been prepared in accordance with the Annual Accounts Act and present fairly, in all material respects, the financial position of the group as of 31 December 2018 and their financial performance and cash flow for the year then ended in accordance with International Financial Reporting Standards (IFRS), as adopted by the EU, and the Annual Accounts Act. The statutory administration report is consistent with the other parts of the annual accounts and consolidated accounts.
We therefore recommend that the general meeting of shareholders adopts the income statement and balance sheet for the parent company and the group.
Basis for opinionsWe conducted our audit in accordance with International Standards on Auditing (ISA) and generally accepted auditing standards in Sweden. Our responsibilities under those standards are further described in the Auditor’s Responsibilities section. We are independent of the parent company and the group in accordance with professional ethics for ac-countants in Sweden and have otherwise fulfilled our ethical responsi-bilities in accordance with these requirements.
We believe that the audit evidence we have obtained is sufficient and appropriate to provide a basis for our opinions.
Other Information than the annual accounts and consolidated accountsThe Board of Directors and the Managing Director are responsible for the other information. The other information comprises pages 1-6 and 43-44 in this document.
Our opinion on the annual accounts and consolidated accounts does not cover this other information and we do not express any form of assurance conclusion regarding this other information.
In connection with our audit of the annual accounts and consoli-dated accounts, our responsibility is to read the information identified above and consider whether the information is materially inconsistent with the annual accounts and consolidated accounts. In this proce-dure we also take into account our knowledge otherwise obtained in the audit and assess whether the information otherwise appears to be materially misstated.
If we, based on the work performed concerning this information, con-clude that there is a material misstatement of this other information, we are required to report that fact. We have nothing to report in this regard.
Responsibilities of the Board of Directors and the Managing DirectorThe Board of Directors and the Managing Director are responsible for the preparation of the annual accounts and consolidated accounts
and that they give a fair presentation in accordance with the Annual Accounts Act and, concerning the consolidated accounts, in accord-ance with IFRS as adopted by the EU. The Board of Directors and the Managing Director are also responsible for such internal control as they determine is necessary to enable the preparation of annual accounts and consolidated accounts that are free from material misstatement, whether due to fraud or error.
In preparing the annual accounts and consolidated accounts, The Board of Directors and the Managing Director are responsible for the assessment of the company’s and the group’s ability to continue as a going concern. They disclose, as applicable, matters related to going concern and using the going concern basis of accounting. The going concern basis of accounting is however not applied if the Board of Directors and the Managing Director intend to liquidate the company, to cease operations, or has no realistic alternative but to do so.
Auditor's responsibilityOur objectives are to obtain reasonable assurance about whether the annual accounts and consolidated accounts as a whole are free from material misstatement, whether due to fraud or error, and to issue an auditor’s report that includes our opinions. Reasonable assurance is a high level of assurance, but is not a guarantee that an audit conducted in accordance with ISAs and generally accepted auditing standards in Sweden will always detect a material misstatement when it exists. Misstatements can arise from fraud or error and are considered material if, individually or in the aggregate, they could reasonably be expected to influence the economic decisions of users taken on the basis of these annual accounts and consolidated accounts.As part of an audit in accordance with ISAs, we exercise professional judgment and maintain professional skepticism throughout the audit. We also: • Identify and assess the risks of material misstatement of the annual
accounts and consolidated accounts, whether due to fraud or error, design and perform audit procedures responsive to those risks, and obtain audit evidence that is sufficient and appropriate to provide a basis for our opinions. The risk of not detecting a material misstate-ment resulting from fraud is higher than for one resulting from error, as fraud may involve collusion, forgery, intentional omissions, misrep-resentations, or the override of internal control.
• Obtain an understanding of the company’s internal control relevant to our audit in order to design audit procedures that are appropriate in the circumstances, but not for the purpose of expressing an opinion on the effectiveness of the company’s internal control.
• Evaluate the appropriateness of accounting policies used and the reasonableness of accounting estimates and related disclosures made by the Board of Directors and the Managing Director.
• Conclude on the appropriateness of the Board of Directors’ and the Managing Director’s use of the going concern basis of accounting in preparing the annual accounts and consolidated accounts. We also draw a conclusion, based on the audit evidence obtained, as to whether any material uncertainty exists related to events or conditions that may cast significant doubt on the company’s and the group’s ability to continue as a going concern. If we conclude that a material uncertainty exists, we are required to draw attention in our auditor’s report to the related disclosures in the annual accounts and consoli-dated accounts or, if such disclosures are inadequate, to modify our opinion about the annual accounts and consolidated accounts. Our
42 Bluefish Annual Report 2018
conclusions are based on the audit evidence obtained up to the date of our auditor’s report. However, future events or conditions may cause a company and a group to cease to continue as a going concern.
• Evaluate the overall presentation, structure and content of the annual accounts and consolidated accounts, including the disclosures, and whether the annual accounts and consolidated accounts represent the underlying transactions and events in a manner that achieves fair presentation.
• Obtain sufficient and appropriate audit evidence regarding the finan-cial information of the entities or business activities within the group to express an opinion on the consolidated accounts. We are responsi-ble for the direction, supervision and performance of the group audit. We remain solely responsible for our opinions.
We must inform the Board of Directors of, among other matters, the planned scope and timing of the audit. We must also inform of signifi-cant audit findings during our audit, including any significant deficien-cies in internal control that we identified.
Report on other legal and regulatory requirementsOpinionsIn addition to our audit of the annual accounts and consolidated accounts, we have also audited the administration of the Board of Directors and the Managing Director of Bluefish Pharmaceuticals AB (Publ) for the year 2018 and the proposed appropriations of the company’s profit or loss.
We recommend to the general meeting of shareholders that the loss be dealt with in accordance with the proposal in the statutory admin-istration report and that the members of the Board of Directors and the Managing Director be discharged from liability for the financial year.
Basis for opinionsWe conducted the audit in accordance with generally accepted auditing standards in Sweden. Our responsibilities under those standards are further described in the Auditor’s Responsibilities section. We are inde-pendent of the parent company and the group in accordance with pro-fessional ethics for accountants in Sweden and have otherwise fulfilled our ethical responsibilities in accordance with these requirements.
We believe that the audit evidence we have obtained is sufficient and appropriate to provide a basis for our opinions.
Responsibilities of the Board of Directors and the Managing DirectorThe Board of Directors is responsible for the proposal for appropriations of the company’s profit or loss. At the proposal of a dividend, this includes an assessment of whether the dividend is justifiable considering the requirements which the company's and the group’s type of operations, size and risks place on the size of the parent company's and the group’s equity, consolidation requirements, liquidity and position in general.
The Board of Directors is responsible for the company’s organization and the administration of the company’s affairs. This includes among other things continuous assessment of the company’s and the group’s financial situation and ensuring that the company's organization is designed so that the accounting, management of assets and the com-pany’s financial affairs otherwise are controlled in a reassuring manner. The Managing Director shall manage the ongoing administration ac-cording to the Board of Directors’ guidelines and instructions and among other matters take measures that are necessary to fulfill the company’s accounting in accordance with law and handle the management of assets in a reassuring manner.
Auditor's responsibilityOur objective concerning the audit of the administration, and thereby our opinion about discharge from liability, is to obtain audit evidence to assess with a reasonable degree of assurance whether any member of the Board of Directors or the Managing Director in any material respect:• has undertaken any action or been guilty of any omission which can
give rise to liability to the company, or• in any other way has acted in contravention of the Companies Act,
the Annual Accounts Act or the Articles of Association.Our objective concerning the audit of the proposed appropriations of the company’s profit or loss, and thereby our opinion about this, is to assess with reasonable degree of assurance whether the proposal is in accordance with the Companies Act.
Reasonable assurance is a high level of assurance, but is not a guar-antee that an audit conducted in accordance with generally accepted auditing standards in Sweden will always detect actions or omissions that can give rise to liability to the company, or that the proposed appropriations of the company’s profit or loss are not in accordance with the Companies Act.
As part of an audit in accordance with generally accepted auditing standards in Sweden, we exercise professional judgment and maintain professional skepticism throughout the audit. The examination of the administration and the proposed appropriations of the company’s profit or loss is based primarily on the audit of the accounts. Additional audit procedures performed are based on our professional judgment with starting point in risk and materiality. This means that we focus the examination on such actions, areas and relationships that are material for the operations and where deviations and violations would have particular importance for the company’s situation. We examine and test decisions undertaken, support for decisions, actions taken and other cir-cumstances that are relevant to our opinion concerning discharge from liability. As a basis for our opinion on the Board of Directors’ proposed appropriations of the company’s profit or loss we examined whether the proposal is in accordance with the Companies Act.
Stockholm 30 April 2019Ernst & Young AB
Anna SvanbergAuthorised Public Accountant

43Bluefish Annual Report 2018
Gross marginOperating profit/loss as a percentage of sales
Gross profit/lossOperating income less cost of goods sold
EBITProfit/loss before financial items and tax (Operat-ing profit/loss)
EBITDAOperating profit/loss before depreciation, am-ortisation and impairment of property, plant and equipment and intangible assets
Equity per shareEquity per share divided by the number of shares
Net sales Gross sales adjusted for discounts, price adjust-ments and returns
Net debtInterest-bearing non-current and current liabilities less cash in bank
Equity ratioEquity divided by total assets
Definitions of key figures

44 Bluefish Annual Report 2018
Information to the shareholders
Future reportsInterim report January-March 15 May 2019Interim report April-June 30 August 2019
Annual general meetingThe annual general meeting will be held on 15 May 2019 at 3 pm at the Company’s offices, Gävlegatan 22, Stockholm.
Shareholders who wish to participate at the annual general meeting must:be entered in the share register maintained by Euroclear Sweden AB on 9 May 2019 and must notify the Company of their participation.
Notification may be by email to [email protected] or regular mail to Bluefish Pharmaceuticals AB, Gävlegatan 22, 113 30 Stockholm.
Mark the envelope "Annual general meeting".Notification may also be given by telephone at +46 8 519 116 00.
NotificationNotification must be received by Bluefish Pharmaceuticals no later than 9 May 2019 and must include the shareholder’s name, personal ID number or corporate identity number, address, telephone number and shareholding. Shareholders who are represented by a proxy must issue a written proxy form for the proxy. If the proxy form is issued by a legal entity, a certified copy of the certificate of registration for the legal entity must be enclosed. Proxy forms and certificates of registration may not be issued earlier than one year prior to the general meeting.
RegistrationIn order to be entitled to participate at the annual general meeting, shareholders whose shares are nominee-registered must request that the shares be temporarily registered in the share register maintained by Euroclear Sweden AB. Re-registration must take place not later than 9 May 2019.
Address
Head office:Bluefish Pharmaceuticals ABCorporate identity number: 556673-9164
Gävlegatan 22113 30 Stockholm
Tel. +46 8 519 116 90Fax. +46 8 519 116 90
Email: [email protected]


