100
Annual Report 2018
Annual Report
2018

Perform
ance Review
Other Inform
ationO
peratio
nal Streng
thsC
orporate Governance
Sustainability R
eviewFinancial S
tatements
Corporate Governance76 Board of Directors profile78 Chairman’s letter79 Board report84 Risk management90 Compliance92 Remuneration report104 Declarations
Financial Statements105 Consolidated financial
statements111 Notes to the consolidated
financial statements164 Parent Company financial
statements169 Notes to the Parent Company
financial statements
Other Information183 Other information184 Independent Auditor’s report192 Shareholder information193 Global reporting initiative index
Operational Strengths24 Our capacities26 OCI Nitrogen28 OCI Beaumont30 Iowa Fertilizer Company (IFCo)32 Natgasoline34 BioMCN36 Sorfert Algérie38 Egyptian Fertilizers Company
(EFC)40 Egypt Basic Industries
Corporation (EBIC)42 Supply chain management
Performance Review04 Our business06 The year at a glance08 Letter to shareholders10 Year in review
Sustainability Review46 Introduction48 Our commitment52 Our communities58 Our employees62 Health & Safety66 Our environment
OCI N.V. is a leading global producer and distributor of natural gas-based products headquartered in the Netherlands. OCI’s production capacity spans three continents and comprises approximately 14 million metric tons per year of nitrogen fertilizers, methanol, diesel exhaust fluid, melamine, and other nitrogen products, serving agricultural and industrial customers around the world.
OCI is listed on Euronext in Amsterdam
www.oci.nl
Other Inform
ationP
erformance R
eviewO
perational Strengths
Corporate G
overnanceS
ustainability Review
Financial Statem
ents
OCI N.V. Annual Report 2018 01

Perform
ance Review
Other Inform
ationO
peratio
nal Streng
thsC
orporate Governance
Sustainability R
eviewFinancial S
tatements
$ Million 2018 2017
Revenue 3,252.5 2,251.5
Gross profit 622.1 320.4
Adjusted EBITDA 937.5 634.3
Adjusted net income (loss) attributable to shareholders 17.1 (27.3)
Earnings/(loss) per share ($) (0.233) (0.495)
Total assets 7,320.0 7,143.6
Total equity 1,477.1 1,418.9
Gross interest-bearing debt 4,580.3 4,677.6
Net debt 4,119.6 4,446.6
Free cash flow 620.4 114.8
Capital expenditures 293.0 147.3
DRIVING BUSINESS VALUE
2018 Adjusted EBITDA
+48%
2018 Revenue
+44%
2018 Free cash flow
+440%
Performance Review
2018 Gross profit
+94%
Other Inform
ationP
erform
ance Review
Operational S
trengthsC
orporate Governance
Sustainability R
eviewFinancial S
tatements
OCI N.V. Annual Report 2018 0302 OCI N.V. Annual Report 2018

Perfo
rmance R
eview
Performance Review
Other Inform
ationO
perational Strengths
Corporate G
overnanceS
ustainability Review
Financial Statem
ents
OUR COMMUNITIES
We are proud to be a trusted corporate citizen dedicated to growing our business responsibly and minimizing our carbon footprint wherever possible.
OUR PEOPLE
We believe our employees are fundamental to our success and are committed to investing in their development.
OUR GLOBAL REACH
We serve agricultural and industrial customers around the world through both our own production and third party traded products.
OUR CORE STRENGTHS
Our people – their expertise, hunger for knowledge and passion to excel. Above all, their loyalty and commitment to OCI.
Our resources – capital resources that enable us to respond faster than our competitors.
Our experience – a tradition of excellence and achievement.
Our entrepreneurial attitude – a strong appetite for investment and diversification to grow our business and create outstanding returns to shareholders.
We aspire to be a leader in our industries providing clean, environmentally sound solutions to our customers
OURBUSINESS
OUR PRODUCTS
We produce anhydrous ammonia, granular urea, CAN, UAN, methanol, melamine and DEF, serving agricultural and industrial customers around the world.
GROUP HIGHLIGHTS
In 2018 our combined group revenue was
$3.3bn
In 2018 we sold
11.2million metric tons
of products to
63countries
Production assets
Warehousing capacity
Distribution / JVs
Sustainability Focus on environmentally sound solutions
Per
form
ance
Bes
t in
clas
s m
argi
ns d
riven
by our competitive strengths Operations
State-of-the-art, well m
aintained and strategically located assets
04 OCI N.V. Annual Report 2018 OCI N.V. Annual Report 2018 05

Perfo
rmance R
eview
Performance Review
Other Inform
ationO
perational Strengths
Corporate G
overnanceS
ustainability Review
Financial Statem
ents
THE YEARAT A GLANCE
Successfully concluded the buyback of our €339 million convertible bond
Established OCI Methanol Marketing to effectively market methanol and biomethanol through a global distribution platform
Both EFC and Sorfert
achieve record production years
Natgasoline ramps up to full production in record time following mechanical completion in April
Established N-7 LLC to extend our sales
and distribution reach throughout
North America
April August
March
May
December
July
June
Acquired 100% of OCI Partners and
delisted the common units from the NYSE
Successful completion of a
well-oversubscribed landmark $1.15 billion
debut bond offering
06 OCI N.V. Annual Report 2018 OCI N.V. Annual Report 2018 07

Perfo
rmance R
eview
Performance Review
Other Inform
ationO
perational Strengths
Corporate G
overnanceS
ustainability Review
Financial Statem
ents
Dear Shareholders,I am pleased that we ended 2018 on a strong note. We achieved record production levels during the year as we continue to ramp up our new plants, resulting in an increase of 27% in own-produced volume sales to 9.4 million metric tons and total sales volumes of 11.2 million metric tons. As a result, we generated strong free cash flow, reduced our net debt by $327 million during the year and made excellent progress on our deleveraging. We are now clearly starting to see the real benefits of our investments in state-of-the-art new facilities.
Maximizing margins through a disciplined commercial strategy
We were also able to capture healthy selling prices through our disciplined commercial strategy. As a company we view selling forward large quantities of nitrogen product to wholesalers during the low season at low prices as value destructive, as it creates an unnecessary overhang in the market when distributors become competitors during the peak season. This is why we have invested heavily in on-site and off-site storage capabilities and retain significant working capital flexibility to weather market fluctuations, thus helping to realize better value for our production facilities.
We believe that this approach, combined with the strategic locations of all our plants, and the strong execution of our operational teams has allowed us to capture the benefits of a rising pricing environment during the second half of the year, maximize netback prices and outperform the industry.
Benefiting from these higher volumes, higher selling prices and improving market conditions, we reported an adjusted EBITDA of $938 million during 2018, representing growth of 48% over the year before.
Reaping the rewards of our growth projects and diversified product offering
We expect our methanol business to grow in 2019 to reach 2.95 million metric tons of proportionate production capacity, and therefore to become one of the largest producers of methanol globally. We achieved a major milestone in June 2018, when Natgasoline successfully started commercial methanol production, marking the completion of OCI’s second major greenfield facility in the United States. The facility reached full utilization shortly after initial start-up and has shown it can run above nameplate capacity. Natgasoline will have its first full year of operations in 2019. In addition, we are finalizing our capacity expansion in the Netherlands, where BioMCN’s second line is due to start up in the spring and we expect to finalize the c.13% methanol capacity increase at OCI Beaumont in the United States in the summer.
We are also excited that our world-scale facility Iowa Fertilizer Company (IFCo), which started first production in 2017, reached record production levels in the fourth quarter of 2018. We expect
higher volumes at IFCo in 2019, and in particular volumes of diesel exhaust fluid (DEF), a high value-added product that is benefiting from fast-growing end markets and year-round demand. We expanded logistical capabilities for DEF meaningfully and added storage facilities in 2018. As a result of this expansion, combined with the establishment of our N-7 joint venture with Dakota Gasification Company earlier in the year, we have already concluded several 2019 contracts totalling more than double the DEF sales volumes achieved in 2018.
Health & safety first
We are proud of our employees for our excellent safety performance during 2018. Five plants achieved zero lost-time injuries and the group’s Lost-Time Injury Rate (LTIR) improved by 33% compared to 2017 despite having several significant turnarounds during 2018. This is the third consecutive year we witness an improvement and continue to achieve one of the best safety records in the industry.
Committed to sustainability
We believe our leading global position gives us the opportunity to encourage sustainable practices in our industries and communities. Our nitrogen fertilizer products will be farmers’ main tool to increase crop yields, and our industrial chemicals play an increasingly important role in developing cleaner fuels.
We endeavour to be a trusted corporate citizen in each of our communities and maintain strong community ties through open dialogue, local employment, and tailored social development programs.
Continuing to create value
We expect our low-cost operations in the US to be a key source of growth in 2019, with tailwinds from fundamentals of our end markets. We are well-positioned to benefit through the unique strategic positioning of our assets in key regions, our globally competitive low-cost asset base and best-in-class free cash flow conversion.
As we continue to ramp up our volumes into 2019 and 2020, we expect additional step-ups in free cash flow, which bodes positively for our deleveraging and future value creation.
Safety First
53%
improvement in groupwide Total Recordable Injury Rates over the last 5 years
Young asset fleet
46%
run-rate production capacity under 5 years old
Our commitment to creating value for our shareholders is absolute
LETTER TOSHAREHOLDERS
Nassef SawirisChief Executive Officer
Record sales volumes
29%
total sales volumes increase
08 OCI N.V. Annual Report 2018 OCI N.V. Annual Report 2018 09

Perfo
rmance R
eview
Performance Review
Other Inform
ationO
perational Strengths
Corporate G
overnanceS
ustainability Review
Financial Statem
ents
YEARIN REVIEW
We generated strong free cash flow during the year and made excellent progress on our deleveraging. We are now clearly starting to see the real benefits of our investments and disciplined commercial approach
Record sales volumes2.5 million metric ton total sales volumes increase in 2018 v. 2017
Diversified product mixDiversified run-rate portfolio mitigates against product and industry seasonality
• Net Ammonia 17%• Urea 24%• CAN 11%• UAN 18%• Methanol 21%
• Melamine 2%
• DEF 7%
Safety firstOur safety record is 75% better than industry average
per
200,
000
man
hour
s
LTIR Employee LRIR
• OCI• Industry average
0.370.08
0.99
0.30
STRATEGIC OBJECTIVES
2018 KEY ACHIEVEMENTS
2019 TARGETS
Operational excellence
• First full year of production at IFCo, which achieved unprecedented production levels of 115% on ammonia in the fourth quarter.
• Both Sorfert and IFCo reaped the benefits of the performance reliability plans implemented during 2017 and 2018.
• Record production volumes achieved at EFC and Sorfert.
• EBIC H2 2018 utilization of 100% following a turnaround in Q2.
• Excellent safety performance achieved across the group with five plants achieving zero lost-time injuries, and a consolidated Lost-Time Injury Rate of 0.08 incidents per 200,000 hours worked, a 33% improvement over 2017.
• Complete planned turnarounds to maximize utilization rates across product portfolio.
• Continue to strive towards achieving no recordable injuries across our plants.
• Continue to invest in best available technology as part of our commitment to be an environmental steward.
Growth projects
• Successful commissioning of Natgasoline, which achieved run-rate production in record time.
• Refurbishment of BioMCN M2 was 93.8% complete as at 31 December 2018.
• IFCo received a permit to take maximum allowable front-end gas feed rate from the previous permit of 110% to 118% of nameplate capacity.
• Completion of add-on production optimization projects, such as OCI Beaumont’s carbon dioxide injection project, which will increase methanol production capacity by approximately 125 thousand tons.
• Commission BioMCN M2.
• We expect IFCo to operate key units above 115% of nameplate capacity this year.
Global commercial strategy
• Focused on optimizing logistics to maximize key market reach.
• Grew our global fertilizer and methanol commercial platforms to respectively include N-7 and OCI Methanol Marketing (OMM).
• Maintained our disciplined sales strategy of limiting selling forward large quantities of product to wholesalers during the low season at low prices, which we view as value destructive.
• Continue our commercial strategy of limiting forward sales.
• Optimize logistics and storage capabilities wherever possible to maximize market reach.
Sustainable fuels
• Introduced bio-methanol production at our US assets as part of our focus on investing in sustainable products.
• More than doubled DEF capacity at IFCo.
• Completed a diesel exhaust fluid pilot program at EFC at the beginning of the year, and obtained relevant ISO and VDA certifications.
• Please refer to our Sustainability Report on pages 44-73.
• Continue investing in products and initiatives to provide cleaner and more sustainable solutions to our customers.
Maximizing free cash flow generation
• Achieved record production volumes and run-rate capacity following completion of our growth capex program, coupled with pricing on upward trajectory, resulting in strong cash flow conversion.
• We remain committed to our financial policy to prioritise the expected strong free cash flows towards deleveraging.
2016
6.1
7.4
Own-produced volumes sold (mt)
9.4
2017 2018 2016
8.2 8.7
11.2
2017 2018
Total volumes sold (mt)
10 OCI N.V. Annual Report 2018 OCI N.V. Annual Report 2018 11 OCI N.V. Annual Report 2018 11

Perfo
rmance R
eview
Performance Review
Other Inform
ationO
perational Strengths
Corporate G
overnanceS
ustainability Review
Financial Statem
ents
Operational excellence
YEARIN REVIEW
2018 Sales
29%
OCI achieved a 29% increase in total sales volumes
‘000 metric tons 2018 2017 %▲
Own product
Ammonia 2,013.1 1,477.8 36%
Urea 2,960.8 2,517.9 18%
Calcium Ammonium Nitrate (CAN) 1,063.8 1,189.3 (11%)
Urea Ammonium Nitrate (UAN) 1,538.4 752.4 104%
Total Fertilizer 7,576.1 5,937.4 28%
Methanol1 1,415.7 1,285.5 10%
Melamine 149.3 152.6 (2%)
Diesel Exhaust Fluid (DEF) 261.0 7.3 nm
Total Industrial Chemicals 1,826.0 1,445.4 26%
Total Own Product Sold 9,402.1 7,382.8 27%
Traded third party
Ammonia 394.4 249.9 58%
Urea 328.1 102.3 221%
UAN 90.1 157.6 (43%)
Methanol 252.1 - nm
Ammonium Sulphate (AS) 673.6 784.1 (14%)
DEF 13.5 - nm
Total Traded Third Party 1,751.8 1,293.9 35%
Total Own Product and Traded Third Party 11,153.9 8,676.7 29%
PRODUCTS
Strong production performance coupled with the first full year of production at IFCo and the start-up of Natgasoline resulted in record sales volumes during 2018
United States
We achieved a major milestone in June, when Natgasoline successfully started commercial methanol production, marking the completion of OCI’s second major greenfield facility in the United States. The facility reached full utilization shortly after initial start-up and ran consistently above nameplate capacity until a fourth quarter shutdown caused by a utilities supply issue that has been resolved.
OCI Beaumont continued to operate steadily, with methanol production meeting the record levels achieved in 2016 following a debottlenecking project that increased the plant’s capacity by approximately 25%. OCI acquired remaining minorities in the facility in July to own 100% of OCI Beaumont.The facility is currently implementing a project to increase methanol production capacity by approximately 13%.
IFCo achieved its first full year of operations in 2018 and implemented several initiatives to increase production rates and streamline logistics. The plant consistently performed at above nameplate capacity throughout the year and reached record production levels of 115% of ammonia nameplate capacity at the end of the year, a result of both optimization work and an increase in its permit to take its maximum allowable front-end gas feed rate from the previous permit of 110% to 118% of nameplate
capacity. At the end of 2018, IFCo received a permit to further increase operating rates on a permanent basis and we expect IFCo to operate key units above 115% of nameplate capacity this year. We expect continued improvement at IFCo in 2019 due to several factors, including consistent production performance, the full effect of the increase in allowable operating rates, and a significant increase in diesel exhaust fluid volumes.
Europe
Both of our Dutch assets underwent large turnarounds during the year. One of OCI Nitrogen’s ammonia lines underwent a planned turnaround from the beginning of May until the end of July, resulting in lower downstream utilization levels during that period. Despite the shutdown and the logistical constraints caused by low water levels in the Rhine river during the fourth quarter, OCI Nitrogen’s CAN and melamine volumes increased by 9% and 27% respectively in the fourth quarter of 2018 compared to the same period last year.
BioMCN underwent a significant turnaround during the third quarter, resulting in lower production levels as compared to its record year in 2017. Both facilities otherwise operated at excellent utilization rates during the year.
North Africa
EFC achieved record production volumes during 2018, with utilization rates exceeding 100% for six months of the year.
EBIC also posted excellent production levels during the year, achieving a utilization rate of 100% in the second half following a four-week planned turnaround in April and May.
Sorfert reaped the benefits of the performance reliability projects implemented during 2017 and 2018, achieving record production volumes during the year and consistently operating at strong utilization rates.
Production assets
Warehousing capacity
Distribution / JVs
12 OCI N.V. Annual Report 2018 OCI N.V. Annual Report 2018 13

Perfo
rmance R
eview
Performance Review
Other Inform
ationO
perational Strengths
Corporate G
overnanceS
ustainability Review
Financial Statem
ents
Focus on ensuring growth projects are on-track
BioMCN M2
The refurbishment of BioMCN’s second methanol plant was 93.8% complete as at 31 December 2018.
Commission the plant to almost double BioMCN’s capacity to 991 thousand tons per year.
2019Actions
2018Progress
YEARIN REVIEWGrowth projects
Natgasoline
Completed construction in April 2018 and ramped up to full utilization shortly in record time.
Natgasoline will achieve its first full year of operations in 2019.
2019Actions
2018Progress
OCI Beaumont
Began implementing a carbon dioxide injection project that is expected to increase methanol production capacity by approximately 125 thousand tons per year.
The expansion is on track for completion in the summer of 2019.
2019Actions
2018Progress 100%
COMPLETE
ONSCHEDULE
93.8%COMPLETE
14 OCI N.V. Annual Report 2018 OCI N.V. Annual Report 2018 15
Perfo
rmance R
eview
Performance Review
Other Inform
ationO
perational Strengths
Corporate G
overnanceS
ustainability Review
Financial Statem
ents
Growing our global supply chain platforms
• Established N-7, a North American marketing joint venture with Dakota Gasification Company (DGC), to market and distribute more than 4.5 million metric tons per year of nitrogen fertilizers, industrial ammonia, and DEF. Adding N-7 to our global supply chain platform extends our reach, product offering, and customer base across the North American market, and facilitates centralized coordination with our other export-focused activities.
• Established OCI Methanol Marketing (OMM) to effectively market methanol and bio-methanol through a global distribution platform that optimizes our trade flows and enhances netback pricing, including through value creative swaps.
Optimizing logistics to maximize key market reach
• IFCo expanded logistical capabilities for DEF significantly by adding new railcars and a newly constructed storage tank, which will support further growth and reliability of supply for a product that is growing in excess of 15% per year in North America.
• Added UAN and methanol warehousing capacity in the United States and enhanced our utilization of truck and rail logistics infrastructure to improve security of supply to our customers.
Maximizing free cash flow generation
• Maintained our disciplined sales strategy of limiting forward sales, which has paid off across our markets and allowed us to capitalize on higher pricing environments. Our industry has been plagued by the practice of selling forward large quantities of product during low seasons, which we see as value destructive. This results in producers making significant commitments that restrict them from fully participating when prices rise. It also allows traders to purchase product at typically seasonally low prices and then become a competitor to producers when the season kicks in.
• Focused on balancing our cost position to maintain a low blended average natural gas cost through a mix of long-term fixed price contracts and hedging of a significant portion of our spot-based gas needs.
Focus on implementing an effective commercial strategy to maximize margins
YEARIN REVIEWGlobal commercial strategy
Focus on maximizing returns
2018
2016 2017 2018 2019 2020 2021
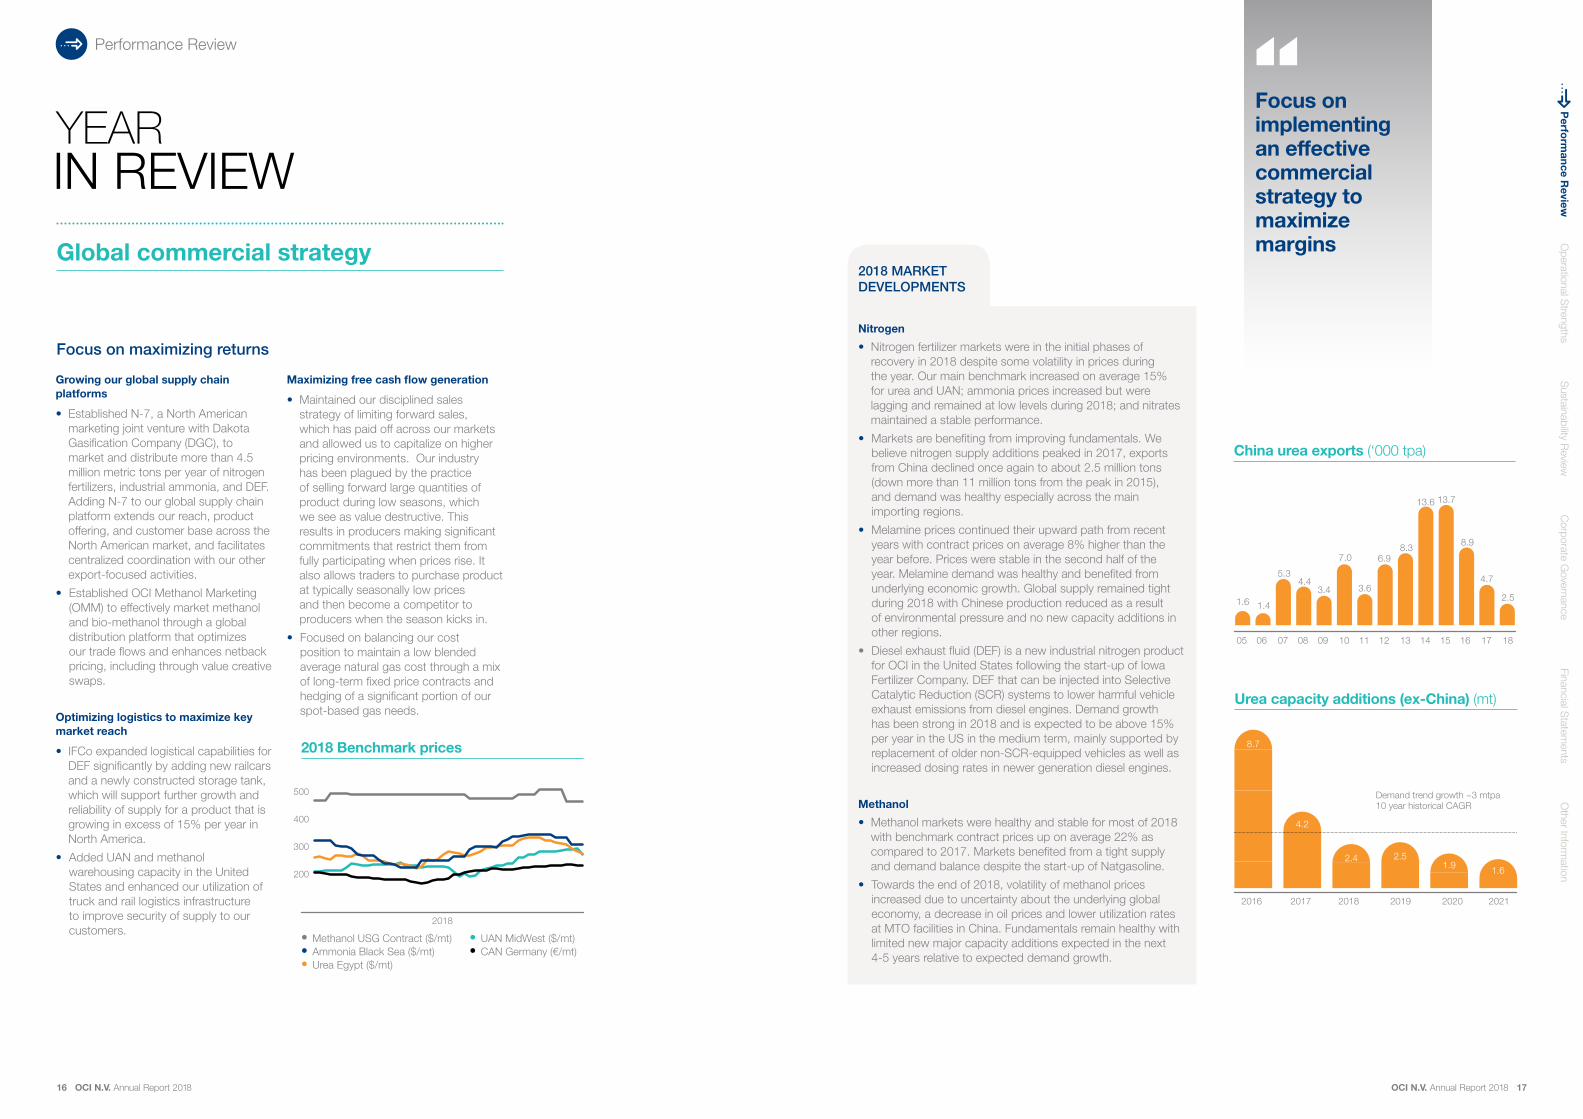
Urea capacity additions (ex-China) (mt)
Demand trend growth ~3 mtpa 10 year historical CAGR
• Methanol USG Contract ($/mt)• Ammonia Black Sea ($/mt) • Urea Egypt ($/mt)
• UAN MidWest ($/mt) • CAN Germany (€/mt)
2018 Benchmark prices
500
400
300
200
Nitrogen
• Nitrogen fertilizer markets were in the initial phases of recovery in 2018 despite some volatility in prices during the year. Our main benchmark increased on average 15% for urea and UAN; ammonia prices increased but were lagging and remained at low levels during 2018; and nitrates maintained a stable performance.
• Markets are benefiting from improving fundamentals. We believe nitrogen supply additions peaked in 2017, exports from China declined once again to about 2.5 million tons (down more than 11 million tons from the peak in 2015), and demand was healthy especially across the main importing regions.
• Melamine prices continued their upward path from recent years with contract prices on average 8% higher than the year before. Prices were stable in the second half of the year. Melamine demand was healthy and benefited from underlying economic growth. Global supply remained tight during 2018 with Chinese production reduced as a result of environmental pressure and no new capacity additions in other regions.
• Diesel exhaust fluid (DEF) is a new industrial nitrogen product for OCI in the United States following the start-up of Iowa Fertilizer Company. DEF that can be injected into Selective Catalytic Reduction (SCR) systems to lower harmful vehicle exhaust emissions from diesel engines. Demand growth has been strong in 2018 and is expected to be above 15% per year in the US in the medium term, mainly supported by replacement of older non-SCR-equipped vehicles as well as increased dosing rates in newer generation diesel engines.
Methanol
• Methanol markets were healthy and stable for most of 2018 with benchmark contract prices up on average 22% as compared to 2017. Markets benefited from a tight supply and demand balance despite the start-up of Natgasoline.
• Towards the end of 2018, volatility of methanol prices increased due to uncertainty about the underlying global economy, a decrease in oil prices and lower utilization rates at MTO facilities in China. Fundamentals remain healthy with limited new major capacity additions expected in the next 4-5 years relative to expected demand growth.
2018 MARKET DEVELOPMENTS
8.7
4.2
2.4 2.51.9 1.6
05 06 07 08 09 10 11 12 13 14 15 16 17 18
China urea exports (‘000 tpa)
1.6 1.4
5.34.4
3.4
7.0
3.6
6.98.3
13.6 13.7
8.9
4.7
2.5
16 OCI N.V. Annual Report 2018 OCI N.V. Annual Report 2018 17

Perfo
rmance R
eview
Performance Review
Other Inform
ationO
perational Strengths
Corporate G
overnanceS
ustainability Review
Financial Statem
ents
YEARIN REVIEWFinancial performance 2018 v
2017PERFORMANCE DRIVERS
Revenue Sales Volumes
• 29% increase total volumes sold reaching a record 11.2 million tons, driven by a 27% increase in own product sales.
• Volumes increased due to the first full year of production at IFCo and the plant’s increased production permit, the start-up of Natgasoline, and record volumes at EFC and Sorfert.
Sales Prices
• General improvement in average pricing for our products as compared to 2017, particularly driven by a 12% improvement in average global benchmark nitrogen fertilizer prices, a 19% improvement in average global methanol prices, and an 8% increase in melamine prices.
Gross profit • Gross profit increased 94% from $320.4 million in 2017 to $622.1 million in 2018.
• Cost of sales increased 36% from $1,931.1 million in 2017 to $2,630.4 million in 2018 due to higher production volumes and higher natural gas costs in the United States and Europe.
• Cost of sales as a percentage of revenue improved from 86% in 2017 to 81% in 2018.
• Average annual Dutch TTF natural gas spot prices increased by 33% to €23.03/MWH, Houston Ship Channel spot prices increased by 5% to $3.12/MMBtu, and Henry Hub spot prices increased by 2% to $3.07/MMBtu.
Adjusted EBITDA Adjusted EBITDA is an Alternative Performance Measure (APM) that intends to give a clear reflection of underlying performance of OCI’s operations. The main APM adjustments in 2018 and 2017 relate to:
• Expenses for expansion projects in 2018 amounted to $5.8 million and are related to the BioMCN expansion project. In 2017, these expenses amounted to $28.0 million and are related to the construction of IFCo until recognition of revenue and depreciation in OCI’s consolidated results began in Q4 2017.
• Adjustments for Sorfert in 2017 and 2018 relate to business interruption caused by the unplanned shutdown of one of Sorfert’s ammonia lines from May to December 2017. The adjustments in 2017 relate to OCI’s best estimate of the loss of profit caused by the shutdown. In December 2018 Sorfert reached the final settlement with the insurance companies. The agreed settlement less an advance payment in Q2 2018 is expected to be received in Q1 2019.
• A change in the unrealized results on natural gas hedge derivatives of $8.8 million in 2018 relate to hedging activities at OCI Beaumont and in the Netherlands.
Employees
2,933In 2018
2018 Revenue split
By Geography
• Europe 47%• North America 40%• Middle East and Africa 6%• Asia 7%
$m 2018 2017
Revenue 3,252.5 2,251.5
Gross Profit 622.1 320.4
Gross profit margin 19.1% 14.2%
Adjusted EBITDA1 937.5 634.3
Adjusted EBITDA margin 28.8% 28.2%
Adj. net income (loss) attributable to shareholders
17.1 (27.3)
Net loss attributable to shareholders (48.7) (103.6)
Basic earnings per share ($/share) (0.233) (0.495)
Operating profit as reported 504.3 148.3
Depreciation and amortization 424.9 330.9
EBITDA 929.2 479.2
EBITDA margin 28.6% 21.3%
APM adjustments for:
Expenses related to expansion projects 5.8 28
Sorfert insurance income/loss of revenue (51.8) 95.5
Unrealised result on natural gas hedging 8.8 0.2
EBIC impact of unavailability of export jetty - 15.4
Other adjustments 6.5 16.0
Natgasoline 44.9 -
Total APM adjustments 8.3 155.1
Adjusted EBITDA 937.5 634.3
1 OCI N.V. uses Alternative Performance Measures (‘APM’) to provide a better understanding of the underlying developments of the performance of the business. The APMs are not defined in IFRS and should be used as supplementary information in conjunction with the most directly comparable IFRS measures. A detailed reconciliation between APM and the most directly comparable IFRS measure can be found in this report.
18 OCI N.V. Annual Report 2018 OCI N.V. Annual Report 2018 19

Perfo
rmance R
eview
Performance Review
Other Inform
ationO
perational Strengths
Corporate G
overnanceS
ustainability Review
Financial Statem
ents
Financial performance
YEARIN REVIEW
Dividend policy
OCI has a flexible dividend policy designed to balance the availability of funds for dividend distribution with pursuing growth opportunities that generate attractive returns. Over the past few years, OCI has pursued two large greenfield projects in the US, which required high capital expenditure. Accordingly, the Board of Directors has not announced a dividend for FY 2018.
2018 v 2017
PERFORMANCE DRIVERS
Selling, general & administrative (SG&A) expenses
• SG&A expenses were $177.6 million in 2018, an increase of 10% compared to $160.9 million in 2017.
• The increase was primarily due higher consultancy and advisory fees related to our debt offerings and plant reliability projects completed during 2018.
• Excluding expenses related to expansion projects, SG&A as a percentage of revenue decreased to 4.8% in 2018 from 6.7% in 2017.
Operating profit • Operating profit was $504.3 million in 2018, a 240% increase from $148.3 million in 2017.
• The increase was primarily driven by the first full year of operations at IFCo, improved margins at OCI Beaumont, and the strong performance of our North African facilities. This was partially offset by higher natural gas prices in Europe.
Finance income and expense
• Finance income decreased 51% from $157.3 million in 2017 to $76.6 million in 2018. This was primarily attributable to a $83.6 million decrease in foreign exchange gains in 2018 to $67.9 million in 2018 compared to $151.5 million in 2017, primarily related to the revaluation of US dollar denominated debt at OCI N.V., which has the euro as its functional currency.
• Finance cost increased 9% from $405.4 million in 2017 to $441.2 million in 2018. The increase was primarily due to a $118.7 million increase in interest expense on financial liabilities measured at amortized cost in 2018 to $340.7 million as compared to $222.0 million in 2017 primarily related to interest expenses at IFCo that are no longer capitalized and debt settlement expenses incurred for refinancing activities, in addition to a $79.8 million decrease in foreign exchange loss to $100.5 million in 2018 compared to $180.3 million in 2017 due.
• Net interest expense amounted to $332.0 million in 2018 as compared to $216.7 million in 2017.
Income Tax • Income tax expense was $9.4 million in 2018 as compared to a $3.1 million gain on income tax in 2017.
• Our net effective tax rate for 2018 was 8.6%, as compared to 2.9% for 2017.
• This was primarily due to an increase in income before tax from $105.9 million loss in 2017 to a $108.9 million profit in 2018.
• Our net effective tax rate is also a result of $66.5 million in income not subject to tax, partially offset by $45.5 million in unrecognized tax assets.
Net Income • Adjusted net income attributable to shareholders was $17.1 million, compared to a loss of $27.3 million in 2017. The main APM adjustments in 2018 and 2017 relate to Natgasoline (costs associated with the construction until start-up), expenses related to refinancing, and non-cash foreign exchange gains or losses on US$ exposure.
Operating profit
$504.3m
In 2018
Adjusted EBITDA
$937.5m
In 2018
$m 2018 2017
Reported net income attributable to shareholders
(48.7) (103.6)
Adjustments for:
Adjustments at EBITDA level 8.3 155.1
Add back: Natgasoline EBITDA adjustment (44.9) -
Expenses related to expansion projects 20.0 9.7
Expenses related to refinancing 31.4 -
Forex gain/loss on USD exposure 34.3 4.9
Recognition of previously unused tax losses BioMCN / Other
3.0 (32.8)
Non-controlling interest adjustment 32.7 (55.0)
Tax effect of adjustments (19.1) (5.6)
Total adjustments at net income level 65.7 76.3
Adjusted net income attributable to shareholders
17.1 (27.3)
20 OCI N.V. Annual Report 2018 OCI N.V. Annual Report 2018 21

Perfo
rmance R
eview
Performance Review
Other Inform
ationO
perational Strengths
Corporate G
overnanceS
ustainability Review
Financial Statem
ents
2018 v 2017
PERFORMANCE DRIVERS
Cash flows from operating activities
• Working capital inflows of $83.1 million in 2018 as compared to outflows of $39.9 million in 2017, a swing of $123.0 million.
• $116.3 million increase in interest paid in 2018 compared to 2017 primarily due to interest expenses relating to IFCo, which were no longer capitalized in 2018.
• The net profit in 2018 of $99.5 million as compared to a loss of $102.8 million in 2017, a swing of $202.3 million.
Cash flows from investing activities
• Dividends from equity-accounted investees of $30.1 million in 2018 compared to $22.6 million in 2017.
• $145.7 million more investments in property, plant and equipment than in 2017, with growth capex mostly for the refurbishment of BioMCN’s second line.
Cash flows from financing activities
• Repayments of and proceeds from borrowings were $2,952.2 million and $3,150.7 million more than in 2017, respectively, due to the group’s large refinancing program including the issuance of OCI’s international bonds.
• Acquisition of non-controlling interest of OCI Partners $117.6 million in 2018.
Free cash flow • Free cash flow increased to $620.4 million in 2018 as compared to $114.8 million in 2017.
• Primarily driven by a higher operational performance, working capital optimization, low maintenance capital expenditure.
Gross debt • $97.3 million decrease in gross debt due to lower revolver drawings and repayments of debts.
Cash & cash Equivalents
• Repayment of loans of $3,241.1 million vs proceeds from loans of $3,290.8 million
• Increase in cash and cash equivalents mainly driven by working capital optimization, and a dividend received from Natgasoline.
Net debt • Net debt stood at $4,119.6 million as at 31 December 2018, from $4,446.6 million as at 31 December 2017.
• Leverage metrics improved with a trailing net debt / adjusted EBITDA of 4.4x at 31 December 2018, down from 7.0x at 31 December 2017.
Financial performance
YEARIN REVIEW
Outlook
We are well-positioned to benefit from improving end markets through the unique strategic positioning of our assets in key regions, our globally competitive low-cost asset base and best-in-class free cash flow conversion.
We expect continued growth in EBITDA and improvement of our leverage metrics in 2019. Net interest and capital expenditures are expected to decrease in 2019, which should contribute positively to our cash flows:
• Interest expense of $340.7 million in 2018 is expected to decrease by $50-70 million in 2019, also benefiting from a 50bps step-down with every half turn in net debt to EBITDA metrics on OCI N.V.’s bank facilities.
• Capital expenditures are expected to be c.$200-220 million, of which around $150-160 million for maintenance capital expenditure and an estimated $50-60 million for growth, including the capacity expansion at OCI Beaumont.
We remain committed to our financial policy to prioritise these expected strong free cash flows towards deleveraging to 2x through the cycle.
$m 2018 2017
Cash and cash equivalents at 1 January 231.0 391.5
Cash flows from operating activities 671.6 181.7
Cash flows from (used in) investing activities (262.9) (146.8)
Cash flows from (used in) financing activities (172.6) (213.6)
Net cash flows (used in) 236.1 (178.7)
Currency translation adjustments (6.4) 18.2
Cash and cash equivalents at 31 December 460.7 231.0
Condensed consolidated statement of cash flows for the years ended 31 December
$m 2018 2017
Long-term interest-bearing debt 4,296.8 3,844.5
Short-term interest-bearing debt 283.5 833.1
Gross interest-bearing debt 4,580.3 4,677.6
Cash and cash equivalents 460.7 231.0
Net debt 4,119.6 4,446.6
Net debt as at 31 December
22 OCI N.V. Annual Report 2018 OCI N.V. Annual Report 2018 23

Perform
ance Review
Other Inform
ationO
peratio
nal Streng
thsC
orporate Governance
Sustainability R
eviewFinancial S
tatements
DELIVERINGRESULTS
Run-Rate Capacities1 (‘000 metric tons)
Plant Country Ownership2Ammonia
GrossAmmonia
Net3 Urea UAN CAN
Total Fertilizer for sale Methanol Melamine4 DEF
Total Fertilizer & Chemicals
for sale
Egyptian Fertilizers Company5
Egypt 100% 876 – 1,648 – – 1,648 – – – 1,648
Egypt Basic Industries Corp.
Egypt 60% 730 730 – – – 730 – – – 730
OCI Nitrogen5 Netherlands 100% 1,184 350 – 730 1,549 2,629 – 219 – 2,849
Sorfert Algérie Algeria 51% 1,606 803 1,259 – – 2,062 – – – 2,062
OCI Beaumont USA 100% 356 356 – – – 356 1,045 – – 1,401
BioMCN Netherlands 100% – – – – – – 991 – – 991
Iowa Fertilizer Company5 USA 100% 914 195 438 1,757 – 2,390 – – 1,019 3,409
Natgasoline USA 50% – – – – – – 1,825 – – 1,825
Total run-rate capacities 5,666 2,434 3,345 2,487 1,549 9,816 3,861 219 1,019 14,915
Natgasoline (913) (913)
Total run-rate capacity for sales attributable to OCI
5,666 2,434 3,345 2,487 1,549 9,816 2,949 219 1,019 14,003
1 Capacities are maximum capacities per line at 365 days. OCI Beaumont’s capacity addition is an estimate of 2,853 tpd x 365 and BioMCN’s M2 capacity is an estimate of 1,250 tpd x 365 days.
2 14.9 mt capacity is not adjusted for OCI’s ownership stakes or downstream product mix limitations (see below). 14.0 mt capacity adjusts for OCI’s 50% stake in Natgasoline only, but does not adjust for the ownership stakes of the entities that OCI consolidates.
3 Net ammonia is estimated sellable capacity.4 Melamine capacity split as 164 ktpa in Geleen and 55 ktpa in China. OCI Nitrogen owns 49% of a Chinese melamine producer, and exclusive right to off-take 90%5 OCI Nitrogen and IFCo each cannot achieve all downstream production simultaneously.
Methanol
5th
largest global methanol producer
Fertilizers
4th
largest global nitrogen fertilizer producer
Melamine
1st
Largest global melamine producer
Operational Strengths
OCI N.V. Annual Report 2018 2524 OCI N.V. Annual Report 2018

Perform
ance Review
Other Inform
ationO
peratio
nal Streng
thsC
orporate Governance
Sustainability R
eviewFinancial S
tatements
World-Class Production Complex
All of OCI Nitrogen’s plants utilize efficient technology from proven global technology providers coupled with proprietary nitric acid and melamine proven technology.
Since our acquisition of the OCI Nitrogen assets from Royal DSM B.V. in 2010, we have fully revamped the facilities through a five-year capital expenditure program launched to upgrade the complex to its current state. As a result of this maintenance and replacement program, OCI Nitrogen is a world-class production complex performing at excellent utilization, reliability and efficiency and emissions rates. OCI Nitrogen consistently ranks amongst the top plants globally in terms of energy efficiency.
The capital investment program also added nearly 500 thousand metric tons of production capacity through various improvement and debottlenecking initiatives of OCI Nitrogen’s CAN, UAN and melamine plants.
Diversified Product Portfolio
As Europe’s second largest integrated nitrates producer and the world’s largest melamine producer, OCI Nitrogen benefits from excellent brand recognition with owned trade names including Nutramon®, Exacote®, and Melafine®. Its diversified product portfolio, which includes ammonia, CAN, UAN and melamine, is fully flexible, allowing us to maximize production of certain swing products depending on global supply and demand.
Strategic Location with Strong Distribution and Logistics
OCI Nitrogen has developed a comprehensive and highly efficient distribution and logistics network through pipeline, road, rail and shipping. The plant has access to both Stein harbor and Rotterdam port, allowing for streamlined import/export activities, security of supply, and links to the seaports of Rotterdam, Terneuzen, Antwerp and Ghent as well as efficient river connections to Belgium, France, Netherlands and Germany. OCI Nitrogen further benefits from having one of the largest rail tank car fleets in Europe, and access to warehousing capacity around the continent.
OCI Nitrogen is Europe’s second largest integrated nitrates fertilizer producer and the world’s largest melamine producer
OCI NITROGEN
Operational Strengths
Ownership
100%
OCI Nitrogen is capable of producing over 2 million metric tons of sellable fertilizer and chemicals products annually through nine interconnected plants located on a fully integrated production site in Geleen, the Netherlands. Our melamine production capacity in Geleen is complemented by a 49% stake in a melamine production facility in China.
Urea ammonium nitrate
0.73million metric tons
Melamine
0.22million metric tons
Anhydrous ammonia
1.18million metric tons
Calcium ammonium nitrate
1.55million metric tons
26 OCI N.V. Annual Report 2018 OCI N.V. Annual Report 2018 2726 OCI N.V. Annual Report 2018 OCI N.V. Annual Report 2018 27
Perform
ance Review
Other Inform
ationO
peratio
nal Streng
thsC
orporate Governance
Sustainability R
eviewFinancial S
tatements
OCI BEAUMONT
World-Class Production Complex
The integrated methanol-ammonia facility uses Lurgi GmbH’s Low Pressure Methanol technology and Haldor Topsøe technology. It is one of the world’s largest merchant methanol producers.
Since acquiring OCI Beaumont in 2011, we have fully rehabilitated the facility and debottlenecked both lines, achieving a 25% increase in ammonia and methanol production capacity. Our investments in the facility have also resulted in reduced energy consumption, the addition of biomethanol production, and greener ammonia and methanol production through the implementation of state-of-the-art Best Available Control Technology (BACT), a pollution control standard mandated by the United States Clean Air Act. We also have multiple over-the-fence industrial gases options, and the shared site provides for utilities redundancy. We are currently implementing a project to increase methanol production capacity by approximately 13%.
Strategic Location on Gulf Coast
OCI Beaumont is strategically located on the Texas Gulf Coast, which provides advantageous access and connectivity to established infrastructure and transportation facilities, including pipeline connections to adjacent customers and port access with dedicated methanol and ammonia export barge docks. OCI Beaumont has connections to one major interstate and three major intrastate natural gas pipelines that provide access to significantly more natural gas supply than the facility requires and flexibility in sourcing natural gas feedstock. OCI Beaumont also has a state-of-the-art ammonia and methanol truck loading facility on-site, providing flexibility to reach customers effectively. The facility also benefits from access to several ammonia and methanol storage tanks.
OCI Beaumont is an integrated methanol and ammonia production facility that is strategically located on the Gulf Coast near Beaumont, Texas.
We are increasing methanol capacity by 125 thousand tons per year
Ownership
100%
Operational Strengths
Methanol
0.91million metric tons
Anhydrous ammonia
0.36million metric tons
28 OCI N.V. Annual Report 2018 OCI N.V. Annual Report 2018 29 OCI N.V. Annual Report 2018 2928 OCI N.V. Annual Report 2018

Perform
ance Review
Other Inform
ationO
peratio
nal Streng
thsC
orporate Governance
Sustainability R
eviewFinancial S
tatements
IFCo has obtained a permit to increase allowable production levels and expects to operate key units above 115% of nameplate capacity
IFCo was first envisioned in November 2011 as part of the Company’s strategic expansion into the United States. IFCo is the first greenfield, world-scale natural gas-based fertilizer plant built in the United States in nearly 30 years.
World-Class Production Complex
IFCo is one of the largest nitrogen fertilizer plants in the United States based on design capacity and utilizes proven state-of-the-art production process technologies from world leaders. IFCo has licensed its ammonia production technology from Kellogg Brown & Root (KBR), a leading supplier of ammonia technology; its urea production technology from Stamicarbon B.V. (Stamicarbon), the world’s largest licensor of urea production technology; and urea granulation, UAN and nitric acid technologies from ThyssenKrupp Uhde. By using premium technology suppliers, IFCo benefits from greater reliability, efficiency and flexibility in the production of nitrogen products.
Diversified Product Portfolio
IFCo’s diversified nitrogen fertilizer product portfolio includes ammonia, granular urea, and UAN, in addition to diesel exhaust fluid, a fuel additive used to lower harmful nitrogen oxide emissions and improve fuel economy. The facility’s design provides significant flexibility in determining the relative production amounts of its various nitrogen products and therefore allows IFCo to maximize production of swing products in response to changes in market dynamics and to maximize netback prices.
Strategic Location with Strong Distribution and Logistics
IFCo is strategically located in southeastern Iowa, adjacent to the Iowa-Illinois border and in the center of the Midwest Corn Belt, the largest market in the United States for direct application nitrogen fertilizer products.
IFCo’s proximity to its core markets allows us to optimize logistics infrastructure with nearby access to truck, rail and barge transportation. With the goal of optimizing logistics infrastructure, IFCo has access to a large fleet of DEF and UAN railcars for use in product delivery, as well as a sizeable storage network for all of its products. IFCo is also able to ship granular urea via rail by nearby transloading facilities at advantaged terms. In addition to truck and rail access, IFCo is located within four miles of the Mississippi River and is able to ship barge urea and UAN to a host of destinations up and down river of the site. IFCo’s physical location in the center of the Midwest Corn Belt provides a strategic location and transportation cost advantage compared to other producers who must ship their products over greater distances to reach our core market. The combination of IFCo’s access to all forms of major transportation options, proximity to customers and storage capacity allows for significant optionality to maximize profitability and commercial reach.
IOWA FERTILIZERCOMPANY (IFCo)
Operational Strengths
Ownership
100%
Urea ammonium nitrate
1.75million metric tons
Granular urea
0.44million metric tons
Anhydrous ammonia
0.91million metric tons
Diesel exhaust fluid
1.02million metric tons
IFCo is a wholly owned nitrogen fertilizer complex in Wever County, Iowa. IFCo began operating in April 2017 and can produce north of 2.5 million metric tons of nitrogen fertilizers and diesel exhaust fluid per year.
30 OCI N.V. Annual Report 2018 OCI N.V. Annual Report 2018 31 OCI N.V. Annual Report 2018 3130 OCI N.V. Annual Report 2018

Perform
ance Review
Other Inform
ationO
peratio
nal Streng
thsC
orporate Governance
Sustainability R
eviewFinancial S
tatements
NATGASOLINE
World-Class Production Complex
Natgasoline is one of the world’s largest methanol production facilities based on nameplate capacity. The facility uses proven state-of-theart Lurgi MegaMethanol® technology and incorporates ‘Best Available Environmental Control Technology (BACT). Located adjacent to OCI Beaumont, Natgasoline has access to multiple over-the-fence industrial gases options, workshops and laboratories and capitalizes on technical support and synergies with OCI Beaumont.
The plant leverages both partners’ significant technical, operational, and sales and marketing experience as leading methanol players as well as their existing relationships both in the domestic market and around the world.
Strategic Location with Strong Distribution and Logistics
Natgasoline is strategically located on the Texas Gulf Coast with access to excellent distribution and logistics infrastructure. The plant is located near six existing natural gas pipelines and receives natural gas from two pipelines that run through the project site. Natgasoline has direct pipeline access to significant methanol storage capacity and an export terminal equipped for the loading of methanol onto both deep-sea marine vessels and barges.
Natgasoline is a world-scale methanol production complex in Beaumont, Texas. OCI and its partner, Consolidated Energy Limited (CEL)/G2X, each own 50% stakes. The plant began operating in June 2018 and can produce 1.83 million metric tons per year.
Operational Strengths
Ownership
50%
Methanol
1.83million metric tons
32 OCI N.V. Annual Report 2018 OCI N.V. Annual Report 2018 33

Perform
ance Review
Other Inform
ationO
peratio
nal Streng
thsC
orporate Governance
Sustainability R
eviewFinancial S
tatements
BIOMCN
Established in 1974, BioMCN owns two methanol plants: M1 and M2. M1 is capable of producing 496 thousand metric tons per year, and is Europe’s fourth largest plant. M2 is under refurbishment, and once operational will make BioMCN Europe’s largest merchant methanol producer.
Bio-methanol Pioneer
BioMCN produces two types of methanol: bio-methanol and regular (also known as grey) methanol. Bio-methanol is produced from biogas sourced from waste digestion plants. BioMCN continuously works to develop innovative renewable methanol manufacturing processes and feedstock sources. This in turn substantially contributes to the global drive to develop greener and more sustainable products.
Strategic Location with Strong Distribution and Logistics
BioMCN is located at the Chemical Park Delfzijl, The Netherlands. The plant site is connected to the national natural gas grid operated by GTS B.V. The GTS grid is connected to the integrated North West European network, supplied by a number of players including GasTerra, Statoil and Gazprom. The plant has easy logistical access to major European end markets via road, rail, barge and sea freight, allowing it to efficiently reach customers across Western Europe.
BioMCN is one of Europe’s largest methanol producers and is the first company in the world to produce and sell industrial quantities of high quality bio-methanol, a second-generation biofuel.
Europe’s largest merchant methanol producer
Ownership
100%
Operational Strengths
Methanol
0.44million metric tons
34 OCI N.V. Annual Report 2018 OCI N.V. Annual Report 2018 35 OCI N.V. Annual Report 2018 3534 OCI N.V. Annual Report 2018

Perform
ance Review
Other Inform
ationO
peratio
nal Streng
thsC
orporate Governance
Sustainability R
eviewFinancial S
tatements
SORFERT ALGÉRIE
World-Class Production Complex
Sorfert is one of the largest integrated nitrogen fertilizer producers in North Africa, capable of producing 1.26 million metric tons of granular urea and 1.6 million metric tons of gross anhydrous ammonia per year. The ammonia capacity is split between two lines, one dedicated to urea production and the other producing merchant capacity. OCI constructed the plant in partnership with Uhde, which supplied the state-of-the-art proven process technology.
Strategic Location with Strong Distribution and Logistics
The plant is strategically located in the Arzew industrial complex in northwest Algeria 35 kilometers east of Oran, near three Algerian ports. Sorfert enjoys access to two export jetties at Arzew Port and Bethioua Port with a direct ammonia pipeline to the port, and exclusive access to urea export logistics. Sorfert’s access to significant storage capacity and flexible infrastructure allows for exports around the world at favorable freight time and cost, coupled with its competitive production costs, maximizes its ability to reach its customers effectively at competitive prices.
As a local Algerian company, Sorfert provided significant employment opportunities during its construction and continues to do so as an operational plant.
Sorfert Algérie is a 51%-owned joint venture between OCI N.V. and Algeria’s state-owned oil and gas authority, Sonatrach.
Sorfert achieved record production levels in 2018
Operational Strengths
Ownership
51%
Anhydrous ammonia
1.60million metric tons
Granular urea
1.26million metric tons
36 OCI N.V. Annual Report 2018 OCI N.V. Annual Report 2018 3736 OCI N.V. Annual Report 2018 OCI N.V. Annual Report 2018 37

Perform
ance Review
Other Inform
ationO
peratio
nal Streng
thsC
orporate Governance
Sustainability R
eviewFinancial S
tatements
World-Class Production Complex
The plant consists of two identical production lines constructed by OCI in 2000 and 2006 in collaboration with Uhde, which supplied the state-of-the-art proven process technology. The facility also includes a 325 thousand metric ton per year urea ammonium nitrate blending unit, which was added onsite in 2010. EFC was fully acquired in 2008.
Strategic Location with Strong Distribution and Logistics
EFC is located at the port of Ain Al Sokhna, Egypt’s deepest port, approximately 55 kilometers south of the Suez Canal at the heart of the global East-West trade route. This gives EFC a freight cost advantage over other Middle Eastern and Asian urea producers as exports from EFC do not pass through the Suez Canal. EFC is also located across the street from Egypt Basic Industries Corporation (EBIC) on the grounds of Suez Industrial Development Company’s (SIDC) industrial park in Ain Sokhna, allowing both facilities to benefit from significant synergies.
The plants benefit from several tie-ins for raw materials and utilities, including water, nitrogen, waste water and CO2. The plants also share workshop facilities and spare parts. Additional tie-in initiatives are assessed and implemented wherever possible. This generates savings in capital expenditure, and allows each plant to depend on the other for backup if required.
EGYPTIAN FERTILIZERSCOMPANY (EFC)
Operational Strengths
EFC has achieved record production levels for the second consecutive year
Ownership
100%
Granular urea
1.65million metric tons
EFC is a 1.65 million metric ton per year granular urea producer in Egypt.
38 OCI N.V. Annual Report 2018 OCI N.V. Annual Report 2018 39 OCI N.V. Annual Report 2018 3938 OCI N.V. Annual Report 2018

Perform
ance Review
Other Inform
ationO
peratio
nal Streng
thsC
orporate Governance
Sustainability R
eviewFinancial S
tatements
World-Class Production Complex
EBIC was constructed by OCI and uses KBR’s latest and commercially proven KBR Advanced Ammonia Process (KAAP) technology. The plant was established in in partnership with KBR, the Egyptian General Petroleum Corporation (EGPC), and a number of private investors. OCI completed construction of the plant in 2009 and increased its stake to 60% from 30% by buying out several minority investors.
Strategic Location with Strong Distribution and Logistics
Located at Sokhna Port, EBIC’s geographic location and logistics infrastructure provide a unique advantage as a cost-effective exporter able to ship volumes both east and west of the Suez Canal.
EBIC owns two refrigerated ammonia storage tanks next to the loading jetty at Sokhna Port, where it also owns and operates a dedicated loading arm. The plant and port facilities are connected through an eight-kilometer pipeline that continuously transports EBIC’s ammonia to both storage tanks located on the jetty, which is able to accommodate vessels with maximum draft of 17 meters.
EBIC is also located across the street from Egyptian Fertilizers Company (EFC) on the grounds of Suez Industrial Development Company’s (SIDC) industrial park in Ain Sokhna, allowing both facilities to benefit from significant synergies.
EBIC’s geographic location and logistics infrastructure provide a unique advantage as a cost-effective exporter able to ship volumes both east and west of the Suez Canal
EGYPT BASIC INDUSTRIESCORPORATION (EBIC)
Operational Strengths
EBIC is a 0.73 million metric ton per year anhydrous ammonia plant.
Ownership
60%
Anhydrous ammonia
0.73million metric tons
40 OCI N.V. Annual Report 2018 OCI N.V. Annual Report 2018 4140 OCI N.V. Annual Report 2018 OCI N.V. Annual Report 2018 41

Perform
ance Review
Other Inform
ationO
peratio
nal Streng
thsC
orporate Governance
Sustainability R
eviewFinancial S
tatements
OCI SUPPLY CHAIN MANAGEMENT
We have a coordinated global sales and marketing organization for our fertilizer products, with hubs in Europe (OCI Fertilizer Trade & Supply), the United States (N-7), the United Arab Emirates (OCI Fertilizer Trading), and Brazil (FITCO OCI Agro). Our methanol sales are centralized through OCI Methanol Marketing (OMM), with offices in Houston, New York, and Delfzijl (NL).
Our strategically developed global distribution network includes branches, agents, and strategic partnerships across Europe, the Middle East, China, and the Americas allows us to effectively reach a diverse customer base across 63 countries in 2018.
Global Distribution Reach
We have developed a strong logistical and distribution advantage as a result of the strategic locations of all our production facilities, which are situated in the heart of high demand regions to maximize netback prices and have access to key distribution infrastructure. Our distribution infrastructure includes a wholly owned ammonia export terminal at the port of Rotterdam, 1.9 million metric tons of owned and leased warehousing capacity across the United States, Europe, and North Africa, 1,582 leased rail cars in the United States and Europe, and a 15 thousand metric ton chartered ammonia vessel. All our production facilities have direct access to key ports and distribution hubs, including port access both east and west of the Suez Canal, and port or harbor access in Europe and the United States.
Our global presence with centralized management allows us to mitigate the effects of regional demand seasonality and maximize freight advantages across locations and product mix.
Through our strategically located trading and distribution operations, we are able to directly reach our customers through a wide-reaching network developed across Europe and the Americas.
Operational Strengths
OCI Global Supply Chain Management
Global
OCI Fertilizer TradingOCI Methanol Marketing
USA
N-7
Latin America
FITCO OCI Agro
Europe
OCI FertilizerTrade & Supply
Global warehousing capacity
1.9million metric tons
Global rail car fleet
1,582number of cars
42 OCI N.V. Annual Report 2018 OCI N.V. Annual Report 2018 43 OCI N.V. Annual Report 2018 4342 OCI N.V. Annual Report 2018

Perform
ance Review
Other Inform
ationO
perational Strengths
Corporate G
overnanceS
ustainability R
eviewFinancial S
tatements
Sustainability ReviewSustainability Review
SUPPORTING COMMUNITIES
Safety
33%
2018 improvement in LTIR
People
9%
2018 increase inwomen employed
Environment
1%
2018 improvement in ammonia GHG intensity
Sustainability Review
44 OCI N.V. Annual Report 2018 OCI N.V. Annual Report 2018 45 OCI N.V. Annual Report 2018 4544 OCI N.V. Annual Report 2018

Perform
ance Review
Other Inform
ationO
perational Strengths
Corporate G
overnanceS
ustainability R
eviewFinancial S
tatements
Sustainability Review
We seek to create a sustainable environment in which we can create value for our communities, our customers, our employees and our shareholders
We believe our position as a leading nitrogen fertilizer and industrial chemicals company gives us the opportunity to encourage sustainable practices in our industries and communities. Our nitrogen fertilizer products will be farmers’ main tool to increase crop yields, and our industrial chemicals portfolio includes methanol, bio-methanol, and diesel exhaust fluid, each of which plays an increasingly important role in developing cleaner fuels.
We endeavor to be a trusted corporate citizen in each of our communities. We maintain strong ties to each community by encouraging open dialogue with local plant management and through our long-standing commitment to being a local employer. We also support the economic and social well-being of our communities through tailored social development programs.
Given the nature of our operations, we maintain a ‘health and safety first’ attitude
at every plant. We invest heavily in the best available technologies to minimize our carbon footprint and develop cleaner products, and aim to achieve zero safety incidences across the group by continuously investing in our employees’ training and development.
We believe in the importance of business transparency and stakeholder engagement as a tool to effect change and sustainably grow our business. We strive to maintain an open dialogue with our stakeholders to ensure our strategy, activities, and policies are implemented responsibly, and aim to nurture our stakeholders’ trust in OCI through our interactions.
In addition to our direct stakeholder interactions, we are an active member of several industry associations where we work with our peers to sustainably improve global standards in our industries, and engage in dialogue on key global challenges related to our industries.
Supporting:
We believe our activities contribute to achieving the following goals, and aim to support additional goals in the future:
Goal
• Our nitrogen fertilizers allow farmers to increase crop yields and improve food quality, resulting in improved food availability and improved diets.
• Community engagement with local charities provides food security at a local level, which helps improve income and access to education.
• Our industrial chemicals, namely methanol, biomethanol, and DEF, are sustainable clean fuel alternatives that can be used to significantly reduce GHG emissions versus conventional fuels.
• Distribution of economic growth ensures the financial wellbeing of employees and the communities in which we operate.
• Good workplace practices as described in our Code of Conduct and other policies promotes a safe and encouraging workplace, diversity, and equal opportunity.
• Nutrient stewardship promotes effective crop yields that improve farmers’ returns.
• We strictly maintain safe, environmentally responsible production sites that protect local environments and ensure safe communities.
• Our investment in maintaining state-of-the-art production facilities, coupled with our GHG targets allows us to minimize our emissions and consequently out impact on climate change.
• Our commitment to educating farmers on nutrient stewardship allows them to maximize yields at optimal fertilizer application. This in turn reduces soil nutrient loss, protects from deforestation, and minimizes runoff to groundwater.
OCI Contribution
We believe in the importance of business transparency and stakeholder engagement
OURCOMMITMENT
In addition to local memberships at the plant level, OCI’s memberships include:
Our commitment to a more sustainable world
46 OCI N.V. Annual Report 2018 OCI N.V. Annual Report 2018 47
Perform
ance Review
Other Inform
ationO
perational Strengths
Corporate G
overnanceS
ustainability R
eviewFinancial S
tatements
Sustainability Review
We are committed to working towards global food security. Through various programs, we work with our customers around the world to maximize yields, strengthen crops, and accelerate growth to meet the world’s rising food demands. We also work to ensure our products are used in a way which safeguards health, occupational and public safety, the environment, and ensures security.
GLOBAL FOOD SECURITY
The world continues to face a significant challenge in ensuring a sustainable supply of food for our burgeoning global population, which is expected to reach 10 billion people by 2050. This is expected to require a doubling of food production levels, all while arable land is projected to decline by 35% by 2050.
With growing populations and declining resources, crop yield optimization through efficient fertilization is imperative to meet our global food needs.
Nutrient stewardship
OCI’s fertilizer products help achieve sustainable agriculture by providing an effective and environmentally sound source of nitrogen, the key nutrient required for crop growth and development. By using nitrogen fertilizers, farmers can:
• grow more food on their land,
• reduce soil nutrient loss and improve soil quality, and
• reduce the need for new farmland to be sequestered, which therefore reduces greenhouse gas (GHG) emissions by limiting deforestation.
Making strides through local programs
Achieving food security by promoting nutrient stewardship
OCI Nitrogen has developed a farmer education program that includes a customer service portal, leaflets and brochures, and two mobile applications. Through these resources, farmers can ensure fertilizer quality is maintained through correct storage, blend products correctly, ensure spreading settings are correct to maximize even fertilization, calculate optimal fertilizer release, accurately track the weather, and receive 24/7 access to the support they need.
OCI Nitrogen also works closely with projects and organizations that encourage sustainable farming, such as the Dutch foundation Veldleeuwerik (Skylark Foundation), the French Institute for Sustainable Agriculture (IAD), Innovatiefonds voor telers (Dutch Innovation Fund for Farmers), Fertilizers Europe, and Responsible Care.
In the United States, we are members of The Fertilizer Institute (TFI), which spearheaded the 4R Nutrient Stewardship program.
Through the TFI, we support the program’s aim to encourage the global implementation of a cropping system that offers enhanced environmental
protection, increased production, increased farmer profitability, and improved sustainability.
RIGHT PLACE
Keep nutrients where crops can
use them
RIGHT TIME
Makes nutrients available when
crops needs them
RIGHT SOURCE
Matches fertilizer type to crop
needs
RIGHT RATE
Matches amount of fertilizer type
crop needs
We work directly with our customers to promote sustainable agriculture and nutrient stewardship.
48 OCI N.V. Annual Report 2018 OCI N.V. Annual Report 2018 4948 OCI N.V. Annual Report 2018

Perform
ance Review
Other Inform
ationO
perational Strengths
Corporate G
overnanceS
ustainability R
eviewFinancial S
tatements
Sustainability ReviewSustainability Review
OURCOMMITMENT
Farmer education
While nitrogen fertilizers offer a sustainable means of maximizing yields, farmer education is essential to ensure nitrogen fertilizer application is optimized for both production and environmental protection. OCI works with farmers around the world through various initiatives to achieve this goal.
Developing more effective fertilizers
We have dedicated resources to develop reliable fertilizers with superior spreading and fertigation properties. Our products are environmentally friendly and provide optimal crop nutrition due to their quality, resulting in lower nitrogen loss and increased crop yields.
Our fertilizers are produced to meet the highest physical quality standards to ensure optimal spreading efficiency, which in turn:
• minimizes yield losses,
• minimizes soil nutrient loss,
• minimizes other impacts on the environment such as water run-off due to optimal fertilizer application
Our granulated products, such as urea and CAN, are perfectly round and robust, making them easy to spread evenly for optimal results. Our aqueous fertilizers, primarily UAN, can be applied with fertigation and crop protection systems.
We have invested in research and technology to develop innovative products, such as Exacote, a range of coated fertilizer blends of urea, CAN and AS specifically formulated for a wide range of crops and nutrient requirements.
Product stewardship
Product stewardship ensures that our products and their raw materials, additives and intermediate products are processed and manufactured, handled, stored, distributed and used in a way which safeguards health, occupational and public safety, the environment, and ensures security.
We use the best available technologies to minimize our carbon footprint, and implement the Product Stewardship guidelines developed by Fertilizers Europe throughout our production processes to monitor and minimize our environmental, health and safety impact from feedstock to farmer.
We comply with international standards as members of the International Fertilizer Association, Fertilizers Europe (formerly EFMA), The Fertilizer Institute (TFI), and the International Methanol Producers & Consumers Association (IMPCA), among others.
Achieving food security by promoting nutrient stewardship
Exacote has a degradable organic polymer coating that is unique to the market and provides many benefits:
Highly efficient
• Reliable polymer coating secures uninterrupted nutrition for up to 2-3 months.
• Well-balanced and stress-free crop development due to predictable nutrient release curve.
• Application of high-efficiency nitrogen fertilizer with added nutrients from CAN and AS results in higher crop yields and lower costs.
Eco-friendly
• Minimized leaching and volatilization of valuable nutrients.
• Organic-based polymer coating that degrades naturally over time.
• Less fertilizer needed to achieve the same results compared to conventional fertilizers.
We promote sustainable agriculture and nutrient stewardship through our supply chain, which begins with sourcing natural gas and ends at our agricultural and industrial customers. We work diligently to ensure every aspect of our business operates optimally, and promote best practices through our Supplier Code of Conduct.
Raw materialsNatural gas and bio-gas sourced from third parties.
Production14 million metric tons of capacity at 8 plants.
Storage1.9 million metric tons of owned and leased storage capacity.
Distribution• Direct pipeline access to key ports,
harbours and customers.
• Dedicated loading arms at each site for each products enable efficient trucking.
• 1,582 Ammonia, UAN and DEF rail tank cars available on-site in NL and USA.
• Access to major European waterways through Stein Harbour and Port of Rotterdam.
• US methanol capacity strategically positioned on US Gulf.
• Port access both east and west of Suez Canal in Egypt and Algeria.
• One chartered 15kt capacity ammonia vessel.
Customers• Agricultural• Industrial
SUPPORTING SUSTAINABLE AGRICULTURE THROUGH A RESPONSIBLE SUPPLY CHAIN
50 OCI N.V. Annual Report 2018 OCI N.V. Annual Report 2018 5150 OCI N.V. Annual Report 2018 OCI N.V. Annual Report 2018 51

Perform
ance Review
Other Inform
ationO
perational Strengths
Corporate G
overnanceS
ustainability R
eviewFinancial S
tatements
Sustainability Review
Economic value generated and distributed by OCI in 2018
We strive to support the economic and social well-being of our communities through strong local community engagement programs and partnerships.
OUR COMMUNITIES
We have invested more than $5 billion in growth and improvement projects in under a decade, which has created thousands of ancillary businesses and job opportunities.
Economic value generated
$3,252.5m
Net sales
Economic value distributed
$2,696.3m
Payments to suppliers, employees, governments, communities and providers of capital
Economic value retained
$556.2m
CAPEX and other investments
Our operations directly and indirectly create significant economic opportunities globally in both developed and developing countries through payments for goods and services, job creation, improved farmer productivity, taxes, research and development, and donations to develop the communities in which we operate.
83%
17%
Training and education
2,650opportunities provided in 2018
STEX Food Bank
270,000meals provided through STEX Food Bank in the last 5 years
52 OCI N.V. Annual Report 2018 OCI N.V. Annual Report 2018 5352 OCI N.V. Annual Report 2018

Perform
ance Review
Other Inform
ationO
perational Strengths
Corporate G
overnanceS
ustainability R
eviewFinancial S
tatements
Sustainability Review
INVESTING IN LOCAL STEM PROGRAMS
Building the Dream
IFCo continued its longstanding support for Southeastern Iowa Community College’s Building the Dream program through a $50,000 donation, part of the plant’s $250,000 pledge made in 2014. This initiative is helping the school build its industrial technologies training centre, health professions centre and make other critical investments to enhance facilities and training programs for students.
EFC and EBIC Summer Internship Program
EFC and EBIC jointly run a summer internship program for university students, welcoming approximately 50-70 students per year on-site to train in a variety of technical and non-technical roles. In 2018, the facilities welcomed 76 interns. Over the last 5 years more than 300 students from a wide range of local Egyptian universities trained on-site.
Girlsday
OCI Nitrogen participated in Girlsday, an initiative by the VHTO (National Expert Organization on Girls/Women and Science/Technology) that aims introduce girls to science, technology and ICT at a young age. This national event takes place annually in April and allows girls to participate in interesting STEM activities and meet female employees who work in STEM fields.
During Girlsday, middle school and high school aged participants were introduced to Engineering and Chemistry through a number of fun and interesting workshops and activities. A total of 150 girls took part, divided over two days.
The girls were hosted by and interacted with female operators, technicians, laboratory technicians, technologists, engineers, and plant managers. In addition to leading the activities, each employee explained her reasons for choosing her respective career path.
Flint Hills Junior Achievement Luncheon
OCI Beaumont engineers participated in the seventh annual engineering job shadow lunch, where they worked with 180 high school freshmen and sophomores to conduct science experiments and watch sponsor-led demonstrations. The event is one of the largest job shadowing events in the area and is designed to spark student interest in engineering as a career path.
Throughout our history, we have invested company resources in educational programs that improve the communities in which we operate. We believe that the key to encouraging tangible improvements in our communities is a high-quality, well-rounded education that promotes critical thinking and entrepreneurship.
Accordingly, all our sites have endowed time and resources into the entire education value chain, from donating school supplies to children in need and rewarding high achievers to funding university scholarships and providing on-site training opportunities. Our local operations have worked hard to encourage students of all ages to pursue an education in fields of science, technology, engineering and mathematics (STEM) through various initiatives. In 2018, 2,650 students and young professionals benefited from the training or education opportunities availed through the programs we participated in.
OURCOMMUNITIESA tailored approach to each community
Investing in Local STEM Programs– Egypt– Iowa– Texas– Netherlands
Investing in Local Healthcare Initiatives– Egypt– Texas– Netherlands
Investing in Local Social Causes– Iowa– Texas– Netherlands
$ 580,000 donated to the
local issues that matter to our communities
in 2018
A tailored approach to each community
We have cultivated local social development programs tailored to the specific needs of each of our communities to maximize the impact of our donations. In addition to our sponsorships and financial contributions to various causes, our employees personally invest their time in our local communities by participating in fundraisers and volunteering at events.
54 OCI N.V. Annual Report 2018 OCI N.V. Annual Report 2018 55 OCI N.V. Annual Report 2018 55 OCI N.V. Annual Report 2018 55

Perform
ance Review
Other Inform
ationO
perational Strengths
Corporate G
overnanceS
ustainability R
eviewFinancial S
tatements
Sustainability Review
OURCOMMUNITIES
INVESTING IN LOCAL HEALTHCARE INITIATIVES
Winter clothing donation to Fort Madison Elementary Schools
IFCo and its employees donated winter coats and other winter clothing items to students attending Richardson Elementary School and Lincoln Elementary School in Fort Madison. As Iowa experiences one of the coldest stretches in recent memory, the company provided the donation to help students stay safe and active throughout the winter months.
Walk to End Lupus Now
OCI Beaumont employees participated in a 5K walk and fundraiser organized by the Lupus Foundation of America Texas Gulf Coast Chapter. All proceeds from the event were donated to lupus research and awareness programs.
Neonatal Care in Alexandria, Egypt
EFC and EBIC regularly donate essential equipment to Alexandria Children’s Hospital, the main paediatric hospital serving Egypt’s North Coast. In 2018, the facilities donated a neonatal artificial ventilator.
Kennedy-Mars
OCI Nitrogen is one of the main sponsors of the Kennedy-Mars in Sittard. Kennedy-Mars is an annual 80 kilometer hike that attracts over 2,500 participants with versions held across the Netherlands.
The Sittard hike is the oldest Kennedy-Mars event and was established in 1963. The hike fits well with OCI Nitrogen’s Vitality campaign, through which the plant encourages its employees to adopt a healthy lifestyle.
In addition to sponsoring the event, several OCI Nitrogen employees participated in the hike.
We have strong ties to local healthcare initiatives that provide necessary physical, mental, and emotional support to our communities. Our plants work with trusted partners focusing on the issues that significantly impact each community, including elderly care centers, cancer treatment and support, essential supplies for the underprivileged, and programs that encourage healthy living.
INVESTING IN LOCAL SOCIAL CAUSES THAT MATTER TO OUR COMMUNITIES
Southeast Iowa Food Pantries
IFCo and its employees once again supported the St. Vincent’s De Paul Food Pantry in Burlington and the Lee County Food Pantry in Fort Madison. Through employee donations and the company’s matching contribution, $10,000 was split between the two organizations to help ensure families throughout the area have access to food and other supplies throughout the year.
Housing Support following Hurricane Harvey
OCI Beaumont continued to support organizations providing essential housing support in the wake of Hurricane Harvey, which devastated communities across Texas in 2017. During 2018, OCI Beaumont contributed more that $ 40,000 to several organizations that either provided housing options to displaced families or helped rebuild homes damaged by the storm.
Leading the Fight Against Hunger in Southeast Texas
One in every four children lives in poverty and about 15% of the elderly in Southeast Texas live in poverty. OCI Beaumont is a strong supporter of the Southeast Texas Food Bank (SETX Food Bank), which works to eliminate hunger and inadequate nutrition in Southeast Texas by providing meals to approximately 12,000 households per month.
Over the last five years, OCI Beaumont has provided approximately 270,000 meals to people in need through the SETX Food Bank, and our employees have invested their time and resources to volunteer at food drives and personally deliver essential foodstuffs.
OCI Lions
OCI Nitrogen has been the main sponsor of the OCI LIONS handball club since the 2011-2012 season. The men’s teams play in the BENE-League and the Dutch premiere league.
The OCI LIONS won the Dutch national championships in 2015, 2016 and 2017, and aim to take their success beyond the Netherlands in the Europa Cup and the BENE-League. OCI Nitrogen’s sponsorship will help them achieve their ambitions.
The OCI LIONS offer OCI Nitrogen significant visibility in its local community. It helps increase name recognition and promotes OCI Nitrogen as an employer. The handball matches also offer good networking possibilities with authorities and local entrepreneurs.
In addition to education and healthcare, our plants pay close attention to the social causes that matter to each community to effectively participate in local development. Such causes include sponsoring local sports teams, music and arts festivals, food banks, toy runs, youth programs, and animal rights.
Sustainability Review
56 OCI N.V. Annual Report 2018 OCI N.V. Annual Report 2018 57 OCI N.V. Annual Report 2018 57 OCI N.V. Annual Report 2018 57

Perform
ance Review
Other Inform
ationO
perational Strengths
Corporate G
overnanceS
ustainability R
eviewFinancial S
tatements
Sustainability Review
A local employer
Our people are fundamental to our success and represent a core tenant of our mission, vision, and values. We strive to create a safe and encouraging workplace where there is mutual trust and respect towards and amongst employees. We promote excellence in every aspect of our operations by investing in our people to foster their development and encourage their passion to excel.
OUR EMPLOYEES
By investing in our people, we are investing in sustainable value creation across OCI
We are proud to have cultivated a strong community focused identity as a local employer with 2,933 employees around the world. We have a commitment to maximize the use of local resources whenever possible by drawing local people into our company and developing their skills, and by choosing local partners where possible to supply materials and other services.
Diversity
Our employment strategy has resulted in a diverse global workforce encompassing 24 nationalities located in ten countries, with diverse ethnicities, religious beliefs, cultures, ages, and other traits working together respectfully and with a shared sense of purpose.
Our Code of Conduct requires all employees to act with honest and integrity to foster a business environment that protects the rights and interests of all stakeholders. Our Code of Conduct also highlights our zero-tolerance policy for any form of harassment or bullying. Employees are required to treat all individuals with respect, tolerance, dignity and without prejudice to create a mutually respectful and positive working environment. We do our utmost to provide employees with a safe environment to address any issue directly with management, and through our
Whistleblowing Policy, we also provide a confidential procedure to raise any concerns, instances of discrimination, and other breaches to our Code of Conduct.
Though we operate in traditionally male-dominated industries, we are working to improve our gender diversity in both technical and non-technical roles and at all levels of our organization. We have made significant strides in recent years, including adding a woman to our Board of Directors in 2016 in line with our Board Diversity Policy. Women as a percentage of total employees increased to 8.8% in 2018 from 8.2% in 2017. We will continue to work towards increasing gender diversity while continuing to hire or promote based on merit.
Fair compensation
We are mindful of the importance of ensuring all employees are fairly compensated and have crafted our local compensation frameworks using each country’s living wage as the baseline. We believe that when an employee can afford their family’s basic needs including discretionary income, they are more motivated to succeed. We consistently rank amongst the top quartile of employers by annual compensation in each of our communities.
In addition to top quartile compensation, we offer employees a range of benefits, including but not limited to health insurance, retirement plans, parental leave, and other non-financial benefits in line with local employment laws.
Wider job creation
As a global developer of world-scale, state-of-the-art greenfield projects, we have a strong track record of wider job creation in our communities. In addition to the permanent jobs created to operate and manage our greenfield facilities, we have created more than 5,000 construction jobs in the United States, 4,500 construction jobs in Egypt, and 2,000 construction jobs in Algeria. Each facility’s positive economic impact extends beyond these jobs because of the ancillary businesses that are established to provide the plant’s operations and employees with services. As an example, IFCo’s presence in Wever County has resulted in more than 700 ancillary jobs that helped revitalize the economy of the surrounding area and have a lasting positive impact on the region.
Nationalities
24Within global workforce
OCI N.V. Annual Report 2018 5958 OCI N.V. Annual Report 201858 OCI N.V. Annual Report 2018 OCI N.V. Annual Report 2018 59

Perform
ance Review
Other Inform
ationO
perational Strengths
Corporate G
overnanceS
ustainability R
eviewFinancial S
tatements
Sustainability Review
OUREMPLOYEESInvesting in our people
We are committed to fostering an environment that encourages individuals to seek opportunities for professional growth and enrichment. We recognize the importance of training and development of new employees, improving the performance of experienced employees, and building future leadership.
To that end, we invest in our employees through training and development programs focused on professional growth and enrichment. Opportunities are tailored to the needs of each employee, and can include on-the-job practical training programs, sponsoring higher education, mentorships and leadership programs for succession planning, and online courses.
Novice program
All fresh graduates from university starting at OCI Nitrogen participate in our Novice program. The objectives of this program are professional and personal development and a strong start in OCI Nitrogen for our potential future managers and directors.
Talent management program
The talent management program identifies and invests in employees in any field and any level with management potential. The objective of the program is to offer talented employees with managerial education, exposure and experience to facilitate and accelerate growth to the next level.
Leadership program
Focusing on senior managers in OCI Nitrogen, the leadership development program helps promote OCI Nitrogen’s mission statement and strategy throughout the company.
Sustainable employability
To enable and stimulate sustainable employability, OCI Nitrogen organizes workshops and training related to mental and physical fitness for the job, taking into account current and future roles. OCI Nitrogen also facilitates regular vitality (medical and lifestyle) check-ups and encourages sport initiatives of employees.
Comprehensive development programs at OCI Nitrogen
OCI Nitrogen has developed a comprehensive training and talent management program that aims to invest in all employees’ professional development.
OCI Nitrogen Awarded “Best Training Company 2018”
On August 28, OCI Nitrogen received the certificate for Best Training Company 2018 in the province of Limburg (Technology and construction sector) from SBB (Cooperation Organisation for Vocational Education, Training and the Labour Market). This award highlight’s OCI’s commitment to employee development, and well positions OCI Nitrogen to attract talent.
Workplace Profile in 2018 Unit 2017 2018
Total Employees # 2,879 2,933
Full-time # 2,832 2,870
Part-time # 47 63
Voluntary turnover rate % 1.9% 1.0%
Women total % 8.2% 8.8%
Woman in Technical roles % 1.6% 1.8%
Woman Non-Technical roles % 6.6% 6.9%
Employee Age Profile
under 25 % 2.6% 1.8%
25-34 % 25.6% 23.5%
35-44 % 37.4% 39.2%
45-54 % 21.2% 22.5%
55-64 % 12.6% 12.3%
65+ % 0.5% 0.6%
Employee training and development $ per employee 1,684 1,727
Employees covered by Collective Bargaining or Unions
% 41.9% 41.4%
Whistleblowing Complaints # 1 4
Employee split by years with OCI
• 0 to 5 years 28%• 6 to 10 years 24%• 11 to 20 years 27%• 21+ years 21%
60 OCI N.V. Annual Report 2018 OCI N.V. Annual Report 2018 61
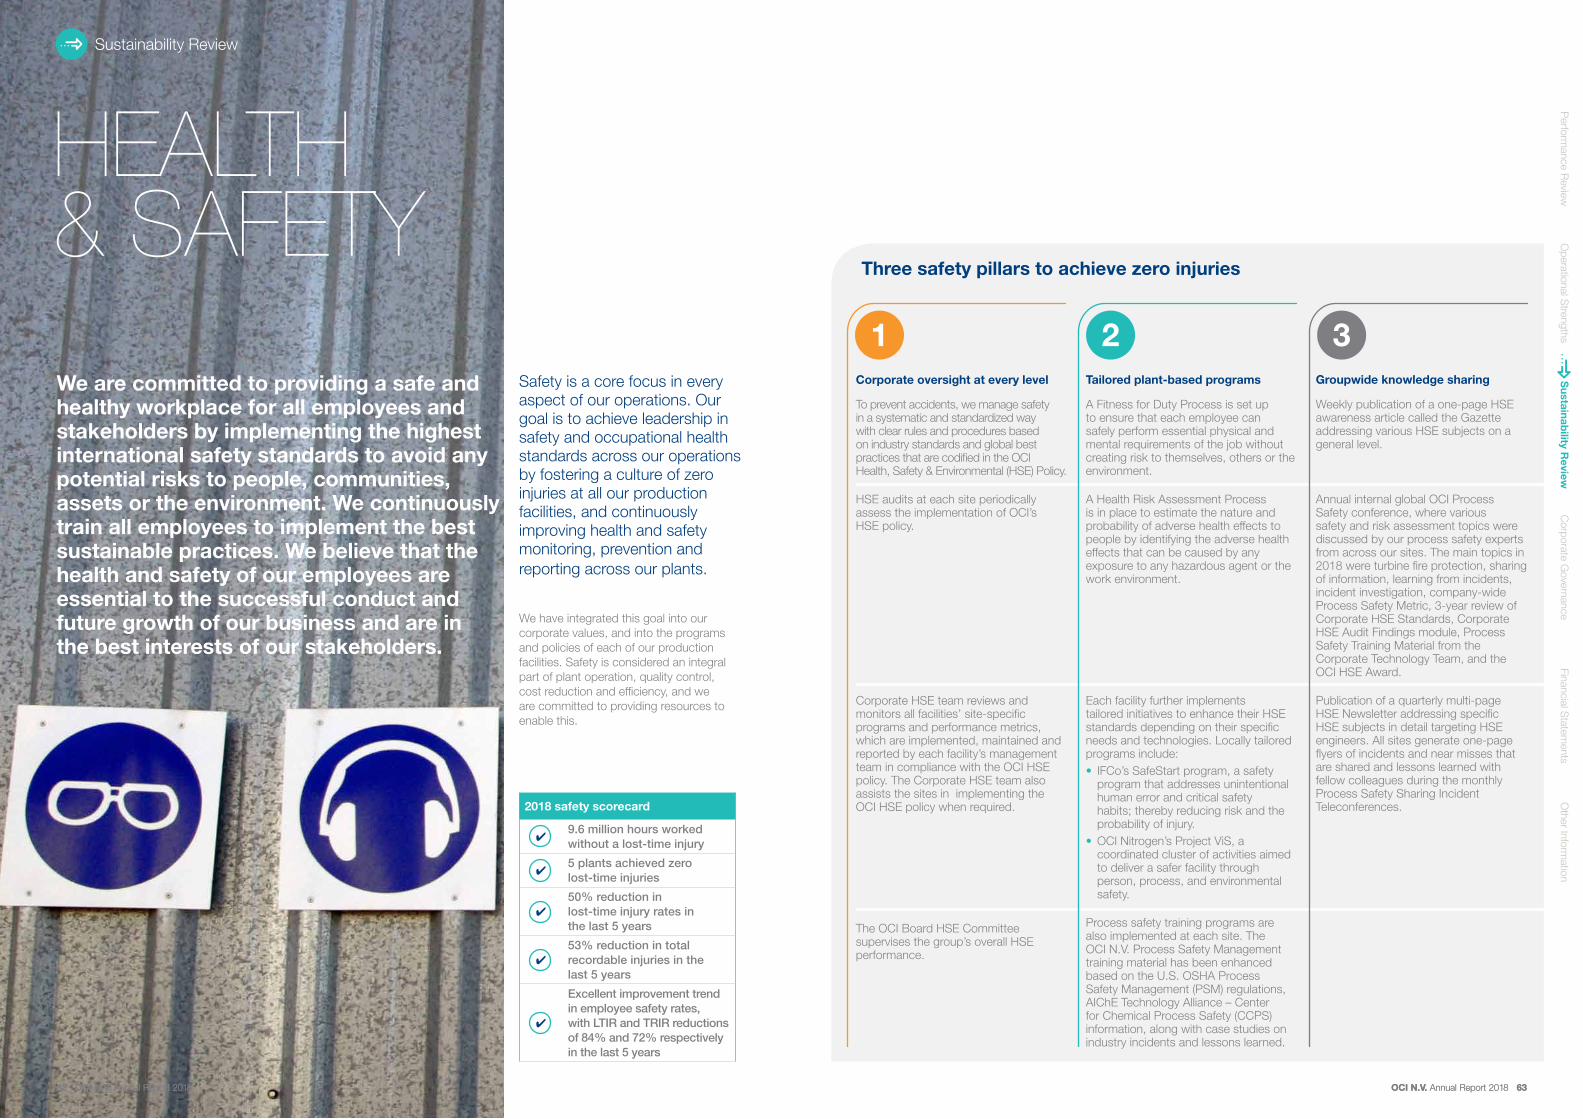
Perform
ance Review
Other Inform
ationO
perational Strengths
Corporate G
overnanceS
ustainability R
eviewFinancial S
tatements
Sustainability Review
We are committed to providing a safe and healthy workplace for all employees and stakeholders by implementing the highest international safety standards to avoid any potential risks to people, communities, assets or the environment. We continuously train all employees to implement the best sustainable practices. We believe that the health and safety of our employees are essential to the successful conduct and future growth of our business and are in the best interests of our stakeholders.
HEALTH & SAFETY
Safety is a core focus in every aspect of our operations. Our goal is to achieve leadership in safety and occupational health standards across our operations by fostering a culture of zero injuries at all our production facilities, and continuously improving health and safety monitoring, prevention and reporting across our plants.
We have integrated this goal into our corporate values, and into the programs and policies of each of our production facilities. Safety is considered an integral part of plant operation, quality control, cost reduction and efficiency, and we are committed to providing resources to enable this.
Corporate oversight at every level
To prevent accidents, we manage safety in a systematic and standardized way with clear rules and procedures based on industry standards and global best practices that are codified in the OCI Health, Safety & Environmental (HSE) Policy.
HSE audits at each site periodically assess the implementation of OCI’s HSE policy.
Corporate HSE team reviews and monitors all facilities’ site-specific programs and performance metrics, which are implemented, maintained and reported by each facility’s management team in compliance with the OCI HSE policy. The Corporate HSE team also assists the sites in implementing the OCI HSE policy when required.
The OCI Board HSE Committee supervises the group’s overall HSE performance.
Tailored plant-based programs
A Fitness for Duty Process is set up to ensure that each employee can safely perform essential physical and mental requirements of the job without creating risk to themselves, others or the environment.
A Health Risk Assessment Process is in place to estimate the nature and probability of adverse health effects to people by identifying the adverse health effects that can be caused by any exposure to any hazardous agent or the work environment.
Each facility further implements tailored initiatives to enhance their HSE standards depending on their specific needs and technologies. Locally tailored programs include:• IFCo’s SafeStart program, a safety
program that addresses unintentional human error and critical safety habits; thereby reducing risk and the probability of injury.
• OCI Nitrogen’s Project ViS, a coordinated cluster of activities aimed to deliver a safer facility through person, process, and environmental safety.
Process safety training programs are also implemented at each site. The OCI N.V. Process Safety Management training material has been enhanced based on the U.S. OSHA Process Safety Management (PSM) regulations, AIChE Technology Alliance – Center for Chemical Process Safety (CCPS) information, along with case studies on industry incidents and lessons learned.
Groupwide knowledge sharing
Weekly publication of a one-page HSE awareness article called the Gazette addressing various HSE subjects on a general level.
Annual internal global OCI Process Safety conference, where various safety and risk assessment topics were discussed by our process safety experts from across our sites. The main topics in 2018 were turbine fire protection, sharing of information, learning from incidents, incident investigation, company-wide Process Safety Metric, 3-year review of Corporate HSE Standards, Corporate HSE Audit Findings module, Process Safety Training Material from the Corporate Technology Team, and the OCI HSE Award.
Publication of a quarterly multi-page HSE Newsletter addressing specific HSE subjects in detail targeting HSE engineers. All sites generate one-page flyers of incidents and near misses that are shared and lessons learned with fellow colleagues during the monthly Process Safety Sharing Incident Teleconferences.
Three safety pillars to achieve zero injuries
1 2 3
2018 safety scorecard
✔9.6 million hours worked without a lost-time injury
✔5 plants achieved zero lost-time injuries
✔
50% reduction in lost-time injury rates in the last 5 years
✔
53% reduction in total recordable injuries in the last 5 years
✔
Excellent improvement trend in employee safety rates, with LTIR and TRIR reductions of 84% and 72% respectively in the last 5 years
OCI N.V. Annual Report 2018 6362 OCI N.V. Annual Report 201862 OCI N.V. Annual Report 2018 OCI N.V. Annual Report 2018 63

Perform
ance Review
Other Inform
ationO
perational Strengths
Corporate G
overnanceS
ustainability R
eviewFinancial S
tatements
Sustainability Review
Total recordable injury rate
HEALTH& SAFETYGlobal Management and Quality Assuance Standards
Safety cases per 200,000 hours worked 2017 2018
5 year trend
Total hours (millions) 8.12 9.67 26%
Total lost time injury rate 0.12 0.08 -50%
Employees 0.17 0.03 -84%
Contractors 0.00 0.16 100%
Total recordable injury rate 0.30 0.39 -53%
Employees 0.35 0.30 -72%
Contractors 0.17 0.53 66%
Our assets hold global certifications recognizing the quality of our products and management processes, including ISO 9001 Quality Management Systems, ISO 14001 Environmental Management Systems, and OHSAS 18001 Occupational Health and Safety Management Systems. Our North African assets are also REACH certified, and BioMCN also holds an International Sustainability and Carbon Certification (ISCC) and NTA8080 (Biomass Sustainability Certification).
OCI Beaumont is a VPP Star Site
OCI Beaumont’s safety record is considered best in class when compared to national averages within its industry classification. As a direct result of OCI Beaumont’s commitment to safety, OCI Beaumont were approved by OSHA in March 2016 as a VPP Star Site. OCI Beaumont is part of an elite group of organizations that provide exemplary occupational safety and health protection and serve as models for others. OCI Beaumont has not had a recordable incident in the last two and a half years.
Plant certifications
PlantISO 9001
ISO 14001
OHSAS 18001 REACH Others
OCI Nitrogen ✔ ✔
Fertilizers Europe Product Stewardship
ISCC Plus Certification (green ammonia)
BioMCN ✔ ✔ ✔
International Sustainability and Carbon Certification (ISCC) (bio-methanol)NTA8080 (Biomass Sustainability Certification)
OCI Beaumont ✔ ✔ OSHA VPP STAR
IFCo
EFC ✔ ✔ ✔ ✔ DEF added to ISO 9001
EBIC ✔ ✔ ✔ ✔
Sorfert ✔
Lost time injury rate
2014
0.13
2016
0.12
2017
0.08
2018
0.36
2016
0.30
2017
0.39
2018
64 OCI N.V. Annual Report 2018 OCI N.V. Annual Report 2018 65
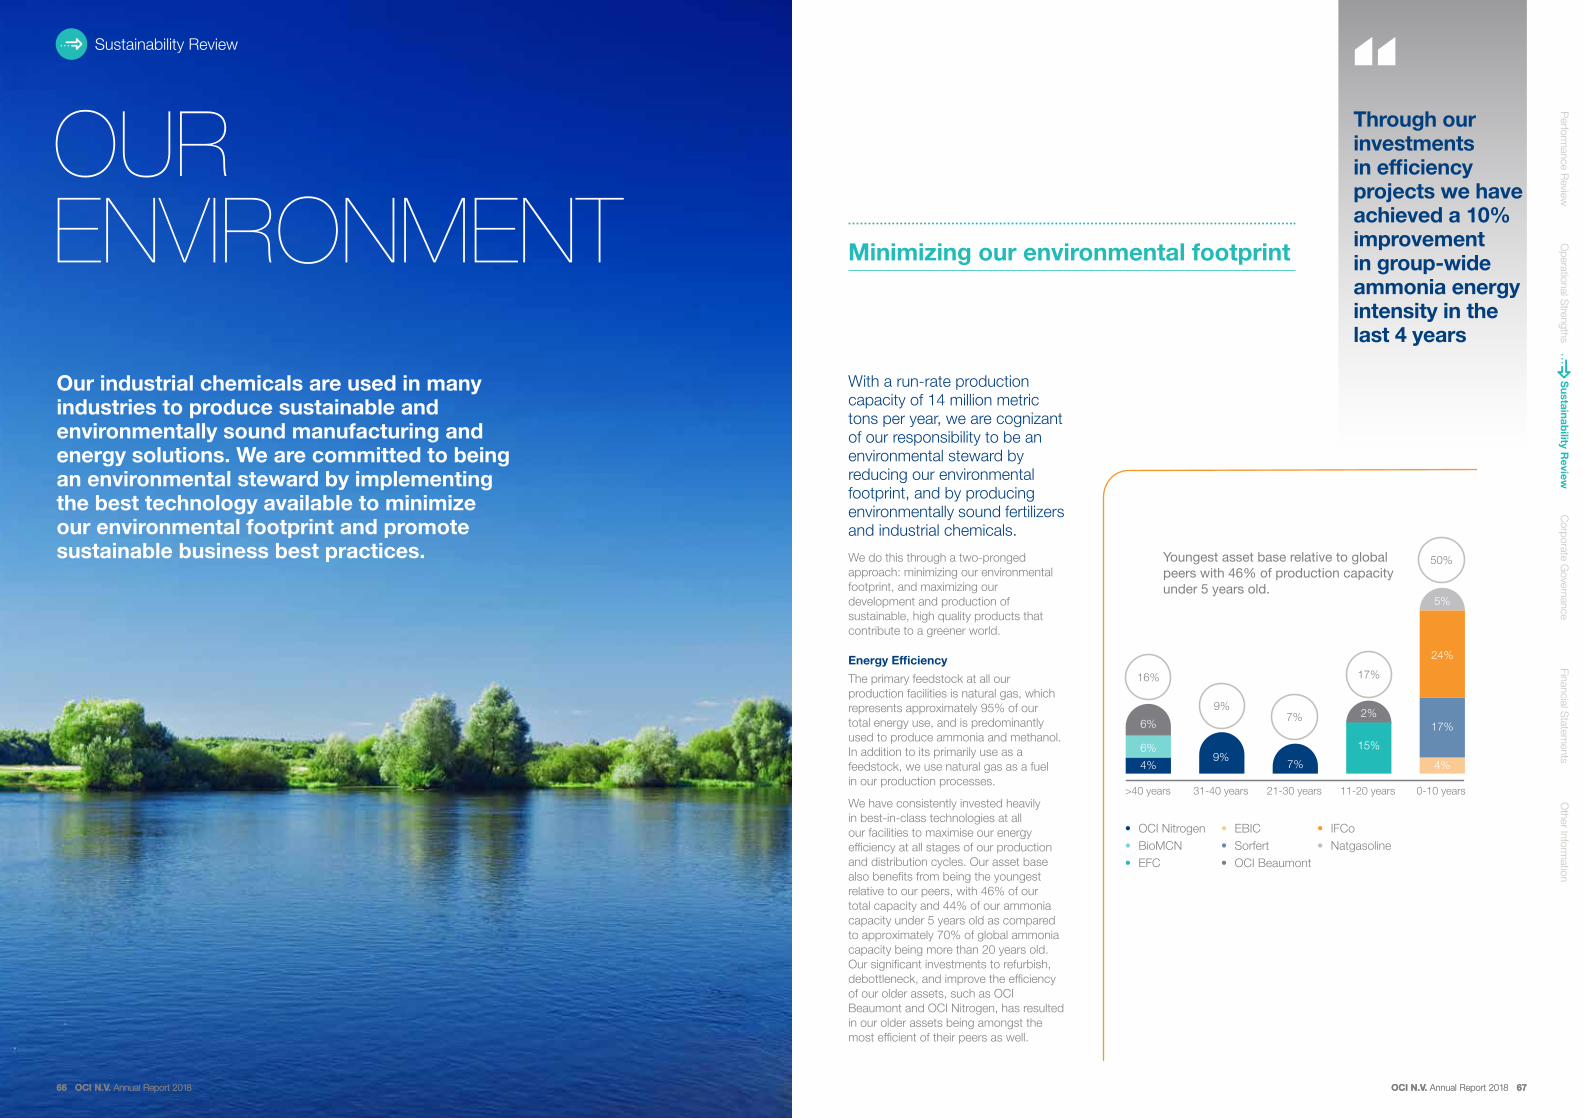
Perform
ance Review
Other Inform
ationO
perational Strengths
Corporate G
overnanceS
ustainability R
eviewFinancial S
tatements
Sustainability ReviewSustainability Review
Through our investments in efficiency projects we have achieved a 10% improvement in group-wide ammonia energy intensity in the last 4 years
Our industrial chemicals are used in many industries to produce sustainable and environmentally sound manufacturing and energy solutions. We are committed to being an environmental steward by implementing the best technology available to minimize our environmental footprint and promote sustainable business best practices.
OUR ENVIRONMENT Minimizing our environmental footprint
With a run-rate production capacity of 14 million metric tons per year, we are cognizant of our responsibility to be an environmental steward by reducing our environmental footprint, and by producing environmentally sound fertilizers and industrial chemicals.
We do this through a two-pronged approach: minimizing our environmental footprint, and maximizing our development and production of sustainable, high quality products that contribute to a greener world.
Energy Efficiency
The primary feedstock at all our production facilities is natural gas, which represents approximately 95% of our total energy use, and is predominantly used to produce ammonia and methanol. In addition to its primarily use as a feedstock, we use natural gas as a fuel in our production processes.
We have consistently invested heavily in best-in-class technologies at all our facilities to maximise our energy efficiency at all stages of our production and distribution cycles. Our asset base also benefits from being the youngest relative to our peers, with 46% of our total capacity and 44% of our ammonia capacity under 5 years old as compared to approximately 70% of global ammonia capacity being more than 20 years old. Our significant investments to refurbish, debottleneck, and improve the efficiency of our older assets, such as OCI Beaumont and OCI Nitrogen, has resulted in our older assets being amongst the most efficient of their peers as well.
>40 years 31-40 years 21-30 years 11-20 years 0-10 years
• OCI Nitrogen• BioMCN• EFC
• EBIC• Sorfert• OCI Beaumont
• IFCo• Natgasoline
16%
9%7%
17%
50%Youngest asset base relative to global peers with 46% of production capacity under 5 years old.
4%
6%
6%
9%7%
15%
2%
4%
17%
24%
5%
66 OCI N.V. Annual Report 2018 OCI N.V. Annual Report 2018 6766 OCI N.V. Annual Report 2018 OCI N.V. Annual Report 2018 67

Perform
ance Review
Other Inform
ationO
perational Strengths
Corporate G
overnanceS
ustainability R
eviewFinancial S
tatements
Sustainability Review
Ammonia GHG intensity
(million tons of co2 equivalent)
4% improvement since 2016
OURENVIRONMENTMinimizing our environmental footprint
OCI Ammonia plants Unit 2017 2018
Energy Consumption TJ
136,069
169,895
Energy IntensityGJ / metric ton gross production
36.7 36.2
OCI Consolidated Emissions 2017 2018
GHG Emissions (Direct) Million tons of CO2 equivalent 6.6 8.0
GHG Emissions (Indirect) Million tons of CO2 equivalent 2.9 3.3
Total GHG Million tons of CO2 equivalent 9.5 11.3
GHG Intensity Metric tons of CO2 equivalent / total metric tons produced
0.919 0.922
Direct emissions = Scope 1 as per Greenhouse gas protocol of the World Resources Institute.
Indirect emissions = Scope 2 (steam and electricity import/export) + Scope 3 (downstream emissions regarding CO2 recovery, e.g. CO2 used for urea production + upstream emissions of purchased H2).
Total metric tons produced is not corrected for transfers
1 Global average emissions sourced from IFA 2018 Environmental Performance Benchmark. Best-in-class averages are the average emission rates of the top 20% of total production surveyed
Our Dutch facilities are a driving force in reducing the Dutch chemical industry’s impact on climate change
Minimizing Emissions
Our production facilities emit greenhouse gases (GHG) directly from the conversion of natural gas into our products, and indirectly through the generation of purchased electricity and steam.
Minimizing our CO2 Impact
We diligently work to minimize our carbon dioxide (CO2) emissions by investing in reduction technologies, recycling CO2
within our downstream processes, and selling CO2 to third parties. Our efforts have resulted in a 7% improvement in our overall GHG intensity and a 5% improvement in our ammonia GHG intensity over the last four years.
Minimizing our NOx and N2O Impact
We have worked diligently to reduce nitrogen oxide (NOx) and nitrous oxide (N2O) emissions,, which are significantly more harmful than CO2.
Our global N2O emissions are 93% lower than the global average for nitric acids plants, and our overall NOx emissions are 55% lower than the global average for nitric acid plants.
World-Class Emissions Standards
IFCo is the first plant in the world to install a methanol removal unit to reduce the methanol emissions via the CO2 off-gas stream of its ammonia plant. The ammonia plant also has a SCR de-NOx unit, and a high efficiency dust scrubber is installed in the urea plant. IFCo’s state-of-the-art technology has resulted in bringing the plant’s N2O emissions to nearly zero, 97% lower than the world’s best-in-class average, and overall NOx emissions are 56% lower than the world’s best-in-class average1.
Continuous Investment to Minimize NOx Emissions
• OCI Beaumont installed a Selective Catalytic Reduction (SCR) Unit in 2016, which nearly halved its NOx emissions. With this system, OCI Beaumont’s NOx emissions per metric ton of ammonia production are 92% lower than the global average.
• OCI Nitrogen invested in a catalyst replacement at its nitric acid plant in 2016 to reduce nitrous oxide emissions. This investment has resulted in a 75% decrease in emissions in 2016, bringing the combined nitric acid plants’ NOx and N2O levels 34% and 89% lower respectively than the industry average.
Water and Land Reclamation in the Egyptian Desert
EFC is the only plant in Egypt that has implemented a novel solution to the large quantity of water produced as a by-product of the urea manufacturing process. In 2010, the plant invested $1.2 million for the construction of two irrigation ponds capable of holding up to 10,000 cubic meters of water. In 2018, EFC added a third point to increase capacity to 15,000 cubic meters. The water is used to irrigate 50 acres of forestry near the plant in an environmentally friendly manner, achieving the bonus of contributing to land reclamation in the Egyptian desert.
Re-use of Carbon Dioxide and Other By-Products
EBIC supplies EFC with the excess CO2 produced in the manufacture of ammonia through a shared pipeline, which allows EFC to produce additional urea. In addition, both plants have been tuned to share some utilities, primarily electricity and waste water. This not only generates savings in capital expenditure, but also allows each plant to depend on the other for backup in case of a malfunction, making our operations at both plants even more reliable.
Working towards the Netherlands’ emissions targets
Our Dutch facilities are a driving force in reducing the Dutch chemical industry’s impact on climate change, in line with the Netherlands’ announced targets to reduce GHG emissions by 49% by 2030.
Best Available Technology
All of our facilities in the United States implement Best Available Control Technology (BACT), a pollution control standard mandated by the United States Clean Air Act, to minimize our environmental impact.
CooperatingRecyclingInvesting
Ammonia energy intensity
(GJ/metric tons of production)
4% improvement since 2016
37.8
2016
36.2
2018
BioMCN won national Enlightenmentz Award for the second consecutive year
BioMCN won the national Enlightenmentz Award for its innovative green methanol production process, which converts carbon dioxide and hydrogen into bio-methanol. The awards promote sustainable innovations in the Netherlands.
2.14
2016
2.05
2018
2.08
2017
36.7
2017
68 OCI N.V. Annual Report 2018 OCI N.V. Annual Report 2018 69

Perform
ance Review
Other Inform
ationO
perational Strengths
Corporate G
overnanceS
ustainability R
eviewFinancial S
tatements
Sustainability Review
OURENVIRONMENTConscientious water management
As part of our continued efforts to minimize our environmental impact and create a sustainable product portfolio, we have invested in developing green products at our production facilities around the world. We will continue to invest in products and initiatives that provide cleaner and more sustainable solutions to our customers.
As water is an essential but finite resource, we each have a role to play in protecting our global water supplies. Each plant works to maximize water efficiency through comprehensive water management processes, recycling and reusing water wherever possible, and ensuring any water discharge meets local regulatory requirements. We also work with farmers to increase nutrient efficiency, which in turn minimizes runoff to local water sources and puts less strain on irrigation supplies.
Greener fuels Greener conventional products
We produce bio-methanol and Diesel Exhaust Fluid (DEF), which can be used in various ways to significantly reduce greenhouse gas emissions and help meet the standards set by the United States Clean Air Act and the European Union’s Renewable Energy and Emissions Directives.
We constantly look for ways to improve the environmental friendliness of our fertilizers and chemicals.
DEF DEF, also known as AdBlue, is a urea solution that can be injected into Selective Catalytic Reduction (SCR) systems to lower harmful vehicle exhaust emissions from diesel engines by converting harmful NOx emissions into nitrogen gas and water vapour. DEF can be used in all types of vehicles equipped with SCR systems, the technology of choice for cars, trucks, buses, and other heavy-duty vehicles to comply with US and EU regulations. Accordingly, we expect demand for DEF to grow by more than 15% per year in the next two years.
Calcium Ammonium NitrateThe CAN produced at OCI Nitrogen is amongst the greenest CAN in the world with minimal nitrous oxide emissions, and with a CO2 footprint that is 75% lower than the industry average. OCI Nitrogen’s CAN is also the first to have its CO2 footprint certified in accordance with the international Carbon Footprint Standard PAS 2050-I. As the largest CAN producer in the Netherlands, OCI Nitrogen’s investments in reducing the CO2 footprint of its CAN production has been a positive stride towards achieving the country’s GHG reduction targets. In recognition of its achievement of producing CAN with the lowest CO2 emissions in Europe, OCI Nitrogen was awarded the VNCI Responsible Care Award in 2008.
Producing environmentally sound solutions
Each plant works to
maximize water efficiency
Water is sourced from municipal sources, wells, and surface water. In 2018, we used approximately 52 million cubic meters of water
Water is used in the production process in several ways, such as cooling water, as steam, or as a raw material for our downstream products. Water is circulated and re-used many times throughout our production cycle
Following several cycles through our plants, water is recycled by being used by neighbouring plants where interconnections exist or is safely released as unpolluted water vapour. In 2018, we re-used or recycled approximately 75% of our water intake
Water is treated at water treatment facilities to ensure it is safe and clean
Water is safely discharged as per local regulations, or further recycled as irrigation water. In 2018, we discharged approximately 25% of our water intake (including irrigation water)
1
5
14
2
3
70 OCI N.V. Annual Report 2018 OCI N.V. Annual Report 2018 71

Perform
ance Review
Other Inform
ationO
perational Strengths
Corporate G
overnanceS
ustainability R
eviewFinancial S
tatements
Sustainability ReviewSustainability Review
OURENVIRONMENTProducing environmentally sound solutions
Greener fuels Greener conventional products
Bio-Methanol as an Advanced Biofuel
Bio-methanol is a second-generation biofuel. It is a highly versatile product that can be used both as a fuel and as a feedstock to produce other biofuels. Bio-methanol can either be blended with gasoline, or it can be used as a feedstock for other environmentally friendly fuels. As a direct fuel, bio-methanol has a 60% GHG savings versus gasoline and does not require any technological changes to modern vehicles.
Bio-methanol can also be used as a green building block for a range of products, including bio-MTBE, bio-DME, bio-hydrogen, synthetic biofuels, silicones, plastics, and paints.
We produce bio-methanol at BioMCN and OCI Beaumont by using biogas rather than natural gas. Biogas, as known as biomethane, is sourced from a range of waste digestion plants and other renewable sources. By using biomethane, we use methane emissions that would otherwise be released into the atmosphere, which account for 16% of global GHG emissions and trap up to 36 times more heat in the atmosphere than CO2 over 100 years.
Ammonia
OCI Nitrogen has an extensive research and development program aiming to significantly reduce or eliminate CO2 emissions caused by ammonia production to help meet Dutch and European CO2 reduction targets. The plant has also been certified to produce green ammonia using green gas certificates.
Initiatives under assessment include:
• Green ammonia production using biogas: OCI Nitrogen has teamed up with Re-N Technology to study the development of a large-scale biogas plant on the Chemelot industrial site. The project, called Zitta® Biogas, aims to make a significant contribution to solving the problem of surplus manure in the Netherlands. At the same time, it will make OCI Nitrogen’s production process more sustainable and will positively contribute to achieving the Netherlands’ GHG reduction targets. The project has received Dutch government support in the form of a renewable energy subsidy called SDE+
• Waste stream gasification: OCI Nitrogen and BioMCN are jointly studying the feasibility to use waste stream gasification technology, to make synthesis gas that than can be converted to ammonia or methanol. The aim of the project is to reduce the carbon footprint at large and replicable scale, by more efficient and circular use of municipal waste
• Carbon Capture and Storage (CCS): OCI Nitrogen is studying the feasibility of capturing and liquefying its CO2 emissions, which would then be stored in empty gas fields under the North Sea. CCS is widely viewed by environmental experts as a vital tool for heavy industries to effectively tackle climate change, and the solution is advocated by the International Energy Agency (IEA)
• Hydrogen Coalition and Power to Ammonia: Green hydrogen is produced from water using green electricity from renewable energy sources
– OCI Nitrogen is one of 23 organizations that joined the Greenpeace Netherlands Hydrogen Coalition, which aims to encourage the Dutch government to stimulate green hydrogen for further sustainability of the energy supply
– OCI Nitrogen is also working with various organizations to invest in R&D aiming to make green hydrogen technology applicable for the large-scale production by 2030.
Methanol
In addition to its use as a chemical building block for countless chemicals, methanol is increasingly used in several clean energy applications, both as a direct fuel alternative, and as feedstock for other environmentally friendly fuels. Through the Methanol Institute, we support and promote the development of sustainable alternative energy applications of methanol.
PRODUCING ENVIRONMENTALLY SOUND SOLUTIONS USING METHANOL
Vehicle fuelVarious government policies in China,
Europe, New Zealand, the United States and others are encouraging the use
of methanol in clean burning vehicle fuel blends.
Dimethyl Ether (DME)Produced from methanol, DME is used as a replacement for propane in liquid petroleum gas, and increasingly as a
replacement for diesel fuel.
Fuel celsMethanol is being used to develop
different types of fuel cells with a range of applications, from personal electronics to
vehicles and industrial equipment.
BiodieselBiodiesel is a renewable fuel produced by from methanol and vegetable oils or animal fats, and is a clean alternative to petroleum based fuels.
ElectricityMethanol can be used to power turbine engines, which bolster power generation at times of peak electricity demand.
Marine fuelNew regulations by the International Maritime Organization have driven the marine industry to develop alternatives for conventional marine fuels.
Methanol is being used as a marine fuel due to its high energy efficiency and cost advantages relative to other fuels.
For more information, please visit www.methanol.org
72 OCI N.V. Annual Report 2018 OCI N.V. Annual Report 2018 7372 OCI N.V. Annual Report 2018 OCI N.V. Annual Report 2018 73

CORPORATE GOVERNANCE
OCI N.V. Annual Report 2018 75
Corporate Governance
Other Inform
ationP
erformance R
eviewO
perational Strengths
Co
rpo
rate Go
vernanceS
ustainability Review
Financial Statem
ents
74 OCI N.V. Annual Report 2018

OCI N.V. (the Company) has a one-tier Board of Directors (the Board), which is responsible for the management, general affairs, strategy, and long-term success of the business as a whole. The Board comprises a majority of Non-Executive Directors and a minority of Executive Directors whose responsibility is collective, taking into account their respective roles as Executive Directors and Non-Executive Directors.
BOARD OF DIRECTORS PROFILE
Michael Bennett Nassef Sawiris Hassan Badrawi Jan Ter Wisch
Position Independent Non-Executive Director and Chairman
Chief Executive Officer Chief Financial Officer Independent Non-Executive Director and Vice-Chairman
Year of birth 1953 1961 1976 1952Gender Male Male Male Male
Nationality American Egyptian Egyptian DutchInitial appointment
dateJanuary 2013 January 2013 May 2018 January 2013
Date of (last) re-
appointment
June 2015 May 2018 - June 2015
End of current term
2019 2019 2019 2019
Independent Yes - - YesOrdinary shares
owned8,500 62,589,631 87,300 10,000
Committee membership1
HSE, N&R - - AC, N&R
Attendance at Board and
Committee meetings1
BoD (6/6)HSE (5/6)N&R (6/7)
BoD (6/6) BoD (6/6) BoD (6/6)AC (7/7)N&R (7/7)
Current external appointments
Director Morningside College
Non-Executive Director:• LafargeHolcim Ltd• Adidas AG
• Director Stichting Administratiekantoor Grass
• Chairman of Investment Committee 5square MKB Fund III Coöperatieve U.A
Previous relevant experience
• Director Alliant Energy Corporation*
• Director SandRidge Energy
• CEO and Director Terra Industries Inc.
• Chairman and President Terra Nitrogen Company L.P
• Chairman The Fertilizer Institute and The Methanol Institute in the United States * Stepped down on
9 March 2018
• Chairman and CEO Orascom Construction Industries S.A.E.
• Non-Executive Director BESIX Group
• Non-Executive Director Orascom Construction Ltd
• Executive Vice President of OCI N.V. since 2016
• Various leadership positions within OCI, encompassing M&A, strategy, business development and investor relations
• Partner and Member European Tax Board Deloitte
• Partner and Board Member Loeff Claeys Verbeke
• Partner and Chairman of Global Tax Board Allen & Overy
• Chairman Stichting De Westberg
Sipko Schat Jérôme GuiraudRobert Jan van de Kraats Greg Heckman
Anja Montijn-Groenewoud
Position Senior Independent Non-Executive Director
Non-Executive Director
Independent Non-Executive Director
Independent Non-Executive Director
Independent Non-Executive Director
Year of birth 1960 1961 1960 1962 1962Gender Male Male Male Male Female
Nationality Dutch French Dutch American DutchInitial appointment
dateDecember 2013 June 2014 June 2014 June 2015 June 2016
Date of (last) re-
appointment
June 2015 May 2018 May 2018 - May 2018
End of current term
2019 2019 2019 2019 2019
Independent Yes No Yes Yes YesOrdinary shares
owned5,000 120,190 3,725 40,000 -
Committee membership1
AC, N&R AC, N&R AC, N&R HSE HSE
Attendance at Board and
Committee meetings1
BoD (6/6)AC (7/7)N&R (7/7)
BoD (6/6)AC (7/7)N&R (7/7)
BoD (6/6)AC (7/7)N&R (6/7)
BoD (5/6)HSE (6/6)
BoD (5/6)HSE (6/6)
Current external appointments
Member of the Supervisory Board:• Rothschild & Co.• Rothschild Bank A.G.• Trafigura Group Pte
Ltd• VanWonen Holding
B.V. (Chairman)• Drienim B.V.
• COO and Director NNS Advisers Ltd
• Executive Chairman and CEO NNS Luxembourg Sarl
• Non-Executive Director and Chairman Orascom Construction Ltd
• Non-Executive Director BESIX Group
• Director NNS Holding Sàrl (and other NNS fully owned entities) and OS Sarl Luxembourg
• Non-Executive Director VEON Ltd.
• Chairman the Board of Directors of TMF Group
• Supervisory Board Member Schiphol Group
• Member of the Board of Directors and CEO* Bunge Ltd.
• Independent Advisory Board Member JBS USA
• Member of University of Illinois Division of Intercollegiate Athletics Campaign Steering Committee
* Appointed acting CEO in January 2019
• Member Supervisory Board Fugro N.V.
• Member of the Board VEUO (a representative organization of listed companies which looks after the interest of companies listed at Euronext Amsterdam)
Previous relevant experience
• Member of the Executive Board Rabobank Group
• Member of the Supervisory Board Vion N.V. (Chairman)
• Member of the Board and Audit Committee, Lafarge SA
• Over 30 years of professional experience in banking and financial markets
• Over 15 years as a director in listed and non-listed companies
• CFO and Vice-Chairman of the Executive Board, Randstad Holding N.V.*
• Qualified Chartered Accountant
• Various finance and operational executive and non-executive positions in the technology, financial services and credit insurance sectors
* Stepped down on 27 March 2018
• President and CEO of The Gavilon Group
• Various positions at ConAgra Foods
• Director, Waitt Brands
• Board of Trustees, Brownell-Talbot College Preparatory School
• Various leadership positions at Accenture including:
• Managing director Resources practice in France and Benelux
• Country Managing • Director Accenture
the Netherlands• Global Director
Management Consulting Resources
1 Board and Committees: BoD: Board of Directors, AC: Audit Committee, HSE: Health, Safety and Environment Committee and N&R: Nomination and Remuneration Committee
76 OCI N.V. Annual Report 2018 OCI N.V. Annual Report 2018 77
Corporate Governance
Other Inform
ationP
erformance R
eviewO
perational Strengths
Co
rpo
rate Go
vernanceS
ustainability Review
Financial Statem
ents
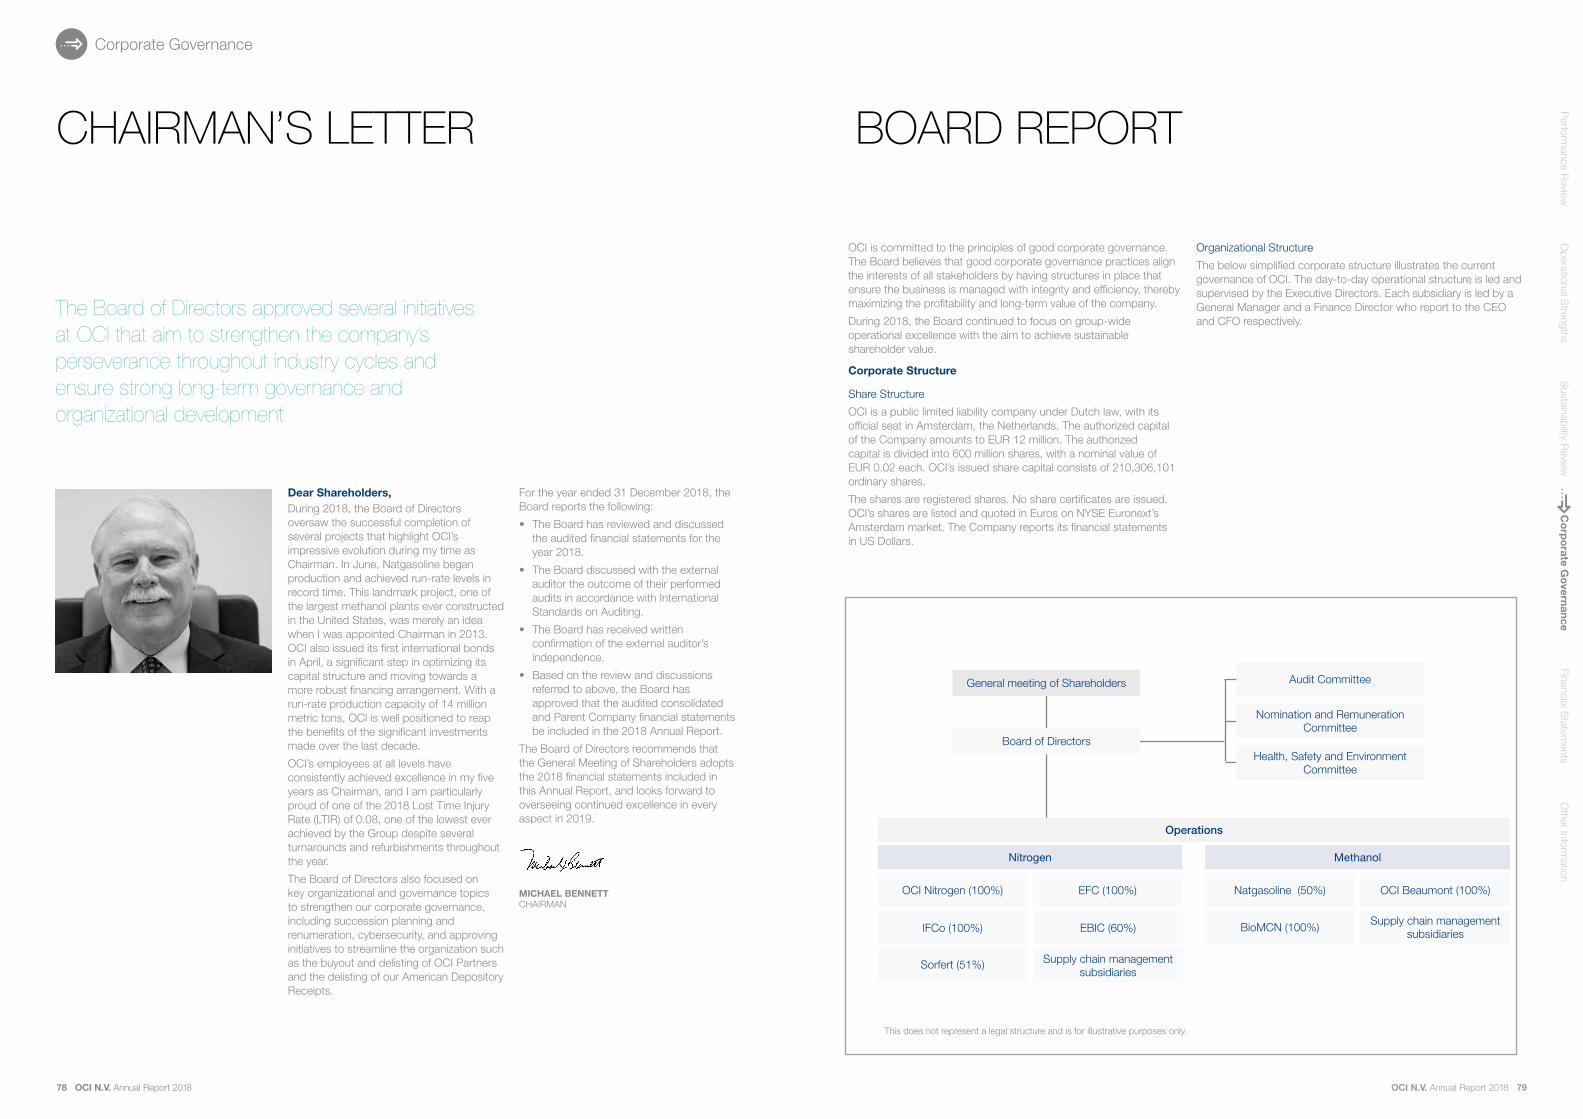
Organizational Structure
The below simplified corporate structure illustrates the current governance of OCI. The day-to-day operational structure is led and supervised by the Executive Directors. Each subsidiary is led by a General Manager and a Finance Director who report to the CEO and CFO respectively.
OCI is committed to the principles of good corporate governance. The Board believes that good corporate governance practices align the interests of all stakeholders by having structures in place that ensure the business is managed with integrity and efficiency, thereby maximizing the profitability and long-term value of the company.
During 2018, the Board continued to focus on group-wide operational excellence with the aim to achieve sustainable shareholder value.
Corporate Structure
Share Structure
OCI is a public limited liability company under Dutch law, with its official seat in Amsterdam, the Netherlands. The authorized capital of the Company amounts to EUR 12 million. The authorized capital is divided into 600 million shares, with a nominal value of EUR 0.02 each. OCI’s issued share capital consists of 210,306,101 ordinary shares.
The shares are registered shares. No share certificates are issued. OCI’s shares are listed and quoted in Euros on NYSE Euronext’s Amsterdam market. The Company reports its financial statements in US Dollars.
Audit Committee
Nomination and Remuneration Committee
Health, Safety and Environment Committee
General meeting of Shareholders
Board of Directors
Nitrogen Methanol
OCI Nitrogen (100%)
IFCo (100%)
Sorfert (51%)
EFC (100%)
EBIC (60%)
Supply chain management subsidiaries
Natgasoline (50%) OCI Beaumont (100%)
Operations
This does not represent a legal structure and is for illustrative purposes only.
BioMCN (100%) Supply chain management subsidiaries
78 OCI N.V. Annual Report 2018 OCI N.V. Annual Report 2018 79
Corporate Governance
Other Inform
ationP
erformance R
eviewO
perational Strengths
Co
rpo
rate Go
vernanceS
ustainability Review
Financial Statem
ents
BOARD REPORT
Dear Shareholders,During 2018, the Board of Directors oversaw the successful completion of several projects that highlight OCI’s impressive evolution during my time as Chairman. In June, Natgasoline began production and achieved run-rate levels in record time. This landmark project, one of the largest methanol plants ever constructed in the United States, was merely an idea when I was appointed Chairman in 2013. OCI also issued its first international bonds in April, a significant step in optimizing its capital structure and moving towards a more robust financing arrangement. With a run-rate production capacity of 14 million metric tons, OCI is well positioned to reap the benefits of the significant investments made over the last decade.
OCI’s employees at all levels have consistently achieved excellence in my five years as Chairman, and I am particularly proud of one of the 2018 Lost Time Injury Rate (LTIR) of 0.08, one of the lowest ever achieved by the Group despite several turnarounds and refurbishments throughout the year.
The Board of Directors also focused on key organizational and governance topics to strengthen our corporate governance, including succession planning and renumeration, cybersecurity, and approving initiatives to streamline the organization such as the buyout and delisting of OCI Partners and the delisting of our American Depository Receipts.
For the year ended 31 December 2018, the Board reports the following:
• The Board has reviewed and discussed the audited financial statements for the year 2018.
• The Board discussed with the external auditor the outcome of their performed audits in accordance with International Standards on Auditing.
• The Board has received written confirmation of the external auditor’s independence.
• Based on the review and discussions referred to above, the Board has approved that the audited consolidated and Parent Company financial statements be included in the 2018 Annual Report.
The Board of Directors recommends that the General Meeting of Shareholders adopts the 2018 financial statements included in this Annual Report, and looks forward to overseeing continued excellence in every aspect in 2019.
MICHAEL BENNETTCHAIRMAN
The Board of Directors approved several initiatives at OCI that aim to strengthen the company’s perseverance throughout industry cycles and ensure strong long-term governance and organizational development
CHAIRMAN’S LETTER

The Board of DirectorsOCI has a one-tier Board, which during 2018 was composed of seven Non-Executive Directors, and two Executive Directors, being the CEO Mr. Nassef Sawiris and the CFO Mr. Hassan Badrawi. Mr. Hassan Badrawi was appointed as CFO at the 2018 AGM.
Apart from certain reserved matters as set out in the Articles of Association and By-laws, the Board has delegated the operational management of the business to the CEO. Matters reserved for the Board include changes in overall strategy, dividend proposals to the General Meeting of Shareholders, as well as the approval of significant transactions.
Non-Executive Directors The role of the Non-Executive Directors is essentially supervisory in nature. One of the Non-Executive Directors fulfils the role of Chairman of the Board and is primarily responsible for the functioning of the Board and its Committees. Together with the Corporate Secretary the Chairman sets the agenda for Board meetings and takes the lead in providing an induction program for new Directors tailored to their respective needs. One of the Directors is the Senior Independent Director and acts as a trusted intermediary for the individual Directors.
Appointment of DirectorsThe General Meeting of Shareholders can appoint, suspend or dismiss a Director by an absolute majority of the votes cast upon a proposal of the Board. In addition, the General Meeting of Shareholders can nominate Directors. To do so they must put a resolution to the General Meeting of Shareholders in line with the requirements as described in the Articles of Association. Directors are appointed for a one-year term and are eligible for reappointment. In line with the Dutch Corporate Governance Code, Directors may not serve for more than eight years with the option to extend four times on an annual basis in case of extraordinary circumstances. The Non-Executive Directors are selected individually for their broad and relevant experience and international profile as well as for their independence. Diversity in terms of age, background and gender are considered. The Board profile for Non-Executive Directors (which can be found on OCI N.V.’s website) provides guiding principles for the composition of the Board.
Shareholders’ Rights and MeetingsOCI’s shareholders exercise their rights through the Annual General Meeting of Shareholders in the Netherlands which is held no later than six months after the end of the Company’s financial year.
Additional Extraordinary General Shareholders meetings may be convened at any time by the Board of Directors or by one or more shareholders representing more than 10% of the issued share capital. Further rights of the Shareholders are detailed in the Articles of Association and the By-laws.
Votes representing shares can be cast at the General Meeting of Shareholders either personally or by proxy. No restrictions are imposed on these proxies, which can be granted electronically or in writing to the Company, or to independent third parties.
OCI’s shareholders may cast one vote for each share. All resolutions adopted by the General Meeting of Shareholders are passed by an absolute majority of the votes cast, unless the law or the Articles of Association prescribe a larger majority.
.
External Auditor The General Meeting of Shareholders appoints the external auditor. The Audit Committee recommends to the Board the external auditor to be proposed for (re)appointment by the General Meeting of Shareholders. In addition, the Audit Committee evaluates the functioning of the external auditor. On 24 May 2018, the General Meeting appointed KPMG Accountants N.V. as external auditor for OCI for the financial year 2018.
Decree Article 10 EU Takeover Directive According to the Dutch Financial Supervision Act, any person or legal entity who, directly or indirectly, acquires or disposes of an interest in the Company’s capital or voting rights must immediately give written notice to the Netherlands Authority for the Financial Markets (AFM) if the acquisition or disposal of the percentage of the outstanding capital interest or voting rights exceeds or falls below certain thresholds (3%, 5%, 10%, 15%, 20%, 25%, 30%, 40%, 50%, 60%, 75% and 95%).
OCI N.V. is aware, on the basis of the information in the registers of the Netherlands Authority for the Financial Markets (AFM), that the following shareholders possessed an interest of more than 3% on 31 December 2018: Nassef Sawiris, Onsi Sawiris, Southeastern Asset Management, Inc., Samih Sawiris, W. H. Gates III, Pictet Asset Management Limited and Pelham Capital Ltd. This information is extracted from the AFM notifications and registers website as at 31 December 2018 https://www.afm.nl/en/professionals/registers/meldingenregisters/ substantiele-deelnemingen
As at 31 December 2018, 45.72% of the total shares outstanding were free-float. For details on the number of outstanding shares, see note 15 of the Consolidated Financial Statements. For details on capital structure, listings, share performance and dividend policy see ‘Shareholder Information’.
The Company confirms that it has no anti-takeover instruments, in the sense of measures that are primarily intended to block future hostile public offers for its shares. Although the members of the Sawiris family have not entered into any formal shareholders agreement, they have historically coordinated their voting on the OCI shares and should therefore be regarded as parties acting in concert (“personen die in onderling overleg handelen”) as defined in section 1:1 of the Dutch Financial Supervision Act. Their collective voting rights of 54.28% as at 31 December 2018 act as an implicit anti-takeover element.
Composition and independence Board The composition of the Board strives to arm the Company with leadership that is diverse in skills, experience, and background, thereby maximizing the Board’s ability to independently and critically act without emphasis on particular interests. The Board maintains independence by ensuring the majority of Non- Executive Directors including the Chairman are independent. Mr. Guiraud is not considered independent within the meaning of the Dutch Corporate Governance Code. The Board’s composition, independence, competencies, and qualifications are detailed in the Board Profile and the diversity policy (available on the corporate website: http://www.oci.nl/corporate-governance/board-profile/). The Board Profile is assessed on an annual basis. This annual review considers the balance of the required competencies and expertise to ensure alignment to OCI’s mission and strategic priorities, opportunities and threats for the company. It also considers diversity. Appointments of new Board members are made based on objective selection criteria highlighting the specific skills and experience needed to ensure a balanced Board composition and to match the overall Board profile. The Board undertakes necessary measures to ensure diversity in education, professional experience, nationality, age and gender in the selection of new candidates for the Board of Directors. In addition, the Board tries to maintain a balance between experience and affinity with the nature and culture of the Company and its affiliated companies. In this regard, the Board will follow the success of female talent in the organization closely. New appointments are based on objective selection criteria highlighting the specific skills and experience needed to ensure a rounded Board. With regard to vacancies, the Board prepares a profile based on the required education and professional experience and the Non-Executive Directors will seek female candidates and candidates with different nationalities. In case of equally suitable candidates, female candidates are preferred.
Assessment and evaluation of the Board OCI engaged the services of Lintstock to assist with the 2018 review of Board performance. Lintstock is a corporate governance advisory firm that specialises in facilitating Board Reviews, and has no other connection with the company.
The first stage of the Review involved Lintstock engaging with the Chairman and Company Secretary to set the context for the evaluation and to tailor the survey content to the specific circumstances of OCI. All Board members were then invited to complete an online survey addressing the performance of the Board and its Committees. The anonymity of the respondents was ensured throughout the process in order to promote an open and frank exchange of views.
The exercise was weighted to ensure that core areas of Board and Committee performance were addressed, as well as having a particular focus on the following topics:
• The role played by the Board in relation to OCI’s recent refinancing, including the information flow around the refinancing and the lessons that the Board can draw from the overall process
• The adequacy of OCI’s Environmental, Social and Governance (ESG) performance, and the top ESG challenges facing the business over the coming years
• The robustness of succession plans in place for members of the Board, and key changes that ought to be made to the profile of the Board over the next 3 - 5 years in the context of OCI’s strategy
• The organisational structure of OCI at senior levels, management succession plans and the Board’s oversight of the processes in place to manage and develop talent
• The understanding amongst Board members of investors, customers and employees, and the development of the mechanisms by which the Board engages with key stakeholder groups
• The atmosphere at Board meetings, and the extent to which the experience of Non-Executive Directors is drawn on for the benefit of the business
• The quality of information and support available to the Board, including specific areas in which Directors would benefit from greater training or support in future
• The individual performance of each of the Board members.
The above topics have the constant attention of the Board throughout the year.
80 OCI N.V. Annual Report 2018 OCI N.V. Annual Report 2018 81
Corporate Governance
Other Inform
ationP
erformance R
eviewO
perational Strengths
Co
rpo
rate Go
vernanceS
ustainability Review
Financial Statem
ents
BOARD REPORT CONTINUED

The Nomination and Remuneration Committee ReportThe Nomination and Remuneration Committee consists of five Non-Executive members. Seven meetings were held in 2018. The Nomination and Remuneration Committee assessed and discussed:
• Review of the Executive Long Term Incentive Plan as part of the overall Remuneration Policy;
• Succession planning and talent management/management development;
• Strengthening of the internal organization with key positions;
• The Board’s profile and composition;
• Share ownership guidelines;
• Retention program in the United States;
• Scenario analysis on the value of the outstanding share plans;
• Evaluation of the 2018 targets for the Executives; and
• Setting 2019 targets for the Executives.
More information on the remuneration policy and the 2018 remuneration review can be found in the Remuneration Report on page 92.
The Health, Safety and Environment Committee Report The Health, Safety and Environment (HSE) Committee consists of three Independent Non-Executive members. Six meetings were held in 2018 including site visits to BioMCN, OCI Beaumont and Natgasoline.
The HSE Committee reviewed and discussed:
• 2018 HSE Strategy;
• Review of the HSE organization;
• Quality and outcome of the HSE audits;
• 2018 HSE performance;
• Benchmark of OCI’s HSE statistics;
• Dutch Safety Board report on Chemelot and impact on OCI Nitrogen;
• Climate Agreement in the Netherlands;
• Reporting system on incidents to the HSE Committee and crisis management;
• Energy and environmental developments;
• HSE award;
• Assessment of the 2018 HSE targets; and
• Setting 2019 HSE targets
More information on HSE can be found in the 2018 Sustainability Report beginning page 44.
Compliance with the Dutch Corporate Governance CodeThe Dutch Corporate Governance Code was amended end 2016 and OCI then amended its governance where necessary. In accordance with the Dutch Corporate Governance Code’s ‘comply or explain’ principle, OCI has outlined below departures from the Dutch Code to ensure full transparency.
• OCI does not meet the target figure on gender balance, even though when performing searches for senior management positions, recruiters are instructed to focus on female candidates. In case of a vacancy in the Board, we will use all efforts to find a suitable female candidate. However, based on experience, the female talent pool for Fertilizer/Chemical companies is limited. We will also focus on adding more female managers at mid-level to increase chances of our internal pipeline delivering female senior managers.
Potential Conflicts of interestPotential or actual conflicts of interest are governed by the Company’s Articles of Association and By-Laws. A Director shall immediately report any conflict of interest or potential conflict of interest that is of material significance and may not take part in any discussion or decision-making that involves a subject or transaction in relation to which he has a potential conflict of interest with the Company. Personal loans are prohibited in our Code of Conduct. OCI complies with provisions 2.7.3 2.7.4, 2.7.5 and 2.7.6 of the Dutch Corporate Governance Code.
In December 2017, NNS Luxembourg S.à.r.l. provided OCI with a credit facility and in March 2018 with another short-term facility. Both facilities were repaid in April 2018 after OCI completed the refinancing of its existing debt. In 2016 JP Morgan issued an irrevocable standby letter of credit at the request of NNS Holding to OCI N.V.. The letter of credit matured as per 31 December 2018 after no commitments were outstanding. The Board discussed and approved these facilities, including the main terms thereof. The CEO and Mr. Guiraud in his capacity as CEO of NNS Capital Ltd. and board member of NNS Luxembourg S.à.r.l. excused themselves from participation and decision making.
Related party transactions:
The overview of the related party transactions is disclosed in the Financial Statements in note 30.
Board rotation scheduleDirectors shall retire periodically in accordance with a Rotation Plan agreed on by the Board, outlined in the table below, in order to avoid, as far as possible, a situation in which many Directors retire at the same time. Directors are appointed for a one-year term and are eligible for reappointment. In line with the revised Dutch Governance Code a Non-Executive Director may not serve for more than eight years with the option to extend four times on an annual basis. There is no maximum term for Executive Directors.
NameDate of first appointment Reappointment
Final retirement Max. 2x4 yrs
Nassef Sawiris 16 January 2013 2019 None
Hassan Badrawi 24 May 2018 2019 None
Michael Bennett 25 January 2013 2019 2021
Jan Ter Wisch 25 January 2013 2019 2021
Sipko Schat 9 December 2013 2019 2021
Jérôme Guiraud 26 June 2014 2019 2022
Robert Jan van de Kraats
26 June 2014 2019 2022
Greg Heckman 10 June 2015 2019 2023
Anja Montijn 28 June 2016 2019 2024
Board InvolvementMembers of the Board regularly visit one or more of OCI N.V.’s businesses, operations and other parts of the Company to gain greater familiarity with senior management and to develop deeper knowledge of local operations, opportunities and challenges and the business in general. In 2018 the Board visited BioMCN, OCI Beaumont and Natgasoline and trained on Risk Management and Cyber security.
Board MeetingsThe Board held six meetings in 2018. During the year, the Board focused on matters contributing to medium and long-term value creation, including:
• Refinancing strategy;
• Refurbishment second line of BioMCN M2;
• Completion of Natgasoline;
• Marketing joint venture in North America;
• Operational performance and cost control;
• Succession planning;
• Organizational design and management development;
• Buyout and delisting of OCI Partners LP's Common Units
• Debt capital structure optimization;
• Review of the Executive Remuneration Policy;
• Climate Agreement in the Netherlands and impact on the Dutch business’ viability;
• HSE;
• Composition of the Board and Committees;
• Crisis management; and
• Cybersecurity.
The Board continued to be involved in shaping the strategy through regular discussions, and focus on supervising the following medium to long term strategic targets:
• Target to achieve investment grade;
• Continue assessing the consolidation in the market; and
• Focus on operational efficiency and cost-saving.
Board CommitteesThe Board of Directors maintains three committees as part of its supervisory role: the Audit Committee, the Nomination & Remuneration Committee and the Health, Safety and Environment Committee. These committees are Non-Executive committees. The following reports comment on how the duties of the committees were carried out during the financial year and contain the topics that were reviewed and advised on.
The Audit Committee ReportThe Audit Committee consists of four Non-Executive members who are mandated with monitoring and supervising activities related to the Company’s financial, internal audit, compliance and tax performance. Robert Jan van de Kraats has competence in accounting or auditing ex section 2(3) of the Audit Committee Decree 2016.
Seven Audit Committee meetings were held in 2018. In accordance with its Charter, the Audit Committee reviewed the annual report including the 2018 financial statements and non-financial information prior to its publication.
Apart from the financial accounts, the Audit Committee reviewed and advised on:
• Risk Management and Internal Controls;
• IT and IT security;
• In-control statement and underlying in-control situation;
• Related Party Transactions;
• Tax review and policy;
• Refinancing;
• Compliance Framework;
• Evaluation year-end closing process;
• Litigation; and
• An assessment of the functioning of the external auditor, its appointment, including scope, risk analysis and materiality.
One Audit Committee meeting was dedicated to mapping and discussing the strategic risks and internal controls and another Audit Committee meeting was dedicated to IT security.
The Company’s external auditor is KPMG Accountants N.V. The external auditor attended all Audit Committee meetings in 2018.
The Chairman met with the internal and external auditor in advance of every Audit Committee meeting to secure all relevant issues to be sufficiently addressed. The Audit Committee met with the external auditor twice during the year without the presence of management.
BOARD REPORT CONTINUED
82 OCI N.V. Annual Report 2018 OCI N.V. Annual Report 2018 83
Corporate Governance
Other Inform
ationP
erformance R
eviewO
perational Strengths
Co
rpo
rate Go
vernanceS
ustainability Review
Financial Statem
ents

Risk management approachOur businesses inherently involve risks. Our management is cognizant of these risks and takes a measured mitigation approach. Our Board and management foster a transparent company-wide approach to risk management and internal controls, driven by our conviction that risk management is most effective when it is aligned with our strategy, is integrated at all management levels, and is as dynamic as the industry and environments where we operate which allows us to quickly act on value creation opportunities.
Risk management is a company-wide activity with roles and responsibilities
allocated across all levels of the group to secure our in-control position. We follow a bottom up approach to ensure that all relevant business risks are identified, managed and reported in a timely and comprehensive manner. The Board has the overall responsibility of maintaining a sound and effective risk management and internal control program. The Audit Committee supports the Board in monitoring our risk exposure, including the design and effectiveness of our internal control program. The internal Audit & Risk team is integrated across operating companies and is being centrally managed at the group level to ensure our Internal Control Framework (IFC) is properly institutionalized and applied, that
Operating Companies (OpCo’s) Management and Internal Controls• First line of defence responsibility for the establishment
of an effective control environment based on corporate directives and policies.
• Weekly business updates to Corporate office functions.
• Detailed monthly review of performance, financials, operating issues, and key risks.
• OpCo’s manage their key risks based on semi-annual risk self-assessments and quarterly updates of their business risk profiles and report to relevant Corporate functions and executive directors.
• Each OpCo has a local Internal Control Officer who is responsible for supporting local management on the effective implementation of internal controls.
• A detailed budget for each subsidiary is prepared and presented to management in the fourth quarter of each preceding year, and includes a one year forecast. Budgets are updated monthly to account for actuals, and the forecasts are updated three times a year, allowing management to make real-time assessments.
• Each year, local management sign the Non Financial Letter of Representation to certify the in-control position in relation to the Code of Conduct, Corporate policies and other non-financial requirements.
• Operational, health, safety, environmental, quality systems are in place at each subsidiary. All our subsidiaries have been awarded relevant certifications, including ISO and REACH, among others. Insurance policies are in place to provide full coverage for our various operating entities.
Corporate Management and Internal Controls• Consolidated OCI N.V. budget and
forecast is used by management to evaluate performance indicators, investment strategy, and operations.
• Each quarter, Corporate management monitors and assesses the consolidated group risk profile comprising of strategic, operational, financial and compliance risks with the involvement of key executives and corporate function heads.
• Internal Audit & Risk facilitates and supervises the risk management process, compliance with OCI’s policies and controls, and proactively advises on further optimization of the internal control system.
• In collaboration with the Director Internal Audit & Risk, the CFO and Group Controller provide guidance on internal and financial controls that must exist for each process at the subsidiary and holding company levels and monitor the implementation of these controls.
• Additional control leadership from Corporate Technical and HSE, Compliance, Internal Control, Legal, Tax, Strategic Planning, and Group Controller.
Corporate Oversight• Board of Directors is given a full
financial and operational update by the Executive Directors at each Board meeting.
• Quarterly reporting by the Internal Audit & Risk department to the Audit Committee of the results from internal audits, OpCo risk assessments and Group consolidated risk dashboard. The reports highlight the assessed level of effectiveness of actions taken to mitigate the risks, the risk trends and the status for each of the individual risks.
• Internal Audit & Risk performs periodic independent internal audits to review any specific issues at the subsidiary and holding company levels. Management is consulted on performance developments and gaps and remediation plans.
• Internal Audit & Risk maintains a central repository for the monitoring of mitigating actions and trends in relation to each risk, and aides the Board in maintaining objectivity in its risk assessments.
• The progress of audit action plans is monitored by the Internal Audit & Risk department, local internal control officers and by local as well as Corporate senior management.
we have effective and up-to-date internal control and internal audit systems in place, and that we are aligned with our external audit partners. We will continue to institutionalize and streamline our ICF across the group in line with the roadmap that is reviewed by the Audit Committee every quarter.
Our IFC aligns with the Enterprise Risk Management Integrated Framework of COSO and the Dutch Corporate Governance Code and is designed to provide reasonable assurance that the risks we face are properly evaluated and mitigated, and that management is provided with all information necessary to make informed decisions.
Executive DirectorsOverall responsibility for implementing risk management, focusing on risks in relation to strategy and value creation
Oversight, Tone, Strategy
Operational responsibility, reporting
STRATEGIC Description Risks that may impede our ability to achieve strategic objectives that we believe are critical to our performance and growth. These are risks that are considered strategic matters for the Board and Executive Directors, and may impact the company as a whole.
Risk appetite As a leading player in our markets, we are able to take certain calculated strategic risks that create opportunities to maximize our ability to deliver outstanding value to our shareholders. Our ability to adapt our risk management to meet the requirements of our global positioning and diversified exposure to emerging and developed markets is key to maintaining our success.
Below is a summary of our key business risks with management’s assessment of each risk’s potential development: Economic and political conditions in the markets in which we operate
Egypt tax verdict appeal
Risk of adverse sovereign action
OPERATIONAL Description Risks that may impede our ability to achieve operational objectives and performance. These risks can be internal or external, and are typically directly managed and monitored by the local management teams of each operating company and supervised by our Executive Directors.
Risk appetite We aim to minimize operational risks while maximizing our ability to capitalize on our leadership positions in our markets. We strive to maximize operational efficiency and stability at all facilities while fostering a safe and entrepreneurial environment for our employees and the environment in general.
Below is a summary of our key business risks with management’s assessment of each risk’s potential development: Cost of production
Buisness interuption
Commodity pricing and over-supply risk
Business continuity and competition
Risks associated with our partnerships
Human capital
Cybersecurity Risk
FINANCIAL Description Risks related to financial, accounting, and reporting controls and processes that may impede our ability to meet financial commitments, obligations, and daily operating needs.
Risk appetite We implement a financial strategy to maintain an efficient balance sheet whilst securing good access to financing. Our key policies are described throughout the annual report.
Below is a summary of our key business risks with management’s assessment of each risk’s potential development: Ability to raise debt or meet financing requirements
Currency fluctuations
REGULATORY Description Risks related to changes in laws and regulations, including HSE, tax, and financial reporting, and other legislation that may require changes in the way we do business.
Risk appetite We comply with applicable laws and regulations everywhere we do business. All employees are bound by our Code of Conduct, which we are continuously embedding throughout the Company. It is in the values of the Company and its employees to act with honesty, integrity and fairness to foster a business climate that maintains such standards.
Below is a summary of our key business risks with management’s assessment of each risk’s potential development: Regulatory conditions in the markets in which we operate
Ability to maintain our health, safety and environment (HSE) standards
Our key business risks with management’s assessment of each risk’s potential developmentOur risk appetite is flexible to account for our diversified market presence and product portfolio, and is tailored to four main categories
Risk decreasing
Risk stable
Risk increasing
Risk Trend
RISK MANAGEMENT
Board of DirectorsSets risk appetite and responsible for overseeing the Group’s Internal Control, with focus on relevant risks at each Board committee
84 OCI N.V. Annual Report 2018 OCI N.V. Annual Report 2018 85
Corporate Governance
Other Inform
ationP
erformance R
eviewO
perational Strengths
Co
rpo
rate Go
vernanceS
ustainability Review
Financial Statem
ents

Risk Risk management approach
OPERATIONAL
Cost of production
Our cost of production is primarily dependent on the availability and cost of natural gas, the primary feedstock in manufacturing our products. Our costs are also subject to fluctuations in the cost of labour, other raw materials, and foreign exchange rates.
Our success is dependent, in part, on our continued ability to manage cost fluctuations through pricing actions and cost savings. We have hedged our global exposure to natural gas price fluctuations through a mix of long-term contracts in Egypt and Algeria, and spot prices in the United States and The Netherlands, where we also take opportunistic hedge positions.
We continuously identify, implement, and sustain cost improvement plans, including our outsourcing projects and those related to general overhead and workforce rationalization.
Business interruption
Our production facilities may experience unplanned shutdowns or utilization rate reductions, which may result in lost volumes and unplanned costs.
We have consistently invested heavily in best-in-class technologies at all our facilities, which maximizes reliability and efficiency. Our facilities are on average the youngest in the industry with approximately 50% of our production capacity under five years old, which supports above-average utilization rates and low maintenance costs. We have also invested heavily in our older facilities to refurbish, debottleneck, and improve efficiency and reliability.
We have a well-developed preventative maintenance system, including scheduled maintenance turnarounds, frequent follow ups on action items from previous shutdowns, and regular knowledge-sharing amongst all sites. We maintain adequate spare parts positions and winterization (where appropriate) as we all as reliability initiatives where required. For large and extended shutdown events, our plants have business interruption insurance.
Business continuity and competition
The industries in which we operate are highly competitive. The products we manufacture are global commodities with little or no product differentiation, and customers make their purchasing decisions principally based on delivered price. Our business continuity is dependent on our ability to maintain our competitive advantage.
Our products are roughly evenly split between industrial chemicals and nitrogen fertilizers, and no single product represents more than 25% of our capacity. Moreover, our diversified product mix is exposed to a variety of cyclical and seasonal patterns which mitigates the impact of an individual product's fluctuations and results in a more stable revenue stream. We also occupy a leading market position in many of our products.
We have policies in place to respond to competitive factors and maintain mutually beneficial relationships with our key customers to effectively compete and achieve our business plans. We have global sales, marketing, distribution and logistics teams that work diligently to expand our sales channels, develop new and repeat customer relationships, negotiate favorable contracts, and create market contacts by attending various industry and trade conferences.
Our production and manufacturing teams also work diligently to ensure our plants operate efficiently to produce high quality products that meet or exceed international standards. Our products and processes are certified by global quality control institutions.
Risk Risk management approach
STRATEGIC
Economic and political conditions in the markets in which we operateOCI N.V. does business in both developed and emerging markets, which means that we are exposed to some countries where there is a risk of political or socioeconomic instability.
Accordingly, developments in any of the countries in which we operate can create an uncertain environment for investment and business activity and may adversely impact our business.
We mitigate the impact of potential weaknesses in any single market by diversifying our presence, both in terms of sales destinations and the geographic locations of our production facilities, which are located in emerging and developed markets.
Our run-rate production capacity of 14 million metric tons is evenly split geographically, with 41% in the USA, 27% in Europe, and 32% in North Africa. In addition, we sell our products around the world, reaching 63 countries in 2018.
We actively monitor economic, political and regulatory developments and maintain positive relationships with various governmental bodies in the countries where we operate as part of our effort to be a ‘local’ player in each of our markets.
Egypt tax verdict appeal
In October 2012, the Egyptian Tax Authority (ETA) raised a tax evasion claim against our Egyptian subsidiary, Orascom Construction Industries S.A.E. (OCI S.A.E.). The tax dispute was related to the sale of OCI S.A.E.’s cement assets to Lafarge SA in 2007. This was filed against OCI S.A.E. despite there being no official investigation. Although OCI S.A.E. and its tax and legal advisors believed that the aforementioned transaction was exempted of tax, management entered into a settlement agreement with the ETA to resolve the tax dispute whereby EGP 7.1 billion would be paid by OCI S.A.E. over a five-year period. The agreement was followed by payment of a first instalment of EGP 2.5 billion in 2013.
Following the change in government, the company was fully exonerated by the Egyptian Public Prosecutor on 18 February 2014 and subsequently by the ETA's Independent Appeals Committee on 4 November 2014. The ETA appealed this decision without including new facts or documents. The appeal is ongoing.
OCI S.A.E. and its local counsel believe the likelihood of a judgment in favor of the ETA is not probable.
As this dispute is a legacy case prior to the demerger of the construction group that formed Orascom Construction PLC (OC) in 2015, any liabilities and any recoveries are shared under the Tax Claim Agreement on a 50:50 basis between OCI N.V. and OC. As of December 31, 2018, should the ETA win their appeal, OCI’s maximum share of the tax claim would be EGP 2.3 billion, which equates to approximately $128.6 million.
For additional information, please refer to note 27 of our financial statements.
Risk of adverse sovereign action
Our North African assets represent 32% of our run-rate production capacity. These facilities are in Egypt and Algeria, where we are exposed to a greater than average risk of adverse sovereign action, including overt or effective expropriation or nationalization of property, the renegotiation of contract terms, the implementation of export controls on commodities regarded by them as strategic, the placement on foreign ownership restrictions, or changes in tax structures or free zone designations.
We work closely with the governments in the countries in which we do business to maintain positive working relationships. Although there is no guarantee that the government of a location where we operate will not adopt adverse policies, we have worked to minimize this risk through watertight contracts for our assets and government agreements.
Our legal team also works diligently to monitor and review our practices and any changes in laws or regulations in the countries where we operate to provide reasonable assurances that we remain in line with all relevant laws.
Management has also drafted contingency plans for various unforeseen events and adverse scenarios.
86 OCI N.V. Annual Report 2018 OCI N.V. Annual Report 2018 87
Corporate Governance
Other Inform
ationP
erformance R
eviewO
perational Strengths
Co
rpo
rate Go
vernanceS
ustainability Review
Financial Statem
ents
RISK MANAGEMENTCONTINUED
Risk Risk management approach
OPERATIONAL
Commodity pricing and over-supply risk
A change in market dynamics in the industries of our fertilizer and industrial chemicals production portfolio, such as over-supply, may result in lower product prices, which would adversely impact our margins.
We have a diversified production portfolio comprising two distinct sectors: nitrogen fertilizers and industrial chemicals, which are estimated to contribute equally to our capacity on a run-rate basis.
These sectors have inherently different industrial dynamics, including different supply/demand drivers, seasonal cycles, customers, competitors, and other factors that may affect prices. This mitigates the risk of potential downturns in any of our products or sectors. We are also geographically diversified in emerging and developed markets to reduce market-related risks.
Risks associated with our partnerships
We participate in partnerships including Natgasoline, Sorfert Algérie, Egypt Basic Industries Corporation, and N-7 LLC. Our investments in partnerships involve various economic, operational, and legal risks that are different from the risks involved in owning facilities and operations independently. In addition, our ability to apply OCI’s governance and internal control standards could be affected by country specific risks and the work boundaries under our JV agreements.
The Shareholders Agreements for our partnerships include clauses that protect OCI N.V.’s economic and operating interests as much as reasonably possible.
We maintain close working relationships with our partners and monitor the operating and financial results of the partnerships in which we hold minority stakes or do not have management control. In our larger partnerships, such as Natgasoline, EBIC, Sorfert and N-7, we retain management control and/or seats on each partnership’s Board of Directors.
In addition, we constantly review all businesses to determine whether they continue to be core assets worth retaining on a long-term basis. This is particularly applicable to businesses in which we do not have management control. If a business becomes non-core or has reached a certain level of maturity, we actively pursue monetizing the business through divestment.
Finally, our Corporate Internal Audit & Risk team performs audit reviews of our JV operations’ governance, risk management, and internal controls to provide additional assurance to our Board of Directors.
Human capital
Our ability to employ, develop, and retain talented employees is essential to maintain our high-quality operations and management.
We have been able to attract, motivate and retain knowledgeable and experienced employees due to our reputation and market position, our in-house training and talent development programs, our Employee Incentive Plans (as described in note 21 of the financial statements), as well as our strategic partnerships with industry leaders, which offer employees exposure to high profile projects and advanced technologies.
Cybersecurity
Despite our IT security measures, our information technology and infrastructure may be vulnerable to cyber-attacks or breached due to unforeseen control deficiencies. Any such breach could result in business disruption or compromise our systems and result in downtime or leak of personal and/or business sensitive data adversely affecting our reputation.
We continuously implement up-to-date security procedures and measures to strengthen our security posture and minimize our vulnerabilities to cyber-attacks. We believe these measures and procedures are appropriate.
Our internal IT team is focused on the monitoring and enhancement of our IT security capabilities across the group for both our IT infrastructures and plant process control systems. In addition, we engage with external security experts to support the implementation of various action plans that are part of our comprehensive cyber security management system.
We run internal and external security assessments across the group to ensure that our risk levels are appropriate. We have also closed a group wide cyber insurance program as last line of defence. Additionally, we regularly run IT audits and security assessments with the supervision of Internal Audit & Risk.
Risk Risk management approach
FINANCIAL
Ability to raise debt or meet financing requirements
Our ability to complete strategic acquisitions and greenfield projects or refinancing existing debt is contingent on our access to new funding.
Although we strive to ensure that adequate levels of working capital and liquidity are maintained, unfavorable financial market conditions may adversely affect our financing costs, hinder our ability to achieve additional financing, and/or hinder our ability to refinancing existing debt. This could therefore have an adverse impact on our business prospects, earnings and/or our financial position.
We strive to maintain a strong financial position and creditworthiness with our creditors. We closely monitor our cash position and credit lines to ensure our financial flexibility. We have also diversified our funding sources to avoid dependence on a single market, and have staggered our debt maturity profile to reduce repayment burdens. OCI has robust in-house financing expertise and a proven track record in both refinancing debt and accessing new funding.
Currency fluctuations
A substantial portion of the Company’s consolidated revenue, operating expenses and long-term debt is denominated in foreign currencies. Significant changes in the exchange rates of operational currencies, which include the US Dollar, the Euro, the Egyptian Pound, and the Algerian Dinar, can have a material effect on the reported and actual financial performance of the Company.
We hedge our foreign exchange cash flow risk on a consolidated basis by matching our foreign currency-denominated liabilities with continuing sources of foreign currencies.
Risk Risk management approach
REGULATORY
Regulatory conditions in the markets in which we operate
Changes in laws, regulations and the related interpretations may alter the environment in which we do business. This includes changes in environmental, health and safety, competition and product-related laws and regulations, as well as changes in accounting standards and taxation requirements. Failure to comply with these laws may result in substantial fines, penalties or other sanctions such as the obligation to invest in newer equipment, permit revocations or facility shutdowns. Consequently, we may experience delays in obtaining or be unable to obtain required permits, which may delay or interrupt our operations. Our ability to manage regulatory, tax and legal matters and to resolve pending matters within current estimates may impact our results.
We actively monitor regulatory developments to ensure we comply with the laws and regulations of the countries where we operate, including
HSE legislation to maintain our licenses to operate. Additionally, we actively provide comments and feedback regarding proposed or draft rules when given the opportunity, specifically when the said draft rules are open for public comments.
As a result of the Paris Climate Agreement, our Dutch operations are part of a group of companies engaged in the ongoing dialogue with Dutch government regarding new carbon dioxide emissions regulations. We are also engaged in ongoing lobbying on the national and European levels to enhance cooperation and transparency between regulators and the fertilizer and chemical industries.
Ability to maintain our health, safety and environment (HSE) standards
HSE is a vital aspect across the group. We have a deep commitment to maintaining our strong HSE track record. Despite the nature of our businesses, we aim to prevent every accident through stringent HSE rules, standards and training programs.
We implement strict HSE training and operating discipline at every plant to minimize HSE risks, and we closely monitor our plants through regular site visits and audits. Our safety and emissions records meet or exceed international standards, underscoring our commitment to providing our employees with a safe, secure and environmentally conscious workplace.
In addition, the HSE Committee supervises our HSE activities, as described in the HSE Committee report.
88 OCI N.V. Annual Report 2018 OCI N.V. Annual Report 2018 89
Corporate Governance
Other Inform
ationP
erformance R
eviewO
perational Strengths
Co
rpo
rate Go
vernanceS
ustainability Review
Financial Statem
ents
RISK MANAGEMENTCONTINUED

COMPLIANCE
Compliance GovernanceThe Group Compliance Officer, in close collaboration with the Board of Directors, provides an adequate compliance framework, consisting of the Compliance Program and all its compliance activities.
The Integrity Committee, comprising of the CFO and the Group Compliance Officer, handles incidents of a severe nature. The Integrity Committee did not meet in 2018, as no incident of a (potential) severe nature was reported.
Management of Operating Companies and staff departments are responsible and accountable for raising compliance awareness within their respective businesses and departments.
During the year, several parts of the compliance program were further implemented, both by the OCI compliance community as a whole and by individual operating companies. This included the roll-out of a Group wide e-learning platform covering Anti-bribery and Corruption, as well as the implementation of compliance policies such as the Anti-bribery and Corruption Policy and the Privacy and Data Protection Policy.
Through the quarterly reporting structure, the Local Compliance Officer ensures that alleged breaches of our Code of Conduct or any other compliance incidents are not only reported to Operating Companies’ management for appropriate action, but also to corporate leadership.
Compliance ManagementOCI strives to conduct all business activities responsibly, transparently, and with integrity and respect towards all stakeholders. These values underpin everything we do and form the essence of our Code of Conduct. Our values form the framework which defines the day-to-day attitudes and behaviors of our employees. To make those values clear the Code of Conduct outlines in specific terms what we stand for as a company and the conduct required in the workplace, in how we deal with business partners, serve our customers and also, the broader responsibilities we have to the communities in which we work and live.
The effectiveness of the Code of Conduct is monitored through our Compliance Program, which provides assurance that all employees are aware of and committed to our Code of Conduct. In conjunction with OCI’s Whistleblowing Policy, the Code of Conduct provides a safe and confidential procedure to raise any concerns and breaches.
OCI is subject to local, regional and international laws and regulations in countries where we conduct business. We are monitoring and adapting to significant and rapid changes in legal and compliance areas to ensure that the Code of Conduct and the Compliance Program, including internal policies and guidelines remain suited for purpose and are properly applied.
Code of ConductThe Code of Conduct describes OCI’s values for conducting business: we conduct our operations with the highest standards of honesty, integrity, and fairness. We foster a business environment that protects the rights and interests of all stakeholders.
The Code of Conduct serves as a framework for all our employees and affiliates, defining in specific terms what we stand for as a company and the day-to-day conduct required in the workplace, in how we deal with business partners, in how we serve our customers and, the broader responsibilities we have to the communities in which we work and live. It also sets out rules on important topics such as the prohibition of bribery, dealing with confidential information, and conflicts of interest, addresses the importance of accurate record keeping and reporting, and explains the possibility of disciplinary measures when in breach of the Code of Conduct.
The Code of Conduct, the Whistleblowing policy and other specific policies such as the Anti-bribery policy are communicated to all employees. Employees receive training that aims to enforce the understanding and practical application of the rules and principles described in these policies. The effectiveness of and compliance with the Code of Conduct is maintained through regular communication and training, adequate handling of incident notifications, and quarterly reviews between management and Local Compliance Officers. Additionally, the Audit Committee receives a Quarterly Compliance Report.
Whistleblowing policy and incident reporting channelsAs part of our commitment to maintaining a positive workplace with a shared sense of purpose, we provide the option to safely report concerns.
Employees are encouraged to promote ethical behavior and should encourage other employees to talk to supervisors or managers when in doubt about the best course of action in a particular situation. Within OCI, employees on all levels are encouraged to report, in good faith, any suspected misbehavior or malpractice to their immediate or next higher-level manager, including possible violations of laws, rules and regulations. We have further facilitated anonymous reporting by establishing an independent anonymous hotline.
All reports are handled with the utmost care and confidentiality, regardless if reported internally or via the anonymous reporting hotline. In 2018 we continued to actively encourage employees to report (potential) incidents. As a result, incident notifications increased to in total of 15 for 2018. All notifications were handled and, where necessary, further investigated.
Bribery and Corruption RiskThe risk of bribery and corruption is addressed in OCI’s Code of Conduct and further explained in the Anti-bribery and Corruption Policy. Guidance on understanding the risk of bribery and corruption has been provided to relevant employees in combination with the e-learning on bribery and corruption.
Insider TradingMembers of the Board of Directors and senior management of Operating Companies are made aware of their obligations under the OCI N.V. Insider Trading Policy.
In 2018 the Group Compliance Officer set the annual agenda for closed trading periods and kept the list of permanent and incidental insiders.
Compliance with International Sanctions legislationIn 2018 measures where initiated to ensure compliance with international sanctions legislation, including updating clauses in commercial contracts and the selection of a tool to screen third parties on compliance, including the risk of sanctions violations. This tool will be implemented in 2019.
Privacy and Data ProtectionThroughout 2018 we continued to implement company-wide project to ensure compliance with the European General Data Protection Regulation.
Compliance ControlsAt the start of every year the Group Compliance Officer, in collaboration with business management, sets the annual compliance agenda. The agenda consists of continuous and new compliance activities and requirements, to ensure growth in maturity of the Compliance Program. These activities and requirements are concrete and measurable, and are reported internally on a quarterly basis, and can be tested on their effectiveness. Through this annual agenda compliance controls are continuously developed and enhanced for effectiveness.
Non-Financial Letter of Representation (NF LoR)At the end of the year, the CEO and CFO of each Operating Company sign the NF LoR to confirm compliance with the Code of Conduct and other corporate non-financial requirements. The outcome is reviewed by the CFO, the Group Compliance Officer and the Director Internal Audit & Risk and the results are reported to the Audit Committee and the Board of Directors.
Reported outstanding actions are followed up on by the Internal Audit department and monitored in quarterly reviews. The outcome of the NF LoR process, in combination with the internal control self- assessments, the HSE reports, the Compliance reports, the risk assessments and the performed internal audits, establishes the basis for the In Control Statement of the Board of Directors in this Report.
Ambition, Strategy, Scope,
Tone-at-the-Top
Compliance principles Compliance organizations
Compliance monitoring Compliance reporting Incident managementCompliance risk
assessment
Compliance with international
sactionsBreach of CoC
Competition & antitrust
Anti bribery& corruption
Insider trading & market abuse
Whistle-blowerThird party
interaction & control
Privacy & data protection
90 OCI N.V. Annual Report 2018 OCI N.V. Annual Report 2018 91
Corporate Governance
Other Inform
ationP
erformance R
eviewO
perational Strengths
Co
rpo
rate Go
vernanceS
ustainability Review
Financial Statem
ents

IntroductionOn behalf of the Board, I am pleased to present our new proposed Remuneration Policy (effective 1 January 2019 subject to shareholder approval at the forthcoming annual general meeting (AGM)) and the Remuneration Report which details how the current approved Remuneration Policy (approved in 2015) was applied in 2018.
The Nomination & Remuneration Committee (the Committee) oversees the Remuneration Policy, remuneration plans and practices of OCI N.V. and recommends changes when appropriate. The Committee is comprised of a majority of Independent Non-Executive Directors from the OCI N.V. Board of Directors.
This 2018 Remuneration Report consists of two sections:
1. Proposed Remuneration Policy: Our current Remuneration Policy was approved by shareholders at our 2015 AGM; this governs remuneration for both Executive and Non-Executive Directors (it is available on the corporate website: http://www.oci.nl/corporate-governance/board-profile). This year, with support from our external advisers, we reviewed our remuneration arrangements in order to provide a simpler structure at similar cost. As such, we are proposing minor changes to simplify the current Remuneration Policy.
The current Remuneration Policy provided good alignment between executive remuneration and shareholders’ long-term interests. However, our new proposed Remuneration Policy further cements the alignment and adopts some new features to reflect developing best practices in corporate governance. This review incorporated the views of our Board (both Executive and Non-Executive Directors), our HR function and other senior executives.
2. Actual Remuneration Report: Details how remuneration arrangements have been operated during the past financial year and actual remuneration paid to the Executive and Non-Executive Directors.
During 2018, following a tendering process, the Committee reappointed Mercer Limited (Mercer) to advise it on senior executive and Board remuneration including the Remuneration Policy review. Mercer is a founder member of the Remuneration Consultants Group and, as such, operates under its code of conduct. The Committee is comfortable that the advice given by Mercer has been and remains objective and independent.
Summary of proposed changes to the Remuneration PolicyOur review of the Remuneration Policy took into account various factors including the strategic opportunities and challenges OCI may face in the next few years, the external corporate governance environment, the views of our employees and commentary from shareholders and advisory bodies.
As a result of our company-wide review of remuneration arrangements, it was decided to discontinue the Share Matching Plan for all eligible employees. Current matching rights will continue to vest at their normal vesting date, but no new awards will be made after those made in 2018 (in relation to deferral of 2017 bonuses). The Committee determined that the Share Matching Plan added complexity to the package and was an unusual
approach in our industry, particularly in the key US talent market.
The proposed Remuneration Policy increases the Performance Share Unit Plan (“PSP”) awards in lieu of the loss of the share match such that the incentive package offers a comparable opportunity while remaining weighted to the longer-term.
Our proposed changes may be summarized as follows.
• Under the current Remuneration Policy, our Executive Directors could use up to 50% of their bonus after tax to voluntarily purchase OCI N.V. shares. If those shares were held for three years, they would be matched on a 1:1 basis under the Share Matching Plan. The Share Matching Plan will be discontinued under the new proposed Remuneration Policy.
• The PSP award will be increased to reflect the lost share matching rights under the Share Matching Plan. Executive Directors will be granted annual on-target awards of 125% of gross annual base salary (previously 100% of gross annual salary) The maximum opportunity will remain at 150% of on-target.
• The TSR peer group constituents for the PSP awards were reviewed and updated for the merger between Agrium and Potash Corporation. AkzoNobel was removed as it is no longer considered a strategically relevant comparator for OCI. In addition, the Committee decided to alter the weighting of selected peers, which are closest to OCI in terms of competitiveness, so that they are doubly weighted for the purposes of the TSR ranking calculations. These changes are considered by the Committee to be neutral in terms of the difficulty of earning payments under the PSP.
• In line with best practice, formal share ownership guidelines were introduced for our Executive Directors effective on 1 December 2018 (available on the corporate website: http://www.oci.nl/corporate-governance/board-profile). For the CEO the guideline is a holding of 300% and for the CFO 150% of gross annual base salary. Executive Directors will have five years from the date of implementation of the share ownership guidelines (or appointment to the Board for future incumbents) to build up this shareholding. Once established the required ownership will not change as a result of any fluctuations in the market price of a share. The Executive Director’s required share ownership will be recalculated at the time of a change in base fee.
Performance and Pay Outcomes in the year
The Committee places great importance on ensuring that there is a clear link between pay and performance and that our remuneration outcomes are reflective of wider company performance within the year.
Salary review
The CEO’s salary has remained unchanged since our listing in 2013 and there is no proposed increase for 2019. The CFO was appointed to the Board of Directors following approval at the 2018 AGM. His salary on appointment was $950,000. Since then he has established himself well in the role and he has also taken on wider operational responsibilities and proven his ability with strong performance. As such from 1 January 2019 his salary was increased to $1,150,000.
Bonus outcomes
As a result of the OCI group’s operational and overall performance and the Executive Directors’ strategic and individual performance, the Committee determined that both Executive Directors will be awarded bonuses of 100% of gross annual base salary.
2015 Performance Share Plan vesting
The performance period for the 2015 PSP award ended during the year 2018. OCI’s TSR performance fell below the threshold target and as a result all of the awards lapsed.
Implementation of the new Remuneration PolicyIn line with our consistent course of action we granted increased target awards of 125% of gross annual base salary to our Executive Directors under the amended PSP on 7 February 2019. The number of performance stock units is based on the gross annual salaries as per 1 January 2019 being $2,000,000 for the CEO and $1,150,000 for the CFO. These awards are contingent on approval of the revised Remuneration Policy and the revised PSP plan at the 2019 AGM. If the revised Remuneration Policy and PSP plan are not approved these awards will lapse.
REMUNERATION REPORT
Remuneration at a glance
RoleChief Executive Officer (CEO)
Chief Financial Officer (CFO)
Old policy
(approved in 2015)Name Nassef Sawiris Hassan Badrawi
Previous salary
(with effect from 1 January 2018)
$2,000,000 $950,000
Bonus for financial year ending 31 December 2018
% of salary 100% of salary 100% of salary
% of maximum 67% 83%
$ total amount $2,000,000 $950,000
Share Matching rights
(awarded in 2018 in relation to deferral of 2017 bonus)
% of bonus deferred
50% 50%
$ amount $381,810 $31,067
Vesting of 2015 PSP award % of salary 0% of salary N/A
% of maximum 0% N/A
New proposed policy
(for approval in 2019)
Annual salary
(with effect from 1 January 2019)
$2,000,000 (+0%) $1,150,000 (+21%)
2019 Target Bonus opportunity 75% of salary 60% of salary
2019 Target PSP award
(subject to shareholder approval)
125% of salary 125% of salary
Share ownership guidelines 300% of salary 150% of salary
We look forward to your support for these proposals at the forthcoming Annual General Meeting.
On behalf of the Nomination & Remuneration Committee
Sipko Schat, Chairman
92 OCI N.V. Annual Report 2018 OCI N.V. Annual Report 2018 93
Corporate Governance
Other Inform
ationP
erformance R
eviewO
perational Strengths
Co
rpo
rate Go
vernanceS
ustainability Review
Financial Statem
ents
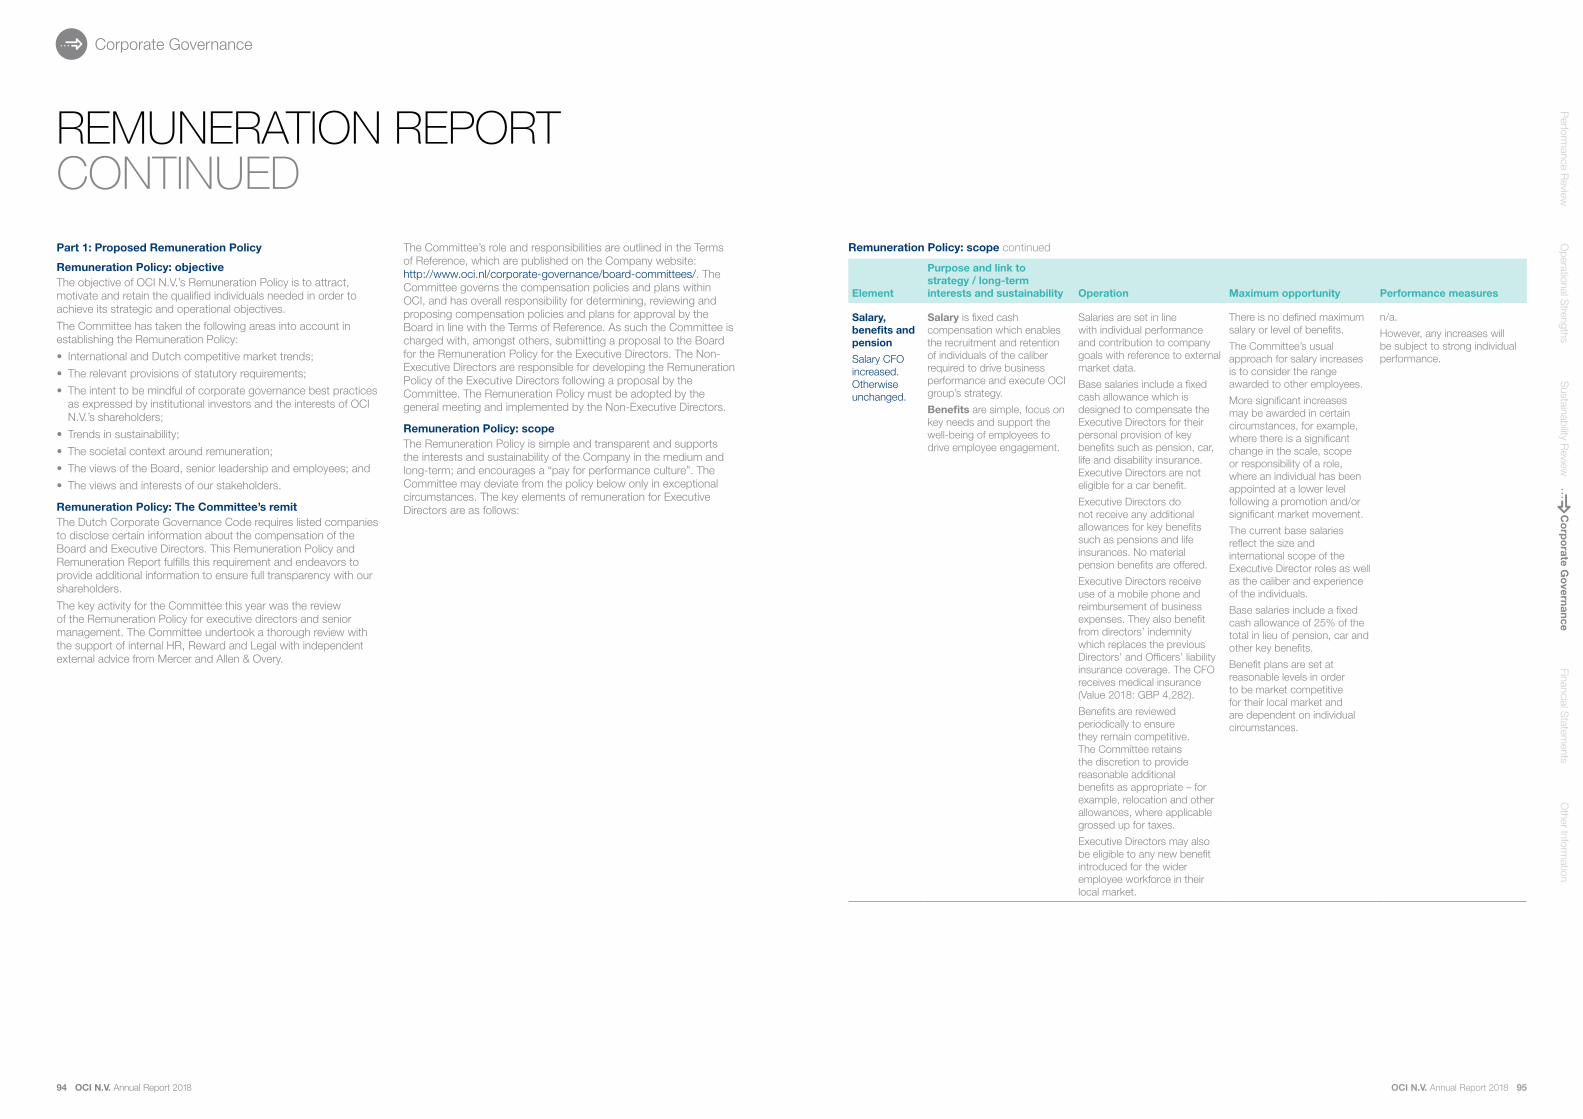
Part 1: Proposed Remuneration Policy
Remuneration Policy: objective The objective of OCI N.V.’s Remuneration Policy is to attract, motivate and retain the qualified individuals needed in order to achieve its strategic and operational objectives.
The Committee has taken the following areas into account in establishing the Remuneration Policy:
• International and Dutch competitive market trends;
• The relevant provisions of statutory requirements;
• The intent to be mindful of corporate governance best practices as expressed by institutional investors and the interests of OCI N.V.’s shareholders;
• Trends in sustainability;
• The societal context around remuneration;
• The views of the Board, senior leadership and employees; and
• The views and interests of our stakeholders.
Remuneration Policy: The Committee’s remitThe Dutch Corporate Governance Code requires listed companies to disclose certain information about the compensation of the Board and Executive Directors. This Remuneration Policy and Remuneration Report fulfills this requirement and endeavors to provide additional information to ensure full transparency with our shareholders.
The key activity for the Committee this year was the review of the Remuneration Policy for executive directors and senior management. The Committee undertook a thorough review with the support of internal HR, Reward and Legal with independent external advice from Mercer and Allen & Overy.
The Committee’s role and responsibilities are outlined in the Terms of Reference, which are published on the Company website: http://www.oci.nl/corporate-governance/board-committees/. The Committee governs the compensation policies and plans within OCI, and has overall responsibility for determining, reviewing and proposing compensation policies and plans for approval by the Board in line with the Terms of Reference. As such the Committee is charged with, amongst others, submitting a proposal to the Board for the Remuneration Policy for the Executive Directors. The Non-Executive Directors are responsible for developing the Remuneration Policy of the Executive Directors following a proposal by the Committee. The Remuneration Policy must be adopted by the general meeting and implemented by the Non-Executive Directors.
Remuneration Policy: scopeThe Remuneration Policy is simple and transparent and supports the interests and sustainability of the Company in the medium and long-term; and encourages a “pay for performance culture”. The Committee may deviate from the policy below only in exceptional circumstances. The key elements of remuneration for Executive Directors are as follows:
Remuneration Policy: scope continued
Element
Purpose and link to strategy / long-term interests and sustainability Operation Maximum opportunity Performance measures
Salary, benefits and pension
Salary CFO increased. Otherwise unchanged.
Salary is fixed cash compensation which enables the recruitment and retention of individuals of the caliber required to drive business performance and execute OCI group’s strategy.
Benefits are simple, focus on key needs and support the well-being of employees to drive employee engagement.
Salaries are set in line with individual performance and contribution to company goals with reference to external market data.
Base salaries include a fixed cash allowance which is designed to compensate the Executive Directors for their personal provision of key benefits such as pension, car, life and disability insurance. Executive Directors are not eligible for a car benefit.
Executive Directors do not receive any additional allowances for key benefits such as pensions and life insurances. No material pension benefits are offered.
Executive Directors receive use of a mobile phone and reimbursement of business expenses. They also benefit from directors’ indemnity which replaces the previous Directors’ and Officers’ liability insurance coverage. The CFO receives medical insurance (Value 2018: GBP 4,282).
Benefits are reviewed periodically to ensure they remain competitive. The Committee retains the discretion to provide reasonable additional benefits as appropriate – for example, relocation and other allowances, where applicable grossed up for taxes.
Executive Directors may also be eligible to any new benefit introduced for the wider employee workforce in their local market.
There is no defined maximum salary or level of benefits.
The Committee’s usual approach for salary increases is to consider the range awarded to other employees.
More significant increases may be awarded in certain circumstances, for example, where there is a significant change in the scale, scope or responsibility of a role, where an individual has been appointed at a lower level following a promotion and/or significant market movement.
The current base salaries reflect the size and international scope of the Executive Director roles as well as the caliber and experience of the individuals.
Base salaries include a fixed cash allowance of 25% of the total in lieu of pension, car and other key benefits.
Benefit plans are set at reasonable levels in order to be market competitive for their local market and are dependent on individual circumstances.
n/a.
However, any increases will be subject to strong individual performance.
REMUNERATION REPORTCONTINUED
94 OCI N.V. Annual Report 2018 OCI N.V. Annual Report 2018 95
Corporate Governance
Other Inform
ationP
erformance R
eviewO
perational Strengths
Co
rpo
rate Go
vernanceS
ustainability Review
Financial Statem
ents

Remuneration Policy: scope continued
Element
Purpose and link to strategy / long-term interests and sustainability Operation Maximum opportunity Performance measures
Annual Bonus
Matching of shares voluntarily purchased from bonus proceeds no longer applies
Committee has discretion to adjust payments to reflect overall performance
Key element of our “pay for performance” culture linked to pre-determined measurable targets set and assessed by the Committee.
Our performance measures evolve over time but always support the long-term interests of the company by ensuring we reward individuals appropriately for driving the strategic agenda and supporting environmentally sound solutions.
Targets are developed around a mix of financial and non-financial measures. The non-financial measures are predominantly strategic goals focusing on the long-term and the sustainability of the company.
Each year these targets are based on specific projects and priorities for the forthcoming year.
At the beginning of each year, the Committee establishes the performance measures and targets based on OCI’s business priorities for the year. These are reviewed after the end of the year and the Committee approves awards based on the performance achieved.
The Committee applies judgement where necessary to ensure approved pay-out levels are reflective of actual, overall company performance.
Target annual bonus opportunity of 75% of gross annual base salary for the CEO and 60% of gross annual base salary for the CFO (unchanged since the listing of OCI in 2013).
Maximum opportunity will be 200% of target.
Performance is assessed over one financial year and is based on a mixture of corporate financial and operational, strategic and personal objectives.
Measures will normally be weighed 60% financial and 40% non-financial. The Committee could determine a different ratio between financial and non-financial measures.
Free Cash Flow will normally be the main financial measure.
The non-financial measures vary from year to year but generally relate to HSE, strategy, financial and people.
Payment under the bonus arrangement may be reduced by up to 20% in the event that HSE performance is judged unsatisfactory by the Committee, taking into account feedback from the HSE Committee. Key measures may include Lost Time Injury Rate (LTIR) and Total Recordable Injury Rate (TRIR).
Awards are subject to malus and clawback provisions as described below.
Remuneration Policy: scope continued
Element
Purpose and link to strategy / long-term interests and sustainability Operation Maximum opportunity Performance measures
Performance Share Unit Plan
Award levels increased to reflect removal of share match and enhancing the emphasis on the long-term interests of the company (no increase to total compensation)
Otherwise unchanged
Share-based compensation which motivates and incentivizes delivery of sustained performance over the long-term, focusing on enterprise value creation, sustainability and retention of our Executive Directors.
The plan aims to incentivize the creation of shareholder value in excess of that achieved by comparable organizations.
TSR is a forward-looking measure and as such is aligned to the sustainability of OCI’s business.
Relative TSR performance vs. comparable organizations supports and encourages the alignment of interests between our Executive Directors and our shareholders, taking into account the cyclical factors that impact our business.
The plan complies with the Dutch Corporate Governance Code and with wider European best practice provisions.
Executive Directors will be granted performance share units which will vest after three years subject to the achievement of pre-specified performance targets. The Committee will determine the extent to which the performance measures have been met. Performance targets may be adjusted in the event that the Committee determines this to be appropriate; these will be at least as challenging as those originally set.
In line with the Dutch Corporate Governance code vested shares (net of tax) are required to be held for a further two years.
The number of performance share units will be calculated based on face value. This involves calculating the number of shares granted based on the share price at date of grant and a fixed percentage of base salary.
Annual share awards are made, subject to complying with any closed periods. Awards are normally made on 7 February each year as a consistent course of action.
Dividends (or equivalents) may be paid to the extent that awards vest.
Executive Directors will be granted awards of 125% of gross annual base salary. Maximum opportunity will be 150% of target.
Performance targets will be set for a three-year period.
These will be based on relative Total Shareholder Return (TSR) against a peer group of companies that reflect the markets in which OCI competes for investment.
Achievement of threshold performance will result in no more than 25% of the maximum award paying out. For achievement of target and maximum performance level, 100% and 150% of target pays out respectively. There is straight-line vesting between these points.
TSR calculations are externally verified. Appropriate adjustments are made to address mergers, acquisitions, demergers, rights issues and other material changes to companies within the peer group.
The Committee has discretion to add additional stretching performance conditions for future cycles. However relative TSR will apply to at least 50% of the awards.
Awards are subject to malus and clawback provisions as described below.
Share Ownership Guidelines
New
Ensures alignment with shareholders’ interests.
Executive Directors are expected to build up share ownership over a period of five years (the later of the date of implementation of the share ownership guidelines or appointment) and maintain holdings of at least 300% of base salary for the CEO and 150% of base salary for the CFO.
Until this requirement has been met, Executive Directors must retain at least 50% of any vested shares from the PSP.
n/a n/a
Legacy arrangements
Executive Directors have awards outstanding in relation to matching rights under the annual bonus (which have now been discontinued) and the “Performance Share Plan” (2014 Executive Directors Incentive Plan). Awards under these plans made prior to 1 January 2019 will continue but no new awards will be granted under these plans.
Legacy awards have a three-year vesting period (the Performance Share Plan is subject to performance measures) and a further two-year holding period in line with the Dutch Corporate Governance Code.
REMUNERATION REPORTCONTINUED
96 OCI N.V. Annual Report 2018 OCI N.V. Annual Report 2018 97
Corporate Governance
Other Inform
ationP
erformance R
eviewO
perational Strengths
Co
rpo
rate Go
vernanceS
ustainability Review
Financial Statem
ents

Remuneration Scenarios
The Remuneration Committee conducts pay scenario modelling on an annual basis which investigates pay-out quantum for Executive Directors under different performance scenarios. This modelling is undertaken to ensure that the Remuneration Policy links directly with the performance of OCI and therefore, is in the interests of shareholders.
In the event that specific short-term and long-term threshold performance targets are not achieved, there will be no variable pay vesting or payout for Executive Directors for the relevant period.
The charts below illustrate how much the current Executive Directors could receive under different scenarios in the first year of the Policy, assuming a constant share price (i.e. no appreciation) and no dividend payments.
Element of Remuneration Details of assumptions
Fixed remuneration
This comprises base salary with effect from 1 January 2019. The base salary is inclusive of the 25% benefits allowance. The CEO’s salary will be $2,000,000 and the CFO’s $1,150,000.
Annual Bonus Assumes maximum opportunity of 150% of salary for the CEO and 120% of salary for the CFO.
For target, the scenario assumes 75% of salary for the CEO and 60% of salary for the CFO.
For threshold, the scenario assumes 30% of salary for the CEO and 24% of salary for the CFO.
For minimum, the scenario assumes no pay-out of the bonus.
Performance Share Unit Plan
Assumptions apply to both Executive Directors. There is a maximum opportunity of 150% of target in conditional shares.
For target, the scenario assumes 125% of salary for both Executive Directors.
For threshold, the scenario assumes 25% of target for both Executive Directors.
For minimum, the scenario assumes 0% of target for both Executive Directors.
Terms of employment and severance arrangements
OCI’s current policy is that the Executive Directors’ service agreements should have notice periods that are a minimum of 3 months and no longer than 12 months. The notice period for both the CEO and the CFO is one month. The notice period for the Employer OCI NV is one month for both Executive Directors.
The Executive Directors referred to in this Remuneration Report are the CEO and CFO. The details of their appointment terms are as follows:
Name Title Date of Appointment
Nassef Sawiris CEO 16 January 2013
Hassan Badrawi CFO 1 October 2017
The appointment of the Executive Directors is determined and extended for the duration (definite term) of one year, in the Annual General Meeting. If the company terminates a service agreement with an Executive Director other than due to an urgent cause or serious culpability, the Executive Director is entitled to a severance payment of an amount equal to 100% of annual base salary, in line with the Dutch Corporate Governance Code.
OCI and its subsidiaries do in general not grant personal loans or guarantees to the Executive Directors. This may only be different in very exceptional cases and only after approval of the Board with the consent of the majority of the Non-Executive Directors.
Additional Notes
Selection of performance measures
Performance targets are set by the Committee to be both stretching and achievable, taking into account OCI’s strategic priorities and the economic landscape.
The performance measures that are used for our annual bonus and Performance Share Unit Plan have been chosen to support OCI’s strategy, long-term interests and sustainability.
For the annual bonus, the Committee continues to believe that it is appropriate to use a balance of corporate financial targets, operational, strategic objectives and individual performance objectives.
OCI N.V. is committed to providing a safe and healthy workplace for all employees and stakeholders by implementing the highest international safety standards to avoid any potential risks to people, communities, assets or the environment. We continuously train all employees to implement the best sustainable practices. We believe that the health and safety of our employees are essential to the successful conduct and future growth of our business and are in the best interests of our stakeholders.
As such, the annual bonus is subject to an HSE underpin relating directly to operating sustainably. The measures are: Lost Time Injury Rate (LTIR) and Total Recordable Injury Rate (TRIR); the targets are set on an annual basis. Given the nature of our operations, we maintain a ‘health and safety first’ attitude at every plant. We invest heavily in the best available technologies to minimize our carbon footprint and develop cleaner products and aim to achieve zero safety incidences across the group by continuously investing in our employees’ training and development.
The Committee considers that the use of relative TSR for the PSP remains the most appropriate measure of long-term performance for the OCI group given the direct alignment to shareholder interests and the cyclical nature of OCI’s business but reserves the right to add one or more additional measures as set out in the table above.
Peer groups – international labour market
The Committee consults multiple points of data when setting the Remuneration Policy, as well as the structure and quantum of remuneration. To ensure the competitiveness of OCI’s remuneration levels, the Committee considers, as one of the reference points, benchmark remuneration data from a peer group of international companies similar in size, complexity and scope to OCI. In addition, the Committee also refers to remuneration levels at Dutch listed companies of a similar size to OCI.
In 2015 the international peer group was reviewed following the spin-off of the Engineering & Construction group. As disclosed in the 2015 Remuneration Report, the peer group is as follows and is unchanged for 2019. The Committee reserves the right to change the peer group as a result of changes to peer companies and/or to OCI itself. Where applicable this will be set out in the Remuneration Report.
REMUNERATION REPORTCONTINUED
International labour market peer group
Celanese CF Industries K + S Koppers Holdings
Methanex Mosaic Nutrien Olin
Tessenderlo Chemie
Wacker Chemie
Westlake Chemical
Peer groups – TSR
The TSR peer group overlaps with but is different to the international labour market peer group as it is used for a different purpose. The TSR peer group is intended to reflect the market in which OCI competes for investment rather than for executive talent.
The TSR peer group was reviewed alongside the remuneration arrangements and it was decided that a number of peers closest to OCI in terms of competitiveness should hold a double weighting for the purposes of the TSR calculation. AkzoNobel was removed from the group due to the divestment of its chemicals business; Agrium and Potash Corporation merged on 1 January 2018 and began trading as Nutrien. These changes are considered by the Committee to be neutral in terms of the difficulty of earning payments under the PSP.
The Committee has the discretion to change the peer group as a result of changes to peer companies and/or to OCI itself. Where applicable this will be set out in the Remuneration Report.
Total Shareholder Return peer group
Celanese CF Industries* DSM Intrepid Potash
Lanxess Methanex* Mosaic* Nutrien*
Solvay Westlake Chemical Yara International*
* Denotes companies with a double weighting
Malus and clawback
Under the proposed Policy there are formal malus and clawback provisions under the incentives plans that may be applied in certain conditions, including:
i) Where there is material misstatement of financial results which resulted in an Award being greater than would have been the case if the misstatement had not been made;
ii) The extent to which any performance target and/or condition satisfied was based on an error, or on inaccurate or misleading information or assumptions which results in an Award being greater than would have been the case had the error not been made;
iii) Serious misconduct of the individual;
iv) Circumstances arose during the vesting period which would have warranted summary dismissal or dismissal for urgent cause; and
v) Any other circumstances allowed under Article 2: 135(8) of the Dutch Civil Code. Minimum Threshhold Target Maximum
• PSP• Annual Bonus• Salary (including Benefits)
2,000
7%
CEO remuneration ($'000) CFO remuneration ($'000)
Minimum Threshhold Target Maximum
3,225
6,000
8,750
1,1501,785
3,278
4,686
98 OCI N.V. Annual Report 2018 OCI N.V. Annual Report 2018 99
Corporate Governance
Other Inform
ationP
erformance R
eviewO
perational Strengths
Co
rpo
rate Go
vernanceS
ustainability Review
Financial Statem
ents
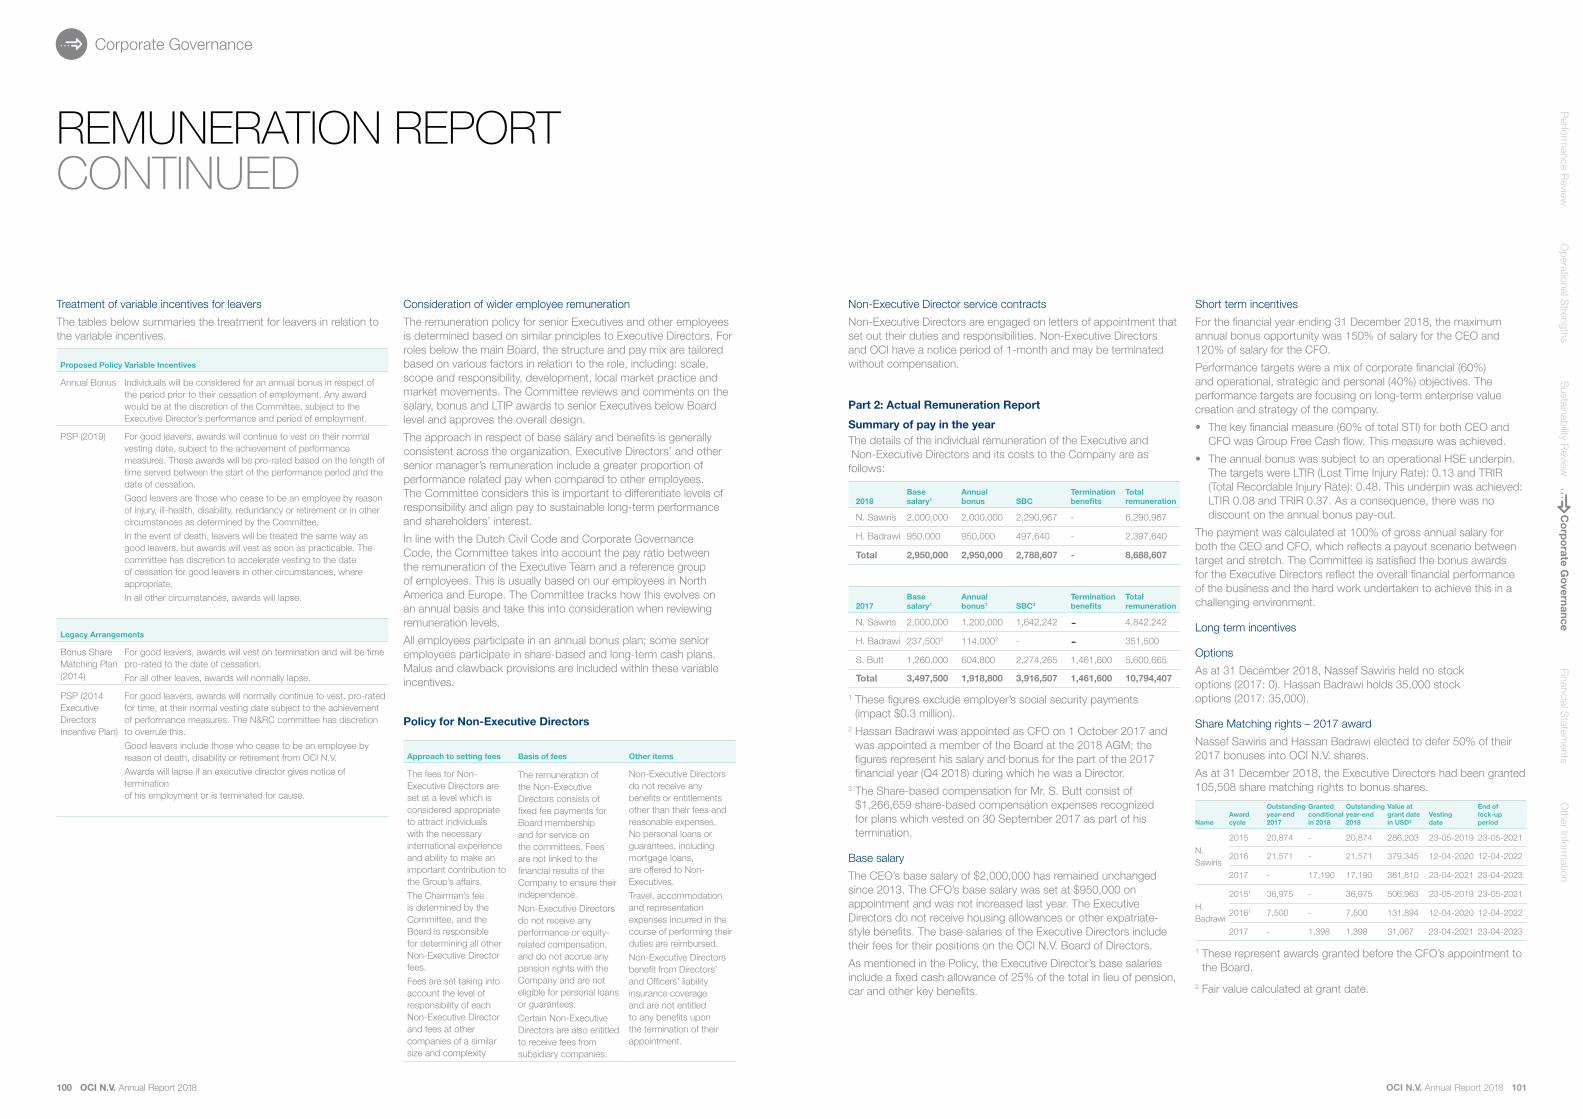
Treatment of variable incentives for leavers
The tables below summaries the treatment for leavers in relation to the variable incentives.
Proposed Policy Variable Incentives
Annual Bonus Individuals will be considered for an annual bonus in respect of the period prior to their cessation of employment. Any award would be at the discretion of the Committee, subject to the Executive Director’s performance and period of employment.
PSP (2019) For good leavers, awards will continue to vest on their normal vesting date, subject to the achievement of performance measures. These awards will be pro-rated based on the length of time served between the start of the performance period and the date of cessation.
Good leavers are those who cease to be an employee by reason of injury, ill-health, disability, redundancy or retirement or in other circumstances as determined by the Committee.
In the event of death, leavers will be treated the same way as good leavers, but awards will vest as soon as practicable. The committee has discretion to accelerate vesting to the date of cessation for good leavers in other circumstances, where appropriate.
In all other circumstances, awards will lapse.
Legacy Arrangements
Bonus Share Matching Plan (2014)
For good leavers, awards will vest on termination and will be time pro-rated to the date of cessation.
For all other leaves, awards will normally lapse.
PSP (2014 Executive Directors Incentive Plan)
For good leavers, awards will normally continue to vest, pro-rated for time, at their normal vesting date subject to the achievement of performance measures. The N&RC committee has discretion to overrule this.
Good leavers include those who cease to be an employee by reason of death, disability or retirement from OCI N.V.
Awards will lapse if an executive director gives notice of termination of his employment or is terminated for cause.
REMUNERATION REPORTCONTINUED
Consideration of wider employee remuneration
The remuneration policy for senior Executives and other employees is determined based on similar principles to Executive Directors. For roles below the main Board, the structure and pay mix are tailored based on various factors in relation to the role, including: scale, scope and responsibility, development, local market practice and market movements. The Committee reviews and comments on the salary, bonus and LTIP awards to senior Executives below Board level and approves the overall design.
The approach in respect of base salary and benefits is generally consistent across the organization. Executive Directors’ and other senior manager’s remuneration include a greater proportion of performance related pay when compared to other employees. The Committee considers this is important to differentiate levels of responsibility and align pay to sustainable long-term performance and shareholders’ interest.
In line with the Dutch Civil Code and Corporate Governance Code, the Committee takes into account the pay ratio between the remuneration of the Executive Team and a reference group of employees. This is usually based on our employees in North America and Europe. The Committee tracks how this evolves on an annual basis and take this into consideration when reviewing remuneration levels.
All employees participate in an annual bonus plan; some senior employees participate in share-based and long-term cash plans. Malus and clawback provisions are included within these variable incentives.
Policy for Non-Executive Directors
Approach to setting fees Basis of fees Other items
The fees for Non-Executive Directors are set at a level which is considered appropriate to attract individuals with the necessary international experience and ability to make an important contribution to the Group’s affairs.
The Chairman’s fee is determined by the Committee, and the Board is responsible for determining all other Non-Executive Director fees.
Fees are set taking into account the level of responsibility of each Non-Executive Director and fees at other companies of a similar size and complexity
The remuneration of the Non-Executive Directors consists of fixed fee payments for Board membership and for service on the committees. Fees are not linked to the financial results of the Company to ensure their independence.
Non-Executive Directors do not receive any performance or equity-related compensation, and do not accrue any pension rights with the Company and are not eligible for personal loans or guarantees.
Certain Non-Executive Directors are also entitled to receive fees from subsidiary companies.
Non-Executive Directors do not receive any benefits or entitlements other than their fees and reasonable expenses. No personal loans or guarantees, including mortgage loans, are offered to Non-Executives.
Travel, accommodation and representation expenses incurred in the course of performing their duties are reimbursed.
Non-Executive Directors benefit from Directors’ and Officers’ liability insurance coverage and are not entitled to any benefits upon the termination of their appointment.
Non-Executive Director service contracts
Non-Executive Directors are engaged on letters of appointment that set out their duties and responsibilities. Non-Executive Directors and OCI have a notice period of 1-month and may be terminated without compensation.
Part 2: Actual Remuneration Report
Summary of pay in the yearThe details of the individual remuneration of the Executive and Non-Executive Directors and its costs to the Company are as follows:
2018Base salary1
Annual bonus SBC
Termination benefits
Totalremuneration
N. Sawiris 2,000,000 2,000,000 2,290,967 - 6,290,967
H. Badrawi 950,000 950,000 497,640 - 2,397,640
Total 2,950,000 2,950,000 2,788,607 - 8,688,607
2017Base salary1
Annual bonus1 SBC3
Termination benefits
Totalremuneration
N. Sawiris 2,000,000 1,200,000 1,642,242 - 4,842,242
H. Badrawi 237,5002 114,0002 - - 351,500
S. Butt 1,260,000 604,800 2,274,265 1,461,600 5,600,665
Total 3,497,500 1,918,800 3,916,507 1,461,600 10,794,407
1 These figures exclude employer’s social security payments (impact $0.3 million).
2 Hassan Badrawi was appointed as CFO on 1 October 2017 and was appointed a member of the Board at the 2018 AGM; the figures represent his salary and bonus for the part of the 2017 financial year (Q4 2018) during which he was a Director.
3 The Share-based compensation for Mr. S. Butt consist of $1,266,659 share-based compensation expenses recognized for plans which vested on 30 September 2017 as part of his termination.
Base salary
The CEO’s base salary of $2,000,000 has remained unchanged since 2013. The CFO’s base salary was set at $950,000 on appointment and was not increased last year. The Executive Directors do not receive housing allowances or other expatriate-style benefits. The base salaries of the Executive Directors include their fees for their positions on the OCI N.V. Board of Directors.
As mentioned in the Policy, the Executive Director’s base salaries include a fixed cash allowance of 25% of the total in lieu of pension, car and other key benefits.
Short term incentives
For the financial year ending 31 December 2018, the maximum annual bonus opportunity was 150% of salary for the CEO and 120% of salary for the CFO.
Performance targets were a mix of corporate financial (60%) and operational, strategic and personal (40%) objectives. The performance targets are focusing on long-term enterprise value creation and strategy of the company.
• The key financial measure (60% of total STI) for both CEO and CFO was Group Free Cash flow. This measure was achieved.
• The annual bonus was subject to an operational HSE underpin. The targets were LTIR (Lost Time Injury Rate): 0.13 and TRIR (Total Recordable Injury Rate): 0.48. This underpin was achieved: LTIR 0.08 and TRIR 0.37. As a consequence, there was no discount on the annual bonus pay-out.
The payment was calculated at 100% of gross annual salary for both the CEO and CFO, which reflects a payout scenario between target and stretch. The Committee is satisfied the bonus awards for the Executive Directors reflect the overall financial performance of the business and the hard work undertaken to achieve this in a challenging environment.
Long term incentives
Options
As at 31 December 2018, Nassef Sawiris held no stock options (2017: 0). Hassan Badrawi holds 35,000 stock options (2017: 35,000).
Share Matching rights – 2017 award
Nassef Sawiris and Hassan Badrawi elected to defer 50% of their 2017 bonuses into OCI N.V. shares.
As at 31 December 2018, the Executive Directors had been granted 105,508 share matching rights to bonus shares.
NameAward cycle
Outstanding year-end 2017
Granted conditional in 2018
Outstanding year-end 2018
Value at grant date in USD²
Vestingdate
End oflock-upperiod
N. Sawiris
2015 20,874 - 20,874 286,203 23-05-2019 23-05-2021
2016 21,571 - 21,571 379,345 12-04-2020 12-04-2022
2017 - 17,190 17,190 381,810 23-04-2021 23-04-2023
H. Badrawi
20151 36,975 - 36,975 506,963 23-05-2019 23-05-2021
20161 7,500 - 7,500 131,894 12-04-2020 12-04-2022
2017 - 1,398 1,398 31,067 23-04-2021 23-04-2023
1 These represent awards granted before the CFO’s appointment to the Board.
2 Fair value calculated at grant date.
100 OCI N.V. Annual Report 2018 OCI N.V. Annual Report 2018 101
Corporate Governance
Other Inform
ationP
erformance R
eviewO
perational Strengths
Co
rpo
rate Go
vernanceS
ustainability Review
Financial Statem
ents

Performance Shares – awards granted in 2018
Awards made in 2018 were granted on 7 February which is the pre-planned consistent course of action. As at 31 December 2018, the Executive Directors had been granted 370,688 conditional performance share units at target.
NameAward cycle
Outstanding year-end 2017
Granted conditional in 2018
Outstanding year-end 2018
Value at grant date in USD1
Vestingdate
End oflock-upperiod
N. Sawiris
2016 141,913 - 141,913 1,549,458 01-07-2019 01-07-2021
2017 103,587 - 103,587 1,973,124 07-02-2020 07-02-2022
2018 - 84,873 84,873 2,181,674 07-02-2021 07-02-2023
H. Badrawi
2018 - 40,315 40,315 1,036,304 07-02-2021 07-02-2023
1 Fair value calculated at grant date.
Internal Pay ratio 2017
Subject to the Share Ownership Guidelines for the Executive Directors of the Board as per 1 December 2018 both Executive Directors are required to own a percentage of OCI shares of their salary. These percentages are a holding of 300% for the CEO and 150% for the CFO.
The table below summarizes the number of shares currently held by Executive Directors (which have no further performance conditions attached). Their holding as a percentage of salary is based on a share price of €17.81 ($20.37) (being the closing share price on 31 December 2018). Both the CEO and CFO already meet the share ownership guidelines.
Shares held Shareholding (% of salary)
N. Sawiris 62,589,631 Majority shareholder in OCI NV
H. Badrawi 87,300 187%
Internal pay ratio
The internal pay ratio of the average employee compensation and the total annual compensation of the CEO and the Executive Board members in 2018 was calculated based on the 2018 average employee benefits expense of a reference group (our employees in Europe and North America) compared to the CEO’s and average Executive Board members’ base salary and annual bonus.
The pay ratio is 29:1 (2017: 25:1) for the CEO and on average 22:1 (2017: 23:1) for the Executive Board members. The change in the CEO pay ratio is due to the 2018 STI payment for the CEO which was higher compared to the two previous years.
Performance Shares – 2015 award
The PSP awards granted on 6 September 2016 were based on a three-year performance period ending 30 June 2018 and were independently calculated by Mercer. As disclosed in previous annual reports, the awards were solely based on relative TSR against a selected comparator peer group:
TSR vesting scheduleLevel of performance Threshold Target Maximum Actual
Peer group ranking
40th percentile
67th percentile
90th
percentile33rd percentile
% of award vesting
25% 100% 150% 0%
OCI’s TSR performance fell below threshold and as a result all awards lapsed.
REMUNERATION REPORTCONTINUED
Peer group ranking (%)20% 40% 60% 80% 100%0%
Pay-out (% of target) 150%
100%
25%
Non-Executive Directors
The Committee reviewed fees for the Non-Executive Directors during the year and decided not to make any increases for 2018. As such, fee rates remain unchanged since 2013.
Main Board AuditRemuneration / Nomination / HSE
Chairman 260,000 25,000 10,000
Member 130,000 20,000 7,500
The Chairman received an additional fixed fee of $81,575 for service on the board of OCI Partners, a publicly-traded subsidiary of the Company in the United States.
Implementation in 2019
Base salaries
We do not propose any increases to the CEO’s salary for 2019.
The Committee decided to increase the CFO’s annual gross base salary to $1,150,000 (representing a 21% increase) as from 1 January 2019. Hassan Badrawi has shown strong performance and has lead OCI’s strategic initiatives including the refinancing in April 2018. Moreover, his oversight and contributions especially towards operational excellence have been significant As a result, the CFO now has a widened span of control with additional operational responsibilities which are reflected in the increase.
Annual bonus
The bonus will be based on corporate financial objectives and strategic, operational and personal objectives. These will be measured over the financial year ending 31 December 2019.
The CEO’s maximum bonus opportunity remains 150% of salary and the CFO’s 120% of salary.
2019 PSU
The 2019 awards were granted on 7 February 2019 to maintain the consistent course of action of granting on February 7 each year as disclosed in the 2017 Annual Report. In line with the Dutch Corporate Governance Code, awards will be subject to a two-year holding period in addition to the current three-year performance period, resulting in a total five-year period from the date of grant.
Malus and clawback provisions will apply to these awards, allowing the Committee to reduce subsisting awards or request the refund of already paid or vested awards in certain circumstances for a two-year period post-vesting.
The 2019 awards will vest three years after the grant date subject to relative TSR as follows:
TSR vesting schedule Threshold Target Maximum
Peer group ranking
40th percentile 67th percentile 90th percentile
Straight-line vesting between points
Vesting (% of target)
25% 100% 150%
The award will be calculated relative to the following peer group. A number of peers hold a double weighting as they are OCI’s closest competitors.
TSR vesting schedule
Single weighting Double weighting
Celanese DSM CF Industries Methanex
Intrepid Potash Lanxess Mosaic Nutrien
Solvay Westlake Chemical
Yara International
On behalf of the Nomination & Remuneration Committee
Sipko Schat, Chairman
Peer group ranking (%)20% 40% 60% 80% 100%0%
Pay-out (% of target) 150%
100%
25%
102 OCI N.V. Annual Report 2018 OCI N.V. Annual Report 2018 103
Corporate Governance
Other Inform
ationP
erformance R
eviewO
perational Strengths
Co
rpo
rate Go
vernanceS
ustainability Review
Financial Statem
ents

IntroductionThis 2018 Annual Report dated 15 March 2019 (the Annual Report) comprises regulated information within the meaning of sections 1:1 and 5:25c of the Dutch Financial Supervision Act (“wet op het financieel toezicht”).
For the consolidated and the parent Company’s 2018 financial statements “jaarrekening” within the meaning of section 2:361 of the Dutch Civil Code, reference is made to the financial statements. The Members of the Board of Directors have signed the 2018 financial statements pursuant to their obligation under section 2:101, paragraph 2 of the Dutch Civil Code.
The following sections of the Annual Report together constitute the Management Report (“jaarverslag”) within the meaning of section 2:391 Civil Code: the Operational Review, the Corporate Governance Section, the Financial Statements and the Additional Information. For other information “overige gegevens” within the meaning of section 2:392 of the Dutch Civil Code, reference is made to the financial statements and to the section Shareholders information.
Corporate governance statementAs referred to in article 2a of the Decree laying down additional requirements for annual reports “Besluit inhoud bestuursverslag” effective 1 January 2018 (the ‘Decree’), OCI N.V. is required to make a statement on corporate governance.
The information required to be included in this corporate governance statement as described in articles 3, 3a and 3b of the Decree can be found in the following sections of this Annual Report and Accounts:
• The information concerning compliance with the Dutch Code, as required by article 3 of the Decree, can be found in the section Compliance with the ‘Dutch Corporate Governance Code’;
• The information concerning OCI N.V.’s Risk Management and control frameworks relating to the financial reporting process, as required by article 3a(a) of the Decree, can be found in the section ‘Risk Management’;
• The information regarding the functioning of OCI N.V.’s General Meeting of Shareholders, and the authority and rights of OCI N.V.’s shareholders and holders of depositary receipts, as required by article 3a(b) of the Decree, can be found within the relevant sections under ‘Corporate Governance’;
• The information regarding the composition and functioning of OCI N.V.’s Board and its Committees, as required by article 3a(c) of the Decree, can be found within the relevant sections under ‘Corporate Governance’;
• The information regarding the diversity policy concerning the composition of the Board, as required by article 3a(d) of the Decree, can be found within the relevant sections of the Sustainability Report; and
• The information concerning the inclusion of the information required by the decree Article 10 European Takeover Directive, as required by article 3b of the Decree, can be found in the section ‘Decree Article 10 EU Takeover Directive’.
The Dutch Corporate Governance Code was last amended on 8 December 2016 and is available at http://www.mccg.nl/.
In control statementThe Board is responsible for the design, implementation and operation of the Company’s internal risk management and control systems. In dischargingthis responsibility, the Board has made an assessment of the effectiveness of the Company’s internal control and risk management systems.Based on this assessment and to the best of its knowledge and belief, the Board states that:• There are no material failures in the
effectiveness of the Company's internal risk management and control systems;
• The Company's internal risk management and control systems provide reasonable assurance that the Company's Annual Report does not contain any errors of material importance;
• There is a reasonable expectation that the Company will be able to continue in operation and meet its liabilities for at least twelve months, therefore, it is appropriate to adopt the going concern basis in preparing the Annual Report;
• There are no material risks or uncertainties that could reasonably be expected to have a material adverse effect on the continuity of the Company’s enterprise in the coming twelve months.
The above statements do not imply that our systems and procedures provide absolute assurance as to the realization of our operational and strategic business objectives, or that they can prevent all misstatements, inaccuracies, errors, fraud and non-compliances with legislation, rules and regulations.
Directors’ statement pursuant to article 5:25c of the Dutch Financial Supervision Act (wet op het financieel toezicht)
In accordance with Article 5:25c of the Dutch Financial Supervision Act (wet op het financieel toezicht), OCI N.V.’s Board declares that to the best of its knowledge,
(i) the 2018 financial statements provide a true and fair view of the assets, liabilities, financial position and results of the Company and its subsidiaries included in the consolidated statements in accordance with International Financial Reporting Standards as adopted by the European Union (IFRS-EU); and (ii) the annual report provides a true and fair view of the situation as at December 31, 2018, and of the Company’s state of affairs for the financial year 2018, as well as the principal risks faced by OCI N.V. (iii) the Management report includes a description of the principal risks and uncertainties that the Company faces.
Non-Financial Statement pursuant to Directive 2014/95/EUDirective 2014/95/EU on the disclosure of non-financial information requires companies to publish a non-financial statement. The relevant provision has been implemented into Dutch law through the Decree disclosure on non-financial information (‘Besluit bekendmaking niet-financiële informatie’) (the ‘Decree’). As referred to in article 2 of the Decree, OCI is required to publish this non-financial statement.
The information regarding environmental, social and employee matters and respect for human rights as required by the Decree is incorporated in the relevant sections of the Sustainability report. The information regarding preventing anti-corruption and bribery as required by the Decree is incorporated in the Risk Management & Compliance section in this report.
Amsterdam, the Netherlands, 15 March 2019
The OCI N.V. Board of Directors
Michael Bennett, Chairman Nassef Sawiris Hassan Badrawi Jan Ter Wisch Sipko Schat Jérôme Guiraud Greg Heckman Robert Jan van de Kraats Anja Montijn
DECLARATIONS FINANCIAL STATEMENTS
OCI N.V. Annual Report 2018 105
106 Consolidated Statement of Financial Position
107 Consolidated Statement of Profit or Loss and Other Comprehensive Income
108 Consolidated Statement of Changes in Equity
109 Consolidated Statement of Cash Flows
111 Notes to the Consolidated Financial Statements
Other Inform
ationP
erformance R
eviewO
perational Strengths
Corporate G
overnanceS
ustainability Review
Financial Statem
ents
104 OCI N.V. Annual Report 2018
Corporate Governance
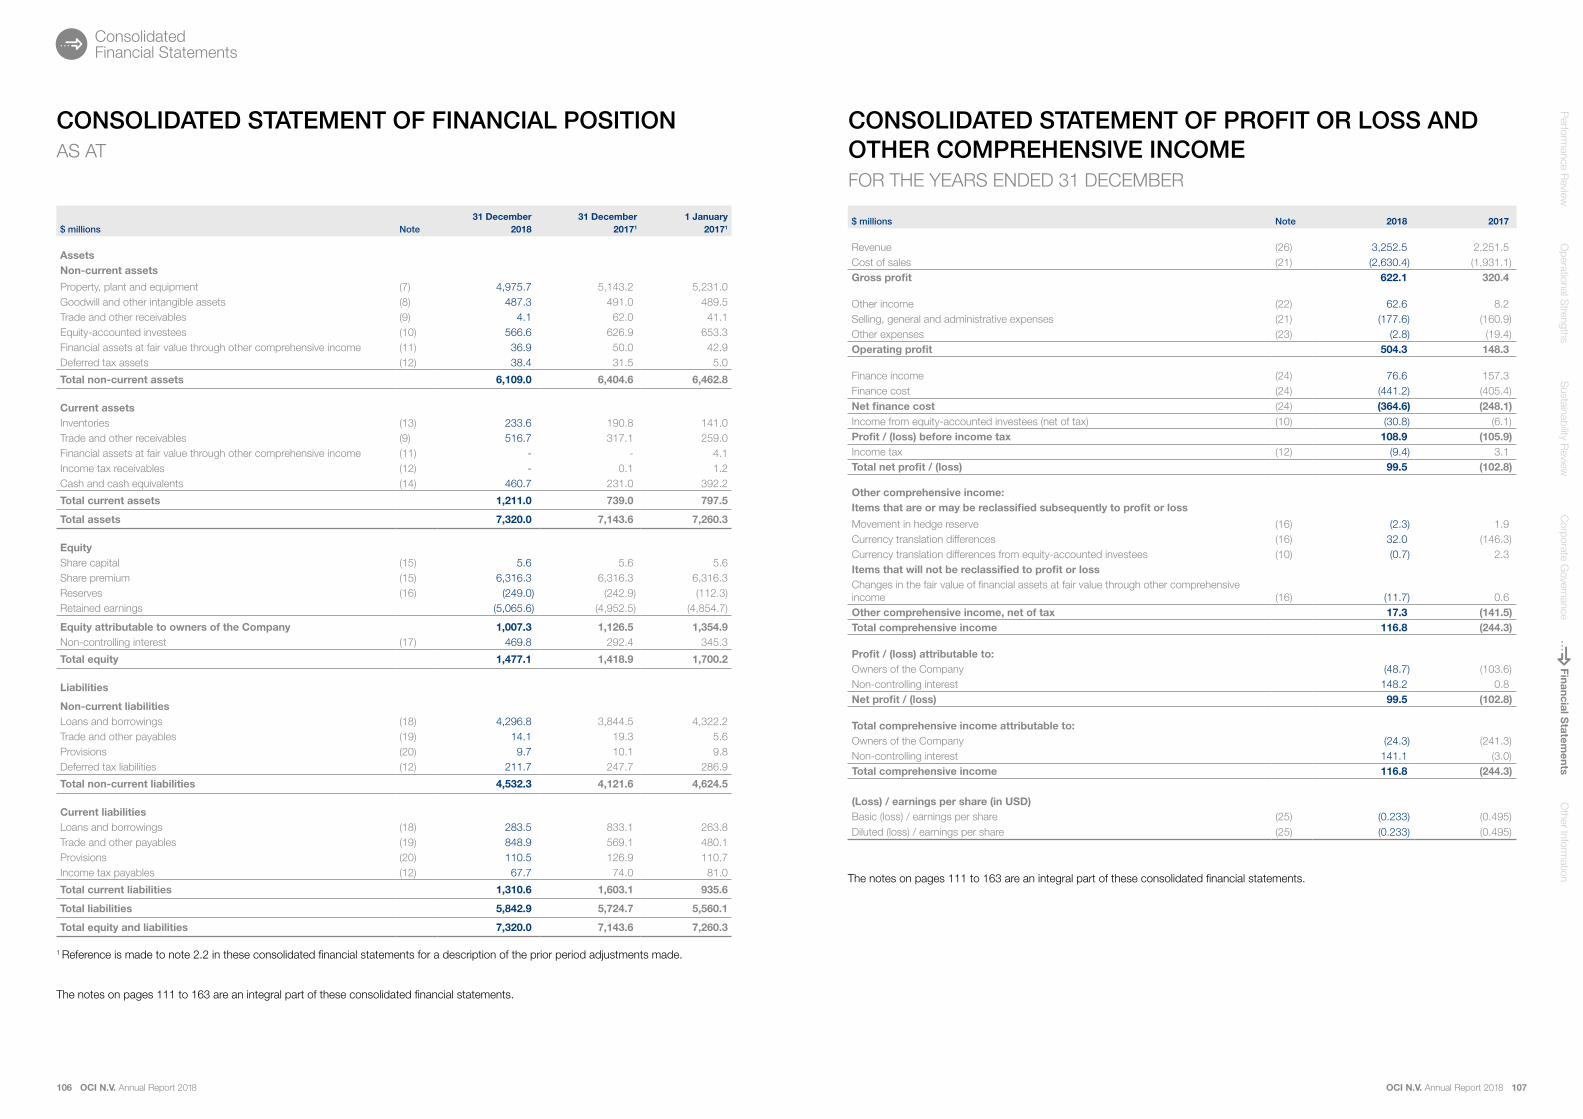
106 OCI N.V. Annual Report 2018 OCI N.V. Annual Report 2018 107
Other Inform
ationP
erformance R
eviewO
perational Strengths
Corporate G
overnanceS
ustainability Review
Financial Statem
ents
Consolidated Financial Statements
CONSOLIDATED STATEMENT OF FINANCIAL POSITION AS AT
$ millions Note31 December
201831 December
20171
1 January20171
AssetsNon-current assets
Property, plant and equipment (7) 4,975.7 5,143.2 5,231.0Goodwill and other intangible assets (8) 487.3 491.0 489.5Trade and other receivables (9) 4.1 62.0 41.1Equity-accounted investees (10) 566.6 626.9 653.3Financial assets at fair value through other comprehensive income (11) 36.9 50.0 42.9Deferred tax assets (12) 38.4 31.5 5.0
Total non-current assets 6,109.0 6,404.6 6,462.8
Current assetsInventories (13) 233.6 190.8 141.0Trade and other receivables (9) 516.7 317.1 259.0Financial assets at fair value through other comprehensive income (11) - - 4.1Income tax receivables (12) - 0.1 1.2Cash and cash equivalents (14) 460.7 231.0 392.2
Total current assets 1,211.0 739.0 797.5
Total assets 7,320.0 7,143.6 7,260.3
EquityShare capital (15) 5.6 5.6 5.6Share premium (15) 6,316.3 6,316.3 6,316.3Reserves (16) (249.0) (242.9) (112.3)Retained earnings (5,065.6) (4,952.5) (4,854.7)
Equity attributable to owners of the Company 1,007.3 1,126.5 1,354.9Non-controlling interest (17) 469.8 292.4 345.3
Total equity 1,477.1 1,418.9 1,700.2
Liabilities
Non-current liabilitiesLoans and borrowings (18) 4,296.8 3,844.5 4,322.2Trade and other payables (19) 14.1 19.3 5.6Provisions (20) 9.7 10.1 9.8Deferred tax liabilities (12) 211.7 247.7 286.9
Total non-current liabilities 4,532.3 4,121.6 4,624.5
Current liabilitiesLoans and borrowings (18) 283.5 833.1 263.8Trade and other payables (19) 848.9 569.1 480.1Provisions (20) 110.5 126.9 110.7Income tax payables (12) 67.7 74.0 81.0
Total current liabilities 1,310.6 1,603.1 935.6
Total liabilities 5,842.9 5,724.7 5,560.1
Total equity and liabilities 7,320.0 7,143.6 7,260.3
1 Reference is made to note 2.2 in these consolidated financial statements for a description of the prior period adjustments made.
The notes on pages 111 to 163 are an integral part of these consolidated financial statements.
$ millions Note 2018 2017
Revenue (26) 3,252.5 2,251.5Cost of sales (21) (2,630.4) (1,931.1)Gross profit 622.1 320.4
Other income (22) 62.6 8.2Selling, general and administrative expenses (21) (177.6) (160.9)Other expenses (23) (2.8) (19.4)Operating profit 504.3 148.3
Finance income (24) 76.6 157.3Finance cost (24) (441.2) (405.4)Net finance cost (24) (364.6) (248.1)Income from equity-accounted investees (net of tax) (10) (30.8) (6.1)Profit / (loss) before income tax 108.9 (105.9)Income tax (12) (9.4) 3.1Total net profit / (loss) 99.5 (102.8)
Other comprehensive income:Items that are or may be reclassified subsequently to profit or loss
Movement in hedge reserve (16) (2.3) 1.9Currency translation differences (16) 32.0 (146.3)Currency translation differences from equity-accounted investees (10) (0.7) 2.3Items that will not be reclassified to profit or lossChanges in the fair value of financial assets at fair value through other comprehensive income (16) (11.7) 0.6Other comprehensive income, net of tax 17.3 (141.5)Total comprehensive income 116.8 (244.3)
Profit / (loss) attributable to:Owners of the Company (48.7) (103.6)Non-controlling interest 148.2 0.8Net profit / (loss) 99.5 (102.8)
Total comprehensive income attributable to:Owners of the Company (24.3) (241.3)Non-controlling interest 141.1 (3.0)Total comprehensive income 116.8 (244.3)
(Loss) / earnings per share (in USD)Basic (loss) / earnings per share (25) (0.233) (0.495)Diluted (loss) / earnings per share (25) (0.233) (0.495)
The notes on pages 111 to 163 are an integral part of these consolidated financial statements.
CONSOLIDATED STATEMENT OF PROFIT OR LOSS AND OTHER COMPREHENSIVE INCOMEFOR THE YEARS ENDED 31 DECEMBER

108 OCI N.V. Annual Report 2018 OCI N.V. Annual Report 2018 109
Other Inform
ationP
erformance R
eviewO
perational Strengths
Corporate G
overnanceS
ustainability Review
Financial Statem
ents
Consolidated Financial Statements
$ millions Note
Share capital
(15)
Share premium
(15)Reserves
(16)Retainedearnings
Equityattributable
to owners of the
Company
Non-controlling
interest(17)
Totalequity
Balance at 1 January 2017 5.6 6,316.3 (112.3) (4,776.9) 1,432.7 345.3 1,778.0
Impact adjustment deferred tax liabilities OCI USA Inc. (2.2) - - - (77.8) (77.8) - (77.8)
Adjusted balance at 1 January 2017 5.6 6,316.3 (112.3) (4,854.7) 1,354.9 345.3 1,700.2
Net profit / (loss) - - - (103.6) (103.6) 0.8 (102.8)Other comprehensive income - - (137.7) - (137.7) (3.8) (141.5)
Total comprehensive income - - (137.7) (103.6) (241.3) (3.0) (244.3)
Impact difference in profit sharing non-controlling interest (15) - - - - - (0.1) (0.1)Dividend to non-controlling interest (15) - - - - - (37.9) (37.9)Treasury shares sold / delivered (16) - - 7.3 (3.0) 4.3 - 4.3Treasury shares acquired (16) - - (0.2) - (0.2) - (0.2)Increase shareholding OCI Beaumont (net of taxes) (15, 2.2) - - - (38.9) (38.9) (11.9) (50.8)Share-based payments (15) - - - 3.3 3.3 - 3.3Impact of the adjustment deferred tax liabilities OCI USA inc. (2.2) - - - 44.4 44.4 - 44.4
Balance at 31 December 2017 5.6 6,316.3 (242.9) (4,952.5) 1,126.5 292.4 1,418.9
Impact of IFRS 9 adoption (4.1) - - - (7.3) (7.3) (0.4) (7.7)Adjusted balance at 1 January 2018 5.6 6,316.3 (242.9) (4,959.8) 1,119.2 292.0 1,411.2
Net profit / (loss) - - - (48.7) (48.7) 148.2 99.5Other comprehensive income - - 24.4 - 24.4 (7.1) 17.3
Total comprehensive income - - 24.4 (48.7) (24.3) 141.1 116.8
Impact difference in profit sharing non-controlling interest (15) - - - - - 37.9 37.9Dividend to non-controlling interest (15) - - - - - (9.6) (9.6)Treasury shares sold / delivered (16) - - 6.2 0.6 6.8 - 6.8Treasury shares acquired (16) - - (1.2) - (1.2) - (1.2)Increase shareholding OCI Beaumont (net of taxes) (15) - - - (80.2) (80.2) (16.1) (96.3)Contribution N-7 LLC (15) - - - (1.4) (1.4) 1.4 -Repayment of convertible bond (equity component) (15) - - (35.5) 23.2 (12.3) - (12.3)Reduction of declared dividends to non-controlling interest (15) - - - - - 23.1 23.1Share-based payments (15) - - - 0.7 0.7 - 0.7
Balance at 31 December 2018 5.6 6,316.3 (249.0) (5,065.6) 1,007.3 469.8 1,477.1
The notes on pages 111 to 163 are an integral part of these consolidated financial statements.
CONSOLIDATED STATEMENT OF CHANGES IN EQUITY
$ millions Note 2018 2017
Net profit / (loss) 99.5 (102.8)
Adjustments for:
Depreciation and amortization (7), (8) 424.9 330.9Interest income (24) (8.7) (5.3)Interest expense (24) 340.7 222.0Net foreign exchange loss and others (24) 32.6 31.4
Loss on sale of scrapped property, plant and equipment (23) 1.5 2.1Share in income of equity-accounted investees (10) 30.8 6.1Gain on sale of financial assets (22) - (0.4)Result on sale of investment (22) (0.2) (0.7)Equity-settled share-based payment transactions (15) 0.7 3.3Impact difference in profit-sharing non-controlling interest (15) 37.9 (0.1)Income tax expense (12) 9.4 (3.1)
Changes in:Inventories (13) (47.8) (28.6)Trade and other receivables (9) (137.1) (65.7)Trade and other payables (19) 283.8 40.0Provisions (20) (15.8) 14.4
Cash flows:Interest paid (24) (278.8) (237.6)
Interest paid Nile Holding loan (24) (75.1) -
Interest received (24) 7.6 4.7Income taxes paid (12) (34.3) (28.9)Cash flow from operating activities 671.6 181.7
Proceeds from sale of property, plant and equipment (7) - 0.4Investments in property, plant and equipment (7) (293.0) (147.3)Proceeds from sale of financial assets at fair value through other comprehensive income (11) - 1.5Proceeds from sale of investment (22) - 3.5Dividends from equity-accounted investees (10) 30.1 22.6Loans issued to equity-accounted investees (30) (27.5) (27.5)Repayment of loans issued to equity-accounted investees (30) 27.5 -Cash flow (used in) investing activities (262.9) (146.8)
CONSOLIDATED STATEMENT OF CASH FLOWSFOR THE YEARS ENDED 31 DECEMBER

110 OCI N.V. Annual Report 2018 OCI N.V. Annual Report 2018 111
Other Inform
ationP
erformance R
eviewO
perational Strengths
Corporate G
overnanceS
ustainability Review
Financial Statem
ents
Consolidated Financial Statements
$ millions Note 2018 2017
Proceeds from sale of treasury shares (16) 6.8 4.3Purchase of treasury shares (16) (1.2) (0.2)Proceeds from borrowings (18) 3,290.8 140.1Repayment of borrowings (18) (3,241.1) (288.9)Newly incurred transaction costs (18) (76.9) (0.3)Dividends paid to non-controlling interest (17), (15) (21.1) (7.5)Repayment of convertible bond (equity component) (18) (12.3) -Acquisition of non-controlling interest (15) (117.6) (61.1)Cash flows (used in) financing activities (172.6) (213.6)
Net cash flows from / (used in) 236.1 (178.7)
Net increase / (decrease) in cash and cash equivalents 236.1 (178.7)Cash and cash equivalents at 1 January 231.0 391.5Effect of exchange rate fluctuations on cash held (6.4) 18.2Cash and cash equivalents at 31 December 460.7 231.0
The notes on pages 111 to 163 are an integral part of these consolidated financial statements.
CONSOLIDATED STATEMENT OF CASH FLOWSFOR THE YEARS ENDED 31 DECEMBER (CONTINUED)
NOTES TO THE CONSOLIDATED FINANCIAL STATEMENTS FOR THE YEARS ENDED 31 DECEMBER
1. General
OCI N.V. (‘OCI’ or ‘Company’) was established on 2 January 2013 as a public limited liability company incorporated under Dutch law, with its head office located at Honthorststraat 19, Amsterdam, the Netherlands. OCI is registered in the Dutch commercial register under no. 56821166 dated 2 January 2013. The consolidated financial statements comprise the financial statements of the Company, its subsidiaries (together referred to as the ‘Group’) and the Group’s interests in associates and joint ventures.
The Group is primarily involved in the production of natural gas-based products.
2. Basis of preparation
2.1 General
The consolidated financial statements have been prepared in accordance with International Financial Reporting Standards as endorsed by the European Union (IFRS-EU).
The consolidated financial statements have been prepared on the historical cost convention, except when otherwise indicated.
The financial year of the Group commences on 1 January and ends on 31 December.
The Company’s functional currency is the Euro (‘EUR’). Because the Group’s major foreign operations have the US dollar as their functional currency, the presentation currency of the Company is the US dollar (‘USD’). All values are rounded to the nearest tenth of a million (in millions of USD), except when stated otherwise.
These financial statements have been authorized for issue by the Company’s Board of Directors on 15 March 2019. These consolidated financial statements are subject to adoption by the Annual General Meeting of Shareholders on 29 May 2019.
Certain comparative numbers have been restated to confirm with the current year’s presentation. Such restatements do not impact the amounts recorded in our statement of financial position nor our statement of profit or loss and other comprehensive income, except for the restatement disclosed in note 2.2 below.
2.2 Adjustment of prior year statement of financial position
During 2018, management identified that the deferred tax liabilities were understated for one of its entities, due to the balance sheet approach not being correctly applied in its financial statements since 2013. As a consequence, the retained earnings have been overstated. The error has been corrected by adjusting each of the financial statement line items for prior periods. The following table is summarizing the impact on the group consolidated financial statements. The impact of changes in equity in 2017 of USD 54.7 million are reflected on the line item ‘Increase shareholding OCI Beaumont’ for USD 10.3 million and on the line item ‘Impact of the adjustment deferred tax liabilities OCI USA Inc.’ for USD 44.4 million. There was no impact on the Group’s operating results, basic or diluted earnings per share and no impact on the total operating, investing or financing cash flow for the year ended 31 December 2017.
Impact of correction of error:
1 January 2017$ millions
As previously reported
Adjustments Adjusted
Total assets 7,260.3 - 7,260.3
Deferred tax liabilities (209.1) (77.8) (286.9)
Other liabilities (5,273.2) - (5,273.2)
Total liabilities (5,482.3) (77.8) (5,560.1)
Retained earnings 4,776.9 77.8 4,854.7
Other equity components (6,554.9) - (6,554.9)
Total equity (1,778.0) 77.8 (1,700.2)

112 OCI N.V. Annual Report 2018 OCI N.V. Annual Report 2018 113
Other Inform
ationP
erformance R
eviewO
perational Strengths
Corporate G
overnanceS
ustainability Review
Financial Statem
ents
Consolidated Financial Statements
2.2 Adjustment of opening balances (continued)
31 December 2017$ millions
As previously reported
Adjustments Adjusted
Total assets 7,143.6 - 7,143.6
Deferred tax liabilities (224.6) (23.1) (247.7)
Other liabilities (5,477.0) - (5,477.0)
Total liabilities (5,701.6) (23.1) (5,724.7)
Retained earnings 4,929.4 23.1 4,952.5
Other equity components (6,371.4) - (6,371.4)
Total equity (1,442.0) 23.1 (1,418.9)
2.3 Completed demerger of the Engineering & Construction Business in 2015
OCI demerged the Company’s Engineering & Construction business in March 2015 (‘the Demerger’). The ultimate parent company holding the demerged Engineering & Construction activities and that became listed on the Cairo and Dubai stock exchanges directly after the demerger is Orascom Construction PLC (’OC’). The demerger was completed on 7 March 2015.
Ongoing relationship between OCI N.V. and Orascom Construction PLCAfter the Demerger, OCI and OC each operate as separately listed companies. There are no cross-directorships, other than Jerome Guiraud who is non-executive director of OCI N.V. and chairman of OC. The senior management teams of OCI N.V. and OC are different.
Construction contracts
During 2018 subsidiaries of OC and OCI were still party to continuing commercial arrangements for the construction of the Natgasoline plant, which was completed in the third quarter of 2018, reference is made to note 30.
Shared services agreementOCI and OC provide certain support services to each other on an ad-hoc basis. The consideration payable is on a cost-plus basis.
Conditional sale agreementOrascom Construction Industries S.A.E (‘OCI S.A.E.’) was the former parent company of the OCI Group, which was replaced by OCI N.V. in 2013 and was delisted from the Egyptian Stock Exchange in 2016. OCI S.A.E. acts as the sub holding of several operating fertilizer companies of OCI NV. At the time of the demerger, OCI S.A.E. also held certain construction activities that could not be legally transferred to Orascom Construction PLC as part of the demerger due to legal, regulatory, or other considerations.
In order to have the Engineering & Construction businesses derecognized from the OCI N.V. consolidated financial statements, a conditional sale agreement was entered into between the OCI Group and the OC Group. The agreement stipulates that the management of construction activities, as well as the economic effect of all related risks and rewards (including the right to any dividends), would be passed from OCI SAE to OC effective 30 September 2014 until OCI SAE’s construction activities are terminated, or until OCI SAE’s construction activities are demerged into a separate construction entity called ‘Construction Egypt’ that is then transferred to OC.
In addition to management, OC also received the right to vote on the board of directors of OCI S.A.E. in matters related to the construction business. This transfer of economic benefits, liabilities and rights will remain in force until the transfer of the ‘Construction Egypt’ shares have been legally formalized. Any new awarded projects will be sought through a wholly-owned subsidiary of OC.
Tax indemnity agreement On 6 February 2015, OC and OCI S.A.E. entered into a tax indemnity agreement. The agreement sets out each party’s obligations in respect of the tax claim lodged by the tax authorities in Egypt relating to the sale of the OCI S.A.E.’s cement business to Lafarge SA in 2007 (further reference is made to note 27). The parties have agreed to equally split any liability incurred by OCI S.A.E. in relation to the Tax Claim (including the costs of dealing with the Tax Claim). In addition, to the extent that any recoveries are made in relation to the tax claim, including interest received on the funds, these will be shared between the parties on a 50%/50% basis (excluding the amount of EGP 1.9 billion (refund received in March 2015) for which it was announced that the rights will be transferred to Tahya Misr social fund in Egypt).
3. Summary of significant accounting policies
The Group has applied the accounting policies set out in note 3 consistently over both periods presented in these consolidated financial statements, except for the new policies resulting from the application of IFRS 9 ‘Financial instruments’ and IFRS 15 ‘Revenue recognition’. These two new standards became effective as of 1 January 2018 and have not resulted in a restatement of the 2017 comparative numbers. The existing accounting policies for financial instruments and revenue recognition applicable to 2017 are included in note 3.5 and 3.13, respectively, while the new accounting policies for financial instruments and revenue recognition applicable to 2018 are included in note 4.1.1 and 4.1.2, respectively.
3.1 Consolidation
The consolidated financial statements include the financial statements of OCI, its subsidiaries and the Group’s interests in associates and joint ventures.
SubsidiariesSubsidiaries are all companies to which OCI is exposed or has rights to variable returns from its involvement with the investee and has the ability to affect those returns through its control over the investee, generally accompanying a shareholding of more than half of the shares issued and related voting power. Subsidiaries are fully consolidated from the date that control commences until the date that control ceases. When the Group ceases to have control over a subsidiary, it derecognizes the assets and liabilities of the subsidiary, and any related non-controlling interest and other components of equity. Any investment retained in the former subsidiary is recognized at fair value. The fair value shall be regarded as the fair value on initial recognition of a financial asset or, when appropriate, the cost on initial recognition of an investment in an associate or joint venture. Any resulting gain or loss is recognized in profit or loss including related cumulative translation adjustments accumulated in other comprehensive income. If it becomes an associate or joint venture, the interest retained is subsequently measured in accordance with the equity method. The principal subsidiaries are listed in note 34.
Transactions eliminated in the consolidated financial statementsIntra-group balances and transactions, and any unrealized income and expenses arising from intra-group transactions, are eliminated in preparing the consolidated financial statements. Unrealized gains arising from transactions with equity-accounted investees are eliminated against the investment to the extent of the Group’s interest in the investees. Unrealized losses are eliminated in the same way as unrealized gains, but only to the extent that there is no evidence of impairment.
Non-controlling interestNon-controlling interest is presented as a separate component in equity. ‘Profit or loss’ and ‘Total comprehensive income’ attributable to the non-controlling interest are presented as a separate line items in the consolidated statement of profit or loss and other comprehensive income. Non-controlling interest is measured at its proportionate share of the acquiree’s identifiable net assets at the balance sheet date. Changes in Group’s ownership interest in a subsidiary that do not result in a loss of control are accounted for as equity transactions.
3.2 Equity-accounted investees
AssociatesAssociates are those companies in which the Group exercises significant influence, but does not have control over the financial and operating policies, and are presumed to exist when the Group holds 20% to 50% of the shareholding and related voting rights of the other entity. Associates are accounted for under the equity method. The Group’s share of profit or loss of an associate is recognized in profit or loss from the date when significant influence begins up to the date when that influence ceases. Investments in associates with negative shareholder’s equity are impaired and a provision for its losses is recognized only if the Group has a legal or constructive obligation to cover the losses. Equity changes in investees accounted for under the equity method that do not result from profit or loss are recognized in other comprehensive income. Unrealized gains on transactions between the Group and its associates are eliminated to the extent of the Group’s interest in associates. Unrealized losses are also eliminated unless the transaction provides evidence of an impairment of the asset transferred. Unrealized gains on transactions between two associates are not eliminated.
Joint venturesInvestments in joint arrangements are classified as either joint ventures or joint operations depending on the contractual rights and obligations of each investor. Those joint arrangements that are assessed as joint ventures are accounted for using the equity method. Joint operations are accounted for using line by line accounting.
Joint ventures are accounted for under the equity method. Under the equity method of accounting, interests in joint ventures are initially recognized at cost and adjusted subsequently for the Group’s share in the post-acquisition profit or losses and movements in comprehensive income. When the Group’s share of losses in a joint venture equals or exceeds its interest in the joint venture (which includes any long-term interest that, in substance, forms part of the Group’s net investment in joint ventures), the Group does not recognize further losses, unless it has incurred obligations or made payments on behalf of the joint venture.
NOTES TO THE CONSOLIDATED FINANCIAL STATEMENTS CONTINUED

114 OCI N.V. Annual Report 2018 OCI N.V. Annual Report 2018 115
Other Inform
ationP
erformance R
eviewO
perational Strengths
Corporate G
overnanceS
ustainability Review
Financial Statem
ents
Consolidated Financial Statements
3. Summary of significant accounting policies (continued)
3.3 Business combinations
Business combinations are accounted for using the acquisition method. The cost of an acquisition is measured as the aggregate of the consideration transferred, measured at acquisition date, fair value and the amount of any non-controlling interest in the acquiree. For each business combination, the Group elects whether to measure the non-controlling interest in the acquiree at fair value or at the proportionate share of the acquiree’s identifiable net assets. Acquisition-related costs are expensed as incurred and included in administrative expenses.
When the Group acquires a business, it assesses the classification of particular financial assets and financial liabilities assumed as, at fair value through profit or loss, or at amortized cost or as a financial asset measured at fair value through other comprehensive income. The Group makes an assessment of whether embedded derivatives of the acquiree should be separates from their host contracts.
If the business combination is achieved in stages, the previously held equity interest is remeasured at its acquisition date fair value and any resulting gain or loss is recognized in profit or loss or other comprehensive income, as appropriate.
The consideration transferred in exchange for the acquiree includes any asset or liability resulting from a contingent consideration arrangement. The Group recognises the acquisition-date fair value of contingent consideration as part of the consideration transferred in exchange for the acquiree.
Changes in the fair value of consideration that are not measurement period adjustments shall be adjusted as follows:
• Contingent consideration classified as equity shall not be remeasured
• Other contingent consideration shall be measured at fair value with changes recognized in profit or loss
3.4 Foreign currency
Foreign currency transactionsThe financial statements of subsidiaries and joint operations are prepared in the currencies which are determined based on the primary economic environment in which they operate (‘the functional currency’). Transactions in currencies other than the functional currency are recorded at the rates of exchange prevailing on the transaction dates. At each balance sheet date, monetary items denominated in foreign currencies are revalued into the entity’s functional currency at the then prevailing closing-rates. Exchange differences arising on the settlement and translation of monetary items are included in profit or loss for the period except when deferred to other comprehensive income for financial assets at fair value through other comprehensive income and the effective part of qualifying cash flow hedges.
Foreign currency translationUpon consolidation, the assets and liabilities of subsidiaries with a functional currency other than the US dollars are translated into US dollars using the exchange rates prevailing at the balance sheet date. Income and expense items are translated using exchange rates prevailing at the date of the transactions. Investments in joint ventures and associates with a functional currency other than the US dollars are translated into US dollars using exchange rates prevailing on the balance sheet date. Exchange rate differences arising during consolidation and on the translation of investments in subsidiaries, joint arrangements and associates are included in other comprehensive income, as ‘Currency translation differences’. When a foreign operation is (partly) disposed of or sold, (the proportionate share of) the related currency translation differences that were recorded in other comprehensive income are recycled to profit or loss as part of the gain or loss on disposal or sale. Goodwill and fair value adjustments arising on the acquisition of a foreign subsidiary are considered as assets and liabilities denominated in the functional currency of the foreign subsidiary.
3.5 Financial instruments
Financial assets
IFRS 9 contains three principal classification categories for financial assets: measured at amortized cost, at fair value through profit or loss (‘FVTPL’) and at fair value through other comprehensive income (‘FVOCI’). The classification of financial assets under IFRS 9 is generally based on the business model in which a financial asset is managed and its contractual cash flow characteristics. IFRS 9 eliminates the previous IAS 39 categories of held to maturity, loans and receivables and available-for-sale.
Amortized cost
Trade and other receivables are held to collect contractual cash flows and are expected to give rise to cash flows representing solely payments of principal and interest. The Group analyzed the contractual cash flow characteristics of those instruments and concluded that they meet the ‘hold-to-collect’ business model criteria for amortized cost measurement. Interest income from these assets is included in finance income using the effective interest rate method. Any gain or loss on derecognition is recognized directly in profit or loss.
The Group sells certain trade receivables under a securitization agreement to a third party. For these selected debtors the Group will use the ‘hold-to-collect-and-sell business model’ as defined under IFRS 9 and will measure these receivables going forward at FVOCI.
Fair value through profit or loss (‘FVTPL’)
Derivative financial instruments held by the Group are classified in the category FVTPL, unless the instrument is designated in a hedge relationship and the hedge meets the requirements for hedge accounting. Under IFRS 9, derivatives embedded in contracts where the host is a financial asset in the scope of the standard are never separated. Instead, the hybrid financial instrument as a whole is assessed for classification.
Fair value through other comprehensive income (‘FVOCI’)
Equity investments, previously recognized as available-for-sale assets, are measured at FVOCI, based on the irrevocable election made by the Group. The Group elected this approach as these investments are not held for trading. Movements in the carrying amount are recognized in other comprehensive income, except for the recognition of impairment gains and losses, interest income and foreign exchange gains and losses which are recognized in the profit or loss. On derecognition the cumulative gain or loss recognized in other comprehensive income is not reclassified from equity to profit or loss. Dividend income is recognized in profit or loss when the Group’s right to received payment is established.
Financial liabilities
Financial liabilities, like loans and borrowings and trade and other payables, are measured at amortized cost, unless the financial liability:• is a derivative at FVTPL;
• arised from the transfer of a financial assets that does not qualify for derecognition or if the continuing involvement approach applies;
• is a financial guarantee contract;
• is a commitment to provide a loan at a below-market interest rate; and
• s a contingent consideration resulting from a business combination to which IFRS 3 applies, measured at FVTPL.
Impairment
The new impairment model requires the recognition of impairment provisions based on expected credit losses (ECL) rather than only incurred credit losses as is the case under IAS 39. Based on the assessment undertaken on historical data, there’s limited impact from the expected credit loss model. The Group will evaluate any possible impact going forward. For the assessment of loss allowance for expected credit losses, a simplified model for trade receivables is applied. The loss allowance is measured at initial recognition and throughout the life of the receivable at an amount equal to lifetime ECL. They are estimated based on the present value of all cash shortfalls over the remaining expected life of the financial asset, i.e., the difference between:
• the contractual cash flows that are due to an entity under the contract; and
• the cash flows that the holder expects to receive.
In order to assess the lifetime ECLs for trade receivables, both historic credit losses experience and forward-looking information is assessed.
For other receivables (and other financial assets) the Group measures the loss allowance at an amount equal to the lifetime ECLs if the credit risk on that financial instrument has increased significantly since initial recognition.
If at the reporting date, the credit risk of other receivables has not increased significantly since initial recognition, the Group measures the loss allowance for that financial instrument at an amount equal to 12-month ECL.
3.6 Cash and cash equivalents
Cash and cash equivalents comprise cash balances and call deposits with original maturities of three months or less from the acquisition date (original maturity) that are subject to an insignificant risk of changes in their fair value and are used by the Group in the management of its short-term commitments. Restricted cash comprises cash balances where specific restrictions exist on the Company’s ability to use this cash. Restricted cash includes cash deposited as collateral for letters of credit issued by the Company. Restricted funds include bank balances reserved by the lending institution for installments of loan payments to be made in the near future.
3.7 Share capital
Ordinary shares are classified as equity. Share premium is the excess amount received over the par value of the shares. Incremental costs directly attributable to the issue of new shares are recognized in equity as a deduction, net of tax, from the proceeds. When ordinary shares are repurchased, the amount of the consideration paid, which includes directly attributable costs, net of tax effects, is recognized as a deduction from ‘Reserves’. Repurchased shares are classified as treasury shares and are presented in ‘Reserves’. When treasury shares are sold or reissued subsequently, the amount received is recognized as an increase in ‘Reserves’, and the resulting surplus or deficit on the transaction is presented in share premium.
3.8 Property, plant and equipment
Items of property, plant and equipment are measured at cost less accumulated depreciation and any impairment. Cost includes expenditure that is directly attributable to the acquisition of the asset. The cost of self-constructed assets includes cost of material, direct labour, other directly attributable cost incurred to bring the asset ready to its intended use, cost of asset retirement obligations and any capitalized borrowing cost.
Purchased software that is integral to the functionality of the related equipment is capitalized as part of that equipment. When parts of property, plant and equipment have different useful lives, they are accounted for as separate items (major components) of property, plant and equipment.
NOTES TO THE CONSOLIDATED FINANCIAL STATEMENTS CONTINUED

116 OCI N.V. Annual Report 2018 OCI N.V. Annual Report 2018 117
Other Inform
ationP
erformance R
eviewO
perational Strengths
Corporate G
overnanceS
ustainability Review
Financial Statem
ents
Consolidated Financial Statements
3. Summary of significant accounting policies (continued)
Any gain or loss on disposal of an item of property, plant and equipment (calculated as the difference between the net proceeds from disposal and the carrying amount of the item) is recognized in profit or loss. Subsequent expenditures are capitalized only when it is probable that the future economic benefits associated with the expenditure will flow to the Group. Ongoing repairs and maintenance costs are expensed as incurred. Spare parts of property, plant and equipment are recognized under property, plant and equipment if the average turn-over exceeds 12 months or more, otherwise they are recognized within inventories.
Finance leases Leased assets in which the Group bears substantially all the risks and rewards incidental to ownership are classified as finance leases and recognized under property, plant and equipment. Upon initial recognition, the leased asset is measured at the lower of its fair value and the present value of minimum lease payments. Minimum lease payments made under finance leases are apportioned between the interest expenses and the reduction of the outstanding liability. The interest expenses are recognized as other financing cost over the lease term. The finance cost is allocated to each period during the lease term so as to produce a constant periodic rate of interest on the remaining balance of the liability.
Property, plant and equipment under construction Expenditures incurred for purchasing and constructing property, plant and equipment are initially recorded as ‘under construction’ until the asset is completed and becomes ready for use. Upon the completion of the assets, the recognized costs are reclassified from ‘under construction’ to its final category of property, plant and equipment. Assets under construction are not depreciated and measured at cost less any impairment losses.
Depreciation Items of property, plant and equipment are depreciated on a straight-line basis through profit or loss over the estimated useful lives of each component, taking into account any residual values. Finance lease assets are depreciated over the shorter of the lease term and their useful lives. If it is reasonably certain that the Group will obtain ownership by the end of the lease term, the finance lease assets are depreciated over their useful lives. Land is not depreciated. Items of property, plant and equipment are depreciated from the date that they are installed and are ready for use, or in respect of internally constructed assets, from the date that the asset is completed and ready for use.
The estimated useful lives for items of property, plant and equipment are as follows: Years
Buildings 10 - 50Plant and equipment 5 - 25Fixtures and fittings 3 - 10
Depreciation methods, useful lives and residual values are reviewed at each reporting date and adjusted if necessary by the Group.
Borrowing costs Borrowing costs attributable to the acquisition, construction or production of assets that necessarily take a substantial period of time to get ready for their intended use or sale, are recognized as part of the cost of those assets. All other borrowing costs are recognized as ‘Finance cost’ in the period in which they are incurred.
3.9 Goodwill and other intangible assets
GoodwillGoodwill represents the excess of purchase price and related costs over the value assigned to the Groups’ share of identifiable assets acquired and liabilities assumed of businesses acquired that were directly attributable to the legal entities comprising the Group. If the fair value of the net assets acquired is in excess of the aggregate consideration transferred, the gain is recognized in profit or loss.
Goodwill on acquisition of entities that qualify as subsidiaries is presented under ‘Goodwill and intangible assets’. Goodwill on acquisitions of entities that qualify as associates or joint ventures is included in ‘Equity-accounted investees’. Goodwill on acquisition of subsidiaries is allocated to cash-generating units for the purpose of impairment testing. The allocation is made to those cash-generating units or group of units that are expected to benefit from the business combination through which the goodwill arose, based on past experience.
Goodwill is initially measured at cost. After initial recognition, goodwill is measured at cost less any impairment losses. Goodwill is tested annually for impairment; an impairment loss is recognized for the amount by which the cash-generating unit’s carrying amount exceeds its recoverable amount. The recoverable amount of the cash-generating unit is determined by the higher of its fair value less cost to sell and its value in use. Impairment losses on goodwill are not reversed. Gains or losses on the disposal of an entity include the carrying amount of goodwill related to the entity sold. All other expenditures on internally generated goodwill and other intangible assets is recognized in profit or loss as incurred.
Other intangible assetsOther intangible assets with a finite useful life (licenses, customer relations, brand names and other rights that are acquired separately or through business combinations) are amortized on a straight-line basis in profit or loss over their estimated useful lives taking into account any residual value and impairment losses, from the date that they are available for use.
The estimated useful lives of intangible assets are as follows: Years
Licenses and trade names 3 - 10Purchased rights and other 4 - 10
Amortization methods, useful lives and residual values are reviewed at each reporting date and adjusted if necessary.
3.10 Inventories
Inventories are measured at the lower of cost and net realizable value. The cost of inventories of raw materials, spare parts and supplies are based on the weighted average principle or the first-in-first-out method, and includes expenditure incurred in acquiring the inventories and bringing them to their existing location and condition. In case of manufactured inventories and work in progress, cost includes an appropriate share of production overheads based on normal operating capacity. Net realizable value is the estimated selling price in the ordinary course of business, less the estimated costs of completion and selling expenses.
3.11 Impairment of assets
Non-derivative financial assetsThe Group assesses at each balance sheet date whether there is objective evidence that a non-derivative financial asset or a group of non-derivative financial assets is impaired. A non-derivative financial asset is considered to be impaired if the counterparty does not meet the agreed payment terms or when evidence exists that the counterpart will not be able to do so. The Group considers evidence of impairment for these assets at both an individual asset and a collective level. All individually significant assets are individually assessed for impairment. Those found not to be impaired are then collectively assessed for any impairment that has been incurred but not yet individually identified. Assets that are not individually significant are collectively assessed for impairment. Collective assessment is carried out by grouping together assets with similar risk characteristics. In assessing collective impairment, the Group uses historical information on the timing of recoveries and the amount of loss incurred, and makes an adjustment if current economic and credit conditions are such that the actual losses are likely to be greater or lesser than suggested by historical trends. An impairment loss is recognized for the amount by which the carrying amount of a non-derivative financial asset exceeds its estimated discounted future cash flows using the original interest rate. Impaired non-derivative financial assets are tested periodically to determine whether the estimated future cash flows have increased and the impairment has to be reversed. Reversal of impairments is only permitted if in a subsequent period after an impairment loss has been recognized, the amount of the impairment loss decreases and the decrease can be related objectively to an event after the impairment loss was recognized.
In the case of a financial asset classified as financial asset at fair value through other comprehensive income, a significant or prolonged decline in the fair value of the financial asset at fair value through other comprehensive income below its acquisition cost is considered as an indicator that the financial asset at fair value through other comprehensive income is impaired. If any such evidence exists for a financial asset at fair value through other comprehensive income, the cumulative loss – measured as the difference between the acquisition cost and the current fair value, less any impairment loss on that financial asset previously recognized in profit or loss – is removed from other comprehensive income and recognized in profit or loss. Impairment losses recognized in profit or loss on equity instruments classified as financial asset at fair value through other comprehensive income are not reversed through profit or loss.
Derivative financial assetsDerivative financial assets are measured at fair value and the Group investigates whether the counterparty’s creditworthiness gives rise to an impairment. When determining the fair value, credit value and debit value adjustments are taken into account.
Non-financial assetsNon-financial assets that have an indefinite useful life, for example goodwill, are not subject to amortization but are tested annually for impairment or more frequently when indicators arise. Assets with a finite useful life are subject to depreciation or amortization and are reviewed at each reporting date to determine whether there is an indication of impairment. If any such indication exists, then the assets’ recoverable amount is estimated. An impairment loss is recognized for the amount by which the assets’ carrying amount exceeds its recoverable amount. The recoverable amount is the higher of an asset’s fair value less costs of disposal and its value in use. The value in use is the present value of the future cash flows expected to be derived from an asset or cash-generating unit by continued use. For the purposes of assessing impairment, assets are grouped based on the lowest level for which there are separately identifiable cash flows (cash-generating units). Impairment losses are recognized in profit or loss. They are allocated first to reduce the carrying amount of any goodwill allocated to the CGU, and then to reduce the carrying amounts of the other assets in the CGU on a pro-rata basis. Non-financial assets, which are impaired, are tested periodically to determine whether the recoverable amount has increased and the impairment be (partially) reversed. Impairment losses on goodwill are not reversed. For other assets, an impairment loss is reversed only to the extent that the asset’s carrying amount does not exceed the carrying amount that would have been determined, net of depreciation or amortization, if no impairment loss had been recognized. Reversal of impairments is only permitted if in a subsequent period after an impairment loss has been recognized, the amount of the impairment loss decreases and the decrease can be related objectively to an event after the impairment loss was recognized.
NOTES TO THE CONSOLIDATED FINANCIAL STATEMENTS CONTINUED
118 OCI N.V. Annual Report 2018 OCI N.V. Annual Report 2018 119
Other Inform
ationP
erformance R
eviewO
perational Strengths
Corporate G
overnanceS
ustainability Review
Financial Statem
ents
Consolidated Financial Statements
3. Summary of significant accounting policies (continued)
3.12 Provisions
Provisions are recognized when a present legal or constructive obligation based on past events exists, and it is probable that an outflow of economic benefits is required to settle the obligation. If the outflow is probable, but cannot be determined reliably, the obligation is disclosed. The non-current part of provisions is determined by discounting the expected future cash flows at a pre-tax rate that reflects current market assessments of the time value of money and the risks specific to the liability. The unwinding of the discount is recognized as finance cost.
Asset retirement obligations The Group recognizes a provision if the Group has an obligation to restore a leased asset in its original condition at the end of its lease term and in case of legal requirements with respect to clean-up of contamination of land, and the estimate can be made reliable.
Claims and contingenciesThe Group is subject to legal and regulatory proceedings in various jurisdictions. Such proceedings may result in criminal or civil sanctions, penalties or disgorgements against the Company. If it is probable that an obligation to the Group exists, which will result in an outflow of resources and the amount of the outflow can be reliably estimated, a provision is recognized.
Donation provisionThe donation provision is recognized as a constructive obligation, the amount is undiscounted as the Group does not know the exact settlement date.
3.13 Revenue from contracts with customers
Revenues are recognized to depict the transfer of goods or services to customers in the ordinary course of the Group’s activities, in the amounts that reflect the considerations to which the Group expects to be entitled in exchange for those goods or services. Revenue is recognized when the Group satisfies the performance obligations by transferring promised goods or services to customers. The main performance obligation of the Group is the transfer of the Group’s fertilizer and chemical products to customers. Revenue from the sale of fertilizer and chemical products are the two main revenue streams of the Group.
Goods are transferred when the customer obtains control of the asset. The timing of when control transfers depends on the sales and shipping terms agreed. Depending on its nature and the agreed sales terms, a performance obligation is either satisfied at certain point in time or over a certain period of time.
Revenue is recognized net of expected discounts and rebates to customers. Accumulated experience and management judgement is used to estimate and provide for the discounts and rebates and revenue is only recognized to the extent that it is highly probably that a significant reversal will not occur. The Group does not have any contracts where the period of time between the transfer of the promised goods or services to the customer and payment by the customer exceeds one year. Consequently, no adjustment is made to transaction prices for the time value of money.
3.14 Government grants
An unconditional government grant related to an asset is recognized in profit or loss as ‘Other income’ when the grant becomes receivable. When the grant relates to an asset, it is recognized as income in equal amounts over the expected useful life of the related asset. Grants that compensate the Group for expenses incurred are recognized in profit or loss as ‘Other income’ on a systematic basis in the periods in which the expenses are recognized. Other government grants are recognized initially as deferred income at fair value when there is reasonable assurance that they will be received and the Group will comply with the conditions associated with the grant, and are then recognized in profit or loss as ‘Other income’ on a systematic basis over the useful life of the asset.
3.15 Operating leases
Leases in which a significant portion of the risks and rewards incidental to ownership are retained by the lessor are classified as operating leases. Payments made by OCI under operating leases (net of any incentives received from the lessor) are charged to the consolidated statement of profit or loss and other comprehensive income on a ‘straight-line’ basis over the period of the lease.
3.16 Finance income and cost
Finance income comprises:
• interest income on funds invested (including on financial assets at fair value through other comprehensive income);
• gains on the disposal of financial assets at fair value through other comprehensive income;
• dividend income;
• fair value gains on financial assets at fair value through profit or loss;
• gains on hedging instruments related to foreign currency and interest rate derivatives that are recognized in profit or loss and reclassifications of amounts previously recognized in other comprehensive income; and
• interest income is recognized as it accrues in profit or loss, using the effective interest method.
Dividend income is recognized in profit or loss on the date that the Group’s right to receive payment is established, which in the case of quoted securities is normally the ex-dividend date.
Finance cost comprise:
• interest expense on borrowings;
• unwinding of the discount on provisions and contingent consideration;
• losses on disposal of financial assets at fair value through other comprehensive income;
• fair value losses on financial assets at fair value through profit or loss;
• loss on hedging instruments related to foreign currency and interest rate derivatives that are recognized in profit or loss and reclassifications of amounts previously recognized in other comprehensive income; and
• impairment losses recognized on financial assets (other than trade receivables).
Borrowing costs that are not directly attributable to the acquisition, construction or production of a qualifying asset are recognized in profit or loss and expensed as incurred. Foreign currency gains and losses are recognized on a net basis as either finance income or finance cost depending on whether foreign currency movements are in a net gain or net loss position.
3.17 Employee benefits
Defined contribution planCertain Group subsidiaries provide pension plans, end of service remuneration plans and long-term service benefits. These pension plans qualify as defined contribution plans. Obligations for contributions to defined contribution plans are expensed as the related service is provided. Prepaid contributions are recognized as an asset to the extent that a cash refund or a reduction in future payments is available.
Short-term employee benefitsShort-term employee benefits are expensed as the related service is provided. A liability is recognized for the amount expected to be paid if the Group has a present legal or constructive obligation to pay this amount as a result of past service provided by the employee and the obligation can be estimated reliably.
Long-term employee benefitsThe Group long-term employee benefits are recognized if the Group has a present legal or constructive obligation to pay this amount as a result of past service provided by the employee and the obligation can be estimated reliably to determine its present value. The discount rate is the yield at the balance sheet date on triple-A (‘AAA’) credit rated bonds that have maturity dates approximating to the terms of the Group’s obligations. Re-measurements are recognized in profit or loss in the period in which they arise.
Termination benefits Employee termination benefits are payable when employment is terminated before the normal retirement date, or whenever an employee accepts voluntary redundancy in exchange for these benefits. OCI recognizes termination benefits when OCI is demonstrably committed to either terminating the employment of current employees according to a detailed formal plan without possibility of withdrawal, or when OCI is providing termination benefits as a result of an offer made to encourage voluntary redundancy. Benefits falling due more than 12 months after balance sheet date are discounted to present value.
Share-based paymentsEmployees (including senior executives) of the Group receive remuneration in the form of share-based payments, whereby employees render services as consideration for equity instruments.
The grant date fair value of equity-settled share-based payment awards granted to employees is recognized as an employee expense, with a corresponding increase in equity, over the period (the vesting period) that the employees render service and becomes unconditionally entitled to the awards. The amount recognized as an expense is adjusted to reflect the number of awards for which the related service and non-market performance conditions are expected to be met, such that the amount ultimately recognized as an expense is based on the number of awards that meet the related service and non-market performance conditions at the vesting date.
For cash-settled share-based compensation plans and share-based compensation plans with cash alternatives the liability is remeasured at each balance sheet date during the vesting period and for share option plans also during the exercise period.
NOTES TO THE CONSOLIDATED FINANCIAL STATEMENTS CONTINUED

120 OCI N.V. Annual Report 2018 OCI N.V. Annual Report 2018 121
Other Inform
ationP
erformance R
eviewO
perational Strengths
Corporate G
overnanceS
ustainability Review
Financial Statem
ents
Consolidated Financial Statements
3. Summary of significant accounting policies (continued)
3.18 Income tax
Current taxCurrent tax is the expected tax payable or receivable on the taxable income or loss for the year, using tax rates enacted or substantively enacted at the reporting date, and any adjustment to tax payable or receivable in respect of previous years. Current tax payable also includes any tax liability arising from the declaration of dividends. Current income tax receivable and payable are offset when there is a legally enforceable right to offset and when the current income tax relates to the same fiscal authority.
Deferred taxDeferred income tax liabilities are recognized for all taxable temporary differences arising between the tax bases of assets and liabilities and their carrying amounts in the consolidated financial statements (‘liability’ method). Deferred income tax assets are recognized for all deductible temporary differences, unused carry forward losses and unused carry forward tax credits, to the extent that it is probable that future taxable profit will be available against which the deferred income tax assets can be utilized.
Deferred income tax is not recognized if it arises from initial recognition of an asset or liability in a transaction that is not a business combination and at the time of the transaction affects neither accounting nor taxable profit or loss. Also, no deferred income tax is recognized regarding the initial recognition of goodwill and regarding investments in subsidiaries, associates and joint arrangements to the extent that the Group is able to control the timing of the reversal of the temporary differences and it is probable that they will not reverse in the foreseeable future.
Deferred income tax is measured at the tax rates that are expected to apply to the period when the asset is realized or the liability is settled, based on tax rates (and tax laws) that have been enacted or substantively enacted at the balance sheet date. Deferred income tax assets and liabilities are offset when there is a legally enforceable right to offset current tax assets against current tax liabilities and when the deferred income tax relates to the same fiscal authority.
3.19 Segment reporting
An operating segment is a component of an entity that engages in business activities for which it may earn revenues and incur expenses (including revenues and expenses relating to transactions with other components of the same entity), whose operating results are regularly reviewed by the entity’s Chief Operating Decision Maker (‘CODM’) to make decisions about resource allocation to the segment and to assess its performance and for which discrete financial information is available. The Group determines and presents operating segments on the basis of information that internally is provided to the CODM during the period. Operating segments are grouped into reporting segments based on similar economic environments and similar products.
3.20 Consolidated statement of cash flows
The consolidated statement of cash flows has been prepared using the ‘indirect’ method. Cash flows in foreign currencies have been translated applying average exchange rates. Currency translation differences are shown separately in the consolidated statement of cash flows. Cash flows from investing activities consist mostly of investments and divestments in property, plant and equipment, intangible assets, and acquisitions insofar as these are paid for in cash. Acquisitions or disposals of subsidiaries are presented as acquisition of subsidiary, net of cash. Cash flows relating to capitalized borrowing cost are presented as cash flows from operating activities. Cash flows from discontinued operations / assets held for demerger are presented separately from the cash flows from continuing operations.
3.21 Earnings per share
Earnings per ordinary share are calculated by dividing the profit or loss (net) attributable to holders of ordinary shares by the weighted average number of ordinary shares outstanding during the year. In making this calculation the (ordinary) treasury shares are deducted from the number of ordinary shares outstanding. The calculation of the diluted earnings per share is based on the weighted average number of ordinary shares outstanding plus the potential increase as a result of the conversion of convertible bonds and the settlement of share-based compensation plans (share option plans). Anti-dilutive effects are not included in the calculation. The convertible notes are assumed to be converted in full. An adjustment is made to profit or loss (net) to eliminate interest charges, whilst allowing for effect of taxation. Regarding equity-settled share option plans it is assumed that all outstanding plans will vest. The potential increase arising from share option plans is based on a calculation of the value of the options outstanding. This is the number of options multiplied by the exercise price, divided by the average share price during the financial year. This potential increase is only applied if the option has intrinsic value.
4. New accounting standards and policies
On a regular basis, the IASB issues new accounting standards, amendments and revisions to existing standards and interpretations. These new accounting standards, amendments and revisions to existing standards and interpretations are subject to endorsement by the European Union.
4.1 Standards, amendments, revisions and interpretations that became effective to OCI during 2018
The Group has applied the following standards for the first time in the annual reporting period commencing 1 January 2018:
4.1.1 IFRS 9 ‘Financial instruments’
IFRS 9 replaces the provisions of IAS 39 that relates to the recognition, classification and measurement of financial assets and financial liabilities, derecognition of financial instruments, impairment of financial assets and hedge accounting. The adoption of IFRS 9 resulted in changes in accounting policies and adjustments to the amounts recognized in the financial statements. In accordance with the transitional provisions in IFRS 9, comparative figures have not been restated. IFRS 9 replaces the ‘incurred loss’ model in IAS 39 with an ‘expected credit loss’ (ECL) model. The new impairment model applies to financial assets measured at amortized cost and debt investments at FVOCI (fair value through other comprehensive income), but not to investments in equity instruments. Under IFRS 9, credit losses are recognized earlier than under IAS 39. The Group applies the IFRS 9 simplified approach in measuring expected credit losses, which uses a lifetime expected loss allowance for all trade receivables. The assessment of the expected credit losses did not result in an additional impairment of trade receivables at the initial adoption of the standard at 1 January 2018. This will be monitored on a continuous basis going forward and periodically reassessed.
There was no impact on the Group’s accounting for financial liabilities, except for modifications of financial liabilities. That is, when a financial liability measured at amortized cost is modified without this resulting in derecognition, a gain or loss is recognized in profit or loss. The gain or loss is calculated as the difference between the original contractual cash flows and the modified cash flows discounted at the original effective interest rate.
As IFRS 9 is required to be applied retrospectively. The modification gains and losses arising from financial liabilities that are still recognized at the date of initial application (1 January 2018) were calculated and adjusted through opening retained earnings on transition based on the transitional provisions in IFRS 9, except for debt modification losses relating to Iowa Fertilizer Company (‘IFCo’), which are adjusted in the opening balance of property, plant and equipment.
The adoption of IFRS 9 resulted in a different classification for available-for-sale financial assets, which are now presented as financial assets at fair value through other comprehensive income.
NOTES TO THE CONSOLIDATED FINANCIAL STATEMENTS CONTINUED

122 OCI N.V. Annual Report 2018 OCI N.V. Annual Report 2018 123
Other Inform
ationP
erformance R
eviewO
perational Strengths
Corporate G
overnanceS
ustainability Review
Financial Statem
ents
Consolidated Financial Statements
4.1 Standards, amendments, revisions and interpretations that became effective to OCI during 2018 (continued)
The total impact of the application of IFRS 9 on the Group’s retained earnings as at 1 January 2018 is as follows:
$ millions
Opening balance as previously reported 1
January 20181
Impact of adoption of
IFRS 9
Restated opening balance as at 1
January 2018
AssetsNon-current assetsProperty, plant and equipment 5,143.2 9.6 5,152.8Goodwill and other intangible assets 491.0 - 491.0Trade and other receivables 62.0 - 62.0Equity-accounted investees 626.9 - 626.9Available-for-sale financial assets 50.0 (50.0) -Financial assets at fair value through other comprehensive income - 50.0 50.0Deferred tax assets 31.5 2.1 33.6
Total non-current assets 6,404.6 11.7 6,416.3
Current assetsInventories 190.8 - 190.8Trade and other receivables 317.1 - 317.1Income tax receivables 0.1 - 0.1Cash and cash equivalents 231.0 - 231.0
Total current assets 739.0 - 739.0
Total assets 7,143.6 11.7 7,155.3
EquityShare capital 5.6 - 5.6Share premium 6,316.3 - 6,316.3Reserves (242.9) - (242.9)Retained earnings (4,929.4) (7.3) (4,936.7)
Equity attributable to owners of the Company 1,149.6 (7.3) 1,142.3Non-controlling interest 292.4 (0.4) 292.0
Total equity 1,442.0 (7.7) 1,434.3
Liabilities
Non-current liabilitiesLoans and borrowings 3,844.5 19.4 3,863.9Trade and other payables 19.3 - 19.3Provisions 10.1 - 10.1Deferred tax liabilities 224.6 - 224.6
Total non-current liabilities 4,098.5 19.4 4,117.9
Current liabilitiesLoans and borrowings 833.1 - 833.1Trade and other payables 569.1 - 569.1Provisions 126.9 - 126.9Income tax payables 74.0 - 74.0
Total current liabilities 1,603.1 - 1,603.1
Total liabilities 5,701.6 19.4 5,721.0
Total equity and liabilities 7,143.6 11.7 7,155.3
1 The amounts presented are the closing balances as previously reported in our 2017 annual report. As described in note 2.2. we adjusted certain previously reported 2017 opening and closing balances in these financial statements.
4.1.2 IFRS 15 ‘Revenue from contracts with customers’
IFRS 15 has been adopted retrospectively. No opening balance adjustments were made as the impact was immaterial.
4.2 Standards, amendments, revisions and interpretations not yet effective to OCI
IFRS standards and interpretations thereof not yet in force which may apply to the future Group’s consolidated financial statements are being assessed for their potential impact. The most important upcoming changes are:
IFRS 16 ‘Leases’IFRS 16 issued on 13 January 2016 is effective for reporting periods beginning on or after 1 January 2019, with earlier application permitted. IFRS 16 sets out the principles for the recognition, measurement, presentation and disclosure of leases for both parties to a contract, i.e. the customer (‘lessee’) and the supplier (‘lessor’). IFRS 16 introduces a single lessee accounting model.
Applying that model, a lessee (like the Group) is required to recognize: (a) assets and liabilities for all leases with voluntary exceptions for short-term leases (of less than 12 months) and leases of which the underlying asset is of low value; and (b) depreciation of lease assets separately from interest on lease liabilities in the statement of profit or loss, (c) repayment of lease liabilities are presented as cash flows from finance activities.
OCI has chosen to implement IFRS 16 using the modified retrospective approach effective 1 January 2019, not restating any comparative numbers. While applying the modified retrospective approach, OCI has elected the option to measure the right-of-use asset based on the value of the lease liability, to exclude initial direct cost of the measurement of the lease liability and to use the incremental borrowing rate to determine the present value of the remaining lease payments. The incremental borrowing rate will be determined for each lease liability as the sum of the entity specific average borrowing rate and a discount reflecting the security of the underlying ‘right-of-use asset’, taking into account the term structure difference between the average borrowing rate and the term of the lease.
The adoption is not expected to result in any adjustment to equity in the 2019 opening balance and will not affect any covenants.
The group elected the following practical expedients and applied these consistently to all leases:
• no reassessment of whether any expired or existing contracts are or contain leases.
• excluded initial direct costs for any existing leases.
• excluded leases with a remaining term of less than 12 months at the transition date.
The impact of implementing IFRS 16 on our 2019 net result is expected to be immaterial.
The group started the IFRS 16 implementation project early 2018 with a focus on contract assessments during the last quarter of 2018 covering all existing lease contracts. Currently, the project is nearly finalized with a final review of contracts entered into during the last quarter of 2018 and an update of our assessment of incremental borrowing rates as at 1 January 2019. As several new trading companies were setup at the end of 2018, the group also entered into several new contracts at the end of the financial year. In our quarterly reporting for the first quarter of 2019 we will include the first-time adoption impact of implementing IFRS 16.
For 1 January 2019, the Group has estimated:• right-of-use assets in the range of USD 175 to 225 million;
• non-current lease liabilities in the range of USD 150 to 200 million; and
• current lease liabilities of approximately USD 25 million.
The impact of implementing IFRS 16 on our 2019 net result is expected to be immaterial.
The group started the IFRS 16 implementation project early 2018 with a focus on contract assessments during the last quarter of 2018 covering all existing lease contracts. Currently, the project is nearly finalized with a final review of contracts entered into during the last quarter of 2018 and an update of our assessment of incremental borrowing rates as at 1 January 2019. As several new trading companies were setup at the end of 2018, the group also entered into several new contracts at the end of the financial year. In our quarterly reporting for the first quarter of 2019 we will include the first-time adoption impact of implementing IFRS 16.
5. Critical accounting judgment, estimates and assumptions
The preparation of the financial statements in compliance with IFRS requires management to make judgments, estimates and assumptions that affect amounts reported in the consolidated financial statements. The estimates and assumptions are based on experience and various other factors that are believed to be reasonable under the circumstances and are used to judge the carrying values of assets and liabilities that are not readily apparent from other sources. The estimates and underlying assumptions are reviewed on an ongoing basis. Revisions to accounting estimates are recognized in the period in which the estimate is revised or in the revision period and future periods, if the changed estimates affect both current and future periods. The most critical accounting policies, involving a higher degree of judgment and complexity in applying principles of valuation and for which changes in the assumptions and estimates could result in significantly different results than those recorded in the financial statements, are the following:
Goodwill and other intangible assets
Intangible assets with finite useful lives are carried at cost less cumulative amortization and any impairment. Amortization is calculated using the ‘straight-line’ method based on the estimated useful lives. Management makes estimates regarding the useful lives and residual values and assumes that amortization takes place on a ‘straight-line’ basis. The assets’ useful lives are reviewed, and adjusted if appropriate, at each balance sheet date. For intangible assets with finite useful lives, OCI assesses annually or more frequently whether indicators exist that suggest the intangible asset might be impaired by comparing the recoverable amounts with their carrying amounts. In determining the recoverable amounts of intangible assets, OCI makes estimates and assumptions about future cash flows based on the value in use. In doing so, OCI also makes assumptions and estimates regarding the discount rates in order to calculate the net present value of the future
NOTES TO THE CONSOLIDATED FINANCIAL STATEMENTS CONTINUED

124 OCI N.V. Annual Report 2018 OCI N.V. Annual Report 2018 125
Other Inform
ationP
erformance R
eviewO
perational Strengths
Corporate G
overnanceS
ustainability Review
Financial Statem
ents
Consolidated Financial Statements
5. Critical accounting judgment, estimates and assumptions (continued)
cash flows. OCI tests at least annually whether goodwill is impaired by comparing the recoverable amounts of cash-generating units with their carrying amounts. The recoverable amount is the higher of the fair value less cost of disposal and the value in use. In determining the recoverable amount, OCI makes estimates and assumptions concerning future revenues, future costs, future working capital, future investments, Weighted Average Cost of Capital (‘WACC’) and future inflation rates.
Property, plant and equipment Depreciation is calculated using the ‘straight-line’ method based on the estimated useful lives, taking into account any residual values. Management makes estimates regarding the useful lives and residual values and assumes that depreciation takes place on a ‘straight-line’ basis. The assets’ residual values and useful lives are reviewed, and adjusted if appropriate, at each balance sheet date. OCI assesses annually, or more frequently, whether indicators exist that suggest that an item of property, plant and equipment might be impaired by comparing the recoverable amounts with their carrying amounts. In determining the recoverable amounts of property, plant and equipment, OCI makes estimates and assumptions about future cash flows based on the value in use. The discount rate to be used in order to calculate the net present value of the future cash flows in the impairment analysis is based on the WACC.
Financial instruments The fair value of financial instruments traded in active markets (financial instruments in the fair value hierarchy level 1) is based on quoted market prices at the balance sheet date. The fair value of financial instruments not traded in an active market with observable market prices (financial instruments in the fair value hierarchy level 2) is determined using generally accepted valuation techniques. These valuation techniques include estimates and assumptions about forward rates, discount rates based on a single interest rate, or on a yield-curve based on market conditions existing at the balance sheet date. The fair value of borrowings and interest rate swaps is calculated based on the present value of the estimated future cash flows based on the yield-curve applicable at the balance sheet date. If the financial instrument contains a floating interest rate, the future expected interest rates are determined based on forward rates. The fair value of forward foreign exchange contracts is determined using quoted forward exchange rates at the balance sheet date. Gas price option and gas swap contracts are valued using applicable market yield curves. All inputs for the fair value calculations represent observable market data that are obtained from external sources that are deemed to be independent and reliable. The net carrying amount of trade receivables and trade payables is assumed to approximate the fair value due to the short-term nature. The fair value of financial instruments with no observable market prices (financial instruments in the fair value hierarchy level 3) is based on assumptions that market participants would use when pricing these asset or liability, including assumptions about risk. Assumptions about risk include the risk inherent in a particular valuation technique used to measure fair value (such as a pricing model) and the risk inherent in the inputs to the valuation technique, including a risk adjustment when there is significant measurement uncertainty.
The fair value of non-current financial liabilities is estimated by discounting the future cash flows using original effective yield-curves. Unlisted equity securities in the financial assets at fair value through other comprehensive income category (financial instruments in the fair value hierarchy level 3) are measured at cost less impairments. A significant and prolonged decline in the fair value of a financial asset at fair value through other comprehensive income below its acquisition cost is considered as an indicator that the financial asset at fair value through other comprehensive income is impaired. If any such evidence exists for a financial asset at fair value through other comprehensive income, the cumulative losses previously recognized in other comprehensive income is recognized in the profit or loss – measured as the difference between the acquisition cost and the current fair value, less any impairment loss on that financial asset previously recognized in profit or loss – is removed from other comprehensive income and recognized in profit or loss.
Impairment financial instruments (including trade receivables)Objective evidence may exist in circumstances in which a counterparty has been placed in bankruptcy, or has failed on the repayments of principal and interest. In other circumstances OCI uses judgment to determine whether financial assets may be impaired. OCI uses judgment to determine whether an impairment can be reversed, an assumption in doing so might be an improvement in the debtor’s credit rating or receipt of payments due. For listed equity securities in the financial assets at fair value through other comprehensive income category, the Group uses the assumption that if the market value declined by more than 25 percent and more than 6 months, the asset is assumed to be impaired.
For unlisted equity securities in the financial assets at fair value through other comprehensive income category, an impairment test is performed if objective evidence becomes available to the Group that the asset might be impaired. For debt-securities, an impairment trigger exists when the counterpart fails to meet its contractual payment obligations or there is evidence that the counterpart has encountered financial difficulties. The impairment is determined based on the carrying amount and the recoverable amount.
The recoverable amount is determined as the present value of estimated future cash flows using the original effective interest rate.
Inventories In determining the net realizable value of inventories, OCI estimates the selling prices in the ordinary course of business, cost of completion and cost to sell. In doing so, OCI makes estimates and assumptions based on current market prices, historical usage of various product categories versus current inventory levels and specific identified obsolescence risks (e.g. end of life of specific goods and spare parts and the impact of new environmental legislation).
Provisions Recognition of provisions include significant estimates, assumptions and judgments. IFRS requires only those provisions to be recognized if there is an expected outflow of resources in the near future and if the cost of these outflows can be estimated reliably. Accordingly, management exercises considerable judgment in determining whether it is more likely than not that there is a present obligation as a result of a past event at the end of the reporting period, whether it is probable that such a proceeding will result in an outflow of resources and whether the amount of the obligation can be reliably estimated. These judgments are subject to change as new information becomes available. The required amount of a provision may change in the future due to new developments in the matter. Revisions to estimates may
significantly impact future profit or loss. Upon resolution, the Group may incur charges in excess of the recorded provisions for such matters.
Provisions for asset retirement obligations, represent estimated costs of decommissioning. Due to the long time period over which future cash outflows are expected to occur, including the respective interest accretion, assumptions are required to be made. Amongst others, the estimated cash outflows could alter significantly if, and when, political developments affect future laws and regulation with respect to asset retirements. The Group has not recognized any asset retirement obligations because a reliable estimate of the amount of the obligations cannot be made.
With respect to legal cases, the Group has to estimate the outcome. Regulatory and legal proceedings as well as government investigations often involve complex legal issues and are subject to substantial uncertainties. The Company periodically reviews the status of these proceedings with both the internal and external legal counsels.
Income taxes OCI is subject to income taxes in several jurisdictions. Estimates are required in determining the group-wide provision for income taxes. There are some transactions and calculations for which the ultimate tax position is uncertain during the ordinary course of business. The Group recognizes provisions for anticipated tax audit issues based on estimates of whether additional taxes will be due. Where the final tax outcome of these matters is different from amounts that were initially recorded, such differences will impact the current income tax and deferred tax provisions in the period in which such determination is made. OCI recognizes deferred tax assets to the extent that it is probable that future taxable profits will be available for the deferred tax asset to be recovered. This is based on estimates of taxable future income by jurisdiction in which OCI operates and the period over which deferred tax assets are expected to be recoverable. In the event that actual results or new estimates differ from previous estimates and depending on the possible tax strategies that may be implemented, changes to the recognition of deferred tax assets could be required, which could impact the financial position and profit or loss.
Leases
The assessment of whether a contract is or contains a lease requires judgment with respect to whether the lessor has substantive substitution rights, who obtains economic benefits from use of the asset and who takes the ‘how and for what purpose’ decisions during the period of use. Judgement is also applied in order to assess whether the entity will exercise any extension or cancelation options of a lease. The group applies judgments in order to determine the incremental borrowing rate in order to calculate the lease liability.
Control over investees
In determining whether OCI shall consolidate certain investments in joint arrangements, OCI makes assumptions about whether certain decisions rights are substantive or protective in nature. In doing so, OCI applies judgement regarding shareholder agreements it has with those other investees. If OCI determines it holds the majority of the substantive decision rights, it assumes that it holds power over the investee. OCI also makes assumptions whether it is exposed to variable returns and whether these are linked to the power OCI holds. The linkage is tested by making assumptions whether OCI might be acting as a principal rather than an agent. If OCI meets all three criteria, OCI assumes it controls the investee.
Liquidity riskAs part of the preparation of the financial statements, the Company has assessed its liquidity risk and going concern. Liquidity risk is the risk that the Group may encounter difficulty in meeting the obligations associated with its financial liabilities that are settled by delivering cash or another financial asset. The Company has made a number of assumptions in assessing its ability to meet its covenant requirements and satisfy obligations as they become due. Determining these assumptions requires significant judgment about future results and cash flows. Key assumptions include product pricing, gas pricing, utilization rates and the ability to arrange financing and obtain waivers for potential covenant breaches.
6. Financial risk and capital management
OverviewThe Group has exposure to credit, liquidity and market risks from financial instruments. These risks arise from exposures that occur in the normal course of business and are managed on a consolidated company basis. This note presents information about the Group’s exposure to each of the above risks, the Group’s objectives, policies and processes for measuring and managing these risks, additionally it also includes the Group’s management of capital.
Risk management frameworkThe Board has oversight responsibility on the establishment and monitoring of the Group’s risk management framework. Senior (local) management is responsible for the effective operation of the internal risk management and control systems. The Audit and Risk department is responsible for the facilitation and supervision of the Risk Management function, compliance with OCI Internal Control Framework and supports the Board in the exercise of their aforementioned risk management duties.
The Group’s risk management policies and practices are established to identify and analyze the risks faced by the Group, to set appropriate risk limits and controls and to monitor risks and adherence to limits. Risk management policies and systems are reviewed regularly to reflect changes in market conditions and the Group’s business activities. The Group, through its training and management standards and procedures, aims to develop a disciplined and constructive control environment in which all employees understand their roles and responsibilities.
The Audit Committee oversees how management monitors compliance with the Group’s risk management policies and procedures, and reviews the adequacy of the risk management framework in relation to the risks faced by the Group. The Audit Committee is assisted in its oversight role by the Audit and Risk Department. The Audit and Risk Department undertakes both regular and ad hoc reviews of risk management controls and procedures, the results of which are reported to the Audit Committee.
NOTES TO THE CONSOLIDATED FINANCIAL STATEMENTS CONTINUED

126 OCI N.V. Annual Report 2018 OCI N.V. Annual Report 2018 127
Other Inform
ationP
erformance R
eviewO
perational Strengths
Corporate G
overnanceS
ustainability Review
Financial Statem
ents
Consolidated Financial Statements
6.1 Credit risk
Credit risk is the risk of financial loss to the Group if a customer or counterparty to a financial instrument fails to meet its contractual obligations, and arises principally from the Group’s receivables from customers and investments in debt securities. The Company mitigates the exposure to credit risk on outstanding cash balances by placing funds at multiple financial institutions with a sufficient credit rating. The Group’s exposure to customer credit risk is monitored and mitigated by performing credit checks before selling any goods. No collateral is received. The Group establishes an allowance, if needed, for impairment that represents its estimate of expected losses in respect of trade and other receivables. The main components of this allowance are a specific loss component that relates to individually significant exposures, and a collective loss component established for groups of similar assets in respect of losses that are expected based on historical performance. IFRS 9 establishes a three-stage impairment model, based on whether there has been a significant increase in the credit risk of a financial asset since its initial recognition. As at 31 December 2018, management assessed any significant increase in credit risk based on internal and external factors related to the financial instruments and concluded no such significant credit risk was present. Hence, no allowance related to credit risk has been recognized.
As of September 2018, the Group entered into a securitization agreement to sell certain trade receivables to an external financial institution. The agreement permits securitization of trade receivables up to EUR 120.0 million (USD 137.1 million). As per 31 December 2018 an amount of EUR 119.7 million (USD 136.8 million) of trade receivables were transferred. The previous factoring program that was in place ended in September 2018.
With respect to transactions with financial institutions, the Group sets a minimum credit rating for the counterparties. The maximum exposure to credit risk is the carrying amount of financial instruments, for an overview reference is made to the tables financial instruments by category. There is no significant concentration of credit risk in trade and other receivables, financial assets at fair value through other comprehensive income or cash and cash equivalents.
The maximum exposure to credit risk at the reporting date is as follows:
$ millions Note 2018 2017
Trade and other receivables (9) 520.8 379.1
Financial assets at fair value through other comprehensive income (11) 36.9 50.0Cash and cash equivalents (14) 460.7 231.0Total 1,018.4 660.1
The maximum exposure to credit risk for trade and other receivables by geographic region is as follows:
$ millions 2018 2017
Middle East and Africa 86.7 76.3Asia and Oceania 26.0 2.3Europe 297.4 231.9Americas 110.7 68.6Total 520.8 379.1
6.2 Liquidity risk
6.2.1 General
Liquidity risk is the risk that the Group will encounter difficulty in meeting the obligations associated with its financial liabilities that are settled by delivering cash or another financial asset.
The following are the contractual maturities of financial liabilities, including estimated interest payments and exclude the impact of netting agreements:
At 31 December 2018$ millions Note
Carryingamount
Contractualcash flow
Less than 1 year
Between 1 and 5 years
More than5 years
Financial liabilitiesCash outflows:Loans and borrowings (18) 4,580.3 6,195.0 560.7 3,785.4 1,848.9Trade and other payables (19) 847.5 847.5 838.7 8.4 0.4Letters of guarantee (27) - 0.2 - 0.2 -Derivatives (19) 15.5 15.5 10.2 5.3 -Total 5,443.3 7,058.2 1,409.6 3,799.3 1,849.3
At 31 December 2017$ millions Note
Carryingamount
Contractualcash flow
Less than 1 year
Between 1 and 5 years
More than5 years
Financial liabilitiesCash outflows:Loans and borrowings (18) 4,677.6 5,579.7 1,051.8 3,547.9 980.0Trade and other payables (19) 587.0 587.0 567.7 19.3 -Letters of guarantee (27) - 0.2 - 0.2 -Derivatives (19) 1.4 1.4 1.4 - -Total 5,266.0 6,168.3 1,620.9 3,567.4 980.0
The interest on floating rate loans and borrowings is based on forward interest rates at period-end. This interest rate may change as the market interest rate changes. Callable loan amounts are classified as ‘Less than one year’. The future obligations will be managed by the future incoming cash from operations, currently available non-restricted cash and cash equivalents of USD 442.0 million and unused amounts on credit facility agreements in the amount of USD 294.4 million, reference is made to note 18.
The Group’s approach to managing liquidity risk is to ensure that it will always have sufficient liquidity to meet its liabilities when due, under both normal and stressed conditions, without incurring unacceptable losses or risking damage to the Group’s reputation. This is also safeguarded by using multiple financial institutions in order to mitigate any concentration of liquidity risk.
Following completion of the bulk of the Group’s expansion projects, the Group’s financing strategy is to secure external financing primarily at OCI N.V. with debt at an operating company level only if there is a compelling economic rationale. Excess cash flows are centralised to OCI N.V. to fund future investment projects. OCI N.V. acts as the financing company thus limiting the number of cross relationships within the Company and maximizing flexibility to divest operating companies.
The liquidity risk is monitored internally at Group level. On an ongoing basis the Group prepares liquidity forecasts to verify whether the Group is able to meet its future debt obligations. The Company has also carefully evaluated the funding of its Business Plan for at least the next 12 months from the date of issuance of the financial statements, taking into account the measures mentioned below and has applied sensitivities to the forecast level of liquidity headroom available. Key assumptions include product pricing, natural gas pricing and utilization rates. Management has applied these assumptions to the forecasts, which would leave sufficient liquidity headroom.
6.2.2 Refinancing activities
Several refinancing activities were completed during the first half of 2018 to optimize the Group’s finance cost, extend its debt maturity profile, and enhance its cashflow up-streaming to OCI N.V.
• On 26 January 2018, IFCo received bondholder approval to exchange USD 425.0 million of its 2019 and 2022 bonds for a new issuance of 2033 and 2037 bonds. The new bonds will be interest only until 1 June 2031 and the exchange extends the aggregate weighted average life of these bonds from 2.5 years to 16.7 years. The exchanged bonds are priced at a rate of 5.25% compared to a weighted average rate of 5.41% upon settlement for the original bonds. The bondholders also agreed to modify terms of the IFCo bonds to, among other things, permit the debt service reserve fund to be funded in full by the deposit of a standby letter of credit; permit IFCo to satisfy its obligation to fund its project operating reserve up to the required balance incrementally over a thirty-six month period; and permit the replacement of OEC’s performance security under the EPC Contract. IFCo incurred USD 14.3 million of debt issuance costs related to the bond exchange in 2018.
• On 13 March 2018, OCI Beaumont (‘OCIB’) successfully closed a USD 455.0 million term loan B facility (the “Term Loan B Facility”) and a USD 40.0 million revolving credit facility. The new Term Loan B Facility of USD 455.0 million replaces and upsizes OCIB’s USD 232 million term loan B facility and is priced at LIBOR + a margin of 4.25%, 2.50% lower than the previous facility, and resulted in an extended maturity of 2025 from 2019. OCIB used the net proceeds of the Term Loan B Facility to repay in full OCIB’s existing term loan B facility and to repay in full the outstanding intercompany loans from OCI N.V. of USD 200 million. OCIB incurred USD 8.2 million of debt issuance costs related to the new financing in 2018.
• In March 2018, OCI N.V. entered into a bridge facility of USD 148.6 million (EUR 130 million). The short-term facility originally planned to mature in March 2019 and carried an interest rate of EURIBOR plus a margin of 4.50%. Simultaneously, OCI N.V. entered into short-term facility with NNS Luxembourg (a related party) for an amount of USD 114.3 million (EUR 100 million). The maturity dates and interest rates for both facilities were identical. Total transaction costs were incurred for an amount of USD 4.2 million. Both facilities were fully utilized to redeem the convertible bond.
• In March 2018, OCI N.V. announced an invitation to the bondholders of its USD 387.4 million (EUR 339 million) 3.875% convertible bonds due September 2018, to tender their bonds for purchase by OCI N.V. The purchase price was USD 115,566 (EUR 101,125) plus a buy back premium of USD 857 (EUR 750), for each bond with a nominal value of USD 114,280 (EUR 100,000). The offer was accepted by bondholders holding convertible bonds for the full principal amount USD 387.4 million (EUR 339 million). A total principal amount of USD 387.4 million was paid to bondholders, of which USD 12.3 million was allocated to the equity component of the convertible bonds.
NOTES TO THE CONSOLIDATED FINANCIAL STATEMENTS CONTINUED

128 OCI N.V. Annual Report 2018 OCI N.V. Annual Report 2018 129
Other Inform
ationP
erformance R
eviewO
perational Strengths
Corporate G
overnanceS
ustainability Review
Financial Statem
ents
Consolidated Financial Statements
6.2.2 Refinancing activities (continued)
• On 26 April 2018, OCI N.V. successfully completed the offering of dual-tranche debut bonds consisting of USD 650.0 million senior secured fixed rate notes due 2023 (the “Dollar Notes”) and EUR 400.0 million senior secured fixed rate notes due 2023 (the “Euro Notes”, and together with the Dollar Notes, the “Notes”). The Dollar Notes bear interest at a rate of 6.625% per annum and the Euro Notes bear interest at a rate of 5.0% per annum. The Notes, issued at par, are senior secured obligations of the Company and are guaranteed by certain of the Company’s subsidiaries. Interest is payable semi-annually. On 26 April 2018, OCI N.V. also entered into a new revolving credit facility and term loan A facility. The new revolving credit facility has a total commitment of USD 700 million (USD 500 million with a 5-year maturity and USD 200 million with a 3-year maturity), with two 1-year extension options. The new term loan A facility has a total commitment of USD 400 million equivalent denominated in euros and a 4-year maturity. Both facilities bear an initial interest rate margin of 4.0% over LIBOR, which declines with the Company’s deleveraging profile. The existing debt at OCI N.V. and OCI Nitrogen B.V. was fully replaced and redeemed after this refinancing. Total debit issuance costs relating to the bond and the facility were USD 42.3 million.
• In May 2018, EFC closed a refinancing of its existing financial indebtedness, with facilities from commercial banks (including Egyptian, regional and international) and Development Financing Institutions (EBRD and IFC). The facility size is USD 380 million and EGP 1,120 million of debt, or approximately a total of USD 445 million, and bears an interest rate margin of 3.75% over LIBOR on the USD commitments and 0.75% over CBE Mid Corridor on the EGP commitments. Total transaction costs were incurred for an amount of USD 7.9 million. The existing debt of EFC was fully replaced and redeemed after this refinancing.
After performing the above-mentioned refinancing activities, management believes that the liquidity risk is within acceptable boundries. The new and existing debt requirements are expected to be settled in the ordinary course of business with operational cash flows.
6.3 Market risk
Market risk is the risk of changes in market prices, such as foreign exchange rates, interest rates, commodity prices and equity prices that will affect the Group’s income or the value of its holdings of financial instruments. The objective of market risk management is to manage and control market risk exposures within acceptable parameters, while optimizing the return.
The Group is exposed to foreign currency risk arising in separate ways:
Foreign exchange translation risk Due to the Group’s international presence, the Group is exposed to foreign exchange fluctuations as these affect the translation of the Group’s business entities presented in foreign currencies that are different from the US dollar (which is the Group’s functional currency). The currencies concerned are mainly the Euro and the Algerian dinar. Foreign exchange translation exposure is considered a part of doing business on an international level; this risk is not hedged. The Group seeks to mitigate translation risk to our credit metrics by broadly matching the currency of debt with cashflows.
Foreign exchange transaction riskThe Group entities predominantly execute their activities in their respective functional currencies. The Group is however exposed to foreign exchange transaction risk to the extent that there is a mismatch between the currencies in which sales, purchases, investments and borrowings are denominated and the respective functional currencies of the Group entities. The Group monitors the exposure to foreign currency risk arising from operating activities and enters selectively into foreign exchange contracts to hedge foreign currency exposures. The nominal amount of the foreign currency derivatives outstanding as per 31 December 2018 was USD 85.6 million (2017: USD 73.7 million) and relates to the USD exposure in companies with Euro as their functional currency. The functional currencies of the Group entities are primarily the US dollar, the Algerian dinar and the Euro. EFC and EBIC have exposure to fluctuations in the USD/EGP exchange rates.
The summary of balances of the Group’s exposure to foreign exchange transaction, where the main exposure currencies are different from the functional currencies, including intercompany balances, is as follows:
At 31 December 2018$ millions USD EUR EGP
Trade and other receivables 67.4 6.4 68.0Trade and other receivables intercompany 934.6 10.3 0.7Trade and other payables (30.6) (4.7) (7.8)Trade and other payables intercompany (24,6) (8.0) (1.1)Loans and borrowings (1,161.0) - (59.9)Loans and borrowings intercompany (29.3) - -Provisions - - (106.5)Cash and cash equivalents 176.3 19.0 22.6
NOTES TO THE CONSOLIDATED FINANCIAL STATEMENTS CONTINUED
At 31 December 2017$ millions USD EUR EGP
Trade and other receivables 13.4 5.5 66.8Trade and other receivables intercompany 1,127.3 0.8 0.4Trade and other payables (8.7) (1.4) (18.1)Trade and other payables intercompany (40.2) (6.4) (3.6)Loans and borrowings (533.8) - (56.9)Loans and borrowings intercompany (1,133.9) - -Provisions - - (106.8)Cash and cash equivalents 56.2 7.7 32.3
The Algerian dinar is not included in the above table of foreign exchange transaction exposure, since there are no entities in the Group which have monetary items denominated in Algerian dinar, except for Sorfert, which has the Algerian dinar as its functional currency.
Significant ratesThe following significant exchange rates applied during the year:
Average 2018
Average 2017
Closing 2018
Closing 2017
Euro 1.1813 1.1310 1.1428 1.2020Egyptian pound 0.0562 0.0562 0.0559 0.0561Algerian dinar 0.0086 0.0090 0.0085 0.0088
The following tables demonstrate the sensitivity to a reasonably possible change in EUR, EGP and DZD exchange rates, with all other variables held constant. The Group’s exposure to foreign currency changes for all other currencies is not material.
31 December 2018$ millions
Change in FX rate
Effect on profit before tax
Effect on equity
EUR - USD 7 percent 22.7 -
(7) percent (22.7) -
EGP - USD 3 percent (2.5) -
(3) percent 2.5 -
DZD - USD 3 percent (7.0) -(3) percent 7.0 -
31 December 2017$ millions
Change in FX rate
Effect on profit before tax
Effect on equity
EUR - USD 7 percent 41.1 -
(7) percent (41.1) -
EGP - USD 7 percent (6.0) -
(7) percent 6.0 -
DZD - USD 4 percent (0.9) -
(4) percent 0.9 -
The figures in the above overview are determined based on the currency volatility of the respective years. A significant part of the Group’s exposure to foreign currency transaction risk relates to intercompany balances.
Interest rate riskThe Group’s cash flow interest rate risks arise from the exposure to variability in future cash flows of floating rate financial instruments and refinancing fixed rate borrowings. The Group regularly reviews its exposure to the global interest rate environment. The Group has not entered into any interest rate derivative.
130 OCI N.V. Annual Report 2018 OCI N.V. Annual Report 2018 131
Other Inform
ationP
erformance R
eviewO
perational Strengths
Corporate G
overnanceS
ustainability Review
Financial Statem
ents
Consolidated Financial Statements
6.3 Market risk (continued)
The Group analyses its interest rate exposure on a dynamic basis. The Group calculates the impact on profit or loss of a defined interest rate shift. The same interest rate shift is used for all currencies. The following table demonstrates the sensitivity to a reasonably possible change in interest rates on that portion of borrowings affected. With all other variables held constant, the Group’s profit before tax is affected through the impact on floating rate borrowings plus refinancing of fixed rate borrowings, as follows:
$ millions In basis points 2018 2017
Effect on profit before tax for the coming year +100 bps (18.3) (23.1)- 100 bps 18.3 22.5
The assumed movement in basis points for the interest rate sensitivity analysis is based on the currently observable market data, showing a lower volatility compared to prior years. The interest rate sensitivity calculation is based on the interest-bearing liabilities excluding the restricted funds of IFCo, reference is made to note 14.
Commodity price riskNatural gas is one of the primary raw materials used in the Group’s production processes. The Group is exposed to natural gas price commodity risk for those entities that buy natural gas at spot prices. Management monitors the development of gas prices and products’ selling prices on a daily basis using external historical and forecast market data provided by several data vendors. Management analyzes the potential profit margin per product based on these data in order to make operational and hedging decisions.
The Group enters into gas hedges in order to hedge future gas price levels over a certain period of time (reference is made to note 19). The Group uses derivatives (flat priced, swaps and options) in order to do so and did not apply hedge accounting on these instruments, therefore all fair value changes related to this financial instrument are recognized in profit or loss. Fixed price gas contracts are accounted for under the ‘own use’ exemption and accounted at cost. The fiscal year 2019 gas price risk is managed by the Group the to an extend of 27% (including both natural hedges and financial hedges).
The outstanding gas derivates in MMBtu as per 31 December 2018 for the years 2019-2023 are:
• Flat priced contracts USD 21.9 million;
• Options USD 44.3 million;
• Swaps USD 0.3 million.
For the entities that are impacted by changes in natural gas prices during FY 2019, an increase in the average natural gas prices by USD 1 per MMBtu would negatively impact the total annual cost of sales by USD 84.7 million and a decrease by USD 1 MMBtu would have a positive impact on cost of sales by USD 79.3 million.
Categories of financial instruments:
31 December 2018$ millions Note
Loans and receivables / payables at
amortized costDerivatives at fair value
Financial assets through other comprehensive income
at fair value
AssetsTrade and other receivables (9) 516.1 4.7 -Financial assets at fair value through other comprehensive income (11) - - 36.9Cash and cash equivalents (14) 460.7 - -Total 976.8 4.7 36.9
LiabilitiesLoans and borrowings (18) 4,580.3 - -Trade and other payables (19) 847.5 15.5 - Total 5,427.8 15.5 -
31 December 2017$ millions Note
Loans and receivables / payables at
amortized costDerivatives at fair value
Available-for-sale financial asset at
fair value
Available-for-sale financial asset at
amortized cost
AssetsTrade and other receivables (9) 376.1 3.0 - -
Available-for-sale financial assets (11) - - 26.0 24.0Cash and cash equivalents (14) 231.0 - - -Total 607.1 3.0 26.0 24.0
LiabilitiesLoans and borrowings (18) 4,677.6 - - -Trade and other payables (19) 587.0 1.4 - - Total 5,264.6 1.4 - -
The Group has limited financial instruments carried at fair value. For derivative financial instruments, the fair value is calculated within hierarchy category level 2. Financial assets at fair value through other comprehensive income recognized as level 1 is USD 3.6 million (2017: USD 4.4 million), the investment in the Infrastructure and Growth Capital Fund of USD 10.1 million (2017: USD 21.6 million) was recognized as level 2 and the investment in Notore Chemical of USD 23.2 million (2017: USD 24.0 million) is recognized as level 3, reference is made to note 11. Notore was listed on the Nigerian Stock Exchange in 2018, however due to the lack in trading volumes the investments is still valued within the hierarchy category level 3 based on audited financial statements.
In 2018 and 2017, there were no transfers between the fair value hierarchy categories. The fair value of loans and borrowings and receivables are disclosed in notes 18 and 9, respectively.
6.4 Capital management
The Board’s policy is to maintain a strong capital base so as to maintain investor, creditor and market confidence and to sustain future development of the business. Capital consists of ordinary shares, retained earnings and non-controlling interest of the Group. The Board of Directors monitors the return on capital as well as the level of dividends to ordinary shareholders. The Group is required by external financial institutions to maintain certain capital requirements compared to its debt. Reference is made to note 18 for a description of financial covenants.
The Group’s net debt to equity ratio at the reporting date was as follows:
$ millions Note 2018Adjusted
2017
Loans and borrowings (18) 4,580.3 4,677.6
Less: cash and cash equivalents (14) 460.7 231.0
Net debt 4,119.6 4,446.6Total equity 1,479.4 1,421.3Net debt to equity ratio at 31 December 2.78 3.13
NOTES TO THE CONSOLIDATED FINANCIAL STATEMENTS CONTINUED

132 OCI N.V. Annual Report 2018 OCI N.V. Annual Report 2018 133
Other Inform
ationP
erformance R
eviewO
perational Strengths
Corporate G
overnanceS
ustainability Review
Financial Statem
ents
Consolidated Financial Statements
7. Property, plant and equipment
$ millionsLand and buildings
Plant and equipment
Fixtures and fittings
Under construction Total
Cost 198.2 4,562.3 19.7 2,134.4 6,914.6Accumulated depreciation (46.8) (1,622.1) (14.7) - (1,683.6)At 1 January 2017 151.4 2,940.2 5.0 2,134.4 5,231.0
Movements in the carrying amount:Additions - 31.7 1.1 202.9 235.7Disposals - (2.1) (0.4) - (2.5)Depreciation (10.9) (315.9) (1.9) - (328.7)Reclassification - (16.4) - - (16.4)Transfers 400.4 1,845.8 3.9 (2,250.1) - Effect of movement in exchange rates (0.9) 17.2 - 7.8 24.1At 31 December 2017 540.0 4,500.5 7.7 95.0 5,143.2
Cost 598.7 6,489.4 24.2 95.0 7,207.3Accumulated depreciation (58.7) (1,988.9) (16.5) - (2,064.1)At 31 December 2017 540.0 4,500.5 7.7 95.0 5,143.2
Impact of adoption of IFRS 9 - 9.6 - - 9.6Restated balance at 1 January 2018 540.0 4,510.1 7.7 95.0 5,152.8
Movements in the carrying amount:Additions 0.4 4.0 4.0 301.5 309.9Disposals (0.8) (1.3) - - (2.1)Depreciation (26.9) (393.7) (2.0) - (422.6)Transfers 0.2 160.0 4.7 (164.9) -Effect of movement in exchange rates (2.6) (51.3) (0.2) (8.2) (62.3)At 31 December 2018 510.3 4,227.8 14.2 223.4 4,975.7
Cost 594.1 6,533.6 32.3 223.4 7,383.4Accumulated depreciation (83.8) (2,305.8) (18.1) - (2,407.7)At 31 December 2018 510.3 4,227.8 14.2 223.4 4,975.7
As at 31 December 2018, the Group has land with a carrying amount of USD 35.3 million (2017: USD 35.3 million).
The transfers of USD 164.9 million are mainly assets under construction that were put into use during the year. This relates mainly to EBIC for USD 9.1 million, OCI Nitrogen for 89.4 million, IFCo for USD 32.6 million and BioMCN for USD 30.8 million. The additions of USD 301.5 million mainly relate to OCI Nitrogen USD 74.0 million (turn-around cost of ammonia plant), IFCo USD 38.8 million (several smaller projects) and BioMCN USD 168.7 million (expansion of second line). The effect of movement in exchange rates in 2018 mainly relates to Sorfert and OCI Nitrogen, which have different functional currencies (Algerian dinar and Euro respectively), to the Group’s presentation currency. The Algerian dinar decreased by 3.4% and the Euro decreased by 4.9% against the US dollar in 2018. The capitalized borrowing costs during the year ended 31 December 2018 amounts to USD 4.1 million and relates fully to BioMCN. The capitalized borrowing costs during the year ended 31 December 2017 amounted to USD 67.9 million and related fully to IFCo. The capitalized borrowing costs for both periods were substantially paid.
The difference between the additions in the above schedule and the investments in property, plant and equipment mentioned in the consolidated statement of cash flows is mainly caused by capital expenditure creditors not yet paid and capitalized borrowing costs, which are presented as part of interest expenses under cash flows from operating activities in the consolidated statement of cash flows. For capital commitments reference is made to note 28.
Property, plant and equipment of USD 2,636.4 million (2017: USD 3,112.0 million) have been pledged as security for external loans and borrowings. Of this amount, USD 2,144.8 million (2017: USD 2,213.5 million) is pledged by IFCo and USD 491.6 million (2017: USD 547.9 million) by OCI Beaumont. Property, plant and equipment of OCI Nitrogen is no longer pledged as security (2017: USD 350.6 million). Reference is made to note 18.
Liens have been placed on IFCo in the amount of USD 53.7 million, reference is made to note 27.
8. Goodwill and other intangible assets
$ millions GoodwillLicenses and
trademarksOther intangible
assets Total
Cost 1,805.5 69.5 4.4 1,879.4Accumulated amortization and impairment (1,322.9) (65.7) (1.3) (1,389.9)At 1 January 2017 482.6 3.8 3.1 489.5
Movements in the carrying amount:Amortization - (1.2) (1.0) (2.2)Effect of movement in exchange rates 2.8 0.4 0.5 3.7At 31 December 2017 485.4 3.0 2.6 491.0
Cost 1,808.3 79.3 5.1 1,892.7Accumulated amortization and impairment (1,322.9) (76.3) (2.5) (1,401.7)At 31 December 2017 485.4 3.0 2.6 491.0
Movements in the carrying amount:Amortization - (1.3) (1.0) (2.3)Effect of movement in exchange rates (1.1) (0.1) (0.2) (1.4)At 31 December 2018 484.3 1.6 1.4 487.3
Cost 1,807.2 75.4 4.8 1,887.4Accumulated amortization and impairment (1,322.9) (73.8) (3.4) (1,400.1)At 31 December 2018 484.3 1.6 1.4 487.3
GoodwillGoodwill has been allocated to the cash generating units as follows:
Cash generating units $ millions Reporting segment 2018 2017
Egyptian Fertilizers Company (‘EFC’) Nitrogen MENA 440.0 440.0OCI Beaumont Methanol US 23.0 23.0OCI Nitrogen Nitrogen Europe 21.3 22.4Total 484.3 485.4
Licenses and trademarksThe licenses and trademarks mainly relate to the customer relationships, trademarks and technology assets of OCI Nitrogen. These intangible assets were identified during the acquisition of OCI Nitrogen in 2010. The useful life of the customer relationships, trademarks and technology assets are respectively 5 to 10 years, 3 years and 5 years.
Other intangible assetsOther intangible assets were recognized as part of the purchase price allocation related to the acquisition of BioMCN B.V. (‘BioMCN’) in 2015.
Goodwill impairment testing The determination of the recoverable amounts for the cash generating units requires significant judgments and estimates, including projections of future cash flows from the businesses. The recoverable amounts have been estimated based on value in use.
The tests were carried out by discounting future cash flows to be generated from the continuing use of the cash-generating units to which the goodwill applies and on the assumption of an indefinite life. Key assumptions used in the calculation of recoverable amounts are the discount rate, the terminal value growth rate, selling price outlook per product, natural gas prices and the number of expected operating days per plant. Selling prices assumptions are based on a published independent price outlook prepared by global fertilizer experts. The other assumptions used are based on past experience and external sources, but that are unpredictable and inherently uncertain.
The impairment tests are based on specific estimates for the US dollar cash flow projections for the years 2019 to 2023 (this period captures the cyclical nature of the industry). For the subsequent years the residual values were calculated based on the average EBITDA margin of the projection period and whereby a perpetual growth rate of 1.5% was taken into account. The estimated pre-tax cash flows are discounted to their present value using pre-tax discount rates.
NOTES TO THE CONSOLIDATED FINANCIAL STATEMENTS CONTINUED

134 OCI N.V. Annual Report 2018 OCI N.V. Annual Report 2018 135
Other Inform
ationP
erformance R
eviewO
perational Strengths
Corporate G
overnanceS
ustainability Review
Financial Statem
ents
Consolidated Financial Statements
8. Goodwill and other intangible assets (continued)
The following rates were applied in performing the impairment test:
Percentage
2018 2017
EFC OCI Beaumont OCI Nitrogen EFC OCI Beaumont OCI Nitrogen
Pre-tax discount rate 14.0% 10.0% 10.7% 13.4 % 8.9 % 10.0 %Perpetual growth rate 1.5% 1.5% 1.5% 1.5 % 1.5 % 1.5 %
Result of the impairment test For all cash generating units the recoverable values significantly exceed the carrying amounts. In 2018 the headroom of EFC is USD 162.0 million, compared to a headroom USD 152.0 million in 2017.
Impairment of EFC goodwill would occur if sales prices would be consistently more than 6.0% lower in the period 2019-2023 compared to the prices assumed in the impairment model.
9. Trade and other receivables
$ millions 2018 2017
Trade receivables (net) 280.5 178.4Loans and trade receivables due from related parties (note 30) 65.4 67.9Prepayments 36.5 24.1Derivative financial instruments 4.7 3.0Other tax receivables 83.3 83.1Supplier advanced payments 21.7 22.6Other receivables 28.7 -Total 520.8 379.1Non-current 4.1 62.0Current 516.7 317.1
Total 520.8 379.1
In 2018, the Group entered into a securitization agreement to sell certain trade receivables to an external financial institution. By doing so, the Group is able to receive cash flows from selected debtors sooner than would normally be the case. Upon transfer of the balances, OCI derecognizes the trade receivables, since substantially all risks and rewards of ownership are transferred. The agreement permits securitization of trade receivables up to EUR 120.0 million (USD 137.1 million). As per 31 December 2018 an amount of EUR 119.7 million (USD 136.8 million) of trade receivables were transferred. The previous factoring program that was in place ended in September 2018.
The EUR 119.7 million (USD 136.8 million) transferred trade receivables are pledged as security under the securitization program (in 2017 USD 108.2 million was pledged as security for loans and borrowings).
The other tax receivable contains an amount of EGP 900 million (USD 50.3 million) relating to a payment made to the Egyptian Tax Authorities as part of the tax claim which will be refunded upon settlement of the tax claim. Reference is made to note 27 ‘OCI S.A.E. tax dispute’.
The carrying amount of ‘Trade and other receivables’ as at 31 December 2018 approximates its fair value.
The aging of current trade receivables at the reporting date were as follows:
$ millions 2018 2017
Neither past due nor impaired 259.8 164.7Past due 1 - 30 days 19.9 13.7Past due 31 - 90 days 0.7 -Past due 91 - 360 days 0.1 -More than 360 days - -Total 280.5 178.4
Management believes that the unimpaired amounts that are past due by more than 30 days are collectible in full, based on historic payment behavior and extensive analysis of customer credit risk, including underlying customers’ credit ratings if they are available. The Group has not recognized any allowance for trade receivables.
Derivative financial instruments include the following:
$ millions 2018 2017
Commodity contracts 4.7 0.8Foreign exchange contracts - 2.2Total 4.7 3.0
10. Equity-accounted investees
(i) The following table shows the movements in the carrying amount of the Group’s associates and joint ventures:
$ millions 2018 2017
At 1 January 626.9 653.3Share in income (30.8) (6.1)Dividend (30.1) (22.6)Intercompany profit elimination on upstream transactions 1.3 -
Effect of movement in exchange rates (0.7) 2.3
At 31 December 566.6 626.9
Joint ventures 4.0 4.1Associates 562.6 622.8Total 566.6 626.9
(ii) The Group has interests in the following associates and joint ventures:
Name Type Participation via Country Participation %
Firewater LLC (Natgasoline) Associate Firewater B.V. United States 50.0Sitech Manufacturing Services C.V. Associate OCI Nitrogen B.V. The Netherlands 35.0Sitech Utility Holding Beheer B.V. Associate OCI Nitrogen B.V. The Netherlands 40.0Sitech Utility Holding C.V. Associate OCI Nitrogen B.V. The Netherlands 39.9Sitech Services B.V. Associate OCI Nitrogen B.V. The Netherlands 23.0Nitrogen Iberian Company SL. Joint venture OCI Nitrogen B.V. Spain 50.0Shanxi Fenghe Melamine Company Ltd. Joint venture OCI Nitrogen B.V. China 49.0Fitco OCI Agro S.A. Joint venture OCI Trade Holding B.V. Uruguay 50.0
(iii) The following table summarizes the financial information of OCI’s associates and joint ventures (on a 100% basis):
$ millions
2018 2017
Associates Joint ventures Total Associates Joint ventures Total
Non-current assets 2,116.5 1.8 2,118.3 1,960.3 0.5 1,960.8Current assets 266.2 9.9 276.1 165.1 17.4 182.5Non-current liabilities (966.1) - (966.1) (579.3) - (579.3)Current liabilities (264.0) (3.7) (267.7) (280.1) (9.6) (289.7)Net assets 1,152.6 8.0 1,160.6 1,266.0 8.3 1,274.3
Income 736.1 48.7 784.8 449.1 111.0 560.1Expenses (787.5) (48.3) (835.8) (455.7) (109.7) (565.4)Net (loss) / profit (51.4) 0.4 (51.0) (6.6) 1.3 (5.3)
NOTES TO THE CONSOLIDATED FINANCIAL STATEMENTS CONTINUED

136 OCI N.V. Annual Report 2018 OCI N.V. Annual Report 2018 137
Other Inform
ationP
erformance R
eviewO
perational Strengths
Corporate G
overnanceS
ustainability Review
Financial Statem
ents
Consolidated Financial Statements
10. Equity-accounted investees (continued)
Associates
The following chart summarizes the financial information of significant associates (on a 100% basis):
Firewater LLC (Natgasoline)Sitech
Services B.V.Sitech Manufacturing
Services C.V.
$ millions 2018 2017 2018 2017 2018 2017
Non-current assets 1,991.7 1,836.6 117.2 118.4 4.4 5.3Current assets (excluding cash and cash equivalents) 79.0 12.5 28.1 19.7 90.0 75.1Cash and cash equivalents 48.1 28.5 19.6 22.8 1.0 6.1
Non-current liabilities (891.4) (579.3) (74.6) - - -Current liabilities (123.0) (64.2) (45.6) (129.3) (95.4) (86.5)
Net assets 1,104.4 1,234.1 44.7 31.6 - -Group’s share of net assets 552.2 617.1 10.3 7.3 - -
Revenues 199.8 - 196.4 175.7 339.6 272.9Depreciation (50.9) (0.2) (12.8) (12.2) (1.0) (0.8)Interest income 0.2 0.2 0.1 - - -Interest expense (24.5) - (1.6) - - -(Loss) / profit before taxes (66.5) (19.4) 19.9 17.1 - -Tax expense - - (4.8) (4.3) - -(Loss) / profit after taxes (66.5) (19.4) 15.1 12.8 - -Other comprehensive income - - - - - -Total comprehensive income (66.5) (19.4) 15.1 12.8 - -Group’s share in total comprehensive income (33.2) (9.7) 3.5 2.9 - -Dividends 60.0 - - 84.8 - -
Included in the associates is Firewater LLC, the holding company of Natgasoline LLC, which is a greenfield plant in Texas USA and the Sitech entities, which are used to operate at the Chemelot site in Geleen, the Netherlands, by OCI Nitrogen. The Chemelot site is also used by other companies.
Natgasoline’s assets were put into operation in August 2018. At 31 December 2018, Natgasoline has capital commitments of USD 1.0 million (2017: USD 82.9 million).
Consolidated Energy AG’s Investment in Firewater LLC (the holding company of Natgasoline LLC)As per 31 December 2018 there were no longer any additional funding contingencies outstanding. As at 31 December 2017, USD 20.0 million was drawn of the additional USD 50.0 million contingency funding committed by CEL.
11. Financial assets at fair value through other comprehensive income
$ millions 2018 2017
Infrastructure and Growth Capital Fund LP (Egypt) 10.1 21.6Notore Chemical Industries (Mauritius) 23.2 24.0Orascom Construction PLC (Dubai) 3.6 4.4Total 36.9 50.0Non-current 36.9 50.0Current - -Total 36.9 50.0
The Group holds an investment in the Infrastructure and Growth Capital Fund LP, which is managed by the Abraaj Group. Abraaj Holdings and Abraaj Investment Management filed for provisional liquidation in the Cayman Islands in June 2018 and their court-appointed joint provisional liquidators, Deloitte and PwC, are overseeing the restructuring of Abraaj’s debt.
The investment in Notore Chemical Industries (Mauritius) represents a 13.07 percent shareholding. Further, OCI N.V. holds shares in Orascom Construction PLC, which is a related party.
12. Income taxes
12.1 Income tax in the statement of profit or loss
$ millions 2018 2017
Current tax (29.8) (17.2)
Deferred tax 20.4 20.3
Total income tax in profit or loss (9.4) 3.1
12.2 Reconciliation of effective tax rate
OCI’s operations are subject to income taxes in various foreign jurisdictions. The statutory income tax rates vary from 0.0% to 30.5%, which results in a difference between the weighted average statutory income tax rate and the Netherlands’ statutory income tax rate of 25.0%.
Reconciliation of the statutory income tax rate in the Netherlands with the effective tax rate can be summarized as follows:
$ millions 2018 % 2017 %
Profit / (loss) before income tax 108.9 (105.9)Enacted income tax rate in the Netherlands 25% 25%Tax calculated at the enacted Dutch tax rate (27.2) 25.0 26.5 25.0Effect of tax rates in foreign jurisdictions 28.3 (26.0) 3.1 2.9Income not subject to tax 66.5 (61.1) 64.2 60.6Expenses non-deductible (16.1) 14.8 (56.0) (52.9)Dividend withholding tax not recoverable (9.3) 8.6 - -Unrecognized tax assets (45.5) 41.8 (69.6) (65.7)
Recognition of previously unrecognized tax assets - - 37.2 35.1Change in tax rates (4.4) 4.0 - -Uncertain tax positions - - (5.6) (5.2)Other (1.7) 1.5 3.3 3.1Total income tax in profit or loss (9.4) 8.6 3.1 2.9
The effective tax rate is 8.6% (2017: 2.9%), mainly due to (i) unrecognized tax assets for an amount of USD (45.5) million mainly relating to IFCo and OCI S.A.E. not meeting the recognition criteria, (ii) income not subject to tax for an amount of USD 66.5 million and (iii) expenses non-deductible for an amount of USD (16.1) million. The expenses non-deductible mainly relate to intercompany interest paid. The income not subject to tax mainly related to intercompany interest received, foreign exchange gains on intercompany loans, dividends received and the tax-free status of several entities in the Group.
12.3 Deferred income tax assets and liabilities
Changes in deferred tax asset and liabilities (net):
$ millions Note 2018 2017
At 1 January (216.2) (204.1)Adjustment of tax position OCI USA Inc. 2.2 - (77.8)Adjusted at 1 January (216.2) (281.9)Profit or loss 20.4 20.3Equity 21.3 54.7Effect of movement in exchange rates 1.2 (9.3)At 31 December (173.3) (216.2)
NOTES TO THE CONSOLIDATED FINANCIAL STATEMENTS CONTINUED
138 OCI N.V. Annual Report 2018 OCI N.V. Annual Report 2018 139
Other Inform
ationP
erformance R
eviewO
perational Strengths
Corporate G
overnanceS
ustainability Review
Financial Statem
ents
Consolidated Financial Statements
12. Income taxes (continued)
Recognized deferred tax assets and liabilities:
Assets Liabilities Net
$ millions 2018 2017 2018Adjusted
2017 2018Adjusted
2017
Intangible assets 77.7 13.0 (62.9) (63.3) 14.8 (50.3)Property, plant and equipment - - (302.2) (126.0) (302.2) (126.0)Inventory 7.0 2.0 (3.8) (4.5) 3.2 (2.5)Investment in partnership - - (77.7) (86.0) (77.7) (86.0)Trade and other receivables - 0.8 - (11.8) - (11.0)Loans and borrowings 47.9 33.0 (0.6) (20.7) 47.3 12.3
Trade and other payables 8.3 0.8 (1.0) (11.5) 7.3 (10.7)Provisions - - (7.2) (10.9) (7.2) (10.9)Uncertain tax positions - - - (4.6) - (4.6)Provision for withholding tax - - (8.5) - (8.5) -Operating losses carry forward and tax credits 149.7 73.5 - - 149.7 73.5
Total 290.6 123.1 (463.9) (339.3) (173.3) (216.2)
Netting of fiscal positions (252.2) (91.6) 252.2 91.6 - - Amounts recognized in the Statement of Financial Position 38.4 31.5 (211.7) (247.7) (173.3) (216.2)
Deferred tax liabilities relating to intangible assets mainly consist of goodwill of EFC for USD 62.6 million. This deferred tax liability will be reversed when the asset is impaired. Deferred tax liabilities recognized in relation to property, plant and equipment will be realized over the depreciation period of the related asset, and mainly relate to EFC (USD 86.4 million), OCI Nitrogen (USD 14.1 million) and IFCo (USD 197.0 million). Furthermore, the deferred tax liability ‘investment in partnership’ (USD 77.7 million) relates to OCI USA Inc’s investment in OCI Beaumont. This deferred tax liability does not have a fixed reversal period. This partnership is a Delaware limited partnership and is a non-taxable entity. Each unit-holder in OCI Beaumont is required to take into account its own share of items of income, gain or loss of the partnership in computing its income tax obligation.
Deferred tax assets relate to temporary differences, tax credits and tax losses carry forward. Temporary differences (mainly start-up costs of IFCo that have been capitalized for tax purposes) amount to USD 77.7 million and have been off set with deferred tax liabilities (USD 197.0 million). In addition, the Company has tax losses carry forward and tax credits totalling USD 319.0 million, for which a valuation allowance has been recorded amounting to USD 176.9 million. The losses carry forward mainly relate to the US operations (USD 201.3 million), Dutch operations (USD 27.5 million) and Egyptian operations (USD 33.1 million). Tax credits are available amounting to USD 54.7 million mainly relating to the US operations.
Expiration scheme of unrecognized carry forward tax losses, tax credits and deferred temporary tax assets:
2018$ millions
Less than 1 year
Between 1 and 5 years
Between 5 and 10 years
Between 10 and 15 years
Between 15 and 20 years Unlimited Total
Unrecognized operating losses carry forward, tax credits and temporary differences 0.6 34.0 1.8 7.3 162.0 63.7 269.4
2017$ millions
Less than 1 year
Between 1 and 5 years
Between 5 and 10 years
Between 10 and 15 years
Between 15 and 20 years Unlimited Total
Unrecognized operating losses carry forward, tax credits and temporary differences - 0.2 17.2 1.6 43.3 77.4 139.7
12.4 Income tax receivables and payables
Changes in income tax receivables and payables:
$ millions 2018 2017
At 1 January (73.9) (79.8)
Profit or loss (29.8) (17.2)Payments 34.3 28.9Effect of movement in exchange rates 1.7 (5.8)At 31 December (67.7) (73.9)Income tax receivable - 0.1Income tax payables (67.7) (74.0)Total (67.7) (73.9)
In 2018, USD 32.0 million (2017: USD 26.0 million) of payments were made by OCI N.V. on behalf of the Dutch fiscal unity.
13. Inventories
$ millions 2018 2017
Finished goods 132.0 108.9Raw materials and consumables 34.6 19.6Spare parts, fuels and others 67.0 62.3Total 233.6 190.8
During 2018, the total write-downs amount to USD 7.2 million (2017: USD 1.1 million) of which USD 3.5 million (2017: USD 0.7 million) relates to spare parts. During 2018 there were insignificant reversals of write downs (2017: nil). Inventory amounting to USD 42.2 million (2017: USD 75.5 million) has been pledged as security for external loans, consisting of USD 37.4 million by IFCo (2017: USD 23.2 million) and USD 4.8 million by OCI Beaumont (2017: USD 8.4 million). Inventory of OCI Nitrogen is no longer pledged as security (2017: USD 43.9 million).Reference is made to note 18.
14. Cash and cash equivalents
$ millions 2018 2017
Cash on hand 0.1 0.1Bank balances 441.9 226.0Restricted cash 18.7 4.9Total 460.7 231.0
Restricted cashRestricted cash of USD 1.1 million as of 31 December 2018 (2017: USD 1.0 million) are held for debt service reserve requirements related to IFCo’s USD 59.7 million Credit Agreement with First Abu Dhabi Bank (formerly, National Bank of Abu Dhabi) entered into in May 2015.
The remaining restricted balances are held as collateral against letters of credit and letters of guarantees issued.
15. Equity attributable to owners of the Company
The movements in the number of shares can be summarized as follows:
2018 2017
Number of shares at 1 January 210,306,101 210,306,101Number of issued shares - -On issue at 31 December - fully paid 210,306,101 210,306,101Par value per share (in EUR) 0.02 0.02At 31 December (in millions of USD) 5.6 5.6
The authorized capital of the Company amounts to EUR 12.0 million. The authorized capital is divided into 600 million shares, with a nominal value of EUR 0.02 each.
NOTES TO THE CONSOLIDATED FINANCIAL STATEMENTS CONTINUED

140 OCI N.V. Annual Report 2018 OCI N.V. Annual Report 2018 141
Other Inform
ationP
erformance R
eviewO
perational Strengths
Corporate G
overnanceS
ustainability Review
Financial Statem
ents
Consolidated Financial Statements
15. Equity attributable to owners of the Company (continued)
Movements in equity attributable to owners of the Company in 2018:• Total dividends declared to non-controlling interest amounted to USD 9.6 million, of which USD 6.6 million related to OCI Beaumont and
USD 3.0 million related to EBIC.
• Impact difference in profit sharing non-controlling interest: In the partnership agreement of Sorfert between OCI and the partner, a profit sharing arrangement is agreed, where the other investor will receive a relatively higher portion of dividends in compensation for lower natural gas prices arranged for by the partner. As a result of this agreement the non-controlling interest increased by USD 37.9 million during 2018.
• The reduction of declared dividends to non-controlling interest in the amount of USD 23.1 million relates to the dividends declared by Sorfert relating to the financial year 2016, that were reduced by a resolution on the general meeting of shareholders of Sorfert in March 2018.
• An amount of USD 0.7 million related to share-based compensation was recognized in retained earnings.
• In July 2018, OCI purchased shares (‘Common Units’) in OCI Beaumont from non-controlling interests for an amount of USD 117.6 million. The net effect after taxes is a decrease in equity of USD 96.3 million. Following the transaction, OCI’s ownership in OCI Beaumont increased from 88.25% to 100%. The Common Units have been suspended from trading and were delisted from the New York Stock Exchange.
• A capital contribution was made in the amount of USD 1.4 million to the newly established and 50% owned US trading entity N-7 LLC.
• As part of the convertible bond repayment an amount of USD 12.3 million was allocated to the equity component. Reference is made to note 18.
Movements in equity attributable to owners of the Company in 2017:• Total dividends declared to non-controlling interest amounted to USD 37.9 million, of which USD 7.5 million related to OCI Beaumont and
was paid. Sorfert declared dividends of USD 30.4 million to non-controlling interest.
• Impact difference in profit sharing non-controlling interest: In the partnership agreement of Sorfert between OCI and the partner, a profit- sharing arrangement is agreed, where the other investor will receive a relatively higher portion of dividends in compensation for lower natural gas prices. As a result of this agreement the non-controlling interest decreased by USD 0.1 million during 2017.
• An amount of USD 3.3 million related to share-based compensation was recognized in retained earnings.
• In December 2017 OCI purchased shares in OCI Beaumont from non-controlling interests for an amount of USD 61.1 million (net of taxes USD 50.8 million). This amount is not consistent with prior year reporting due to the income tax effect being recorded of USD 10.3 million, reference is made to note 2.2. Following the transaction, OCI’s ownership in OCI Beaumont increased from 79.88% to 88.25%.
• Impact of the adjustment of the deferred tax liabilities of OCI USA inc. of USD 44.4 million. Reference is made to note 2.2.
NOTES TO THE CONSOLIDATED FINANCIAL STATEMENTS CONTINUED
16. Reserves
$ millionsHedge
reserve
Financial assets at fair value
through other comprehensive
income1Currency
translationConvertible
note2Treasury
shares Total
At 1 January 2017 - 11.2 (117.9) 31.4 (37.0) (112.3)
Increase in hedge reserve 1.9 - - - - 1.9Currency translation differences - - (140.2) - - (140.2)Financial assets at fair value through other comprehensive income
- 0.6 - - - 0.6
Other comprehensive income 1.9 0.6 (140.2) - - (137.7)Treasury shares sold - - - - 7.3 7.3
Treasury shares acquired - - - - (0.2) (0.2)
At 31 December 2017 1.9 11.8 (258.1) 31.4 (29.9) (242.9)
Decrease in hedge reserve (2.3) - - - - (2.3)Currency translation differences - - 34.3 4.1 - 38.4Financial assets at fair value through other comprehensive income
- (11.7) - - - (11.7)
Other comprehensive income (2.3) (11.7) 34.3 4.1 - 24.4Repayment of convertible bond - - - (35.5) - (35.5)Treasury shares sold / delivered - - - - 6.2 6.2Treasury shares acquired - - - - (1.2) (1.2)
At 31 December 2018 (0.4) 0.1 (223.8) - (24.9) (249.0)
1 Cannot be subsequently reclassified to profit or loss2 Relates to equity component of convertible Euro-notes, net of taxes (reference is made to note 18). OCI is a company incorporated under Dutch law. In accordance with the Dutch Civil Code, legal reserves have to be established in certain circumstances. The hedging reserve, the financial assets at fair value through other comprehensive income reserve, the currency translation reserve and other legal reserves are legal reserves that limit distributions to shareholders to the extent that these reserves individually have a credit balance. ‘Other reserves’ include amongst other the reserve for non-distributed income of minority share holdings.
Treasury sharesDuring the financial year ended 31 December 2018 the company acquired 46,209 shares and sold and delivered out of share-based payment plans 255,471 shares.
2018 2017
Number of shares 1,010,050 1,219,312
Average carrying value per share (USD) 23.25 24.52Total carrying value of treasury shares (In millions of USD) 23.5 29.9

142 OCI N.V. Annual Report 2018 OCI N.V. Annual Report 2018 143
Other Inform
ationP
erformance R
eviewO
perational Strengths
Corporate G
overnanceS
ustainability Review
Financial Statem
ents
Consolidated Financial Statements
17. Non-controlling interest
2018$ millions
OCI Partners
LP1
Egyptian BasicIndustries
Corporation
SorfertAlgeria
Spa Other Total
Non-controlling interest - 40.00% 49.01% - -
Non-current assets - 130.5 489.6 3.5 623.6Current assets - 25.9 158.9 98.0 282.8Non-current liabilities - - (262.5) (1.2) (263.7)Current liabilities - (34.7) (48.0) (90.2) (172.9)Net assets - 121.7 338.0 10.1 469.8
Revenues 26.3 80.5 236.3 35.5 378.6Profit 6.7 14.7 126.0 0.8 148.2Other comprehensive income - - (7.1) - (7.1)Total comprehensive income 6.7 14.7 118.9 0.8 141.1
Dividend cash flows (6.6) (5.0) (6.5) (3.0) (21.1)
1 OCI aquired the remaining units of OCI Beaumont in July 2018.
2017$ millions
OCI Partners
LP
Egyptian BasicIndustries
Corporation
SorfertAlgeria
Spa Other Total
Non-controlling interest percentage 11.75% 40.00% 49.01% - -
Non-current assets 66.7 140.1 544.0 - 750.8Current assets 6.4 27.4 55.2 9.2 98.2Non-current liabilities (50.1) (13.8) (308.5) 0.7 (371.7)Current liabilities (6.7) (46.5) (131.7) - (184.9)Net assets 16.3 107.2 159.0 9.9 292.4
Revenues 40.3 36.5 133.7 0.4 210.9Profit / (loss) 5.3 (4.1) (0.4) - 0.8Other comprehensive income - - (3.8) - (3.8)Total comprehensive income 5.3 (4.1) (4.2) - (3.0)
Dividend cash flows (7.5) - - - (7.5)
NOTES TO THE CONSOLIDATED FINANCIAL STATEMENTS CONTINUED
18. Loans and borrowings
$ millions 2018 2017
At 1 January 4,677.6 4,586.0Impact of adoption of IFRS 9 19.4 -Restated balance at 1 January 4,697.0 4,586.0Proceeds from loans 3,290.8 140.1
Redemptions of loans (3,241.1) (288.9)Newly incurred transaction costs (76.9) (0.3)Amortization of transaction costs / (bond) premiums 28.7 22.7Effect of movement in exchange rates (58.2) 188.3Debt modification gain (2.2) -Accrued interest (56.6) 29.7Other (1.2) -At 31 December 4,580.3 4,677.6Non-current 4,296.8 3,844.5Current 283.5 833.1Total 4,580.3 4,677.6
The effect of movement in exchange rate mainly relates to EUR and DZD denominated loans, which are different from the Group’s presentation currency.
Information about the Group’s exposure to interest rate, foreign currency and liquidity risk is disclosed in the financial risk and capital management paragraph in note 6.

144 OCI N.V. Annual Report 2018 OCI N.V. Annual Report 2018 145
Other Inform
ationP
erformance R
eviewO
perational Strengths
Corporate G
overnanceS
ustainability Review
Financial Statem
ents
Consolidated Financial Statements
NOTES TO THE CONSOLIDATED FINANCIAL STATEMENTS CONTINUED
18. Loans and borrowings (continued)
Borrowing company Type of
loan Principal amount
($ millions) Interest rate Date of maturity Carrying amount1
($ millions) Long-term portion
($ millions) Short-term portion
($ millions) Fair value ($ millions) Collateral / Guarantee given (if applicable)
Sorfert Algeria SPA (‘Sorfert’) Secured USD 972.7 (DZD 114,440.0) Algerian bank interest rate plus rate of 1.95% per annum June 2026 606.9 525.9 81.0 n/aDebt service reserve account, ban for any disposal or decrease of
the Company share and assets
Iowa Fertilizer Company (‘IFCo’) Secured
USD 63.1USD 120.0USD 429.0USD 147.2USD 425.4
Fixed: 5.00%Fixed: 5.50%Fixed: 5.25%
Fixed 5.875%Fixed 5.25%
December 2019December 2022December 2025December 2027December 2037
31.7119.7425.0146.0409.8
-119.7425.0146.0409.8
31.7----
34.8121.5453.5155.1453.2
Certain bank accounts, property of IFCo, inventories, all funds, including equity contributions
of USD 762.0 million by OCI
Iowa Fertilizer Company (‘IFCo’) Secured USD 59.7 USD LIBOR + 3.0% December 2019 19.3 - 19.3 19.9 Certain bank accounts, property of IFCo and all funds
Egyptian Fertilizers Company (‘EFC’) Secured
USD 60.0USD 100.0
USD 62.6 (EGP 1,120.0)USD 220.0
LIBOR + 3.75%LIBOR + 3.75%
CBE Mid Corridor + 0.75% margin for EGP denominated borrowingsLIBOR + 3.75%
June 2025June 2026June 2025June 2025
56.092.859.5
168.9
50.082.355.6
153.9
6.010.5
3.915.0
57.094.859.9
172.5
Pledge EFC shares 99.9% owned by ‘Orascom Fertilizer Plant Maintenance’. Power of Attorney for perfection of commercial and
real estate mortgages. OCI will pay for shortfalls
OCI N.V. (‘OCI’)Senior
Secured Notes
USD 650.0USD 457.1 (EUR 400.0)
Fixed at 6.625%Fixed at 5.0% for EUR denominated notes
April 2023636.9447.4
636.9447.4
--
638.6466.1
The Notes are guaranteed, jointly and severally, by OCI Chemicals B.V., OCI Fertilizers B.V., OCI Fertilizer International B.V., OCI Intermediate B.V., BioMethanol Chemie Nederland B.V. and
BioMethanol Chemie Holding II B.V.
OCI N.V. (‘OCI’) Secured USD 522.3 LIBOR + 4.00% April 2023 513.6 513.6 - 522.4
Guaranteed, jointly and severally, by OCI Chemicals B.V., OCI Fertilizers B.V., OCI Fertilizer International B.V., OCI Intermediate
B.V., BioMethanol Chemie Nederland B.V. and BioMethanol Chemie Holding II B.V.
OCI N.V. (‘OCI’) Secured USD 368.7 (EUR 322.6) EURIBOR + 4.00% April 2022 364.2 290.5 73.7 368.6
Guaranteed, jointly and severally, by OCI Chemicals B.V., OCI Fertilizers B.V., OCI Fertilizer International B.V., OCI Intermediate
B.V., BioMethanol Chemie Nederland B.V. and BioMethanol Chemie Holding II B.V.
OCI Fertilizer Trading Ltd. (‘OFT’) and OCI Fertilizers Trade & Supply Ltd. (‘OFTS’)
Revolver USD 75.0 LIBOR + 2.50%Renewed
annually38.2 - 38.2 38.2 n/a
OCI Beaumont (‘OCIB’) Secured USD 455.0 USD LIBOR + 4.25% March 2025 444.4 440.2 4.2 451.6Secured by liens on OCI Beaumonts’ assets
as well as assets of future consolidated entities
Total 31 December 2018 4,580.3 4,296.8 283.5 n/a
Sorfert Algeria SPA (‘Sorfert’) SecuredUSD 1,007.1
(DZD 114,440.0)Algerian bank interest rate plus rate of 1.95% per annum June 2026 713.3 629.5 83.8 n/a
Debt service reserve account, ban for any disposal or decrease of the Company share and assets
Iowa Fertilizer Company (‘IFCo’) Secured
USD 242.8USD 365.7USD 429.0USD 147.2
Fixed: 5.00%Fixed: 5.50%Fixed: 5.25%
Fixed 5.875%
December 2019December 2022December 2025December 2027
1,138.6 1,033.5 105.1 1,199.6Certain bank accounts, property
of IFCo, all funds, including equity contributions of USD 762.0 million by OCI
Iowa Fertilizer Company (‘IFCo’) Secured USD 59.7 USD LIBOR + 3.0% December 2019 32.5 19.9 12.6 32.5Certain bank accounts, property of
IFCo and all funds
Iowa Fertilizer Company (‘IFCo’) Revolver USD 50.0 US Prime rate -/- 1.75%-3.15% May 2018 35.0 - 35.0 35.0Secured by liens on IFCo’s account receivables, inventory and
restricted funds
Egyptian Fertilizers Company (‘EFC’) SecuredUSD 930.0USD 56.9
(EGP 1,015.0)
LIBOR + 5.00% marginCBE Mid Corridor + 2.90% margin for EGP denominated borrowings October 2019 405.7 346.5 59.2 405.7
Pledge EFC shares 99.9% owned by ‘Orascom Fertilizer Plant Maintenance’. Power of Attorney for perfection of commercial and
real estate mortgages. OCI will pay for shortfalls
OCI Nitrogen B.V. (‘OCI Nitrogen’) SecuredUSD 601.0(EUR 500.0)
EURIBOR + a variable margin based on leverage ratio ranging 3.50%-4.50% August 2021 533.4 475.3 58.1 533.4Pledge of OCI Fertilizers B.V. shares in OCI Nitrogen, Pledge
of moveable assets, trade receivables and company accounts, property mortgage
OCI N.V. (‘OCI’)Unsecured convertible
bond
USD 407.5(EUR 339.0)
Fixed at 3.875% September 2018 403.5 - 403.5 413.1 n/a
OCI N.V. (‘OCI’) SecuredUSD 660.0(EUR 549.1)
a variable margin ranging EURIBOR + 2.25%-4.00% and LIBOR + 2.75%-4.50% based on Group’s leverage ratio
July 2020 671.1 671.1 - 671.1Pledge of shares in OCI Chem 2 B.V., which
indirectly holds 50% share in NatgasolineOCI N.V. (‘OCI’)
Subordinated USD 372.7 LIBOR + margin increasing over time ranging 7.50% - 9.75% January 2021 372.7 372.7 - 372.7 n/a
OCI N.V. (‘OCI’) Unsecured USD 48.0LIBOR + a variable margin based on Group’s leverage ratio ranging 2.75%-
4.50%July 2020 48.1 48.1 - 48.1 n/a
OCI Fertilizer Trading Ltd. (‘OFT’) and OCI Fertilizers Trade & Supply Ltd. (‘OFTS’)
Revolver USD 105.0 LIBOR + 1.50% - 2.50%Renewed
annually42.8 - 42.8 42.8 n/a
OCI Beaumont (‘OCIB’) Secured USD 450.0 USD LIBOR + 6.75% margin, with USD LIBOR Floor of 1.0% August 2019 227.9 223.4 4.5 234.2Secured by liens on OCI Beaumonts’ assets
as well as assets of future consolidated entities
OCI Beaumont (‘OCIB’) Revolver USD 40.0 LIBOR + 4.75% March 2018 16.0 - 16.0 16.0Secured by liens on OCI Beaumonts’ assets
as well as assets of future consolidated entities
Egypt Basic Industries Corporation (‘EBIC’) Unsecured USD 100.0 LIBOR + 4.00% December 2020 37.0 24.5 12.5 37.0 n/a
Total 31 December 2017 4,677.6 3,844.5 833.1 n/a
1As at 31 December 2018 the carrying amount of loans and borrowings excluded interest of USD 63.2 million (2017: USD 44.5 million)

146 OCI N.V. Annual Report 2018 OCI N.V. Annual Report 2018 147
Other Inform
ationP
erformance R
eviewO
perational Strengths
Corporate G
overnanceS
ustainability Review
Financial Statem
ents
Consolidated Financial Statements
18. Loans and borrowings (continued)
CovenantsCertain loan agreements include financial covenants. The definitions for calculating the financial covenants applicable to the facilities within the Group can be summarized as follows:
• Debt Service Coverage Ratio: Income Available (revenue earned less operating expenses) to Debt Service (net finance charges including the capital element of finance leases) or gross profit less change in working capital to interest and principal payments.
• Debt to Equity Ratio: Gross Debt (current and long-term debt obligations) to total Equity (the sole capital of the borrower).
• Net Leverage Ratio: the Group’s Net Debt (meaning the aggregate amount of all obligations of the Group, excluding intergroup loans and cash and cash equivalents, but including finance leases) to adjusted EBITDA.
• Interest Coverage Ratio: EBITDA, EBIT or Distribution Receipts (cash received by the borrower by way of dividends or repayments of loans) to Finance Charges (meaning finance payments in respect of borrowings including the interest element of finance leases).
As per 31 December 2018 all financial covenants were met.
In the event the company would not comply with the covenant requirements, the loans would become immediately due. Refer to note 6.2 for additional discussion of the Company’s liquidity risk. The external borrowings include change in control clauses that enable the lenders to call the financing provided.
Fair value measurement loans and borrowings
Except for the IFCo bonds, the senior secured notes of OCI N.V. and the loan of Sorfert, the fair value of all other loans and facilities is calculated within hierarchy category level 2. The bonds of IFCo and OCI N.V. are measured following hierarchy category 1. The fair value of the loan of Sorfert cannot be determined as no observable market data is available.
New and amended financing arrangements in 2018
IFCoOn 26 January 2018, IFCo received bondholder approval to exchange USD 425.0 million of its 2019 and 2022 bonds for a new issuance of 2033 and 2037 bonds. The new bonds are interest bearing only until 1 June 2031 and the exchange extends the aggregate weighted average life of these bonds from 2.5 years to 16.7 years. The exchanged bonds are priced at a rate of 5.25% compared to a weighted average rate of 5.41% upon settlement for the original bonds.
The bondholders also agreed to modify terms of the IFCo bonds to, among other things, permit the debt service reserve fund to be funded in full by the deposit of a standby letter of credit; permit IFCo to satisfy its obligation to fund its project operating reserve up to the required balance incrementally over a thirty-six month period; and permit the replacement of OEC’s performance security under the EPC Contract. IFCo incurred USD 14.3 million of debt issuance costs related to the bond exchange in 2018.
OCI Beaumont
On 13 March 2018, OCI Beaumont (‘OCIB’) successfully completed the closing of a USD 455.0 million term loan B facility (the “Term Loan B Facility”) and a USD 40.0 million revolving credit facility. The new Term Loan B Facility of USD 455.0 million replaces and upsizes OCIB’s USD 232 million term loan B facility and is priced at LIBOR + a margin of 4.25%, or 2.50% lower than the previous facility. The Term Loan B Facility matures in 2025, in contrast to OCIB’s previous facility that matured in 2019. OCIB used the net proceeds of the Term Loan B Facility to repay in full OCIB’s existing term loan B facility and to repay in full the outstanding intercompany loans from OCI N.V. of USD 200 million. OCIB incurred USD 8.2 million of debt issuance costs related to the new financing in 2018.
OCI
In March 2018, OCI N.V. entered into a bridge facility of USD 148.6 million (EUR 130 million). The short-term facility originally planned to mature in March 2019 and carried an interest rate of EURIBOR plus a margin of 4.50%. Simultaneously, OCI N.V. entered into short-term facility with NNS Luxembourg (a related party) for an amount of USD 114.3 million (EUR 100 million). The maturity dates and interest rates for both facilities were identical. Total transaction costs were incurred for an amount of USD 4.2 million. Both facilities were fully utilized to redeem the convertible bond.
In March 2018, OCI N.V. announced an invitation to the bondholders of its USD 387.4 million (EUR 339 million) 3.875% convertible bonds due September 2018, to tender their bonds for purchase by OCI N.V. The purchase price was USD 115,566 (EUR 101,125) plus a buy back premium of USD 857 (EUR 750), for each bond with a nominal value of USD 114,280 (EUR 100,000). The offer was accepted by bondholders holding convertible bonds for the full principal amount USD 387.4 million (EUR 339 million). A total principal amount of USD 387.4 million was paid to bondholders, of which USD 12.3 million was allocated to the equity component of the convertible bonds.
On 26 April 2018, OCI N.V. successfully completed the offering of dual-tranche debut bonds consisting of USD 650.0 million senior secured fixed rate notes due 2023 (the “Dollar Notes”) and EUR 400.0 million senior secured fixed rate notes due 2023 (the “Euro Notes”, and together with the Dollar Notes, the “Notes”). The Dollar Notes bear interest at a rate of 6.625% per annum and the Euro Notes bear interest at a rate of 5.0% per annum. The Notes were issued at par, are senior secured obligations of the Company and are, or will be, guaranteed by certain of the Company’s subsidiaries. Interest will be payable semi-annually.
NOTES TO THE CONSOLIDATED FINANCIAL STATEMENTS CONTINUED
On 26 April 2018, OCI N.V. also entered into a new revolving credit facility and term loan A facility. The new revolving credit facility has a total commitment of USD 700 million (USD 500 million with a 5-year maturity and USD 200 million with a 3-year maturity), with two 1-year extension options. The new term loan A facility has a total commitment of USD 400 million equivalent denominated in euros and a 4-year maturity. Both facilities bear an initial interest rate margin of 4.0% over LIBOR, which declines with the Company’s deleveraging profile. Total transaction costs were incurred for an amount of USD 42.3 million.
The existing debt at OCI N.V. and OCI Nitrogen was fully replaced and redeemed after this refinancing.
EFCIn May 2018, EFC closed a refinancing of its existing financial indebtedness, with facilities from commercial banks (including Egyptian, regional and international) and Development Financing Institutions (EBRD and IFC). The facility size is USD 380 million and EGP 1,120 million of debt, or approximately a total of USD 445 million, and bears an interest rate margin of 3.75% over LIBOR on the USD commitments and 0.75% over CBE Mid Corridor on the EGP commitments. Total transaction costs were incurred for an amount of USD 7.9 million.
The existing debt of EFC was fully replaced and redeemed after this refinancing.
New and amended financing arrangements in 2017
EBICIn March 2017, EBIC refinanced the outstanding term loan in the amount of USD 49.6 million with a 4-year amortizing loan, with semi-annual installments of USD 6.3 million and a final maturity date in December 2020. The modified term loan carries an interest rate of LIBOR plus a margin of 4%. Debt modification costs were incurred of USD 0.3 million.
IFCoIn May 2017, IFCo entered into a working capital facility of USD 50.0 million, of which USD 35.0 million was drawn per 31 December 2017. The short-term facility matures in May 2018 and carries an interest rate of US Prime rate minus a margin between 1.75%- 3.15%.
OCI In December 2017, OCI entered into a credit facility agreement with NNS Luxembourg Sarl (a related party) for USD 48.0 million. The loan matures in July 2020 and carries an interest rate of LIBOR plus a margin of 4.25% at inception. Depending on the leverage ratio the margin varies between LIBOR plus a margin of 2.75% and LIBOR plus a margin of 4.50%. The facility is used for general corporate purposes, including the purchase of OCI Beaumont shares from non-controlling interests in December 2017, reference is made to note 15.
Proceeds from borrowings
Proceeds from borrowings in 2018 totalled an amount of USD 3,290.8 million, which consisted of the net proceeds of the new financing arrangements of IFCo, OCI Beaumont, OCI N.V. and EFC mentioned above.
Undrawn bank facilitiesAs of 31 December 2018, the Group had not drawn external bank facilities in the amount of USD 294.4 million. This relates to a trade finance facility of OFT and OFTS of USD 36.8 million, and external bank facilities of EFC of USD 40.0 million, OCI Beaumont of USD 40.0 million and OCI N.V. of USD 177.6 million.
19. Trade and other payables
$ millions 2018 2017
Trade payables 314.2 214.5Trade payables due to related parties (note 30) 82.4 87.4Amounts payable under the securitization programme 95.1 -Accrued dividends 10.6 45.0Other payables 131.5 80.2Share-based payment liabilities 0.8 2.0Accrued expenses 144.8 110.6Accrued interest 63.3 44.5Other tax payable 4.8 2.8
Derivative financial instruments 15.5 1.4
Total 863.0 588.4Non-current 14.1 19.3Current 848.9 569.1Total 863.0 588.4
Information about the Group’s exposure to currency and liquidity risk is included in note 6. The carrying amount of ‘Trade and other payables’ approximates its fair value.
148 OCI N.V. Annual Report 2018 OCI N.V. Annual Report 2018 149
Other Inform
ationP
erformance R
eviewO
perational Strengths
Corporate G
overnanceS
ustainability Review
Financial Statem
ents
Consolidated Financial Statements
b. Employee benefit expenses
$ millions 2018 2017
Wages and salaries 169.4 148.5Social securities 7.6 6.5Employee profit sharing 28.7 13.0Pension cost 15.7 10.8Share-based compensation expenses (c) 3.0 5.3Other employee expenses 13.3 10.9Total 237.7 195.0
During the financial year ended 31 December 2018, the number of key executives was 2 (2017: 2 key executives), which represents the Executive Board members; Nassef Sawiris (‘CEO’), and Hassan Badrawi (‘CFO’). During the financial year ended 31 December 2018, the average number of staff employed in the Group converted into full-time equivalents amounted to 2,933 employees (2017: 2,879 employees).
c. Share-based compensation arrangements OCI has three share-based compensation plans which are intended to (i) attract and retain the best available personnel for positions of substantial responsibility, (ii) provide additional incentive to management and employees, (iii) promote the success of the Company’s business, and (iv) align the economic interests of key personnel directly with those of shareholders. Under the first plan, stock options have been granted to management and employees. The other plans are comprised of share incentive plans.
Share option plansOn 20 December 2013, the non-executive board members of OCI adopted an additional Employees Incentive Plan. This plan authorized the issuance of up to 1 million shares to employees and excludes the executive directors. The exercise price of the options granted to employees is equal to the fair market value of the shares on the date of grant. The options granted under this plan generally vest after three years (cliff vesting) and expire after seven years. Employees currently hold 828,175 vested options which are exercisable as at 31 December 2018 for which payment of the purchase price could be made with a promissory note.
The Company modified the plan as at 7 March 2015 due to the demerger of the Construction business. Under the terms of the demerger, OCI shareholders received one Orascom Construction share for every two OCI shares owned. As a result of these developments, all outstanding options held by awardees related to OCI shares have been replaced with new option rights. The new option right will give the awardee a right to a cash payment equal to the increase in value of one OCI share plus ½ Orascom Construction share, less the original exercise price. The exercise price of the options and all other terms and conditions remained the same. Of the 828,175 option rights outstanding as at 31 December 2018, 520,675 are option rights held by former employees which are now employed by Orascom Construction after the demerger.
The following table summarizes information about the stock options outstanding at 31 December 2018:
Grant date
Number of options outstanding at
31 December 2018 Fertilizer
Number of options outstanding at
31 December 2018 Construction
Number of options outstanding at
31 December 2018 Total
Exercise price per share (EUR)
Remaining life as at 31 December
2018(in years)
Number of options exercisable at
31 December 2018
31 December 2013 307,500 520,675 828,175 32.74 2.0 828,175
Total 307,500 520,675 828,175 - - 828,175
19. Trade and other payables (continued)
Derivative financial instrumentsDerivative financial instruments consists of commodity gas hedges contracts in order to hedge future gas price levels. The fair value of these contracts amounts to USD 15.5 million as per 31 December 2018. All derivatives included in trade and other payables are classified in the fair value hierarchy level 2.
20. Provisions
$ millions
Claimsand other
provisionsDonation provision Total
At 1 January 2018 30.2 106.8 137.0
Provision made during the year 2.0 - 2.0Provision used during the year (0.2) - (0.2)Provisions reversed (17.1) - (17.1)Effect of movement in exchange rates (1.2) (0.3) (1.5)At 31 December 2018 13.7 106.5 120.2Non-current 9.7 - 9.7Current 4.0 106.5 110.5Total 13.7 106.5 120.2
Claims and other provisionsThe Group is involved in various litigations and arbitrations. In cases where it is probable that the outcome of the proceedings will be unfavorable, and the financial outcome can be measured reliably, a provision has been recognized. Reference is made to note 27 for detailed information with respect to major ongoing litigations and claims for which no provision has been recognized. The reversal of provisions in the amount of USD 17.1 million is, mainly related to the reversal of a take-or-pay provision on the gas contract of Sorfert, as a result of a business interruption caused by an incident in 2017. During 2018 it became clear this provision was no longer applicable, since the company was released from this liability.
Donation provisionOn 13 November 2014, the Company announced that it had decided to transfer the rights to the amounts receivable from the first installment already paid to the Egyptian Tax Authority in 2013 of EGP 2,500 million (approximately USD 360.0 million) to the Tahya Misr (‘Long Live Egypt’) Fund (reference is made to note 27). No formal agreement has been drafted with the Tahya Misr Fund yet and no payments have been made to the fund. The transfer of rights has been approved by OCI’s Board of Directors on 12 November 2014.
Following the guidance under IAS 37 (constructive obligations) the Company has presented the transfer of rights to the Tahya Misr Fund as a donation provision. The timing of the outflow of resources is uncertain.
In March 2015, the Company received a cheque for EGP 1,904 million (approximately USD 266.2 million) from the Egyptian Authorities. At year end 2018 the carrying amount in US dollars had reduced to USD 106.5 million, due to the devaluation and weakening of the EGP since March 2015.
21. Development of cost of sales and selling, general and administrative expenses
a. Expenses by nature
$ millions 2018 2017
Raw materials and consumables and finished goods 1,931.9 1,398.5Employee benefit expenses (b) 237.7 195.0Depreciation and amortization 424.9 330.9Consultancy expenses 34.6 15.4Other 178.9 152.2Total 2,808.0 2,092.0Cost of sales 2,630.4 1,931.1Selling, general and administrative expenses 177.6 160.9Total 2,808.0 2,092.0
NOTES TO THE CONSOLIDATED FINANCIAL STATEMENTS CONTINUED

150 OCI N.V. Annual Report 2018 OCI N.V. Annual Report 2018 151
Other Inform
ationP
erformance R
eviewO
perational Strengths
Corporate G
overnanceS
ustainability Review
Financial Statem
ents
Consolidated Financial Statements
21. Development of cost of sales and selling, general and administrative expenses (continued)
Measurement of fair valuesAs a consequence of the demerger of construction on 7 March 2015 the option plans were modified from equity-settled plans into cash settled plans and as a consequence fair values are remeasured as at 31 December 2018 to determine the liability out of share option plans as at 31 December 2018. The inputs used in the measurement of the fair values at remeasurement date were as follows:
Options granted in: 2013
Fair value at 31 December 2018 (remeasurement date) EUR 0.29Share price at grant date EUR 32.74Share price at remeasurement date EUR 20.66Exercise price EUR 32.74Expected volatility (weighted average) 33.7%Expected life (weighted average in years) 1.0Expected dividends noneRisk-free interest rate (based on government bonds) 0.38%Performance conditions none
Expected volatility has been based on the developments of the share price over the option’s expected life taking into account the remaining contractual life and the effects of expected early exercise. The fair value on remeasurement date were calculated using the Black-Scholes option model.
Reconciliation of outstanding share optionsThe number and weighted-average exercise prices of share options under the share option plans and replacement awards were as follows:
OptionsNumber of options
2018
Weighted-average exercise price
2018 (EUR)Number of options
2017
Weighted-average exercise price
2017 (EUR)
Outstanding at 1 January 828,175 32.74 2,780,675 27.81Forfeited during the year1 - - (1,952,500) 25.71Outstanding at 31 December 828,175 32.74 828,175 32.74Exercisable at 31 December 828,175 32.74 828,175 32.74
The options outstanding at 31 December 2018 have an exercise price of EUR 32.74 (2017: EUR 32.74) and a contractual life of 2.0 years (2017: 3.0 years).
Performance share plansIn 2014 a new performance share plan was introduced for the Executive Board. The share plan comprises the conditional granting of shares in OCI. Each year a plan with a 3-year vesting period starts in which the Company’s performance is measured on total shareholder return (‘TSR’) against a peer group of companies. The fair value of these awards has been calculated using Monte-Carlo simulations. The number of conditional shares corresponds to a percentage (at most 150%) of the fixed reference salary divided by the price of the share on the stock market on the first day of the vesting period. The relative ranking that OCI achieves in the peer group determines the definitive number of shares that are granted at the end of the vesting period. The remaining shares vested must be retained by the members of the Executive Board for a period of 2 years.
In 2015, in total 125,269 conditional shares have been granted with a fair value of EUR 0.7 million (fair value at grant date EUR 5.369 per share, using a volatility of 42.5%, a risk-free rate of (0.7) percent). At 30 September 2017, 57,188 conditional shares are forfeited. In July 2018, at the end of the plan, the Performance share plan 2015 vested at a TSR of 0%, resulting in nil conditional shares delivered.
In 2016, in total 261,120 conditional shares have been granted with a fair value of EUR 2.6 million (fair value at grant date EUR 9.833 per share, using a volatility of 38.4%, a risk-free rate of (0.6) percent). At 30 September 2017, a total of 119,207 conditional shares are vested at a TSR of 19.9% resulting in a total number of shares of 23,682 delivered.
In 2017, in total 190,600 conditional shares have been granted with a fair value of EUR 3.4 million (fair value at grant date EUR 17.710 per share, using a volatility of 39.3%, a risk-free rate of (0.7) percent). At 30 September 2017, a total of 87,013 conditional shares are vested at a TSR of 55.4% resulting in a total number of shares of 48,239 delivered.
In 2018, in total 166,564 conditional shares have been granted with a fair value of EUR 3.4 million (fair value at grant date EUR 20.770 per share, using a volatility of 37.5%, a risk-free rate of (0.589) percent).
Bonus matching planIn 2014 a new bonus matching plan was introduced for the members of the Executive Board and Senior Management. In this plan members of the Executive Board and Senior Management are entitled to buy shares from their annual bonus. The shares will be withheld for a period of three years. After the 3-year period, the participants will receive a bonus share for each share of the plan. For the members of the Executive Board, the shares vested must be retained for a period of 2 years.
In 2015 65,007 bonus matching rights were granted in the bonus matching plan. At December 2016, 825 bonus matching rights forfeited giving a total at 31 December 2016 of 64,182 bonus matching rights with a fair value of EUR 1.5 million (with a fair value of EUR 24.125 at grant date equal to the share price at grant date). In March 2017, 2,920 bonus matching rights have been forfeited giving a total at 31 December 2017 of 61,262 bonus matching rights with a fair value of EUR 1.5 million. In June 2018, the bonus matching plan vested for which a total of 61,262 shares were delivered.
In 2016, 172,648 bonus matching rights were granted in the bonus matching plan with a fair value of EUR 2.1 million (with a fair value of EUR 12.22 at grant date equal of the share price at grant date). In March 2017, 10,900 bonus matching rights were granted in the bonus matching plan 2016 and in September 2017, 14,027 shares were vested, giving a total outstanding at 31 December 2017 of 169,521 bonus matching rights.
In 2017, 95,060 bonus matching rights were granted in the bonus matching plan with a fair value of EUR 1.6 million (with a fair value of EUR 16.59 at grant date equal of the share price at grant date). In September 2017, 14,496 shares were vested giving a total outstanding at 31 December 2017 of 80,564 bonus matching rights.
In 2018, 93,451 bonus matching rights were granted in the bonus matching plan with a fair value of EUR 1.7 million (with a fair value of EUR 18.085 at grant date equal of the share price at grant date).
22. Other income
$ millions 2018 2017
Insurance claim 51.8 1.6Gain on embedded derivatives in biogas purchase contracts 3.2 -Result on sale of Gavilon 0.2 0.7Gain on sale of financial assets - 0.4Release of accrual for settlement of claims 4.0 -Other 3.4 5.5Total 62.6 8.2
Insurance claimsInsurance proceeds in 2018 of USD 51.8 million relate to the recognition of the insurance refund for the business interruption caused by an incident at Sorfert in 2017.
Result on sale of Gavilon The USD 0.2 million of ‘Result on sale of Gavilon’ in 2018 relates to the final release of the escrow account created during the sales transaction of Gavilon in 2013. During 2013, OCI Fertilizer Holding Limited (‘OCI FH’) sold its full ownership in Gavilon Group for a total consideration of USD 666.7 million, resulting into a gain of USD 262.1 million. As at 31 December 2018, USD 0.2 million (2017: USD 1.3 million) was still held by the buyer in the escrow account, which was created to cover any post-closing indemnity under the Sale and Purchase Agreement. The amount of USD 0.2 million was collected in January 2019 and the escrow account was closed.
Release of liability for settlement of claimsAn accrual for settlement of claims was released for an amount of USD 4.0 million. Reference is made to note 23.
23. Other expenses
$ millions 2018 2017
Settlement of claims - 11.0Loss on gas price derivative by IFCo - 1.0Loss on sale of scrapped assets 1.5 2.1Other 1.3 5.3Total 2.8 19.4
The settlement of claims in 2017 related to a liability due to Lafarge Egypt (a related party). In December 2007, OCI S.A.E. sold OBMH S.A.E., the holding company of OCI S.A.E.’s cement assets, to Lafarge S.A. (now LafargeHolcim Ltd.) for USD 15.0 billion. OCI S.A.E. indemnified Lafarge for certain potential liabilities related to the sold assets, which in 2017 resulted in a liability due to Lafarge. In 2018 this liability was paid. Simultaneously, an accrual of USD 4.0 million was released. Reference is made to note 22.
NOTES TO THE CONSOLIDATED FINANCIAL STATEMENTS CONTINUED
152 OCI N.V. Annual Report 2018 OCI N.V. Annual Report 2018 153
Other Inform
ationP
erformance R
eviewO
perational Strengths
Corporate G
overnanceS
ustainability Review
Financial Statem
ents
Consolidated Financial Statements
24. Net finance cost
$ millions 2018 2017
Interest income on loans and receivables 8.7 5.3Fair value gain on derivative - 0.5Foreign exchange gain 67.9 151.5Finance income 76.6 157.3Interest expense and other financing costs on financial liabilities measured at amortized cost (340.7) (222.0)Fair value loss on derivative - (3.1)Foreign exchange loss (100.5) (180.3)Finance cost (441.2) (405.4)Net finance cost recognized in profit or loss (364.6) (248.1)
The increase in interest expenses in 2018 compared to 2017 is mainly caused by interest expenses relating to IFCo, which is no longer capitalized in 2018 (as IFCo commenced production as of October 2017) and debt settlement expenses incurred for refinancing activities (reference is made to note 18). The foreign exchange gains and losses in 2018 mainly relate to external financing and in 2017 mainly to the revaluation of intercompany balances in foreign currencies (for which the statement of profit or loss impact is not eliminated in the consolidated financial statements).
25. Earnings per share
2018 2017
i. BasicNet (loss) attributable to shareholders (48.7) (103.6)
Weighted average number of ordinary share (Basic) 209,234,670 209,365,410
Basic earnings per ordinary share (0.233) (0.495)
ii. DilutedNet (Loss) attributable to holders of ordinary shareholders (48.7) (103.6)Interest expense on convertible notes n/a anti-dilutiveNet (loss) attributable to holders of ordinary shareholders based on full conversion n/a (103.6)Weighted average number of ordinary shares (Basic) 209,234,670 209,365,410Adjustment for assumed conversion of convertible notes n/a anti-dilutiveAdjustment for assumed equity-settled share-based compensation anti-dilutive anti-dilutiveWeighted average number of ordinary shares outstanding on the basis of full conversion 209,234,670 209,365,410Diluted earnings per ordinary share (0.233) (0.495)
(i) Weighted average number of ordinary shares calculation
shares 2018 2017
Issued ordinary shares at 1 January 210,306,101 210,306,101
Effect of treasury shares held (1,071,431) (940,691)Weighted average number of ordinary shares outstanding as per 31 December 209,234,670 209,365,410
26. Segment reporting
OCI’s reportable segments are consistent with how the Chief Operating Decision Maker (‘CODM‘) manages the business operations and views the markets it serves. The reportable segments in 2018 are: Methanol US, Methanol Europe, Nitrogen US, Nitrogen Europe and Nitrogen MENA. This represents a change compared to the reportable segments of 2017, and the comparative information has been restated in the new structure. Due to changes in organizational structure and internal reporting, OCI has renamed and realigned its segments by moving trading activities from OCI Nitrogen & Trading to the previous North Africa segment and including Natgasoline in the previous OCI Partners & Trading segment. The organizational structure of the segments is based on a number of factors that the chief operating decision maker (‘CODM’) uses to evaluate, view, and direct business operations.
NOTES TO THE CONSOLIDATED FINANCIAL STATEMENTS CONTINUED
Segment policyThe Company derives the results of the business segments directly from its internal management reporting system. All segments are managed separately because they require different operating strategies and use their own assets and employees. The entities grouped together in each segment have similar regulatory environments, macroeconomic conditions, banking, insurance and public utilities. The Group has two revenue streams from contracts with customers that relate to the sale of goods, namely, Nitrogen and Methanol.
Segment revenues includes revenues from sales to external customers and intersegment revenues. Profit / (loss) is the primary performance measure used by our CODM to evaluate operating results and allocate capital resources among segments. Profit / (loss) is also the profitability measure used to set management and executive incentive compensation goals. ‘Other’ consists of share-based compensation and certain corporate general and administrative expenses that are not allocated to the segments. Segment results, assets and liabilities include items directly attributable to a segment as well as those that can be reasonably and consistently re-allocated.
A summary description of each reportable segment is as follows:
Methanol USThis segment consists of OCI Beaumont (OCIB), Natgasoline LLC and the trading entities: OCI Methanol Marketing LLC (OMM) and OCI Fuels Ltd.
OCI Beaumont is an integrated methanol and ammonia production facility that is strategically located on the Texas Gulf Coast near Beaumont. Natgasoline LLC is a greenfield world scale methanol production complex in Beaumont, Texas. OCI and its partner, Consolidated Energy Limited (CEL)/G2X, each own 50% stakes.
Natgasoline LLC is an equity-accounted investee of the Group, reference is made to note 10. Natgasoline was under construction in the prior period and included in the ‘Other’ segment. As Natgasoline commenced production in 2018 and due to the similarities in regulatory environment, products and customer base, this equity accounted investee has been included in the ‘Methanol US’ segment in 2018 on a proportionally consolidated basis. The elimination column is used to eliminate the proportionally consolidated figures of Natgasoline that are included in the US Methanol segment and to include the investment in, and results from Natgasoline (associate) and thereby reconcile to the Group’s reported figures.
OCIB and Natgasoline sell mainly domestically; primarily to industrial customers in and around the U.S. Gulf Coast through pipeline connections to adjacent customers, port access with dedicated methanol and ammonia import / export jetties, and truck loading facilities for both methanol and ammonia. OCI Fuels is a trading entity that supplies biogas to OCIB to process into bio-methanol. OMM is a trading entity that sells products produced by OCIB and Natgasoline.
Methanol EuropeThis segment consists of only BioMCN, located at Delfzijl in the Netherlands. BioMCN is one of Europe’s largest methanol producers. BioMCN produces two types of methanol: bio-methanol and regular (also known as grey) methanol. In 2017 BioMCN exceeds the quantitative threshold for disclosure as a reportable segment and was therefore presented separately in 2017. In 2018 BioMCN no longer meets the quantitative threshold for disclosure, but the segment is considered to be of continuing significance and therefor the segment information is also presented for 2018.
Nitrogen US
This segment consists of Iowa Fertilizer Company (IFCo), a wholly owned greenfield nitrogen fertilizer complex in Iowa and the trading entities: OCI Fertilizers USA and N-7. IFCo has been operational since October 2017. IFCo products are sold via the trading entities.
Nitrogen Europe
This segment consists of OCI Nitrogen. OCI Nitrogen is Europe’s second largest integrated nitrates fertilizer producer and the world’s largest melamine producer with production site in Geleen, the Netherlands.
Nitrogen MENA
This segment consists of Egyptian Fertilizer Company (EFC), Egypt Basic Industries Corporation (EBIC), Sorfert, OCI Fertilizer Trading (OFT),
OCI Fertilizer Trade and Supply (OFTS) and OCI S.A.E. EFC is a granular urea producer in Egypt. EBIC is an ammonia plant in Egypt. Sorfert is a partnership with Algeria’s state-owned oil and gas authority and is one of the largest nitrogen fertilizer producers in North Africa. OFT and OFTS are trading entities based in Dubai and the Netherlands. The trading entities OFT and OFTS were previously reported as part of ‘Nitrogen Europe‘ however have been reallocated to ‘Nitrogen MENA’ due to changes in trading activities and internal monitoring.
OtherThis segment consists of all remaining entities of the Group.

154 OCI N.V. Annual Report 2018 OCI N.V. Annual Report 2018 155
Other Inform
ationP
erformance R
eviewO
perational Strengths
Corporate G
overnanceS
ustainability Review
Financial Statem
ents
Consolidated Financial Statements
26. Segment reporting (continued)
2018$ millions
Methanol US1
Methanol Europe
Nitrogen US
Nitrogen Europe
Nitrogen MENA Other Eliminations Total
Segment revenues 549.5 238.2 489.1 906.8 1,237.6 3.7 - 3,424.9
Inter-segment revenues (77.8) (1.1) - (0.4) (93.1) - - (172.4)Total revenues 471.7 237.1 489.1 906.4 1,144.5 3.7 - 3,252.5
Income from equity-accounted investees
(1.3) - - 3.7 - - (33.2) (30.8)
Depreciation and amortization (86.5) (8.3) (117.1) (62.8) (174.6) (1.0) 25.4 (424.9)
Finance income 0.1 - 3.0 5.7 6.9 61.0 (0.1) 76.6Finance expense (42.9) (0.7) (66.5) (20.9) (82.4) (240.1) 12.3 (441.2)Intercompany finance cost (net) (3.9) 4.1 (45.6) 7.2 (54.2) 92.4 - -
Income tax (expense) / income (14.6) (2.0) (0.8) (4.9) (30.6) 43.5 - (9.4) Net profit / (loss) 31.5 (16.5) (70.6) 39.6 228.0 (112.5) - 99.5
Equity-accounted investees - - - 13.7 - 0.7 552.2 566.6Capital expenditures PP&E 124.0 168.7 38.8 74.0 18.7 2.7 (117.0) 309.9Total assets 1,636.8 267.7 2,336.9 628.6 2,850.5 108.3 (508.8) 7,320.0
2017$ millions
Methanol US1
Methanol Europe
Nitrogen US
Nitrogen Europe
Nitrogen MENA Other Eliminations Total
Segment revenues 343.3 184.4 193.3 908.6 732.4 3.7 - 2,365.7
Inter-segment revenues (18.4) - (0.1) (0.3) (93.2) (2.2) - (114.2)Total revenues 324.9 184.4 193.2 908.3 639.2 1.5 - 2,251.5
Income from equity-accounted investees
- - - 2.9 - 0.7 (9.7) (6.1)
Depreciation and amortization (60.4) (10.4) (29.1) (52.9) (177.2) (1.0) 0.1 (330.9)
Finance income 0.1 - - 4.8 22.2 130.3 (0.1) 157.3Finance expense (24.3) (0.1) (0.7) (30.5) (111.0) (238.8) - (405.4)Intercompany finance cost (net) (17.4) - (39.4) 21.5 (44.7) 80.0 - -
Income tax income / (expense) (1.6) 26.5 1.1 (27.8) (12.9) 17.8 - 3.1 Net (loss) / profit 16.4 59.8 (92.4) 87.8 (109.4) (65.0) - (102.8)
Equity-accounted investees - - - 10.8 - 0.7 615.4 626.9Capital expenditures PP&E 155.8 25.5 146.1 46.4 16.6 - (154.7) 235.7Total assets 1,552.6 117.7 2,290.9 615.5 2,781.0 109.4 (323.5) 7,143.6
1 Including ammonia at OCIB
NOTES TO THE CONSOLIDATED FINANCIAL STATEMENTS CONTINUED
Geographical information of continuing operationsThe geographic information below analyses the Group’s revenue (by destination of the goods) and non-current assets (by the Company where the activities are being operated). OCI has no single customer that represents 10 percent or more of revenues and therefore information about major customers is not provided.
Revenue Non-current assets
$ millions 2018 2017 2018 2017
Europe 1,513.8 1,274.5 619.1 564.5Americas 1,321.7 752.2 3,232.5 3,388.6Africa & Middle East 182.9 154.8 2,254.5 2,450.1Asia & Oceania 234.1 70.0 2.9 1.4Total 3,252.5 2,251.5 6,109.0 6,404.6
The key performance obligation of the OCI group is always the supply of products as specified in the contracts with customers, possible additional performance obligations included are transportation and related cost of insurance, depending on the incoterms. The Group has two revenue streams from contracts with customers that relate to the supply of products i.e. Nitrogen and Methanol. No impairment losses on receivables are recognized (reference is made to note 6.1 and note 9). The entity does not have any judgements, or changes in the judgements, made in applying IFRS 15 that significantly affect the determination of the amount and timing of revenue from contracts with customers. Based on the IFRS accounting policies adopted, the following modifications to the contracts are allowed: discounts and rebates. They are all taken into account when presenting the segment revenues. Time value of money is not considered to be relevant for the amendment of the revenue amount, as the payment terms are short. Also, there are no non-cash considerations that would need to be disclosed separately.
27. Contingencies
Contingent liabilities
Letters of guarantee / letters of creditLetters of guarantee issued by banks in favor of others as at 31 December 2018 amounted to USD 0.2 million (2017 USD 0.2 million). Outstanding letters of credit as at 31 December 2018 (uncovered portion) amounted to nil (2017: nil).
Litigations and claimsIn the normal course of business, the Group entities and joint ventures are involved in some arbitration or court cases as defendants or claimants. These litigations are carefully monitored by the entities’ management and legal counsels, and are regularly assessed with due consideration for possible insurance coverage and recourse rights on third parties. OCI does not expect these proceedings to result in liabilities that have a material effect on the Company’s financial position. In cases where it is probable that the outcome of the proceedings will be unfavorable, and the financial outcome can be measured reliably, a provision has been recognized in the financial statements which is disclosed in note 20 ‘Provisions’. It should be understood that, in light of possible future developments, such as (a) potential additional lawsuits, (b) possible future settlements, and (c) rulings or judgments in pending lawsuits, certain cases may result in additional liabilities and related costs. At this point in time, OCI cannot estimate any additional amount of loss or range of loss in excess of the recorded amounts with sufficient certainty to allow such amount or range of amounts to be meaningful. Moreover, if and to the extent that the contingent liabilities materialize, they are typically paid over a number of years and the timing of such payments cannot be predicted with confidence. While the outcome of said cases, claims and disputes cannot be predicted with certainty, we believe, based upon legal advice and information received, that the final outcome will not materially affect our consolidated financial position but could be material to our results of operations or cash flows in any one accounting period.
Sorfert legal caseOn 5 March 2018, the lower criminal court of Oran (Tribunal du pôle pénal spécialisé d’Oran) issued a judgment against Sorfert regarding an alleged violation of exchange control regulations as well as the regulation of public markets and public service delegations. The lower court ordered Sorfert to pay a fine in the amount of 5.5 billion Algerian dinars (about USD 47 million) and an officer of the company received a fine of DZD 2.8 billion (about USD 24 million). On 7 March 2018, Sorfert lodged an appeal with the Court of Appeal of Oran, Algeria who upheld the verdict against Sorfert in its judgment rendered on 28 November 2018. Sorfert has lodged an appeal against this judgment with the Supreme Court. Sorfert disputes the validity of the judgment and continues to vigorously defend its case. During the appeal with the Supreme Court the enforcement of the judgment is suspended. Various renowned local and international law firms have examined OCI’s legal position. No provision has been recorded related to this matter.
EBIC free zone statusOn 20 April 2013, the Administrative Court ruled in favour of EBIC for the reinstatement of EBIC to its previous status as a free zone entity in Egypt. The General Authority for Investment and Free Zones (‘GAFI’) filed an appeal before the Administrative Court. The Court has not yet rendered a decision. OCI concluded to release the (deferred) tax liabilities totalling USD 138.2 million at 31 December 2015 and no tax filings have been done by EBIC since the filing for the year 2011. On 4 January 2018, GAFI issued an executive decision that allows for the enforcement of the Administrative Court’s judgment in favour of EBIC and EBIC received the Free Zone Status tax card. EBIC’s free zone status will remain subject to the outcome of the Appeal before the Administrative Court.
156 OCI N.V. Annual Report 2018 OCI N.V. Annual Report 2018 157
Other Inform
ationP
erformance R
eviewO
perational Strengths
Corporate G
overnanceS
ustainability Review
Financial Statem
ents
Consolidated Financial Statements
27. Contingencies (continued)
OCI S.A.E. tax dispute In October 2012, the Egyptian Tax Authority (‘ETA’) raised a tax evasion claim against our Egyptian subsidiary, Orascom Construction Industries S.A.E. (‘OCI S.A.E.’). The tax dispute related to the sale of OCI S.A.E.’s cement business to Lafarge SA in 2007. This was filed against OCI S.A.E. despite there being no official investigation. Although OCI S.A.E. and its legal and tax advisors believed that the aforementioned transaction was exempted of tax, management entered into a settlement agreement whereby EGP 7.1 billion would be paid over a 5-year period. The agreement was followed by payment of a first installment of EGP 2.5 billion in 2013. Following the change in government, the company was exonerated from the tax claim by the Egyptian Public Prosecutor on 18 February 2014 and subsequently by the ETA’s Independent Appeals Committee on 4 November 2014. The ETA appealed this decision without including new facts or documents. The appeal is ongoing. OCI S.A.E. and its local counsel believe the likelihood of a judgment in favor of the ETA is not probable. On 13 November 2014 OCI S.A.E. announced that it would transfer its rights to EGP 1.9 billion undue paid tax amounts to the Tahya Misr Fund.
Despite the ETA Independent Appeals Committee ruling in favour of OCI S.A.E., OCI S.A.E. was still held to pay EGP 900 million. OCI S.A.E. has lodged a reimbursement claim for this amount.
As this dispute occurred prior to the demerger of the Engineering and Construction Group that formed Orascom Construction PLC (‘OC’) in 2015, any liabilities and any recoveries are shared on a 50:50 basis between OCI N.V. and OC. As of 31 December 2017, should the ETA win their appeal, OCI’s maximum share of the tax claim would be EGP 2.3 billion, which equates to approximately USD 128.6 million.
Liens on assets of IFCoLiens placed on the IFCo property relates to ongoing disputes between the EPC Contractor, Orascom Engineering and Construction (“OEC”), and subcontractors were reduced over the course of the year. The current lien balance placed against IFCo is USD 53.7 million and relates to on-going litigation between OEC and a single subcontractor. The EPC agreement requires the removal of all liens prior to final payment of existing contractual amounts.
Asset retirement obligationsSorfert has a contractual asset retirement obligation in connection with the lease of its land. This asset retirement obligation is being disclosed as a contingent liability because it is not possible to determine a reliable estimate in both timing and value of this obligation.
OCI Nitrogen entered into agreements with DSM and associated company Sitech for respectively the lease of the sites (land) on which it operates its plant and site services/usage. These agreements have an indefinite term and include an asset dismantling obligation and the obligation to clean up environmental pollution occurred after zero measurement. These obligations have not been accounted for, since the company has no plans to end its business activities in the foreseeable future as such the financial impact is assessed as not material by the company management.
28. Capital commitments
$ millions 2018 2017
IFCo 25.1 16.9OCI Beaumont 1.7 -BioMCN 4.5 37.1OCI Nitrogen 21.6 14.9Total 52.9 68.9
29. Operating lease commitments
The Group leases a number of office spaces, warehouses, computers, machinery and vehicles under operating leases. Lease terms vary from 1 year up to 18 years.
(i) Future minimum lease payments
$ millions 2018 2017
Less than one year 37.5 18.5Between one and five years 79.9 54.9More than five years 54.7 30.8Total 172.1 104.2
NOTES TO THE CONSOLIDATED FINANCIAL STATEMENTS CONTINUED
(ii) Amount recognized in profit or loss
$ millions 2018 2017
Lease expense 33.2 18.9Total 33.2 18.9
Operating lease expense is recognized in either ‘Cost of sales’ or in ‘Selling, general and administrative expenses’ depending on the nature of the underlying asset.
30. Related party transactions
Transactions with related parties – Normal course of businessTransactions with related parties occur when a relationship exists between the Company, its participating interest and their directors and key management personnel. In the normal course of business, the Company buys and sells goods and services from and to various related parties (including associates) within the Group. The CEO is able to expense the use of a private aircraft for business travel.
Moreover, OCI used to own construction operations until 7 March 2015 when the Engineering & Construction business was divested into a separate legal entity incorporated under the name Orascom Construction PLC (‘OC’) in the United Arab Emirates. The Sawiris Family, the majority shareholders of OCI, also owns the majority of the outstanding shares of OC, which qualifies OC and its subsidiaries to be classified as related parties. The Group has ongoing construction contracts with OC Group. The transactions with the following entities of the OC Group are presented in the financial statements as related party transactions:
• Orascom Construction PLC (‘OC’)
• OCI Construction Holding Cyprus
• OCI Construction Cyprus
• Orascom E&C (‘OEC’)
• Contrack International Inc. (‘Contrack’)
• The Weitz Group LLC (‘Weitz’)
• Orascom Construction Egypt
• Suez Industrial Development Company
Next to this, the Group engages in transactions with its associates and joint ventures of the Group:
• Firewater LLC
• Natgasoline LLC
• Fitco OCI Agro S.A.
• Shanxi Fenghe Melamine Company Ltd.
• Nitrogen Iberian Company SL
• Sitech Manufacturing Services C.V.
• Sitech Utility Holding Beheer B.V
• Sitech Utility Holding C.V.
• Sitech Services B.V.
The Utility Support Group B.V. is a subsidiary of Sitech Services B.V.
Other related party transactions of the Group:
The Group engages in transactions with NNS Luxembourg Sarl.
The Group had recognized a liability towards Lafarge Egypt in 2017 related to the settlement of a claim, which was paid in 2018.

158 OCI N.V. Annual Report 2018 OCI N.V. Annual Report 2018 159
Other Inform
ationP
erformance R
eviewO
perational Strengths
Corporate G
overnanceS
ustainability Review
Financial Statem
ents
Consolidated Financial Statements
30. Related party transactions (continued)
The following is a list of significant related party transactions and outstanding amounts as at 31 December 2018:
Related party Relation
Revenue transactions
during the year
AR outstanding at year end
Purchase transactions
during the year
AP outstanding at year end
Loans receivables
Interest income
Interest expense
and other financing charges
Orascom Construction Egypt
OC group company - - - 4.0 - - -
Contrack International
OC group company - - - 0.3 - - -
Orascom E&C OC group company - - - 30.0 - - -
OCI Construction Cyprus
OC group company - - - 0.8 - - -
OCI Construction Holding Cyprus
OC group company - - - 0.8 - - -
Orascom Construction PLC
OC group company - 3.5 - 1.0 - - -
Natgasoline LLC Related via an associate 4.5 - 105.1 13.9 - 0.7 -
Fitco Agro S.A. Joint venture 1.1
Sitech Manufacturing Services C.V.
Associate - - 127.8 28.9 - - -
Utility Support Group B.V.
Related via an associate 23.3 4.8 86.0 0.8 53.1 1.9 -
Sitech Services B.V. Associate - - 6.6 1.0 - - -
OCI Nitrogen Iberian Company
Joint venture 11.1 3.6 - - - - -
NNS Luxembourg Sarl
Related via shareholder - - 0.2 0.6 - - 8.8
Shanxi Fenghe Melamine Co Ltd.
Joint venture 0.3 0.4 28.6 - - - -
Nassef Sawiris Shareholder - - 1.4 0.3 - - -Total 40.3 12.3 355.7 82.4 53.1 2.6 8.8
NOTES TO THE CONSOLIDATED FINANCIAL STATEMENTS CONTINUED
The following is a list of significant related party transactions and outstanding amounts as at 31 December 2017:
Related party Relation
Revenue transactions
during the year
AR outstanding at year end
Purchase transactions
during the year
AP outstanding at year end
Loans receivables
Loans payables
Interest income
Interest expense
Orascom Constrution Egypt
OC group company - - - 5.4 - - - -
Contrack International
OC group company - - 0.4 0.5 - - - -
Orascom E&C OC group company - - 22.3 35.9 - - - -OCI Construction Cyprus
OC group company - - - 0.8 - - - -
OCI Construction Holding Cyprus
OC group company - - - 0.8 - - - -
Weitz OC group company - 0.1 - - - - - -Orascom Construction PLC
OC group company - 3.6 1.0 1.0 - - - -
Suez Industrial Development Company
OC group company- - 0.2 - - - - -
Natgasoline LLC Related via an associate
- 0.2 - - - - - -
Fitco Agro S.A. Joint venture 24.9 4.5 - - - - - -Sitech Manufacturing Services C.V.
Associate - - 97.9 29.0 - - - -
Utility Support Group B.V.
Related via an associate
19.0 1.1 66.8 1.4 55.9 - 1.6 -
Sitech Services B.V.
Associate - - 6.7 1.2 - - - -
OCI Nitrogen Iberian Company
Joint venture 13.6 2.4 - - - - - -
Lafarge Related via key management
personnel
- - - 11.0 - - - -
NNS Luxembourg Sarl
Related via shareholder
- - 0.2 0.4 - 48.1 - 0.1
Shanxi Fenghe Melamine Co Ltd.
Joint venture 0.6 0.1 26.4 - - - - -
Nassef Sawiris Shareholder - - 1.9 0.4 - - -Total 58.1 12.0 223.8 87.8 55.9 48.1 1.6 0.1
In addition to the related party transactions in the table above, the Company incurs certain operating expenses for immaterial amounts in relation to services provided by related parties.
Construction contractsOn 7 March 2015, OC was demerged from the Group. The Sawiris family is a majority shareholder in both OCI and OC. Commercial relationships remain on-going between OCI and OC.

160 OCI N.V. Annual Report 2018 OCI N.V. Annual Report 2018 161
Other Inform
ationP
erformance R
eviewO
perational Strengths
Corporate G
overnanceS
ustainability Review
Financial Statem
ents
Consolidated Financial Statements
30. Related party transactions (continued)
OEC, a wholly owned subsidiary of OC is:
• A party to an Engineering, Procurement and Construction (‘EPC’) contract for IFCo’s fertilizer and industrial chemicals greenfield plant in Iowa, USA. Under the terms of the EPC contract, the contractor is required to furnish a complete nitrogen fertilizer facility that is engineered, procured and constructed on a lump-sum fixed-price basis of USD 1,216.0 million, plus limited increases, including costs related to breaches, extraordinary subsurface conditions, certain hazardous substances, change orders, changes in law, certain work outside the boundaries of the property, specified reimbursable work and off-site and on-site training (‘Contract Price’). The Contract Price was divided among certain categories of work and then further divided among specified milestones. OEC subcontracted Tecnimont, KBR and Uhde for state-of-the-art engineering and technology procurement. The project was funded by a combination of cash and a non-recourse project finance tax-exempt municipal bond issuance. In addition, OCI paid USD 150.0 million to OEC in July 2015 pursuant to an indemnity for certain liabilities under or in connection with the contracts within the Group. This amount was allocated to IFCo and recognized in property, plant and equipment in the second half of 2015.
OCI and OEC entered into a settlement and acceleration agreement in 2016. The agreement addresses outstanding claims between IFCo and OEC, and provides for additional consideration of up to USD 200.0 million to accelerate commercial operations where possible. The terms and conditions of this agreement have been mutually agreed by OCI and OEC, and the necessary consents were received in November 2016.
Of the consideration of USD 200.0 million, OCI paid USD 170.0 million to OEC during 2016. This amount was allocated to IFCo and recognized in property, plant and equipment in 2016. The assets of IFCo were placed in use in October 2017. As per 31 December 2018 USD 30.0 million is recognized under Trade and Other Payables.
• A party to an EPC contract for Natgasoline’s 1.75 million metric ton per year methanol plant under construction in Texas, USA. Under the terms of the EPC contract, the contractor was required to furnish a complete methanol facility that is engineered, procured and constructed on a lump-sum fixed-price basis of USD 1,396.0 million plus limited increases, including costs related to breaches, extraordinary subsurface conditions, change orders, changes in law, work outside the boundaries of the property and necessary for the operation of the Facility, specified reimbursable work and off-site and on-site training and delays caused by other contractors, engineers or other person engaged to work on the plant (‘Contract Price’). The Contract Price was divided among certain categories of work and then further divided among specified milestones. OEC subcontracted ALPC to engineer and procure the plant incorporating state-of-the-art production process technology from Lurgi MegaMethanol® technology supplied by Air Liquide’s engineering & construction division, Air Liquide Global E&C Solutions. The project was funded by a combination of cash and debt. The plant was placed in use in 2018.
Due to the related party nature of above transactions, the terms and conditions may not necessarily be the same as transactions negotiated between third parties. Management believes that the terms and conditions of all transactions with our related parties are generally no less favorable to either party than those that could have been negotiated with unaffiliated parties with respect to similar services.
31. Remuneration of the Board of Directors (Key management personnel)
During 2018, we considered the members of the Board of Directors (Executive and Non-executive) to be the key management personnel as defined in IAS 24 ‘Related parties’. For transactions with key management personnel reference is made to note 30. No other benefits or remuneration were provided to or have been entered into with above mentioned key management personnel except as disclosed below.
Remuneration of the DirectorsDuring the financial year ended 31 December 2018, the total remuneration costs relating to the Executive Directors amounted to USD 8.7 million (2017: USD 10.8 million) consisting of the elements listed in the table below:
2018 Age Base salary1 Annual bonusShare-based
compensationTotal
remuneration
N. Sawiris 57 2,000,000 2,000,000 2,290,967 6,290,967H. Badrawi 42 950,000 950,000 497,640 2,397,640Total 2,950,000 2,950,000 2,788,607 8,688,607
1 These figures exclude employer’s social security payments (USD 0.3 million).
NOTES TO THE CONSOLIDATED FINANCIAL STATEMENTS CONTINUED
2017 Age Base salary3 Annual bonusShare-based
compensation2
Termination benefits
Total remuneration
N. Sawiris 56 2,000,000 1,200,000 1,642,242 - 4,842,242S. Butt1 58 1,260,000 604,800 2,274,265 1,461,600 5,600,665H. Badrawi1 41 237,500 114,000 83,620 - 435,120Total 3,497,500 1,918,800 4,000,127 1,461,600 10,878,027
1 Mr. S. Butt stepped down as Chief Financial Officer of OCI effective 30 September 2017 and Mr. H Badrawi was appointed as Chief Financial Officer of OCI as per 1 October 2017.
2 The share-based compensation for Mr. S. Butt consists of USD 1,266,659 share-based compensation expenses recognized for plans which vested in September 2017 as part of his termination agreement.
3 These figures exclude employer’s social security payments (USD 0.3 million).
As at 31 December 2018, the Executive Directors held 35,000 stock options (2017: nil). Mr. Badrawi participated in this plan before he was appointed as a board member for OCI N.V.
Outstandingyear end 2018 Granted Exercised Expired
Outstanding year end 2018 Exercise price Expiration
H. Badrawi 35,000 - - - 35,000 EUR 32.74 31-12-2020Total 35,000 - - - 35,000 - -
At 31 December 2018, the Executive Directors held 370,688 conditional performance shares (2017: 313,581).
Outstandingyear end 2017
Grantedconditional Vested
Less / more due to TSR
Outstanding year end 2018 Vesting date
N. Sawiris 68,081 - - (68,081) - 01-07-2018141,913 - - - 141,913 01-07-2019103,587 - - - 103,587 07-02-2020
- 84,873 - - 84,873 07-02-2021N. Sawiris total 313,581 84,873 - (68,081) 330,373 -
H. Badrawi - 40,315 - - 40,315 07-02-2021H. Badrawi total - 40,315 - - 40,315 -Total 313,581 125,188 - (68,081) 370,688 -
As at 31 December 2018, the Executive Directors held 105,508 bonus matching shares (2017: 96,100).
Outstandingyear end 2017 Granted Vested
Outstanding year end 2018 Vesting date
N. Sawiris 20,874 - - 20,874 23-05-2019
21,571 - - 21,571 12-04-2020- 17,190 - 17,190 23-04-2021
N Sawiris total 42,445 17,190 - 59,635 -H. Badrawi 9,180 - (9,180) - 15-06-2018
36,975 - - 36,975 23-05-20197,500 - - 7,500 12-04-2020
- 1,398 - 1,398 23-04-2021H. Badrawi total 53,655 1,398 (9,180) 45,873 -Total 96,100 18,588 (9,180) 105,508 -

162 OCI N.V. Annual Report 2018 OCI N.V. Annual Report 2018 163
Other Inform
ationP
erformance R
eviewO
perational Strengths
Corporate G
overnanceS
ustainability Review
Financial Statem
ents
Consolidated Financial Statements
31. Remuneration of the Board of Directors (Key management personnel) (continued)
In 2018, the total remuneration costs relating to the Non-Executive Directors amounted to USD 1,271,575 (2017: USD 1,352,500) consisting of the elements in the table below:
2018 Annual fixed feeAudit committee
membershipAdditional
fee
Nomination governance and
remunerationcommittee
Healthsafety
environmentcommittee Total
M. Bennett1 260,000 - 81,575 7,500 7,500 356,575J.A. Ter Wisch 130,000 20,000 - 7,500 - 157,500S. N. Schat 130,000 20,000 - 10,000 - 160,000A. Montijn 130,000 - - - 7,500 137,500R.J. van de Kraats 130,000 25,000 - 7,500 - 162,500G.A. Heckman 130,000 - - - 10,000 140,000J. Guiraud 130,000 20,000 - 7,500 - 157,500Total 1,040,000 85,000 81,575 40,000 25,000 1,271,575
1 The additional fee for Mr. Bennett is for service on the Board of OCI Beaumont in the US. The decrease compared to 2017 is due to OCI Beaumont no longer being a publicly listed company since July 2018.
2017 Annual fixed feeAudit committee
membershipAdditional
fee
Nominationgovernancecommittee
Healthsafety
environmentcommittee Total
M. Bennett1 260,000 - 150,000 11,250 7,500 428,750J.A. Ter Wisch 130,000 20,000 - 8,750 3,750 162,500S. N. Schat 130,000 20,000 - 10,000 - 160,000A. Montijn 130,000 - - 3,750 7,500 141,250R.J. van de Kraats 130,000 25,000 - 7,500 - 162,500G.A. Heckman 130,000 - - - 10,000 140,000J. Guiraud 130,000 20,000 - 7,500 - 157,500Total 1,040,000 85,000 150,000 48,750 28,750 1,352,500
1 The additional fee for Mr. Bennett is for service on the Board of OCI Beaumont in the US. 2 During 2017, the Nomination governance committee was combined with the Remuneration committee.
32. Subsequent events
No subsequent events have occurred.
33. External auditors’ fee
The service fees recognized in the financial statements 2018 for the service of KPMG amounted to USD 3.9 million (2017: USD 3.3 million). Other assurance services provided to the Group include tax services and agreed-upon procedures related to covenant reporting and other statutory requirements.
The amounts per service category are shown in the following table:
Total service feeof which KPMG Accountants N.V.
(The Netherlands)
$ millions 2018 2017 2018 2017
Audit of group financial statements 3.2 2.9 1.6 1.5Other assurance services 0.7 0.3 0.6 -Total assurance services 3.9 3.2 2.2 1.5
Tax services - - - -Sundry services - 0.1 - -Total 3.9 3.3 2.2 1.5
NOTES TO THE CONSOLIDATED FINANCIAL STATEMENTS CONTINUED
34. List of principal subsidiaries as per 31 December 2018
Companies Country Percentage of
interestConsolidation
method
Sorfert Algérie Spa Algeria 50.99 FullOCI Fertilizer Trading Limited UAE 100.00 FullOCI Fuels Limited Cyprus 100.00 FullOrascom Construction Industries S.A.E. Egypt 99.96 FullEgypt Basic Industries Corporation Egypt 60.00 FullEgyptian Fertilizers Company Egypt 99.90 FullOCI Fertilizer Trade and Supply B.V. The Netherlands 100.00 FullOCI Nitrogen B.V. The Netherlands 100.00 FullBioMCN B.V. The Netherlands 100.00 FullIowa Fertilizer Company LLC United States 100.00 FullOCI Fertilizer USA LLC United States 100.00 FullOCI USA Inc. United States 100.00 FullOCI Partners LP / OCI Beaumont United States 100.00 FullN-7 LLC United States 50.00 FullOCI Methanol Marketing LLC United States 100.00 Full
A full list of affiliated companies will be available for public inspection at the Commercial Registry in conformity with the provisions of Article 2:379 and 2:414 of the Dutch Civil Code.

165 Parent Company Statement of Financial Position
166 Parent Company Statement of Profit or Loss and other Comprehensive Income
167 Parent Company Statement of Changes in Equity
168 Parent Company Statement of Cash Flows
169 Notes to the Parent Company Financial Statements
183 Other Information
184 Independent Auditor’s Report
192 Shareholder Information
193 Global reporting initiative index
PARENT COMPANY FINANCIALSTATEMENTS
Other Inform
ationP
erformance R
eviewO
perational Strengths
Corporate G
overnanceS
ustainability Review
Financial Statem
ents
164 OCI N.V. Annual Report 2018
PARENT COMPANY STATEMENT OF FINANCIAL POSITION
$ millions Note31 December
201831 December
2017
AssetsNon-current assetsProperty, plant and equipment 0.6 0.8Investment in subsidiaries (41) 7,646.3 7,317.7Financial assets at fair value through other comprehensive income (43) 3.6 4.4Other receivables (42) 392.1 -Total non-current assets 8,042.6 7,322.9
Current assetsOther receivables (42) 515.8 1,026.2Cash and cash equivalents (44) 11.1 17.6Total current assets 526.9 1,043.8Total assets 8,569.5 8,366.7
EquityShare capital (45), (15) 5.6 5.6Share premium (15) 6,316.3 6,316.3Currency translation reserve (1,570.1) (1,254.6)
Other reserves (127.2) (97.4)
Retained earnings 1,824.6 707.4Equity attributable to owners of the Company 6,449.2 5,677.3
Liabilities
Non-current liabilitiesLoans and borrowings (46) 1,888.5 1,621.3Trade and other payables (47) 0.3 2.0Deferred tax liabilities (53) 1.6 24.9Total non-current liabilities 1,890.4 1,648.2
Current liabilitiesLoans and borrowings (46) 147.1 938.3Trade and other payables (47) 70.2 39.4Income tax payables 12.6 63.5Total current liabilities 229.9 1,041.2Total liabilities 2,120.3 2,689.4Total equity and liabilities 8,569.5 8,366.7
The notes on pages 169 to 182 are an integral part of these parent company financials statements.

Parent Company Financial Statements
Other Inform
ationP
erformance R
eviewO
perational Strengths
Corporate G
overnanceS
ustainability Review
Financial Statem
ents
166 OCI N.V. Annual Report 2018 OCI N.V. Annual Report 2018 167
PARENT COMPANY STATEMENT OF PROFIT OR LOSS AND OTHER COMPREHENSIVE INCOME FOR THE YEAR ENDED 31 DECEMBER
$ millions Note 2018 2017
Revenue from dividend income (48) 1,279.9 35.8Other income (50) 0.1 1.5General and administrative expenses (49) (33.5) (28.9)Other expenses (51) (17.9) (8.7)Operating profit / (loss) 1,228.6 (0.3)
Finance income (52) 75.3 211.1Finance cost (52) (261.6) (349.3)Net finance (cost) (52) (186.3) (138.2)Profit / (loss) before income tax 1,042.3 (138.5)Income tax (53) 51.9 32.2
Total net profit / (loss) 1,094.2 (106.3)
Other comprehensive income:Items that are or may be reclassified subsequently to profit or loss
Currency translation differences (314.7) 716.7
Items that will not be reclassified to profit or loss
Changes in fair value of other financial assets (0.8) 1.1Other comprehensive income, net of tax (315.5) 717.8Total comprehensive income (778.7) 611.5
The notes on pages 169 to 182 are an integral part of these parent company financials statements.
PARENT COMPANY STATEMENT OF CHANGES IN EQUITY
$ millions Note
Sharecapital
(15)
Sharepremium
(15)
Financial assets at fair value
through other comprehensive
income1Currency
translation2Other
reservesRetainedearnings
Equityattributable
to ownersof the
Company
Balance at 1 January 2017 5.6 6,316.3 (0.8) (1,971.6) (107.8) 816.7 5,058.4
Net profit / (loss) - - - - - (106.3) (106.3)Other comprehensive income - - 1.1 716.7 - - 717.8
Total comprehensive income - - 1.1 716.7 - (106.3) 611.5
Capital increase (15) - - - - (0.2) - (0.2)Treasury shares sold / delivered (16) - - - - 7.3 (3.0) 4.3Share-based compensation (15) - - - - 3.3 - 3.3
Balance at 31 December 2017 5.6 6,316.3 0.3 (1,254.9) (97.4) 707.4 5,677.3
Impact of IFRS 9 adoption (4.1) - - - - - (0.8) (0.8)Restated balance at 1 January 2018 5.6 6,316.3 0.3 (1,254.9) (97.4) 706.6 5,676.5
Net profit / (loss) (45.2) - - - - - 1,094.2 1,094.2Other comprehensive income - - (0.8) (314.7) - - (315.5)Total comprehensive income - - (0.8) (314.7) - 1,094.2 778.7
Repayment of convertible bond (equitycomponent) (35.5) 23.2 (12.3)Treasury shares sold / delivered (16) - - - - 6.2 0.6 6.8Treasury shares acquired (16) - - - - (1.2) - (1.2)Share-based payments (15) - - - - 0.7 - 0.7Balance at 31 December 2018 5.6 6,316.3 (0.5) (1,569.6) (127.2) 1,824.6 6,449.2
1 Cannot be reclassified to profit or loss2 Legal reserve under Dutch Law.
The notes on pages 169 to 182 are an integral part of these parent company financials statements.

Parent Company Financial Statements
Other Inform
ationP
erformance R
eviewO
perational Strengths
Corporate G
overnanceS
ustainability Review
Financial Statem
ents
168 OCI N.V. Annual Report 2018 OCI N.V. Annual Report 2018 169
PARENT COMPANY STATEMENT OF CASH FLOWSFOR THE YEAR ENDED 31 DECEMBER
$ millions Note 2018 2017
Net profit / (loss) 1,094.2 (106.3)
Adjustments for:
Depreciation (49) 0.2 0.2Interest income (52) (19.5) (83.8)Interest expense (52) 159.9 125.7Net foreign exchange loss (52) 45.9 96.3Dividend income from subsidiaries (48) (1,279.9) (35.8)Share-based compensation (15) 0.7 3.3Income tax expense (53) (51.9) (32.2)
Changes in:Other receivables (42) (150.0) 82.9Trade and other payables (47) 3.9 (5.6)
Cash flows:Interest paid (79.9) (39.3)Interest paid Nile Holding loan (75.1) -Interest received 1.2 0.2Income taxes paid (32.0) (26.0)Dividends received 75.3 35.8Cash flow (used in) / from operating activities (307.0) 15.4
Capital contributions to subsidiaries (41) (3.4) (107.0)Cash flow (used in) investing activities (3.4) (107.0)
Proceeds from sale of treasury shares (16) 6.8 4.3
Purchase of treasury shares (16) (1.2) (0.2)Proceeds from borrowings (18), (46) 2,391.3 48.0Proceeds from borrowings from subsidiaries (46) 402.7 39.6Repayment of borrowings (46) (1,815.1) (56.6)Repayment of borrowings from subsidiaries (46) (621.1) (23.3)Newly incurred transaction costs (46) (46.5) -Repayment of convertible bond (equity component) (18) (12.3) -Cash flow from financing activities 304.6 11.8
Net (decrease) in cash and cash equivalents (5.8) (79.8)Cash and cash equivalents at 1 January 17.6 89.6Effect of exchange rate fluctuations on cash held (0.7) 7.8Cash and cash equivalents at 31 December 11.1 17.6
The notes on pages 169 to 182 are an integral part of these parent company financials statements.
NOTES TO THE PARENT COMPANY FINANCIAL STATEMENTS
35. General
OCI N.V. (‘The Company’ or ‘OCI’) was established on 2 January 2013 as a public limited liability company incorporated under Dutch law, with its head office located at Honthorststraat 19, Amsterdam, the Netherlands. OCI is registered in the Dutch commercial register under no. 56821166 dated 2 January 2013. OCI is a holding company and is tax resident in the Netherlands.
36. Basis of preparation
The parent company financial statements have been prepared in accordance with International Financial Reporting Standards as endorsed by the European Union (IFRS-EU).
The parent company financial statements have been prepared on the historical cost basis, except when otherwise indicated.
The financial year of OCI commences on 1 January and ends on 31 December.
The Company’s functional currency is the Euro (‘EUR’). Because the Company’s major foreign operations have the US dollar as their functional currency, the presentation currency of the Company is the US dollar (‘USD’).
All values are rounded to the nearest tenth million (in millions of USD), except when stated otherwise.
The parent company financial statements have been authorized for issue by the Company’s Board of Directors on 15 March 2019. The financial statements are subject to adoption of the Annual General Meeting of Shareholders on 29 May 2019.
37. Accounting principles applied
In the parent company financial statements, the same accounting policies have been applied as set out in the notes to the consolidated financial statements, except for the measurement of the subsidiaries as presented under ‘Investments in subsidiaries’ in the parent company financial statements. These policies have been consistently applied to all years presented.
The application of new accounting standards IFRS 9 ‘Financial Instruments’ and IFRS 15 ‘Revenue from contracts with customers’ have been diclosed in paragraph 4.1 of the consolidated financial statements. The application of both standards have a limited impact on the parent financial statements.
IFRS 9 is effective as of 1 January 2018. The impact of the adoption of this standard resulted in an increase of loans & borrowings of USD 1.0 million relating to previous debt modifications, after tax effect of USD 0.2 million the impact on retained earnings is USD 0.8 million. Equity investments, previously recognized as available-for-sale financial assets are measured at Fair value through other comprehensive income. The outstanding amount as per 31 December 2017 was USD 4.4 million, which was restated in the opening balance of 2018. Reference is made to note 4.1 of the consolidated financial statements.
The expected impact of IFRS’s not yet effective is disclosed in paragraph 4.2 of the consolidated financial statements. The impact of the application of IFSR 16 ‘Leases’ on OCI N.V. is limited to the lease of the office building in Amsterdam and company car leases.
For an overview of the amendments that became applicable and the new standards not yet applicable to OCI, reference is made to note 4.2 of the consolidated financial statements.
38. Summary of significant accounting policies
Investments in subsidiaries
These policies have been consistently applied to all years presented.
In the parent company financial statements, investments in subsidiaries are recorded at cost less impairment. In the parent company statement of profit or loss and other comprehensive income, dividend received from investments in subsidiaries is recorded as dividend income.
Due to this application, the parent company equity and net result are not equal to the consolidated equity and net result. A reconciliation for total equity attributable to owners of the company and total comprehensive income is presented in note 45 to the parent company financial statements.
Dividend distributionDividend distribution to the Company’s shareholders is recognized as a liability in the parent company financial statements, in the period in which the dividend is approved by the Company’s shareholders.
Dividend IncomeDividend income from the Company’s subsidiaries is recognized when the right to receive payment is established.

Parent Company Financial Statements
Other Inform
ationP
erformance R
eviewO
perational Strengths
Corporate G
overnanceS
ustainability Review
Financial Statem
ents
170 OCI N.V. Annual Report 2018 OCI N.V. Annual Report 2018 171
NOTES TO THE PARENT COMPANY FINANCIAL STATEMENTS CONTINUED
39. Use of estimates and judgments
The preparation of the parent company financial statements requires management to exercise judgment and make estimates and assumptions that affect the application of the Company’s accounting policies and the reported amounts of assets, liabilities, income and expenses. Actual results could differ from these estimates.
Estimates and underlying assumptions are reviewed on an ongoing basis. Revisions to accounting estimates are recognized in the period in which the estimates are revised and in any future periods affected.
The areas involving a higher degree of judgment or complexity, or areas where assumptions and estimates are significant to the parent company financial statements are the impairment of the investments in subsidiaries.
Impairment of investments in subsidiariesAt each balance sheet date, the Company reviews whether there is an indication that its investments in subsidiaries might be impaired.
An indication for impairment of the investments in subsidiaries may include, respectively, management’s downward adjustment of the strategic plan. Further indications for impairments of its investments may include other areas where observable data indicates that there is a measurable decrease in the estimated future cash flows. These determinations require significant judgment. In making this judgment, management evaluates, among other factors, the financial performance of and business outlook for its investments, including factors such as industry and sector performance, changes in technology and operational and financing cash flow.
If any indication for impairment exists, the recoverable amount of the investments is estimated in order to determine the extent, if any, of the impairment loss. An investment is impaired if the recoverable amount is lower than the carrying amount. The recoverable amount is defined as the higher of an investment’s fair value less costs to sell and its value in use.
The investments’ fair value less costs to sell represents the best estimate of the amount OCI would receive if it sold its investments. The fair value of each investment has been estimated on the basis of the present value of future cash flows, taking into account costs to sell.
The determination of the investment’s value in use is based on calculations using pre-tax cash flow projections based on financial budgets approved by management covering a 5-year period.
If the recoverable amount of an investment is estimated to be less than its carrying amount, the carrying amount of the investment is reduced to its recoverable amount. Any impairment loss is recognized immediately in the statement of profit or loss.
Impairment losses recognized in prior periods shall be reversed only if there has been a change in the estimates or external market information used to determine the investment’s recoverable amount since the last impairment loss was recognized. The recoverable amount shall not exceed the carrying amount that would have been determined had no impairment loss been recognized in prior years.
40. Financial risk and capital management
Reference is made to note 6 ‘Financial risk and capital management‘ in the notes to the consolidated financial statements.
40.1 Credit risk
The maximum exposure to credit risk at the reporting date was as follows:
$ millions Note 2018 2017
Other receivables (42) 907.9 1,026.2
Financial assets at fair value through other comprehensive income (43) 3.6 4.4Cash and cash equivalents (44) 11.1 17.6Total 922.6 1,048.2
The maximum exposure to credit risk for other receivables by geographic region was as follows:
$ millions 2018 2017
Middle East and Africa 360.2 368.9Europe 43.8 634.8Americas 503.9 22.5Total 907.9 1,026.2
40.2 Liquidity risk
The following are the contractual maturities of financial liabilities, including estimated interest payments and excluding the impact of netting agreements:
At 31 December 2018$ millions Note
Carryingamount
Contractualcash flow
Less than 1 year
Between 1 and 5 years
More than5 years
Financial liabilitiesLoans and borrowings (46) 1,962.2 2,484.9 191.4 2,293.5 -Loans and borrowings from subsidiaries1 (46) 73.4 73.4 73.4 - -
Trade and other payables (47) 70.5 70.5 70.2 0.3 -Letters of guarantee (27) - 0.2 - 0.2 -Total 2,106.1 2,629.0 335.0 2,294.0 -
At 31 December 2017$ millions Note
Carryingamount
Contractualcash flow
Less than 1 year
Between 1 and 5 years
More than5 years
Financial liabilitiesLoans and borrowings (46) 1,495.4 1,715.5 452.8 1,262.7 -Loans and borrowings from subsidiaries2 (46) 1,064.2 1,157.7 525.3 632.4 -
Trade and other payables (47) 41.4 41.4 39.4 2.0 -Letters of guarantee (27) - 0.2 - 0.2 -Total 2,601.0 2,914.8 1,017.5 1,897.3 -
1 The contractual cash flows do not include interest cash flows for the loans received from OCI Overseas Holding, OCI Beaumont and OCI Nitrogen since these loans are repayable on demand.
2 The contractual cash flows do not include interest cash flows for the loan received from OCI Overseas Holding, BioMCN and OCI USA since these loans are repayable on demand.
As part of the preparation of the financial statements, the Company has assessed its liquidity risk. Liquidity risk is the risk that the Company may encounter difficulty in meeting the obligations associated with its financial liabilities that are settled by delivering cash or another financial asset. The Company has made a number of assumptions in assessing its ability to meet its covenant requirements and satisfy obligations as they become due. Determining these assumptions requires significant judgment about future results and cash flows. Key assumptions include product pricing, gas pricing, utilization rates, and the ability to arrange financing and obtain waivers for anticipated covenant breaches. Refer to note 6.2 and note 18 of the notes to the consolidated financial statements for the Company’s analyses of liquidity risk and debt covenants, respectively. Furthermore, the Company’s financial liabilities include loans and borrowings from subsidiaries. Although these loans and borrowings from subsidiaries are sometimes classified as short-term due the contractual terms, the repayment date of these loans and borrowings can be controlled and determined by OCI and may be extended beyond one year.

Parent Company Financial Statements
Other Inform
ationP
erformance R
eviewO
perational Strengths
Corporate G
overnanceS
ustainability Review
Financial Statem
ents
172 OCI N.V. Annual Report 2018 OCI N.V. Annual Report 2018 173
NOTES TO THE PARENT COMPANY FINANCIAL STATEMENTS CONTINUED
40.3 Market risk
Foreign exchange riskAs of 31 December 2018, if the US dollar had weakened / strengthened by 7 percent against the Euro with all other variables held constant, the translation of foreign currency receivables, payables, cash and cash equivalents and loans and borrowings would have resulted in a increase / decrease of USD 25.4 million of the profit of the year.
The summary of quantitative data about the Company’s exposure to foreign exchange transaction exposure based on risk management policy for the main currencies was as follows:
At 31 December $ millions
2018USD
2017USD
Other receivables 866.8 999.5Trade and other payables (28.6) (9.2)Loans and borrowings (1,190.3) (1,060.1)Cash and cash equivalents (10.5) 6.6
The following tables demonstrate the sensitivity to a reasonably possible change in EUR-USD exchange rates, with all other variables held constant. The impact on the Company’s general and administrative expenses is due to changes in the fair value of monetary assets and liabilities, including inter-company positions. The Company’s exposure to foreign currency changes for all other currencies is not material.
2018$ millions
Change in FX rate
Effect on profit before tax
Effect on equity
EUR - USD 7 percent 25.4 -
(7) percent (25.4) -
2017$ millions
Change in FX rate
Effect on profit before tax
Effect on equity
EUR - USD 7 percent 4.8 -
(7) percent (4.8) -
Interest rate riskThe following table demonstrates the sensitivity to a reasonably possible change in interest rates on that portion of borrowings affected. With all other variables held constant, the Company’s profit before tax is affected through the impact on floating rate borrowings plus refinancing of fixed rate borrowings, as follows:
$ millions In basis points 2018 2017
Effect on profit before tax for the coming year +100 bps (5.6) (8.8)- 100 bps 5.6 8.8
Categories of financial instruments
2018 $ millions Note
Loans andreceivables /
payables atamortized cost
Financial asset at fair value through
other comprehensive income
AssetsOther receivables (42) 907.9 -Financial asset at fair value through other comprehensive income (43) - 3.6Cash and cash equivalents (44) 11.1 -Total 919.0 3.6
LiabilitiesLoans and borrowings from third parties (46) 1,962.1 -Loans and borrowings from subsidiaries (46) 73.5 -Trade and other payables (47) 70.5 - Total 2,106.1 -
2017 $ millions Note
Loans andreceivables /payables at
amortized cost
Financial assetsat fair value through
other comprehensive income
AssetsOther receivables (42) 1,026.2 -Financial asset at fair value through other comprehensive income (43) - 4.4Cash and cash equivalents (44) 17.6 -Total 1,043.8 4.4
LiabilitiesLoans and borrowings from third parties (46) 1,495.4 -Loans and borrowings from subsidiaries (46) 1,064.2 -Trade and other payables (47) 41.4 - Total 2,601.0 -
The only financial instrument carried at fair value by the Company is the financial asset at fair value through other comprehensive income which is measured with hierarchy level 1 of the fair value hierarchy category.

Parent Company Financial Statements
Other Inform
ationP
erformance R
eviewO
perational Strengths
Corporate G
overnanceS
ustainability Review
Financial Statem
ents
174 OCI N.V. Annual Report 2018 OCI N.V. Annual Report 2018 175
NOTES TO THE PARENT COMPANY FINANCIAL STATEMENTS CONTINUED
41. Investment in subsidiaries
$ millions 2018 2017
Balance at 1 January 7,317.7 5,583.6Capital contribution 712.3 869.1Exchange rate differences (383.7) 865.0
Balance at 31 December 7,646.3 7,317.7
Capital contributions and additionsIn 2018, the following additions to the capital of the subsidiaries in the amount of USD 712.3 million have been made:
• Capital contributions in kind of USD 708.9 million were made to OCI Intermediate B.V. by settling loans.
• Capital contributions were made in cash of USD 3.4 million to OCI Intermediate B.V.
In 2017, the following additions to the capital of the subsidiaries in the amount of USD 869.1 million have been made:
• Capital contributions were made in kind to OCI Chemicals of USD 323.4 million by settling of loans.
• On 31 March 31 2017 OCI established a new 100% subsidiary, OCI Intermediate B.V. (‘OCI Intermediate’) and made a capital contribution in kind of USD 438.7 million by settling loans. OCI Chemicals B.V. (‘OCI Chemicals’) and OCI Fertilizers B.V. (‘OCI Fertilizers’) were transferred to this subsidiary.
• Capital contribution to OCI Intermediate of USD 107.0 million in cash.
Impairment testing 2018
Management did not identify any impairment triggers. This is based on the improved performance compared to prior years, the strong outlook and deleveraging expected in the coming years and various other internal and external factors. Therefore no impairment test was performed.
List of subsidiaries as per 31 December 2018
NameCountry of
incorporation Ownership %
OCI Intermediate B.V. The Netherlands 100.0OCI UK Ltd. United Kingdom 100.0
OCI Intermediate is a holding company which has all operating companies as subsidiaries.
42. Other receivables
$ millions 2018 2017
Receivables from subsidiaries 897.3 1,021.8Receivables from related parties 3.5 3.6
Other receivables 7.1 0.8
Total 907.9 1,026.2
Non-current 392.1 -Current 515.8 1,026.2
At 31 December 907.9 1,026.2
The carrying amount of receivables approximates their fair value.
The assessment of the expected credit losses did not result in an additional impairment of receivables at the initial adoption of the standard at 1 January 2018. This will be monitored on a continuous basis going forward and periodically reassessed.
Specification of loans and other receivables from subsidiaries:
$ millions Type Interest rate2018
Long-term2018
Short-term2017
Long-term2017
Short-term
OCI USA Inc. Unsecured 8% fixed 392.1 - - -OCI S.A.E. Unsecured LIBOR + 3.25% - 344.8 - 353.3OCI Intermediate B.V. Unsecured LIBOR + 3.25% - - - 607.5Other receivables subsidiaries - - - 160.4 - 61.0Total 392.1 505.2 - 1,021.8
43. Financial assets at fair value through other comprehensive income
$ millions 2018 2017
Orascom Construction Limited (Dubai) 3.6 4.4Total 3.6 4.4
Orascom Construction Limited is a related party.
44. Cash and cash equivalents
$ millions 2018 2017
Bank balances 11.1 17.6Total 11.1 17.6
The bank balances are freely available for usage and are not restricted.

Parent Company Financial Statements
Other Inform
ationP
erformance R
eviewO
perational Strengths
Corporate G
overnanceS
ustainability Review
Financial Statem
ents
176 OCI N.V. Annual Report 2018 OCI N.V. Annual Report 2018 177
NOTES TO THE PARENT COMPANY FINANCIAL STATEMENTS CONTINUED
45. Equity attributable to owners of the Parent Company
45.1 Reconciliation of consolidated income and equity attributable to shareholders to Parent Company income and equity attributable to owners
$ millions2018
Equity2018
Profit / (loss)2017
Equity2017
Profit / (loss)
Consolidated equity attributable to owners of the company 1,007.3 (24.3) 1,149.6 (241.3)Impact adjustment deferred tax liabilities OCI USA Inc. - - (23.1) -Adjusted consolidated equity attributable to owners of the company 1,007.3 - 1,126.5 -Revaluation of subsidiaries 7,592.0 - 7,592.0 -
Difference gain on demerger (387.8) - (387.8) -
Difference in profit or loss 1,796.9 1,142.9 654.0 (2.7)Other comprehensive income (1,555.5) (339.9) (1,215.6) 855.5Other direct equity movements (including impact IFRS 9 adoption) 162.9 - 74.8 -Impairment subsidiaries (2,166.6) - (2,166.6) -Parent Company equity attributable to owners 6,449.2 778.7 5,677.3 611.5
The differences between total shareholders’ equity and total comprehensive income according to the consolidated financial statements and the parent company financial statements in general relate to the accounting of investments at cost (fair value as deemed cost upon adoption of IFRS) in the parent company financial statements and subsequent impairments.
The reconciling items for equity and income are further detailed below.
Reconciling item – Revaluation of subsidiaries The revaluation of subsidiaries of USD 7,592.0 million relates to the step up in fair value at the date of transition to IFRS, 1 January 2014. The revaluation reserve related to the deemed cost value step-up of the subsidiaries was subsequently converted into share capital and partly distributed as part of the demerger transaction of OCI’s E&C Bunsiness.
Reconciling item – Gain on demerger
In the 2015 parent company financial statements, the demerger gain of USD 243.0 million is lower compared to the demerger gain as reported in the consolidated financial statements of USD 630.8 million as the investment is stated at cost in the parent company financial statements versus the equity value in the consolidated financial statements.
Reconciling item – Difference in profit or loss The 2018 net result is USD 1,142.9 million higher in the parent company financial statements as the net profit for 2018 is USD 1,094.2 million, whereas the net loss attributable to owners of the company in the consolidated financial statements was USD 48.7 million.
The 2017 profit or loss are USD 2.7 million lower in the parent company financial statements as the net loss for 2017 is USD 106.3 million, whereas the net loss attributable to owners of the company in the consolidated financial statements was USD 103.6 million.
Reconciling item – Other comprehensive incomeThe reconciliation item ‘Other comprehensive income’ represents hedge and currency translation differences which are recognized in the consolidated financial statements but not in the parent company financial statements as the investments are stated at cost.
The 2018 difference in income of USD 339.9 million comprises USD 327.0 million of currency translation differences and USD 12.9 million of gains on cash flow hedges and financial asset at fair value through other comprehensive income, which do not occur in the parent company financial statements.
The 2017 difference in income of USD 855.5 million comprises USD 856.9 million of currency translation differences and USD 1.4 million of losses on cash flow hedges and financial asset at fair value through other comprehensive income, which do not occur in the parent company financial statements.
Reconciling item – Other direct equity movementsThe other direct equity movements in 2018 mainly relate to the effect of OCI Beaumont buy-back of minority shares net of taxes. In 2017 the other direct equity movements represent capital contributions in the minority shareholding of Sorfert, OCI Beaumont, Mepco and EFC, which are not included in the parent company financial statements.
45.2 Appropriation of net profit / (loss)
$ millions 2018 2017
Added to / (deducted from) retained earnings 1,094.2 (106.3)
Total net profit / (loss) attributable to shareholders 1,094.2 (106.3)
Upon adoption of this proposed net profit / (loss) appropriation, the dividend for the 2018 financial year will be nil. This proposed net profit / (loss) appropriation is in conformity with article 26 of the Company’s Articles of Association.
46. Loans and borrowings
$ millions 2018 2017
Senior notes 1,084.3 -
Convertible note - 403.5Term loan and revolving credit facility 877.8 671.1
Nile Holding - 372.7
Sub-total third-party 1,962.1 1,447.3
NNS Luxembourg - 48.1Sub-total related parties - 48.1
OCI Overseas Holding Ltd. 24.4 524.6OCI Nitrogen 44.1 529.4OCI Beaumont 5.0 -BioMCN - 8.4OCI USA - 1.8Sub-total subsidiaries 73.5 1,064.2
Total 2,035.6 2,559.6
Non-current 1,888.5 1,621.3Current 147.1 938.3At 31 December 2,035.6 2,559.6
Reference is made to note 18 ‘Loans and borrowings’ of the consolidated financial statements for detailed information on third-party loans and the undrawn bank facility.
The carrying amounts of loans and borrowings from subsidiaries approximates their fair values.
$ millions 2018 2017
Balance at 1 January 2,559.6 2,271.8Impact of IFRS 9 adoption 1.0 -Restated balance at 1 January 2,560.6 2,271.8Proceeds from borrowings 2,391.3 48.0
Proceeds from borrowings subsidiaries 402.7 39.6
Proceeds from borrowings subsidiaries in kind 4.1 7.3
Redemptions of borrowings (1,815.1) (56.6)Redemptions of borrowings subsidiaries (621.1) (23.3)Redemptions of borrowings subsidiaries in kind (768.5) (12.0)Newly incurred transaction costs (46.5) -Amortization of transaction costs / (bond) premiums 18.0 12.4Effect of movement in exchange rates (47.6) 198.6Accrued interest (42.3) 73.8At 31 December 2,035.6 2,559.6
Parent Company Financial Statements
Other Inform
ationP
erformance R
eviewO
perational Strengths
Corporate G
overnanceS
ustainability Review
Financial Statem
ents
178 OCI N.V. Annual Report 2018 OCI N.V. Annual Report 2018 179
NOTES TO THE PARENT COMPANY FINANCIAL STATEMENTS CONTINUED
46. Loans and borrowings (continued)
Net proceeds from borrowings third-partyProceeds from borrowings in 2018 for the Company totaled an amount of USD 2,391.3 million (2017: USD 48.0 million). Reference is made to note 18 of the consolidated financial statements.
Net proceeds in cash from borrowings from subsidiariesProceeds from borrowings from subsidiaries in 2018 includes proceeds of USD 402.7 million in cash, of which USD 277.5 million is from OCI USA LLC, USD 59.1 million from OCI Nitrogen B.V., USD 8.2 million from OCI Beaumont and USD 57.9 million from OCI Overseas Holding Ltd. Proceeds from borrowings from subsidiaries also include USD 4.1 million in kind settlements that relates to OCI USA LLC and OCI Overseas Holding.
The maturity dates of loans and borrowings from third-party and related party are as follows:
$ millions 2018 2017
2018 - 405.2
2019 73.7 -
2020 92.1 727.5
2021 110.6 372.7
2022 92.1 -
2023 1,629.7 -
Sub-total 1,998.2 1,505.4
Deducted transaction costs (36.1) (10.0)
Total 1,962.1 1,495.4
Specification of loans and borrowings from subsidiaries:
$ millions Type Interest %2018
Long-term2018
Short-term2017
Long-term2017
Short-term
OCI Overseas Holding Ltd. Unsecured LIBOR + 3.25 - 24.3 - 524.6OCI Nitrogen Unsecured EURIBOR + 4.20 - 44.2 529.4 -OCI Beaumont Unsecured LIBOR + 0.50 - 5.0 - -BioMCN Unsecured EURIBOR + 3.25 - - - 8.4OCI USA Unsecured LIBOR + 3.25 - - - 1.8Total - 73.5 529.4 534.8
47. Trade and other payables
$ millions 2018 2017
Payables due to subsidiaries 15.3 20.2
Payables due to related parties 3.0 2.5
Share-based compensation 0.8 2.0Accrued interest 31.7 2.5Other current liabilities 19.7 14.2Total 70.5 41.4Non-current 0.3 2.0
Current 70.2 39.4
Total 70.5 41.4
The carrying amount of ‘Trade and other payables’ approximates its fair value.
48. Revenue from dividend income
Revenue from dividend income in 2018 consists of USD 1,279.9 million from OCI Intermediate of which USD 75.3 million was in cash and USD 1,204.6 million was dividends in kind.
49. Development of general and administrative expenses
a. Expenses by nature
$ millions 2018 2017
Employee benefit expenses (b) 10.5 14.6Depreciation 0.2 0.2Consultancy expenses 17.5 7.6Other 5.3 6.5Total 33.5 28.9
The expenses by nature comprise ‘general and administrative expenses’.
b. Employee benefit expenses
$ millions 2018 2017
Wages and salaries 4.0 4.3Social securities 0.2 0.2Employee profit sharing 3.2 3.8Pension cost 0.5 0.2
Share-based compensation expense 3.0 5.3Other employee expenses (0.4) 0.8Total 10.5 14.6
For specifications on share-based payments, reference is made to note 21c of the notes to the consolidated financial statements.
50. Other income
$ millions 2018 2017
Holding recharges - 1.5
Other 0.1 -Total 0.1 1.5
51. Other expenses
$ millions 2018 2017
Other 17.9 8.7
Total 17.9 8.7
The increase in other expenses is mainly due to higher recharge of head office cost to OCI N.V.

Parent Company Financial Statements
Other Inform
ationP
erformance R
eviewO
perational Strengths
Corporate G
overnanceS
ustainability Review
Financial Statem
ents
180 OCI N.V. Annual Report 2018 OCI N.V. Annual Report 2018 181
NOTES TO THE PARENT COMPANY FINANCIAL STATEMENTS CONTINUED
52. Net finance cost
$ millions 2018 2017
Interest income on loans and receivables third-party 0.5 0.2Interest income on loans and receivables related parties 0.7 -Interest income on loans and receivables subsidiaries 18.3 83.6Foreign exchange gain 55.8 127.3Finance income 75.3 211.1Interest expense and other financing costs on financial liabilities measured at amortized cost third-party (136.8) (81.6)
Interest expense and other financing costs on financial liabilities measured at amortized cost related party (8.8) (0.1)
Interest expense and other financing costs on financial liabilities measured at amortized cost subsidiaries (14.3) (44.0)Foreign exchange loss (101.7) (223.6)Finance cost (261.6) (349.3)Net finance (cost) recognized in profit or loss (186.3) (138.2)
53. Income tax
$ millions 2018 2017
Current tax 29.4 38.0Deferred tax 22.5 (5.8)Total income tax in profit or loss 51.9 32.2
53.1 Income tax expense
Reconciliation of the statutory income tax rate in the Netherlands with the effective tax rate can be summarized as follows:
$ millions 2018 % 2017 %
Profit / (loss) before income tax 1,042.3 (138.5)Enacted income tax rate in the Netherlands 25% 25% Tax calculated at statutory tax rate (260.6) 25.0 34.6 (25.0)Expenses non-deductible (14.8) 1.4 (29.5) 21.3Income not subject to tax1 323.0 (31.0) 26.1 (18.8)Changes in estimates relating to prior years 4.3 (0.4) - -Other - - 1.0 (0.7)Total income tax in profit or loss 51.9 (5.0) 32.2 (23.2)
1 Income not subject to tax related to dividend income is USD 1,279.9 million.
53.2 Deferred income tax assets and liabilities
Changes in deferred tax assets and liabilities
$ millions 2018 2017
At 1 January (24.9) (16.4)Impact of IFRS 9 adoption 0.2 -Adjusted balance at 1 January (24.7) (16.4)Profit or loss 22.5 (5.8)Effect of movement in exchange rates 0.6 (2.7)At 31 December (1.6) (24.9)
Recognized deferred tax assets and liabilities
Assets Liabilities Net
$ millions 2018 2017 2018 2017 2018 2017
Trade and other receivables - - - (11.8) - (11.8)Loans and borrowings - - (0.6) (1.6) (0.6) (1.6)Trade and other payables - - (1.0) (11.5) (1.0) (11.5)Total - - (1.6) (24.9) (1.6) (24.9)
Of the deferred tax liabilities at 31 December 2018, an amount of USD 0.6 million is to be settled within 12 months and an amount of USD 1.0 million after 12 months.
54. Related party balances
For an overview of the related parties, reference is made to note 30 of the consolidated financial statements. The Company has the following current account related party balances as at 31 December 2018:
Related party Relation
Revenue transactions
during the year
AR outstanding at year end
Purchase transactions
during the year
AP outstanding at year end
Loans receivables
Loans payables
Interest income
Interest expense
and other financing charges
Orascom Construction PLC (‘OC’)
OC group company - 3.5 - 1.0 - - - -
Contrack InternationalOC group company - - - 0.3 - - - -
OCI Construction CyprusOC group company - - - 0.8 - - - -
Nassef Sawiris CEO - - 1.4 0.3 - - - -
NatgasolineRelated via an
associate - - - - - - 0.7 -
NNS Luxembourg SarlRelated via
shareholder - - 0.2 0.6 - - - 8.8
Total - 3.5 1.6 3.0 - - 0.7 8.8
The Company has the following current account related party balances as at 31 December 2017:
Related party Relation
Revenue transactions
during the year
AR outstanding at year end
Purchase transactions
during the year
AP outstanding at year end
Loans receivables
Loans payables
Interest income
Interest expense
Orascom Construction PLC (‘OC’)
OC group company - 3.6 1.0 1.0 - - - -
Contrack InternationalOC group company - - 0.3 0.3 - - - -
OCI Construction CyprusOC group company - - - 0.8 - - - -
Nassef Sawiris CEO - - 1.9 0.4 - - - -
NatgasolineRelated via an
associate - - - - - - - -
NNS Luxembourg SarlRelated via
shareholder - - 0.2 0.4 - 48.1 - 0.1
Total - 3.6 3.4 2.9 - 48.1 - 0.1
The current accounts consist of management fees, transferred cost and other.
All outstanding related party balances are unsecured.

Parent Company Financial Statements
Other Inform
ationP
erformance R
eviewO
perational Strengths
Corporate G
overnanceS
ustainability Review
Financial Statem
ents
182 OCI N.V. Annual Report 2018 OCI N.V. Annual Report 2018 183
NOTES TO THE PARENT COMPANY FINANCIAL STATEMENTS CONTINUED
55. Contingencies
GuaranteesOCI has provided financial guarantees to certain subsidiaries including EFC related to its International Finance Corporation (‘IFC’) bank loan. For OFT, OFTS and OCI S.A.E. a comfort letter was provided by OCI.
In June 2018, OCI N.V. entered into a new guarantee facility with Rabobank for a maximum guarantee amount of USD 171.4 million (EUR 150 million). Under this guarantee facility, USD 125.3 million (EUR 109.6 million) has been drawn. The facility is used to issue guarantees on behalf of the subsidiaries, mainly for operational purposes.
56. Operating lease commitments
OCI N.V. leases office space and vehicles under operating leases. The office space leases typically run for a period of 7 years, with an option to renew the lease after that date. Lease payments are indexed annually.
(i) Future minimum lease payments
$ millions 2018 2017
Less than one year 0.5 0.6Between one and five years 1.1 1.9More than five years - -Total 1.6 2.5
(ii) Amount recognized in profit or loss
$ millions 2018 2017
Lease expense 0.6 0.7Total 0.6 0.7
Operating lease expense is recognized in ‘Selling, general and administrative expenses’.
57. Employees
The total number of employees in 2018 was 25 (2017: 26 employees).
58. Fiscal unity
OCI N.V. forms a fiscal unity with several Dutch entities for corporation tax purposes. In accordance with the standard conditions, a company and its subsidiaries that form the fiscal unity are jointly and severally liable for taxation payable by the fiscal unity. The following entities are included in the fiscal unity headed by OCI N.V.:
· OCI N.V.
· OCI Intermediate B.V.
· OCI Nitrogen B.V.
· OCI Personnel B.V.
· OCI Terminal Europoort B.V.
· OCI Fertilizers B.V.
· OCI China Holding B.V.
Amsterdam, the Netherlands, 15 March 2019
The OCI N.V. Board of DirectorsMichael Bennett, Chairman
Nassef Sawiris
Hassan Badrawi
Jan Ter Wisch
Sipko Schat
Jérôme Guiraud
Robert Jan van de Kraats
Greg Heckman
Anja Montijn
Extract from the Articles of Association relating to Net Profit / (Loss) appropriationArticle 26. ‘Profits and Distributions’.
26.1 The Board may decide that the profits realized during a financial year will fully or partially be appropriated to increase and/or from reserves.
26.2 The profits remaining after application of Article 26.1 shall be put at the disposal of the General Meeting. The Board shall make a proposal for that purpose. A proposal to pay a dividend shall be dealt with as a separate agenda item at the General Meeting of Shareholders.
26.3 Distributions from the Company’s distributable reserves are made pursuant to a resolution of the General Meeting at the proposal of the Board.
26.4 Provided it appears from an interim statement of assets signed by the Board that the requirement mentioned in Article 26.8 concerning the position of the Company’s assets has been fulfilled, the Board may make one or more interim distributions to the holders of Shares.
26.5 The Board may decide that a distribution on Shares shall not take place as a cash payment but as a payment in Shares, or decide that holders of Shares shall have the option to receive a distribution as a cash payment and / or as a payment in Shares, out of the profit and / or at the expense of reserves, provided that the Board is designated by the General Meeting pursuant to Articles 6.2. The Board shall determine the conditions applicable to the aforementioned choices.
26.6 The Company’s policy on reserves and dividends shall be determined and can be amended by the Board. The adoption and thereafter each amendment of the policy on reserves and dividends shall be discussed and accounted for at the General Meeting of Shareholders under a separate agenda item.
26.7 The Company may further have a policy with respect to profit participation for employees which policy will be established by the Board.
26.8 Distributions may be made only insofar as the Company’s equity exceeds the amount of the paid in and called up part of the issued capital, increased by the reserves which must be kept by virtue of the law or these Articles of Association.
OTHER INFORMATION
Other Information
184 OCI N.V. Annual Report 2018 OCI N.V. Annual Report 2018 185
Other Info
rmatio
nP
erformance R
eviewO
perational Strengths
Corporate G
overnanceS
ustainability Review
Financial Statem
ents
To: the General Meeting of Shareholders and the Board of Directors of OCI N.V.
Report on the audit of the 2018 financial statements included in the annual report
Our opinionIn our opinion the accompanying financial statements give a true and fair view of the financial position of OCI N.V. as at 31 December 2018 and of its result and its cash flows for the year then ended, in accordance with International Financial Reporting Standards as adopted by the European Union (EU-IFRS) and with Part 9 of Book 2 of the Dutch Civil Code.
What we have auditedWe have audited the 2018 financial statements of OCI N.V. (hereafter: the Company) based in Amsterdam, the Netherlands. The financial statements comprise of: 1 the consolidated and parent company statement of financial position as at 31 December 2018;2 the following consolidated and parent company statements for 2018: the statement of profit or loss and other comprehensive
income, changes in equity and cash flows; and3 the notes comprising a summary of the significant accounting policies and other explanatory information.
Basis for our opinionWe conducted our audit in accordance with Dutch law, including the Dutch Standards on Auditing. Our responsibilities under those standards are further described in the ‘Our responsibilities for the audit of the financial statements’ section of our report.We are independent of the Company in accordance with the EU Regulation on specific requirements regarding statutory audits of public-interest entities, the ‘Wet toezicht accountantsorganisaties’ (Wta, Audit firms supervision act), the ‘Verordening inzake de onafhankelijkheid van accountants bij assurance-opdrachten’ (ViO, Code of Ethics for Professional Accountants, a regulation with respect to independence) and other relevant independence regulations in the Netherlands. Furthermore, we have complied with the ‘Verordening gedrags- en beroepsregels accountants’ (VGBA, Dutch Code of Ethics). We believe the audit evidence we have obtained is sufficient and appropriate to provide a basis for our opinion.
INDEPENDENT AUDITOR’S REPORT
Audit approach
Summary
Materiality
– Materiality of USD 24 million for the consolidated financial statements– Materiality of USD 60 million for the parent company financial statements
Group audit (audit scope coverage)
– 99% of total assets– 97% of revenue
Key audit matter
– Accounting for the debt refinancing & securitization program– Valuation of goodwill of CGU Egyptian Fertilizer Company
Opinion
Unqualified opinion
MaterialityBased on our professional judgment we determined the materiality for the consolidated financial statements as a whole at USD 24 million (2017: USD 12 million). The materiality is determined with reference to the consolidated revenues, of which it represents 0.7% (2017: 0.5%). We consider this as the most appropriate benchmark as the Company is result oriented and because reported revenues are more stable compared to other relevant benchmarks, such as profit before tax from continuing operations.We determined a separate materiality for our audit of the parent company financial statements. Based on our professional judgment we determined the materiality for the parent company financial statements at USD 60 million (2017: USD 55 million) using total assets as a benchmark, of which it represents 0.7% (2017: 0.7%). Given the nature of the parent company’s activities – the holding and financing of investments within the Company – we consider the use of the total asset benchmark as most appropriate.We have also taken into account misstatements and/or possible misstatements that in our opinion are material for the users of the financial statements for qualitative reasons.We agreed with the Board of Directors that misstatements in excess of USD 1 million which are identified during the audit, will be reported to them, as well as smaller misstatements that in our view must be reported on qualitative grounds.
Other Information
186 OCI N.V. Annual Report 2018 OCI N.V. Annual Report 2018 187
Other Info
rmatio
nP
erformance R
eviewO
perational Strengths
Corporate G
overnanceS
ustainability Review
Financial Statem
ents
INDEPENDENT AUDITOR’S REPORT CONTINUED
Audit scope in relation to fraud and non-compliance with laws and regulationsIn accordance with the Dutch Standards on Auditing we are responsible for obtaining reasonable assurance that the financial statements taken as a whole are free from material misstatement, whether caused by fraud or error. In determining the audit procedures we will make use of the evaluation of management in relation to fraud risk management (prevention, detection and response), including ethical standards to create a culture of honesty.In our process of identifying fraud risks we assessed fraud risk factors, which we discussed with the Board of Directors. Fraud risk factors are events or conditions that indicate an incentive or pressure to commit fraud or provide an opportunity to commit fraud. We also assessed factors related to the risk of non-compliance with laws and regulations which could have a direct or indirect impact on the financial statements, but our assessment did not reveal a specific risk.Based on the auditing standards we addressed the following presumed fraud risks that were relevant to our audit: – fraud risk in relation to the revenue recognition during the cut-off period– fraud risk in relation to management override of controls Our audit procedures included an evaluation of the internal controls relevant to mitigate the identified fraud risks and supplementary substantive audit procedures, including detailed testing of relevant sales transactions close to period-end with supporting documentation such as invoices and delivery notes. Furthermore, we performed detailed testing of journal entries meeting the criteria for selection based on unusual entries. In addition, data analytics are part of our audit approach to address fraud risks which could have a material impact on the financial statements. This also relates to audit procedures carried out to address the risk of management override of controls.Furthermore, we identified and addressed the following other fraud risk which could have a material impact on the financial statements: – overstating the capitalization of expenses during the commissioning phase of a new plant taken into operations during the
financial year Our audit procedures included an evaluation of the internal controls relevant to mitigate this risk and supplementary substantive audit procedures, including detailed testing of asset capitalization during the commissioning phase with documentation supporting the meeting of the capitalization criteria.Our audit procedures differ from a specific forensic fraud investigation, which investigation often has a more in-depth character. Our procedures to address fraud risks did not result in findings to be included in this audit report.
Scope of the group auditOCI N.V. is at the head of a group of components. The financial information of this group is included in the financial statements of OCI N.V.We requested 12 component auditors (2017: 11 component auditors) to perform a full scope audit of the financial information of the related component (audit of complete reporting package). In setting our selection we used both the relative size of the component and the likelihood for the component to include a significant risk. Furthermore, we requested two component auditors to perform specified audit procedures over the component’s tax positions and the component’s bank balances. One component auditor performed an audit of specific items. This resulted into an audit coverage of 99% of consolidated total assets (2017: 98%) and 97% of consolidated revenues (2017: 96%). We have:– performed audit procedures ourselves at group level in respect of areas such as the annual goodwill impairment test;– used the work of KPMG auditors and non-KPMG auditors who audited complete reporting packages or specific items or
performing specified audit procedures at component level, and;– performed an audit ourselves on the parent company financial statements.The group audit team provided detailed instructions to all component auditors as part of the group audit, covering the significant audit areas, including the relevant risks of material misstatement identified by us, and set out the information required to be reported back to the group audit team. The group audit team visited component auditors in Algeria, Egypt and the United States of America and performed file reviews for components in Algeria and the United States of America. Telephone conferences were held with all the component auditors that were part of the group audit. During these visits and telephone conferences, the planning, audit approach, findings and observations reported to the group audit team were assessed and discussed. Any further work deemed necessary was subsequently performed by the component auditors and assessed by us.By performing the procedures mentioned above at components, together with additional procedures at group level, we have been able to obtain sufficient and appropriate audit evidence about the group’s financial information to provide an opinion on the consolidated financial statements.Our procedures as described above can be summarized as follows:
98%Audit of the complete
reporting package
1%Audit of specific items and specified audit procedures
Total assets
93%Audit of the complete
reporting package
4%Audit of specific items and specified audit procedures
Revenue

Other Information
188 OCI N.V. Annual Report 2018 OCI N.V. Annual Report 2018 189
Other Info
rmatio
nP
erformance R
eviewO
perational Strengths
Corporate G
overnanceS
ustainability Review
Financial Statem
ents
INDEPENDENT AUDITOR’S REPORT CONTINUED
Valuation of goodwill of CGU Egyptian Fertilizers Company
DescriptionOCI N.V. carries a significant amount of goodwill in the balance sheet (USD 484 million as per 31 December 2018). Under EU-IFRS, the Company is required to test the amount of goodwill for impairment at least annually.
A significant part of the goodwill relates to the cash generating unit (‘CGU’) EFC (Egyptian Fertilizers Company) amounting to USD 440 million. The CGU EFC impairment test was significant to our audit due to the complexity of the assessments made and judgments and assumptions involved which are affected by expected future market and economic developments.
Our responseOur audit procedures included, among other things, the involvement of a valuation specialist to assist us in evaluating the significant assumptions, in particular the terminal growth and pre-tax discount rates, and the valuation methodology used by the Company. We furthermore assessed the appropriateness of other data used by comparing them to external and historical data, such as external market growth expectations, commodity prices and plant efficiency and by analysing sensitivities in the Company’s valuation model. We focused on the sensitivity in the available headroom for CGU EFC, evaluating whether a reasonably possible change in assumptions could cause the carrying amount to exceed its recoverable amount and assessed the historical accuracy of management’s estimates. Furthermore, we assessed the adequacy of the disclosure (note 8) to the financial statements.
Our observationWe consider management’s key assumptions and estimates applied in the impairment test of CGU EFC to be within the acceptable range and we assessed the disclosure (note 8) to the consolidated financial statements as being appropriate.
Report on the other information included in the annual report In addition to the financial statements and our auditor’s report thereon, the annual report contains other information that consists of:– the Board of Directors’ report, including reports on performance review, operational strengths, sustainability review and
corporate governance; – the other information pursuant to Part 9 of Book 2 of the Dutch Civil Code.Based on the following procedures performed, we conclude that the other information:– is consistent with the financial statements and does not contain material misstatements; and– contains the information as required by Part 9 of Book 2 of the Dutch Civil Code.We have read the other information. Based on our knowledge and understanding obtained through our audit of the financial statements or otherwise, we have considered whether the other information contains material misstatements. By performing these procedures, we comply with the requirements of Part 9 of Book 2 of the Dutch Civil Code and the Dutch Standard 720. The scope of the procedures performed is substantially less than the scope of those performed in our audit of the financial statements. The Board of Directors of OCI N.V. is responsible for the preparation of the other information, including the Board of Directors’ report in accordance with Part 9 of Book 2 of the Dutch Civil Code and the other information pursuant to Part 9 of Book 2 of the Dutch Civil Code.
Our key audit mattersKey audit matters are those matters that, in our professional judgment, were of most significance in our audit of the financial statements. We have communicated the key audit matters to the Board of Directors. The key audit matters are not a comprehensive reflection of all matters discussed.These matters were addressed in the context of our audit of the financial statements as a whole and in forming our opinion thereon, and we do not provide a separate opinion on these matters.Group liquidity risk is no longer a key audit matter due to the increase in revenues and operating cash flows during 2018. Furthermore, the debt repayment terms have been extended as a consequence of the debt refinancing activities with updated debt covenants in favor to the Company.
Accounting for the debt refinancing & securitization program
DescriptionOCI N.V. executed significant debt and working capital restructuring programs in 2018 to optimize finance costs, extend debt maturities and strengthen the Company’s liquidity position. As part of this program several loans of a total value of approximately USD 3.2 billion have been renewed as disclosed in note 6.2.2 and note 18 to the consolidated financial statements. Furthermore, as disclosed in note 9 to the consolidated financial statements a new group securitization program was set up to optimize working capital. Such contracts were evaluated under the new financial instruments standard, IFRS 9. Due to the significance of this transaction and the complexity related to the application of a new standard, we pay special attention to the accounting of the debt refinancing & securitization program during our audit.
Our responseOur audit procedures included, among other things, the involvement of a financial instruments’ specialist to assist us in the evaluation of the Company’s accounting treatment for the debt modifications or extinguishments and the accounting treatment for the new securitization program. We reconciled the underlying information referred to in the Company’s accounting assessments to loan agreements, invoices, bank statements and bank confirmations. We performed independent evaluations to challenge management’s calculations and assessments. We attended meetings and calls with specialists engaged by the Company to discuss the scope and work performed by such specialists. We further assessed the adequacy of the notes in the consolidated financial statements, describing the refinancing activities and accounting treatment (note 6.2.2), the securitization agreement (note 9), the loans and borrowings (note 18) and the impact of the first-time adoption of IFRS 9 (note 4.1).
Our observationThe results of our procedures performed on the accounting treatment of the refinancing activities and securitization program were satisfactory and we assessed related financial statement disclosures (notes 4.1, 6.2.2, 9 and 18) to the consolidated financial statements as appropriate.

Other Information
190 OCI N.V. Annual Report 2018 OCI N.V. Annual Report 2018 191
Other Info
rmatio
nP
erformance R
eviewO
perational Strengths
Corporate G
overnanceS
ustainability Review
Financial Statem
ents
INDEPENDENT AUDITOR’S REPORT CONTINUED
Report on other legal and regulatory requirements
EngagementOn 24 May 2018, we were reappointed by the General Meeting of Shareholders as auditor of OCI N.V. for the financial year 2018. Our first appointment as statutory auditor of the Company was in 2013 to audit the 2013 financial statements.
No prohibited non-audit services We have not provided prohibited non-audit services as referred to in Article 5(1) of the EU Regulation on specific requirements regarding statutory audits of public-interest entities.
Description of responsibilities regarding the financial statements
Responsibilities of the Board of Directors for the financial statementsThe Board of Directors is responsible for the preparation and fair presentation of the financial statements in accordance with EU-IFRS and Part 9 of Book 2 of the Dutch Civil Code. Furthermore, the Board of Directors is responsible for such internal control as management determines is necessary to enable the preparation of the financial statements that are free from material misstatement, whether due to fraud or error.As part of the preparation of the financial statements, the Board of Directors is responsible for assessing the Company’s ability to continue as a going concern. Based on the financial reporting frameworks mentioned, the Board of Directors should prepare the financial statements using the going concern basis of accounting unless the Board of Directors either intends to liquidate the Company or to cease operations, or has no realistic alternative but to do so. The Board of Directors should disclose events and circumstances that may cast significant doubt on the Company’s ability to continue as a going concern in the financial statements. Our responsibilities for the audit of the financial statementsOur objective is to plan and perform the audit engagement in a manner that allows us to obtain sufficient and appropriate audit evidence for our opinion. Our audit has been performed with a high, but not absolute, level of assurance, which means we may not detect all material errors and fraud during our audit.Misstatements can arise from fraud or error and are considered material if, individually or in the aggregate, they could reasonably be expected to influence the economic decisions of users taken on the basis of these financial statements. The materiality affects the nature, timing and extent of our audit procedures and the evaluation of the effect of identified misstatements on our opinion. We have exercised professional judgment and have maintained professional scepticism throughout the audit, in accordance with Dutch Standards on Auditing, ethical requirements and independence requirements. Our audit included among other things:– identifying and assessing the risks of material misstatement of the financial statements, whether due to fraud or error,
designing and performing audit procedures responsive to those risks, and obtaining audit evidence that is sufficient and appropriate to provide a basis for our opinion. The risk of not detecting a material misstatement resulting from fraud is higher than the risk resulting from error, as fraud may involve collusion, forgery, intentional omissions, misrepresentations, or the override of internal control;
– obtaining an understanding of internal control relevant to the audit in order to design audit procedures that are appropriate in the circumstances, but not for the purpose of expressing an opinion on the effectiveness of OCI N.V.’s internal control;
– evaluating the appropriateness of accounting policies used and the reasonableness of accounting estimates and related disclosures made by OCI N.V.;
– concluding on the appropriateness of OCI N.V.’s use of the going concern basis of accounting, and based on the audit evidence obtained, whether a material uncertainty exists related to events or conditions that may cast significant doubt on OCI N.V.’s ability to continue as a going concern. If we conclude that a material uncertainty exists, we are required to draw attention in our auditor’s report to the related disclosures in the financial statements or, if such disclosures are inadequate, to modify our opinion. Our conclusions are based on the audit evidence obtained up to the date of our auditor’s report. However, future events or conditions may cause a company to cease to continue as a going concern;
– evaluating the overall presentation, structure and content of the financial statements, including the disclosures; and– evaluating whether the financial statements represent the underlying transactions and events in a manner that achieves fair
presentation.Because we are ultimately responsible for the opinion, we are also responsible for directing, supervising and performing the group audit. In this respect we have determined the nature and extent of the audit procedures to be carried out for group components. Decisive were the size and/or the risk profile of the group components or operations. On this basis, we selected group components for which an audit or review had to be carried out on the complete set of financial information or specific items. We communicate with the Board of Directors regarding, among other matters, the planned scope and timing of the audit and significant audit findings, including any significant findings in internal control that we identify during our audit. In this respect we also submit an additional report to the audit committee in accordance with Article 11 of the EU Regulation on specific requirements regarding statutory audits of public-interest entities. The information included in this additional report is consistent with our audit opinion in this auditor’s report.We provide the Board of Directors with a statement that we have complied with relevant ethical requirements regarding independence, and to communicate with them all relationships and other matters that may reasonably be thought to bear on our independence, and where applicable, related safeguards.From the matters communicated with the Board of Directors, we determine the key audit matters: those matters that were of most significance in the audit of the financial statements. We describe these matters in our auditor’s report unless law or regulation precludes public disclosure about the matter or when, in extremely rare circumstances, not communicating the matter is in the public interest.
Amstelveen, 15 March 2019 KPMG Accountants N.V.M. Meester RA
Other Information
192 OCI N.V. Annual Report 2018 OCI N.V. Annual Report 2018 193
Other Info
rmatio
nP
erformance R
eviewO
perational Strengths
Corporate G
overnanceS
ustainability Review
Financial Statem
ents
Share listingOCI N.V.’s shares have been listed on the Euronext in Amsterdam as of 25 January 2013.
Number of outstanding ordinary shares as at 31 December 2018
210,306,101
Highest share price (EUR/share) 29.24
Average share price (EUR/share) 22.83
Lowest share price (EUR/share) 16.975
Share price at 31 December 2018 (EUR/share) 17.81
Market capitalization at 31 December 2018 (EUR billion) 3.75
Share capitalAll of the Company’s issued shares are ordinary shares with authorized par value of 0.02 Euros. The number of paid-up ordinary shares outstanding is disclosed in note 15 of the financial statements.
Dividend policyOCI has a flexible dividend policy designed to balance the availability of funds for dividend distribution with pursuing growth opportunities that generate attractive returns. Over the past few years, OCI has pursued two large greenfield projects in the US, which required high capital expenditure. Accordingly, the Board of Directors has not announced a dividend for FY 2018.
Investor relationsOCI N.V. places great importance on maintaining active dialogue with existing and potential shareholders, banks, and analysts.
OCI N.V. is committed to providing relevant, high-quality and timely information to all stakeholders, and to giving current and potential shareholders, analysts and financial press broader insight into the Company and the industries in which we operate.
To this end, OCI N.V. strives to ensure that relevant information is provided equally and simultaneously to all interested parties. As per the Company’s by-laws, OCI N.V. observes a ‘black-out’ period during which analysts’ meetings and presentations to and/or direct discussions with current or potential shareholders do not take place shortly before the publication of the regular financial information.
Contact UsThis annual report is available online at www.oci.nl
OCI N.V.Honthorststraat 19 1071 DC Amsterdam The Netherlands
Investor relations contact
Hans Zayed Investor Relations Director E-mail: [email protected]
Tel: (+31) 20 723 45 00
Corporate & ESG contact
Erika Wakid
Corporate Development Director
E-mail: [email protected]
Tel: (+44) 020 7297 8820
OCI N.V. stock symbols: OCI / OCI.NA / OCI.AS
SHAREHOLDER INFORMATION GLOBAL REPORTING INITIATIVE INDEX
GRI Indicator GRI Standard Title Response Location
Organizational profile
GRI 102-1 Name of the organization About OCI
GRI 102-2 Activities, brands, products, and services
Our Business
GRI 102-3 Location of headquarters About OCI
GRI 102-4 Location of operations Our Business
GRI 102-5 Ownership and legal form About OCI
GRI 102-6 Markets served Our Business
GRI 102-7 Scale of the organization Our Business
GRI 102-8 Information on employees and other workers
Sustainability Report - Our Employees
GRI 102-9 Supply chain Sustainability Report - Responsible Supply Chain
GRI 102-10 Significant changes to the organization and its supply chain
Letter to Shareholders, Sustainability Report - Responsible Supply Chain
GRI 102-11 Precautionary Principle or approach
We support the Precautionary Principle by working to reduce our environmental impact. We therefore aim to minimize our energy consumption and environmental footprint while producing high quality fertilizers that allow farmers to sustainably optimize yields.
GRI 102-12 External initiatives UN SDGs, GRI
GRI 102-13 Membership of associations Sustainability Report - Our Commitment
GRI 102-14 Statement from senior decision-maker
Letter to Shareholders
GRI 102-16 Values, principles, standards, and norms of behavior
Our Business
GRI 102-18 Governance structure Corporate Governance
GRI 102-40 List of stakeholder groups Our key stakeholders include our employees, customers, investors, and communities.
GRI 102-41 Collective bargaining agreements
Sustainability Report - Our Employees
GRI 102-42 Identifying and selecting stakeholders
We strive to maintain an open dialogue with our stakeholders to ensure our strategy, activities, and policies are implemented responsibly, and aim to nurture our stakeholders’ trust in OCI through our interactions. Our stakeholders are individuals or entities that have a link to or an interest in our activities
GRI 102-43 Approach to stakeholder engagement
We engage with stakeholders on a regular basis through customer and investor meetings and calls, industry and investor conferences, customer service, employee meetings, surveys, portals and hotlines, community outreach programs, and governmental or regulatory interactions.
In addition to our direct stakeholder interactions, we are an active member of several industry associations where we work with our peers to sustainably improve global standards in our industries and engage in dialogue on key global challenges related to our industries.
Other Information
194 OCI N.V. Annual Report 2018 OCI N.V. Annual Report 2018 195
Other Info
rmatio
nP
erformance R
eviewO
perational Strengths
Corporate G
overnanceS
ustainability Review
Financial Statem
ents
GLOBAL REPORTING INITIATIVE INDEXCONTINUED
Organizational profile
GRI 102-44 Key topics and concerns raised During the year, no significant concerns were raised by our stakeholders, and corporate questions were addressed at the Annual General Meeting or on our quarterly results conference calls.
GRI 102-45 Entities included in the consolidated financial statements
Note 34 of the financial statements
GRI 102-46 Defining report content and topic Boundaries
We determine material topics and boundaries by engaging with key stakeholders, benchmarking against industry peers, and considering disclosure requirements and guidelines issues by various institutions and regulatory bodies.
We assess the topics raised by the various interactions we have with stakeholders by considering both its impact on OCI, and its influence on our stakeholders. We evaluate the impact these material topics have on our global value chain, our local operations and our stakeholders to report a holistic view of how we strive to sustainably manage our business. Our assessment criteria also considered the GRI’s materiality principles of sustainability context, materiality, completeness, and stakeholder inclusiveness.
GRI 102-47 List of material topics Through these interactions and assessments, we have identified our key material issues and boundaries to be:
• Occupational health and safety• Environmental impact and climate change • Energy efficiency• Local economic development• Food security through nutrient stewardship• Employee development• Ethics and integrity• Stakeholder engagement
GRI 102-48 Restatements of information Any exceptions, restatements, or changes to data reported are noted where applicable. We incorrectly stated 2017 spending on employee training in our 2017 annual report. This has been corrected on page 60.
GRI 102-49 Changes in reporting Any exceptions, restatements, or changes to data reported are noted where applicable. There are no such changes in this report.
GRI 102-50 Reporting period Year ended 31 December 2018
GRI 102-51 Date of most recent report 2017
GRI 102-52 Reporting cycle Annual
GRI 102-53 Contact point for questions regarding the report
GRI 102-54 Claims of reporting in accordance with the GRI Standards
This report has been prepared in accordance with the GRI Standards: Core Option
GRI 102-55 GRI content index Global Reporting Initiative Index
GRI 102-56 External assurance None
Economic
201-1 Direct economic value generated and distributed
Our Communities - Economic value generated and distributed by OCI in 2018
Energy
302-1 Energy consumption within the organization
Our Environment - Minimizing our Environmental Footprint
302-3 Energy intensity Our Environment - Minimizing our Environmental Footprint
Emissions
305-1 Direct (Scope 1) GHG emissions Our Environment - Minimizing our Environmental Footprint
305-2 Energy indirect (Scope 2) GHG emissions
Our Environment - Minimizing our Environmental Footprint
305-3 Other indirect (Scope 3) GHG emissions
Our Environment - Minimizing our Environmental Footprint
305-4 GHG emissions intensity Our Environment - Minimizing our Environmental Footprint
Environmental compliance
307-1 Non-compliance with environmental laws and regulations
OCI has complied with applicable environmental laws and regulations
Water
303-1 Water withdrawal by source Our Environment - Conscientious Water Management
Employment
401-1 New employee hires and employee turnover
Our Employees
401-2 Benefits provided to full-time employees that are not provided to temporary or part-time employees
Our Employees. In addition, please refer to financial benefits as described in our financial statements. Our part-time employees receive benefits commensurate to hours worked.
Occupational health and safety
403-2 Types of injury and rates of injury, occupational diseases, lost days, and absenteeism, and number of work-related fatalities
Health and Safety
Training and Education
404-1 Average hours of training per year per employee
Our Employees
404-2 Programs for upgrading employee skills and transition assistance programs
Our Employees