78
ANNUAL REPORT 2018
ANNUAL REPORT 2018
2 ANNUAL REPORT 2018
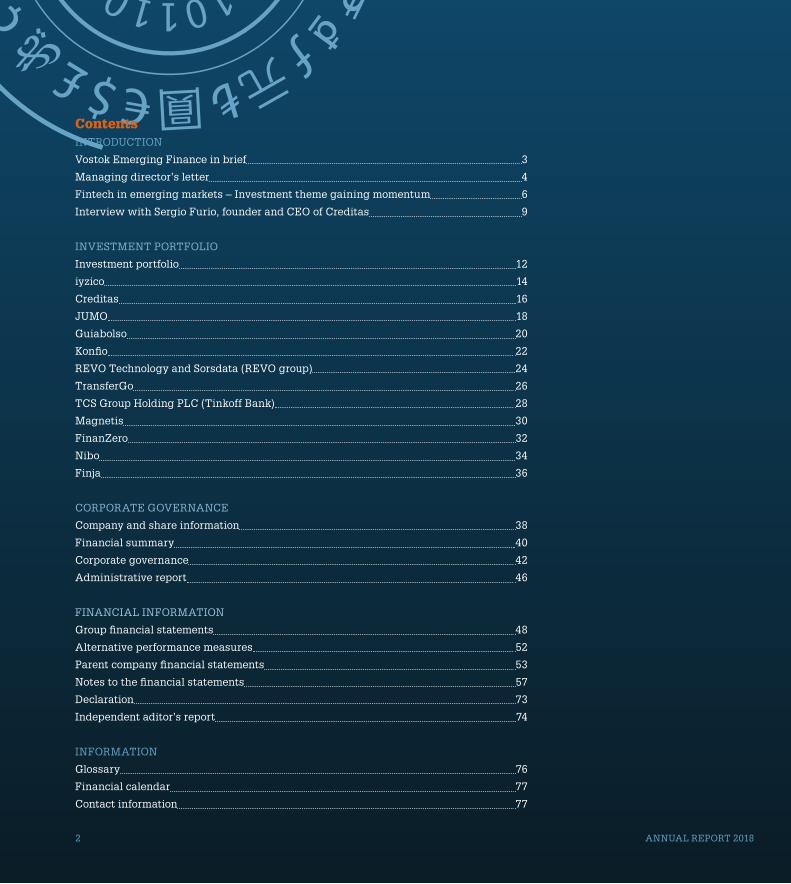
ContentsINTRODUCTION
Vostok Emerging Finance in brief 3
Managing director’s letter 4
Fintech in emerging markets – Investment theme gaining momentum 6
Interview with Sergio Furio, founder and CEO of Creditas 9
INVESTMENT PORTFOLIO
Investment portfolio 12
iyzico 14
Creditas 16
JUMO 18
Guiabolso 20
Konfio 22
REVO Technology and Sorsdata (REVO group) 24
TransferGo 26
TCS Group Holding PLC (Tinkoff Bank) 28
Magnetis 30
FinanZero 32
Nibo 34
Finja 36
CORPORATE GOVERNANCE
Company and share information 38
Financial summary 40
Corporate governance 42
Administrative report 46
FINANCIAL INFORMATION
Group financial statements 48
Alternative performance measures 52
Parent company financial statements 53
Notes to the financial statements 57
Declaration 73
Independent aditor’s report 74
INFORMATION
Glossary 76
Financial calendar 77
Contact information 77

ANNUAL REPORT 2018 3
> Read more on page 26.
> Read more on page 18.
> Read more on page 28.
> Read more on page 20.
> Read more on page 30. > Read more on page 16.
> Read more on page 32.> Read more on page 34.
> Read more on page 24.
Vostok Emerging Finance Ltd (“VEF” or the “Company”) is a listed Swedish investment company that invests in growth stage private fintech companies. We take minority stakes and are active investors with board representation in each of our 11 portfolio companies, always looking to back the best entrepreneurs in the markets we are in. We focus on scale emerging markets and invest across all areas of financial services inclusive of payments, credit, mobile money and wealth advisors.
> Read more on page 14.
> Read more on page 36.> Read more on page 22.
Feb 2019Tinkoff exit
Apr 2017Nibo
Sep 2017Magnetis
Oct 2017Guiabolso
Dec 2017Creditas
Jan 2017iyzico
Dec 20166 portfolio companies
June 2016TransferGo
Aug 2016Finja
July 2015Listed on Nasdaq First North Sweden
May–June 2015Incorporated and Spin off from Vostok New Ventures with Tinkoff Bank
Sep 2015First investment in REVO/Sorsdata
Dec 2015Fund raising USD 69 mln
Dec 2015JUMO
Mar 2016FinanZero
Jun 2018Konfio
Dec 201812 portfolio companies
Vostok Emerging Finance in brief
Dec 201711 portfolio companies
4 ANNUAL REPORT 2018
INT
RO
DU
CT
ION
INV
EST
ME
NT
PO
RT
FO
LIO
CO
RP
OR
AT
E G
OV
ER
NA
NC
EF
INA
NC
IAL
IN
FO
RM
AT
ION
INF
OR
MA
TIO
N
Dear fellow shareholder,As is traditional, in our annual investor letter, we look back on 2018, key actions and learnings, as well as our outlook for 2019 and current thinking and positioning. In summary, while 2018 was a transition year in terms of our net asset value (NAV) evo-lution, following the strong growth delivered through 2016–17, the ground work and positioning for a very exciting 2019 for VEF were firmly laid. The recent exit from TCS Group Holding PLC (“Tinkoff Bank”) was a key milestone and puts us in as strong a capital position as we have ever been, but with much more experience and options through which to deploy this cap-ital in a shareholder value accretive way. Within the portfolio, Creditas and iyzico stepped up as VEF size portfolio standout names, while it is always a joy to see a new portfolio company, Konfio, hit the ground running in 2018.
Reflecting on 2018From a top-down perspective, 2018 was a very different year to 2017 as we moved from a uniformly positive macro, political and markets tailwind into one of the most volatile years, on all fronts, in recent history. For VEF and its portfolio companies this mainly manifested itself through periodic confidence-sapping election windows and weaker/volatile local currencies across the board.
With just three fairly benign macro years behind the company (although a much longer cycle hardened careers at team level before this), it was great to see how our portfolio companies reacted, or to be clear, didn’t react, to the top down noise. We always work off the thesis that we are investing in structural growth stories, which are not immune to the short-term macro, but should grow through the cycle as individuals and companies continuously shift their financial services custom to fintech. When we look at our portfo-lio companies’ key metrics growth ranging from 50–200% YoY in 2018, and north of that in some of the earlier stage cases, our port-folio has shown much macro resilience to date.
Furthermore, 2018 was a year where we only made one new investment. This follows five investments in 2017 and three in 2016. Effectively, we continue to raise the investment bar in line with a growing risk environment. Our investment into Konfio, a Mexican SME lender, in mid-2018 was the only one that hit that high bar, and their delivery and performance since invest-ing has only confirmed our confidence in that decision. We also spent a lot of time and fresh capital supporting our current port-folio companies (TransferGo, JUMO, REVO, Magnetis, Finja and FinanZero) to make sure they are in a strong capital place to both manage through any local headwinds, but also have the capital in place to further drive their growth.
From an investment perspective, what has tended to work best for us to date is focused single-country plays with excep-tionally strong leadership teams. Effectively a focused team of professionals, in a single scale market, coming to the office every day executing along one specific line of business. Within this, we would point to portfolio standouts of Creditas and iyzico, but also Magnetis and Nibo, and more recently Konfio.
Finally, we continued to sell down our position in Tinkoff Bank in 2018 and completed the exit in Q1 2019. This is our first portfolio exit, a clear milestone for the company. We entered into Tinkoff Bank at USD 2.98 a share, a USD 19 mln holding. Over the course of our exit of the position we have taken USD 108 mln (average exit price USD 17) off the table, plus an addi-tional USD 9 mln in dividends. An IRR of 65% and 6.1x cash on cash returns. First big exit for VEF, done. Tinkoff, we salute you.
2018 performance reviewFollowing back to back bumper years of near 40–50% growth in our NAV YoY in 2016 and 2017, in line with broader markets, our NAV broadly tracked sideways in 2018, rising 1.4% YoY to end the year at USD 201.5 mln. NAV per share in SEK did rise nicely 12.4% YoY, with currency being the clear differentiating factor.
Managing director’s letter
ANNUAL REPORT 2018 5
Over the year, Tinkoff Bank was the main driver of NAV in both directions (up for 9M18 and off in Q4) as its share price went from USD 19 on January 1, 2018, peaking at USD 23.8 in March before ending the year at USD 15.4. Within the major-ity private portfolio, iyzico was a clear positive force as Turkey’s leading payments company continues to go from strength to strength and its valuation mark in tandem with these trends. Creditas, the other size holding in our portfolio at YE18 also delivered a very impressive first year as a VEF portfolio company and we have high hopes for the company as we look into 2019.
Guiabolso weighed on proceedings through Q4 and FY18 as their NAV reduction over the period partly reflects longer-term nature of its revised strategy. In general, for those positions val-ued by mark to model, local currency weighed on all through 2018 while comparison listed company multiples were generally a positive force in 1H18 before weighing into 2H18.
Outlook for 2019Given our deliberate cash build-up through 2H18, we enter 2019 in a very strong position, as this is a great window for the long-term structural investor, like VEF, to be liquid. Effectively we enter 2019 in the strongest position we have ever been in, with capital in the bank, a strong portfolio, a healthy pipeline and the tailwind of our first value accretive exit.
We spend a lot of time internally on the concept of capital allocation and we are always looking to put our investment dol-lars to work in the most value supportive way, with three clear options of new investments, investing harder into current port-folio companies and/or returning capital to shareholders.
On the pipeline front, with the global economy and mar-kets starting to show signs of struggle, these are market con-ditions that should see a continued pricing power shift to the buyer. It is the kind of environment where we will continue to be very selective with transactions, but are very much readied
for opportunities as they arise. Pipeline is not the issue, and hasn’t been for some time, it is the right deals at the right time and price we crave and only look to do.
We continue to analyse our current portfolio holdings and always look to put more capital to work in the names we like best in the most opportunistic way. In that regard, in 2019, as we did through 2018, we expect to be active sporadically within our own portfolio names as the situations arise or as we create them.
There is always a balance in these things and it is a func-tion of clear capital allocation with the constant goal of creat-ing value for shareholders. We weigh up current portfolio and pipeline needs, coupled with logical buffers for the business, but buybacks are very much on our mind, effectively placing a stra-tegic layer over simple capital allocation maths. As in 2018, we will continue to buy back our own stock to cover the compa-ny’s obligations under the outstanding long-term incentive pro-grams, as recently announced.
Concluding remarksWe start 2019 with a strong portfolio, a strong cash cushion/firepower and feeling as well placed in the EM Fintech eco-system as we ever have. With our first exit behind us, the the-ory of value creation in the EM fintech space via our vehicle has become a realised reality and we remain confident of this trend continuing. Confident that our actions and NAV will be reflected in our share price, we continue to actively engage the market to drive that sooner as opposed to later. We re-iterate that delivering shareholder value through a focused approached to increasing our NAV per share and reducing traded discount to market value remain our core focus. We take a long-term view on our company, investments and indeed life, which is necessary when investing in the space that we do. Hence we are ready to react and act in any environment with these support-ing mindsets.
David Nangle
6 ANNUAL REPORT 2018
INT
RO
DU
CT
ION
INV
EST
ME
NT
PO
RT
FO
LIO
CO
RP
OR
AT
E G
OV
ER
NA
NC
EF
INA
NC
IAL
IN
FO
RM
AT
ION
INF
OR
MA
TIO
N
Fintech in emerging markets – Investment theme gaining momentumFintech valuation marks and exitsWhen Vostok Emerging Finance began to invest in fintech assets across emerging markets back in 2015, the EM fintech ideology and investment theme was still in its infancy, with few proof-points regarding the value creation secular trend that it was fast becoming. Fast-forward to today and there is an abundance and growing number of macro and micro level proof points that more than support fintech’s place as one of the world’s new economy value creation champions.
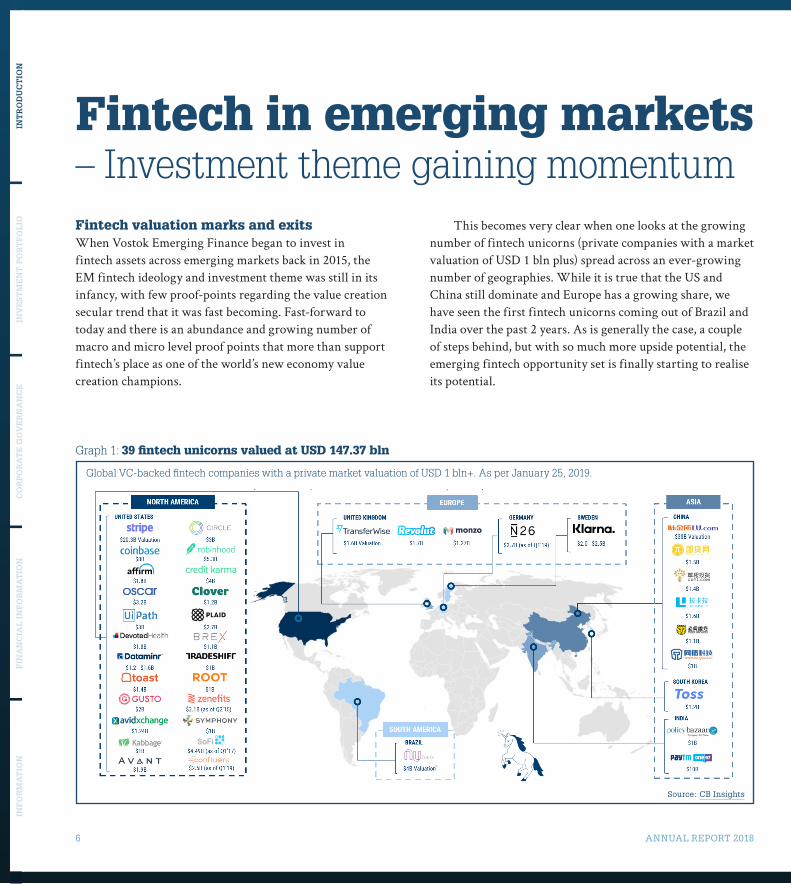
This becomes very clear when one looks at the growing number of fintech unicorns (private companies with a market valuation of USD 1 bln plus) spread across an ever-growing number of geographies. While it is true that the US and China still dominate and Europe has a growing share, we have seen the first fintech unicorns coming out of Brazil and India over the past 2 years. As is generally the case, a couple of steps behind, but with so much more upside potential, the emerging fintech opportunity set is finally starting to realise its potential.
Graph 1: 39 fintech unicorns valued at USD 147.37 bln
Global VC-backed fintech companies with a private market valuation of USD 1 bln+. As per January 25, 2019.
Source: CB Insights
ANNUAL REPORT 2018 7
North America
USD 1.8 bln
USD 0.6 bln
USD 28.9 bln
USD 98.7 bln
USD 1.5 bln
Europe
USD 19.2 bln
USD 1.6 bln
USD 2 bln
USD 21.2 bln
China
USD 1.6 bln
USD 1.6 bln
USD 5.6 bln
USD 1.4 bln
Brazil
USD 6.9 bln
USD 7.3 bln
Russia
USD 3 bln
USD 0.8 bln
Australia/NZ
USD 4.1 bln
USD 2.1 bln
Furthermore, these fintech champions are evolving across a broad spectrum of financial services inclusive of payments, credit, investments, mobile money and insurance. Business type is not just replicated across geographies, but is clearly spread across a multitude of differing financial services sub-segments.
One can always debate the validity of proof points from the private markets and the valuations that their capital places on fintech unicorns (although it is hard to discount them all – think Stripe and Ant Financial). However, we are seeing a growing number of IPOs and M&As where private valuation
points are being realised and further benchmarked in the public market space.
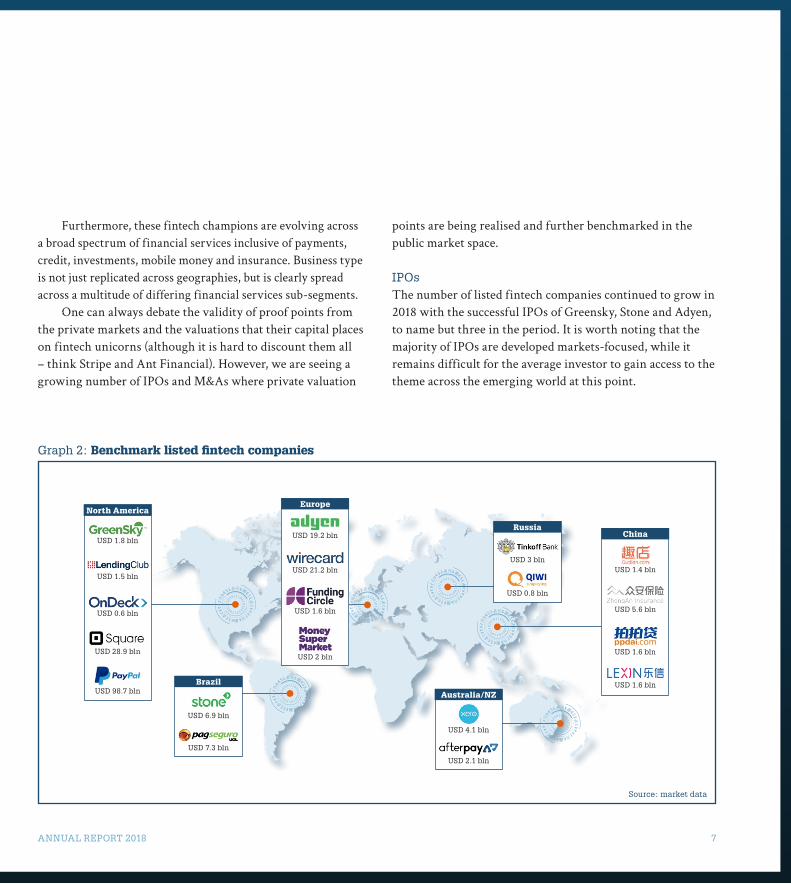
IPOsThe number of listed fintech companies continued to grow in 2018 with the successful IPOs of Greensky, Stone and Adyen, to name but three in the period. It is worth noting that the majority of IPOs are developed markets-focused, while it remains difficult for the average investor to gain access to the theme across the emerging world at this point.
Graph 2: Benchmark listed fintech companies
Source: market data
8 ANNUAL REPORT 2018
INT
RO
DU
CT
ION
INV
EST
ME
NT
PO
RT
FO
LIO
CO
RP
OR
AT
E G
OV
ER
NA
NC
EF
INA
NC
IAL
IN
FO
RM
AT
ION
INF
OR
MA
TIO
N
M&APrivate valuations are not just being vindicated via IPOs, but in the majority of cases we are seeing them through the M&A process. Numerous fintech M&As occurred through 2018. Of note, we would mention benchmark transactions like the purchase of iZettle by PayPal for USD 2.2 bln.
In conclusion, at this stage it is clear to see the growing number of proof points and validation of the value being cre-ated across the global fintech universe. Early stage private companies are increasingly reaching their potential, carving out a healthy slice of the global financial services pie, seeing their valuations rise through the private investment world before being validated with an exit via the IPO and M&A market. The emerging world is following the developed world, generally with a lag (China aside), but this only high-lights that there is so much more runway to go in our focus space of operating.
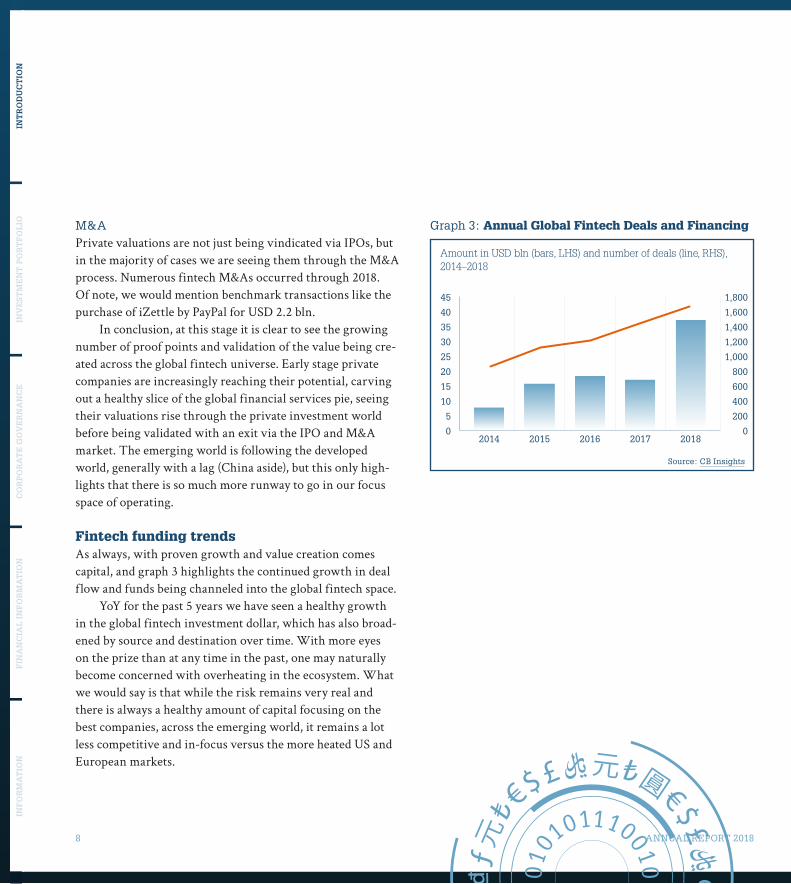
Fintech funding trendsAs always, with proven growth and value creation comes capital, and graph 3 highlights the continued growth in deal flow and funds being channeled into the global fintech space.
YoY for the past 5 years we have seen a healthy growth in the global fintech investment dollar, which has also broad-ened by source and destination over time. With more eyes on the prize than at any time in the past, one may naturally become concerned with overheating in the ecosystem. What we would say is that while the risk remains very real and there is always a healthy amount of capital focusing on the best companies, across the emerging world, it remains a lot less competitive and in-focus versus the more heated US and European markets.
Graph 3: Annual Global Fintech Deals and Financing
Amount in USD bln (bars, LHS) and number of deals (line, RHS), 2014–2018
1,800
1,600
1,400
1,200
1,000
800
600
400
200
0
45
40
30
35
20
25
15
10
5
02014 2015 2016 2017 2018
Source: CB Insights
ANNUAL REPORT 2018 9
Interview with Sergio Furio, founder and CEO of CreditasTo provide further insight into the type of business and, arguably more important, the type of people we back at VEF, in this section of our Annual Report we catch up with Sergio Furio, founder and CEO of Creditas, Brazil’s biggest and fastest-growing secured consumer lender. In almost every way, Creditas and Sergio are exactly what we are looking to back. A driven, focused, energetic, and almost addictive entrepreneur, driving one of the fastest-growing fintech companies in Brazil with a best-in-class offering into a scale opportunity space, but also one that improves the financial wellbeing of the growing Brazilian customer base who interact with it.
As an introduction, can you share with our investors how it all
began, the impetus for, and idea behind Creditas?
I’m originally Spanish, born and raised in Valencia, but moved to New York as my career took off with BCG, the consultancy group, where I spent a lot of time working with and advising some of the largest financial institutions in the US. My eureka moment for Creditas was triggered by my then wife to be, who is Brazilian. When I told her that I wanted to become a fintech entrepreneur, she told me all about the state of finan-cial services in Brazil, the issues with it, where consumers pay 100%+ annual percentage rate for a simple personal loan. Clearly inspired, but in-part driven by the desire to impress, I started digging into the problem and realized that most of it was not related to higher levels of delinquency risk or higher funding costs, but largely by the gross inefficiency of the incumbent Brazilian banking system. I saw a clear oppor-tunity to improve financial services by leveraging on better technology and digital channels. So, in 2012, we got married, decided to move to Brazil, and started up the business. It was one of those opportunities where the more time you spent on it, and especially when I arrived in Brazil, that it just became
more and more obvious. Within a year I realized that THE amazing opportunity was in refinancing all that expensive unsecured consumer debt by using the customer’s properties (and eventually other assets) as a collateral.
Who is Sergio Furio, what makes you tick, drives you on?
In the early days it was about risking my life for the unknown. Getting out of my comfort zone and proving to myself that I can do amazing things outside of the safety and structure of the corporate world, almost with my own hands. Today, I’m very passionate about causing clear and tangi-ble impact. There are so many problems in our society, and I think that I can deliver change, inspire others and ultimately create a better world. I’m doing exactly what I want to do at this moment in my life. And I enjoy the idea of having my daughters proud of what we did one day.
Can you share some of the unique features of both Creditas and the
Brazilian market that form the basis of your success to date.
Creditas is all about providing liquidity to the owners of illiq-uid assets. If you think about it, people work most of their lives to create wealth that is trapped in real estate property or their cars. In Brazil alone, there is a USD 3 trillion pool of assets in the combination of consumer real estate and cars. Today, consumers are only using a fraction of those assets to secure low-cost debt (currently only ~7% of that total value is used as loan collateral). If we can use those assets and inject that liquidity back to the consumer, if we can tap into this opportunity, in a seamless way, the impact would be massive. We could triple the available funds in Brazil, and that would mean better education, more small business investments, home renovations… and we could do all this at a fraction of the cost that they are currently paying to their friendly neigh-borhood bank.

10 ANNUAL REPORT 2018
INT
RO
DU
CT
ION
INV
EST
ME
NT
PO
RT
FO
LIO
CO
RP
OR
AT
E G
OV
ER
NA
NC
EF
INA
NC
IAL
IN
FO
RM
AT
ION
INF
OR
MA
TIO
N
What opportunities and challenges are you presented with when
operating a business like Creditas in a country like Brazil?
While our business concept is super logical and simple to explain, the challenges on the road to success are very real. Collateralized loans are extremely complex to originate. Besides dealing with customer acquisition, credit analysis and funding of the loans, you need to take care of the loan pro-duction. This involves the asset appraisal and more impor-tantly, analyzing the legal risk. In Brazil we don’t have title insurance, and that means that we need to do an inter-nal underwriting of the property title, including all poten-tial liabilities of the borrower that may impact the title, and
liabilities on the companies that the borrower may own that can also indirectly impact the property. As ever, if you tackle the hard path in business there is a very real chance you can build some real defensible moats for your business to allow you to return strong profits through the cycle. Creditas has been able to continuously build sustainable advantage due to the complexity of the product. So, I guess you could say we embrace the challenges that Brazil offers in our space, and it is through our success in overcom-ing them that we have built something truly unique and defensible.
Photo © Claudio Gatti
ANNUAL REPORT 2018 11
What have been the key milestones for Creditas so far, moments
that made the difference?
Between 2012 and 2015, Creditas focused on partnering with mid-sized banks and act as a distribution channel for them. After completing the platform, a key milestone was achieved in April 2016 when we issued our first fully originated home equity loan. In 2017 we launched our first asset-backed investment fund that allowed us to fund the loans and keep most of the loan return while minimizing our capital con-sumption. In 2018 we issued our first residential mortgage backed security, first in June through a private placement, and then in December through a public offering that was dis-tributed mostly to retail investors. From an equity stand-point, our USD 55 million Series C led by Vostok Emerging Finance in December 2017 represented an inflection point for the company that allowed us to grow 5x in revenues in 2018. Finally, in January 2019 we were granted a financial institu-tion license by the Brazilian Central Bank that gives us full independence to originate our loans and increase both eco-nomics and innovation. All this and we are still so early in our journey and look forward to many more milestones to come!
How do you feel about 2019 (and beyond) for the business?
We have plans to grow 30x between 2019 and 2021 and as such 2019 is going to be a critical year. As well as driving more origination volume through our platform, our auto-mation efforts are really starting to kick in, and we expect to see healthy productivity improvements and efficiency gains through the year. We believe that becoming a low-cost pro-ducer is a necessary part of our strategy to build a sustainable competitive advantage, and that means significant technology investments. Our team today of near 600 strong should grow to around 900 by year-end as we continue our accelerated
growth and prepare launching new products in our portfolio. There is a plentitude of initiatives that are to be implemented which should start making secured lending a go-to prod-uct, and Creditas as the recognized brand in the space and by Brazilian households in general.
How would you describe your relationship with VEF and your
investors in general?
Our quarterly board meetings give us some discipline in our relationship with our investors. We gather in a round table and digest 100 pages of in-depth content to make sure that everyone is on the same page. In between board meetings, we have a very close relationship and have constant interactions on specific opportunities, business development, product and technology and funding. VEF has been a great partner since leading our round and has active participation in our key strategic decisions. Both David and Alexis are outstanding professionals and have been supporting us with introductions and thought partnership during these last 15 months.
To close off, what would you say to investors in Vostok Emerging
Finance, who indirectly are shareholders in your company?
Fintech in emerging markets is going to be an amazing ride. Full of ups and downs, but with clear and consistent secu-lar trends that favor disruption. VEF has been quick in land-ing in Brazil and now enjoys a great brand among fintech entrepreneurs looking for Series B/C. There are tremendous opportunities to be built in Latin America and patience is going to be the investors’ friend.

12 ANNUAL REPORT 2018
INT
RO
DU
CT
ION
INV
EST
ME
NT
PO
RT
FO
LIO
CO
RP
OR
AT
E G
OV
ER
NA
NC
EF
INA
NC
IAL
IN
FO
RM
AT
ION
INF
OR
MA
TIO
N
Portfolio developmentVEF’s net asset value as at December 31, 2018 was USD 201.4 mln (December 31, 2017: USD 198.6 mln) or USD 0.31 per share (December 31, 2017: USD 0.30 per share). Given a SEK/USD exchange rate of 8.97 (December 31, 2017: 8.23) this cor-responds to a net asset value of SEK 1,806 mln (December 31, 2017: SEK 1,635 mln) or 2.78 SEK per share (December 31, 2017: SEK 2.47 per share).
Over the period January 1, 2018–December 31, 2018, VEF’s net asset value per share in USD increased by 3.2%. During the same period the MSCI Emerging Markets index* decreased by 16.9% in USD terms. The majority of VEF’s growth in net asset value was a result of the mark up in valu-ation of iyzico, TransferGo, FinanZero and Magnetis. VEF’s SDR price decreased by 24.6% in USD and 17.8% in SEK in 2018.
During 2018, gross investments in financial assets were USD 80.62 mln (2017: USD 79.5). Whereof USD 15.00 mln was in one new portfolio company, Konfio, USD 12.16 mln was attributable to additional investments in JUMO, TransferGo, REVO/Sorsdata, iyzico, Finja, FinanZero and Magnetis, and USD 53.46 mln was invested in liquidity place-ments. Moreover, VEF sold 3,555,000 shares in Tinkoff Bank (USD 65.43 mln).
The largest revaluations of financial assets during 2018, were iyzico (USD 15.11 mln), Guiabolso (USD -14.74 mln), TransferGo (USD 3.37 mln) and Tinkoff Bank (USD -3.35 mln).
Investment portfolio
Liquidity management VEF has investments in money market funds as part of its liquidity management operations. As per December 31, 2018, the liquidity management investments are valued at USD 44.90 mln, based on the latest NAV of each fund. At the end of the year, net investments in liquidity placements for the year were USD 39.47 mln.
* TheMSCIEmergingMarketsIndexisafreefloatweightedequityindexthat
consists of indices in 26 emerging economies.
VEF SDR and quarterly Net Asset Value developmentDecember 2017–December 2018 (SEK/SDR)
Net Asset Value SDR Price
1.5
2.0
3.0
2.5
Jan2018
Feb MarDec2017
Apr JulJunMay OctSepAug DecNov
Cash and cash equivalents
Portfolio structure – Net asset value
TCS Group Holding PLC
JUMO
Konfio
Creditas
Guiabolso
REVO Technology/ Sorsdata
iyzico
Magnetis
Liquidity management
TransferGo
Finja
Nibo
FinanZero
ANNUAL REPORT 2018 13
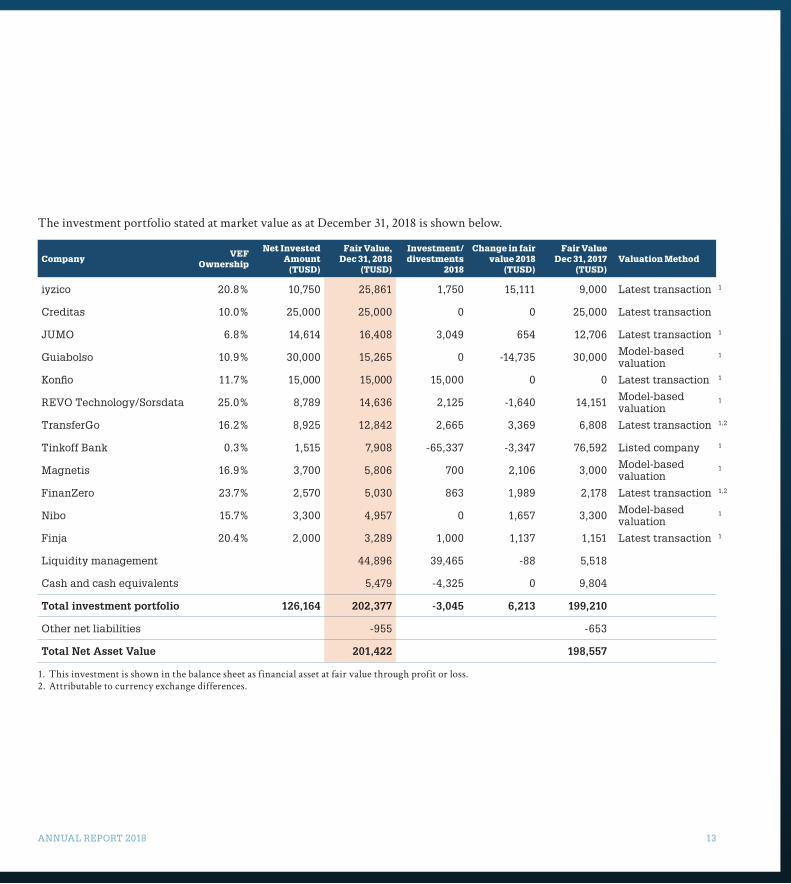
The investment portfolio stated at market value as at December 31, 2018 is shown below.
CompanyVEF
Ownership
Net Invested Amount
(TUSD)
Fair Value, Dec 31, 2018
(TUSD)
Investment/divestments
2018
Change in fair value 2018
(TUSD)
Fair Value Dec 31, 2017
(TUSD)Valuation Method
iyzico 20.8% 10,750 25,861 1,750 15,111 9,000 Latest transaction 1
Creditas 10.0% 25,000 25,000 0 0 25,000 Latest transaction
JUMO 6.8% 14,614 16,408 3,049 654 12,706 Latest transaction 1
Guiabolso 10.9% 30,000 15,265 0 -14,735 30,000 Model-based valuation
1
Konfio 11.7% 15,000 15,000 15,000 0 0 Latest transaction 1
REVO Technology/Sorsdata 25.0% 8,789 14,636 2,125 -1,640 14,151 Model-based valuation
1
TransferGo 16.2% 8,925 12,842 2,665 3,369 6,808 Latest transaction 1,2
Tinkoff Bank 0.3% 1,515 7,908 -65,337 -3,347 76,592 Listed company 1
Magnetis 16.9% 3,700 5,806 700 2,106 3,000 Model-based valuation
1
FinanZero 23.7% 2,570 5,030 863 1,989 2,178 Latest transaction 1,2
Nibo 15.7% 3,300 4,957 0 1,657 3,300 Model-based valuation
1
Finja 20.4% 2,000 3,289 1,000 1,137 1,151 Latest transaction 1
Liquidity management 44,896 39,465 -88 5,518
Cash and cash equivalents 5,479 -4,325 0 9,804
Total investment portfolio 126,164 202,377 -3,045 6,213 199,210
Other net liabilities -955 -653
Total Net Asset Value 201,422 198,557
1. This investment is shown in the balance sheet as financial asset at fair value through profit or loss.2. Attributable to currency exchange differences.
14 ANNUAL REPORT 2018
INT
RO
DU
CT
ION
INV
EST
ME
NT
PO
RT
FO
LIO
CO
RP
OR
AT
E G
OV
ER
NA
NC
EF
INA
NC
IAL
IN
FO
RM
AT
ION
INF
OR
MA
TIO
N
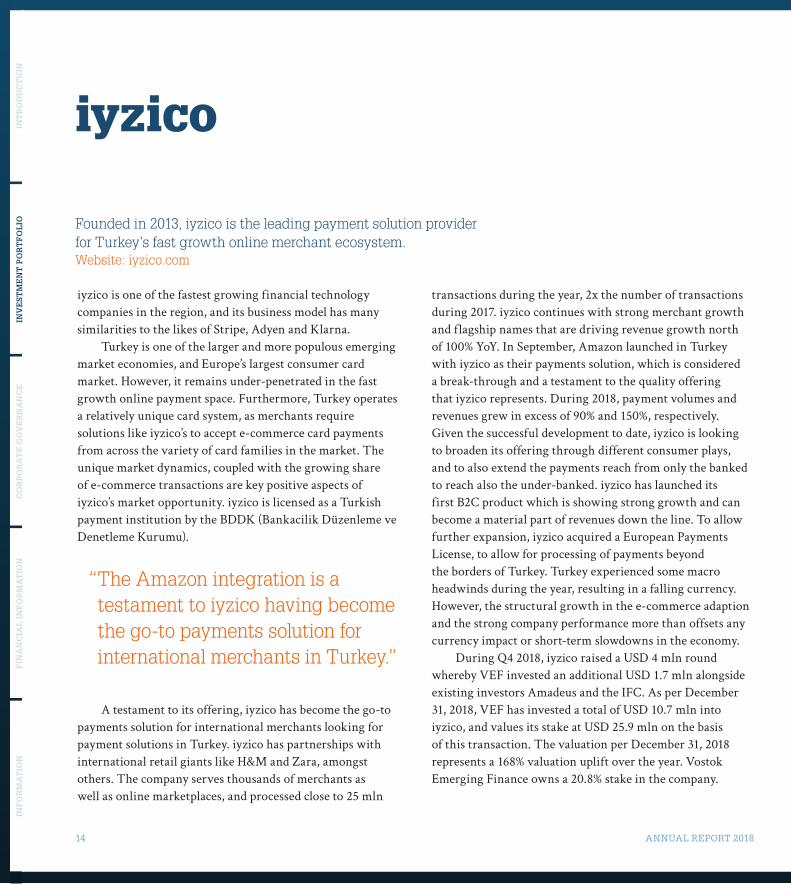
iyzico is one of the fastest growing financial technology companies in the region, and its business model has many similarities to the likes of Stripe, Adyen and Klarna.
Turkey is one of the larger and more populous emerging market economies, and Europe’s largest consumer card market. However, it remains under-penetrated in the fast growth online payment space. Furthermore, Turkey operates a relatively unique card system, as merchants require solutions like iyzico’s to accept e-commerce card payments from across the variety of card families in the market. The unique market dynamics, coupled with the growing share of e-commerce transactions are key positive aspects of iyzico’s market opportunity. iyzico is licensed as a Turkish payment institution by the BDDK (Bankacilik Düzenleme ve Denetleme Kurumu).
“ The Amazon integration is a testament to iyzico having become the go-to payments solution for international merchants in Turkey.”
A testament to its offering, iyzico has become the go-to payments solution for international merchants looking for payment solutions in Turkey. iyzico has partnerships with international retail giants like H&M and Zara, amongst others. The company serves thousands of merchants as well as online marketplaces, and processed close to 25 mln
iyzico
Founded in 2013, iyzico is the leading payment solution provider for Turkey’s fast growth online merchant ecosystem.Website: iyzico.com
transactions during the year, 2x the number of transactions during 2017. iyzico continues with strong merchant growth and flagship names that are driving revenue growth north of 100% YoY. In September, Amazon launched in Turkey with iyzico as their payments solution, which is considered a break-through and a testament to the quality offering that iyzico represents. During 2018, payment volumes and revenues grew in excess of 90% and 150%, respectively. Given the successful development to date, iyzico is looking to broaden its offering through different consumer plays, and to also extend the payments reach from only the banked to reach also the under-banked. iyzico has launched its first B2C product which is showing strong growth and can become a material part of revenues down the line. To allow further expansion, iyzico acquired a European Payments License, to allow for processing of payments beyond the borders of Turkey. Turkey experienced some macro headwinds during the year, resulting in a falling currency. However, the structural growth in the e-commerce adaption and the strong company performance more than offsets any currency impact or short-term slowdowns in the economy.
During Q4 2018, iyzico raised a USD 4 mln round whereby VEF invested an additional USD 1.7 mln alongside existing investors Amadeus and the IFC. As per December 31, 2018, VEF has invested a total of USD 10.7 mln into iyzico, and values its stake at USD 25.9 mln on the basis of this transaction. The valuation per December 31, 2018 represents a 168% valuation uplift over the year. Vostok Emerging Finance owns a 20.8% stake in the company.
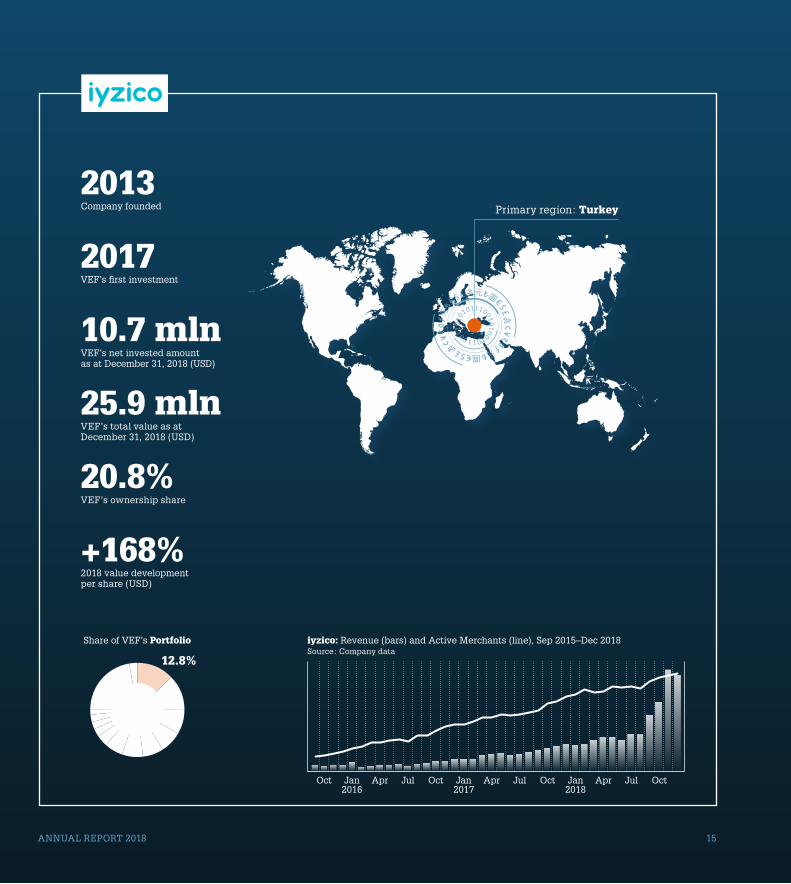
ANNUAL REPORT 2018 15
Share of VEF’s Portfolio
Primary region: Turkey
VEF’s net invested amount as at December 31, 2018 (USD)
10.7 mln
Company founded
2013
VEF’s total value as at December 31, 2018 (USD)
25.9 mln
VEF’s first investment
2017
VEF’s ownership share
20.8%
2018 value development per share (USD)
+168%
12.8%
Oct Jan2016
JulApr Oct Jan2017
Apr AprJul JulOct OctJan2018
iyzico: Revenue (bars) and Active Merchants (line), Sep 2015–Dec 2018Source: Company data
16 ANNUAL REPORT 2018
INT
RO
DU
CT
ION
INV
EST
ME
NT
PO
RT
FO
LIO
CO
RP
OR
AT
E G
OV
ER
NA
NC
EF
INA
NC
IAL
IN
FO
RM
AT
ION
INF
OR
MA
TIO
N
Brazilians are paying some of the highest interest rates any-where in the world and have a large volume of unsecured consumer loans driving the high rates, while at the same time approximately 70% of all homes and cars are owned debt-free and hence, do not have mortgage or auto financing. Creditas leverages these assets, which represent a value of USD 3 tln in the country, to offer home equity and auto secured loans to reduce the high borrowing costs and offer loans at more rea-sonable rates, as is the norm in markets like the US.
“ Approximately 70% of all homes and cars in Brazil are owned debt-free. Creditas leverages these assets to offer loans at more affordable rates.”
Creditas was recently granted a financial institution license by the Central Bank of Brazil, which allows them to issue credit products through their own funding vehi-cle without the need for intermediaries. The company is cur-rently focused on addressing the core, largest opportunity set in terms of products, but is well positioned to explore and offer other niche products leveraging similar principles and processes. Creditas has shown exceptional growth through-out the year, slowly shifting focus from top line growth to
Creditas
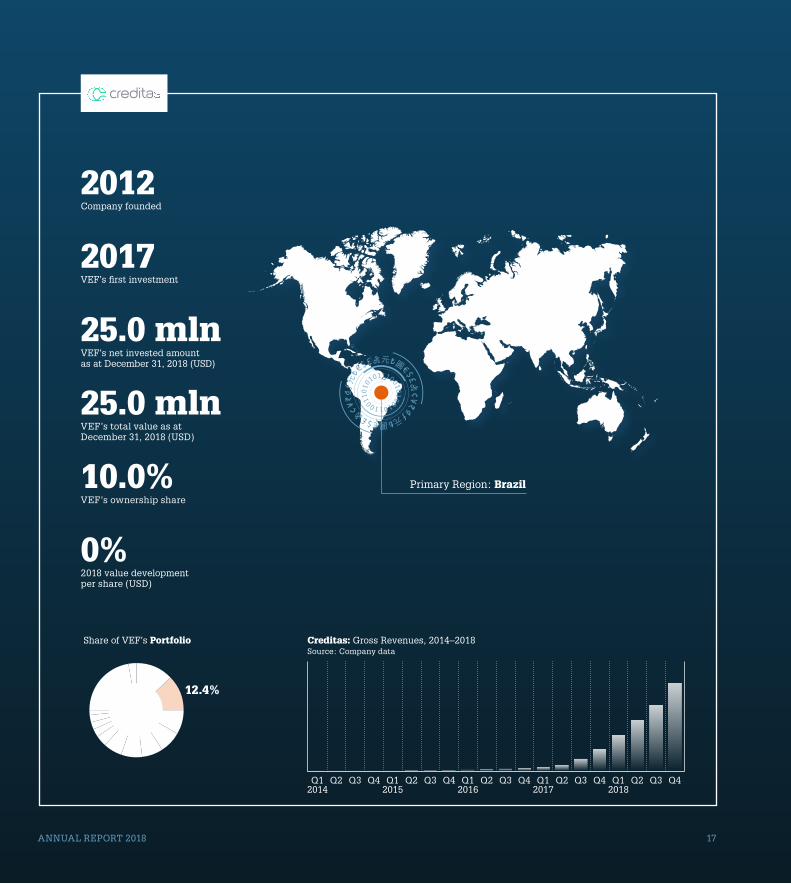
Creditas is a leading, digital-first secured lending platform, with the mission of reducing the Brazilian consumer debt burden through offering consumer loans at more affordable rates by using borrower collateral like homes and autos. Website: creditas.com.br
contribution margins and higher quality revenues. Revenues grew in excess of 5x during the year while origination increased by around 100% during 2018. Essentially all KPIs in the sales funnel, both on the auto financing and home equity side are growing well above 100% YoY. Creditas was founded in 2012 by Sergio Furio and is based in São Paulo, Brazil.
VEF has invested a total of USD 25 mln into Creditas. During Q2 2018, a second close following the Q4 2017 financing round happened, where Amadeus and Santander Bank invested into the company, at the same valuation as VEF. As per December 31, 2018, VEF has an ownership of 9.95% of the company valued at USD 25.0 mln on the basis of the latest transaction in the company.
ANNUAL REPORT 2018 17
Primary Region: Brazil
Share of VEF’s Portfolio Creditas: Gross Revenues, 2014–2018Source: Company data
VEF’s net invested amount as at December 31, 2018 (USD)
25.0 mln
Company founded
2012
VEF’s total value as at December 31, 2018 (USD)
25.0 mln
VEF’s first investment
2017
VEF’s ownership share
10.0%
2018 value development per share (USD)
0%
Q12014
Q2 Q3 Q4 Q12015
Q12016
Q12017
Q12018
Q2 Q2 Q2 Q2Q3 Q3 Q3 Q3Q4 Q4 Q4 Q4
12.4%
18 ANNUAL REPORT 2018
INT
RO
DU
CT
ION
INV
EST
ME
NT
PO
RT
FO
LIO
CO
RP
OR
AT
E G
OV
ER
NA
NC
EF
INA
NC
IAL
IN
FO
RM
AT
ION
INF
OR
MA
TIO
N
JUMO operates across numerous African markets including Tanzania, Ghana, Zambia, Kenya and Uganda. In 2018 JUMO expanded their offering to the sub-continent in Pakistan. They’ve also opened offices in Singapore, Bangladesh and India in addition to new offices in San Francisco and London.
JUMO marketplace was set up to provide value and a service for three distinct partners in their ecosystem. First, it gives consumers/SMEs across mobile money markets in Africa and beyond access to basic financial services direct to their mobile phone without the need to directly interact with or physically go to a bank branch. Second, it allows some of the larger financial services providers the ability to access a broad array of mobile money customers across the conti-nent in a cost efficient and scalable manner. Finally, it pro-vides products for the mobile network operators’ end users and hence helps to augment the utility of their mobile money pipes and increase customer stickiness and reduce churn.
“ More than 10 mln people have saved or borrowed on the JUMO platform, with more than USD 1 bln of credit disbursed.”
JUMO
JUMO is the largest and fastest-growing technology platform operating inclusive mobile financial services marketplaces in emerging markets.Website: jumo.world
Since its launch in 2014, more than 10 mln people have saved or borrowed on the JUMO platform, with nearly 70% of these being micro and small business owners. During the year, JUMO has originated close to 25 mln loans and grew the disbursement volume more than 2x YoY. JUMO has con-tinued to grow the share of off-balance sheet distribution as it shifts to the marketplace model, and now originates around 50% of the total volume disbursed through third-party finan-cial service providers. On the product diversification front, JUMO is continuously developing new financial products, and has launched a savings product to complement the exist-ing and growing suite of credit products. In terms of geo-graphical expansion, JUMO is now live in Pakistan with plans of further expansion in the sub-continent through their proven partnership models.
During the fourth quarter of 2018, JUMO successfully finalized the second close of a big capital raise which took the full round to near USD 65 mln. The round attracted a new investor base and was led by Goldman Sachs, who alongside existing investors were joined by Proparco (the private sector financing arm of the French Development Agency – AFD) and Finnfund. VEF took up its rights and invested USD 3.1 mln in the round and JUMO is valued on the basis of this transaction, which values its 6.8% ownership in the company at USD 16.4 mln. Vostok Emerging Finance has invested a total of USD 14.6 mln in the company.

ANNUAL REPORT 2018 19
Region: Pan-Africa
Share of VEF’s Portfolio
VEF’s net invested amount as at December 31, 2018 (USD)
14.6 mln
Company founded
2014
VEF’s total value as at December 31, 2018 (USD)
16.4 mln
VEF’s first investment
2015
VEF’s ownership share
6.8%
2018 value development per share (USD)
+5%
Region: Asia
8.1%
Jan2016
Apr Jul Oct Jan2017
Apr AprJul JulOct OctJan2018
JUMO: Gross Revenues (bars) and Loan Volume (line), 2016–2018Source: Company data
20 ANNUAL REPORT 2018
INT
RO
DU
CT
ION
INV
EST
ME
NT
PO
RT
FO
LIO
CO
RP
OR
AT
E G
OV
ER
NA
NC
EF
INA
NC
IAL
IN
FO
RM
AT
ION
INF
OR
MA
TIO
N
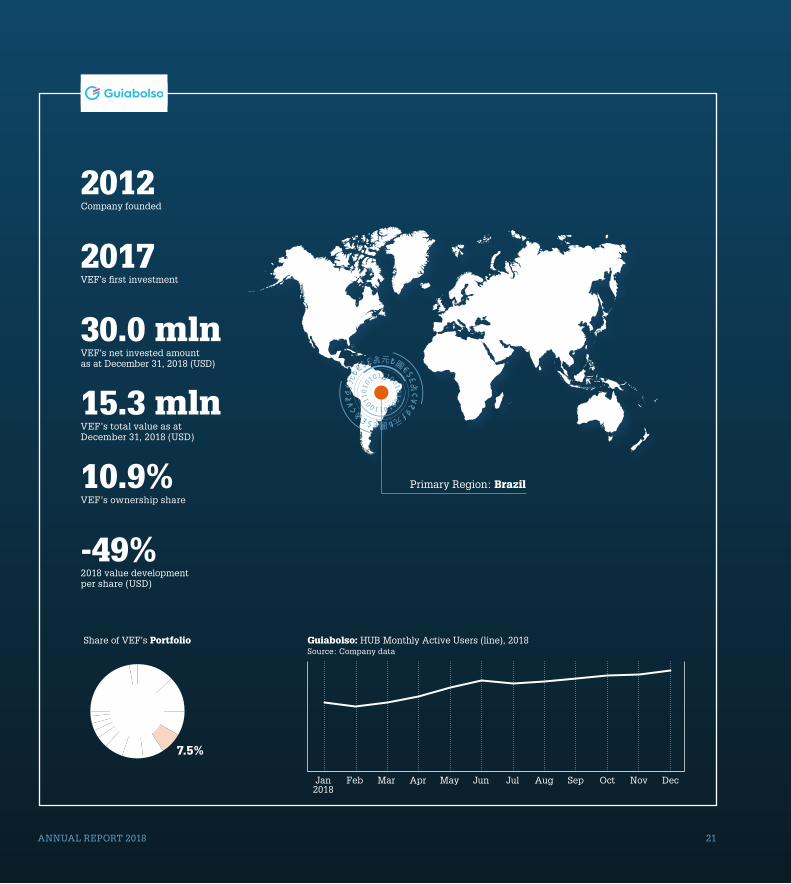
Guiabolso leverages its proprietary bank data aggrega-tion technology to automatically aggregate people’s finan-cial information, allowing users to better understand their finances and keep track of their budgets.
Through their technology, Guiabolso can offer the best financial profile available in the market to their large and fast-growing customer base. With a complete view and unique insight into the typically complex financial profile of the Brazilian, Guiabolso is in a unique position to offer their customers a wide range of products, spanning from credit reports and financial education tools through to investment offerings as well as third party credit products. The compa-ny’s ability to match its users to better-suited and more com-petitively priced financial products sets it apart in a country with one of the world’s highest interest rates.
“ Through its proprietary bank data aggregation technology, Guiabolso is in a unique position to offer their customers better-suited financial products.”
Guiabolso’s monetization efforts have previously focused on providing consumer loans through the Guiabolso loan marketplace, both via their in-house credit provider “Just”, as well as through white-label bank partners. The goal has been to initially take balance sheet risk and originate
Guiabolso
Guiabolso is the leading Brazilian Personal Finance Platform with the mission of transforming the financial well-being of ordinary Brazilians. Website: guiabolso.com.br
credit through Just to get the marketplace going and incen-tivize more white label partners into the mix.
From Q3 2018 and onwards, 100% of Guiabolso’s credit origination is done through partners, and the company is entirely focused on growing the asset-light credit market-place and the active user base (+63% during the year) and introducing multiple revenue lines throughout 2019. The partnership revenue/asset-light model approach de-risks the operations and will lead to a slow-down in credit origination and near-term revenue generation in favor of a growing user base, which represents the real value creation in the busi-ness model. Guiabolso continues to extend their offering of curated financial products with a view to become the finan-cial hub for Brazilians. The business model is similar to the likes of Mint and Credit Karma in the US. Founded in 2012, Guiabolso is based in São Paulo, Brazil.
As at December 31, 2018, VEF has invested a total of USD 30 mln in Guiabolso, and values its 10.9% stake at USD 15.3 mln on the basis of an EV/revenue peer multiples val-uation model. The valuation represents a 49% decrease in valuation over the year, and is derived from and reflects Guiabolso’s new strategic long-term focus impacting the short-term revenue growth, depreciating BRL, and lower val-uation multiples in the peer group.
ANNUAL REPORT 2018 21
Share of VEF’s Portfolio
VEF’s net invested amount as at December 31, 2018 (USD)
30.0 mln
Company founded
2012
VEF’s total value as at December 31, 2018 (USD)
15.3 mln
VEF’s first investment
2017
VEF’s ownership share
10.9%
2018 value development per share (USD)
-49%
Primary Region: Brazil
7.5%
Guiabolso: HUB Monthly Active Users (line), 2018Source: Company data
Jan2018
Feb Mar Apr May Jun Jul Aug Sep Oct Nov Dec
22 ANNUAL REPORT 2018
INT
RO
DU
CT
ION
INV
EST
ME
NT
PO
RT
FO
LIO
CO
RP
OR
AT
E G
OV
ER
NA
NC
EF
INA
NC
IAL
IN
FO
RM
AT
ION
INF
OR
MA
TIO
N
The latest addition to the VEF portfolio is Konfio. After Brazil, Mexico is Latin America’s scale market opportu-nity with a population of 127 mln (number 10 globally) and approximately 7 mln SMEs in the market. Within the broader Mexican SME credit space, Konfio is focused on the top-end credit of the small business segment which is viewed as a USD 45 bln opportunity. For every 20 companies in Mexico, 19 are considered “very small” with annual sales of up to USD 700 k. With its online and digital-first approach, Konfio leverages technology and big data analytics, and has taken advantage of recent Mexican fiscal control by using a combination of electronic SME invoice data and non-corre-lated credit bureau data in its credit scoring process. Konfio complements traditional financial analysis and streamlines the loan application process, providing convenience and affordability to customers who are creditworthy but his-torically underserved by traditional banks. Revenues are in principal generated from origination fees and interest mar-gins on the loans. Founded in 2014 by David Arana, Konfio is head quartered in Mexico City.
Konfio
Konfio is a Mexican digital-first unsecured lending platform, with a mission to support the growth of Mexico’s vast and underserved small business community. Website: konfio.mx
“ Konfio is focused on the top-end credit of the small business segment which is viewed as a USD 45 bln opportunity.”
Konfio has had a strong 2018 with credit origination and gross revenues growing around 4x and 3.5x respectively, while keeping the NPLs (non-performing loans) low and sta-ble with a healthy balance mix of repeat and new customers, and maintaining or improving already healthy unit econom-ics and higher credit quality of the portfolio.
During June 2018, Vostok Emerging Finance invested USD 15 mln into Konfio. VEF led the broader Series C investment round of USD 25 mln and was joined by existing investors including Quona Capital, QED, Kaszek Ventures and IFC amongst others. Following the transaction VEF holds a board seat and an ownership of 11.7% of the company. VEF’s ownership at the end of 2018 is valued at USD 15 mln on the basis of this transaction.

ANNUAL REPORT 2018 23
Share of VEF’s Portfolio
VEF’s net invested amount as at December 31, 2018 (USD)
15.0 mln
Company founded
2014
VEF’s total value as at December 31, 2018 (USD)
15.0 mln
VEF’s first investment
2018
VEF’s ownership share
11.7%
2018 value development per share (USD)
0%
Primary Region: Mexico
Q12014
Q2 Q3 Q4 Q12015
Q12016
Q12017
Q12018
Q2 Q2 Q2 Q2Q3 Q3 Q3 Q3Q4 Q4 Q4 Q4
Konfio: Quarterly Origination (bars) and Quarterly Total Income (line), 2014–2018Source: Company data
7.4%
24 ANNUAL REPORT 2018
INT
RO
DU
CT
ION
INV
EST
ME
NT
PO
RT
FO
LIO
CO
RP
OR
AT
E G
OV
ER
NA
NC
EF
INA
NC
IAL
IN
FO
RM
AT
ION
INF
OR
MA
TIO
N
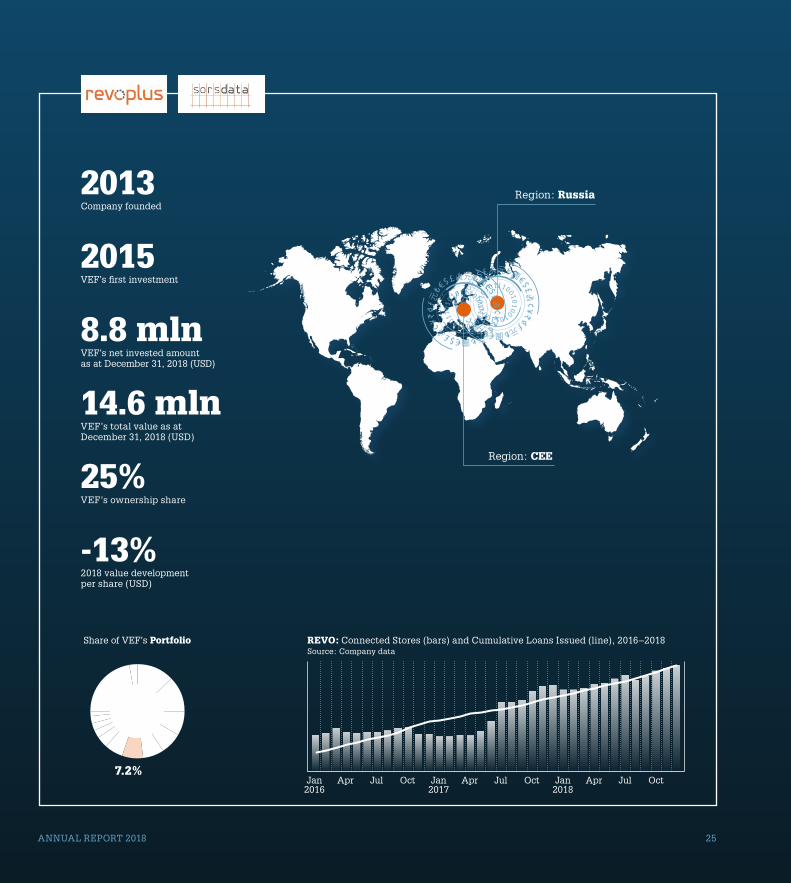
Operating in Russia and Poland, REVO partners with leading merchants to deliver instant omni-channel financing solu-tions for consumers online and offline, similar to Klarna in Western Europe and Affirm in the US.
REVO and Sorsdata began operations in the spring of 2013. The group has built partnerships with leading mer-chants in categories such as apparel, toys, footwear, sporting goods, homeware, travel, electronics, furniture, and others. REVO’s sister company, Sorsdata, focuses on customer data analytics, largely gathered through the REVO machine, and provides targeted marketing services for merchants to drive repeat purchases and loyalty. The two companies effectively operate as one.
“ During the year, REVO added over 850 new stores to the platform.”
During 2018, REVO in Russia launched cooperation with numerous leading online and offline partners, among these are OneTwoTrip, MVideo, Ozon and Adidas, adding over 850 new stores to the platform for a total of 5,000 stores. Adding partners is a key driver for growing volumes and rev-enues, with transaction volume expanding more than 70% year on year. In addition, in the fall of 2018, REVO launched operations in Poland, partnering with a number of leading retailers in household goods and fashion.
REVO Technology and Sorsdata (REVO group)REVO is the leader in digital point of sale finance in Russia and CEE.Website: revo.ru
During the second quarter of 2018, VEF invested an addi-tional USD 2.1 mln into REVO in the form of a two-year con-vertible loan note, alongside existing investor Baring Vostok.
As per December 31, 2018 VEF owns 25% in REVO group and had invested a total of USD 8.8 mln. The 25% stake in the group is valued at USD 14.6 mln. The valuation is derived from valuation models focused on multiples of NII (net interest income) and revenues, coupled with the intrinsic value of the convertible loan note.
ANNUAL REPORT 2018 25
Region: Russia
Share of VEF’s Portfolio
VEF’s net invested amount as at December 31, 2018 (USD)
8.8 mln
Company founded
2013
VEF’s total value as at December 31, 2018 (USD)
14.6 mln
VEF’s first investment
2015
VEF’s ownership share
25%
2018 value development per share (USD)
-13%
Region: CEE
7.2%Jan
2016Apr Jul Oct Jan
2017Apr AprJul JulOct OctJan
2018
REVO: Connected Stores (bars) and Cumulative Loans Issued (line), 2016–2018Source: Company data
26 ANNUAL REPORT 2018
INT
RO
DU
CT
ION
INV
EST
ME
NT
PO
RT
FO
LIO
CO
RP
OR
AT
E G
OV
ER
NA
NC
EF
INA
NC
IAL
IN
FO
RM
AT
ION
INF
OR
MA
TIO
N
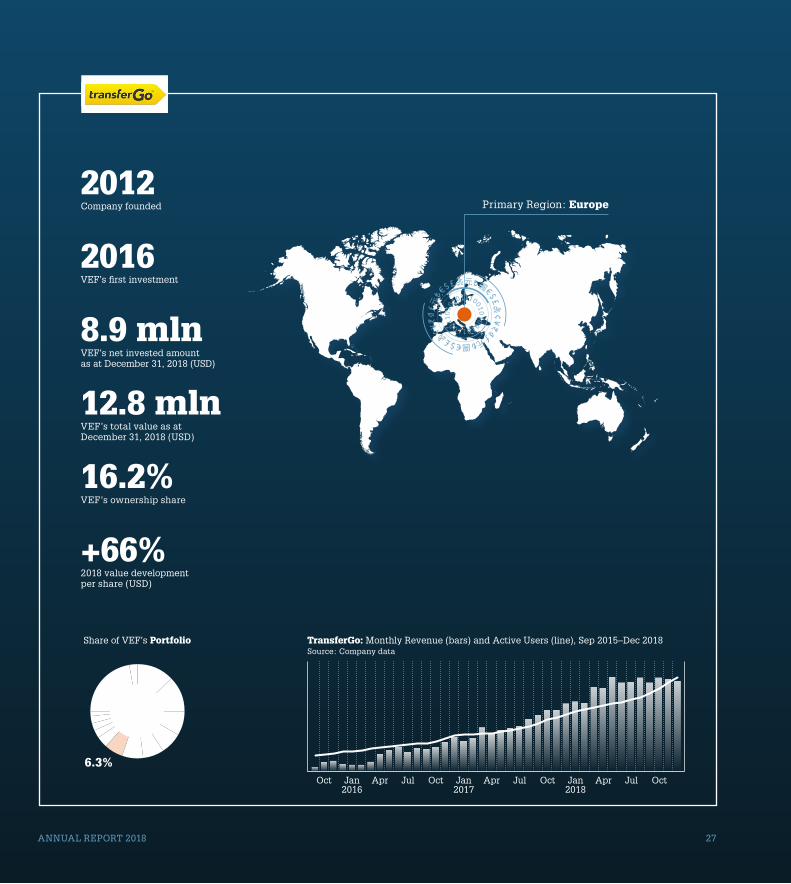
Geographically, TransferGo is mainly focused on the key corridors of broader Europe, with principal flows chan-neling from West to East, while its segment of focus is blue-collar workers, who are some of the most consistent and regular remittance customers in the world. TransferGo is based in the UK and is regulated by the UK Financial Conduct Authority (FCA) as an authorized payment institution.
Remittances is an attractive market within global finan-cial services, and one that has been ripe for disruption for some time. Totaling approximately USD 600 bln of annual peer-to-peer flows globally, pricing remains too high, and speed too slow. Remittances is a business that is won on the balance and interaction between trust, speed and price, and the majority of the industry has been failing custom-ers for years on these metrics. 2018 was a successful year for TransferGo, having shown systematic and steady growth across essentially all KPIs with transaction volumes and rev-enues growing around 65% and 60% respectively.
TransferGo
TransferGo is a rapidly-growing digital money transfer business, focused on offering a real-time service tailored to its blue-collar customer base. Website: transfergo.com
“ TransferGo focuses on the blue-collar workers segment, who are some of the most consistent and regular remittances customers in the world.”
TransferGo is well focused, positioned and financially equipped to invest in acquiring new customers, opening new markets, including Germany as well as Turkey as new send markets, and further ramping up the already strong traction in the business.
In 2018, TransferGo successfully closed a new funding round of around USD 16 mln. VEF lead the round alongside existing and new investors including Revo Capital, a Turkish VC fund, and Ripple. In the process, VEF exercised the out-standing USD 2.8 mln (EUR 2.5 mln) convertible loan note plus accrued interest and invested an additional USD 2.7 mln (EUR 2.3 mln) in TransferGo, taking VEF’s ownership stake to 16.2% in the company.
As per December 31, 2018, VEF’s stake in TransferGo is valued at USD 12.8 mln on the basis of the aforementioned transaction.
ANNUAL REPORT 2018 27
Share of VEF’s Portfolio
VEF’s net invested amount as at December 31, 2018 (USD)
8.9 mln
Company founded
2012
VEF’s total value as at December 31, 2018 (USD)
12.8 mln
VEF’s first investment
2016
VEF’s ownership share
16.2%
2018 value development per share (USD)
+66%
Primary Region: Europe
6.3%Oct Jan
2016JulApr Oct Jan
2017Apr AprJul JulOct OctJan
2018
TransferGo: Monthly Revenue (bars) and Active Users (line), Sep 2015–Dec 2018Source: Company data
28 ANNUAL REPORT 2018
INT
RO
DU
CT
ION
INV
EST
ME
NT
PO
RT
FO
LIO
CO
RP
OR
AT
E G
OV
ER
NA
NC
EF
INA
NC
IAL
IN
FO
RM
AT
ION
INF
OR
MA
TIO
N
During 2018, Tinkoff Bank grew its credit customer base by 2.7 mln new active customers, delivered net loan growth of 53%, and maintained the number two credit card issuer posi-tion in Russia with an estimated 11.8% market share, sec-ond to Sberbank. The online retail deposit account pro-gram, Tinkoff Black, grew by 63% YoY and had 4.5 mln cus-tomers at the end of Q4. Tinkoff Bank has a number of other related business lines coming through its ecosystem, inclu-sive of a mortgage broker, retail investment broker and an insurance offering to name but three. The group also focuses on the Russian SME segment, and had 425 thousand custom-ers, growing 1.8x YoY into an estimated Russian SME market size of 5 mln. Tinkoff Bank continuously launches new busi-ness lines to drive further growth and diversify the group’s revenue streams. During the year, non-credit businesses lines generated more than 30% of revenues, demonstrating an increasingly balanced portfolio by the day.
TCS Group Holding PLC (Tinkoff Bank)Tinkoff Bank was founded in 2007 and has since established itself at the forefront of innovation in delivery of digital consumer and SME financial services in Russia. The business was listed on the London Stock Exchange on October 25, 2013.Website: tinkoff.ru/eng/
Tinkoff Bank resolved to pay a USD 0.28 per share dividend following the release of their Q3 2018 results. The fourth interim dividend was paid in December, 2018, amounting to USD 0.28 mln. During the year, VEF have received dividends of in total USD 2.7 mln from Tinkoff Bank.
VEF’s investment is valued based on the closing bid price per December 31, 2018. As per December 31, 2018, VEF owns 0.28% of Tinkoff Bank. As per the date of this report, Vostok Emerging Finance have entirely exited the position in the company, and no longer holds any shares in Tinkoff Bank.
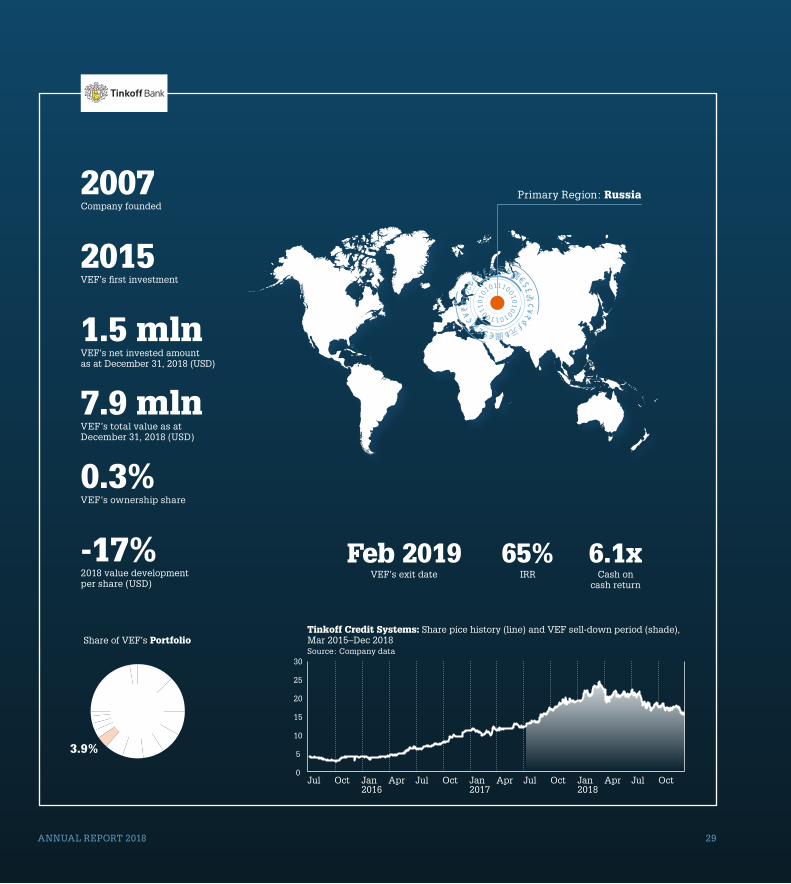
ANNUAL REPORT 2018 29
Primary Region: Russia
Share of VEF’s Portfolio
VEF’s net invested amount as at December 31, 2018 (USD)
1.5 mln
Company founded
2007
VEF’s total value as at December 31, 2018 (USD)
7.9 mln
VEF’s first investment
2015
VEF’s ownership share
0.3%
2018 value development per share (USD)
-17%VEF’s exit date
Feb 2019IRR
65%Cash on
cash return
6.1x
3.9%
30
25
20
15
10
5
0Oct Jan
2016JulApr Oct Jan
2017Apr AprJul JulOct OctJan
2018Jul
Tinkoff Credit Systems: Share pice history (line) and VEF sell-down period (shade), Mar 2015–Dec 2018Source: Company data
30 ANNUAL REPORT 2018
INT
RO
DU
CT
ION
INV
EST
ME
NT
PO
RT
FO
LIO
CO
RP
OR
AT
E G
OV
ER
NA
NC
EF
INA
NC
IAL
IN
FO
RM
AT
ION
INF
OR
MA
TIO
N
The product takes the individual’s risk preferences into account, then builds and manages a tailored portfolio of money market, insured fixed income, hedge funds and equity ETFs at the click of a button. Magnetis’ business model shares the same characteristics as the likes of Betterment and Wealthfront in the US. On top of this it addresses a unique problem faced by Brazilian savers. The central bank intro-duced certain inflation control measures, some of which effectively cap interest rates on savings accounts. Between 2010–2016, real returns on savings accounts has been on average 0.5%, yielding 3–4 percentage points less than treas-uries. The Brazilian market has a unique combination of high real interest rates, a deep pool of active wealth and a high level of financial markets and consumer technology adoption, and represents an addressable market, for digi-tal wealth managers, of USD 720 bln, generating revenues of some USD 13 bln annually. Founded in early 2015, Magnetis is based in São Paolo.
“ Brazil represents an addressable market of USD 720 bln for digital wealth managers, generating USD 13 bln of revenues annually.”
Magnetis
Magnetis is a leading Brazilian digital investment advisor, offering the average Brazilian a simple, digital tool to manage their wealth and at the same time addresses the inability for savers to access fair returns. Website: magnetis.com.br
During the year, the company has consistently shown very strong development across the board with a customer base growing around 150% YoY, while loyalty remains strong with high levels of monthly recurring revenues, growing close to 70% and AUM demonstrating an 80% increase dur-ing 2018. At the same time, new products, initiatives and partnerships are in the making, further improving customer experience, unit economics and long-term profitability.
During Q3 2018 Magnetis successfully closed a bridge financing round where VEF invested an additional USD 700 thousand in the form of a two-year convertible loan note, to add to its initial USD 3.0 mln investment, alongside exist-ing investor Monashees. VEF values its stake in Magnetis on the basis of an EV/AUM % peer multiple, and as at December 31, 2018, Vostok Emerging Finances’ 16.9% ownership in the company is valued at USD 5.8 mln including the convertible loan note.

ANNUAL REPORT 2018 31
Primary Region: Brazil
Share of VEF’s Portfolio
VEF’s net invested amount as at December 31, 2018 (USD)
3.7 mln
Company founded
2015
VEF’s total value as at December 31, 2018 (USD)
5.8 mln
VEF’s first investment
2017
VEF’s ownership share
16.9%
2018 value development per share (USD)
+70%
Oct Jan2016
JulApr Oct Jan2017
Apr AprJul JulOct OctJan2018
Magnetis: Monthly AUM (bars) and Customers (line), Mar 2015–Dec 2018Source: Company data
JulApr
2.9%
32 ANNUAL REPORT 2018
INT
RO
DU
CT
ION
INV
EST
ME
NT
PO
RT
FO
LIO
CO
RP
OR
AT
E G
OV
ER
NA
NC
EF
INA
NC
IAL
IN
FO
RM
AT
ION
INF
OR
MA
TIO
N
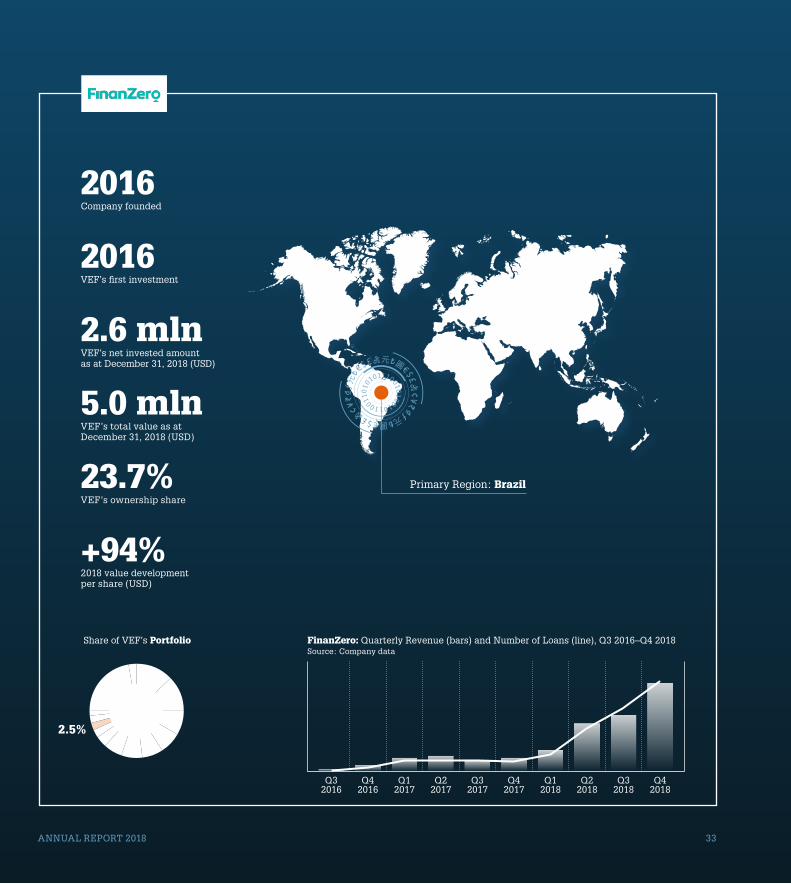
FinanZero handles the lending process from start to finish, with the customer and the bank integrated into FinanZero’s platform. For the consumers, this means that all the relevant credit providers are reached through one single application, cutting the lead times and cumbersome process of the tradi-tional approach where a separate application needs to be sent to each bank or credit provider. Further to helping consum-ers getting the best offers available in the market, from the credit providers’ perspective, FinanZero adds value through more effective distribution, lower customer acquisition cost, better segmentation and pricing and lowered administration costs. FinanZero currently focuses on four sizeable loan bro-ker segments, unsecured consumer loans, unsecured SME/payroll loans, secured car finance loans and secured home equity loans. FinanZero’s business model combines aspects of comparison, lead generation and consumer loan broker-age, similar to the Lendo business model in Scandinavia.
“ FinanZero is in the pole position to be the market leader and take the Lendo position in Brazil.”
FinanZero has made strong progress since our invest-ment. Post the latest funding round in the company, which closed in Q1 2018, traction has been good.
FinanZero
FinanZero is a pioneering marketplace for consumer loans in Brazil. The business is an independent broker for loans, negotiating the customer’s loan with several banks and credit institutions at once, to find the loan with the best interest rate and terms for the consumer. Website: finanzero.com.br
The number of loans sold showed record numbers in Q4 2018, consistently demonstrating QoQ double-digit growth with steadily increasing revenues generated while main-taining strong conversion rates in the sales funnel. This is the direct result of adding new partnerships with finan-cial service providers realizing the value of the marketplace. Further, FinanZero continues API integrations with existing and new key partners resulting in improved operational effi-ciency. This paves the way for FinanZero’s plan to operate in the future and will result in significant volume growth and attract additional attention from other banks to integrate in a similar manner.
During February 2018, VEF’s outstanding converti-ble loan note of USD 0.1 mln was converted into shares. In March, 2018, FinanZero closed a new external funding round in the amount of USD 3.6 mln (SEK 30 mln), where VEF took up its rights alongside existing investors and a number of new, external investors. VEF invested an additional USD 0.9 mln (SEK 7.12 mln). Following conversion of the loan note and the new investment round, VEF holds 23.7% of the shares in the company.
As per December 31, 2018, VEF’s ownership in FinanZero is valued at USD 5.0 mln (SEK 45.1 mln) on the basis of the latest transaction.
ANNUAL REPORT 2018 33
Primary Region: Brazil
Share of VEF’s Portfolio
VEF’s net invested amount as at December 31, 2018 (USD)
2.6 mln
Company founded
2016
VEF’s total value as at December 31, 2018 (USD)
5.0 mln
VEF’s first investment
2016
VEF’s ownership share
23.7%
2018 value development per share (USD)
+94%
2.5%
FinanZero: Quarterly Revenue (bars) and Number of Loans (line), Q3 2016–Q4 2018Source: Company data
Q32016
Q42016
Q12017
Q22017
Q32017
Q42017
Q12018
Q22018
Q32018
Q42018
34 ANNUAL REPORT 2018
INT
RO
DU
CT
ION
INV
EST
ME
NT
PO
RT
FO
LIO
CO
RP
OR
AT
E G
OV
ER
NA
NC
EF
INA
NC
IAL
IN
FO
RM
AT
ION
INF
OR
MA
TIO
N
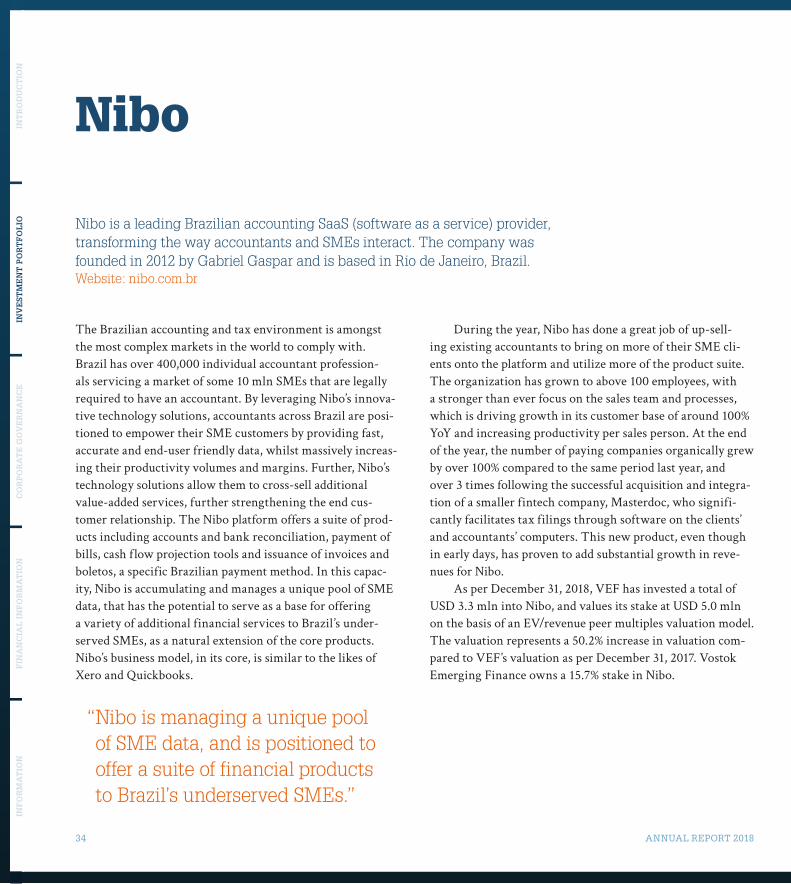
The Brazilian accounting and tax environment is amongst the most complex markets in the world to comply with. Brazil has over 400,000 individual accountant profession-als servicing a market of some 10 mln SMEs that are legally required to have an accountant. By leveraging Nibo’s innova-tive technology solutions, accountants across Brazil are posi-tioned to empower their SME customers by providing fast, accurate and end-user friendly data, whilst massively increas-ing their productivity volumes and margins. Further, Nibo’s technology solutions allow them to cross-sell additional value-added services, further strengthening the end cus-tomer relationship. The Nibo platform offers a suite of prod-ucts including accounts and bank reconciliation, payment of bills, cash flow projection tools and issuance of invoices and boletos, a specific Brazilian payment method. In this capac-ity, Nibo is accumulating and manages a unique pool of SME data, that has the potential to serve as a base for offering a variety of additional financial services to Brazil’s under-served SMEs, as a natural extension of the core products. Nibo’s business model, in its core, is similar to the likes of Xero and Quickbooks.
“ Nibo is managing a unique pool of SME data, and is positioned to offer a suite of financial products to Brazil’s underserved SMEs.”
Nibo
Nibo is a leading Brazilian accounting SaaS (software as a service) provider, transforming the way accountants and SMEs interact. The company was founded in 2012 by Gabriel Gaspar and is based in Rio de Janeiro, Brazil. Website: nibo.com.br
During the year, Nibo has done a great job of up-sell-ing existing accountants to bring on more of their SME cli-ents onto the platform and utilize more of the product suite. The organization has grown to above 100 employees, with a stronger than ever focus on the sales team and processes, which is driving growth in its customer base of around 100% YoY and increasing productivity per sales person. At the end of the year, the number of paying companies organically grew by over 100% compared to the same period last year, and over 3 times following the successful acquisition and integra-tion of a smaller fintech company, Masterdoc, who signifi-cantly facilitates tax filings through software on the clients’ and accountants’ computers. This new product, even though in early days, has proven to add substantial growth in reve-nues for Nibo.
As per December 31, 2018, VEF has invested a total of USD 3.3 mln into Nibo, and values its stake at USD 5.0 mln on the basis of an EV/revenue peer multiples valuation model. The valuation represents a 50.2% increase in valuation com-pared to VEF’s valuation as per December 31, 2017. Vostok Emerging Finance owns a 15.7% stake in Nibo.

ANNUAL REPORT 2018 35
Share of VEF’s Portfolio
VEF’s net invested amount as at December 31, 2018 (USD)
3.3 mln
Company founded
2012
VEF’s total value as at December 31, 2018 (USD)
5.0 mln
VEF’s first investment
2017
VEF’s ownership share
15.7%
2018 value development per share (USD)
+50%
Primary Region: Brazil
2.4%
Jan2016
Jul Jul JulSep Sep SepMar Mar MarMay May MayNov Nov Nov NovJan2017
Jan2018
Nibo: Monthly Revenue (bars) and Partner Accountants (line), Nov 2015–Dec 2018Source: Company data
36 ANNUAL REPORT 2018
INT
RO
DU
CT
ION
INV
EST
ME
NT
PO
RT
FO
LIO
CO
RP
OR
AT
E G
OV
ER
NA
NC
EF
INA
NC
IAL
IN
FO
RM
AT
ION
INF
OR
MA
TIO
N
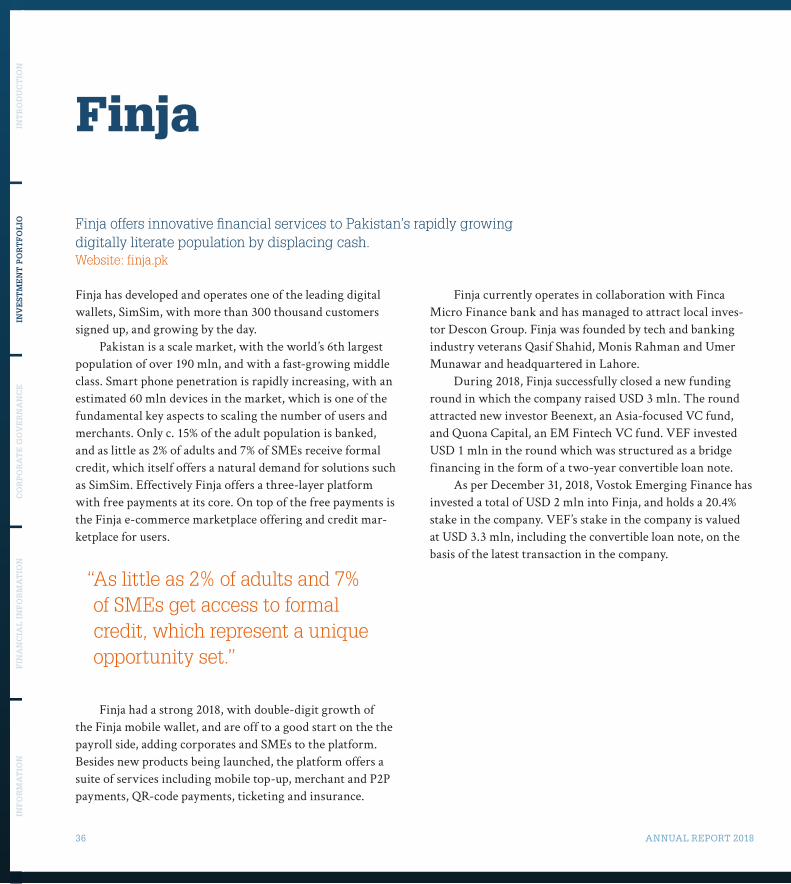
Finja has developed and operates one of the leading digital wallets, SimSim, with more than 300 thousand customers signed up, and growing by the day.
Pakistan is a scale market, with the world’s 6th largest population of over 190 mln, and with a fast-growing middle class. Smart phone penetration is rapidly increasing, with an estimated 60 mln devices in the market, which is one of the fundamental key aspects to scaling the number of users and merchants. Only c. 15% of the adult population is banked, and as little as 2% of adults and 7% of SMEs receive formal credit, which itself offers a natural demand for solutions such as SimSim. Effectively Finja offers a three-layer platform with free payments at its core. On top of the free payments is the Finja e-commerce marketplace offering and credit mar-ketplace for users.
“ As little as 2% of adults and 7% of SMEs get access to formal credit, which represent a unique opportunity set.”
Finja had a strong 2018, with double-digit growth of the Finja mobile wallet, and are off to a good start on the the payroll side, adding corporates and SMEs to the platform. Besides new products being launched, the platform offers a suite of services including mobile top-up, merchant and P2P payments, QR-code payments, ticketing and insurance.
Finja
Finja offers innovative financial services to Pakistan’s rapidly growing digitally literate population by displacing cash.Website: finja.pk
Finja currently operates in collaboration with Finca Micro Finance bank and has managed to attract local inves-tor Descon Group. Finja was founded by tech and banking industry veterans Qasif Shahid, Monis Rahman and Umer Munawar and headquartered in Lahore.
During 2018, Finja successfully closed a new funding round in which the company raised USD 3 mln. The round attracted new investor Beenext, an Asia-focused VC fund, and Quona Capital, an EM Fintech VC fund. VEF invested USD 1 mln in the round which was structured as a bridge financing in the form of a two-year convertible loan note.
As per December 31, 2018, Vostok Emerging Finance has invested a total of USD 2 mln into Finja, and holds a 20.4% stake in the company. VEF’s stake in the company is valued at USD 3.3 mln, including the convertible loan note, on the basis of the latest transaction in the company.

ANNUAL REPORT 2018 37
Share of VEF’s Portfolio
VEF’s net invested amount as at December 31, 2018 (USD)
2.0 mln
Company founded
2016
VEF’s total value as at December 31, 2018 (USD)
3.3 mln
VEF’s first investment
2016
VEF’s ownership share
20.4%
2018 value development per share (USD)
+95%
Primary Region: Pakistan
1.6%
Jan2017
JulApr Oct JulJan2018
OctApr
Finja: Wallets (bars) and Transactions (line), Oct 2016–Dec 2018Source: Company data
Oct
38 ANNUAL REPORT 2018
INT
RO
DU
CT
ION
INV
EST
ME
NT
PO
RT
FO
LIO
CO
RP
OR
AT
E G
OV
ER
NA
NC
EF
INA
NC
IAL
IN
FO
RM
AT
ION
INF
OR
MA
TIO
N
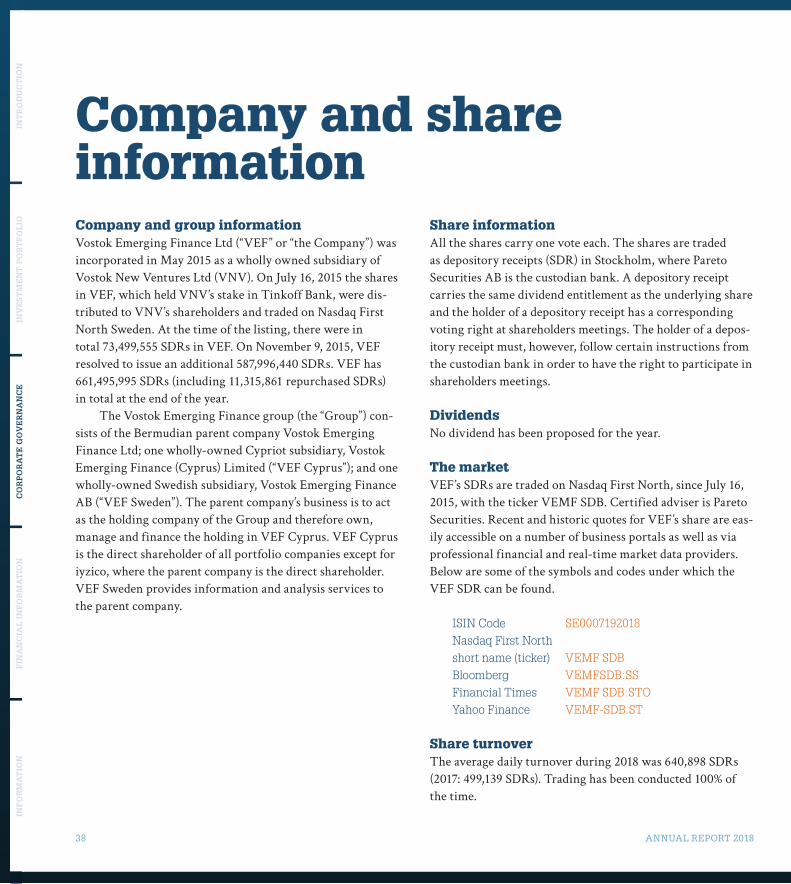
Company and share informationCompany and group informationVostok Emerging Finance Ltd (“VEF” or “the Company”) was incorporated in May 2015 as a wholly owned subsidiary of Vostok New Ventures Ltd (VNV). On July 16, 2015 the shares in VEF, which held VNV’s stake in Tinkoff Bank, were dis-tributed to VNV’s shareholders and traded on Nasdaq First North Sweden. At the time of the listing, there were in total 73,499,555 SDRs in VEF. On November 9, 2015, VEF resolved to issue an additional 587,996,440 SDRs. VEF has 661,495,995 SDRs (including 11,315,861 repurchased SDRs) in total at the end of the year.
The Vostok Emerging Finance group (the “Group”) con-sists of the Bermudian parent company Vostok Emerging Finance Ltd; one wholly-owned Cypriot subsidiary, Vostok Emerging Finance (Cyprus) Limited (“VEF Cyprus”); and one wholly-owned Swedish subsidiary, Vostok Emerging Finance AB (“VEF Sweden”). The parent company’s business is to act as the holding company of the Group and therefore own, manage and finance the holding in VEF Cyprus. VEF Cyprus is the direct shareholder of all portfolio companies except for iyzico, where the parent company is the direct shareholder. VEF Sweden provides information and analysis services to the parent company.
Share informationAll the shares carry one vote each. The shares are traded as depository receipts (SDR) in Stockholm, where Pareto Securities AB is the custodian bank. A depository receipt carries the same dividend entitlement as the underlying share and the holder of a depository receipt has a corresponding voting right at shareholders meetings. The holder of a depos-itory receipt must, however, follow certain instructions from the custodian bank in order to have the right to participate in shareholders meetings.
DividendsNo dividend has been proposed for the year.
The marketVEF’s SDRs are traded on Nasdaq First North, since July 16, 2015, with the ticker VEMF SDB. Certified adviser is Pareto Securities. Recent and historic quotes for VEF’s share are eas-ily accessible on a number of business portals as well as via professional financial and real-time market data providers. Below are some of the symbols and codes under which the VEF SDR can be found.
ISIN Code SE0007192018Nasdaq First North short name (ticker) VEMF SDBBloomberg VEMFSDB:SSFinancial Times VEMF SDB:STOYahoo Finance VEMF-SDB.ST
Share turnoverThe average daily turnover during 2018 was 640,898 SDRs (2017: 499,139 SDRs). Trading has been conducted 100% of the time.

ANNUAL REPORT 2018 39
Major shareholdersAs per December 31, 2018 Holding, SDRs Holding, %
Libra Fund* 161,110,674 24.4%Ruane Cunniff & Goldfarb* 118,878,736 18.0%Fidelity FIL 66,149,599 10.0%Swedbank Robur Funds 57,674,245 8.7%Wellington Management* 33,736,296 5.1%Alecta Pension Insurance 33,500,000 5.1%Bank Julius Baer & Co 18,354,000 2.8%LGT Bank 18,011,000 2.7%Svenska Handelsbanken Luxembourg 15,288,000 2.3%Avanza Pension 9,622,483 1.5%10 largest owners 532,325,033 80.5%Other holders (approx. 7,440)** 129,170,962 19.5%Total 661,495,995 100.0%Based on Euroclear Sweden AB data and holdings known to the Company. * Holding as per the latest notification to the Company.** Includes 11,315,861 repurchased SDRs
VEF share (SDR) price development and turnoverJuly 16, 2015–December 31, 2018
VEF SDR Price (SEK, left-hand scale) MSCI Emerging Markets Index (adjusted, left-hand scale) VEF SDR average daily turnover per month (Million SDRs, right-hand scale)
SEKMillion SDRs
0 0
0.5 1
1.0 2
1.5 3
2.0
2.5
2016 2017 2018
40 ANNUAL REPORT 2018
INT
RO
DU
CT
ION
INV
EST
ME
NT
PO
RT
FO
LIO
CO
RP
OR
AT
E G
OV
ER
NA
NC
EF
INA
NC
IAL
IN
FO
RM
AT
ION
INF
OR
MA
TIO
N
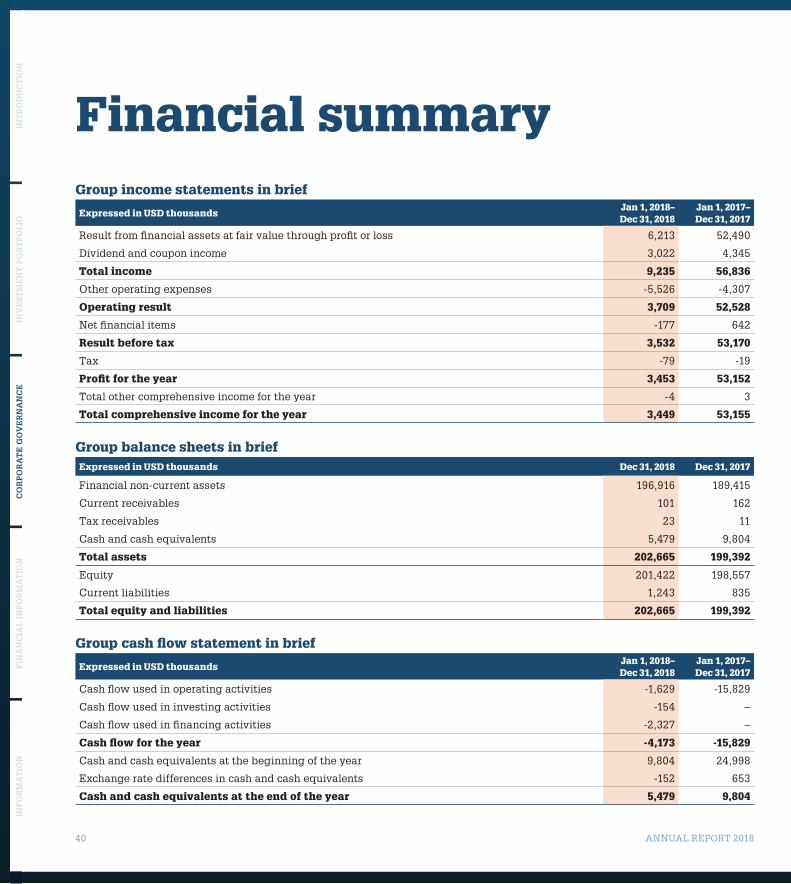
Group income statements in brief
Expressed in USD thousandsJan 1, 2018– Dec 31, 2018
Jan 1, 2017– Dec 31, 2017
Result from financial assets at fair value through profit or loss 6,213 52,490
Dividend and coupon income 3,022 4,345
Total income 9,235 56,836
Other operating expenses -5,526 -4,307
Operating result 3,709 52,528
Net financial items -177 642
Result before tax 3,532 53,170
Tax -79 -19
Profit for the year 3,453 53,152
Total other comprehensive income for the year -4 3
Total comprehensive income for the year 3,449 53,155
Group balance sheets in briefExpressed in USD thousands Dec 31, 2018 Dec 31, 2017
Financial non-current assets 196,916 189,415
Current receivables 101 162
Tax receivables 23 11
Cash and cash equivalents 5,479 9,804
Total assets 202,665 199,392
Equity 201,422 198,557
Current liabilities 1,243 835
Total equity and liabilities 202,665 199,392
Group cash flow statement in brief
Expressed in USD thousandsJan 1, 2018– Dec 31, 2018
Jan 1, 2017– Dec 31, 2017
Cash flow used in operating activities -1,629 -15,829
Cash flow used in investing activities -154 –
Cash flow used in financing activities -2,327 –
Cash flow for the year -4,173 -15,829
Cash and cash equivalents at the beginning of the year 9,804 24,998
Exchange rate differences in cash and cash equivalents -152 653
Cash and cash equivalents at the end of the year 5,479 9,804
Financial summary
ANNUAL REPORT 2018 41
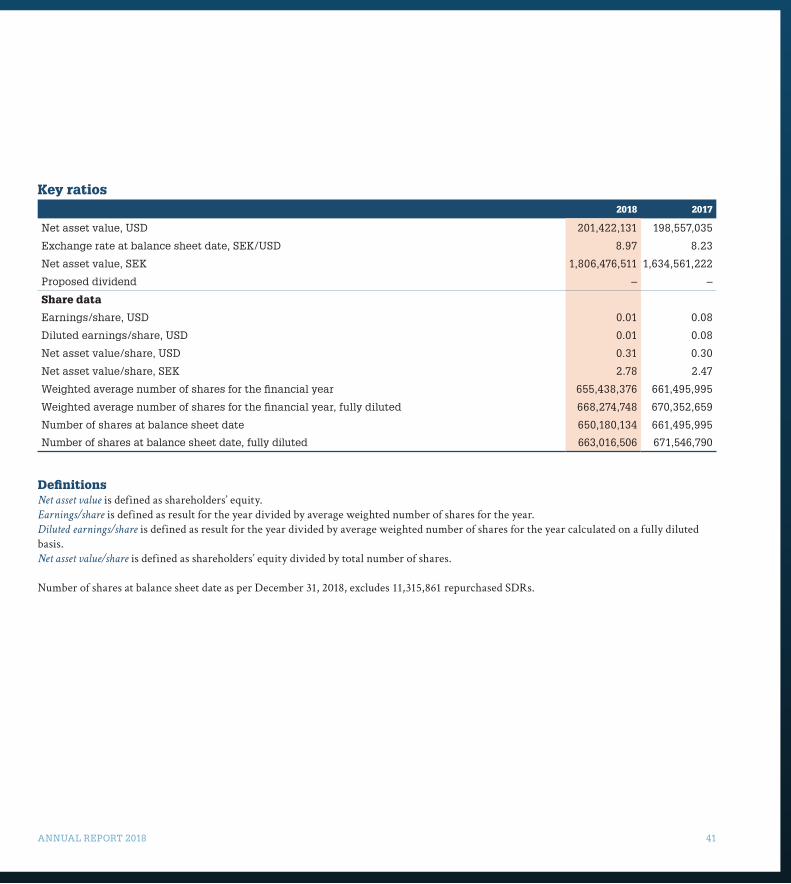
Key ratios2018 2017
Net asset value, USD 201,422,131 198,557,035
Exchange rate at balance sheet date, SEK/USD 8.97 8.23
Net asset value, SEK 1,806,476,511 1,634,561,222
Proposed dividend – –
Share data
Earnings/share, USD 0.01 0.08
Diluted earnings/share, USD 0.01 0.08
Net asset value/share, USD 0.31 0.30
Net asset value/share, SEK 2.78 2.47
Weighted average number of shares for the financial year 655,438,376 661,495,995
Weighted average number of shares for the financial year, fully diluted 668,274,748 670,352,659
Number of shares at balance sheet date 650,180,134 661,495,995
Number of shares at balance sheet date, fully diluted 663,016,506 671,546,790
DefinitionsNet asset value is defined as shareholders’ equity.Earnings/share is defined as result for the year divided by average weighted number of shares for the year.Diluted earnings/share is defined as result for the year divided by average weighted number of shares for the year calculated on a fully diluted basis.Net asset value/share is defined as shareholders’ equity divided by total number of shares.
Number of shares at balance sheet date as per December 31, 2018, excludes 11,315,861 repurchased SDRs.
42 ANNUAL REPORT 2018
INT
RO
DU
CT
ION
INV
EST
ME
NT
PO
RT
FO
LIO
CO
RP
OR
AT
E G
OV
ER
NA
NC
EF
INA
NC
IAL
IN
FO
RM
AT
ION
INF
OR
MA
TIO
N
Corporate governance
Board of DirectorsLars O GrönstedtChairman of the BoardAppointed: Chairman and member of the Board since 2015Nationality: Swedish citizenBorn: 1954Independence: Independent of the Company, management and major shareholders.Education: BA in languages and literature from Stockholm University, and a MBA from Stockholm School of Economics. Previous experience and other significant positions: Mr. Grönstedt spent most of his professional life at the Swedish bank Handelsbanken. He was CEO of the bank between 2001–2006, and Chairman of the Board between 2006–2008. Today he is, among other things, senior advisor to Nord Stream 2, chairman of Manetos Smart Buildings, Realcap Ventures and Vostok New Ventures Ltd, as well as deputy chairman of the Swedish National Debt Office and speaker of the elected body of representatives of Trygg-Stiftelsen. Holdings in VEF: 130,000 SDRs. Remuneration: USD 65 thousand. No agreement regarding severance pay or pension.
Per BriliothBoard memberAppointed: Member of the Board since 2015Nationality: Swedish citizenBorn: 1969Independence: Independent of the Company, management and major shareholders.Education: Graduate of Stockholm University and a Master of Finance from London Business School. Previous experience and other significant positions: Between 1994 and 2000, Per Brilioth was head of the Emerging Markets sec-tion at the Swedish investment bank Hagströmer & Qviberg
and he has worked close to the Russian stock market for a number of years. Since 2001, Per Brilioth is the Managing Director of Vostok New Ventures Ltd. He is the Chairman of the board of Pomegranate Investment AB and member of the boards of Vostok New Ventures Ltd and LeoVegas AB. Holdings in VEF: 2,790,000 SDRs. Remuneration: USD 29 thousand. No agreement regarding severance pay or pension.
Voria FattahiBoard memberAppointed: Member of the Board since 2016Nationality: Swedish citizenBorn: 1982Independence: Independent of the Company, management and major shareholders.Education: Master of Science degree in Business and Economics from the Stockholm School of Economics and an MBA from INSEAD.Previous experience and other significant positions: In August 2018, Voria Fattahi joined Sprints Capital, focusing on invest-ments in tech-enabled companies primarily in Europe. Prior to joining Sprints Capital, Voria Fattahi served as Investment Director at Volati AB between 2015-2018, focusing on invest-ments in Nordic companies that spans several different sectors. Mr. Fattahi also served as Investment Director at Kinnevik AB between 2011–2015, with a key focus on investments in digi-tal businesses primarily in the financial services sector in both developed and emerging markets. He has previously worked at Apax Partners, focusing on investments in financial services companies globally and at JP Morgan in the financial institu-tions group. He is a member of the board of Hittapunktse. Holdings in VEF: 439,703 SDRs. Remuneration: USD 29 thousand. No agreement regarding severance pay or pension.
ANNUAL REPORT 2018 43
Milena IvanovaBoard memberAppointed: Member of the Board since 2015Nationality: Bulgarian citizenBorn: 1975Independence: Independent of the Company, management and major shareholders. Education: An MBA from INSEAD, France and a bachelor in European Business from University of Lincolnshire and Humberside, UK. She completed the International Directors Program at INSEAD, France in 2018 and is in the process of becoming a certified Director.Previous experience and other significant positions: An experi-enced executive with background in financial institutions, that spans work across corporate finance, equity research and asset management. Professional experience focused on emerging markets over a period of twenty years including roles in Poland, Kazakhstan, Russia in addition to London and Vienna. Acts as an independent advisor, a coach and mentor since 2013. Milena Ivanova served as the Deputy Head of Equity Research for Renaissance Capital and was the firm’s strategist for Russia, based in Moscow until the end of 2012. She joined Renaissance Capital in early 2008 as the bank’s analyst for Central Asia based in Almaty, and subse-quently served as Head for Research and Equities for Central Asia. Previously, Milena Ivanova has, among other things, worked for UniCredit Markets & Investment Banking (CAIB) as an analyst in the equity research banking team, responsi-ble for CEE regional financial sector coverage and individual banking stocks. Holdings in VEF: 600,000 SDRs. Remuneration: USD 29 thousand. No agreement regarding severance pay or pension.
Ranjan TandonBoard memberAppointed: Member of the Board since 2017Nationality: US citizenBorn: 1951Independence: Independent of the Company and management but not independent of major shareholders. Education: Degree in Chemical Engineering from the Indian Institute of Technology in Kanpur, India and a graduate of Harvard Business School.Previous experience and other significant positions: Ranjan Tandon is Founder and Chairman of Libra Advisors, a New York hedge fund established in 1990, which was converted to a family office in 2012. Barron’s had consistently ranked Libra – a long/short fund with a focus on domestic and emerging market equities, in the top 100 Hedge funds. He has held several operating posi-tions with DCM in India and Halliburton in Europe; was CFO of InterMarine in Texas; and a financial Executive with Merrill Lynch before following his passion for investing. He is a board member of the NYU Tandon Engineering School, Rubicon Limited and the Carl Schurz Park Conservancy. Holdings in VEF: 161,110,674 SDRs through Libra Fund. Remuneration: USD 29 thousand. No agreement regarding severance pay or pension.
David NangleManaging Director and Board memberAppointed: Member of the Board since 2015Nationality: Irish citizenBorn: 1975Independence: Not independent of the Company and manage-ment but independent of major shareholders.Education: Degree in B. Comm International (French) from University College Dublin, Ireland.
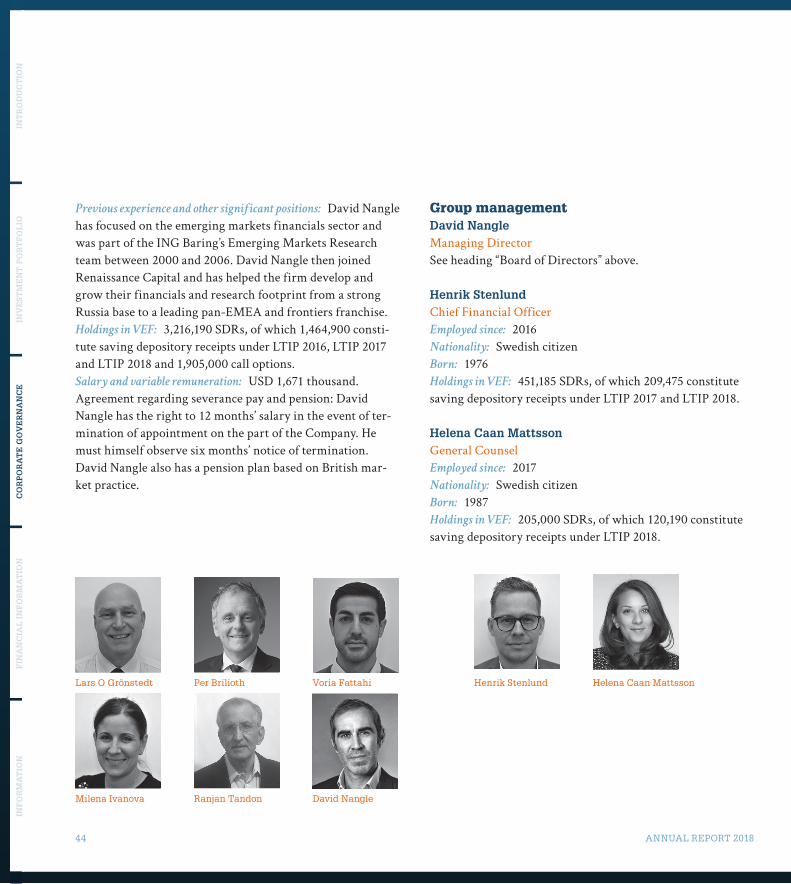
44 ANNUAL REPORT 2018
INT
RO
DU
CT
ION
INV
EST
ME
NT
PO
RT
FO
LIO
CO
RP
OR
AT
E G
OV
ER
NA
NC
EF
INA
NC
IAL
IN
FO
RM
AT
ION
INF
OR
MA
TIO
N
Previous experience and other significant positions: David Nangle has focused on the emerging markets financials sector and was part of the ING Baring’s Emerging Markets Research team between 2000 and 2006. David Nangle then joined Renaissance Capital and has helped the firm develop and grow their financials and research footprint from a strong Russia base to a leading pan-EMEA and frontiers franchise. Holdings in VEF: 3,216,190 SDRs, of which 1,464,900 consti-tute saving depository receipts under LTIP 2016, LTIP 2017 and LTIP 2018 and 1,905,000 call options. Salary and variable remuneration: USD 1,671 thousand. Agreement regarding severance pay and pension: David Nangle has the right to 12 months’ salary in the event of ter-mination of appointment on the part of the Company. He must himself observe six months’ notice of termination. David Nangle also has a pension plan based on British mar-ket practice.
Group managementDavid NangleManaging Director See heading “Board of Directors” above.
Henrik StenlundChief Financial Officer Employed since: 2016Nationality: Swedish citizenBorn: 1976Holdings in VEF: 451,185 SDRs, of which 209,475 constitute saving depository receipts under LTIP 2017 and LTIP 2018.
Helena Caan MattssonGeneral CounselEmployed since: 2017Nationality: Swedish citizenBorn: 1987Holdings in VEF: 205,000 SDRs, of which 120,190 constitute saving depository receipts under LTIP 2018.
Henrik Stenlund Helena Caan MattssonLars O Grönstedt Per Brilioth Voria Fattahi
Milena Ivanova Ranjan Tandon David Nangle

ANNUAL REPORT 2018 45
Organisation of activitiesThe Board of Directors meets in person at least three times a year and more frequently if needed. In addition to this, meet-ings are conducted by telephone conference when necessary. Between meetings, the Managing Director has regular con-tact with the Chairman of the Board and the other Board members. The Board of Directors adopts decisions on overall issues affecting the Group.
The Managing Director manages the Group’s day-to-day activities and prepares investment recommendations in coop-eration with management of the Group.
Recommendations on investments are made by the Board of Directors of the parent company to the board of VEF Cyprus. Investment decisions are then taken by the board of VEF Cyprus.
AuditorsPricewaterhouseCoopers AB
Ulrika RamsvikBorn 1973. Authorised Public Accountant, Auditor-in-charge. Auditor in the Company since 2015. PricewaterhouseCoopers AB, Gothenburg, Sweden.
Bo HjalmarssonBorn 1960. Authorised Public Accountant, Co-signing auditor. Auditor in the Company since 2015. PricewaterhouseCoopers AB, Stockholm, Sweden.
46 ANNUAL REPORT 2018
INT
RO
DU
CT
ION
INV
EST
ME
NT
PO
RT
FO
LIO
CO
RP
OR
AT
E G
OV
ER
NA
NC
EF
INA
NC
IAL
IN
FO
RM
AT
ION
INF
OR
MA
TIO
N
Administrative report
The Board of Directors and the Managing Director of
Vostok Emerging Finance Ltd, corporate identity number
50298, hereby present the annual report for the financial
year January 1, 2018–December 31, 2018.
Group net resultsDuring the year, the result from financial assets at fair value through profit or loss amounted to USD 6.21 mln (2017: 52.49 mln), primarily driven by the mark up in valuation of iyzico, TransferGo, FinanZero and Magnetis.
Net operating expenses amounted to USD -5.53 (2017: -4.31 mln).
Net financial items were USD -0.18 mln (2017: 0.64 mln)Net result of the year was USD 3.45 mln (2017: 53.15
mln). Total shareholders’ equity amounted to USD 201.42 mln on December 31, 2018 (December 31, 2017: 198.56 mln).
Liquid assetsThe liquid assets of the Group, defined as cash and bank deposits adjusted for concluded but not yet settled share transactions, amounted to USD 5.48 mln on December 31, 2018 (December 31, 2017: 9.80 mln). VEF has also invest-ments in money markets funds, as part of its liquidity man-agement operations. As per December 31, 2018 the liquid-ity investments are valued at USD 44.90 mln (December 31, 2017: 5.52 mln).
Portfolio performanceVEF’s NAV per share increased by 3.2% in USD in 2018. During the same period, the MSCI Emerging Markets index decreased by 16.9% in USD terms. VEF’s share price decreased by 24.6% in USD and 17.8% in SEK over the year.
Major events during the yearDuring 2018, gross investments in financial assets were USD 80.62 mln (2017: 79.54 mln), of which > USD 15.00 mln relates to investment in Konfio > USD 3.05 mln investment in JUMO > USD 2.67 mln investment in TransferGo > USD 2.13 mln investment in REVO > USD 1.75 mln investment in iyzico> USD 1.00 mln investment in Finja > USD 0.86 mln investment in FinanZero, > USD 0.70 mln investment in Magnetis and > USD 53.46 mln concern liquidity placements.
Gross divestment in financial assets were USD 79.34 mln (2017: 62.78 mln), of which > USD 65.34 mln relates to divestments in Tinkoff Bank; and> USD 14.0 mln relates to divestments in liquidity
placements.
Moreover, VEF repurchased 11,315,861 SDRs in the Company for the purpose of delivery of SDRs in connection with the Company’s long-term incentive programs.
The largest revaluations of financial assets during 2018, were iyzico (USD 15.11 mln), Guiabolso (USD -14.74 mln), TransferGo (USD 3.37 mln), Tinkoff Bank (USD -3.35 mln), Magnetis (USD 2.11 mln) and FinanZero (USD 1.99 mln).
Major events after the reporting yearDuring January and February 2019, VEF sold its remaining 508,258 shares in Tinkoff Bank, at a value of USD 8.71 mln.
After the end of the year, VEF has repurchased 630,000 Swedish Depository Receipts (SDRs) in the company for the purpose of delivery of SDRs in connection with the Company’s long-term incentive programs.
ANNUAL REPORT 2018 47
Parent companyThe parent company’s business is to act as the holding com-pany of the Group and therefore own, manage and finance the holding in VEF Cyprus. The net result for the year was USD 17.02 mln (2017: 3.22 mln). Financial assets at fair value through profit or loss refers to liquidity management invest-ments and holdings in iyzico.
Future development and risksVEF does not provide any prognosis on the future develop-ment for 2019, but is considered well positioned financially for 2019. VEF continuously have the financial capacity to run the business in accordance with its strategy and objectives.
For a detailed account of risks associated with investing in VEF and VEF’s business, please refer to Note 4.
Share dataVEF has in total 661,495,995 SDRs. During 2018, VEF has repurchased 11,315,861 SDRs. Number of outstanding shares per December 31, 2018 is 650,180,134.
Board meetingsThe Board of Directors currently comprises six Directors. During the year, the Board has held 13 Board meetings, of which five in person, six by telephone conference, and has passed two resolutions by circulation. Board meetings are conducted in English.
Remuneration principles for Senior ManagementThe remuneration principles currently in force were adopted at the Annual General Meeting of the Company held on May 17, 2018. The principles read as follows:
“The remuneration to the Managing Director and other mem-
bersoftheseniormanagementshallconsistoffixedsalary,varia-
bleremuneration,otherbenefitsandpensionbenefits.Exceptforthe
ManagingDirector,theseniormanagementcurrentlyincludestwo
individuals.Thetotalremunerationshallcorrespondtotheprevail-
ingmarketconditionsandbecompetitive.Thefixedandvariable
remunerationshallcorrespondtotherespectiveindividual’srespon-
sibilityandauthority.Thevariablecomponentshould,inthefirst
instance,becoveredwithintheparametersoftheCompany’slong
termincentiveplanandshall,wherepayableinotherinstances,
berelatedtomilestoneorextraordinaryaccomplishmentsofthe
Companyand/oritsportfolioinvestments,e.g.particularlysuccess-
fulinvestments,exitsorsimilarevents.Theperiodofnoticeofter-
minationofemploymentshallbethreetosixmonthsintheeventof
terminationbythememberoftheseniormanagement.Intheevent
ofterminationbytheCompany,thetotaloftheperiodofnoticeof
terminationandtheperiodduringwhichseverancecompensationis
payableshallnotexceed12months.Pensionbenefitsshallbeeither
benefit-basedorcontributionbasedoracombinationthereof,with
individualretirementages.Benefitbasedpensionbenefitsarecondi-
tionalonthebenefitsbeingearnedduringapredeterminedperiodof
employment.TheBoardofDirectorsshallbeentitledtodeviatefrom
theseguidelinesinindividualcasesshouldspecialreasonsexist.”
The Board has not deviated from these principles. The Board has not yet proposed new remuneration principles for 2019 and will do so in connection with its proposals for the 2019 AGM.
Treatment of retained earningsThe Group’s total retained earnings amount to USD 106.35 mln. The Board of Directors propose that the retained earnings and the additional paid in capital of the parent company, USD 156.11 mln, which include the year’s profit of USD 17.02 mln, be brought forward, and that no dividends be paid for the year.
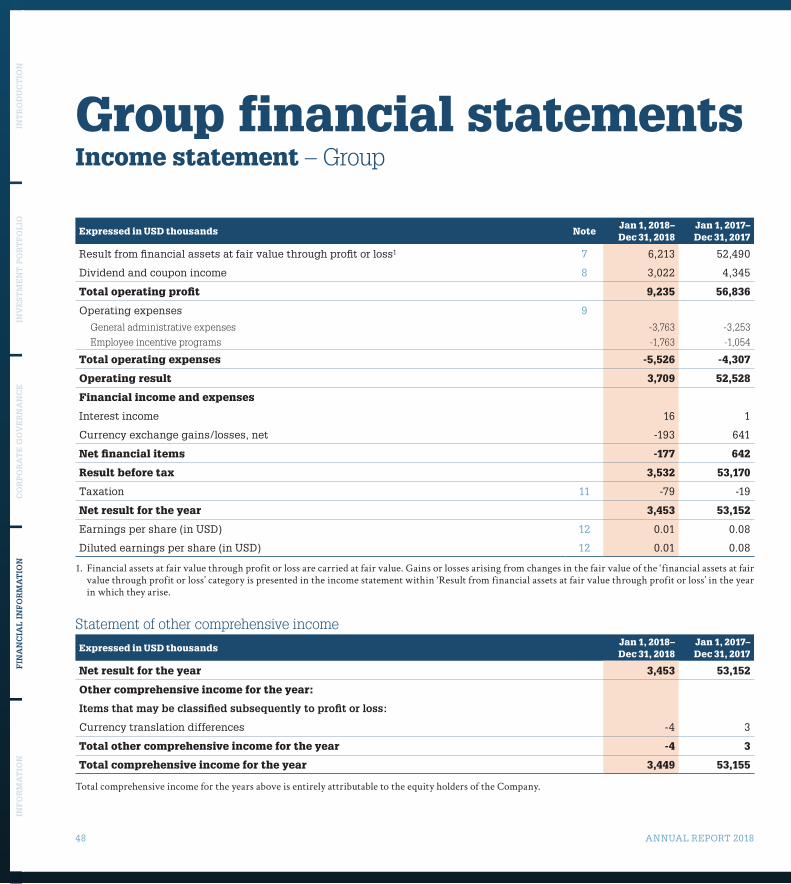
48 ANNUAL REPORT 2018
INT
RO
DU
CT
ION
INV
EST
ME
NT
PO
RT
FO
LIO
CO
RP
OR
AT
E G
OV
ER
NA
NC
EF
INA
NC
IAL
IN
FO
RM
AT
ION
INF
OR
MA
TIO
N
Group financial statementsIncome statement – Group
Expressed in USD thousands NoteJan 1, 2018– Dec 31, 2018
Jan 1, 2017– Dec 31, 2017
Result from financial assets at fair value through profit or loss¹ 7 6,213 52,490
Dividend and coupon income 8 3,022 4,345
Total operating profit 9,235 56,836
Operating expenses 9
General administrative expenses -3,763 -3,253
Employee incentive programs -1,763 -1,054
Total operating expenses -5,526 -4,307
Operating result 3,709 52,528
Financial income and expenses
Interest income 16 1
Currency exchange gains/losses, net -193 641
Net financial items -177 642
Result before tax 3,532 53,170
Taxation 11 -79 -19
Net result for the year 3,453 53,152
Earnings per share (in USD) 12 0.01 0.08
Diluted earnings per share (in USD) 12 0.01 0.08
1. Financial assets at fair value through profit or loss are carried at fair value. Gains or losses arising from changes in the fair value of the ‘financial assets at fair value through profit or loss’ category is presented in the income statement within ‘Result from financial assets at fair value through profit or loss’ in the year in which they arise.
Statement of other comprehensive income
Expressed in USD thousandsJan 1, 2018– Dec 31, 2018
Jan 1, 2017– Dec 31, 2017
Net result for the year 3,453 53,152
Other comprehensive income for the year:
Items that may be classified subsequently to profit or loss:
Currency translation differences -4 3
Total other comprehensive income for the year -4 3
Total comprehensive income for the year 3,449 53,155
Total comprehensive income for the years above is entirely attributable to the equity holders of the Company.
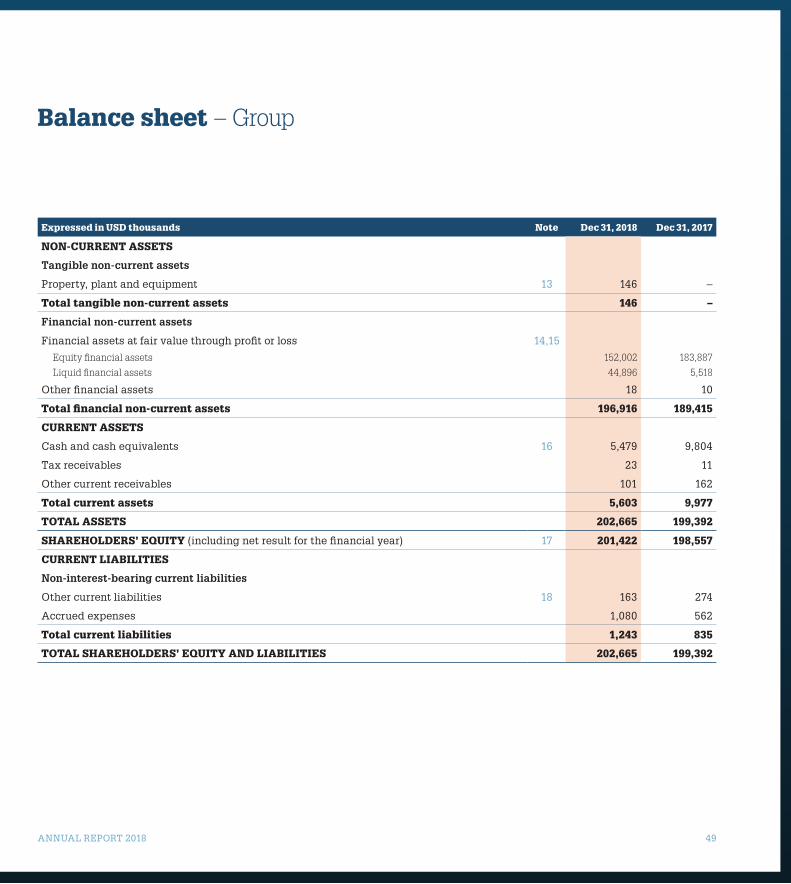
ANNUAL REPORT 2018 49
Expressed in USD thousands Note Dec 31, 2018 Dec 31, 2017
NON-CURRENT ASSETS
Tangible non-current assets
Property, plant and equipment 13 146 –
Total tangible non-current assets 146 –
Financial non-current assets
Financial assets at fair value through profit or loss 14,15
Equity financial assets 152,002 183,887
Liquid financial assets 44,896 5,518
Other financial assets 18 10
Total financial non-current assets 196,916 189,415
CURRENT ASSETS
Cash and cash equivalents 16 5,479 9,804
Tax receivables 23 11
Other current receivables 101 162
Total current assets 5,603 9,977
TOTAL ASSETS 202,665 199,392
SHAREHOLDERS’ EQUITY (including net result for the financial year) 17 201,422 198,557
CURRENT LIABILITIES
Non-interest-bearing current liabilities
Other current liabilities 18 163 274
Accrued expenses 1,080 562
Total current liabilities 1,243 835
TOTAL SHAREHOLDERS’ EQUITY AND LIABILITIES 202,665 199,392
Balance sheet – Group
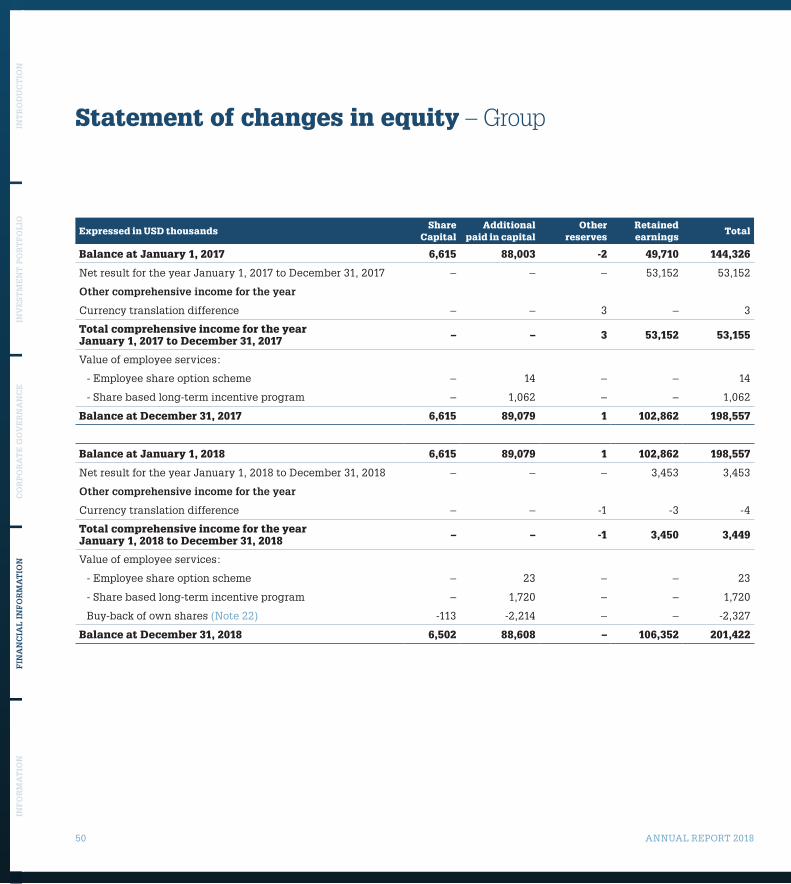
50 ANNUAL REPORT 2018
INT
RO
DU
CT
ION
INV
EST
ME
NT
PO
RT
FO
LIO
CO
RP
OR
AT
E G
OV
ER
NA
NC
EF
INA
NC
IAL
IN
FO
RM
AT
ION
INF
OR
MA
TIO
N
Expressed in USD thousandsShare
CapitalAdditional
paid in capitalOther
reservesRetained earnings
Total
Balance at January 1, 2017 6,615 88,003 -2 49,710 144,326
Net result for the year January 1, 2017 to December 31, 2017 – – – 53,152 53,152
Other comprehensive income for the year
Currency translation difference – – 3 – 3
Total comprehensive income for the year January 1, 2017 to December 31, 2017 – – 3 53,152 53,155
Value of employee services:
- Employee share option scheme – 14 – – 14
- Share based long-term incentive program – 1,062 – – 1,062
Balance at December 31, 2017 6,615 89,079 1 102,862 198,557
Balance at January 1, 2018 6,615 89,079 1 102,862 198,557
Net result for the year January 1, 2018 to December 31, 2018 – – – 3,453 3,453
Other comprehensive income for the year
Currency translation difference – – -1 -3 -4
Total comprehensive income for the year January 1, 2018 to December 31, 2018 – – -1 3,450 3,449
Value of employee services:
- Employee share option scheme – 23 – – 23
- Share based long-term incentive program – 1,720 – – 1,720
Buy-back of own shares (Note 22) -113 -2,214 – – -2,327
Balance at December 31, 2018 6,502 88,608 – 106,352 201,422
Statement of changes in equity – Group
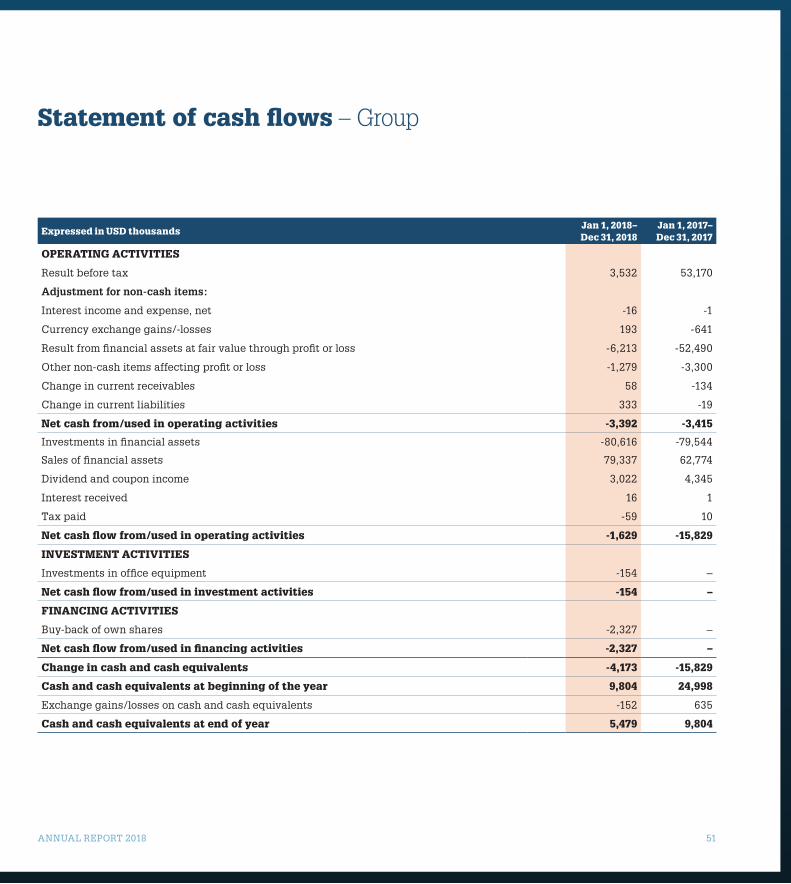
ANNUAL REPORT 2018 51
Expressed in USD thousandsJan 1, 2018– Dec 31, 2018
Jan 1, 2017– Dec 31, 2017
OPERATING ACTIVITIES
Result before tax 3,532 53,170
Adjustment for non-cash items:
Interest income and expense, net -16 -1
Currency exchange gains/-losses 193 -641
Result from financial assets at fair value through profit or loss -6,213 -52,490
Other non-cash items affecting profit or loss -1,279 -3,300
Change in current receivables 58 -134
Change in current liabilities 333 -19
Net cash from/used in operating activities -3,392 -3,415
Investments in financial assets -80,616 -79,544
Sales of financial assets 79,337 62,774
Dividend and coupon income 3,022 4,345
Interest received 16 1
Tax paid -59 10
Net cash flow from/used in operating activities -1,629 -15,829
INVESTMENT ACTIVITIES
Investments in office equipment -154 –
Net cash flow from/used in investment activities -154 –
FINANCING ACTIVITIES
Buy-back of own shares -2,327 –
Net cash flow from/used in financing activities -2,327 –
Change in cash and cash equivalents -4,173 -15,829
Cash and cash equivalents at beginning of the year 9,804 24,998
Exchange gains/losses on cash and cash equivalents -152 635
Cash and cash equivalents at end of year 5,479 9,804
Statement of cash flows – Group

52 ANNUAL REPORT 2018
INT
RO
DU
CT
ION
INV
EST
ME
NT
PO
RT
FO
LIO
CO
RP
OR
AT
E G
OV
ER
NA
NC
EF
INA
NC
IAL
IN
FO
RM
AT
ION
INF
OR
MA
TIO
N
Jan 1, 2018– Dec 31, 2018
Jan 1, 2017– Dec 31, 2017
Net asset value, USD 201,422,131 198,557,035
Exchange rate at balance sheet date, SEK/USD 8.97 8.23
Earnings/share, USD1 0.01 0.08
Diluted earnings/share, USD2 0.01 0.08
Net asset value/share, USD3 0.31 0.30
Net asset value/share, SEK4 2.78 2.47
Net asset value, SEK5 1,806,476,511 1,634,561,222
Weighted average number of shares for the financial year6 655,438,376 661,495,995
Weighted average number of shares for the financial year, fully diluted6 668,274,748 670,352,659
Number of shares at balance sheet date6 650,180,134 661,495,995
Number of shares at balance sheet date, fully diluted6 663,016,506 671,546,790
1. Earnings/share is defined as result for the year divided by average weighted number of shares for the year.2. Diluted earnings/share is defined as result for the year divided by average weighted number of shares for the year calculated on a fully
diluted basis.3. Net asset value/share is defined as shareholders’ equity divided by total number of shares. 4. Net asset value/share is defined as shareholders’ equity divided by total number of shares multiplied with the SEK/USD exchange rate at
balance sheet date5. Net asset value in USD multiplied with the SEK/USD exchange rate at balance sheet date6. Number of shares at balance sheet date as per December 31, 2018, excludes 11,315,861 repurchased SDRs.
Alternative performance measuresAs of July 3, 2016, new guidelines on APMs (Alternative Performance Measures) have been issued by ESMA (the European Securities and Markets Authority). APMs are finan-cial measures other than financial measures defined or speci-fied by International Financial Reporting Standards (IFRS).
Vostok Emerging Finance regularly uses alternative perfor-mance measures to enhance comparability from period to period and to give deeper information and provide meaningful supple-mental information to analysts, investors and other parties.
It is important to know that not all companies calculate alternative performance measures identically, therefore these measurements have limitations and should not be used as a sub-stitute for measures of performance in accordance with IFRS.
Below you find our presentation of the APMs and how we calculate these measures.
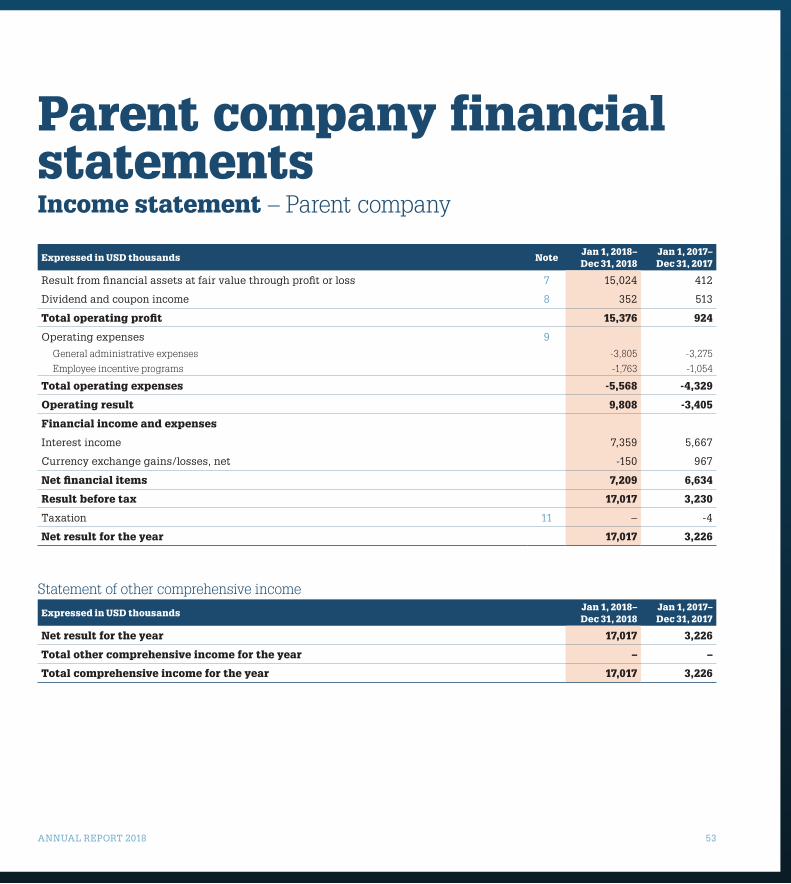
ANNUAL REPORT 2018 53
Expressed in USD thousands NoteJan 1, 2018– Dec 31, 2018
Jan 1, 2017– Dec 31, 2017
Result from financial assets at fair value through profit or loss 7 15,024 412
Dividend and coupon income 8 352 513
Total operating profit 15,376 924
Operating expenses 9
General administrative expenses -3,805 -3,275
Employee incentive programs -1,763 -1,054
Total operating expenses -5,568 -4,329
Operating result 9,808 -3,405
Financial income and expenses
Interest income 7,359 5,667
Currency exchange gains/losses, net -150 967
Net financial items 7,209 6,634
Result before tax 17,017 3,230
Taxation 11 – -4
Net result for the year 17,017 3,226
Statement of other comprehensive income
Expressed in USD thousandsJan 1, 2018– Dec 31, 2018
Jan 1, 2017– Dec 31, 2017
Net result for the year 17,017 3,226
Total other comprehensive income for the year – –
Total comprehensive income for the year 17,017 3,226
Parent company financial statementsIncome statement – Parent company
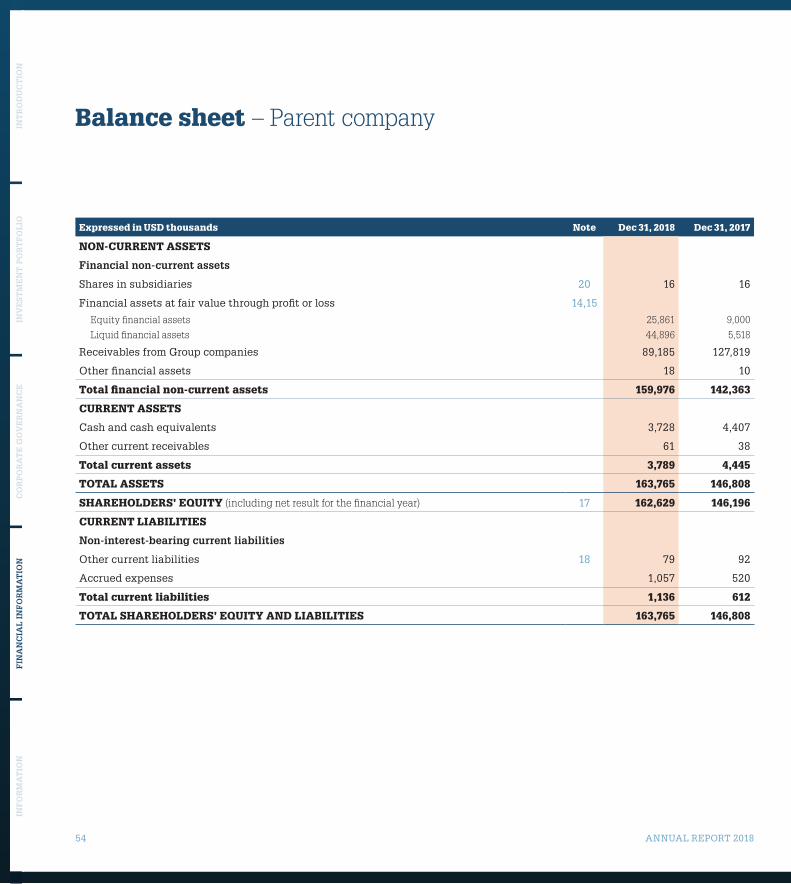
54 ANNUAL REPORT 2018
INT
RO
DU
CT
ION
INV
EST
ME
NT
PO
RT
FO
LIO
CO
RP
OR
AT
E G
OV
ER
NA
NC
EF
INA
NC
IAL
IN
FO
RM
AT
ION
INF
OR
MA
TIO
N
Expressed in USD thousands Note Dec 31, 2018 Dec 31, 2017
NON-CURRENT ASSETS
Financial non-current assets
Shares in subsidiaries 20 16 16
Financial assets at fair value through profit or loss 14,15
Equity financial assets 25,861 9,000
Liquid financial assets 44,896 5,518
Receivables from Group companies 89,185 127,819
Other financial assets 18 10
Total financial non-current assets 159,976 142,363
CURRENT ASSETS
Cash and cash equivalents 3,728 4,407
Other current receivables 61 38
Total current assets 3,789 4,445
TOTAL ASSETS 163,765 146,808
SHAREHOLDERS’ EQUITY (including net result for the financial year) 17 162,629 146,196
CURRENT LIABILITIES
Non-interest-bearing current liabilities
Other current liabilities 18 79 92
Accrued expenses 1,057 520
Total current liabilities 1,136 612
TOTAL SHAREHOLDERS’ EQUITY AND LIABILITIES 163,765 146,808
Balance sheet – Parent company

ANNUAL REPORT 2018 55
Expressed in USD thousandsShare
CapitalAdditional
paid in capitalOther
reservesRetained earnings
Total
Balance at January 1, 2017 6,615 88,003 – 47,276 141,893
Net result for the year January 1, 2017 to December 31, 2017 – – – 3,226 3,226
Other comprehensive income for the year
Currency translation difference – – – – –
Total comprehensive income for the year January 1, 2017 to December 31, 2017 – – – 3,226 3,226
Value of employee services:
- Employee share option scheme – 14 – – 14
- Share based long-term incentive program – 1,062 – – 1,062
Balance at December 31, 2017 6,615 89,079 – 50,502 146,196
Balance at January 1, 2018 6,615 89,079 – 50,502 146,196
Net result for the year January 1, 2018 to December 31, 2018 – – – 17,017 17,017
Other comprehensive income for the year
Currency translation difference – – – – –
Total comprehensive income for the year January 1, 2018 to December 31, 2018 – – – 17,017 17,017
Value of employee services:
- Employee share option scheme – 23 – – 23
- Share based long-term incentive program – 1,720 – – 1,720
Buy-back of own shares (Note 22) -113 -2,214 – – -2,327
Balance at December 31, 2018 6,502 88,608 – 67,519 162,629
Statement of changes in equity – Parent company

56 ANNUAL REPORT 2018
INT
RO
DU
CT
ION
INV
EST
ME
NT
PO
RT
FO
LIO
CO
RP
OR
AT
E G
OV
ER
NA
NC
EF
INA
NC
IAL
IN
FO
RM
AT
ION
INF
OR
MA
TIO
N
Expressed in USD thousandsJan 1, 2018– Dec 31, 2018
Jan 1, 2017– Dec 31, 2017
OPERATING ACTIVITIES
Result before tax 17,017 3,230
Adjustment for non-cash items:
Interest income -7,359 -5,668
Currency exchange gains/-losses 150 -967
Result from financial assets at fair value through profit or loss -15,024 -412
Other non-cash items affecting profit or loss 1,391 532
Change in current receivables 45,832 -33,900
Change in current liabilities 562 -169
Net cash from/used in operating activities 42,569 -37,354
Investments in financial assets -55,215 -13,223
Dividend income 352 513
Sales of financial assets 14,000 28,925
Interest received 16 1
Tax paid – –
Net cash flow from/used in operating activities 1,722 -21,138
INVESTING ACTIVITIES
Investments in subsidiaries – –
Net cash flow from/used in investing activities – –
FINANCING ACTIVITIES
Buy-back of own shares -2,327 –
Net cash flow from/used in financing activities -2,327 –
Change in cash and cash equivalents -605 -21,138
Cash and cash equivalents at beginning of the year 4,406 24,888
Exchange gains/losses on cash and cash equivalents -73 657
Cash and cash equivalents at end of year 3,728 4,407
Statement of cash flows – Parent company
ANNUAL REPORT 2018 57
Notes to the financial statements(Expressed in USD thousand unless indicated otherwise)
Note 1 General informationVostok Emerging Finance Ltd was incorporated and registered with the Bermuda Registrar of Companies on May 28, 2015 with registered number 50298. The registered office of the Company is in Hamilton, Bermuda (Clarendon House, 2 Church Street, Hamilton, Bermuda). On July 16, 2015 the shares in VEF, which held Vostok New Ventures’ (VNV) stake in Tinkoff Bank, were distributed to VNV’s shareholders by way of a mandatory redemption program and traded on Nasdaq First North Sweden. At the time of the listing, there were in total 73,499,555 SDRs in VEF. On November 9, 2015, VEF resolved to issue an additional 587,996,440 SDRs. The Company has in total 661,495,995 SDRs as at the end of the reporting year, including 11,315,861 repurchased SDRs.
In October 2016, two subsidiaries to Vostok Emerging Finance Ltd. were established. One Cypriot subsidiary, VEF Cyprus, for managing the invest-ment portfolio and one Swedish subsidiary, VEF Sweden, which provides business support services to the parent company.
VEF is an investment company whose business concept is to identify and invest in fintech companies in emerging markets with a bias for markets with scalable population and growth profiles for financial services.
These Group consolidated financial statements were authorised for issue by the Board of Directors on March 28, 2019. The Board of Directors propose that the retained earnings and the additional paid in capital of the parent company, USD 156.11 mln, which include the year’s profit of USD 17.02 mln, be brought forward, and that no dividends be paid for the year.
The principal accounting policies adopted in the preparation of these financial statements are set out below.
Note 2 Significant accounting principlesAccounting basisThe consolidated and the parent company financial statements are prepared in accordance with International Financial Reporting Standards, IFRS, as adopted by the EU, as at December 31, 2018. The consolidated financial statements have been prepared under the historical cost convention, as modified by the revaluation of financial assets at fair value through profit and loss. The preparation of financial statements in conformity with IFRS requires the use of certain critical accounting estimates. It also requires management to exercise its judgement in the process of applying the Group’s accounting policies. The areas involving a higher degree of judgement or complexity, or areas where assumptions and estimates are significant to the consolidated financial statements are disclosed in Note 3.
Changes in accounting policy and disclosuresNew and amended standards adopted by the GroupThe group has applied the following standards and amendments for the first time for their annual reporting period commencing January 1, 2018:> IFRS 9 Financial Instruments
> IFRS15RevenuefromContractswithCustomers.The group had to change its accounting policies following the adoption of IFRS 9 and IFRS 15. The new standards listed above did not have any impact on the amounts recognised in current or prior periods and are not expected to significantly affect future periods.
New standards and interpretations not yet adoptedA number of new standards and amendments to standards and interpreta-tions are effective for annual periods beginning after January 1, 2019 and have not been applied in preparing these consolidated financial statements.
IFRS16,‘Leases’, affects primarily the accounting by leases and will result in the recognition of almost all leases on balance sheet. The standard removes the current distinction between operating and financing leases and requires recognition of an asset (the right to use the leased item) and a financial lia-bility to pay rentals for virtually all lease contracts. An optional exemption exists for short-term and low-value leases. The income statement will also be affected because the total expense is typically higher in the earlier years of a lease and lower in later years. Additionally, operating expenses will be replaced with interest and depreciation, thereby increasing the operating result. Operating cash f lows will be higher as cash payments for the prin-cipal portion of the lease liability are classified within financing activities. Only the part of the payments that reflects interest can continue to be pre-sented as operating cash f lows. The accounting by lessors will not signifi-cantly change. Some differences may arise as a result of the new guidance on the definition of a lease. Under IFRS 16, a contract is, or contains, a lease if the contract conveys the right to control the use of an identified asset for a period of time in exchange for consideration. The standard is mandatory for financial years commencing on or after January 1, 2019. The new standard will not have any significant impact on the Group’s financial statements. As at the reporting date, the group has non-cancellable operating lease commitments of USD 0.25 mln which will increase non-current assets and interest-bearing liabilities in the opening balance of 2019. Currently the only type of leasing the Group is exposed to is rental of office space. The Group will apply the standard from its mandatory adoption date of January 1, 2019. The Group intends to apply the simplified transition approach and will not restate comparative amounts for the year prior to first adoption.
There are no other IFRSs or IFRIC interpretations that are not yet effec-tive that would be expected to have a material impact on the Group.

58 ANNUAL REPORT 2018
INT
RO
DU
CT
ION
INV
EST
ME
NT
PO
RT
FO
LIO
CO
RP
OR
AT
E G
OV
ER
NA
NC
EF
INA
NC
IAL
IN
FO
RM
AT
ION
INF
OR
MA
TIO
N
Financial periodThe financial year comprises the period January 1–December 31.
Principles of consolidation SubsidiariesSubsidiaries are all entities (including structured entities) over which the Group has control. The Group controls an entity when the Group is exposed to or has rights to variable returns from its involvement with the entity and has the ability to affect those returns through its power over the entity. Subsidiaries are fully consolidated from the date on which control is transferred to the Group. They are deconsolidated from the date that con-trol ceases. The Group applies the acquisition method to account for busi-ness combinations. Inter-company transactions, balances and unrealised gains on transactions between Group companies are eliminated. Unrealised losses are also eliminated. When necessary, amounts reported by subsidiar-ies have been adjusted to conform with the Group’s accounting policies.
In accordance with IFRS 10 Consolidated Financial Statements the Group values its investments (portfolio companies) at fair value. Vostok Emerging Finance falls within the classification of an investment company as its business concept is to use experience, expertise and a widespread net-work to identify and invest in assets with considerable potential for value appreciation and obtain a return.
Investments in associated companiesAssociated companies are all entities where the Group has the right to exer-cise significant influence, which is normally the case when the Group holds between 20% and 50% of the voting rights. As Vostok Emerging Finance falls within the classification of an investment company, all investments in associates are accounted for by applying fair value. On increase/decrease of the investments in associated companies, the Group makes an assessment of fair value for the total investment.
Segment reportingOperating segments are reported in a manner consistent with the internal reporting provided to the chief operating decision maker in the same way as for a Swedish company governed by the Swedish Companies Act and the Swedish Corporate Governance Code. The board of directors of an investment company is by necessity deeply involved in investment decisions and monitoring portfolio companies’ performance. The Board has therefore been identified as the chief operating decision maker of the Group for purposes of internal reporting. In the internal reporting of the Group, there is only one operating segment.
Foreign currency translationThe functional and presentational currency Items included in the financial statements are measured using the currency of the primary economic environment in which the entity operates (‘the functional currency’). The functional currency of the Group is USD, which is also the presentational currency. All amounts are stated in USD thou-sands if not otherwise stated.
Transactions and balancesTransactions in currencies other than USD are translated into USD at the rate of exchange that was in effect at the transaction date. Monetary assets and liabilities denominated in foreign currencies are translated at rates of exchange prevailing at the balance sheet date. Realized and unreal-ized exchange gains/losses on portfolio investments, which include loan receivables, investments in associated companies, and financial assets at fair value through profit or loss are recognized in profit or loss as part of the result from each of the categories of financial assets, which are included in the investment portfolio. Realized and unrealized exchange gains/losses on other assets and liabilities are reported among financial items.
Group companiesAs at the reporting date, the assets and liabilities of subsidiaries that have not the same functional currency as the parent company are translated into the presentation currency of the Group at rates of exchange prevailing at the balance sheet date. Their income statements are translated at the average exchange rate for the year. The exchange differences arising on the translation are recognized as other comprehensive income. The following exchange rates have been used:
Average Closing
SEK 8.6921 8.971
Property, plant and equipmentProperty, plant and equipment are stated at historical cost less accumulated depreciation. Depreciation on furniture, fittings and equipment is based on cost on a straight-line basis of estimated useful life of five years. The assets’ residual values and useful lives are reviewed, and adjusted if appropriate, at each balance sheet date.
LeasesLeases in which a significant portion of the risks and rewards of ownership are retained by the lessor are classified as operating leases. Payments made under operating leases are charged to the income statement on a straight-line basis over the period of the lease. The Group’s leases are exclusively operating leases, and refer to office rents.
Investments and other financial assetsClassificationFrom January 1, 2018, the group classifies its financial assets in the follow-ing measurement categories> those to be measured subsequently at fair value through profit or loss and> those to be measured at amortised cost. The classification depends on the entity’s business model for managing the financial assets and the contractual terms of the cash f lows. For assets measured at fair value, gains and losses will be recorded in profit or loss.
Recognition and derecognitionPurchases and sales of financial assets are recognized on trade-date – the date on which the Group commits to purchase or sell the asset. Financial assets are derecognized when the rights to receive cash f lows from the investments have expired or have been transferred and the Group has transferred substantially all risks and rewards of ownership.
ANNUAL REPORT 2018 59
MeasurementAt initial recognition, the group measures a financial asset at its fair value plus, in the case of a financial asset not at fair value through profit or loss (FVPL), transaction costs that are directly attributable to the acquisition of the financial asset. Transaction costs of financial assets carried at FVPL are expensed in profit or loss.
Financial assets with embedded derivatives are considered in their entirety when determining whether their cash f lows are solely payment of principal and interest.
Debt instruments
Subsequent measurement of debt instruments depends on the group’s busi-ness model for managing the asset and the cash f low characteristics of the asset. There are two measurement categories into which the group classifies its debt instruments:> Amortised cost: Assets that are held for collection of contractual cash
f lows where those cash f lows represent solely payments of principal and interest are measured at amortised cost. Interest income from these financial assets is included in finance income using the effective interest rate method. Any gain or loss arising on derecognition is recognised directly in profit or loss and presented in other gains/(losses) together with foreign exchange gains and losses. Impairment losses are presented as separate line item in the statement of profit or loss.
> FVPL: A gain or loss on a debt investment that is subsequently measured at FVPL is recognised in profit or loss and presented net within operating results in the period in which it arises
Equityinstruments
The group subsequently measures all equity investments at fair value through profit or loss. Dividends from such investments continue to be rec-ognised in profit or loss as other income when the group’s right to receive payments is established.
Changes in the fair value of financial assets at FVPL are recognised in operating results in the statement of profit or loss as applicable.
ImpairmentFrom January 1, 2018, the group assesses on a forward-looking basis the expected credit losses associated with its debt instruments carried at amor-tised cost. The impairment methodology applied depends on whether there has been a significant increase in credit risk. For trade receivables, the group applies the simplified approach permitted by IFRS 9, which requires expected lifetime losses to be recognised from initial recognition of the receivables. Currently the Group has no significant debt instruments car-ried at amortised cost. The expected credit losses for the parent company’s receivables on Group companies is considered insignificant and no expected credit loss is therefore recorded for these receivables.
Accounting policies applied until December 31, 2017The group has applied IFRS 9 retrospectively, but has elected not to restate comparative information. As a result, the comparative information pro-vided continues to be accounted for in accordance with the group’s previous accounting policy.
Classification
Until December 31, 2017, the group classified its financial assets in the following categories: > financial assets at fair value through profit or loss, > loans and receivables.The classification depended on the purpose for which the investments were acquired. Management determined the classification of its investments at initial recognition.
Reclassification
Financial assets previously classified as Loan and receivables under IAS 39 have been reclassified to the category Amortised costs in accordance with IFRS 9. Financial assets at fair value through profit or loss under IAS 39 remains as financial assets at fair value through profit or loss under IFRS 9. The reclassification did not have any impact on the amounts recognized.
Subsequentmeasurement
The measurement at initial recognition did not change on adoption of IFRS 9, see description above. Subsequent to the initial recognition, loans and receivables were carried at amortised cost using the effective interest method.
Financial assets at FVPL were subsequently carried at fair value. Gains or losses arising from changes in the fair value were recognised as follows:> for financial assets at FVPL – in profit or loss within operating profit
Details on how the fair value of financial instruments is determined are disclosed in note 5.
Impairment
The group assessed at the end of each reporting period whether there was objective evidence that a financial asset or group of financial assets was impaired. A financial asset or a group of financial assets was impaired and impairment losses were incurred only if there was objective evidence of impairment as a result of one or more events that occurred after the initial recognition of the asset (a ‘loss event’) and that loss event (or events) had an impact on the estimated future cash f lows of the financial asset or group of financial assets that could be reliably estimated.
Cash and cash equivalentsCash and cash equivalents include cash and bank balances and other short-term highly liquid investments with original maturities of three months or less.
Share capitalOrdinary shares are classified as equity. Share issue costs associated with the issuance of new equity are treated as a direct reduction of the proceeds.
Current and deferred income taxThe current income tax charge is calculated on the basis of the tax laws enacted or substantively enacted at the balance sheet date in the coun-tries where the Group’s subsidiaries operate and generate taxable income. Management periodically evaluates positions taken in tax returns with respect to situations in which applicable tax regulations are subject to
60 ANNUAL REPORT 2018
INT
RO
DU
CT
ION
INV
EST
ME
NT
PO
RT
FO
LIO
CO
RP
OR
AT
E G
OV
ER
NA
NC
EF
INA
NC
IAL
IN
FO
RM
AT
ION
INF
OR
MA
TIO
N
interpretation and establishes provisions where appropriate on the basis of amounts expected to be paid to the tax authorities.
Deferred income tax is provided in full, using the liability method, on temporary differences arising between the tax bases of assets and liabilities and their carrying amounts in the financial statements. However, the deferred income tax is not accounted for if it arises from initial recognition of an asset or liability in a transaction other than a business combination that at the time of the transaction affects neither accounting nor taxable profit or loss. Deferred income tax is determined using tax rates (and laws) that have been enacted or substantially enacted by the balance sheet date and are expected to apply when the related deferred income tax asset is realised or the deferred income tax liability is settled.
Deferred income tax assets are recognised to the extent that it is proba-ble that future taxable profit will be available against which the temporary differences can be utilised. Deferred income tax is provided on temporary differences arising on investments in subsidiaries except where the timing of the reversal of the temporary difference is controlled by the Group and it is probable that the temporary difference will not reverse in the foreseea-ble future. The Group currently has no temporary differences and has no deferred income tax recognised.
Employee benefitsShort-term obligationsLiabilities for wages and salaries, including non-monetary benefits that are expected to be settled wholly within 12 months after the end of the period in which the employees render the related service are recognised in respect of employees’ services up to the end of the reporting period and are measured at the amounts expected to be paid when the liabilities are settled. The liabilities are presented as current employee benefit obligations in the balance sheet.
Pension obligationsThe Group has a defined contribution pension plan which is based on the market practice. The Group has no further obligations once the contribu-tions have been paid. The contributions are reported as a cost recognised as employee benefit pension expense in profit or loss when they are due.
Share-based compensationThe Group operates an equity-settled, share-based compensation plan. The fair value of the employee services received in exchange for the grant of the options is recognised as an expense. The total amount to be expensed over the vesting period is determined by reference to the fair value of the options granted, excluding the impact of any non-market vesting conditions (for example, profitability and net assets development). Non-market vesting conditions are included in assumptions about the number of options that are expected to become exercisable. At each balance sheet date, the entity revises its estimates of the number of options that are expected to become exercisable. It recognizes the impact of the revision of original estimates, if any, in the income statement, and a corresponding adjustment to equity over the remaining vesting period.
The proceeds received net of any directly attributable transaction costs are credited to share capital (nominal value) and additional paid in capital when the options are exercised. For more information, see note 10.
Long-term incentive programThrough the long-term incentive program, VEF will grant shares to the participants at nil consideration. The fair value of deferred shares granted to employees for nil consideration under the long-term incentive program is recognised as an expense over the relevant service period, being the period to which the services are performed and the vesting period of the shares. The fair value is measured at the grant date of the shares and is recognised in equity. The number of shares expected to vest is estimated based on the non-market vesting conditions. The estimates are revised at the end of each reporting period and adjustments are recognised in profit or loss and in equity. Where shares are forfeited due to a failure by the employee to satisfy the service conditions, any expenses previously recognised in relation to such shares are reversed effective the date of the forfeiture. Any social security contributions payable in connection with the grant are considered an integral part of the grant itself and the charges are treated as cash-settled transactions. For more information, see note 10.
Operating incomeOperating income comprises the fair value of the consideration received in the ordinary course of the Group’s activities.
For investments held at both the start and end of the year, the change in value consists of the difference in the market value between these dates. For investments acquired during the year, the change in value consists of the difference between cost and the market value at the end of the year. For investments sold during the year, the change in value consists of the dif-ference between the sales price received and the value of investments at the start of the year. All changes in value are reported in the income statement within ‘Result from financial assets at fair value through profit or loss’ or ‘Result from loans’, depending on from what category of assets the changes in value relate.
Dividend income is recognised when the right to receive payment is established. Furthermore, dividend income is accounted for inclusive of withholding taxes. These withholding taxes are shown either as an expense in the income statement, or as a current receivable, depending on whether or not the withholding tax is refundable.
Interest income on non-current loan receivables is recognised on a time-proportion basis using the effective interest method. When a receiv-able is impaired, the Group reduces the carrying amount to its recoverable amount, being the estimated future cash f low discounted at the original effective interest rate of the instrument and continues unwinding the discount as interest income. Interest income on impaired non-current loan receivables is recognised using the original effective interest rate.
Interest income on current loan receivables and other receivables is recognised taking into account accrued interest on the balance sheet date.
Cash flow statementThe cash f low statement is presented in accordance with the indirect method. The Group’s business consists of investments in portfolio com-panies. Therefore, the investments are classified as the Group’s operating activities and not investment activities.
ANNUAL REPORT 2018 61
Note 3 Significant estimates and judgementsThe management of VEF has to make estimates and judgements when preparing the Financial Statements of the Group. Uncertainties in the estimates and judgements could have an impact on the carrying amount of assets and liabilities and the Group’s result. The most important estimates and judgements in relation thereto are:
Fair value of unlisted financial assets The estimates and judgements when assessing the fair value of unlisted investments in financial assets at fair value through profit or loss are con-tinually evaluated and are based on historical experience and other factors, including expectations of future events that are believed to be reasonable under the circumstances. For more information about fair value estimation, see note 5.
Note 4 Financial risk managementThe Group’s activities expose it to a variety of risks, including market related risks, business related risks and financial related risks.
Risk management is carried out by management under policies approved by the Board of Directors.
Market related risksEmerging and frontier markets risksEmerging and frontier markets are still, from an economic point of view, in a phase of development, investments are affected by unusually large f luctuations in profit and loss and other factors outside the Group’s control that may have an adverse impact on the value of Vostok Emerging Finance’s adjusted equity. Unstable state administration could have an adverse impact on investments.
Emerging or frontier markets typically do not have a fully developed legal system comparable to that in more developed countries. Existing laws and regulations are sometimes applied inconsistently and both the independence and efficiency of the court system constitute a significant risk. Statutory changes have taken place and will probably continue to take place at a rapid pace, and it remains difficult to predict the effect of legislative changes and legislative decisions for companies. It could be more difficult to obtain redress or exercise one’s rights in emerging and frontier markets than in countries with more mature legal systems. VEF continu-ously monitors these risk areas through various channels including third party research reports and through knowledge and expertise within the Group’s network. The Group evaluates any significant findings from above mentioned monitoring and, if needed, takes action in order to mitigate identified risk areas.
Exposure to financial services companies in emerging and frontier marketsVEF is subject to risks associated with ownership and management of investments in financial services companies in emerging and frontier mar-kets, including the following:> Regulatoryrisks– most financial services companies in emerging and
frontier markets are subject to extensive regulatory requirements. Such requirements, or the interpretation by competent authorities of such, may change rapidly. Failure to adapt to the relevant requirements may lead to sanctions or loss of business opportunities, which in turn could have
a material adverse effect on the business, results of operations, financial condition and prospects of the Group’s investments.
> Operationalrisk– financial services companies in emerging and frontier markets are exposed to operational risk, including the risk of fraud by employees, customers or third parties, mismanagement, unauthorized transactions by employees and operational errors. Any failure to properly mitigate operational risks could have a material adverse effect on the business, results of operations, financial condition and prospects of the Group’s investments.
> Reputationalrisk– consumer behaviour may be negatively impacted by negative publicity in traditional media as well as in social media. Any loss of reputation could have a material adverse effect on the business, results of operations, financial condition and prospects of the Group’s investments.
> IT risk – financial services companies are likely to be dependent on IT systems and any disruption that affects the operations of critical systems could have a material adverse effect on the business, results of operations, financial condition and prospects of the Group’s investments.
Vostok Emerging Finance works, primarily through board representation, to ensure that each portfolio company has appropriate internal control processes to handle these business-related risks.
Exposure to BrazilA major part of the Group’s investments operate in Brazil, approximately 28% of the Group’s NAV, and consist of the ownerships of shares in Creditas (12.4% of the portfolio), Guiabolso (7.5% of the portfolio), Magnetis (2.9% of the portfolio), FinanZero (2.5% of the portfolio) and Nibo (2.4% of the portfolio).
Brazil has experienced deep economic and social changes in recent years. Between the years 2000 and 2013, Brazil was one of the fastest growing economies in the world, until it hit a deep recession in 2014 with declining GDP and rising inflation. 2017 marked a year when the economy started to recover, and inflation fell to middle two-digit levels. The value of these investments may be affected by uncertainties such as political and diplo-matic developments, social or religious instability, changes in government policy, tax and interest rates, restrictions on the political and economic development of laws and regulations in Brazil, major policy changes or lack of internal consensus between leaders, executive and decision-making bodies and strong economic groups.
In addition, political changes may be less predictable in a growth country such as Brazil than in other more developed countries. Such instability may in some cases have an adverse impact on both the operations and SDR price of VEF. The country’s progress and development may be limited by a number of factors, including widely spread corruption, high taxes, an incli-nation towards import protectionism, crime and violence, and dominant monopolies.
The Brazilian economy is rich on commodities and as such is vulnera-ble to f luctuations in the market. Vostok Emerging Finance continuously monitors the macroeconomic and socioeconomic development in Brazil through various channels including third party research reports and through knowledge and expertise within the Group’s network. The Group evaluates any significant findings in order to mitigate any adverse impact on the Group’s operations.
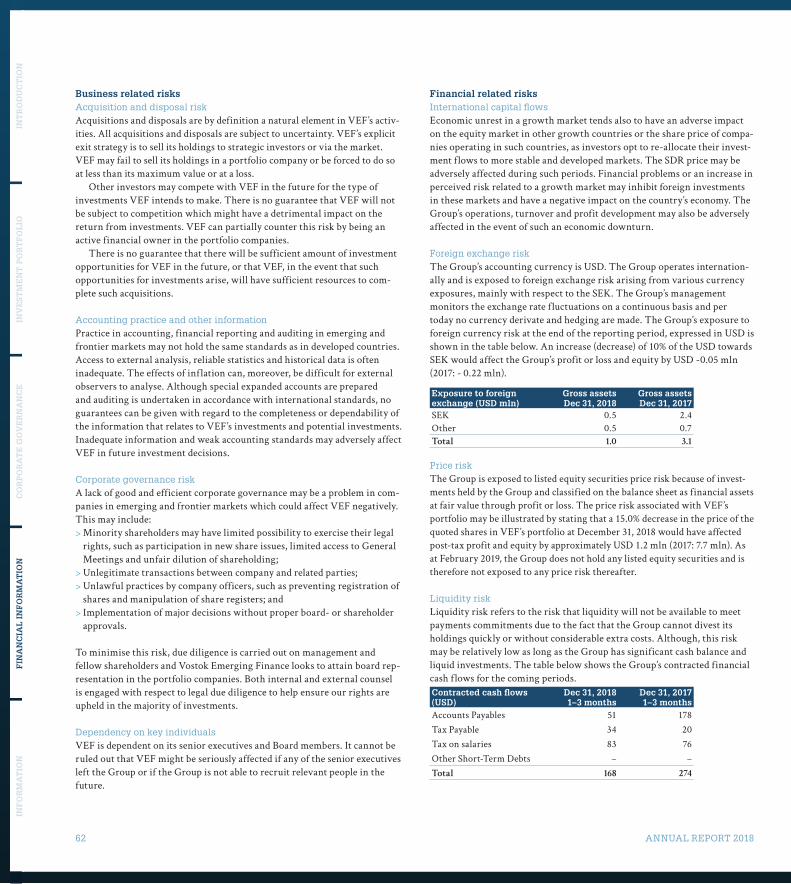
62 ANNUAL REPORT 2018
INT
RO
DU
CT
ION
INV
EST
ME
NT
PO
RT
FO
LIO
CO
RP
OR
AT
E G
OV
ER
NA
NC
EF
INA
NC
IAL
IN
FO
RM
AT
ION
INF
OR
MA
TIO
N
Business related risksAcquisition and disposal riskAcquisitions and disposals are by definition a natural element in VEF’s activ-ities. All acquisitions and disposals are subject to uncertainty. VEF’s explicit exit strategy is to sell its holdings to strategic investors or via the market. VEF may fail to sell its holdings in a portfolio company or be forced to do so at less than its maximum value or at a loss.
Other investors may compete with VEF in the future for the type of investments VEF intends to make. There is no guarantee that VEF will not be subject to competition which might have a detrimental impact on the return from investments. VEF can partially counter this risk by being an active financial owner in the portfolio companies.
There is no guarantee that there will be sufficient amount of investment opportunities for VEF in the future, or that VEF, in the event that such opportunities for investments arise, will have sufficient resources to com-plete such acquisitions.
Accounting practice and other informationPractice in accounting, financial reporting and auditing in emerging and frontier markets may not hold the same standards as in developed countries. Access to external analysis, reliable statistics and historical data is often inadequate. The effects of inflation can, moreover, be difficult for external observers to analyse. Although special expanded accounts are prepared and auditing is undertaken in accordance with international standards, no guarantees can be given with regard to the completeness or dependability of the information that relates to VEF’s investments and potential investments. Inadequate information and weak accounting standards may adversely affect VEF in future investment decisions.
Corporate governance riskA lack of good and efficient corporate governance may be a problem in com-panies in emerging and frontier markets which could affect VEF negatively. This may include: > Minority shareholders may have limited possibility to exercise their legal
rights, such as participation in new share issues, limited access to General Meetings and unfair dilution of shareholding;
> Unlegitimate transactions between company and related parties;> Unlawful practices by company officers, such as preventing registration of
shares and manipulation of share registers; and> Implementation of major decisions without proper board- or shareholder
approvals.
To minimise this risk, due diligence is carried out on management and fellow shareholders and Vostok Emerging Finance looks to attain board rep-resentation in the portfolio companies. Both internal and external counsel is engaged with respect to legal due diligence to help ensure our rights are upheld in the majority of investments.
Dependency on key individualsVEF is dependent on its senior executives and Board members. It cannot be ruled out that VEF might be seriously affected if any of the senior executives left the Group or if the Group is not able to recruit relevant people in the future.
Financial related risksInternational capital flows Economic unrest in a growth market tends also to have an adverse impact on the equity market in other growth countries or the share price of compa-nies operating in such countries, as investors opt to re-allocate their invest-ment f lows to more stable and developed markets. The SDR price may be adversely affected during such periods. Financial problems or an increase in perceived risk related to a growth market may inhibit foreign investments in these markets and have a negative impact on the country’s economy. The Group’s operations, turnover and profit development may also be adversely affected in the event of such an economic downturn.
Foreign exchange riskThe Group’s accounting currency is USD. The Group operates internation-ally and is exposed to foreign exchange risk arising from various currency exposures, mainly with respect to the SEK. The Group’s management monitors the exchange rate f luctuations on a continuous basis and per today no currency derivate and hedging are made. The Group’s exposure to foreign currency risk at the end of the reporting period, expressed in USD is shown in the table below. An increase (decrease) of 10% of the USD towards SEK would affect the Group’s profit or loss and equity by USD -0.05 mln (2017: - 0.22 mln).
Exposure to foreign exchange (USD mln)
Gross assets Dec 31, 2018
Gross assets Dec 31, 2017
SEK 0.5 2.4Other 0.5 0.7Total 1.0 3.1
Price riskThe Group is exposed to listed equity securities price risk because of invest-ments held by the Group and classified on the balance sheet as financial assets at fair value through profit or loss. The price risk associated with VEF’s portfolio may be illustrated by stating that a 15.0% decrease in the price of the quoted shares in VEF’s portfolio at December 31, 2018 would have affected post-tax profit and equity by approximately USD 1.2 mln (2017: 7.7 mln). As at February 2019, the Group does not hold any listed equity securities and is therefore not exposed to any price risk thereafter.
Liquidity riskLiquidity risk refers to the risk that liquidity will not be available to meet payments commitments due to the fact that the Group cannot divest its holdings quickly or without considerable extra costs. Although, this risk may be relatively low as long as the Group has significant cash balance and liquid investments. The table below shows the Group’s contracted financial cash f lows for the coming periods.Contracted cash flows (USD)
Dec 31, 2018 1–3 months
Dec 31, 2017 1–3 months
Accounts Payables 51 178Tax Payable 34 20Tax on salaries 83 76Other Short-Term Debts – –Total 168 274
ANNUAL REPORT 2018 63
Credit riskCredit risk is the risk that one party to a financial instrument will cause a loss for the other party by failing to pay for its obligation.
VEF is exposed to counterparty credit risk on cash and cash equivalents and liquidity portfolio with banks and financial institutions. Per December 31, 2018 the cash is placed in bank accounts, within financial institutions. The majority of VEF’s cash was placed in financial institutions with a credit quality step 1. Therefore, the credit risk is considered to be limited.Credit Quality Step Moody’s Fitch S&P’s1 Aaa – Aa3 AAA – AA- AAA – AA-2 A1 – A3 A+ – A- A+ – A-3 Baa1 – Baa3 BBB+ – BBB- BBB+ – BBB-4 Ba1 – Ba3 BB+ – BB- BB+ – BB-5 B1 – B3 B+ – B- B+ – B-6 worse than B3 worse than B- CCC+ and worse
Maximum credit risk exposure (USD) Dec 31, 2018 Dec 31, 2017
Lending to financial institutions– Credit Quality step 1 46,280 13,001– Credit Quality step 4 4,095 2,321– No rating – –Total 50,375 15,322
Capital risk managementThe Group’s objectives when managing capital are to:> safeguard the Group’s ability to continue as a going concern in order to
provide returns for shareholders and benefits for other stakeholders; and> maintain an optimal capital structure to reduce the cost of capital. To maintain or adjust the capital structure, the Group may adjust the divi-dend payment to shareholders, return capital to shareholders or issue new shares. No dividend has been proposed for the year.
Note 5 Fair value estimationThe fair value of financial instruments traded in active markets is based on quoted market prices at the balance sheet date. A market is regarded as active if quoted prices are readily and regularly available from an exchange, dealer, broker, industry Company, pricing service, or regulatory agency, and those prices represent actual and regularly occurring market transactions on an arm’s length basis. The quoted market price used for financial assets held by the Group is the current bid price. These instruments are included in level 1. The fair value of financial instruments that are not traded in an active market is determined by using valuation techniques. These valuation techniques maximize the use of observable market data where it is available and rely as little as possible on entity specific estimates. If all significant inputs required to determine the fair value of an instrument are observable, the instrument is included in level 2. If one or more of the significant inputs is not based on observable market data, the instrument is included in level 3.
Investments in assets that are not traded on any market will be held at fair value determined by recent transactions made at prevailing market con-ditions or different valuation models depending on the characteristics of the company as well as the nature and risks of the investment. These different techniques may include discounted cash f low valuation (DCF), exit-multiple valuation also referred to as Leveraged Buyout (LBO) valuation, asset-based valuation as well as forward looking multiples valuation based on com-parable traded companies. Usually, transaction-based valuations are kept unchanged for a period of 12 months unless there is cause for a significant change in valuation. After 12 months, the fair value for non-traded assets will normally be derived through any of the models described above.
At each reporting date, possible changes or events subsequent to the relevant transaction are assessed and if this assessment implies a change in the investment’s fair value, the valuations are adjusted accordingly.
The fair value of financial instruments is measured by level of the following fair value measurement hierarchy: > Quoted prices (unadjusted) in active markets for identical assets or liabili-
ties (level 1).> Inputs other than quoted prices included within level 1 that are observa-
ble for the asset or liability, either directly (that is, as prices) or indirectly (that is, derived from prices) (level 2).
> Inputs for the asset or liability that are not based on observable market data (that is, unobservable inputs) (level 3).
The following table presents the Group’s assets that are measured at fair value at December 31, 2018.
Level 1 Level 2 Level 3 Total balance
Financial assets at fair value through profit or loss 52,804 103,430 40,664 196,898Total assets 52,804 103,430 40,664 196,898
64 ANNUAL REPORT 2018
INT
RO
DU
CT
ION
INV
EST
ME
NT
PO
RT
FO
LIO
CO
RP
OR
AT
E G
OV
ER
NA
NC
EF
INA
NC
IAL
IN
FO
RM
AT
ION
INF
OR
MA
TIO
N
The following table presents the Group’s assets that are measured at fair value at December 31, 2017.
Level 1 Level 2 Level 3 Total balance
Financial assets at fair value through profit or loss 82,111 100,487 6,808 189,406Total assets 82,111 100,487 6,808 189,406
The following table presents the Group’s changes of financial assets in level 32018 2017
Opening balance January 1 6,808 –Transfers from level 2 to level 3 50,451 6,146Transfers from level 3 to level 2 -6,808 –Change in fair value and other -9,787 662Closing balance December 31 40,664 6,808
As per December 31, 2018, VEF’s holding in Tinkoff Bank is classified as a level 1 investment as its GDRs are trading on London Stock Exchange. Vostok Emerging Finance also has a liquidity management portfolio of listed corporate bonds that are also classified as level 1 investments. The investments in iyzico, FinanZero, Finja, TransferGo, JUMO, Creditas and Konfio are all valued as level 2 investments on the basis of the valuations of their respective latest transaction which all closed throughout 2018. During the year, four transfers between level 2 and level 3 have been done. REVO/Sorsdata, Guiabolso, Nibo and Magnetis were all moved from level 2 and are consequently classified as level 3 investments and valued based on peer group valuation models. During the same period, TransferGo has been moved from level 3 to level 2 and is now valued based on the latest transac-tion. The validity of valuations based on a transaction is inevitably eroded over time, since the price at which the investment was made reflects the conditions that existed on the transaction date. At each reporting date, pos-sible changes or events subsequent to the relevant transaction are assessed and if this assessment implies a change in the investment’s fair value, the valuation is adjusted accordingly. The transaction-based valuations are fre-quently assessed using multiples of comparable traded companies for each unlisted investment or other valuation models. When transaction-based valuations of unlisted holdings are used, no material event is deemed to have occurred in the specific portfolio company that would suggest that the transaction-based value is no longer valid.
iyzicoAs per December 31, 2018, VEF owns 20.8% in iyzico and has invested a total of USD 10.7 mln during the first quarter of 2017 and the fourth quarter of 2018. During the fourth quarter of 2018, iyzico was moved from a level 3 investment and is now categorized as a level 2 investment. VEF’s ownership in iyzico is valued at USD 25.9 mln on the basis of the latest transaction in the company which closed during Q4, 2018. The valuation represents a 168% increase in valuation over the course of the year.
CreditasAs per December 31, 2018, VEF owns 10.0% in Creditas and has invested a total of USD 25.0 mln during the fourth quarter of 2017. During Q2 2018, a second close following the Q4 2017 financing round happened, where Amadeus and Santander Bank invested in the company, at the same valua-tion as in Q4 2017.As per December 31, 2018, Creditas is valued on the basis of this transaction and is categorized as a level 2 investment. Given the time frame since VEF’s investment in Creditas, management have sense checked the transaction-based valuation through a valuation model, and do not fore-see any negative downside to the valuation as per December 31, 2018.
JUMOAs per December 31, 2018, VEF owns 6.8% in JUMO, and has invested a total of USD 14.6 mln into the company. During Q3, 2018 VEF took up its rights in the latest financing round and invested an additional USD 3.1 mln in JUMO. VEF’s stake in JUMO is valued at USD 16.4 mln as per December 31, 2018 on the basis of this transaction. The valuation represents a 5.1% increase in valuation over the year. JUMO is categorized as a level 2 investment.
GuiabolsoAs per December 31, 2018, VEF owns 10.9% in Guiabolso and has invested a total of USD 30.0 mln during the fourth quarter of 2017. During the third quarter 2018, Guiabolso was moved from level 2 to level 3 valued on the basis of a forward looking EV/revenue peer multiples model consisting of five listed peers. Based on the valuation model, VEF values its stake in Guiabolso at USD 15.3 mln (USD 140 mln for 100% of the company). The valuation represents a 49% decrease as compared to December 31, 2017.
Sensitivity analysis EV/revenue multiple
-15% -10% -5% 0% +5% +10% +15%13,196 13,886 14,576 15,265 15,955 16,644 17,334
Sensitivity analysis USD/BRL
+15% +10% +5% 3.9 -5% -10% -15%17,959 16,961 16,069 15,265 14,538 13,877 13,274
KonfioDuring June 2018, VEF led the USD 25 mln financing round in Konfio, and invested USD 15 mln into the company. As per December 31, 2018, VEF’s 11.7% ownership in Konfio is valued on the basis of this transaction. Konfio is categorized as a level 2 investment.
ANNUAL REPORT 2018 65
REVO/SorsdataAs per December 31, 2018, VEF has a 25% ownership in REVO/Sorsdata and has invested a total of USD 8.8 mln into the companies, including a two-year convertible loan note in the amount of USD 2.1 mln in Q3 2018. REVO/Sorsdata is categorized as a level 3 investment and is valued on the basis of a forward looking EV/revenue peer multiples model consisting of five listed peers. Based on the model, VEF values its stake in REVO/Sorsdata at USD 12.3 mln plus USD 2.3 mln related to the convertible loan note. The total valuation of VEF’s stakes in the companies was USD 14.6 mln. The valuation represents a 12.6% decrease in valuation of VEF’s stake over the year. A weakened RUB and derating comps during the third quar-ter negatively impacted the valuation at year-end.
Sensitivity analysis EV/revenue multiple
-15% -10% -5% 0% +5% +10% +15%12,683 13,334 13,985 14,636 15,287 15,938 16,589
Sensitivity USD/RUB
+15% +10% +5% 69.5 -5% -10% -15%13,023 13,512 14,047 14,636 15,287 16,010 16,818
TransferGoAs per December 31, 2018, VEF has invested a total of USD 8.9 mln into TransferGo. VEF owns 16.2% in the company and has during Q2 2018, exer-cised its outstanding convertible loan note in the amount of USD 2.8 mln (EUR 2.5 mln) plus accrued interest. VEF also invested an additional USD 2.7 mln (EUR 2.25 mln) in the financing round carried out by the company in Q2 2018. As per December 31, 2018, VEF’s holding in TransferGo is val-ued at USD 12.8 mln on the basis of this transaction and is categorized as a level 2 investment. The valuation in TransferGo represents a 65.8% increase in valuation during 2018.
Tinkoff BankThe investment in Tinkoff Bank is listed on the London Stock Exchange and the valuation is based on the closing bid-price per December 31, 2018. Tinkoff is categorized as a level 1 investment.
MagnetisAs per December 31, 2018, VEF owns 16.9% in Magnetis and has invested a total of USD 3.7 mln over the course of two funding rounds, where the last round closed during Q3 2018, in which VEF invested an additional USD 0.7 mln in the form of a two-year convertible loan note. As per December 31, 2018, Magnetis is valued on the basis of an EV/AUM % multiple peers model applied to the company’s current AUM. The holding in Magnetis was moved from a level 2 investment to a level 3 investment during the fourth quarter of 2018, and is valued at USD 5.1 mln plus the principal amount from the convertible loan note including accrued interest of USD 0.7 mln, in total USD 5.8 mln. The valuation represents an increase of 69.8% during the year, driven by the strong performance and development in the company.
Sensitivity analysis EV/AUM multiple
-15% -10% -5% 0% +5% +10% +15%5,058 5,307 5,557 5,806 6,055 6,304 6,553
Sensitivity analysis USD/BRL
+15% +10% +5% 3.9 -5% -10% -15%5,141 5,343 5,563 5,806 6,074 6,372 6,704
FinanZeroAs per December 31, 2018, VEF has invested a total of USD 2.6 mln (SEK 21.5 mln) into FinanZero. VEF’s 23.7% ownership in the company is valued at USD 5.0 mln (SEK 45.1 mln) on the basis of the latest transaction in the company, which closed in March 2018. In the very same transaction, VEF took up its rights and invested an additional USD 0.9 mln. The valuation in FinanZero represents a valuation increase of 93.7% over the year. The holding in FinanZero is categorized as a level 2 investment.
NiboAs per December 31, 2018, VEF owns 15.7% in Nibo and has invested a total of USD 3.3 mln during the second quarter of 2017. As per December 31, 2018, Nibo is valued on the basis of a forward looking EV/revenue multiples peer model consisting of four listed peers in the accounting SaaS and SaaS space, showing similar characteristics and operations as Nibo. Based on the model, VEF values its stake in Nibo at USD 5.0 mln at December 31, 2018. The valuation represents an increase in valuation of 50.2% over the course of the year. Nibo is categorized as a level 3 investment.
Sensitivity analysis EV/revenue multiple
-15% -10% -5% 0% +5% +10% +15%4,230 4,472 4,715 4,957 5,199 5,442 5,684
Sensitivity analysis USD/BRL
+15% +10% +5% 3.9 -5% -10% -15%4,311 4,506 4,721 4,957 5,218 5,508 5,832

66 ANNUAL REPORT 2018
INT
RO
DU
CT
ION
INV
EST
ME
NT
PO
RT
FO
LIO
CO
RP
OR
AT
E G
OV
ER
NA
NC
EF
INA
NC
IAL
IN
FO
RM
AT
ION
INF
OR
MA
TIO
N
FinjaAs per December 31, 2018, VEF has invested a total of USD 2 mln into Finja in two different financing rounds. During the last funding round, closed during the third quarter of 2018, VEF invested USD 1 mln in the form of a two-year convertible loan note. As per December 31, 2018, VEF holds a 20.4% stake in Finja and is valued at USD 3.3 mln based on the terms of this transaction. The valuation change represents an increase of 94.6% over the year. The holding in Finja is categorized as a level 2 investment.
Liquidity investmentsAs per December 31, 2018, the liquidity management investments are val-ued at USD 44.90 mln, based on the closing price and/or latest NAV of each fund. All liquidity investments are categorized as level 1 investments.
Change in financial assets at fair value through profit or lossCompany Opening balance
Jan 1, 2018Investments/
(divestments), netFair value
changeClosing balance
Dec 31, 2018Percentage weight of
total portfolioiyzico 9,000 1,750 15,111 25,861 12.8%Creditas 25,000 0 0 25,000 12.4%JUMO 12,706 3,049 654 16,408 8.1%Guiabolso 30,000 0 -14,735 15,265 7.5%Konfio 0 15,000 0 15,000 7.4%REVO Technology/Sorsdata 14,151 2,125 -1,640 14,636 7.2%TransferGo 6,808 2,665 3,369 12,842 6.3%Tinkoff Bank 76,592 -65,337 -3,347 7,908 3.9%Magnetis 3,000 700 2,106 5,806 2.9%FinanZero 2,178 863 1,989 5,030 2.5%Nibo 3,300 0 1,657 4,957 2.4%Finja 1,151 1,000 1,137 3,289 1.6%Liquidity management 5,518 39,465 -88 44,896 22.2%Total 189,406 1,280 6,213 196,898 97.2%
Note 6 Segment informationFor management purposes, the Group is organised into one main operating segment, which invests in equity securities. All of the Group’s activities are interrelated, and each activity is dependent on the others. Accordingly, all significant operating decisions are based upon analysis of the Group as one segment. The financial results from this segment are equivalent to the financial statements of the Group as a whole. As an investment company, the Board is deeply involved in investment decisions and follow-up of port-folio companies’ development. The Board has been identified as the Group’s highest operational decision maker in the field of internal reporting. Internal reporting contains only one segment.
Note 7 Result from financial assets at fair value through profit or loss
Group 2018
Group 2017
Parent Company
2018
Parent Company
2017Proceeds from sale of financial assets at fair value through profit or loss 79,337 62,774 14,000 28,924Acquisition value of sold financial assets at fair value through profit or loss -24,594 -35,828 -14,000 -28,964
Change in fair value from sold financial assets at fair value through profit or loss -58,091 -26,907 – 39Change in fair value of remaining financial assets at fair value through profit or loss 9,561 52,451 15,024 413Result from financial assets at fair
value through profit or loss 6,213 52,490 15,024 412
During 2018 and 2017 result from financial assets at fair value through profit or loss comprises the result from fair value changes of financial assets that have been designated on initial recognition as assets to be measured at fair value with fair value changes in profit or loss.
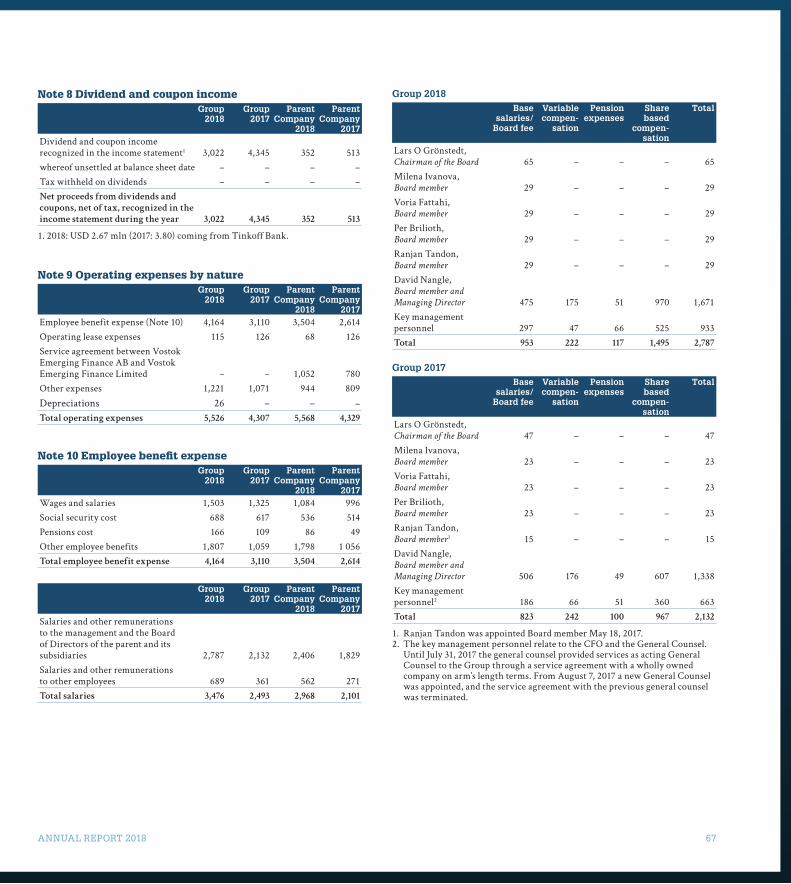
ANNUAL REPORT 2018 67
Note 8 Dividend and coupon incomeGroup
2018Group
2017Parent
Company 2018
Parent Company
2017Dividend and coupon income recognized in the income statement1 3,022 4,345 352 513whereof unsettled at balance sheet date – – – –Tax withheld on dividends – – – –Net proceeds from dividends and
coupons, net of tax, recognized in the
income statement during the year 3,022 4,345 352 513
1. 2018: USD 2.67 mln (2017: 3.80) coming from Tinkoff Bank.
Note 9 Operating expenses by natureGroup
2018Group
2017Parent
Company 2018
Parent Company
2017Employee benefit expense (Note 10) 4,164 3,110 3,504 2,614Operating lease expenses 115 126 68 126Service agreement between Vostok Emerging Finance AB and Vostok Emerging Finance Limited – – 1,052 780Other expenses 1,221 1,071 944 809
Depreciations 26 – – –Total operating expenses 5,526 4,307 5,568 4,329
Note 10 Employee benefit expenseGroup
2018Group
2017Parent
Company 2018
Parent Company
2017Wages and salaries 1,503 1,325 1,084 996 Social security cost 688 617 536 514 Pensions cost 166 109 86 49 Other employee benefits 1,807 1,059 1,798 1 056 Total employee benefit expense 4,164 3,110 3,504 2,614
Group 2018
Group 2017
Parent Company
2018
Parent Company
2017Salaries and other remunerations to the management and the Board of Directors of the parent and its subsidiaries 2,787 2,132 2,406 1,829 Salaries and other remunerations to other employees 689 361 562 271 Total salaries 3,476 2,493 2,968 2,101
Group 2018Base
salaries/ Board fee
Variable compen-
sation
Pension expenses
Share based
compen-sation
Total
Lars O Grönstedt, Chairman of the Board 65 – – – 65Milena Ivanova, Board member 29 – – – 29Voria Fattahi, Board member 29 – – – 29Per Brilioth, Board member 29 – – – 29Ranjan Tandon, Board member 29 – – – 29David Nangle, Board member and
Managing Director 475 175 51 970 1,671Key management personnel 297 47 66 525 933Total 953 222 117 1,495 2,787
Group 2017Base
salaries/ Board fee
Variable compen-
sation
Pension expenses
Share based
compen-sation
Total
Lars O Grönstedt, Chairman of the Board 47 – – – 47Milena Ivanova, Board member 23 – – – 23Voria Fattahi, Board member 23 – – – 23Per Brilioth, Board member 23 – – – 23Ranjan Tandon, Board member
1 15 – – – 15David Nangle, Board member and
Managing Director 506 176 49 607 1,338Key management personnel2 186 66 51 360 663Total 823 242 100 967 2,132
1. Ranjan Tandon was appointed Board member May 18, 2017. 2. The key management personnel relate to the CFO and the General Counsel.
Until July 31, 2017 the general counsel provided services as acting General Counsel to the Group through a service agreement with a wholly owned company on arm’s length terms. From August 7, 2017 a new General Counsel was appointed, and the service agreement with the previous general counsel was terminated.
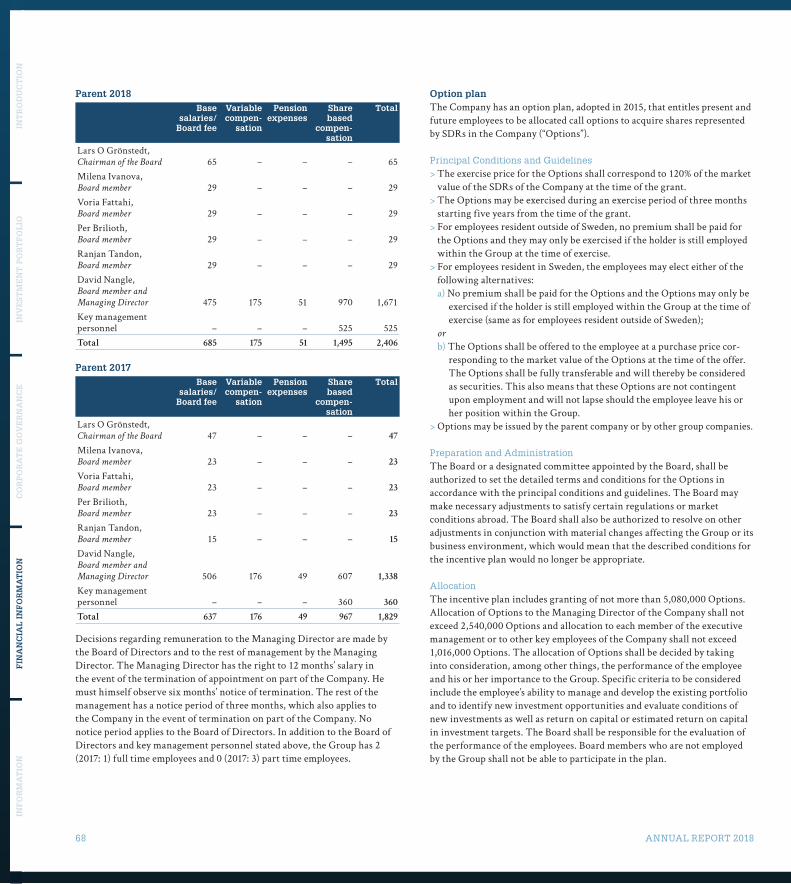
68 ANNUAL REPORT 2018
INT
RO
DU
CT
ION
INV
EST
ME
NT
PO
RT
FO
LIO
CO
RP
OR
AT
E G
OV
ER
NA
NC
EF
INA
NC
IAL
IN
FO
RM
AT
ION
INF
OR
MA
TIO
N
Parent 2018Base
salaries/ Board fee
Variable compen-
sation
Pension expenses
Share based
compen-sation
Total
Lars O Grönstedt, Chairman of the Board 65 – – – 65Milena Ivanova, Board member 29 – – – 29Voria Fattahi, Board member 29 – – – 29Per Brilioth, Board member 29 – – – 29Ranjan Tandon, Board member 29 – – – 29David Nangle, Board member and
Managing Director 475 175 51 970 1,671Key management personnel – – – 525 525Total 685 175 51 1,495 2,406
Parent 2017Base
salaries/ Board fee
Variable compen-
sation
Pension expenses
Share based
compen-sation
Total
Lars O Grönstedt, Chairman of the Board 47 – – – 47
Milena Ivanova, Board member 23 – – – 23
Voria Fattahi, Board member 23 – – – 23
Per Brilioth, Board member 23 – – – 23
Ranjan Tandon, Board member 15 – – – 15
David Nangle, Board member and
Managing Director 506 176 49 607 1,338
Key management personnel – – – 360 360
Total 637 176 49 967 1,829
Decisions regarding remuneration to the Managing Director are made by the Board of Directors and to the rest of management by the Managing Director. The Managing Director has the right to 12 months’ salary in the event of the termination of appointment on part of the Company. He must himself observe six months’ notice of termination. The rest of the management has a notice period of three months, which also applies to the Company in the event of termination on part of the Company. No notice period applies to the Board of Directors. In addition to the Board of Directors and key management personnel stated above, the Group has 2 (2017: 1) full time employees and 0 (2017: 3) part time employees.
Option planThe Company has an option plan, adopted in 2015, that entitles present and future employees to be allocated call options to acquire shares represented by SDRs in the Company (“Options”).
Principal Conditions and Guidelines> The exercise price for the Options shall correspond to 120% of the market
value of the SDRs of the Company at the time of the grant.> The Options may be exercised during an exercise period of three months
starting five years from the time of the grant.> For employees resident outside of Sweden, no premium shall be paid for
the Options and they may only be exercised if the holder is still employed within the Group at the time of exercise.
> For employees resident in Sweden, the employees may elect either of the following alternatives:a) No premium shall be paid for the Options and the Options may only be
exercised if the holder is still employed within the Group at the time of exercise (same as for employees resident outside of Sweden);
or
b) The Options shall be offered to the employee at a purchase price cor-responding to the market value of the Options at the time of the offer. The Options shall be fully transferable and will thereby be considered as securities. This also means that these Options are not contingent upon employment and will not lapse should the employee leave his or her position within the Group.
> Options may be issued by the parent company or by other group companies.
Preparation and AdministrationThe Board or a designated committee appointed by the Board, shall be authorized to set the detailed terms and conditions for the Options in accordance with the principal conditions and guidelines. The Board may make necessary adjustments to satisfy certain regulations or market conditions abroad. The Board shall also be authorized to resolve on other adjustments in conjunction with material changes affecting the Group or its business environment, which would mean that the described conditions for the incentive plan would no longer be appropriate.
AllocationThe incentive plan includes granting of not more than 5,080,000 Options. Allocation of Options to the Managing Director of the Company shall not exceed 2,540,000 Options and allocation to each member of the executive management or to other key employees of the Company shall not exceed 1,016,000 Options. The allocation of Options shall be decided by taking into consideration, among other things, the performance of the employee and his or her importance to the Group. Specific criteria to be considered include the employee’s ability to manage and develop the existing portfolio and to identify new investment opportunities and evaluate conditions of new investments as well as return on capital or estimated return on capital in investment targets. The Board shall be responsible for the evaluation of the performance of the employees. Board members who are not employed by the Group shall not be able to participate in the plan.
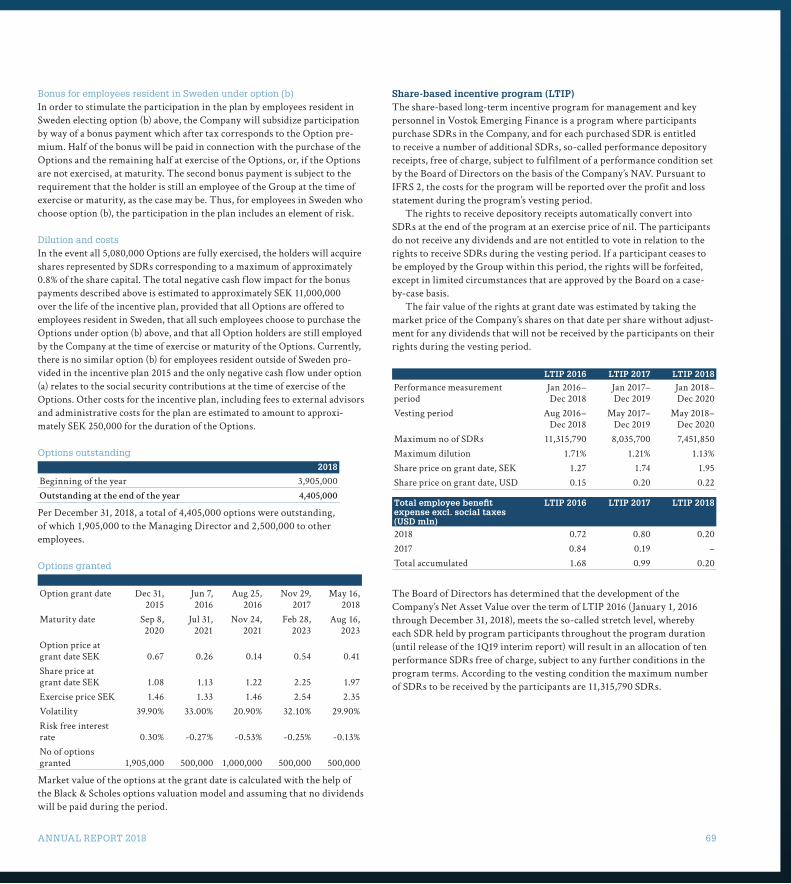
ANNUAL REPORT 2018 69
Bonus for employees resident in Sweden under option (b)In order to stimulate the participation in the plan by employees resident in Sweden electing option (b) above, the Company will subsidize participation by way of a bonus payment which after tax corresponds to the Option pre-mium. Half of the bonus will be paid in connection with the purchase of the Options and the remaining half at exercise of the Options, or, if the Options are not exercised, at maturity. The second bonus payment is subject to the requirement that the holder is still an employee of the Group at the time of exercise or maturity, as the case may be. Thus, for employees in Sweden who choose option (b), the participation in the plan includes an element of risk.
Dilution and costsIn the event all 5,080,000 Options are fully exercised, the holders will acquire shares represented by SDRs corresponding to a maximum of approximately 0.8% of the share capital. The total negative cash f low impact for the bonus payments described above is estimated to approximately SEK 11,000,000 over the life of the incentive plan, provided that all Options are offered to employees resident in Sweden, that all such employees choose to purchase the Options under option (b) above, and that all Option holders are still employed by the Company at the time of exercise or maturity of the Options. Currently, there is no similar option (b) for employees resident outside of Sweden pro-vided in the incentive plan 2015 and the only negative cash f low under option (a) relates to the social security contributions at the time of exercise of the Options. Other costs for the incentive plan, including fees to external advisors and administrative costs for the plan are estimated to amount to approxi-mately SEK 250,000 for the duration of the Options.
Options outstanding
2018
Beginning of the year 3,905,000Outstanding at the end of the year 4,405,000
Per December 31, 2018, a total of 4,405,000 options were outstanding, of which 1,905,000 to the Managing Director and 2,500,000 to other employees.
Options granted
Option grant date Dec 31, 2015
Jun 7, 2016
Aug 25, 2016
Nov 29, 2017
May 16, 2018
Maturity date Sep 8, 2020
Jul 31, 2021
Nov 24, 2021
Feb 28, 2023
Aug 16, 2023
Option price at grant date SEK 0.67 0.26 0.14 0.54 0.41Share price at grant date SEK 1.08 1.13 1.22 2.25 1.97Exercise price SEK 1.46 1.33 1.46 2.54 2.35Volatility 39.90% 33.00% 20.90% 32.10% 29.90%Risk free interest rate 0.30% -0.27% -0.53% -0.25% -0.13%No of options granted 1,905,000 500,000 1,000,000 500,000 500,000
Market value of the options at the grant date is calculated with the help of the Black & Scholes options valuation model and assuming that no dividends will be paid during the period.
Share-based incentive program (LTIP)The share-based long-term incentive program for management and key personnel in Vostok Emerging Finance is a program where participants purchase SDRs in the Company, and for each purchased SDR is entitled to receive a number of additional SDRs, so-called performance depository receipts, free of charge, subject to fulfilment of a performance condition set by the Board of Directors on the basis of the Company’s NAV. Pursuant to IFRS 2, the costs for the program will be reported over the profit and loss statement during the program’s vesting period.
The rights to receive depository receipts automatically convert into SDRs at the end of the program at an exercise price of nil. The participants do not receive any dividends and are not entitled to vote in relation to the rights to receive SDRs during the vesting period. If a participant ceases to be employed by the Group within this period, the rights will be forfeited, except in limited circumstances that are approved by the Board on a case-by-case basis.
The fair value of the rights at grant date was estimated by taking the market price of the Company’s shares on that date per share without adjust-ment for any dividends that will not be received by the participants on their rights during the vesting period.
LTIP 2016 LTIP 2017 LTIP 2018
Performance measurement period
Jan 2016– Dec 2018
Jan 2017– Dec 2019
Jan 2018– Dec 2020
Vesting period Aug 2016– Dec 2018
May 2017– Dec 2019
May 2018– Dec 2020
Maximum no of SDRs 11,315,790 8,035,700 7,451,850Maximum dilution 1.71% 1.21% 1.13%Share price on grant date, SEK 1.27 1.74 1.95Share price on grant date, USD 0.15 0.20 0.22
Total employee benefit expense excl. social taxes (USD mln)
LTIP 2016 LTIP 2017 LTIP 2018
2018 0.72 0.80 0.202017 0.84 0.19 –Total accumulated 1.68 0.99 0.20
The Board of Directors has determined that the development of the Company’s Net Asset Value over the term of LTIP 2016 (January 1, 2016 through December 31, 2018), meets the so-called stretch level, whereby each SDR held by program participants throughout the program duration (until release of the 1Q19 interim report) will result in an allocation of ten performance SDRs free of charge, subject to any further conditions in the program terms. According to the vesting condition the maximum number of SDRs to be received by the participants are 11,315,790 SDRs.
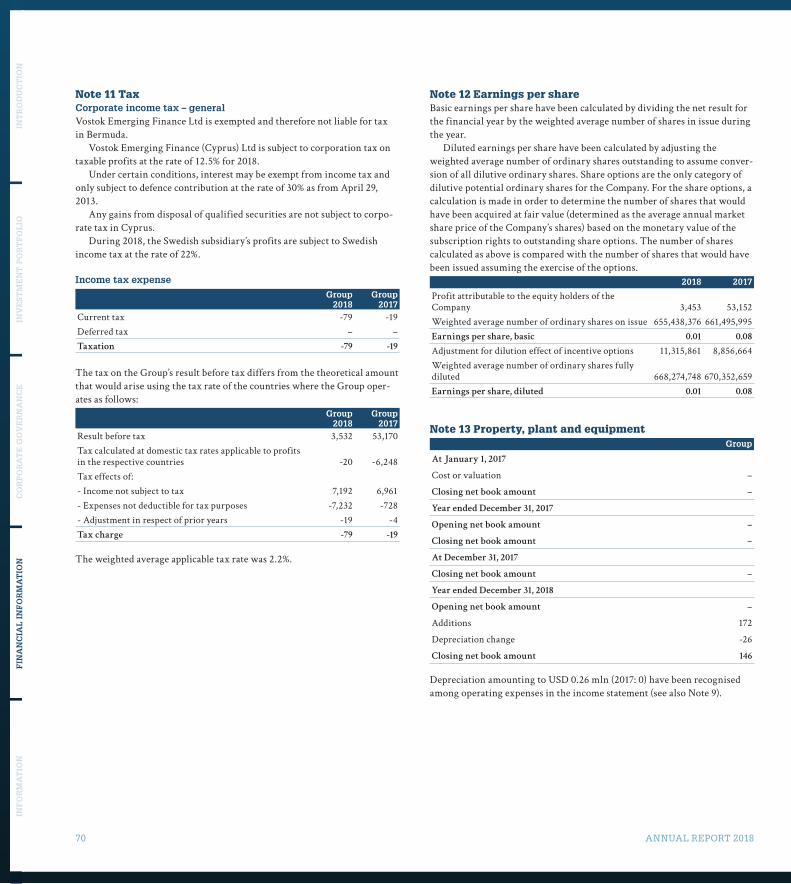
70 ANNUAL REPORT 2018
INT
RO
DU
CT
ION
INV
EST
ME
NT
PO
RT
FO
LIO
CO
RP
OR
AT
E G
OV
ER
NA
NC
EF
INA
NC
IAL
IN
FO
RM
AT
ION
INF
OR
MA
TIO
N
Note 11 TaxCorporate income tax – generalVostok Emerging Finance Ltd is exempted and therefore not liable for tax in Bermuda.
Vostok Emerging Finance (Cyprus) Ltd is subject to corporation tax on taxable profits at the rate of 12.5% for 2018.
Under certain conditions, interest may be exempt from income tax and only subject to defence contribution at the rate of 30% as from April 29, 2013.
Any gains from disposal of qualified securities are not subject to corpo-rate tax in Cyprus.
During 2018, the Swedish subsidiary’s profits are subject to Swedish income tax at the rate of 22%.
Income tax expense
Group 2018
Group 2017
Current tax -79 -19Deferred tax – –Taxation -79 -19
The tax on the Group’s result before tax differs from the theoretical amount that would arise using the tax rate of the countries where the Group oper-ates as follows:
Group 2018
Group 2017
Result before tax 3,532 53,170Tax calculated at domestic tax rates applicable to profits in the respective countries -20 -6,248Tax effects of:- Income not subject to tax 7,192 6,961- Expenses not deductible for tax purposes -7,232 -728- Adjustment in respect of prior years -19 -4Tax charge -79 -19
The weighted average applicable tax rate was 2.2%.
Note 12 Earnings per shareBasic earnings per share have been calculated by dividing the net result for the financial year by the weighted average number of shares in issue during the year.
Diluted earnings per share have been calculated by adjusting the weighted average number of ordinary shares outstanding to assume conver-sion of all dilutive ordinary shares. Share options are the only category of dilutive potential ordinary shares for the Company. For the share options, a calculation is made in order to determine the number of shares that would have been acquired at fair value (determined as the average annual market share price of the Company’s shares) based on the monetary value of the subscription rights to outstanding share options. The number of shares calculated as above is compared with the number of shares that would have been issued assuming the exercise of the options.
2018 2017
Profit attributable to the equity holders of the Company 3,453 53,152Weighted average number of ordinary shares on issue 655,438,376 661,495,995Earnings per share, basic 0.01 0.08
Adjustment for dilution effect of incentive options 11,315,861 8,856,664Weighted average number of ordinary shares fully diluted 668,274,748 670,352,659Earnings per share, diluted 0.01 0.08
Note 13 Property, plant and equipmentGroup
At January 1, 2017
Cost or valuation –
Closing net book amount –
Year ended December 31, 2017
Opening net book amount –
Closing net book amount –
At December 31, 2017
Closing net book amount –
Year ended December 31, 2018
Opening net book amount –
Additions 172
Depreciation change -26
Closing net book amount 146
Depreciation amounting to USD 0.26 mln (2017: 0) have been recognised among operating expenses in the income statement (see also Note 9).
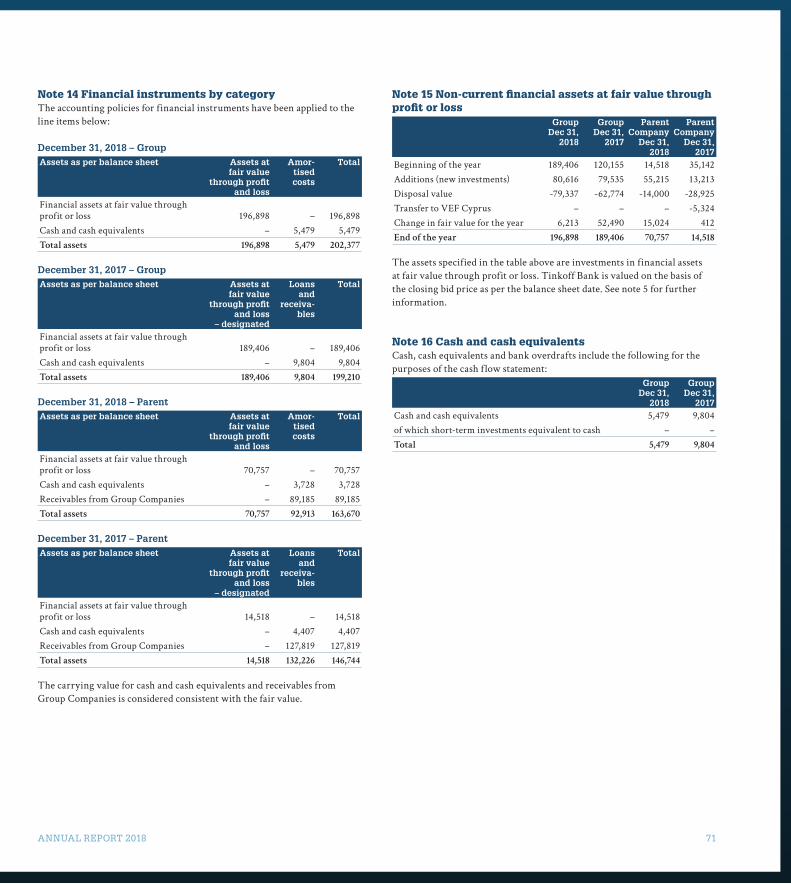
ANNUAL REPORT 2018 71
Note 14 Financial instruments by categoryThe accounting policies for financial instruments have been applied to the line items below:
December 31, 2018 – GroupAssets as per balance sheet Assets at
fair value through profit
and loss
Amor-tised costs
Total
Financial assets at fair value through profit or loss 196,898 – 196,898Cash and cash equivalents – 5,479 5,479Total assets 196,898 5,479 202,377
December 31, 2017 – GroupAssets as per balance sheet Assets at
fair value through profit
and loss – designated
Loans and
receiva-bles
Total
Financial assets at fair value through profit or loss 189,406 – 189,406Cash and cash equivalents – 9,804 9,804Total assets 189,406 9,804 199,210
December 31, 2018 – ParentAssets as per balance sheet Assets at
fair value through profit
and loss
Amor-tised costs
Total
Financial assets at fair value through profit or loss 70,757 – 70,757Cash and cash equivalents – 3,728 3,728Receivables from Group Companies – 89,185 89,185Total assets 70,757 92,913 163,670
December 31, 2017 – ParentAssets as per balance sheet Assets at
fair value through profit
and loss – designated
Loans and
receiva-bles
Total
Financial assets at fair value through profit or loss 14,518 – 14,518Cash and cash equivalents – 4,407 4,407Receivables from Group Companies – 127,819 127,819Total assets 14,518 132,226 146,744
The carrying value for cash and cash equivalents and receivables from Group Companies is considered consistent with the fair value.
Note 15 Non-current financial assets at fair value through profit or loss
Group Dec 31,
2018
Group Dec 31,
2017
Parent Company
Dec 31, 2018
Parent Company
Dec 31, 2017
Beginning of the year 189,406 120,155 14,518 35,142Additions (new investments) 80,616 79,535 55,215 13,213Disposal value -79,337 -62,774 -14,000 -28,925Transfer to VEF Cyprus – – – -5,324Change in fair value for the year 6,213 52,490 15,024 412End of the year 196,898 189,406 70,757 14,518
The assets specified in the table above are investments in financial assets at fair value through profit or loss. Tinkoff Bank is valued on the basis of the closing bid price as per the balance sheet date. See note 5 for further information.
Note 16 Cash and cash equivalentsCash, cash equivalents and bank overdrafts include the following for the purposes of the cash f low statement:
Group Dec 31,
2018
Group Dec 31,
2017Cash and cash equivalents 5,479 9,804of which short-term investments equivalent to cash – –Total 5,479 9,804
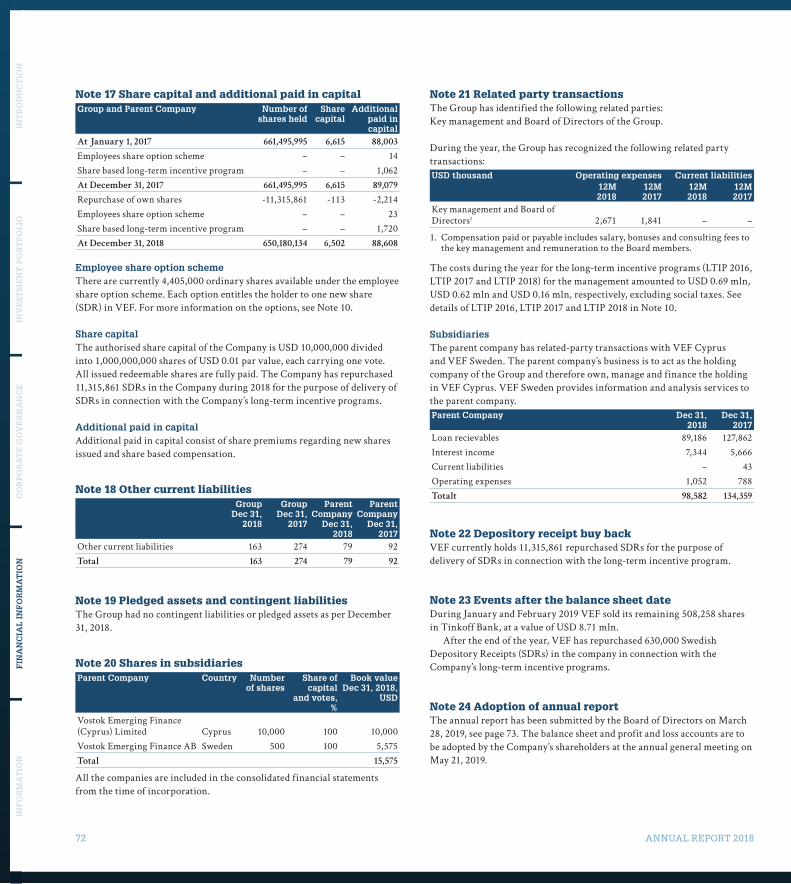
72 ANNUAL REPORT 2018
INT
RO
DU
CT
ION
INV
EST
ME
NT
PO
RT
FO
LIO
CO
RP
OR
AT
E G
OV
ER
NA
NC
EF
INA
NC
IAL
IN
FO
RM
AT
ION
INF
OR
MA
TIO
N
Note 17 Share capital and additional paid in capitalGroup and Parent Company Number of
shares heldShare
capitalAdditional
paid in capital
At January 1, 2017 661,495,995 6,615 88,003
Employees share option scheme – – 14Share based long-term incentive program – – 1,062At December 31, 2017 661,495,995 6,615 89,079
Repurchase of own shares -11,315,861 -113 -2,214Employees share option scheme – – 23Share based long-term incentive program – – 1,720At December 31, 2018 650,180,134 6,502 88,608
Employee share option schemeThere are currently 4,405,000 ordinary shares available under the employee share option scheme. Each option entitles the holder to one new share (SDR) in VEF. For more information on the options, see Note 10.
Share capitalThe authorised share capital of the Company is USD 10,000,000 divided into 1,000,000,000 shares of USD 0.01 par value, each carrying one vote. All issued redeemable shares are fully paid. The Company has repurchased 11,315,861 SDRs in the Company during 2018 for the purpose of delivery of SDRs in connection with the Company’s long-term incentive programs.
Additional paid in capitalAdditional paid in capital consist of share premiums regarding new shares issued and share based compensation.
Note 18 Other current liabilitiesGroup
Dec 31, 2018
Group Dec 31,
2017
Parent Company
Dec 31, 2018
Parent Company
Dec 31, 2017
Other current liabilities 163 274 79 92Total 163 274 79 92
Note 19 Pledged assets and contingent liabilitiesThe Group had no contingent liabilities or pledged assets as per December 31, 2018.
Note 20 Shares in subsidiariesParent Company Country Number
of sharesShare of
capital and votes,
%
Book value Dec 31, 2018,
USD
Vostok Emerging Finance (Cyprus) Limited Cyprus 10,000 100 10,000Vostok Emerging Finance AB Sweden 500 100 5,575Total 15,575
All the companies are included in the consolidated financial statements from the time of incorporation.
Note 21 Related party transactionsThe Group has identified the following related parties: Key management and Board of Directors of the Group.
During the year, the Group has recognized the following related party transactions: USD thousand Operating expenses Current liabilities
12M2018
12M2017
12M2018
12M2017
Key management and Board of Directors1 2,671 1,841 – –
1. Compensation paid or payable includes salary, bonuses and consulting fees to the key management and remuneration to the Board members.
The costs during the year for the long-term incentive programs (LTIP 2016, LTIP 2017 and LTIP 2018) for the management amounted to USD 0.69 mln, USD 0.62 mln and USD 0.16 mln, respectively, excluding social taxes. See details of LTIP 2016, LTIP 2017 and LTIP 2018 in Note 10.
SubsidiariesThe parent company has related-party transactions with VEF Cyprus and VEF Sweden. The parent company’s business is to act as the holding company of the Group and therefore own, manage and finance the holding in VEF Cyprus. VEF Sweden provides information and analysis services to the parent company.Parent Company Dec 31,
2018Dec 31,
2017Loan recievables 89,186 127,862Interest income 7,344 5,666Current liabilities – 43Operating expenses 1,052 788Totalt 98,582 134,359
Note 22 Depository receipt buy backVEF currently holds 11,315,861 repurchased SDRs for the purpose of delivery of SDRs in connection with the long-term incentive program.
Note 23 Events after the balance sheet dateDuring January and February 2019 VEF sold its remaining 508,258 shares in Tinkoff Bank, at a value of USD 8.71 mln.
After the end of the year, VEF has repurchased 630,000 Swedish Depository Receipts (SDRs) in the company in connection with the Company’s long-term incentive programs.
Note 24 Adoption of annual reportThe annual report has been submitted by the Board of Directors on March 28, 2019, see page 73. The balance sheet and profit and loss accounts are to be adopted by the Company’s shareholders at the annual general meeting on May 21, 2019.
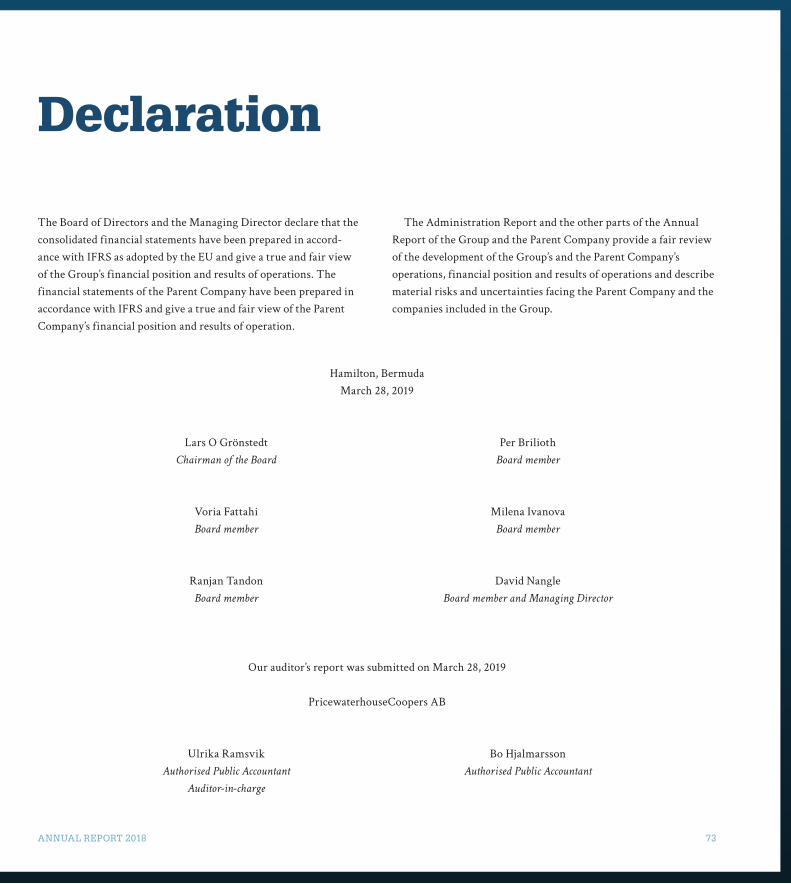
ANNUAL REPORT 2018 73
Declaration
The Board of Directors and the Managing Director declare that the consolidated financial statements have been prepared in accord-ance with IFRS as adopted by the EU and give a true and fair view of the Group’s financial position and results of operations. The financial statements of the Parent Company have been prepared in accordance with IFRS and give a true and fair view of the Parent Company’s financial position and results of operation.
The Administration Report and the other parts of the Annual Report of the Group and the Parent Company provide a fair review of the development of the Group’s and the Parent Company’s operations, financial position and results of operations and describe material risks and uncertainties facing the Parent Company and the companies included in the Group.
Hamilton, BermudaMarch 28, 2019
Lars O Grönstedt Per Brilioth Chairman of the Board Board member
Voria Fattahi Milena Ivanova Board member Board member
Ranjan Tandon David Nangle Board member Board member and Managing Director
Our auditor’s report was submitted on March 28, 2019
PricewaterhouseCoopers AB
Ulrika Ramsvik Bo Hjalmarsson Authorised Public Accountant Authorised Public Accountant
Auditor-in-charge
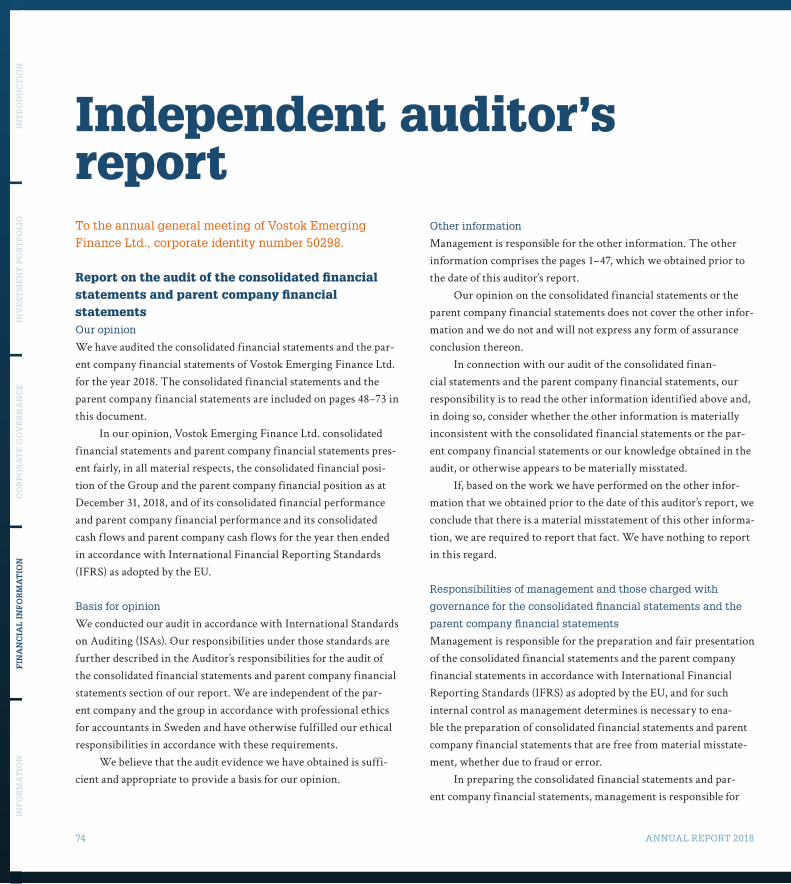
74 ANNUAL REPORT 2018
INT
RO
DU
CT
ION
INV
EST
ME
NT
PO
RT
FO
LIO
CO
RP
OR
AT
E G
OV
ER
NA
NC
EF
INA
NC
IAL
IN
FO
RM
AT
ION
INF
OR
MA
TIO
N
Independent auditor’s reportTo the annual general meeting of Vostok Emerging Finance Ltd., corporate identity number 50298.
Report on the audit of the consolidated financial statements and parent company financial statementsOur opinion
We have audited the consolidated financial statements and the par-ent company financial statements of Vostok Emerging Finance Ltd. for the year 2018. The consolidated financial statements and the parent company financial statements are included on pages 48–73 in this document.
In our opinion, Vostok Emerging Finance Ltd. consolidated financial statements and parent company financial statements pres-ent fairly, in all material respects, the consolidated financial posi-tion of the Group and the parent company financial position as at December 31, 2018, and of its consolidated financial performance and parent company financial performance and its consolidated cash flows and parent company cash flows for the year then ended in accordance with International Financial Reporting Standards (IFRS) as adopted by the EU.
Basis for opinion
We conducted our audit in accordance with International Standards on Auditing (ISAs). Our responsibilities under those standards are further described in the Auditor’s responsibilities for the audit of the consolidated financial statements and parent company financial statements section of our report. We are independent of the par-ent company and the group in accordance with professional ethics for accountants in Sweden and have otherwise fulfilled our ethical responsibilities in accordance with these requirements.
We believe that the audit evidence we have obtained is suffi-cient and appropriate to provide a basis for our opinion.
Other information
Management is responsible for the other information. The other information comprises the pages 1–47, which we obtained prior to the date of this auditor’s report.
Our opinion on the consolidated financial statements or the parent company financial statements does not cover the other infor-mation and we do not and will not express any form of assurance conclusion thereon.
In connection with our audit of the consolidated finan-cial statements and the parent company financial statements, our responsibility is to read the other information identified above and, in doing so, consider whether the other information is materially inconsistent with the consolidated financial statements or the par-ent company financial statements or our knowledge obtained in the audit, or otherwise appears to be materially misstated.
If, based on the work we have performed on the other infor-mation that we obtained prior to the date of this auditor’s report, we conclude that there is a material misstatement of this other informa-tion, we are required to report that fact. We have nothing to report in this regard.
Responsibilities of management and those charged with
governance for the consolidated financial statements and the
parent company financial statements
Management is responsible for the preparation and fair presentation of the consolidated financial statements and the parent company financial statements in accordance with International Financial Reporting Standards (IFRS) as adopted by the EU, and for such internal control as management determines is necessary to ena-ble the preparation of consolidated financial statements and parent company financial statements that are free from material misstate-ment, whether due to fraud or error.
In preparing the consolidated financial statements and par-ent company financial statements, management is responsible for
ANNUAL REPORT 2018 75
assessing the Group’s ability to continue as a going concern, disclos-ing, as applicable, matters related to going concern and using the going concern basis of accounting unless management either intends to liquidate the Group or to cease operations, or has no realistic alternative but to do so.
Those charged with governance are responsible for overseeing the Group’s financial reporting process.
Auditor’s responsibilities for the audit of the consolidated
financial statements and parent company financial statements
Our objectives are to obtain reasonable assurance about whether the consolidated financial statements and parent company finan-cial statements as a whole are free from material misstatement, whether due to fraud or error, and to issue an auditor’s report that includes our opinion. Reasonable assurance is a high level of assur-ance, but is not a guarantee that an audit conducted in accordance with ISAs will always detect a material misstatement when it exists. Misstatements can arise from fraud or error and are considered material if, individually or in the aggregate, they could reasonably be expected to influence the economic decisions of users taken on the basis of these consolidated financial statements and parent company financial statements.
As part of an audit in accordance with ISAs, we exercise pro-fessional judgment and maintain professional scepticism throughout the audit. We also:> Identify and assess the risks of material misstatement of the con-
solidated financial statements and parent company financial state-ments, whether due to fraud or error, design and perform audit procedures responsive to those risks, and obtain audit evidence that is sufficient and appropriate to provide a basis for our opin-ion. The risk of not detecting a material misstatement resulting from fraud is higher than for one resulting from error, as fraud may involve collusion, forgery, intentional omissions, misrep-resentations, or the override of internal control.
> Obtain an understanding of internal control relevant to the audit in order to design audit procedures that are appropriate in the cir-cumstances, but not for the purpose of expressing an opinion on the effectiveness of the Group’s internal control.
> Evaluate the appropriateness of accounting policies used and the reasonableness of accounting estimates and related disclosures made by management.
> Conclude on the appropriateness of management’s use of the going concern basis of accounting and, based on the audit evi-dence obtained, whether a material uncertainty exists related to events or conditions that may cast significant doubt on the Group’s ability to continue as a going concern. If we conclude that a material uncertainty exists, we are required to draw attention in our auditor’s report to the related disclosures in the consolidated financial statements or parent company financial statements or, if such disclosures are inadequate, to modify our opinion. Our con-clusions are based on the audit evidence obtained up to the date of our auditor’s report. However, future events or conditions may cause the Group to cease to continue as a going concern.
> Evaluate the overall presentation, structure and content of the consolidated financial statements and parent company financial statements, including the disclosures, and whether the consoli-dated financial statements represent the underlying transactions and events in a manner that achieves fair presentation.
> Obtain sufficient appropriate audit evidence regarding the finan-cial information of the entities or business activities within the Group to express an opinion on the consolidated financial state-ments. We are responsible for the direction, supervision and per-formance of the group audit. We remain solely responsible for our audit opinion.
We communicate with those charged with governance regarding, among other matters, the planned scope and timing of the audit and significant audit findings, including any significant deficiencies in internal control that we identify during our audit.
Stockholm, March 28, 2019PricewaterhouseCoopers AB
Ulrika RamsvikAuthorisedpublicaccountant
Auditor-in-charge
Bo HjalmarssonAuthorisedpublicaccountant
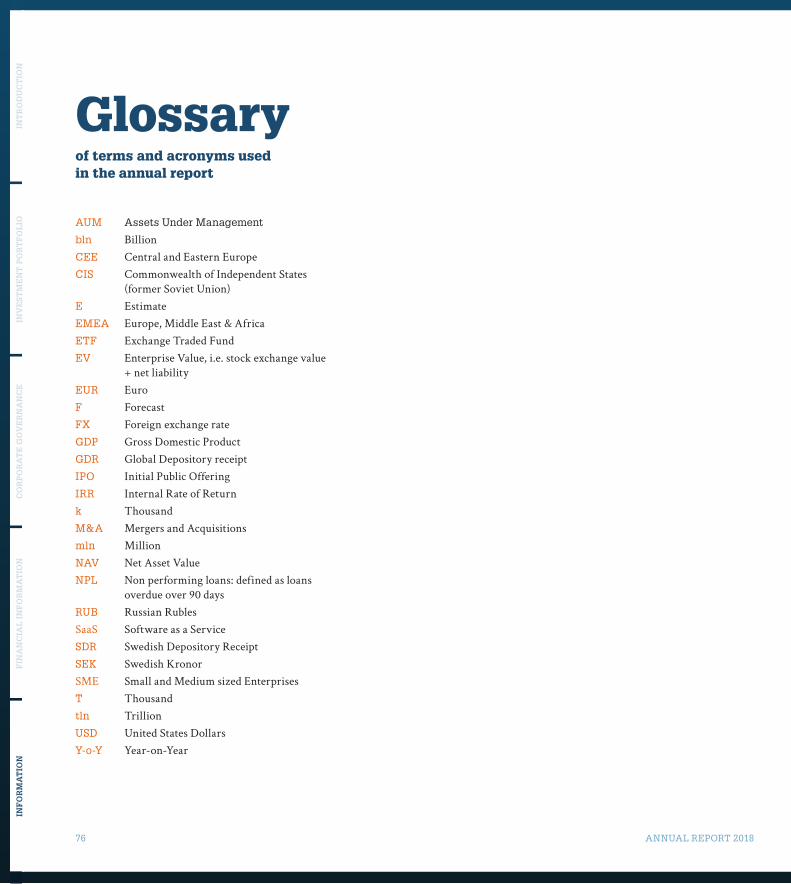
76 ANNUAL REPORT 2018
INT
RO
DU
CT
ION
INV
EST
ME
NT
PO
RT
FO
LIO
CO
RP
OR
AT
E G
OV
ER
NA
NC
EF
INA
NC
IAL
IN
FO
RM
AT
ION
INF
OR
MA
TIO
N
Glossaryof terms and acronyms used in the annual report
AUM Assets Under Management
bln BillionCEE Central and Eastern EuropeCIS Commonwealth of Independent States
(former Soviet Union)E EstimateEMEA Europe, Middle East & AfricaETF Exchange Traded FundEV Enterprise Value, i.e. stock exchange value
+ net liabilityEUR EuroF ForecastFX Foreign exchange rateGDP Gross Domestic ProductGDR Global Depository receipt IPO Initial Public OfferingIRR Internal Rate of Returnk ThousandM&A Mergers and Acquisitionsmln MillionNAV Net Asset ValueNPL Non performing loans: defined as loans
overdue over 90 daysRUB Russian RublesSaaS Software as a ServiceSDR Swedish Depository Receipt SEK Swedish KronorSME Small and Medium sized EnterprisesT Thousandtln TrillionUSD United States DollarsY-o-Y Year-on-Year
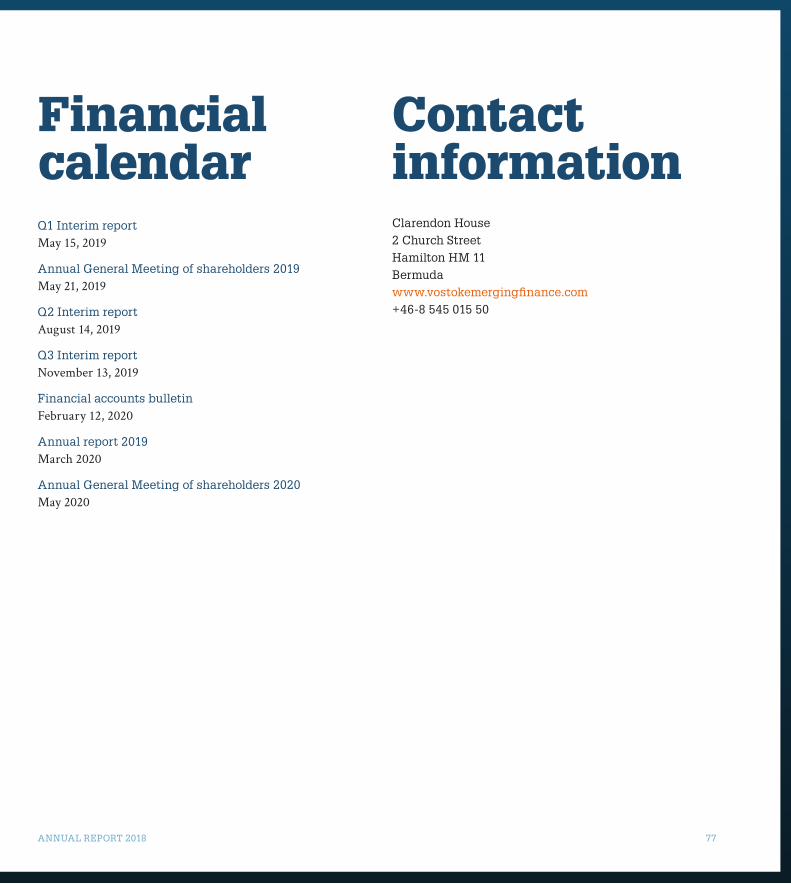
ANNUAL REPORT 2018 77
Financial calendar
Contact information
Q1 Interim reportMay 15, 2019
Annual General Meeting of shareholders 2019May 21, 2019
Q2 Interim report August 14, 2019
Q3 Interim report November 13, 2019
Financial accounts bulletinFebruary 12, 2020
Annual report 2019March 2020
Annual General Meeting of shareholders 2020May 2020
Clarendon House 2 Church Street Hamilton HM 11Bermuda www.vostokemergingfinance.com+46-8 545 015 50