50
Annual Report 2020 Essential Services for your facility and infrastructure

AnnualReport2020
Essential Servicesfor your facilityand infrastructure

It was the best of times,
it was the worst of times
“
Charles Dickens A Tale of Two Cities
”

The ARA Group acknowledges the connection of people, land and communitieswithin the areas that we work. We pay our respects to Elders past, present and emerging.
We seek to maintain meaningful partnerships by undertaking the appropriate engagement practices within our business and for our communities. We know the importance of respecting, understanding and sharing the oldest living cultures in the world.
Acknowledgement of Country
ARA Group LimitedABN 47 074 886 561
Contents
ARA 2020
1
Letter from the Executive Chair and Managing Director
The Unsung Heroes of the ARA Group
19 Years of Sales and Profitability
6
8
12
ARA In The Community
4
ARA Endowment Fund
Black Lives Matter
Our Community Partnerships
32
34
35
Audited Financial Statements
5
Audited Financial Statements
ARA Directory
38
94
ARA Divisions
3
Our Divisions
Our Locations
Our Leadership Team
26
28
29
ARA Initiatives
2
Cleaning and Covid-19
ARA Indigenous Services
Made in Australia and New Zealand
Security Matters
16
18
20
22
Essential Servicesfor your facility and infrastructure
AnnualReport
2020

1
5
Annual Report 2020
4
The ARA Group
Section ARA 2020
Letter from the Executive Chair and Managing Director
The Unsung Heroes of the ARA group
19 Years of Sales and Profitability
6
8
12
This past financial year has been a tale of before COVID-19 and after COVID-19.”
“

Executive Chair and Managing Director
Letter from the
Edward Federman
Co-founder, Executive Chair and Managing Director ARA Group Limited
I cannot think of a better description of this time we are living in than the introduction to A Tale of Two Cities. This past financial year has been a tale of before COVID-19 and after COVID-19.
The first six months of the financial year were the best of times, whilst the second six months of the financial year was a significant challenge. When the COVID-19 pandemic came to the shores of Australia and New Zealand, we were unsure of what was going to happen to the business. It was incumbent upon the management of ARA to demonstrate leadership in dealing with the effect of the pandemic to ensure the safety of our employees and our customers and also to preserve the value of the company for our shareholders.
We immediately formed a Pandemic Committee consisting of the Executive Directors of ARA, the Chief Financial Officer, the General Counsel and the Compliance Manager. We established protocols of operation within the confines of government guidelines and our own judgment given the industries where ARA operates. The Senior Management Team met every day to determine how each business was performing given the government mandated lockdowns and to make sure our employees and customers were safe and healthy. The daily meetings ensured that the company could react quickly to make certain that health and safety were the first priority and we were doing everything possible to maintain the profitability of ARA.
The majority of ARA businesses are essential services and thrived during the past six months whilst other ARA businesses struggled once the pandemic came to the Australasian shores. ARA Electrical had an exceptional year as they
did a lot of infrastructure work and those sites continued to be open. ARA Property Services also had a very strong second half of the financial year as a result of extra cleaning requirements for our customers. ARA Manufacture did well as a result of the need for Australian manufactured products. ARA businesses that performs non-essential services struggled at times as customers restricted contractors from their premises.
Many ARA employees worked less hours or took pay cuts for a period of time due to the uncertainty of the pandemic. I will be forever grateful to the entire ARA team for their personal sacrifices during the initial period of uncertainty.
Managing during this pandemic has made ARA a better company. The collaboration and communication between senior managers have improved significantly. The daily meetings at the senior management level has encouraged a secondary level of collaboration with managers, salespeople and business development personnel around ARA. The emphasis of all the meetings have been cross selling and introducing all of ARA services to existing customers.
Despite dealing with the effect of a pandemic, ARA has completed this financial year in a very strong position. 2020 was the tenth consecutive year of record sales and the fifth consecutive year of record earnings. Earnings per share increased to $.46 per share in 2020 as compared to $.42 per share in 2019.
Revenue grew from $555 million in 2019 to $621 million in 2020, an increase of $66 million or 12%. Revenue has grown at a compounded growth rate of 11% during the past ten years. The company had 4% organic growth in 2020.
EBITDA before acquisition expenses increased from $32.5 million in 2019 to $36.8 million in 2020, an increase of $4.3 million, or 13%. EBITDA before profit sharing with management and employees and acquisition expenses was $40.7 million, or 7% of revenue. This represents an increase of $2.5 million, or 7%, from the previous financial year’s EBITDA before profit sharing with management and employees and acquisition expenses ($38.2 million). EBITDA has grown at a compounded growth rate of 16% during the past ten years.
Cash flow during the past financial year was strong but was adversely affected by the exceptional cash flow experienced in 2019 when ARA converted 121% of its EBITDA into operating cash flow. In 2020, ARA converted 82% of its EBITDA into operating cash flow. Free cash flow in 2020 was $22.9 million as compared to free cash flow in 2019 of $26.5 million.
Confirmed forward orders for the Group is $208 million at 30 June 2020 as compared to $236 million at the end of the previous financial year. This level of backlog for ARA puts the Group in a reasonable operating position for the start of the new financial year. There still remains a great deal of uncertainty in the community of the ongoing threat of COVID-19.
ARA’s businesses have demonstrated the benefit of its diverse, but related, group of essential building services it has in the Group during the past financial year. It took a great effort by a lot of people for ARA to achieve our record operating results in 2020. I will be forever grateful to the ARA employees, the Senior Management Team and the ARA Board of Directors for the support we gave to one another during the trying times of 2020.
Edward Federman
Executive Chair and Managing Director ARA Group Limited
Section 1 ARA 2020
It was the best of times, it was the worst of times, it was the age of wisdom, it was the age of foolishness, it was the epoch of belief, it was the epoch of incredulity, it was the season of Light, it was the season of Darkness, it was the spring of hope, it was the winter of despair, we had everything before us, we had nothing before us, we were all going direct to Heaven, we were all going direct the other way – in short, the period was so far like the present period, that some of its noisiest authorities insisted on its being received, for good or for evil, in the superlative degree of comparison only.”
Charles Dickens A Tale of Two Cities
7
Annual Report 2020
6
The ARA Group
“
Note: EBITDA is presented before the impact of the new accounting standard (AASB 16) leases.
Section 1 ARA 2020
9
Annual Report 2020
8
The ARA Group
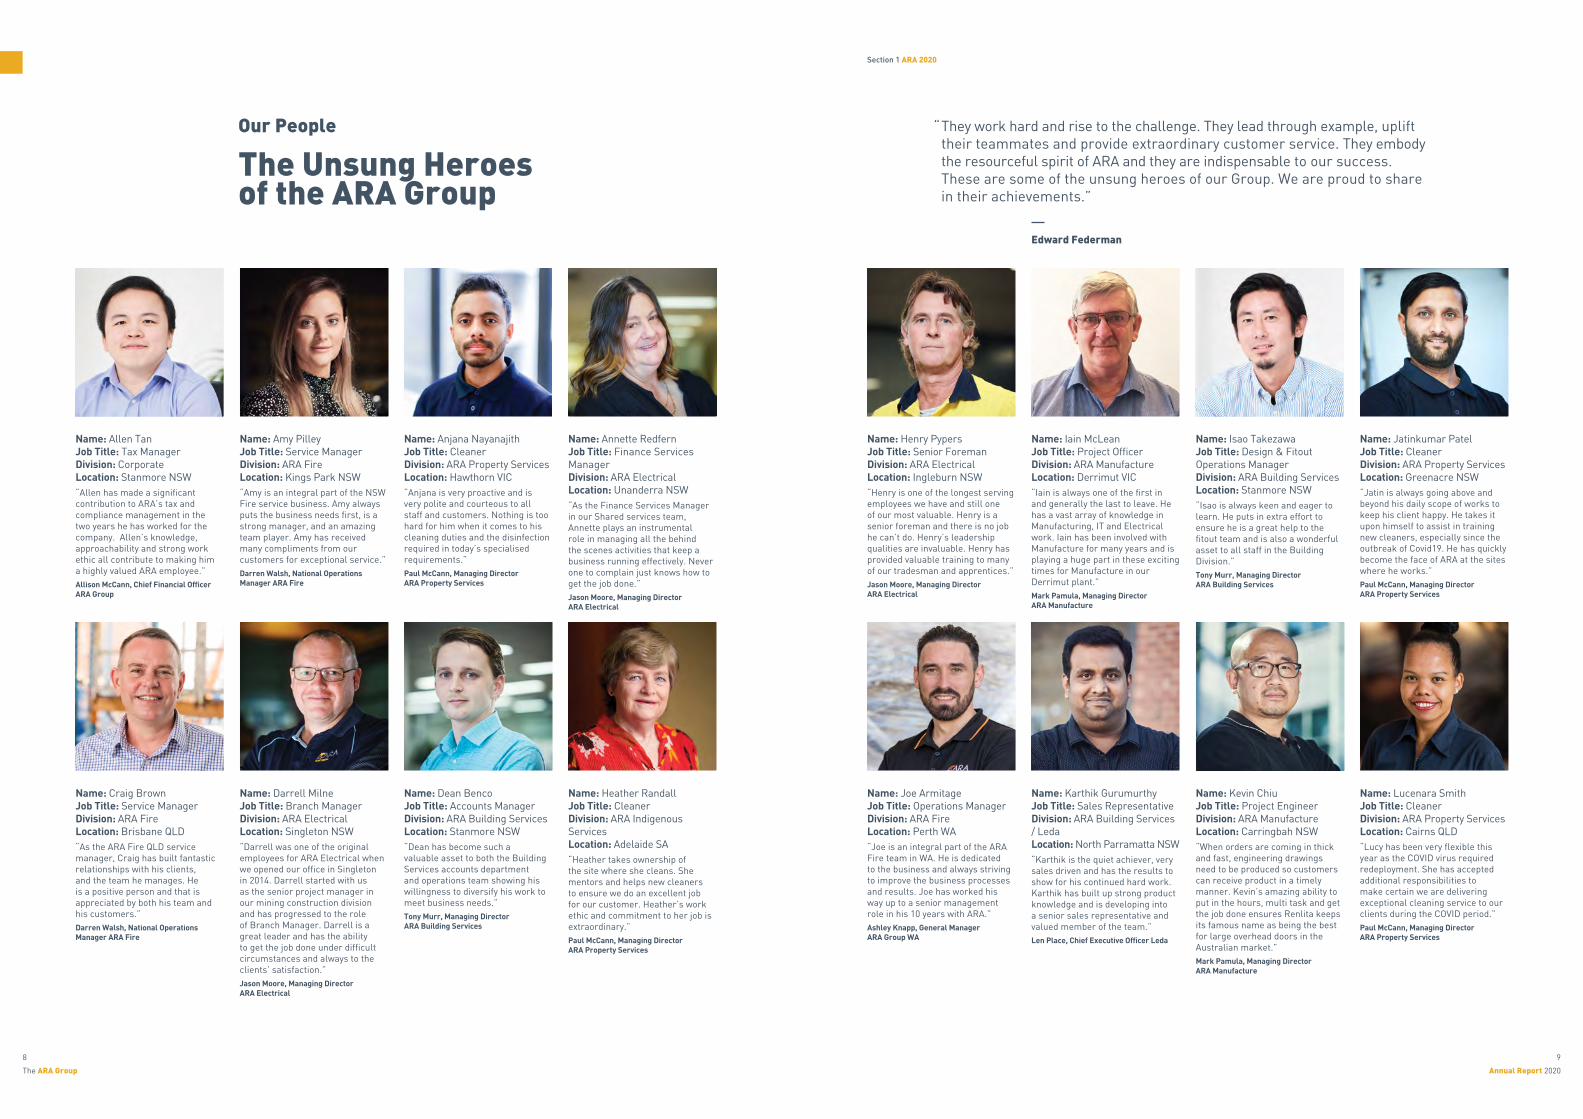
Name: Allen Tan Job Title: Tax Manager Division: Corporate Location: Stanmore NSW“Allen has made a significant contribution to ARA’s tax and compliance management in the two years he has worked for the company. Allen’s knowledge, approachability and strong work ethic all contribute to making him a highly valued ARA employee.”Allison McCann, Chief Financial Officer ARA Group
Name: Craig Brown Job Title: Service Manager Division: ARA Fire Location: Brisbane QLD“As the ARA Fire QLD service manager, Craig has built fantastic relationships with his clients, and the team he manages. He is a positive person and that is appreciated by both his team and his customers.”Darren Walsh, National Operations Manager ARA Fire
Name: Joe Armitage Job Title: Operations Manager Division: ARA Fire Location: Perth WA“Joe is an integral part of the ARA Fire team in WA. He is dedicated to the business and always striving to improve the business processes and results. Joe has worked his way up to a senior management role in his 10 years with ARA.”Ashley Knapp, General Manager ARA Group WA
Name: Anjana Nayanajith Job Title: Cleaner Division: ARA Property Services Location: Hawthorn VIC“Anjana is very proactive and is very polite and courteous to all staff and customers. Nothing is too hard for him when it comes to his cleaning duties and the disinfection required in today’s specialised requirements.”Paul McCann, Managing Director ARA Property Services
Name: Isao Takezawa Job Title: Design & Fitout Operations Manager Division: ARA Building Services Location: Stanmore NSW“Isao is always keen and eager to learn. He puts in extra effort to ensure he is a great help to the fitout team and is also a wonderful asset to all staff in the Building Division.”Tony Murr, Managing Director ARA Building Services
Name: Dean Benco Job Title: Accounts Manager Division: ARA Building Services Location: Stanmore NSW“Dean has become such a valuable asset to both the Building Services accounts department and operations team showing his willingness to diversify his work to meet business needs.”Tony Murr, Managing Director ARA Building Services
Name: Kevin Chiu Job Title: Project Engineer Division: ARA Manufacture Location: Carringbah NSW“When orders are coming in thick and fast, engineering drawings need to be produced so customers can receive product in a timely manner. Kevin’s amazing ability to put in the hours, multi task and get the job done ensures Renlita keeps its famous name as being the best for large overhead doors in the Australian market.”Mark Pamula, Managing Director ARA Manufacture
Name: Amy Pilley Job Title: Service Manager Division: ARA Fire Location: Kings Park NSW“Amy is an integral part of the NSW Fire service business. Amy always puts the business needs first, is a strong manager, and an amazing team player. Amy has received many compliments from our customers for exceptional service.”Darren Walsh, National Operations Manager ARA Fire
Name: Darrell Milne Job Title: Branch Manager Division: ARA Electrical Location: Singleton NSW“Darrell was one of the original employees for ARA Electrical when we opened our office in Singleton in 2014. Darrell started with us as the senior project manager in our mining construction division and has progressed to the role of Branch Manager. Darrell is a great leader and has the ability to get the job done under difficult circumstances and always to the clients’ satisfaction.”Jason Moore, Managing Director ARA Electrical
Name: Karthik Gurumurthy Job Title: Sales Representative Division: ARA Building Services / Leda Location: North Parramatta NSW“Karthik is the quiet achiever, very sales driven and has the results to show for his continued hard work. Karthik has built up strong product knowledge and is developing into a senior sales representative and valued member of the team.”Len Place, Chief Executive Officer Leda
Name: Annette Redfern Job Title: Finance Services Manager Division: ARA Electrical Location: Unanderra NSW“As the Finance Services Manager in our Shared services team, Annette plays an instrumental role in managing all the behind the scenes activities that keep a business running effectively. Never one to complain just knows how to get the job done.”Jason Moore, Managing Director ARA Electrical
Name: Jatinkumar Patel Job Title: Cleaner Division: ARA Property Services Location: Greenacre NSW“Jatin is always going above and beyond his daily scope of works to keep his client happy. He takes it upon himself to assist in training new cleaners, especially since the outbreak of Covid19. He has quickly become the face of ARA at the sites where he works.”Paul McCann, Managing Director ARA Property Services
Name: Heather Randall Job Title: Cleaner Division: ARA Indigenous Services Location: Adelaide SA“Heather takes ownership of the site where she cleans. She mentors and helps new cleaners to ensure we do an excellent job for our customer. Heather’s work ethic and commitment to her job is extraordinary.”Paul McCann, Managing Director ARA Property Services
Name: Lucenara Smith Job Title: Cleaner Division: ARA Property Services Location: Cairns QLD“Lucy has been very flexible this year as the COVID virus required redeployment. She has accepted additional responsibilities to make certain we are delivering exceptional cleaning service to our clients during the COVID period.”Paul McCann, Managing Director ARA Property Services
They work hard and rise to the challenge. They lead through example, uplift their teammates and provide extraordinary customer service. They embody the resourceful spirit of ARA and they are indispensable to our success. These are some of the unsung heroes of our Group. We are proud to share in their achievements.”
The Unsung Heroesof the ARA Group
Our People
Name: Henry Pypers Job Title: Senior Foreman Division: ARA Electrical Location: Ingleburn NSW“Henry is one of the longest serving employees we have and still one of our most valuable. Henry is a senior foreman and there is no job he can’t do. Henry’s leadership qualities are invaluable. Henry has provided valuable training to many of our tradesman and apprentices.”Jason Moore, Managing Director ARA Electrical
Name: Iain McLean Job Title: Project Officer Division: ARA Manufacture Location: Derrimut VIC“Iain is always one of the first in and generally the last to leave. He has a vast array of knowledge in Manufacturing, IT and Electrical work. Iain has been involved with Manufacture for many years and is playing a huge part in these exciting times for Manufacture in our Derrimut plant.”Mark Pamula, Managing Director ARA Manufacture
Edward Federman
“

Section 1 ARA 2020
11
Annual Report 2020
10
The ARA Group
Name: Muhamed Cengic Job Title: Client Manager Division: ARA Mechanical Location: Kingsgrove NSW“Mo is a completely motivated and focused individual who has helped develop a new and exciting product in EA Plus. Mo is always working towards having the reputation of ARA shine and always has the respect of our customers.”Phil Harding, Managing Director ARA Mechanical
Name: Sonya Dacombe Job Title: Service Administrator Division: ARA Products / Metalbilt Location: Christchurch NZ“Sonya is our ‘go to’ person in the Christchurch office. She handles everything that comes her way with professionalism and positivity.”Geoff Willis, General Manager Metalbilt
Name: Rob Heffernan Job Title: Account Manager Division: ARA Fire Location: Perth WA“Rob has demonstrated dedication to his clients and is always putting in an extra effort. He is often praised by his clients. Rob has worked his way up to this current role as Account Manager after beginning his career with ARA as an apprentice 12 years ago.”Ashley Knapp, General Manager ARA Group WA
Name: Yorma Garcia Job Title: Senior Accounts Manager Division: ARA Building Services Location: Stanmore NSW“Yorma has been a dedicated employee for well over a decade. No matter what the challenge our business encounters, Yorma always rises to the occasion.”Tony Murr, Managing Director ARA Building Services
Name: Rocky Limatoae Job Title: Team Leader Division: ARA Products / Metalbilt Location: Auckland NZ“Rocky is respected and well-liked by all staff. His cool head and patience sets an example for others to follow.”Geoff Willis, General Manager Metalbilt
Name: Norm Loughran Job Title: Senior Project Manager Division: ARA Mechanical Location: Kingsgrove NSW“Norm is always completely focused on ensuring complete cost control on his projects while delivering the projects safely. Norm always has the best interests of the ARA Group in mind and is a complete team player.”Phil Harding, Managing Director ARA Mechanical
Name: Steve Fazakerley Job Title: HSEQ Manager Division: ARA Electrical Location: Ingleburn NSW“Steve is an integral part of our business and has been a large part of building a great culture in our business and ensuring the safety and well being of our people. Nothing is a problem for Steve and he is always willing to help everyone no matter the day or time.”Jason Moore, Managing Director ARA Electrical
Name: Robert Mucha Job Title: Foreman Division: ARA Manufacture Location: Adelaide SA“Rob’s commitment, effort and desire to step up and go above and beyond when it was really needed over the past couple of years has earned the respect of management, supervisors and staff at ARA Manufacture. Thank you for all of your extra effort Rob.”Mark Pamula, Managing Director ARA Manufacture
Name: Rita Laycock Job Title: Quality Manager Division: ARA Property Services / Complex Solutions Location: North Paramatta NSW“Rita is the backbone of our organisation and keeps everything and everyone in check! Rita is highly valued and respected by the team.”Ash Jones, General Manager Complex Solutions
Name: Zerin Sarkar Job Title: Cleaner Division: ARA Property Services / Complex Solutions Location: North Paramatta NSW“Zerin represents precisely what Complex Solutions is all about. Zerin is professional, hard-working and a wonderful person.”Ash Jones, General Manager Complex Solutions
Name: Samantha Stanton Job Title: Installation & Service Coordinator/Administration Division: ARA Building Services / Leda Location: Derrimut VIC“Sam manages the installation and service functions for both LEDA Victoria and LEDA South Australia including administration. She is the national point of contact for the NBN Co Service & Maintenance contract. Sam quietly goes about her work efficiently and is central to both states running smoothly.”Len Place, Chief Executive Officer Leda
Name: Igor Savuljica Job Title: Project Manager Division: ARA Security Location: Stanmore NSW
“ARA Security had three major security infrastructure projects at three different jails. There was pressure on getting adequate resources and pressure to meet accelerated timelines. Igor, Michael and Glenn teamed up exceptionally well to make certain all three projects were completed on time and on budget.”Tony Franov, Managing Director ARA Security
Name: Glenn Harris Job Title: Executive Manager Client Services Division: ARA Security Location: Stanmore NSW
Name: Michael Vais Senior Job Title: Project Manager Division: ARA Security Location: Stanmore NSW
Name: Peter Sanderson Job Title: Operations Manager Division: ARA Building / Leda Location: Tuggerah NSW“Peter has introduced processes and procedures that have improved LEDA’s manufacturing capability to meet European Union standards and manufacture under licence Hostile Vehicle Mitigation products at our Tuggerah facility, making LEDA the first and only manufacturer of HVM products in Australia.”Len Place, Chief Executive Officer Leda
The Unsung Heroesof the ARA Group
Thanks to

Section 1 ARA 2020
13
Annual Report 2020
12
The ARA Group
2002
2006
2010
2014
2004
2008
2012
2016
2003
2007
2011
2015
2005
2009
2013
2017
2018
2019
2020
2002
2006
2010
2014
2004
2008
2012
2016
2003
2007
2011
2015
2005
2009
2013
2017
2018
2019
2020
$ 2
692
817
$ 7
447
844
$ 6
553
299
$ 1
3 02
0 85
7
$ 4
042
872
$ 9
901
948
$ 1
2 04
9 34
2
$ 1
6 65
8 91
9
$ 1
424
211
$ 8
277
627
$ 9
243
426
$ 1
0 02
8 50
1
$ 6
911
968
$ 1
0 58
8 94
8
$ 8
809
653
$ 2
2 90
6 83
8
$ 2
7 03
9 89
7
$ 3
2 50
9 37
6
$ 3
6 76
0 78
6
19 Years ofSales and Profitability
Financial Year 2020
$ 3
72 3
32 3
84
$ 4
79 2
11 2
31
$ 5
55 2
98 2
15
$ 6
21 2
98 0
88
$ 3
52 3
22 3
32
$ 2
48 5
52 0
09
$ 1
97 3
95 7
99
$ 2
01 2
31 9
51
$ 1
84 0
24 8
16
$ 1
54 0
37 9
26
$ 9
6 94
6 95
5
$ 8
6 18
7 41
9
$ 7
2 22
1 95
6
$ 6
2 99
3 64
0
$ 2
8 08
2 55
2
$ 3
21 6
78 5
29
$ 3
01 0
54 2
33
$ 2
79 9
72 9
44
$ 2
70 1
67 3
54
Revenue grew to $621 million in 2020 from $555 million in 2019. The increase of $66 million of revenue represents a 12% increase from the prior year. This is the eighteenth year out of ARA’s nineteen years of operations that revenue has increased from the prior financial year. From 2011 to 2020, a period of the last ten years, revenue has grown at a compound rate of 11%. Revenue in 2020 was the tenth year in succession of record revenue.
Annual Revenue Annual EBITDA (before the impact of AASB16, accounting for operating leases)
EBITDA in 2020 was ARA’s fifth successive year of record profits. EBITDA in 2020, before acquisition expenses, was $36.8 million, an increase of $4.3 million, or 13%, from the $32.5 million of EBITDA reported in 2019. From 2011 to 2020, a period of the last ten years, EBITDA before acquisition expenses has grown at a compounded growth rate of 16%.
Note: EBITDA is presented before the impact of the new accounting standard (AASB 16) leases.

2Section ARA
InitiativesCleaning and Covid-19
ARA Indigenous Services
Made in Australia and New Zealand
Security Matters
16
18
20
22
It was incumbent upon the management of ARA to demonstrate leadership in dealing with the effect of the pandemic.”
15
Annual Report 2020
14
The ARA Group
“

Section 2 ARA Initiatives
17
Annual Report 2020
16
The ARA Group
During these unprecedented times, it has been very fortuitous that ARA has become a significant cleaning company. ARA has made two acquisitions of substantial cleaning companies during the past three years. Total cleaning turnover in 2020 was $91 million, an increase of $14 million, or 18% from the previous year. The revenue growth in 2020 was all organic growth.
The ARA Property Services Division helped the Group with its organic growth offset certain parts of the business where it was more difficult to get our service technicians on customers’ sites after COVID-19 reached the Australian shores.
The ARA cleaning business includes hospitals, commercial buildings, small office buildings, national corporate clients, food manufacturing, schools and multi-location businesses. The majority of our clients in 2020 required a more thorough cleaning in the second half of the financial year as a result of the COVID-19 pandemic. Occasionally, we were asked to do a very vigorous clean if there was a risk of a member of the customers’ staff that had been exposed to the virus. There have also been many opportunities to supply our customers with hand sanitiser, masks and other consumable products. Our management team was very aggressive in sourcing consumable items in order to service our clients well.
Financial year 2020 was a difficult year as a result of the pandemic, but ARA Property Services demonstrated its commitment to servicing our customers and yet keeping our own employees safe and healthy.
Cleaning and COVID-19
ARA Cleaning
Photo Descriptions
Above
COVID-19 Cleaning
Right Page
Healthcare Cleaning

Section 2 ARA Initiatives
19
Annual Report 2020
18
The ARA Group
When ARA purchased the CMC Property Services cleaning business in 2017, we also became the business partner of Michael O’Loughlin and his CMC Indigenous Services business. Our combined business became known as ARA Indigenous Services. At the time of our merger, the business was a commercial cleaning business.
The compelling strategy in combining our businesses was the opportunity to expand the service offering from commercial cleaning to having ARA Indigenous Services be a conduit for all of ARA’s services – Electrical, Fire Protection, Security, Mechanical and Building. Our thinking was that many of our customers would have Indigenous engagement goals and ARA Indigenous Services would be well placed to help those customers improve their engagement with the Indigenous community.
This strategy would also provide momentum for ARA to give significant and varied employment opportunities to Indigenous men and women. We hoped ARA would be a training ground and make a difference in many people’s lives.
It has taken longer than we expected, but there are now favourable circumstances in the business community, and particularly in the sectors where ARA competes, to provide ARA services through ARA Indigenous Services. Specifically, ARA Indigenous Services is the fire protection service supplier to a major university in Western Australia, the mechanical contractor for a school in New South Wales, bidding for important work in the tunnels being constructed in New South Wales, to name but a few situations.
These opportunities are noteworthy for both ARA Indigenous Services and the ARA Group. Together, we are committed to increasing our Indigenous employment. The work that is emerging is great for the Indigenous community and great for the ARA Group and our shareholders.
A conduit for all of ARA’s capabilities
Photo Descriptions
Right Page
Fire Services through
ARA Indigenous Services

Section 2 ARA Initiatives
21
Annual Report 2020
20
The ARA Group
The ARA Group has always been interested in manufacturing in Australia and New Zealand. The first acquisition that was made to begin ARA operations in 2001 was Sealeck Doors in Adelaide. Six months later, Monarch Doors was acquired solidifying ARA as a significant building products manufacturer in Australia.
Other manufacturing businesses within ARA are:
ARA Electrical – switchboard manufacturing
ARA Security – secure safes and cabinets
ARA Manufacture – physical security doors, windows, counters
ARA Manufacture – bullet resistant and bullet proof fabricated glass
ARA Fire – fabrication of pipe for fire protection systems
ARA Products / Metalbilt – steel roller shutters in New Zealand, commercial and industrial doors
In financial year 2020, ARA continued its quest to build a significant manufacturing business in Australasia.
Additional manufacturing businesses were acquired in 2020:
ARA Building / Leda Security Products – bollards, gates, turnstiles and commercial bicycle racks
ARA Building / ISM Interiors – commercial joinery shop
ARA Building / Lockin Lockers – custom lockers for offices, gyms and end of trip facilities
All of this manufacturing capability adds up to an Australasian manufacturing business doing approximately $85 million of sales annually. ARA is committed to manufacturing in Australia and New Zealand. With supply chains affected due to the world-wide pandemic, ARA can meet the needs of customers in Australia and New Zealand with quality products and short lead times.
Photo DescriptionsLeft to right, top to bottom
Renlita Series 3000
Custom Joinery & Lockers
Fire Pipe Fabrication
Bio-Containment Doors
Bollards
Steel Roller Shutters
Secure Safes
Right Page
Switchboards
Made in Australiaand New Zealand

Section 2 ARA Initiatives
23
Annual Report 2020
22
The ARA Group
The ARA Group operates seven specialist divisions. When analysing the market segments where ARA competes, Security is approximately 24% of ARA’s total revenue. Security service and products approximates $150 million per annum of revenue.
Security at ARA provides a broad and comprehensive range of capabilities.
The largest segment of Security revenue is the installation and service of electronic security systems, products and integrated security solutions. ARA has nationwide security businesses in both Australia and New Zealand. Our client base includes enterprise clients comprising large corporates, particularly in the finance industry, government including prisons, commercial buildings and defence.
Much of ARA Manufactured products are physical security products:
• Steel doors• Bullet proof/blast proof doors• Physically secure walls, counters, pass throughs• Bullet proof and bullet resistant glass• Steel roller shutters• Armoured safes and secure cabinets • Bollards• Turnstiles• Gates• Hostile Vehicle Barriers
ARA also distributes electronic security products to the wider industry, which include:
• Access control systems• CCTV equipment• Cameras• Access control cards and readers• Access control card printers• Lanyards, card holders and consumables
In today’s world, security does matter.
There are many threats in the world in which we live.
From electronic security products, installation and service to secure entry products, ballistic resistant, bullet and blast proof barriers, ARA is a complete integrated security solutions and service provider.
SecurityMatters
At ARA
Photo DescriptionsLeft page, top to bottom
Access Control
Lanyards
Access Card Printer
Secure Safe
Gates, Access Control, CCTV & Security System
Right Page, top to bottom, left to right
CCTV
Monitoring Rooms
Security System
Pass Through Unit
Blast Proof Door
Steel Roller Shutter
Steel Door
Bollards
Security Walls, Windows & Ballistic Glass

3Section ARA
DivisionsOur Divisions
Our Locations
Our Leadership Team
26
28
29
Despite dealing with the effect of a pandemic, ARA has completed this financial year in a very strong position.”
25
Annual Report 2020
24
The ARA Group
“

Section 3 ARA Divisions
27
Annual Report 2020
26
The ARA Group
$14.5 Million
Electrical, high voltage, data & engineering
High Voltage Services
Low Voltage Services
Engineering Solutions
Installation Services
Switchboards
Mobile Switch Rooms
Data Centres
Structured Cabling
All aspects of fire protection
Inspection & Testing
Sprinkler Systems
Detection & EWIS Systems
Passive & Fire Doors
Portable Systems
Special Hazards
Oxygen Reduction
Pipe Fabrication
Integration of & solutions for electronic security
Access Control
CCTV
ATM Security & Guarding
Electronic Security Solutions
Safes, Vaults & Teller Units
Locksmith Services
Building repairs & maintenance services
Remedial Building Repairs
Insurance Building Repairs
24/7 Emergency Service
Exterior & Interior Design
Fit Outs of Interior Spaces
Refurbishments
Multi Trade Services
Bollards, Gates and Commercial Bicycle Racks
Thermal Imaging
Joinery and Lockers
Maintenance
Energy management for commercial buildings
HVAC Design
Mechanical Ventilation
Air Conditioning
Chiller Plants
Building Automation
Energy Management
Metering
Commercial cleaning
Commercial Cleaning
Healthcare Cleaning
Food Processing Cleaning
Grounds Maintenance
Waste Management & Recycling
Distribution & Manufacture
Distribution of electronic security products and Manufacture of physical security products.
Access Control
CCTV
Photo ID Systems
Identity Security
Architectural Hardware
Commercial Doors
Industrial Doors
High Security Doors
Physical Security Systems
Ballistic Glass
Operates as a conduit for all ARA capabilities.
DivisionCapabilities
RevenueDivisions
Revenue Indigenous
$621 MillionService57% 15%
Construction15% Product
13% Infrastructure
2020
RevenueRevenueComprised of
$127 Million$58 Million$104 Million $65 Million $91 Million $109 Million $67 Million

Property & Building
Section 3 ARA Divisions
29
Annual Report 2020
28
The ARA Group
Edward FedermanCo-founder, Managing Director ARA Group / ARA Fire
Executive Chair, Director ARA Group 19 years with ARA
Allison McCannChief Financial Officer ARA Group
Director ARA Group 10 years with ARA
Brett ChambersDirector ARA Electrical
Director ARA Group 19 years with ARA
Stuart HarmerManaging Director ARA Products
11 years with ARA
Paul McCannManaging Director ARA Property Services
3 years with ARA - 27 years with CMC
Michael O’LoughlinManaging Director ARA Indigenous Services
3 years with ARA
Jason MooreManaging Director ARA Electrical
10 years with ARA
Tony FranovManaging Director ARA Security
Director ARA Group 19 years with ARA
Tony MurrManaging Director ARA Building Services
16 years with ARA
Mark PamulaManaging Director ARA Manufacture
19 years with ARA
Phil HardingManaging Director ARA Mechanical
14 years with ARA
The vast majority of ARA’s senior management team have been with ARA for over a decade. The continuity of their leadership has been critical to our success. This team has worked together to build and maintain our strong culture of service to our customers, whilst valuing the hard work of our employees and encouraging collaboration for the benefit of the Group.
OurLeadership Team
The ARA seniormanagement teamis critical to our success.
ACTCanberraNSWArtarmonBella VistaCastle HillStanmoreQLDEagle FarmCairnsSAWayvilleVICPort MelbourneWAPerthNEW ZEALANDAuckland KerikeriWellington
Security
ACT
Canberra
NSW
Bathurst
Kingsgrove
Orange
Tuggerah
QLD
Tingalpa
VIC
Port Melbourne
Mechanical
NSW
Heatherbrae
Ingleburn
Nowra
Singleton
Unanderra
QLD
Tingalpa
Electrical
ACT
Canberra
NSW
Kings Park
Tuggerah
QLD
Bundaberg
Kingston
Loganholme
SA
Regency Park
VIC
Derrimut
WA
Kalgoorlie
Perth
Fire
NSWBelrose
Caringbah
Rydalmere
QLDLoganholme
SARegency Park
VICDerrimut
Port Melbourne
NEW ZEALANDAuckland
Christchurch
Wellington
Products
ACTCanberra
NSWStanmore
VICMelbourne
Indigenous Services
ACTCanberraNSWParramattaStanmoreTuggerahQLDSlacks CreekSARegency ParkWayvilleVICAirport WestMelbourneDerrimutWABalcattaNEW ZEALANDAucklandTASHobart (Service location only)
OurLocations
ARA Group
The ARA Group proudly services facilities and infrastructure throughout Australia and New Zealand.
With over 40 ARA locations, we are well-positioned to deliver multi-site contracts and provide immediate support through our national base of service technicians who are available 24/7. We are experienced in setting up remote and temporary work sites for major industrial projects and we are open to opportunities in any location.

4Section ARA
In the Community
ARA Endowment Fund
Black Lives Matter
Our Community Partnerships
32
34
35
Together, we can create a lasting legacy.”
31
Annual Report 2020
30
The ARA Group
“

Section 4 ARA in the Community
33
Annual Report 2020
32
The ARA Group
The ARA Endowment Fund was established in 2009. The goal of the Fund is to grow the principal balance and donate the earnings of the Fund to registered Australian charities. In the early years of the Fund, we donated small amounts to many well deserving charities. The principal balance of the Endowment Fund is now approximately $2 million. As the principal balance grew and the annual income grew, the trustees of the Fund determined that the Endowment Fund needed a focus and a few selected Foundations to support.
Given the commitment of the ARA Group to racial equality, reconciliation in Australia and the equal opportunities for all people, regardless of colour, the Trustees of the Endowment Fund chose to partner with the GO Foundation, the Indigenous Literacy Foundation and the David Lynch Foundation. During the past financial year, the ARA Endowment Fund donated $30,000 to each of the three partner Foundations.
• The GO Foundation, established by Adam Goodes and Michael O’Loughlin, provides mentoring, leadership and educational opportunities to Aboriginal and Torres Strait Islander youth.
• The Indigenous Literacy Foundation provides culturally appropriate and first language books to improve literacy levels for children in remote Aboriginal and Torres Strait Island communities.
• The David Lynch Foundation assists populations at risk, victims of domestic violence and veterans suffering from post-traumatic stress disorder to alleviate stress through the evidence-based Transcendental Meditation technique.
The ARA Endowment Fund is the ARA Group’s commitment to leave an enduring legacy to the Australian community. The Group is committed to building the principal balance in the Endowment Fund to $10 million in the next 10 years. When the Endowment Fund reaches this level of principal balance the annual donation to our Foundation partners will be in the hundreds of thousands of dollars each year.
During the past year, ARA employees contributed approximately $50,000 to the Endowment Fund. These employee donations were matched dollar for dollar by ARA.
Together, we can create a lasting legacy.
The ARAEndowment Fund
Creating a lasting legacy
The GO Foundation Empowering through education.
“On behalf of the GO Foundation, we are thrilled to have the continued support of the ARA Endowment Fund. The Fund’s generous contributions support the GO Foundation’s programs and help ensure our young GO Scholars have all the resources and tools they need for their studies. GO provides support for Aboriginal and Torres Strait Islander youth throughout their education, from kindy to the work force. As Ed’s business partner through ARA Indigenous Services, it’s wonderful to have his support and the support of the ARA Endowment Fund in the GO Foundation and our vision of a brighter future for young Indigenous Australians.”
Michael O’Loughlin Co-Founder and Deputy Chairman The GO Foundation
Indigenous Literacy Foundation Reading opens doors.
“This year the Indigenous Literacy Foundation celebrates our tenth year as a Foundation. During 2020 we will gift nearly 100,000 books; publish our 100th book and in language and expand our early literacy program to over 50 sites. It’s an exciting time in our history and we are incredibly proud to partner with the ARA Endowment Fund to help achieve these and our long-term strategic goal of empowering children and families in remote Indigenous communities in their own literacy journeys.
Empowering communities for us is about publishing books in first languages. It’s about providing books and access to books that are culturally relevant and which reflect the lives and culture of the kids reading them. It’s about working with schools, businesses and the broad Australian community to build a better understanding of our First Nations’ history and culture.
The ARA Endowment Fund helps us achieve these very real milestones. But it achieves much more in real terms because it’s about a shared goal and vision for our First Nations’ children which is all about Equity and the resultant benefits in education, wellbeing and employment.”
Karen Williams Executive Director Indigenous Literacy Foundation
David Lynch Foundation Change begins within.
“On behalf of the David Lynch Foundation of Australia, we are once again supremely thankful and indebted to the ARA Endowment Fund and our great personal supporter, Ed Federman, for their incredible support. The last 12 months have seen excellent progress with our Domestic Violence Women’s shelter project in Sydney, including some fabulous research with one of Australia’s preeminent research institutions. We’ve also just begun a first wave of teaching for a Bushfire Relief project in NSW and hope to commence a Strengthening the Inner Women Domestic Violence project very soon in Adelaide. All of these projects, along with others that are continuing in the background could not have been done without the support of the ARA Endowment Fund and everyone involved. We would particularly love to thank Ed also for his incredible support in every way and look forward to another progressive year ahead. ”
Mark Bunn CEO Australia David Lynch Foundation
Section 4 ARA in the Community
35
Annual Report 2020
34
The ARA Group
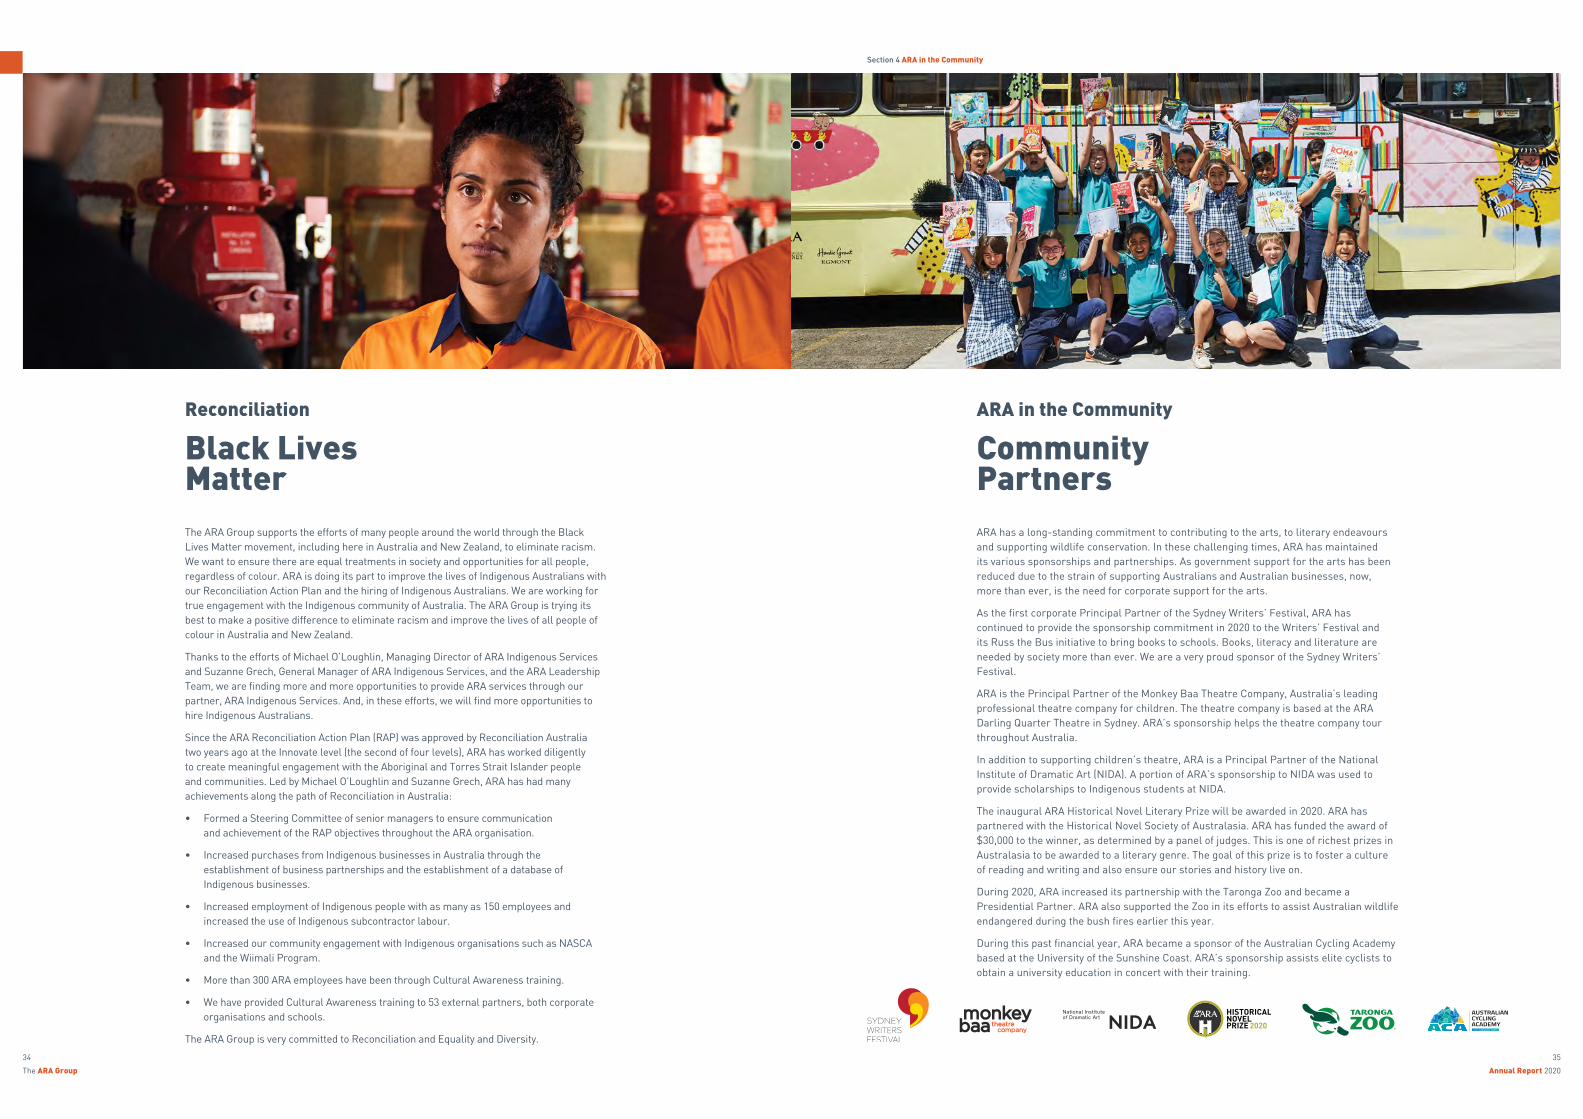
ARA has a long-standing commitment to contributing to the arts, to literary endeavours and supporting wildlife conservation. In these challenging times, ARA has maintained its various sponsorships and partnerships. As government support for the arts has been reduced due to the strain of supporting Australians and Australian businesses, now, more than ever, is the need for corporate support for the arts.
As the first corporate Principal Partner of the Sydney Writers’ Festival, ARA has continued to provide the sponsorship commitment in 2020 to the Writers’ Festival and its Russ the Bus initiative to bring books to schools. Books, literacy and literature are needed by society more than ever. We are a very proud sponsor of the Sydney Writers’ Festival.
ARA is the Principal Partner of the Monkey Baa Theatre Company, Australia’s leading professional theatre company for children. The theatre company is based at the ARA Darling Quarter Theatre in Sydney. ARA’s sponsorship helps the theatre company tour throughout Australia.
In addition to supporting children’s theatre, ARA is a Principal Partner of the National Institute of Dramatic Art (NIDA). A portion of ARA’s sponsorship to NIDA was used to provide scholarships to Indigenous students at NIDA.
The inaugural ARA Historical Novel Literary Prize will be awarded in 2020. ARA has partnered with the Historical Novel Society of Australasia. ARA has funded the award of $30,000 to the winner, as determined by a panel of judges. This is one of richest prizes in Australasia to be awarded to a literary genre. The goal of this prize is to foster a culture of reading and writing and also ensure our stories and history live on.
During 2020, ARA increased its partnership with the Taronga Zoo and became a Presidential Partner. ARA also supported the Zoo in its efforts to assist Australian wildlife endangered during the bush fires earlier this year.
During this past financial year, ARA became a sponsor of the Australian Cycling Academy based at the University of the Sunshine Coast. ARA’s sponsorship assists elite cyclists to obtain a university education in concert with their training.
The ARA Group supports the efforts of many people around the world through the Black Lives Matter movement, including here in Australia and New Zealand, to eliminate racism. We want to ensure there are equal treatments in society and opportunities for all people, regardless of colour. ARA is doing its part to improve the lives of Indigenous Australians with our Reconciliation Action Plan and the hiring of Indigenous Australians. We are working for true engagement with the Indigenous community of Australia. The ARA Group is trying its best to make a positive difference to eliminate racism and improve the lives of all people of colour in Australia and New Zealand.
Thanks to the efforts of Michael O’Loughlin, Managing Director of ARA Indigenous Services and Suzanne Grech, General Manager of ARA Indigenous Services, and the ARA Leadership Team, we are finding more and more opportunities to provide ARA services through our partner, ARA Indigenous Services. And, in these efforts, we will find more opportunities to hire Indigenous Australians.
Since the ARA Reconciliation Action Plan (RAP) was approved by Reconciliation Australia two years ago at the Innovate level (the second of four levels), ARA has worked diligently to create meaningful engagement with the Aboriginal and Torres Strait Islander people and communities. Led by Michael O’Loughlin and Suzanne Grech, ARA has had many achievements along the path of Reconciliation in Australia:
• Formed a Steering Committee of senior managers to ensure communication and achievement of the RAP objectives throughout the ARA organisation.
• Increased purchases from Indigenous businesses in Australia through the establishment of business partnerships and the establishment of a database of Indigenous businesses.
• Increased employment of Indigenous people with as many as 150 employees and increased the use of Indigenous subcontractor labour.
• Increased our community engagement with Indigenous organisations such as NASCA and the Wiimali Program.
• More than 300 ARA employees have been through Cultural Awareness training.
• We have provided Cultural Awareness training to 53 external partners, both corporate organisations and schools.
The ARA Group is very committed to Reconciliation and Equality and Diversity.
CommunityPartners
Black LivesMatter
ARA in the CommunityReconciliation
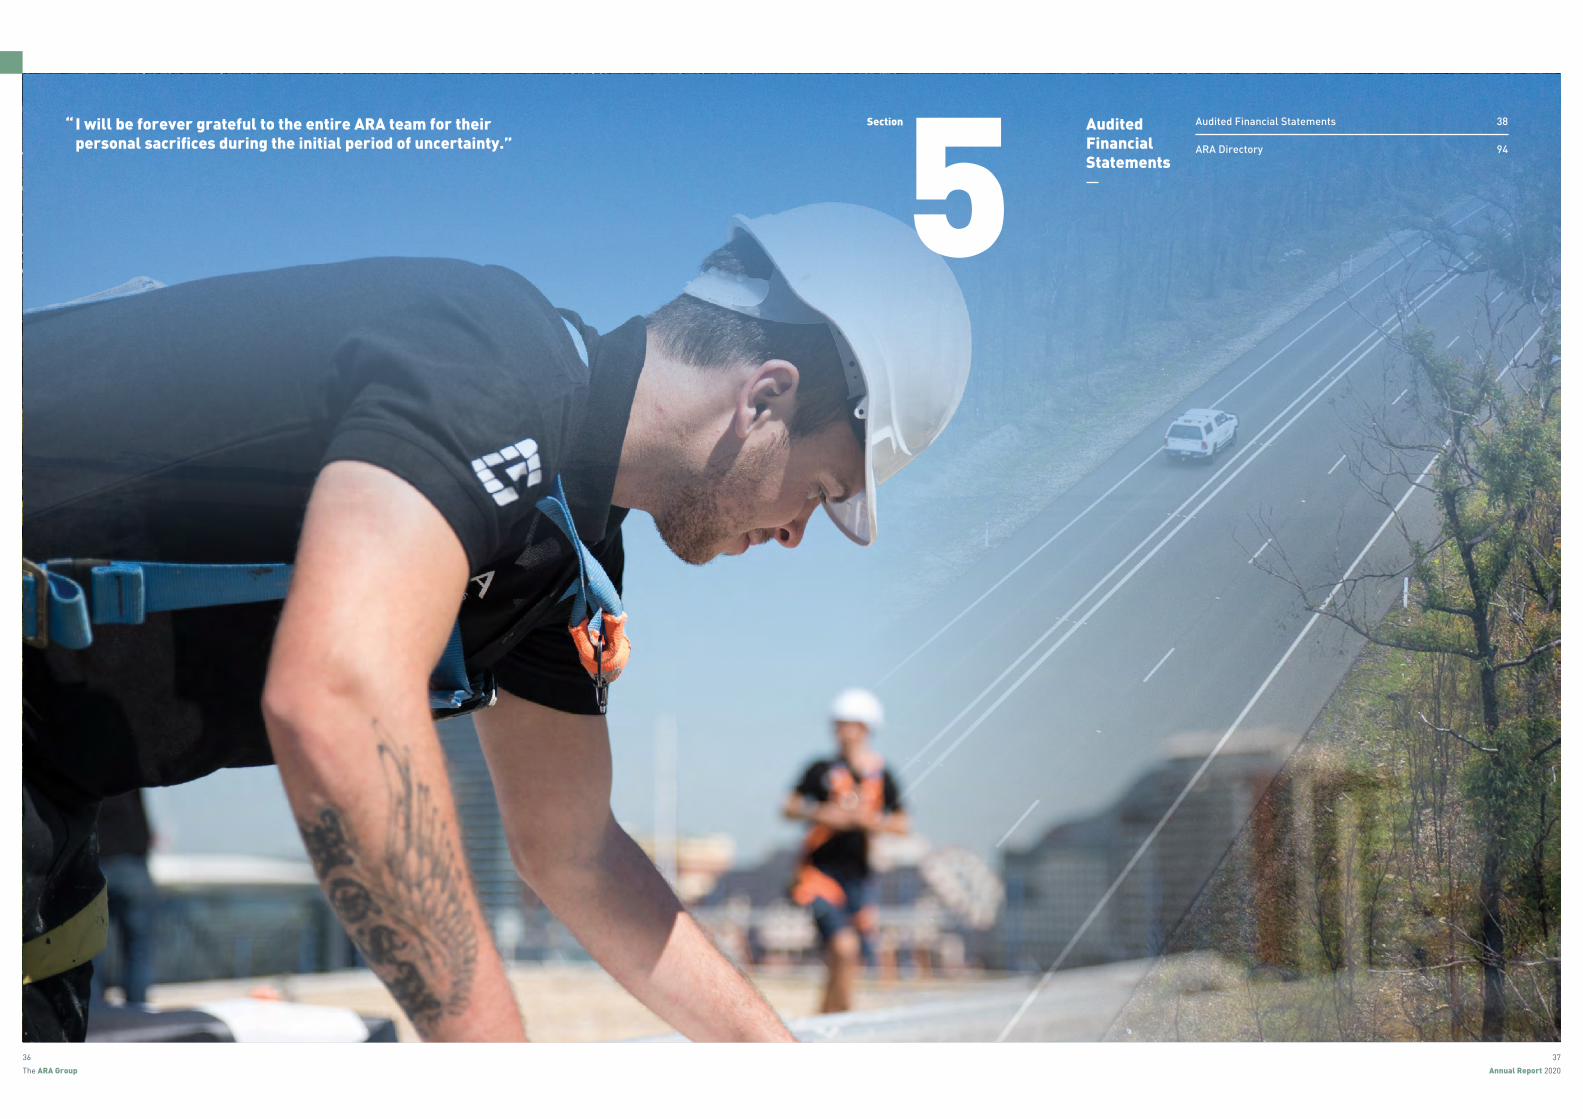
5Section Audited
FinancialStatements
Audited Financial Statements
ARA Directory
38
94
I will be forever grateful to the entire ARA team for their personal sacrifices during the initial period of uncertainty.”
37
Annual Report 2020
36
The ARA Group
“

39
Annual Report 2020
38
The ARA Group
Section 5 Audited Financial Statements
ARA Group Limited and Controlled Entities
Directors' report
Your directors submit their report on ARA Group Limited (the "Company") and its controlled entities (collectivelythe "Group") for the year ended 30 June 2020.
The results in this report are before the impact of AASB 16 Leases in order to provide a meaningful comparisonto prior year. The impact of AASB 16 Leases has resulted in an increase in EBITDA by $11.2 million due to theremoval of operating lease expenses relating to property and motor vehicles. The prior year has not beenchanged for the impact of this standard which became effective for the Group on 1 July 2019. A reconciliationfrom the amounts reported in this report to the statutory accounts is set out in the table below.
Directors
The names and details of the Company's Directors in office during the financial year and until the date of thisreport are set out below. Directors were in office for this entire period.
Edward Federman (Executive Director and Executive Chair)
Edward Federman is a co-founder, Executive Chair and Managing Director of ARA Group Limited. Edward holdsan MBA and has over thirty-five years of experience in the building services industry. Edward also serves on theGroup’s Compensation Committee.
Leo Browne (Non-Executive Director)
Leo Browne is a co-founder and Non-Executive Director of ARA Group Limited. Leo has over fifty years ofexperience in the building services industry. Leo is chair of the Compensation Committee.
James Marshall (Non-Executive Director)
James Marshall joined the Board as a Non-Executive Director in 2014. James is a corporate lawyer and Head ofRestructuring at Ashurst law firm. James’ legal and commercial experience brings a breadth of expertise to theBoard.
Brett Chambers (Executive Director)
Brett Chambers joined the Board as an Executive Director in 2010. Brett has over thirty-five years of experiencein the electrical industry and has worked for the Company since 2001. Brett is a Director of the ARA ElectricalDivision.
Norbert Schweizer OAM (Non-Executive Director)
Norbert Schweizer joined the Board as a Non-Executive Director in 2006. Norbert is a corporate lawyer andfounder of Schweizer Kobras legal practice. Norbert has extensive experience in corporate and business law.
Allison McCann (Executive Director and Company Secretary)
Allison McCann joined the Board as an Executive Director in 2017 and was appointed Company Secretary in2012. Allison is the Group’s Chief Financial Officer and has worked for the Group since 2010. Allison is achartered accountant and has over fifteen years of finance and commercial experience.
Tony Franov (Executive Director)
Tony Franov joined the Board as an Executive Director in 2018. Tony has twenty years of experience in thesecurity industry and has worked for ARA since 2001. Tony is the Managing Director of the ARA SecurityDivision.
David Sefton (Company Secretary)
David Sefton was appointed Company Secretary in 2015. David is the Group’s General Counsel and has workedfor the Group since 2015. David is a corporate lawyer with over thirty years of experience.
1
ARA Group Limited and Controlled Entities
Directors' report (continued)
Directors' meetings
The number of meetings of directors (including meetings of committees of directors) held during the year and thenumber of meetings attended by each director were as follows:
Directors
Number ofBoard meetings
held
Number ofBoard meetings
attended
Number ofcompensation
committeemeetings held
Number ofcompensation
committeemeetings attended
Leo Browne 8 8 1 1Edward Federman 8 8 1 1James Marshall 8 8 - -Brett Chambers 8 8 - -Norbert Schweizer OAM 8 8 - -Allison McCann 8 8 1 1Tony Franov 8 8 - -
Results of operations
Net profit for the year of the economic entity after providing for income tax prepared on a consistent basis withthe prior year (i.e. excluding the impact of AASB 16) amounted to $18,778,102 (2019: $16,727,610). The netprofit for the year increased by 12% from the previous year.
The increase in net profit for the year was principally due to a very strong performance from the Electrical andProperty Divisions.
Review of operations
Total sales of the Group's products and services were $621,298,088 in 2020 compared with $555,298,215 in2019, an increase of $66 million, or 12%. The Group's earnings before interest, tax, depreciation andamortisation (EBITDA) amounted to $36,760,786 in 2020 (before acquisition costs of $260,488) compared with$32,509,376 in 2019 (before acquisition costs of $196,473), an increase of $4.3 million, or 13%. The Group'sEBITDA before acquisition costs and profit sharing expense was $41,594,941 in 2020 (7% of revenue) and$38,200,177 in 2019 (7% of revenue), an increase of $3.4 million, or 9%.
There were a few one-off items included in EBITDA for the year, as set out below.
2020$
Losses from discontinued operations (sale of cash in transit business) (1,291,615)Restructuring costs (1,411,878)Government JobKeeper wage subsidies received 3,411,450
Total positive effect of unusual items included in EBITDA in 2020 707,957
2

41
Annual Report 2020
40
The ARA Group
Section 5 Audited Financial Statements
ARA Group Limited and Controlled Entities
Directors' report (continued)
Review of operations (continued)
Earnings before interest, tax, depreciation, amortisation and profit sharing expense summary
2019
2020(Prior to
adjusting forAASB 16)
Impact ofadoption ofAASB 16 in
2020 2020$ $ $ $
Earnings before interest, tax, depreciation,amortisation and profit sharing expense 38,200,177 41,594,941 11,174,242 52,769,183Profit sharing expense (5,690,801) (4,834,155) - (4,834,155)EBITDA (Earnings before interest, tax,depreciation, amortisation and acquisitionexpense) 32,509,376 36,760,786 11,174,242 47,935,028
Acquisition costs (196,473) (260,488) - (260,488)Depreciation and amortisation expense (5,156,320) (5,805,247) (10,434,311) (16,239,558)
EBIT (Earnings before interest and tax) 27,156,583 30,695,051 739,931 31,434,982
Net interest expense (3,068,140) (3,480,410) (415,651) (3,896,061)Profit before income tax 24,088,443 27,214,641 324,280 27,538,921Income tax expense (7,360,833) (8,436,539) (97,284) (8,533,823)
Profit after income tax 16,727,610 18,778,102 226,996 19,005,098
The Group made three major acquisitions during the financial year. Two manufacturing businesses werepurchased and one security service business. The acquisitions were all in Australia. All of the acquisitions wereaccretive to earnings in 2020.
Throughout the financial year, the operating businesses maintained a strong forward order book. At 30 June2020, the confirmed forward orders totalled approximately $208 million (30 June 2019: $236 million). Thedecrease in the forward order book is principally due to the completion of infrastructure projects in 2020 by theElectrical, Mechanical and Fire Divisions.The backlog remains strong across all divisions.
The Group's net senior bank debt (senior bank debt less cash) increased by $7.1 million from $47.6 million at 30June 2019 to $54.7 million at 30 June 2020. The increase in net senior bank debt is principally due to an increasein borrowings to pay for the acquisitions during the year.
The overall EBITDA operating margin remained at 6% of sales.
Principal activities
The principal activities of the economic entity during the financial year were the provision of essential buildingservices (installation and service) such as fire protection services, electrical, electrical engineering and highvoltage services, electronic security services and products, air conditioning, building fit out, building repairs,building automation, commercial joinery and end of trip facilities, cleaning services and the manufacturing ofspecialised building products such as steel doors, ballistic doors and partitions, steel security doors and steel firedoors, aluminium security shutters and grilles and security bollards. The acquisitions in 2020 increased theactivities of the companies in the economic entity during the year.
3
ARA Group Limited and Controlled Entities
Directors' report (continued)
Significant changes in the state of affairs
The COVID-19 outbreak was declared a pandemic by the World Health Organization in March 2020.
We have not seen a significant impact on the Group to date. Certain businesses and geographical locations didexperience a decline in revenue and qualified for JobKeeper subsidies. The outbreak and the response of theAustralian and New Zealand Governments in dealing with the pandemic is interfering with general activity levelswithin the community, the economy and certain operations of our business. The scale and duration of thesedevelopments remain uncertain as at the date of this report. This being the case, we do not consider itpracticable to provide a qualitative or quantitative estimate of the potential impact in the future of this outbreak onthe Group at this time.
The financial statements have been prepared based upon conditions existing at 30 June 2020 and consideringevents up to the date of this report.
During the year, the Group issued 1,169,884 new shares, increasing the number of shares issued from39,858,379 at 30 June 2019 to 41,028,263 at 30 June 2020. This increased contributed equity by $4,743,507from $88,570,325 at 30 June 2019 to $93,313,832 at 30 June 2020.
The issue of new shares relate to:
• 685,000 new shares issued as purchase consideration for businesses acquired, and• 484,884 newly issued shares to new and existing shareholders.
On 31 March 2020, the Group entered into an Amended Facility Agreement with its banks (Westpac BankingCorporation, Bank of Queensland and Commonwealth Bank of Australia). The total Facility is $140 million, anincrease of $30 million from 30 June 2019. The Facility is principally a revolving cash advance facility to assistthe Group to fund organic growth and strategic acquisitions. The Facility runs to 31 July 2023.
There were no other significant changes in the state of affairs of the Group during the financial year.
Significant events after the reporting period
There have been no significant events occurring after the reporting period which may affect either the Group'soperations or results of those operations or the Group's state of affairs.
Future developments
The Group will continue to focus on margin improvements in all of its businesses. The directors continue to seekmanagement to focus on margin improvements, although it is recognised that the competitive environment andthe state of some sectors of the local economy makes it difficult for significant margin increases.
The Group's acquisition strategy will remain consistent in its approach to examine opportunities that complementits current services and products. One element of the Group's acquisition strategy is to acquire companies thatincrease the overall operating margin of the Group. It is expected the Group will continue to focus on organicgrowth and improved operating margins in 2021, although appropriate acquisition opportunities will be thoroughlyinvestigated. It remains the goal of the Directors to pay dividends of $0.30 per share during the financial year2021.
If the Group identifies appropriate acquisitions in 2021, it will likely use a combination of new equity, cash flowfrom operations, and borrowings to finance the execution of any acquisitions, as it did in 2020. In any event, thedirectors will ensure that the Group does not become highly leveraged. The goal of the Group remains that its netbank debt will not exceed 30% of its total capital structure. At 30 June 2020, net debt was $54.7 million, or 30%of its capital structure ($47.6 million at 30 June 2019 and 30% of its capital structure). The increase in debt wasprincipally due to debt funding for the acquisitions during the financial year offset by cash flow from operationsand the issuance of new equity. At 30 June 2020, the leverage ratio (total net senior bank debt excluding bankguarantees, divided by the trailing twelve months EBITDA, adjusted for acquisitions made during the year) was1.47 (30 June 2019: 1.42). Bank covenants under the current facility agreement are measured before the impactof AASB 16 Leases.
4

43
Annual Report 2020
42
The ARA Group
Section 5 Audited Financial Statements
ARA Group Limited and Controlled Entities
Directors' report (continued)
Future developments (continued)
Net interest expense increased by only $412,270, despite increased borrowings for acquisitions. The Group'sinterest cover ratio (EBIT divided by interest expense) was 9 times in 2020 and in 2019.
Environmental regulations
The economic entity's operations are not regulated by any significant environmental regulation under a law of theCommonwealth or of a State or Territory. The Group has embarked upon a plan to reduce its carbon footprint inthe environment. The Group has implemented an Environmental Management Policy and continues to worktowards ISO accreditation in all of its businesses.
Dividends
The Group paid $0.257 per share in 2020 (2019: $0.312 per share) of which $0.077 per share related todividends declared at 30 June 2019.
Fully franked dividends amounting to $13,505,553, or $0.33 per share, were declared by ARA Group Limitedduring the financial year (2019: $11,795,394 or $0.30 per share). Of the total amount declared in 2020, $0.15 pershare was declared for shareholders of record as of 30 June 2020. $6,154,238 was provided for in the accountsas of 30 June 2020. $2,015,413 of this, or $0.05 per share was paid on 3 July 2020. The remaining $0.10 pershare will be paid in financial year 2021.
In addition to dividends paid by ARA Group Limited, ARA Indigenous Services Pty Ltd paid total dividends of$459,189 in 2020 to shareholders. $234,187 of which was paid to shareholders outside of the Group.
Share options
No option to acquire shares in the Company has been granted to any person. No shares have been issuedduring the financial year or since the end thereof by virtue of the exercise of any options. There are no unissuedshares under option at the date of this report.
Indemnification and insurance of directors and officers
Insurance premiums of $20,566 were paid during the financial year for Directors and Officer Liability Insurance.
Indemnification of auditor
To the extent permitted by law, the Company has agreed to indemnify its auditor, Ernst & Young (Australia), aspart of the terms of its audit engagement agreement against claims by third parties arising from the audit (for anunspecified amount). No payment has been made to indemnify Ernst & Young (Australia) during or since thefinancial year.
Proceedings on behalf of the Company
No person has applied for leave of the Court to bring proceedings on behalf of the Company or intervene in anyproceedings to which the Company is a party for the purpose of taking responsibility on behalf of the Companyfor all or any part of those proceedings. The Company was not a party to any such proceedings during the year.
5
ARA Group Limited and Controlled Entities
Directors' report (continued)
Auditor's independence declaration
The directors have received a declaration from the auditor of ARA Group Limited and Controlled Entities. This has been included on page 44.
Signed in accordance with a resolution of the Board of Directors made pursuant to section 298(2) of the Corporations Act 2001.
Edward FedermanExecutive DirectorSydney7 August 2020
6

45
Annual Report 2020
44
The ARA Group
Section 5 Audited Financial Statements
A member firm of Ernst & Young Global Limited Liability limited by a scheme approved under Professional Standards Legislation
Ernst & Young Services Pty Limited
200 George Street Sydney NSW 2000 Australia GPO Box 2646 Sydney NSW 2001
Tel: +61 2 9248 5555 Fax: +61 2 9248 5959 ey.com/au
Auditor’s Independence Declaration to the Directors of ARA Group Limited As lead auditor for the audit of the financial report of ARA Group Limited for the financial year ended 30 June 2020, I declare to the best of my knowledge and belief, there have been:
a) no contraventions of the auditor independence requirements of the Corporations Act 2001 in relation to the audit; and
b) no contraventions of any applicable code of professional conduct in relation to the audit. This declaration is in respect of ARA Group Limited and the entities it controlled during the financial year. Ernst & Young Chris Lawton Partner 7 August 2020
ARA Group Limited and Controlled Entities
Consolidated statement of profit or loss and othercomprehensive income
For the year ended 30 June 2020
2020 2019Notes $ $
Revenue from contracts with customers 5.1 621,298,088 555,298,215
Other income 6.1 191,965 118,310
Changes in inventories of finished goods and work in progress (4,503,125) 854,899Raw materials and consumables used (168,718,154) (151,171,094)Employee benefits expense (225,808,958) (194,744,755)Management and subcontract fees (136,850,174) (132,031,996)Profit sharing expense (4,834,155) (5,690,801)Depreciation of property, plant and equipment 6.4 (4,013,038) (3,431,635)Depreciation of right-of-use assets 6.5 (10,434,311) -Amortisation expense 6.6 (1,792,209) (1,724,685)Other expenses from ordinary activities 6.7 (32,840,459) (40,123,402)Acquisition expenses (260,488) (196,473)Finance costs 6.3 (3,509,396) (3,156,871)Finance costs - interest on payments for right-of-use assets (415,651) -Finance income 6.2 28,986 88,731Profit before income tax expenses 27,538,921 24,088,443
Income tax expense 7 (8,533,823) (7,360,833)
Net profit for the year 19,005,098 16,727,610
Net profit for the year is attributable to:Owners of the Parent 18,418,455 16,344,292Non-controlling interests 586,643 383,318
19,005,098 16,727,610
Other comprehensive incomeOther comprehensive income to be reclassified to profit or loss insubsequent periods:Exchange differences on translation of foreign operations 20.2 (108,887) 4,014Net unrealised gain/(loss) on cash flow hedges, net of tax 20.2 201,083 (633,907)Net other unrealised comprehensive income/(loss) to bereclassified to profit or loss in subsequent periods 92,196 (629,893)
Other comprehensive income/(loss) for the year 92,196 (629,893)
Total comprehensive income for the year 19,097,294 16,097,717
Total comprehensive income for the year is attributable to:Owners of the Parent 18,510,651 15,714,399Non-controlling interests 586,643 383,318
19,097,294 16,097,717
The accompanying notes form part of these financial statements.
8
47
Annual Report 2020
46
The ARA Group
Section 5 Audited Financial Statements
ARA Group Limited and Controlled Entities
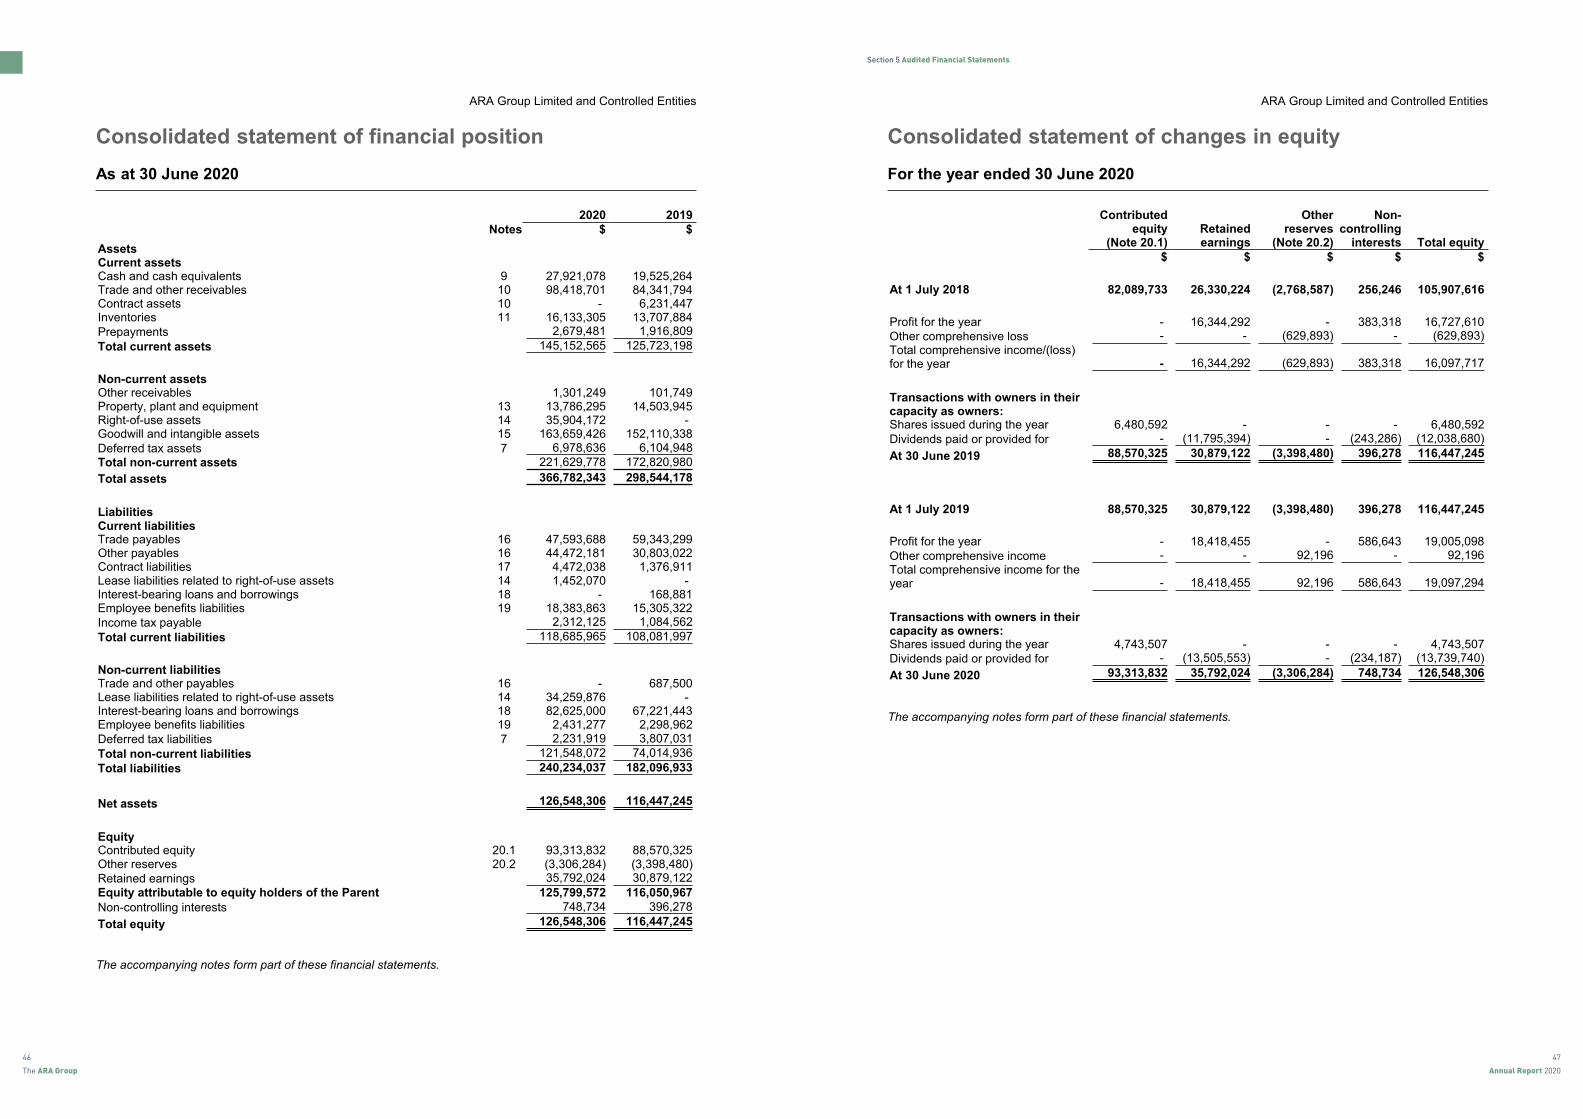
Consolidated statement of financial position
As at 30 June 2020
2020 2019Notes $ $
AssetsCurrent assetsCash and cash equivalents 9 27,921,078 19,525,264Trade and other receivables 10 98,418,701 84,341,794Contract assets 10 - 6,231,447Inventories 11 16,133,305 13,707,884Prepayments 2,679,481 1,916,809
Total current assets 145,152,565 125,723,198
Non-current assetsOther receivables 1,301,249 101,749Property, plant and equipment 13 13,786,295 14,503,945Right-of-use assets 14 35,904,172 -Goodwill and intangible assets 15 163,659,426 152,110,338Deferred tax assets 7 6,978,636 6,104,948Total non-current assets 221,629,778 172,820,980
Total assets 366,782,343 298,544,178
LiabilitiesCurrent liabilitiesTrade payables 16 47,593,688 59,343,299Other payables 16 44,472,181 30,803,022Contract liabilities 17 4,472,038 1,376,911Lease liabilities related to right-of-use assets 14 1,452,070 -Interest-bearing loans and borrowings 18 - 168,881Employee benefits liabilities 19 18,383,863 15,305,322Income tax payable 2,312,125 1,084,562
Total current liabilities 118,685,965 108,081,997
Non-current liabilitiesTrade and other payables 16 - 687,500Lease liabilities related to right-of-use assets 14 34,259,876 -Interest-bearing loans and borrowings 18 82,625,000 67,221,443Employee benefits liabilities 19 2,431,277 2,298,962Deferred tax liabilities 7 2,231,919 3,807,031
Total non-current liabilities 121,548,072 74,014,936
Total liabilities 240,234,037 182,096,933
Net assets 126,548,306 116,447,245
EquityContributed equity 20.1 93,313,832 88,570,325Other reserves 20.2 (3,306,284) (3,398,480)Retained earnings 35,792,024 30,879,122Equity attributable to equity holders of the Parent 125,799,572 116,050,967Non-controlling interests 748,734 396,278
Total equity 126,548,306 116,447,245
The accompanying notes form part of these financial statements.
9
ARA Group Limited and Controlled Entities
Consolidated statement of changes in equity
For the year ended 30 June 2020
Contributedequity
(Note 20.1)Retainedearnings
Otherreserves
(Note 20.2)
Non-controlling
interests Total equity$ $ $ $ $
At 1 July 2018 82,089,733 26,330,224 (2,768,587) 256,246 105,907,616
Profit for the year - 16,344,292 - 383,318 16,727,610Other comprehensive loss - - (629,893) - (629,893)Total comprehensive income/(loss)for the year - 16,344,292 (629,893) 383,318 16,097,717
Transactions with owners in theircapacity as owners:Shares issued during the year 6,480,592 - - - 6,480,592Dividends paid or provided for - (11,795,394) - (243,286) (12,038,680)
At 30 June 2019 88,570,325 30,879,122 (3,398,480) 396,278 116,447,245
At 1 July 2019 88,570,325 30,879,122 (3,398,480) 396,278 116,447,245
Profit for the year - 18,418,455 - 586,643 19,005,098Other comprehensive income - - 92,196 - 92,196Total comprehensive income for theyear - 18,418,455 92,196 586,643 19,097,294
Transactions with owners in theircapacity as owners:Shares issued during the year 4,743,507 - - - 4,743,507Dividends paid or provided for - (13,505,553) - (234,187) (13,739,740)
At 30 June 2020 93,313,832 35,792,024 (3,306,284) 748,734 126,548,306
The accompanying notes form part of these financial statements.
10
49
Annual Report 2020
48
The ARA Group
Section 5 Audited Financial Statements
ARA Group Limited and Controlled Entities
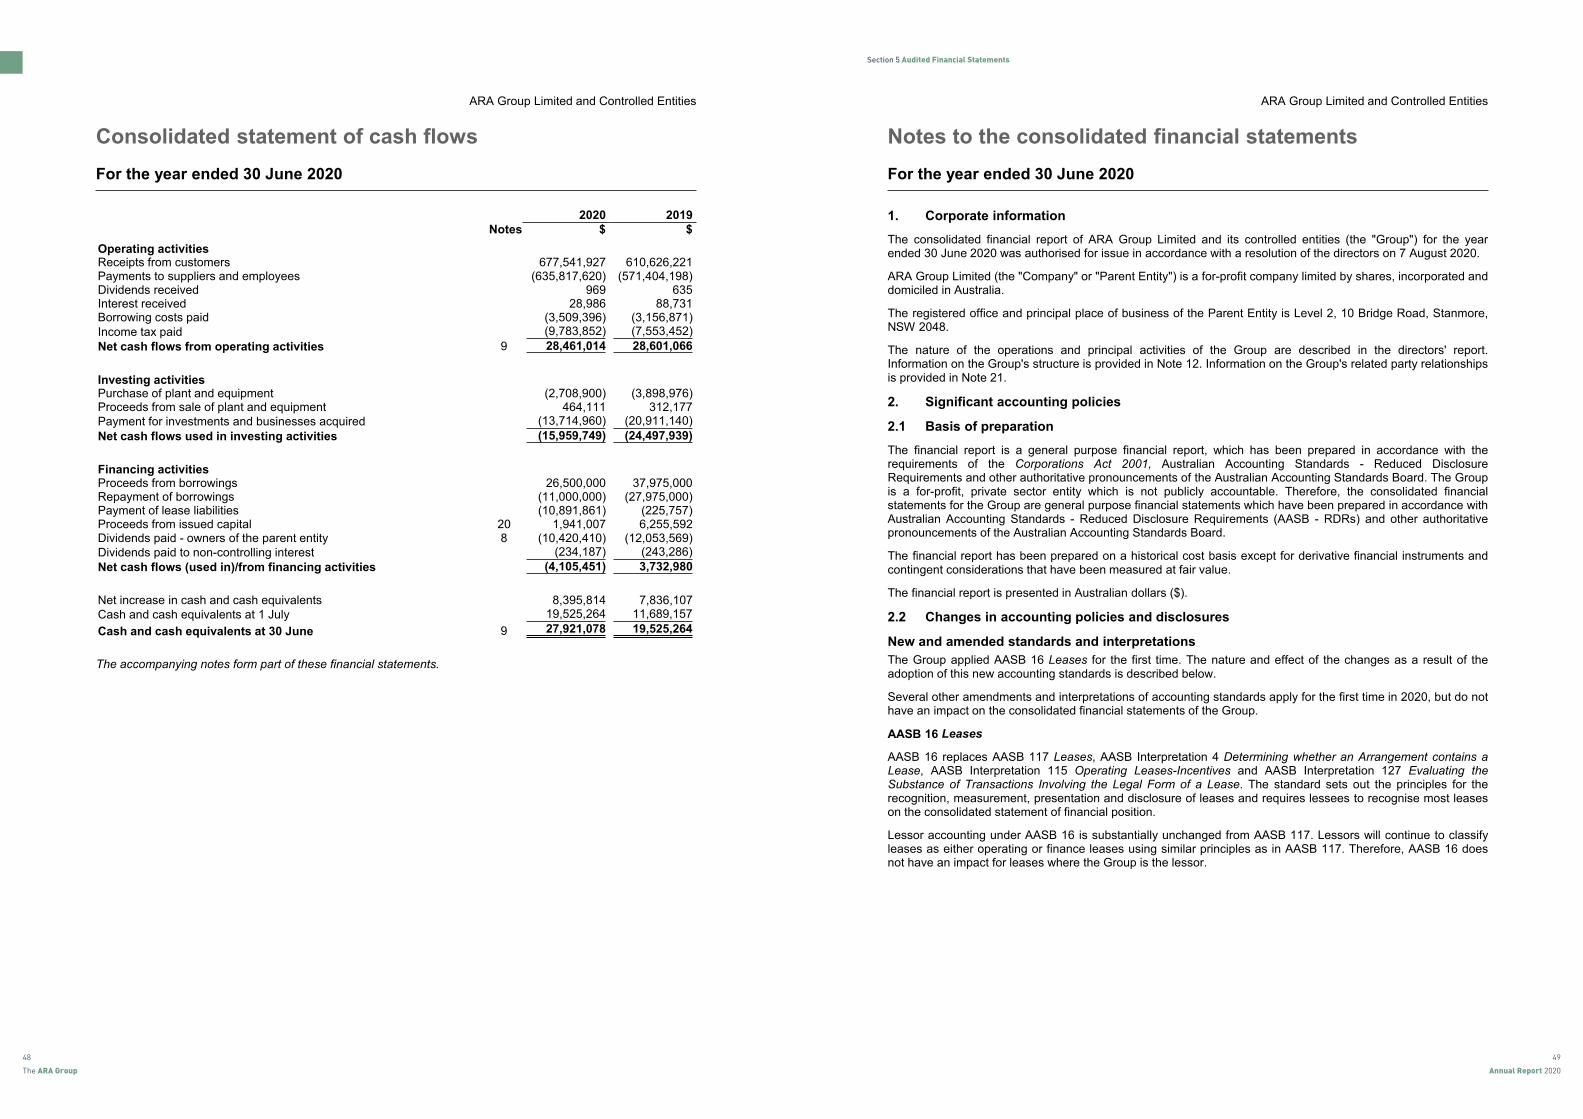
Consolidated statement of cash flows
For the year ended 30 June 2020
2020 2019Notes $ $
Operating activitiesReceipts from customers 677,541,927 610,626,221Payments to suppliers and employees (635,817,620) (571,404,198)Dividends received 969 635Interest received 28,986 88,731Borrowing costs paid (3,509,396) (3,156,871)Income tax paid (9,783,852) (7,553,452)
Net cash flows from operating activities 9 28,461,014 28,601,066
Investing activitiesPurchase of plant and equipment (2,708,900) (3,898,976)Proceeds from sale of plant and equipment 464,111 312,177Payment for investments and businesses acquired (13,714,960) (20,911,140)
Net cash flows used in investing activities (15,959,749) (24,497,939)
Financing activitiesProceeds from borrowings 26,500,000 37,975,000Repayment of borrowings (11,000,000) (27,975,000)Payment of lease liabilities (10,891,861) (225,757)Proceeds from issued capital 20 1,941,007 6,255,592Dividends paid - owners of the parent entity 8 (10,420,410) (12,053,569)Dividends paid to non-controlling interest (234,187) (243,286)
Net cash flows (used in)/from financing activities (4,105,451) 3,732,980
Net increase in cash and cash equivalents 8,395,814 7,836,107Cash and cash equivalents at 1 July 19,525,264 11,689,157
Cash and cash equivalents at 30 June 9 27,921,078 19,525,264
The accompanying notes form part of these financial statements.
11
ARA Group Limited and Controlled Entities
Notes to the consolidated financial statements
For the year ended 30 June 2020
1. Corporate information
The consolidated financial report of ARA Group Limited and its controlled entities (the "Group") for the yearended 30 June 2020 was authorised for issue in accordance with a resolution of the directors on 7 August 2020.
ARA Group Limited (the "Company" or "Parent Entity") is a for-profit company limited by shares, incorporated anddomiciled in Australia.
The registered office and principal place of business of the Parent Entity is Level 2, 10 Bridge Road, Stanmore,NSW 2048.
The nature of the operations and principal activities of the Group are described in the directors' report.Information on the Group's structure is provided in Note 12. Information on the Group's related party relationshipsis provided in Note 21.
2. Significant accounting policies
2.1 Basis of preparation
The financial report is a general purpose financial report, which has been prepared in accordance with therequirements of the Corporations Act 2001, Australian Accounting Standards - Reduced DisclosureRequirements and other authoritative pronouncements of the Australian Accounting Standards Board. The Groupis a for-profit, private sector entity which is not publicly accountable. Therefore, the consolidated financialstatements for the Group are general purpose financial statements which have been prepared in accordance withAustralian Accounting Standards - Reduced Disclosure Requirements (AASB - RDRs) and other authoritativepronouncements of the Australian Accounting Standards Board.
The financial report has been prepared on a historical cost basis except for derivative financial instruments andcontingent considerations that have been measured at fair value.
The financial report is presented in Australian dollars ($).
2.2 Changes in accounting policies and disclosures
New and amended standards and interpretations
The Group applied AASB 16 Leases for the first time. The nature and effect of the changes as a result of theadoption of this new accounting standards is described below.
Several other amendments and interpretations of accounting standards apply for the first time in 2020, but do nothave an impact on the consolidated financial statements of the Group.
AASB 16 Leases
AASB 16 replaces AASB 117 Leases, AASB Interpretation 4 Determining whether an Arrangement contains aLease, AASB Interpretation 115 Operating Leases-Incentives and AASB Interpretation 127 Evaluating theSubstance of Transactions Involving the Legal Form of a Lease. The standard sets out the principles for therecognition, measurement, presentation and disclosure of leases and requires lessees to recognise most leaseson the consolidated statement of financial position.
Lessor accounting under AASB 16 is substantially unchanged from AASB 117. Lessors will continue to classifyleases as either operating or finance leases using similar principles as in AASB 117. Therefore, AASB 16 doesnot have an impact for leases where the Group is the lessor.
12

51
Annual Report 2020
50
The ARA Group
Section 5 Audited Financial Statements
ARA Group Limited and Controlled Entities
Notes to the consolidated financial statements (continued)
For the year ended 30 June 2020
2. Significant accounting policies (continued)
2.2 Changes in accounting policies and disclosures (continued)
New and amended standards and interpretations (continued)
AASB 16 Leases (continued)
The Group adopted AASB 16 using the modified retrospective method of adoption, with the date of initialapplication of 1 July 2019. Under this method, the standard is applied retrospectively with the cumulative effecton initially applying the standard recognised at the date of initial application. The Group elected to use thetransition practical expedient to not reassess whether a contract is, or contains, a lease at 1 July 2019. Instead,the Group applied the standard only to contracts that were previously identified as leases applying AASB 117 andAASB Interpretation 4 Determining whether an Arrangement contains a Lease at the date of initial application.
The Group has lease contracts for various items of properties, plant and equipment, motor vehicles. Before theadoption of AASB 16, the Group classified each of its leases (as lessee) at the inception date as either a financelease or an operating lease.
Upon adoption of AASB 16, the Group applied a single recognition and measurement approach for all leasesexcept for short-term leases and leases of low-value assets. Refer to Note 2.4(e) Leases for the accountingpolicy beginning 1 July 2019. The standard provides specific transition requirements and practical expedients,which have been applied by the Group.
Leases previously classified as finance leases
The Group did not change the initial carrying amounts of recognised assets and liabilities at the date of initialapplication for leases previously classified as finance leases (i.e., the right-of-use assets and lease liabilitiesequal the lease assets and liabilities recognised under AASB 117). The requirements of AASB 16 were applied tothese leases from 1 July 2019.
Leases previously accounted for as operating leases
The Group recognised right-of-use assets and lease liabilities for those leases previously classified as operatingleases, except for short-term leases and leases of low-value assets. The right-of-use assets were recognisedbased on the amount equal to the lease liabilities, adjusted for any related prepaid and accrued lease paymentspreviously recognised. Lease liabilities were recognised based on the present value of the remaining leasepayments, discounted using the incremental borrowing rate at the date of initial application.
The Group also applied the available practical expedients wherein it:
• Used a single discount rate to a portfolio of leases with reasonably similar characteristics
• Relied on its assessment of whether leases are onerous immediately before the date of initial application
• Applied the short-term leases exemptions to leases with lease term that ends within 12 months of thedate of initial application
• Excluded the initial direct costs from the measurement of the right-of-use asset at the date of initialapplication
• Used hindsight in determining the lease term where the contract contained options to extend or terminatethe lease
13
ARA Group Limited and Controlled Entities
Notes to the consolidated financial statements (continued)
For the year ended 30 June 2020
2. Significant accounting policies (continued)
2.2 Changes in accounting policies and disclosures (continued)
New and amended standards and interpretations (continued)
The lease liabilities as at 1 July 2019 can be reconciled to the operating lease commitments as of 30 June 2019,as follows:
$
Operating lease commitments as at 30 June 2019 28,263,266
Weighted average incremental borrowing rate as at 1 July 2019 4.0%
Discounted operating lease commitments as at 1 July 2019 25,718,843Less:Commitments relating to short-term leases (986,764)Commitments relating to leases of low-value assets (3,464,324)Add:Commitments relating to leases previously classified as finance leases 265,324Lease payments relating to renewal periods not included in operating lease commitments as at30 June 2019 16,841,284
Lease liabilities as at 1 July 2019 38,374,363
Standards issued but not yet effective
Certain Australian Accounting Standards and Interpretations have recently been issued or amended but are notyet effective and have not been adopted by the Group for the annual reporting period ended 30 June 2020. Thedirectors have not early adopted any of these new or amended standards or interpretations.
2.3 Basis of consolidation
Subsidiaries are all those entities over which the Group has the power to govern the financial and operatingpolicies so as to obtain benefits from their activities. The existence and effect of potential voting rights that arecurrently exercisable or convertible are considered when assessing whether the Group controls another entity.
The financial statements of the subsidiaries are prepared for the same reporting period as ARA Group Limited,using consistent accounting policies. In preparing the consolidated financial statements, all intercompanybalances, transactions, unrealised gains and losses resulting from intra-group transactions and dividends havebeen eliminated in full.
Non-controlling interests are allocated their share of net profit after tax in the consolidated statement of profit orloss and other comprehensive income and are presented within equity in the consolidated statement of financialposition, separately from the equity of the owners of the Parent. Losses are attributed to the non-controllinginterest even if that results in a deficit balance.
A change in the ownership interest of a subsidiary that does not result in a loss of control, is accounted for as anequity transaction.
If the Group loses control over a subsidiary, it:
• Derecognises the assets (including goodwill) and liabilities of the subsidiary;
• Derecognises the carrying amount of any non-controlling interest;• Derecognises the cumulative translation differences, recorded in equity;• Recognises the fair value of the consideration received;• Recognises the fair value of any investment retained;• Recognises any surplus or deficit in profit or loss; and• Reclassifies the Parent Entity's share of components previously recognised in other comprehensive income
("OCI") to profit or loss, or retained earnings, as appropriate.
14

53
Annual Report 2020
52
The ARA Group
Section 5 Audited Financial Statements
ARA Group Limited and Controlled Entities
Notes to the consolidated financial statements (continued)
For the year ended 30 June 2020
2. Significant accounting policies (continued)
2.4 Summary of significant accounting policies
a) Current versus non-current classification
The Group presents assets and liabilities in the consolidated statement of financial position based oncurrent/non-current classification. An asset is current when it is:
• Expected to be realised or intended to be sold or consumed in the normal operating cycle• Held primarily for the purpose of trading• Expected to be realised within twelve months after the reporting period, or• Cash or cash equivalent unless restricted from being exchanged or used to settle a liability for at least
twelve months after the reporting period.
All other assets are classified as non-current.
A liability is current when:
• It is expected to be settled in the normal operating cycle• It is held primarily for the purpose of trading• It is due to be settled within twelve months after the reporting period, or• There is no unconditional right to defer the settlement of the liability for at least twelve months after the
reporting period.
The Group classifies all other liabilities as non-current.
Deferred tax assets and liabilities are classified as non-current assets and liabilities.
b) Income tax
The charge for income tax expense for the year is based on the profit for the year adjusted for anynon-assessable or disallowed items. It is calculated using tax rates that have been enacted or are substantivelyenacted by the reporting date.
Deferred tax is accounted for using the statement of tax balance sheet method in respect of temporarydifferences arising between the tax bases of assets and liabilities and their carrying amounts in the financialstatements. No deferred income tax will be recognised from the initial recognition of an asset or liability, excludinga business combination, where there is no effect on accounting or taxable profit or loss.
Deferred tax is calculated at the tax rates that are expected to apply to the period when the asset is realised orliability is settled. Deferred tax is credited in the consolidated statement of profit or loss and other comprehensiveincome except where it relates to items that may be credited directly to equity, in which case the deferred tax isadjusted directly against equity.
Deferred income tax assets are recognised to the extent that it is probable that future profits will be availableagainst which deductible temporary differences can be utilised.
The amount of benefit brought to account or which may be realised in the future is based on the assumption thatno adverse change will occur in income taxation legislation and the anticipation that the economic entity willderive sufficient future assessable income to enable the benefit to be realised and comply with the conditions ofdeductibility imposed by the law.
15
ARA Group Limited and Controlled Entities
Notes to the consolidated financial statements (continued)
For the year ended 30 June 2020
2. Significant accounting policies (continued)
2.4 Summary of significant accounting policies (continued)
b) Income tax (continued)
ARA Group Limited and its wholly-owned subsidiaries have formed an income tax consolidated group under theTax Consolidation Regime. Each entity in the group recognises its own current and deferred tax liabilities, exceptfor any deferred liabilities resulting from unused tax losses and tax credits, which are immediately assumed bythe Parent Entity. The current tax liability of each group entity is then subsequently assumed by the Parent Entity.The group notified the Australian Taxation Office that it had formed an income tax consolidated group to applyfrom 1 July 2004. The consolidated group has entered into a tax sharing agreement whereby each company inthe group contributes to the income tax payable in proportion to their contribution to profit before tax of the taxconsolidated group.
c) Inventories
Raw material and stores, work in progress and finished goods are measured at the lower of cost and netrealisable value. Costs are assigned on a first-in first-out or weighted average cost basis and include directmaterials, direct labour and an appropriate proportion of variable and fixed overhead expenses. Net realisablevalue is the estimated selling price in the ordinary course of business, less estimated costs of completion andestimated costs necessary to make the sale.
d) Property, plant and equipment
Each class of property, plant and equipment is carried at cost less, where applicable, any accumulateddepreciation and impairment. Such cost includes the cost of replacing part of the plant and equipment andborrowing costs for long-term construction projects if the recognition criteria are met.
Plant and equipment
The carrying amount of property, plant and equipment is reviewed for indicators of impairment annually bydirectors to ensure it is not in excess of the recoverable amount from those assets. The recoverable amount isassessed on the basis of the expected net cash flows that will be received from the assets employment andsubsequent disposal.
Depreciation
The depreciable amount of all fixed assets are depreciated on a straight line basis over their estimated usefullives commencing from the time the asset is held ready for use. Leasehold improvements are depreciated overthe shorter of either the unexpired period of the lease or the estimated useful lives of the improvements.
Class of fixed asset Depreciation rateLeasehold improvements 10% - 20%Plant and equipment 7.5% - 40%Office furniture and equipment 7.5% - 20%Computer equipment and software 33% - 40%Motor vehicles 22.5%
Derecognition and disposal
An item of property, plant and equipment is derecognised upon disposal or when no further future economicbenefits are expected from its use or disposal.
Any gain or loss arising on derecognition of the asset (calculated as the difference between the net disposalproceeds and the carrying amount of the asset) is included in profit or loss in the year the asset is derecognised.
The residual values, useful lives and methods of depreciation of property, plant and equipment are reviewed ateach financial year end and adjusted prospectively, if appropriate.
16
55
Annual Report 2020
54
The ARA Group
Section 5 Audited Financial Statements
ARA Group Limited and Controlled Entities
Notes to the consolidated financial statements (continued)
For the year ended 30 June 2020
2. Significant accounting policies (continued)
2.4 Summary of significant accounting policies (continued)
e) Leases
Group as a lessee
The Group applies a single recognition and measurement approach for all leases, except for short-term leasesand leases of low-value assets. The Group recognises lease liabilities to make lease payments and right-of-useassets representing the right to use the underlying assets.
(i) Right-of-use assets
The Group recognises right-of-use assets at the commencement date of the lease (i.e., the date the underlyingasset is available for use). Right-of-use assets are measured at cost, less any accumulated depreciation andimpairment losses, and adjusted for any remeasurement of lease liabilities. The cost of right-of-use assetsincludes the amount of lease liabilities recognised, initial direct costs incurred, and lease payments made at orbefore the commencement date less any lease incentives received. Right-of-use assets are depreciated on astraight-line basis over the shorter of the lease term and the estimated useful lives of the assets, as follows:
Property leases 10% to 50%Plant and equipment 7.5% to 40%Motor vehicles 10% to 30%Other equipment 7.5% to 40%
If ownership of the leased asset transfers to the Group at the end of the lease term or the cost reflects theexercise of a purchase option, depreciation is calculated using the estimated useful life of the asset.
The right-of-use assets are also subject to impairment. Refer to the accounting policies in Note 2.4(f) Impairmentof non-financial assets.
(ii) Lease liabilities
At the commencement date of the lease, the Group recognises lease liabilities measured at the present value oflease payments to be made over the lease term. The lease payments include fixed payments (includingin-substance fixed payments) less any lease incentives receivable, variable lease payments that depend on anindex or a rate, and amounts expected to be paid under residual value guarantees. The lease payments alsoinclude the exercise price of a purchase option reasonably certain to be exercised by the Group and payments ofpenalties for terminating the lease, if the lease term reflects the Group exercising the option to terminate. Variablelease payments that do not depend on an index or a rate are recognised as expenses (unless they are incurredto produce inventories) in the period in which the event or condition that triggers the payment occurs.
In calculating the present value of lease payments, the Group uses its incremental borrowing rate at the leasecommencement date because the interest rate implicit in the lease is not readily determinable. After thecommencement date, the amount of lease liabilities is increased to reflect the accretion of interest and reducedfor the lease payments made. In addition, the carrying amount of lease liabilities is remeasured if there is amodification, a change in the lease term, a change in the lease payments (e.g., changes to future paymentsresulting from a change in an index or rate used to determine such lease payments) or a change in theassessment of an option to purchase the underlying asset.
(iii) Short-term leases and leases of low-value assets
The Group applies the short-term lease recognition exemption to its short-term leases of machinery andequipment (i.e., those leases that have a lease term of 12 months or less from the commencement date and donot contain a purchase option). It also applies the lease of low-value assets recognition exemption to leases ofoffice equipment that are considered to be low value. Lease payments on short-term leases and leases oflow-value assets are recognised as expense on a straight-line basis over the lease term.
17
ARA Group Limited and Controlled Entities
Notes to the consolidated financial statements (continued)
For the year ended 30 June 2020
2. Significant accounting policies (continued)
2.4 Summary of significant accounting policies (continued)
f) Impairment of non-financial assets
The Group assesses, at each reporting date, whether there is an indication that an asset may be impaired. If anyindication exists, or when annual impairment testing for an asset is required, the Group estimates the asset’srecoverable amount. An asset’s recoverable amount is the higher of an asset’s, or cash-generating unit's(CGU's), fair value less costs of disposal and its value in use. The recoverable amount is determined for anindividual asset, unless the asset does not generate cash inflows that are largely independent of those from otherassets or groups of assets. When the carrying amount of an asset or CGU exceeds its recoverable amount, theasset is considered impaired and is written down to its recoverable amount.
In assessing value in use, the estimated future cash flows are discounted to their present value using a pre-taxdiscount rate that reflects current market assessments of the time value of money and the risks specific to theasset. In determining fair value less costs of disposal, recent market transactions are taken into account. If nosuch transactions can be identified, an appropriate valuation model is used. These calculations are corroboratedby valuation multiples, quoted share prices for publicly traded companies or other available fair value indicators.
The Group bases its impairment calculation on detailed budgets and forecast calculations, which are preparedseparately for each of the Group's CGUs to which the individual assets are allocated.
Impairment losses of continuing operations are recognised in the consolidated statement of profit or loss andother comprehensive income in expense categories consistent with the function of the impaired asset.
For assets excluding goodwill, an assessment is made at each reporting date to determine whether there is anindication that previously recognised impairment losses no longer exist or have decreased. If such indicationexists, the Group estimates the asset’s or CGU's recoverable amount. A previously recognised impairment loss isreversed only if there has been a change in the assumptions used to determine the asset’s recoverable amountsince the last impairment loss was recognised. The reversal is limited so that the carrying amount of the assetdoes not exceed its recoverable amount, nor exceed the carrying amount that would have been determined, netof depreciation, had no impairment loss been recognised for the asset in prior years. Such reversal is recognisedin the statement of profit or loss unless the asset is carried at a revalued amount, in which case, the reversal istreated as a revaluation increase.
Goodwill is tested for impairment annually and when circumstances indicate that the carrying value may beimpaired.
Impairment is determined for goodwill by assessing the recoverable amount of each CGU (or group of CGUs) towhich the goodwill relates. When the recoverable amount of the CGU is less than its carrying amount, animpairment loss is recognised. Impairment losses relating to goodwill cannot be reversed in future periods.
Intangible assets with indefinite useful lives are tested for impairment annually at the CGU level, as appropriate,and when circumstances indicate that the carrying value may be impaired.
g) Foreign currency transactions and balances
Foreign currency transactions during the year are converted to Australian currency at the rates of exchangeapplicable at the dates of the transactions. Amounts receivable and payable in foreign currencies at balance dateare converted at the rates of exchange ruling at that date.
The gains and losses from conversion of short-term assets and liabilities, whether realised or unrealised, areincluded in profit from ordinary activities as they arise.
Both the functional and presentation currency of the Group is Australian dollars ($) except for New Zealandentities where the functional currency is New Zealand dollars.
18

57
Annual Report 2020
56
The ARA Group
Section 5 Audited Financial Statements
ARA Group Limited and Controlled Entities
Notes to the consolidated financial statements (continued)
For the year ended 30 June 2020
2. Significant accounting policies (continued)
2.4 Summary of significant accounting policies (continued)
g) Foreign currency transactions and balances (continued)
On consolidation, the assets and liabilities of foreign operations are translated into Australian dollars at the rate ofexchange prevailing at the reporting date and their statements of profit or loss are translated at exchange ratesprevailing at the dates of the transactions. The exchange differences arising on translation for consolidation arerecognised in OCI. On disposal of a foreign operation, the component of OCI relating to that particular foreignoperation is reclassified to profit or loss.
Any goodwill arising on the acquisition of a foreign operation and any fair value adjustments to the carryingamounts of assets and liabilities arising on the acquisition are treated as assets and liabilities of the foreignoperation and translated at the spot rate of exchange at the reporting date.
h) Borrowing costs
Borrowing costs directly attributable to the acquisition, construction or production of a qualifying asset (i.e. anasset that necessarily takes a substantial period of time to get ready for its intended use or sale) are capitalisedas part of the cost of that asset. All other borrowing costs are expensed in the period they occur. Borrowing costsconsist of interest and other costs that an entity incurs in connection with the borrowing of funds.
i) Employee entitlements
Provision is made for the Group’s liability for employee entitlements arising from services rendered by employeesto balance date. Employee entitlements expected to be settled within one year together with entitlements arisingfrom wages and salaries and annual leave which will be settled after one year, have been measured at theirnominal amount. Other employee entitlements payable later than one year have been measured at an amountthat is considered to approximate the present value of the estimated future cash outflows to be made for thoseentitlements.
Contributions are made by the Group to employee superannuation funds and are charged as expenses whenincurred.
j) Contributed equity
Ordinary shares are classified as equity. Incremental costs directly attributable to the issue of new shares arededucted from equity.
k) Dividend to equity holders of the Parent Entity
The Group recognises a liability to make cash distributions to equity holders of the Parent Entity when thedistribution is authorised and the distribution is no longer at the discretion of the Group. A corresponding amountis recognised directly in equity.
l) Business combinations and goodwill
Business combinations are accounted for using the acquisition method. The cost of an acquisition is measuredas the aggregate of the consideration transferred, which is measured at acquisition date fair value, and theamount of any non-controlling interest in the acquiree. For each business combination, the Group elects whetherto measure the non-controlling interest in the acquiree at fair value or at the proportionate share of the acquiree’sidentifiable net assets. Acquisition-related costs are expensed as incurred, and disclosed separately in theconsolidated statement of profit or loss and other comprehensive income.
The acquisition method of accounting involves recognising at acquisition date, separately from goodwill, theidentifiable assets acquired, the liabilities assumed and any non-controlling interest in the acquiree. Theidentifiable assets acquired and the liabilities assumed are measured at their acquisition date fair values.
When the Group acquires a business, it assesses the financial assets and liabilities assumed for appropriateclassification and designation in accordance with the contractual terms, economic circumstances and pertinentconditions as at the acquisition date.
19
ARA Group Limited and Controlled Entities
Notes to the consolidated financial statements (continued)
For the year ended 30 June 2020
2. Significant accounting policies (continued)
2.4 Summary of significant accounting policies (continued)
l) Business combinations and goodwill (continued)
The difference between the above items and the fair value of the consideration (including the fair value of anypre-existing investment in the acquiree) is goodwill.
Any contingent consideration to be transferred by the acquirer is recognised at fair value at the acquisition date.Subsequent changes to the fair value of the contingent consideration which is deemed to be an asset or liabilityare recognised in accordance with AASB 9 Financial Instruments in the consolidated statement of profit or lossand other comprehensive income. If the contingent consideration is classified as equity, it is not remeasured untilit is finally settled within equity.
Goodwill is initially measured at cost (being the excess of the aggregate of the consideration transferred and theamount recognised for non-controlling interests and any previous interest held over the net identifiable assetsacquired and liabilities assumed). If the fair value of the net assets acquired is in excess of the aggregateconsideration transferred, the Group re-assesses whether it has correctly identified all of the assets acquired andall of the liabilities assumed and reviews the procedures used to measure the amounts to be recognised at theacquisition date. If the re-assessment still results in an excess of the fair value of net assets acquired over theaggregate consideration transferred, then the gain is recognised in profit or loss.
After initial recognition, goodwill is measured at cost less any accumulated impairment losses. For the purpose ofimpairment testing, goodwill acquired in a business combination is, from the acquisition date, allocated to each ofthe Group's cash-generating units that are expected to benefit from the combination, irrespective of whetherother assets or liabilities of the acquiree are assigned to those units.
Where goodwill has been allocated to a cash-generating unit (CGU) and part of the operation within that unit isdisposed of, the goodwill associated with the disposed operation is included in the carrying amount of theoperation when determining the gain or loss on disposal. Goodwill disposed in these circumstances is measuredbased on the relative values of the disposed operation and the portion of the cash-generating unit retained.
m) Discontinued operations
A disposal group qualifies as discontinued operation if it is a component of an entity that either has beendisposed of, or is classified as held for sale, and:
• Represents a separate major line of business or geographical area of operations
• Is part of a single co-ordinated plan to dispose of a separate major line of business or geographical areaof operations, or
• Is a subsidiary acquired exclusively with a view to resale
Additional disclosures are provided in Note 4. The financial statements and all other notes to the financialstatements include amounts for continuing operations, unless indicated otherwise.
n) Intangible assets
Intangible assets acquired separately are measured on initial recognition at cost. The cost of intangible assetsacquired in a business combination is their fair value at the date of acquisition. Following initial recognition,intangible assets are carried at cost less any accumulated amortisation and accumulated impairment losses.
The useful lives of intangible assets are assessed as either finite or indefinite.
20

59
Annual Report 2020
58
The ARA Group
Section 5 Audited Financial Statements
ARA Group Limited and Controlled Entities
Notes to the consolidated financial statements (continued)
For the year ended 30 June 2020
2. Significant accounting policies (continued)
2.4 Summary of significant accounting policies (continued)
n) Intangible assets (continued)
Intangible assets with finite lives are amortised over the useful economic life and assessed for impairmentwhenever there is an indication that the intangible asset may be impaired. The amortisation period and theamortisation method for an intangible asset with a finite useful life are reviewed at least at the end of eachreporting period. Changes in the expected useful life or the expected pattern of consumption of future economicbenefits embodied in the asset are considered to modify the amortisation period or method, as appropriate, andare treated as changes in accounting estimates and adjusted on a prospective basis. The amortisation expenseon intangible assets with finite lives is recognised in the consolidated statement of profit or loss and othercomprehensive income as the expense category that is consistent with the function of the intangible assets.
Intangible assets with indefinite useful lives are not amortised, but are tested for impairment annually, eitherindividually or at the cash-generating unit level. The assessment of indefinite life is reviewed annually todetermine whether the indefinite life continues to be supportable. If not, the change in useful life from indefinite tofinite is made on a prospective basis.
Gains or losses arising from derecognition of an intangible asset are measured as the difference between the netdisposal proceeds and the carrying amount of the asset and are recognised in the consolidated statement ofprofit or loss and other comprehensive income when the asset is derecognised.
A summary of the policies applied to the Group's intangible assets is, as follows:
Goodwill Developmentcosts
Customercontracts
Intellectualproperty
Brand name
Useful lives Indefinite Finite Finite Finite Indefinite
Amortisationmethod used
Noamortisation
Amortised on astraight linebasis over 7years
Amortised on astraight linebasis over 5 - 7years
Amortised on astraight linebasis over 10years
None
Research and development costs
Research costs are expensed as incurred. An intangible asset arising from development expenditure on aninternal project is recognised only when the Group can demonstrate the technical feasibility of completing theintangible asset so that it will be available for use or sale, its intention to complete and its ability to use or sell theasset, how the asset will generate future economic benefits, the availability of resources to complete thedevelopment and the ability to reliably measure the expenditure attributable to the intangible asset during itsdevelopment. Following the initial recognition of the development expenditure, the cost model is applied requiringthe asset to be carried at cost less any accumulated amortisation and accumulated impairment losses. Anyexpenditure so capitalised is amortised over the period of expected benefit from the related project.
The carrying value of an intangible asset arising from development expenditure is tested for impairment annuallywhen the asset is not yet available for use, or more frequently when an indication of impairment arises during thereporting period.
o) Cash and cash equivalents
For the purposes of the consolidated statement of cash flows, cash includes cash on hand and at call depositswith banks or financial institutions, investments in money market instruments maturing within less than threemonths and net of bank overdrafts.
21
ARA Group Limited and Controlled Entities
Notes to the consolidated financial statements (continued)
For the year ended 30 June 2020
2. Significant accounting policies (continued)
2.4 Summary of significant accounting policies (continued)
p) Revenue from contracts with customers
The Group is in the business of providing essential building services (installation and service) such as fireprotection services, electrical, electrical engineering and high voltage services, electronic security services andproducts, air conditioning, building fit out, building repairs, building automation, cleaning services and themanufacturing of specialised building products such as steel doors, ballistic doors and partitions, steel securitydoors and steel fire doors, aluminium security shutters and grilles. Revenue from contracts with customers isrecognised when control of the goods or services are transferred to the customer at an amount that reflects theconsideration to which the Group expects to be entitled in exchange for those goods or services. The Group hasgenerally concluded that it is the principal in its revenue arrangements, because it typically controls the goods orservices before transferring them to the customer.
Sale of goods
Revenue from sale of goods relates primarily to the Group’s Products Division and includes the sale ofcommercial, industrial and high security doors, architectural hardware, security access products including accesscontrol and CCTV. Revenue from the sale of goods is recognised at a point in time when the performanceobligation is satisfied which is generally on the delivery of goods to the customer.
The transaction price is typically fixed for each performance obligation, with no variable revenue associated withthis revenue stream.
Payment terms are typically due within 30 to 60 days from delivery.
Warranty is provided on all of the Group's manufactured products for 12 to 24 months. Warranty for productswhich the Group has a distribution agreement for is typically 12 to 24 months.
Returns and refunds are accepted under our standard terms and conditions.
Rendering of services
Revenue from services is derived from building services (installation and service) including services for fireprotection, electrical engineering and high voltage, electronic security, air conditioning, building repairs andcleaning services. With the exception of cleaning services, service revenue is recognised over time based onpercentage of completion. The percentage of completion of each project is assessed using the proportion ofcosts incurred to date compared to the total forecast cost. Where losses are anticipated, they are provided for infull.
In rendering services, variations to the original contract may occur. Variations may result in an increase,decrease or omission of any part of the scope. Previously, variations were only included in the contract valuewhen it was probable the variation would be approved, and the amount of revenue could be reliably measured.Under AASB 15 Revenue from contracts with customers variations can be included as variable consideration ifthe rights and obligations relating to the variation are enforceable. The variable consideration should beestimated by using either the ‘expected value’ method (the sum of probability-weighted amounts in a range ofpossible consideration amounts) or the ‘most likely amount’ method (the single most likely amount in a range ofpossible consideration amounts). The Group has adopted the ‘most likely amount’ method.
For cleaning services, contracts are usually entered with customers for a fixed period of time and defined scopewith specified costs (i.e. monthly or yearly rates). Revenue is recognised as the service is provided/delivered tothe customer in accordance with the contract terms. In most cases, revenue is recognised on a straight-linebasis. From time to time, customers may request additional services. These services are agreed with thecustomer prior to the commencement of work, including the time period, scope and costs. Revenue is recognisedin proportion to the stage of completion for the additional services agreed.
Services are invoiced according to the terms of the engagement, and are generally due within 30 to 60 days frominvoicing.
22
61
Annual Report 2020
60
The ARA Group
Section 5 Audited Financial Statements
ARA Group Limited and Controlled Entities
Notes to the consolidated financial statements (continued)
For the year ended 30 June 2020
2. Significant accounting policies (continued)
2.4 Summary of significant accounting policies (continued)
p) Revenue from contracts with customers (continued)
Construction revenue
Construction revenue relates to larger sized contracts for commercial, industrial and residential customers.Contract works can be for design, design and construct, installation and retrofit works for fire protection, electricalengineering, high voltage electrical works, electronic security, heat, ventilation and air conditioning “HVAC”,building fit out and building repairs works.
The performance obligation is satisfied over-time and is accounted for in accordance with “Rendering ofServices” above.
Works are invoiced according to the terms of the engagement, and are generally due within 30 to 60 days frominvoicing.
Defect liability periods are typically 12 months from practical completion.
Infrastructure revenue
Infrastructure revenue relates to fire protection, electrical engineering, electronic security, and HVAC projects fora number of contracts.
The performance obligation is satisfied over-time and is accounted for in accordance with “Rendering ofServices” above.
Works are invoiced according to the terms of the engagement, and are generally due within 30 to 60 days frominvoicing.
Defect liability periods are typically 12 months from practical completion.
Contract balances
Contract assets
A contract asset is the right to consideration in exchange for goods or services transferred to the customer. If theGroup performs by transferring goods or services to a customer before the customer pays consideration orbefore payment is due, a contract asset is recognised for the earned consideration that is conditional.
Contract liabilities
A contract liability is the obligation to transfer goods or services to a customer for which the Group has receivedconsideration (or an amount of consideration is due) from the customer. If a customer pays consideration beforethe Group transfers goods or services to the customer, a contract liability is recognised when the payment ismade or the payment is due (whichever is earlier). Contract liabilities are recognised as revenue when the Groupperforms under the contract.
q) Other income
Interest income
Interest income is recognised as interest accrues using the effective interest method. This is a method ofcalculating the amortised cost of a financial asset and allocating the interest income over the relevant periodusing the effective interest rate, which is the rate that exactly discounts estimated future cash receipts throughthe effective life of the financial asset to the net carrying amount of the financial asset.
Dividend income
Dividend income is recognised when the right to receive a dividend has been established.
r) Goods and services tax (GST)
Revenues, expenses and assets are recognised net of the amount of GST, except:
23
ARA Group Limited and Controlled Entities
Notes to the consolidated financial statements (continued)
For the year ended 30 June 2020
2. Significant accounting policies (continued)
2.4 Summary of significant accounting policies (continued)
r) Goods and services tax (GST) (continued)
• Where the amount of GST incurred is not recoverable from the taxation authority, it is recognised as partof the cost of acquisition of an asset or as part of an item of expense; or
• For receivables and payables which are recognised inclusive of GST.
The net amount of GST recoverable from, or payable to, the taxation authority is included as part of receivablesor payables.
Commitments and contingencies are disclosed net of the amount of GST recoverable from, or payable to, thetaxation authority.
Cash flows are included in the consolidated statement of cash flows on a gross basis. The GST component ofcash flows arising from investing and financing activities which is recoverable from, or payable to, the taxationauthority is classified as part of operating cash flows.
s) Financial instruments - initial recognition and subsequent measurement
A financial instrument is any contract that gives rise to a financial asset of one entity and a financial liability orequity instrument of another entity.
(i) Financial assets
Initial recognition and measurement
Financial assets are classified, at initial recognition, as subsequently measured at amortised cost, fair valuethrough OCI, and fair value through profit or loss.
The classification of financial assets at initial recognition depends on the financial asset’s contractual cash flowcharacteristics and the Group’s business model for managing them. The Group initially measures a financialasset at its fair value plus transaction costs.
For a financial asset to be classified and measured at amortised cost or fair value through OCI, it needs to giverise to cash flows that are ‘solely payments of principal and interest (SPPI)’ on the principal amount outstanding.This assessment is referred to as the SPPI test and is performed at an instrument level.
The Group’s business model for managing financial assets refers to how it manages its financial assets togenerate cash flows. The business model determines whether cash flows will result from collecting contractualcash flows, selling the financial assets, or both.
Subsequent measurement
For purposes of subsequent measurement, financial assets are classified in two categories:
• Financial assets at amortised cost (debt instruments)
• Financial assets at fair value through profit or loss
24
63
Annual Report 2020
62
The ARA Group
Section 5 Audited Financial Statements
ARA Group Limited and Controlled Entities
Notes to the consolidated financial statements (continued)
For the year ended 30 June 2020
2. Significant accounting policies (continued)
2.4 Summary of significant accounting policies (continued)
s) Financial instruments - initial recognition and subsequent measurement (continued)
(i) Financial assets (continued)
Subsequent measurement (continued)
Financial assets at amortised cost (debt instruments)
This category is the most relevant to the Group. The Group measures financial assets at amortised cost if both ofthe following conditions are met:
• The financial asset is held within a business model with the objective to hold financial assets in order tocollect contractual cash flows, and
• The contractual terms of the financial asset give rise on specified dates to cash flows that are paymentsof principal and interest on the principal amount outstanding.
Financial assets at amortised cost are subsequently measured using the effective interest rate (EIR) method andare subject to impairment. Gains and losses are recognised in profit or loss when the asset is derecognised,modified or impaired.
The Group’s financial assets at amortised cost includes trade receivables and other receivables.
Financial assets at fair value through profit or loss
This category includes derivative instruments which the Group had not irrevocably elected to classify at fair valuethrough OCI as described in Note 2.4(t).
Derecognition
A financial asset is primarily derecognised when:
• The rights to receive cash flows from the asset have expired, or
• The Group has transferred its rights to receive cash flows from the asset or has assumed an obligation topay the received cash flows in full without material delay to a third party under a ‘pass-through’arrangement; and either (a) the Group has transferred substantially all the risks and rewards of the asset,or (b) the Group has neither transferred nor retained substantially all the risks and rewards of the asset,but has transferred control of the asset.
Impairment of financial assets
The Group recognises an allowance for expected credit losses (ECLs) for all debt instruments not held at fairvalue through profit or loss. ECLs are based on the difference between the contractual cash flows due inaccordance with the contract and all the cash flows that the Group expects to receive, discounted at anapproximation of the original effective interest rate. The expected cash flows will include cash flows from the saleof collateral held or other credit enhancements that are integral to the contractual terms.
ECLs are recognised in two stages. For credit exposures for which there has not been a significant increase incredit risk since initial recognition, ECLs are provided for credit losses that result from default events that arepossible within the next 12-months (a 12-month ECL). For those credit exposures for which there has been asignificant increase in credit risk since initial recognition, a loss allowance is required for credit losses expectedover the remaining life of the exposure, irrespective of the timing of the default (a lifetime ECL).
For trade receivables and contract assets, the Group applies a simplified approach in calculating ECLs.Therefore, the Group does not track changes in credit risk, but instead recognises a loss allowance based onlifetime ECLs at each reporting date. The Group has established a provision matrix that is based on its historicalcredit loss experience, adjusted for forward-looking factors specific to the debtors and the economic environment.
25
ARA Group Limited and Controlled Entities
Notes to the consolidated financial statements (continued)
For the year ended 30 June 2020
2. Significant accounting policies (continued)
2.4 Summary of significant accounting policies (continued)
s) Financial instruments - initial recognition and subsequent measurement (continued)
(i) Financial assets (continued)
The Group considers a financial asset in default when contractual payments are 90 days past due. However, incertain cases, the Group may also consider a financial asset to be in default when internal or external informationindicates that the Group is unlikely to receive the outstanding contractual amounts in full before taking intoaccount any credit enhancements held by the Group. A financial asset is written off when there is no reasonableexpectation of recovering the contractual cash flows.
(ii) Financial liabilities
Initial recognition and measurement
Financial liabilities are classified, at initial recognition, as loans and borrowings, payables, or as derivativesdesignated as hedging instruments in an effective hedge, as appropriate.
All financial liabilities are recognised initially at fair value and, in the case of loans and borrowings and payables,net of directly attributable transaction costs.
The Group’s financial liabilities include trade and other payables, loans and borrowings including bank overdrafts,and derivative financial instruments.
Subsequent measurement
The measurement of financial liabilities depends on their classification, as described below:
Loans and borrowings
After initial recognition, interest-bearing loans and borrowings are subsequently measured at amortised costusing the EIR method. Gains and losses are recognised in profit or loss when the liabilities are derecognised aswell as through the EIR amortisation process.
Amortised cost is calculated by taking into account any discount or premium on acquisition and fees or costs thatare an integral part of the EIR. The EIR amortisation is included as finance costs in the consolidated statement ofprofit or loss and other comprehensive income.
This category generally applies to interest-bearing loans and borrowings.
Trade and other payables
Trade and other payables are carried at amortised cost and due to their short-term nature they are notdiscounted. They represent liabilities for goods and services provided to the Group prior to the end of thefinancial year that are unpaid and arise when the Group becomes obliged to make future payments in respect ofthe purchase of these goods and services. The amounts are unsecured and are usually paid within 30-60 days ofrecognition.
Derecognition
A financial liability is derecognised when the obligation under the liability is discharged or cancelled or expires.When an existing financial liability is replaced by another from the same lender on substantially different terms, orthe terms of an existing liability are substantially modified, such an exchange or modification is treated as thederecognition of the original liability and the recognition of a new liability. The difference in the respective carryingamounts is recognised in the consolidated statement of profit or loss and other comprehensive income.
26

65
Annual Report 2020
64
The ARA Group
Section 5 Audited Financial Statements
ARA Group Limited and Controlled Entities
Notes to the consolidated financial statements (continued)
For the year ended 30 June 2020
2. Significant accounting policies (continued)
2.4 Summary of significant accounting policies (continued)
t) Derivative financial instruments and hedge accounting
Initial recognition and subsequent measurement
The Group uses derivative financial instruments, such as interest rate swaps to hedge its interest rate risks. Suchderivative financial instruments are initially recognised at fair value on the date on which a derivative contract isentered into and are subsequently remeasured at fair value. Derivatives are carried as financial assets when thefair value is positive and as financial liabilities when the fair value is negative.
Any gains or losses arising from changes in the fair value of derivatives are taken directly to profit or loss, exceptfor the effective portion of cash flow hedges, which is recognised in OCI and later reclassified to profit or losswhen the hedge item affects profit or loss.
For the purpose of hedge accounting, hedges are classified as cash flow hedges when hedging the exposure tovariability in cash flows that is either attributable to a particular risk associated with a recognised asset or liabilityor a high probable forecast transaction. The Group currently has cash flow hedges attributable to future interestpayments.
At the inception of a hedge relationship, the Group formally designates and documents the hedge relationship towhich it wishes to apply hedge accounting and the risk management objective and strategy for undertaking thehedge.
The documentation includes identification of the hedging instrument, the hedged item, the nature of the risk beinghedged and how the Group will assess whether the hedging relationship meets the hedge effectivenessrequirements (including the analysis of sources of hedge ineffectiveness and how the hedge ratio is determined).A hedging relationship qualifies for hedge accounting if it meets all of the following effectiveness requirements:
• There is ‘an economic relationship’ between the hedged item and the hedging instrument.
• The effect of credit risk does not ‘dominate the value changes’ that result from that economic relationship.
• The hedge ratio of the hedging relationship is the same as that resulting from the quantity of the hedgeditem that the Group actually hedges and the quantity of the hedging instrument that the Group actuallyuses to hedge that quantity of hedged item.
Hedges that meet all the qualifying criteria for hedge accounting are accounted for, as described below:
Cash flow hedges
The effective portion of the gain or loss on the hedging instrument is recognised directly in OCI in the cash flowhedge reserve, while any ineffective portion is recognised immediately in the consolidated statement of profit orloss and other comprehensive income.
Amounts recognised as OCI are transferred to profit or loss when the hedged transaction affects profit or loss,such as when the hedged financial income or financial expense is recognised. When the hedged item is the costof a non-financial asset or non-financial liability, the amounts recognised as OCI are transferred to the initialcarrying amount of the non-financial asset or liability.
If the hedging instrument expires or is sold, terminated or exercised without replacement or rollover (as part ofthe hedging strategy), or if its designation as a hedge is revoked, or when the hedge no longer meets the criteriafor hedge accounting, any cumulative gain or loss previously recognised in OCI remains separately in equity untilthe forecast transaction occurs or the foreign currency firm commitment is met.
u) Fair value measurement
The Group measures financial instruments such as derivatives at fair value at each balance sheet date.
27
ARA Group Limited and Controlled Entities
Notes to the consolidated financial statements (continued)
For the year ended 30 June 2020
2. Significant accounting policies (continued)
2.4 Summary of significant accounting policies (continued)
u) Fair value measurement (continued)
Fair value is the price that would be received to sell an asset or paid to transfer a liability in an orderly transactionbetween market participants at the measurement date. The fair value measurement is based on the presumptionthat the transaction to sell the asset or transfer the liability takes place either:
• In the principal market for the asset or liability, or
• In the absence of a principal market, in the most advantageous market for the asset or liability
The principal or the most advantageous market must be accessible by the Group.
The fair value of an asset or a liability is measured using the assumptions that market participants would usewhen pricing the asset or liability, assuming that market participants act in their economic best interest.
The Group uses valuation techniques that are appropriate in the circumstances and for which sufficient data areavailable to measure fair value, maximising the use of relevant observable inputs and minimising the use ofunobservable inputs.
All assets and liabilities for which fair value is measured or disclosed in the financial statements are categorisedwithin the fair value hierarchy, described as follows, based on the lowest level input that is significant to the fairvalue measurement as a whole:
• Level 1 - Quoted (unadjusted) market prices in active markets for identical assets or liabilities
• Level 2 - Valuation techniques for which the lowest level input that is significant to the fair valuemeasurement is directly or indirectly observable
• Level 3 - Valuation techniques for which the lowest level input that is significant to the fair valuemeasurement is unobservable
For the purpose of fair value disclosures, the Group has determined classes of assets and liabilities on the basisof the nature, characteristics and risks of the asset or liability and the level of the fair value hierarchy, asexplained above.
v) Critical accounting estimates and judgements
The Directors evaluate estimates and judgements incorporated into the financial report based on historicalknowledge and best available current information. Estimates assume a reasonable expectation of future eventsand are based on current trends and economic data, obtained both externally and within the group.
JudgementThe Group considers that the entity in which it owns less than 50% of the voting rights meets the requirementsunder the accounting standards to be consolidated as part of the Group. Although ARA Group Limited hold 49%of the share capital of the entity with the remaining 51% being held by one other party, ARA Group Limited hasthe casting vote in Board decisions in the event of a deadlock.
Key estimates - Impairment of goodwill and other intangible assets with indefinite useful lifeThe Group assesses impairment at each reporting date by evaluating conditions specific to the Group that maylead to an impairment of assets. Where an impairment exists, the recoverable amount of the asset is determined.Value-in-use calculations performed in assessing recoverable amounts incorporate a number of key estimates.The current pandemic has increased the level of uncertainty over future economic conditions which impactsthese estimates. However to date there has been limited impact on the group as a whole due to the diversity ofits operations.
28

67
Annual Report 2020
66
The ARA Group
Section 5 Audited Financial Statements
ARA Group Limited and Controlled Entities
Notes to the consolidated financial statements (continued)
For the year ended 30 June 2020
2. Significant accounting policies (continued)
2.4 Summary of significant accounting policies (continued)
v) Critical accounting estimates and judgements (continued)
Key estimates - Impairment of goodwill and other intangible assets with indefinite useful life (continued)The Group determines whether goodwill is impaired at least on an annual basis. This requires an estimation ofthe recoverable amount of the CGUs, using a value in use discounted cash flow methodology, to which thegoodwill and intangibles with indefinite useful lives are allocated. No impairment loss was recognised in thecurrent year or the prior year in respect of goodwill.
Key estimates - Costs to complete on construction contractsThe stage of completion of each project is assessed using the proportion of costs incurred to date compared tothe total estimated cost. Construction profits are recognised on this percentage of completion. Where losses areanticipated they are provided for in full.
Determining the lease term of contracts with renewal options – Group as lessee
The Group determines the lease term as the non-cancellable term of the lease, together with any periodscovered by an option to extend the lease if it is reasonably certain to be exercised if it is reasonably certain not tobe exercised.
The Group has several lease contracts that include extension options. The Group applies judgement inevaluating whether it is reasonably certain whether or not to exercise the option to renew the lease. That is, itconsiders all relevant factors that create an economic incentive for it to exercise the renewal. After thecommencement date, the Group reassesses the lease term if there is a significant event or change incircumstances that is within its control and affects its ability to exercise or not to exercise the option to renew(e.g., construction of significant leasehold improvements or significant customisation to the leased asset).
Leases - Estimating the incremental borrowing rate
The Group cannot readily determine the interest rate implicit in the lease, therefore, it uses its incrementalborrowing rate (IBR) to measure lease liabilities. The IBR is the rate of interest that the Group would have to payto borrow over a similar term, and with a similar security, the funds necessary to obtain an asset of a similar valueto the right-of-use asset in a similar economic environment. The IBR therefore reflects what the Group ‘wouldhave to pay’, which requires estimation when no observable rates are available (such as for subsidiaries that donot enter into financing transactions) or when they need to be adjusted to reflect the terms and conditions of thelease (for example, when leases are not in the subsidiary’s functional currency). The Group estimates the IBRusing observable inputs (such as market interest rates) when available and is required to make certainentity-specific estimates (such as the subsidiary’s stand-alone credit rating).
w) Comparatives
Where necessary, comparative figures have been reclassified to conform with changes in presentation in thecurrent year.
29
ARA Group Limited and Controlled Entities
Notes to the consolidated financial statements (continued)
For the year ended 30 June 2020
3. Business combinations
Acquisitions in 2020
Effective 1 July 2019, the Group acquired the shares of Leda Trading Pty Limited for cash consideration of$6,213,463 and the issuance of shares to the value of $1,700,000. Leda Trading Pty Limited owned other entitiesand these together are considered Leda Group (“Leda”). Leda is a leader in perimeter security and hostile vehiclemitigation in Australia.
A number of other acquisitions were completed during the year including an electronic security business and amanufacturer specialising in commercial joinery and end of trip facilities. Total cash consideration for these twoentities and a number of smaller acquisitions was $4,960,822 and shares to the value of $1,102,500 were issued.
The assets acquired were measured at fair value.
No contingent liabilities were identified at the acquisition date for any business combinations acquired.
All acquisitions except for Leda have been provisionally accounted for at 30 June 2020.
Assets acquired and liabilities assumed
The below table discloses the fair values of the identifiable assets and liabilities of acquisitions in 2020 as at thedate of acquisition:
Fair value recognised on acquisition
Leda Others Total$ $ $
AssetsCash 35,918 - 35,918Receivables 2,600,578 3,217,085 5,817,663Inventories 2,343,687 849,567 3,193,254Other assets 491,393 261,462 752,855Property, plant and equipment (Note 13) 595,687 1,081,049 1,676,736Deferred tax asset (Note 7) 150,508 752,514 903,022
6,217,771 6,161,677 12,379,448
LiabilitiesPayables and other liabilities 2,612,188 4,691,625 7,303,813Employee provisions 501,694 1,312,978 1,814,672Total identifiable net (liabilities)/ assets at fair value 3,103,889 157,074 3,260,963
Goodwill (Note 15) 4,809,574 7,906,248 12,715,822
Purchase consideration transferred 7,913,463 8,063,322 15,976,785
30

69
Annual Report 2020
68
The ARA Group
Section 5 Audited Financial Statements
ARA Group Limited and Controlled Entities
Notes to the consolidated financial statements (continued)
For the year ended 30 June 2020
3. Business combinations (continued)
Acquisitions in 2020 (continued)
Leda Others Total$ $ $
Purchase considerationShares issued, at fair value 1,700,000 1,102,500 2,802,500Cash 6,213,463 4,960,822 11,174,285Deferred consideration (cash) - 2,000,000 2,000,000
Total consideration 7,913,463 8,063,322 15,976,785
Net cash outflow on acquisitionCash consideration 6,213,463 4,960,822 11,174,285Deferred consideration paid for an acquisition made in prior year - 2,280,187 2,280,187Costs on acquisition 53,483 207,005 260,488
Total consideration 6,266,946 7,448,014 13,714,960
Acquisitions in 2019
Effective 1 February 2019, the Group acquired the business and assets of Metalbilt Doors and Danks RollerShutters for cash consideration of AUD10,022,910 (NZD10,500,000). Metalbilt Doors and Danks Roller Shuttersare New Zealand based businesses specialising in industrial and commercial door design and manufacture.
Other acquisitions include Australasian Vaulting Industries Pty Ltd for cash consideration of $1,800,000 andThermoscan Inspection Services Pty Ltd for cash consideration of $5,796,888. 100% of the share capital of bothbusinesses was acquired.
There were a further three small acquisitions during the year with the total purchase price of $2,391,825.
The assets acquired were measured at fair value.
No contingent liabilities were identified at the acquisition date for any business combinations acquired.
The acquisitions were provisionally accounted for at 30 June 2019. During the year ended 30 June 2020, thefinalisation of the acquisition accounting resulted in an increase in goodwill by $281,007.
31
ARA Group Limited and Controlled Entities
Notes to the consolidated financial statements (continued)
For the year ended 30 June 2020
3. Business combinations (continued)
Assets acquired and liabilities assumed
The below table discloses the fair values of the identifiable assets and liabilities of acquisitions in 2019 as at thedate of acquisition:
Fair value recognised on acquisition
Final Provisional$ $
AssetsReceivables 2,218,281 2,321,777Inventories 2,308,598 2,308,598Other assets 17,288 17,288Property, plant and equipment 3,089,823 3,089,823Deferred tax asset 208,793 255,247
7,842,783 7,992,733
LiabilitiesPayables and other liabilities 4,408,489 4,277,432Deferred tax liability 543,175 543,175Total identifiable net assets at fair value 2,891,119 3,172,126
Goodwill 17,120,504 16,839,497
Purchase consideration transferred 20,011,623 20,011,623
Purchase considerationShares issued, at fair value 225,000 225,000Cash 19,786,623 19,786,623
Total consideration 20,011,623 20,011,623
Net cash outflow on acquisitionCash consideration 19,786,623 19,786,623Deferred consideration paid for an acquisition made in prior year 928,044 928,044Costs on acquisition 196,473 196,743
20,911,140 20,911,410
4. Discontinued operations
On 2 March 2020, the Group disposed of its Cash in Transit business unit. Financial information relating to thediscontinued operation for the period to the date of disposal is set out below:
2020$
Loss before tax from a discontinued operations (1,291,615)Income tax benefit 387,485
Loss for the year from discontinued operations (904,130)
The only asset or liability of the Cash in Transit business was property, plant and equipment of $857,779. The netcash outflow of the business unit in 2020 approximated the loss during the year.
32

71
Annual Report 2020
70
The ARA Group
Section 5 Audited Financial Statements
ARA Group Limited and Controlled Entities
Notes to the consolidated financial statements (continued)
For the year ended 30 June 2020
5. Revenue from contracts with customers
5.1 Disaggregated revenue information
Set out below is the disaggregation of the Group’s revenue from contracts with customers:
2020 2019$ $
Type of goods or serviceSale of goods 92,389,070 66,666,628Rendering of services 357,394,141 347,896,643Construction revenue 91,550,054 76,353,489Infrastructure revenue 79,964,823 64,381,455
Total revenue from contracts with customers 621,298,088 555,298,215
Geographical marketsAustralia 594,059,859 540,685,357New Zealand 27,238,229 14,612,858
Total revenue from contracts with customers 621,298,088 555,298,215
Timing of revenue recognitionGoods transferred at a point in time 92,389,070 66,666,628Services transferred over time 528,909,018 488,631,587
Total revenue from contracts with customers 621,298,088 555,298,215
5.2 Performance obligations
Information about the Group’s performance obligations are summarised below:
Sale of goods
Revenue from the sale of goods is recognised at a point in time when the performance obligation is satisfiedwhich is generally on the delivery of the goods to the customer.
Rendering of services, construction revenue and infrastructure revenue
The performance obligation for rendering of services, construction revenue and infrastructure revenue is satisfiedover time as the services are provided.
6. Other income and expenses
6.1 Other income
2020 2019$ $
Profit on disposal of property, plant and equipment 107,870 6,093Other income 84,095 112,217
191,965 118,310
33
ARA Group Limited and Controlled Entities
Notes to the consolidated financial statements (continued)
For the year ended 30 June 2020
6. Other income and expenses (continued)
6.2 Finance income
2020 2019$ $
Interest income 28,986 88,731
6.3 Finance costs
2020 2019$ $
Borrowing costs:External interest paid 3,509,396 3,156,871
6.4 Depreciation of property, plant and equipment
2020 2019$ $
Depreciation of non-current assetsLeasehold improvements (Note 13) 753,332 732,479Plant and machinery (Note 13) 1,574,411 1,400,653Office furniture and equipment (Note 13) 237,916 194,632Computer equipment and software (Note 13) 867,751 662,645Motor vehicles (Note 13) 579,628 441,226
Total depreciation 4,013,038 3,431,635
6.5 Depreciation of right-of-use assets
The right-of-use assets has been recognised as a result of the adoption of AASB 16 Leases in the current year.
2020 2019$ $
Right-of-use assets (Note 14) 10,434,311 -
6.6 Amortisation expense
2020 2019$ $
AmortisationAmortisation of borrowing costs 283,639 297,043Amortisation of customer contracts (Note 15) 1,437,550 1,361,160Amortisation of intellectual property (Note 15) 71,020 66,482
Total amortisation 1,792,209 1,724,685
34
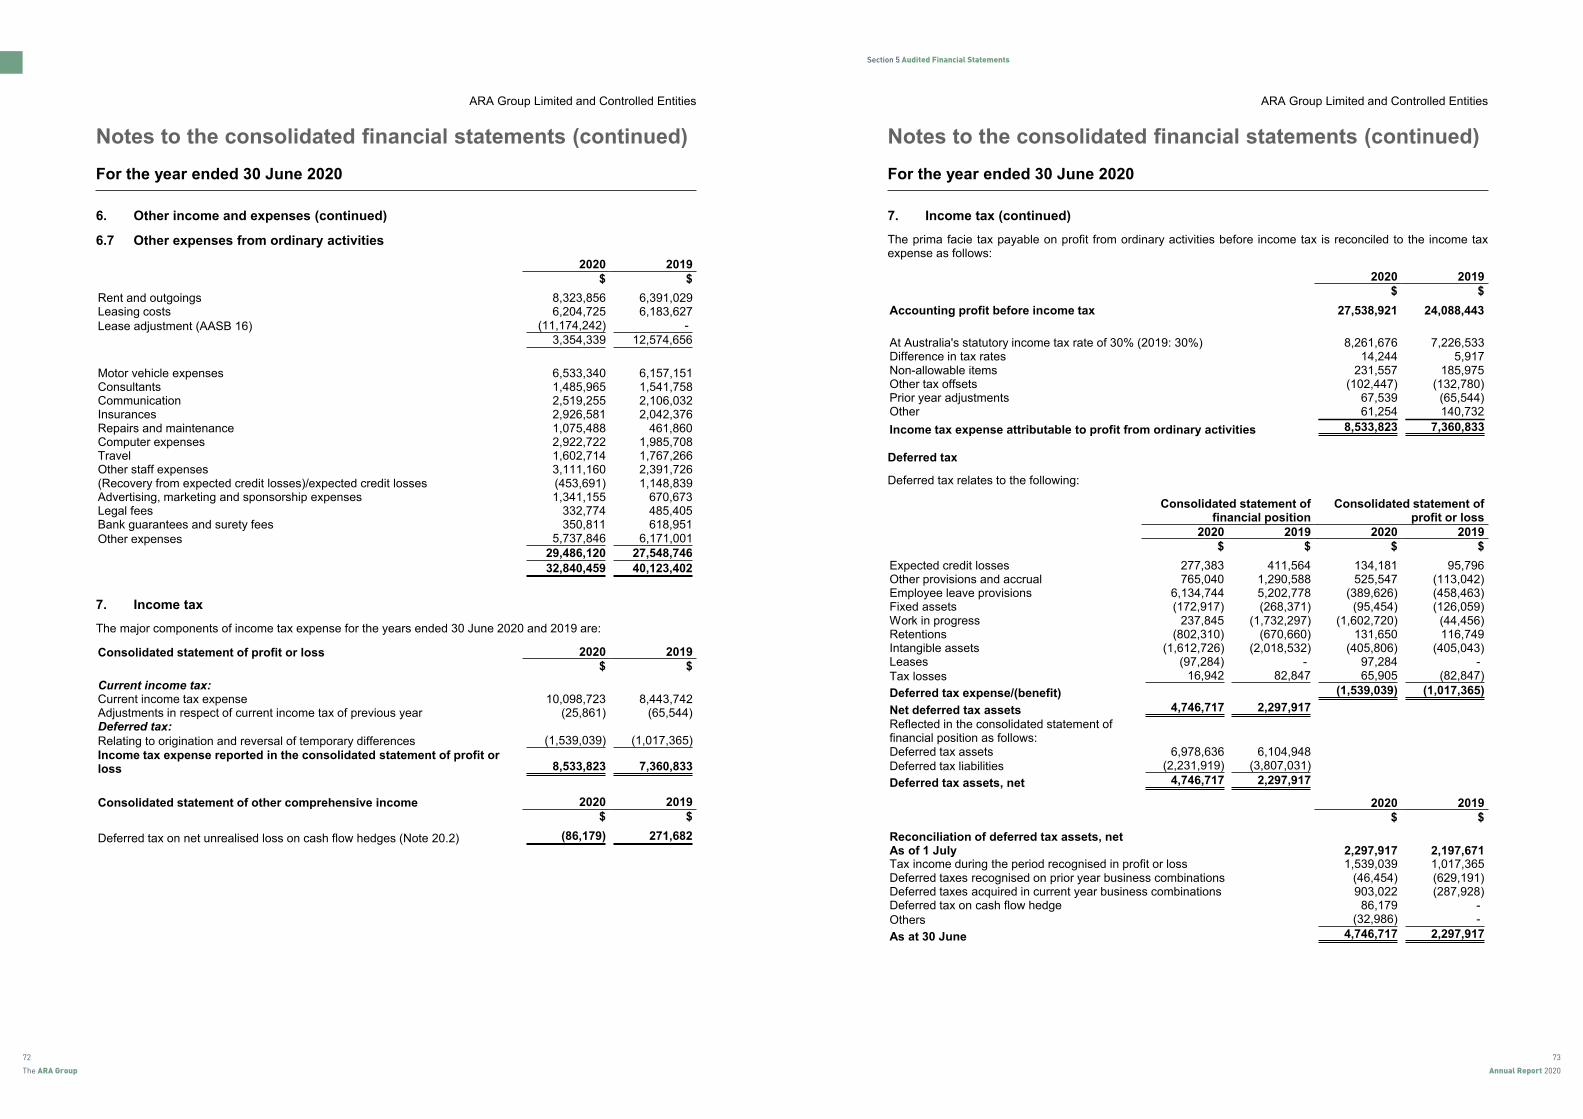
73
Annual Report 2020
72
The ARA Group
Section 5 Audited Financial Statements
ARA Group Limited and Controlled Entities
Notes to the consolidated financial statements (continued)
For the year ended 30 June 2020
6. Other income and expenses (continued)
6.7 Other expenses from ordinary activities
2020 2019$ $
Rent and outgoings 8,323,856 6,391,029Leasing costs 6,204,725 6,183,627Lease adjustment (AASB 16) (11,174,242) -
3,354,339 12,574,656
Motor vehicle expenses 6,533,340 6,157,151Consultants 1,485,965 1,541,758Communication 2,519,255 2,106,032Insurances 2,926,581 2,042,376Repairs and maintenance 1,075,488 461,860Computer expenses 2,922,722 1,985,708Travel 1,602,714 1,767,266Other staff expenses 3,111,160 2,391,726(Recovery from expected credit losses)/expected credit losses (453,691) 1,148,839Advertising, marketing and sponsorship expenses 1,341,155 670,673Legal fees 332,774 485,405Bank guarantees and surety fees 350,811 618,951Other expenses 5,737,846 6,171,001
29,486,120 27,548,746
32,840,459 40,123,402
7. Income tax
The major components of income tax expense for the years ended 30 June 2020 and 2019 are:
Consolidated statement of profit or loss 2020 2019$ $
Current income tax:Current income tax expense 10,098,723 8,443,742Adjustments in respect of current income tax of previous year (25,861) (65,544)Deferred tax:Relating to origination and reversal of temporary differences (1,539,039) (1,017,365)Income tax expense reported in the consolidated statement of profit orloss 8,533,823 7,360,833
Consolidated statement of other comprehensive income 2020 2019$ $
Deferred tax on net unrealised loss on cash flow hedges (Note 20.2) (86,179) 271,682
35
ARA Group Limited and Controlled Entities
Notes to the consolidated financial statements (continued)
For the year ended 30 June 2020
7. Income tax (continued)
The prima facie tax payable on profit from ordinary activities before income tax is reconciled to the income taxexpense as follows:
2020 2019$ $
Accounting profit before income tax 27,538,921 24,088,443
At Australia's statutory income tax rate of 30% (2019: 30%) 8,261,676 7,226,533Difference in tax rates 14,244 5,917Non-allowable items 231,557 185,975Other tax offsets (102,447) (132,780)Prior year adjustments 67,539 (65,544)Other 61,254 140,732
Income tax expense attributable to profit from ordinary activities 8,533,823 7,360,833
Deferred tax
Deferred tax relates to the following:
Consolidated statement offinancial position
Consolidated statement ofprofit or loss
2020 2019 2020 2019$ $ $ $
Expected credit losses 277,383 411,564 134,181 95,796Other provisions and accrual 765,040 1,290,588 525,547 (113,042)Employee leave provisions 6,134,744 5,202,778 (389,626) (458,463)Fixed assets (172,917) (268,371) (95,454) (126,059)Work in progress 237,845 (1,732,297) (1,602,720) (44,456)Retentions (802,310) (670,660) 131,650 116,749Intangible assets (1,612,726) (2,018,532) (405,806) (405,043)Leases (97,284) - 97,284 -Tax losses 16,942 82,847 65,905 (82,847)
Deferred tax expense/(benefit) 4,746,717 2,297,917 (1,539,039) (1,017,365)
Net deferred tax assets 4,746,717 2,297,917 (1,539,039) (1,017,365)Reflected in the consolidated statement offinancial position as follows:Deferred tax assets 6,978,636 6,104,948 - -Deferred tax liabilities (2,231,919) (3,807,031) - -
Deferred tax assets, net 4,746,717 2,297,917 - -
2020 2019$ $
Reconciliation of deferred tax assets, netAs of 1 July 2,297,917 2,197,671Tax income during the period recognised in profit or loss 1,539,039 1,017,365Deferred taxes recognised on prior year business combinations (46,454) (629,191)Deferred taxes acquired in current year business combinations 903,022 (287,928)Deferred tax on cash flow hedge 86,179 -Others (32,986) -
As at 30 June 4,746,717 2,297,917
36

75
Annual Report 2020
74
The ARA Group
Section 5 Audited Financial Statements
ARA Group Limited and Controlled Entities
Notes to the consolidated financial statements (continued)
For the year ended 30 June 2020
7. Income tax (continued)
Deferred tax (continued)
The Group offsets tax assets and liabilities if and only if it has a legally enforceable right to set off current taxassets and current tax liabilities and the deferred tax assets and deferred tax liabilities relate to income taxeslevied by the same tax authority.
8. Dividends
2020 2019
Dividends declared (all franked to 30%)Cents per
share $Cents per
share $Quarter 1— Fully paid, Ordinary class (40,825,796 shares) (2019:38,790,023 shares shares) 8.00 3,266,064 8.00 3,103,202Quarter 2— Fully paid, Ordinary class (40,852,513 shares) (2019:38,790,023 shares) 10.00 4,085,251 6.80 2,637,722Quarter 3— Fully paid, Ordinary class (41,102,513 shares) (2019:39,805,004 shares) - - 7.50 2,985,375Quarter 4— Declared and not paid, Ordinary Class (41,028,263shares) (2019: 39,858,379 shares) 15.00 6,154,238 7.70 3,069,095
Total 33.00 13,505,553 30.00 11,795,394
Dividends payable brought forward 3,069,095 3,327,270
Dividends declared during the year 13,505,553 11,795,394
Dividends paid during the year (10,420,410) (12,053,569)
Dividends payable carried forward (Note 16) 6,154,238 3,069,095
Dividends fully paid by ARA Indigenous 459,189 553,106Dividends fully paid by ARA Indigenous outside theGroup 234,187 243,286
2020 2019$ $
Franking credit balanceThe amount of franking credits available for the subsequent financial year are:
Franking account balance as at the start of the financial year at 30% (2019:30%) 22,205,046 20,258,739Franking credits that will arise from the payment of income taxes payable asat the end of the financial year 12,671,923 7,019,702Franking debits that will arise from the payment of dividends as at the end ofthe financial year (4,566,256) (5,073,395)
30,310,713 22,205,046
37
ARA Group Limited and Controlled Entities
Notes to the consolidated financial statements (continued)
For the year ended 30 June 2020
9. Cash and cash equivalents
2020 2019$ $
Cash at bank and on hand 27,921,078 19,525,264
2020 2019$ $
a) Cash flow reconciliationReconciliation of net profit after tax to net cash flows from operations:Profit for the year 19,005,098 16,727,610
Adjustments for:Acquisition costs 260,488 196,473Depreciation and amortisation 5,805,247 5,156,320Depreciation of right-of-use assets 10,434,311 -Decrease in provision for expected credit losses (453,691) (208,251)Profit (net) on sale of assets (107,870) (6,093)
Changes in assets and liabilities:(Increase)/decrease in trade and other receivables and other financial assets (9,072,632) (531,555)(Increase)/decrease in inventories 767,833 1,453,699(Increase)/decrease in prepayments (9,816) (377,760)(Increase)/decrease in deferred tax assets - net (1,592,232) (388,174)(Increase)/decrease in contract assets 6,231,447 (145,061)Increase/(decrease) in trade and other payables (8,526,043) 6,004,149Increase/(decrease) in income tax payable 1,227,563 (177,948)Increase/(decrease) in employee benefits 1,396,184 1,693,953Increase/(decrease) in contract liabilities 3,095,127 (1,067,978)Increase/(decrease) in other reserves - 271,682
Net cash flows from operating activities 28,461,014 28,601,066
b) Credit stand-by arrangement and loan facilities
The Group has a syndicated bank facility with Westpac Banking Corporation, Bank of Queensland andCommonwealth Bank of Australia. The total facility available to the Group is $140,000,000 (2019: $110,100,000).Of these facilities, $87,045,291 was utilised at 30 June 2020 (2019: $69,462,877). All bank covenants weresatisfied during the year.
In addition the Group has a separate credit card facility with Westpac Banking Corporation of $2,800,000 (2019:$2,800,000). $1,505,523 was utilised at 30 June 2020 (2019: $2,705,000).
Included in the Group's total facility of $140,000,000 is a $30,000,000 term loan. The Group is required to repayprincipal of $4,000,000 (2019: $4,000,000) each financial year under its bank facility agreement if the term loan isfully drawn. At 30 June 2020, the headroom on the term loan facility was $8,625,000 (2019: $12,375,000). TheGroup does not expect to pay any principal during financial year 2021. At 30 June 2020, the term loan hadamortised by $3,750,000, reducing the total facility available to the Group to $136,250,000.
As at 30 June 2020 the Group had cash on deposit owing to third parties of $217,471 (2019: $2,608,361).
38

77
Annual Report 2020
76
The ARA Group
Section 5 Audited Financial Statements
ARA Group Limited and Controlled Entities
Notes to the consolidated financial statements (continued)
For the year ended 30 June 2020
10. Trade and other receivables and contract assets
2020 2019$ $
CurrentTrade receivables 90,780,855 80,479,414Provision for expected credit losses (1,014,558) (1,439,612)
89,766,297 79,039,802
Retentions 2,940,731 2,562,423Other debtors 5,711,673 2,739,569
98,418,701 84,341,794
Contract assets
As at 30 June 2020, the Group has contract assets of $nil (2019: $6,231,447) which is net of an allowance forexpected credit losses of $nil (2019: $nil).
11. Inventories
2020 2019$ $
Raw materials and stores 5,311,491 2,715,383Work in progress 2,331,610 2,314,206Finished goods 8,799,852 8,704,266Provision for obsolescence (309,648) (25,971)
16,133,305 13,707,884
12. Controlled entities
Subsidiaries
% Equity interestName Principal Activities 2020 2019
Allen & Newton Pty Ltd Building 100 100Allen & Newton Queensland Pty Limited Building 100 100ARA Building Services Pty Limited Building 100 100ARA Building Services (Qld) Pty Limited Building 100 100ARA Corporate Services Pty Limited Corporate 100 100ARA Electrical Engineering Services Pty Limited Electrical 100 100ARA Electrical High Voltage Services Pty Limited Electrical 100 100ARA Fire Protection Services Pty Limited Fire 100 100ARA Indigenous Services Pty Ltd Property 49 49ARA Manufacture Pty Limited Products 100 100ARA Mechanical Services Pty Limited Mechanical 100 100ARA Property Services Pty Ltd the trustee for CMC Unit Trust Property 100 100ARA Security Services Pty Limited Security 100 100Asset Fire Security & Mechanical Services Pty Limited Fire 100 100Australasian Vaulting Industries Pty Ltd Security 100 100CMC Cleaning Services Pty Ltd Property 100 100CMC ECRM Pty Ltd Property 100 100
1649 1649
39
ARA Group Limited and Controlled Entities
Notes to the consolidated financial statements (continued)
For the year ended 30 June 2020
12. Controlled entities (continued)
Subsidiaries (continued)
% Equity interestName Principal Activities 2020 2019
CMC Maintenance Pty Ltd Property 100 100CMC Property Services (Aust) Pty Ltd Property 100 100CMC Rapid Response Pty Ltd Property 100 100Complex Solutions Pty Ltd Property 100 100Crimewatch Video Pty Limited Security 100 100Datatech Australia Pty Limited Electrical 100 100Dynamic Facilities Maintenance Group Pty Limited Building 100 100Environmental Automation Pty Limited Mechanical 100 100Excell Control Pty Limited Electrical 100 100HUD Electronic Security Pty Ltd Security 100 100HUD Security Pty Ltd Security 100 100Hunter Power Pty Limited Electrical 100 100ID Supplies Pty Limited Products 100 100International Security Control Solutions Pty Limited Products 100 100Leda Export Pty Ltd (a) Building 100 -Leda Group (Australia) Pty Ltd (a) Building 100 -Leda International Pty Ltd (a) Building 100 -Leda Security Exports Pty Ltd (a) Building 100 -Leda Security Products Pty Ltd (a) Building 100 -Leda Trading Pty Ltd (a) Building 100 -Leda Security Products (Ningbo) Co Ltd Building 100 -Ningbo Fenghua Leda Security Manufacturing Co., Ltd Building 100 -Monarch Group Pty Limited Products 100 100National Construction Solutions Pty Limited Building 100 100Parking Guidance Australia Pty Limited Products 100 100Sherry Services & Maintenance Pty Ltd Electrical 100 100TALV Pty Limited Building 100 100Thermoscan Inspection Services Pty Ltd Building 100 100Transelect Pty Limited Electrical 100 100Web ID Pty Limited Mechanical 100 100
ARA Group NZ LimitedSecurity andProducts 100 100
3100 2300(a) The Leda group of entities were acquired 1 July 2019.
All wholly owned controlled entities incorporated in Australia are subject to a Deed of Cross Guarantee with theexception of ARA Building Services (Qld) Pty Ltd.
All wholly owned controlled entities are incorporated in Australia with the exception of ARA Group NZ Limitedwhich is incorporated in New Zealand, and Leda Security Products (Ningbo) Co Ltd and Ningbo Fenghua LedaSecurity Manufacturing Co., Ltd which are incorporated in the People's Republic of China.
40

79
Annual Report 2020
78
The ARA Group
Section 5 Audited Financial Statements
ARA Group Limited and Controlled Entities
Notes to the consolidated financial statements (continued)
For the year ended 30 June 2020
14. Leases
Group as a lessee
The Group has lease contracts for various items of property leases, plant and machinery, motor vehicles andother equipment used in its operations. Leases of property, plant and machinery generally have lease termsbetween 2 and 10 years, while motor vehicles and other equipment generally have lease terms between 3 and 5years. The Group’s obligations under its leases are secured by the lessor’s title to the leased assets. Generally,the Group is restricted from assigning and subleasing the leased assets.
The Group applies the ‘short-term lease’ and ‘lease of low-value assets’ recognition exemptions for these leases.
Set out below are the carrying amounts of right-of-use assets recognised and the movements during the period:
Propertyleases
Plant andequipment
Motorvehicles Total
$ $ $ $
As at 1 July 2019 (on adoption of AASB 16) 26,802,205 141,217 11,298,887 38,242,309
Additions 4,383,805 - 3,712,369 8,096,174Depreciation expense (5,134,880) (44,158) (5,255,273) (10,434,311)
As at 30 June 2020 26,051,130 97,059 9,755,983 35,904,172
Set out below are the carrying amounts of lease liabilities (included under interest-bearing loans and borrowings)and the movements during the period:
2020$
As at 1 July 38,374,363
Additions 8,096,174Accretion of interest 415,651Payments (11,174,242)
At 30 June 35,711,946
Current 1,452,070Non-current 34,259,876
The following are the amounts recognised in profit or loss:
2020$
Depreciation expense of right-of-use assets 10,434,311Interest expense on lease liabilities 415,651Expense relating to short-term leases 706,605Expense relating to leases of low-value assets 2,647,734
14,204,301
The Group had total cash outflows for leases of $14,528,581 in 2020. The Group also had non-cash additions toright-of-use assets and lease liabilities of $8,096,174 in 2020.
42
AR
AG
rou
pL
imite
da
nd
Co
ntr
olle
dE
ntitie
s
No
tes
toth
eco
nso
lid
ate
dfi
nan
cia
lsta
tem
en
ts(c
on
tin
ued
)
Fo
rth
eye
ar
en
de
d3
0J
un
e2
02
0
13
.P
rop
ert
y,
pla
nt
an
de
qu
ipm
en
t
Le
as
eh
old
imp
rov
em
en
tsP
lan
ta
nd
ma
ch
ine
ry
Off
ice
furn
itu
rea
nd
eq
uip
me
nt
Co
mp
ute
re
qu
ipm
en
ta
nd
so
ftw
are
Mo
tor
Ve
hic
les
To
tal
$$
$$
$$
Co
st
At
1Ju
ly2
01
98
,40
4,7
41
18
,33
6,9
30
2,5
28
,84
96
,38
5,4
40
3,3
05
,09
83
8,9
61
,05
8A
dd
itio
ns
61
2,9
17
1,0
42
,70
91
66
,09
25
70
,80
73
16
,37
52
,70
8,9
00
Acq
uis
itio
no
fa
su
bsid
iary
(No
te3
)2
06
,93
18
92
,57
57
8,0
92
11
8,6
58
38
0,4
80
1,6
76
,73
6D
isp
osa
ls(8
39
,28
0)
(45
1,6
90
)(1
1,5
50
)-
(94
1,6
14
)(2
,24
4,1
34
)R
eva
lua
tio
na
dju
stm
en
t1
9,6
56
18
,02
2(1
9,4
09
)6
,15
2(2
4,4
21
)-
Re
cla
ssifi
catio
na
nd
tra
nsfe
r(t
o)/
fro
mo
the
rg
rou
pco
mp
an
y(N
BV
)8
,12
8(8
5,0
91
)(1
4,6
05
)4
3,0
36
(73
7)
(49
,26
9)
At
30
Ju
ne
20
20
8,4
13
,09
31
9,7
53
,45
52
,72
7,4
69
7,1
24
,09
33
,03
5,1
81
41
,05
3,2
91
Ac
cu
mu
late
dd
ep
rec
iati
on
At
1Ju
ly2
01
94
,37
6,8
91
11
,73
8,6
83
1,6
26
,19
75
,17
1,4
59
1,5
43
,88
32
4,4
57
,11
3D
ep
recia
tio
nch
arg
efo
rth
eye
ar
75
3,3
32
1,5
74
,41
12
37
,91
68
67
,75
15
79
,62
84
,01
3,0
38
Dis
po
sals
(47
2,2
61
)(2
99
,81
4)
(10
,97
8)
(6,6
25
)(3
64
,20
8)
(1,1
53
,88
6)
Tra
nsfe
rto
oth
er
gro
up
co
mp
an
y(2
,60
0)
(15
,50
4)
(8,2
80
)(2
2,1
48
)(7
37
)(4
9,2
69
)
At
30
Ju
ne
20
20
4,6
55
,36
21
2,9
97
,77
61
,84
4,8
55
6,0
10
,43
71
,75
8,5
66
27
,26
6,9
96
Ne
tb
oo
kv
alu
e
At
30
Ju
ne
20
19
4,0
27
,85
06
,59
8,2
47
90
2,6
52
1,2
13
,98
11
,76
1,2
15
14
,50
3,9
45
At
30
Ju
ne
20
20
3,7
57
,73
16
,75
5,6
79
88
2,6
14
1,1
13
,65
61
,27
6,6
15
13
,78
6,2
95 4
1
ARA Group Limited and Controlled Entities
Notes to the consolidated financial statements (continued)
For the year ended 30 June 2020
13. Property, plant and equipment
Leaseholdimprovements
Plant andmachinery
Officefurniture and
equipment
Computerequipment
and softwareMotor
Vehicles Total$ $ $ $ $ $
CostAt 1 July 2019 8,404,741 18,336,930 2,528,849 6,385,440 3,305,098 38,961,058Additions 612,917 1,042,709 166,092 570,807 316,375 2,708,900Acquisition of a subsidiary (Note 3) 206,931 892,575 78,092 118,658 380,480 1,676,736Disposals (839,280) (451,690) (11,550) - (941,614) (2,244,134)Revaluation adjustment 19,656 18,022 (19,409) 6,152 (24,421) -Reclassification and transfer (to)/from other group company (NBV) 8,128 (85,091) (14,605) 43,036 (737) (49,269)
At 30 June 2020 8,413,093 19,753,455 2,727,469 7,124,093 3,035,181 41,053,291
Accumulated depreciationAt 1 July 2019 4,376,891 11,738,683 1,626,197 5,171,459 1,543,883 24,457,113Depreciation charge for the year 753,332 1,574,411 237,916 867,751 579,628 4,013,038Disposals (472,261) (299,814) (10,978) (6,625) (364,208) (1,153,886)Transfer to other group company (2,600) (15,504) (8,280) (22,148) (737) (49,269)
At 30 June 2020 4,655,362 12,997,776 1,844,855 6,010,437 1,758,566 27,266,996
Net book value
At 30 June 2019 4,027,850 6,598,247 902,652 1,213,981 1,761,215 14,503,945
At 30 June 2020 3,757,731 6,755,679 882,614 1,113,656 1,276,615 13,786,295
41
ARA Group Limited and Controlled Entities
Notes to the consolidated financial statements (continued)
For the year ended 30 June 2020
10. Trade and other receivables and contract assets
2020 2019$ $
CurrentTrade receivables 90,780,855 80,479,414Provision for expected credit losses (1,014,558) (1,439,612)
89,766,297 79,039,802
Retentions 2,940,731 2,562,423Other debtors 5,711,673 2,739,569
98,418,701 84,341,794
Contract assets
As at 30 June 2020, the Group has contract assets of $nil (2019: $6,231,447) which is net of an allowance forexpected credit losses of $nil (2019: $nil).
11. Inventories
2020 2019$ $
Raw materials and stores 5,311,491 2,715,383Work in progress 2,331,610 2,314,206Finished goods 8,799,852 8,704,266Provision for obsolescence (309,648) (25,971)
16,133,305 13,707,884
12. Controlled entities
Subsidiaries
% Equity interestName Principal Activities 2020 2019
Allen & Newton Pty Ltd Building 100 100Allen & Newton Queensland Pty Limited Building 100 100ARA Building Services Pty Limited Building 100 100ARA Building Services (Qld) Pty Limited Building 100 100ARA Corporate Services Pty Limited Corporate 100 100ARA Electrical Engineering Services Pty Limited Electrical 100 100ARA Electrical High Voltage Services Pty Limited Electrical 100 100ARA Fire Protection Services Pty Limited Fire 100 100ARA Indigenous Services Pty Ltd Property 49 49ARA Manufacture Pty Limited Products 100 100ARA Mechanical Services Pty Limited Mechanical 100 100ARA Property Services Pty Ltd the trustee for CMC Unit Trust Property 100 100ARA Security Services Pty Limited Security 100 100Asset Fire Security & Mechanical Services Pty Limited Fire 100 100Australasian Vaulting Industries Pty Ltd Security 100 100CMC Cleaning Services Pty Ltd Property 100 100CMC ECRM Pty Ltd Property 100 100
1649 1649
39
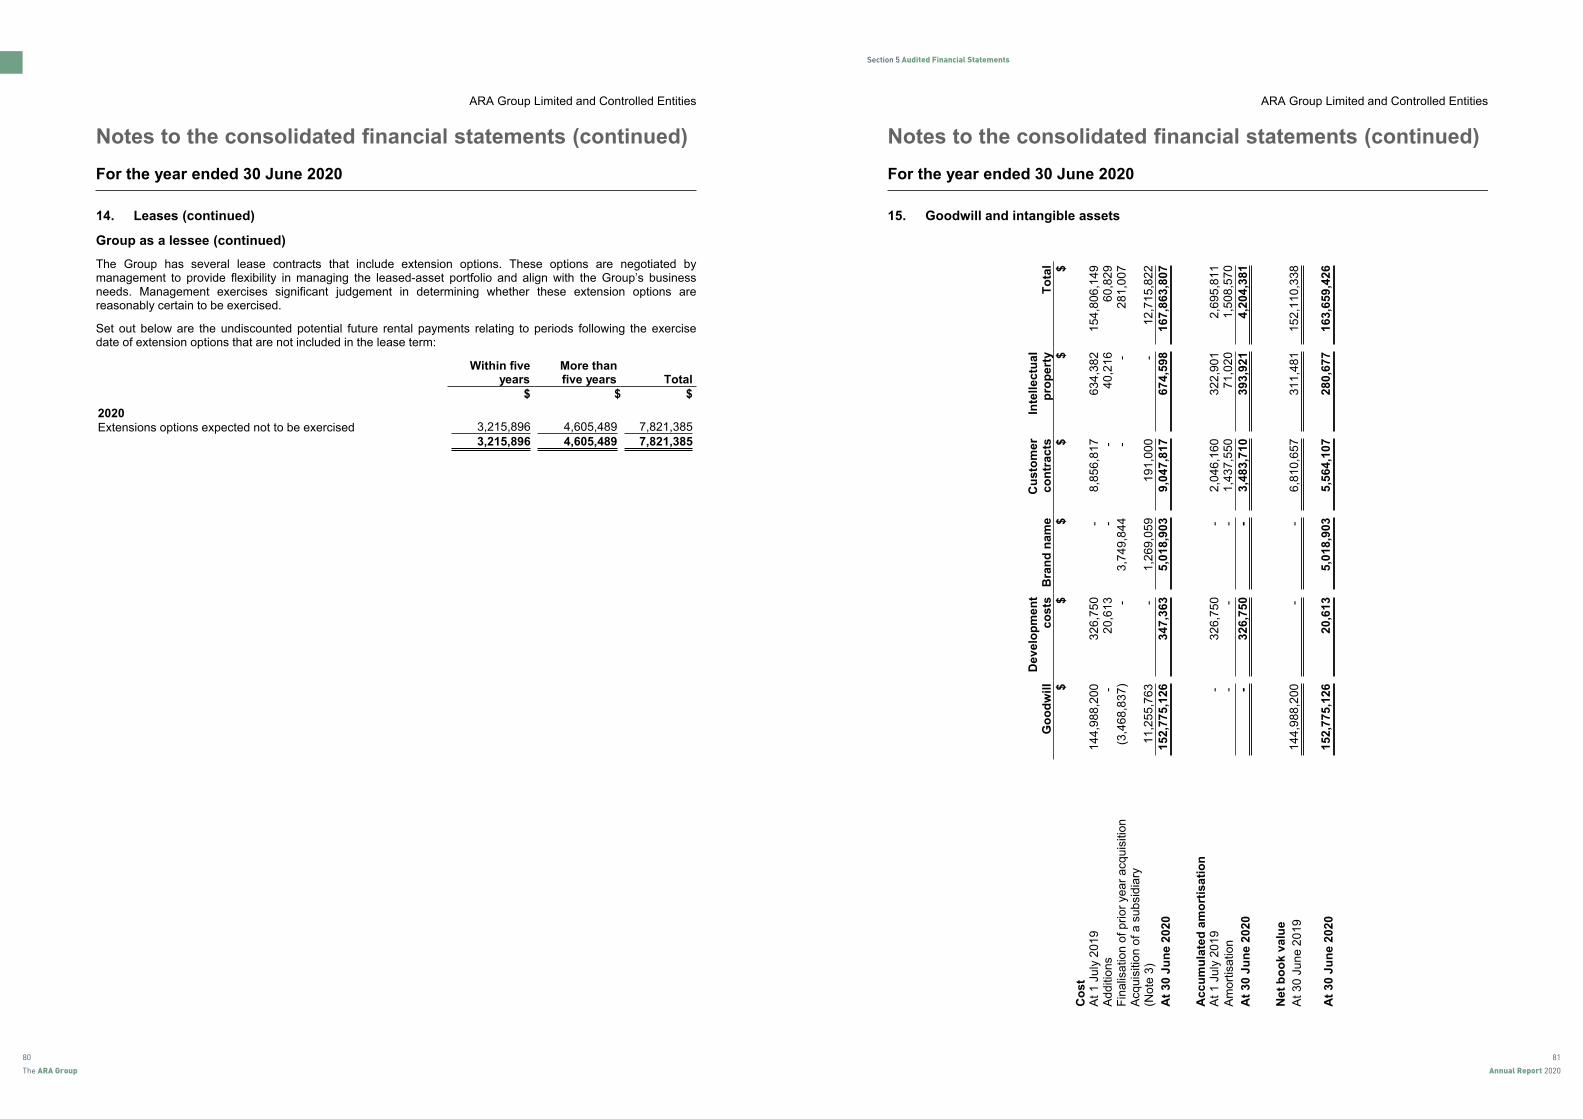
81
Annual Report 2020
80
The ARA Group
Section 5 Audited Financial Statements
ARA Group Limited and Controlled Entities
Notes to the consolidated financial statements (continued)
For the year ended 30 June 2020
14. Leases (continued)
Group as a lessee (continued)
The Group has several lease contracts that include extension options. These options are negotiated bymanagement to provide flexibility in managing the leased-asset portfolio and align with the Group’s businessneeds. Management exercises significant judgement in determining whether these extension options arereasonably certain to be exercised.
Set out below are the undiscounted potential future rental payments relating to periods following the exercisedate of extension options that are not included in the lease term:
Within fiveyears
More thanfive years Total
$ $ $
2020Extensions options expected not to be exercised 3,215,896 4,605,489 7,821,385
3,215,896 4,605,489 7,821,385
43
AR
AG
rou
pL
imite
da
nd
Co
ntr
olle
dE
ntitie
s
No
tes
toth
eco
nso
lid
ate
dfi
nan
cia
lsta
tem
en
ts(c
on
tin
ued
)
Fo
rth
eye
ar
en
de
d3
0J
un
e2
02
0
15
.G
oo
dw
illa
nd
inta
ng
ible
assets
Go
od
wil
lD
ev
elo
pm
en
tc
os
tsB
ran
dn
am
eC
us
tom
er
co
ntr
ac
tsIn
tell
ec
tua
lp
rop
ert
yT
ota
l$
$$
$$
$
Co
st
At
1Ju
ly2
01
91
44
,98
8,2
00
32
6,7
50
-8
,85
6,8
17
63
4,3
82
15
4,8
06
,14
9A
dd
itio
ns
-2
0,6
13
--
40
,21
66
0,8
29
Fin
alis
atio
no
fp
rio
rye
ar
acq
uis
itio
n(3
,46
8,8
37
)-
3,7
49
,84
4-
-2
81
,00
7A
cq
uis
itio
no
fa
su
bsid
iary
(No
te3
)1
1,2
55
,76
3-
1,2
69
,05
91
91
,00
0-
12
,71
5,8
22
At
30
Ju
ne
20
20
15
2,7
75
,12
63
47
,36
35
,01
8,9
03
9,0
47
,81
76
74
,59
81
67
,86
3,8
07
Ac
cu
mu
late
da
mo
rtis
ati
on
At
1Ju
ly2
01
9-
32
6,7
50
-2
,04
6,1
60
32
2,9
01
2,6
95
,81
1A
mo
rtis
atio
n-
--
1,4
37
,55
07
1,0
20
1,5
08
,57
0
At
30
Ju
ne
20
20
-3
26
,75
0-
3,4
83
,71
03
93
,92
14
,20
4,3
81
Ne
tb
oo
kv
alu
e
At
30
Ju
ne
20
19
14
4,9
88
,20
0-
-6
,81
0,6
57
31
1,4
81
15
2,1
10
,33
8
At
30
Ju
ne
20
20
15
2,7
75
,12
62
0,6
13
5,0
18
,90
35
,56
4,1
07
28
0,6
77
16
3,6
59
,42
6 44
ARA Group Limited and Controlled Entities
Notes to the consolidated financial statements (continued)
For the year ended 30 June 2020
15. Goodwill and intangible assets
GoodwillDevelopment
costs Brand nameCustomercontracts
Intellectualproperty Total
$ $ $ $ $ $
CostAt 1 July 2019 144,988,200 326,750 - 8,856,817 634,382 154,806,149Additions - 20,613 - - 40,216 60,829Finalisation of prior year acquisition (3,468,837) - 3,749,844 - - 281,007Acquisition of a subsidiary(Note 3) 11,255,763 - 1,269,059 191,000 - 12,715,822
At 30 June 2020 152,775,126 347,363 5,018,903 9,047,817 674,598 167,863,807
Accumulated amortisationAt 1 July 2019 - 326,750 - 2,046,160 322,901 2,695,811Amortisation - - - 1,437,550 71,020 1,508,570
At 30 June 2020 - 326,750 - 3,483,710 393,921 4,204,381
Net book value
At 30 June 2019 144,988,200 - - 6,810,657 311,481 152,110,338
At 30 June 2020 152,775,126 20,613 5,018,903 5,564,107 280,677 163,659,426
44
ARA Group Limited and Controlled Entities
Notes to the consolidated financial statements (continued)
For the year ended 30 June 2020
14. Leases
Group as a lessee
The Group has lease contracts for various items of property leases, plant and machinery, motor vehicles andother equipment used in its operations. Leases of property, plant and machinery generally have lease termsbetween 2 and 10 years, while motor vehicles and other equipment generally have lease terms between 3 and 5years. The Group’s obligations under its leases are secured by the lessor’s title to the leased assets. Generally,the Group is restricted from assigning and subleasing the leased assets.
The Group applies the ‘short-term lease’ and ‘lease of low-value assets’ recognition exemptions for these leases.
Set out below are the carrying amounts of right-of-use assets recognised and the movements during the period:
Propertyleases
Plant andequipment
Motorvehicles Total
$ $ $ $
As at 1 July 2019 (on adoption of AASB 16) 26,802,205 141,217 11,298,887 38,242,309
Additions 4,383,805 - 3,712,369 8,096,174Depreciation expense (5,134,880) (44,158) (5,255,273) (10,434,311)
As at 30 June 2020 26,051,130 97,059 9,755,983 35,904,172
Set out below are the carrying amounts of lease liabilities (included under interest-bearing loans and borrowings)and the movements during the period:
2020$
As at 1 July 38,374,363
Additions 8,096,174Accretion of interest 415,651Payments (11,174,242)
At 30 June 35,711,946
Current 1,452,070Non-current 34,259,876
The following are the amounts recognised in profit or loss:
2020$
Depreciation expense of right-of-use assets 10,434,311Interest expense on lease liabilities 415,651Expense relating to short-term leases 706,605Expense relating to leases of low-value assets 2,647,734
14,204,301
The Group had total cash outflows for leases of $14,528,581 in 2020. The Group also had non-cash additions toright-of-use assets and lease liabilities of $8,096,174 in 2020.
42

83
Annual Report 2020
82
The ARA Group
Section 5 Audited Financial Statements
ARA Group Limited and Controlled Entities
Notes to the consolidated financial statements (continued)
For the year ended 30 June 2020
16. Trade and other payables
2020 2019$ $
Current
Trade payables 47,593,688 59,343,299
Other payablesTrade creditors accruals 9,221,922 2,976,179Other creditors and accruals 26,138,183 21,352,431Deferred purchase consideration for acquisitions 2,740,367 796,956Cash on deposit owing to third parties 217,471 2,608,361Dividends payable (Note 8) 6,154,238 3,069,095
44,472,181 30,803,022
Non-current
Deferred purchase consideration for acquisitions - 687,500
17. Contract liabilities
2020 2019$ $
Short-term advances for services 4,472,038 1,376,911
18. Interest-bearing loans and borrowings
Interest rate Maturity 2020 2019% Financial years $ $
blankCurrentFinance leases and hire purchase contracts(a) 2.63 - 10.07 1 - 5 years - 168,881
- 168,881
Non-currentBank bills and loans secured (Note 22.2) (a) 2.70 - 3.80 2 - 3 years 82,625,000 67,125,000Finance leases and hire purchase contracts(a) 2.63 - 10.07 1 - 5 years - 96,443
82,625,000 67,221,443
82,625,000 67,390,324
45
ARA Group Limited and Controlled Entities
Notes to the consolidated financial statements (continued)
For the year ended 30 June 2020
18. Interest-bearing loans and borrowings (continued)
(a) Total current and non-current secured liabilities2020 2019
$ $
Bank bills and loans 82,625,000 67,125,000Finance leases and hire purchase contracts - 265,324
82,625,000 67,390,324
The bank bills and loans are secured by a fixed charged over the Group's assets. For 2019, finance leases andhire purchase contracts are secured by the lessor's title to the leased assets. For 2020, finance leases and hirepurchases are included in lease liabilities due to the adoption of AASB 16.
(b) The carrying amounts of assets pledged as security, the current market value of which exceeds the value ofthe mortgage
2020 2019$ $
First mortgage over all of the assets of the parent entity and all controlledentities - total assets pledged as security 330,855,350 298,544,178
19. Employee benefits liabilities
2020 2019$ $
CurrentAnnual leave 13,114,593 11,165,736Long service leave 5,269,270 4,139,586
18,383,863 15,305,322
Non-currentLong service leave 2,431,277 2,298,962
2,431,277 2,298,962
Aggregate employee entitlement liability 20,815,140 17,604,284
20. Contributed equity and reserves
20.1 Contributed equity
2020 2019$ $
Fully paid shares
Fully paid ordinary shares 93,313,832 88,570,325
46

85
Annual Report 2020
84
The ARA Group
Section 5 Audited Financial Statements
ARA Group Limited and Controlled Entities
Notes to the consolidated financial statements (continued)
For the year ended 30 June 2020
20. Contributed equity and reserves (continued)
20.1 Contributed equity (continued)
2020 2019Fully paid ordinary shares No. $ No. $At beginning of financial year 39,858,379 88,570,325 38,244,481 82,089,733Issued during financial year- acquisitions 685,000 2,802,500 50,000 225,000- capital raising 484,884 1,941,007 1,563,898 6,255,592
At reporting date 41,028,263 93,313,832 39,858,379 88,570,325
At the reporting date, issued capital consists of 41,028,263 ordinary shares. All ordinary shares participate individends and the proceeds on winding up of the Parent Entity are in proportion to the number of shares held. Atshareholders' meetings, each ordinary share is entitled to one vote per share held when a poll is called,otherwise each shareholder has one vote on a show of hands.
The Group issued 479,001 ordinary shares at $4.00 per share and 5,883 ordinary shares at $4.25 during the yearto new and existing shareholders increasing equity by $1,941,007. The Group issued 425,000 ordinary shares at$4.00 per share as purchase consideration to the vendor of Leda Security Trading Pty Limited effective 1 July2019. A further 250,000 ordinary shares at $4.25 per share were issued as purchase consideration to the vendorof ISM Interiors effective 1 March 2020. This increased equity by $2,802,500.
20.2 Other reserves
a) Movement
Year ended 30 June 2020Other
reserveHedge
reserve
Foreigncurrency
translationreserve Total
$ $ $ $
Balance at the start of the financial year (2,839,864) (562,630) 4,014 (3,398,480)Net unrealised loss on cash flow hedges - 287,262 - 287,262Deferred tax on net unrealised loss on cash flow hedges - (86,179) - (86,179)Currency translation differences - - (108,887) (108,887)
(2,839,864) (361,547) (104,873) (3,306,284)
Year ended 30 June 2019Other
reserveHedge
reserve
Foreigncurrency
translationreserve Total
$ $ $ $
Balance at the start of the financial year (2,839,864) 71,277 - (2,768,587)Net unrealised gain on cash flow hedges - (905,589) - (905,589)Deferred tax on net unrealised gain on cash flow hedges - 271,682 - 271,682Currency translation differences - - 4,014 4,014
(2,839,864) (562,630) 4,014 (3,398,480)
On 26 August 2016, the Group entered into a 5 year interest rate swap. On 30 November 2018, the Groupentered into two more interest rate swaps both with 20 month terms. Since inception, a mark to market valuationof $361,547 has been recognised in hedge reserve at 30 June 2020 (2019: $562,630).
47
ARA Group Limited and Controlled Entities
Notes to the consolidated financial statements (continued)
For the year ended 30 June 2020
20. Contributed equity and reserves (continued)
20.2 Other reserves (continued)
b) Nature and purpose of reserve
Other reserve
The other reserves represents goodwill arising from subsequent acquisitions of previous non-controlling interests.The acquisitions are treated as transactions between owners and the resulting goodwill is recognised directly inother reserves.
Hedge reserve
This reserve records movements for the interest rate swap contracts qualifying for hedge accounting.
Foreign currency translation reserve
The foreign currency translation reserve is used to record exchange differences arising from the translation of thefinancial statements of foreign subsidiaries and branches.
21. Related party disclosure
Transaction with key management personnel
Rental property paid to Directors
The Group rented certain properties that are controlled by members of the Group’s key management personnel.Total rental paid during the year amounted to $982,810 (2019: $842,641).
Amounts paid to related parties during the year for rent are subject to commercial lease and are at arms length.
Compensation of key management personnel of the GroupTotal compensation paid to key management personnel during the year amounted to $5,458,944 (2019:$5,641,008)).
Directors feesTotal directors fees paid during the year amounted to $220,000 (2019: $220,000).
Bank GuaranteesThe Group issued two bank guarantees totalling $187,725 (2019: $87,725) on behalf of one of the Group's keymanagement personnel. All fees in relation to the bank guarantee have been reimbursed to the Group.
As at 30 June 2020 and 2019, there were no outstanding balances owing or payable to related parties forservices provided to related parties.
22. Commitments and contingencies
22.1 Commitments
There are no commitments as at the reporting date which would have a material effect on the Company'sfinancial statements as at 30 June 2020.
48
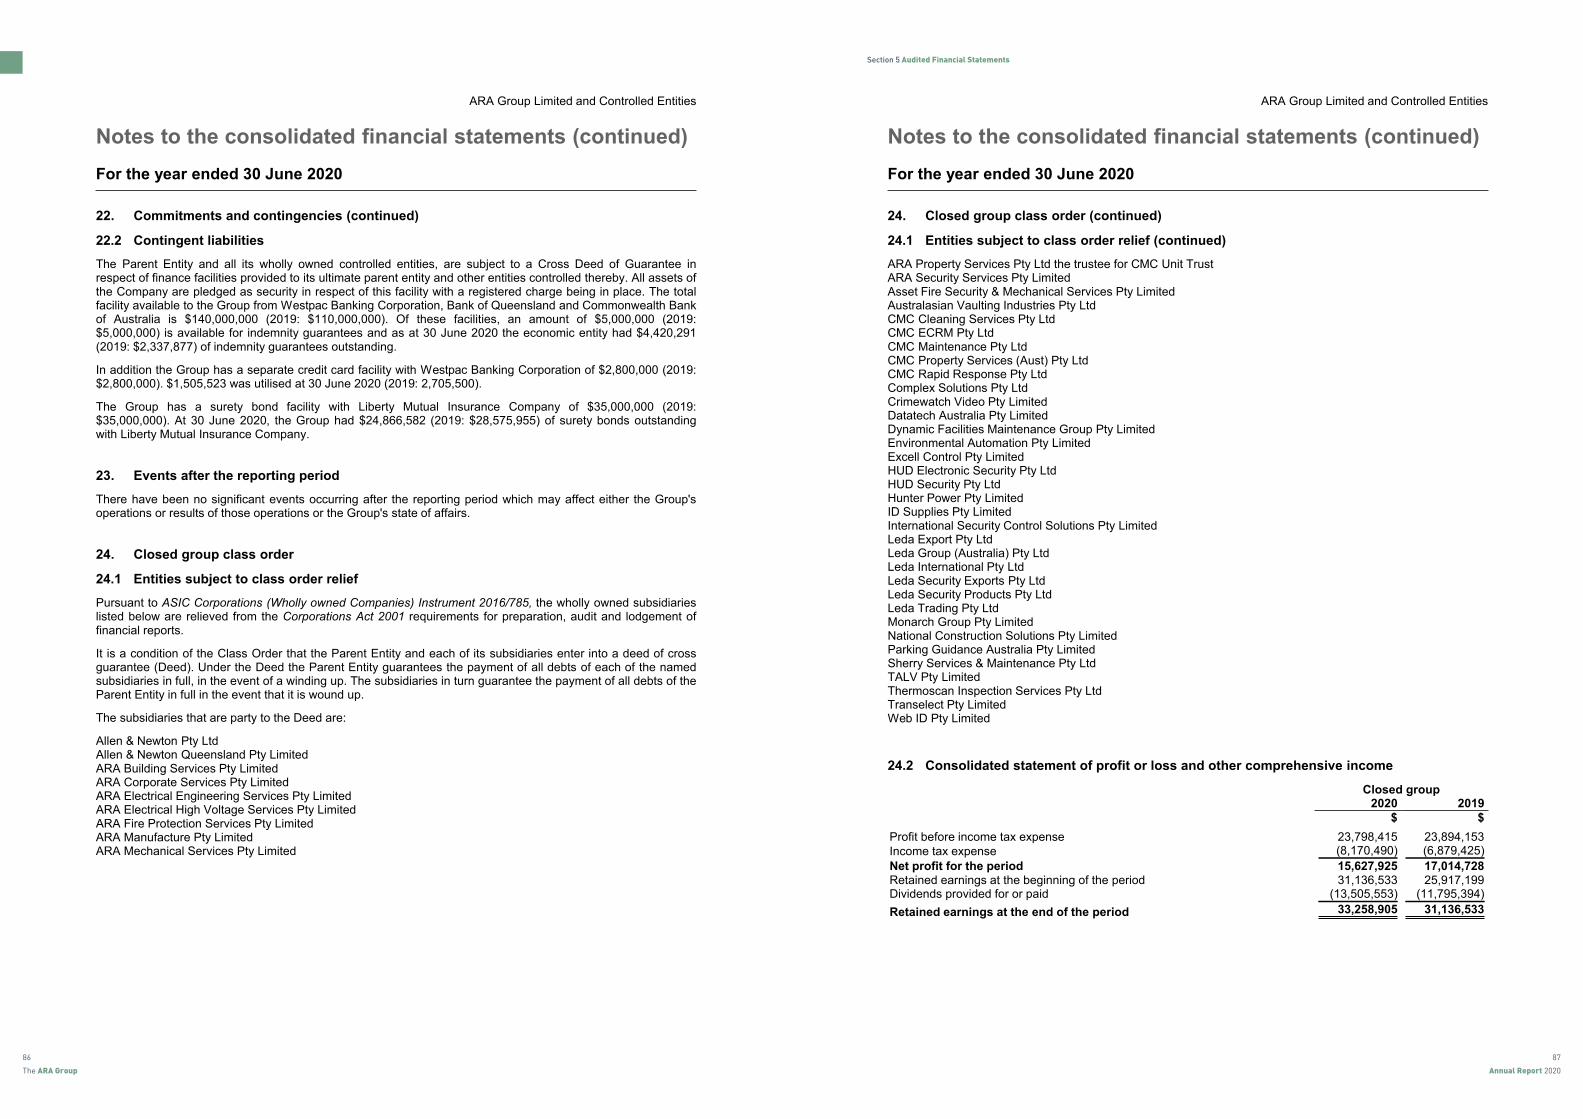
87
Annual Report 2020
86
The ARA Group
Section 5 Audited Financial Statements
ARA Group Limited and Controlled Entities
Notes to the consolidated financial statements (continued)
For the year ended 30 June 2020
22. Commitments and contingencies (continued)
22.2 Contingent liabilities
The Parent Entity and all its wholly owned controlled entities, are subject to a Cross Deed of Guarantee inrespect of finance facilities provided to its ultimate parent entity and other entities controlled thereby. All assets ofthe Company are pledged as security in respect of this facility with a registered charge being in place. The totalfacility available to the Group from Westpac Banking Corporation, Bank of Queensland and Commonwealth Bankof Australia is $140,000,000 (2019: $110,000,000). Of these facilities, an amount of $5,000,000 (2019:$5,000,000) is available for indemnity guarantees and as at 30 June 2020 the economic entity had $4,420,291(2019: $2,337,877) of indemnity guarantees outstanding.
In addition the Group has a separate credit card facility with Westpac Banking Corporation of $2,800,000 (2019:$2,800,000). $1,505,523 was utilised at 30 June 2020 (2019: 2,705,500).
The Group has a surety bond facility with Liberty Mutual Insurance Company of $35,000,000 (2019:$35,000,000). At 30 June 2020, the Group had $24,866,582 (2019: $28,575,955) of surety bonds outstandingwith Liberty Mutual Insurance Company.
23. Events after the reporting period
There have been no significant events occurring after the reporting period which may affect either the Group'soperations or results of those operations or the Group's state of affairs.
24. Closed group class order
24.1 Entities subject to class order relief
Pursuant to ASIC Corporations (Wholly owned Companies) Instrument 2016/785, the wholly owned subsidiarieslisted below are relieved from the Corporations Act 2001 requirements for preparation, audit and lodgement offinancial reports.
It is a condition of the Class Order that the Parent Entity and each of its subsidiaries enter into a deed of crossguarantee (Deed). Under the Deed the Parent Entity guarantees the payment of all debts of each of the namedsubsidiaries in full, in the event of a winding up. The subsidiaries in turn guarantee the payment of all debts of theParent Entity in full in the event that it is wound up.
The subsidiaries that are party to the Deed are:
Allen & Newton Pty LtdAllen & Newton Queensland Pty LimitedARA Building Services Pty LimitedARA Corporate Services Pty LimitedARA Electrical Engineering Services Pty LimitedARA Electrical High Voltage Services Pty LimitedARA Fire Protection Services Pty LimitedARA Manufacture Pty LimitedARA Mechanical Services Pty Limited
49
ARA Group Limited and Controlled Entities
Notes to the consolidated financial statements (continued)
For the year ended 30 June 2020
24. Closed group class order (continued)
24.1 Entities subject to class order relief (continued)
ARA Property Services Pty Ltd the trustee for CMC Unit TrustARA Security Services Pty LimitedAsset Fire Security & Mechanical Services Pty LimitedAustralasian Vaulting Industries Pty LtdCMC Cleaning Services Pty LtdCMC ECRM Pty LtdCMC Maintenance Pty LtdCMC Property Services (Aust) Pty LtdCMC Rapid Response Pty LtdComplex Solutions Pty LtdCrimewatch Video Pty LimitedDatatech Australia Pty LimitedDynamic Facilities Maintenance Group Pty LimitedEnvironmental Automation Pty LimitedExcell Control Pty LimitedHUD Electronic Security Pty LtdHUD Security Pty LtdHunter Power Pty LimitedID Supplies Pty LimitedInternational Security Control Solutions Pty LimitedLeda Export Pty LtdLeda Group (Australia) Pty LtdLeda International Pty LtdLeda Security Exports Pty LtdLeda Security Products Pty LtdLeda Trading Pty LtdMonarch Group Pty LimitedNational Construction Solutions Pty LimitedParking Guidance Australia Pty LimitedSherry Services & Maintenance Pty LtdTALV Pty LimitedThermoscan Inspection Services Pty LtdTranselect Pty LimitedWeb ID Pty Limited
24.2 Consolidated statement of profit or loss and other comprehensive income
Closed group2020 2019
$ $
Profit before income tax expense 23,798,415 23,894,153Income tax expense (8,170,490) (6,879,425)
Net profit for the period 15,627,925 17,014,728Retained earnings at the beginning of the period 31,136,533 25,917,199Dividends provided for or paid (13,505,553) (11,795,394)
Retained earnings at the end of the period 33,258,905 31,136,533
50

89
Annual Report 2020
88
The ARA Group
Section 5 Audited Financial Statements
ARA Group Limited and Controlled Entities
Notes to the consolidated financial statements (continued)
For the year ended 30 June 2020
24. Closed group class order (continued)
24.3 Consolidated statement of financial position
The consolidated statement of financial position of the Closed Group is as follows:
Closed group2020 2019
$ $
Current assetsCash and cash equivalents 23,451,978 16,373,169Trade and other receivables 91,431,337 78,041,540Contract assets - 5,774,324Inventories 13,377,371 10,969,922Other assets 2,495,808 1,663,740
Total current assets 130,756,494 112,822,695
Non-current assetsOther financial assets 16,878,129 16,485,872Other debtors 1,301,249 -Property, plant and equipment 12,714,744 13,323,014Right-of-use assets 35,450,563 -Deferred tax assets 6,660,565 5,801,214Goodwill and intangible assets 152,517,832 141,832,899
Total non-current assets 225,523,082 177,442,999
Total assets 356,279,576 290,265,694
Current liabilitiesTrade payables 48,838,868 57,178,384Other payables 37,952,064 26,103,467Contract liabilities 4,705,610 1,147,745Other financial liabilities 72,248 -Lease liabilities related to right-of-use assets 1,367,649 -Income tax payable 1,768,923 1,171,994Employee benefits 17,322,937 14,383,404
Total current liabilities 112,028,299 99,984,994
Non-current liabilitiesOther creditors - 687,500Other financial liabilities 82,672,633 67,221,443Lease liabilities related to right-of-use assets 33,761,452 -Deferred tax liabilities 2,190,500 3,768,430Employee benefits 2,384,662 2,298,962
Total non-current liabilities 121,009,247 73,976,335
Total liabilities 233,037,546 173,961,329
Net assets 123,242,030 116,304,365
51
ARA Group Limited and Controlled Entities
Notes to the consolidated financial statements (continued)
For the year ended 30 June 2020
24. Closed group class order (continued)
24.3 Consolidated statement of financial position (continued)
Closed group2020 2019
$ $
EquityShare capital 93,184,536 88,570,326Retained earnings 33,258,905 31,136,533Other reserves (3,201,411) (3,402,494)
Total equity 123,242,030 116,304,365
25. Information relating to parent ARA Group Limited
2020 2019$ $
Current assets 49,037,857 40,578,249Non-current assets 266,132,676 239,543,001
Total assets 315,170,533 280,121,250
Current liabilities 11,563,602 7,493,210Non-current liabilities 270,573,461 227,540,117
Total liabilities 282,137,063 235,033,327
Net assets 33,033,470 45,087,923
Contributed equity 93,313,832 88,570,325Accumulated losses (59,918,815) (42,919,772)Other reserves (361,547) (562,630)
33,033,470 45,087,923
Loss for the year (4,967,298) (2,716,847)
26. Auditor's remuneration
The auditor of ARA Group Limited and Controlled Entities is Ernst & Young (Australia).
2020 2019$ $
Amounts received or due and receivable by Ernst & Young audit firm for:Ernst & Young audit 408,830 380,000Ernst & Young other services 129,453 171,070
538,283 551,070Amounts received or due and receivable by non Ernst & Young audit firm for:
Services provided by other accounting firms 83,590 94,861621,873 645,931
52

91
Annual Report 2020
90
The ARA Group
Section 5 Audited Financial Statements
ARA Group Limited and Controlled Entities
Directors' declaration
In accordance with a resolution of the directors of ARA Group Limited and Controlled Entities, I state that:
In the opinion of the directors:
(a) the consolidated financial statements and notes of ARA Group Limited and Controlled Entities for thefinancial year ended 30 June 2020 are in accordance with the Corporations Act 2001, including:
(i) giving a true and fair view of the Group's financial position as at 30 June 2020 and itsperformance for the year ended on that date; and
(ii) complying with Australian Accounting Standards - Reduced Disclosure Requirements (includingthe Australian Accounting Interpretations) and the Corporations Regulations 2001;
(b) there are reasonable grounds to believe that the Company will be able to pay its debts as and whenthey become due and payable.
(c) as at the date of this declaration, there are reasonable grounds to believe that the members of theClosed Group identified in Note 24 will be able to meet any obligations or liabilities to which they areor may become subject, by virtue of the Deed of Cross Guarantee.
On behalf of the board
Edward FedermanExecutive DirectorSydney7 August 2020
53
A member firm of Ernst & Young Global Limited Liability limited by a scheme approved under Professional Standards Legislation
Ernst & Young Services Pty Limited 200 George Street Sydney NSW 2000 Australia GPO Box 2646 Sydney NSW 2001
Tel: +61 2 9248 5555 Fax: +61 2 9248 5959 ey.com/au
Independent Auditor's Report to the Members of ARA Group Limited
Opinion
We have audited the financial report of ARA Group Limited (the Company) and its subsidiaries (collectively the Group), which comprises the consolidated statement of financial position as at 30 June 2020, the consolidated statement of comprehensive income, consolidated statement of changes in equity and consolidated statement of cash flows for the year then ended, notes to the financial statements, including a summary of significant accounting policies, and the directors declaration.
In our opinion, the accompanying financial report of the Group is in accordance with the Corporations Act 2001, including:
a) giving a true and fair view of the consolidated financial position of the Group as at 30 June 2020 and of its consolidated financial performance for the year ended on that date; and
b) complying with Australian Accounting Standards – Reduced Disclosure Requirements and the Corporations Regulations 2001.
Basis for Opinion
We conducted our audit in accordance with Australian Auditing Standards. Our responsibilities under those standards are further described in the Auditor’s Responsibilities for the Audit of the Financial Report section of our report. We are independent of the Group in accordance with the auditor independence requirements of the Corporations Act 2001 and the ethical requirements of the Accounting Professional and Ethical Standards Board’s APES 110 Code of Ethics for Professional Accountants (including Independence Standards) (the Code) that are relevant to our audit of the financial report in Australia. We have also fulfilled our other ethical responsibilities in accordance with the Code.
We believe that the audit evidence we have obtained is sufficient and appropriate to provide a basis for our opinion.
Information Other than the Financial Report and Auditor’s Report Thereon
The directors are responsible for the other information. The other information is the directors’ report accompanying the financial report.
Our opinion on the financial report does not cover the other information and accordingly we do not express any form of assurance conclusion thereon.
In connection with our audit of the financial report, our responsibility is to read the other information and, in doing so, consider whether the other information is materially inconsistent with the financial report or our knowledge obtained in the audit or otherwise appears to be materially misstated.
If, based on the work we have performed, we conclude that there is a material misstatement of this other information, we are required to report that fact. We have nothing to report in this regard.
93
Annual Report 2020
92
The ARA Group
Section 5 Audited Financial Statements
A member firm of Ernst & Young Global Limited Liability limited by a scheme approved under Professional Standards Legislation
Responsibilities of the Directors for the Financial Report
The directors of the Company are responsible for the preparation of the financial report that gives a true and fair view in accordance with Australian Accounting Standards – Reduced Disclosure Requirements and the Corporations Act 2001 and for such internal control as the directors determine is necessary to enable the preparation of the financial report that gives a true and fair view and is free from material misstatement, whether due to fraud or error.
In preparing the financial report, the directors are responsible for assessing the Group’s ability to continue as a going concern, disclosing, as applicable, matters relating to going concern and using the going concern basis of accounting unless the directors either intend to liquidate the Group or to cease operations, or have no realistic alternative but to do so.
Auditor's Responsibilities for the Audit of the Financial Report
Our objectives are to obtain reasonable assurance about whether the financial report as a whole is free from material misstatement, whether due to fraud or error, and to issue an auditor’s report that includes our opinion. Reasonable assurance is a high level of assurance, but is not a guarantee that an audit conducted in accordance with the Australian Auditing Standards will always detect a material misstatement when it exists. Misstatements can arise from fraud or error and are considered material if, individually or in the aggregate, they could reasonably be expected to influence the economic decisions of users taken on the basis of this financial report.
As part of an audit in accordance with the Australian Auditing Standards, we exercise professional judgment and maintain professional scepticism throughout the audit. We also: • Identify and assess the risks of material misstatement of the financial report, whether due to fraud
or error, design and perform audit procedures responsive to those risks, and obtain audit evidence that is sufficient and appropriate to provide a basis for our opinion. The risk of not detecting a material misstatement resulting from fraud is higher than for one resulting from error, as fraud may involve collusion, forgery, intentional omissions, misrepresentations, or the override of internal control.
• Obtain an understanding of internal control relevant to the audit in order to design audit procedures
that are appropriate in the circumstances, but not for the purpose of expressing an opinion on the effectiveness of the Group’s internal control.
• Evaluate the appropriateness of accounting policies used and the reasonableness of accounting
estimates and related disclosures made by the directors.
• Conclude on the appropriateness of the directors’ use of the going concern basis of accounting and, based on the audit evidence obtained, whether a material uncertainty exists related to events or conditions that may cast significant doubt on the Group’s ability to continue as a going concern. If we conclude that a material uncertainty exists, we are required to draw attention in our auditor’s report to the related disclosures in the financial report or, if such disclosures are inadequate, to modify our opinion. Our conclusions are based on the audit evidence obtained up to the date of our auditor’s report. However, future events or conditions may cause the Group to cease to continue as a going concern.
A member firm of Ernst & Young Global Limited Liability limited by a scheme approved under Professional Standards Legislation
• Evaluate the overall presentation, structure and content of the financial report, including the
disclosures, and whether the financial report represents the underlying transactions and events in a manner that achieves fair presentation.
• Obtain sufficient appropriate audit evidence regarding the financial information of the entities or
business activities within the Group to express an opinion on the financial report. We are responsible for the direction, supervision and performance of the Group audit. We remain solely responsible for our audit opinion.
We communicate with the directors regarding, among other matters, the planned scope and timing of the audit and significant audit findings, including any significant deficiencies in internal control that we identify during our audit. Ernst & Young Chris Lawton Partner Sydney 7 August 2020

ARA Directory
ARA Group 1300 233 305 www.aragroup.com.au
10 Bridge Rd, Stanmore NSW 2048
Locked Bag 5501, Camperdown NSW 2050
ARA Building Services 1300 660 573 www.arabuilding.com.au
ACT 1/9 Lithgow St, Fyshwick ACT 2609
NSW Head Office Level 2, 10 Bridge Rd, Stanmore NSW 2048
8 Ferris Street North Parramatta NSW 2151
Unit 1, 22 Reliance Dr, Tuggerah NSW 2259
QLD Unit 3, 3375 Pacific Highway, Slacks Creek QLD 4127
SA 19 Taminga Street Regency Park SA 5010
61 Goodwood Road Wayville SA 5034
VIC 24-30 Halsey Road Airport West VIC 3042
67 Calarco Drive Derrimut VIC 3030
93 Cook St, Port Melbourne VIC 3207
WA 14 Kenhelm Street Balcatta WA 6021
ARA Electrical 1300 272 353 www.araelect.com.au
NSW
14c Williamson Rd, Ingleburn NSW 2565
34 Norfolk Ave, Nowra NSW 2541
8 Magpie St, Singleton NSW 2330
20 Investigator Dr, Unanderra NSW 2526
34 Camfield Dr, Heatherbrae NSW 2324
Unit 1, 19 York Rd, Ingleburn NSW 2565
QLD Unit 37, 1631 Wynnum Rd, Tingalpa QLD 4173
ARA Fire 1300 272 347 www.arafire.com.au
ACT 1/9 Lithgow St, Fyshwick ACT 2609
NSW 20 Binney Rd, Kings Park NSW 2148
Unit 1, 22 Reliance Dr, Tuggerah NSW 2259
1729 Botany Rd, Banksmeadow NSW 2019
QLD Unit 2, 102 Enterprise St, Bundaberg QLD 4670
37 Mary St, Kingston QLD 4114
45 Chetwynd St, Loganholme QLD 4129
SA 19 Taminga St, Regency Park SA 5010
VIC 93 Cook St, Port Melbourne VIC 3207
WA Unit 7, 14 Atbara St, West Kalgoorlie WA 6430
14 Kenhelm St, Balcatta WA 6021
ARA Indigenous Services 1300 889 210 www.araindigenous.com.au
NSW Level 2, 10 Bridge Rd, Stanmore NSW 2048
VIC 442 - 450 Auburn Rd, Hawthorn VIC 3122
ARA Mechanical 1300 332 237 (ACES) 1300 322 627 (EA) www.aramechanical.com.au
ACT 1/9 Lithgow St, Fyshwick ACT 2609
NSW Head Office Unit 7, 192 Kingsgrove Rd, Kingsgrove NSW 2208
86 Bathurst Rd, Orange NSW 2800
Unit 30, 192 Kingsgrove Rd, Kingsgrove NSW 2208
1/6 Morton Cl, Tuggerah NSW 2259
QLD Unit 37, 1631 Wynnum Rd, Tingalpa QLD 4172
VIC 93 Cook St, Port Melbourne VIC 3207
ARA Products 1300 111 010 1300 306 440 (Manufacturing) www.araproducts.com.au
NSW Austlink Corporate Park Unit 3, 4 Narabang Way, Belrose NSW 2085
Unit 1, 5 Endeavour Rd, Caringbah NSW 2229
Unit 22, 287 Victoria Rd, Rydalmere NSW 2116
QLD Unit 8, 4 Henry St, Loganholme QLD 4129
SA 19 Taminga St, Regency Park SA 5010
VIC Unit 2, 34 Wirraway Dr, Port Melbourne VIC 3207
67 Calarco Dr, Derrimut VIC 3030
NEW ZEALAND 26 Timothy Pl, Avondale Auckland 1026
10 Calgary Pl, Hornby South Christchurch 8042
33 Marsden St, Melling Lower Hutt Wellington 5010
ARA Property Services 1300 889 210 www.arapropertyservices.com.au
NSW Level 2, 10 Bridge Rd, Stanmore NSW 2048
8 Ferris St, North Parramatta NSW 2151
QLD Office 42, Building 1 Level 2 Kings Row 52 McDougall St Heat Milton QLD 4064
SA Suite 6, 213 Greenhill Rd, Eastwood SA 5063
VIC 442 - 450 Auburn Rd, Hawthorn VIC 3122
ARA Security AUS 1300 303 325 NZ 0508 272 732
www.arasec.com.au www.arasec.co.nz
ACT 1/9 Lithgow St, Fyshwick ACT 2609
NSW Head Office Level 1, 10 Bridge Rd, Stanmore NSW 2048
Unit 8/8-20 Hotham Pde, Artarmon NSW 2064
H145/28 Lexington Dr, Bella Vista NSW 2153
QLD 2/41 Lavarack Ave, Eagle Farm QLD 4009
SA 59 Goodwood Rd, Wayville SA 5034
VIC 93 Cook St, Port Melbourne VIC 3207
WA 14 Kenhelm St, Balcatta WA 6021
NEW ZEALAND 7/9 General Gates Ave, Kerikeri 0230
608A Rosebank Rd, Avondale 1026
Unit E2, 63 Marsden St, Lower Hutt Wellington 5042
4 Clayton St, Newmarket Auckland 1023
94
The ARA Group

aragroup.com.au
AUS 1300 233 305 NZ 0508 272 732


