25
Academic Excellence Indicator System (AEIS) 2011-2012 Annual Report and Public Hearing Webb CISD 1
| Date post: | 01-Jan-2016 |
| Category: |
Documents |
| Upload: | lucas-jenkins |
| View: | 214 times |
| Download: | 0 times |

1
Academic Excellence Indicator System (AEIS)
2011-2012Annual Report and Public Hearing
Webb CISD

2
The Academic Excellence Indicator System report describes the educational performance of a District and each campus in the District.
It is intended to inform the public about the educational performance of the District and of each campus in relation to the district, the state, and a comparable group of schools.
What is the AEIS report?

3
Due to the lack of state assessment results for most grades and no accountability information, the AEIS reports are substantially reduced for 2011-12.
STAAR
No STAAR results are shown on the 2011-12 AEIS reports, since performance standards have not been determined yet for the grades 3 – 8 STAAR assessments
Changes to 2011 – 2012 AEIS Report

4
TAKS by grade: Performance is shown only for grades 10 & 11.
TAKS (Sum of All Grades Tested): shown for grades 10 & 11
TAKS Commended Performance: shown for grades 10 & 11 only
TAKS – Indicators that changed:

5
TAKS-M: Results on the TAKS-M assessments are included in the TAKS indicators and also shown separately, for grades 10 & 11 only.
TAKS-Alt: The TAKS-Alt was not available for the 2012 TAKS administration.
TAKS – Indicators that changed

6
No Prior Year: Only one year of data (spring 2012) is shown
TAKS Participation: No participation report is available for 2011-12.
Progress of Prior Year TAKS Failers: Performance is shown only for grades 10 & 11.
TAKS Performance of Mobile Students (state report only): Performance is shown only for grades 10 & 11.
TAKS – Indicators that changed

7
ECE
Pre
K
Kind
er 1st
2nd
3rd
4th
5th
6th
7th
8th
9th
10th
11th
12th
0
5
10
15
20
25
30
35
2011-2012 Webb CISD Enrollment
8
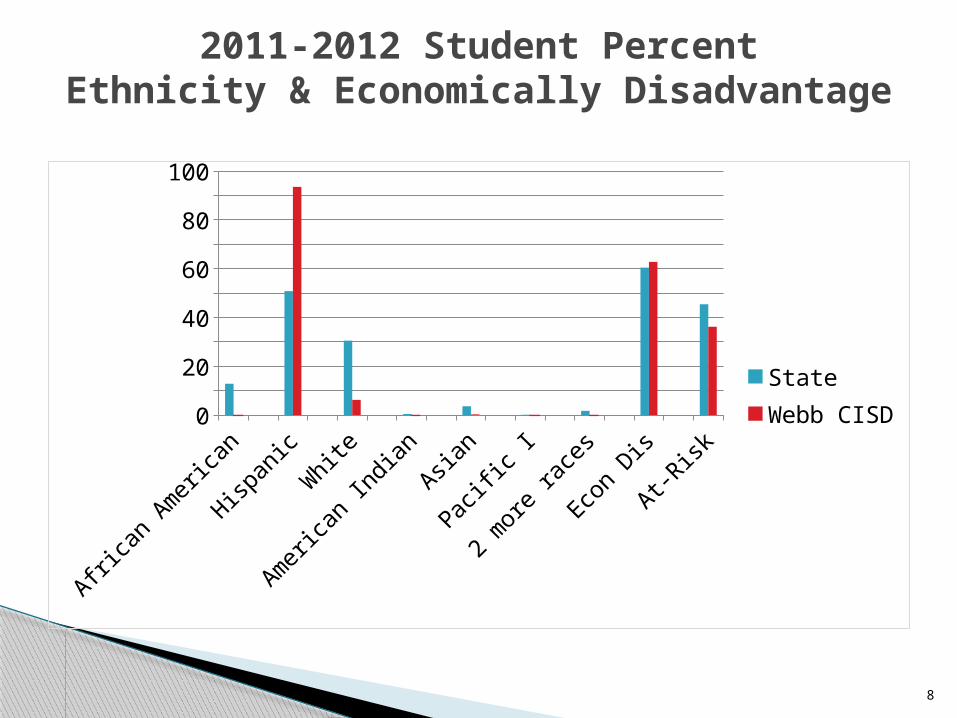
Afric
an A
mer
ican
Hispa
nic
Whi
te
Amer
ican
Indi
an
Asia
n
Pacific
I
2 m
ore
race
s
Econ
Dis
At-R
isk
0
20
40
60
80
100
StateWebb CISD
2011-2012 Student PercentEthnicity & Economically Disadvantage
9
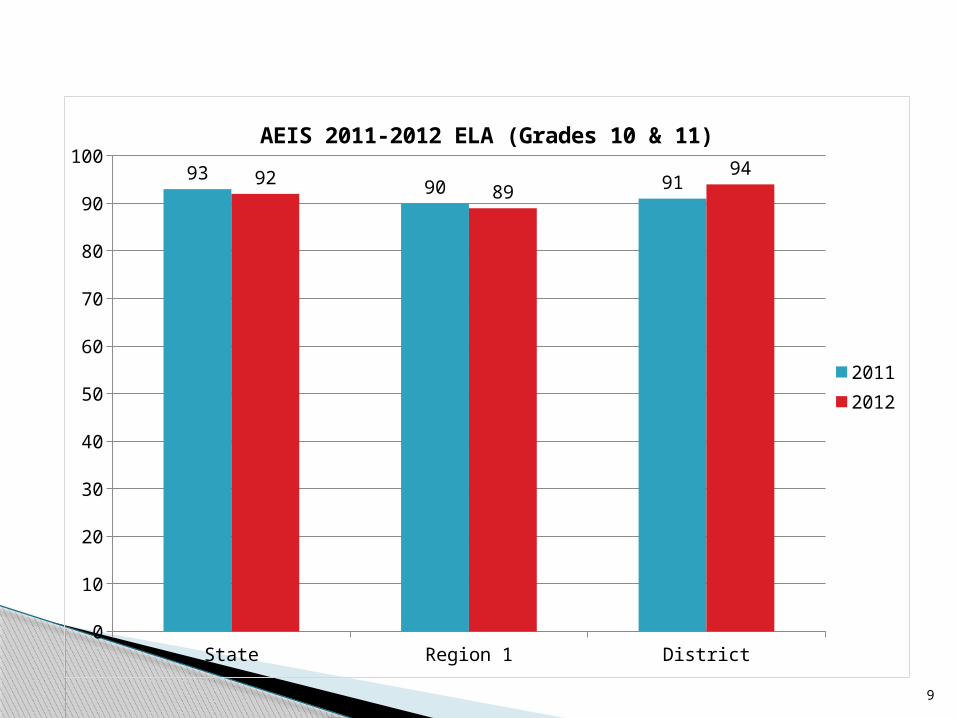
State Region 1 District0
10
20
30
40
50
60
70
80
90
10093
90 919289
94
AEIS 2011-2012 ELA (Grades 10 & 11)
20112012

10
State Region 1 District0
10
20
30
40
50
60
70
80
90
100
82 80 8282 81 81
AEIS 2011-2012 Math (Grades 10 & 11)
20112012

11
State Region 1 District0
10
20
30
40
50
60
70
80
90
100
8377 75
8480
75
AEIS 2011-2012 Science (Grades 10 & 11)
20112012

12
State Region 1 District0
10
20
30
40
50
60
70
80
90
100 96 94 9696 94 92
AEIS 2011-2012 Social Studies (Grades 10 & 11)
20112012

13
Reading Mathematics Writing Science Social Studies0
10
20
30
40
50
60
70
80
90
100
63 63
0
38
50
Webb CISD AEIS 2012 Special Education

14
State Region 1 Webb CISD
95.2
95.3
95.4
95.5
95.6
95.7
95.8
95.9
96
96.195.5
95.5
96
95.7
95.6
95.5 2009 - 2010
2010 - 2011
District, Region, StateAttendance Rate

15
State Region 1 District0.0%
10.0%
20.0%
30.0%
40.0%
50.0%
60.0%
70.0%
80.0%
90.0%
100.0%
26.3%30.3%
48.0%
30.3% 31.6%
14.0%
College Readiness IndicatorAdvance Course/Dual Enrollment Completion
20112012

16
State Region 1
Webb CISD
0
20
40
60
80
100
1208
2.7
91
.8 95
80
.1
90
.08
10
0
20102011
College Readiness IndicatorRHSP/DAP Graduates

17
State Region 1 Webb CISD
0
5
10
15
20
25
3022.7 24.9
20
24 24.6
7.7
20102011
College Readiness IndicatorsAP/IB Tested

18
Class of 2010 Class of 20110
10
20
30
40
50
60
70
80
90
100
66% 64%
56%53%
90%
72%
StateRegion IWebb CISD
College Ready GraduatesEnglish Language Arts

19
Class of 2010 Class of 20110
10
20
30
40
50
60
70
80
90
100
64% 67%
58% 61%
75%72%
StateRegion IWebb CISD
College Ready GraduatesMathematics

20
Class of 2010 Class of 20110
10
20
30
40
50
60
70
80
90
100
52% 52%42%
42%
75% 72%
StateRegion IWebb CISD
College Ready GraduatesBoth Subjects

21
0 Years 1- 5 Years 6- 10 Years 11- 20 Years Over 20 Years
4.6%
28.7%
22.3%
26.6%
17.9%
0.0%
14.3%
12.0%
38.3%
35.5%
Teachers Percent by Years of Experience
State
District

22
2010 - 2011 2011 - 2012
11.9%12.6%
8.3%
11.2%
Turnover Percent Rate for Teachers
StateDistrict
23
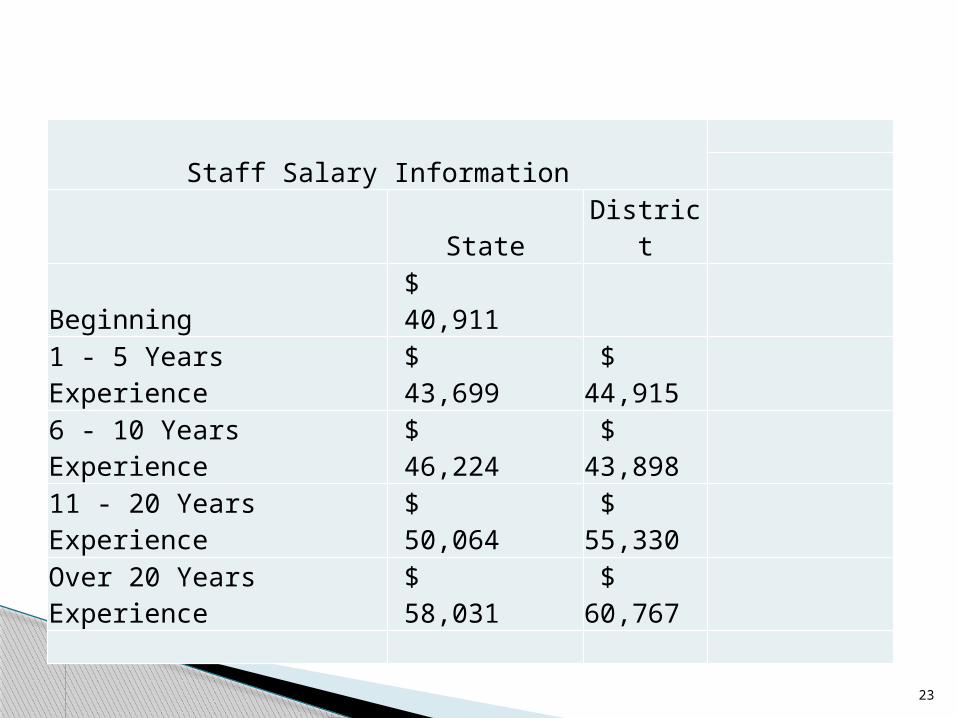
Staff Salary Information
State District
Beginning $ 40,911
1 - 5 Years Experience $ 43,699
$ 44,915
6 - 10 Years Experience $ 46,224
$ 43,898
11 - 20 Years Experience $ 50,064
$ 55,330
Over 20 Years Experience
$ 58,031
$ 60,767

24
Financial Information
Calendar year 2011 Tax Information
Adopted Tax Rate State District
Maintenance & Operations: 1.068 0.803
Interest & Sinking Fund#: 0.176 0.049
Total Rate (Sum of Above): 1.244 0.852
Note: Total Rate has not changed since 2007.
Fund Balance
Fund Balance (End of Year 2010 - 2011 audited):
$ 58,910,905

25
The report is available:
TEA websitehttp://ritter.tea.state.tx.us/cgi/sas/broker
District websitehttp://www.laredoisd.org/
Campus libraries or offices
Accessing the AEIS Reports


