35
ANNUAL REPORT FY2014 For the year ended March 31, 2015
ANNUALREPORT
FY2014For the year ended March 31, 2015
1CHIYODA CORPORATION ANNUAL REPORT FY2014
Note: Yen amounts are rounded down to the nearest million and percentages are rounded to the nearest unit.
Financial Highlights
Years Ended March 31, 2015, 2014, 2013, 2012, and 2011
2015 2014 2013 2012 2011
For the Year (Millions of Yen)
Revenues ¥480,979 ¥446,147 ¥398,918 ¥254,675 ¥247,082
Cost of revenue 435,327 404,685 356,402 215,783 215,563
Operating income 21,466 21,079 25,113 24,197 17,544
Income before income taxesand minority interests 22,012 22,538 26,747 23,543 11,476
Net income 11,029 13,447 16,077 14,364 7,979
At Year-End (Millions of Yen)
Total assets ¥515,839 ¥475,288 ¥435,379 ¥365,795 ¥353,392
Total equity 208,405 198,031 189,356 168,737 155,758
Current ratio (%) 151.0 156.3 166.3 165.5 173.8
Per Common Share (Yen)
Earnings per share (EPS) ¥42.58 ¥51.91 ¥62.06 ¥55.44 ¥30.79
Book value per share (BPS) 796.89 758.31 727.24 648.95 599.15
Dividend per share 13.0 16.0 19.0 17.0 11.0
Ratios (%)
Return on assets (ROA) 4.5 5.0 6.4 6.6 4.6
Return on equity (ROE) 5.5 7.0 9.0 8.9 5.3
Forward-Looking Statements: This annual report contains forward-looking statements about Chiyoda Corporation’s outlooks, plans, forecasts, results and other items that may take place in the future. Such statements are based on data available as of July 1, 2015. Unknown risks and other uncertainties that happen in the future may cause our actual results to be different from the forward-looking statements contained in this report. The risks and uncertainties include business and economic conditions, competitive pressure, changes in laws and regula-tions, addition or elimination of products, and exchange rate fluctuation, among others.
Revenues Operating Income Net Income
01 Financial Highlights02 At a Glance03 To Our Shareholders04 Management’s Discussion and Analysis06 Topics
08 Commitment to CSR12 Corporate Governance14 Corporate Information16 Directors and Officers17 Stock Information
Prof i le
Contents
Founded in 1948 in the post war period to reconstruct Japan, Chiyoda started its engi-
neering business for domestic projects mainly in petroleum refining, gas processing and
petrochemical fields, and expanded into overseas projects in the 1960s. Since then, Chiyoda
has been and is growing steadily under the corporate philosophy of enhancing its business
by aiming for harmony between energy and the environment and contributing to the
sustainable development of society.
Aiming to raise corporate value, the Group announced in 2013 a four-year business
plan, “Seize the moment, Open up new frontiers”. The Medium-Term Management Plan
includes a growth strategy and an operating foundation strategy. The Group aims to
maintain growth as a constant provider of the value and service required by society and
customers, by identifying the current trend. The operating foundation strategy provides the
base for achieving the sustainable growth of the Group.
The management team and employees of the Group will adhere to Compliance, Health,
Safety and Environment (HSE) and risk management to fulfil Corporate Social Responsibility
(CSR) when implementing each action plan.
Courtesy of Mizushima LNG Co., Ltd.
0
100
200
300
400
500
600
700
800
Billions of yen
2011 20132012 2014 2011 20132012 2014 2011 20132012 20142015 2015 2015
Billions of yen Billions of yen
0
10
20
30
0
5
10
15
20
25
30
247.1 254.7
398.917.5
24.2 25.1
8.0
14.416.1446.1
21.1
13.4
481.0
21.5
11.0
0
100
200
300
400
500
600
700
800
Billions of yen
2011 20132012 2014 2011 20132012 2014 2011 20132012 20142015 2015 2015
Billions of yen Billions of yen
0
10
20
30
0
5
10
15
20
25
30
247.1 254.7
398.917.5
24.2 25.1
8.0
14.416.1446.1
21.1
13.4
481.0
21.5
11.0
0
100
200
300
400
500
600
700
800
Billions of yen
2011 20132012 2014 2011 20132012 2014 2011 20132012 20142015 2015 2015
Billions of yen Billions of yen
0
10
20
30
0
5
10
15
20
25
30
247.1 254.7
398.917.5
24.2 25.1
8.0
14.416.1446.1
21.1
13.4
481.0
21.5
11.0
(Billions of yen) (Billions of yen) (Billions of yen)

2 3CHIYODA CORPORATION ANNUAL REPORT FY2014 CHIYODA CORPORATION ANNUAL REPORT FY2014
Puerto La Cruz
Cameron LNGUSA/LNG
Freeport LNGUSA/LNG
FEED*****/Feasibility Study EPC*/EPCm**/EPsCm***/EPCI****
Titanium Sponge PlantSaudi Arabia/Metal
Yamal LNGRussia/LNG
Laffan Refinery Phase 2 Project
Long Term Service Agreement (RasGas/Qatargas/Shell) Qatar/LNG, GTL
Ichthys LNGAustralia/LNG
Long Term Service Agreement Shell Asia/Downstream
Jangkrik FPU Indonesia/Offshore
Nghi Son Refinery
LNG CanadaCanada/LNG
Mozambique LNG Area 4Mozambique/LNG
Abadi LNGIndonesia/FLNG
Tangguh Tr. 3Indonesia/LNG
New Ulaanbaatar International AirportMongolia/Infrastructure
Golden Pass LNGUSA/LNG
Alaska LNGUSA/LNG
Mozambique LNG Area 1Mozambique/LNG
New Bohol AirportPhilippines/InfrastructureRAPIDMalaysia/Re�nery & Petrochemical
LNG
Gas Processing*1
Petroleum and Petrochemicals
Fine Industries*2
Others
54
8
22
98
7
74
75 8
12
78
2
52
At a Glance
Major Projects in Progress
To Our Shareholders
(As of June 2015)
*1: Classified as “Other Gas Related Works” in “Consolidated Financial Results” *2: Classified as “General Chemicals/Industrial Facilities” in “Consolidated Financial Results” *3: Courtesy of ExxonMobil PNG Limited *4: Courtesy of Shell *5: Courtesy of Solar Frontier K.K. *6: Courtesy of Kashima Aromatics Co., Ltd.
* EPC: Engineering, Procurement and Construction** EPCm: Engineering, Procurement and Construction management*** EPsCm: Engineering, Procurement support and Construction management**** EPCI: Engineering, Procurement, Construction and Installation***** FEED: Front-end Engineering and Design
Revenues New Orders Backlog of Contracts
481.0Billion yen
257.9 (54%)
38.0 (8%)
106.7 (22%)
41.9 (9%)
36.5 (8%)
746.8Billion yen
550.8 (74%)
49.6 (7%)
49.1 (7%)
39.6 (5%)
57.7 (8%)
1,416.9Billion yen
1,103.0 (78%)
33.3 (2%)
170.0 (12%)
33.1 (2%)
77.6 (5%)
Thank you for your continued support over the past 12 months.
We present Chiyoda Group΄s corporate overview for the fiscal year ended March 31, 2015, the
halfway our Medium-Term management Plan entitled “Seize the moment, Open up New Frontiers”.
As a result of implementing various measures in accordance with the growth strategies and
operation foundation strategies defined in the Plan, we have achieved impressive results, especially
in the LNG and gas related field, or our core business. An LNG plant in Papua New Guinea, and LNG
receiving terminal projects in Japan were successfully completed. Now we are moving forward
with the EPC works in Australia, the USA, Russia and Japan. All of them are progressing steadily.
As the global market environment in this field is becoming more uncertain in the short-term, we
have to carefully explore the possible market opportunities while continuing to build our technical
expertise to strengthen and maintain our competitiveness.
In the Petroleum, Petrochemicals and Gas chemical field, which is also our core business, we
have maintained stable operations. Several projects in Japan and a large scale complex in Saudi
Arabia have also been completed successfully. In this field, the Group will aim to earn handsome
profits by implementing measures to select and concentrate on business opportunities in Asia and
the Middle East and by seeking projects which inevitably require our own technologies.
In the new business field in which we have been taking several measures, we have achieved
good results including two EPC contracts for an airport as social infrastructure and an Engineering,
Procurement, Construction and Installation (EPCI) contract in the offshore/upstream field. The Group
will continue and accelerate the business development to produce more profits early.
In the pharmaceutical industry, the Group was newly awarded EPC works for manufacturing
facilities of active pharmaceutical ingredients and vaccines. The Group aims to advance into the life
science field by enhancing our function to provide advanced solutions.
In these two years, the business environment surrounding the Group has changed drastically,
such as a plunge in oil prices. Now is the time for the Group to “seize the moment”, create new
added value and “open up new frontiers.”
We have decided to pay a dividend of ¥13 per share, in line with our earnings for the fiscal
year 2014.
We ask all of our shareholders for your continued support in our ongoing efforts.
June 2015
*3
*4
*5
*6
Shogo Shibuya President & CEOChiyoda Corporation

4 5CHIYODA CORPORATION ANNUAL REPORT FY2014 CHIYODA CORPORATION ANNUAL REPORT FY2014
Results of Operations
Analysis of Results
The global economic environment surrounding the Chiyoda Group has become more increasingly uncertain during
this fiscal year, mainly due to economic slowdowns in several regions, geopolitical fears and a plunge in crude oil prices
in the latter half of this fiscal year, while the US economy has continuously been relatively stable. Notwithstanding the
positive outlook for long-term future global energy demand, near-term investment decision making in numerous oil and
gas-related facilities is becoming unpredictable. The recovery of the Japanese economy is only moderate as demand has
not fully recovered following the increase of consumption tax, despite government fiscal and monetary policies easing
and the depreciation of the Yen in global financial markets.
Under such circumstances, the Group has continued to strengthen its core business in the conventional fields of oil
and gas, according to strategies defined in its Medium-Term Management Plan. In parallel, the Group has accelerated
expansion in new business spheres including offshore and upstream business, new and renewable energy, such as the
Hydrogen Supply Chain, utilizing Chiyoda s own technologies, and solar power generation utilizing photovoltaic and
concentrating solar power technology.
Ongoing projects including LNG plants in Australia, the USA and Russia, refinery projects in Vietnam, Qatar and
Venezuela, the Mongolian international airport project and LNG receiving terminals and photovoltaic power generation
systems in Japan have all progressed properly.
Consequently, consolidated new orders for the fiscal year amounted to 746,791 million yen (26.6% increase
year on year). The backlog and revenues were 1,416,901 million yen (32.1% increase) and 480,979 million yen (7.8%
increase) respectively.
The operating income amounted to 21,466 million yen (1.8% increase), ordinary income to 22,271 million yen (2.5%
decrease year on year), and net income resulted in 11,029 million yen (18.0% decrease).
The decrease in incomes resulted from the increase in selling, general and administrative expenses, equity in
losses of associated companies, delays in recovery of overseas subsidiaries and reversal of deferred tax assets due to
tax rate reduction.
Results by Business Segment
LNG Plants/Other Gas Related WorksThe Group has been moving forward with the EPC works for LNG plants in Australia, the USA and Russia, and Front End
Engineering Design (FEED) works in Indonesia, Mozambique, Canada and the USA, all of which have progressed properly.
Our Qatari subsidiary has been executing Engineering, Procurement and Construction management (EPCm) works for
the maintenance and modification of existing LNG and gas processing plants, most of which were originally built by the
Group. In Japan, two LNG receiving terminal projects have been completed and a further one is in the execution phase.
Modification studies and construction works for existing plants have been awarded and under execution. The Group will
continue to pursue opportunities within LNG plants and other gas-related fields as the Group s core business, whether
onshore or offshore, overseas or domestic, and conventional or unconventional.
Petroleum/Petrochemicals/Gas ChemicalsThe Group was awarded an Engineering, Procurement, Construction and Commissioning (EPCC) contract for a Residue
Fluid Catalytic Cracking (RFCC) plant in Malaysia. EPC works have been ongoing for a refinery and petrochemical complex
in Vietnam, a refinery project in Qatar and the Engineering, Procurement support and Construction management (EPsCm)
work for heavy crude oil upgrading facilities in Venezuela. Additionally, our subsidiary in Singapore has been performing
Management’s Discussion and Analysis
project management services under an Enterprise Framework Agreement for downstream projects within Asia. In Japan,
we have completed an EPC work for a Trans-Alkylation Unit and continued to perform diagnosis of existing facilities,
maintenance and upgrading works, studies and construction works aimed at energy saving in the facilities, and studies
to strengthen the infrastructure of a refinery against possible catastrophe damage.
Mining/Mineral Refining/General Chemicals/Industries/EnvironmentThe Group has been moving forward with an EPC execution of the international airport in Mongolia and newly
awarded one in the Philippines, and the preparation of tenders for future transport infrastructure projects. In
an effort to expand its business into medium-small sized water treatment systems, the Group is operating a
demonstration plant for an industrial wastewater treatment/water recycling system in Saudi Arabia and is estab-
lishing a framework within the Group to execute these works in the Middle East and Asia. Meanwhile, we are
also responding to the expansion in demand of overseas Japanese clients΄ businesses in non-hydrocarbon fields.
In Japan, the Group has been awarded a number of EPC works for large-scale photovoltaic power generation
systems and further business opportunities are expected in this field. In pharmaceutical industry, the Group
was newly awarded EPC works for manufacturing facilities of active pharmaceutical ingredient and vaccine. The
Group also executed several EPC works for manufacturing facilities of active pharmaceutical ingredients and
nanotechnology research development facilities in cooperation with industry, government and academia.
New Business FieldsThe Group, in cooperation with our strategic alliance partner Xodus Group, has started providing integrated services in the
offshore/upstream field especially for Japanese customers. The EPCI execution of a floating production unit in Indonesia is
in progress. The Group is actively proceeding with business activities in the Subsea/Subsurface Engineering field. As part of
this strategy, the Group has formed a new joint venture company with Xodus Group and Saipem International BV in order to
enter into the subsea engineering business, while the Group also invested in a company established to develop commercially
viable technology for exploiting seabed methane hydrate. As for the concentrating solar power system, the Group continues
to operate a demonstration plant in Italy with the aim of developing business opportunities in this field. Furthermore, we
have developed our own technology to transport and deliver large volumes of hydrogen and are actively collaborating with
various parties in order to establish a hydrogen supply chain to achieve a hydrogen-based society.
Moreover, the Group is considering to focus newly on the growing market for life science field symbolized by iPS cells,
applying our pharmaceutical and medical technologies.
With its highest backlog of contracts, the Group will continue to work diligently on the execution of existing
large projects in Australia, Russia and U.S. which enhance its core business. To materialize The Medium-Term
Management Plan, the Group will also continue to accelerate our growth strategy to diversify the business portfo-
lio by expanding new business fields.
In consideration of these circumstances, and assuming an exchange rate of ¥120/dollar, our forecasts for the
fiscal year ending March 31, 2016 include 350.0 billion yen in consolidated new contracts and 600.0 billion yen
in revenues. Our forecast for the consolidated operating profit is 20.0 billion yen, consolidated ordinary income is
22.0 billion yen, and the consolidated net income is 12.0 billion yen.
Outlook for the Next Fiscal Year

6 7CHIYODA CORPORATION ANNUAL REPORT FY2014 CHIYODA CORPORATION ANNUAL REPORT FY2014
North America/Challenges in LNG Business
EPC projects in the USA, which were awarded last
year, started smoothly and ground breaking cere-
monies were held for Cameron LNG and Freeport
LNG respectively. The Group is performing at the
forefront FEED works for Golden Pass LNG and
LNG Canada, and a feasibility study for Alaska
LNG, all of which are expected to be potential
EPC targets.
Aiming to carry out each project properly, we
have established a scheme including the alliance
with local partners and carefully worked out each
individual construction plan. As we are entering the field construction stage, we will reinforce our execution scheme and
plan to improve efficiency through measures such as positive adoption of a modular construction method to achieve
successful completion.
Having anticipated the complicated situations because of the simultaneous execution of several mega projects
in North America, we are enhancing our scheme of the Group as a whole for North America. The scheme is intended
to carry out those projects efficiently while preparing the environment for producing a synergy effect with operation
foundation strategies implemented according to our Medium-Term Management Plan.
Philippines/Awarded the New Bohol Airport
In March, the Group and joint venture partner, Mitsubishi Corporation (MC) had reached an agreement with the
Department of Transportation and Communications of the Government of the Republic of the Philippines to construct
the New Bohol Airport in the Philippines.
The New Bohol Airport will have facilities such as a 2000-meter runway, a passenger terminal building which can
accommodate 1 million passengers annually, and airport special equipment. Built under the “Eco Airport” concept
and employing advanced Japanese technology, the airport will be furnished with a photovoltaic power generation
system and a filtering system to avoid polluting the surrounding environment by drainage during the construction.
It is the second airport construction project jointly executed by “Chiyoda
and MC,” the first being the new Ulaanbaatar International Airport project in
Mongolia, now under construction. As an integrated engineering company,
the Group will continue to explore its business opportunities in the trans-
portation infrastructure industry, including the airport sector.
Mozambique/Qatar/Saudi Arabia/UAE/ Engineering Training for Young Engineers from Overseas
Since 1970s, the Group has been accommodating over 4,100 engineers as trainees from overseas for engineering train-
ing, and in 2014, 34 engineers were trained from countries such as Mozambique, Qatar, Saudi Arabia and UAE.
Nowadays, the demand for such human
resources development is even more increasing,
especially in the oil and gas producing countries.
The training provided by the Group is intended to
meet such demand, and the trainees were given
a chance to understand the Japanese people and
culture as well, which we believe is meaningful.
The Group will work constantly on
human resources development, expecting
to strengthen the relationship with countries
worldwide.
Japan/Commitment to CSR
As an integrated engineering company, the Group pledges to contribute to the sustainable development of society
through its business activity including the construction of energy plant and social infrastructure, and to take a variety
of social contribution activities such as supporting human resources development. In addition to our contribution from
our business activity, the Group constantly conducts CSR activities, for example, dispatching volunteers to the disaster
affected areas by the Great East Japan Earthquake, inviting vision-impaired people
to a Japan Philharmonic Orchestra Concert and sale of goods made by challenged
people (Heart-made Sale), both in collaboration with the Yokohama City Council
of Social Welfare, and supporting educational programs for elementary school and
junior high school.
Moreover, the Group has continuously supported and will continue to support
the spirit of the United Nations Global Compact (UNGC) which is a voluntary global
initiative that encourages businesses to act as good corporate citizens and achieve
sustainable growth.
Topics
Scene from the Heart-made Sale

8 9CHIYODA CORPORATION ANNUAL REPORT FY2014 CHIYODA CORPORATION ANNUAL REPORT FY2014
We strive to be a reliable company to our customers and other business partners by providing world-class technologies and knowledge.
-
● Initiatives for a stable supply of energy and reduction of greenhouse gas
● Plant construction that lives up to customer trust● Enhancement of information security awareness
We will work to remain an invaluable company to society by utilizing refined technologies to promote harmony between the global environment and eco-nomic and social activities. Environment
● Continuous research and development for a low carbon economy (energy conservation/effective utilization of CO2)
● Promotion of business development towards a hydro-gen-based society
● Expansion and promotion of renewable energy● Execution of environmentally friendly projects● Implementation of biodiversity preservation activities
Through our engineering business in Japan and overseas, we contribute to local communities in ways including human resources development, technol-ogy transfer and environmental protection. -
● Contribution to local economic development and human resource development
● Tie-ups and cooperation with educational institutions to educate the next generation
● Continuous response to the Great East Japan Earthquake● Cooperation with the community and NPO● Support to challenged people
We are dedicated to respecting the human rights of all people. We will create a corporate culture where the diversity, individuality and character of employ-ees are respected, where people are motivated to do their best, and of which employees and their families are proud.
Human Rights
/ Labor
● Creation of a pleasant work environment● Enhancement of the human resource development system● Enhancement of the safety culture● Enhancement of the crisis management system
We are dedicated to achieving even greater transpar-ency and stability by conducting our operations fairly in accordance with the highest ethical standards.
Anti-Corruption
● Review of the compliance program and execution of its brief explanation session to employees
● Assignment of a compliance manager in each division, group companies and project teams
● Continuous compliance training and monitoring● Continuous export control training and auditing● Operation of the consultation and reporting system
“Welcome to All about Compliance”
Activities in FY2014UN Global Compact
Chiyoda Group CSR Visions
Commitment to CSR
The Chiyoda Group’s CSR
◆ CT-CO2 AR®: High Efficiency Synthetic Gas Production Process Using CO2
Chiyoda Group has accomplished effective utilization of CO2 by developing a high-efficiency reforming process—CT-CO2
AR®—employing a novel catalyst. This catalyst was already commercialized in an existing synthetic gas plant last year,
exhibiting smooth and safe operation.
The technology, comprising a catalyst with high resistance to carbon formation, produces synthetic gas from natural
gas with higher efficiency than conventional reforming technology. It reduces energy consumption by around 10% and
reduces carbon dioxide emission drastically.
CT-CO2 AR® can not only reduce energy consumption by replacing the existing catalyst with a superior one, but can
also achieve remarkable environmental benefits when applied to grass-root plants. Furthermore, it leads to resource min-
imization by downsizing facilities, and is expected to effectively utilize the CO2 contained in natural gas.
The technology succeeds in greatly reducing the environmental burden from chemical plants, such as oxo-alcohols
and acetic acid.
◆ Commercialization of Hybrid Titania Catalysts for the Hydrodesulfurization (HDS) of Diesel Oil
The Group has successfully developed and commercialized the Hybrid Titania catalysts
by combining the advantages of titania, which has significantly high activity, and alu-
mina carriers, which have superiority in material.
We have already established both a production method for Hybrid Titania catalysts
and a supply system.
The Hybrid Titania catalysts, with high HDS activity and high hydrodenitrogenation
selectivity, are highly promising in hydrotreating difficult desulfurization oils such as
Light Cycle Oil (LCO) from Fluid Catalytic Cracking (FCC), thermal cracked oil and vac-
uum gas oil.
The Hybrid Titania catalyst was adopted for use in the HDS unit of the Yamaguchi
Oil Refinery of Seibu Oil Company, Limited in Japan. This refinery started to produce sul-
fur-free kerosene and diesel oil at the beginning of 2014.
◆ The Development of a New Manufacturing Process for Production of Propylene
Propylene, one of the basic industrial chemicals, is mainly produced by thermal
steam-cracking of hydrocarbon feedstock such as naphtha at present,and alter-
native methods are desired to improve both high energy consumption and low
propylene selectivity.
The Group has been developing an energy saving propylene manufacturing
process by means of fixed-bed-type catalytic cracking using our own zeolite
catalysts, and we have received high appraisal for the results and won the Best Paper Award in the Fuels & Petrochemical
Division of the American Institute of Chemical Engineers.
The Group will accelerate its research and development to commercialize this technology and contribute to saving
energy and reducing CO2 emissions by applying it to non-conventional fossil resources such as shale gas and oil.
Environmental Initiatives
A Reliable Company
Environmental Initiatives
Social Contributions through Business Activities
Respect for Human Rights
Commitment to Fairness
CSR Visions 1
CSR Visions 2
CSR Visions 3
CSR Visions 4
CSR Visions 5
As an integrated engineering company, the Chiyoda Group pledges to contribute to the sustainable development
of society through its business activities, and to constantly strive to increase corporate value and earn the trust and
understanding of all stakeholders by adhering to the following principles.

10 11CHIYODA CORPORATION ANNUAL REPORT FY2014 CHIYODA CORPORATION ANNUAL REPORT FY2014
◆ Establishment of a Safety Culture by Sharing On-site Practices
In order to share knowledge and expertise from both outside and inside Chiyoda about Safety, Quality and the
Environment (SQE), the Group has been holding a series of Corporate SQE Conventions.
In November 2014, the 7th Convention titled “Establishment of a Safety Culture by Sharing On-site Practices” was
a great success attended by more than 500 ardent participants including corporate management executives, where
the safety activities of the Papua New Guinea LNG Project (PNG) were introduced. Their methods and practices were
presented, then two-way communication in a pleasant atmosphere was demonstrated in front of the audience so that
everyone there could share one and the same understanding as the
members of the PNG Project, which has achieved the result of “over 65
million man-hours without lost time injury”, the best safety record in
Chiyoda’s history.
In this way, the Group will constantly make efforts to instill the corpo-
rate policy “Safety is a core value.”
◆ Activities on United Nations Global Compact (UNGC)
The Group has been supporting the principles of the UNGC for human rights, labor, environment and anti-corruption
to promote and enhance our CSR activities since November 2012. This year, as a member of the study groups in Global
Compact Network Japan on anti-corruption and supply chain management, the Group has discussed and studied how
to cope with the relevant global issues, and also assisted the Network Japan in the Roundtable conducted among Japan,
China and Korea by assigning language-aid staffers:● Anti-corruption:
Recognizing that corruption is a risk which will severely damage corporate
governance, trust and reputation in civil or administrative disposition and
criminal impeachment, effective measures are studied and discussed.● Supply Chain Management:
Through the attendance at monthly sessions or seminars by experts, the study
is deepened on how to promote CSR procurement in collaboration between
buyers and suppliers while respecting the environment, the workplace and human rights.
Continuous Social Contribution
The Group has been supporting its members to promote their social contribution in regional areas under the motto
of “CSR to be promoted by each as a participant”. As part of that, volunteer members of the Group employees have
been dispatched twice a year to the disaster-affected areas of the Great East Japan Earthquake.
This year, volunteer activities have included the interaction with kindergarten children through environmental
lessons, reforestation activities, supporting the community in developing an energy circulation system, supporting
the construction of a workplace for making regional products. Then, those products have been sold in the Group
in-house sale in Yokohama.
Furthermore, the Group΄s employees visited a junior high school in the area and gave a lecture to the students
on its global activities, and also accepted them on their school trip to Chiyoda Global Headquarters in Yokohama.
The Group constantly continues with its efforts to improve its activities by way of exchanging views with regional
experts or local residents, and through discussion among volunteer members including in-house questionnaires.
◆ Compliance Activities in 2014
In recent years broader and stricter requirements for compliance have been sought by the global community including
its clients, business partners. Chiyoda Corporation has reviewed and reinforced its overall compliance program to man-
age the Group-wide program as follows:
● To raise awareness and deepen knowledge of compliance through training courses and manuals among the employees.● To recognize and evaluate compliance risk our Group is faced with.● To implement preventive measures* for major risks with periodic reporting.● To review, improve and respond to the results by monitoring.● Chiyoda has launched its management system of PDCA cycle on a periodical basis to cope with compliance risk.
* Chiyoda applies due diligence when deciding on business partners including vendors, subcontractors and consultants in terms of anti-corruption including prevention of bribery to foreign public servants.
◆ Establishment of Corporate Risk Management Policy
The Chiyoda Group has established its Corporate Risk Management Policy. Under that Policy, the Group aims to pro-
mote the risk management activities and planning/implementing its Corporate Strategy, to maintain and enhance its
Corporate Value. The Group ensures that it discloses its business risk information to the stakeholders so as to increase
transparency, to mitigate the risk by taking proactive countermeasures, then to achieve the business target.
◆ Establishment of Business Continuity Plan (BCP)
In 2014, the Group established its BCP, anticipating various risks that would disrupt its business. The BCP provided the
direction and course of action in order to avoid such risks, or recover quickly even if such a disruption may occur, and was
known to all employees. When a disaster including a fire/an earthquake or any epidemic, terrorism/turmoil, occurs, and
if the impact on the Group is anticipated to be large enough to disrupt its Group business/operation, the Group imme-
diately declares the imposition of BCP. Then, based on the basic philosophy of “Employees’ safety First”, the Group makes
utmost efforts to continue its minimally required important business and to make a quick return to normal operation as
well as to contribute to the restoration of communities affected by such a disaster.
Respect for Human Rights Commitment to Fairness
Soil preparation for afforestation
Main Activities in FY2014 (Including Domestic Group Companies)
Dispatch of lecturers to university 16 people
Training for interns 67 people
Visiting seminars 7 times
Community cleanup campaigns 32 people
Food aid activity TABLE FOR TWO 1,817 meals
ECOCAP program to enable the purchase of vaccines For 231 people
Dispatch of volunteers to disaster-hit areas 37 people
Collaboration with NPO (Second Harvest Japan, Food Bank Yamanashi)
Support to challenged people• In-house sale events of goods made by challenged people: 7 times• Inviting 50 people from the Yokohama Blind Association to a concert

12 13CHIYODA CORPORATION ANNUAL REPORT FY2014 CHIYODA CORPORATION ANNUAL REPORT FY2014
Corporate Governance
The Chiyoda Group believes that CSR-oriented management that earns the support and trust of all its stakeholders,
including shareholders, customers, and employees, is the basis of its corporate activities. We are therefore working in var-
ious ways to enhance corporate governance and actively implement CSR-oriented management, including maintaining
transparency and soundness.
Corporate Governance System
Risk Management
Disaster Prevention Measures
Chiyoda has established the Compliance Unit and the Internal Audit Unit to raise the quality and transparency of manage-
ment, improve response to stakeholders and reinforce risk management and the compliance system. We also established
the Safety, Quality and Environmental (SQE) Unit and an internal control system directly linked to management.
To ensure speedy and accurate decision-making to deal with rapidly changing social and economic conditions,
Chiyoda has adopted the executive officer system, which separates the functions of directors, who are responsible for
management supervision, from those of executive officers, who are responsible for the execution of business operations.
The Board of Directors and Meetings of the Board of DirectorsThe Board of Directors is composed of 10 directors as of June 25, 2015. Important matters concerning the Company are
reported and resolved at meetings of the Board of Directors. The Executive Committee, made up of the four representative
directors, examines matters before they are submitted for resolution at meetings of the Board of Directors. It makes
decisions about business execution matters by unanimous resolution.
Audit & Supervisory BoardChiyoda has also adopted the corporate auditor system. The Corporate Auditors Committee is made up of three outside
corporate auditors who closely monitor the execution of duties by directors and executive officers. The corporate auditors
attend meetings of the Executive Committee and express their opinion when necessary. In addition, their responsibilities
include deciding the content of resolutions submitted to the General Meeting of Shareholders, such as the appointment
or dismissal of accounting auditors, auditing consolidated financial documents in close cooperation with the accounting
auditors, and preparing audit reports.
Executive Officer SystemWhere necessary, executive officers cooperate with outside specialists such as corporate lawyers in carrying out duties
assigned to them at meetings of the Board of Directors and the Executive Committee. Executive officers provide regular
progress reports at executive officer and Executive Committee meetings attended by directors and corporate auditors.
Reinforcing Internal ControlsThe Chiyoda Group constantly conducts self-assessments of existing internal control functions and reinforces internal con-
trol systems. In addition, the Group has established the Internal Audit Unit as an autonomous unit to perform evaluations.
Chiyoda has a system in place for auditing the development and operation of a suitable overall internal control framework
and constituent components, and for submitting reports to the Executive Committee.
• To ensure the transparency of information and raise the effectiveness of audits, Chiyoda aims to establish an integrated
framework of internal controls and a real-time monitoring system for senior management.
• To prevent insider trading, an information management system is in place that encompasses Group companies. All
important information is appropriately reported to the Board of Directors and the Executive Committee.
To manage individual project risk and profitability, the Group is increasing management transparency by implementing a
double-check/internal control function in administration divisions in addition to a self-auditing system in project operation
divisions. Professional auditing teams from administration divisions have effectively implemented project audits to verify
the validity of the project execution plans formulated by the project operation divisions.
In accordance with our Corporate Risk Management Policy, the Group has established risk management and crisis
management systems to deal with significant risks and has appointed risk managers and crisis managers. We constantly
work to prevent the occurrence of problems. In the event that a problem occurs, we shall immediately activate a Crisis
Control Center that will minimize damage by mobilizing the entire workforce.
Corporate Governance and Internal Controls
The Group has prepared Disaster Response Manual (Japanese and English versions) as part of its BCP. The Manual compiles
the actions to be taken in the event of a disaster by those working in the Group including all the directors, employees,
temporary staff members, customers and partners, and so on. Once a disaster occurs, the Chiyoda Disaster Prevention
Force is to be formed, and an emergency communication route is also to be set up to confirm the safety of all the above
personnel and their family members as a first priority.
Further to be prepared for a disaster, the Group has been taking the following measures:
• Stock of emergency supplies such as PHS, drinking water, foods, blankets
• Provision of helmets and emergency bags to all the personnel
• Formation of self-protective disaster prevention unit
• Participation in an emergency drill to be conducted twice a year both in Chiyoda Global Headquarters and in Koyasu
Office & Research Park
• Safety confirmation drill to be conducted a few times a year
Global Operation Unit
Corporate Planning Unit Corporate Services Unit, HRM* UnitFinance & Accounting UnitLegal & Project Audit Unit
General Shareholders’ Meeting
Executive O�cers
Executive O�cer Meeting
4 Representative DirectorsCompliance Committee
Department Internal Controls
Business Execution Departments(Risk Manager)
Self-Assessment
Financial Audit
Executive Committee
Election
ElectionElection
Election ReportReport
Report
ReportSubmit/Report
Submit/Report
Submit/Report
Organization Sta�ng
Scheduled Reports (deliverables, etc.)
(advice) Submit/Report
Submit/Report
Audit ReferralSupervision
Survey, Report Request
Election
Directors
Board of Directors Corporate Auditors
Audit & Supervisory Board
Accounting Auditor
GroupCompanies
*HRM: Human Resource Management
Internal Controls Management Committee
(ICMC)
Internal Audit UnitRisk Management Division
SQE Unit
Compliance Unit
Crisis Management Unit(Crisis Manager)
■ : Departments with internal control functions■ : Important organizations and arms of the Company
AuditAudit

14 15CHIYODA CORPORATION ANNUAL REPORT FY2014 CHIYODA CORPORATION ANNUAL REPORT FY2014
Corporate Information (As of March 31, 2015)
Corporate Data Global Network
Chiyoda Global HeadquartersMinato Mirai Grand Central Tower4-6-2, Minatomirai, Nishi-ku, Yokohama 220-8765, JapanTel: (81)45-225-7777 (voice guidance)
EstablishedJanuary 20, 1948
Paid-in Capital¥ 43,396 million
Number of Employees1,573 (Non-Consolidated)6,097 (Consolidated)
Annual Fiscal CloseMarch 31
Shareholders’ MeetingJune
Chiyoda’s global network enables Project Lifecycle Engineering to be offered all over the world. Chiyoda has expanded
its network in order to provide prompt support for customers’ business activities on a global scale. Our services cover
the entire life cycles of projects – from planning, engineering, procurement and construction through to operation and
maintenance. With a view to meeting the ever-changing needs of our customers, we offer services by utilizing local
offices and group companies with thorough knowledge of the latest local and global circumstances in countries around
the world.
Audit & Supervisory BoardBoard of Directors
Executive Committee
President
Executive O�ce UnitInternal Audit Unit
Project Administration UnitProject Management UnitIT Management UnitGlobal Operation Unit
Global Project Management Division
Global Human Resource Planning UnitWork Process Innovation Task TeamChiyoda Globalization Task Force Team Change the Mindset
SQE UnitCompliance UnitCrisis Management Unit
Risk Management Division
O�shore & Upstream Business Planning UnitO�shore & Upstream Business Operation Unit
O�shore & Upstream Project Operations
Gas & LNG Project Unit No. 1
Gas & LNG Project Operations No. 1
Strategic Project Development Unit
Gas & LNG Project Unit No. 2
Gas & LNG Project Operations No. 2
Downstream & Non Hydrocarbon Project Operations
ChAS/Life Science Business Planning & Administration UnitChAS Marketing Unit Advanced Process Engineering Unit
ChAS & Life Science Project Operations
Plant Diagnosis UnitConsulting UnitPharmaceutical Industries Project UnitSpace & Bio Engineering Unit
Engineering Operation UnitGas & LNG Process Engineering UnitRe�nery, Petrochemical & New Energy Process Engineering UnitIntegrity Management Unit
Technology & Engineering Division
Mechanical Engineering UnitControl System Engineering UnitElectrical System & Smart Grid Engineering Unit Piping Engineering UnitCivil Engineering Unit
PLC* Planning & Administration UnitProcurement UnitConstruction UnitCommissioning Unit
Project Logistics & Construction Division
Corporate Planning UnitIR, PR & CSR Section
Corporate Services UnitHRM* UnitFinance & Accounting Unit
Corporate Planning & Management Division
Legal & Project Audit Unit
HRM: Human Resource Management PLC: Project Logistics & Construction IP: Infrastructure Project
Strategic Business Planning & Administration Unit
Corporate Relations Sec.Business Development Unit 1Business Development Unit 2Business Development Unit 3Energy Infrastructure Planning Unit
Business Development Division
IP* Planning & Administration UnitStrategic Business & Investment Management Unit
Infrastructure Project Operations
Green Infrastructure Project Unit
Technology Development Unit Environmental Project Unit
Research & Development Center
Hydrogen Supply Chain Development Unit
Downstream & Chemical Project Unit International Downstream Project UnitMetals & Mining Project Unit Global Collaboration Unit
Sales Base Engineering Center
Procurement Center
Operation Support
Project Execution Base
Abu Dhabi O�ce
Chiyoda-CCC Engineering (Pte) Limited
Bangalore O�ce
Chiyoda Oceania Pty Limited
Chiyoda Philippines Corporation
Chiyoda Corporation Netherlands B.V.
Milan Representative O�ce
Beijing O�ce
Chiyoda & Public Works Co., Ltd.
Chiyoda Corporation (Shanghai)
Korea Representative O�ce
Chiyoda International Corporation
Middle East Headquarters Doha O�ce
Chiyoda Almana Engineering LLC
Chiyoda Petrostar Ltd.
L&T-Chiyoda Limited
Chiyoda Mozambique Limitada
PT. Chiyoda International Indonesia
Chiyoda do Brasil Representações Ltda.
Chiyoda Human Resources International (Pte) Limited
Chiyoda Singapore (Pte) Limited
Chiyoda Malaysia Sdn. Bhd.
Chiyoda Sarawak Sdn. Bhd.
Chiyoda (Thailand) Limited
Xodus Subsea Ltd.
Xodus Group (Holdings) Ltd
USA
Brazil
Japan<Chiyoda Global Headquarters>
Korea
China
MyanmarThailandMalaysia
Singapore
Indonesia
Australia
IndiaUAE
QatarSaudi Arabia
Italy
The NetherlandsUK
Philippines
Mozambique
Organization Chart
Chiyoda’s Global Network
(As of May 1, 2015)
16 17CHIYODA CORPORATION ANNUAL REPORT FY2014 CHIYODA CORPORATION ANNUAL REPORT FY2014
Directors and Officers (As of June 25, 2015) Stock Information (As of March 31, 2015)
Representative Directors Directors
Board of Directors
Audit & Supervisory Board Members
Monthly Stock Price Range on the Tokyo Stock Exchange
Executive Officers
President & CEO Shogo Shibuya
Senior Executive Vice President Keiichi Nakagaki
Senior Executive Vice President Hiroshi Ogawa
Executive Vice President & CFO Masahito Kawashima
Executive Vice President Tadashi Izawa
Senior Vice President Masao Ishikawa
Senior Vice President Mamoru Nakano
Senior Vice President Akira Fujisawa
Senior Vice President Nobuyuki Uchida
Senior Vice President Hiromi Koshizuka
Vice President Shuichi Wada
Vice President Noriyuki Kasuya
Munehiko Nakano*2 Mikio Kobayashi*2 Yukihiro Imadegawa*2
Executive Vice President Katsuo Nagasaka
Executive Vice President Masahiko Kojima
Senior Vice President Ryosuke Shimizu
Senior Vice President Arata Sahara
Director Masaji Santo*1
Director Nobuo Tanaka*1
Vice President Eisuke Oki
Vice President Masao Fujiwara
Vice President Yasumitsu Abe
Vice President Jinei Yamaguchi
Vice President Toshiyuki Kariya
Vice President Seiichiro Ikeda
Vice President Terunobu Iio
Vice President Hideaki Tomiku
*1: External Director*2: Outside Corporate Auditor
(Yen) (Yen)
(Thousandsof shares)
20101 2 34 5 6 7 8 9 101112 4 5 6 7 8 9 1011121 2 3 4 5 6 7 8 9 1011121 2 3 5 6 7 8 9 10111241 2 3 1 2 34 5 6 7 8 9 101112
2011 2012 2013 2014 2015
0
2,100
1,400
700
100,000
50,000
0
21,000
14,000
7,000
Share Price (left) Volume (right) Nikkei Stock Average (right)
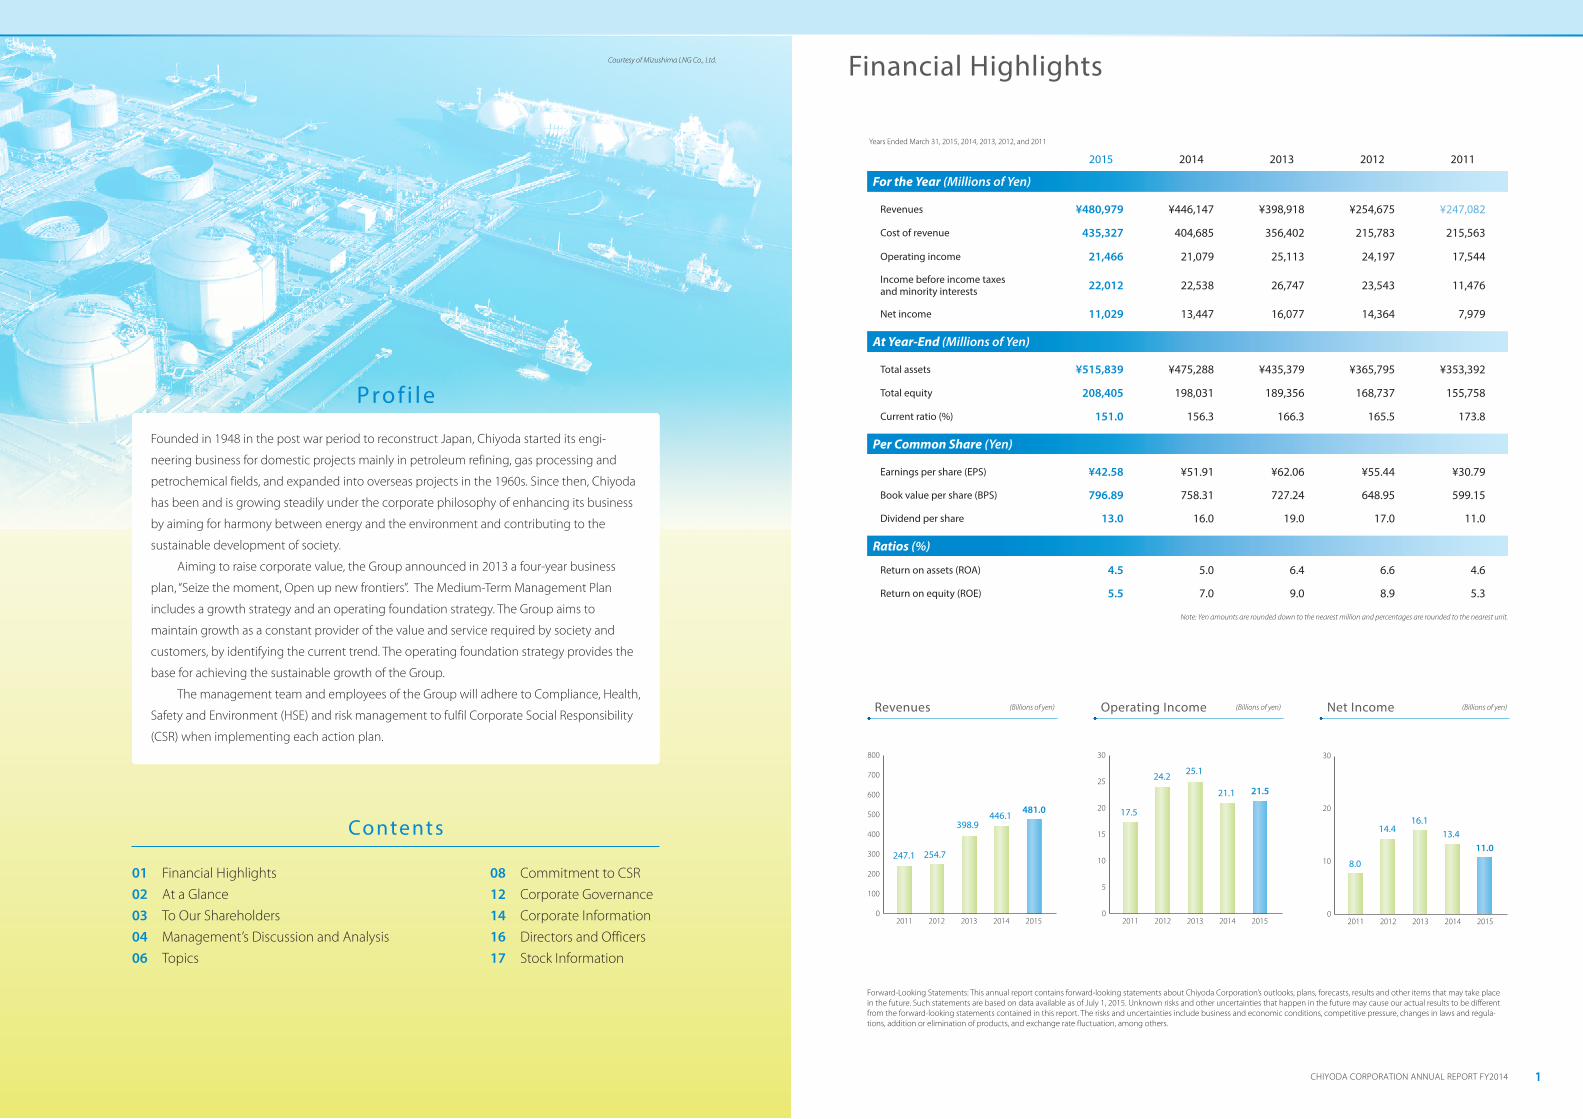
Breakdown by shareholder
Financial Institutions Securities CompaniesOther CorporationsForeign Investors and OthersIndividuals and Others
Total Number of Shares Issued:
260,325 thousand
3.6222.98
37.4315.13
20.84
Authorized Shares570,000,000
Capital Stock Issued 260,324,529
Number of Shareholders24,863
Number of Shares per Unit1,000
Stock CodeISIN: JP3528600004SEDOL1: 6191704 JPTSE: 6366
Transfer Agent of Common StockMitsubishi UFJ Trust and Banking Corporation1-4-5 Marunouchi, Chiyoda-ku, Tokyo
Number of Shares Owned
(Thousands of Shares)
Ratio Shares Owned
(%)
Mitsubishi Corporation 86,931 33.39
The Master Trust Bank of Japan, Ltd. (Trust Account) 11,991 4.60
Japan Trustee Services Bank, Ltd. (Trust Account) 10,759 4.13
The Bank of Tokyo-Mitsubishi UFJ, Ltd. 9,033 3.47
The Mitsubishi UFJ Trust and Banking Corporation 5,888 2.26
BNP Paribas Securities (Japan) Limited 3,564 1.36
Meiji Yasuda Life Insurance Company 2,265 0.87
State Street Bank and Trust Company 505041 2,245 0.86
Trust & Custody Services Bank, Ltd. 2,179 0.83
Japan Trustee Services Bank, Ltd. (Trust Account 7) 1,728 0.66
Major Shareholders (As of March 31, 2015)

CORPORATE PHILOSOPHY
Enhance our business in aiming for harmonybetween energy and the environment, and contribute to the sustainable development of a society as an integrated engineering companythrough the use of our collective wisdom andpainstakingly developed technology.
Minato Mirai Grand Central Tower4-6-2, Minatomirai, Nishi-ku, Yokohama 220-8765, JapanTel: (81)45-225-7777 (voice guidance)http://www.chiyoda-corp.com/en/
(As of August 2015)
Selected in FTSE Group’s responsibleinvestment index

ConsolidatedF i n a n c i a lS t a temen t s
FY2014
For the Year Ended March 31, 2015, and Independent Auditor’s Report

1 2Consolidated Financial Statements Consolidated Financial Statements
- 2 -
Chiyoda Corporation and Consolidated Subsidiaries Consolidated Balance Sheet March 31, 2015
Millions of Yen
Thousands of U.S. Dollars
(Note 1) ASSETS 2015 2014 2015 CURRENT ASSETS: Cash and cash equivalents (Note 13) ¥ 113,246 ¥ 145,303 $ 943,719 Short-term investments (Note 13) 69 64 575 Notes and accounts receivable—trade (Note 13) 29,740 56,502 247,838 Allowance for doubtful accounts (56 ) (3 ) (472 ) Costs and estimated earnings on long-term construction contracts (Notes 3 and 13) 24,100 16,503 200,834 Costs of construction contracts in process 59,668 33,826 497,234 Accounts receivable—other 16,327 4,936 136,059 Jointly controlled assets of joint venture (Note 13) 182,855 127,466 1,523,793 Deferred tax assets (Note 10) 11,697 18,868 97,483 Prepaid expenses and other 6,930 5,629 57,750 Total current assets 444,578 409,096 3,704,817 PROPERTY, PLANT AND EQUIPMENT: Land 5,266 5,265 43,884 Buildings and structures 13,915 12,557 115,958 Machinery and equipment 721 944 6,016 Tools, furniture, and fixtures 7,211 7,106 60,096 Construction in progress 16 286 137 Total 27,131 26,159 226,093 Accumulated depreciation (12,304 ) (11,201 ) (102,538 ) Net property, plant and equipment 14,826 14,958 123,555 INVESTMENTS AND OTHER ASSETS: Investment securities (Notes 4 and 13) 23,940 21,131 199,501 Investments in and advances to unconsolidated subsidiaries and associated companies (Note 5) 8,547 8,155 71,227 Goodwill 12,034 12,395 100,283 Software 7,393 7,056 61,611 Asset for retirement benefits 33 34 280 Other assets (Note 10) 4,717 2,528 39,314 Allowance for doubtful accounts (231 ) (68 ) (1,930 ) Total investments and other assets 56,434 51,233 470,288 TOTAL ¥ 515,839 ¥ 475,288 $ 4,298,660 See notes to consolidated financial statements.
Millions of Yen
Thousands of U.S. Dollars
(Note 1) LIABILITIES AND EQUITY 2015 2014 2015 CURRENT LIABILITIES: Short-term bank loans (Note 13) ¥ 991 ¥ 1,283 $ 8,258 Current portion of long-term debt (Notes 6, 12 and 13) 51 82 431 Notes and accounts payable—trade (Note 13) 137,652 145,392 1,147,104 Advance receipts on construction contracts 123,869 80,182 1,032,241 Income taxes payable (Note 13) 1,366 5,513 11,384 Deposits received 3,352 4,985 27,935 Allowance for warranty costs for completed works 364 507 3,035 Allowance for losses on construction contracts 3,988 4,002 33,241 Accrued expenses and other 22,703 19,730 189,197 Total current liabilities 294,339 261,679 2,452,831 LONG-TERM LIABILITIES: Long-term debt (Notes 6, 12 and 13) 10,063 10,040 83,863 Liability for retirement benefits (Note 7) 1,070 2,080 8,920 Provision for treatment of PCB waste 339 365 2,831 Asset retirement obligations 983 970 8,196 Other (Note 10) 636 2,121 5,301 Total long-term liabilities 13,093 15,578 109,113 COMMITMENTS AND CONTINGENT LIABILITIES (Notes 6, 12, 14 and 15) EQUITY (Notes 8 and 18): Common stock—authorized, 570,000 thousand shares; issued, 260,324 thousand shares in 2015 and 2014 43,396 43,396 361,636 Capital surplus 37,112 37,112 309,272 Retained earnings 115,831 109,525 965,260 Treasury stock—at cost, 1,323 thousand shares in 2015 and 1,310 thousand shares in 2014 (1,405 ) (1,390 ) (11,712 ) Accumulated other comprehensive income (loss): Unrealized gain on available-for-sale securities 7,218 4,920 60,152 Deferred (loss) gain on derivatives under hedge accounting (2,064 ) 648 (17,201 ) Foreign currency translation adjustments 5,229 2,486 43,576 Defined retirement benefit plans 1,076 (287 ) 8,974 Total 206,395 196,411 1,719,959 Minority interests 2,010 1,619 16,756 Total equity 208,405 198,031 1,736,715 TOTAL ¥ 515,839 ¥ 475,288 $ 4,298,660
Consolidated Balance Sheet(March 31, 2015)

3 4Consolidated Financial Statements Consolidated Financial Statements
- 3 -
Chiyoda Corporation and Consolidated Subsidiaries Consolidated Statement of Income Year Ended March 31, 2015
Millions of Yen
Thousands of U.S. Dollars
(Note 1) 2015 2014 2015 REVENUE ¥ 480,979 ¥ 446,147 $ 4,008,160 COST OF REVENUE 435,327 404,685 3,627,728 Gross profit 45,651 41,462 380,432 SELLING, GENERAL, AND ADMINISTRATIVE EXPENSES (Note 11) 24,185 20,383 201,543 Operating income 21,466 21,079 178,889 OTHER INCOME (EXPENSES): Interest and dividend income 3,111 2,590 25,925 Interest expense (255 ) (233 ) (2,128 ) Equity in losses of associated companies (783 ) (374 ) (6,532 ) Foreign exchange loss (1,182 ) (145 ) (9,851 ) Loss on valuation of investment securities (258 ) (2,157 ) Retirement benefit expenses (Note 7) (299 ) Other—net (85 ) (78 ) (708 ) Other income—net 545 1,459 4,547 INCOME BEFORE INCOME TAXES AND MINORITY INTERESTS 22,012 22,538 183,436 INCOME TAXES (Note 10): Current 6,257 13,101 52,144 Deferred 4,542 (3,773 ) 37,851 Total income taxes 10,799 9,327 89,995 NET INCOME BEFORE MINORITY INTERESTS 11,212 13,210 93,441 MINORITY INTERESTS IN NET INCOME 183 (236 ) 1,529 NET INCOME ¥ 11,029 ¥ 13,447 $ 91,911 Yen U.S. Dollars PER SHARE OF COMMON STOCK (Notes 2.y and 17): Basic net income ¥ 42.58 ¥ 51.91 $ 0.35 Cash dividends applicable to the year 13.00 16.00 0.10 See notes to consolidated financial statements.
- 4 -
Chiyoda Corporation and Consolidated Subsidiaries Consolidated Statement of Comprehensive Income Year Ended March 31, 2015
Millions of Yen
Thousands of U.S. Dollars
(Note 1) 2015 2014 2015 NET INCOME BEFORE MINORITY INTERESTS ¥ 11,212 ¥ 13,210 $ 93,441 OTHER COMPREHENSIVE INCOME (LOSS) (Note 16): Unrealized gain (loss) on available-for-sale securities 2,298 (1,664 ) 19,151 Deferred loss on derivatives under hedge accounting (2,712 ) (2,242 ) (22,601 ) Foreign currency translation adjustments 2,815 3,625 23,461 Defined retirement benefit plans 1,364 11,367 Share of other comprehensive income of associates accounted for using the equity method 142 104 1,189 Total other comprehensive income (loss) 3,908 (176 ) 32,568 COMPREHENSIVE INCOME ¥ 15,121 ¥ 13,034 $ 126,009 TOTAL COMPREHENSIVE INCOME ATTRIBUTABLE TO: Owners of the parent ¥ 14,722 ¥ 13,087 $ 122,687 Minority interests 398 (53 ) 3,322 See notes to consolidated financial statements.
Consolidated Statement of Income(Year Ended March 31, 2015)
Consolidated Statement of Comprehensive Income(Year Ended March 31, 2015)

5 6Consolidated Financial Statements Consolidated Financial Statements
- 5 - (Continued)
Chiyoda Corporation and Consolidated Subsidiaries Consolidated Statement of Changes in Equity Year Ended March 31, 2015 Thousands Millions of Yen Accumulated Other Comprehensive Income (Loss)
Outstanding Number of Shares of Common
Stock Common
Stock Capital Surplus
Retained Earnings
Treasury Stock
Unrealized Gain on
Available- for-Sale
Securities
Deferred (Loss) Gain on
Derivatives under Hedge Accounting
Foreign Currency
Translation Adjustments
Defined Retirement
Benefit Plans Total
Minority Interests
Total Equity
BALANCE, APRIL 1, 2013 259,045 ¥ 43,396 ¥ 37,112 ¥ 100,988 ¥ (1,349 ) ¥ 6,584 ¥ 2,890 ¥ (1,235 ) ¥ 188,386 ¥ 969 ¥ 189,356 Net income 13,447 13,447 13,447 Cash dividends, ¥19.00 per share (4,921 ) (4,921 ) (4,921 ) Change of scope of consolidation 12 12 12 Purchase of treasury stock (31 ) (40 ) (40 ) (40 ) Net change in the year (1,664 ) (2,242 ) 3,721 ¥ (287 ) (472 ) 650 178 BALANCE, MARCH 31, 2014 (APRIL 1, 2014, as previously reported) 259,014 43,396 37,112 109,525 (1,390 ) 4,920 648 2,486 (287 ) 196,411 1,619 198,031 Cumulative effect of accounting change (579 ) (579 ) (579 ) BALANCE, APRIL 1, 2014 (as restated) 259,014 43,396 37,112 108,946 (1,390 ) 4,920 648 2,486 (287 ) 195,831 1,619 197,451 Net income 11,029 11,029 11,029 Cash dividends, ¥16.00 per share (4,144 ) (4,144 ) (4,144 ) Purchase of treasury stock (12 ) (15 ) (15 ) (15 ) Net change in the year 2,298 (2,712 ) 2,743 1,363 3,693 391 4,084 BALANCE, MARCH 31, 2015 259,001 ¥ 43,396 ¥ 37,112 ¥ 115,831 ¥ (1,405 ) ¥ 7,218 ¥ (2,064 ) ¥ 5,229 ¥ 1,076 ¥ 206,395 ¥ 2,010 ¥ 208,405
- 6 - (Concluded)
Chiyoda Corporation and Consolidated Subsidiaries Consolidated Statement of Changes in Equity Year Ended March 31, 2015 Thousands of U.S. Dollars (Note 1) Accumulated Other Comprehensive Income (Loss)
Common
Stock Capital Surplus
Retained Earnings
Treasury Stock
Unrealized Gain on
Available- for-Sale
Securities
Deferred (Loss) Gain on
Derivatives under Hedge Accounting
Foreign Currency
Translation Adjustments
Defined Retirement
Benefit Plans Total
Minority Interests
Total Equity
BALANCE, MARCH 31, 2014 (APRIL 1, 2014, as previously reported) $ 361,636 $ 309,272 $ 912,715 $ (11,586 ) $ 41,001 $ 5,400 $ 20,717 $ (2,392 ) $ 1,636,765 $ 13,494 $ 1,650,259 Cumulative effect of accounting change (4,831 ) (4,831 ) (4,831 ) BALANCE, APRIL 1, 2014 (as restated) 361,636 309,272 907,883 (11,586 ) 41,001 5,400 20,717 (2,392 ) 1,631,933 13,494 1,645,427 Net income 91,911 91,911 91,911 Cash dividends, $0.13 per share (34,535 ) (34,535 ) (34,535 ) Purchase of treasury stock (125 ) (125 ) (125 ) Net change in the year 19,151 (22,601 ) 22,858 11,366 30,775 3,262 34,038 BALANCE, MARCH 31, 2015 $ 361,636 $ 309,272 $ 965,260 $ (11,712 ) $ 60,152 $ (17,201 ) $ 43,576 $ 8,974 $ 1,719,959 $ 16,756 $ 1,736,715 See notes to consolidated financial statements.
Consolidated Statement of Changes in Equity (Year Ended March 31, 2015)

7 8Consolidated Financial Statements Consolidated Financial Statements
- 7 - (Continued)
Chiyoda Corporation and Consolidated Subsidiaries Consolidated Statement of Cash Flows Year Ended March 31, 2015
Millions of Yen
Thousands of U.S. Dollars
(Note 1) 2015 2014 2015 OPERATING ACTIVITIES: Income before income taxes and minority interests ¥ 22,012 ¥ 22,538 $ 183,436 Adjustments for: Income taxes paid (12,550 ) (13,709 ) (104,587 ) Depreciation 3,569 3,196 29,745 Amortization of goodwill 1,469 825 12,248 Increase (decrease) in allowance for doubtful accounts 216 (12 ) 1,801 Decrease in allowance for warranty costs for completed works (170 ) (4 ) (1,424 ) (Decrease) increase in allowance for losses on construction contracts (47 ) 2,534 (395 ) Increase (decrease) in liability for retirement benefits 100 (768 ) 839 Loss on sales and disposals of fixed assets 338 31 2,820 Foreign exchange gain—net (499 ) (224 ) (4,164 ) Equity in losses of associated companies 783 374 6,532 Loss on valuation of investment securities 258 2,157 Changes in operating assets and liabilities: Decrease (increase) in trade notes and accounts receivable, and costs and estimated earnings on long-term construction contracts 21,217 (1,896 ) 176,813 Increase in costs of construction contracts in process (25,282 ) (16,974 ) (210,689 ) (Decrease) increase in trade notes and accounts payable (9,759 ) 23,650 (81,330 ) Increase (decrease) in advance receipts on construction contracts 43,019 (2,111 ) 358,494 (Increase) decrease in accounts receivable—other (4,872 ) 2,519 (40,602 ) Increase in jointly controlled assets of joint venture (55,246 ) (31,955 ) (460,391 ) Decrease in deposits received (1,710 ) (2,141 ) (14,251 ) Decrease (increase) in interest and dividend receivable 109 (713 ) 913 Other—net (7,101 ) (2,334 ) (59,176 ) Total adjustments (46,157 ) (39,715 ) (384,648 ) Net cash used in operating activities—(Forward) ¥ (24,145 ) ¥ (17,177 ) $ (201,211 )
- 8 - (Concluded)
Chiyoda Corporation and Consolidated Subsidiaries Consolidated Statement of Cash Flows Year Ended March 31, 2015
Millions of Yen
Thousands of U.S. Dollars
(Note 1) 2015 2014 2015 Net cash used in operating activities—(Forward) ¥ (24,145 ) ¥ (17,177 ) $ (201,211 ) INVESTING ACTIVITIES: Net decrease in time deposits 192 Proceeds from redemption of marketable securities 2,400 Purchases of property, plant and equipment (1,441 ) (1,981 ) (12,014 ) Proceeds from sales of property, plant and equipment 146 90 1,224 Purchases of intangible assets (2,431 ) (3,294 ) (20,259 ) Payments for asset retirement obligations (7 ) Payments for purchases of investment securities (1,245 ) (4,046 ) (10,377 ) Purchase of shares of subsidiaries resulting in change in scope of consolidation (9,134 ) Payments of short-term loans receivable (445 ) Payments of long-term loans receivable (605 ) (712 ) (5,048 ) Proceeds from collections of long-term loans 118 101 985 Other—net 14 41 123 Net cash used in investing activities (5,444 ) (16,796 ) (45,366 ) FINANCING ACTIVITIES: Net (decrease) increase in short-term bank loans (390 ) 11 (3,257 ) Repayments of long-term debt (4 ) (264 ) (40 ) Payments of cash dividends (4,139 ) (4,914 ) (34,493 ) Other—net (34 ) (81 ) (284 ) Net cash used in financing activities (4,569 ) (5,249 ) (38,078 ) FOREIGN CURRENCY TRANSLATION ADJUSTMENTS ON CASH AND CASH EQUIVALENTS 2,101 3,974 17,514 NET DECREASE IN CASH AND CASH EQUIVALENTS (32,057 ) (35,249 ) (267,141 ) INCREASE IN CASH AND CASH EQUIVALENTS FROM NEWLY CONSOLIDATED SUBSIDIARY 323 CASH AND CASH EQUIVALENTS, BEGINNING OF YEAR 145,303 180,229 1,210,861 CASH AND CASH EQUIVALENTS, END OF YEAR ¥ 113,246 ¥ 145,303 $ 943,719 See notes to consolidated financial statements.
Consolidated Statement of Cash Flows(Year Ended March 31, 2015)
9 10Consolidated Financial Statements Consolidated Financial Statements
Notes to Consolidated Financial Statements(Year Ended March 31, 2015)
- 9 -
Chiyoda Corporation and Consolidated Subsidiaries Notes to Consolidated Financial Statements Year Ended March 31, 2015 1. BASIS OF PRESENTATION OF CONSOLIDATED FINANCIAL STATEMENTS
The accompanying consolidated financial statements have been prepared in accordance with the provisions set forth in the Japanese Financial Instruments and Exchange Act and its related accounting regulations and in accordance with accounting principles generally accepted in Japan ("Japanese GAAP"), which are different in certain respects as to the application and disclosure requirements of International Financial Reporting Standards. In preparing these consolidated financial statements, certain reclassifications and rearrangements have been made to the consolidated financial statements issued domestically in order to present them in a form which is more familiar to readers outside Japan. In addition, certain reclassifications have been made in the 2014 consolidated financial statements to conform to the classifications used in 2015. The consolidated financial statements are stated in Japanese yen, the currency of the country in which Chiyoda Corporation (the "Company") is incorporated and principally operates. The translations of Japanese yen amounts into U.S. dollar amounts are included solely for the convenience of readers outside Japan and have been made at the rate of ¥120 to $1, the approximate rate of exchange at March 31, 2015. Such translations should not be construed as representations that the Japanese yen amounts could be converted into U.S. dollars at that or any other rate. Japanese yen figures less than a million yen are rounded down to the nearest million yen, except for per share data. U.S. dollar figures less than a thousand U.S. dollars are rounded down to the nearest thousand U.S. dollars, except for per share data.
2. SUMMARY OF SIGNIFICANT ACCOUNTING POLICIES
a. Consolidation—The consolidated financial statements as of March 31, 2015, include the accounts of the Company and its 30 significant (29 in 2014) subsidiaries (together, the "Group"). Under the control and influence concepts, those companies in which the Company, directly or indirectly, is able to exercise control over operations are fully consolidated, and those companies over which the Group has the ability to exercise significant influence are accounted for by the equity method. Investments in six (five in 2014) associated companies are accounted for by the equity method in 2015.
- 10 -
Investments in the remaining unconsolidated subsidiaries and associated companies are stated at cost. If the equity method of accounting had been applied to the investments in these companies, the effect on the accompanying consolidated financial statements would not be material. Most of the foreign consolidated subsidiaries have a December 31 year-end which does not accord with that of the Company. As a result, adjustments have been made for any significant transactions which took place during the period between the year-end of these subsidiaries and the year-end of the Company. The excess of the cost of acquisition over the fair value of the net assets of an acquired subsidiary at the date of acquisition is being amortized over a period of 5 to 20 years. All significant intercompany balances and transactions have been eliminated in consolidation. All material unrealized profit included in assets resulting from transactions within the Group is also eliminated.
b. Unification of Accounting Policies Applied to Foreign Subsidiaries for the Consolidated Financial
Statements—In May 2006, the Accounting Standards Board of Japan (the "ASBJ") issued ASBJ Practical Issues Task Force ("PITF") No. 18, "Practical Solution on Unification of Accounting Policies Applied to Foreign Subsidiaries for the Consolidated Financial Statements." PITF No. 18 prescribes that the accounting policies and procedures applied to a parent company and its subsidiaries for similar transactions and events under similar circumstances should in principle be unified for the preparation of the consolidated financial statements. However, financial statements prepared by foreign subsidiaries in accordance with either International Financial Reporting Standards or generally accepted accounting principles in the United States of America tentatively may be used for the consolidation process, except for the following items that should be adjusted in the consolidation process so that net income is accounted for in accordance with Japanese GAAP, unless they are not material: (a) amortization of goodwill; (b) scheduled amortization of actuarial gain or loss of pensions that has been recorded in equity through other comprehensive income; (c) expensing capitalized development costs of R&D; (d) cancellation of the fair value model of accounting for property, plant and equipment and investment properties and incorporation of the cost model of accounting; and (e) exclusion of minority interests from net income, if contained in net income.
c. Unification of Accounting Policies Applied to Foreign Associated Companies for the Equity Method—In
March 2008, the ASBJ issued ASBJ Statement No. 16, "Accounting Standard for Equity Method of Accounting for Investments." The new standard requires adjustments to be made to conform the associate's accounting policies for similar transactions and events under similar circumstances to those of the parent company when the associate's financial statements are used in applying the equity method unless it is impracticable to determine such adjustments. In addition, financial statements prepared by foreign associated companies in accordance with either International Financial Reporting Standards or generally accepted accounting principles in the United States of America tentatively may be used in applying the equity method if the following items are adjusted so that net income is accounted for in accordance with Japanese GAAP, unless they are not material: (a) amortization of goodwill; (b) scheduled amortization of actuarial gain or loss of pensions that has been recorded in equity through other comprehensive income; (c) expensing capitalized development costs of R&D; (d) cancellation of the fair value model of accounting for property, plant and equipment and investment properties and incorporation of the cost model of accounting; and (e) exclusion of minority interests from net income, if contained in net income.

11 12Consolidated Financial Statements Consolidated Financial Statements
Notes to Consolidated Financial Statements
- 11 -
d. Construction Contracts—In December 2007, the ASBJ issued ASBJ Statement No. 15, "Accounting Standard for Construction Contracts" and ASBJ Guidance No. 18, "Guidance on Accounting Standard for Construction Contracts." Under this accounting standard, construction revenue and construction costs should be recognized by the percentage-of-completion method if the outcome of a construction contract can be estimated reliably. When total construction revenue, total construction costs, and the stage of completion of the contract at the balance sheet date can be reliably measured, the outcome of a construction contract is deemed to be estimated reliably. If the outcome of a construction contract cannot be reliably estimated, the completed-contract method should be applied. When it is probable that the total construction costs will exceed total construction revenue, an estimated loss on the contract should be immediately recognized by providing for a loss on construction contracts. Concerning the construction contracts, the Group applies the accounting methods as follows:
Unbilled costs on contracts, which are accounted for by the completed-contract method, are stated as costs of construction contracts in process. Payments received in excess of costs and estimated earnings on contracts, which are accounted for by the percentage-of-completion method, and payments received on the other contracts, are presented as current liabilities. Costs of preparation work for unsuccessful proposals and other projects that are not realized are charged to income, as incurred, and are included in cost of revenue.
e. Cash Equivalents—Cash equivalents are short-term investments that are readily convertible into cash and that are exposed to insignificant risk of changes in value. Cash equivalents include time deposits, certificates of deposit, and commercial paper, all of which mature or become due within three months of the date of acquisition.
f. Investment Securities—All marketable securities are classified as available-for-sale securities and are reported
at fair value, with unrealized gains and losses, net of applicable taxes, reported in a separate component of equity. The cost of securities sold is determined based on the moving-average method. Nonmarketable available-for-sale securities are stated at cost determined by the moving-average method. For other-than-temporary declines in fair value, investment securities are reduced to net realizable value by a charge to income.
g. Short-Term Investments—Short-term investments are time deposits, which will mature three months after the
date of acquisition. Short-term investments are exposed to insignificant risk of changes in value. h. Jointly Controlled Assets of Joint Venture—The jointly controlled assets of the joint venture are jointly
controlled cash recognized based on the Company's share of the venture. i. Allowance for Doubtful Accounts—The allowance for doubtful accounts is stated in amounts considered to be
appropriate based on the Group's past credit loss experience and an evaluation of potential losses in the receivables outstanding.
- 12 -
j. Property, Plant and Equipment—Property, plant and equipment are stated at cost. Depreciation is computed by the declining-balance method, except for buildings owned by the Company that are depreciated using the straight-line method, at rates based on the estimated useful lives of the assets. The range of useful lives is from 8 to 57 years for buildings and structures, from 4 to 17 years for machinery and equipment, and from 4 to 15 years for tools, furniture, and fixtures. Equipment held for lease is depreciated by the straight-line method over the respective lease periods.
k. Long-Lived Assets—The Group reviews its long-lived assets for impairment whenever events or changes in
circumstance indicate the carrying amount of an asset or asset group may not be recoverable. An impairment loss is recognized if the carrying amount of an asset or asset group exceeds the sum of the undiscounted future cash flows expected to result from the continued use and eventual disposition of the asset or asset group. The impairment loss would be measured as the amount by which the carrying amount of the asset exceeds its recoverable amount, which is the higher of the discounted cash flows from the continued use and eventual disposition of the asset or the net selling price at disposition.
l. Software—Software for internal use is amortized on a straight-line basis over its estimated useful life (five
years at the maximum). m. Other Assets—Intangible assets are carried at cost less accumulated amortization, which is calculated by the
straight-line method over their estimated useful lives. n. Allowance for Warranty Costs for Completed Work—The allowance for warranty costs for completed work is
provided based on past rate experience. o. Allowance for Losses on Construction Contracts—The allowance for losses on construction contracts is
provided for an estimated amount of probable losses to be incurred in future years in respect of construction projects in progress. When there are losses on completed-contract method applied contracts, the allowance for losses on construction contracts is offset against the costs of construction contracts in process in the balance sheet.
p. Provision for Treatment of PCB Waste—A provision for treatment of PCB (Poly Chlorinated Biphenyl)
waste is provided based on estimated costs of the treatment for PCB products and equipment as well as their collection and transportation fees.
q. Retirement and Pension Plans—The Company and consolidated subsidiaries have funded or unfunded
defined benefit pension plans and a defined contribution pension plans for employees. Certain consolidated subsidiaries have defined benefit corporate pension plans or severance lump-sum payment plans, and calculate retirement benefit expenses by using the simplified method. Effective April 1, 2000, the Company and its domestic consolidated subsidiaries adopted a new accounting standard for retirement benefits and accounted for the liability for retirement benefits based on the projected benefit obligations and plan assets at the balance sheet date. The projected benefit obligations are attributed to periods on a straight-line basis. Actuarial gains and losses are amortized on a straight-line basis over 10 years within the average remaining service period. Past service costs are amortized on a straight-line basis over 10 years within the average remaining service period.

13 14Consolidated Financial Statements Consolidated Financial Statements
- 13 -
The transitional obligation of ¥5,696 million ($47,466 thousand) is being amortized and charged to income over 15 years using the straight-line amortization method and included in an operating expense in the consolidated statements of income for the years ended March 31, 2015 and 2014. In May 2012, the ASBJ issued ASBJ Statement No. 26, "Accounting Standard for Retirement Benefits" and ASBJ Guidance No. 25, "Guidance on Accounting Standard for Retirement Benefits," which replaced the accounting standard for retirement benefits that had been issued by the Business Accounting Council in 1998 with an effective date of April 1, 2000, and the other related practical guidance, and were followed by partial amendments from time to time through 2009.
(a) Under the revised accounting standard, actuarial gains and losses and past service costs that are yet to be
recognized in profit or loss are recognized within equity (accumulated other comprehensive income), after adjusting for tax effects, and any resulting deficit or surplus is recognized as a liability (liability for retirement benefits) or asset (asset for retirement benefits).
(b) The revised accounting standard does not change how to recognize actuarial gains and losses and past
service costs in profit or loss. Those amounts are recognized in profit or loss over a certain period no longer than the expected average remaining service period of the employees. However, actuarial gains and losses and past service costs that arose in the current period and have not yet been recognized in profit or loss are included in other comprehensive income, and actuarial gains and losses and past service costs that were recognized in other comprehensive income in prior periods and then recognized in profit or loss in the current period, are treated as reclassification adjustments.
(c) The revised accounting standard also made certain amendments relating to the method of attributing
expected benefit to periods, the discount rate, and expected future salary increases.
This accounting standard and the guidance for (a) and (b) above are effective for the end of annual periods beginning on or after April 1, 2013, and for (c) above are effective for the beginning of annual periods beginning on or after April 1, 2014, or for the beginning of annual periods beginning on or after April 1, 2015, subject to certain disclosure in March 2015, all with earlier application being permitted from the beginning of annual periods beginning on or after April 1, 2013. However, no retrospective application of this accounting standard to consolidated financial statements in prior periods is required. The Company applied the revised accounting standard and guidance for retirement benefits for (a) and (b) above, effective March 31, 2014, and for (c) above, effective April 1, 2014. With respect to (c) above, the Company changed the method of attributing expected benefit to periods from a straight-line basis to a benefit formula basis, the method of determining discount rate from using the period which approximates the expected average remaining service period to using a single weighted average discount rate reflecting the estimated timing and amount of benefit payment, and recorded the effect of (c) above as of April 1, 2014, in retained earnings. As a result, liability for retirement benefits as of April 1, 2014, increased by ¥901 million ($7,513 thousand), and retained earnings as of April 1, 2014, decreased by ¥579 million ($4,831 thousand). The effect on the profit and loss for the year ended March 31, 2015, was not material.
- 14 -
r. Asset Retirement Obligations—In March 2008, the ASBJ issued ASBJ Statement No. 18, "Accounting Standard for Asset Retirement Obligations" and ASBJ Guidance No. 21, "Guidance on Accounting Standard for Asset Retirement Obligations." Under this accounting standard, an asset retirement obligation is defined as a legal obligation imposed either by law or contract that results from the acquisition, construction, development, and normal operation of a tangible fixed asset and is associated with the retirement of such tangible fixed asset. The asset retirement obligation is recognized as the sum of the discounted cash flows required for the future asset retirement and is recorded in the period in which the obligation is incurred if a reasonable estimate can be made. If a reasonable estimate of the asset retirement obligation cannot be made in the period the asset retirement obligation is incurred, the liability should be recognized when a reasonable estimate of the asset retirement obligation can be made. Upon initial recognition of a liability for an asset retirement obligation, an asset retirement cost is capitalized by increasing the carrying amount of the related fixed asset by the amount of the liability. The asset retirement cost is subsequently allocated to expense through depreciation over the remaining useful life of the asset. Over time, the liability is accreted to its present value each period. Any subsequent revisions to the timing or the amount of the original estimate of undiscounted cash flows are reflected as an adjustment to the carrying amount of the liability and the capitalized amount of the related asset retirement cost.
s. Research and Development Costs—Research and development costs are charged to income as incurred. t. Leases—In March 2007, the ASBJ issued ASBJ Statement No. 13, "Accounting Standard for Lease
Transactions," which revised the previous accounting standard for lease transactions. Under the previous accounting standard, finance leases that were deemed to transfer ownership of the leased property to the lessee were capitalized. However, other finance leases were permitted to be accounted for as operating lease transactions if certain "as if capitalized" information was disclosed in the notes to the lessee's financial statements. The revised accounting standard requires that all finance lease transactions be capitalized by recognizing lease assets and lease obligations in the balance sheet. The Company applied the revised accounting standard effective April 1, 2008. All other leases are accounted for as operating leases.
u. Income Taxes—The provision for income taxes is computed based on the pretax income included in the
consolidated statement of income. The asset and liability approach is used to recognize deferred tax assets and liabilities for the expected future tax consequences of temporary differences between the carrying amounts and the tax bases of assets and liabilities. Deferred taxes are measured by applying currently enacted income tax rates to the temporary differences. The Company and its wholly owned domestic subsidiaries file a tax return under the consolidated corporate-tax system, which allows companies to base tax payments on the combined profits or losses of the parent company and its wholly owned domestic subsidiaries.
v. Foreign Currency Transactions—All short-term and long-term monetary receivables and payables
denominated in foreign currencies are translated into Japanese yen at the exchange rates at the balance sheet date. Foreign exchange gains and losses from translation are recognized in the consolidated statement of income to the extent that they are not hedged by foreign currency forward contracts.
Notes to Consolidated Financial Statements

15 16Consolidated Financial Statements Consolidated Financial Statements
- 15 -
w. Foreign Currency Financial Statements—Balance sheet accounts of consolidated foreign subsidiaries are translated into Japanese yen at the current exchange rate as of the balance sheet date except for equity, which is translated at the historical rate. Differences arising from such translation are shown as "Foreign currency translation adjustments" under accumulated other comprehensive income in a separate component of equity. Revenue and expense accounts of consolidated foreign subsidiaries are translated into Japanese yen at the current exchange rate as of the balance sheet date.
x. Derivatives and Hedging Activities—The Group uses derivative financial instruments, including foreign
currency forward contracts and interest swap contracts, as a means of hedging exposure to foreign currency risks and interest rate risks. The Group does not enter into derivatives for trading or speculative purposes. Derivative financial instruments are classified and accounted for as follows:
(1) All derivatives are recognized as either assets or liabilities and measured at fair value, with gains or losses
recognized in the consolidated statement of income. (2) For derivatives used for hedging purposes, if such derivatives qualify for hedge accounting because of
high correlation and effectiveness between the hedging instruments and the hedged items, gains or losses on derivatives are deferred until maturity of the hedged transactions.
Foreign currency forward contracts are utilized to hedge foreign exchange risks. Certain assets and liabilities
on construction contracts denominated in foreign currencies are translated at the contracted rates if the forward contracts qualify for hedge accounting. Foreign currency deposits are held to hedge foreign exchange risks derived from forecasted purchases of fixed assets denominated in foreign currency. Interest rate swaps which qualify for hedge accounting and meet specific matching criteria are not remeasured at market value but the differential paid or received under the swap agreements is recognized and included in interest expense.
y. Per Share Information—Basic net income per share is computed by dividing net income available to common
shareholders by the weighted-average number of common shares outstanding for the period, retroactively adjusted for stock splits. Diluted net income per share reflects the potential dilution that could occur if securities were exercised or converted into common stock. Diluted net income per share of common stock assumes full conversion of the outstanding convertible notes and bonds at the beginning of the year (or at the time of issuance) with an applicable adjustment for related interest expense, net of tax, and full exercise of outstanding warrants. Diluted net income per share is not disclosed because there is no potential stock that has a dilutive effect for the fiscal years ended March 31, 2015 and 2014. Cash dividends per share presented in the accompanying consolidated statement of income are dividends applicable to the respective fiscal years, including dividends to be paid after the end of the year.
- 16 -
z. Accounting Changes and Error Corrections—In December 2009, the ASBJ issued ASBJ Statement No. 24, "Accounting Standard for Accounting Changes and Error Corrections" and ASBJ Guidance No. 24, "Guidance on Accounting Standard for Accounting Changes and Error Corrections." Accounting treatments under this standard and guidance are as follows: (1) Changes in Accounting Policies—When a new accounting policy is applied following revision of an accounting standard, the new policy is applied retrospectively unless the revised accounting standard includes specific transitional provisions, in which case the entity shall comply with the specific transitional provisions. (2) Changes in Presentation—When the presentation of financial statements is changed, prior-period financial statements are reclassified in accordance with the new presentation. (3) Changes in Accounting Estimates—A change in an accounting estimate is accounted for in the period of the change if the change affects that period only, and is accounted for prospectively if the change affects both the period of the change and future periods. (4) Corrections of Prior-Period Errors—When an error in prior-period financial statements is discovered, those statements are restated.
3. CONSTRUCTION CONTRACTS
Costs and estimated earnings recognized with respect to construction contracts which are accounted for by the percentage-of-completion method at March 31, 2015 and 2014, were as follows:
Millions of Yen Thousands of U.S. Dollars
2015 2014 2015
Costs and estimated earnings ¥ 397,990 ¥ 379,837 $ 3,316,590 Amounts billed (373,890 ) (363,334 ) (3,115,755 ) Net ¥ 24,100 ¥ 16,503 $ 200,834
4. INVESTMENT SECURITIES
Investment securities at March 31, 2015 and 2014, consisted of the following:
Millions of Yen Thousands of U.S. Dollars
2015 2014 2015
Noncurrent—Equity securities ¥ 23,940 ¥ 21,131 $ 199,501 The costs and aggregate fair values of investment securities at March 31, 2015 and 2014, were as follows:
March 31, 2015 Millions of Yen
Cost Unrealized
Gains Unrealized
Losses Fair
Value
Securities classified as— Available-for-sale—equity securities ¥ 11,471 ¥ 10,426 ¥ 21,898
Notes to Consolidated Financial Statements

17 18Consolidated Financial Statements Consolidated Financial Statements
- 17 -
March 31, 2014 Millions of Yen
Cost Unrealized
Gains Unrealized
Losses Fair
Value
Securities classified as— Available-for-sale—equity securities ¥ 11,465 ¥ 7,128 ¥ 2 ¥ 18,591
March 31, 2015 Thousands of U.S. Dollars
Cost Unrealized
Gains Unrealized
Losses Fair
Value
Securities classified as— Available-for-sale—equity securities $ 95,597 $ 86,888 $ 182,485
Available-for-sale securities whose fair value cannot be reliably determined at March 31, 2014, were as follows.
Similar information for 2015 is disclosed in Note 13.
Carrying Amount March 31, 2014 Millions of Yen
Securities classified as—Available-for-sale—equity securities ¥ 2,540
5. INVESTMENTS IN AND ADVANCES TO UNCONSOLIDATED SUBSIDIARIES AND ASSOCIATED
COMPANIES Investments in and advances to unconsolidated subsidiaries and associated companies at March 31, 2015 and 2014, were as follows:
Millions of Yen Thousands of U.S. Dollars
2015 2014 2015
Investments ¥ 7,387 ¥ 7,183 $ 61,566 Long-term receivables 1,159 971 9,661 Total ¥ 8,547 ¥ 8,155 $ 71,227
- 18 -
6. LONG-TERM DEBT Long-term debt at March 31, 2015 and 2014, consisted of the following:
Millions of Yen Thousands of U.S. Dollars
2015 2014 2015
Long-term loans principally from banks, due serially through 2018, with interest rates at 2.0% (2015) and ranging from 1.9% to 2.0% (2014)—Unsecured ¥ 10,020 ¥ 10,023 $ 83,502 Obligations under finance leases 95 99 792 Total 10,115 10,122 84,295 Less current portion (51 ) (82 ) (431 ) Long-term debt, less current portion ¥ 10,063 ¥ 10,040 $ 83,863
Annual maturities of long-term debt, excluding finance leases, at March 31, 2015, were as follows:
Year Ending March 31 Millions of Yen
Thousands of U.S. Dollars
2016 ¥ 4 $ 40 2017 5 43 2018 10,005 83,376 2019 3 25 2020 2021 and thereafter 1 16 Total ¥ 10,020 $ 83,502
Commitment-line contracts at March 31, 2015, were as follows:
Millions of Yen Thousands of U.S. Dollars
Commitment-line contracts ¥ 15,000 $ 125,000 Unused commitments ¥ 15,000 $ 125,000
7. RETIREMENT AND PENSION PLANS
The Company and consolidated subsidiaries have funded or unfunded defined benefit pension plans and a defined contribution pension plans for employees. Under defined benefit corporate pension plans, all of which are funded, employees are entitled to certain lump-sum payments or pension payments based on cumulated points which are granted in accordance with years of continuous employment, occupational classification and performance evaluation. Under severance lump-sum payment plans, employees are entitled to certain lump-sum payments based on salary and service period.
Notes to Consolidated Financial Statements

19 20Consolidated Financial Statements Consolidated Financial Statements
- 19 -
Certain consolidated subsidiaries have defined benefit corporate pension plans or severance lump-sum payment plans, and calculate retirement benefit expenses by using the simplified method.
(1) The changes in defined benefit obligation for the years ended March 31, 2015 and 2014, were as follows:
Millions of Yen Thousands of U.S. Dollars
2015 2014 2015
Balance at beginning of year (as previously reported) ¥ 21,787 ¥ 20,630 $ 181,562 Cumulative effect of accounting change 901 7,513 Balance at beginning of year (as restated) 22,689 20,630 189,076 Current service cost 913 593 7,609 Interest cost 198 326 1,657 Actuarial losses 6 176 58 Benefits paid (1,709 ) (1,691 ) (14,247 ) The amount of obligation processing with the changes from simplified method to the principle method 1,751 Others 52 441 Balance at end of year ¥ 22,151 ¥ 21,787 $ 184,594
(2) The changes in plan assets for the years ended March 31, 2015 and 2014, were as follows:
Millions of Yen Thousands of U.S. Dollars
2015 2014 2015
Balance at beginning of year ¥ 20,370 ¥ 17,705 $ 169,757 Expected return on plan assets 405 707 3,381 Actuarial losses 1,495 853 12,458 Contributions from the employer 1,195 1,477 9,963 Benefits paid (1,709 ) (1,691 ) (14,247 ) The amount of obligation processing with the changes from simplified method to the principle method
1,318
Others 57 481 Balance at end of year ¥ 21,815 ¥ 20,370 $ 181,795
- 20 -
(3) The changes in the liability recorded in the consolidated balance sheet by using the simplified method for the years ended March 31, 2015 and 2014, were as follows:
Millions of Yen Thousands of U.S. Dollars
2015 2014 2015
Balance at beginning of year ¥ 629 ¥ 943 $ 5,249 Benefit costs 235 300 1,959 Benefits paid (95 ) (46 ) (799 ) Contribution to the plans (107 ) (332 ) (895 ) Decrease by implementation of defined contribution plans (173 ) The amount of expense processing with the changes from simplified method to the principle method (433 ) Change of scope of consolidation 71 Others 39 299 326 Balance at end of year ¥ 700 ¥ 629 $ 5,839
(4) Reconciliation between the liability recorded in the consolidated balance sheet and the balances of defined
benefit obligation and plan assets
Millions of Yen Thousands of U.S. Dollars
2015 2014 2015
Funded defined benefit obligation ¥ 23,441 ¥ 23,088 $ 195,345 Plan assets (23,073 ) (21,511 ) (192,282 ) 367 1,577 3,062 Unfunded defined benefit obligation 669 469 5,576 Net liability arising from defined benefit obligation ¥ 1,036 ¥ 2,046 $ 8,639
Millions of Yen Thousands of U.S. Dollars
2015 2014 2015
Liability for retirement benefits ¥ 1,070 ¥ 2,080 $ 8,920 Asset for retirement benefits (33 ) (34 ) (280 ) Net liability arising from defined benefit obligation ¥ 1,036 ¥ 2,046 $ 8,639
Notes to Consolidated Financial Statements

21 22Consolidated Financial Statements Consolidated Financial Statements
- 21 -
(5) The components of net periodic benefit costs for the years ended March 31, 2015 and 2014, were as follows:
Millions of Yen Thousands of U.S. Dollars
2015 2014 2015
Service cost ¥ 913 ¥ 593 $ 7,609 Interest cost 198 326 1,657 Expected return on plan assets (405 ) (707 ) (3,381 ) Amortization of prior service cost (176 ) (176 ) (1,468 ) Recognized actuarial losses 134 2 1,116 Amortization of transitional obligation 608 608 5,073 Benefit costs in simplified method 235 300 1,959 Others 299 Net periodic benefit costs ¥ 1,507 ¥ 1,248 $ 12,566
(6) Amounts recognized in other comprehensive income (before income tax effect) in respect of defined
retirement benefit plans for the years ended March 31, 2015 and 2014
Millions of Yen Thousands of U.S. Dollars
2015 2014 2015
Prior service cost ¥ (176 ) $ (1,468 ) Actuarial losses 1,620 13,507 Transitional obligation 608 5,073 Total ¥ 2,053 $ 17,112
(7) Amounts recognized in accumulated other comprehensive income (before income tax effect) in respect of
defined retirement benefit plans as of March 31, 2015 and 2014
Millions of Yen Thousands of U.S. Dollars
2015 2014 2015
Unrecognized prior service cost ¥ (146 ) ¥ (323 ) $ (1,224 ) Unrecognized actuarial (gains) losses (1,463 ) 157 (12,199 ) Unamortized transitional obligation 608 Total ¥ (1,610 ) ¥ 442 $ (13,423 )
- 22 -
(8) Plan assets
a. Components of plan assets Plan assets as of March 31, 2015 and 2014, consisted of the following:
2015 2014
Debt investments 24 % 26 % Equity investments 40 37 General accounts 24 25 Others 12 12 Total 100 % 100 %
b. Method of determining the expected rate of return on plan assets
The expected rate of return on plan assets is determined considering the long-term rates of return which are expected currently and in the future from the various components of the plan assets.
(9) Assumptions used for the years ended March 31, 2015 and 2014, were set forth as follows:
2015 2014
Discount rate Mainly 0.7% Mainly 1.5% Expected rate of return on plan assets Mainly 1.9% Mainly 3.7%
(10) Payables to defined contribution plans of the Company and consolidated subsidiaries for the years ended
March 31, 2015 and 2014, were ¥824 million ($6,871 thousand) and ¥550 million, respectively.
8. EQUITY Japanese companies are subject to the Companies Act of Japan (the "Companies Act"). The significant provisions in the Companies Act that affect financial and accounting matters are summarized below:
a. Dividends
Under the Companies Act, companies can pay dividends at any time during the fiscal year in addition to the year-end dividend upon resolution at the shareholders' meeting. For companies that meet certain criteria, the Board of Directors may declare dividends (except for dividends in kind) at any time during the fiscal year if the company has prescribed so in its articles of incorporation. However, the Company cannot do so because it does not meet all the criteria. The Companies Act permits companies to distribute dividends in kind (noncash assets) to shareholders subject to a certain limitation and additional requirements. Semiannual interim dividends may also be paid once a year upon resolution by the Board of Directors if the articles of incorporation of the company so stipulate. The Companies Act provides certain limitations on the amounts available for dividends or the purchase of treasury stock. The limitation is defined as the amount available for distribution to the shareholders, but the amount of net assets after dividends must be maintained at no less than ¥3 million.
Notes to Consolidated Financial Statements

23 24Consolidated Financial Statements Consolidated Financial Statements
- 23 -
b. Increases/Decreases and Transfer of Common Stock, Reserve, and Surplus The Companies Act requires that an amount equal to 10% of dividends must be appropriated as a legal reserve (a component of retained earnings) or as additional paid-in capital (a component of capital surplus), depending on the equity account charged upon the payment of such dividends, until the aggregate amount of legal reserve and additional paid-in capital equals 25% of the common stock. Under the Companies Act, the total amount of additional paid-in capital and legal reserve may be reversed without limitation. The Companies Act also provides that common stock, legal reserve, additional paid-in capital, other capital surplus, and retained earnings can be transferred among the accounts within equity under certain conditions upon resolution of the shareholders.
c. Treasury Stock and Treasury Stock Acquisition Rights
The Companies Act also provides for companies to purchase treasury stock and dispose of such treasury stock by resolution of the Board of Directors. The amount of treasury stock purchased cannot exceed the amount available for distribution to the shareholders, which is determined by a specific formula. Under the Companies Act, stock acquisition rights are presented as a separate component of equity. The Companies Act also provides that companies can purchase both treasury stock acquisition rights and treasury stock. Such treasury stock acquisition rights are presented as a separate component of equity or deducted directly from stock acquisition rights.
9. SUPPLEMENTAL CASH FLOW INFORMATION
Acquisition cost and net payments for assets and liabilities of Xodus Group (Holdings) Limited ("Xodus Group"), a newly consolidated subsidiary acquired through share purchase, for the year ended March 31, 2014, were as follows:
Millions of Yen
Current assets ¥ 5,061 Fixed assets 2,540 Goodwill 6,283 Current liabilities (2,856 ) Fixed liabilities (166 ) Foreign currency translation adjustments (77 ) Minority interests (380 ) Acquisition cost of Xodus Group's shares 10,405 Cash and cash equivalents (1,265 ) Exchange gain on the acquisition (5 ) Net payments for the acquisition ¥ 9,134
There was no significant acquisition of newly consolidated subsidiaries for the year ended March 31, 2015.
- 24 -
10. INCOME TAXES The Company and its domestic subsidiaries are subject to Japanese national and local income taxes which, in the aggregate, resulted in normal effective statutory tax rates of approximately 36% and 38% for the years ended March 31, 2015 and 2014, respectively. The tax effects of significant temporary differences, which resulted in deferred tax assets and liabilities at March 31, 2015 and 2014, were as follows:
Millions of Yen Thousands of U.S. Dollars
2015 2014 2015
Deferred tax assets: Cost of revenue ¥ 5,087 ¥ 14,927 $ 42,398 Tax loss carryforwards 4,971 41,428 Allowance for losses on construction contracts 1,276 1,305 10,635 Allowance for employees' bonus 1,258 1,438 10,490 Deferred gain/loss on derivatives under hedge accounting 885 7,381 Future deductible depreciation 811 1,079 6,758 Costs of construction contracts in process 709 657 5,916 Other 4,082 3,871 34,023 Less valuation allowance (1,161 ) (1,084 ) (9,683 ) Total 17,922 22,195 149,350 Deferred tax liabilities: Unrealized loss/gain on available-for-sale securities 3,207 2,460 26,731 Deferred gain/loss on derivatives under hedge accounting 433 Profit/loss in joint venture 145 Other 384 457 3,207 Total 3,592 3,496 29,939 Net deferred tax assets ¥ 14,329 ¥ 18,699 $ 119,411
Prior to April 1, 2014, "Defined retirement benefit plans" was disclosed separately. From this fiscal year ended
March 31, 2015, the amounts are included in "Other" within the deferred tax assets section due to the decrease in materiality. Net deferred tax assets as of March 31, 2015 and 2014, were recorded in the accompanying consolidated balance sheet as follows:
Millions of Yen Thousands of U.S. Dollars
2015 2014 2015
Current assets—Deferred tax assets ¥ 11,697 ¥ 18,868 $ 97,483 Investments and other assets—Other assets 2,631 685 21,927 Long-term liabilities—Other (854 )
Notes to Consolidated Financial Statements
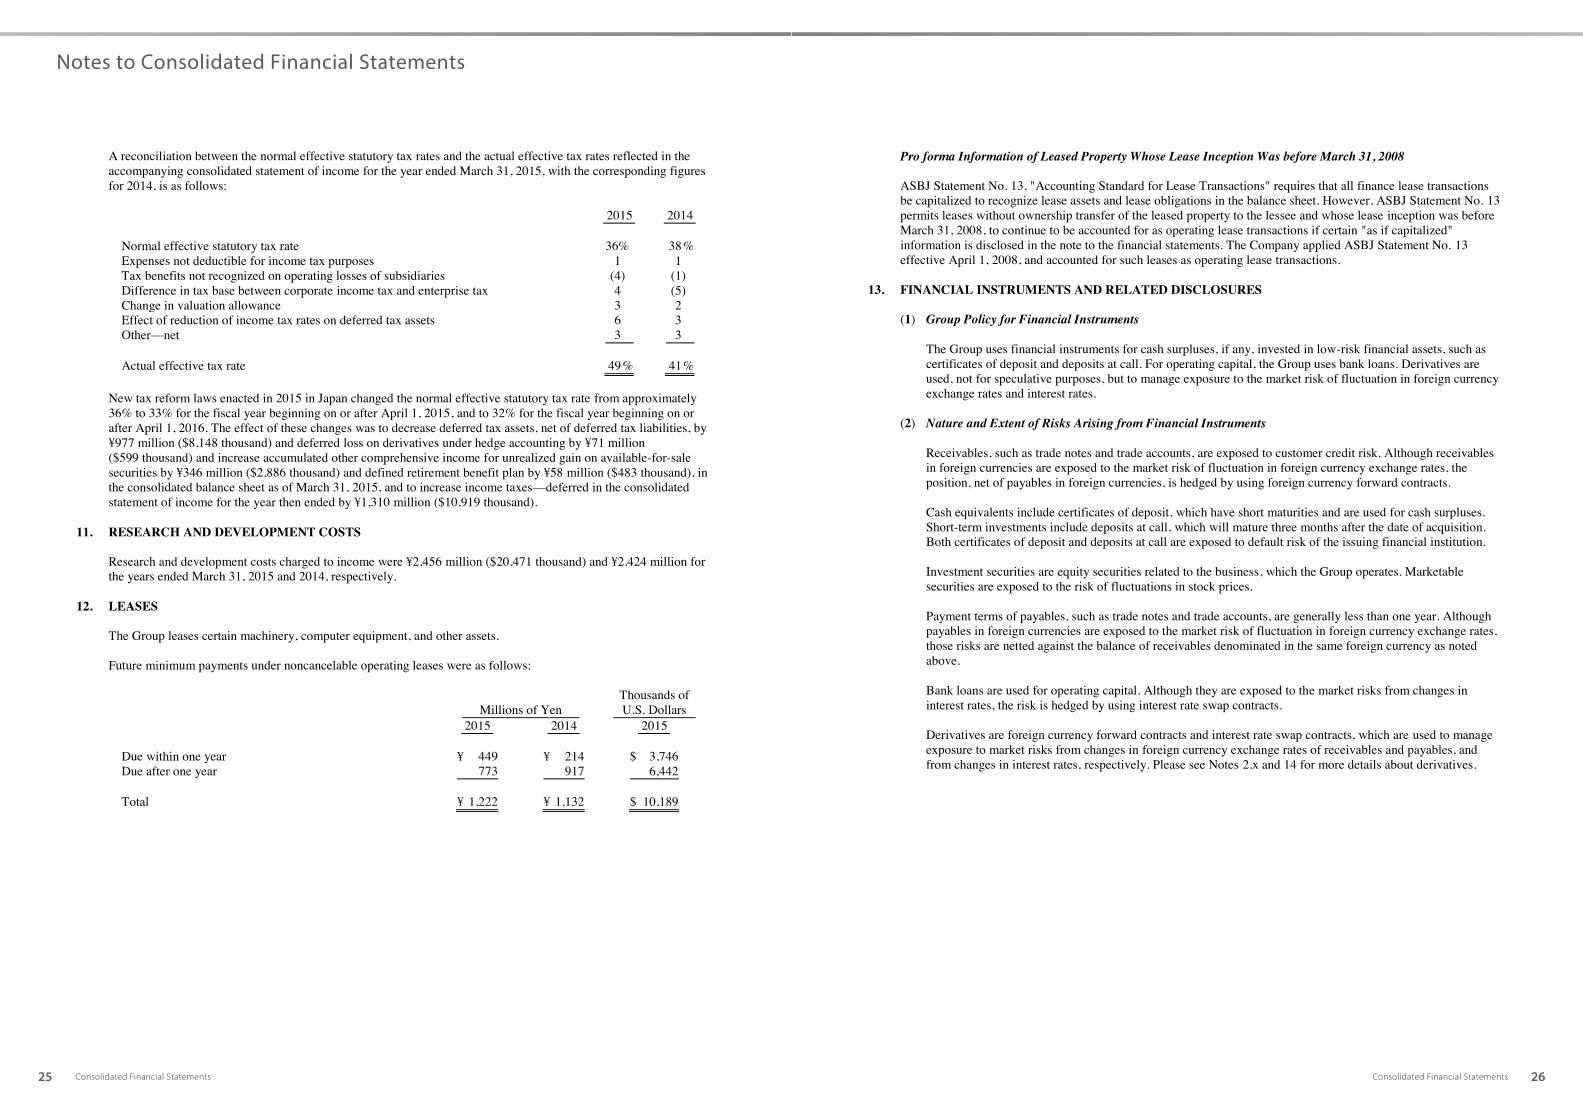
25 26Consolidated Financial Statements Consolidated Financial Statements
- 25 -
A reconciliation between the normal effective statutory tax rates and the actual effective tax rates reflected in the accompanying consolidated statement of income for the year ended March 31, 2015, with the corresponding figures for 2014, is as follows:
2015 2014
Normal effective statutory tax rate 36% 38 % Expenses not deductible for income tax purposes 1 1 Tax benefits not recognized on operating losses of subsidiaries (4) (1) Difference in tax base between corporate income tax and enterprise tax 4 (5) Change in valuation allowance 3 2 Effect of reduction of income tax rates on deferred tax assets 6 3 Other—net 3 3 Actual effective tax rate 49 % 41 %
New tax reform laws enacted in 2015 in Japan changed the normal effective statutory tax rate from approximately
36% to 33% for the fiscal year beginning on or after April 1, 2015, and to 32% for the fiscal year beginning on or after April 1, 2016. The effect of these changes was to decrease deferred tax assets, net of deferred tax liabilities, by ¥977 million ($8,148 thousand) and deferred loss on derivatives under hedge accounting by ¥71 million ($599 thousand) and increase accumulated other comprehensive income for unrealized gain on available-for-sale securities by ¥346 million ($2,886 thousand) and defined retirement benefit plan by ¥58 million ($483 thousand), in the consolidated balance sheet as of March 31, 2015, and to increase income taxes—deferred in the consolidated statement of income for the year then ended by ¥1,310 million ($10,919 thousand).
11. RESEARCH AND DEVELOPMENT COSTS
Research and development costs charged to income were ¥2,456 million ($20,471 thousand) and ¥2,424 million for the years ended March 31, 2015 and 2014, respectively.
12. LEASES
The Group leases certain machinery, computer equipment, and other assets. Future minimum payments under noncancelable operating leases were as follows:
Millions of Yen Thousands of U.S. Dollars
2015 2014 2015
Due within one year ¥ 449 ¥ 214 $ 3,746 Due after one year 773 917 6,442 Total ¥ 1,222 ¥ 1,132 $ 10,189
- 26 -
Pro forma Information of Leased Property Whose Lease Inception Was before March 31, 2008 ASBJ Statement No. 13, "Accounting Standard for Lease Transactions" requires that all finance lease transactions be capitalized to recognize lease assets and lease obligations in the balance sheet. However, ASBJ Statement No. 13 permits leases without ownership transfer of the leased property to the lessee and whose lease inception was before March 31, 2008, to continue to be accounted for as operating lease transactions if certain "as if capitalized" information is disclosed in the note to the financial statements. The Company applied ASBJ Statement No. 13 effective April 1, 2008, and accounted for such leases as operating lease transactions.
13. FINANCIAL INSTRUMENTS AND RELATED DISCLOSURES
(1) Group Policy for Financial Instruments The Group uses financial instruments for cash surpluses, if any, invested in low-risk financial assets, such as certificates of deposit and deposits at call. For operating capital, the Group uses bank loans. Derivatives are used, not for speculative purposes, but to manage exposure to the market risk of fluctuation in foreign currency exchange rates and interest rates.
(2) Nature and Extent of Risks Arising from Financial Instruments
Receivables, such as trade notes and trade accounts, are exposed to customer credit risk. Although receivables in foreign currencies are exposed to the market risk of fluctuation in foreign currency exchange rates, the position, net of payables in foreign currencies, is hedged by using foreign currency forward contracts. Cash equivalents include certificates of deposit, which have short maturities and are used for cash surpluses. Short-term investments include deposits at call, which will mature three months after the date of acquisition. Both certificates of deposit and deposits at call are exposed to default risk of the issuing financial institution. Investment securities are equity securities related to the business, which the Group operates. Marketable securities are exposed to the risk of fluctuations in stock prices. Payment terms of payables, such as trade notes and trade accounts, are generally less than one year. Although payables in foreign currencies are exposed to the market risk of fluctuation in foreign currency exchange rates, those risks are netted against the balance of receivables denominated in the same foreign currency as noted above. Bank loans are used for operating capital. Although they are exposed to the market risks from changes in interest rates, the risk is hedged by using interest rate swap contracts. Derivatives are foreign currency forward contracts and interest rate swap contracts, which are used to manage exposure to market risks from changes in foreign currency exchange rates of receivables and payables, and from changes in interest rates, respectively. Please see Notes 2.x and 14 for more details about derivatives.
Notes to Consolidated Financial Statements
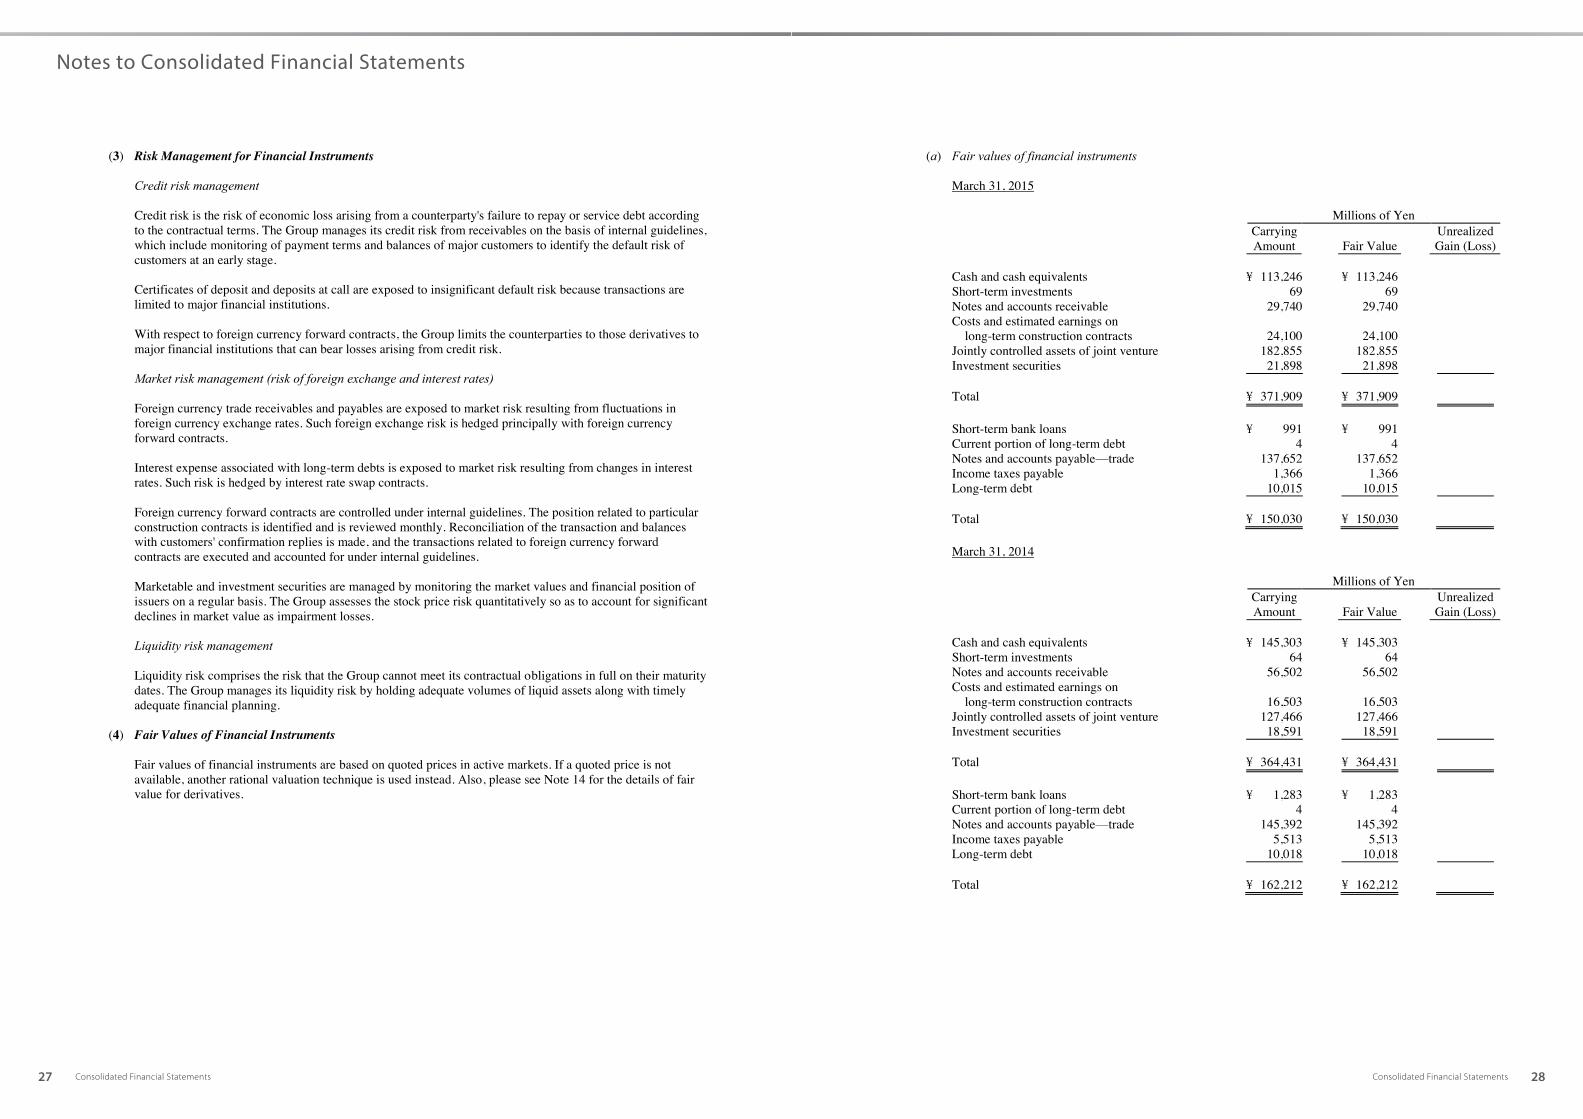
27 28Consolidated Financial Statements Consolidated Financial Statements
- 27 -
(3) Risk Management for Financial Instruments Credit risk management Credit risk is the risk of economic loss arising from a counterparty's failure to repay or service debt according to the contractual terms. The Group manages its credit risk from receivables on the basis of internal guidelines, which include monitoring of payment terms and balances of major customers to identify the default risk of customers at an early stage. Certificates of deposit and deposits at call are exposed to insignificant default risk because transactions are limited to major financial institutions. With respect to foreign currency forward contracts, the Group limits the counterparties to those derivatives to major financial institutions that can bear losses arising from credit risk. Market risk management (risk of foreign exchange and interest rates) Foreign currency trade receivables and payables are exposed to market risk resulting from fluctuations in foreign currency exchange rates. Such foreign exchange risk is hedged principally with foreign currency forward contracts. Interest expense associated with long-term debts is exposed to market risk resulting from changes in interest rates. Such risk is hedged by interest rate swap contracts. Foreign currency forward contracts are controlled under internal guidelines. The position related to particular construction contracts is identified and is reviewed monthly. Reconciliation of the transaction and balances with customers' confirmation replies is made, and the transactions related to foreign currency forward contracts are executed and accounted for under internal guidelines. Marketable and investment securities are managed by monitoring the market values and financial position of issuers on a regular basis. The Group assesses the stock price risk quantitatively so as to account for significant declines in market value as impairment losses. Liquidity risk management Liquidity risk comprises the risk that the Group cannot meet its contractual obligations in full on their maturity dates. The Group manages its liquidity risk by holding adequate volumes of liquid assets along with timely adequate financial planning.
(4) Fair Values of Financial Instruments
Fair values of financial instruments are based on quoted prices in active markets. If a quoted price is not available, another rational valuation technique is used instead. Also, please see Note 14 for the details of fair value for derivatives.
- 28 -
(a) Fair values of financial instruments March 31, 2015
Millions of Yen
Carrying Amount Fair Value
Unrealized Gain (Loss)
Cash and cash equivalents ¥ 113,246 ¥ 113,246 Short-term investments 69 69 Notes and accounts receivable 29,740 29,740 Costs and estimated earnings on long-term construction contracts 24,100 24,100 Jointly controlled assets of joint venture 182,855 182,855 Investment securities 21,898 21,898 Total ¥ 371,909 ¥ 371,909 Short-term bank loans ¥ 991 ¥ 991 Current portion of long-term debt 4 4 Notes and accounts payable—trade 137,652 137,652 Income taxes payable 1,366 1,366 Long-term debt 10,015 10,015 Total ¥ 150,030 ¥ 150,030
March 31, 2014
Millions of Yen
Carrying Amount Fair Value
Unrealized Gain (Loss)
Cash and cash equivalents ¥ 145,303 ¥ 145,303 Short-term investments 64 64 Notes and accounts receivable 56,502 56,502 Costs and estimated earnings on long-term construction contracts 16,503 16,503 Jointly controlled assets of joint venture 127,466 127,466 Investment securities 18,591 18,591 Total ¥ 364,431 ¥ 364,431 Short-term bank loans ¥ 1,283 ¥ 1,283 Current portion of long-term debt 4 4 Notes and accounts payable—trade 145,392 145,392 Income taxes payable 5,513 5,513 Long-term debt 10,018 10,018 Total ¥ 162,212 ¥ 162,212
Notes to Consolidated Financial Statements

29 30Consolidated Financial Statements Consolidated Financial Statements
- 29 -
March 31, 2015
Thousands of U.S. Dollars
Carrying Amount Fair Value
Unrealized Gain (Loss)
Cash and cash equivalents $ 943,719 $ 943,719 Short-term investments 575 575 Notes and accounts receivable 247,838 247,838 Costs and estimated earnings on long-term construction contracts 200,834 200,834 Jointly controlled assets of joint venture 1,523,793 1,523,793 Investment securities 182,485 182,485 Total $ 3,099,248 $ 3,099,248 Short-term bank loans $ 8,258 $ 8,258 Current portion of long-term debt 40 40 Notes and accounts payable—trade 1,147,104 1,147,104 Income taxes payable 11,384 11,384 Long-term debt 83,462 83,462 Total $ 1,250,250 $ 1,250,250
Cash and Cash Equivalents, Short-Term Investments, Notes and Accounts Receivable, and Costs and
Estimated Earnings on Long-Term Construction Contracts The carrying values of the accounts mentioned above approximate fair value because of their short maturities. Jointly Controlled Assets of Joint Venture The jointly controlled assets of the joint venture are jointly controlled cash recognized based on the Company's share of the venture. The carrying values of jointly controlled assets of the joint venture approximate fair value because of their short maturities. Investment Securities The fair values of investment securities are measured at the quoted market price of the stock exchange for the equity instruments. Fair value information for investment securities by classification is included in Note 4. The above schedules do not include investment securities whose fair value cannot be reliably determined. Short-Term Bank Loans, Notes and Accounts Payable—Trade and Income Taxes Payable The carrying values of the accounts mentioned above approximate fair value because of their short maturities.
- 30 -
Current Portion of Long-Term Debt (Bank Loans) and Long-Term Debt (Bank Loans) The fair value of fixed rate loans is calculated by discounting total principal and interest payments to present value using a discount rate equal to the rate that would be charged if the loan was newly borrowed. The fair value of floating rate loans, which are subject to a specific method for interest rate swaps, is calculated by discounting total principal and interest payments, which are handled together with interest rate swaps, to present value using a discount rate equal to the rate that would be charged if the loan was newly borrowed. Derivatives Fair value information for derivatives is included in Note 14.
(b) Carrying amount of financial instruments whose fair values cannot be reliably determined
Millions of Yen Thousands of U.S. Dollars
2015 2014 2015
Investment securities that do not have a quoted market price in an active market ¥ 2,038 ¥ 2,537 $ 16,990 Investments in equity instruments that do not have a quoted market price in an active market 2 2 24 Investments in unconsolidated subsidiaries and associated companies that do not have a quoted market price in an active market 7,387 7,183 61,566
The impairment losses on investment securities for the year ended March 31, 2015, were ¥258 million
($2,157 thousand).
(5) Maturity Analysis for Financial Assets and Securities with Contractual Maturities March 31, 2015
Millions of Yen
Due in 1 Year or Less
Due after 1 Year through 5 Years
Due after 5 Years through 10 Years
Cash and cash equivalents ¥ 113,206 Short-term investments 69 Notes and accounts receivable, and costs and estimated earnings on long-term construction contracts 52,285 ¥ 882 ¥ 672 Jointly controlled assets of joint venture 182,855 Total ¥ 348,415 ¥ 882 ¥ 672
Notes to Consolidated Financial Statements
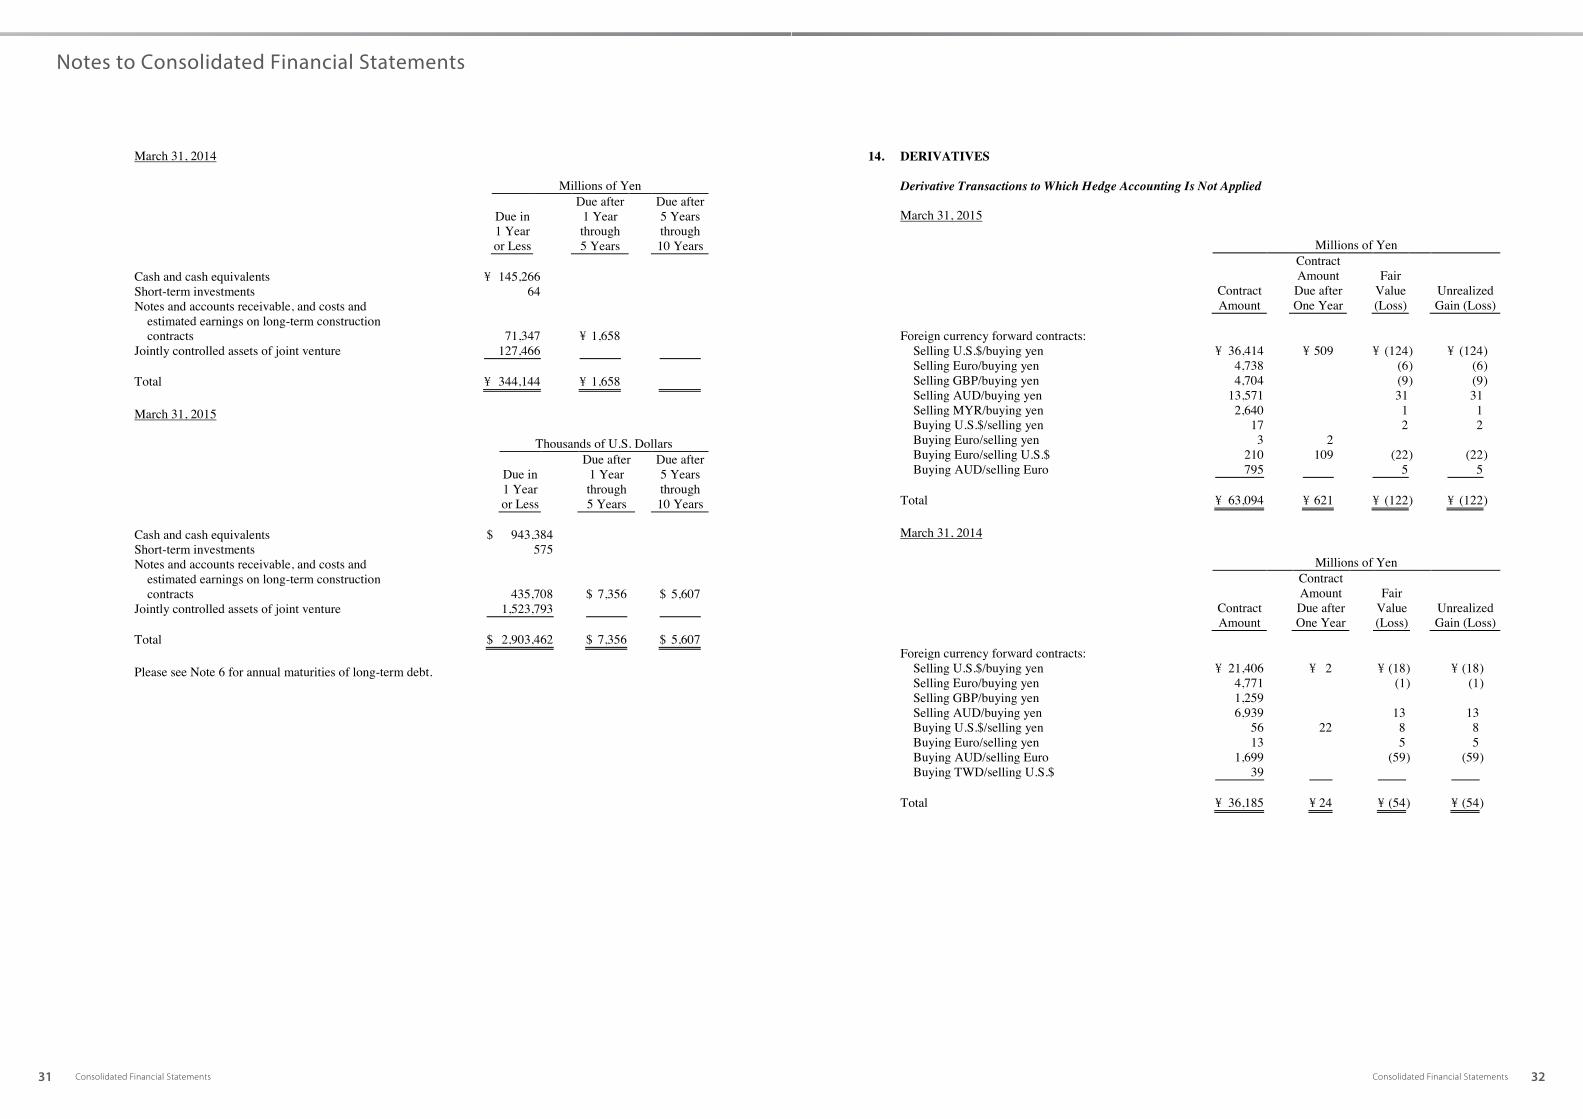
31 32Consolidated Financial Statements Consolidated Financial Statements
- 31 -
March 31, 2014
Millions of Yen
Due in 1 Year or Less
Due after 1 Year through 5 Years
Due after 5 Years through 10 Years
Cash and cash equivalents ¥ 145,266 Short-term investments 64 Notes and accounts receivable, and costs and estimated earnings on long-term construction contracts 71,347 ¥ 1,658 Jointly controlled assets of joint venture 127,466 Total ¥ 344,144 ¥ 1,658
March 31, 2015
Thousands of U.S. Dollars
Due in 1 Year or Less
Due after 1 Year through 5 Years
Due after 5 Years through 10 Years
Cash and cash equivalents $ 943,384 Short-term investments 575 Notes and accounts receivable, and costs and estimated earnings on long-term construction contracts 435,708 $ 7,356 $ 5,607 Jointly controlled assets of joint venture 1,523,793 Total $ 2,903,462 $ 7,356 $ 5,607
Please see Note 6 for annual maturities of long-term debt.
- 32 -
14. DERIVATIVES Derivative Transactions to Which Hedge Accounting Is Not Applied March 31, 2015
Millions of Yen
Contract Amount
Contract Amount Due after One Year
Fair Value (Loss)
Unrealized Gain (Loss)
Foreign currency forward contracts: Selling U.S.$/buying yen ¥ 36,414 ¥ 509 ¥ (124 ) ¥ (124 ) Selling Euro/buying yen 4,738 (6 ) (6 ) Selling GBP/buying yen 4,704 (9 ) (9 ) Selling AUD/buying yen 13,571 31 31 Selling MYR/buying yen 2,640 1 1 Buying U.S.$/selling yen 17 2 2 Buying Euro/selling yen 3 2 Buying Euro/selling U.S.$ 210 109 (22 ) (22 ) Buying AUD/selling Euro 795 5 5 Total ¥ 63,094 ¥ 621 ¥ (122 ) ¥ (122 )
March 31, 2014
Millions of Yen
Contract Amount
Contract Amount Due after One Year
Fair Value (Loss)
Unrealized Gain (Loss)
Foreign currency forward contracts: Selling U.S.$/buying yen ¥ 21,406 ¥ 2 ¥ (18 ) ¥ (18 ) Selling Euro/buying yen 4,771 (1 ) (1 ) Selling GBP/buying yen 1,259 Selling AUD/buying yen 6,939 13 13 Buying U.S.$/selling yen 56 22 8 8 Buying Euro/selling yen 13 5 5 Buying AUD/selling Euro 1,699 (59 ) (59 ) Buying TWD/selling U.S.$ 39 Total ¥ 36,185 ¥ 24 ¥ (54 ) ¥ (54 )
Notes to Consolidated Financial Statements

33 34Consolidated Financial Statements Consolidated Financial Statements
- 33 -
March 31, 2015
Thousands of U.S. Dollars
Contract Amount
Contract Amount Due after One Year
Fair Value (Loss)
Unrealized Gain (Loss)
Foreign currency forward contracts: Selling U.S.$/buying yen $ 303,456 $ 4,246 $ (1,034 ) $ (1,034 ) Selling Euro/buying yen 39,485 (52 ) (52 ) Selling GBP/buying yen 39,201 (82 ) (82 ) Selling AUD/buying yen 113,093 261 261 Selling MYR/buying yen 22,006 14 14 Buying U.S.$/selling yen 141 17 17 Buying Euro/selling yen 25 17 (3 ) (3 ) Buying Euro/selling U.S.$ 1,751 911 (187 ) (187 ) Buying AUD/selling Euro 6,627 49 49 Total $ 525,789 $ 5,176 $ (1,018 ) $ (1,018 )
Derivative Transactions to Which Hedge Accounting Is Applied
March 31, 2015
Millions of Yen
Hedged Item Contract Amount
Contract Amount Due after One Year
Fair Value (Loss)
Foreign currency forward contracts— Accounted for under deferred hedge accounting method:
Selling U.S.$/buying yen Foreign currency ¥ 16,971 ¥ 5,396 ¥ (2,295 ) Buying U.S.$/selling yen forecasted 673 207 36 Buying Euro/selling yen transaction 186 102 (19 ) Buying Euro/selling U.S.$ 7,271 726 (1,453 ) Buying KRW/selling U.S.$ 3,347 616 65 Total ¥ 28,450 ¥ 7,049 ¥ (3,666 ) Other*1: Selling U.S.$/buying yen Receivables ¥ 342 Buying U.S.$/selling yen Payables 242 ¥ 28 Buying Euro/selling yen 100 Total ¥ 685 ¥ 28 Interest rate swaps*2 (fixed rate payment, floating rate receipt)
Long-term debt ¥ 10,000 ¥ 10,000
Total ¥ 10,000 ¥ 10,000
- 34 -
March 31, 2014
Millions of Yen
Hedged Item Contract Amount
Contract Amount Due after One Year
Fair Value (Loss)
Foreign currency forward contracts— Accounted for under deferred hedge accounting method:
Selling U.S.$/buying yen Foreign currency ¥ 9,921 ¥ 5,689 ¥ (405 ) Buying U.S.$/selling yen forecasted 909 193 29 Buying Euro/selling yen transaction 22 7 Buying Euro/selling U.S.$ 10,074 5,329 296 Buying TWD/selling U.S.$ 84 (1 ) Buying KRW/selling U.S.$ 4,029 2,766 184 Total ¥ 25,041 ¥ 13,978 ¥ 111 Other*1: Selling U.S.$/buying yen Receivables ¥ 32 Buying U.S.$/selling yen Payables 365 Buying Euro/selling yen 186 Total ¥ 584 Interest rate swaps*2 (fixed rate payment, floating rate receipt)
Long-term debt ¥ 10,000 ¥ 10,000
Total ¥ 10,000 ¥ 10,000
Notes to Consolidated Financial Statements
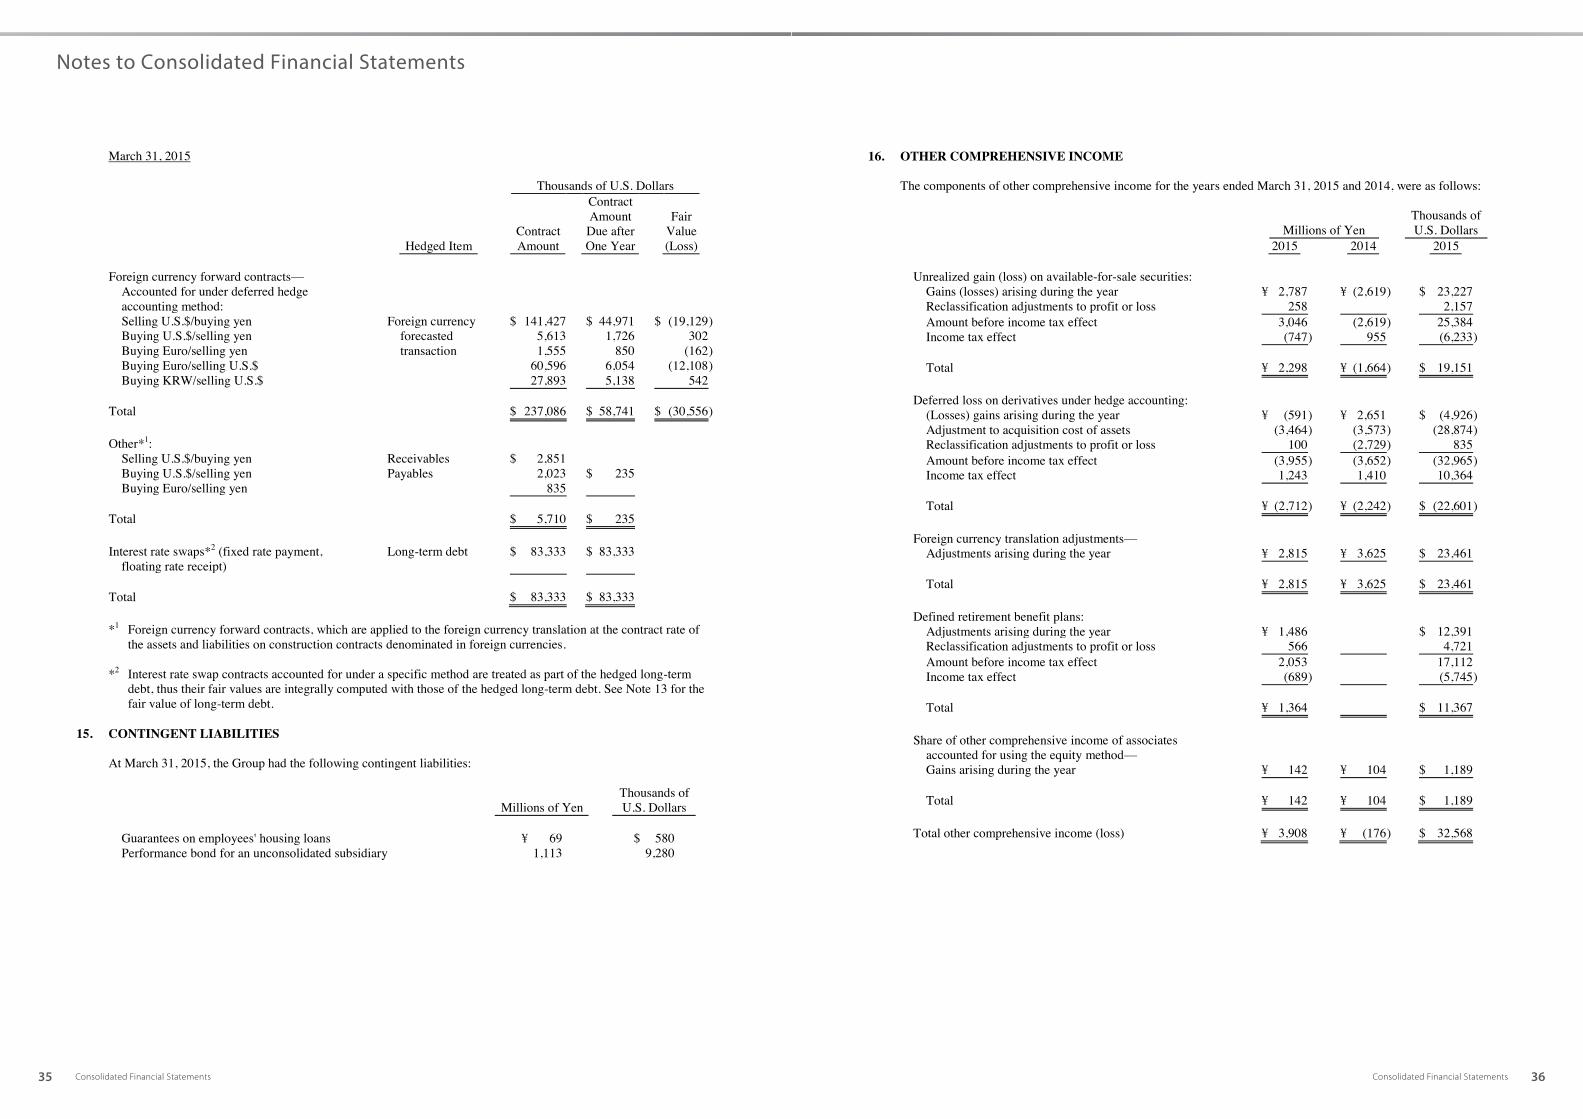
35 36Consolidated Financial Statements Consolidated Financial Statements
- 35 -
March 31, 2015
Thousands of U.S. Dollars
Hedged Item Contract Amount
Contract Amount Due after One Year
Fair Value (Loss)
Foreign currency forward contracts— Accounted for under deferred hedge accounting method:
Selling U.S.$/buying yen Foreign currency $ 141,427 $ 44,971 $ (19,129 ) Buying U.S.$/selling yen forecasted 5,613 1,726 302 Buying Euro/selling yen transaction 1,555 850 (162 ) Buying Euro/selling U.S.$ 60,596 6,054 (12,108 ) Buying KRW/selling U.S.$ 27,893 5,138 542 Total $ 237,086 $ 58,741 $ (30,556 ) Other*1: Selling U.S.$/buying yen Receivables $ 2,851 Buying U.S.$/selling yen Payables 2,023 $ 235 Buying Euro/selling yen 835 Total $ 5,710 $ 235 Interest rate swaps*2 (fixed rate payment, floating rate receipt)
Long-term debt $ 83,333 $ 83,333
Total $ 83,333 $ 83,333
*1 Foreign currency forward contracts, which are applied to the foreign currency translation at the contract rate of
the assets and liabilities on construction contracts denominated in foreign currencies. *2 Interest rate swap contracts accounted for under a specific method are treated as part of the hedged long-term
debt, thus their fair values are integrally computed with those of the hedged long-term debt. See Note 13 for the fair value of long-term debt.
15. CONTINGENT LIABILITIES
At March 31, 2015, the Group had the following contingent liabilities:
Millions of Yen Thousands of U.S. Dollars
Guarantees on employees' housing loans ¥ 69 $ 580 Performance bond for an unconsolidated subsidiary 1,113 9,280
- 36 -
16. OTHER COMPREHENSIVE INCOME The components of other comprehensive income for the years ended March 31, 2015 and 2014, were as follows:
Millions of Yen Thousands of U.S. Dollars
2015 2014 2015
Unrealized gain (loss) on available-for-sale securities: Gains (losses) arising during the year ¥ 2,787 ¥ (2,619 ) $ 23,227 Reclassification adjustments to profit or loss 258 2,157 Amount before income tax effect 3,046 (2,619 ) 25,384 Income tax effect (747 ) 955 (6,233 ) Total ¥ 2,298 ¥ (1,664 ) $ 19,151 Deferred loss on derivatives under hedge accounting: (Losses) gains arising during the year ¥ (591 ) ¥ 2,651 $ (4,926 ) Adjustment to acquisition cost of assets (3,464 ) (3,573 ) (28,874 ) Reclassification adjustments to profit or loss 100 (2,729 ) 835 Amount before income tax effect (3,955 ) (3,652 ) (32,965 ) Income tax effect 1,243 1,410 10,364 Total ¥ (2,712 ) ¥ (2,242 ) $ (22,601 ) Foreign currency translation adjustments— Adjustments arising during the year ¥ 2,815 ¥ 3,625 $ 23,461 Total ¥ 2,815 ¥ 3,625 $ 23,461 Defined retirement benefit plans: Adjustments arising during the year ¥ 1,486 $ 12,391 Reclassification adjustments to profit or loss 566 4,721 Amount before income tax effect 2,053 17,112 Income tax effect (689 ) (5,745 ) Total ¥ 1,364 $ 11,367 Share of other comprehensive income of associates accounted for using the equity method— Gains arising during the year ¥ 142 ¥ 104 $ 1,189 Total ¥ 142 ¥ 104 $ 1,189 Total other comprehensive income (loss) ¥ 3,908 ¥ (176 ) $ 32,568
Notes to Consolidated Financial Statements
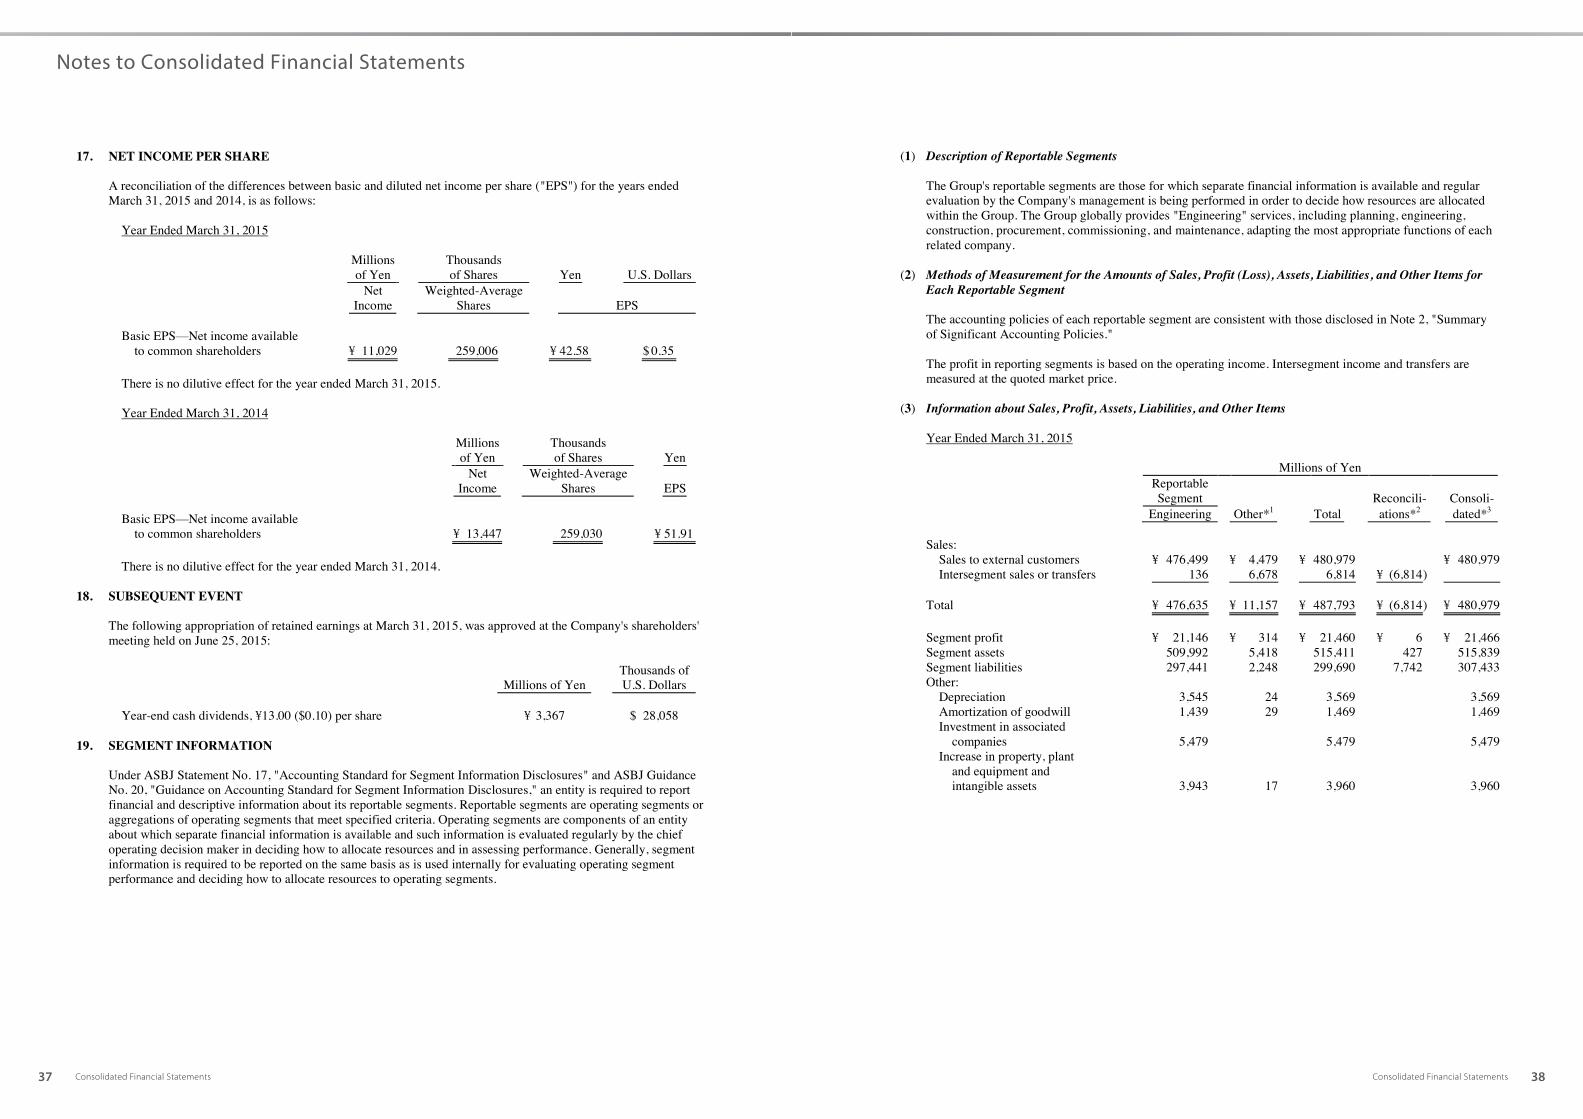
37 38Consolidated Financial Statements Consolidated Financial Statements
- 37 -
17. NET INCOME PER SHARE A reconciliation of the differences between basic and diluted net income per share ("EPS") for the years ended March 31, 2015 and 2014, is as follows:
Year Ended March 31, 2015
Millions of Yen
Thousands of Shares Yen U.S. Dollars
Net
Income Weighted-Average
Shares EPS
Basic EPS—Net income available to common shareholders ¥ 11,029 259,006 ¥ 42.58 $ 0.35
There is no dilutive effect for the year ended March 31, 2015. Year Ended March 31, 2014
Millions of Yen
Thousands of Shares Yen
Net
Income Weighted-Average
Shares EPS
Basic EPS—Net income available to common shareholders ¥ 13,447 259,030 ¥ 51.91
There is no dilutive effect for the year ended March 31, 2014.
18. SUBSEQUENT EVENT The following appropriation of retained earnings at March 31, 2015, was approved at the Company's shareholders' meeting held on June 25, 2015:
Millions of Yen Thousands of U.S. Dollars
Year-end cash dividends, ¥13.00 ($0.10) per share ¥ 3,367 $ 28,058
19. SEGMENT INFORMATION
Under ASBJ Statement No. 17, "Accounting Standard for Segment Information Disclosures" and ASBJ Guidance No. 20, "Guidance on Accounting Standard for Segment Information Disclosures," an entity is required to report financial and descriptive information about its reportable segments. Reportable segments are operating segments or aggregations of operating segments that meet specified criteria. Operating segments are components of an entity about which separate financial information is available and such information is evaluated regularly by the chief operating decision maker in deciding how to allocate resources and in assessing performance. Generally, segment information is required to be reported on the same basis as is used internally for evaluating operating segment performance and deciding how to allocate resources to operating segments.
- 38 -
(1) Description of Reportable Segments The Group's reportable segments are those for which separate financial information is available and regular evaluation by the Company's management is being performed in order to decide how resources are allocated within the Group. The Group globally provides "Engineering" services, including planning, engineering, construction, procurement, commissioning, and maintenance, adapting the most appropriate functions of each related company.
(2) Methods of Measurement for the Amounts of Sales, Profit (Loss), Assets, Liabilities, and Other Items for
Each Reportable Segment The accounting policies of each reportable segment are consistent with those disclosed in Note 2, "Summary of Significant Accounting Policies." The profit in reporting segments is based on the operating income. Intersegment income and transfers are measured at the quoted market price.
(3) Information about Sales, Profit, Assets, Liabilities, and Other Items
Year Ended March 31, 2015
Millions of Yen
Reportable Segment Reconcili- Consoli-
Engineering Other*1 Total ations*2 dated*3
Sales: Sales to external customers ¥ 476,499 ¥ 4,479 ¥ 480,979 ¥ 480,979 Intersegment sales or transfers 136 6,678 6,814 ¥ (6,814 ) Total ¥ 476,635 ¥ 11,157 ¥ 487,793 ¥ (6,814 ) ¥ 480,979 Segment profit ¥ 21,146 ¥ 314 ¥ 21,460 ¥ 6 ¥ 21,466 Segment assets 509,992 5,418 515,411 427 515,839 Segment liabilities 297,441 2,248 299,690 7,742 307,433 Other: Depreciation 3,545 24 3,569 3,569 Amortization of goodwill 1,439 29 1,469 1,469 Investment in associated companies 5,479 5,479 5,479 Increase in property, plant and equipment and intangible assets 3,943 17 3,960 3,960
Notes to Consolidated Financial Statements

39 40Consolidated Financial Statements Consolidated Financial Statements
- 39 -
Year Ended March 31, 2014
Millions of Yen
Reportable Segment Reconcili- Consoli-
Engineering Other*1 Total ations*2 dated*3
Sales: Sales to external customers ¥ 441,615 ¥ 4,532 ¥ 446,147 ¥ 446,147 Intersegment sales or transfers 14 6,280 6,295 ¥ (6,295 ) Total ¥ 441,629 ¥ 10,813 ¥ 452,443 ¥ (6,295 ) ¥ 446,147 Segment profit ¥ 20,788 ¥ 282 ¥ 21,070 ¥ 8 ¥ 21,079 Segment assets 470,188 4,773 474,961 326 475,288 Segment liabilities 267,501 1,781 269,283 7,973 277,257 Other: Depreciation 3,175 21 3,196 3,196 Amortization of goodwill 795 29 825 825 Investment in associated companies 5,375 5,375 5,375 Increase in property, plant and equipment and intangible assets 4,126 27 4,154 4,154
Year Ended March 31, 2015
Thousands of U.S. Dollars
Reportable Segment Reconcili- Consoli-
Engineering Other*1 Total ations*2 dated*3
Sales: Sales to external customers $ 3,970,828 $ 37,332 $ 4,008,160 $ 4,008,160 Intersegment sales or transfers 1,135 55,650 56,786 $ (56,786 ) Total $ 3,971,964 $ 92,982 $ 4,064,947 $ (56,786 ) $ 4,008,160 Segment profit $ 176,217 $ 2,618 $ 178,835 $ 53 $ 178,889 Segment assets 4,249,937 45,156 4,295,094 3,566 4,298,660 Segment liabilities 2,478,681 18,740 2,497,422 64,522 2,561,944 Other: Depreciation 29,545 200 29,745 29,745 Amortization of goodwill 11,998 249 12,248 12,248 Investment in associated companies 45,663 45,663 45,663 Increase in property, plant and equipment and intangible assets 32,858 144 33,003 33,003
- 40 -
Notes for the year ended March 31, 2015: *1 "Other" represents industry segments, which are not included in the reportable segment, consisting of
temporary staffing services and travel services. *2 The details of the reconciliations are as follows:
(1) The reconciliation in segment profit of ¥6 million ($53 thousand) is the elimination of intersegment trades.
(2) The reconciliation in segment assets of ¥427 million ($3,566 thousand) is the result of the elimination
of intersegment trades of ¥(2,275) million ($(18,962) thousand) and the Group's assets of ¥2,703 million ($22,528 thousand), which are not included in the reportable segment.
(3) The reconciliation in segment liabilities of ¥7,742 million ($64,522 thousand) is the result of the
elimination of intersegment trades of ¥(2,257) million ($(18,811) thousand) and the Group's liabilities of ¥10,000 million ($83,333 thousand), which are not included in the reportable segment.
*3 The calculation of the segment profit is based on the operating income in the consolidated statement of
income. Notes for the year ended March 31, 2014: *1 "Other" represents industry segments, which are not included in the reportable segment, consisting of
temporary staffing services and travel services. *2 The details of the reconciliations are as follows:
(1) The reconciliation in segment profit of ¥8 million is the elimination of intersegment trades. (2) The reconciliation in segment assets of ¥326 million is the result of the elimination of intersegment
trades of ¥(2,047) million and the Group's assets of ¥2,374 million, which are not included in the reportable segment.
(3) The reconciliation in segment liabilities of ¥7,973 million is the result of the elimination of
intersegment trades of ¥(2,026) million and the Group's liabilities of ¥10,000 million, which are not included in the reportable segment.
*3 The calculation of the segment profit is based on the operating income in the consolidated statement of
income.
Related Information (1) Information about Products and Services
The proportion of engineering business is more than 90% of the total sales of the Group. Accordingly, the presentation of the information about each service is not required under Japanese accounting standards.
Notes to Consolidated Financial Statements

41 42Consolidated Financial Statements Consolidated Financial Statements
- 41 -
(2) Information about Geographical Areas
(a) Revenue Year Ended March 31, 2015
Millions of Yen Thousands of U.S. Dollars
Japan ¥ 113,341 $ 944,508 Australia 151,255 1,260,461 Russia 52,087 434,059 Asia 73,935 616,128 Middle East 50,624 421,869 Others 39,735 331,133 Total ¥ 480,979 $ 4,008,160
Year Ended March 31, 2014
Millions of Yen
Japan ¥ 128,743 Australia 114,894 Papua New Guinea 68,990 Malaysia 53,380 Others 80,138 Total ¥ 446,147
Note: Revenue is classified by country or region based on the location of construction sites.
(b) Property, plant and equipment Year Ended March 31, 2015
Millions of Yen Thousands of U.S. Dollars
Japan ¥ 12,183 $ 101,530 Asia 1,974 16,453 Others 668 5,571 Total ¥ 14,826 $ 123,555
- 42 -
Year Ended March 31, 2014
Millions of Yen
Japan ¥ 12,454 Asia 1,746 Others 757 Total ¥ 14,958
(3) Information about Major Customers
Year Ended March 31, 2015
Millions of Yen Thousands of U.S. Dollars
Name Related Segment Revenue Revenue
Ichthys Lng Pty Ltd. Engineering ¥ 143,688 $ 1,197,404 OJSC Yamal LNG Engineering 51,948 432,900
Year Ended March 31, 2014
Millions of Yen Name Related Segment Revenue
Ichthys Lng Pty Ltd. Engineering ¥ 109,964 Esso Highlands Ltd. Engineering 68,788 Tokuyama Malaysia Sdn. Bhd Engineering 49,934
(4) Information about Goodwill by Segment
The ending balance of goodwill as of March 31, 2015 and 2014, was as follows:
Millions of Yen Thousands of U.S. Dollars
2015 2014 2015
Engineering ¥ 11,599 ¥ 11,930 $ 96,658 Other* 434 464 3,624 Total ¥ 12,034 ¥ 12,395 $ 100,283
* Other involves temporary staffing services.
* * * * * *
Notes to Consolidated Financial Statements

43 Consolidated Financial Statements
Independent Auditor’s Report
CORPORATE PHILOSOPHY
Enhance our business in aiming for harmonybetween energy and the environment, and contribute to the sustainable development of a society as an integrated engineering companythrough the use of our collective wisdom andpainstakingly developed technology.
Minato Mirai Grand Central Tower4-6-2, Minatomirai, Nishi-ku, Yokohama 220-8765, JapanTel: (81)45-225-7777 (voice guidance)http://www.chiyoda-corp.com/en/
(As of August 2015)
Selected in FTSE Group’s responsibleinvestment index


