ASX ANNOUNCEMENT 2019 Annual Report 30 September 2019 www.strandline.com.au Page | 1 Annual Report for the year ended 30 June 2019 HIGHLIGHTS Strandline Resources (ASX: STA) is pleased to release its Annual Report for the 12 months to June 30, 2019. The Report highlights the strong progress the Company has made over the past year as it moves towards its goal of becoming a global mineral sands producer with projects of varying scale and geographical diversity. During the year, Strandline advanced each of its projects through a combination of rapid exploration activity and technical and financial assessment. As a result of our success on these fronts, our pipeline of assets continued its shift towards development and, ultimately, production and cashflow. The Company’s key achievements during the year included: • Completed Definitive Feasibility Study (DFS) and commenced financing for two major mineral sands projects (the Fungoni and Coburn projects), with a combined Net Present Value (NPV) of over A$600 million • Expanded global JORC-Compliant Mineral Resources by over 65% to 29Mt of contained Heavy Mineral (HM) • Strandline’s global Resources are now undeniably world-scale and include 4.7Mt of contained zircon, 2.9Mt of rutile-leucoxene, 14.9Mt of ilmenite and other valuable minerals of monazite and garnet • At the Fungoni in Tanzania: - Project financing advancing following a completed DFS, which resulted in significant increases in forecast financial returns and reduced implementation risk - Project pre-tax NPV is US$48.7m (A$64.9m at USD:AUD 0.75, 10% discount rate) - Project pre-tax IRR is 61% with a first quartile revenue-to-cost ratio of 2.8 - Mining Licence granted by the new Tanzanian Mining Commission - Binding sales contracts secured for 100% of forecast revenue – third and final offtake agreement signed underpinning product sales for the life of the Fungoni mine - EPC Contract executed with GR Engineering Services for Fungoni’s process infrastructure; other major non-process infrastructure contracts also advanced in accordance with the project schedule - Strandline mandated Nedbank CIB, which then executed a Credit-Approved Term Sheet to underwrite a US$26 million Project Finance Facility (Facility) • At the Coburn Project in WA: - The JORC-Compliant Mineral Resource Estimate increased by 64% to 1.6Bt at 1.2% Total Heavy Minerals (THM), up from 979Mt, further enhancing the project’s geological robustness and scale - Contained HM content rose to 19.6Mt from 12.3Mt, comprising a high-value mineral assemblage with in-situ zircon 4.3Mt, rutile 1.4Mt, leucoxene 1.0Mt and ilmenite 9.4Mt - DFS completed showing Coburn will generate strong financial returns with a pre-tax NPV of A$551m (USD:AUD 0.72, 8% discount rate) and a pre-tax IRR of 32% For personal use only
Transcript
ASX ANNOUNCEMENT 2019 Annual Report
30 September 2019
www.strandline.com.au Page | 1
Annual Report for the year ended 30 June 2019
HIGHLIGHTS
Strandline Resources (ASX: STA) is pleased to release its Annual Report for the 12 months to June 30, 2019.
The Report highlights the strong progress the Company has made over the past year as it moves towards its goal of becoming a global mineral sands producer with projects of varying scale and geographical diversity.
During the year, Strandline advanced each of its projects through a combination of rapid exploration activity and technical and financial assessment. As a result of our success on these fronts, our pipeline of assets continued its shift towards development and, ultimately, production and cashflow.
The Company’s key achievements during the year included:
• Completed Definitive Feasibility Study (DFS) and commenced financing for two major mineral sands projects (the Fungoni and Coburn projects), with a combined Net Present Value (NPV) of over A$600 million
• Expanded global JORC-Compliant Mineral Resources by over 65% to 29Mt of contained Heavy Mineral (HM)
• Strandline’s global Resources are now undeniably world-scale and include 4.7Mt of contained zircon, 2.9Mt of rutile-leucoxene, 14.9Mt of ilmenite and other valuable minerals of monazite and garnet
• At the Fungoni in Tanzania:
- Project financing advancing following a completed DFS, which resulted in significant increases in forecast financial returns and reduced implementation risk
- Project pre-tax NPV is US$48.7m (A$64.9m at USD:AUD 0.75, 10% discount rate)
- Project pre-tax IRR is 61% with a first quartile revenue-to-cost ratio of 2.8
- Mining Licence granted by the new Tanzanian Mining Commission
- Binding sales contracts secured for 100% of forecast revenue – third and final offtake agreement signed underpinning product sales for the life of the Fungoni mine
- EPC Contract executed with GR Engineering Services for Fungoni’s process infrastructure; other major non-process infrastructure contracts also advanced in accordance with the project schedule
- Strandline mandated Nedbank CIB, which then executed a Credit-Approved Term Sheet to underwrite a US$26 million Project Finance Facility (Facility)
• At the Coburn Project in WA:
- The JORC-Compliant Mineral Resource Estimate increased by 64% to 1.6Bt at 1.2% Total Heavy Minerals (THM), up from 979Mt, further enhancing the project’s geological robustness and scale
- Contained HM content rose to 19.6Mt from 12.3Mt, comprising a high-value mineral assemblage with in-situ zircon 4.3Mt, rutile 1.4Mt, leucoxene 1.0Mt and ilmenite 9.4Mt
- DFS completed showing Coburn will generate strong financial returns with a pre-tax NPV of A$551m (USD:AUD 0.72, 8% discount rate) and a pre-tax IRR of 32%
- DFS shows Life of Mine (LOM) revenue of A$3.9b and LOM EBITDA of A$1.9b, with an attractive revenue-to-operating cost ratio of 2.2, based on TZMI’s Feburary-2019 commodity price forecast
- 70% increase in JORC-Complaint Ore Reserves to 523Mt @ 1.11% Total Heavy Mineral (THM); This underpins an initial mine life of 22.5 years at the planned mining rate of 23.4Mtpa
- Key project approvals already in place (environmental, native title, heritage and mining), making Coburn construction-ready pending finalisation of project financing
- Engagement with global consumers confirms high demand for Coburn’s products in both concentrate and final product form, which opens the door to a wide range of offtake and investment options
• At the Tajiri project in Tanzania:
- Tajiri confirmed as a world-scale mineral sands deposit with 80% Mineral Resource increase to 268Mt @ 3.3% THM, up from 147Mt, and with significant exploration upside
- All Tajiri resources start from surface, with no overburden and contain large coherent high-grade domains comprising mostly high-value titanium-dominated mineral assemblage
- Contained HM content rose to 8.8Mt, up 91% from 4.6Mt, with in-situ rutile 580,000t, zircon 335,000t, ilmenite 5,206,000t and almandine garnet 1,477,000t
- Tajiri underpins Strandline’s outstanding long-term production outlook in Tanzania
Refer to the full Annual Report dated 30 September 2019.
For further enquiries, please contact: Luke Graham CEO and Managing Director Strandline Resources Limited T: +61 8 9226 3130 E: [email protected]
For media and broker enquiries: Paul Armstrong Read Corporate T: +61 8 9388 1474 E: [email protected]
Full details on the project DFS are included in the 2019 Annual Report. The Company confirms that all the material assumptions continue to apply and have not materially changed.
This report contains certain forward looking statements. Forward looking statements are only predictions and are subject to risks, uncertainties and assumptions which are outside of the control of Strandline. These risks, uncertainties and assumptions include commodity prices, currency fluctuations, economic and financial market conditions, environmental risks and legislative, fiscal or regulatory developments, political risks, project delay, approvals and cost estimates.
Actual values, results or events may be materially different to those contained in this announcement. Given these uncertainties, readers are cautioned not to place reliance on forward looking statements. Any forward looking statements in this announcement reflect the views of Strandline only at the date of this announcement. Subject to any continuing obligations under applicable laws and ASX Listing Rules, Strandline does not undertake any obligation to update or revise any information or any of the forward looking statements in this announcement to reflect changes in events, conditions or circumstances on which any forward looking statements is based.
Strandline – Capitalising on the growing mineral sands market
Didier Murcia Independent Non-Executive Chairman Luke Edward Graham Managing Director and CEO Peter Richard Watson Executive Director John Russell Hodder Non-Executive Director Ernest Thomas Eadie Independent Non-Executive Director
Company Secretary
Mr Flavio Lino Garofalo
Registered and Principal Office
35 Richardson Street West Perth, Western Australia 6005
The Directors of Strandline Resources Limited (“Strandline” or “the Company”) submit the Annual Report on the Consolidated Entity (“the Group”) consisting of Strandline Resources Limited and the entities it controlled at the end of, or during, the year ended 30 June 2019. DIRECTORS The names and details of the Company’s Directors in office during the financial period and until the date of this report are as follows. Directors were in office for the entire period unless otherwise stated.
Mr Murcia is a lawyer with over 30 years’ legal and corporate experience in the mining industry and was previously a Non-Executive Director from 23 October 2014 to 29 February 2016. Appointed a Member of the Order of Australia for services to the international community through support for the provision of medical and educational resources in Tanzania. He is Honorary Consul for the United Republic of Tanzania, a position that he has held for over 20 years. He is Chairman and founding director of Perth-based legal group MPH Lawyers and has held directorships in the following ASX listed companies over the past three years:
• Alicanto Minerals Limited – Non-Executive Chairman (appointed May 2012)
• Centaurus Metals Limited - Non-Executive Chairman (appointed April 2009, Chairman since January 2010)
• Gryphon Minerals Limited - Non-Executive Director (delisted from ASX October 2016)
Mr Murcia is also Chairman of the Remuneration Committee. Luke Edward Graham, Managing Director and Chief Executive Officer
A.Dip (Hons) (Elec Eng), MAICD, appointed 19 September 2016
Mr Graham brings a diverse and extensive skill set to the development of Strandline Resources as an emerging mineral sands producer, formerly senior manager of global minerals engineering and mine operations Company Sedgman Pty Limited (a member of the CIMIC Group). An engineer by profession, he has extensive experience in major mine and port project development, design, construction and operations within the resources sector including mineral sands, coal, iron, copper and gold projects, and successfully managing multi-functional operations. Mr Graham is a Non-executive Director of:
• Primero Group Ltd - Non-Executive Director (appointed 21 May 2018) Peter Richard Watson, Executive Director
BEng (Hons) (Chem), GAICD, FIEAust, Dip (Acct), appointed 10 September 2018
Mr Watson is a chemical engineer with over 30 years’ experience in the resources sector, both in Australia and overseas. He has held technical and executive roles with a number of companies throughout his career, culminating in his appointment as the Managing Director & Chief Executive Officer of Sedgman Limited, a market leading engineering and mining services firm. Initially joining Sedgman as Chief Operating Officer of the Metals Division in 2010, Mr Watson successfully led and supported the development and execution of EPC and Operations Contracts in excess of A$2 Billion as he progressed through roles as Executive General Manager (2011 – 2012) and Global Executive Director (2012 – 2014), before being made MD & CEO (2014 – 2016). During this time at Sedgman, Peter provided leadership and guidance across a suite of over 10 large scale Mine Operations contracts and over 30 EPC contracts across a broad spectrum of commodities.
Has held directorships in the following ASX listed companies over the past three years:
• Resource Generation Limited - Non-Executive Director (appointed 22 November 2017 and resigned 1 November 2018)
• New Century Resources Limited - Non-Executive Director (appointed 19 January 2018) • Sedgman Limited – Managing Director (resigned 7 October 2016)
John Russell Hodder, Non-Executive Director B.Sc, B.Com, appointed 8 June 2016
Mr Hodder is a geologist, director and fund manager with over 20 years’ experience in the Resources Industry. Principal of mining focused Tembo Resource Fund. He has served as a director of a number of junior mining companies and has significant experience of operating and investing in Africa. He established the Commonwealth Development Corporation (CDC), a mining, oil and gas investment vehicle in 1995 and was responsible for its activities for eight years. Mr Hodder has held directorships in the following ASX listed companies over the past three years:
• Paladin Energy Limited (appointed Non-Executive Director on 14 February 2018)
• Nzuri Copper Limited - formerly Regal Resources Limited (resigned as Non-Executive Director on 7 Dec 2016)
Mr Hodder is also a member of the Remuneration Committee and Chairman of the Audit & Risk Committee. Ernest Thomas Eadie, Independent Non-Executive Director B.Sc (Hons), M.Sc., F.AusIMM. appointed 19 September 2016
Mr Eadie was previously the Managing Director from 1 January 2016 to 18 September 2016 and Non-Executive Director from 9 October 2015 to 31 December 2015. Geologist and mining executive with over 20 years’ experience in the resources industry with many significant mineral discoveries to his name. Former Executive Chairman of Copper Strike, former founding Chairman of Syrah Resources and previously Executive General Manager – Exploration and Technology at Pasminco. Past board member of the Australasian Institute of Mining and Metallurgy and the Australian Mineral Industry Research Association. Has held directorships in the following ASX listed companies over the past three years:
• Alderan Resources Limited (appointed Non-Executive Director on 23 January 2017 and Non-Executive Chairman on 21 August 2019)
• Copper Strike Limited (resigned as Non-Executive Director on 6 September 2016)
• New Century Resources Limited (appointed Non-Executive Director on 13 July 2017 and resigned on 28 March 2019)
• Pure Alumina Ltd (appointed Non-Executive Chairman on 3 July 2018)
Mr Eadie is also a member of the Audit & Risk Committee. Asimwe Matungwa Herman Kabunga, Former Independent Non-Executive Director B.Sc, appointed 18 June 2015 and resigned on 8 October 2018
Mr Kabunga is a Tanzanian born Australian entrepreneur who holds a Bachelor of Science, Mathematics and Physics and has over 20 years technical and commercial experience in Tanzania, the United States and Australia. Mr. Kabunga has extensive experience in the mining industry, logistics, land access, tenure negotiation and acquisition, as well as a developer of technology businesses. He has been instrumental in establishing the Tanzania Community of Western Australia Inc and served as its first President. Mr Kabunga has held directorships in the following ASX listed companies over the past three years:
• Lindian Resources Limited (appointed June 2017) • Volt Resources Limited (appointed Chairman April 2017) COMPANY SECRETARY Flavio Lino Garofalo, Company Secretary and Chief Financial Officer B.Bus, CPA, appointed 5 June 2018
Mr Garofalo is a finance and corporate executive with over 20 years’ experience in the mining industry. He has held several other senior executive roles for ASX-listed mining companies, including General Manager of Finance, CFO and Company Secretary. Mr Garofalo has extensive experience in project financing, capital raisings and investor relations for listed resources companies which have transitioned from exploration and development to production. He is a member of CPA Australia with operational experience in both major and junior mining companies working in various jurisdictions including Africa, China and Australia.
INTERESTS IN SHARES, OPTIONS AND PERFORMANCE RIGHTS OF THE COMPANY The following table sets out each Director’s relevant interest in shares and rights or options in shares of the Company as at the date of this Report:
Director Shares Performance Rights Options
D Murcia 897,500 - -
L Graham 7,565,722 8,166,667 -
P Watson 395,708 1,584,100 -
T Eadie 5,977,711 - -
J Hodder - - -
PRINCIPAL ACTIVITIES The principal activity of the Company during the course of the financial year was mineral exploration and project evaluation in Australia and Tanzania, with a focus on mineral sands.
CORPORATE STRUCTURE Strandline is a company limited by shares that is incorporated and domiciled in Australia.
REVIEW OF OPERATIONS
The Company made strong progress on its Heavy Mineral Sands (HMS) exploration and development strategy during the year.
Strandline’s project portfolio contains high quality assets which offer a range of development options and timelines, geographic diversity and scalability. They include two zircon-titanium rich, ‘development ready’ projects, being the Fungoni Project in Tanzania and the large Coburn Project in Western Australia, as well as a series of titanium dominated exploration targets spread along 350km of highly prospective Tanzanian coastline, including the advanced and large scale Tajiri Project in northern Tanzania.
During the financial year, the Company made several key announcements across its project portfolio, as summarised below:
FY19 – POSITIONING FOR GROWTH
✓ Completed Definitive Feasibility Study (DFS) and commenced financing for two major mineral sands projects (Fungoni and Coburn projects), with a combined Net Present Value (NPV) of over A$600 million
✓ Expanded global JORC-Compliant Mineral Resources by over 65% to 29Mt of contained Heavy Mineral (HM), up from 17.4Mt the previous year
✓ Global Resource inventory is undeniably world-scale, comprising 4.7Mt of contained zircon, 2.9Mt of rutile-leucoxene, 14.9Mt of ilmenite and comprises other valuable minerals of monazite and garnet
✓ Positioning the Company strongly to capitalise on the growing mineral sands market
FUNGONI PROJECT – Central Tanzania
➢ Project financing advancing following a completed DFS on Fungoni, which resulted in significant increases in forecast financial returns and reduced implementation risk:
- Project pre-tax NPV of US$48.7m (A$64.9m at USD:AUD 0.75, 10% discount rate)
- Project pre-tax IRR of 61% with a first quartile revenue-to-operating cost ratio of 2.8
➢ Mining Licence granted by the new Tanzanian Mining Commission
➢ Binding sales contracts secured for 100% of forecast revenue – third and final offtake agreement signed underpinning product sales for the life of the Fungoni mine
➢ EPC Contract executed with GR Engineering Services for Fungoni’s process infrastructure; other major non-process infrastructure contracts also advanced in accordance with the project execution schedule
➢ Strandline mandated Nedbank CIB, which then executed a Credit-Approved Term Sheet to underwrite a US$26 million Project Finance Facility (Facility)
➢ Focus is now on finalising Facility documentation and conditions precedent to achieve Financial Close and commencement of construction, including land access and secondary-level development approvals
COBURN PROJECT - Western Australia
➢ JORC-Compliant Mineral Resource Estimate increases by 64% to 1.6Bt at 1.2% Total Heavy Minerals (THM), up from 979Mt, further enhancing the project’s geological robustness and scale
➢ Contained HM content rises to 19.6Mt from 12.3Mt, comprising a high-value mineral assemblage with in-situ zircon 4.3Mt, rutile-leucoxene 2.4Mt and ilmenite 9.4Mt
➢ DFS completed showing Coburn will generate strong financial returns with a pre-tax NPV of A$551m (USD:AUD 0.72, 8% discount rate) and a pre-tax IRR of 32%
➢ Life of Mine (LOM) revenue of A$3.9b and LOM EBITDA of A$1.9b, with an attractive revenue-to-operating cost ratio of 2.2, based on TZMI’s Feburary-2019 commodity price forecast
➢ 70% increase in JORC-Complaint Ore Reserves to 523Mt @ 1.11% Total Heavy Mineral (THM); This underpins an initial mine life of 22.5 years at the planned mining rate of 23.4Mtpa
➢ Key project approvals already in place (environmental, native title, heritage and mining), making Coburn construction-ready pending finalisation of project financing
➢ Engagement with global consumers confirms high demand for Coburn’s products in both concentrate and final product form, which opens the door to a wide range of offtake and investment options
➢ Significant opportunity to grow Ore Reserves (estimate +15 years to total project mine life of 37 years) through evaluation of resources extending north and along strike of current Ore Reserves
➢ Air-core and infill auger drilling at Bagamoyo confirmed extensive high-grade zircon-titanium mineralisation from surface, with thicknesses of 3m to 10.5m
➢ Strandline announced a large Exploration Target at Bagamoyo, reaffirming the Company’s strategy to establish an enduring mineral sands business in Tanzania based on a pipeline of quality projects
TAJIRI PROJECT - Northern Tanzania
➢ Tajiri confirmed as a world-scale mineral sands deposit with 80% Mineral Resource increase to 268Mt @ 3.3% THM, up from 147Mt at 3.1% THM, and with significant exploration upside
➢ All Tajiri resources start from surface, with no overburden and contain large coherent high-grade domains comprising mostly high-value titanium-dominated mineral assemblage
➢ Contained HM content rises to 8.8Mt, up 91% from 4.6Mt, with in-situ rutile 580,000t, zircon 335,000t, ilmenite 5,206,000t and almandine garnet 1,477,000t
➢ Tajiri underpins Strandline’s outstanding long-term production outlook in Tanzania
EXPLORATION JOINT VENTURE WITH RIO TINTO – Southern Tanzania
➢ Mineral sands exploration and project evaluation continued across the Company’s suite of tenements in Southern Tanzanian in Joint Venture (JV) with Rio Tinto
➢ The current Stage 1 earn-in activities commenced in June 2017 with Rio Tinto having the option to sole fund US$5 million of exploration within 3.5 years to earn a 51% interest in the joint venture
➢ Expenditure commitment of US$2 million was completed at financial year-end
➢ Assay and assemblage results from air core drilling programs will be announced in due course
➢
Figure 2 Coburn Preliminary 3-D Engineering Model of Wet Concentration Plant (WCP) and Mineral Separation Plan (MSP) Infrastructure
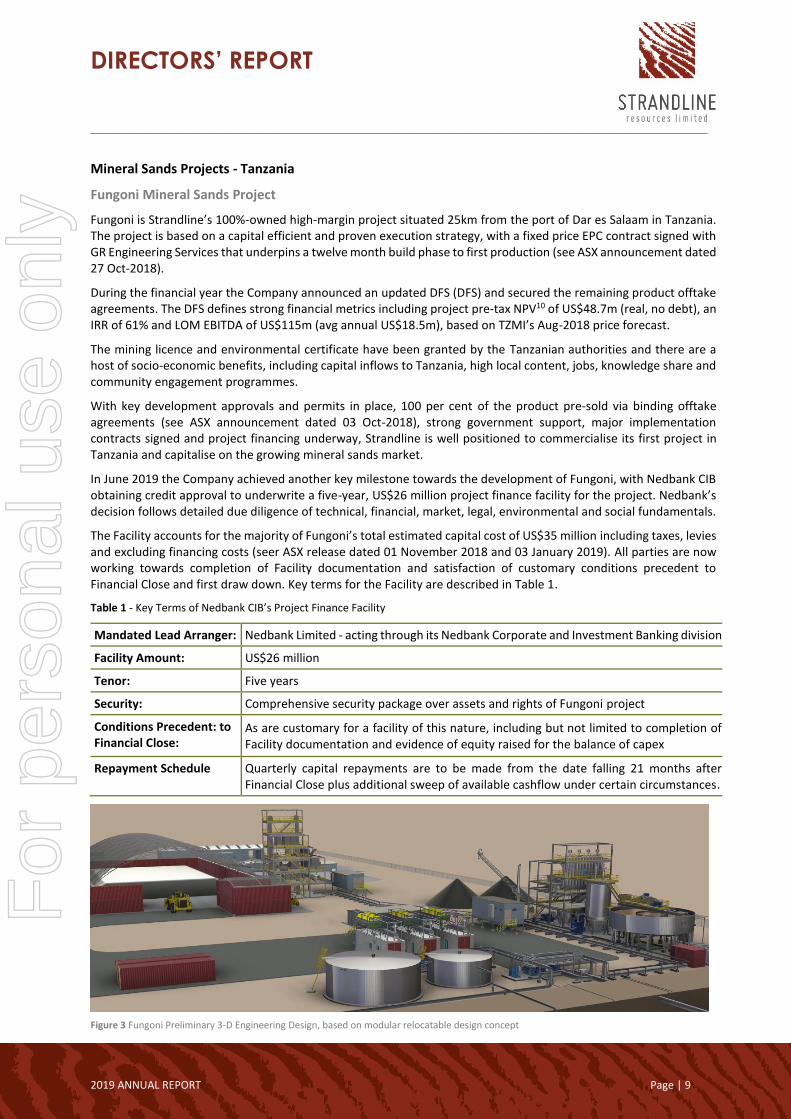
Fungoni is Strandline’s 100%-owned high-margin project situated 25km from the port of Dar es Salaam in Tanzania. The project is based on a capital efficient and proven execution strategy, with a fixed price EPC contract signed with GR Engineering Services that underpins a twelve month build phase to first production (see ASX announcement dated 27 Oct-2018).
During the financial year the Company announced an updated DFS (DFS) and secured the remaining product offtake agreements. The DFS defines strong financial metrics including project pre-tax NPV10 of US$48.7m (real, no debt), an IRR of 61% and LOM EBITDA of US$115m (avg annual US$18.5m), based on TZMI’s Aug-2018 price forecast.
The mining licence and environmental certificate have been granted by the Tanzanian authorities and there are a host of socio-economic benefits, including capital inflows to Tanzania, high local content, jobs, knowledge share and community engagement programmes.
With key development approvals and permits in place, 100 per cent of the product pre-sold via binding offtake agreements (see ASX announcement dated 03 Oct-2018), strong government support, major implementation contracts signed and project financing underway, Strandline is well positioned to commercialise its first project in Tanzania and capitalise on the growing mineral sands market.
In June 2019 the Company achieved another key milestone towards the development of Fungoni, with Nedbank CIB obtaining credit approval to underwrite a five-year, US$26 million project finance facility for the project. Nedbank’s decision follows detailed due diligence of technical, financial, market, legal, environmental and social fundamentals.
The Facility accounts for the majority of Fungoni’s total estimated capital cost of US$35 million including taxes, levies and excluding financing costs (seer ASX release dated 01 November 2018 and 03 January 2019). All parties are now working towards completion of Facility documentation and satisfaction of customary conditions precedent to Financial Close and first draw down. Key terms for the Facility are described in Table 1.
Mandated Lead Arranger: Nedbank Limited - acting through its Nedbank Corporate and Investment Banking division
Facility Amount: US$26 million
Tenor: Five years
Security: Comprehensive security package over assets and rights of Fungoni project
Conditions Precedent: to Financial Close:
As are customary for a facility of this nature, including but not limited to completion of Facility documentation and evidence of equity raised for the balance of capex
Repayment Schedule Quarterly capital repayments are to be made from the date falling 21 months after Financial Close plus additional sweep of available cashflow under certain circumstances.
Figure 3 Fungoni Preliminary 3-D Engineering Design, based on modular relocatable design concept
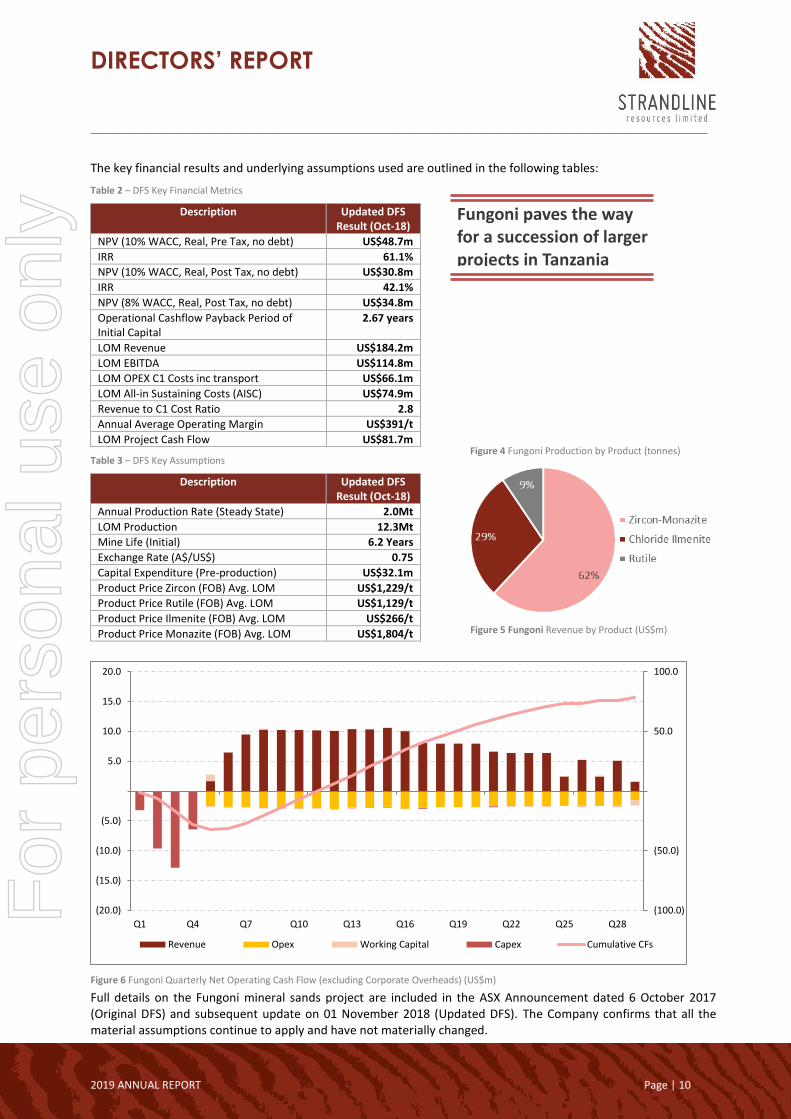
Full details on the Fungoni mineral sands project are included in the ASX Announcement dated 6 October 2017 (Original DFS) and subsequent update on 01 November 2018 (Updated DFS). The Company confirms that all the material assumptions continue to apply and have not materially changed.
(100.0)
(50.0)
50.0
100.0
(20.0)
(15.0)
(10.0)
(5.0)
5.0
10.0
15.0
20.0
Q1 Q4 Q7 Q10 Q13 Q16 Q19 Q22 Q25 Q28
Revenue Opex Working Capital Capex Cumulative CFs
Figure 5 Fungoni Revenue by Product (US$m)
Fungoni paves the way for a succession of larger projects in Tanzania
The Tajiri project, located in northern Tanzania continues to emerge as a game-changer for Strandline, representing a substantial increase in scale from Fungoni and offering a potentially mutli-decade production outlook as the project advances behind Fungoni.
During the financial year, the Company announced an 80% increase in the JORC-compliant Mineral Resource to 268Mt at 3.3% THM (up from 147Mt @ 3.1%THM), with contained HM of 8.8Mt (up from 4.6Mt, refer to ASX announcement dated 9 July 2019).
Tajiri comprises a series of higher-grade mineral sands deposits stretching along 30kms of Tanzanian coastline. The northern tip of the Tajiri Mineral Resource is situated just 35km south of the established Tanga port facilities. All Tajiri resources start from surface, with no overburden and contain large coherent higher-grade domains comprising mostly high-value titanium-dominated mineral assemblage, with elevated zones of zircon and almandine garnet.
Several Tajiri resources remain open along or across strike providing significant opportunities to grow Resources further over time. The Company recently secured highly prospective tenure along strike to the south of Tajiri (titled Sakura) and exploration continues to evaluate the priority targets.
The resource update means that Tajiri now has the geological critical mass, robustness and market appeal to advance project feasibility, development approvals/permitting and partnering activities.
Figure 7 Strandline suite of tenements in Tanzania, including Tajiri, situated in proximity to Tanga infrastructure (plan view)
Bagamoyo Project
The Bagamoyo tenements are located approximately 40km north of Dar es Salaam and close to the proposed Bagamoyo port development. Outstanding assays received from air core and auger drilling programme early in the financial year confirmed the Bagamoyo project as a major mineral sand’s discovery.
Extensive high-grade zircon-titanium mineralisation was delineated from surface, with thickness of 3m to 10.5m. Mineral assemblage test work from composite samples confirm a high unit-value assemblage for the upper zone of BG-2, averaging 8.2% zircon, 5.7% rutile, 0.5% leucoxene and 67% Ilmenite.
Figure 8 Tajiri Project Mineral Resources, showing a series of high value deposits from surface (plan view)
The Company has estimated a maiden Exploration Target at Bagamoyo comprising 78 to 156Mt at 3% to 4.5% THM (refer to ASX release dated 17 September 2018). Minor field activity was performed during the year and a further drill programme is required to test the veracity of the Exploration Target.
Strandline would caution the reader that the potential quantity and grade of the combined Exploration Target is conceptual in nature and there has been insufficient exploration to define a JORC compliant Mineral Resource. It is also uncertain if further exploration and resource development work will result in the determination of a Mineral Resource.
Southern Tanzania Exploration in Joint Venture with Rio Tinto
The Sudi, Rushungi and Mtwara Projects form part of the Earn-in and Joint Venture (JV) Agreement with Rio Tinto Mining & Exploration Limited (Rio Tinto) across the Company’s suite of HMS tenements located in the southern region of Tanzania. The JV has enabled Strandline to accelerate exploration activities on the Project Area, with Rio Tinto contributing expertise and funding.
The Agreement with Rio Tinto is worth up to US$10.75 million (~A$14.5 million) consisting of a two-stage earn-in plus cash payments. The Stage 1 earn-in commenced in June 2017 with Rio Tinto having the option to sole fund US$5 million of exploration within 3.5 years to earn a 51% interest in the joint venture, including a minimum JV commitment of US$2 million. Stage 2 involves an option to incur a further US$4 million expenditure within 2 years to earn an aggregated 75% interest (see ASX announcement 26 June 2017 and 26 April 2017).
During the financial year, the minimum expenditure commitment of US$2 million was met and exploration results from drilling completed during the year are being reviewed to determine the next phase of activity.
Mineral Sands Projects – Australia
Coburn Project
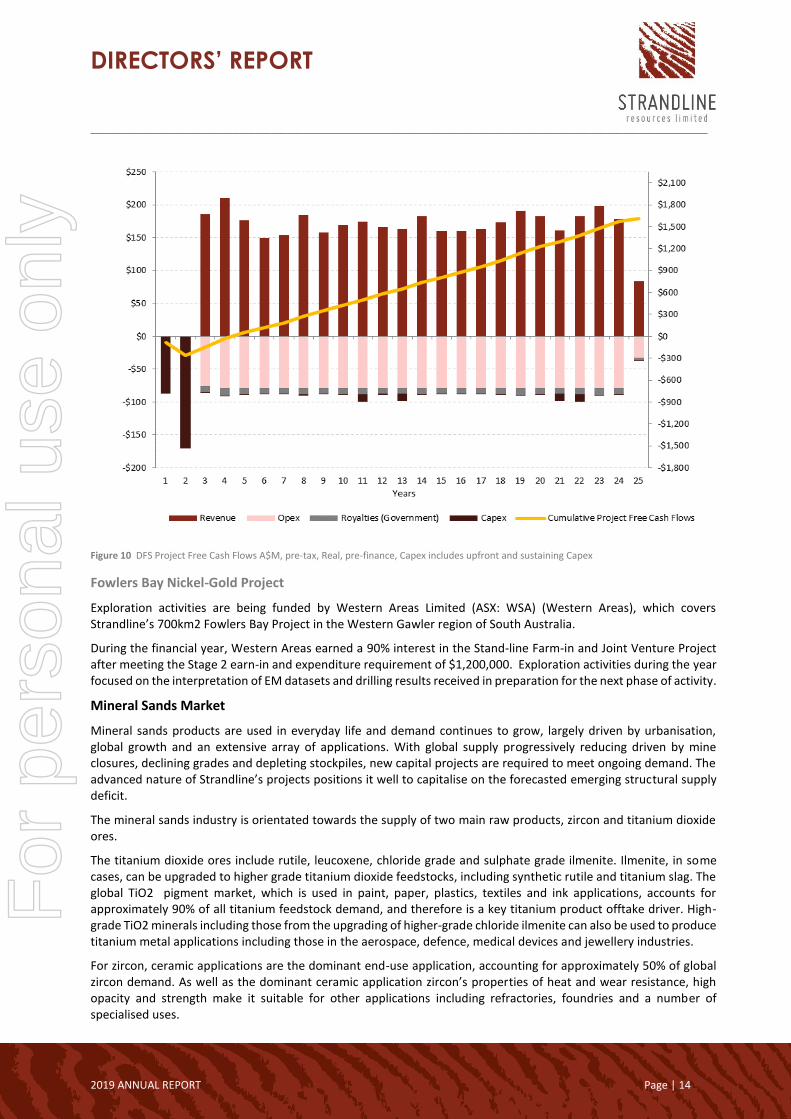
The Company announced the updated DFS on the Coburn mineral sands project on 16 April 2019 (refer to ASX announcement dated 16 April 2019). The DFS shows Coburn will generate strong financial returns with a pre-tax NPV8 of A$551 million (USD:AUD 0.72, real, no debt) and an IRR% of 32.3%. Forecast project revenue for the initial 22.5 years of Reserves is A$3.91 billion based on TZMI’s February-2019 commodity price forecast, with a LOM operating cost (C1) of A$1.78 billion and All-in-Sustaining-Cost (AISC) of A$1.97 billion. The project has an attractive revenue-to-opex ratio of 2.2.
Coburn is in the Tier-1 mining jurisdiction of Western Australia, close to key infrastructure and the dominant mineral sands market of Asia. The DFS design shows Coburn can deliver both a high-value Heavy Mineral Concentrate product (HMC Case) or can be refined further to final products (Final Products Case).
Total pre-production capital expenditure is estimated to be $207m for the HMC Case, with an additional A$50m required for the Final Products Case which includes MSP infrastructure. The project execution plan identifies a nominal 18-month design and construct duration to achieve first ore delivered to process facilities.
The Coburn DFS represents a significant milestone in Strandline’s strategy to become a low-cost, high-margin mineral sands producer of relevance to key customers around the world. The Coburn project is one of largest and most advanced undeveloped mineral sands projects in the world with an attractive high-value product suite and low-cost operation with the ability to generate strong financial returns.
As part of the DFS, the Company announced a 70 per cent increase in JORC-2012 compliant Ore Reserves with an updated Reserve estimated of 523Mt grading 1.11% THM. This is an increase of 215Mt of ore compared with the previous Reserve, which was developed in 2010.
Significant opportunities exist to grow project Reserves and mine life through evaluation of resources extending north and along strike of the current Reserves (titled Mine Life “Extension Case” Scoping Study). Scoping Study results confirmed the potential to significantly increase the mine life and project returns in the order of an additional 15 years to total 37.5 years with an overall project EBITDA of A$3.7b.
The Company is now focusing on advancing project financing and pre-execution activities, including evaluation of project funding, offtake and strategic partner arrangements. Full details on the Coburn mineral sands project are
included in the ASX Announcement dated 16 April 2019. The Company confirms that all the material assumptions continue to apply and have not materially changed.
The DFS metrics are summarised below:
Description DFS Final Product
Case3
DFS HMC
Case3
NPV (8% WACC, Real, Pre Tax, no debt) 1 $551M $481M
IRR 32.3% 36.4%
Capital Expenditure (Pre-production) A$257M A$207M
Payback of Capital from start of production4 2.3 years 2.2 years
LOM Revenue A$3,906M A3,417M
LOM OPEX C1 Costs inc. transport A$1,778M A$1,622M
Annual Production Rate (Steady State) 23.4Mt 23.4Mt
LOM Production (Ore Mined) 523.4Mt 523.4Mt
Mine Life 22.5 Years 22.5 Years
Annual Avg HMC Produced (from WCP) 229 kt/year 229 kt/year
Annual Avg Premium Zircon Production 32 kt/year -
Annual Avg Zircon Concentrate Production 58 kt/year -
Annual Avg HiTi90 Production 20 kt/year -
Annual Avg Ilmenite Production 110 kt/year -
Exchange Rate (A$/US$) 0.72 0.72
Product Price2
LOM Avg HMC Price (FOB) - US$479/t
LOM Avg Premium Zircon (FOB) US$1,480/t -
LOM Avg Zircon Concentrate (FOB) US$495/t -
LOM Avg HiTi90 (FOB) US$1,014/t -
LOM Avg Ilmenite (FOB) US$267/t -
Notes:
1 The NPV has been calculated using project related costs only and does not consider Strandline’s corporate costs. DFS capital and operating costs have been developed in accordance with a ±10% accuracy
2 Pricing assumptions for ilmenite, rutile and zircon were obtained from TZ Mineral International Pty Ltd’s (TZMI) mineral sands marketing report, titled Titanium Feedstock Price Forecast February 2019. TZMI pricing was then adjusted where appropriate to account for quality characteristics of the Coburn product. In the case of concentrate product (zircon concentrate), pricing was adjusted further to consider downstream handling costs
3 DFS contemplates two viable development options: (1) HMC Case producing a high-grade +95% heavy mineral concentrate (HMC) product (which can be sold to the downstream global processing market); (2) Final Products Case building an additional mineral separation plant to separate the valuable zircon and titanium minerals into final product form
4 Pre-tax and ungeared
Table 4 DFS Key Financial Metrics and Assumptions
Figure 9 DFS Project production and revenue split - Pie Charts
Exploration activities are being funded by Western Areas Limited (ASX: WSA) (Western Areas), which covers Strandline’s 700km2 Fowlers Bay Project in the Western Gawler region of South Australia.
During the financial year, Western Areas earned a 90% interest in the Stand-line Farm-in and Joint Venture Project after meeting the Stage 2 earn-in and expenditure requirement of $1,200,000. Exploration activities during the year focused on the interpretation of EM datasets and drilling results received in preparation for the next phase of activity.
Mineral Sands Market
Mineral sands products are used in everyday life and demand continues to grow, largely driven by urbanisation, global growth and an extensive array of applications. With global supply progressively reducing driven by mine closures, declining grades and depleting stockpiles, new capital projects are required to meet ongoing demand. The advanced nature of Strandline’s projects positions it well to capitalise on the forecasted emerging structural supply deficit.
The mineral sands industry is orientated towards the supply of two main raw products, zircon and titanium dioxide ores.
The titanium dioxide ores include rutile, leucoxene, chloride grade and sulphate grade ilmenite. Ilmenite, in some cases, can be upgraded to higher grade titanium dioxide feedstocks, including synthetic rutile and titanium slag. The global TiO2 pigment market, which is used in paint, paper, plastics, textiles and ink applications, accounts for approximately 90% of all titanium feedstock demand, and therefore is a key titanium product offtake driver. High-grade TiO2 minerals including those from the upgrading of higher-grade chloride ilmenite can also be used to produce titanium metal applications including those in the aerospace, defence, medical devices and jewellery industries.
For zircon, ceramic applications are the dominant end-use application, accounting for approximately 50% of global zircon demand. As well as the dominant ceramic application zircon’s properties of heat and wear resistance, high opacity and strength make it suitable for other applications including refractories, foundries and a number of specialised uses.
Figure 10 DFS Project Free Cash Flows A$M, pre-tax, Real, pre-finance, Capex includes upfront and sustaining Capex
Some mineral sands deposits host garnet and the rare earth containing mineral, monazite. Monazite is often sought after for the extraction of those rare earth oxides including amongst others Cerium, Lanthanum, Neodymium and Praseodymium. The rare earths are used in a multitude of modern applications, such as, flat screen television glass, rare earth magnets, silicon wafer polishing pastes (computer chip production), batteries, electronics, electric cars and catalytic converters. Garnet is typically used in abrasive applications.
Strandline’s exploration and development focuses primarily on discovering and evaluating ore bodies that show an abundance of higher value minerals, nominally zircon, rutile and leucoxene, with ilmenite, garnet and monazite as a co-product to the product suite.
During the year, Strandline expanded its global mineral sands JORC-compliant Mineral Resources by ~65% through performing targeted exploration and project evaluation, increasing in-situ contained Heavy Mineral (HM) from 17.4Mt to now 29.0Mt. The Tajiri project in Tanzania and the Coburn project in Western Australia both underwent significant Resource increases and are undeniably world-scale deposits.
Financial
Financial Results
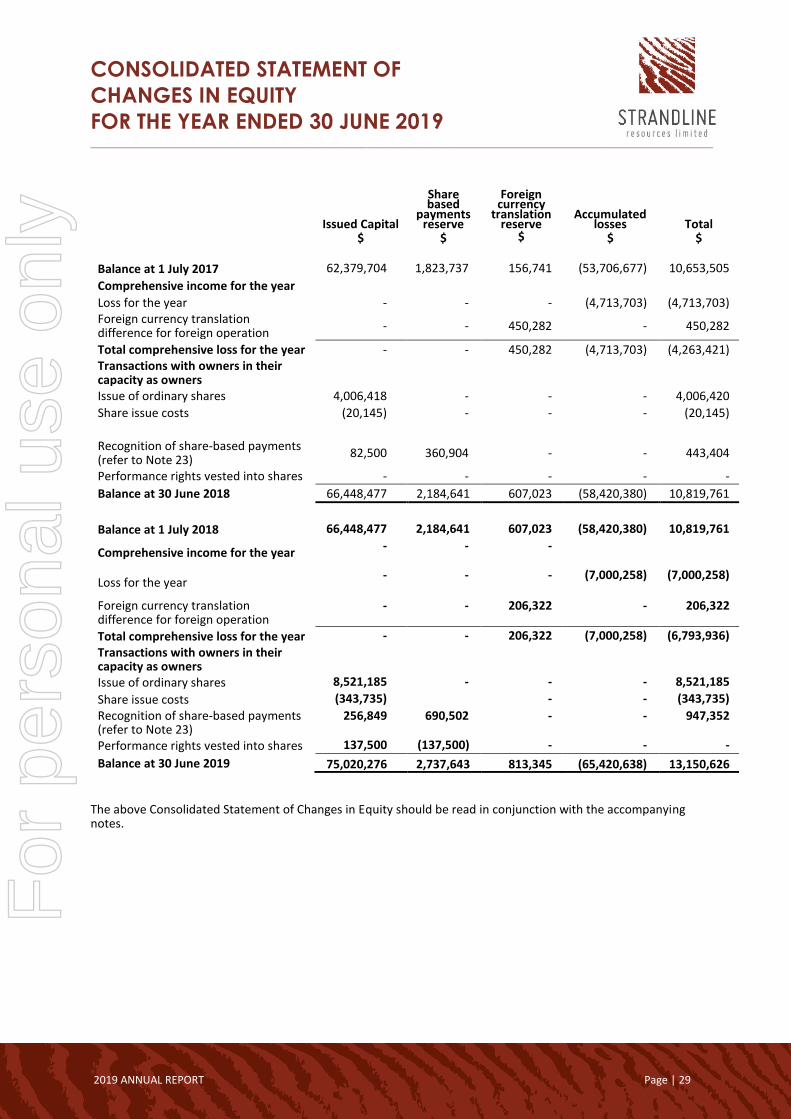
The Group incurred a loss after tax for the financial year of $7.0 million (2018: $4.71 million) which includes project exploration costs and corporate expenses expensed during the year. As the Group is still in the exploration and evaluation stage, revenue streams mainly consist of interest from investing surplus funds from capital raising and research and development rebates received from the Australian government.
Funds received for the financial year included interest received of $0.06 million and a research and development rebate of $0.19 million received from the Australian Government for mine infrastructure and advanced processing design for the Fungoni mineral sands Project. Amounts received from Rio Tinto Mining & Exploration Limited included a $0.36 million commitment fee in relation to satisfaction of the minimum US$2 million minimum expenditure commitment under the JV. Exploration and evaluation expenditure for the year was $4.61 million (2018: $3.20 million) which includes costs for the Coburn and Fungoni DFS.
Financial Position
The Group’s net asset position as at 30 June 2019 was $13.15 million and consolidated cash on hand as at 30 June 2019 was $6.01 million (2018: $4.29 million).
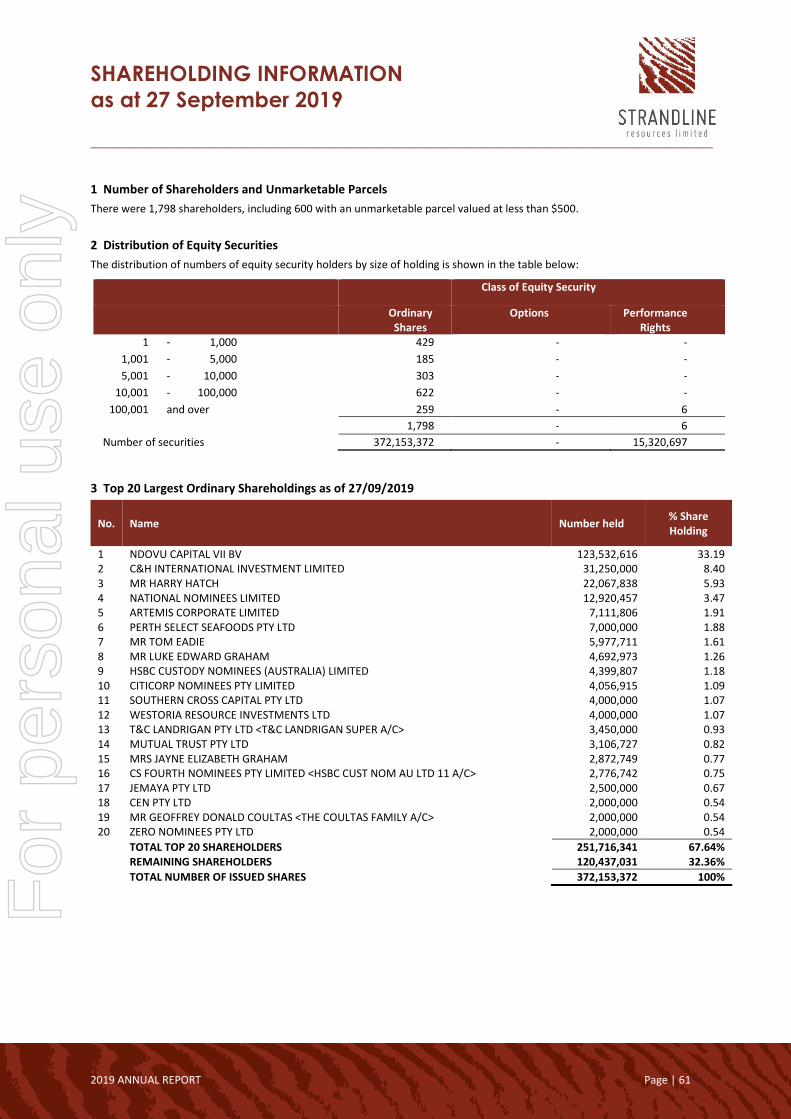
Total contributed equity as at 30 June 2019 was $75,020,276 (2018: $66,448,477) and summarised in the table below:
Share Capital Date Number of Shares Opening Balance 1 July 2018 289,315,617
Share issue @ 14.2 cents 15 August 2018 4,100,462
Share issue @ 11 cents 11 November 2018 27,273,852
Share issue @ 12 cents 3 June 2019 46,000,000
Option conversions 30 June 2019 5,790
TOTAL 30 June 2019 366,695,721 The Company has no unlisted options and the following performance rights on issue as at 30 June 2019 as follows.
Performance Rights Number
Unlisted performance rights expiring 15/08/19 3,975,230
Unlisted performance rights expiring 15/08/20 9,535,105
Unlisted performance rights expiring 15/08/21 3,389,367
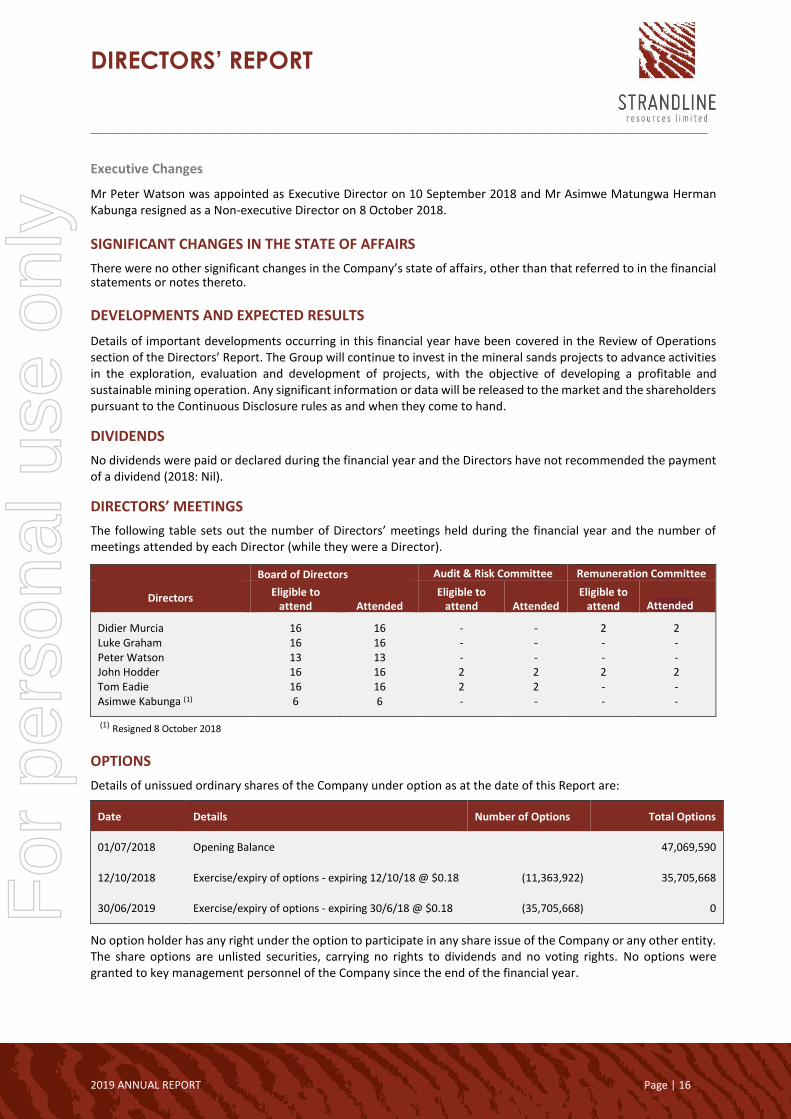
Mr Peter Watson was appointed as Executive Director on 10 September 2018 and Mr Asimwe Matungwa Herman Kabunga resigned as a Non-executive Director on 8 October 2018.
SIGNIFICANT CHANGES IN THE STATE OF AFFAIRS
There were no other significant changes in the Company’s state of affairs, other than that referred to in the financial statements or notes thereto.
DEVELOPMENTS AND EXPECTED RESULTS
Details of important developments occurring in this financial year have been covered in the Review of Operations section of the Directors’ Report. The Group will continue to invest in the mineral sands projects to advance activities in the exploration, evaluation and development of projects, with the objective of developing a profitable and sustainable mining operation. Any significant information or data will be released to the market and the shareholders pursuant to the Continuous Disclosure rules as and when they come to hand.
DIVIDENDS
No dividends were paid or declared during the financial year and the Directors have not recommended the payment of a dividend (2018: Nil).
DIRECTORS’ MEETINGS
The following table sets out the number of Directors’ meetings held during the financial year and the number of meetings attended by each Director (while they were a Director).
Board of Directors Audit & Risk Committee Remuneration Committee
Directors Eligible to attend Attended
Eligible to attend Attended
Eligible to attend Attended
Didier Murcia 16 16 - - 2 2 Luke Graham 16 16 - - - - Peter Watson 13 13 - - - - John Hodder 16 16 2 2 2 2 Tom Eadie 16 16 2 2 - - Asimwe Kabunga (1) 6 6 - - - -
(1) Resigned 8 October 2018
OPTIONS
Details of unissued ordinary shares of the Company under option as at the date of this Report are:
No option holder has any right under the option to participate in any share issue of the Company or any other entity. The share options are unlisted securities, carrying no rights to dividends and no voting rights. No options were granted to key management personnel of the Company since the end of the financial year.
Details of performance rights over unissued ordinary shares of the Company as at the date of this Report are:
Expiry date
of rights Exercise price
of rights Vested
rights Unvested rights
Total number of shares under rights
31 December 2019 nil - 323,025 323,025
15 August 2020 nil - 9,535,105 9,858,130
15 August 2021 nil - 5,462,567 15,320,697
Date Details Number of Rights Total
01/07/2018 Opening Balance
14,572,835
15/08/2018 Performance Rights issued 1,229,167 15,802,002
15/08/2018 Performance Rights – expiring 15/08/18 vested (2,291,667) 13,510,335
30/11/2018 Performance Rights issued 3,389,367 16,899,702
15/08/2019 Performance Rights expiring 15/08/2019 vested (3,652,205) 13,247,497
15/08/2019 Performance Rights issued 2,073,200 15,320,697
The performance rights do not include the right to participate in any other share issue of the Company or any or any other entity. The performance rights are unlisted securities, carrying no rights to dividends and no voting rights. Of the Performance Rights issued as part of the Company’s Long Term Incentive Plan 2,666,667 were issued to Mr Luke Graham, 722,700 were issued to Mr P Watson and 1,229,167 were issued to Mr F Garofalo. The performance rights issued to Mr Graham and Mr Watson were in accordance with shareholder approval received at the 2018 Annual General Meeting of the Company.
The 2,291,667 Performance Rights vested to Mr Luke Graham are in accordance with the vesting criteria contained in the terms and conditions pursuant to shareholder approval at the 2017 Annual General Meeting of the Company.
INDEMNIFICATION AND INSURANCE OF DIRECTORS AND OFFFICERS
During the financial year, the Company paid a premium in respect of a contract insuring the Directors of the Company, the Company Secretary, and all executive officers of the Company and of any related body corporate against a liability incurred as such as a Director, Company Secretary or executive officer to the extent permitted by the Corporations Act 2001. The contract of insurance prohibits disclosure of the nature of the liability and the amount of the premium.
The Company has not otherwise, during or since the end of the financial year, except to the extent permitted by law, indemnified or agreed to indemnify an officer or auditor of the Company or of any related body corporate against a liability incurred as such as an officer or auditor. The Company has made an agreement to provide access, indemnity and insurance for all its Directors and executive officers for any breach of duty as a Director or executive officer by the Company, for which they may be held personally liable.
The agreement provides for the Company to pay insurance premiums and legal costs where:
a) the liability does not arise out of conduct involving a lack of good faith; or b) the liability is for costs and expenses incurred by the Director or executive officer in defending proceedings in
which judgment is given in their favour or in which they are acquitted.
ENVIRONMENTAL MATTERS
The Company’s environmental obligations are regulated under both State and Federal legislation, in Australia and Tanzania. Performance with respect to environmental obligations is monitored by the Board of Directors and subjected from time to time to government agency audits and site inspections. During the year there were no non-compliance incidents.
The Directors have considered compliance with the National Greenhouse and Energy Reporting Act 2007 which requires entities to report annual greenhouse gas emissions and energy use. In respect of the financial year ended 30 June 2019, the Directors have assessed that there are no current reporting requirements.
No person has applied for leave of Court to bring proceedings on behalf of the Company or intervene in any proceedings to which the Company is a party for the purpose of taking responsibility on behalf of the Company for all or any part of those proceedings.
AUDITORS’ INDEPENDENCE DECLARATION
A copy of the Auditors’ Independence Declaration is set out separately in this Annual Report.
REMUNERATION REPORT (AUDITED)
Remuneration Report
This audited Remuneration Report, which forms part of the Directors’ Report, sets out information about the remuneration of Strandline Resources Limited’s key management personnel for the financial year ended 30 June 2019. The term ‘key management personnel’ refers to those persons having authority and responsibility for planning, directing and controlling the activities of the Company, directly or indirectly, including any Director (whether executive or otherwise) of the Company. The prescribed details for each person covered by this report are detailed below under the following headings:
a) key management personnel;
b) remuneration policy;
c) relationship between the remuneration policy and Company performance;
d) remuneration of key management personnel;
e) bonuses and share-based payments granted as compensation for the current financial year;
f) key management personnel equity holdings;
g) key terms of employment contracts;
h) loans and other transactions;
i) voting of shareholders at last year’s annual general meeting; and
j) reliance on external remuneration consultants.
a) Key management personnel
The Directors and other key management personnel of the Company during or since the end of the financial year were:
• Didier Murcia (Non-Executive Chairman)
• Luke Edward Graham (Managing Director)
• Peter Richard Watson (Executive Director) – Appointed 10 September 2018
• John Russell Hodder (Non-Executive Director)
• Ernest Thomas Eadie (Non-Executive Director)
• Asimwe Matungwa Herman Kabunga (Non-Executive Director) – resigned 8 October 2018
• Flavio Garofalo (CFO & Company Secretary)
Except as noted, the named persons held their current position for the whole of the financial year and since the end of the financial year.
b) Remuneration policy
The Remuneration Committee, established on 25 October 2016, is responsible for reviewing compensation arrangements for the Directors and the other key management personnel and making recommendations to the Board. The Board assesses the appropriateness of the nature and amount of emoluments of such officers on a periodic basis by reference to relevant employment market conditions, with the overall objective of ensuring maximum stakeholder benefit from the retention of a high quality Board and executive team.
No directors received retirement benefits from the Company. The Company’s Non-Executive Directors receive only fees for their services and the reimbursement of reasonable expenses. The total aggregate fee pool to be paid to Directors, excluding Executive Directors, is set at $400,000 per year, in accordance with the Company’s Constitution and as approved by the shareholders of the Company.
The fees paid to the Company’s Non-Executive Directors reflect the demands on, and responsibilities of these Directors. They do not receive any retirement benefits, other than compulsory superannuation. The Chairman normally receives an annual salary of $100,000 inclusive of superannuation and Non-Executive Directors normally receive an annual salary of $54,750 inclusive of superannuation. At times, some individuals may choose to sacrifice part of their salary or fees to increase payments towards superannuation.
Non-Executive Directors may also receive share options where this is considered appropriate by the Board as a whole and with regard to the stage of the Company’s development. Such options would vest across the life of the option and would be primarily designed to provide an incentive to Non-Executive Directors to remain with the Company. However, no share options have been issued to date.
c) Relationship between the remuneration policy and Company performance
The Company’s pay and reward framework is designed to ensure reward structures are aligned with shareholders’ interest by being market competitive to attract and retain high calibre individuals, rewarding high individual, performance, recognising the contribution of each key management personnel to the contributed growth and success of the Company and ensuring that long term incentives are linked to shareholder value.
To achieve these objectives, the remuneration of key management personnel comprise a fixed salary component and an ‘at risk’ variable component linked to performance of the individual and the Company as a whole. Fixed remuneration comprises base salary, superannuation contributions and other defined benefits. ‘At risk’ variable remuneration comprises both short term and long term incentives.
The Strandline Resources Ltd Short Term Incentive Scheme applies to executives in the Company and is designed to link any STI payment with the achievement by each Key Management Personnel of specified key performance indicators (‘KPI’s’) which are in turn linked to the Company’s strategic objectives and targets.
The KPI’s are established at the start of each financial year and any STI is paid at the end of the financial year and will be determined by the extent to which KPI’s have been achieved. A maximum of up to 50% of the fixed remuneration can be payable under the STI and the Board has the discretion to reduce or suspend any bonus payments where Company circumstances render it appropriate.
The shareholders approved a short-term incentive plan at the Company’s General Meeting on 24 November 2016 and a long-term incentive plan at the Company’s Annual General Meeting on 28 November 2017 to assist in the recruitment, reward, retention and motivation of executive-level employees of the Company and encourage achievement of short term strategic business objectives and ownership of shares in the Company by those employees.
The Company does however grant share-based payments in the form of options and performance rights to align the interests of executives, employees and consultants with those of shareholders. During the year nil (2018: nil) options were granted and 4,618,534 (2018: 9,989,501) performance rights were issued. Performance rights are issued and which will only vest if the performance conditions are satisfied before the expiry date. The performance conditions are set to align with the Company’s key strategies to develop its mineral sands projects. The STI’s are measured again KPI’s including but not limited to Safety, Project Development and Commercial factors. LTI’s are measured against section (e) of the remuneration report.
The table below sets out summary information about the Company’s earnings and movement in share price for the five years to 30 June 2019:
Details 30 June
2019
30 June
2018
30 June
2017
30 June
2016
30 June
2015
Revenue 701,403 491,760 700,125 4,777 21,479
Loss before tax (7,000,260) (4,713,703) (5,105,882) (3,256,600) (21,941,682)
Loss after tax (7,000,260) (4,713,703) (5,105,882) (3,256,600) (21,941,682)
Share price at start of year 12 cents 0.5 cents 0.5 cents 0.8 cents 1.2 cents
Share price at end of year 13.5 cents 12 cents* 0.6 cents 0.5 cents 0.8 cents
Basic and diluted loss per share (2.36) cents (1.73) cents (0.20) cents (0.28) cents (4.24) cents
* The Company completed a 12:1 consolidation of its share capital structure during the financial year
(1) Appointed 10 September 2018. (2) Resigned 8 October 2018. (3) The LTI vested during FY19 for L Graham were 100% awarded of which 50% was paid in shares and 50% Cash.
Remuneration of key management personnel – 2018
Name
Short-term employee benefits
Post-
Other long-term
employee benefits
Share-based payment
Options and Performance
Rights
Total
employment benefits
Salary
Bonus Other
Super-annuation & fees
$ $ $ $ $ $ $
Directors
D Murcia 70,086 - - - - - 70,086
L Graham 305,000 82,500 82,500 (4) 25,000 - 250,185(5) 745,185
T Brazier (3) 185,128 - - 17,587 - - 202,715 216,507 - - 20,568 - - 237,075 (1) Resigned 1 November 2017. (2) Appointed 5 June 2018. (3) Appointed 11 July 2017, resigned 2 July 2018. (4) During the period, 1,375,000 Fully Paid Ordinary Shares (post 12:1 consolidation of share capital) were issued to the Mr L Graham for his
participation in the Company’s Short Term Incentive Plan pursuant to shareholder approval given on 24 November 2016. Shares were issued
lieu of an equivalent cash payment. (5) For performance rights with market conditions, the fair value of services received is measured using a binomial pricing model
No key management personnel appointed during the period received a payment as part of his or her consideration for agreeing to hold the position. The relative proportions of remuneration that are linked to performance and those that are fixed are as follows:
Name Fixed remuneration At risk - STI At risk - LTI
2019 2018 2019 2018 2019 2018
Directors
D Murcia 100% 100% - - - -
L Graham 45% 44% 19% 22% 36% 34%
T Eadie 100% 100% - - - -
P Watson 72% - - - 28% -
J Hodder 100% 100% - - - -
Executive
F Garofalo 77% 100% - - 23% -
e) Bonuses and share-based payments granted as compensation for the current financial year
Bonuses
During the period, 581,082 Fully Paid Ordinary Shares were issued to the Mr L Graham for his participation in the Company’s Short Term Incentive Plan pursuant to shareholder approval given on 24 November 2016. Shares were issued lieu of an equivalent cash payment.
Incentive share-based payment arrangements
During the year no share options were granted to key management personnel (2018: nil) and no share options were exercised during the year (2018: nil). During the year 4,618,534 performance rights were granted to key management personnel (2018: 5,500,000, post 12:1 share consolidation).
The performance rights were issued to Mr L Graham, Mr P Watson and Mr F Garofalo (2018: Mr L Graham). The performance rights will only vest if the performance conditions are satisfied before the expiry date and performance rights issued to directors were approved by shareholders at the Company’s General Meeting held on 23 November 2018.
The key terms and conditions of the performance rights granted during the year are as follows:
Details of the performance conditions are as follows:
The performance rights will only vest if certain performance conditions are met. At the end of each tranche’s performance measurement period, the Board will rank the Company’s Total Shareholder Return (TSR) against a peer group of other companies as determined by the Board.
The peer group may be varied from time to time by the Board in its absolute discretion. The percentage of performance rights in each respective tranche that will vest will depend upon the Company’s TSR performance relative to the companies in the peer group, which will constitute Category A, B or C TSR performance, as set out:
(a) Category A TSR performance: If the Company’s TSR is at/or below the 45th percentile of the peer group of companies’ TSR, no PRs will vest.
(b) Category B TSR performance: If the Company’s TSR ranks between the 46th and 50th percentile (inclusive) of the peer group of companies’ TSR, for each percentile over the 45th percentile, 10% of the PRs will vest (up to a maximum of 50% for this Category).
(c) Category C TSR performance: For each 1% ranking at or above the 51st percentile of the peer group of companies TSR, an additional 2% of the PRs will vest (up to a maximum of 100%, which vest at or above the 75th percentile).
Fair value of share options and performance rights granted in the year
The fair value of services received in return for share options granted is based on the fair value of the share options granted, independently determined using the Black-Scholes option pricing model. For performance rights with market conditions, the fair value of services received is measured using a binomial pricing model.
For performance rights with non-market conditions, fair value is measured using the closing share price at grant date.
f) Key management personnel equity holdings in Strandline Resources Limited
Fully paid ordinary shares
Name
Balance at 1 July Acquired
Net other change
Held on appointment/
resignation
Balance
at 30 June No. No. No. No. No.
2019
Directors
D Murcia - 897,500 - - 897,500
L Graham 1,671,459 2,872,749 - - 4,544,208
P Watson (1) - 103,100 - 292,608 395,708
J Hodder - - - - -
T Eadie 5,977,711 - - - 5,977,711
Executive
F Garofalo - - - - - (1) appointed on 10 September 2018
Share options
Name
Balance at 1 July Acquired
Net other change
Held on appointment/r
esignation Balance at
30 June Vested and exercisable
Unvested and exercisable
No. No. No. No. No. No. No.
2019
Directors
D Murcia - - - - - - -
L Graham - - - - - - -
P Watson (1) - - - - - - -
J Hodder - - - - - - -
T Eadie 1,330,151 - (1,330,151) - - -
Executive
F Garofalo - - - - - - - (1) appointed on 10 September 2018
2019 Directors D Murcia - - - - - - - L Graham 10,083,334 (2,291,667) 2,666,667 - - 10,458,334 $1,683,792 P Watson (1) - 722,700 - - 861,400 1,584,100 $255,040 J Hodder - - - - - - - T Eadie - - - - - - Executive F Garofalo - 1,229,167 - - - 1,229,167 $197,896
(1) appointed on 10 September 2018
(2) The value at the exercise date of the Performance rights granted as part of remuneration and were exercised during the year has been determined as the intrinsic value of the options at the date.
g) Key terms of employment contracts Remuneration and other terms of employment for executives are formalised in employment contracts. The service agreements specify the components of remuneration , benefits and notice periods as set out below. Mr Luke Edward Graham (Managing Director and Chief Executive Officer):
• Term of agreement – permanent basis commencing 19 September 2016.
• Fixed Annual Remuneration of $400,000 per annum (including superannuation), to be reviewed annually.
• Short Term Incentive (STI) - performance to be assessed annually against a series of both financial and non-financial Key Performance Indicators (KPIs). The maximum annual amount payable under the Short Term Incentive is 50% of the Fixed Annual Remuneration. The STI will be paid in August each year in cash and/or performance rights.
• Long Term Incentive (LTI) - entitled to participate in a Long Term Incentive Plan (“LTIP”) to be approved by Shareholders.
• Contract is capable of termination in the following circumstances: - By either party during the probation period (of 6 months from the commencement date) by giving 2
weeks’ notice; - By either party following the probation period on giving 3 months’ notice; or - By the Company without notice upon serious misconduct or gross neglect of duty.
Mr Peter Richard Watson (Executive Director Strategy and Development):
• Terms of agreement – permanent basis commencing 10 September 2018
• Fixed Annual Remuneration of $165,000 per annum (including superannuation), to be reviewed annually.
• Short Term Incentive (STI) - performance to be assessed annually against a series of both financial and non-financial Key Performance Indicators (KPIs). The maximum annual amount payable under the Short Term Incentive is 35% of the Fixed Annual Remuneration. The STI will be paid in August each year in cash and/or performance rights.
• Long Term Incentive (LTI) - entitled to participate in a Long Term Incentive Plan (“LTIP”) to be approved by Shareholders.
• Contract is capable of termination in the following circumstances: - By either party during the probation period (of 6 months from the commencement date) by giving 2
weeks’ notice; - By either party following the probation period on giving 1 months’ notice; or - By the Company without notice upon serious misconduct or gross neglect of duty.
Mr Flavio Lino Garofalo (Company Secretary & Chief Financial Officer): • Term of agreement – permanent basis commencing 5 June 2018.
• Fixed Annual Remuneration of $295,650 per annum (including superannuation), to be reviewed annually.
• Short Term Incentive (STI) - performance to be assessed annually against a series of both financial and non-financial Key Performance Indicators (KPIs). The maximum annual amount payable under the Short Term Incentive is 35% of the Fixed Annual Remuneration. The STI will be paid in August each year in cash and/or performance rights.
• Long Term Incentive (LTI) - entitled to participate in a Long Term Incentive Plan (“LTIP”) to be approved by Shareholders.
• Contract is capable of termination in the following circumstances: - By either party during the probation period (of 6 months from the commencement date) by giving 2
weeks’ notice; - By either party following the probation period on giving 2 months’ notice; or - By the Company without notice upon serious misconduct or gross neglect of duty.
h) Loans and other transactions
No loans have been made by the Company to key management personnel during the year (2018: nil). Mr. Didier Murcia, Non-Executive Chairman, is a partner in the legal firm, Murcia Pestell Hillard. Fees totalling $124,482 were paid to Murcia Pestell Hillard for work completed on various legal matters (2018: $97,677). All transactions related to the services were based on normal commercial terms.
Mr. Didier Murcia, is also Chairman of Artemis Management Tanzania, a provider of corporate, administration, logistics, tenement management and evaluation and environment management services in Tanzania. Fees totalling $52,816 were paid to Artemis Management Tanzania for corporate and administration services (2018: $37,520). All transactions related to the services were based on normal commercial terms. No other transactions occurred between the Company and key management personnel during the year, aside from that disclosed in the remuneration of key management personnel above (2018: nil).
i) Voting of shareholders at last year’s annual general meeting
The Company received more than 99% of “yes” votes on its remuneration report for the 2018 financial year (2017: 99%).
j) Reliance on external remuneration consultants
During the year the Board did not engage the services of a remuneration consultant to provide recommendations when setting the remuneration received by Directors or other key management personnel.
This is the end of the audited Remuneration Report NON-AUDIT SERVICES Non audit services included tax compliance services performed by BDO Corporate Tax (WA) Pty Ltd during the year of $9,945 (2018: $10,404). SUBSEQUENT EVENTS
There has not been any matter or circumstance occurring subsequent to the end of the financial year that has significantly affected, or may significantly affect, the operations of the Group, the results of those operations or the state of affairs of the Group in future financial years.
CORPORATE GOVERNANCE The Company’s corporate governance statement can be found at the following website: www.strandline.com.au/corporategovernance This Directors’ Report is signed in accordance with a resolution of the Directors. On behalf of the Directors
Luke Graham MANAGING DIRECTOR 30 September 2019 Perth, Western Australia
BDO Audit (WA) Pty Ltd ABN 79 112 284 787 is a member of a national association of independent entities which are all members of BDO Australia Ltd ABN 77 050 110 275,an Australian company limited by guarantee. BDO Audit (WA) Pty Ltd and BDO Australia Ltd are members of BDO International Ltd, a UK company limited by guarantee, andform part of the international BDO network of independent member firms. Liability limited by a scheme approved under Professional Standards Legislation.
38 Station StreetSubiaco, WA 6008PO Box 700 West Perth WA 6872Australia
DECLARATION OF INDEPENDENCE BY PHILLIP MURDOCH TO THE DIRECTORS OF STRANDLINERESOURCES LIMITED
As lead auditor of Strandline Resources Limited for the year ended 30 June 2019, I declare that, to thebest of my knowledge and belief, there have been:
1. No contraventions of the auditor independence requirements of the Corporations Act 2001 inrelation to the audit; and
2. No contraventions of any applicable code of professional conduct in relation to the audit.
This declaration is in respect of Strandline Resources Limited and the entities it controlled during theperiod.
Phillip Murdoch
Director
BDO Audit (WA) Pty Ltd
Perth, 30 September 2019
For
per
sona
l use
onl
y
CONSOLIDATED STATEMENT OF PROFIT OR LOSS
AND OTHER COMPREHENSIVE INCOME
FOR THE YEAR ENDED 30 JUNE 2019 _____________________________________________________________________________________________________________________
2019 ANNUAL REPORT Page | 27
Notes
2019
$
2018
$ Revenue from continuing operations 5 58,719 64,750
Other income 6 450,055 159,338
Research and development grant 6 192,629 267,672
Employee benefits expense 8 (1,161,572) (969,598)
Depreciation expense 8 (11,207) (11,825)
Share based payment expense 8 (947,351) (443,404)
Exploration and evaluation expenditure (4,612,239) (3,200,310)
Other expenses (969,292) (580,326)
Loss before income tax (7,000,258) (4,713,703)
Income tax benefit 7 - -
Loss after income tax for the year (7,000,258) (4,713,703)
Other comprehensive income
Items that may be re-classified to profit or loss
Exchange differences arising on translation of foreign operations 206,322 450,282
Other comprehensive income for the year, net of income tax 206,322 450,282
Total comprehensive loss for the year (6,793,936) (4,263,421)
Loss attributable to:
Owners of Strandline Resources Limited (6,793,936) (4,263,421)
Cents per share
Cents per share
Loss per share Basic and diluted loss per share (cents per share) 9 (2.36) (1.73)
The above Consolidated Statement of Profit or Loss and Other Comprehensive Income should be read in conjunction with the accompanying notes.
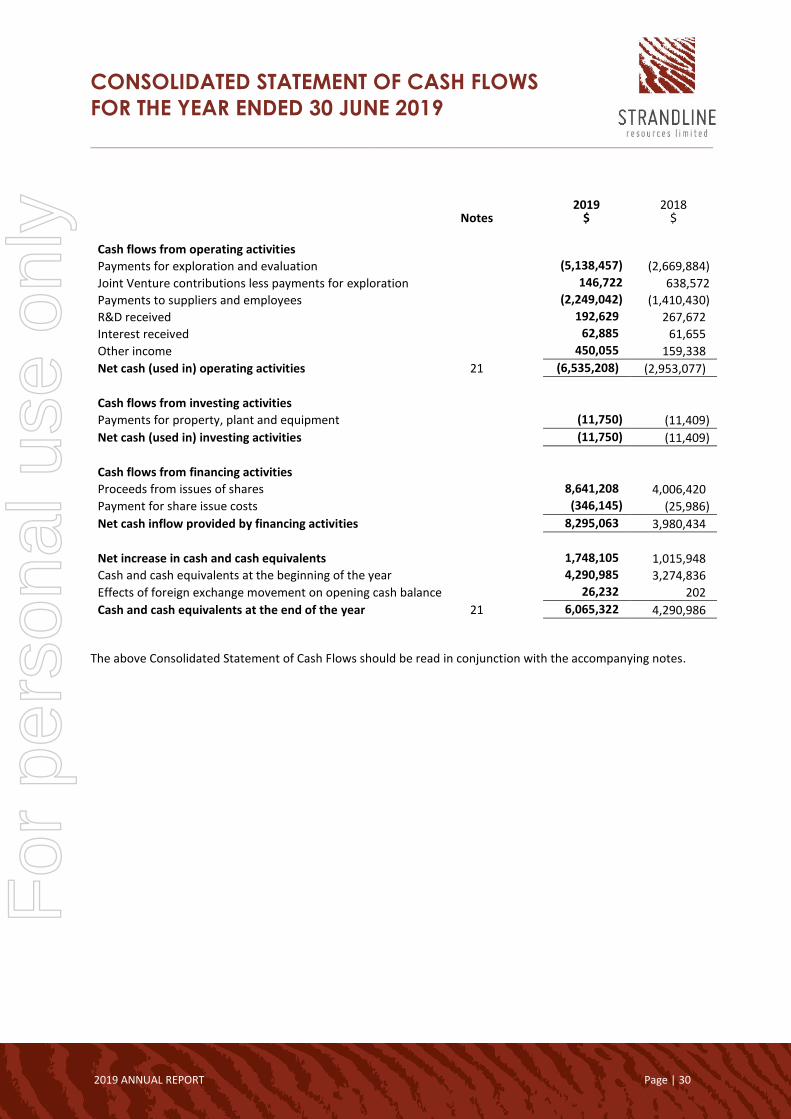
Payments for exploration and evaluation (5,138,457) (2,669,884)
Joint Venture contributions less payments for exploration 146,722 638,572
Payments to suppliers and employees (2,249,042) (1,410,430)
R&D received 192,629 267,672
Interest received 62,885 61,655
Other income 450,055 159,338
Net cash (used in) operating activities 21 (6,535,208) (2,953,077)
Cash flows from investing activities
Payments for property, plant and equipment (11,750) (11,409)
Net cash (used in) investing activities (11,750) (11,409)
Cash flows from financing activities
Proceeds from issues of shares 8,641,208 4,006,420
Payment for share issue costs (346,145) (25,986)
Net cash inflow provided by financing activities 8,295,063 3,980,434
Net increase in cash and cash equivalents 1,748,105 1,015,948
Cash and cash equivalents at the beginning of the year 4,290,985 3,274,836
Effects of foreign exchange movement on opening cash balance 26,232 202
Cash and cash equivalents at the end of the year 21 6,065,322 4,290,986
The above Consolidated Statement of Cash Flows should be read in conjunction with the accompanying notes.
For
per
sona
l use
onl
y
NOTES TO THE CONSOLIDATED FINANCIAL
STATEMENTS FOR THE YEAR ENDED
30 JUNE 2019 _____________________________________________________________________________________________________________________
2019 ANNUAL REPORT Page | 31
1. General information
Strandline Resources Limited (‘Company’ or ‘Strandline’) is a limited company incorporated in Australia. The address of its registered office and principal place of business is disclosed in the Corporate Directory of the Annual Report. These consolidated financial statements comprise the Company and its subsidiaries (together referred to as the “Group”). The Group is primarily involved in the exploration and development of mineral sands, and also has interests in other base metal resources.
2. New Standards and Interpretations in issue not yet adopted
At the date of authorisation of the financial statements, the AASB Standards and Interpretations listed below were in issue but not yet effective and are most relevant to the Group:
Standard Interpretation
Nature of Change Application date for the Company
Impact on the Company financial statements
AASB 16 Leases
AASB 16 eliminates the operating and finance lease classifications for lessees currently accounted for under AASB 117 Leases. It instead requires an entity to bring most leases into its statement of financial position in a similar way to how existing finance leases are treated under AASB 117. An entity will be required to recognise a lease liability and a right of use asset in its statement of financial position for most leases. There are some optional exemptions for leases with a period of 12 months or less and for low value leases. Lessor accounting remains largely unchanged from AASB 117.
1 January 2019 The Group has assessed the impact of this standard as having no material impact.
3. Significant accounting policies
3.1. Statement of compliance
These financial statements are general purpose financial statements which have been prepared in accordance with the Corporations Act 2001, AASB Standards and Interpretations, and comply with other requirements of the law.
For the purposes of preparing the financial statements, the Group is a for-profit entity. Accounting Standards include Australian Accounting Standards. Compliance with Australian Accounting Standards ensures that the Group financial statements and notes comply with International Financial Reporting Standards (IFRS).
The Group has adopted all new and amended Accounting Standards and Interpretations issued by the AASB that are relevant to the Group and effective for reporting periods beginning on or after 1 July 2018. The adoption of these standards and interpretations did not have a material impact on the Group financial report.
3.2. Basis of preparation
The financial statements have been prepared on the basis of historical cost, except for financial assets and financial liabilities that are recognised initially at fair values and subsequently measured at amortised costs using the effective interest method, as explained in the accounting policies below. Historical cost is generally based on the fair values of the consideration given in exchange for assets. All amounts are presented in Australian dollars, unless otherwise noted.
The following significant accounting policies have been adopted in the preparation and presentation of the financial statements:
For
per
sona
l use
onl
y
NOTES TO THE CONSOLIDATED FINANCIAL
STATEMENTS FOR THE YEAR ENDED
30 JUNE 2019 _____________________________________________________________________________________________________________________
2019 ANNUAL REPORT Page | 32
a) Going concern basis
The financial statements have been prepared on the going concern basis, which contemplates the continuity of normal business activity and the realisation of assets and the settlement of liabilities in the normal course of business.
b) Revenue recognition
Revenue is measured at the fair value of the consideration received or receivable. The following specific recognition criteria must also be met before revenue is recognised.
Interest revenue
Interest revenue is accrued on a time basis, by reference to the principal outstanding and at the effective interest rate applicable, which is the rate that exactly discounts estimated future cash receipts through the expected life of the financial asset to that asset’s net carrying amount on initial recognition.
Joint venture management fees
Revenue is recognised on the completion of the services provided under the contractual arrangement.
c) Leasing
Leases are classified as finance leases whenever the terms of the lease transfer substantially all the risks and rewards of ownership to the lessee. All other leases are classified as operating leases.
The minimum lease payments of operating leases, where the lessor effectively retains substantially all of the risks and benefits of ownership of the leased item, are recognised as an expense on a straight line basis.
d) Employee benefits
Wages and salaries, annual leave and sick leave
Liabilities for wages and salaries, including non-monetary benefits and annual leave expected to be settled within 12 months of the reporting date are recognised in liabilities in respect of employees’ services up to the reporting date and are measured at the amounts expected to be paid when the liabilities are settled. Liabilities for non-accumulating sick leave are recognised when the leave is taken and measured at the rates paid or payable.
Long service leave
The liability for long service leave expected to be settled within 12 months of the reporting date is recognised in the current provision for employee benefits and in accordance with the above. The liability for long service leave expected to be settled more than 12 months from the reporting date is recognised in the current provision for employee benefits and is measured as the present value of expected future payments to be made in respect of services provided by employees up to the reporting date. Consideration is given to expected future wage and salary levels, experience of employee departures and periods of service. Expected future payments are discounted using market yields at the reporting date on corporate bonds with terms to maturity and currency that match, as closely as possible, the estimated future cash outflows.
e) Share-based payments transactions of the Company
The Group may provide benefits to employees and consultants (including Directors) in the form of share-based payments, whereby employees and consultants render services in exchange for options or rights over shares (“equity settled transactions”).
Equity-settled share based payments to employees and consultants are measured at the fair value of the equity instruments at the grant date.
The fair value determined at the grant date of the equity-settled share-based payments is expensed on a straight-line basis over the vesting period, based on the Group’s estimate of equity instruments that will eventually vest, with a corresponding increase in equity. At the end of each reporting period, the Group revises its estimate of the number of equity instruments expected to vest. The impact of the revision of the original estimates, if any, is recognised in profit or loss such that the cumulative expense reflects the revised estimate, with a corresponding adjustment to the equity-settled employee benefits reserve. For options, the fair value is determined using a Black-Scholes model. For
For
per
sona
l use
onl
y
NOTES TO THE CONSOLIDATED FINANCIAL
STATEMENTS FOR THE YEAR ENDED
30 JUNE 2019 _____________________________________________________________________________________________________________________
2019 ANNUAL REPORT Page | 33
performance rights with market conditions, the fair value is measured using a binomial pricing model. For performance rights with non-market conditions, the fair value is measured using the closing share price at grant date.
The cumulative expense recognised for equity-settled transactions at each reporting date until vesting date reflects the extent to which the vesting period has expired and the number of awards that, in the opinion of the Directors, will ultimately vest.
No adjustment is made for the likelihood of market performance conditions being met as the effect of these conditions is included in the determination of the fair value at grant date. No expense is recognised for awards that do not ultimately vest, except for awards where vesting is conditional upon a market condition.
Where an equity-settled award is cancelled, it is treated as if it had vested on the date of cancellation, and any expense not yet recognised for the award is recognised immediately. However, if a new award is substituted for the cancelled award, and designated as a replacement award on the date that it is granted, the cancelled and new award are treated as if they were a modification of the original award.
f) Taxation
The income tax expense or benefit for the year is the tax payable on the current year’s taxable income, based on the applicable income tax rate adjusted by changes in deferred tax assets and liabilities attributable to temporary differences, and to unused tax losses. Deferred income tax is provided on all temporary differences at the reporting date between the tax bases of assets and liabilities and their carrying amounts for financial reporting purposes.
Deferred income tax assets are recognised for all deductible temporary differences, carry forward of unused tax assets and unused tax losses, to the extent that it is probable that taxable profit will be available against which the deductible temporary differences, and the carry-forward of unused tax assets and unused tax losses can be utilised.
A deferred income tax asset is not recognised where the deferred income tax asset relating to the deductible temporary difference arises from the initial recognition of an asset or liability in a transaction that is not a business combination and, at the time of the transaction, affects neither the accounting profit nor taxable profit or loss.
The carrying amount of deferred income tax assets is reviewed at each reporting date and reduced to the extent it is no longer probable that sufficient taxable profit will be available to allow all or part of the deferred income tax to be utilised.
Deferred income tax assets and liabilities are measured at the tax rates that are expected to apply to the year when the asset is realised or the liability is settled, based on tax rates (and tax laws) that have been enacted at the reporting date. Income taxes relating to items recognised directly in equity are recognised in equity and not in the statement of profit or loss and other comprehensive income.
g) Exploration and evaluation expenditure
Exploration and evaluation expenditure is expensed as incurred other than those incurred for the acquisition of mineral property licences or rights to explore which continue to be capitalised in respect of each identifiable area of interest. The expenditure is only carried forward to the extent that it is expected to be recouped through the successful development or sale of the area of interest, or where activities in the area of interest have not yet reached a stage which permits reasonable assessment of the existence of economically recoverable reserves.
Accumulated costs in relation to an abandoned area of interest are written off in full against the profit or loss in the year in which the decision to abandon the area is made.
A regular review is undertaken of each area of interest to determine the appropriateness of continuing to carry forward costs in relation to that area of interest. When it is determined that it is no longer appropriate to continue the capitalisation of costs in relation to an area of interest they are expensed in profit or loss.
For
per
sona
l use
onl
y
NOTES TO THE CONSOLIDATED FINANCIAL
STATEMENTS FOR THE YEAR ENDED
30 JUNE 2019 _____________________________________________________________________________________________________________________
2019 ANNUAL REPORT Page | 34
h) Impairment
At each reporting date, the Group assesses whether there is any indication that an asset may be impaired. Where an indicator of impairment exists, the Group makes a formal estimate of the recoverable amount. Where the carrying amount of an asset exceeds its recoverable amount, the asset is considered impaired and is written down to its recoverable amount.
Recoverable amount is the greater of fair value less costs to sell and value in use. It is determined for an individual asset, unless the asset’s value in use cannot be estimated to be close to its fair value less costs to sell, and it does not generate cash inflows that are largely independent of those from other assets or groups of assets, in which case, the recoverable amount is determined for the cash-generating unit to which the asset belongs. The estimated future cash flows are discounted to their present value using a pre-tax discount rate that reflects current market assessments of the time value of money and the risks specific to the asset.
If the recoverable amount of an asset (or cash-generating unit) is estimated to be less than its carrying amount, the carrying amount of the asset (cash-generating unit) is reduced to its recoverable amount. An impairment loss is recognised in the statement of profit or loss and other comprehensive income immediately, unless the relevant asset is carried at fair value, in which case the impairment loss is treated as a revaluation decrease.
Where an impairment loss subsequently reverses, the carrying amount of the asset (cash-generating unit) is increased to the revised estimate of its recoverable amount, but only to the extent that the increased carrying amount does not exceed the carrying amount that would have been determined had no impairment loss been recognised for the asset (cash-generating unit) in prior years. A reversal of an impairment loss is recognised in the statement of profit or loss and other comprehensive income immediately, unless the relevant asset is carried at fair value, in which case the reversal of the impairment loss is treated as a revaluation increase.
i) Provisions
Provisions are recognised when the Group has a present obligation (legal or constructive) as a result of a past event, it is probable that the Group will be required to settle the obligation, and a reliable estimate can be made of the amount of the obligation.
The amount recognised as a provision is the best estimate of the consideration required to settle the present obligation at the end of the reporting period, taking into account the risks and uncertainties surrounding the obligation. When a provision is measured using the cash flows estimated to settle the present obligation, its carrying amount is the present value of those cash flows, where the effect of the time value of money is material.
When some or all of the economic benefits required to settle a provision are expected to be recovered from a third party, a receivable is recognised as an asset if it is virtually certain that reimbursement will be received, and the amount of the receivable can be measured reliably.
j) Goods and services tax
Revenues, expenses and assets are recognised net of the amount of goods and services tax (GST), except:
- where the amount of GST incurred is not recoverable from the taxation authority, it is recognised as part of the cost of acquisition of the asset or as part of the expense item; or
- for receivables and payables which are recognised inclusive of GST.
The net amount of GST recoverable from, or payable to, the taxation authority is included as part of receivables or payables. Cash flows are included in the statement of cash flows on a gross basis. The GST component of cash flows arising from investing and financing activities which are recoverable from, or payable to, the taxation authority is classified as an operating cash flow.
k) Trade and other receivables
Trade and other receivables are recognised initially at fair value and subsequently measured at amortised costs using the effective interest method, less provision for impairment.
For
per
sona
l use
onl
y
NOTES TO THE CONSOLIDATED FINANCIAL
STATEMENTS FOR THE YEAR ENDED
30 JUNE 2019 _____________________________________________________________________________________________________________________
2019 ANNUAL REPORT Page | 35
l) Cash and cash equivalents
For the purposes of the statement of cash flows, cash and cash equivalents includes cash on hand, cash in banks and deposits at call which are readily convertible to cash and used in the cash management function on a day to day basis, net of outstanding bank overdrafts.
m) Trade and other payables
Liabilities for trade creditors and other amounts represent the consideration to be paid in the future for goods and services received, whether or not billed to the Group. These amounts are initially recognised at fair value and subsequently measured at amortised costs using the effective interest rate method.
Deferred cash settlements are recognised at the present value of the outstanding consideration payable on the acquisition of an asset discounted using a current pre-tax rate that reflects the risks specific to the liability.
n) Share capital
Ordinary share capital is recognised at the fair value of the consideration received by the Group. Any transaction costs arising on the issue of ordinary shares are recognised directly in equity as a reduction in share proceeds received.
o) Loss per share
Basic loss per share is determined by dividing the loss for the year attributable to owners of the Group, excluding any costs of service equity other than ordinary shares, by the weighted average number of ordinary shares outstanding during the financial year, adjusted for bonus elements in ordinary shares issued during the year.
p) Segment reporting
An operating segment is a component of an entity that engages in business activities from which it may earn revenues and incur expenses (including revenues and expenses relating to transactions with other components of the same entity), whose operating results are regularly reviewed by the entity’s chief operating decision maker to make decisions about resources to be allocated to the segment and assess its performance and for which discrete financial information is available. This includes start-up operations which are yet to earn revenues.
Operating segments have been identified based on the information provided to the chief operating decision makers - identified as being the Board of Strandline. Operating segments that meet the quantitative criteria as described by AASB 8 Operating Segments are reported separately. However, an operating segment that does not meet the quantitative criteria is still reported separately where information about the segment would be useful to users of the financial statements.
q) Investments and other financial assets
Investments and other financial assets are recognised and derecognised on settlement date where the purchase or sale of an investment is under a contract whose terms require delivery of the investment within the time-frame established by the market concerned. They are initially measured at fair value, net of transaction costs, except for those financial assets classified as fair value through profit or loss, which are initially measured at fair value.
The Group classifies its financial assets in the following measurement categories:
• Those to be measured subsequently at fair value (either through other comprehensive income (OCI), or through profit or loss);
• Those to be measured at amortised cost.
The classification is based on two criteria: the Group’s business model for managing the assets; and whether the instruments’ contractual cash flows represent ‘solely payments of principal and interest’ on the principal amount outstanding (‘the SPPI criterion’).
For assets measured at fair value, gains and losses will either be recorded in profit or loss or OCI. For investments in equity instruments that are not held for trading, the classification will depend on whether the Group has made an irrevocable election at the time of initial recognition to account for the equity investment at FVOCI.
For
per
sona
l use
onl
y
NOTES TO THE CONSOLIDATED FINANCIAL
STATEMENTS FOR THE YEAR ENDED
30 JUNE 2019 _____________________________________________________________________________________________________________________
2019 ANNUAL REPORT Page | 36
r) Foreign Currency Translation
The functional currency of each of the Group’s entities is measured using the currency of the primary economic environment in which the entity operates. The consolidated financial statements are presented in Australian dollars which is the parent entity’s functional presentation currency. The functional currency of the Tanzanian subsidiaries is the United States Dollar.
Foreign currency transactions
Transactions in foreign currencies are translated to the respective financial currencies of Group entities at exchange rates at the date of the transactions. Monetary assets and liabilities denominated in foreign currencies at the reporting date are retranslated to the functional currency at the exchange rate at that date. The foreign currency gain or loss on monetary items is the difference between amortised cost in the functional currency at the beginning of the period, adjusted for effective interest and payments during the period, and the amortised cost in foreign currency translated at the exchange rate at the end of the period.
Non-monetary assets and liabilities that are measured in a foreign currency are retranslated to the functional currency at the exchange rate at the date that the fair value was determined. Non-monetary items that are measured based on historical cost in a foreign currency are translated using the exchange rate at the date of the transaction.
Foreign currency differences arising on retranslation are recognised in profit or loss. However, foreign currency differences arising on the retranslation of available-for-sale equity instruments, a financial liability designated as a hedge of the net investment in a foreign operation, or qualifying cash flow hedges are recognised in other comprehensive income.
Foreign operations
The assets and liabilities of foreign operations, including good will and fair value adjustment arising on acquisition, are translated to the presentation currency at exchange rates at the reporting date. The income and expenses of foreign operations are translated to Australian dollars at exchange rates at the dates of the transactions. Foreign currency differences are recognised in other comprehensive income, and presented in the foreign currency translation reserve (translation reserve) in equity. However, if the operation is a non-wholly subsidiary, then the relevant proportion of the translation difference is allocated to the non-controlling interests. When a foreign operation is disposed of, such that control, significant influence or joint control is lost, the cumulative amount in the translation reserve related to that foreign operation is reclassified to profit or loss as part of the gain or loss on disposal.
When the Group disposes of only part of its interest in a subsidiary that includes a foreign operation while retaining control, the relevant proportion of the cumulative amount is reattributed to non-controlling interests. When the Group disposes of only part of its interest in a subsidiary that includes a foreign operation while retaining control, the relevant proportion of the cumulative amount is reattributed to non-controlling interests. When the Group disposes of only part of its investment in an associate or joint venture that includes a foreign operation while retaining significant influence or joint control, the relevant proportion of the cumulative amount is reclassified to profit or loss.
s) Critical accounting judgements and key sources of estimation uncertainty
In the application of the Group’s accounting policies, which are described in note 3, the Directors are required to make judgements, estimates and assumptions about the carrying amounts of assets and liabilities that are not readily apparent from other sources. The estimates and associated assumptions are based on historical experience and other factors that are considered to be relevant. Actual results may differ from these estimates. The estimates and underlying assumptions are reviewed on an ongoing basis. Revisions to accounting estimates are recognised in the period in which the estimate is revised if the revision affects only that period or in the period of the revision and future periods if the revision affects both current and future periods.
For
per
sona
l use
onl
y
NOTES TO THE CONSOLIDATED FINANCIAL
STATEMENTS FOR THE YEAR ENDED
30 JUNE 2019 _____________________________________________________________________________________________________________________
2019 ANNUAL REPORT Page | 37
Critical judgements in applying accounting policies
The following are the critical judgements, apart from those involving estimations (see below), that the Directors have made in the process of applying the Company’s accounting policies and that have the most significant effect on the amounts recognised in the financial statements:
Capitalisation of exploration and evaluation expenditure
Under AASB 6 ’Exploration for and Evaluation of Mineral Resources’, the Company may capitalise exploration and evaluation expenditure purchase costs as incurred provided that certain conditions are satisfied. All other exploration expenditure is expenses when its incurred. The Group capitalises acquisition expenditure relating to exploration and evaluation where it is considered likely to be recouped through the successful development or sale of the area of interest or where the activities have not reached a stage which permits a reasonable assessment of the existence of economically recoverable reserves. While there are certain areas of interest from which no reserves have been extracted, the directors are of the continued belief that such expenditure should not be written off since feasibility studies in such areas have not yet concluded. The Group’s policy is outlined in note 3.
Taxation
The Group is subject to various taxes in Australia and offshore jurisdictions and at times significant judgement is required in determining the Group’s liability associated with these taxes. The Group estimates its tax liabilities based on its understanding of the transactions and the tax laws in the local jurisdictions in which it operates. Should the final outcome of these matters be different from the initial assessment, such differences will impact the Group’s liabilities in the period in which such determination is made.
Key sources of estimation uncertainty
The following are the key assumptions concerning the future, and other key sources of estimation uncertainty at the end of the reporting period, that have a significant risk of causing a material adjustment to the carrying amounts of assets and liabilities in the next financial year.
Impairment of exploration and evaluation expenditure
Exploration and evaluation expenditure is reviewed for impairment if there is any indication that the carrying amount may not be recoverable. The Directors are required to exercise judgement on future events and the likelihood of defining an economic reserve. Assumptions made are altered as exploration and evaluation continues and more information becomes available. Where it is evident that the value of exploration and evaluation expenditure cannot be recovered the capitalised amount will be impaired through the statement of profit or loss and other comprehensive income.
The future recoverability of capitalised exploration and evaluation expenditure is dependent on a number of factors, including whether the Group decides to exploit the related lease itself or, if not, whether it successfully recovers the related exploration and evaluation asset through sale.
Factors that could impact the future recoverability include the level of reserves and resources, future technological changes, costs of drilling and production, production rates, future legal changes (including changes to environmental restoration obligations) and changes to commodity prices.
Share-based payment transactions
The Company measures the cost of equity-settled transactions with Directors, employees and consultants by reference to the fair value of the equity instruments at the date at which they are granted. For options, the fair value is determined using the Black Scholes model. For performance rights with market conditions, the fair value is measured using a binomial pricing model. For performance rights with non-market conditions, the fair value is measured using the closing share price at grant date.
For
per
sona
l use
onl
y
NOTES TO THE CONSOLIDATED FINANCIAL
STATEMENTS FOR THE YEAR ENDED
30 JUNE 2019 _____________________________________________________________________________________________________________________
2019 ANNUAL REPORT Page | 38
Tax losses
The deferred tax liability in relation to temporary differences arising from exploration and evaluation expenditure has not been recognised as the Company expects to have sufficient carried forward tax losses to offset this balance. The future recovery of these losses is subject to the Company satisfying the requirements imposed by the regulatory taxation authorities and passing the required Continuity of Ownership and Same Business Test rules at the time the losses are expected to be utilised.
t) Adoption of new and revised Accounting Standards
(i) New and amended standards
A number of new or amended standards became applicable for the current reporting period and Strandline Resources Limited have reviewed its accounting policies in light of these standards:
• AASB 9 Financial Instruments (“AASB 9”); and
• AASB 15 Revenue from Contracts with Customers (“AASB 15”).
AASB 15 has had no impact on adoption on these financial statements. The impacts of AASB 9 has been detailed in note 1(t)(ii)
(ii) AASB 9 Financial Instruments
AASB 9 replaces the provisions of AASB 139 that relate to the recognition, classification and measurement of financial assets and liabilities, recognition of financial instruments, impairment of financial assets and hedge accounting.
The adoption of AASB 9 resulted in minimal changes in accounting policies. The new accounting policies are set out below.
Impact of adoption
Classification and measurement of financial assets - On the date of initial application, 1 July 2018, the financial instruments of the Group were as follows, with any reclassification noted.
Equity investments previously classified as available-for-sale
The Group elected to present in other comprehensive income changes in the fair value of all its equity investments previously classified as available-for-sale, because these investments are held as long-term strategic investments that are not expected to be sold in the short to medium term. As a result, assets with a fair value of $210,000 were reclassified from available-for-sale financial assets, recognised under ‘Financial Assets’ to financial assets at fair value at FVOCI and any future fair value gains will be reclassified from the Investment Revaluation Reserve to the FVOCI Reserve from 1 July 2018 onwards.
Investments and other financial assets
Investments and other financial assets Investments are recognised and derecognised on settlement date where the purchase or sale of an investment is under a contract whose terms require delivery of the investment within the time-frame established by the market concerned. They are initially measured at fair value, net of transaction costs, except for those financial assets classified as fair value through profit or loss, which are initially measured at fair value.
For
per
sona
l use
onl
y
NOTES TO THE CONSOLIDATED FINANCIAL
STATEMENTS FOR THE YEAR ENDED
30 JUNE 2019 _____________________________________________________________________________________________________________________
2019 ANNUAL REPORT Page | 39
The Group classifies its financial assets in the following measurement categories:
• Those to be measured subsequently at fair value (either through other comprehensive income, or through profit or loss);
• Those to be measured at amortised cost.
The classification depends on the entity’s business model for managing the financial assets and the contractual terms of the cash flows.
For assets measured at fair value, gains and losses will either be recorded in profit or loss or OCI. For investments in equity instruments that are not held for trading, the classification will depend on whether the Group has made an irrevocable election at the time of initial recognition to account for the equity investment at FVOCI.
Measurement
At initial recognition, the group measures a financial asset at its fair value plus, in the case of a financial asset not at fair value through profit or loss (FVPL), transaction costs that are directly attributable to the acquisition of the financial asset. Transaction costs of financial assets carried at FVPL are expensed in profit or loss. Financial assets with embedded derivatives are considered in their entirety when determining whether their cash flows are solely payment of principal and interest.
The Group subsequently measures all equity investments at fair value. The fair values of quoted investments are based on current bid prices. If the market for a financial asset is not active (and for unlisted securities), the Group establishes fair value by using valuation techniques. These include reference to the fair values of recent arm’s length transactions, involving the same instruments or other instruments that are substantially the same, discounted cash flow analysis, and pricing models to reflect the issuer’s specific circumstances.
Where the Group’s management has elected to present fair value gains and losses on equity investments in OCI, there is no subsequent reclassification of fair value gains and losses to profit or loss following the derecognition of the investment. Dividends from such investments continue to be recognised in profit or loss as other income when the Group’s right to receive payments is established.
Impairment losses (and reversal of impairment losses) on equity investments measured at FVOCI are not reported separately from other changes in fair value.
Impairment
The Group assesses at each balance date whether there is objective evidence that a financial asset or group of financial assets is impaired. For other receivables, the Group applies the simplified approach permitted by AASB 9, which requires expected lifetime losses to be recognised from initial recognition of the receivables. The expected credit losses on these financial assets are estimated using a provision matrix based on the Group’s historical credit loss experience.
(iii) Impact of standards issued but not yet applied by the entity
AASB 16: Leases was issued in February 2016. It will result in almost all leases being recognised on the balance sheet, as the distinction between operating and finance leases is removed. Under the new standard, an asset (the right to use the leased item) and a financial liability to pay rentals are recognised. The only exceptions are short-term and low-value leases.
The accounting for lessors will not significantly change.
The standard is mandatory for first interim periods within annual reporting periods beginning on or after 1 January 2019. Strandline Resources Limited does not intend to adopt the standard before its effective date.
For
per
sona
l use
onl
y
NOTES TO THE CONSOLIDATED FINANCIAL
STATEMENTS FOR THE YEAR ENDED
30 JUNE 2019 _____________________________________________________________________________________________________________________
2019 ANNUAL REPORT Page | 40
4. Segment information
The Group operates in one business segment, namely the mineral exploration industry. AASB 8 ‘Operating Segments’ states that similar operating segments can be aggregated to form one reportable segment. Also, based on the quantitative thresholds included in AASB 8, there is only one reportable segment, namely the mineral exploration industry. However, none of the other operating segments currently meet any of the prescribed quantitative thresholds and as such do not have to be reported separately. Strandline Resources Limited has therefore decided to aggregate all its operating segments into one reportable operating segment.
The revenues and results of this segment are those of the Group as a whole and are set out in the statement of profit or loss and other comprehensive income. The Group has exploration and evaluation assets in Australia and Tanzania and geographical segment information is shown below:
Geographical Segment Information 2019
Revenue
$
2019 Non-Current
Assets $
2018 Revenue
$
2018 Non-Current
Assets $
Australia 450,055 937,912 159,338 261,293
Tanzania - 6,774,644 - 7,249,117
450,055 7,712,556 159,338 7,510,410
2019
$
2018
$ 5. Revenue from continuing operations
Interest revenue 58,719 64,750
6. Other income
2019 $
2018 $
Research & Development tax credit Earn-in revenue (a)
192,629 357,398
267,672 -
JV Management Fees 92,657 159,338
642,686 427,010
(a) Earn-in revenue recognised during the year relates to the JV Minimum Commitment owing to the Company with respect to the Joint Venture Agreement with Rio Tinto Mining and Exploration Limited.
7. Income taxes
2019 $
2018 $
Income tax recognised in the profit or loss Tax benefit comprises: Current tax benefit - -
Total tax benefit relating to continuing operations - -
For
per
sona
l use
onl
y
NOTES TO THE CONSOLIDATED FINANCIAL
STATEMENTS FOR THE YEAR ENDED
30 JUNE 2019 _____________________________________________________________________________________________________________________
2019 ANNUAL REPORT Page | 41
7. Income taxes (Cont’d)
The benefit for the year can be reconciled to the accounting loss as follows: Loss before tax (7,000,260) (4,713,703) Income tax expense calculated at 30% (2,100,078) (1,414,111)
Effect of expenses that are not deductible in determining taxable loss 193,539 53,297 Effect of unused tax losses not recognised as deferred tax assets 2,079,060 1,533,335 Effect of deductible capitalised expenditure (172,521) (172,521) Income tax benefit recognised in the statement of profit or loss and other comprehensive income
- -
The tax rate used for the 2019 and 2018 reconciliations above is the corporate tax rate of 30% payable by Australian corporate entities on taxable profits under Australian tax law.
Capital raising costs recognised directly in equity 279,789 217,917 Temporary differences 266,151 260,037
Net unrecognised deferred tax asset 15,332,177 13,185,130
Tax losses
Unused tax losses have not been recognised as a deferred tax asset as the future recovery of those losses is subject to the Company satisfying the requirements imposed by the regulatory taxation authorities. The amount of unrecognised carry forward tax losses is based on management’s assessment of their ability to meet the same business or the modified continuity of ownership test. The benefits of these deferred tax assets not brought to account will only be brought to account if:
• future assessable income is derived of a nature and of an amount sufficient to enable the benefit to be realised;
• the conditions for deductibility imposed by tax legislation continue to be complied with; and • no changes in tax legislation adversely affect the Company in realising the benefit.
8. Loss for the year Loss for the year has been arrived at after charging the following items of expenses:
2019
$ 2018
$ Employee benefit expense
Directors’ fees 193,023 185,303
Wages and salaries 885,226 539,135
Superannuation expenses 71,485 57,965
Increase in provision for annual leave - 126,998
Increase in provision for long service leave (4,581) 1,726
Staff recruitment 16,419 58,470
Total employee benefit expense 1,161,572 969,597
Depreciation expense (11,207) 11,825
Occupancy expenses 84,046 68,945
Share-based payments 947,351 443,404
For
per
sona
l use
onl
y
NOTES TO THE CONSOLIDATED FINANCIAL
STATEMENTS FOR THE YEAR ENDED
30 JUNE 2019 _____________________________________________________________________________________________________________________
2019 ANNUAL REPORT Page | 42
9. Loss per share
2019 Cents
per share
2018 Cents
per share
Basic and diluted loss per share (2.36) (1.73)
Basic & Diluted loss per share The loss and weighted average number of ordinary shares used in the calculation of basic loss per share are as follows:
2019 2018 $ $ Loss for the year (7,000,258) (4,713,703)
2019 2018 No. No. Weighted average number of ordinary shares for the purposes of the basic loss per share
296,867,490 272,844,242
10. Other receivable
2019 $
2018 $
Goods and services tax recoverable 134,837 149,559
Accrued interest 1,832 5,998
Other income 36 -
136,705 155,557
Individual receivables which are known to be uncollectible are written off by reducing the carrying amount directly. The other receivables are assessed collectively to determine whether there is objective evidence that an impairment has been incurred but not yet been identified. No impairments have been identified.
11. Prepayments 2019
$ 2018
$
Office rent and Expatriate Accommodation 2,777 37,202
12. Property, Plant & Equipment
Plant & Equipment Gross Carrying value at cost Accumulated deprecation
294,638
(269,103) 274,491 (250,305)
Net book amount 25,535 24,185
Plant & Equipment Opening net book amount - 1 July Additions Disposals Depreciation charge Foreign exchange movement
24,011
11,750, 8,589
11,207 (7,608)
24,011 11,407
- 11,825
592
Closing net book value – 30 June 25,535 24,185
For
per
sona
l use
onl
y
NOTES TO THE CONSOLIDATED FINANCIAL
STATEMENTS FOR THE YEAR ENDED
30 JUNE 2019 _____________________________________________________________________________________________________________________
2019 ANNUAL REPORT Page | 43
2019 2018 13. Exploration and evaluation expenditure $ $
Carried forward exploration and evaluation expenditure 7,239,023 7,078,032
Foreign exchange movement 221,748 160,991
7,460,771 7,239,023
In accordance with applicable accounting standards, the Group has assessed whether or not there are any indicators that would require the group to undertake an impairment assessment as at the reporting date.
Following this assessment, including the potential impact of the recent changes to the legal framework governing the natural resources sector in Tanzania, the Group has determined there are no indicators of impairment however acknowledge the recoverability of the carrying amount of the exploration and evaluation assets is dependent on successful development and commercial exploitation, or alternatively, sale of the respective areas of interest.
14. Financial assets 2019
$ 2018
$
Financial Assets held at Fair Value through Other Comprehensive Income 210,000 210,000
Other investments consist of 4,200,000 unlisted ordinary shares in Torrens Mining Limited (“Torrens”), an unlisted public company. The investment consists of 4,000,000 shares received on the sale of the Mount Gunson Project to Torrens at a value of $200,000 and an additional 200,000 shares subscribed for at a cost of $10,000.
The cost of the investment is deemed fair value based on Torrens securing additional funding to continue operations.
In addition, the Company is eligible to receive a further deferred cash payment of $1 million once Torrens makes a formal decision to mine in connection with the Project. If, prior to a decision to mine, the Project assets become listed on the Australian Securities Exchange (whether via an IPO of Torrens or a sale into a listed vehicle), or the Project assets are otherwise sold to a third party, then $250,000 of the deferred cash consideration will become payable within 60 days and the remaining amount of the deferred cash consideration will convert to a 2% net smelter royalty (capped at $1.25M).
15. Current trade and other payables 2019
$ 2018
$
Trade payables 172,486 146,464
Accrued director fees 8,333 13,054
Other creditors and accruals 305,313 236,907
Unearned joint venture revenue 160,258 638,572
646,390 1,034,997
Accounts payable are all payable in Australian dollars, are non-interest bearing and normally settled on 30 day terms. Refer to note 22 for details of the Company’s exposure to liquidity risks on financial liabilities.
16. Current provisions
2019
$ 2018
$ Provision for annual leave Provision for long service leave
113,597
3,972
93,641 8,553
117,569 102,194
For
per
sona
l use
onl
y
NOTES TO THE CONSOLIDATED FINANCIAL
STATEMENTS FOR THE YEAR ENDED
30 JUNE 2019 _____________________________________________________________________________________________________________________
The Company does not have a limited amount of authorized capital and issued shares do not have a par value.
Fully paid ordinary shares 2019 2018
No. $ No. $ Balance at beginning of year 289,315,617 66,448,477 3,012,697,074 62,379,704 Performace Rights - expiring 15/8/18 vested- Luke Graham 2,291,667 137,500
Issue of Shares to Luke Graham (50% of STI bonus taken as shares) 581,082 82,514
Issue of Shares to MF, PW, BC, JA (100% of STI bonus taken as shares) 1,227,713 174,335
Share issue at 0.8 cents per share on 10 July 2017 pursuant to a Share Placement
209,916,267 1,679,328
Share issue at 0.5 cent per share in lieu of payment for a bonus to Luke Graham upon achievement of performance hurdles (i)
16,500,000 82,500
Share consolidation pursuant to shareholder approval at the 2017 Annual General Meeting
(2,969,186,572) -
Share issue at 12 cents per share on 26 March 2018 upon exercise of options
2,858,521 343,023
Share issue at 18 cents per share on 26 March 2018 upon exercise of options
4,800 864
Share issue at 12 cents per share on 16 April 2018 upon exercise of options
14,020,362 1,682,443
Share issue at 18 cents per share on 16 April 2018 upon exercise of options
75 14
Share issue at 12 cents per share on 12 June 2018 upon exercise of options
442,324 53,079
Share issue at 18 cents per share on 12 June 2018 upon exercise of options
26 5
Share issue at 12 cents per share on 29 June 2018 upon exercise of options
2,060,509 247,261
Share issue at 18 cents per share on 29 June 2018 upon exercise of options
2,231 401
Balance at end of year 366,695,721 75,020,276 289,315,617 66,448,477
(i) Shares issued to Mr Luke Graham pursuant to the Company’s Short term Incentive Plan, as approved by shareholders on 24 November 2016. The shares were issued in lieu of an equivalent cash payment.
For
per
sona
l use
onl
y
NOTES TO THE CONSOLIDATED FINANCIAL
STATEMENTS FOR THE YEAR ENDED
30 JUNE 2019 _____________________________________________________________________________________________________________________
2019 ANNUAL REPORT Page | 45
17. Issued capital (Cont’d) Fully paid ordinary shares carry one vote per share and carry the right to dividends. Ordinary shares participate in the proceeds on winding up of the Company in proportion to the number of shares held. Share options and performance rights on issue
Share options and performance rights issued by the Company carry no rights to dividends and no voting rights.
As at 30 June 2019, the Company has zero share options on issue (2018: 47,069,590).
During the year Nil options were granted (2018: Nil), 6,916 options were converted into shares (2018: 19,388,848) and 47,062,674 options expired (2018: 16,627,679). Further details regarding the options are contained in note 23 to the financial statements.
As at 30 June 2019, the Company has 16,899,702 performance rights on issue (2018: 14,572,835) exercisable on a 1:1 basis for 16,899,702 shares (2018: 14,572,835). During the year 4,618,534 performance rights were granted (2018: 9,989,501), 2,291,667 performance rights were converted into shares (2018: Nil) and nil performance rights expired (2018: Nil). The Company has made an assessment that it is probable the performance conditions will be met for the performance rights on issue. Further details regarding the performance rights are contained in note 23 to the financial statements.
Recognition of share-based payments (i) 553,002 360,904
Balance at end of year 2,737,643 2,184,642
The share-based payments reserve arises on the grant of share options and performance rights to executives, employees, consultants and advisors. Amounts are transferred out of the reserve and into issued capital when the options are exercised. Further information about share-based payments is contained in note 23 to the financial statements.
(i) Total expenses arising from share-based payment transactions recognized during the year ended 30 June 2019 as part of employee benefit expense was $553,002 (2018: $360,904). The amount recognized in the current period includes an adjustment for reversal of previously recognized expenses due to performance rights that did not ultimately vest of nil (2018: $nil).
2019 $
2018 $
Foreign currency translation reserve
Balance at beginning of year 607,023 156,741
Foreign currency translation difference for foreign operations 206,222 450,282
Balance at end of year 813,345 607,023
For
per
sona
l use
onl
y
NOTES TO THE CONSOLIDATED FINANCIAL
STATEMENTS FOR THE YEAR ENDED
30 JUNE 2019 _____________________________________________________________________________________________________________________
2019 ANNUAL REPORT Page | 46
18. Reserves (Cont’d)
The foreign currency translation reserve comprises all foreign currency differences arising from the translation of the financial statements of foreign operations, as well as from the translation of liabilities that hedge the Group’s net investment in foreign subsidiaries.
19. Commitments for expenditure
2019
$ 2018
$ Leasing commitments Leasing arrangements for office space and office equipment
Not longer than 1 year 6,150 2,184
Longer than 1 year and not longer than 5 years 819 819
6,969 3,003
20. Contingent liabilities The Directors are not aware of any contingent liabilities as at 30 June 2019 (2018: $nil). 21. Cash and cash equivalents
For the purposes of the statement of cash flows, cash and cash equivalents includes cash on hand, cash in banks and deposits at call which are readily convertible into cash and used in the cash management function on a day to day basis, net of outstanding bank overdrafts.
Cash and cash equivalents at the end of the reporting period as shown in the statement of cash flows can be reconciled to the related items in the statement of financial position as follows:
2019 $
2018 $
Cash at bank Cash in joint venture (1) – restricted cash Cash on deposit
865,323 160,258
5,200,000
352,413 638,572
3,300,000
Cash and bank balances 6,065,322 4,290,985
(1) Earn In and Unincorporated Joint Venture Agreement
The Group is party to an earn in and unincorporated joint venture agreement (‘Agreement’) with Rio Tinto Mining and Exploration Limited (‘Rio Tinto’) covering a suite of exploration tenements owned by the Group, located in the Southern region of Tanzania, East Africa (‘Tenements’) which commenced on 21 June 2017. Rio Tinto can earn an interest of 51% in the Tenements by funding USD 5 million (Stage 1) in exploration expenditure and can extend that interest to 75% by funding a further USD 4 million (Stage 2). Until such time that the Stage 1 funding requirement is satisfied, Strandline remains the 100% owner and operator of the tenements.
Rio Tinto must incur a minimum of USD 2 million in funding within 18 months of the commencement of the Agreement (‘Minimum Commitment’).
The Group recognises any joint venture cash balance at each reporting date (up to the Minimum Commitment) in its consolidated financial statements as restricted cash, with the corresponding credit recognised in the Statement of Financial Position as funds to be spent in line with the Agreement. To date no exploration expenditure in relation to this Agreement has been recognised as these are offset against the contributions by Rio Tinto under the Agreement.
For
per
sona
l use
onl
y
NOTES TO THE CONSOLIDATED FINANCIAL
STATEMENTS FOR THE YEAR ENDED
30 JUNE 2019 _____________________________________________________________________________________________________________________
2019 ANNUAL REPORT Page | 47
21. Cash and cash equivalents (Cont’d)
As at 30 June 2019 contributions totaled AUD 3,065,736 and payments for exploration of the tenements totaled AUD 2,919,013, leaving a restricted cash total of AUD 146,722.
Reconciliation of loss for the year to net cash outflow used by operating activities
2019
$
2018 $
Loss for the year (7,000,260) (4,713,703)
Non-cash items
Depreciation 11,207 11,825
Share-based payments 947,351 443,404
Gain on sale of fixed assets - -
Movements in working capital
Increase in trade and other receivables (101,172) 600,322
Increase in prepayments 34,425 (31,540)
Increase in trade and other payables (399,671) 440,456
Increase in provisions 15,376 7,661 Movements in Foreign currency translation reserve excluding Capitalised E&E and Property, plant and equipment
(42,465) 288,498
Net cash outflow used in operating activities (6,535,207) (2,953,077)
Non-cash financing activities There were no non-cash financing activities during the year (2018: Nil). 22. Financial instruments Capital management
The Group manages its capital to ensure that it will be able to continue as a going concern while maximizing the return to stakeholders through the optimization of debt and equity. The Board’s policy is to maintain a strong capital base to maintain investor, creditor and market confidence and to sustain future development of the business.
Capital management requires the maintenance of a strong cash balance to support ongoing exploration and evaluation activities. There were no changes in the Group’s approach to capital management during the year. The Group is not subject to externally imposed capital requirements.
Categories of financial instruments
2019
$ 2018
$ Financial assets Cash and cash equivalents 6,065,322 4,290,985 Other investments 210,000 210,000 6,275,322 4,500,985
Financial liabilities
Trade and other payables 646,390 1,034,997
For
per
sona
l use
onl
y
NOTES TO THE CONSOLIDATED FINANCIAL
STATEMENTS FOR THE YEAR ENDED
30 JUNE 2019 _____________________________________________________________________________________________________________________
In common with all other businesses, the Group is exposed to risks that arise from its use of financial instruments. These risks include market risk, interest rate risk, credit risk and liquidity risk. The Group’s objectives, policies and processes for measuring and managing those risks are disclosed below
The Board has overall responsibility for the establishment and oversight of the risk management framework. Risk management policies are established to identify and analyse the risks faced by the Group, to set appropriate risk limits and controls and to monitor risks and adherence to limits. Risk management policies and systems are reviewed regularly to reflect changes in market conditions and the Company’s activities. The Group aims to develop a disciplined and constructive control environment in which all employees understand their roles and obligations.
Currency Risk
The Group is exposed to currency risk on purchases that are denominated in currency other than the respective functional currencies of the Group entities, primarily the Australian dollar (AUD) and the United States Dollar (USD). The currencies in which these transactions primarily are denominated are AUD and USD. The Group investment in its Tanzanian subsidiaries is denominated in AUD and is not hedged as those currency positions are considered to be long term in nature.
Interest rate risk management
The consolidated entity’s exposure to the market risk for change in interest rate arises from holding cash and deposits. Funds held in operating accounts and term deposits earned a variable interest rate ranging from 0% to 2.7% (2018: 0% to 2.7%) based on the type of account and cash balance. The consolidated entity did not have any loans or borrowings.
The interest-bearing financial instruments held are:
2019
$ 2018
$ Cash and cash equivalents 6,065,322 4,290,985 6,065,322 4,290,985
A change of 1% in the variable interest rate at the reporting date would have an impact on the consolidated entity profits and loss and equity of $34,560 (2018: $41,749) assuming all other variable are constant.
Fair value of financial assets and liabilities
The Group’s financial assets and financial liabilities are recognised initially at fair value and subsequently measured at amortised cost using the effective interest method. The fair value of the financial assets and financial liabilities as at 30 June 2019 and 30 June 2018 approximates their carrying amounts.
Fair value hierarchy
The level in the fair value hierarchy within which the financial asset or financial liability is categorised is determined on the basis of the lowest level input that is significant to the fair value measurement being:
For
per
sona
l use
onl
y
NOTES TO THE CONSOLIDATED FINANCIAL
STATEMENTS FOR THE YEAR ENDED
30 JUNE 2019 _____________________________________________________________________________________________________________________
2019 ANNUAL REPORT Page | 49
22. Financial instruments (cont’d) Level 1: Quoted prices (unadjusted) in active markets for identical assets or liabilities that the entity can access at the measurement date;
Level 2: Inputs other than quoted prices included within Level 1 that are observable for the asset or liability, either directly or indirectly; and
Level 3: Unobservable inputs for the asset or liability. The Group’s financial assets measured at fair value are set out in the table below:
As set out in note 14 to the financial statements, other investments consist of 4,200,000 unlisted ordinary shares in Torrens Mining Limited (“Torrens”). Torrens is an unlisted public company. The cost of the investment is deemed fair value based on equity issued by Torrens Mining Limited. Credit risk management
Credit risk refers to the risk that a counterparty will default on its contractual obligations resulting in financial loss to the Group and arises principally from the Group’s receivables. There were no trade and other receivables in arrears.
The Group’s exposure and the credit ratings of its counterparties are continuously monitored. The Company has adopted a policy of only dealing with creditworthy counterparties and obtaining sufficient collateral/security bonds where appropriate, as a means of mitigating the risk of financial loss from defaults.
The credit risk on liquid funds is limited because the counterparties are banks with high credit ratings assigned by international credit rating agencies. The credit rating of the Group’s bank is AA-.
At risk amounts are as follows:
2019
$ 2018
$ Financial assets Cash and cash equivalents 6,065,322 4,290,985
6,065,322 4,290,985
Liquidity risk management
Liquidity risk is the risk that the Group will not be able to meet its financial obligations as and when they fall due. The Group’s approach to managing liquidity is to ensure, as far as possible, that it will always have sufficient liquidity to meet its liabilities as and when they fall due, under both normal and stressed conditions, without incurring unacceptable losses or risking damage to the Group’s reputation.
Ultimate responsibility for liquidity risk management rests with the Board, which has established an appropriate liquidity risk management framework for the management of the Group’s short, medium and long-term funding and liquidity management requirements. The Group manages liquidity risk by maintaining adequate reserves by continuously monitoring forecast and actual cash flows, identifying when further capital raising or other initiatives are required.
For
per
sona
l use
onl
y
NOTES TO THE CONSOLIDATED FINANCIAL
STATEMENTS FOR THE YEAR ENDED
30 JUNE 2019 _____________________________________________________________________________________________________________________
2019 ANNUAL REPORT Page | 50
22. Financial instruments (cont’d)
Liquidity risk table
The following table details the Group’s remaining contractual maturity for its non-derivative financial liabilities. These are based on the undiscounted cash flows of financial liabilities based on the earliest date on which the Group can be required to pay.
Contractual cash flows
Carrying amount
Less than 1 month
1-3 months
3-12 months
1 year to 5 years
Total contractual cash flows
$ $ $ $ $ $ 2019
Financial liabilities
Trade and other payables 646,390 (646,390) - - - (646,390)
2018
Financial liabilities
Trade and other payables 1,034,997 (396,425) (638,572) - - (1,034,997)
23. Share-based payments
Share-based payments including options and performance rights are granted at the discretion of the Board to align the interests of executives, employees and consultants with those of shareholders.
Each option issued converts into one ordinary share of Strandline Resources Limited on exercise. No amounts are paid or payable by the recipient on receipt of the option. Options neither carry rights to dividends nor voting rights. Options may be exercised at any time from the date of vesting to the date of their expiry by paying the exercise price.
Performance rights are, in effect, options to acquire unissued shares in the Company, the exercise of which is subject to certain performance milestones and remaining in employment during the vesting period. Performance rights are granted under the Group’s Long Term Incentive Plan for no consideration and are granted for a period not exceeding 5 years.
Fair value of share options granted in the year
The fair value of services received in return for share options granted is based on the fair value of the share options granted, independently determined using the Black-Scholes option pricing model.
Performance Rights
Fair value of performance rights granted in the year
For performance rights with market conditions, the fair value of services received is measured using a binomial pricing model. For performance rights with non-market conditions, fair value is measured using the closing share price at grant date. Vesting is based on the performance conditions being met which are listed below.
A total of 2,666,667 performance rights were granted during the year to Mr. Luke Graham, a director of the Company.
For
per
sona
l use
onl
y
NOTES TO THE CONSOLIDATED FINANCIAL
STATEMENTS FOR THE YEAR ENDED
30 JUNE 2019 _____________________________________________________________________________________________________________________
The performance condition of each tranche is set out as follows:
Tranches
1 – 3:
The performance rights will only vest if certain performance conditions are met. At the end of each tranche’s performance measurement period, the Board will rank the Company’s Total Shareholder Return (TSR) against a peer group of other companies as determined by the Board. The percentage of performance rights in each respective tranche that will vest will depend upon the Company’s TSR performance relative to the companies in the peer group, which will constitute Category A, B or C TSR performance, as set out below:
(a) Category A TSR performance: If the Company’s TSR is at/or below the 45th percentile of the peer group of companies’ TSR, no PRs will vest.
(b) Category B TSR performance: If the Company’s TSR ranks between the 46th and 50th percentile (inclusive) of the peer group of companies’ TSR, for each percentile over the 45th percentile, 10% of the PRs will vest (up to a maximum of 50% for this Category).
(c) Category C TSR performance: For each 1% ranking at or above the 51st percentile of the peer group of companies TSR, an additional 2% of the PRs will vest (up to a maximum of 100%, which vest at or above the 75th percentile).
Tranche 1 Period: 1 July 2016 – 30 June 2018 Tranche 2 Period: 1 July 2017 – 30 June 2019 Tranche 3 Period: 1 July 2018 – 30 June 2020
Movements in performance rights during the period The following reconciles the performance rights outstanding at the beginning and end of the year:
2019 2018 No. No.
Balance at beginning of the year 14,572,835 4,583,333
Granted during the year 4,618,534 9,989,502
Exercised during the year (2,291,667) -
Expired during the year - -
Balance at end of the year 16,899,702 14,572,835
For
per
sona
l use
onl
y
NOTES TO THE CONSOLIDATED FINANCIAL
STATEMENTS FOR THE YEAR ENDED
30 JUNE 2019 _____________________________________________________________________________________________________________________
2019 ANNUAL REPORT Page | 52
23. Share-based payments (Cont’d) Recognition of share-based transactions
2019
$ 2018
$
Share options - -
Performance rights 553,001 360,904
Total share-based payments recognised in reserves 553,001 360,904
24. Other unlisted options The following refers to unlisted options issued by the Company, other than those issued as a share based payment transaction. No options were granted during the year (2018: nil). The options in the prior year were granted as a free-attaching option as part of a renounceable Rights Issue. Shareholders who participated in the Rights Issue, for every two new shares taken up, receive one option exercisable at 12 cent on or before 30 June 2018 and one option exercisable at 18 cents on or before 30 June 2019. Movements in share options during the period The following reconciles the share options outstanding at the beginning and end of the year:
2019 2018
Number of
options
Weighted average
exercise price $
Number of options
Weighted average
exercise price $
Balance at beginning of the year 47,069,590 0.12 83,618,781 0.108
Granted during the year - - - -
Forfeited during the year - - - -
Exercised during the year (6,916) (0.18) (19,388,249) (0.12)
Expired during the year (47,062,674) (0.18) (17,160,942) (0.12)
Balance at end of the year - - 47,069,590 0.12
Exercisable at end of the year - - 47,069,590 0.12
Share options exercised during the year A total of 6,916 share options were exercised during the financial year (2018: 19,388,249)
Share options outstanding at the end of the year The share options outstanding at the end of the year had a weighted average exercise price of nil cents (2018: 12 cents) and a weighted average remaining contractual life of nil days (2018: 302 days). 25. Key management personnel compensation
The Directors and other members of key management personnel of the Company during the year were:
• Didier Murcia (Non-Executive Chairman, appointed 1 March 2016, former Non-Executive Director from 23 October 2014 to 29 February 2016)
• Luke Edward Graham (Managing Director, appointed 19 September 2016)
• Peter Richard Watson (Executive Director, appointed 10 September 2018)
• John Russell Hodder (Non-Executive Director, appointed 8 June 2016)
• Ernest Thomas Eadie (Non-Executive Director, appointed 19 September 2016, former Managing Director from 1 January 2016 to 18 September 2016, former Non-Executive Director from 9 October 2015 to 31 December 2015)
• Asimwe Matungwa Herman Kabunga (Non-Executive Director, appointed on 18 June 2015 and resigned on 8 October 2018)
For
per
sona
l use
onl
y
NOTES TO THE CONSOLIDATED FINANCIAL
STATEMENTS FOR THE YEAR ENDED
30 JUNE 2019 _____________________________________________________________________________________________________________________
The aggregate compensation made to key management personnel of the Group is set out below:
2019
$ 2018
$ Short- term employee benefits 1,255,256 610,336
Share-based payments 472,976 250,185
1,728,182 860,521
The short-term employee benefits are recognized in both the statement of profit or loss and other comprehensive income as an expense, and the statement of financial position as an exploration and evaluation asset, depending upon the work activity undertaken. The compensation of each member of the key management personnel of the Group is set out in the Remuneration Report contained within the Director’s Report section of the Annual Report. The remuneration of Directors and key executives is determined by the Board having regard to the performance of individuals and market trends.
26. Remuneration of auditors
2019
$ 2018
$ Audit Services
BDO Audit (WA) Pty Ltd
Audit and review of the financial statements 40,480 42,219
Total remuneration for audit services 40,480 42,219
2019
$ 2018
$ Non Audit Services
BDO Corporate Tax (WA) Pty Ltd
Tax compliance services 9,945 10,404
Total remuneration for non-audit services 9,945 10,404
27. Related party transactions Transactions with key management personnel
Compensation
Details of key management personnel compensation are disclosed in the Directors’ Report section contained within the Annual Report.
Equity holdings
Disclosure of key management personnel equity holdings is set out in the Remuneration Report contained within the Director’s Report section of the Annual Report.
Loans
No loans have been made by the Company to key management personnel during the year (2018: nil).
For
per
sona
l use
onl
y
NOTES TO THE CONSOLIDATED FINANCIAL
STATEMENTS FOR THE YEAR ENDED
30 JUNE 2019 _____________________________________________________________________________________________________________________
2019 ANNUAL REPORT Page | 54
27. Related party transactions (Cont’d)
Other transactions
Mr. Didier Murcia, Non-Executive Chairman, is a chairman of the legal firm, Murcia Pestell Hillard. Fees totalling $124,482 were paid to Murcia Pestell Hillard for work completed on various legal matters (2018: $97,677). All transactions related to the services were based on normal commercial terms.
Mr. Didier Murcia, is also Non-executive Chairman of Artemis Management Tanzania, a provider of corporate, administration, logistics, tenement management and evaluation and environment management services in Tanzania. Fees totalling $52,816 were paid to Artemis Management Tanzania for corporate and administration services (2018: $37,520). All transactions related to the services were based on normal commercial terms.
28. Group entities
Country of Ownership Interest Incorporation 2019 2018
Parent Entity
Strandline Resources Limited
Subsidiaries
Active Resources (Tanzania) Limited Tanzania 100% 100%
Jacana Resources (Tanzania) Limited Tanzania 100% 100%
Tanzanian Graphite Limited Tanzania 100% 100%
Coburn Resources Pty Ltd (1) Australia 100% 100% (1) formerly Strandline Resources Australia Pty Ltd
29. Parent entity disclosures As at and throughout the financial year, the parent of the Group was Strandline Resources Limited.
Company
2019 $
2018 $
Results of the Parent Entity
Loss for the period (2,218,149) (3,066,825)
Other comprehensive income - -
Total comprehensive loss for the period (2,218,149) (3,066,825)
2019 $
2018
$
Financial Position of the Parent Entity at Year End
Current assets 3,302,479 3,615,835
Non-current assets 19,618,245 18,417,623
Total assets 22,920,724 22,033,458
Current liabilities 963,602 846,983
Total liabilities 963,602 846,983
Net assets 21,957,122 21,186,475
Contributed equity 69,365,092 66,448,412
Reserves 2,256,758 2,184,641
Accumulated losses (49,664,728) (47,446,577)
Total equity 21,957,122 21,186,475
For
per
sona
l use
onl
y
NOTES TO THE CONSOLIDATED FINANCIAL
STATEMENTS FOR THE YEAR ENDED
30 JUNE 2019 _____________________________________________________________________________________________________________________
2019 ANNUAL REPORT Page | 55
29. Parent Entities disclosures (Cont’d)
Parent Entity Contingencies
The parent entity had no contingent liabilities as at 30 June 2019 (2018: nil). Expenditure Commitments 2019 2018
Leasing commitments $ $ Leasing arrangements for office space and office equipment Not longer than 1 year 6,150 2,184
Longer than 1 year and not longer than 5 years 819 819
6,969 3,003
30. Events after the reporting period
There has not been any matter or circumstance occurring subsequent to the end of the financial year that has significantly affected, or may significantly affect, the operations of the Group, the results of those operations or the state of affairs of the Group in future financial years.
31. Approval of financial statements
The financial statements were approved by the Board of Directors on 26 September 2019.
(a) in the Directors’ opinion, there are reasonable grounds to believe that the Company will be able to pay its debts as and when they become due and payable;
(b) in the Directors’ opinion, the attached consolidated financial statements are in compliance with International Financial Reporting Standards, as stated in note 3 to the financial statements;
(c) in the Directors’ opinion, the attached consolidated financial statements and notes thereto are in accordance with the Corporations Act 2001 and other mandatory professional reporting requirements, including compliance with accounting standards and giving a true and fair view of the financial position and performance of the consolidated Group;
(d) the Directors have been given the declarations required by s.295A of the Corporations Act 2001; and
(e) the remuneration disclosures included in the Directors’ Report on pages 16 to 23 of this Annual Report (as part of the audited Remuneration Report), for the year ended 30 June 2019, comply with s.300A of the Corporations Act 2001.
Signed in accordance with a resolution of the Directors made pursuant to s.295 (5) of the Corporations Act 2001.
On behalf of the Directors
Luke Graham Managing Director Perth, 30 September 2019
For
per
sona
l use
onl
y
2
BDO Audit (WA) Pty Ltd ABN 79 112 284 787 is a member of a national association of independent entities which are all members of BDO Australia Ltd ABN 77 050 110 275,an Australian company limited by guarantee. BDO Audit (WA) Pty Ltd and BDO Australia Ltd are members of BDO International Ltd, a UK company limited by guarantee, andform part of the international BDO network of independent member firms. Liability limited by a scheme approved under Professional Standards Legislation.
38 Station StreetSubiaco, WA 6008PO Box 700 West Perth WA 6872Australia
INDEPENDENT AUDITOR'S REPORT
To the members of Strandline Resources Limited
Report on the Audit of the Financial Report
Opinion
We have audited the financial report of Strandline Resources Limited (the Company) and itssubsidiaries (the Group), which comprises the consolidated statement of financial position as at 30June 2019, the consolidated statement of profit or loss and other comprehensive income, theconsolidated statement of changes in equity and the consolidated statement of cash flows for the yearthen ended, and notes to the financial report, including a summary of significant accounting policiesand the directors’ declaration.
In our opinion the accompanying financial report of the Group, is in accordance with the CorporationsAct 2001, including:
(i) Giving a true and fair view of the Group’s financial position as at 30 June 2019 and of itsfinancial performance for the year ended on that date; and
(ii) Complying with Australian Accounting Standards and the Corporations Regulations 2001.
Basis for opinion
We conducted our audit in accordance with Australian Auditing Standards. Our responsibilities underthose standards are further described in the Auditor’s responsibilities for the audit of the FinancialReport section of our report. We are independent of the Group in accordance with the CorporationsAct 2001 and the ethical requirements of the Accounting Professional and Ethical Standards Board’sAPES 110 Code of Ethics for Professional Accountants (the Code) that are relevant to our audit of thefinancial report in Australia. We have also fulfilled our other ethical responsibilities in accordancewith the Code.
We confirm that the independence declaration required by the Corporations Act 2001, which has beengiven to the directors of the Company, would be in the same terms if given to the directors as at thetime of this auditor’s report.
We believe that the audit evidence we have obtained is sufficient and appropriate to provide a basisfor our opinion.
Key audit matters
Key audit matters are those matters that, in our professional judgement, were of most significance inour audit of the financial report of the current period. These matters were addressed in the context ofour audit of the financial report as a whole, and in forming our opinion thereon, and we do not providea separate opinion on these matters.F
or p
erso
nal u
se o
nly
2
Valuation of Exploration and Evaluation Assets
Key audit matter How the matter was addressed in our audit
At 30 June 2019, we note that thecarrying value of the capitalisedexploration and evaluation asset issignificant to the financial statements, asdisclosed in Note 13. The company isrequired to assess for indicators ofimpairment at each reporting period.
As the carrying value of exploration andevaluation expenditure represents asignificant asset of the Group, weconsider it necessary to assess whetherany facts or circumstances exist tosuggest that the carrying amount of thisasset may exceed its recoverableamount.
As a result, the capitalised explorationand evaluation expenditure wererequired to be assessed for impairmentindicators in accordance with AASB 6Exploration for and Evaluation of MineralResources. This required critical analysisof the key estimates and judgementsused in the assessment of impairmentindicators.
Our procedures included, but were not limited to:
· Obtaining a schedule of the areas of interestheld by the Group and assessing whether therights to tenure of those areas of interestremained current at balance date;
· Considering the status of the ongoingexploration programmes in the respectiveareas of interest by holding discussions withmanagement, and reviewing the Group’sexploration budgets, ASX announcements anddirector’s minutes;
· Considering whether any facts orcircumstances existed to suggest impairmenttesting was required; and
· Assessing the adequacy of the relateddisclosures in Note 3.2(g) and Note 13 to theFinancial Statements.
Accounting for share-based payments
Key audit matter How the matter was addressed in our audit
During the financial year ended 30 June2019, the Group issued performancerights and shares to employees and keymanagement personnel, which havebeen accounted for as share-basedpayments, as disclosed in Note 23 of thefinancial report.
Refer to Notes 3.2(e) of the financialreport for a description of theaccounting policy and significantestimates and judgements applied tothese arrangements.
Our procedures included, but were not limited to thefollowing:
· Reviewing the relevant agreements to obtain anunderstanding of the contractual nature andterms and conditions of the share-based paymentarrangements;
· Holding discussions with management tounderstand the share-based paymenttransactions in place;
For
per
sona
l use
onl
y
Key audit matter How the matter was addressed in our audit
Share-based payments are a complexaccounting area and due to the complexand judgemental estimates used indetermining the fair value of the share-based payments, we consider theGroup’s accounting for share-basedpayments to be a key audit matter.
· Reviewing management’s determination of thefair value of the share-based payments granted,considering the appropriateness of the valuationmodels used and assessing the valuation inputs;
· Involving our valuation specialists to assess thereasonableness of management’s valuationinputs in respect to the market based conditionsattached to certain share-based payments;
· Assessing the allocation of the share-basedpayment expense over the relevant vestingperiod; and
· Assessing the adequacy of the related disclosuresin Notes 3.2(e) and 23 of the financial report.
Other information
The directors are responsible for the other information. The other information comprises theinformation in the Group’s annual report for the year ended 30 June 2019, but does not include thefinancial report and the auditor’s report thereon.
Our opinion on the financial report does not cover the other information and we do not express anyform of assurance conclusion thereon.
In connection with our audit of the financial report, our responsibility is to read the other informationand, in doing so, consider whether the other information is materially inconsistent with the financialreport or our knowledge obtained in the audit or otherwise appears to be materially misstated.
If, based on the work we have performed, we conclude that there is a material misstatement of thisother information, we are required to report that fact. We have nothing to report in this regard.
Responsibilities of the directors for the Financial Report
The directors of the Company are responsible for the preparation of the financial report that gives atrue and fair view in accordance with Australian Accounting Standards and the Corporations Act 2001and for such internal control as the directors determine is necessary to enable the preparation of thefinancial report that gives a true and fair view and is free from material misstatement, whether due tofraud or error.
In preparing the financial report, the directors are responsible for assessing the ability of the group tocontinue as a going concern, disclosing, as applicable, matters related to going concern and using thegoing concern basis of accounting unless the directors either intend to liquidate the Group or to ceaseoperations, or has no realistic alternative but to do so.F
or p
erso
nal u
se o
nly
2
Auditor’s responsibilities for the audit of the Financial Report
Our objectives are to obtain reasonable assurance about whether the financial report as a whole is freefrom material misstatement, whether due to fraud or error, and to issue an auditor’s report thatincludes our opinion. Reasonable assurance is a high level of assurance, but is not a guarantee that anaudit conducted in accordance with the Australian Auditing Standards will always detect a materialmisstatement when it exists. Misstatements can arise from fraud or error and are considered materialif, individually or in the aggregate, they could reasonably be expected to influence the economicdecisions of users taken on the basis of this financial report.
A further description of our responsibilities for the audit of the financial report is located at theAuditing and Assurance Standards Board website at:
This description forms part of our auditor’s report.
Report on the Remuneration Report
Opinion on the Remuneration Report
We have audited the Remuneration Report included in pages 18 to 24 of the directors’ report for theyear ended 30 June 2019.
In our opinion, the Remuneration Report of Strandline Resources Limited, for the year ended 30 June2019, complies with section 300A of the Corporations Act 2001.
Responsibilities
The directors of the Company are responsible for the preparation and presentation of theRemuneration Report in accordance with section 300A of the Corporations Act 2001. Our responsibilityis to express an opinion on the Remuneration Report, based on our audit conducted in accordance withAustralian Auditing Standards.
Issued Shares (%) NDOVU CAPITAL VII BV 126,532,616 33.19
C&H INTERNATIONAL INVESTMENT LIMITED 31,250,000 8.40
5 Top 20 Largest Option Holders as of 27/09/2019
Nil
6 Performance Right Holders as of 27/09/2019
No. Name Number held % Performance Right Holding
1 MR LUKE GRAHAM 8,166,667 53.30 2 MR FLAVIO GAROFALO 2,214,667 14.45 3 MR MIKE FERRARO 1,820,438 11.88 4 MR PETER WATSON 1,584,100 10.34 4 MR BRENDAN CUMMINS 1,354,150 8.84 6 MS ANNA RABIN 180,675 1.19
TOTAL PERFORMANCE RIGHT HOLDERS 15,320,697 100%
7 Voting Rights
At a general meeting of the Company shareholders are entitled:
• On a show of hands, each person who is a member or sole proxy has one vote.
• On a poll, each shareholder is entitled to one vote for each fully paid share.
Holders of options and performance rights have no voting rights. Voting rights will be attached to the unissued ordinary shares when the options or performance rights have been exercised.
8 Restricted Securities
There were no restricted securities.
9 On-Market Buy Back
There is no current on-market buy back.
10 Securities Approved Not Issued
None.
11 Issue of Shares under Short-Term Incentive Plan
On 15 August 2019, 729,847 Fully Paid Ordinary Shares issued to the Mr Luke Graham, Managing Director/CEO for his participation on the Company’s Short Term Incentive Plan pursuant to shareholder approval given on 24 November 2016. Shares were issued lieu of an equivalent cash payment. A total of 1,227,713 Fully Paid Ordinary Shares issued to employees of the Company for their participation on the Company’s Short Term Incentive Plan pursuant to shareholder approval given on 24 November 2016. Shares were issued lieu of an equivalent cash payment. A total of 2,291,667 Fully Paid Ordinary Shares issued to the Mr Luke Graham, Managing Director/CEO for Performance Rights vested upon satisfaction of the performance and time based vesting criteria contained in the terms and conditions pursuant to shareholder approval given on 24 November 2016.
Notes: (1) Mineral Resources reported at a cut-off grade of 1.0% THM (2) Valuable Mineral assemblage is reported as a percentage of in situ THM content (3) Appropriate rounding applied
Refer ASX announcement 2 May 2017 for full details of the Fungoni Mineral Resource Estimate. Mineral Resources were converted to Ore Reserves in accordance with the JORC Code 2012 Edition based on the pit designs, recognising the level of confidence in the Mineral Resource Estimation, and reflecting modifying factors. Refer ASX announcement 6 October 2017 for full details of the Fungoni Ore Reserve statement.
Table B Ore Reserve Statement for Fungoni Project at October 2017
ORE RESERVES SUMMARY FOR FUNGONI PROJECT
Deposit Reserve Category Ore Slimes Heavy Mineral
(Mt) (Mt) (%) In Situ HM (kt) THM (%)
FUNGONI Proved 6.9 1.2 18 341 4.9
FUNGONI Probable 5.4 1.0 19 138 2.6
Total* 12.3 2.3 19 480 3.9
*Note totals may deviate from the arithmetic sum due to rounding.
Table C Tanga South (Tajiri) Project Mineral Resource Estimate (July 2019)
Notes: 1 Mineral Resources reported at various THM cut-offs 2 Mineral Assemblage is reported as a percentage of insitu THM content 3 Appropriate rounding applied
Refer to the ASX announcement dated 09 July 2019 for full details of the Mineral Resource estimate for the Tajiri Project.
Table D Coburn Project JORC 2012 Global Mineral Resources – Amy South and Amy North
Ore (1) Valuable HM Grade (In-Situ) (2)
Resource Category
Material (Mt)
In situ THM (Mt)
THM (%)
Ilmenite (%)
Rutile (%)
Zircon (%)
Leucoxene (%)
Slimes
(%) Oversize (%)
Measured 119 1.5 1.3 45 5 24 6 3 6
Indicated 607 7.7 1.3 48 7 22 5 3 3
Inferred 880 10.4 1.2 49 7 21 4 3 1
Total 1606 19.6 1.2 48 7 22 5 3 2
Table E Coburn Project JORC 2012 Ore Reserve Statement April 2019
ORE RESERVES SUMMARY FOR COBURN PROJECT
Deposit
Reserve Category Ore Heavy Mineral
(Mt) In Situ HM (Mt) THM (%)
Coburn - Amy South Proved 106 1.16 1.10
Coburn - Amy South Probable 417 4.66 1.12
Total1 523 5.83 1.11
Refer to the ASX announcement dated 16 April 2019 for full details of the Ore Reserve and Mineral Resource estimates for the Coburn Project.
MINERAL SANDS COMPETENT PERSON’S STATEMENTS
The information in this report that relates to Exploration Results is based on, and fairly represents, information and supporting documentation prepared by Mr Brendan Cummins, Chief Geologist and employee of Strandline. Mr Cummins is a member of the Australian Institute of Geoscientists and he has sufficient experience which is relevant to the style of mineralisation and type of deposits under consideration and to the activity which has been undertaken to qualify as a Competent Person as defined in the 2012 Edition of the “Australasian Code for Reporting of Exploration Results, Mineral Resources and Ore Reserves”. Mr Cummins consents to the inclusion in this release of the matters based on the information in the form and context in which they appear. Mr Cummins is a shareholder of Strandline Resources.
Tanga South Mineral Resources The information in this report that relates to Mineral Resources for Tanga South is based on, and fairly represents, information and supporting documentation prepared by Mr Greg Jones, (Consultant to Strandline and Geological Services Manager for IHC Robbins) and Mr Brendan Cummins (Chief Geologist and employee of Strandline). Mr Jones is a member of the Australasian Institute of Mining and Metallurgy and Mr Cummins is a member of the Australian Institute of Geoscientists and both have sufficient experience of relevance to the styles of mineralisation and types of deposits under consideration, and to the activities undertaken to qualify as Competent Persons as defined in the 2012 Edition of the Joint Ore Reserves Committee (JORC) Australasian Code for Reporting of Exploration Results, Mineral Resources and Ore Reserves. Specifically, Mr Cummins is the Competent Person for the drill database, geological model interpretation and completed the site inspection. Mr Jones is the Competent Person for the resource estimation. Mr Jones and Mr Cummins consent to the inclusion in this report of the matters based on their information in the form and context in which they appear.
Notes: 1. Total may deviate from the arithmetic sum due to rounding
Notes: 1. Mineral Resources reported at a cut-off grade of 0.8% THM
2. Valuable Mineral assemblage is reported as a percentage of in situ THM content 3. Appropriate rounding applied
Fungoni Mineral Resources The information in this report that relates to Mineral Resources for Fungoni is based on, and fairly represents, information and supporting documentation prepared by Mr Greg Jones, (Consultant to Strandline and Geological Services Manager for IHC Robbins) and Mr Brendan Cummins (Chief Geologist and employee of Strandline). Mr Jones is a member of the Australasian Institute of Mining and Metallurgy and Mr Cummins is a member of the Australian Institute of Geoscientists and both have sufficient experience of relevance to the styles of mineralisation and types of deposits under consideration, and to the activities undertaken to qualify as Competent Persons as defined in the 2012 Edition of the Joint Ore Reserves Committee (JORC) Australasian Code for Reporting of Exploration Results. Mineral Resources and Ore Reserves. Specifically, Mr Cummins is the Competent Person for the drill database, geological model interpretation and completed the site inspection. Mr Jones is the Competent Person for the mineral resource estimation. Mr Jones and Mr Cummins consent to the inclusion in this report of the matters based on their information in the form and context in which they appear.
Fungoni Ore Reserves The information in this report that relates to the Fungoni Ore Reserves are based on information compiled under the direction of Mr Adrian Jones. Mr Jones is a Member of the Australasian Institute of Mining and Metallurgy and is employed by AMC. Mr Jones has sufficient experience relevant to the style of mineralization and type of deposit under consideration to qualify as a Competent Person as defined in the JORC Code. Non-mining modifying factors for the Ore Reserve estimate are drawn from contributions provided by various sources. Significant contributors to this report are identified in Table 5 (ASX 6/10/2017) together with their area of contribution.
Coburn Mineral Resources The information in this report that relates to Mineral Resources is based on, and fairly represents, information and supporting documentation prepared by Mr Greg Jones, (Consultant to Strandline and Geological Services Manager for IHC Robbins) and Mr Brendan Cummins (Chief Geologist and employee of Strandline). Mr Jones is a member of the Australasian Institute of Mining and Metallurgy and Mr Cummins is a member of the Australian Institute of Geoscientists and both have sufficient experience of relevance to the styles of mineralisation and types of deposits under consideration, and to the activities undertaken to qualify as Competent Persons as defined in the 2012 Edition of the Joint Ore Reserves Committee (JORC) Australasian Code for Reporting of Exploration Results, Mineral Resources and Ore Reserves. Specifically, Mr Cummins is the Competent Person for the provision of the drill database, and completed the site inspection. Mr Jones is the Competent Person for the data integration and resource estimation. Mr Jones and Mr Cummins consent to the inclusion in this report of the matters based on their information in the form and context in which they appear.
Coburn Ore Reserves The information in this report that relates to the Coburn Ore Reserves is based on information compiled under the direction of Mr Adrian Jones. Mr Jones is a Member of the Australasian Institute of Mining and Metallurgy and is employed by AMC. Mr Jones has sufficient experience relevant to the style of mineralization and type of deposit under consideration to qualify as a Competent Person as defined in the JORC Code. Non-mining modifying factors for the Ore Reserve estimate are drawn from contributions provided by various sources. Significant contributors to this report are identified in Table 5 (ASX announcement 16/04/2019) together with their area of contribution.
Scoping Study Production Targets (No ore reserves declared) The information in this report that relates to the Mine Extension Case Scoping Study is based on information compiled under the direction of Mr Adrian Jones. Mr Jones is a Member of the Australasian Institute of Mining and Metallurgy and is employed by AMC. Mr Jones has sufficient experience relevant to the style of mineralization and type of deposit under consideration to qualify as a Competent Person as defined in the JORC Code. Non-mining modifying factors for the production targets are drawn from contributions provided by various sources as stated in the Coburn Ore Reserve announcement dated 16 April 2019.
This report contains certain forward looking statements. Forward looking statements are only predictions and are subject to risks, uncertainties and assumptions which are outside of the control of Strandline. These risks, uncertainties and assumptions include commodity prices, currency fluctuations, economic and financial market conditions, environmental risks and legislative, fiscal or regulatory developments, political risks, project delay, approvals and cost estimates. Actual values, results or events may be materially different to those contained in this announcement. Given these uncertainties, readers are cautioned not to place reliance on forward looking statements. Any forward looking statements in this announcement reflect the views of Strandline only at the date of this announcement. Subject to any continuing obligations under applicable laws and ASX Listing Rules, Strandline does not undertake any obligation to update or revise any information or any of the forward looking statements in this announcement to reflect changes in events, conditions or circumstances on which any forward looking statements is based.
For
per
sona
l use
onl
y
STRANDLINE RESOURCES LTD 35 Richardson Street | West Perth | WA | 6005