REPORT TO THE EUROPEAN COMMISSION ON THE IMPLEMENTATION OF REGULATION 812/2004 BY THE UNITED KINGDOM FOR THE CALENDAR YEAR 2010 1 Annual report on the implementation of Council Regulation (EC) No 812/2004 – 2010 Member State: United Kingdom Reference Period: 2010 Date: May 26 th 2011 Authors: Simon Northridge 1 , Al Kingston 1 and Len Thomas 2 , Sea Mammal Research Unit / Scottish Oceans Institute 1 and the Centre for Research into Ecological and Environmental Monitoring 2 , University of St Andrews
Transcript
REPORT TO THE EUROPEAN COMMISSION ON THE IMPLEMENTATION OF REGULATION812/2004 BY THE UNITED KINGDOM FOR THE CALENDAR YEAR 2010
1
Annual report on the implementation of Council Regulation (EC) No 812/2004 – 2010
Member State: United Kingdom
Reference Period: 2010
Date: May 26th
2011
Authors: Simon Northridge1, Al Kingston
1and Len Thomas
2, Sea Mammal Research Unit /
Scottish Oceans Institute1
and the Centre for Research into Ecological and EnvironmentalMonitoring
2, University of St Andrews
2
Summary
This report summarises ongoing work on the implementation of Council Regulation812/2004 during the calendar year 2010 by the UK. The work is focused on two areas,firstly on the development of measures to minimise cetacean bycatch and secondly onmonitoring fisheries to estimate the total mortality of cetaceans in relevant UK fishingoperations. Estimates of cetacean bycatch for 2010 were of 536 porpoises (UCL 1054) and287 (UCL 713) common dolphins, though caveats apply to these estimates.
Work on mitigation continues to focus on the use of one specific type of acoustic deterrentdevice (DDD). These devices (DDD-03F) are being used in the UK component of themidwater pair trawl fishery for bass in the Western English Channel with continuedsuccess. A variant of the same device (DDD-03H) is being adopted by the over 12m gill andtangle net fleet in the Western Channel and Celtic Sea. Observations on this fleet segmentcontinue to demonstrate the effectiveness of these devices in minimising porpoise bycatch,but the effect on common dolphins is not yet clear. Most of this fleet segment has now triedusing DDDs and it is anticipated that all relevant vessels will be equipped by the end of2011.
Monitoring was focused on pelagic trawls in ICES divisions VIa and IVb, on the bassmidwater pair trawl fishery in Division VIIe, on a wide range of static gear types in subareaVII and on static gear in the North Sea (subarea IV). Bycatches of porpoises and commondolphins are reported from several gear types in subarea VII. Bycatch estimates arepresented in the main body of this report for each of the strata as specified in the reportingformat, that is by metier and by ICES sub-division. Under these constraints it is estimatedthat 86 common dolphins and 338 harbour porpoises were killed in UK fisheries in 2010.These estimates are biased low because this level of stratification excludes fisheries andareas where bycatch is known to occur but where no monitoring was done in 2010.
Difficulties encountered are described and discussed together with the UK rational forcontinued monitoring more widely than is prescribed under Regulation 812/2004.
3
ACOUSTIC DETERRENT DEVICES
1. General Information
Since 2009 the UK has been trialling alternative pinger types as part of a scientificinvestigation under paragraph 3 Article 2 of Regulation 812/2004. Previous studies in theUK, France and Ireland, have shown that the existing commercially available acousticdeterrents were unable to meet the rigours of use, at least in the tangle net fisheries ofCornwall and the wider Celtic Sea (Anonymous 2003, Anonymous 2005, Cosgrove et al.2005, Le Berre 2005).
The UK fishing industry had proposed using a louder device so that fewer devices would beneeded and so that each could be individually deployed during net shooting rather thanhaving to remain fixed to the gear. The DDD manufactured by STM in Italy appears tohave suitable acoustic properties to meet this requirement. Theoretical considerationssuggest that each such device would ensonify a string of nets to the same acoustic level asup to ten quieter devices, thereby limiting the overall numbers required. Prior todeployment under commercial fishing conditions, experimental trials of the DDDs wereconducted to determine any potential widescale negative impacts, and it was demonstratedthat dolphin and porpoise avoidance was limited to around 2km from the device. Furthertrials addressing this issue in more detail are ongoing.
During 2010 funds were secured from the Fisheries Challenge Fund for a collaborativeoutreach programme between the SMRU and the Cornish Fish Producers’ Organisation toincrease the uptake of DDDs in the over 12m netting sector working in the Celtic Sea andChannel . This work is ongoing and the majority of the fleet have now tested and usedDDDs and most operational issues have been adequately explored and resolved wherenecessary. This project is due to be completed in the Spring of 2011 by which time it isanticipated all relevant (over 12m) vessels will be equipped with DDDs.
The situation in the North Sea is less clear as there are fewer vessels operating there that arerequired to use pingers under Regulation 812/2004, and the more specific and detailedrequirements in Annex 1 of the Regulation for this area (Division IV) involving mesh sizeand season make it more difficult to determine from logbook data which vessels arerequired to use pingers.
All UK vessels taking part in the bass midwater pair trawl fishery (2 pair teams during2010) in the English Channel used a version of the DDD designed for trawl use, anddolphin bycatch remains greatly reduced compared with previous years.
Not additive as most vessels fish inseveral sub-divisions and often fish in
more than 1 per trip
2599 Jan-Dec Unk Unk
TangTram/Demersal>220mm mesh
IV 2 0%(0) 8 352 Jan-Dec Unk Unk
Gill/Demersal<400m IV 0 - 0 0 Aug-Oct - -
PTM/Demersal-bass VIIE 2 (pairteams)
100%(2) 10 34 Nov-Apr Unk Unk
1 Metiers are described here in slightly more detail than is required by the Commission. This is because it is unwise toinclude e.g. tangle nets with other set gear, while hake nets and ‘light gillnets’ have different bycatch rates comparedwith general gillnets
5
Table 2.1 includes data on vessels that are required to use pingers under Regulation 812/2004 Article2, Annex I, as well as some others using such devices on a voluntary basis.
2.2 Mitigation measures
Metier2 Fishing
areaPinger characteristics
(see http://www.stm-products.com)
Other mitigationmeasures
GNS VIIdefghj DDD-03L none
GND VIIdefghj DDD-03L none
PTM VIIe DDD-03H none
2.3 Additional information
The DDD-03Ls being tested appear to work well in terms of reducing porpoise and dolphin bycatch,though, to date not enough data on dolphin bycatch in static gear have been collected to be sure of thelevel of bycatch reduction. Three animals (1 porpoise and 2 dolphins) were reported in static gear thatwas equipped with pingers during 2010, but at present we are trying to establish the optimal distancebetween adjacent pingers as the reported animals were all more than 1.5km from the nearest device.Fifteen dolphins caught by one pelagic pair team targeting bass while using DDD-02Fs were likelycaused by the deterioration of the batteries of these devices which were four years old. No dolphinswere caught by a second team when new DDD-03Hs were in use.
There are several practical issues associated with the full implementation of these devices, which wewill be working with the fishing industry to resolve:
Fishermen were not very happy with the multi-charger units supplied by the manufacturer andan alternative charging device for several pingers is being developed. The devices arerechargeable, obviating the need for battery changes, which is useful, but for longer trips somemeans of charging all the devices on board will be required.
At present devices are being attached to each end of a string of nets that may be 4 or 5 km inlength. This approach is being taken because attaching devices part way along a fleet requires acrew member to attach and deploy the devices during shooting which is potentially hazardous.In fully implementing and enforcing the use of pingers we will look to find a practical solution.
Concerns have been raised that the use of these devices may attract seals and lead to an increasein seal-damaged fish. Seal-damaged fish are being systematically recorded in nets with andwithout DDDs in the same areas in order to allow this assessment to be made. So far the datado not indicate any increase in seal depredation when DDDs are being used.
During February and March 2010 one of the pair teams fishing for bass which was usingDDD02-F devices, began to experience an elevated level of bycatch. When tested these
devices were shown not to be holding their charge and since they had been used for fourseasons they were discarded at the end of March 2010 for new models. This suggests that sometype of ongoing quality assessment needs to be integrated with any programme of pinger use toensure that devices are replaced before they are worn out and become ineffective.
3. Monitoring and assessment
3.1 Monitoring and assessment of the effects of pinger use
Under the Fisheries Challenge project, dolphin and porpoise bycatches are being reported usingGPS positions, as are the locations of DDDs being used on the same nets. The intention is todetermine how effectiveness of pingers is related to distance from the nearest device. Trials arealso underway to provide more detailed estimates of the exclusion distance of two types ofpinger (DDD and Aquamark), which may help determine the optimal pinger spacing, but willalso be useful in determining potential habitat exclusion depending on the number of boats thatdeploy these devices.
3.2. Report on measures to control specifications when pingers are in use by fishermen
As the industry is still in the process of trialling new devices, no new enforcement measureshave been implemented. However, relevant gillnet vessels are regularly inspected at sea.Observers are also monitoring pinger use and quantifying catch, seal damage and bycatch inpingered nets, but are not involved in any enforcement measures. The UK questions whetherthere is any need to deploy DDDs or other pingers on nets that are set deeper than 200m asprevious research has shown that cetacean bycatch rates are close to zero in such deep water(Northridge and Hammond 2000).
3.3 Overall assessment
Pingers or acoustic deterrent devices are effective in reducing cetacean bycatch, but have a number oftechnical challenges that limit their practical use. Implementing pingers as an effective bycatchreduction measure therefore requires a collaborative and constructive approach with industry to resolvethese technical issues, and this is the way in which the UK has undertaken this work.
During 2010 almost all of the UK fleet fishing in the SW has used DDDs, and we expect all of the fleetmandated to use pingers under regulation 812/2004 to be fully equipped with pingers by the end of2011.
OBSERVER SCHEMES
4. General information on implementation of Articles 4 and 5
Monitoring of protected species in UK fisheries is conducted by the Sea Mammal Research Unit(SMRU) at the University of St Andrews, in collaboration with the Centre for Environment, Fisheriesand Aquaculture Science at Lowestoft (CEFAS), the Agri-Food and Biosciences Institute of NorthernIreland (AFBINI) and Marine Science Scotland (MSS).
4.1 Information on legislative or administrative measures following provisions of Art.4 or 5.
Monitoring under Regulation 812/2004 is done largely in collaboration with the fishing industry.Bycatch mitigation work is a key complementary programme of work that is intended to ensure any
7
problem that is identified with protected species bycatch can be addressed in an equitable andexpedient manner to meet the UK’s obligations under Regulation 812/2004 and the Habitats DirectiveArticle 12. The observer scheme relies upon good collaborative links with industry. Neverthelessfisheries regulations were enacted in England and Scotland to ensure that there is also a legalobligation for skippers and owners to take observers when asked to do so.
4.2 Provide information on difficulties implementing articles 4 and 5 of Council Regulation (EC)No 812/2004.
The principal difficulties in implementing articles 4 and 5 remain logistic ones. Firstly, targetingsampling at a predefined level, for example at 5% of fishing effort, is difficult to address because of thedynamic nature of fisheries, which means that it is not possible to know in advance for how many daysat sea a specific fleet will be fishing. It is only possible to estimate based on the most recent years’ dataand there are often extreme fluctuations in effort from year to year.
With small boat fleets an additional problem is encountered when a gear type of interest (eg gillnets) isonly one of several that are used on a single vessel and when these vessels can switch gears from day today. Targeting a significant number of trips using relevant gears can be difficult as there are notnecessarily any easily identifiable boats using the specified gear at the required time.
Finally, for larger UK flagged vessels that rarely visit UK ports, it is hard to place UK observers onboard. In the UK this issue has been addressed by employing observers based in Spain to cover UKflagged boats that operate mainly from Spanish ports.
Regulation 812/2004 requires that the level of monitoring of certain fleets that should be designed toobtain a bycatch estimate with a CV of less than 0.3, for the most commonly caught species. Thisprecision target is not feasible where bycatch rates are very low (for example in most pelagic trawlfisheries see Northridge and Thomas 2003 ), and this means that monitoring was previously beingcontinued in these fisheries, aiming at the ‘pilot’ levels of monitoring at 10% and 5% of effort.
As mentioned in the UK’s report on the 2009 fisheries (Northridge and Kingston 2010), the UK hasdecreased observation effort in the pelagic sector, where cetacean bycatch rates are now known to bevery low, but is focusing monitoring on other sectors where bycatch is least known or most likely torepresent a conservation concern. The UK suggests that a more productive means of monitoringbycatch is to limit the amount of sampling in any one fishery to a level that is sufficient to determinewhether or not bycatch levels exceed a pre-specified threshold or reference limit.
4.3 Indicate whether the observer programme is dedicated for the purpose of this Regulationonly, or whether the on-board observers are used for other purposes also.
A dedicated monitoring scheme is operated by the SMRU, while collaborative links with the threefishery research laboratories in the UK also allow selected observations from the Discard SamplingProgrammes to be included in our assessment of cetacean bycatch. Data from discard surveysconducted by CEFAS, MSS and AFBINI are used with discretion because discard sampling is notalways compatible with protected species monitoring. The UK observer monitoring programme is alsodesigned to fulfil the UK’s obligations under Article 12 of the Habitats Directive.
5. Monitoring
Fishing effort data for the UK fleet and corresponding observation levels are listed for 2010 by fleetsegment as proposed by the Commission in 2010. Fleet segments or metiers are described to at least
8
Level 5 of Appendix IV of Council Decision 2008/949. This level of disaggregation of effort data,however, would still result in grouping fishery types with very different bycatch rates into the samecategories, so we have also – where necessary – separated out in more detail those specific fleetsegments that need to be considered separately from others in the same segment at Level 5 ofAppendix IV of Council Decision 2008/949. The number of hauls and towing time are not reliablyavailable for the UK fleet, so the most detailed effort descriptor is days at sea. Data are given fortowed gears (Table 5.1 – 215 days sampled it total) and for static gears (Table 5.2 – 298 days sampled)separately.
REPORT TO THE EUROPEAN COMMISSION ON THE IMPLEMENTATION OF REGULATION 812/2004 BY THE UNITED KINGDOM FORTHE CALENDAR YEAR 2010
9
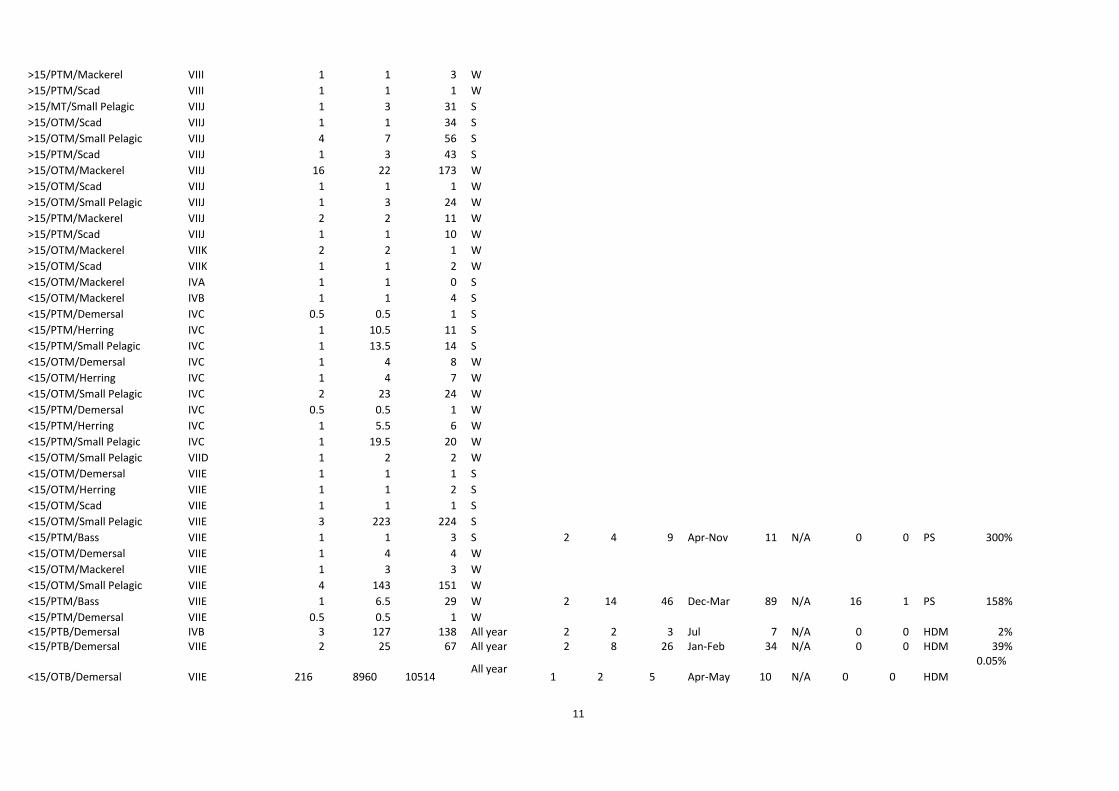
5.1 Description of fishing effort and observer effort in towed gear
METIER GROUND
Total fishing Effort Amount of observer effort achieved
>15/OTM/Herring VIA 13 22 49 S 1 2 7 Apr-Nov N/A N/A 0 0 PMS 14%
>15/OTM/Mackerel VIA 3 3 33 S
3 PMS = Pilot Monitoring Scheme – as indicated in Annex III of the Regulation at 5% or 10% of effort; HDM = Habitats Directive Monitoring; PS = Pilot Study (chiefly under 15mvessels in those sectors defined in Annex III of the Regulation); SS = Scientific Studies – studies on vessels using pingers on the effects thereof.
10
>15/OTM/Scad VIA 1 2 6 S
>15/PTM/Blue Whiting VIA 0.5 0.5 2 S
>15/PTM/Herring VIA 2.5 9 41 S
>15/PTM/Small Pelagic VIA 1 1 2 S
>15/OTM/Blue Whiting VIA 3 3 11 W
>15/OTM/Demersal VIA 7 17 35 W
>15/OTM/Herring VIA 1 1 4 W
>15/OTM/Mackerel VIA 27 53 253 W
>15/OTM/Small Pelagic VIA 1 3 4 W
>15/PTM/Herring VIA 0.5 0.5 2 W
>15/PTM/Mackerel VIA 2 5 20 W
>15/PTM/Small Pelagic VIA 2 11.5 14 W
>15/OTM/Blue Whiting VIB 2 2 9 W
>15/OTM/Demersal VIIA 10 141 563 S 2 3 16 Jan-Nov 23 N/A 0 0 HDM 3%
>15/PTM/Herring VIIA 2 16 41 S
>15/OTM/Demersal VIIA 9 64 210 W
>15/MT/Small Pelagic VIIB 1 1 0 S
>15/OTM/Herring VIIB 1 1 3 S
>15/OTM/Scad VIIB 2 2 13 S
>15/OTM/Mackerel VIIB 16 19 121 W
>15/OTM/Scad VIIB 1 2 9 W
>15/OTM/Herring VIIC 1 1 3 S
>15/OTM/Scad VIIC 2 3 15 S
>15/OTM/Mackerel VIIC 1 1 1 W
>15/OTM/Scad VIIC 1 1 3 W
>15/OTM/Herring VIID 1 1 15 S
>15/OTM/Scad VIID 1 1 10 S
>15/PTM/Scad VIID 1 2 9 S
>15/PTM/Scad VIID 1 3 28 W
>15/PTM/Bass VIIE 0.5 1 2 S 2 3 9 Apr-Nov 13 N/A 3 0 PMS 450%
>15/PTM/Herring VIIE 1 1 5 S
>15/PTM/Scad VIIE 1 5 50 S
>15/PTM/Bass VIIE 1 7 32 W 2 7 25 Dec-Mar 44 N/A 7 0 PMS 78%
>15/PTM/Scad VIIE 1 3 11 W
>15/PTM/Small Pelagic VIIE 1 1 0 W
>15/OTM/Small Pelagic VIIG 1 1 0 S
>15/PTM/Herring VIIG 1 1 0 S
>15/MT/Small Pelagic VIIH 1 1 9 S
>15/OTM/Small Pelagic VIIH 2 2 14 S
>15/OTM/Mackerel VIII 1 1 0 W
11
>15/PTM/Mackerel VIII 1 1 3 W
>15/PTM/Scad VIII 1 1 1 W
>15/MT/Small Pelagic VIIJ 1 3 31 S
>15/OTM/Scad VIIJ 1 1 34 S
>15/OTM/Small Pelagic VIIJ 4 7 56 S
>15/PTM/Scad VIIJ 1 3 43 S
>15/OTM/Mackerel VIIJ 16 22 173 W
>15/OTM/Scad VIIJ 1 1 1 W
>15/OTM/Small Pelagic VIIJ 1 3 24 W
>15/PTM/Mackerel VIIJ 2 2 11 W
>15/PTM/Scad VIIJ 1 1 10 W
>15/OTM/Mackerel VIIK 2 2 1 W
>15/OTM/Scad VIIK 1 1 2 W
<15/OTM/Mackerel IVA 1 1 0 S
<15/OTM/Mackerel IVB 1 1 4 S
<15/PTM/Demersal IVC 0.5 0.5 1 S
<15/PTM/Herring IVC 1 10.5 11 S
<15/PTM/Small Pelagic IVC 1 13.5 14 S
<15/OTM/Demersal IVC 1 4 8 W
<15/OTM/Herring IVC 1 4 7 W
<15/OTM/Small Pelagic IVC 2 23 24 W
<15/PTM/Demersal IVC 0.5 0.5 1 W
<15/PTM/Herring IVC 1 5.5 6 W
<15/PTM/Small Pelagic IVC 1 19.5 20 W
<15/OTM/Small Pelagic VIID 1 2 2 W
<15/OTM/Demersal VIIE 1 1 1 S
<15/OTM/Herring VIIE 1 1 2 S
<15/OTM/Scad VIIE 1 1 1 S
<15/OTM/Small Pelagic VIIE 3 223 224 S
<15/PTM/Bass VIIE 1 1 3 S 2 4 9 Apr-Nov 11 N/A 0 0 PS 300%
<15/OTM/Demersal VIIE 1 4 4 W
<15/OTM/Mackerel VIIE 1 3 3 W
<15/OTM/Small Pelagic VIIE 4 143 151 W
<15/PTM/Bass VIIE 1 6.5 29 W 2 14 46 Dec-Mar 89 N/A 16 1 PS 158%
<15/PTM/Demersal VIIE 0.5 0.5 1 W<15/PTB/Demersal IVB 3 127 138 All year 2 2 3 Jul 7 N/A 0 0 HDM 2%<15/PTB/Demersal VIIE 2 25 67 All year 2 8 26 Jan-Feb 34 N/A 0 0 HDM 39%
<15/OTB/Demersal VIIE 216 8960 10514All year
1 2 5 Apr-May 10 N/A 0 0 HDM
0.05%
12
5.2 Description of fishing effort and observer effort in static gear4
METIER GROUND
Total fishing Effort Amount of observer effort achieved
Ves
sels
Trip
s
Da
ysa
tSe
a
No
.of
Ves
sels
No
.of
trip
s
Da
ysa
tse
a
Sea
son
Tota
l
Len
gth
of
Net
s(k
m)
Tota
lSo
ak
Tim
e(K
mH
)
Typ
eo
f
mo
nit
ori
ng
Co
vera
ge
>15/Gill/Demersal IVA 1 1 29
>15/Gill/Demersal IVB 6 28 176
>15/Gill/Demersal IVC 6 22 69
>15/Gill/Demersal VIIE 19 45 170 2 2 7 Nov 33 27354 PS 4%
>15/Gill light/Demersal VIIE 1 1 12 1 1 1 Nov 11 550 PS 8%
4 This Table also includes metiers that are not listed under Annex III of Regulation 812/2004, that have been monitored by the UK in order to better quantify bycatch in areas where it isknown or thought to occur most frequently. This is an obligation under Article 12 of the Habitats Directive (Council Directive 92/43/EEC of 21 May 1992).
PTM/Bass VIIE BassCommonDolphin 5 15 11 0.11 0.21 26 0.00
86
REPORT TO THE EUROPEAN COMMISSION ON THE IMPLEMENTATION OF REGULATION812/2004 BY THE UNITED KINGDOM FOR THE CALENDAR YEAR 2010
17
6.2 Recording of incidental catches
Dedicated marine mammal observers follow a standard data collection protocol. On a haul by haulbasis they record the vantage point on the ship from which they are able to make their observations,which depends on the discretion of the master of the vessel and on safety considerations, and make ajudgement as to the probability that they would be able to observe a bycaught mammal should oneoccur.
Bycaught animals are sampled whenever possible. One or more teeth are removed for agedetermination, skin and blubber samples are obtained, sex is determined and girth, length and blubberthickness measurements are taken. The internal temperature of each animal is also recorded todetermine very approximate time of death.
Consideration needs to be given to safety and human health issues when animals are sampled, whichmeans that not all bycaught mammals can be sampled. It is also often the case, especially on smallboats, that bycaught cetaceans cannot be brought on board and have to be cut from the net beforecoming over the net hauler. A substantial proportion also fall from the net as it leaves the water.Animals taken in trawls are easier to sample and handle, but sampling cannot be allowed tocontaminate fish that are intended for human consumption. Whether the animal reached the deck or fellfrom the net is recorded, as is its orientation in the net.
7. Discussion
Bycatch estimates given in Table 6.1 (86 dolphins and 338 porpoises) are substantially lower than inprevious years, but this is an artefact of the way in which the data have been aggregated. Reporting for2010 has followed the guidelines proposed last year by the Commission, with fleet and observerbycatch and effort data presented by major gear class, by ICES subdivision and by major targetgrouping. This means that for some subdivisions where little or no sampling was done for specificmetiers, and no bycatch was reported, bycatch estimates are zero, even though bycatch may have beenobserved in these sectors in previous years. To provide a more reliable estimate of total bycatch wehave examined all data collected since 2000 and provide more reliable estimates of bycatch in Annex 1for fishery sectors that are more in line with those reported on in previous years.
Bycatch estimates for the bass pair trawl fishery have CVs of zero because the entire fleet (2 pairteams) was sampled. As in previous years Table 5.1 indicates that there have been more daysmonitored in this fishery than are recorded in the official landings statistics. This is because the fisheryoperates sporadically and mid-water pair trawls may occur on the same trip as other gear types, whilelandings of bass may be small compared with those of other fish species, which obscures the true effortin the fishery.
Estimates of porpoise and dolphin bycatch in the set gillnet fisheries of the southwest of England(Western English Channel and Celtic Sea – ICES Divisions VIIaefghji) calculated in the Annex arearound 540 porpoises in 2010 and 290 common dolphins with CV’s of 0.13 and 0.17 respectively,from 817 observed hauls observed without pingers. These same fisheries have been monitored formany years, and since 2005 under the present monitoring scheme over 4000 net hauls have beenobserved. A statistical analysis (using a generalised linear modelling approach) did not reveal anysignificant differences in catch rates between years since 2005, and so we have also used all the datafrom these six years of observations to estimate total bycatches for 2010.
18
8. Conclusions
The principal area of concern for cetacean bycatch remains the south-western waters of the WesternChannel and Celtic Sea. The situation in the North Sea remains unclear as only one porpoise has beenreported caught among 582 observed hauls in the past four years. . Monitoring is now being focusedon these two areas and as sufficient data are compiled, more robust estimates of current bycatch rateswill become available.
The UK is now undertaking more limited monitoring in its pelagic trawl fleets, except where cetaceanbycatch is known to be a concern, or where there is insufficient information to form an assessment oflikely take rates. Most sampling effort is now directed at under 15m vessels using static gears insubareas VII and IV, while the over 12m vessels that are involved in ongoing trials of acousticmitigation devices are also subject to ongoing collaborative study.
In terms of bycatch mitigation, a considerable amount of progress has been made in recent years.Dolphin bycatch rates in the bass pair trawl fishery remain substantially lower than in the years 2002-2005, while efforts are also being made to minimise porpoise and dolphin bycatches in the static netfisheries of the southwest with industry collaboration.
The development and implementation of mitigation measures is a slow process that needs to beconducted in collaboration with the industry if it is to be successfully adopted, but already it is likelythat during 2010 some tens of dolphins and porpoises have avoided being bycatch as a result of pingerdeployments in the over 12m fleet fishing in subarea VII.
Progress on the testing and deployment of DDD pingers in the static net fisheries of subarea VII isproceeding well, and by mid-2011 a much clearer picture of the efficacy of these devices will beavailable, by which time it is also hoped that full implementation of the pinger requirements for vesselsover 12m using set nets in subarea VII will be well under way.
Although there is at present no evidence of a major conservation issue for either common dolphins orporpoises in our waters, the UK is committed to reducing cetacean bycatch to the lowest level possibleand to sustainable fishing practices that minimise damage to the environment, with an overall visionfor clean, healthy, productive and biodiverse seas.
References
Anonymous. 2003. Trial of acoustic deterrents ('porpoise pingers') for prevention of porpoise (Phocoena phocoena)bycatch - Phase 1 Deployment Trial. Financial Instrument for Fisheries Guidance (FIFG) Project, Sea FishIndustry Authority.
Anonymous. 2005. Trial of acoustic deterrents ('porpoise pingers') for prevention of porpoise (Phocoena phocoena)bycatch - Phase 2 and 3 and tangle net endurance trial. Sea Fish Industry Authority.
Cosgrove, R., D. Browne, and S. Robson. 2005. Assessment of Acoustic Deterrent Devices in Irish Gill Net andTangle Net Fisheries. Bord Iascaigh Mhara.
Le Berre, N. 2005. Impact de l'Introduction de Repulsifs Acoustiques a Cetaces (<<Pingers>>) sur la securite et lesconditions de travial a bord des filayeurs de manch-ouest. Comite Local des peches et des Elevages marins(CLPMEM) de Paimpol-Lannion.
Northridge, S. and P. Hammond. 2000. Small Cetacean Bycatches in UK Fisheries. Sea Mammal Research Unit.Northridge, S. and A. Kingston. 2010. Report to the European Commission on the implementation of regulation
(EC) No 812/2004 by the United Kingdom for the calendar year 2009. Sea Mammal Research Unit /Scottish Oceans Institute.
Northridge, S. and L. Thomas. 2003. Monitoring Levels Required in European Fisheries to Assess CetaceanBycatch, with Particular Reference to UK Fisheries. University of St Andrews.
19
ANNEX to UK Progress Report on Implementation of Council Regulation 812/2004, for 2010
Estimates of bycatch in the main body of this report were calculated using just those metiers in which
bycatch had been observed during 2010. This is not a satisfactory method of estimation because in any
one year sampling is unlikely to be sufficient to provide a positive or precise estimate of bycatch in all
metiers. In order to obtain a more accurate estimate of bycatch we have therefore pooled data over
several years to obtain best estimates of the underlying bycatch rate for porpoises, dolphins and seals in
all metiers. To achieve this, some statistical modelling was required in order to determine for example
whether bycatch rate varies significantly between years or with other covariates.
We have used all SMRU observations made in gill and entangling net fisheries in ICES subareas VII
and VIII on UK boats since 2000, except those nets in which pingers had been used. Data were
divided into five fixed net metiers as detailed above; drift nets were not included in the analysis as no
mammal bycatches have yet been observed in these metiers. The five metiers are tang/tram which
includes all entangling gear such as tangle nets for monkfish and trammel nets, hake gillnets, light
flatfish gillnets (mainly for sole), light gillnets (mainly for bass, also red mullet etc), and other gillnets
for cod, pollack etc. These metiers were based on the stated target species from the observer forms and
our own understanding of differences in design and usage among these nets types. We investigated
temporal, spatial and fishery related factors that may affect bycatch using a series of generalised linear
models (GLMs) and generalised additive (GAM) models.
Sampling by ICES division was not evenly spread, so in order to improve model fits we also grouped
ICES divisions into four zones: divisions VIII, VIIj, and VIIh were lumped into one ‘offshore’ zone,
VIIg and VIIa into one ‘Irish’ zone, while VIIf and VIIe were treated as north and south
Devon/Cornwall respectively. Sampling and effort data from VIId (the central and eastern Channel)
were excluded because sampling has been light there, and mainly at the western end of the region and
is therefore possibly unrepresentative. We included net length (i.e. fleet length) in our initial analysis,
as well as month and year as temporal covariates.
Since 2000 we have observed 4047 unpingered net hauls, with bycatches of 45 porpoises, 27 common
dolphins and 21 seals (mainly grey seals but species not always determined). We assumed a binomial
distribution in the statistical analysis (hauls either with bycatch or without bycatch), and used a logit
link function in the GLM/GAM analyses. For GAMs we used standard thin plate regression splines
except for month covariate, where we used a cyclic cubic regression spline, so the expected values for
first and last month join up.
We found that for porpoises and dolphins, fleet length (length of netting in the water) was the most
significant explanatory variable, though metier came out next best. Unfortunately the net length
available in the logbook data for the entire fleet are unreliable, so we cannot use this covariate to
extrapolate total bycatch numbers, whereas we can use landings to allocate a metier to each trip in the
fleet data. Stratification by metier is therefore feasible at the fleet level, but not so by net length.
We found no evidence of any trend in observed bycatch rate with year after 2005. Before that date our
observations were too few to be sure what was going on, but we have excluded these earlier
observations from further analysis as the model results indicated that they may introduce a bias with
20
respect to later years. We found some evidence of seasonal bycatch patterns among observed
bycatches of all three mammals, but we have not taken this into account in the subsequent estimates,
assuming we have sampled effort by month roughly in proportion to actual effort.
After we had excluded observations prior to 2005 we found that none of the temporal or spatial
covariates helped to explain much of the observed variability in bycatch, so we have proceeded to
estimate total bycatch by metier alone for all of the ICES divisions (VIIaefghj and VIII) together, using
a pooled estimate of bycatch rate for each metier based on observations from 2005-2010. Fleet effort
data for 2010 were used to estimate total bycatch figures, having first removed hauls with pingers, all
of which were (we believe) observed.
We estimated fishing effort in net hauls based on the number of days at sea reported in the fleet effort
database. We used the observer data from 2000-2010 to estimate the number of hauls per day by
metier. Further modelling of these data suggested that there is a significant difference in the number of
hauls per day between day trips and multi-day trips. We have therefore stratified the fleet data into day
trips and multi day trips prior to estimating the number of hauls per day by metier. At this point we
have not included the error associated with the estimate of the number of hauls per day in the final
calculation of bycatch. This is something that should be addressed in future and will have the
consequence of increasing the CV and the upper confidence limit on each estimate, but will not alter
the pint estimates.
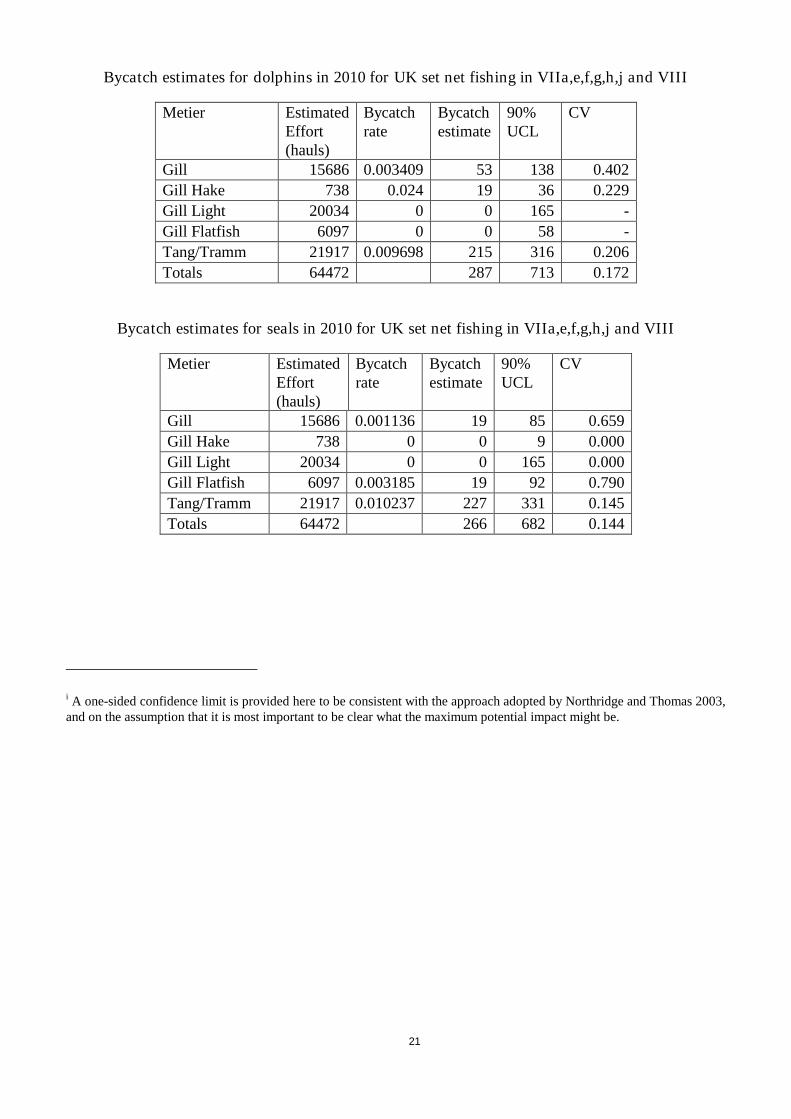
The three tables below show our estimate of the number of hauls conducted in each of the five set net
metiers within the study region (ICES divisions VIIa,e,f,g,h,j, and VIII) during 2010, the estimates of
the bycatch rates by metier based on six years of observations, and the estimates of the numbers of
animals bycaught within each metier and overall, together with associated one sided upper confidence
limits and CVs. Bycatch totals are not dissimilar to those produced for previous years, though we have
stratified our estimates somewhat differently this year as described above, but they are higher than
those reported in the main body of the report above, where calculations were done only for those
metiers where bycatches had been observed in 2010.
Bycatch estimates for porpoises in 2010 for UK set net fishing in VIIa,e,f,g,h,j and VIII
Metier EstimatedEffort(hauls)
Bycatchrate
Bycatchestimate
90%UCLi
CV
Gill 15686 0.0113636 179 302 0.239
Gill Hake 738 0.048 35 57 0.183
Gill Light 20034 0.0027624 56 262 0.707
Gill Flatfish 6097 0 0 58 -
Tang/Tramm 21917 0.0118534 265 375 0.151
Totals 64472 536 1054 0.133
21
Bycatch estimates for dolphins in 2010 for UK set net fishing in VIIa,e,f,g,h,j and VIII
Metier EstimatedEffort(hauls)
Bycatchrate
Bycatchestimate
90%UCL
CV
Gill 15686 0.003409 53 138 0.402
Gill Hake 738 0.024 19 36 0.229
Gill Light 20034 0 0 165 -
Gill Flatfish 6097 0 0 58 -
Tang/Tramm 21917 0.009698 215 316 0.206
Totals 64472 287 713 0.172
Bycatch estimates for seals in 2010 for UK set net fishing in VIIa,e,f,g,h,j and VIII
Metier EstimatedEffort(hauls)
Bycatchrate
Bycatchestimate
90%UCL
CV
Gill 15686 0.001136 19 85 0.659
Gill Hake 738 0 0 9 0.000
Gill Light 20034 0 0 165 0.000
Gill Flatfish 6097 0.003185 19 92 0.790
Tang/Tramm 21917 0.010237 227 331 0.145
Totals 64472 266 682 0.144
i A one-sided confidence limit is provided here to be consistent with the approach adopted by Northridge and Thomas 2003,and on the assumption that it is most important to be clear what the maximum potential impact might be.