30
ANNUAL REPORT TO THE THIRTIETH LEGISLATURE 2019 REGULAR SESSION
ON
ACT 40, SESSION LAWS OF HAWAI‘I 2004
HRS § 601-21
A Report on Statewide Substance Abuse Treatment Monitoring Program
Prepared by:
Adult Client Services Branch, First Circuit The Judiciary, State of Hawai‘i
December 2018
1
ANNUAL REPORT TO THE THIRTIETH LEGISLATURE 2019 REGULAR SESSION
ON
ACT 40, SESSION LAWS OF HAWAI‘I 2004 HRS § 601-21
A Report on Statewide Substance Abuse Treatment
Monitoring Program
HRS § 601-21 requires the Judiciary to: (a) collect data in accordance with HRS § 321-192.5 from any circuit court, adult probation, and any provider of substance abuse treatment that provides substance abuse treatment to persons served through public funds administered by the judiciary; and (b) include in the contract with any treatment provider all criteria established by the department of health pursuant to HRS § 321-192.5 to determine whether the treatment provider is achieving success in treating individuals with substance abuse.
The Judiciary’s efforts to comply with the above-referenced statue are outlined below.
• The Judiciary continues to include language in its Requests for Proposals and existing contracts with substance abuse treatment providers to hold programs accountable for complying with Department of Health (DOH) criteria to determine success in treating individuals with substance abuse.
• The Judiciary received available data taken from the Web Infrastructure for
Treatment Services (WITS) information system. Reports from WITS are attached. It is noted that some of the Judiciary’s contracted providers were not ADAD providers, thus numbers were taken for these programs from Caseload Explorer (CE), the Judiciary statewide ACSB case and management information system for probation. These statistics must be considered preliminary as ACSB still needs to ensure that all program data is entered in a timely manner.
It is noted that the data provided by ADAD is based on information provided by treatment providers. Some of this information may not match with what is contained in CE as there may be inconsistency in the way data is entered and interpreted. The Department of Health ADAD/WITS reported data in the tables shown on the following pages.
The following FY18 statewide probation data was also obtained from CE:
• 925 unduplicated adults entered 1,011 programs with 1,133 admits in FY 18. The
higher number of admits reflect clients being admitted to treatment more than once during the year.
• 5,380 offenders were active in treatment during the same year
2
• Of the 5,380 offenders, 4,169 were males, 1,186 were females, and 25 were
unspecified.
• Treatment services include assessments, education, motivational enhancement, outpatient, intensive outpatient, day and residential care, with continuing care following core treatment. Special needs, including those for pregnant and parenting women and individuals with co-occurring (mental health and substance abuse) disorders have been addressed by treatment programs.
• Through the efforts of the Interagency Council on Intermediate Sanctions (ICIS),
programs have been evaluated using the Correctional Program Checklist (CPC) to determine how much in alignment programs are with the application of effective practices in working with offenders. Most programs are beginning to look at their programming and are working toward adopting and adapting to these principles.
• The CPC assessment team continues to be active in supporting the vendors as
they begin to implement some of these practices, by providing opportunities for greater interaction between programs and the criminal justice system through training. Probation officers are consistently transmitting Level of Services Inventory-Revised data which provide vendors with the risk (to recidivate) classification of referred offenders to address dosage and treatment placement.
• Clients from Neighbor Islands had to travel to O‘ahu or Maui for residential type
placements, reflecting the need for higher levels of substance abuse treatment on all islands. There are no residential treatment programs on Hawaiʻi Island, Kauaʻi, Lānaʻi, and Molokaʻi.
3
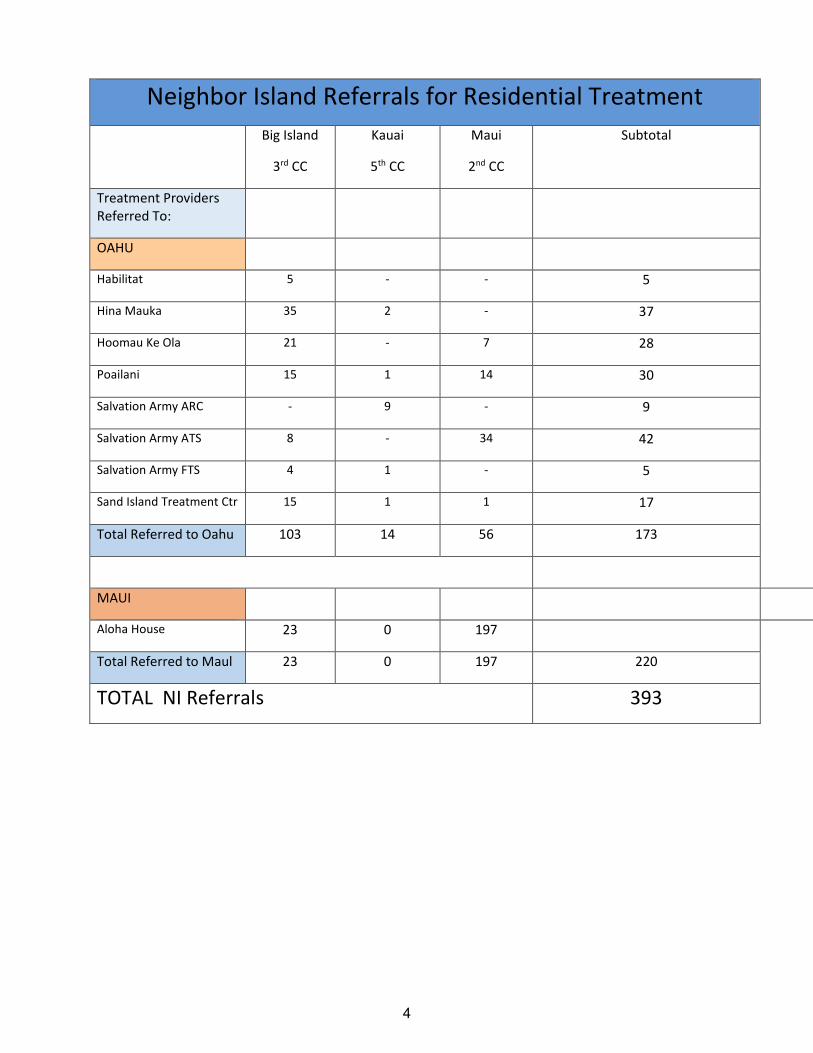
Neighbor Island Referrals for Residential Treatment Big Island
3rd CC
Kauai
5th CC
Maui
2nd CC
Subtotal
Treatment Providers Referred To:
OAHU
Habilitat 5 - - 5
Hina Mauka 35 2 - 37
Hoomau Ke Ola 21 - 7 28
Poailani 15 1 14 30
Salvation Army ARC - 9 - 9
Salvation Army ATS 8 - 34 42
Salvation Army FTS 4 1 - 5
Sand Island Treatment Ctr 15 1 1 17
Total Referred to Oahu 103 14 56 173
MAUI
Aloha House 23 0 197
Total Referred to Maul 23 0 197 220
TOTAL NI Referrals 393
4
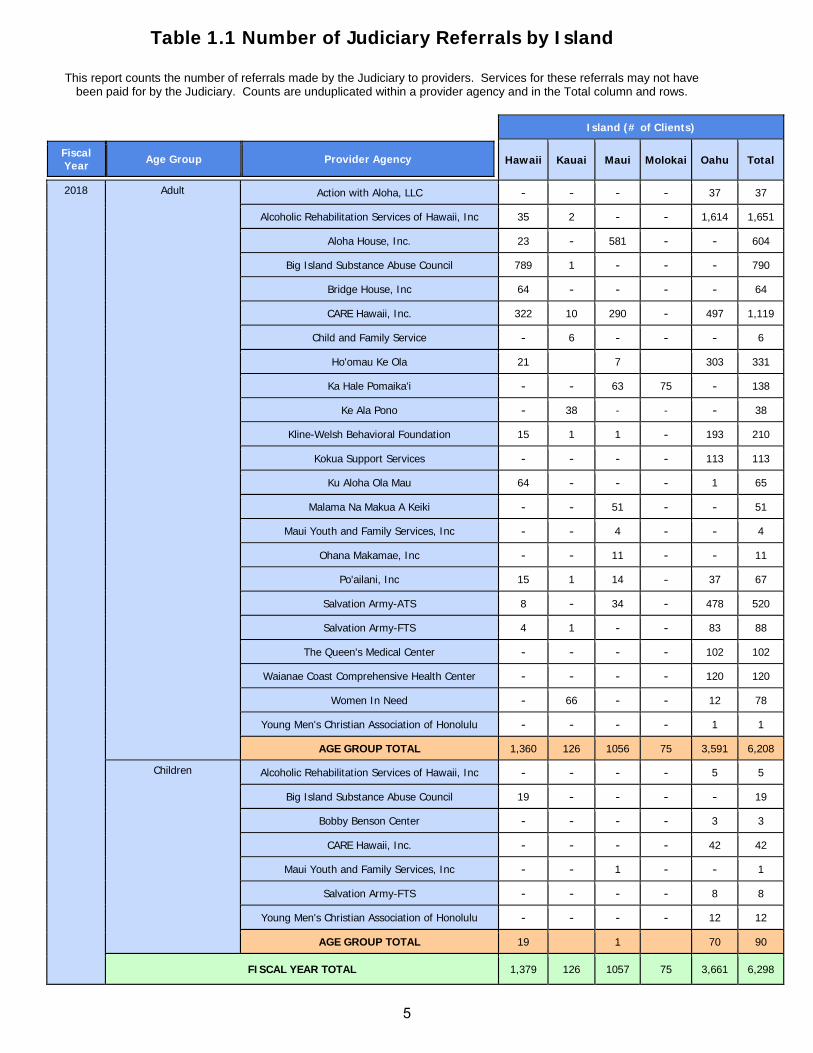
Table 1.1 Number of Judiciary Referrals by Island
This report counts the number of referrals made by the Judiciary to providers. Services for these referrals may not have been paid for by the Judiciary. Counts are unduplicated within a provider agency and in the Total column and rows.
Fiscal Year
Age Group
Provider Agency
Island (# of Clients)
Hawaii
Kauai
Maui
Molokai
Oahu
Total
2018 Adult Action with Aloha, LLC - - - - 37 37
Alcoholic Rehabilitation Services of Hawaii, Inc 35 2 - - 1,614 1,651
Aloha House, Inc. 23 - 581 - - 604
Big Island Substance Abuse Council 789 1 - - - 790
Bridge House, Inc 64 - - - - 64
CARE Hawaii, Inc. 322 10 290 - 497 1,119
Child and Family Service - 6 - - - 6
Ho'omau Ke Ola 21 7 303 331
Ka Hale Pomaika'i - - 63 75 - 138
Ke Ala Pono - 38 - - - 38
Kline-Welsh Behavioral Foundation 15 1 1 - 193 210
Kokua Support Services - - - - 113 113
Ku Aloha Ola Mau 64 - - - 1 65
Malama Na Makua A Keiki - - 51 - - 51
Maui Youth and Family Services, Inc - - 4 - - 4
Ohana Makamae, Inc - - 11 - - 11
Po'ailani, Inc 15 1 14 - 37 67
Salvation Army-ATS 8 - 34 - 478 520
Salvation Army-FTS 4 1 - - 83 88
The Queen's Medical Center - - - - 102 102
Waianae Coast Comprehensive Health Center - - - - 120 120
Women In Need - 66 - - 12 78
Young Men's Christian Association of Honolulu - - - - 1 1
AGE GROUP TOTAL 1,360 126 1056 75 3,591 6,208 Children Alcoholic Rehabilitation Services of Hawaii, Inc - - - - 5 5
Big Island Substance Abuse Council 19 - - - - 19
Bobby Benson Center - - - - 3 3
CARE Hawaii, Inc. - - - - 42 42
Maui Youth and Family Services, Inc - - 1 - - 1
Salvation Army-FTS - - - - 8 8
Young Men's Christian Association of Honolulu - - - - 12 12
AGE GROUP TOTAL 19 1 70 90
FISCAL YEAR TOTAL 1,379 126 1057 75 3,661 6,298
5
Fiscal Year
Island
Age Group
Provider Agency
Client Gender (# of Clients)
Female
Male
Unknown
Total
2018 Hawaii Adult Big Island Substance Abuse Council
146 644 790
Bridge House, Inc 14 50 64
CARE Hawaii, Inc. 65 257 322
Ku Aloha Ola Mau 17 47 64
AGE GROUP TOTAL 242 998 1,240
Children Big Island Substance Abuse Council
8 11 19
AGE GROUP TOTAL 8 11 19
ISLAND TOTAL 250 1,010 1,259
Kauai Adult CARE Hawaii, Inc. 1 9 10
Child and Family Service 6 - 6
Ke Ala Pono 5 33 38
Women In Need 53 13 66
AGE GROUP TOTAL 65 55 120
ISLAND TOTAL 65 55 120
Maui Adult Aloha House, Inc. 116 488 604
CARE Hawaii, Inc. 85 205 290
Malama Na Makua A Keiki 51 - 51
Maui Youth and Family Services, Inc
4 - 4
Ohana Makamae, Inc 11 11
AGE GROUP TOTAL 256 704 960
Children Maui Youth and Family Services, Inc
1 - 1
AGE GROUP TOTAL 1 1
ISLAND TOTAL 257 704 961
Hawai‘i Adult Ka Hale Pomaika’i 37 101 138
AGE GROUP TOTAL 37 101 138
ISLAND TOTAL 37 101 138
Hawai‘i Adult Action with Aloha, LLC 3 34 37
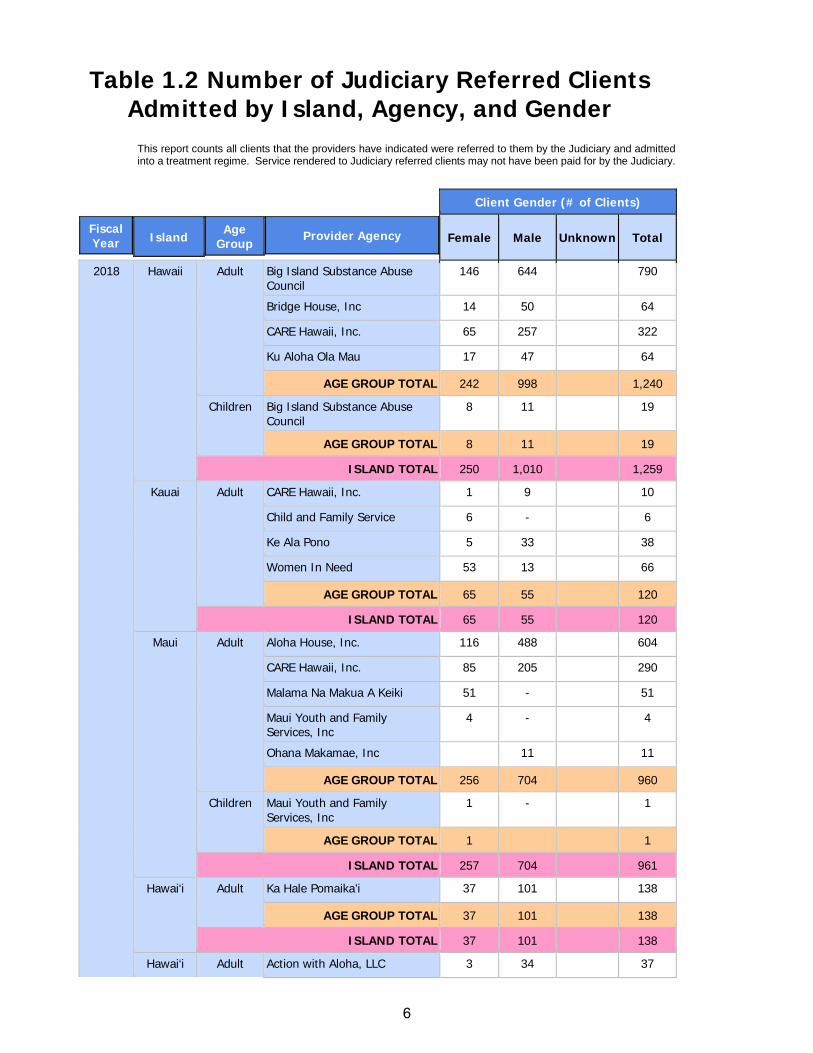
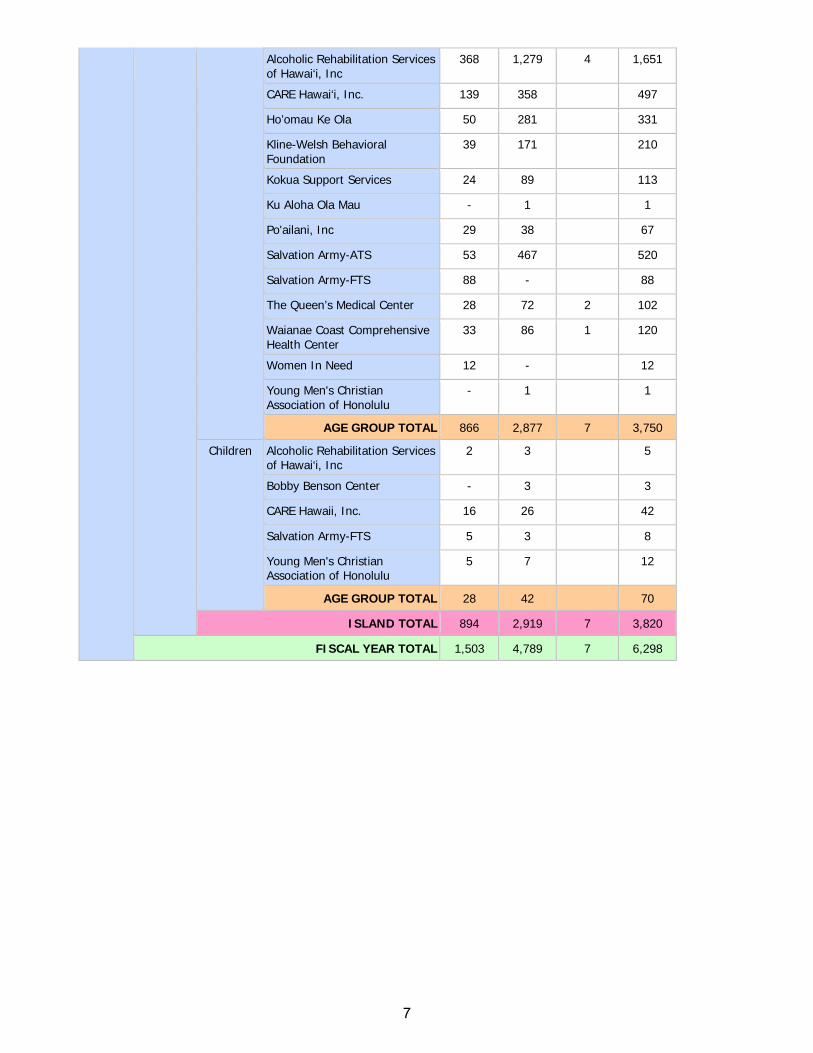
Table 1.2 Number of Judiciary Referred Clients Admitted by Island, Agency, and Gender
This report counts all clients that the providers have indicated were referred to them by the Judiciary and admitted into a treatment regime. Service rendered to Judiciary referred clients may not have been paid for by the Judiciary.
6
Alcoholic Rehabilitation Services of Hawai‘i, Inc
368 1,279 4 1,651
CARE Hawai‘i, Inc. 139 358 497
Ho’omau Ke Ola 50 281 331
Kline-Welsh Behavioral Foundation
39 171 210
Kokua Support Services 24 89 113
Ku Aloha Ola Mau - 1 1
Po'ailani, Inc 29 38 67
Salvation Army-ATS 53 467 520
Salvation Army-FTS 88 - 88
The Queen’s Medical Center 28 72 2 102
Waianae Coast Comprehensive Health Center
33 86 1 120
Women In Need 12 - 12
Young Men's Christian Association of Honolulu
- 1 1
AGE GROUP TOTAL 866 2,877 7 3,750
Children Alcoholic Rehabilitation Services of Hawai‘i, Inc
2 3 5
Bobby Benson Center - 3 3
CARE Hawaii, Inc. 16 26 42
Salvation Army-FTS 5 3 8
Young Men's Christian Association of Honolulu
5 7 12
AGE GROUP TOTAL 28 42 70
ISLAND TOTAL 894 2,919 7 3,820
FISCAL YEAR TOTAL 1,503 4,789 7 6,298
7
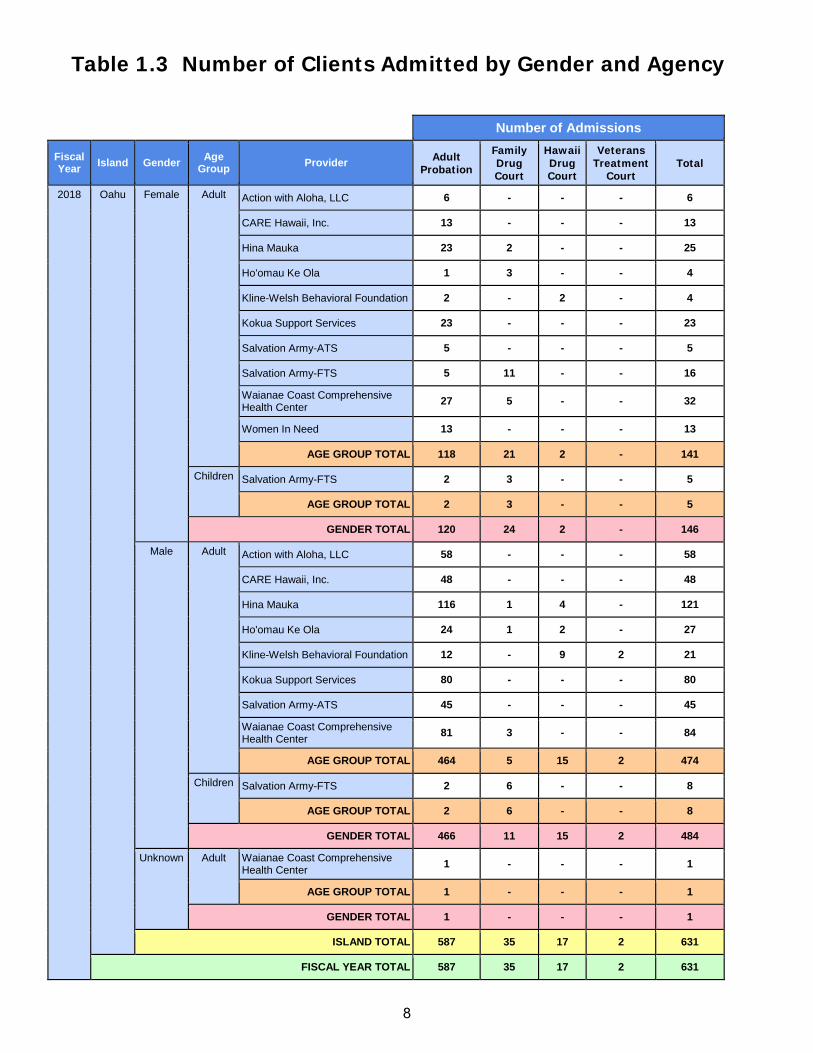
Table 1.3 Number of Clients Admitted by Gender and Agency
Number of Admissions
Fiscal Year Island Gender Age
Group Provider Adult Probation
Family Drug Court
Hawaii Drug Court
Veterans Treatment
Court Total
2018 Oahu Female Adult Action with Aloha, LLC 6 - - - 6
CARE Hawaii, Inc. 13 - - - 13
Hina Mauka 23 2 - - 25
Ho'omau Ke Ola 1 3 - - 4
Kline-Welsh Behavioral Foundation 2 - 2 - 4
Kokua Support Services 23 - - - 23
Salvation Army-ATS 5 - - - 5
Salvation Army-FTS 5 11 - - 16
Waianae Coast Comprehensive Health Center 27 5 - - 32
Women In Need 13 - - - 13
AGE GROUP TOTAL 118 21 2 - 141
Children Salvation Army-FTS 2 3 - - 5
AGE GROUP TOTAL 2 3 - - 5
GENDER TOTAL 120 24 2 - 146
Male Adult Action with Aloha, LLC 58 - - - 58
CARE Hawaii, Inc. 48 - - - 48
Hina Mauka 116 1 4 - 121
Ho'omau Ke Ola 24 1 2 - 27
Kline-Welsh Behavioral Foundation 12 - 9 2 21
Kokua Support Services 80 - - - 80
Salvation Army-ATS 45 - - - 45
Waianae Coast Comprehensive Health Center 81 3 - - 84
AGE GROUP TOTAL 464 5 15 2 474
Children Salvation Army-FTS 2 6 - - 8
AGE GROUP TOTAL 2 6 - - 8
GENDER TOTAL 466 11 15 2 484
Unknown Adult Waianae Coast Comprehensive Health Center 1 - - - 1
AGE GROUP TOTAL 1 - - - 1
GENDER TOTAL 1 - - - 1
ISLAND TOTAL 587 35 17 2 631
FISCAL YEAR TOTAL 587 35 17 2 631
8
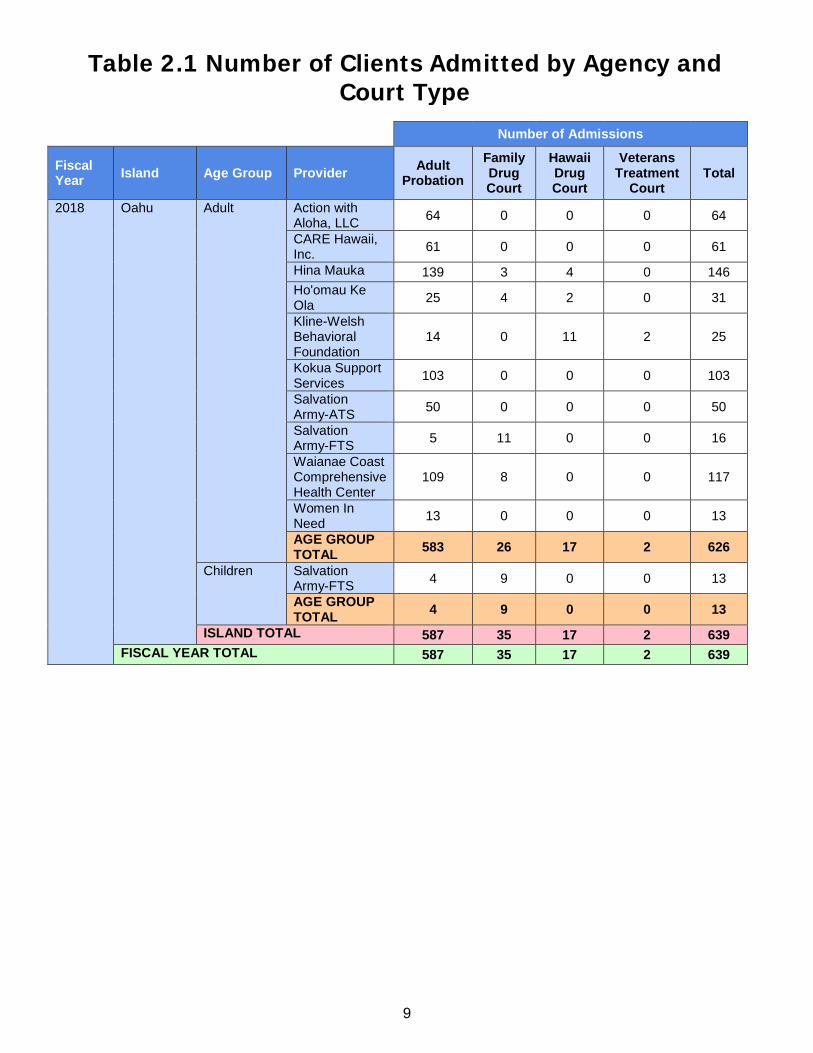
Table 2.1 Number of Clients Admitted by Agency and Court Type
Number of Admissions
Fiscal Year Island Age Group Provider Adult
Probation Family Drug Court
Hawaii Drug Court
Veterans Treatment
Court Total
2018 Oahu Adult Action with
Aloha, LLC 64 0 0 0 64
CARE Hawaii, Inc. 61 0 0 0 61
Hina Mauka 139 3 4 0 146 Ho'omau Ke Ola 25 4 2 0 31
Kline-Welsh Behavioral Foundation
14 0 11 2 25
Kokua Support Services 103 0 0 0 103
Salvation Army-ATS 50 0 0 0 50
Salvation Army-FTS 5 11 0 0 16
Waianae Coast Comprehensive Health Center
109 8 0 0 117
Women In Need 13 0 0 0 13
AGE GROUP TOTAL 583 26 17 2 626
Children Salvation
Army-FTS 4 9 0 0 13
AGE GROUP TOTAL 4 9 0 0 13
ISLAND TOTAL 587 35 17 2 639
FISCAL YEAR TOTAL 587 35 17 2 639
9
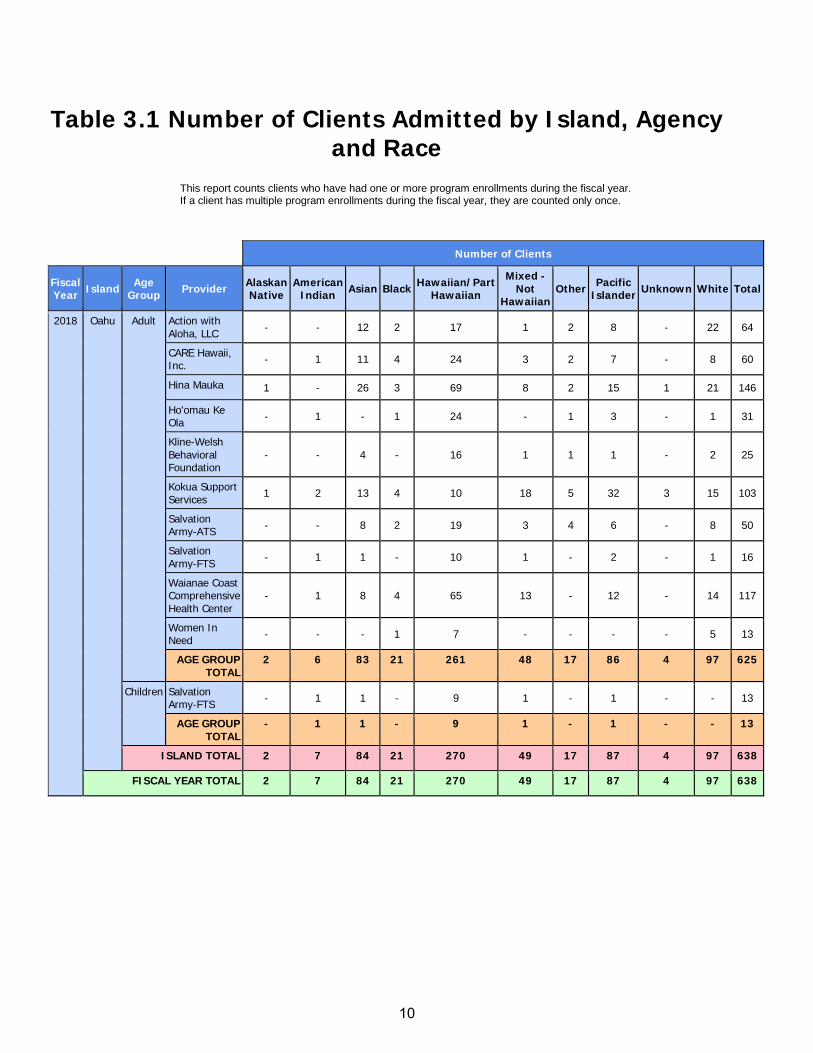
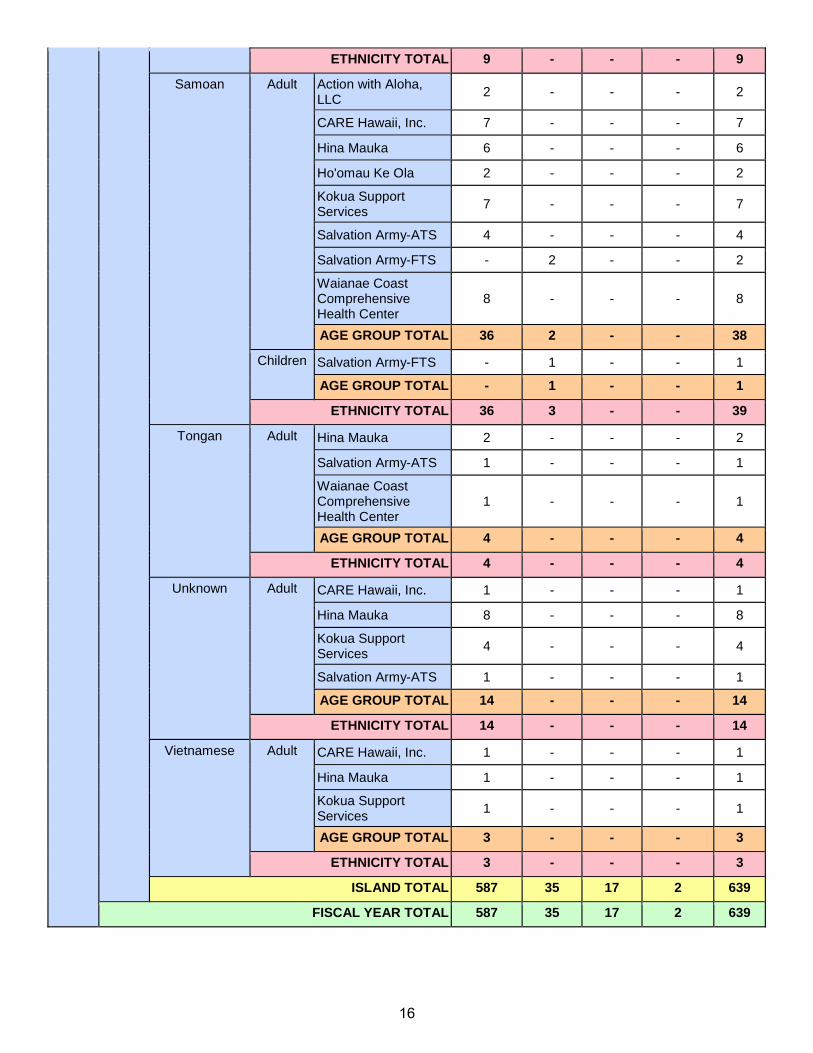
Table 3.1 Number of Clients Admitted by Island, Agency and Race
Number of Clients
Fiscal Year Island Age
Group Provider Alaskan Native
American Indian Asian Black Hawaiian/Part
Hawaiian
Mixed - Not
Hawaiian Other Pacific
Islander Unknown White Total
2018 Oahu Adult Action with Aloha, LLC - - 12 2 17 1 2 8 - 22 64
CARE Hawaii, Inc. - 1 11 4 24 3 2 7 - 8 60
Hina Mauka 1 - 26 3 69 8 2 15 1 21 146
Ho'omau Ke Ola - 1 - 1 24 - 1 3 - 1 31
Kline-Welsh Behavioral Foundation
- - 4 - 16 1 1 1 - 2 25
Kokua Support Services 1 2 13 4 10 18 5 32 3 15 103
Salvation Army-ATS - - 8 2 19 3 4 6 - 8 50
Salvation Army-FTS - 1 1 - 10 1 - 2 - 1 16
Waianae Coast Comprehensive Health Center
- 1 8 4 65 13 - 12 - 14 117
Women In Need - - - 1 7 - - - - 5 13
AGE GROUP TOTAL
2 6 83 21 261 48 17 86 4 97 625
Children Salvation Army-FTS - 1 1 - 9 1 - 1 - - 13
AGE GROUP TOTAL
- 1 1 - 9 1 - 1 - - 13
ISLAND TOTAL 2 7 84 21 270 49 17 87 4 97 638
FISCAL YEAR TOTAL 2 7 84 21 270 49 17 87 4 97 638
This report counts clients who have had one or more program enrollments during the fiscal year. If a client has multiple program enrollments during the fiscal year, they are counted only once.
10
Number of Admissions
Fiscal Year Island Ethnicity Age
Group Provider Adult Probation
Family Drug Court
Hawaii Drug Court
Veterans Treatment
Court Total
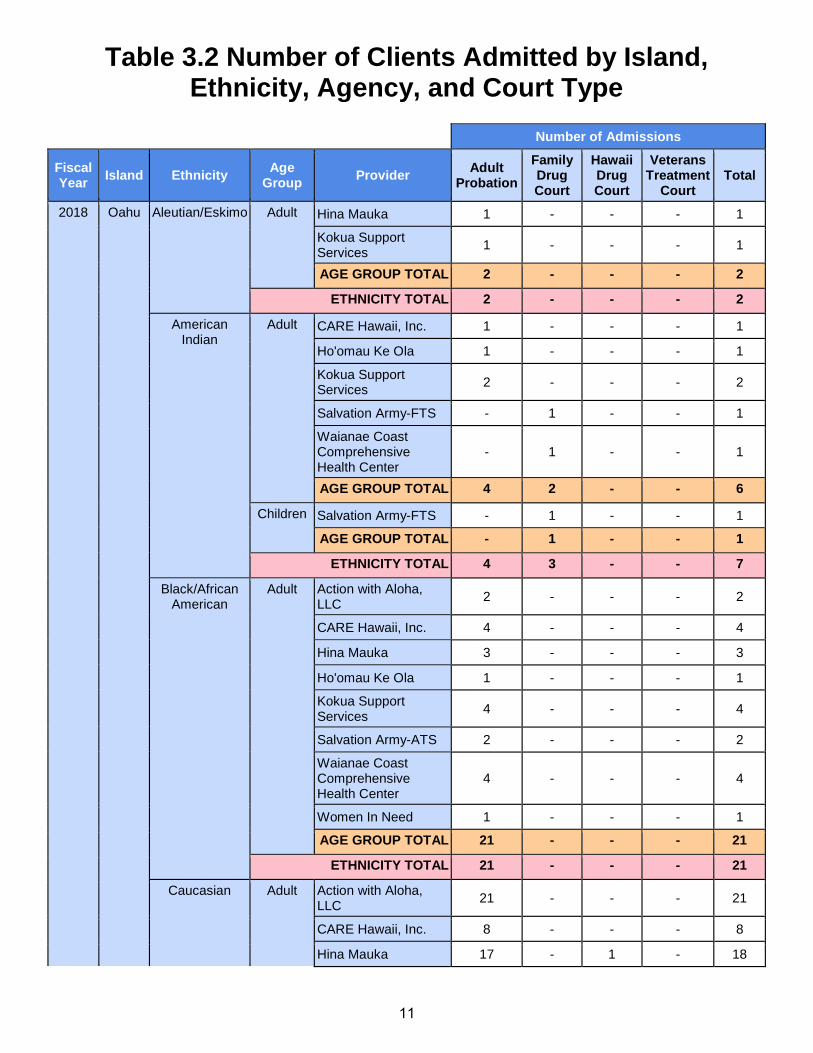
2018 Oahu Aleutian/Eskimo Adult Hina Mauka 1 - - - 1
Kokua Support Services 1 - - - 1
AGE GROUP TOTAL 2 - - - 2
ETHNICITY TOTAL 2 - - - 2
American Indian
Adult CARE Hawaii, Inc. 1 - - - 1
Ho'omau Ke Ola 1 - - - 1
Kokua Support Services 2 - - - 2
Salvation Army-FTS - 1 - - 1
Waianae Coast Comprehensive Health Center
- 1 - - 1
AGE GROUP TOTAL 4 2 - - 6
Children Salvation Army-FTS - 1 - - 1
AGE GROUP TOTAL - 1 - - 1
ETHNICITY TOTAL 4 3 - - 7
Black/African American
Adult Action with Aloha, LLC 2 - - - 2
CARE Hawaii, Inc. 4 - - - 4
Hina Mauka 3 - - - 3
Ho'omau Ke Ola 1 - - - 1
Kokua Support Services 4 - - - 4
Salvation Army-ATS 2 - - - 2
Waianae Coast Comprehensive Health Center
4 - - - 4
Women In Need 1 - - - 1
AGE GROUP TOTAL 21 - - - 21
ETHNICITY TOTAL 21 - - - 21
Caucasian Adult Action with Aloha, LLC 21 - - - 21
CARE Hawaii, Inc. 8 - - - 8
Hina Mauka 17 - 1 - 18
Table 3.2 Number of Clients Admitted by Island, Ethnicity, Agency, and Court Type
11
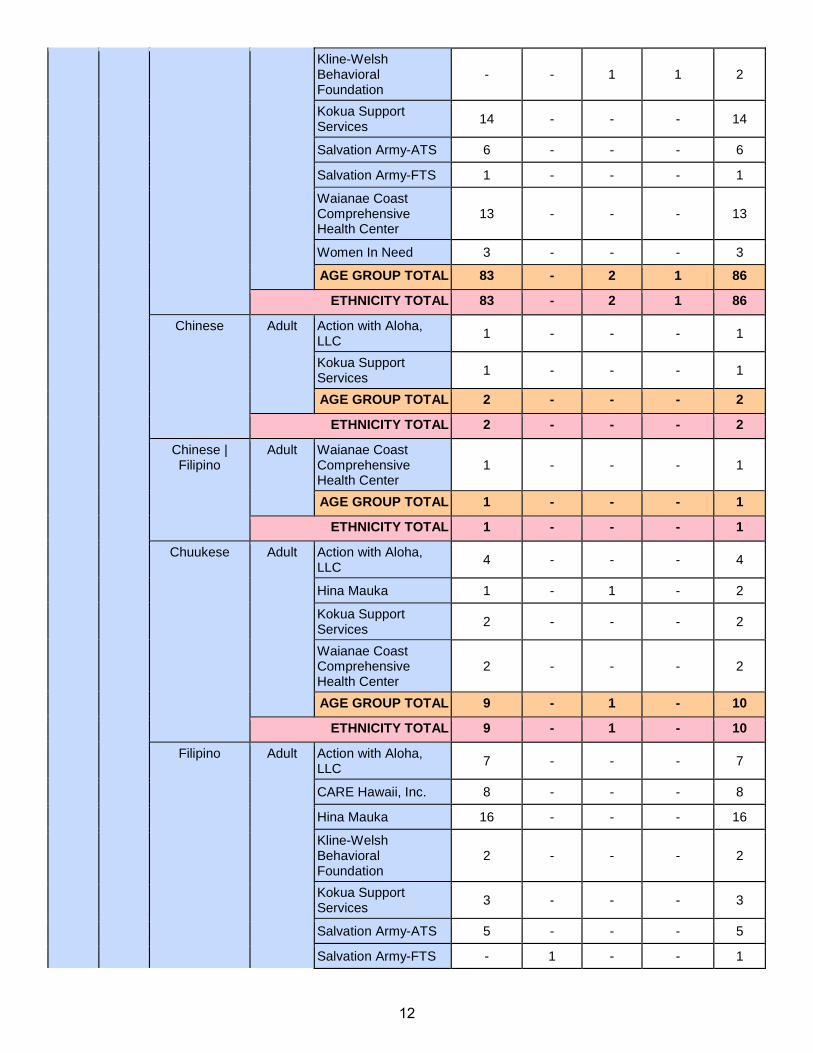
Kline-Welsh Behavioral Foundation
- - 1 1 2
Kokua Support Services 14 - - - 14
Salvation Army-ATS 6 - - - 6
Salvation Army-FTS 1 - - - 1
Waianae Coast Comprehensive Health Center
13 - - - 13
Women In Need 3 - - - 3
AGE GROUP TOTAL 83 - 2 1 86
ETHNICITY TOTAL 83 - 2 1 86
Chinese Adult Action with Aloha, LLC 1 - - - 1
Kokua Support Services 1 - - - 1
AGE GROUP TOTAL 2 - - - 2
ETHNICITY TOTAL 2 - - - 2
Chinese | Filipino
Adult Waianae Coast Comprehensive Health Center
1 - - - 1
AGE GROUP TOTAL 1 - - - 1
ETHNICITY TOTAL 1 - - - 1
Chuukese Adult Action with Aloha, LLC 4 - - - 4
Hina Mauka 1 - 1 - 2
Kokua Support Services 2 - - - 2
Waianae Coast Comprehensive Health Center
2 - - - 2
AGE GROUP TOTAL 9 - 1 - 10
ETHNICITY TOTAL 9 - 1 - 10
Filipino Adult Action with Aloha, LLC 7 - - - 7
CARE Hawaii, Inc. 8 - - - 8
Hina Mauka 16 - - - 16
Kline-Welsh Behavioral Foundation
2 - - - 2
Kokua Support Services 3 - - - 3
Salvation Army-ATS 5 - - - 5
Salvation Army-FTS - 1 - - 1
12
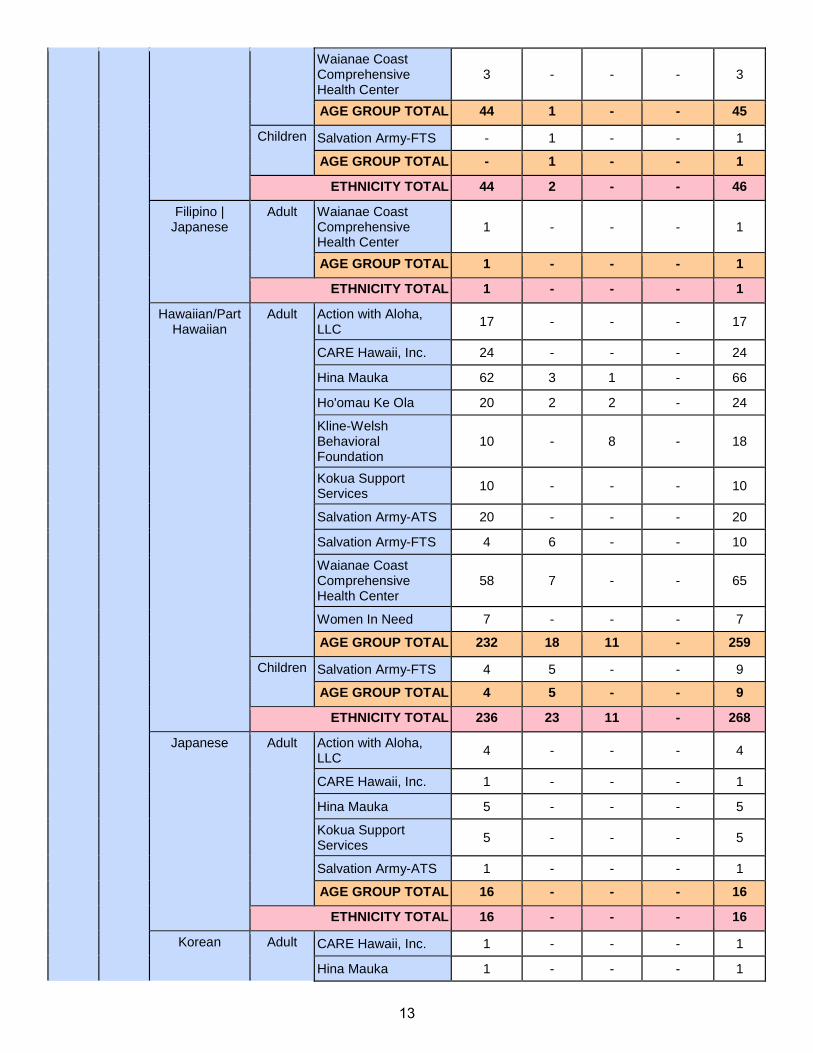
Waianae Coast Comprehensive Health Center
3 - - - 3
AGE GROUP TOTAL 44 1 - - 45
Children Salvation Army-FTS - 1 - - 1
AGE GROUP TOTAL - 1 - - 1
ETHNICITY TOTAL 44 2 - - 46
Filipino | Japanese
Adult Waianae Coast Comprehensive Health Center
1 - - - 1
AGE GROUP TOTAL 1 - - - 1
ETHNICITY TOTAL 1 - - - 1
Hawaiian/Part Hawaiian
Adult Action with Aloha, LLC 17 - - - 17
CARE Hawaii, Inc. 24 - - - 24
Hina Mauka 62 3 1 - 66
Ho'omau Ke Ola 20 2 2 - 24
Kline-Welsh Behavioral Foundation
10 - 8 - 18
Kokua Support Services 10 - - - 10
Salvation Army-ATS 20 - - - 20
Salvation Army-FTS 4 6 - - 10
Waianae Coast Comprehensive Health Center
58 7 - - 65
Women In Need 7 - - - 7
AGE GROUP TOTAL 232 18 11 - 259
Children Salvation Army-FTS 4 5 - - 9
AGE GROUP TOTAL 4 5 - - 9
ETHNICITY TOTAL 236 23 11 - 268
Japanese Adult Action with Aloha, LLC 4 - - - 4
CARE Hawaii, Inc. 1 - - - 1
Hina Mauka 5 - - - 5
Kokua Support Services 5 - - - 5
Salvation Army-ATS 1 - - - 1
AGE GROUP TOTAL 16 - - - 16
ETHNICITY TOTAL 16 - - - 16
Korean Adult CARE Hawaii, Inc. 1 - - - 1
Hina Mauka 1 - - - 1
13
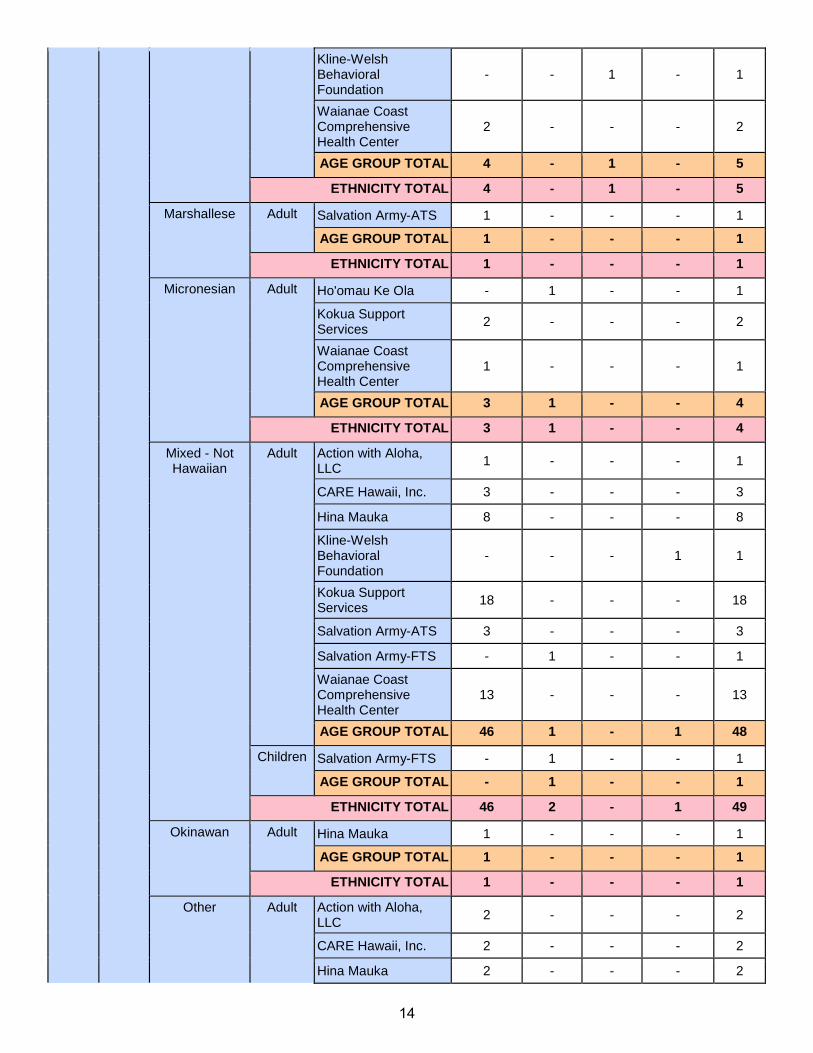
Kline-Welsh Behavioral Foundation
- - 1 - 1
Waianae Coast Comprehensive Health Center
2 - - - 2
AGE GROUP TOTAL 4 - 1 - 5
ETHNICITY TOTAL 4 - 1 - 5
Marshallese Adult Salvation Army-ATS 1 - - - 1
AGE GROUP TOTAL 1 - - - 1
ETHNICITY TOTAL 1 - - - 1
Micronesian Adult Ho'omau Ke Ola - 1 - - 1
Kokua Support Services 2 - - - 2
Waianae Coast Comprehensive Health Center
1 - - - 1
AGE GROUP TOTAL 3 1 - - 4
ETHNICITY TOTAL 3 1 - - 4
Mixed - Not Hawaiian
Adult Action with Aloha, LLC 1 - - - 1
CARE Hawaii, Inc. 3 - - - 3
Hina Mauka 8 - - - 8
Kline-Welsh Behavioral Foundation
- - - 1 1
Kokua Support Services 18 - - - 18
Salvation Army-ATS 3 - - - 3
Salvation Army-FTS - 1 - - 1
Waianae Coast Comprehensive Health Center
13 - - - 13
AGE GROUP TOTAL 46 1 - 1 48
Children Salvation Army-FTS - 1 - - 1
AGE GROUP TOTAL - 1 - - 1
ETHNICITY TOTAL 46 2 - 1 49
Okinawan Adult Hina Mauka 1 - - - 1
AGE GROUP TOTAL 1 - - - 1
ETHNICITY TOTAL 1 - - - 1
Other Adult Action with Aloha, LLC 2 - - - 2
CARE Hawaii, Inc. 2 - - - 2
Hina Mauka 2 - - - 2
14
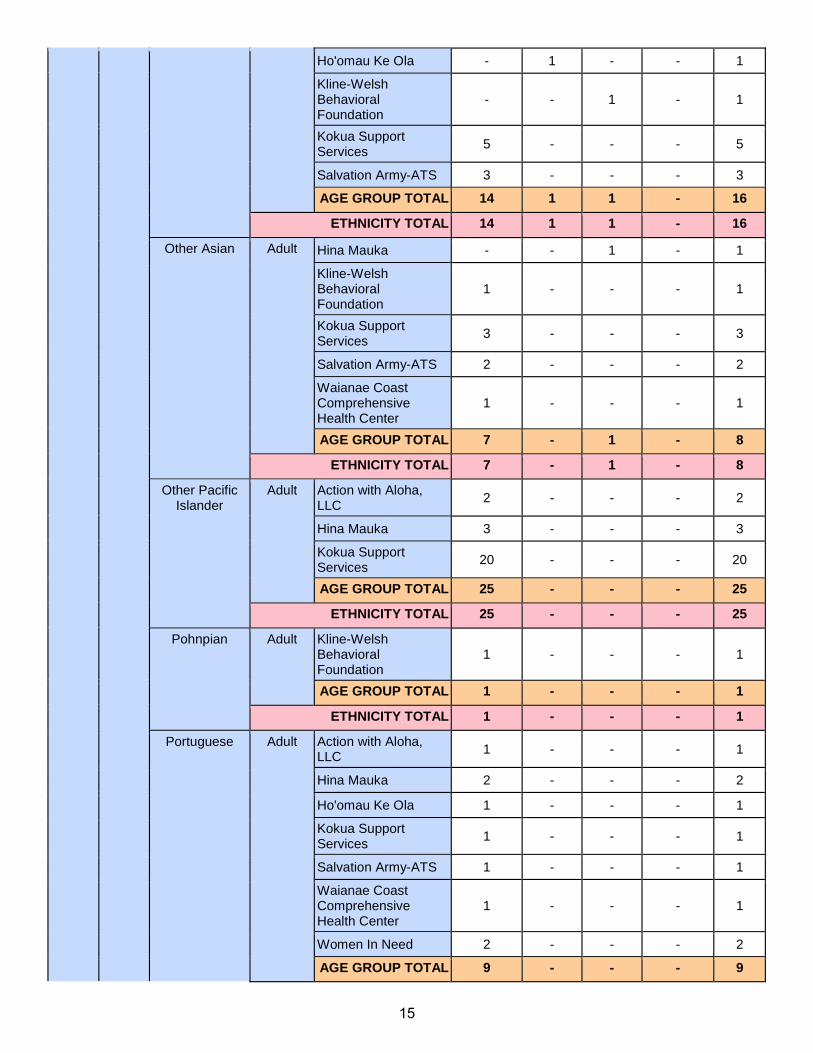
Ho'omau Ke Ola - 1 - - 1
Kline-Welsh Behavioral Foundation
- - 1 - 1
Kokua Support Services 5 - - - 5
Salvation Army-ATS 3 - - - 3
AGE GROUP TOTAL 14 1 1 - 16
ETHNICITY TOTAL 14 1 1 - 16
Other Asian Adult Hina Mauka - - 1 - 1
Kline-Welsh Behavioral Foundation
1 - - - 1
Kokua Support Services 3 - - - 3
Salvation Army-ATS 2 - - - 2
Waianae Coast Comprehensive Health Center
1 - - - 1
AGE GROUP TOTAL 7 - 1 - 8
ETHNICITY TOTAL 7 - 1 - 8
Other Pacific Islander
Adult Action with Aloha, LLC 2 - - - 2
Hina Mauka 3 - - - 3
Kokua Support Services 20 - - - 20
AGE GROUP TOTAL 25 - - - 25
ETHNICITY TOTAL 25 - - - 25
Pohnpian Adult Kline-Welsh Behavioral Foundation
1 - - - 1
AGE GROUP TOTAL 1 - - - 1
ETHNICITY TOTAL 1 - - - 1
Portuguese Adult Action with Aloha, LLC 1 - - - 1
Hina Mauka 2 - - - 2
Ho'omau Ke Ola 1 - - - 1
Kokua Support Services 1 - - - 1
Salvation Army-ATS 1 - - - 1
Waianae Coast Comprehensive Health Center
1 - - - 1
Women In Need 2 - - - 2
AGE GROUP TOTAL 9 - - - 9
15
ETHNICITY TOTAL 9 - - - 9
Samoan Adult Action with Aloha, LLC 2 - - - 2
CARE Hawaii, Inc. 7 - - - 7
Hina Mauka 6 - - - 6
Ho'omau Ke Ola 2 - - - 2
Kokua Support Services 7 - - - 7
Salvation Army-ATS 4 - - - 4
Salvation Army-FTS - 2 - - 2
Waianae Coast Comprehensive Health Center
8 - - - 8
AGE GROUP TOTAL 36 2 - - 38
Children Salvation Army-FTS - 1 - - 1
AGE GROUP TOTAL - 1 - - 1
ETHNICITY TOTAL 36 3 - - 39
Tongan Adult Hina Mauka 2 - - - 2
Salvation Army-ATS 1 - - - 1
Waianae Coast Comprehensive Health Center
1 - - - 1
AGE GROUP TOTAL 4 - - - 4
ETHNICITY TOTAL 4 - - - 4
Unknown Adult CARE Hawaii, Inc. 1 - - - 1
Hina Mauka 8 - - - 8
Kokua Support Services 4 - - - 4
Salvation Army-ATS 1 - - - 1
AGE GROUP TOTAL 14 - - - 14
ETHNICITY TOTAL 14 - - - 14
Vietnamese Adult CARE Hawaii, Inc. 1 - - - 1
Hina Mauka 1 - - - 1
Kokua Support Services 1 - - - 1
AGE GROUP TOTAL 3 - - - 3
ETHNICITY TOTAL 3 - - - 3
ISLAND TOTAL 587 35 17 2 639
FISCAL YEAR TOTAL 587 35 17 2 639
16
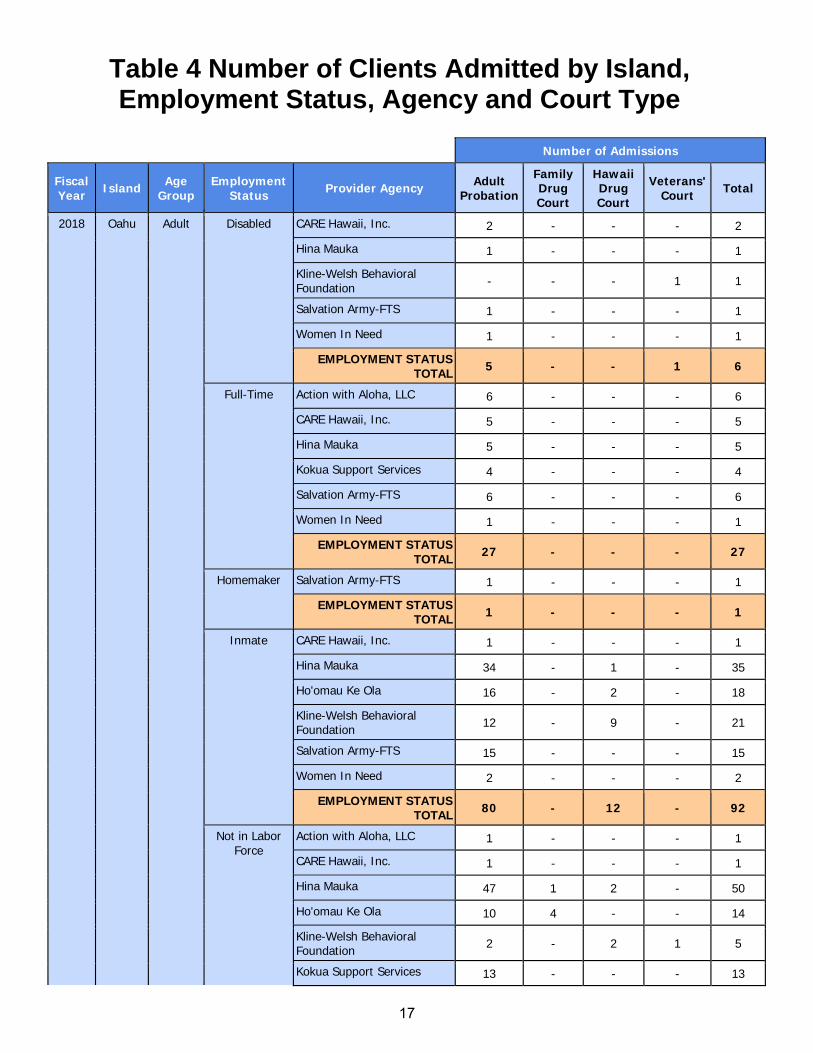
Table 4 Number of Clients Admitted by Island, Employment Status, Agency and Court Type
Number of Admissions
Fiscal Year Island Age
Group Employment
Status Provider Agency Adult Probation
Family Drug Court
Hawaii Drug Court
Veterans' Court Total
2018 Oahu Adult Disabled CARE Hawaii, Inc. 2 - - - 2
Hina Mauka 1 - - - 1
Kline-Welsh Behavioral Foundation - - - 1 1
Salvation Army-FTS 1 - - - 1
Women In Need 1 - - - 1
EMPLOYMENT STATUS TOTAL 5 - - 1 6
Full-Time Action with Aloha, LLC 6 - - - 6
CARE Hawaii, Inc. 5 - - - 5
Hina Mauka 5 - - - 5
Kokua Support Services 4 - - - 4
Salvation Army-FTS 6 - - - 6
Women In Need 1 - - - 1
EMPLOYMENT STATUS TOTAL 27 - - - 27
Homemaker Salvation Army-FTS 1 - - - 1
EMPLOYMENT STATUS TOTAL 1 - - - 1
Inmate CARE Hawaii, Inc. 1 - - - 1
Hina Mauka 34 - 1 - 35
Ho'omau Ke Ola 16 - 2 - 18
Kline-Welsh Behavioral Foundation 12 - 9 - 21
Salvation Army-FTS 15 - - - 15
Women In Need 2 - - - 2
EMPLOYMENT STATUS TOTAL 80 - 12 - 92
Not in Labor Force
Action with Aloha, LLC 1 - - - 1
CARE Hawaii, Inc. 1 - - - 1
Hina Mauka 47 1 2 - 50
Ho'omau Ke Ola 10 4 - - 14
Kline-Welsh Behavioral Foundation 2 - 2 1 5
Kokua Support Services 13 - - - 13
17
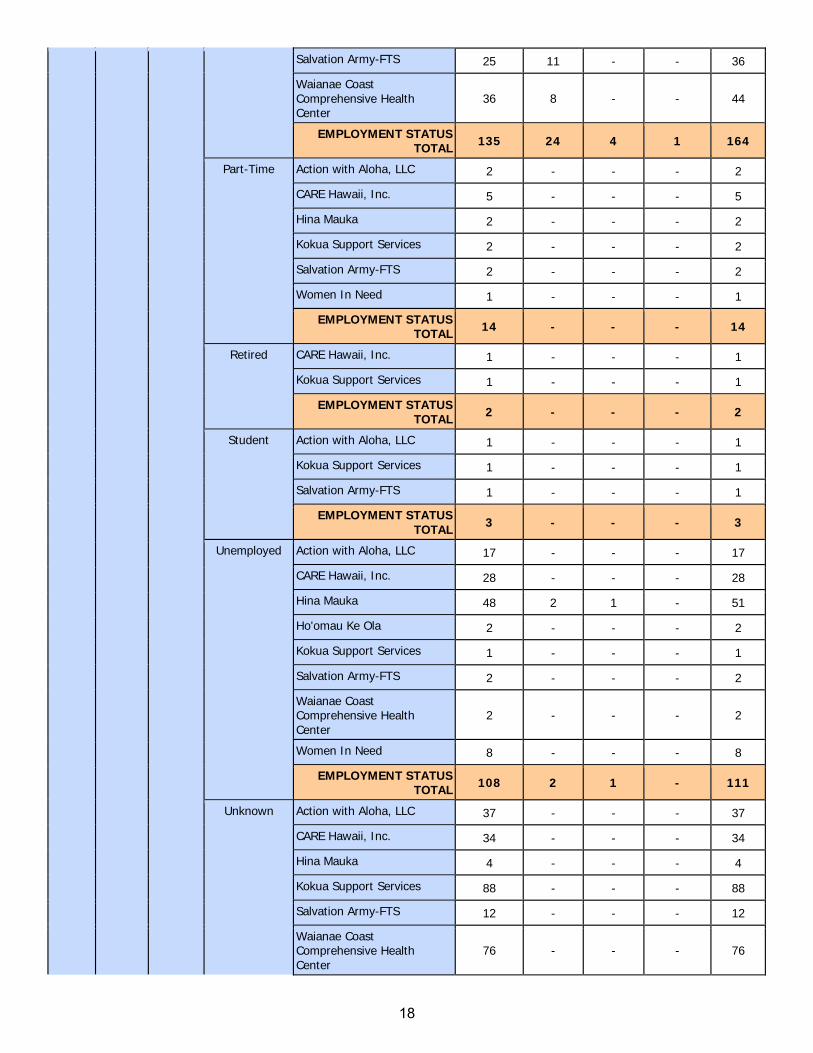
Salvation Army-FTS 25 11 - - 36
Waianae Coast Comprehensive Health Center
36 8 - - 44
EMPLOYMENT STATUS TOTAL 135 24 4 1 164
Part-Time Action with Aloha, LLC 2 - - - 2
CARE Hawaii, Inc. 5 - - - 5
Hina Mauka 2 - - - 2
Kokua Support Services 2 - - - 2
Salvation Army-FTS 2 - - - 2
Women In Need 1 - - - 1
EMPLOYMENT STATUS TOTAL 14 - - - 14
Retired CARE Hawaii, Inc. 1 - - - 1
Kokua Support Services 1 - - - 1
EMPLOYMENT STATUS TOTAL 2 - - - 2
Student Action with Aloha, LLC 1 - - - 1
Kokua Support Services 1 - - - 1
Salvation Army-FTS 1 - - - 1
EMPLOYMENT STATUS TOTAL 3 - - - 3
Unemployed Action with Aloha, LLC 17 - - - 17
CARE Hawaii, Inc. 28 - - - 28
Hina Mauka 48 2 1 - 51
Ho'omau Ke Ola 2 - - - 2
Kokua Support Services 1 - - - 1
Salvation Army-FTS 2 - - - 2
Waianae Coast Comprehensive Health Center
2 - - - 2
Women In Need 8 - - - 8
EMPLOYMENT STATUS TOTAL 108 2 1 - 111
Unknown Action with Aloha, LLC 37 - - - 37
CARE Hawaii, Inc. 34 - - - 34
Hina Mauka 4 - - - 4
Kokua Support Services 88 - - - 88
Salvation Army-FTS 12 - - - 12
Waianae Coast Comprehensive Health Center
76 - - - 76
18
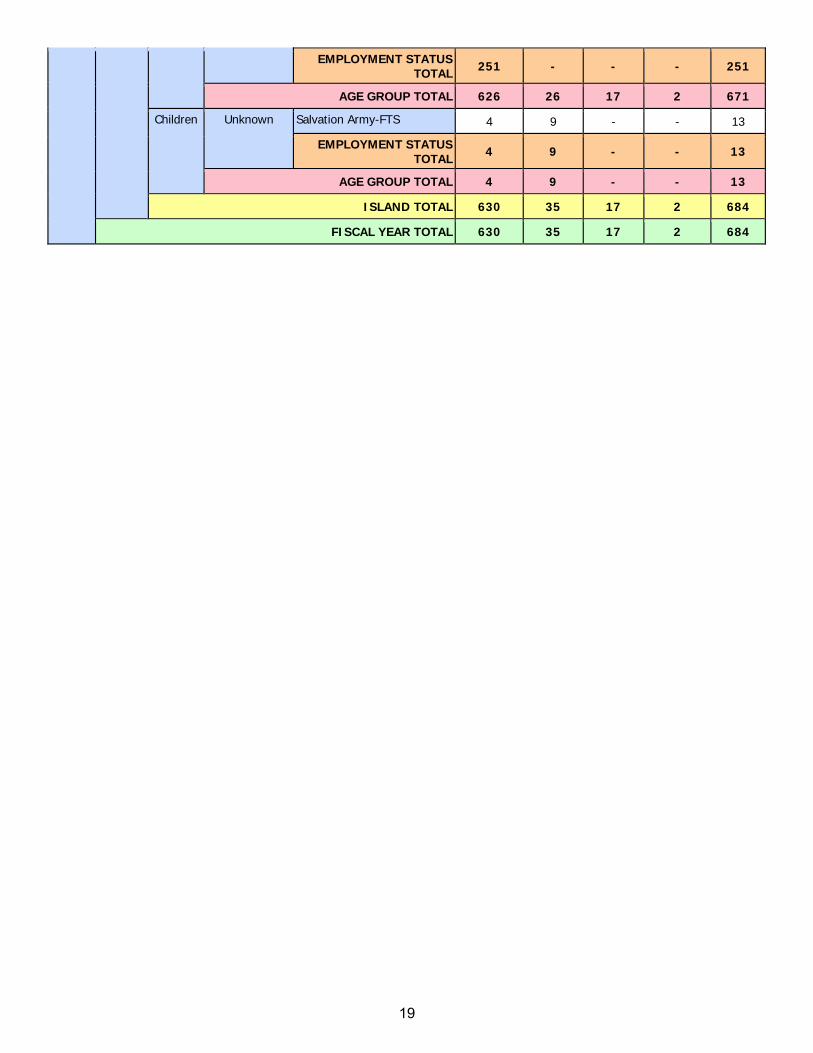
EMPLOYMENT STATUS TOTAL 251 - - - 251
AGE GROUP TOTAL 626 26 17 2 671
Children Unknown Salvation Army-FTS 4 9 - - 13
EMPLOYMENT STATUS TOTAL 4 9 - - 13
AGE GROUP TOTAL 4 9 - - 13
ISLAND TOTAL 630 35 17 2 684
FISCAL YEAR TOTAL 630 35 17 2 684
19
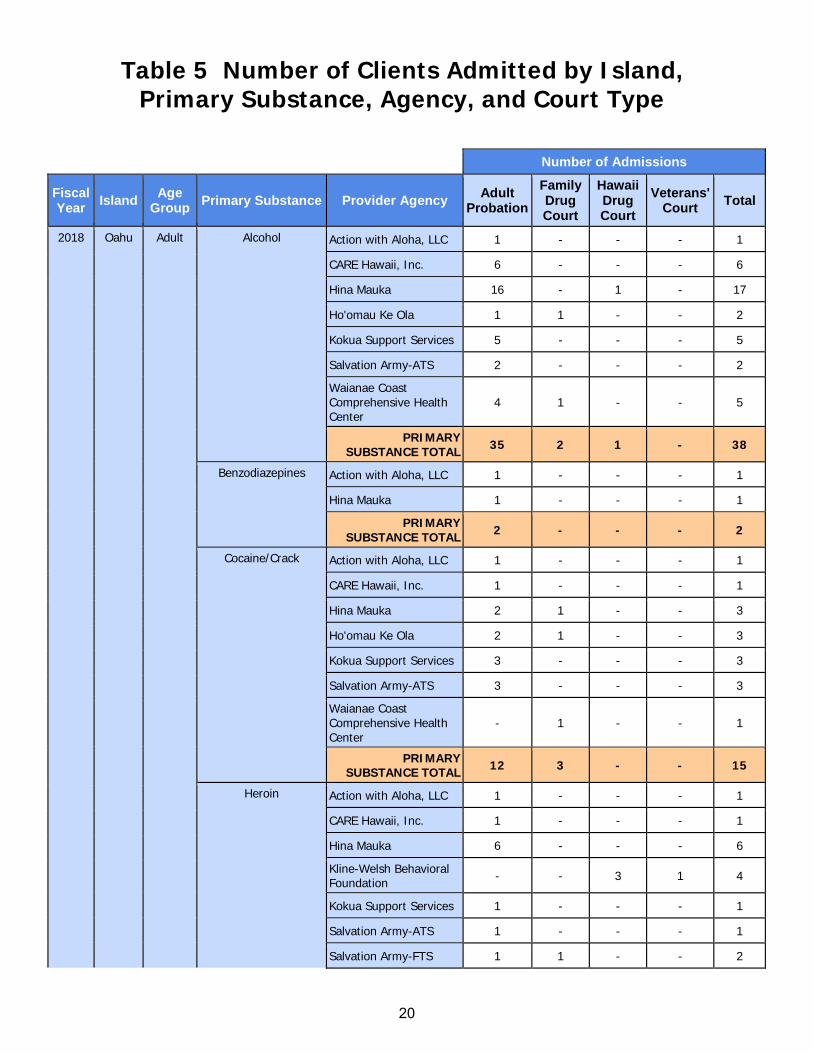
Table 5 Number of Clients Admitted by Island, Primary Substance, Agency, and Court Type
Number of Admissions
Fiscal Year Island Age
Group Primary Substance Provider Agency Adult Probation
Family Drug Court
Hawaii Drug Court
Veterans' Court Total
2018 Oahu Adult Alcohol Action with Aloha, LLC 1 - - - 1
CARE Hawaii, Inc. 6 - - - 6
Hina Mauka 16 - 1 - 17
Ho'omau Ke Ola 1 1 - - 2
Kokua Support Services 5 - - - 5
Salvation Army-ATS 2 - - - 2
Waianae Coast Comprehensive Health Center
4 1 - - 5
PRIMARY SUBSTANCE TOTAL 35 2 1 - 38
Benzodiazepines Action with Aloha, LLC 1 - - - 1
Hina Mauka 1 - - - 1
PRIMARY SUBSTANCE TOTAL 2 - - - 2
Cocaine/Crack Action with Aloha, LLC 1 - - - 1
CARE Hawaii, Inc. 1 - - - 1
Hina Mauka 2 1 - - 3
Ho'omau Ke Ola 2 1 - - 3
Kokua Support Services 3 - - - 3
Salvation Army-ATS 3 - - - 3
Waianae Coast Comprehensive Health Center
- 1 - - 1
PRIMARY SUBSTANCE TOTAL 12 3 - - 15
Heroin Action with Aloha, LLC 1 - - - 1
CARE Hawaii, Inc. 1 - - - 1
Hina Mauka 6 - - - 6
Kline-Welsh Behavioral Foundation - - 3 1 4
Kokua Support Services 1 - - - 1
Salvation Army-ATS 1 - - - 1
Salvation Army-FTS 1 1 - - 2
20
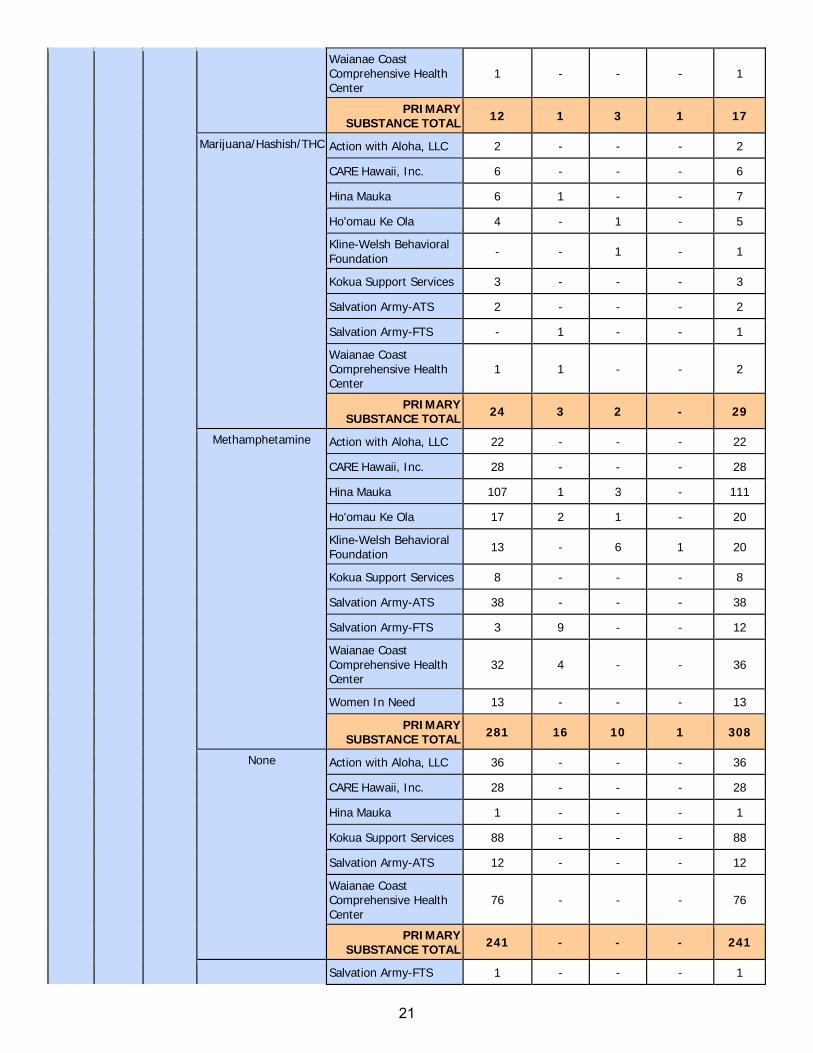
Waianae Coast Comprehensive Health Center
1 - - - 1
PRIMARY SUBSTANCE TOTAL 12 1 3 1 17
Marijuana/Hashish/THC Action with Aloha, LLC 2 - - - 2
CARE Hawaii, Inc. 6 - - - 6
Hina Mauka 6 1 - - 7
Ho'omau Ke Ola 4 - 1 - 5
Kline-Welsh Behavioral Foundation - - 1 - 1
Kokua Support Services 3 - - - 3
Salvation Army-ATS 2 - - - 2
Salvation Army-FTS - 1 - - 1
Waianae Coast Comprehensive Health Center
1 1 - - 2
PRIMARY SUBSTANCE TOTAL 24 3 2 - 29
Methamphetamine Action with Aloha, LLC 22 - - - 22
CARE Hawaii, Inc. 28 - - - 28
Hina Mauka 107 1 3 - 111
Ho'omau Ke Ola 17 2 1 - 20
Kline-Welsh Behavioral Foundation 13 - 6 1 20
Kokua Support Services 8 - - - 8
Salvation Army-ATS 38 - - - 38
Salvation Army-FTS 3 9 - - 12
Waianae Coast Comprehensive Health Center
32 4 - - 36
Women In Need 13 - - - 13
PRIMARY SUBSTANCE TOTAL 281 16 10 1 308
None Action with Aloha, LLC 36 - - - 36
CARE Hawaii, Inc. 28 - - - 28
Hina Mauka 1 - - - 1
Kokua Support Services 88 - - - 88
Salvation Army-ATS 12 - - - 12
Waianae Coast Comprehensive Health Center
76 - - - 76
PRIMARY SUBSTANCE TOTAL 241 - - - 241
Salvation Army-FTS 1 - - - 1
21
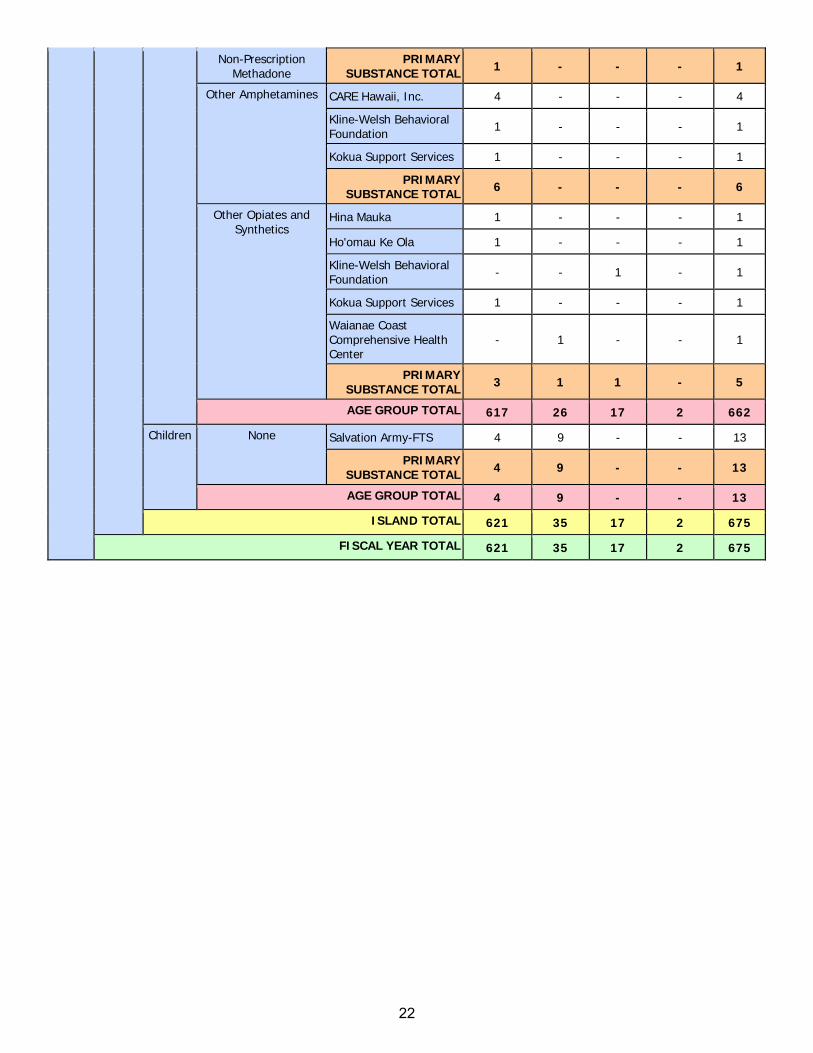
Non-Prescription Methadone
PRIMARY SUBSTANCE TOTAL 1 - - - 1
Other Amphetamines CARE Hawaii, Inc. 4 - - - 4
Kline-Welsh Behavioral Foundation 1 - - - 1
Kokua Support Services 1 - - - 1
PRIMARY SUBSTANCE TOTAL 6 - - - 6
Other Opiates and Synthetics
Hina Mauka 1 - - - 1
Ho'omau Ke Ola 1 - - - 1
Kline-Welsh Behavioral Foundation - - 1 - 1
Kokua Support Services 1 - - - 1
Waianae Coast Comprehensive Health Center
- 1 - - 1
PRIMARY SUBSTANCE TOTAL 3 1 1 - 5
AGE GROUP TOTAL 617 26 17 2 662
Children None Salvation Army-FTS 4 9 - - 13
PRIMARY SUBSTANCE TOTAL 4 9 - - 13
AGE GROUP TOTAL 4 9 - - 13
ISLAND TOTAL 621 35 17 2 675
FISCAL YEAR TOTAL 621 35 17 2 675
22
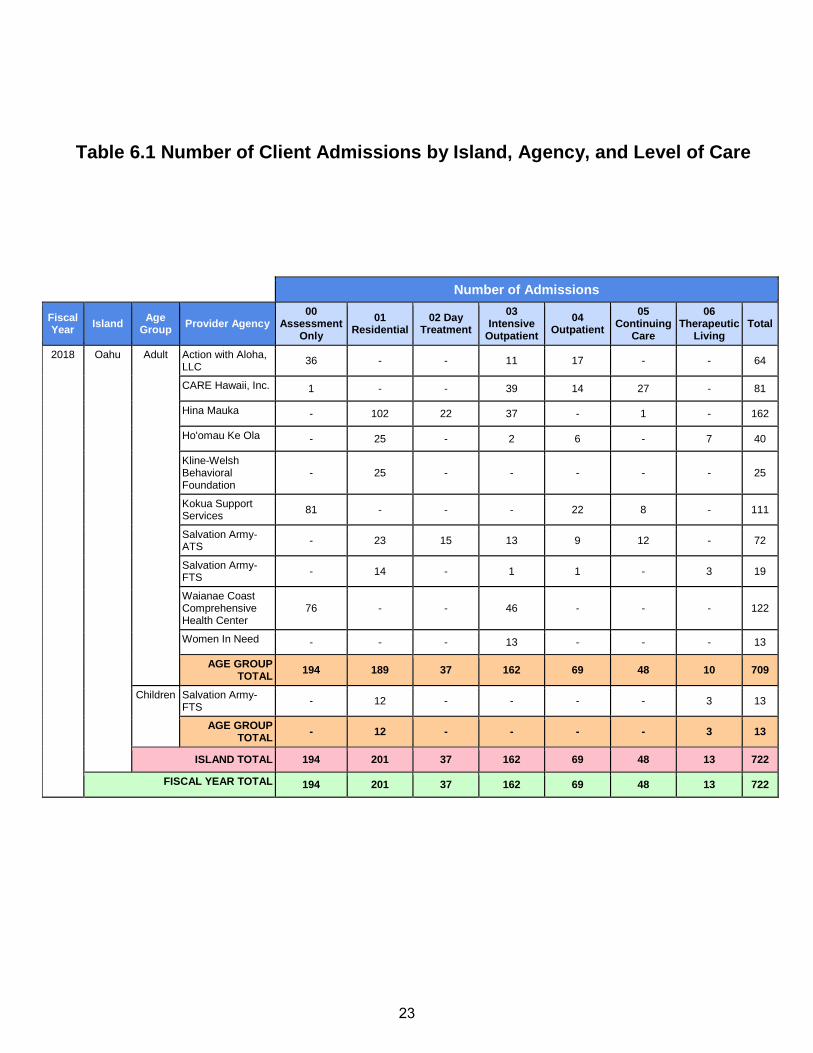
Table 6.1 Number of Client Admissions by Island, Agency, and Level of Care
Number of Admissions
Fiscal Year Island Age
Group Provider Agency 00
Assessment Only
01 Residential
02 Day Treatment
03 Intensive
Outpatient 04
Outpatient 05
Continuing Care
06 Therapeutic
Living Total
2018 Oahu Adult Action with Aloha, LLC 36 - - 11 17 - - 64
CARE Hawaii, Inc. 1 - - 39 14 27 - 81
Hina Mauka - 102 22 37 - 1 - 162
Ho'omau Ke Ola - 25 - 2 6 - 7 40
Kline-Welsh Behavioral Foundation
- 25 - - - - - 25
Kokua Support Services 81 - - - 22 8 - 111
Salvation Army-ATS - 23 15 13 9 12 - 72
Salvation Army-FTS - 14 - 1 1 - 3 19
Waianae Coast Comprehensive Health Center
76 - - 46 - - - 122
Women In Need - - - 13 - - - 13
AGE GROUP TOTAL 194 189 37 162 69 48 10 709
Children Salvation Army-FTS - 12 - - - - 3 13
AGE GROUP TOTAL - 12 - - - - 3 13
ISLAND TOTAL 194 201 37 162 69 48 13 722
FISCAL YEAR TOTAL 194 201 37 162 69 48 13 722
23
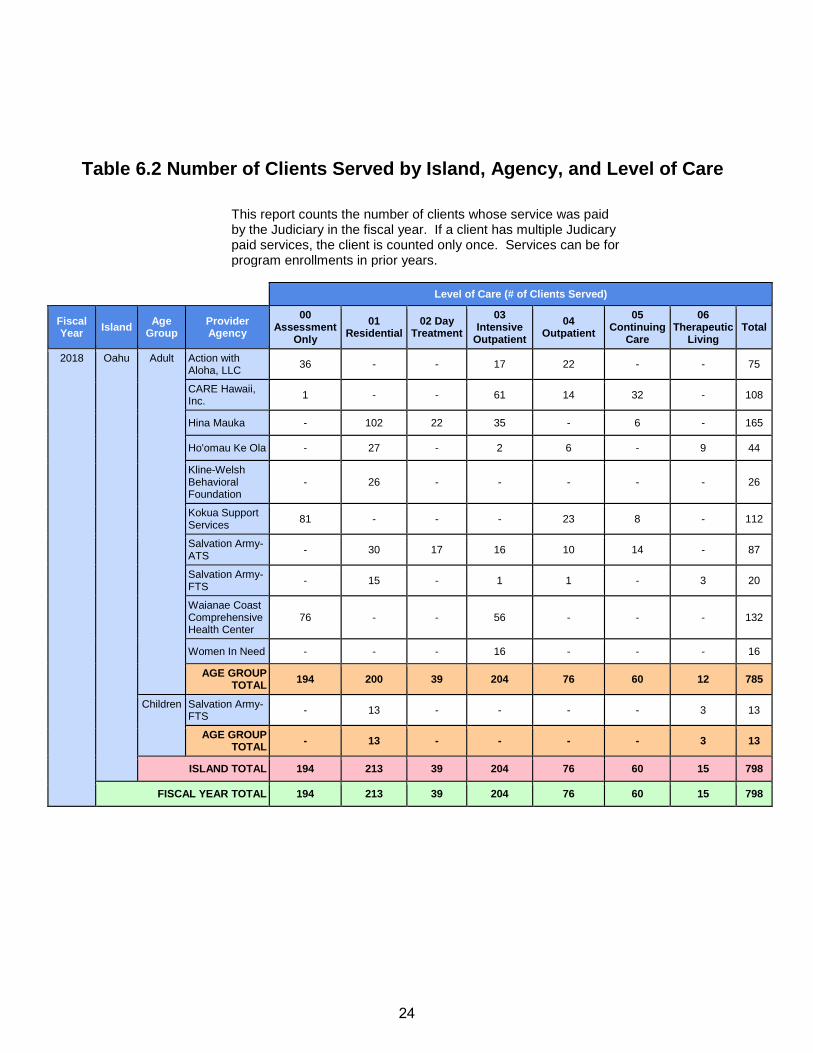
Table 6.2 Number of Clients Served by Island, Agency, and Level of Care
This report counts the number of clients whose service was paid by the Judiciary in the fiscal year. If a client has multiple Judicary paid services, the client is counted only once. Services can be for program enrollments in prior years.
Level of Care (# of Clients Served)
Fiscal Year Island Age
Group Provider Agency
00 Assessment
Only
01 Residential
02 Day Treatment
03 Intensive
Outpatient 04
Outpatient 05
Continuing Care
06 Therapeutic
Living Total
2018 Oahu Adult Action with Aloha, LLC 36 - - 17 22 - - 75
CARE Hawaii, Inc. 1 - - 61 14 32 - 108
Hina Mauka - 102 22 35 - 6 - 165
Ho'omau Ke Ola - 27 - 2 6 - 9 44
Kline-Welsh Behavioral Foundation
- 26 - - - - - 26
Kokua Support Services 81 - - - 23 8 - 112
Salvation Army-ATS - 30 17 16 10 14 - 87
Salvation Army-FTS - 15 - 1 1 - 3 20
Waianae Coast Comprehensive Health Center
76 - - 56 - - - 132
Women In Need - - - 16 - - - 16
AGE GROUP TOTAL 194 200 39 204 76 60 12 785
Children Salvation Army-FTS - 13 - - - - 3 13
AGE GROUP TOTAL - 13 - - - - 3 13
ISLAND TOTAL 194 213 39 204 76 60 15 798
FISCAL YEAR TOTAL 194 213 39 204 76 60 15 798
24
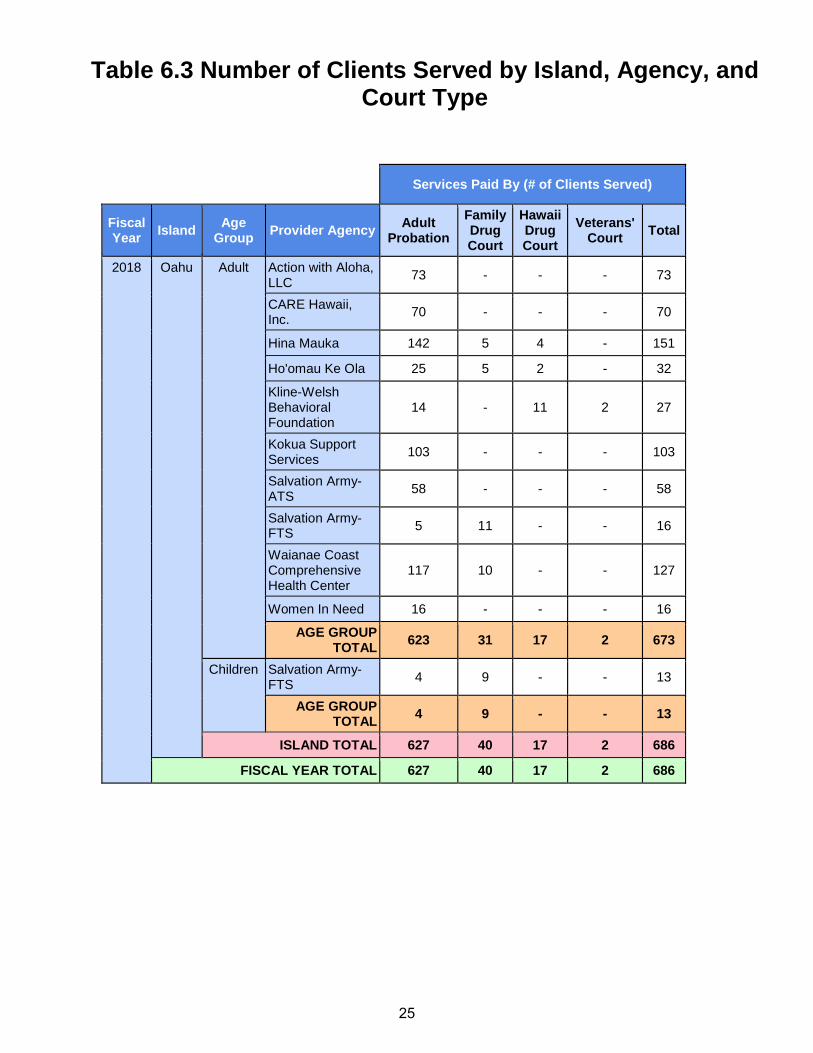
Table 6.3 Number of Clients Served by Island, Agency, and Court Type
Services Paid By (# of Clients Served)
Fiscal Year Island Age
Group Provider Agency Adult Probation
Family Drug Court
Hawaii Drug Court
Veterans' Court Total
2018 Oahu Adult Action with Aloha, LLC 73 - - - 73
CARE Hawaii, Inc. 70 - - - 70
Hina Mauka 142 5 4 - 151
Ho'omau Ke Ola 25 5 2 - 32
Kline-Welsh Behavioral Foundation
14 - 11 2 27
Kokua Support Services 103 - - - 103
Salvation Army-ATS 58 - - - 58
Salvation Army-FTS 5 11 - - 16
Waianae Coast Comprehensive Health Center
117 10 - - 127
Women In Need 16 - - - 16
AGE GROUP TOTAL 623 31 17 2 673
Children Salvation Army-FTS 4 9 - - 13
AGE GROUP TOTAL 4 9 - - 13
ISLAND TOTAL 627 40 17 2 686
FISCAL YEAR TOTAL 627 40 17 2 686
25
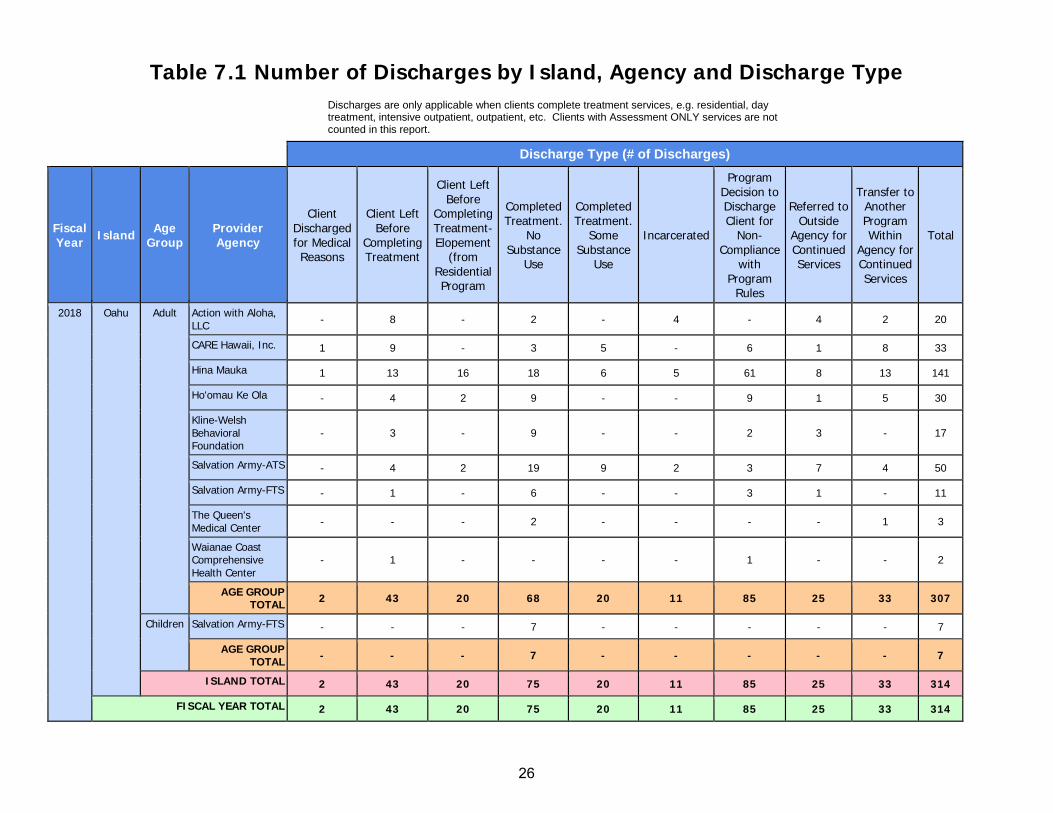
Table 7.1 Number of Discharges by Island, Agency and Discharge Type
Discharges are only applicable when clients complete treatment services, e.g. residential, day treatment, intensive outpatient, outpatient, etc. Clients with Assessment ONLY services are not counted in this report.
Discharge Type (# of Discharges)
Fiscal Year Island Age
Group Provider Agency
Client Discharged for Medical Reasons
Client Left Before
Completing Treatment
Client Left Before
Completing Treatment-Elopement
(from Residential Program
Completed Treatment.
No Substance
Use
Completed Treatment.
Some Substance
Use
Incarcerated
Program Decision to Discharge Client for
Non-Compliance
with Program
Rules
Referred to Outside
Agency for Continued Services
Transfer to Another Program Within
Agency for Continued Services
Total
2018 Oahu Adult Action with Aloha, LLC - 8 - 2 - 4 - 4 2 20
CARE Hawaii, Inc. 1 9 - 3 5 - 6 1 8 33
Hina Mauka 1 13 16 18 6 5 61 8 13 141
Ho'omau Ke Ola - 4 2 9 - - 9 1 5 30
Kline-Welsh Behavioral Foundation
- 3 - 9 - - 2 3 - 17
Salvation Army-ATS - 4 2 19 9 2 3 7 4 50
Salvation Army-FTS - 1 - 6 - - 3 1 - 11
The Queen's Medical Center - - - 2 - - - - 1 3
Waianae Coast Comprehensive Health Center
- 1 - - - - 1 - - 2
AGE GROUP TOTAL 2 43 20 68 20 11 85 25 33 307
Children Salvation Army-FTS - - - 7 - - - - - 7
AGE GROUP TOTAL - - - 7 - - - - - 7
ISLAND TOTAL 2 43 20 75 20 11 85 25 33 314
FISCAL YEAR TOTAL 2 43 20 75 20 11 85 25 33 314
26
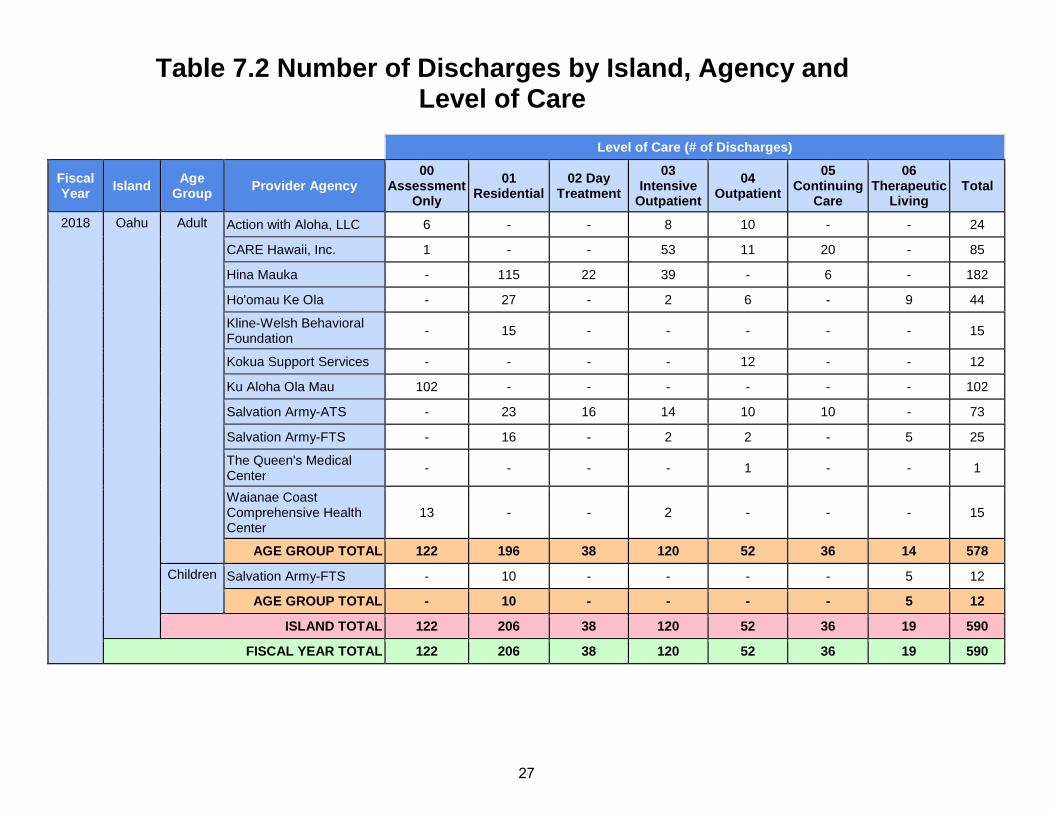
Table 7.2 Number of Discharges by Island, Agency and Level of Care
Level of Care (# of Discharges)
Fiscal Year Island Age
Group Provider Agency 00
Assessment Only
01 Residential
02 Day Treatment
03 Intensive
Outpatient 04
Outpatient 05
Continuing Care
06 Therapeutic
Living Total
2018 Oahu Adult Action with Aloha, LLC 6 - - 8 10 - - 24
CARE Hawaii, Inc. 1 - - 53 11 20 - 85
Hina Mauka - 115 22 39 - 6 - 182
Ho'omau Ke Ola - 27 - 2 6 - 9 44
Kline-Welsh Behavioral Foundation - 15 - - - - - 15
Kokua Support Services - - - - 12 - - 12
Ku Aloha Ola Mau 102 - - - - - - 102
Salvation Army-ATS - 23 16 14 10 10 - 73
Salvation Army-FTS - 16 - 2 2 - 5 25
The Queen's Medical Center - - - - 1 - - 1
Waianae Coast Comprehensive Health Center
13 - - 2 - - - 15
AGE GROUP TOTAL 122 196 38 120 52 36 14 578
Children Salvation Army-FTS - 10 - - - - 5 12
AGE GROUP TOTAL - 10 - - - - 5 12
ISLAND TOTAL 122 206 38 120 52 36 19 590
FISCAL YEAR TOTAL 122 206 38 120 52 36 19 590
27
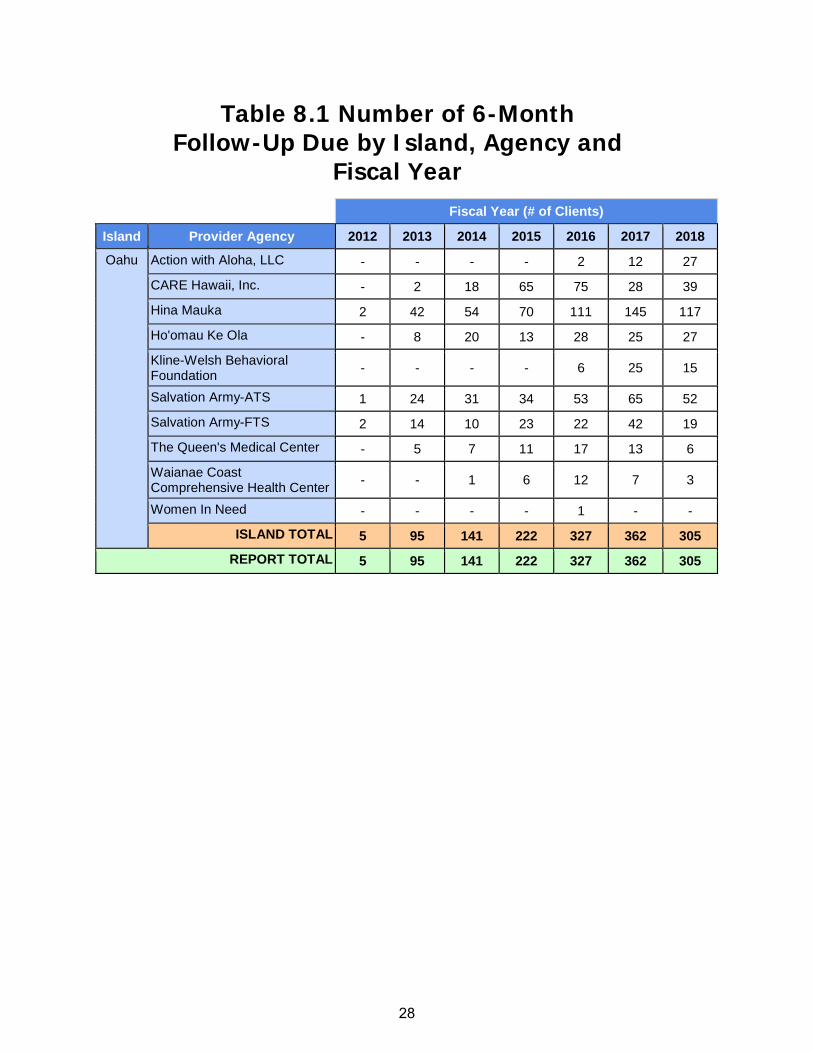
Table 8.1 Number of 6-Month Follow-Up Due by Island, Agency and
Fiscal Year
Fiscal Year (# of Clients)
Island Provider Agency 2012 2013 2014 2015 2016 2017 2018
Oahu Action with Aloha, LLC - - - - 2 12 27
CARE Hawaii, Inc. - 2 18 65 75 28 39
Hina Mauka 2 42 54 70 111 145 117
Ho'omau Ke Ola - 8 20 13 28 25 27
Kline-Welsh Behavioral Foundation - - - - 6 25 15
Salvation Army-ATS 1 24 31 34 53 65 52
Salvation Army-FTS 2 14 10 23 22 42 19
The Queen's Medical Center - 5 7 11 17 13 6
Waianae Coast Comprehensive Health Center - - 1 6 12 7 3
Women In Need - - - - 1 - -
ISLAND TOTAL 5 95 141 222 327 362 305
REPORT TOTAL 5 95 141 222 327 362 305
28
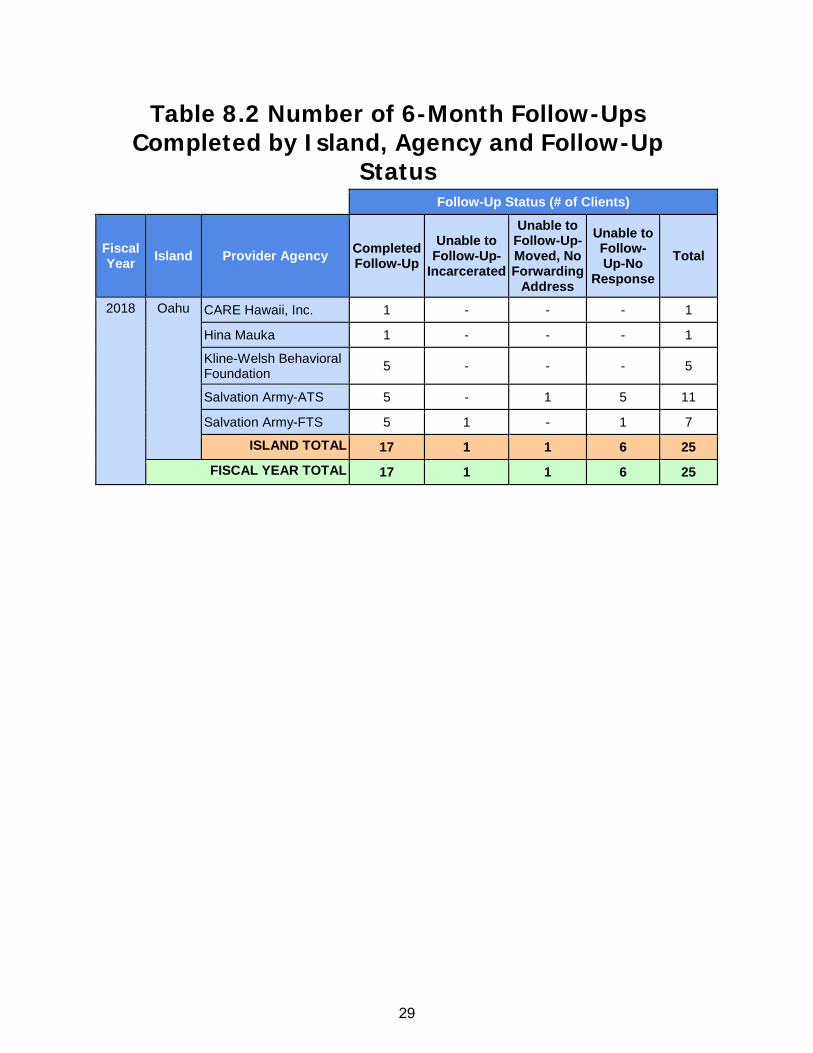
Table 8.2 Number of 6-Month Follow-Ups Completed by Island, Agency and Follow-Up
Status
Follow-Up Status (# of Clients)
Fiscal Year Island Provider Agency Completed
Follow-Up
Unable to Follow-Up-
Incarcerated
Unable to Follow-Up-Moved, No Forwarding
Address
Unable to Follow-Up-No
Response
Total
2018 Oahu CARE Hawaii, Inc. 1 - - - 1
Hina Mauka 1 - - - 1
Kline-Welsh Behavioral Foundation 5 - - - 5
Salvation Army-ATS 5 - 1 5 11
Salvation Army-FTS 5 1 - 1 7
ISLAND TOTAL 17 1 1 6 25
FISCAL YEAR TOTAL 17 1 1 6 25
29


