106
Annual Report and Single Audit Reports for the year ended June 30, 2016

wright.edu/controller
3640 Colonel Glenn Hwy.
Dayton, OH 45435
Annual Reportand
Single Audit Reports
for the year ended
June 30, 2016
Single Audit AR 18436 v10.indd 3-4 12/22/16 1:46 PM

WRIGHT STATE UNIVERSITY ANNUAL REPORT AND SINGLE AUDIT REPORTS FOR FEDERAL AWARDSTABLE OF CONTENTS JUNE 30, 2016
Page (s)
Part I - Financial Information
Independent Auditors Report 3-5
Management's Discussion and Analysis 7-21
Financial Statements:Financial Statements 23-34Notes to Financial Statements 35-79
Required Supplementary Information:Schedule of the Wright State University Proportionate Share 82
OPERS Net Pension Liability and Contributions
Schedule of the Wright State University Proportionate Share 83STRS Net Pension Liability and Contributions
Part II - OMB 2 CFR 200 Supplemental Financial Reports
Schedule of Expenditures of Federal Awards 85-96Notes to the Schedule of Expenditures of Federal Awards 97
Independent Auditors Report on Internal Control over Financial Reporting and on 99-100Compliance and Other Matters Based on an Audit of Financial StatementsPerformed in Accordance with Government Auditing Standards
Independent Auditors Report on Compliance for Each Major Federal Program; 101-102Report on Internal Control over Compliance
Schedule of Findings and Questioned Costs 103
1

This page intentionally left blank
2

Crowe Horwath LLP Independent Member Crowe Horwath International
INDEPENDENT AUDITOR'S REPORT
To the Board of Trustees of Wright State University Dayton, Ohio
Report on the Financial Statements
We have audited the accompanying financial statements of the business-type activities and aggregate discretely presented component units of Wright State University (the University), a component unit of the State of Ohio, as of and for the years ended June 30, 2016 and 2015, and the related notes to the financial statements, which collectively comprise the University’s basic financial statements as listed in the table of contents.
Management’s Responsibility for the Financial Statements
Management is responsible for the preparation and fair presentation of these financial statements in accordance with accounting principles generally accepted in the United States of America; this includes the design, implementation, and maintenance of internal control relevant to the preparation and fair presentation of financial statements that are free from material misstatement, whether due to fraud or error.
Auditor’s Responsibility
Our responsibility is to express opinions on these financial statements based on our audits. We conducted our audits in accordance with auditing standards generally accepted in the United States of America and the standards applicable to financial audits contained in Government Auditing Standards, issued by the Comptroller General of the United States. Those standards require that we plan and perform the audit to obtain reasonable assurance about whether the financial statements are free from material misstatement.
An audit involves performing procedures to obtain audit evidence about the amounts and disclosures in the financial statements. The procedures selected depend on the auditor’s judgment, including the assessment of the risks of material misstatement of the financial statements, whether due to fraud or error. In making those risk assessments, the auditor considers internal control relevant to the entity’s preparation and fair presentation of the financial statements in order to design audit procedures that are appropriate in the circumstances, but not for the purpose of expressing an opinion on the effectiveness of the entity’s internal control. Accordingly, we express no such opinion. An audit also includes evaluating the appropriateness of accounting policies used and the reasonableness of significant accounting estimates made by management, as well as evaluating the overall presentation of the financial statements.
We believe that the audit evidence we have obtained is sufficient and appropriate to provide a basis for our audit opinions.
3
Opinions
In our opinion, the financial statements referred to above present fairly, in all material respects, the respective financial position of the business-type activities and the aggregate discretely presented component units of the University, as of June 30, 2016 and 2015, and the respective changes in its financial position and, where applicable, cash flows thereof for the years then ended in accordance with accounting principles generally accepted in the United States of America.
Emphasis of matter
As disclosed in Note 1, during 2016 the University elected to change its reporting to include Wright State Applied Research Corporation as a discretely presented component unit and also changed the format of presentation for the aggregate discretely presented component units in the financial statements. Both changes were made retroactively to July 1, 2015. Our opinion is not modified with respect to this matter.
Other Matters
Required Supplementary Information
Accounting principles generally accepted in the United States of America require that the Management’s Discussion and Analysis, the Schedule of the Wright State University Proportionate Share of the OPERS Net Pension Liability and Contributions, and the Schedule of the Wright State University Proportionate Share of the STRS Net Pension Liability and Contributions as listed in the table of contents be presented to supplement the basic financial statements. Such information, although not a part of the basic financial statements, is required by Governmental Accounting Standards Board who considers it to be an essential part of financial reporting for placing the basic financial statements in an appropriate operational, economic, or historical context. We have applied certain limited procedures to the required supplementary information in accordance with auditing standards generally accepted in the United States of America, which consisted of inquiries of management about the methods of preparing the information and comparing the information for consistency with management’s responses to our inquiries, the basic financial statements, and other knowledge we obtained during our audit of the basic financial statements. We do not express an opinion or provide any assurance on the information because the limited procedures do not provide us with sufficient evidence to express an opinion or provide any assurance.
Supplementary Information
Our audit was conducted for the purpose of forming opinions on the financial statements that collectively comprise the University’s basic financial statements. The accompanying schedule of expenditures of federal awards as required by Title 2 U.S. Code of Federal Regulations (CFR) Part 200, Uniform Administrative Requirements, Cost Principles, and Audit Requirements for Federal Awards is presented for purposes of additional analysis and is not a required part of the basic financial statements.
The schedule of expenditures of federal awards is the responsibility of management and was derived from and relates directly to the underlying accounting and other records used to prepare the financial statements. Such information has been subjected to the auditing procedures applied in the audit of the financial statements and certain additional procedures, including comparing and reconciling such information directly to the underlying accounting and other records used to prepare the basic financial statements or to the basic financial statements themselves, and other additional procedures in accordance with auditing standards generally accepted in the United States of America. In our opinion, the schedule of expenditures of federal awards is fairly stated, in all material respects, in relation to the basic financial statements as a whole.
4

Other Reporting Required by Government Auditing Standards
In accordance with Government Auditing Standards, we have also issued our report dated the same date of this report on our consideration of the University’s internal control over financial reporting and on our tests of its compliance with certain provisions of laws, regulations, contracts, and grant agreements and other matters. The purpose of that report is to describe the scope of our testing of internal control over financial reporting and compliance and the results of that testing, and not to provide an opinion on internal control over financial reporting or on compliance. That report is an integral part of an audit performed in accordance with Government Auditing Standards in considering the University’s internal control over financial reporting and compliance.
Crowe Horwath LLP
Columbus, Ohio October 14, 2016
5

This page intentionally left blank
6
Wright State University
Management’s Discussion and Analysis Fiscal Year Ended June 30, 2016
Wright State University’s Management Discussion and Analysis (MD&A) presents an overview of its financial condition and assists the reader in focusing on significant financial issues for the year ended June 30, 2016, with selected comparative information for the years ended June 30, 2015 and 2014. The discussion has been prepared by management and should be read in conjunction with the accompanying financial statements and footnotes. The financial statements, footnotes, and this discussion are the responsibility of management.
Financial and Other University Highlights
• The 2015 – 2016 was a year of intense preparation for the university’s review by the Higher LearningCommission (HLC) for reaffirmation of accreditation. Wright State University submitted its assuranceargument to the HLC in November 2015. The document was the collaborative effort of numerousfaculty, staff, and student representatives and was cited as “exemplary” by the HLC review team. TheUniversity also received commendation for its strategic planning and self-study processes. The reviewculminated in a campus visit by a peer review team in March 2016. The HLC final report for affirmationof reaccreditation was received in July 2016. The reaccreditation is effective for 10 years beginningwith the 2016-2017 academic year. Wright State has been continuously accredited since 1968.
• Wright State University made significant progress on its capital plan, bringing several major projects tonear or full completion. October 2015 brought the opening ceremony for the $17 million, 67,000 squarefoot Student Success Center building which co-locates academic support services, study centers, andstate-of-the art teaching and learning environments. The Raj Soin College of Business opened itsstudent-managed Rey-Rey Café this year. Tom Hanks was on campus in May 2016 to dedicate theTom Hanks Center for Motion Pictures. The second phase of renovations and the new addition to theCreative Arts Center were opened to ArtsGala patrons in April 2016 with full completion expected forfall 2016.
• Wright State continues efforts to increase student academic success. In addition to the new StudentSuccess Center, the University actively engages with area community colleges such as Sinclair andClark State to develop programs for a path to a bachelor’s degree for all students. These efforts alsoincluded a 30% increase in College Credit Plus enrollments in fall 2015. This program providesstudents in grades 7-12 who qualify to take college level courses for which they earn high school andcollege credit upon successful completion of the course. Along these lines, the University was awardeda $0.7 million grant from the State of Ohio (the State) to partner with Clark State Community Collegeto credential local high school teachers to teach College Credit Plus courses.
• Wright State continues to be named in various national ratings for its achievement in academic andstudent success. Several Wright State online graduate programs were ranked among the best in 2016by US News and World Report. The College of Education and Human Services’ online Master ofEducation program was ranked 17th of all responding schools, landing in the top 10% of programs. TheIndustrial and Human Factors Engineering program offered through the College of Engineering andComputer Science landed at 41st out of responding programs. Raj Soin College of Business’ Masterof Information Systems and Master in Logistics and Supply Chain Management was ranked 59th of theparticipating programs.
• The American Association for Access, Equity and Diversity recognized the University with its EdwardM. Kennedy Community Service Award for the university’s effort to make campus accessible andinclusive to all. The Association called Wright State a national leader of services for students withdisabilities and one of the top five disability-friendly universities in the United States.
7

• In April 2016, Wright State University’s Model United Nations team continued its remarkable streak atthe National Model United Nations Conference, receiving recognition for the 37th year in a row. Theteam returned from the national conference in New York City with a Distinguished Delegation award.Competing against approximately 150 universities from around the world, Wright State was one ofapproximately 30 colleges to receive this level of recognition. In addition, the team won fiveOutstanding Position Paper awards.
• While undergraduate tuition remained the same in 2016 as in 2015, non-resident fees as well as tuitionfor graduate level and professional schools increased 2.3% for 2016. This compares to a 2.2% tuitionincrease for all degree levels at both campuses and for professional schools in 2015. The Universitycontinues to pursue revenue enhancing efforts and expense optimization initiatives in order to mitigatethe necessary increases in tuition costs. Wright State remains the fourth lowest in-state undergraduatetuition rate among Ohio’s thirteen four-year public institutions.
• Total state appropriations increased $3.6 million from 2015 to 2016 in addition to a $1.1 million increasefrom 2014 to 2015. The 2016 and 2015 increases were primarily a result of a larger pool of state dollarsawarded to higher education as well as the university’s continued success in driving course and degreecompletions in alignment with the university’s mission and the priorities of the State’s performancefunding model.
• Total net position decreased $37.4 million in 2016 largely as a result of increased salaries and benefitsas well as student financial aid and scholarships aimed at increasing enrollment, retention, studentsuccess and programming. Net position was also impacted by negative variances in budgeted to actualrevenues from state appropriations, tuition revenue and investment income. Net investment in capitalincreased $12.1 million as a result of the progress in campus capital projects. Unrestricted net positionfell by $48.8 million primarily as a result of the use of unrestricted resources to fund some of the capitalprojects as well as the revenue shortfalls and expense overages mentioned previously. Net positiondecreased $268.1 million in 2015. The implementation of GASB 68 was responsible for a restatementwhich reduced unrestricted net position by $246.1 million. Further reductions were caused by theuniversity’s use of reserves to fund capital projects and investments in targeted enrollment strategies.
• Fall 2015 headcount was 18,059 as opposed to 17,779 in fall 2014. Embedded in this 1.6% increasewas an increase in international students and graduate level students. Increased credit hours andgraduate and professional level fees led to a $2.2 million (1.2%) increase in gross student tuition. Theincrease in gross tuition was offset by a $4.4 million increase in scholarships, resulting in an overall$2.2 million decrease in net tuition and fees revenue. Fall 2014 headcount represented an increase of1% from fall 2013 headcount. This combined with the slight tuition and fees rate increase resulted in a$6.4 million (4.4%) increase in net student tuition and fees revenue in fiscal year 2015.
• The Wright State University Foundation continued its $150 million fundraising campaign knownas Rise. Shine. The Campaign for Wright State University. The campaign, which was launched inOctober 2014, has been vastly successful reaching large numbers of alumni, friends, corporations andfoundations. As of June 30, 2016, the campaign has generated $159 million. The University is honoredto have Tom Hanks, Hollywood icon, and Amanda Wright Lane, great grandniece of universitynamesakes Wilbur and Orville Wright, co-chair the campaign.
• During 2016, the University implemented GASB Statement No. 72, Fair Value Measurement andApplication issued in February 2015. This Statement addresses accounting and financial reportingissues related to fair value measurements. This statement provides guidance for determining a fairvalue measurement for financial reporting purposes. It also provides guidance for applying fair valueto certain investments and disclosures related to all fair value measurements. Please refer to thediscussion of New Accounting Standards Adopted in Note 1 of the financial statements for furtherdetails.
8

Using the Annual Report
This annual report includes three financial statements: the Statement of Net Position, the Statement of Revenues, Expenses and Changes in Net Position, and the Statement of Cash Flows. These financial statements are prepared in accordance with GASB Statement No. 35, Basic Financial Statements-and Management’s Discussion and Analysis-For Public Colleges and Universities as amended by GASB Statement No. 63, Financial Reporting of Deferred Outflows of Resources, Deferred Inflows of Resources, and Net Position; GASB Statement No. 68, Accounting and Financial Reporting for Pensions – An Amendment of GASB Statement No. 27; and GASB Statement No. 71, Pension Transition for Contributions Made Subsequent to the Measurement Date - An Amendment of GASB Statement No. 68. These financial statements focus on the financial condition of the University, the results of operations, and cash flows of the University as a whole.
Under the provisions of GASB Statement No. 61, The Financial Reporting Entity: Omnibus, the Wright State University Foundation (the Foundation) and the Wright State Applied Research Corporation (WSARC) have both been determined to be component units of the University. Accordingly, the Foundation and WSARC are discretely presented in the university’s financial statements. Management’s Discussion and Analysis and information included in this discussion and analysis relate only to Wright State University and not to the Wright State University Foundation or the Wright State Applied Research Corporation unless specifically noted.
The three financial statements should help the reader of the annual report understand the university’s overall financial condition and how it has changed as a result of the current year’s financial activities. These financial statements present similar information to that disclosed in private sector (i.e. corporate) financial statements. The financial statements will also assist the reader in evaluating the ability of the University to meet its financial obligations. The Statement of Cash Flows presents information related to both cash inflows and cash outflows and is further categorized by operating, noncapital financing, capital and related financing, and investing activities.
Comparison of the university’s financial statements between fiscal years 2016, 2015, and 2014 is complicated by two circumstances: the adoption of GASB No. 68 and the transition of the fiscal agency of OhioLINK.
During 2015, the University adopted GASB Statement No. 68, Accounting and Financial Reporting for Pensions – An Amendment of GASB Statement No. 27 and GASB Statement No. 71, Pension Transition for Contributions Made Subsequent to the Measurement Date - An Amendment of GASB Statement No. 68 which significantly revise accounting for pension costs and liabilities. For reasons discussed below, many end users of this financial statement will gain a clearer understanding of the university’s actual financial condition by adding deferred inflows related to pension and the net pension liability to the reported net position and subtracting deferred outflows related to pension from the reported net position.
Prior to the adoption of GASB No. 68, the University followed GASB No. 27, Accounting for Pensions by State and Local Governmental Employers when accounting for pension costs. GASB No. 27 focused on a funding approach limiting pension costs to contributions annually required by law, which may or may not be sufficient to fully fund each plan’s net pension liability. GASB No. 68 takes an earnings approach to pension accounting; however, the nature of Ohio’s statewide pension systems and state law governing those systems requires additional explanation in order to properly understand the information presented in these statements.
Under the new standards required by GASB No. 68, the net pension liability equals the university’s proportionate share of each plan’s collective:
1. Present value of estimated future pension benefits attributable to active and inactive employees’past service,
2. Less plan assets available to pay these benefits.
9

In Statement No. 68, GASB notes pension obligations, whether funded or unfunded, are part of the “employment exchange” – that is, the employee is trading services in exchange for wages, benefits, and the promise of a future pension. GASB noted the unfunded portion of this pension promise is a present obligation of the government, part of a bargained-for benefit to the employee, and therefore it should be reported by the government as a liability since it received the benefit of the exchange. However, the University is not responsible for certain key factors affecting the balance of this liability. In Ohio, the employee shares the obligation of funding pension benefits with the employer. Both employer and employee contribution rates are capped by state statute. A change in these caps requires action of both Houses of the General Assembly and approval of the Governor. Benefit provisions are also determined by state statute. The employee enters the employment exchange with the knowledge that the employer’s promise is limited not by contract but by law and there is a specific, legal limit to its contribution to the pension system. In Ohio, no legal means exists to enforce the unfunded liability of the pension system to governmental employers. Because all parties enter the employment exchange with notice as to the law, state law mitigates the moral obligation of the public employer to the employee. The pension system is responsible for the administration of the plan.
Although most long-term liabilities have set repayment schedules, net pension liability has no repayment schedule. As explained above, items affecting net pension liability such as changes in pension benefits, contribution rates, and return on investments are outside the control of the University. In the event contributions, investment returns, and other changes are insufficient to meet required pension payments, state statute does not assign or identify the responsible party for the unfunded portion. Due to the unique nature of net pension liability, it is separately identified within the noncurrent liabilities section of the Statement of Net Position.
In accordance with GASB No. 68, the university’s statements - prepared on an accrual basis of accounting - include an annual pension expense for its proportionate share of each plan’s change in net pension liability not accounted for as deferred inflows/outflows. The University is also reporting a net pension liability and deferred inflows/outflows of resources related to pensions. The adoption of the statement has impacted the financial statements for fiscal years 2016 and 2015; however, adequate information was not available to restate prior fiscal years. Therefore the user is cautioned about drawing comparisons between fiscal years in areas of the statements impacted by GASB No. 68.
Comparison of the financial statements between fiscal years is also impacted by the transition of the fiscal agency of OhioLINK. For over two decades, Wright State University served as the fiscal agent for OhioLINK, a statewide library initiative of Ohio’s college and university libraries and the State of Ohio. In an effort to better streamline operations and improve overall efficiency, the State of Ohio consolidated OhioLINK into the Ohio Technology Consortium during 2014. The Ohio State University was then appointed the new fiscal agent for OhioLINK. Before the transition to The Ohio State University, all of OhioLINK’s assets, liabilities, revenues, and expenses had been included in the university’s financial statements. As a result of the transition, only a portion of OhioLINK’s revenues and expenses and none of the assets and liabilities were included in the university’s financial statements in 2014. However, none of OhioLINK’s revenues and expenses for fiscal years ended June 30, 2016 and 2015 are included in the university’s financial statements. The variances caused by this transition are explained throughout the analysis.
Statements of Net Position
The Statement of Net Position, which reports all assets, liabilities, deferred inflows and deferred outflows of the University, presents the financial position of the University as of June 30, 2016, with comparative information as of June 30, 2015. Our net position is simply the residual after subtracting liabilities and deferred inflows from the sum of assets and deferred outflows. The change in net position during the fiscal year is an indicator of the change in the overall financial condition of the University during the year.
10

A summary of the university’s assets, liabilities, and net position as of June 30 is as follows:
2016 2015 2014
Current assets $ 65,496 $ 94,459 $ 105,750Noncurrent assets: Capital assets, net 375,898 365,995 332,897 Other 53,232 80,246 131,735Deferred outflows of resources 50,233 19,322 443 Total assets and deferred outflows 544,859 560,022 570,825
Current liabilities 66,595 71,504 68,633Noncurrent liabilities 377,401 333,513 112,224Deferred inflows of resources 16,361 33,120 Total liabilities and deferred inflows 460,357 438,137 180,857
Net position: Net investment in capital 287,556 275,426 270,844 Restricted 16,821 17,573 17,350 Unrestricted (219,875) (171,114) 101,774 Total net position $ 84,502 $ 121,885 $ 389,968
(All dollar amounts in thousands)
The university’s total net position decreased $37.4 million in 2016. Net investment in capital increased $12.1 million related to the significant progress in the renovation and expansion of the Creative Arts Center made during 2016. While in prior years costs for this project have been primarily funded by proceeds from previous debt issuances, the funding in 2016 was primarily provided by internal resources and some state capital appropriations to supplement the overall funding. Unrestricted net position decreased $48.8 million in 2016 as a result of budget challenges and commitments made to students, faculty and staff mentioned previously. As a result of implementing GASB No. 68, the University restated net position at July 1, 2014, from $389,968,220 to $143,909,833. In addition to the decrease in net position produced by this restatement, the university’s net position decreased $22 million in 2015 primarily as a result of strategic investments in initiatives core to the mission and furthering the university’s competitive position in the region.
Total assets and deferred outflows decreased $15.2 million in 2016 from 2015. Current assets, comprised primarily of cash and operating investments, student and sponsor receivables, and prepaid expenses, decreased by $29 million in 2016. Restricted cash and investments decreased by $4.7 million during 2016 as a result of the spending of bond proceeds secured in previous years to fund the university’s capital projects. Cash and short term investments decreased $20.4 million during 2016 as a result of the revenue shortfalls and expense overages incurred for programming and enrollment enhancements previously mentioned. The accounts receivable balance also decreased $3.6 million during the year which is largely related to the write-off of $4.4 million of outstanding receivables from an affiliated entity. Current assets decreased by $11.3 million in 2015 from 2014 due to a $35.3 million decrease in restricted cash and investments for spending on capital projects that was offset by a $25.3 increase in cash and short term investments.
Other noncurrent assets decreased $27 million from $80.2 million in 2015 to $53.2 million in 2016. These assets are comprised of long-term investments, long-term student loans receivable, and long-term prepaid expenses and advanced charges. Long-term unrestricted investments represent the majority of the balance in both 2016 and 2015 at $43.6 million and $69.1 million, respectively. A significant portion of the $25.5 million decrease in long-term unrestricted investments is related to the decrease in unrestricted net position resulting from the university’s use of reserves for strategic initiatives related to enrollment management and
11

program development previously mentioned. Loans receivable comprise the balance of the noncurrent assets at $9.4 million and $11 million in 2016 and 2015, respectively. The decrease in this balance during 2016 is the result of a reduction in new loans being initiated and a return of funds to the sponsor. Other noncurrent assets decreased $51.5 million in 2015 due to a decrease in long-term investments which were liquidated for strategic initiatives and a shift to cash and short-term investments.
Capital assets, net of depreciation increased $9.9 million to $375.9 million in 2016 from $366 million in 2015. This compares to a $33.1 million increase in 2015. The majority of capital activity in 2016 was for the Creative Arts Center renovation. In 2015, capital spending occurred as follows: $3.2 million for the energy conservation project, $19.9 million for the Neuroscience Engineering Collaboration (NEC) Building, $10.4 million for the Student Success Center, and $8.8 million for renovation of the Creative Arts Center. In addition, routine moveable equipment and library acquisitions were made during both years.
Deferred outflows of resources includes unamortized loss from the refunding of debt in 2013 and balances related to the implementation of GASB No. 68. The unamortized loss from refunding balance was $0.4 million in both 2016 and 2015. The deferred outflows of resources balance related to pension was $49.8 million in 2016 and $18.9 million in 2015. This $30.9 million increase is completely outside of the university’s control and largely relates to the university’s proportionate share of differences between expected and actual experience as well as projected and actual investment earnings recorded by the state retirement plans.
Current liabilities are comprised primarily of accounts payable; accrued liabilities; unearned revenues from both student fees and advance payments for contracts and grants; and the current portion of long-term liabilities. These liabilities decreased $4.9 million from $71.5 at June 30, 2015 to $66.6 million at June 30, 2016. The overall change in current liabilities is comprised of changes in a number of balances. Accounts payable balances remained relatively flat at $13.6 million in 2015 as compared to $14 million in 2016. Unearned revenue decreased $4 million from $28.4 million in 2015 to $24.4 million in 2016. The primary components of unearned revenue are income received in advance of expenditures from project sponsors on contracts and grants as well as summer semester tuition and fees for the subsequent fiscal year received prior to the close of the current year end. The unearned revenue balance related to contracts and grants decreased $2.8 million as funds received in advance were spent on projects. Unearned tuition and fees decreased $0.4 million in 2016. An additional $0.9 million decrease resulted from advance ticket sales returning to a more typical level in 2016 after an escalated level in 2015 related to advance ticket sales for a popular event held at the Wright State University Nutter Center in July 2015. Current liabilities increased $2.9 million during 2015. Fluctuations of liabilities balances in 2015 included a $3.3 million decrease in accounts payable balances which was a result of higher than normal construction related invoices received close to the end of fiscal 2014. Unearned revenue increased $4.6 million as a result of a $3.2 million increase in unearned tuition and fees and a $1.3 million increase related to advance ticket sales mentioned previously.
Noncurrent liabilities are comprised of unearned revenue, net pension liability and the long-term portion of university debt. They increased $43.9 million from $333.5 million at June 30, 2015 to $377.4 million at June 30, 2016. The increase is attributable to the $50.1 million change in net pension liability which increased from $228.1 million as of June 30, 2015 to $278.2 million as of June 30, 2016. The net pension liability represents the university’s proportionate share of the net pension liabilities recorded by the state retirement plans. The offsetting reduction in noncurrent liabilities was a $5.9 million decrease in long-term liabilities as the University continues to service its debt. Similarly, the $221.3 million increase in noncurrent liabilities from $112.2 million in 2014 to $333.5 million in 2015 was due to the $228.1 million increase in net pension liability which was slightly offset by a $7.4 million decrease related to debt service
Deferred inflows of resources includes balances related to the implementation of GASB No. 68. The deferred inflows of resources related to pension decreased $16.7 million from $33.1 million at June 30, 2015 to $16.4 million at June 30, 2016. The decrease is completely beyond the university’s control and relates to the university’s proportionate share of differences between expected and actual experience as well as projected and actual investment earnings recorded by the state retirement plans.
12
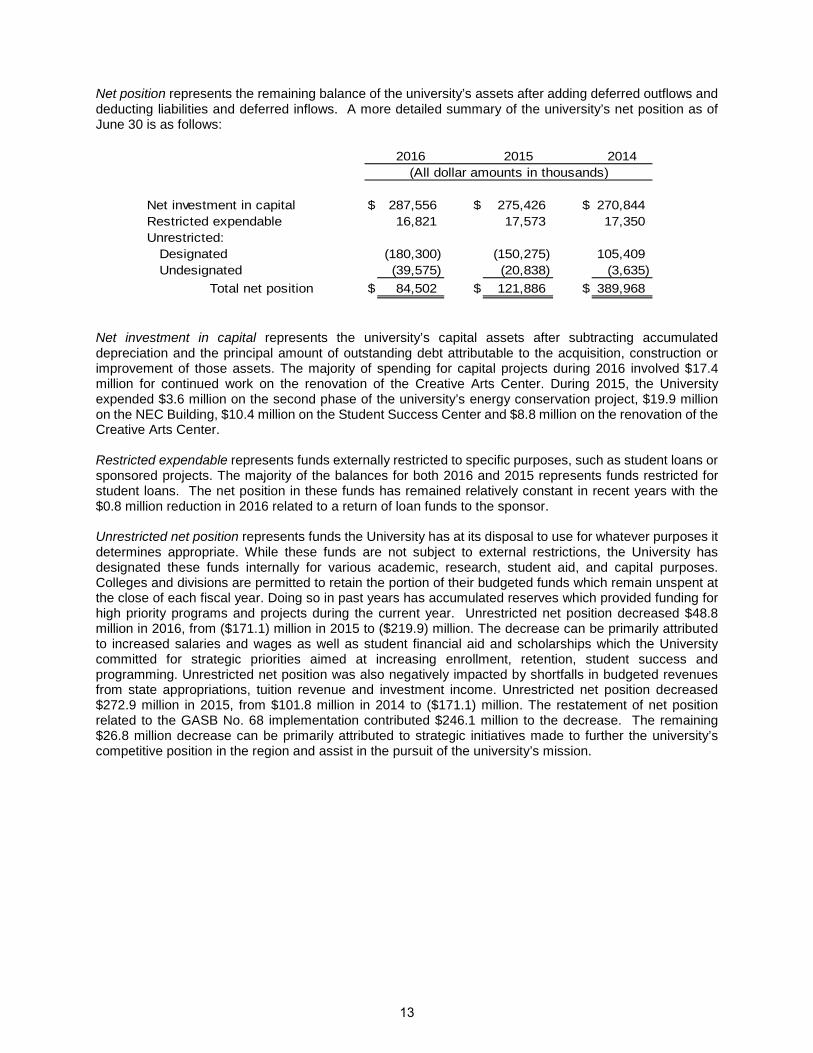
Net position represents the remaining balance of the university’s assets after adding deferred outflows and deducting liabilities and deferred inflows. A more detailed summary of the university’s net position as of June 30 is as follows:
2016 2015 2014
Net investment in capital $ 287,556 $ 275,426 $ 270,844Restricted expendable 16,821 17,573 17,350Unrestricted: Designated (180,300) (150,275) 105,409 Undesignated (39,575) (20,838) (3,635)
Total net position $ 84,502 $ 121,886 $ 389,968
(All dollar amounts in thousands)
Net investment in capital represents the university’s capital assets after subtracting accumulated depreciation and the principal amount of outstanding debt attributable to the acquisition, construction or improvement of those assets. The majority of spending for capital projects during 2016 involved $17.4 million for continued work on the renovation of the Creative Arts Center. During 2015, the University expended $3.6 million on the second phase of the university’s energy conservation project, $19.9 million on the NEC Building, $10.4 million on the Student Success Center and $8.8 million on the renovation of the Creative Arts Center.
Restricted expendable represents funds externally restricted to specific purposes, such as student loans or sponsored projects. The majority of the balances for both 2016 and 2015 represents funds restricted for student loans. The net position in these funds has remained relatively constant in recent years with the $0.8 million reduction in 2016 related to a return of loan funds to the sponsor.
Unrestricted net position represents funds the University has at its disposal to use for whatever purposes it determines appropriate. While these funds are not subject to external restrictions, the University has designated these funds internally for various academic, research, student aid, and capital purposes. Colleges and divisions are permitted to retain the portion of their budgeted funds which remain unspent at the close of each fiscal year. Doing so in past years has accumulated reserves which provided funding for high priority programs and projects during the current year. Unrestricted net position decreased $48.8 million in 2016, from ($171.1) million in 2015 to ($219.9) million. The decrease can be primarily attributed to increased salaries and wages as well as student financial aid and scholarships which the University committed for strategic priorities aimed at increasing enrollment, retention, student success and programming. Unrestricted net position was also negatively impacted by shortfalls in budgeted revenues from state appropriations, tuition revenue and investment income. Unrestricted net position decreased $272.9 million in 2015, from $101.8 million in 2014 to ($171.1) million. The restatement of net position related to the GASB No. 68 implementation contributed $246.1 million to the decrease. The remaining $26.8 million decrease can be primarily attributed to strategic initiatives made to further the university’s competitive position in the region and assist in the pursuit of the university’s mission.
13
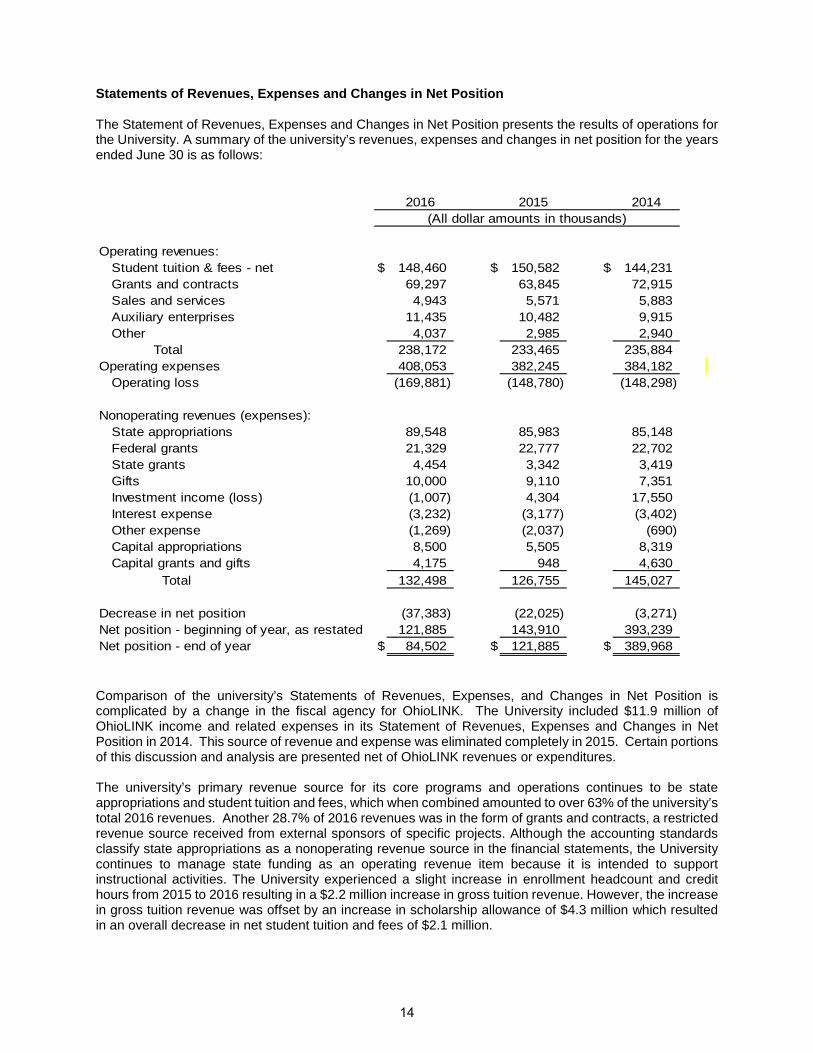
Statements of Revenues, Expenses and Changes in Net Position
The Statement of Revenues, Expenses and Changes in Net Position presents the results of operations for the University. A summary of the university’s revenues, expenses and changes in net position for the years ended June 30 is as follows:
2016 2015 2014
Operating revenues: Student tuition & fees - net $ 148,460 $ 150,582 $ 144,231 Grants and contracts 69,297 63,845 72,915 Sales and services 4,943 5,571 5,883 Auxiliary enterprises 11,435 10,482 9,915 Other 4,037 2,985 2,940
Total 238,172 233,465 235,884Operating expenses 408,053 382,245 384,182 Operating loss (169,881) (148,780) (148,298)
Nonoperating revenues (expenses): State appropriations 89,548 85,983 85,148 Federal grants 21,329 22,777 22,702 State grants 4,454 3,342 3,419 Gifts 10,000 9,110 7,351 Investment income (loss) (1,007) 4,304 17,550 Interest expense (3,232) (3,177) (3,402) Other expense (1,269) (2,037) (690) Capital appropriations 8,500 5,505 8,319 Capital grants and gifts 4,175 948 4,630
Total 132,498 126,755 145,027
Decrease in net position (37,383) (22,025) (3,271)Net position - beginning of year, as restated 121,885 143,910 393,239Net position - end of year $ 84,502 $ 121,885 $ 389,968
(All dollar amounts in thousands)
Comparison of the university’s Statements of Revenues, Expenses, and Changes in Net Position is complicated by a change in the fiscal agency for OhioLINK. The University included $11.9 million of OhioLINK income and related expenses in its Statement of Revenues, Expenses and Changes in Net Position in 2014. This source of revenue and expense was eliminated completely in 2015. Certain portions of this discussion and analysis are presented net of OhioLINK revenues or expenditures.
The university’s primary revenue source for its core programs and operations continues to be state appropriations and student tuition and fees, which when combined amounted to over 63% of the university’s total 2016 revenues. Another 28.7% of 2016 revenues was in the form of grants and contracts, a restricted revenue source received from external sponsors of specific projects. Although the accounting standards classify state appropriations as a nonoperating revenue source in the financial statements, the University continues to manage state funding as an operating revenue item because it is intended to support instructional activities. The University experienced a slight increase in enrollment headcount and credit hours from 2015 to 2016 resulting in a $2.2 million increase in gross tuition revenue. However, the increase in gross tuition revenue was offset by an increase in scholarship allowance of $4.3 million which resulted in an overall decrease in net student tuition and fees of $2.1 million.
14
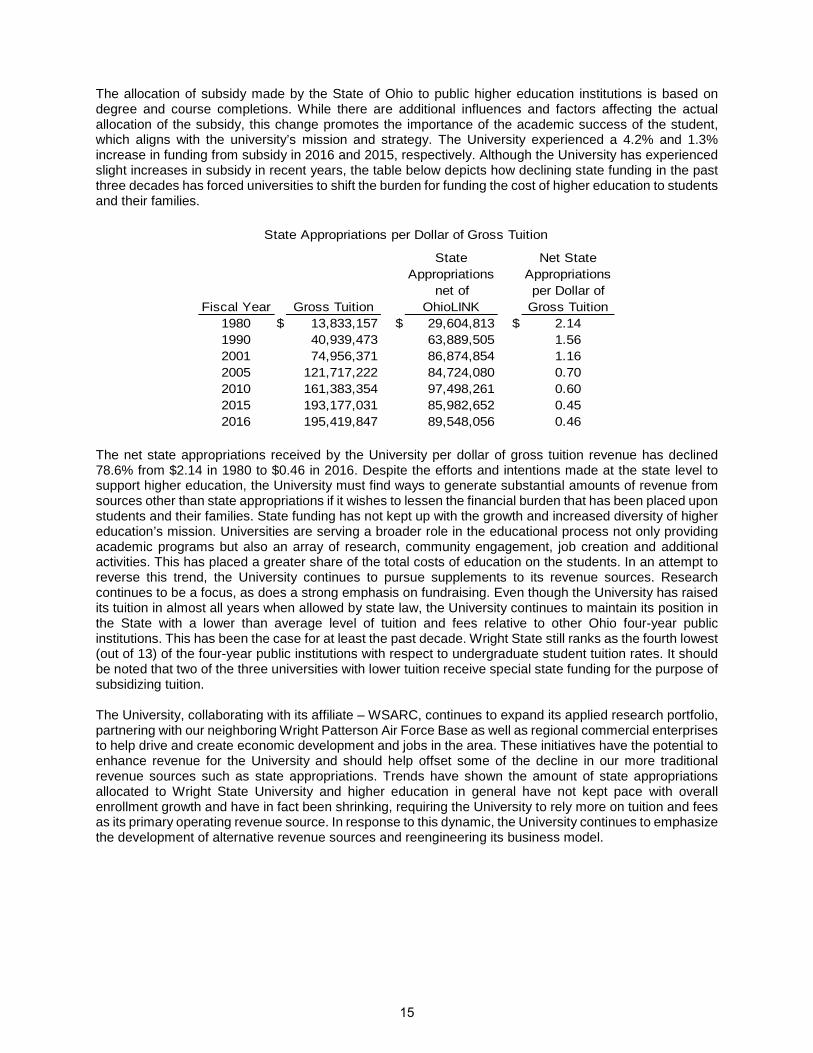
The allocation of subsidy made by the State of Ohio to public higher education institutions is based on degree and course completions. While there are additional influences and factors affecting the actual allocation of the subsidy, this change promotes the importance of the academic success of the student, which aligns with the university’s mission and strategy. The University experienced a 4.2% and 1.3% increase in funding from subsidy in 2016 and 2015, respectively. Although the University has experienced slight increases in subsidy in recent years, the table below depicts how declining state funding in the past three decades has forced universities to shift the burden for funding the cost of higher education to students and their families.
Fiscal Year Gross Tuition
State Appropriations
net of OhioLINK
Net State Appropriations per Dollar of
Gross Tuition1980 $ 13,833,157 $ 29,604,813 $ 2.141990 40,939,473 63,889,505 1.562001 74,956,371 86,874,854 1.162005 121,717,222 84,724,080 0.702010 161,383,354 97,498,261 0.602015 193,177,031 85,982,652 0.452016 195,419,847 89,548,056 0.46
State Appropriations per Dollar of Gross Tuition
The net state appropriations received by the University per dollar of gross tuition revenue has declined 78.6% from $2.14 in 1980 to $0.46 in 2016. Despite the efforts and intentions made at the state level to support higher education, the University must find ways to generate substantial amounts of revenue from sources other than state appropriations if it wishes to lessen the financial burden that has been placed upon students and their families. State funding has not kept up with the growth and increased diversity of higher education’s mission. Universities are serving a broader role in the educational process not only providing academic programs but also an array of research, community engagement, job creation and additional activities. This has placed a greater share of the total costs of education on the students. In an attempt to reverse this trend, the University continues to pursue supplements to its revenue sources. Research continues to be a focus, as does a strong emphasis on fundraising. Even though the University has raised its tuition in almost all years when allowed by state law, the University continues to maintain its position in the State with a lower than average level of tuition and fees relative to other Ohio four-year public institutions. This has been the case for at least the past decade. Wright State still ranks as the fourth lowest (out of 13) of the four-year public institutions with respect to undergraduate student tuition rates. It should be noted that two of the three universities with lower tuition receive special state funding for the purpose of subsidizing tuition.
The University, collaborating with its affiliate – WSARC, continues to expand its applied research portfolio, partnering with our neighboring Wright Patterson Air Force Base as well as regional commercial enterprises to help drive and create economic development and jobs in the area. These initiatives have the potential to enhance revenue for the University and should help offset some of the decline in our more traditional revenue sources such as state appropriations. Trends have shown the amount of state appropriations allocated to Wright State University and higher education in general have not kept pace with overall enrollment growth and have in fact been shrinking, requiring the University to rely more on tuition and fees as its primary operating revenue source. In response to this dynamic, the University continues to emphasize the development of alternative revenue sources and reengineering its business model.
15

Below is a graphic illustration of revenues by source for the year ended June 30, 2016.
State appropriations increased $3.5 from $86 million in 2015 to $89.5 million in 2016. This compares to the smaller $1.1 million increase from $84.9 million (net of OhioLINK) in 2014 to $86 million in 2015. The University does not expect any dramatic changes in its level of funding and is encouraged by the increase in the total pool of funds provided by the State for 2016 and 2017.
Student tuition and fees, net were $148.5 million, $150.6 million, and $144.2 million, in 2016, 2015, and 2014, respectively, which provided a 1.4% decrease from 2015 to 2016 and a 4.4 % increase from 2014 to 2015. The State of Ohio budget did not allow for undergraduate tuition increases for 2016. However, nonresident fees, graduate tuition and professional fees were all increased 2.3% in 2016. Tuition revenue before the application of scholarships (financial aid applied to students’ bills) was up $2.2 million, or 1.2%, from 2015 to 2016 due to the increased graduate level tuition rates as well as slight increases in both undergraduate and graduate level credit hours. This increase in gross tuition revenue was offset by a $4.4 million increase in scholarships. The $6.4 million increase in net tuition revenue from 2014 to 2015 was a result of a 2.2% tuition increase for all degree levels at both campuses.
Grants and contracts were $95.1 million in 2016, increasing $5.1 million from $90 million in 2015. The increase was attributable to a $2.5 million increase in state grants and a $3.3 increase in nongovernmental grants with an offset caused by a reduction in federal grants. The $5 million increase from 2015 compares to a $2.7 million increase in grants and contracts (without the impact of OhioLINK) experienced from 2014 to 2015.
Sales and services, which are primarily revenues generated from specific departmental sales activities to organizations external to the University, were $4.9 million, $5.6 million, and $5.9 million, for the years ended June 30, 2016, 2015, and 2014, respectively. The largest portion of these revenues are clinical income and other services generated by the Boonshoft School of Medicine. Other revenue sources include conferences and events; printing and communication services; as well as computing and telecommunications. The decrease of $0.7 million in 2016 and $0.3 million in 2015 were both largely driven by a decline in Boonshoft School of Medicine revenue.
Auxiliary revenues were $11.4 million, $10.5 million, and $9.9 million, for the years ended June 30, 2016, 2015, and 2014, respectively. Auxiliary enterprises are comprised of residence life and housing, bookstores, hospitality (dining and catering) services, vending, parking and transportation, intercollegiate athletics, the Student Union, and the Nutter Center. A large portion of the $0.9 million growth in revenues in 2016 is attributable to increased events held at the Nutter Center as part of the Center’s 25th anniversary. Additional revenue increases were experienced as residency occupancies improved. Similarly, a large portion of the
16

$0.6 million growth in revenues in 2015 is attributable to increased housing occupancy rates as students joined STEMCity, a learning community for students in science and math disciplines.
Investment income (loss) was ($1) million in 2016, $4.3 million in 2015, and $17.6 million in 2014. The $1 million investment loss in 2016 represented a $7.5 million variance from the $6.5 million budgeted. Although the investment results were less than favorable, the university’s investment returns were consistent with performance benchmarks as defined by the university’s Investment Policy Statement. The university’s portfolio is managed using a fund of funds approach under a discretionary management model following the Investment Policy Statement last updated and approved by the Board of Trustees in October 2014. The portfolio utilizes a blend of traditional asset classes such as equities and fixed income with new positions in funds designed to reduce volatility and risk. The University plans to continue pressing for new opportunities for income generation, especially as the need for new revenue sources intensifies.
Capital Appropriations, Gifts and Grants were $12.7 million in 2016, an increase of $6.3 million from the $6.4 million realized in 2015. This increase was a result of both greater capital appropriations from the State of Ohio and from capital grants and gifts. In 2016, the University received capital appropriations from the State as follows: $3.7 million for the renovation of the Creative Arts Center, $2 million for classroom and modernization, $0.8 million for a shared salt storage facility, $0.7 for the construction of the NEC Building as well as additional, smaller amounts for renovations at Lake Campus, the Veteran and Military Center, data analytics and visual environment, and manufacturing center robotics. The major capital appropriations from the State in 2015 included: $3.6 million for the construction of the NEC Building, $1 million for improvements at the Lake Campus, and $0.3 million for the Student Success Center.
The following is a graphic illustration of expenses by function for the year ended June 30, 2016.
Total operating expenses were $408 million in 2016 as compared to $382.2 million in 2015 and to $384.2 million in 2014. The $25.8 million increase in 2016 represents a 6.7% increase in operating expenses. A large portion of the overall increase in 2016 operating expenses is attributable to a $7.8 million increase in salaries and benefits which continue to represent the largest portion of operating costs for the University. Salaries and benefits were 67.6% of total operating expenses in 2016 as compared to 70% and 65.9% in 2015 and 2014, respectively. The University also experienced a one-time expense in 2016 with the write-off of $4.4 million outstanding amounts due from an affiliated entity. During 2016, the University continued expense optimization efforts in the areas of energy conservation, health and wellness initiatives, enterprise print management, strategic contract management, and strategic hiring. The $2 million decrease in 2015 represented a 0.5% decrease in operating expenses. However, the transition of OhioLINK represented an $11.9 million decrease in operating expenses from 2014 to 2015. Therefore, without OhioLINK, operating
17
expenses actually increased $9.9 million representing a 2.7% increase. The overall increase in 2015 operating expenses (without OhioLINK) is principally attributable to a $14.7 million increase in salaries and benefits.
Statements of Cash Flows
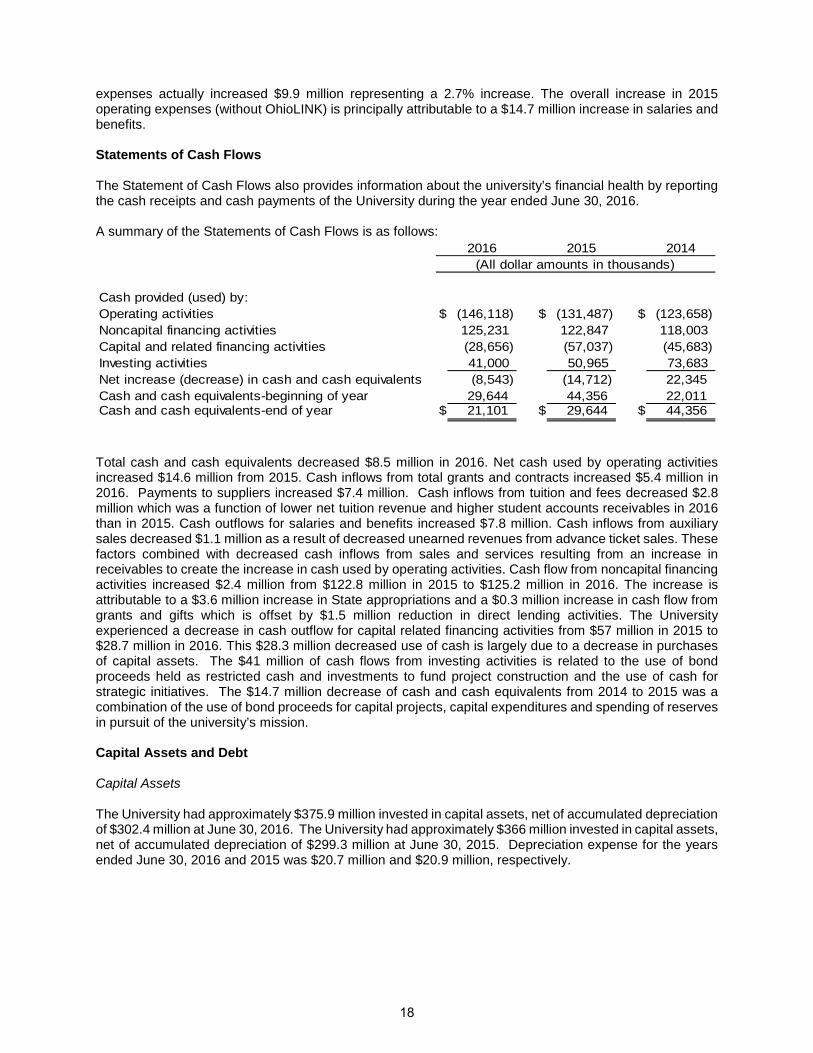
The Statement of Cash Flows also provides information about the university’s financial health by reporting the cash receipts and cash payments of the University during the year ended June 30, 2016.
A summary of the Statements of Cash Flows is as follows: 2016 2015 2014
Cash provided (used) by:Operating activities $ (146,118) $ (131,487) $ (123,658)Noncapital financing activities 125,231 122,847 118,003Capital and related financing activities (28,656) (57,037) (45,683)Investing activities 41,000 50,965 73,683Net increase (decrease) in cash and cash equivalents (8,543) (14,712) 22,345 Cash and cash equivalents-beginning of year 29,644 44,356 22,011 Cash and cash equivalents-end of year $ 21,101 $ 29,644 $ 44,356
(All dollar amounts in thousands)
Total cash and cash equivalents decreased $8.5 million in 2016. Net cash used by operating activities increased $14.6 million from 2015. Cash inflows from total grants and contracts increased $5.4 million in 2016. Payments to suppliers increased $7.4 million. Cash inflows from tuition and fees decreased $2.8 million which was a function of lower net tuition revenue and higher student accounts receivables in 2016 than in 2015. Cash outflows for salaries and benefits increased $7.8 million. Cash inflows from auxiliary sales decreased $1.1 million as a result of decreased unearned revenues from advance ticket sales. These factors combined with decreased cash inflows from sales and services resulting from an increase in receivables to create the increase in cash used by operating activities. Cash flow from noncapital financing activities increased $2.4 million from $122.8 million in 2015 to $125.2 million in 2016. The increase is attributable to a $3.6 million increase in State appropriations and a $0.3 million increase in cash flow from grants and gifts which is offset by $1.5 million reduction in direct lending activities. The University experienced a decrease in cash outflow for capital related financing activities from $57 million in 2015 to $28.7 million in 2016. This $28.3 million decreased use of cash is largely due to a decrease in purchases of capital assets. The $41 million of cash flows from investing activities is related to the use of bond proceeds held as restricted cash and investments to fund project construction and the use of cash for strategic initiatives. The $14.7 million decrease of cash and cash equivalents from 2014 to 2015 was a combination of the use of bond proceeds for capital projects, capital expenditures and spending of reserves in pursuit of the university’s mission.
Capital Assets and Debt
Capital Assets
The University had approximately $375.9 million invested in capital assets, net of accumulated depreciation of $302.4 million at June 30, 2016. The University had approximately $366 million invested in capital assets, net of accumulated depreciation of $299.3 million at June 30, 2015. Depreciation expense for the years ended June 30, 2016 and 2015 was $20.7 million and $20.9 million, respectively.
18

A summary of net capital assets for the year ended June 30 is as follows:
2016 2015 2014
Land, land improvements and infrastructure $ 42,427 $ 43,025 $ 42,267Buildings 282,199 275,849 223,972Machinery and equipment 18,337 20,488 20,797Library books and publications 15,131 15,802 16,545Construction in progress 17,805 10,831 29,316
Total capital assets - net $ 375,899 $ 365,995 $ 332,897
(All dollar amounts in thousands)
The university’s capital assets net of accumulated depreciation increased $10 million in 2016 compared to $33.1 million in 2015. The University experienced a slower growth in capital assets in 2016 because many capital projects reached completion or near completion in 2015. During 2016, the majority of capital spending related to the continuation of the Creative Arts Center which resulted in a $7.7 million increase in capitalized buildings, $9.3 increase in construction in progress, and $0.4 of capitalized equipment. The University received $3.7 million of state capital appropriations for the project. Additionally, $2.8 million of proceeds from a previous debt issuance were utilized for the project. The remaining costs were covered using internal funding. A shared salt storage facility was completed in 2016 resulting in a $2.2 increase in capitalized buildings. Minor construction projects and acquisitions of machinery and equipment as well as library books and publications also occurred during the year. The large volume of capital projects in 2015 included $3.6 million for the second phase of the energy efficiency project, $19.9 million for the NEC Building, $10.4 million for the Student Success Center, and $8.8 million for renovation of the Creative Arts Center.
Debt
The University did not enter into any new debt agreements during 2016. Furthermore, the University has no current plans to initiate any new debt in the foreseeable future. Instead, the focus is on completing projects funded by current debt agreements.
In November 2011, the University issued $55.2 million General Receipts Series 2011A Bonds to fund construction of a new classroom building, replacement of main water lines, renovation of the Student Union, renovation of the Schuster Concert Hall, improvement and addition of the Rinzler Student Sports Complex, construction of the NEC Building, expansion of the Creative Arts Center, replacement of the Nutter Center scoreboard, construction of parking lots and acquisition of a parcel of land adjacent to main campus. All of these projects have been completed except for the expansion of the Creative Arts Center. As of June 30, 2016 and 2015, $1.7 million and $4.5 million, respectively, of bond proceeds and premiums remain unspent and available. Series 2011B bonds, totaling $1.5 million, were also issued as an advance refunding of $1.4 million outstanding Series 2003 General Receipts serial and term bonds. The average coupon rate of the Series A bonds is 4.82%, but the effective interest rate is only 4.13%.
In November 2012, the University issued $23.2 million in General Receipts bonds which were sold at a premium of $2.1 million. These bonds have an effective interest rate of 2.87% and consist of $21.4 million serial bonds and a $1.8 million term bond. Of the total bonds, $9.0 million were issued to pay the associated bond issuance costs and to finance construction of a student academic success center to be located within a new classroom building, a new multi-functional student commons building, and relocation of a grounds storage facility. The Student Success Center was completed in the spring of 2015 with a grand open celebration held in the fall. As of June 30, 2016 and 2015, unspent bond proceeds and premiums provide a balance of $2.4 million and $3.7 million, respectively, of funding for these projects. The remaining $14.2 million Series 2012 bonds were issued as an advance refunding of $14.4 million outstanding Series 2004 General Receipts serial and term bonds. The advance refunding resulted in an economic gain to the University of $1.3 million and a savings of $1.6 million in debt service payments.
19

In February 2013, the University entered into a $25.5 million Loan Agreement with the Ohio Air Quality Development Authority to fund the second phase of an energy conservation project. This debt was issued as a Series A note backed by a $17.2 million tax exempt revenue bond and a Series B note backed by an $8.3 million tax exempt revenue bond (QECB). The Series A note carries an interest rate of 1.78% and the Series B note carries an interest rate of 4.16%. The QECB qualifies for a large federal rebate that brings the effective interest rate down to .94%. The weighted average interest rate of the entire $25.5 million Loan Agreement is 1.51%. Wright State expects to reduce energy consumption by nearly 40 percent through the funded energy efficiency investments that include applying state-of-the-art technology to modernize heating/cooling plants in buildings across its Dayton and Celina campuses. The project promises to save the University more than $35 million over a 15-year period which well exceeds the debt service on the notes. As of June 30, 2016 the proceeds of this debt have been effectively spent on the project. As of June 30, 2015, $0.7 million was available for funding of this project.
Outstanding debt was $92.9 million, $100 million, and $106.8 million at June 30, 2016, 2015, and 2014, respectively. The 2016 balance of $92.9 million includes $72 million of outstanding bonds and $20.9 million of outstanding notes. The 2015 balance of $100 million includes $77.5 million of outstanding bonds and $22.5 million of outstanding notes. The 2014 balance of $106.8 million includes $82.7 million of outstanding bonds, $24 million of outstanding notes, and $0.1 million of equipment leases. The University maintains a debt rating from Moody’s Investors Service of A2, outlook stable.
Concluding Thoughts
This year provided the University with a wonderful opportunity to demonstrate its commitment to the quality and distinctiveness of our academic programs and to its mission of transforming the lives of the students and communities it serves. The university-wide efforts to prepare for the Higher Learning Commission review team visit and the reaffirmation of the university’s accreditation reinforced the strategic plan goals of building a solid foundation for student success at all levels through high-quality, innovative programs; conducting scholarly research and creative endeavors that impact quality of life; engaging in meaningful community service; and driving the economic revitalization of our region and our state and empowering all of our students, faculty, staff, and alumni to develop professionally, intellectually, and personally.
The university’s mission and strategic plan guide the University as it continues to address several challenges with significant impacts on university finances. One such challenge is the affordability of a college education. As previously mentioned, overall state support for higher education has declined in the past several decades. Additional pressures stem from recent state legislation calling for colleges and universities to reduce the cost of obtaining an undergraduate degree by at least 5%. The university plan considers options such as discounts for summer tuition, textbook affordability measures, and reduced credit hour requirements. The University is dedicated to providing an affordable education, as evidenced by our continuing low tuition rates. Furthermore, the success of Rise. Shine. The Campaign for Wright State University will positively impact the affordability for our students through its objective of increased scholarship funding.
The pressures the University faces as a result of state mandated tuition freezes and affordability and efficiency initiatives, which constrict revenue sources externally, have been exacerbated by enrollment and investment returns that have fallen short of budget targets. Reduced revenues as well as increased employment and financial aid related spending have strained reserves as the University continues its commitment to increasing enrollment, student success initiatives, and retention. In fall 2015, the University developed strategies to address three key areas: personnel expenses, space needs and capital expenditures. As the year progressed, the University determined the Strategic Hire Process, which was designed to address personnel costs by critically evaluate staffing, was not effectively addressing the full scope of the budget issues. Therefore the University devised a budget remediation plan that will realign the budget over the next two fiscal years. In addition to these initiatives, the University continues to actively pursue cost saving and revenue enhancing initiatives such as health care cost containment; energy efficiencies; increased research collaboration and revenue; shared services with other universities and local governments; and partnerships with businesses.
20

The financial challenges the University faced in 2016 have provided an opportunity to address base budget concerns and to develop a financial plan which will better align resources with strategic objectives. The university community is dedicated to strengthening its financial operations while continuing to pursue our vision: Wright State University, inspired by the creative spirit of the Wright brothers, will be Ohio’s most learning-centered and innovative university, known and admired for our inclusive culture that respects the unique value of each of our students, faculty, staff, and alumni and for the positive transformative impact we have on the lives of our students and the communities we serve. The dedication of faculty and staff to this vision has been captured by the sentiment Tom Hanks wrote in a recent letter accepting an Honorary Alumnus Award from the University, “You have made a good place where good people can help make the world and our country a better place - from right there in Dayton - and I feel lucky to be a part of all you stand for. Thank you."
21

This page intentionally left blank
22
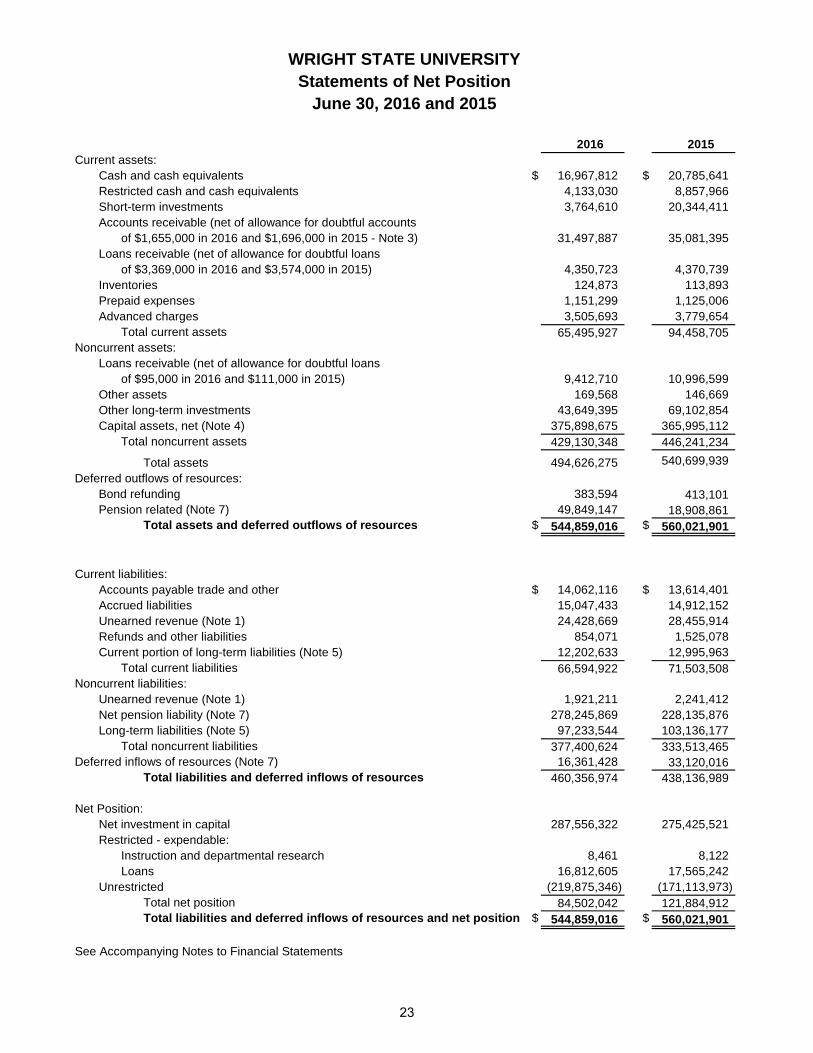
2016 2015Current assets:
Cash and cash equivalents $ 16,967,812 $ 20,785,641Restricted cash and cash equivalents 4,133,030 8,857,966Short-term investments 3,764,610 20,344,411Accounts receivable (net of allowance for doubtful accounts
of $1,655,000 in 2016 and $1,696,000 in 2015 - Note 3) 31,497,887 35,081,395Loans receivable (net of allowance for doubtful loans
of $3,369,000 in 2016 and $3,574,000 in 2015) 4,350,723 4,370,739Inventories 124,873 113,893Prepaid expenses 1,151,299 1,125,006Advanced charges 3,505,693 3,779,654
Total current assets 65,495,927 94,458,705Noncurrent assets:
Loans receivable (net of allowance for doubtful loansof $95,000 in 2016 and $111,000 in 2015) 9,412,710 10,996,599
Other assets 169,568 146,669Other long-term investments 43,649,395 69,102,854Capital assets, net (Note 4) 375,898,675 365,995,112
Total noncurrent assets 429,130,348 446,241,234
Total assets 494,626,275 540,699,939
Deferred outflows of resources:Bond refunding 383,594 413,101Pension related (Note 7) 49,849,147 18,908,861
Total assets and deferred outflows of resources $ 544,859,016 $ 560,021,901
Current liabilities:Accounts payable trade and other $ 14,062,116 $ 13,614,401Accrued liabilities 15,047,433 14,912,152Unearned revenue (Note 1) 24,428,669 28,455,914Refunds and other liabilities 854,071 1,525,078Current portion of long-term liabilities (Note 5) 12,202,633 12,995,963
Total current liabilities 66,594,922 71,503,508Noncurrent liabilities:
Unearned revenue (Note 1) 1,921,211 2,241,412Net pension liability (Note 7) 278,245,869 228,135,876Long-term liabilities (Note 5) 97,233,544 103,136,177
Total noncurrent liabilities 377,400,624 333,513,465Deferred inflows of resources (Note 7) 16,361,428 33,120,016
Total liabilities and deferred inflows of resources 460,356,974 438,136,989
Net Position:Net investment in capital 287,556,322 275,425,521Restricted - expendable:
Instruction and departmental research 8,461 8,122Loans 16,812,605 17,565,242
Unrestricted (219,875,346) (171,113,973)Total net position 84,502,042 121,884,912Total liabilities and deferred inflows of resources and net position $ 544,859,016 $ 560,021,901
See Accompanying Notes to Financial Statements
WRIGHT STATE UNIVERSITYStatements of Net Position
June 30, 2016 and 2015
23
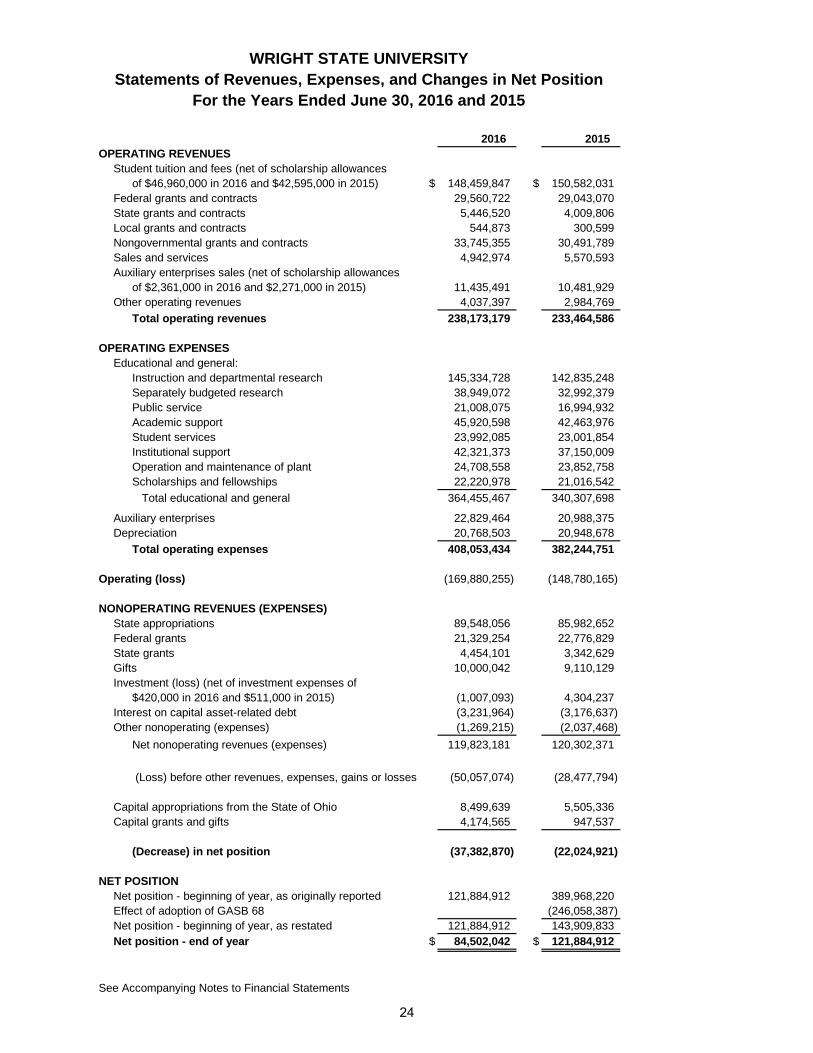
2016 2015OPERATING REVENUES
Student tuition and fees (net of scholarship allowancesof $46,960,000 in 2016 and $42,595,000 in 2015) $ 148,459,847 $ 150,582,031
Federal grants and contracts 29,560,722 29,043,070State grants and contracts 5,446,520 4,009,806Local grants and contracts 544,873 300,599Nongovernmental grants and contracts 33,745,355 30,491,789Sales and services 4,942,974 5,570,593Auxiliary enterprises sales (net of scholarship allowances
of $2,361,000 in 2016 and $2,271,000 in 2015) 11,435,491 10,481,929Other operating revenues 4,037,397 2,984,769
Total operating revenues 238,173,179 233,464,586
OPERATING EXPENSESEducational and general:
Instruction and departmental research 145,334,728 142,835,248Separately budgeted research 38,949,072 32,992,379Public service 21,008,075 16,994,932Academic support 45,920,598 42,463,976Student services 23,992,085 23,001,854Institutional support 42,321,373 37,150,009Operation and maintenance of plant 24,708,558 23,852,758Scholarships and fellowships 22,220,978 21,016,542
Total educational and general 364,455,467 340,307,698
Auxiliary enterprises 22,829,464 20,988,375Depreciation 20,768,503 20,948,678
Total operating expenses 408,053,434 382,244,751
Operating (loss) (169,880,255) (148,780,165)
NONOPERATING REVENUES (EXPENSES)State appropriations 89,548,056 85,982,652Federal grants 21,329,254 22,776,829State grants 4,454,101 3,342,629Gifts 10,000,042 9,110,129Investment (loss) (net of investment expenses of
$420,000 in 2016 and $511,000 in 2015) (1,007,093) 4,304,237Interest on capital asset-related debt (3,231,964) (3,176,637)Other nonoperating (expenses) (1,269,215) (2,037,468)
Net nonoperating revenues (expenses) 119,823,181 120,302,371
(Loss) before other revenues, expenses, gains or losses (50,057,074) (28,477,794)
Capital appropriations from the State of Ohio 8,499,639 5,505,336Capital grants and gifts 4,174,565 947,537
(Decrease) in net position (37,382,870) (22,024,921)
NET POSITIONNet position - beginning of year, as originally reported 121,884,912 389,968,220Effect of adoption of GASB 68 (246,058,387)Net position - beginning of year, as restated 121,884,912 143,909,833Net position - end of year $ 84,502,042 $ 121,884,912
See Accompanying Notes to Financial Statements
WRIGHT STATE UNIVERSITY
For the Years Ended June 30, 2016 and 2015Statements of Revenues, Expenses, and Changes in Net Position
24

WRIGHT STATE UNIVERSITYStatements of Cash Flows
For the Years Ended June 30, 2016 and 2015
CASH FLOWS FROM OPERATING ACTIVITIES 2016 2015
Student tuition and fees $ 147,481,060 $ 150,291,745Federal, state, local, and nongovernmental grants and contracts 66,449,371 61,019,417Sales and services of educational and other departmental activities 4,943,392 5,692,188Payments to employees (212,663,091) (208,080,503)Payments for benefits (62,978,926) (59,777,731)Payments to suppliers (80,220,672) (72,810,054)Payments for scholarships and fellowships (22,367,547) (21,304,810)Student loans issued (1,380,539) (2,688,275)Student loans collected 2,984,444 3,310,655Student loan interest and fees collected 439,811 545,960Auxiliary enterprise sales 11,194,439 12,313,970
Net cash (used) by operating activities (146,118,258) (131,487,438)
CASH FLOWS FROM NONCAPITAL FINANCING ACTIVITIES
State appropriations 89,548,056 85,982,652Direct lending receipts 96,119,114 99,881,132Direct lending disbursements (96,182,433) (98,476,818)Grants for noncapital purposes 25,783,355 26,119,458Gifts 9,963,178 9,340,500
Net cash provided by noncapital financing activities 125,231,270 122,846,924
CASH FLOWS FROM CAPITAL AND RELATED FINANCING ACTIVITIES
Capital appropriations from the State of Ohio 7,766,347 10,104,511Capital grants and gifts received 2,821,135 861,897Purchases of capital assets (29,393,285) (58,369,348)Sales of capital assets 48,530 36,938Principal paid on capital debt and leases (6,682,255) (6,527,321)Interest paid on capital debt and leases (3,545,672) (3,486,344)Bond interest subsidy 329,730 343,100
Net cash (used) by capital and related financing activities (28,655,470) (57,036,567)
CASH FLOWS FROM INVESTING ACTIVITIES
Proceeds from sales and maturities of investments 108,619,135 347,852,176Interest on investments 130,470 29,658,858Purchase of investments (67,749,912) (326,545,982)
Net cash provided by investing activities 40,999,693 50,965,052
Net (Decrease) in Cash and Cash Equivalents (8,542,765) (14,712,029)
Cash and Cash Equivalents - Beginning of Year 29,643,607 44,355,636
Cash and Cash Equivalents - End of Year $ 21,100,842 $ 29,643,607
See Accompanying Notes to Financial Statements
25

WRIGHT STATE UNIVERSITYStatements of Cash Flows
For the Years Ended June 30, 2016 and 2015
Reconciliation of operating (loss) tonet cash (used) by operating activities: 2016 2015
Operating loss $ (169,880,255) $ (148,780,165)
Depreciation and amortization 20,477,808 20,657,983
Provision for doubtful accounts 677,695 1,247,785
Provision for doubtful loans (37,654) 343,509
Pension expense 2,411,119 (3,711,356)
Changes in assets and liabilities:
Accounts receivable 3,713,224 (6,534,831) Inventory (10,980) 123,695 Prepaid expenses (11,719) (406,791) Advanced charges 273,961 313,680 Other assets (22,899) (10,669) Accounts payable (1,087,147) (529,252) Accrued liabilities 135,281 691,812 Unearned revenue (4,027,244) 4,443,606 Compensated absences 300,000 (400,000)
Refunds and other liabilities (671,007) 784,685 Loans to students and employees 1,641,559 278,871
Net cash (used) by operating activities $ (146,118,258) $ (131,487,438)
Noncash transactions:
Donated capital assets $ 1,344,195 $ 1,064,053
Total noncash transactions $ 1,344,195 $ 1,064,053
See Accompanying Notes to Financial Statements
26

WRIGHT STATE UNIVERSITY FOUNDATION, INC. CONSOLIDATED STATEMENTS OF FINANCIAL POSITION
June 30, 2016 and 2015
The accompanying notes are an integral part of these consolidated financial statements.
2016 2015ASSETS
Cash and cash equivalents $ 1,049,283 $ 1,578,574 Pledges receivable (net) 12,381,300 11,329,600 Gifts receivable from trusts held by others 1,314,700 1,394,640 Investment in securities 112,339,191 118,053,214 Other investments 634,750 900,614 Interest and dividends receivable 160,715 189,449 Capital assets 2,532,135 2,604,131 Annuity assets 744,395 706,048 Other assets 911,754 646,787
Total assets $ 132,068,223 $ 137,403,057
LIABILITIES AND NET ASSETS LIABILITIES Accounts payable Wright State University $ 1,154,789 $ 1,117,925
Trade and other 184,947 307,618 Deposits held in custody for others 1,957,705 2,026,895 Annuities payable 352,100 328,800 Loan payable 600,000 800,000
Total liabilities 4,249,541 4,581,238
NET ASSETS Unrestricted
Designated 1,829,847 2,302,576 Undesignated 3,374,339 5,321,114
Temporarily restricted 78,655,374 82,213,309 Permanently restricted 43,959,122 42,984,820
Total net assets 127,818,682 132,821,819
Total liabilities and net assets $ 132,068,223 $ 137,403,057
27

WRIGHT STATE UNIVERSITY FOUNDATION, INC. CONSOLIDATED STATEMENTS OF ACTIVITIES
For the year ended June 30, 2016 with comparative 2015 totals
The accompanying notes are an integral part of these consolidated financial statements.
Temporarily Permanently Total TotalUnrestricted Restricted Restricted 2016 2015
Revenue and other support Gifts and contributions $ 151,419 $ 8,379,149 $ 878,006 $ 9,408,574 $ 11,572,187
Investment earnings Interest and dividends 1,617,594 4,792,272 - 6,409,866 2,738,783 Net realized and unrealized gains (losses) (2,711,807) (5,854,941) - (8,566,748) (339,458)
Administrative fee charged to certain restricted accounts 845,485 (845,485) - - - Change in value of split interest agreements - (79,940) (12,171) (92,111) (5,333) Other income 205,500 (3,727) 1,417 203,190 273,665 Net assets released from restrictions 9,838,213 (9,838,213) - - - Change in donor restrictions - (107,050) 107,050 - -
Total revenue and other support 9,946,404 (3,557,935) 974,302 7,362,771 14,239,844
Expenses Program services
Scholarships 3,368,276 - - 3,368,276 3,053,382 University programs 5,707,199 - - 5,707,199 4,026,473 Athletic programs 383,793 - - 383,793 677,883 Research 479,000 - - 479,000 538,708 Miscellaneous grants 595,295 - - 595,295 1,082,706
Fund raising 1,415,946 - - 1,415,946 1,599,698 Management and general 416,399 - - 416,399 418,567
Total expenses 12,365,908 - - 12,365,908 11,397,417
Change in net assets (2,419,504) (3,557,935) 974,302 (5,003,137) 2,842,427
Net assets Beginning of year 7,623,690 82,213,309 42,984,820 132,821,819 129,979,392
End of year $ 5,204,186 $ 78,655,374 $ 43,959,122 $127,818,682 $132,821,819
28

WRIGHT STATE UNIVERSITY FOUNDATION, INC. CONSOLIDATED STATEMENTS OF ACTIVITIES
For the year ended June 30, 2015
The accompanying notes are an integral part of these consolidated financial statements.
Temporarily Permanently TotalUnrestricted Restricted Restricted 2015
Revenue and other support Gifts and contributions $ 147,684 $ 9,891,739 $ 1,532,764 $ 11,572,187
Investment earnings Interest and dividends 802,712 1,936,071 - 2,738,783 Net realized and unrealized gains (losses) (563,843) 224,385 - (339,458)
Administrative fee charged to certain restricted accounts 871,936 (871,936) - - Change in value of split interest agreements - (5,900) 567 (5,333) Other income 247,598 16,924 9,143 273,665 Net assets released from restrictions 8,196,784 (8,196,784) - - Change in donor restrictions - 18,982 (18,982) -
Total revenue and other support 9,702,871 3,013,481 1,523,492 14,239,844
Expenses Program services
Scholarships 3,053,382 - - 3,053,382 University programs 4,026,473 - - 4,026,473 Athletic programs 677,883 - - 677,883 Research 538,708 - - 538,708 Miscellaneous grants 1,082,706 - - 1,082,706
Fund raising 1,599,698 - - 1,599,698 Management and general 418,567 - - 418,567
Total expenses 11,397,417 - - 11,397,417
Change in net assets (1,694,546) 3,013,481 1,523,492 2,842,427
Net assets Beginning of year 9,318,236 79,199,828 41,461,328 129,979,392
End of year $ 7,623,690 $ 82,213,309 $ 42,984,820 $ 132,821,819
29

WRIGHT STATE UNIVERSITY FOUNDATION, INC. CONSOLIDATED STATEMENTS OF CASH FLOWS
For the years ended June 30, 2016 and 2015
(Continued)
2016 2015 Cash flows from operating activities
Cash received from contributors $ 8,170,692 $ 6,720,088 Gifts and contributions received for permanently restricted accounts (878,006) (1,532,764) Interest and dividends received 6,429,984 2,807,023 Cash received for other revenue sources 145,262 251,224 Cash paid to students (9,459,269) (7,757,738) Cash paid to employees (416,398) (418,567) Cash paid to suppliers (2,506,626) (3,083,117) Interest paid (8,571) (9,332) Custodial deposits returned (50,000) -
Net cash used in operating activities 1,427,068 (3,023,183)
Cash flows from investing activities Cash paid for investments (7,227,925) (4,384,648) Cash received from investments 4,641,064 4,427,108 Investment in capital assets (47,504) (46,563)
Net cash used in investing activities (2,634,365) (4,103)
Cash flows from financing activities Gifts and contributions received for permanently restricted accounts 878,006 1,532,764 Payments on line of credit (200,000) (200,000)
Net cash from financing activities 678,006 1,332,764
Net change in cash and cash equivalents (529,291) (1,694,522)
Cash and cash equivalents, beginning of year 1,578,574 3,273,096
Cash and cash equivalents, end of year $ 1,049,283 $ 1,578,574
30

WRIGHT STATE UNIVERSITY FOUNDATION, INC. CONSOLIDATED STATEMENTS OF CASH FLOWS
For the Years ended June 30, 2016 and 2015
The accompanying notes are an integral part of these consolidated financial statements.
2016 2015 Reconciliation of change in net assets to net cash used in operating activities
Change in net assets $ (5,003,137) $ 2,842,427 Adjustments to reconcile change in net assets to cash from operating activities
Net realized and unrealized losses 8,566,748 339,458 Gifts and contributions received for permanently restricted accounts (878,006) (1,532,764) Depreciation 119,500 116,887 Changes in assets and liabilities
Pledges receivable (1,051,700) (4,889,300) Gifts receivable from trusts held by others 79,940 (68,540) Interest and dividends receivable 28,733 22,573 Annuity assets (38,347) 109,076 Other assets (264,967) (5,193) Accounts payable (85,806) 35,278 Deposits held in custody for others (69,190) 29,015 Annuities payable 23,300 (22,100)
Net cash used in operating activities $ 1,427,068 $ (3,023,183)
31

WRIGHT STATE APPLIED RESEARCH CORPORATION STATEMENTS OF FINANCIAL POSITION
June 30, 2016 and 2015
The accompanying notes are an integral part of these financial statements.
2016 2015 ASSETS Cash $ 8,706,781 $ 3,290,934
Billed accounts receivable 3,229,636 2,864,107 Unbilled accounts receivable 1,127,062 140,873 Other accounts receivable 1,248 168,361
Other current assets 1,184,661 121,857 Due from Wright State University - 1,718,742
Investment 202,500 202,500 Other assets 300,000 300,000
Property and equipment, net 5,050,671 4,135,258
Total assets $ 19,802,559 $ 12,942,632
LIABILITIES AND NET ASSETS Liabilities Accounts payable $ 629,082 $ 616,613 Other payables 32,788 32,789 Accrued expenses 738,407 90,858
Due to Wright State University 5,019,168 7,126,607 Deferred revenue 7,503,496 2,640,430 Total liabilities 13,922,941 10,507,297
Net assets Unrestricted 5,879,618 2,435,335
Total liabilities and net assets $ 19,802,559 $ 12,942,632
32

WRIGHT STATE APPLIED RESEARCH CORPORATION STATEMENTS OF ACTIVITIES
For the years ended June 30, 2016 and 2015
The accompanying notes are an integral part of these financial statements.
2016 2015 Revenue
Contract and grant revenue $ 15,191,206 $ 15,243,528
Expenses Program services
Direct labor 5,886,830 6,148,943 Travel 96,796 103,554 Subcontract costs 4,136,382 3,837,443 Other direct costs 409,553 1,681,274 Facility cost allocated 487,523 437,072
Total program services expenses 11,017,084 12,208,286
Support services Overhead 3,017,333 1,775,857 General and administration 2,772,522 1,953,482
Total support services 5,789,855 3,729,339
Other (income) expenses Rental income (115,390) (31,145)
Facility expenses 368,560 46,206 Other unallowable expenses 273,577 16,735
Miscellaneous income (7,859) (1,039)
Total other (income) expenses 518,888 30,757
Total expenses 17,325,827 15,968,382
Change in net assets before contributions (2,134,621) (724,854)
Contribution 1,194,444 150,000 Contribution to equity 4,384,460 -
Change in net assets 3,444,283 (574,854)
Net assets Beginning of year 2,435,335 3,010,189
End of year $ 5,879,618 $ 2,435,335
33
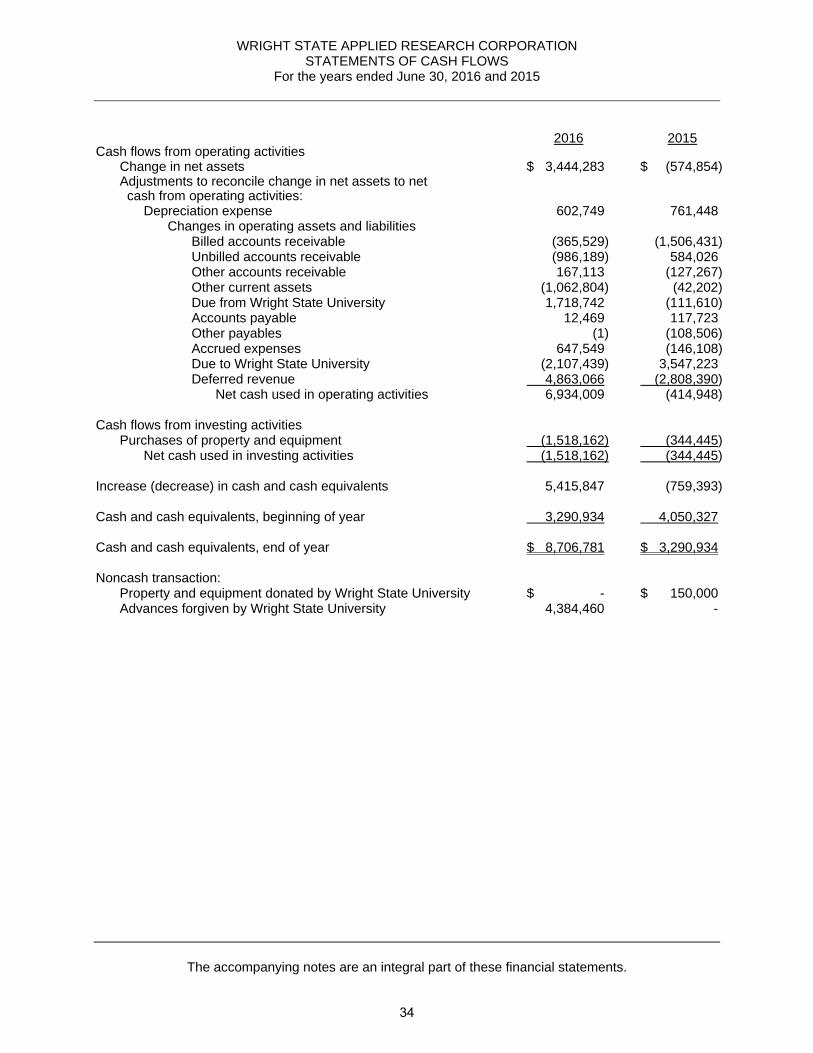
WRIGHT STATE APPLIED RESEARCH CORPORATION STATEMENTS OF CASH FLOWS
For the years ended June 30, 2016 and 2015
The accompanying notes are an integral part of these financial statements.
2016 2015Cash flows from operating activities
Change in net assets $ 3,444,283 $ (574,854) Adjustments to reconcile change in net assets to net cash from operating activities:
Depreciation expense 602,749 761,448 Changes in operating assets and liabilities
Billed accounts receivable (365,529) (1,506,431) Unbilled accounts receivable (986,189) 584,026 Other accounts receivable 167,113 (127,267) Other current assets (1,062,804) (42,202) Due from Wright State University 1,718,742 (111,610) Accounts payable 12,469 117,723 Other payables (1) (108,506) Accrued expenses 647,549 (146,108) Due to Wright State University (2,107,439) 3,547,223Deferred revenue 4,863,066 (2,808,390)
Net cash used in operating activities 6,934,009 (414,948)
Cash flows from investing activities Purchases of property and equipment (1,518,162) (344,445)
Net cash used in investing activities (1,518,162) (344,445)
Increase (decrease) in cash and cash equivalents 5,415,847 (759,393)
Cash and cash equivalents, beginning of year 3,290,934 4,050,327
Cash and cash equivalents, end of year $ 8,706,781 $ 3,290,934
Noncash transaction: Property and equipment donated by Wright State University $ - $ 150,000 Advances forgiven by Wright State University 4,384,460 -
34

WRIGHT STATE UNIVERSITY
Notes to Financial Statements
Years Ended June 30, 2016 and 2015
(1) Organization and Summary of Significant Accounting Policies
Organization and Basis of Presentation
Wright State University (the University) is a state-assisted institution of higher education created in 1967. The University has an enrollment of approximately 18,000 undergraduate, graduate, and professional students on its two campuses. The financial statements include the university’s eight colleges, three schools, and other individual departments. The university’s Board of Trustees approves policies and procedures by which the University is governed.
The university’s financial statements have been prepared in accordance with accounting principles generally accepted in the United States of America, as prescribed by the Governmental Accounting Standards Board (GASB). The University is a political subdivision of the State of Ohio and accordingly, its financial statements are discretely presented in the State of Ohio’s Comprehensive Annual Financial Report in accordance with GASB Statement No. 14, and amended by GASB Statement Nos. 39 and 61. These statements provide additional guidance to determine whether certain organizations for which the University is not financially accountable should be reported as a component unit of the University based upon the nature and significance of their relationship to the University. Although the Wright State University Foundation (the Foundation) and the Wright State Applied Research Corporation (WSARC) are legally separate, tax-exempt entities, it has been determined they meet the criteria for discrete presentation within the university’s financial statements. This was implemented for WSARC retroactively as of July 1, 2015 as management had previously deemed it to be immaterial. Presentation of financial information for the Foundation has been changed from multi-column presentation to a separate page presentation for June 30, 2016. The Foundation and WSARC are private nonprofit organizations that report under Financial Accounting Standards Board (FASB) standards that have been codified in Accounting Standards Codification (ASC) 958, Not-for-Profit Entities. As such, certain revenue recognition criteria and presentation features are different from GASB revenue recognition criteria and presentation features. No modifications have been made to the Foundation’s or WSARC’s financial information in the university’s financial reporting entity for these differences.
The Foundation is the primary fund-raising organization for the University and contributions to the Foundation are primarily restricted to the activities of the University. These contributions are relied upon for the on-going operations of the University. The Foundation is exempt for federal income taxes under Section 501(c)(3) of the Internal Revenue Code. Complete financial statements for the Foundation can be obtained by sending a request to the Wright State University Foundation Bldg., 3640 Colonel Glenn Highway, Dayton, OH 45435.
WSARC is the contracting entity for the Wright State Research Institute (WSRI), a department of the University. WSARC maintains a tax-exempt status according to the provisions of Section 501(c)(3) of the Internal Revenue Service. WSARC provides applied research services such as business development, total cost accounting and recovery, Federal Acquisition Regulations based contracting support for large contracts, security support and special facilities for classified contracts to WSU and WSRI. Complete financial statements for WSARC can be obtained by sending a request to the Wright State Applied Research Corporation, 4035 Colonel Glenn Highway, Suite 100, Beavercreek, OH 45431.
35

Wright State University
Notes to Financial Statements (Continued)
No other affiliated organization, such as the Alumni Association, meets the requirements for inclusion in the university’s financial statements.
Summary of Significant Accounting Policies
Basis of Accounting The financial statements of the University have been prepared using the economic resources measurement focus and on the full accrual basis of accounting, whereby revenue is recognized in the period earned, or in the case of advances from other governments, when all eligibility requirements are met in accordance with GASB Statement No. 33, Accounting and Financial Reporting for Nonexchange Transactions. Expenses are recognized when the related liabilities are incurred.
Financial Statements The University reports as a business-type activity, as defined by GASB Statement No. 35, Basic Financial Statements - and Management’s Discussion and Analysis - for Public Colleges and Universities. Business-type activities are those that are financed in whole or in part by fees charged to external parties for goods or services.
New Accounting Standards Adopted In fiscal year 2016, the University adopted new accounting standard GASB Statement No. 72, Fair Value Measurement and Application issued in February 2015. This Statement addresses accounting and financial reporting issues related to fair value measurements. This statement provides guidance for determining a fair value measurement for financial reporting purposes. It also provides guidance for applying fair value to certain investments and disclosures related to all fair value measurements.
Upcoming Accounting Standards In June 2015, the GASB issued GASB Statement No. 75, Accounting and Financial Reporting for Postemployment Benefits Other Than Pensions. Under GASB 75 and similar to GASB 68 (pensions), the University, as a cost-sharing employer, will be required to recognize its proportionate share of the collective unfunded net Other Post-Employment Benefits (OPEB) liability, OPEB expense, and deferred OPEB outflows (inflows) of the state’s retirement system plans within its financial statements. This will be a significant change for every participating employer in all cost-sharing plans around the country. Institutions will see a significant liability reflected on their balance sheets along with an impact to OPEB expenses and a corresponding reduction to unrestricted net position. The GASB also necessitates expanded disclosures and required supplemental information to the university’s financial statements. The University will also be required to track certain components of the net OPEB liability (deferred inflows/outflows) and amortize them over the appropriate periods in accordance with the standard. The University has not yet determined its share of the unfunded net OPEB liability; but it is expected to be significant and material to the university’s financial statements. The provisions of this statement are effective for financial statements for the year ending June 30, 2018.
Net position • Net investment in capital comprises total investment in capital assets, net of accumulated
depreciation, reduced by the outstanding balances of bonds, mortgages, notes, and otherborrowings that are attributable to the acquisition, construction, or improvement of thoseassets, and related debt.
• Restricted net position consists of restricted assets, deferred outflows of resources, liabilities,and deferred inflows of resources related to those assets. Expendable restricted net positionrepresents resources in which the University is legally or contractually obligated to spendresources in accordance with restrictions imposed by external third parties such as guarantors.
36

Wright State University
Notes to Financial Statements (Continued)
• Unrestricted net position represents the net amount of the assets, deferred outflows ofresources, liabilities, and deferred inflows of resources that are not included in thedetermination of net investment in capital or the restricted component of net position. This netposition is not subject to external restrictions. Management or the Board of Trusteesdesignates most of the unrestricted net position for specific purposes in research, academic,capital acquisition, or other initiatives.
It is the university’s policy to first apply restricted resources when an expense is incurred for purposes for which both restricted net position and unrestricted net position are available.
Cash and Cash Equivalents Cash and cash equivalents include amounts held in the State Treasury Asset Reserve of Ohio (STAROhio). In addition, external investment managers may maintain balances in a money market fund. These balances are included as cash equivalents due to their high liquidity and short-term nature. Other investments purchased with three months or less to maturity are also considered cash equivalents.
Investments All investments are stated at fair value in accordance with GASB statement 72, Fair Value Measurement and Application. Investments of publically traded securities are reported at fair value, as established by the major securities markets. Money market investments (U.S. Treasury and Agency obligations) that have a remaining maturity of one year or less at the time of purchase are reported at amortized cost and approximate fair value. Investment income is recognized on an accrual basis. Purchases and sales of investments are accounted for on the trade date basis. Investment trade settlements receivable and payable represent investment transactions occurring on or before June 30, which settle after such date. Realized and unrealized gains and losses are reported as investment income or loss.
All securities purchased by external investment managers in the university’s “liquidity” and “diversified” investment pools, with the exception of money market purchases and redemptions, are considered investments regardless of maturity date, as these investment pools are designed more for capital appreciation and have average durations of at least two years. Investments with maturities of less than one year are considered short-term or current.
Alternative investments are generally less liquid than publically traded securities and include private equity, investments in real assets, and other strategies. These alternative investments are intended to reduce market risk, credit risk and interest rate risk. The University believes the carrying amounts of these holdings are reasonable estimates of the fair values as of year-end. Because these investments are not readily marketable, the estimated value is subject to uncertainty, and therefore, may differ from the value that would have been used had a ready market for the investment existed. Such difference could be material.
Inventories Inventories - which consist principally of publications, general merchandise and other goods - are stated at the lower of cost or market. Cost is determined using the first-in, first-out (FIFO) method.
Capital Assets and Collections Capital assets include land, land improvements, infrastructure, buildings, machinery, equipment, software, library books, publications and construction in progress. They are recorded at cost at the date of acquisition, or fair market value at the date of donation in the case of gifts. Building renovations that materially increase the value or extend the useful life of the structure are also capitalized. Normal repairs and maintenance are expensed in the year in which the expenses are incurred. The threshold for capitalizing moveable equipment with an estimated useful life of more than one year is $5,000. Using the straight-line method, capital assets are depreciated over their estimated useful lives; generally, 40 years for buildings, 30 years for land improvements and
37

Wright State University
Notes to Financial Statements (Continued)
infrastructure, 15 years for library books and publications, and 5 to 10 years for machinery and equipment. The University does not capitalize works of art or historical treasures that are held for exhibition, education, research, and public service. These collections are not encumbered or sold for financial gain. Consequently, such collections are not recognized in the financial statements. Effective with the fiscal year ended June 30, 2015, the capitalization threshold for the purchase of moveable equipment may be waived when the acquisition is related to a major project. Moveable equipment items attributable to a major project may be capitalized and depreciated over a 5 year useful life. A major project is defined as a project in which: (1) the total construction cost (building improvement, land improvement, infrastructure, etc.) is anticipated to be $100,000 or more and the moveable capital equipment expenditures are expected to be at least $100,000; or (2) although the construction costs are anticipated to be less than $100,000, the total project costs, including moveable equipment, are anticipated to be at least $200,000.
Compensated Absences Compensated absences is comprised of vacation and sick leave benefits. Vacation benefits are accrued as a liability as the benefits are earned if the employee’s right to receive compensation is attributable to service already rendered and it is probable that the employer will compensate the employee for the benefits through paid time off or some other means. Sick leave benefits are accrued as a liability using the vesting method. The liability includes employees currently eligible to receive termination benefits and those identified as probable of receiving payment in the future.
Unearned Revenue Unearned revenue primarily consists of the amounts received in advance from grant and contract sponsors that have not yet been earned under the terms of the agreement and amounts received in advance for tuition and fees not yet earned. These amounts were $5.5 million and $17.2 million, respectively, for the year ended June 30, 2016 and $8.3 million and $17.6 million, respectively, for the year ended June 30, 2015.
Deferred Outflows and Inflows of Resources Deferred outflows represent the consumption of resources that are applicable to a future reporting period but do not require any further exchange of goods or services. Deferred outflows of resources in the university’s financial statements consist of the unamortized deferred refunding balance and pension related balances.
Deferred inflows represent an acquisition of resources that apply to a future period and will not be recognized as revenue until that time. Deferred inflows in the university’s financial statements are related to pensions and are further explained in Note 7.
Revenues and Expenses Revenues and expenses are classified as operating or nonoperating. Operating revenues are resources primarily from exchange transaction activities. These include payments received for services, such as tuition and fees, and most grants and contracts. Nonoperating revenues are from non-programmatic sources and have the characteristics of nonexchange transactions. They include state appropriations, some federal and state grants, gifts, and investment income. Nearly all of the university’s expenses are a result of exchange transactions, and therefore classified as operating expenses. The major recurring nonoperating expenses are net losses on the disposition of capital assets and interest expense on capital assets-related debt.
Pensions For purposes of measuring the net pension liability, deferred outflows of resources and deferred inflows of resources related to pensions, and pension expense, information about the fiduciary net position of the Ohio Public Employees Retirement System (OPERS) and the State Teachers Retirement System of Ohio (STRS) and additions to/deductions from their fiduciary net positions have been determined on the same basis as reported by these pension systems. For this purpose,
38

Wright State University
Notes to Financial Statements (Continued)
benefit payments (including refunds of employee contributions) are recognized when due and payable in accordance with the benefit terms. The pension systems report investments at fair value.
Scholarship Allowances Scholarship allowances represent aid awarded to the student in the form of reduced tuition and are computed and reported in the financial statements under the alternate method as prescribed by the National Association of College and University Business Officers (NACUBO). Financial aid in the form of a cash payment to the student is reported as scholarship and fellowship expense in the financial statements. Third party loans such as Stafford loans and certain aid awarded to the students by third parties are credited to the student’s account as if the student made the payment.
Income Taxes The University is exempt from federal income taxes under Section 115 of the Internal Revenue Code. However, certain revenues are considered unrelated business income and are taxable under Internal Revenue Code Sections 511 through 513.
Estimates The preparation of financial statements in conformity with accounting principles generally accepted in the United States of America requires management to make estimates and assumptions that affect the reported amounts of assets and liabilities and disclosure of contingent assets and liabilities at the date of the financial statements and the reported amounts of revenues and expenses during the reporting period. Actual results could differ from those estimates.
(2) Cash, Cash Equivalents and Investments
The classification of cash, cash equivalents and investments in the financial statements is based on criteria set forth in GASB Statement No. 9. Cash equivalents are defined to include investments with original maturities of three months or less. Consistent with this definition, university funds on deposit in the State Treasury Asset Reserve of Ohio are classified as cash equivalents in the Statements of Net Position. However, for GASB Statement No. 3 disclosure purposes (see below), the funds in the State Treasury Asset Reserve of Ohio are classified as investments.
Deposits
Under state law, the university’s deposits must be secured by Federal Deposit Insurance and collateralized for amounts in excess of FDIC coverage. Collateral may be pledged or pooled. Pooled collateral may be held on the financial institution’s premises or held by its trust department or agent on its behalf. The fair value of the pledged securities plus the federal deposit insurance must at all times equal one hundred five percent of the total amount of public deposits to be secured by the pooled securities. These securities may be held in the name of the University or the pledging bank by a holding or custodial bank that is mutually acceptable to both parties. The University does not have a deposit policy for custodial credit risk.
As of June 30, 2016 and 2015, the university’s bank balances are $22,854,386 and $25,927,565, respectively. Of these balances, $21,002,029 and $20,180,275, respectively, are uninsured with collateral held by pledging banks not in the university’s name.
39

Wright State University
Notes to Financial Statements (Continued)
At June 30, the carrying amount of deposits (book balances) is as follows:
2016 2015
Petty cash $ 39,807 $ 36,798 Demand deposits 19,931,911 18,582,834 Money market funds 46,178 3,881,912
Total $ 20,017,896 $ 22,501,544
The difference in the carrying amount and bank balances is caused by items in-transit (primarily outstanding checks) and by cash on hand.
Investments - Fair Value
Wright State University’s Board of Trustees approved a revision to the university’s Investment Policy Statement in October 2014. The revised policy established a discretionary model in which a fiduciary manager is responsible for investing the university’s portfolio utilizing a fund of funds approach. This Investment Policy provides for the prudent investment of the university’s assets in a manner which will meet three main objectives: safety, liquidity and return on investment. The Investment Policy parallels state law which requires an amount equal to at least twenty-five percent of the university’s investment portfolio be invested in securities of the United States government or one of its agencies or instrumentalities, the treasurer of the State of Ohio’s pooled investment program, obligations of the State of Ohio, or any political subdivision of the State of Ohio, certificates of deposit of any national bank located in the State of Ohio, written repurchase agreements with any eligible Ohio financial institution that is a member of the federal reserve system or federal home loan bank, money market funds or bankers’ acceptances maturing in two hundred seventy days or less which are eligible for purchase by the federal reserve system.
The University categorizes its investments within the fair value hierarchy established by generally accepting accounting principles. Fair value is the price that would be received for an asset or paid to transfer a liability (an exit price) on the measurement date in the university’s principal or most advantageous market. The hierarchy is based on the valuation inputs used to measure the fair value of the asset. Level 1 inputs are quoted prices in active markets for identical assets; Level 2 inputs are significant other observable inputs; Level 3 inputs are significant unobservable inputs. Some investments are valued at net asset value (NAV) and are therefore not subject to the hierarchy classification.
40

Wright State University
Notes to Financial Statements (Continued)
The fair value of university investments at June 30 is as follows:
Quoted Prices Significant
in Active Markets Other Significant
for Identical Observable Unobservable
Assets Inputs Inputs
Totals (Level 1) (Level 2) (Level 3) Other
Investment in securities:
Stocks and traded securities $ 779,013 $ 779,013 $ $ $
State Treasury Asset Reserve
of Ohio (STAROhio) 1,082,946 1,082,946
Mutual funds:
Equity 15,291,205 15,291,205
Fixed income 8,925,588 8,925,588
Alternative assets:
Hedge funds 6,831,933 6,831,933
Private equity partnerships 5,760,937 5,760,937
Distressed debt 6,337,309 6,337,309
Private real estate 3,484,820 3,484,820
Total investments in securities 48,493,751 26,078,752 22,414,999
Other investments:
Real estate 3,200 3,200
Total other investments 3,200 3,200
Total investments $ 48,496,951 $ 26,078,752 $ $ 3,200 $ 22,414,999
2016
Quoted Prices Significant
in Active Markets Other Significant
for Identical Observable Unobservable
Assets Inputs Inputs
Totals (Level 1) (Level 2) (Level 3) Other
Investment in securities:
Stocks and traded securities $ 821,444 $ 821,444 $ $ $
State Treasury Asset Reserve
of Ohio (STAROhio) 7,142,063 7,142,063
Mutual funds:
Equity 38,922,420 38,922,420
Fixed income 31,967,450 31,967,450
Alternative assets:
Hedge funds 7,600,748 7,600,748
Private equity partnerships 3,412,357 3,412,357
Distressed debt 6,719,646 6,719,646
Total investments in securities 96,586,128 78,853,377 17,732,751
Other Investments:
Real estate 3,200 3,200
Total other investments 3,200 3,200
Total investments $ 96,589,328 $ 78,853,377 $ $ 3,200 $ 17,732,751
2015
41

Wright State University
Notes to Financial Statements (Continued)
The balance of deposits and investments reported above are included in the Statements of Net Position as follows:
2016 2015
Deposits $ 20,017,896 $ 22,501,544 Investments 48,496,951 96,589,328
Total $ 68,514,847 $ 119,090,872
Included in the Statements of Net PositionCash and cash equivalents $ 16,967,812 $ 20,785,641 Restricted cash and cash equivalents 4,133,030 8,857,966 Short-term investments 3,764,610 20,344,411 Long-term investments 43,649,395 69,102,854
Total $ 68,514,847 $ 119,090,872
Year Ended June 30
Balances held in the State of Treasury Asset Reserve of Ohio (STAROhio) are included in the total fair value of investments for disclosure purposes. However, these balances are considered cash and cash equivalents for reporting on the Statements of Net Position. The following presents a reconciliation of the fair value of investments reported above to the investments reported on the Statements of Net Position.
2016 2015
Total fair value of investments $ 48,496,951 $ 96,589,328 State Treasury Asset
Reserve (STAROhio) 1,082,946 7,142,063
Fair value of investments less STAROhio $ 47,414,005 $ 89,447,265
Included in the Statements of Net PositionsShort-term investments $ 3,764,610 $ 20,344,411 Long-term investments 43,649,395 69,102,854
Total $ 47,414,005 $ 89,447,265
Year Ended June 30
Because alternative investments - hedge funds, private equity, distressed debt and private real estate – have no active market, they are valued using NAV which is based on information such as historical and current performance of the underlying assets; cash flow projections; liquidity and credit premiums required by a market participant; and financial trend analysis with respect to the individual fund manager. Furthermore the liquidity of these investments may be impacted by the lack of a present market for the interest in the funds, lock-up periods, redemption notice periods and limits to the frequency of redemptions.
42

Wright State University
Notes to Financial Statements (Continued)
The following table provides additional information for those assets valued using NAV:
Redemption Earliest
Redemption Notice Lock-up Redemption
2016 2015 Frequency Period Period Date
Alternative assets:
Hedge funds $ 6,831,933 $ 7,600,748 semi- annual 95 days 24 mos. 6/30/2017
Private equity 4,245,545 3,341,180 not liquid not liquid
Private equity 1,515,392 71,177 not liquid not liquid
Distressed debt 6,337,309 6,719,646 quarterly 65 days 24 mos. 3/31/2017
Private real estate 3,484,820 quarterly 65 days
Total $ 22,414,999 $ 17,732,751
Fair Value June 30
The university’s hedge fund allocation is invested in a “fund of funds” structured as an offshore company. The fund’s investment objective is to achieve high returns balanced against an appropriate level of volatility and directional market exposure over a full market cycle. The fund is broadly diversified and invests in various private funds such as hedge funds that pursue hedged or other alternative investment strategies, private equity funds, hybrid funds and any other alternative investment funds, while also opportunistically investing directly in any other securities and financial instruments. The fund’s portfolio may be allocated across several hedge fund styles and strategies, including, but not limited to credit hedging, distressed debt, equity long/short and global macro. The fund generally invests in 15-25 funds and the fund of funds manager requires full transparency of each of the underlying funds’ investment positions. The University is subject to the fund’s initial two-year lock-up period which expires in January 2017. Redemptions are on a semi-annual basis with 95 days prior notification. The University has no significant unfunded commitments to this hedge fund allocation as of June 30, 2016 and 2015.
Approximately 74% of the university’s private equity partnership is a domestic partnership for the purpose of making private equity investments (the “Investee Funds”). The partnership is typically invested in venture capital, growth equity and buyout funds focusing on oil and gas exploration, technology, healthcare and telecom sectors. The investments consist of nonmarketable limited partnership interests in a select group of nonregistered private investment partnerships for long term capital appreciation. It is estimated the underlying assets of the investments will generally be liquidated in the next 6 to 9 years. Certain of the Investee Funds may take additional time to liquidate which will in turn impact the timing of when the University will be in a position to liquidate itself from the partnership. During the fiscal year ended June 30, 2012, Wright State University made a $5,000,000 original commitment to this fund. As of June 30, 2016 and 2015, the university’s outstanding commitment related to this is $1,350,000 and $2,000,000, respectively.
The remaining 26% of the university’s private equity fund investment is structured as a domestic partnership in which the University is a limited partner. The investment objective of the partnership is to achieve an attractive risk-adjusted return relative to other asset class alternatives through the identification and selection of a set of private assets managers across a broad spectrum of private equity, real estate, infrastructure and real assets whose stated terms are 5 to 7 years. Diversification is accomplished by investing 40-60% of committed capital in underlying funds focused on the United States, 20-40% on Europe and 0-30% on emerging markets. Capital commitments of the limited partners are payable to the partnership in installments over a 3–5 year period. During the fiscal year ended June 30, 2015, Wright State University made a $4,900,000 original commitment to this fund. As of June 30, 2016 and 2015, the university’s outstanding commitment related to this is $3,436,404 and $4,828,823, respectively.
The university’s investment in distressed debt is in the form of a fund that invests in a diversified portfolio of structured credit instruments, the majority of which are Collateralized Debt Obligation
43
Wright State University
Notes to Financial Statements (Continued)
(CDO) equity and mezzanine notes. CDOs are structured finance securities that hold a diversified pool of income-generating collateral that is financed through the issuance of debt securities. CDO investors assume the first level of default risk. These notes are lowly correlated to traditional and other alternative investments, have minimal interest rate risk, and are highly transparent. In addition to CDOs, investments in the fund may include fixed income securities, loan participations, credit-linked notes, medium term notes, registered and unregistered investment companies or pooled investment vehicles and derivatives instruments such as credit default swaps and total return swaps. The University is subject to the fund’s initial two-year lock-up period which expires in January 2017. Redemptions are on a quarterly basis with 65 days prior notification. At June 30, 2016, the University has no significant unfunded commitments to this hedge fund allocation.
The university’s investment in private real estate seeks both current and long-term capital appreciation principally through investing in pooled investment vehicles that invest in commercial real estate properties. The investment strategy targets approximately 80–95% of the fund’s net assets for investment in open-end core funds focused on high-quality core real estate properties. The remaining 5–25% of the net assets may be invested in liquid real estate strategies for cash management purposes or less liquid higher return strategies and properties focused on value-added and opportunistic real estate opportunities. No more than 25% of the net assets in the funds are focused on investments outside the United States. Redemptions are on a quarterly basis with 65 days prior notification. On June 30, 2016, the University notified the fund of its intent to exercise its redemption option. The fund was subsequently liquidated on July 29, 2016.
Investments – Risks
The various investments in stocks, securities, mutual funds and other investments are exposed to a variety of uncertainties, including interest rate, market and credit risks. Due to the level of risk associated with certain investments, it is possible changes in the values of these investments could occur in the near term. Such changes could materially affect the amounts reported in the financial statements of the University. The Investment Policy has established asset allocations and permissible asset classes in order to minimize the various risks and the probability of loss. The new Investment Policy provides for a portfolio comprised of mutual funds managed in accordance with the diversification and industry concentration restrictions set forth in the Investment Company Act of 1940 which provides, among other things, protection in terms of concentration of risk for issuers and for industry sectors.
Interest Rate Risk The university’s Investment Policy minimizes the risk of the loss of value due to changing interest rates through the use of target durations for each of the university’s investment pools. The Cash Pool is maintained to meet the daily obligations of the University and consists of highly liquid instruments with little to no risk of loss of principal. The Liquidity Pool provides a source of funds in the event the Cash Pool is insufficient to meet the university’s cash needs and maintains a weighted average life of less than five years. The Diversified Investment Pool provides the University an opportunity to earn a higher rate of return through investments with longer durations.
44

Wright State University
Notes to Financial Statements (Continued)
The maturities of the university’s interest bearing investments at June 30 are as follows:
LessInvestment Type Fair Value Than 1 1-5 6-10
Bond funds $ 8,925,588 $ 279,789 $ 6,320,604 $ 2,325,195
Total $ 8,925,588 $ 279,789 $ 6,320,604 $ 2,325,195
LessInvestment Type Fair Value Than 1 1-5 6-10
Bond funds $ 31,967,450 $ 6,380,762 $ 13,963,649 $ 11,623,039
Total $ 31,967,450 $ 6,380,762 $ 13,963,649 $ 11,623,039
2016 Investment Maturities (in years)
2015 Investment Maturities (in years)
Credit Risk Credit risk is the risk the issuer or other counterparty to an investment will not fulfill its obligation to the holder of the investment. Credit quality information, commonly expressed in terms of credit ratings issued by nationally recognized rating organizations such as Moody’s Investors Service; Standard & Poor’s; or Fitch Ratings, provides a current depiction of potential variable cash flows and credit risk. The university’s Investment Policy limits exposure to credit risk by limiting purchases of fixed income securities to no lower than AA for the Cash Pool and Liquidity Pool accounts. The vast majority of portfolio mutual fund holdings are required to invest in investment grade funds. The only exception to this represents those funds held as part of the high yield strategy. The allocation for this is targeted at three percent of the overall portfolio.
The university’s credit risk at June 30 is as follows:
Investment Type Total AAA/Aaa AA/Aa A BBB/Baa B
State Treasury Asset
Reserve (STAROhio) $ 1,082,946 $ 1,082,946 $ $ $ $
Bond funds 8,925,588 2,527,987 3,792,617 279,789 1,199,029 1,126,166
Total $ 10,008,534 $ 3,610,933 $ 3,792,617 $ 279,789 $ 1,199,029 $ 1,126,166
Investment Type Total AAA/Aaa AA/Aa A BBB/Baa B
State Treasury Asset
Reserve (STAROhio) $ 7,142,063 $ 7,142,063 $ $ $ $
Bond funds 31,967,450 14,236,809 11,966,551 3,382,137 2,381,953
Total $ 39,109,513 $ 7,142,063 $ 14,236,809 $ 11,966,551 $ 3,382,137 $ 2,381,953
2016 Credit Ratings
2015 Credit Ratings
45

Wright State University
Notes to Financial Statements (Continued)
Custodial Credit Risk For an investment, custodial credit risk is the risk that, in the event of the failure of the counterparty, the University will not be able to recover the value of its investments or collateral securities in the possession of an outside party. As of June 30, 2016 and 2015, none of the university’s investments were exposed to custodial, counterparty credit risk. The university’s Investment Policy minimizes custodial credit risk through the use of mutual funds and other pooled asset portfolios transacted through national reputable brokerage firms protected by the Securities Investor Protection Corporation.
Concentration of Credit Risk Concentration of credit risk is the risk associated with a lack of diversification. It is the risk of loss attributed to the magnitude of the university’s investment in a single issuer. Investments are diversified within asset classes with the intent to minimize the risk of losses to the portfolio. As previously mentioned, concentration of credit risk is managed at the mutual fund level as required by the Investment Company Act of 1940. As of June 30, 2016 and 2015, the University has no reportable concentration of credit risk as no one single issuer constitutes more than five percent of the university’s investment portfolio
Foreign Currency Risk Foreign currency risk relates to the possible adverse effects changes in exchange rates can have on the fair value of investments. As of June 30, 2016 and 2015, the university’s exposure to foreign currency is limited to its investment in international mutual funds of $6,691,998 and $15,344,015, respectively.
Unspent Debt Proceeds The university’s unspent debt proceeds at June 30 are as follows:
Debt Date Issued Amount Issued 2016 2015
Series 2011A November 2011 $ 55,240,000 $ 1,702,798 $ 4,477,279 Series 2012 November 2012 23,195,000 2,379,193 3,705,706 2013 Notes
Series A & B February 2013 25,000,000 51,039 674,981
Total $ 103,435,000 $ 4,133,030 $ 8,857,966
Amount Unspent
The unspent proceeds are held in Project Fund trust accounts as provided for in the bond resolutions approved by the Board of Trustees. The bond resolutions also require the bond proceeds to be held by a bank or trust company which is a member of the Federal Deposit Insurance Corporation. The Bank of New York Mellon acts as the trustee of the bond project funds for the Series 2011 and 2012 bonds. The Huntington National Bank acts as the trustee of the project fund for 2013 Notes Series A and B. As of June 30, 2016 and 2015, $4,133,030 and $8,857,966, respectively, of the unspent debt related proceeds are classified as restricted cash and cash equivalents in the Statements of Net Position.
46

Wright State University
Notes to Financial Statements (Continued)
For disclosure purposes the trust account balances as of June 30 are classified as follows:
2016 2015Carry amount of deposits:
Demand deposits $ 4,133,030 $ 8,182,985 Money market funds 674,981
Total unspent bond proceeds $ 4,133,030 $ 8,857,966
Year Ended June 30
Investment Income (Loss)
The composition of investment income (loss) is as follows:
2016 2015Net interest and dividend income $ 969,336 $ 1,832,627 Realized gains (losses) on sales (812,393) 27,747,945 Unrealized gains (losses) in fair value (1,164,036) (25,276,335)
Total $ (1,007,093) $ 4,304,237
Year Ended June 30
(3) Accounts Receivable
The composition of accounts receivable at June 30 is as follows:
2016 2015
Sponsor receivables $ 9,970,117 $ 12,158,559Student and student-related accounts 13,943,220 14,508,479Wright State University Foundation 1,154,789 1,117,925Wright State Applied Research Corporation 5,019,168 7,126,607Interest receivable 52,127 76,252State appropriations 1,264,605 257,845Other, primarily departmental sales and services 1,748,861 1,531,728
Total 33,152,887 36,777,395Less: Allowance for doubtful accounts 1,655,000 1,696,000
Net accounts receivable$
31,497,887$
35,081,395
47

Wright State University
Notes to Financial Statements (Continued)
(4) Capital Assets
Capital assets activity for the years ended June 30, 2016 and 2015 is summarized as follows:
Balance Balance7/1/2015 Additions Retirements Transfers 6/30/2016
Land $ 4,051,702 $ $ $ $ 4,051,702 Land improvements and infrastructure 58,925,326 1,464,075 (27,623) 60,361,778 Buildings 449,708,100 15,902,161 1,038,816 466,649,077 Machinery and equipment 87,433,105 5,463,777 (17,334,312) 75,562,570 Library books and publications 54,389,003 1,472,878 (2,042,047) 53,819,834 Construction in progress 10,831,408 8,012,772 (1,038,816) 17,805,364
Total 665,338,644 32,315,663 (19,403,982) 678,250,325
Less accumulated depreciation: Land improvements and infrastructure 19,952,003 2,034,467 (76) 21,986,394 Buildings 173,858,649 10,591,824 184,450,473 Machinery and equipment 66,945,530 5,998,502 (15,718,262) 57,225,770 Library books and publications 38,587,350 2,143,710 (2,042,047) 38,689,013 Total accumulated depreciation 299,343,532 20,768,503 (17,760,385) 302,351,650
Capital assets, net $ 365,995,112 $ 11,547,160 $ (1,643,597) $ $ 375,898,675
Balance Balance7/1/2014 Additions Retirements Transfers 6/30/2015
Land $ 4,051,702 $ $ $ $ 4,051,702 Land improvements and infrastructure 56,351,309 2,574,017 58,925,326 Buildings 388,537,227 38,996,096 (12,778) 22,187,555 449,708,100 Machinery and equipment 83,010,539 7,581,964 (3,159,398) 87,433,105 Library books and publications 53,833,454 1,503,864 (948,315) 54,389,003 Construction in progress 29,315,594 5,803,369 (2,100,000) (22,187,555) 10,831,408
Total 615,099,825 56,459,310 (6,220,491) 665,338,644
Less accumulated depreciation: Land improvements and infrastructure 18,135,679 1,816,324 19,952,003 Buildings 164,565,449 9,299,110 (5,910) 173,858,649 Machinery and equipment 62,213,130 7,586,052 (2,853,652) 66,945,530 Library books and publications 37,288,473 2,247,192 (948,315) 38,587,350 Total accumulated depreciation 282,202,731 20,948,678 (3,807,877) 299,343,532
Capital assets, net $ 332,897,094 $ 35,510,632 $ (2,412,614) $ $ 365,995,112
48

Wright State University
Notes to Financial Statements (Continued)
(5) Long-Term Liabilities
Long-term liabilities consist of bonds payable, notes payable, equipment lease purchase obligations, and compensated absences. Activity for long-term liabilities for the years ended June 30, 2016 and 2015 is summarized as follows:
Beginning EndingBalance Balance Current
07/01/2015 Additions Reductions 06/30/2016 PortionBonds, notes and equipmentlease purchase obligations:
General obligation bonds $ 77,447,271 $ $ 5,413,708 $ 72,033,563 $ 5,615,295Notes payable 22,462,192 1,559,578 20,902,614 1,587,338Equipment leases 22,677 22,677
Total bonds, notes and equipment leases 99,932,140 6,995,963 92,936,177 7,202,633
Other liabilities:Compensated absences 16,200,000 5,087,314 4,787,314 16,500,000 5,000,000
Total other liabilities 16,200,000 5,087,314 4,787,314 16,500,000 5,000,000
Total long-term liabilities $ 116,132,140 $ 5,087,314 $ 11,783,277 $ 109,436,177 $ 12,202,633
Beginning EndingBalance Balance Current
07/01/2014 Additions Reductions 06/30/2015 PortionBonds and equipment leasepurchase obligations:
General obligation bonds $ 82,701,978 $ $ 5,254,707 $ 77,447,271 $ 5,413,708Notes payable 23,994,495 1,532,303 22,462,192 1,559,578Equipment leases 72,695 50,018 22,677 22,677
Total bonds, notes and equipment leases 106,769,168 6,837,028 99,932,140 6,995,963
Other liabilities: Compensated absences 16,600,000 5,372,543 5,772,543 16,200,000 6,000,000
Total other liabilities 16,600,000 5,372,543 5,772,543 16,200,000 6,000,000
Total long-term liabilities $ 123,369,168 $ 5,372,543 $ 12,609,571 $ 116,132,140 $ 12,995,963
49
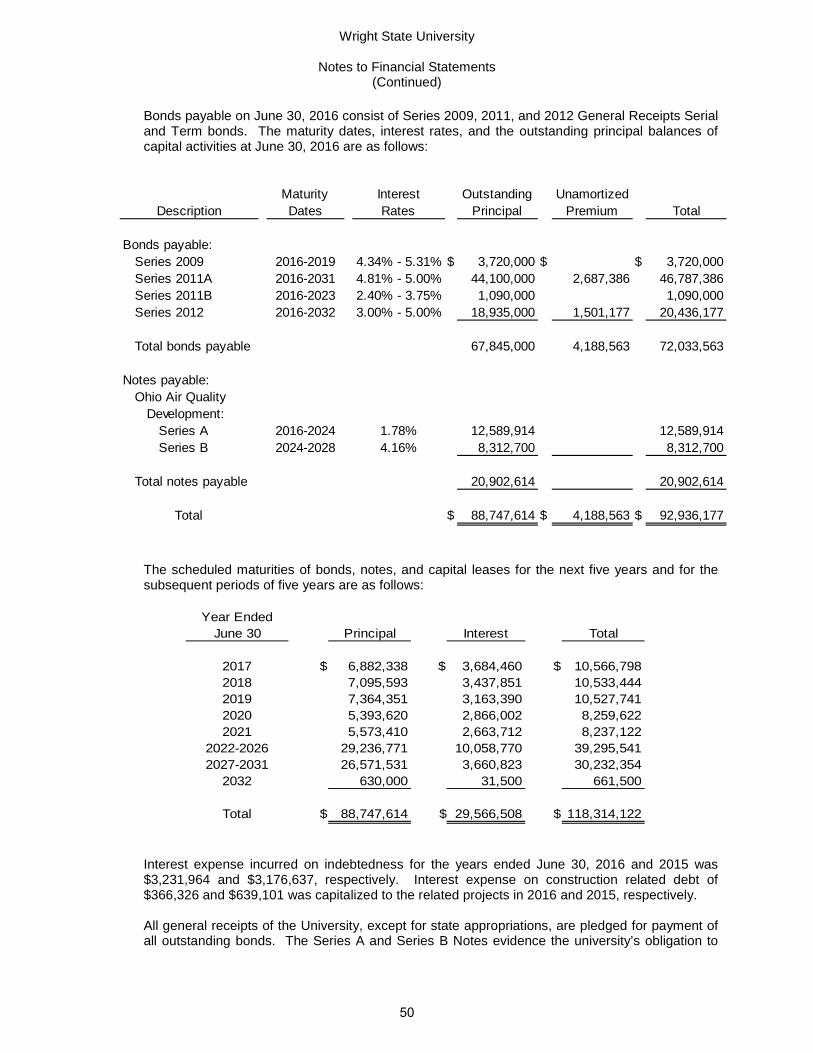
Wright State University
Notes to Financial Statements (Continued)
Bonds payable on June 30, 2016 consist of Series 2009, 2011, and 2012 General Receipts Serial and Term bonds. The maturity dates, interest rates, and the outstanding principal balances of capital activities at June 30, 2016 are as follows:
Maturity Interest Outstanding UnamortizedDescription Dates Rates Principal Premium Total
Bonds payable: Series 2009 2016-2019 4.34% - 5.31% $ 3,720,000 $ $ 3,720,000
Series 2011A 2016-2031 4.81% - 5.00% 44,100,000 2,687,386 46,787,386Series 2011B 2016-2023 2.40% - 3.75% 1,090,000 1,090,000Series 2012 2016-2032 3.00% - 5.00% 18,935,000 1,501,177 20,436,177
Total bonds payable 67,845,000 4,188,563 72,033,563
Notes payable:Ohio Air Quality
Development:Series A 2016-2024 1.78% 12,589,914 12,589,914Series B 2024-2028 4.16% 8,312,700 8,312,700
Total notes payable 20,902,614 20,902,614
Total $ 88,747,614 $ 4,188,563 $ 92,936,177
The scheduled maturities of bonds, notes, and capital leases for the next five years and for the subsequent periods of five years are as follows:
Year Ended
June 30 Principal Interest Total
2017 $ 6,882,338 $ 3,684,460 $ 10,566,7982018 7,095,593 3,437,851 10,533,4442019 7,364,351 3,163,390 10,527,7412020 5,393,620 2,866,002 8,259,6222021 5,573,410 2,663,712 8,237,122
2022-2026 29,236,771 10,058,770 39,295,5412027-2031 26,571,531 3,660,823 30,232,354
2032 630,000 31,500 661,500
Total $ 88,747,614 $ 29,566,508 $ 118,314,122
Interest expense incurred on indebtedness for the years ended June 30, 2016 and 2015 was $3,231,964 and $3,176,637, respectively. Interest expense on construction related debt of $366,326 and $639,101 was capitalized to the related projects in 2016 and 2015, respectively. All general receipts of the University, except for state appropriations, are pledged for payment of all outstanding bonds. The Series A and Series B Notes evidence the university’s obligation to
50
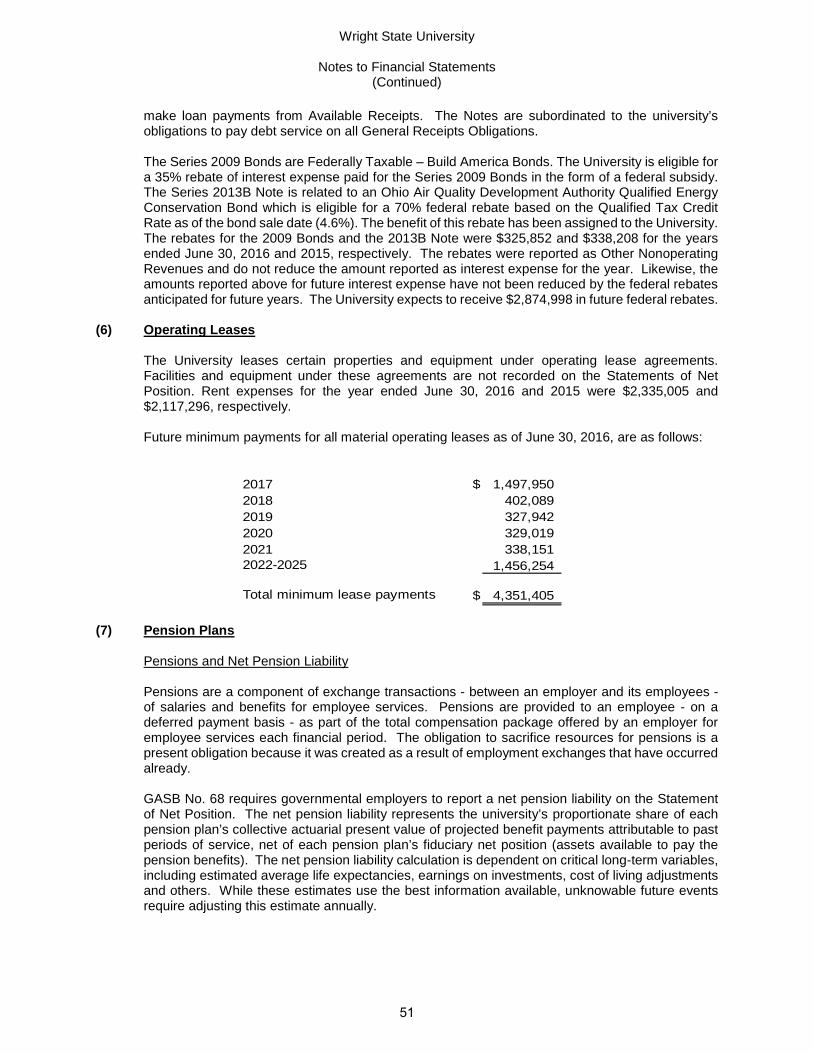
Wright State University
Notes to Financial Statements (Continued)
make loan payments from Available Receipts. The Notes are subordinated to the university’s obligations to pay debt service on all General Receipts Obligations.
The Series 2009 Bonds are Federally Taxable – Build America Bonds. The University is eligible for a 35% rebate of interest expense paid for the Series 2009 Bonds in the form of a federal subsidy. The Series 2013B Note is related to an Ohio Air Quality Development Authority Qualified Energy Conservation Bond which is eligible for a 70% federal rebate based on the Qualified Tax Credit Rate as of the bond sale date (4.6%). The benefit of this rebate has been assigned to the University. The rebates for the 2009 Bonds and the 2013B Note were $325,852 and $338,208 for the years ended June 30, 2016 and 2015, respectively. The rebates were reported as Other Nonoperating Revenues and do not reduce the amount reported as interest expense for the year. Likewise, the amounts reported above for future interest expense have not been reduced by the federal rebates anticipated for future years. The University expects to receive $2,874,998 in future federal rebates.
(6) Operating Leases
The University leases certain properties and equipment under operating lease agreements. Facilities and equipment under these agreements are not recorded on the Statements of Net Position. Rent expenses for the year ended June 30, 2016 and 2015 were $2,335,005 and $2,117,296, respectively.
Future minimum payments for all material operating leases as of June 30, 2016, are as follows:
2017 $ 1,497,950 2018 402,089 2019 327,942 2020 329,019 2021 338,151
1,456,254
Total minimum lease payments $ 4,351,405
2022-2025
(7) Pension Plans
Pensions and Net Pension Liability
Pensions are a component of exchange transactions - between an employer and its employees - of salaries and benefits for employee services. Pensions are provided to an employee - on a deferred payment basis - as part of the total compensation package offered by an employer for employee services each financial period. The obligation to sacrifice resources for pensions is a present obligation because it was created as a result of employment exchanges that have occurred already.
GASB No. 68 requires governmental employers to report a net pension liability on the Statement of Net Position. The net pension liability represents the university’s proportionate share of each pension plan’s collective actuarial present value of projected benefit payments attributable to past periods of service, net of each pension plan’s fiduciary net position (assets available to pay the pension benefits). The net pension liability calculation is dependent on critical long-term variables, including estimated average life expectancies, earnings on investments, cost of living adjustments and others. While these estimates use the best information available, unknowable future events require adjusting this estimate annually.
51
Wright State University
Notes to Financial Statements (Continued)
GASB 68 assumes the net pension liability for each plan is solely the obligation of the employers because (1) the employers benefit from the employee services, and (2) state statute requires all funding to come from these employers. The University cannot control benefit terms or the manner in which pensions are financed; however, the University does receive the benefit of employee services in exchange for compensation including pension.
Plan Descriptions
University faculty are provided pensions through the State Teachers Retirement System of Ohio (STRS). Substantially all other university employees are provided pensions through the Ohio Public Employees Retirement System (OPERS). Both OPERS and STRS are statewide cost-sharing multiple employer defined benefit pension plans. Authority to establish and amend benefits for OPERS and STRS are authorized by Chapters 145 and 3307, respectively, of the Ohio Revised Code. Both OPERS and STRS issue publicly available financial reports. The OPERS report can be obtained at https://www.opers.org/financial/reports.shtml. The STRS report can be obtained at https://www.strsoh.org/employer/publications.html#other.
OPERS and STRS each offer three separate retirement plans: a defined benefit plan, a defined contribution plan, and a combined plan.
Defined Benefit Plans pay service retirement benefits using a fixed formula based on age, years of service and salary. In addition to service retirement, participants are eligible for disability and survivor benefits.
Defined Contribution Plans are member-directed, optional retirement plans available to new members. Participants allocate both member and employer contributions in investment choices provided by the plans. Retirement benefits are based on the member’s account value.
Combined Plans offer features of both a defined benefit plan and a member-directed, defined contribution plan. In the combined plans, employee contributions are invested in self-directed investments, and the employer contribution is used to fund a reduced defined benefit in addition to disability and survivor benefits.
Benefits Provided
OPERS and STRS defined benefit plans provide retirement, disability, annual cost-of-living adjustments, and survivor benefits for plan members and beneficiaries. The benefit provisions stated in the following paragraphs are current provisions and apply to active plan participants. Vested, terminated employees who are entitled to benefits but are not yet receiving them are bound by the provisions in effect at the time they last terminated their public service.
OPERS Benefits Under OPERS, retirement benefits are specific to each plan and members must meet the eligibility requirements based on their age and years of service within the plan. Retirement eligibility also varies by division and transition group.
Defined Benefit members who were eligible to retire before January 7, 2023 under law in effect prior to SB 343 are included in transition Groups A and B. Group C includes those members who are not in either of the other groups and members who were hired on or after January 7, 2013.
University members in transition Group A are eligible for full retirement benefits at any age with 30 years of service or at age 65 with 5 years of service. Group B members are eligible for full benefits at age 52 with 31 years of service, at any age with 32 years of service, or at age 66 with 5 years of service. Group C members are eligible for full benefits at age 55 with 32 years of service or at age 67 with 5 years of service. Members in Groups A and B are eligible for retirement with reduced
52

Wright State University
Notes to Financial Statements (Continued)
benefits at age 60 with 5 years of service credit or at age 55 with 25 or more years of service credit. Members of Group C are eligible for reduced retirement benefits at age 57 with 25 years of service or at age 62 with 5 years of service.
Under the Traditional Plan (the defined benefit plan), the annual benefit for Groups A and B is based on 2.2% of final average salary (FAS) multiplied by the actual years of service for the first 30 years of service credit and 2.5% for years of service in excess of 30 years. For Group C, the annual benefit applies a factor of 2.2% for the first 35 years and a factor of 2.5% for the years of service in excess of 35. FAS represents the average of the three highest years of earnings over a member’s career for Groups A and B. FAS for Group C is based on the average of the five highest years of earnings over a member’s career.
The OPERS law enforcement program consists of two separate divisions: Law Enforcement and Public Safety. Both groups of members are eligible for special retirement options under the Traditional Pension Plan and are not eligible to participate in the Member-Directed Defined Contribution or Combined plans. Public Safety Group members of Groups A and B may file an application for full retirement benefits at age 48 or older with 25 or more years of credited service or at age 52 or older with 15 or more years of credited service. Public Safety Group C is eligible for benefits at age 52 or older with 25 years or at age 56 or older with 15 years. Those members classified as Law Enforcement officers are eligible for full retirement as follows: for Group A, at age 52 or older with 15 or more years of credited service; for Group B, at age 48 or older with 25 years or at age 52 or older with 15 years of service; and for Group C, at age 48 or older with 25 years of service or at age 56 with 15 years of service. Annual benefits under both divisions are calculated by multiplying 2.5% of FAS by the actual years of service for the first 25 years of service credit, and 2.1% of FAS for each year of service over 25 years.
In the Combined Plan, the benefit formula for the defined benefit component of the plan for university members in transition Groups A and B applies a factor of 1% to the member’s FAS for the first 30 years of service. A factor of 1.25% is applied to years of service in excess of 30. The benefit formula for transition Group C applies a factor of 1% to the member’s FAS for the first 35 years of service and a factor of 1.25% is applied to years in excess of 35. These options also permit early retirement with a reduced benefit as early as age 48 under qualifying circumstances.
Members of the Defined Benefit and Combined Plans who become disabled at any age with 60 contributing months will be eligible for disability benefits until a determined age. Law enforcement officers are immediately eligible for disability benefits if disabled by an on-duty illness or injury. Members participating in the Defined Contribution Plan are not eligible for disability benefits. Disability benefits are determined in the same manner as retirement benefits.
After a benefit recipient retiring under the Traditional Pension Plan has received benefits for 12 months, an annual cost-of-living adjustment of 3% is provided on the member’s base benefit. Members retiring under the Combined Plan receive an annual cost-of-living adjustment of 3% on the defined benefit portion of their benefit.
STRS Benefits Members of the Defined Benefit plan are eligible for full retirement benefits at any age with 30 years of service or at age 65 with five years of service. Age and service requirements for full retirement benefits increased effective August 1, 2015 and will continue to increase periodically until they reach age 60 with 35 years of service or age 65 with five years of service on August 1, 2026. Employees are eligible to retire with reduced benefits at age 60 with five years of qualifying service credit, at age 55 with 25 years of service, or with 30 years of service regardless of age. Age and service requirements for reduced retirement benefits increased effective August 1, 2015 and will continue to increase periodically until age 55 with 29 years of service on August 1, 2021.
53
Wright State University
Notes to Financial Statements (Continued)
Prior to August 1, 2015, benefits under the Defined Benefit Plan benefits were based on 2.2% of FAS for the three highest years of earnings, multiplied by years of total Ohio service credit and the percentage increased if the member has 35 or more years of contributing service credit. Effective August 1, 2015, benefits are now based on an annual amount equal to 2.2% of FAS for the five highest years of earnings, multiplied by all years of service. Under the Combined Plan, benefits are based on the balance in the member’s defined contribution account plus an annual amount equal to 1% of FAS for the three highest paid years multiplied by years of total Ohio service credit. Effective August 1, 2015, FAS is the average of the member’s five highest salary years.
A Defined Benefit Plan or Combined Plan member with five or more years of credited service who is determined to be disabled (illness or injury preventing the individual’s ability to perform regular job duties for at least 12 months) may receive a disability benefit. New members on or after July 1, 2013, must have at least 10 years of qualifying service credit to apply for disability benefits. Disability benefits are determined in the same manner as retirement benefits.
Under the Defined Benefit Plan, members will receive an annual cost of living adjustment of 2% beginning on the fifth anniversary of retirement. Under the Combined Plan, a cost of living adjustment is not available on the service retirement benefit. For disability and survivor benefits, the basic benefit is increased each year by 2% of the original base benefit.
Contributions
Ohio Revised Code Chapters 145 and 3307 set the rates for employer and employee contributions for OPERS and STRS, respectively. Contribution rates can only be modified by the state legislature.
OPERS Contributions Under OPERS, the employee contribution rate for the plan years ended June 30, 2016 and 2015 was 10% for all employees with the exception of law enforcement, which is 13%. The employer contribution rate is 14% for all employees with the exception of law enforcement whose rate is 18.1%.
For Member-Directed Plans, for the plan years ended June 30, 2015 and 2014, 13.23% was paid into the member’s member-directed account and the remaining 0.77% was paid to OPERS to cover unfunded liabilities, as required by state legislation. Effective January 1, 2016, these rates changed to 13% and 1%, respectively. The university’s contributions to OPERS were $9,034,533, $9,045,674, $8,712,371, and $8,534,584 for the fiscal years ended June 30, 2016, 2015, 2014, and 2013 respectively. The university’s contributions were equal to the required contributions for each year as set by state statute.
STRS Contributions Under STRS plans, the employee contribution rates were 13% and 12%, for years ended June 30, 2016 and 2015, respectively. Under the Combined Plan, 1% of the employee contribution is to fund the defined benefit. The member contribution rate is scheduled to increase to 14% of salary effective July 1, 2016. The employer contribution rate is 14%. Under the Defined Contribution Plan, 4.5% of the employer contribution is used to amortize the unfunded actuarial accrued liability of the defined benefit plan. The university’s contributions to STRS for the years ended June 30, 2016, 2015, 2014, and 2013, respectively, were $10,739,476, $10,756,852, $10,202,409, and $10,064,517. The university’s contributions were equal to the required contributions as set by state statute.
54
Wright State University
Notes to Financial Statements (Continued)
Pension Liabilities, Pension Expense, and Deferred Outflows of Resources and Deferred Inflows of Resources Related to Pensions
At June 30, 2016 and 2015, respectively, the University reported liabilities of $278,245,869 and $228,135,876 for its proportionate share of the OPERS and STRS net pension liabilities which were measured as of December 31, 2015 and 2014 and June 30, 2015 and 2014, respectively. The total pension liabilities used to calculate the net pension liabilities were determined by actuarial valuations as of those respective dates. The university’s proportion of the net pension liabilities for STRS as well as the OPERS Combined Plan were based on the university’s share of contributions to each plan relative to the total employer contributions received from all participating employers of each plan. The calculation of proportionate share for the Member-Directed Plan is based on employer contributions to the plan as contributions specific to purchased defined benefit annuities are identifiable only to retirees purchasing the annuities. The university’s proportion of the net pension liability for the OPERS Traditional Plan was based on the combined university employer and member contributions relative to the total combined employer and member contributions received from all participating employers and members of the plan.
Information for each plan’s proportionate share and pension expense for the years ended June 30, 2016 and 2015 is as follows:
OPERS STRS Total
Fiscal Year Ended 6/30/2016:
Measurement date December 31, 2015 July 1, 2015Proportionate share of the
net pension liability $ 76,754,115 $ 201,491,754 $ 278,245,869 Proportion of the
net pension liability 0.44437907% 0.72906324%Pension expense $ 3,631,667 $ (1,220,548) $ 2,411,119
Fiscal Year Ended 6/30/2015:
Measurement date December 31, 2014 July 1, 2014Proportionate share of the
net pension liability $ 54,649,018 $ 173,486,858 $ 228,135,876 Proportion of the
net pension liability 0.45455184% 0.71324907%Pension expense $ (969,438) $ (2,741,918) $ (3,711,356)
55

Wright State University
Notes to Financial Statements (Continued)
At June 30, 2016 and 2015, the University reports deferred outflows of resources and deferred inflows of resources related to pensions from the following sources:
OPERS STRS Total
Fiscal Year Ended 6/30/2016:
Deferred Outflows of Resources:Differences between expected and actual
experience $ $ 9,157,707 $ 9,157,707 Net difference between projected and actual
earnings on pension plan investments 22,813,991 22,813,991 University contributions subsequent to the
measurement date 3,521,053 10,739,477 14,260,530 Net effect of change in
proportionate share 3,616,919 3,616,919
Total $ 26,335,044 $ 23,514,103 $ 49,849,147
Deferred Inflows of Resources:Differences between expected and actual
experience $ 1,594,311 $ $ 1,594,311 Net difference between projected and actual
earnings on pension plan investments 13,957,345 13,957,345 Net effect of change in
proportionate share 809,772 809,772
Total $ 2,404,083 $ 13,957,345 $ 16,361,428
Fiscal Year Ended 6/30/2015:
Deferred Outflows of Resources:Differences between expected and actual
experience $ $ 1,670,188 $ 1,670,188 Net difference between projected and actual
earnings on pension plan investments 2,938,669 2,938,669 University contributions subsequent to the
measurement date 3,543,152 10,756,852 14,300,004
Total $ 6,481,821 $ 12,427,040 $ 18,908,861
Deferred Inflows of Resources:Differences between expected and actual
experience $ 1,024,290 $ $ 1,024,290 Net difference between projected and actual
earnings on pension plan investments 32,095,726 32,095,726
Total $ 1,024,290 $ 32,095,726 $ 33,120,016
As of June 30, 2016 and 2015, the University reported $3,521,053 and $3,543,152, respectively, as deferred outflows of resources related to pensions resulting from university contributions to OPERS made subsequent to the measurement date. As of June 30, 2016 and 2015, the University reported deferred outflows of resources related to pensions of $10,739,477 and $10,756,852,
56

Wright State University
Notes to Financial Statements (Continued)
respectively, resulting from university contributions to STRS made subsequent to the measurement date. These contributions will be recognized as reductions of the net pension liabilities in the years ending June 30, 2017 and 2016, respectively. Other amounts reported as deferred outflows and deferred inflows of resources related to pensions will be recognized in pension expense as follows
Year Ended June 30 OPERS STRS Total
2017 $ 4,608,395 $ (2,197,276) $ 2,411,119 2018 4,978,609 (2,197,276) 2,781,333 2019 5,736,526 (2,197,274) 3,539,252 2020 5,138,974 5,409,107 10,548,081 2021 (13,359) (13,359)
Thereafter (39,237) (39,237)
Total $ 20,409,908 $ (1,182,719) $ 19,227,189
Actuarial Assumptions
OPERS The total pension liabilities in the December 31, 2015 and 2014 actuarial valuations were determined using the following actuarial assumptions, applied to all periods included in the measurement:
Inflation 3.75% Salary increases 4.25% – 10.05%, including inflation Investment rate of return 8.0%, net of pension plan investment expense, including inflation
Mortality rates were based on the RP-2000 Combined Mortality Table for Males or Females, as appropriate, with adjustments for mortality improvements based on Projection Scale AA.
The actuarial assumptions used in the December 31, 2015 and 2014 valuations were based on the results of an actuarial experience study for the period January 1, 2006 - December 31, 2010.
The long-term expected rate of return on pension plan investments was determined using a building-block method in which best-estimate ranges of expected future real rates of return (expected returns, net of pension plan investment expense and inflation) are developed for each major asset class. The OPERS Board of Trustees sets target allocations as well as minimum and maximum allowable allocations, or ranges, surrounding each asset class target. The purpose of these ranges is to appropriately and cost-effectively balance the Board’s investment policy with the investment strategies pursued over shorter time periods. These ranges are combined to produce the long-term expected rate of return by weighting the expected future real rates of return by the target asset allocation percentage and by adding expected inflation.
57

Wright State University
Notes to Financial Statements (Continued)
The target allocation and best estimates of arithmetic real rates of return for each major asset class for the plan years ended December 31, 2015 and 2014 are summarized in the following table:
Long-Term Long-TermTarget Expected Real Target Expected Real
OPERS Asset Class Allocation Rate of Return Allocation Rate of Return
Fixed income 23.00% 2.31% 23.00% 2.31%Domestic equity 20.70% 5.84% 19.90% 5.84%International equity 18.30% 7.40% 19.10% 7.40%Real estate 10.00% 4.25% 10.00% 4.25%Private equity 10.00% 9.25% 10.00% 9.25%Other investments 18.00% 4.59% 18.00% 4.59%
Total 100.00% 100.00%
20142015
STRS The total pension liabilities in the June 30, 2015 and 2014 actuarial valuations were determined using the following actuarial assumptions, applied to all periods included in the measurement:
Inflation 2.75% Salary increases 2.75% – 12.25%, average, including inflation Investment rate of return 7.75%, net of pension plan investment expense, including inflation
Mortality rates were based on the RP-2000 Combined Mortality Table for Males or Females, as appropriate, with adjustments for mortality improvements based on Projection Scale AA.
The actuarial assumptions used in the June 30, 2015 and 2014 valuations were based on the results of an actuarial experience study effective July 1, 2012.
The long-term expected rate of return on pension plan investments was determined by STRS’s investment consultant by developing best-estimate ranges of expected future real rates of return (expected returns, net of pension plan investment expense and inflation) for each major asset class. The STRS Board of Trustees sets target allocations as well as minimum and maximum allowable allocations, or ranges, surrounding each asset class target. The purpose of these ranges is to appropriately and cost-effectively balance the Board’s investment policy with the investment strategies pursued over shorter time periods. These ranges are combined to produce the long-term expected rate of return by weighting the expected future real rates of return by the target asset allocation percentage and by adding expected inflation.
58

Wright State University
Notes to Financial Statements (Continued)
The target allocation and best estimates of geometric real rates of return for each major asset class for the plan years ended June 30, 2015 and 2014 are summarized in the following table:
Long-TermTarget Expected Real
STRS Asset Class Allocation Rate of Return
Fixed income 18.00% 3.75%Domestic equity 31.00% 8.00%International equity 26.00% 7.85%Real estate 10.00% 6.75%Alternatives 14.00% 8.00%Liquidity reserves 1.00% 3.00%
Total 100.00%
Discount Rates The discount rates used to measure the total pension liabilities were 8% for OPERS for plan years ended December 31, 2015 and 2014 and 7.75% for STRS for plan years ended June 30, 2015 and 2014, respectively. The projection of cash flows used to determine the discount rates assumed employee contributions will be made at the current contribution rate and contributions from the University will be made at statutorily required rates. Projected inflows from investment earnings were calculated using the long-term assumed investment rate of return for each plan (8% and 7.75%). Based on those assumptions, the pension plans’ fiduciary net positions were projected to be available to make all projected future benefit payments of current active and inactive employees. Therefore, the respective long-term expected rates of return on pension plan investments were applied to all periods of projected benefit payments to determine the total pension liabilities.
Sensitivity of The University’s Proportionate Share of The Net Pension Liability to Changes in The Discount Rate Net pension liability is sensitive to changes in the discount rate. To illustrate the potential impact, the university’s proportionate share of the net pension liabilities calculated using the discount rates of 8% for OPERS and 7.75% for STRS is compared to what the university’s proportionate share of the net pension liabilities would be if calculated using a discount rate 1 percentage point lower (7% for OPERS and 6.75% for STRS) or 1 percentage point higher (9% for OPERS and 8.75% for STRS) than the current rate.
59

Wright State University
Notes to Financial Statements (Continued)
The following table provides the results of the sensitivity analysis at June 30:
1% DecreaseCurrent
Discount Rate 1% IncreaseOPERS Range (7.00%) (8.00%) (9.00%)STRS Range (6.75%) (7.75%) (8.75%)
University's proportionate share:OPERS net pension liability $ 122,733,851 $ 76,754,115 $ 37,987,664 STRS net pension liability 279,887,247 201,491,754 135,196,678
Total $ 402,621,098 $ 278,245,869 $ 173,184,342
1% DecreaseCurrent
Discount Rate 1% IncreaseOPERS Range (7.00%) (8.00%) (9.00%)STRS Range (6.75%) (7.75%) (8.75%)
University's proportionate share:OPERS net pension liability $ 100,930,447 $ 54,649,018 $ 15,679,972 STRS net pension liability 248,365,352 173,486,858 110,164,849
Total $ 349,295,799 $ 228,135,876 $ 125,844,821
2016
2015
Pension Plan Fiduciary Net Position Detailed information about OPERS and STRS fiduciary net position is available in the separately issued financial reports. Financial reports for OPERS may be obtained online at www.opers.org or by writing to Ohio Public Employees Retirement System, Director-Finance, 277 East Town Street, Columbus, Ohio 43215-4642. Financial reports for STRS may be obtained at www.strsoh.org or by writing to State Teachers Retirement System of Ohio, Attn: Chief Financial Officer, 275 E. Broad St., Columbus, OH 43215-3771.
Alternative Retirement Plan (ARP) Contributions
Certain full-time university staff and faculty have the option to choose the ARP in place of OPERS or STRS. The ARP is a defined contribution plan which provides employees with the opportunity to establish individual retirement accounts with a defined group of investment options, with each participant having control of the assets and investment options associated with those assets. The administrators of the plan are the providers of the plan investment options. Authority to establish and amend benefits and contribution requirements for the ARP is provided by state statute per the Ohio Revised Code.
Under the provisions of ARP, the required contribution rate for plan participants for employees who would otherwise participate in OPERS was 10% of the employees’ covered compensation for the years ended June 30, 2016 and 2015. The required rates for plan participants who would otherwise participate in STRS were 13% and 12% for those for the years ended June 30, 2016 and 2015,
60
Wright State University
Notes to Financial Statements (Continued)
respectively. The university’s contributions to a participating faculty member’s account and to STRS are 9.5% and 4.5% of a participant’s compensation, respectively. The university’s contributions to a participating staff member’s account and to OPERS were 13.23% and 0.77% of a participant’s compensation, respectively through December 31, 2015. Effective January 1, 2016, the contribution rates to a participating staff member’s account and to OPERS are 13% and 1%, respectively. Plan participants’ contributions were $7,903,171, $6,862,582, and $5,865,779, and the university’s contributions to the plan providers amounted to $7,501,937, $6,905,431, and $6,117,266 for the years ended June 30, 2016, 2015, and 2014, respectively. In addition, the amounts contributed to STRS by the University on behalf of ARP participants were $1,809,017, $1,693,514, and $1,573,660, respectively, for the years ended June 30, 2016, 2015, and 2014. The amounts contributed to OPERS by the University on behalf of ARP participants were $212,870, $184,076, and $163,962 for the years ended June 30, 2016, 2015, and 2014, respectively.
(8) Other Postemployment Benefits (OPEB)
The Ohio Revised Code provides the statutory authority for public employers to fund postretirement health care through their contributions to STRS and OPERS.
Ohio Public Employees Retirement System
OPERS provides postemployment health care coverage to age-and-service retirees with 10 or more years of qualifying Ohio service credit. Health care coverage for disability benefit recipients and qualified survivor benefits is available. The Ohio Revised Code permits, but does not mandate, OPERS to provide OPEB to its eligible members and beneficiaries. Authority to establish and amend benefits is provided in Chapter 145 of the Ohio Revised Code.
OPERS’ Post Employment Health Care plan was established under, and is administered in accordance with, Internal Revenue Code 401(h). Each year, the OPERS Retirement Board determines the portion of the employer contribution rate that will be set aside for funding of postemployment health care benefits. The portion of employer contributions allocated to health care for members in the Traditional Plan was an effective rate of 2%, 2%, and 1.5% for the years ended June 30, 2016, 2015, and 2014, respectively. The portion of the university’s 2016, 2015, and 2014 contributions to OPERS used to fund postretirement benefits was $1,260,217, $1,265,942, and $915,901. The OPERS Retirement Board is also authorized to establish rules for the payment of a portion of the health care benefits provided by the retiree or their surviving beneficiaries. Payment amounts vary depending on the number of covered dependents and the coverage selected.
State Teachers Retirement System of Ohio
STRS provides access to health care coverage to eligible retirees who participated in the Defined Benefit or Combined Plans. Coverage under the current program includes hospitalization, physicians’ fees, prescription drugs and reimbursement of monthly Medicare Part B premiums. Pursuant to Chapter 3307 of the Ohio Revised Code, the Retirement Board has discretionary authority over how much, if any, of the associated health care costs will be absorbed by STRS. All benefit recipients, for the most recent year, pay a portion of the health care costs in the form of a monthly premium.
Under Ohio Law, funding for postemployment health care may be deducted from employer contributions. Of the 14% employer contribution rate, no covered payroll was allocated to postemployment health care for 2016 and 2015, compared to 1% of covered payroll for 2014. The portion of the university’s 2016, 2015, and 2014 contributions to STRS used to fund postemployment benefits was $0, $0, and $626,502 for the years ended June 30, 2016, 2015, and 2014, respectively.
61

Wright State University
Notes to Financial Statements (Continued)
(9) State Support
The University is a state-assisted institution of higher education which receives a student subsidy from the State of Ohio primarily based upon the number of successful degree and course completions. This subsidy is calculated annually by the Ohio Department of Higher Education (formerly known as the Ohio Board of Regents), Ohio’s higher education advising and coordinating board.
In addition to student subsidies, the State of Ohio provides funding for construction of major plant facilities. The funding is obtained from the issuance of general obligation bonds by the Ohio Public Facilities Commission (OPFC), which in turn results in construction and subsequent transfer of the facility to the University by the Ohio Department of Higher Education. Costs incurred during construction are included in construction in progress and recognized as capital appropriations. Upon completion of a facility, the Ohio Department of Higher Education turns control over to the University.
University facilities are not pledged as collateral for the revenue bonds. Instead, the bonds are supported by a pledge of monies in the Higher Education Bond Service Fund established in the custody of the Treasurer of State. If sufficient monies are not available from this fund, a pledge exists to assess a special student fee uniformly applicable to students in state-assisted institutions of higher education throughout the State. As a result of the above described financial assistance provided by the State to the University, outstanding debt issued by OPFC is not included in the university’s financial statements.
(10) Commitments and Contingencies
At June 30, 2016, the University is committed under contractual obligations for:
Capital expenditures $ 5,732,537Non-capital goods and services 15,634,176
Total contractual commitments $ 21,366,713
These commitments are being funded from the following sources:
State appropriations requested and approved $ 1,903,861University funds 19,462,852
Total sources $ 21,366,713
The University is presently involved as a defendant or codefendant in various matters of litigation. The university's administration believes that the ultimate disposition of these matters would not have a material adverse effect upon the financial statements of the University.
Wright State University is the subject of an ongoing federal investigation. The expected time of completion and the potential impacts of the investigation are unknown at this time.
In June 2015, The U.S. Department of Education (DOE) concluded a program review of Wright State University’s administration of programs authorized by Title IV of the Higher Education Act of 1965 for the 2013 – 2014 and 2014 – 2015 academic award years. The University submitted a response to the review in August 2015. The University received a Final Program Review Determination (Final Determination) from the DOE in July 2016. The University has submitted an
62
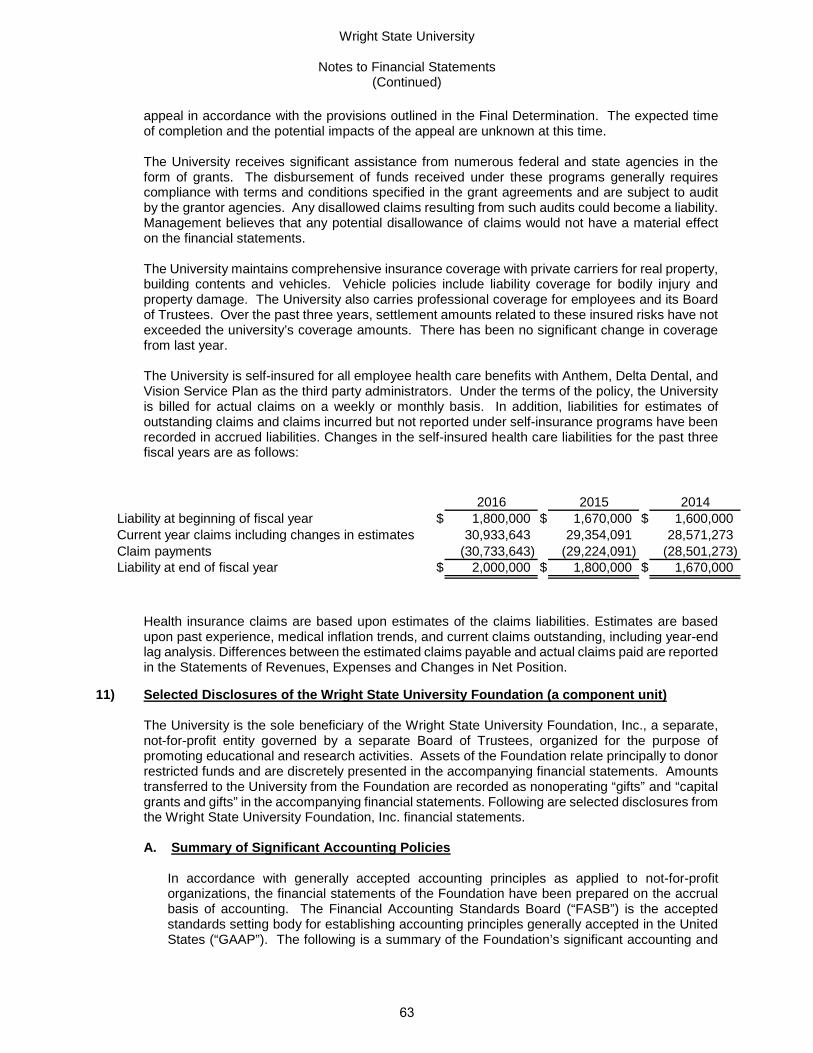
Wright State University
Notes to Financial Statements (Continued)
appeal in accordance with the provisions outlined in the Final Determination. The expected time of completion and the potential impacts of the appeal are unknown at this time.
The University receives significant assistance from numerous federal and state agencies in the form of grants. The disbursement of funds received under these programs generally requires compliance with terms and conditions specified in the grant agreements and are subject to audit by the grantor agencies. Any disallowed claims resulting from such audits could become a liability. Management believes that any potential disallowance of claims would not have a material effect on the financial statements.
The University maintains comprehensive insurance coverage with private carriers for real property, building contents and vehicles. Vehicle policies include liability coverage for bodily injury and property damage. The University also carries professional coverage for employees and its Board of Trustees. Over the past three years, settlement amounts related to these insured risks have not exceeded the university’s coverage amounts. There has been no significant change in coverage from last year.
The University is self-insured for all employee health care benefits with Anthem, Delta Dental, and Vision Service Plan as the third party administrators. Under the terms of the policy, the University is billed for actual claims on a weekly or monthly basis. In addition, liabilities for estimates of outstanding claims and claims incurred but not reported under self-insurance programs have been recorded in accrued liabilities. Changes in the self-insured health care liabilities for the past three fiscal years are as follows:
2016 2015 2014Liability at beginning of fiscal year $ 1,800,000 $ 1,670,000 $ 1,600,000 Current year claims including changes in estimates 30,933,643 29,354,091 28,571,273 Claim payments (30,733,643) (29,224,091) (28,501,273) Liability at end of fiscal year $ 2,000,000 $ 1,800,000 $ 1,670,000
Health insurance claims are based upon estimates of the claims liabilities. Estimates are based upon past experience, medical inflation trends, and current claims outstanding, including year-end lag analysis. Differences between the estimated claims payable and actual claims paid are reported in the Statements of Revenues, Expenses and Changes in Net Position.
11) Selected Disclosures of the Wright State University Foundation (a component unit)
The University is the sole beneficiary of the Wright State University Foundation, Inc., a separate,not-for-profit entity governed by a separate Board of Trustees, organized for the purpose ofpromoting educational and research activities. Assets of the Foundation relate principally to donorrestricted funds and are discretely presented in the accompanying financial statements. Amountstransferred to the University from the Foundation are recorded as nonoperating “gifts” and “capitalgrants and gifts” in the accompanying financial statements. Following are selected disclosures fromthe Wright State University Foundation, Inc. financial statements.
A. Summary of Significant Accounting Policies
In accordance with generally accepted accounting principles as applied to not-for-profit organizations, the financial statements of the Foundation have been prepared on the accrual basis of accounting. The Financial Accounting Standards Board (“FASB”) is the accepted standards setting body for establishing accounting principles generally accepted in the United States (“GAAP”). The following is a summary of the Foundation’s significant accounting and
63

Wright State University
Notes to Financial Statements (Continued)
reporting policies presented to assist the reader in interpreting the financial statements and other data in this report.
Principles of Consolidation The consolidated financial statements include the accounts of Wright State University Foundation and its wholly-owned limited liability company subsidiary Fairborn Office Property LLC. The consolidated entities are collectively referred to as “the Foundation”. All significant intercompany accounts and transactions have been eliminated in the consolidated financial statements.
Cash and Cash Equivalents The Foundation considers all highly liquid investments with maturities of three months or less when purchased to be cash equivalents, excepting cash equivalent holdings in its investment portfolios that have resulted from recent security sales that will be used to purchase other long-term securities.
Pledges Receivable Unconditional pledges are recorded in the period that the pledges are received. Conditional pledges are recorded in the period in which the conditions have been met. Payments on pledges to be collected in future years are recorded at net present value. All pledges are presented net of an allowance for doubtful collections.
Gifts Receivable from Trusts Held by Others Irrevocable trusts which will benefit the Foundation are recognized as gift revenue and as a receivable in an amount equal to the present value of the estimated future benefits to be received when trust assets are distributed. Adjustments to the receivable to reflect revaluation of the present value of the estimated future payments to the donor-designated beneficiaries and changes in actuarial assumptions during the term of the trust will be recognized as changes in the value of the asset.
Investment in Securities Investments are stated at fair value. The fair values of investments are based on quoted market prices, where available. If quoted market prices are not available, fair values are based on quoted market prices of comparable instruments, when appropriate. Investments are initially recorded at their acquisition cost if they were purchased and at fair value if they are received through a contribution or exchange transaction. Securities traded on a national exchange are valued at their last reported sales price on the exchange on which they are traded.
Alternative investments, such as hedge funds, private equity and venture capital instruments, for which there is no ready market, are valued at fair value as estimated by management. To estimate fair value, management may rely on valuations reported by the general partners of such investments in unaudited financial reports and/or the Foundation’s independent investment advisor. The Foundation believes the carrying amount of these financial instruments is a reasonable estimate of fair value. Because of the inherent uncertainty of valuation in the absence of readily ascertainable market values, the estimated values of those investments may differ from the values that would have been used had a ready market existed for such investments or if the investments were realized, and the differences could be material.
Realized gains or losses are included in the consolidated statement of activities. Unrealized gains or losses are based on the differences between cost and fair value of each classification of security and are reported in the consolidated statement of activities. Investments are managed by professional investment managers.
64
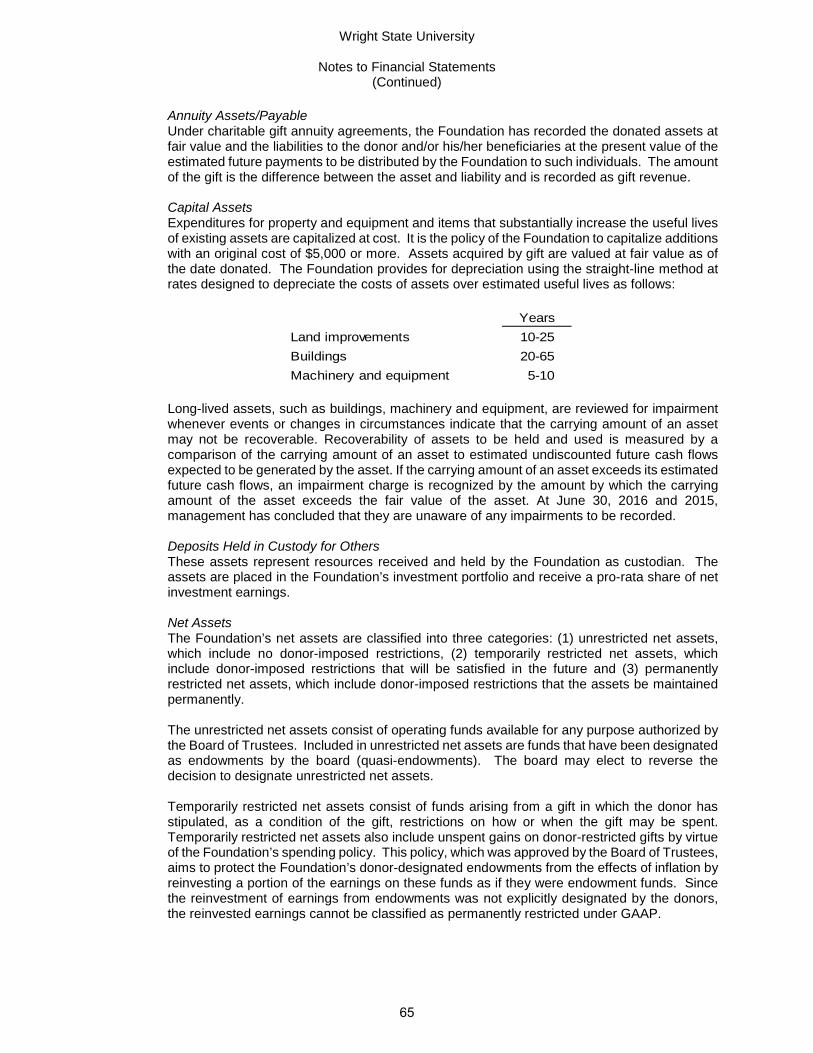
Wright State University
Notes to Financial Statements (Continued)
Annuity Assets/Payable Under charitable gift annuity agreements, the Foundation has recorded the donated assets at fair value and the liabilities to the donor and/or his/her beneficiaries at the present value of the estimated future payments to be distributed by the Foundation to such individuals. The amount of the gift is the difference between the asset and liability and is recorded as gift revenue.
Capital Assets Expenditures for property and equipment and items that substantially increase the useful lives of existing assets are capitalized at cost. It is the policy of the Foundation to capitalize additions with an original cost of $5,000 or more. Assets acquired by gift are valued at fair value as of the date donated. The Foundation provides for depreciation using the straight-line method at rates designed to depreciate the costs of assets over estimated useful lives as follows:
Years
Land improvements 10-25
Buildings 20-65
Machinery and equipment 5-10
Long-lived assets, such as buildings, machinery and equipment, are reviewed for impairment whenever events or changes in circumstances indicate that the carrying amount of an asset may not be recoverable. Recoverability of assets to be held and used is measured by a comparison of the carrying amount of an asset to estimated undiscounted future cash flows expected to be generated by the asset. If the carrying amount of an asset exceeds its estimated future cash flows, an impairment charge is recognized by the amount by which the carrying amount of the asset exceeds the fair value of the asset. At June 30, 2016 and 2015, management has concluded that they are unaware of any impairments to be recorded.
Deposits Held in Custody for Others These assets represent resources received and held by the Foundation as custodian. The assets are placed in the Foundation’s investment portfolio and receive a pro-rata share of net investment earnings.
Net Assets The Foundation’s net assets are classified into three categories: (1) unrestricted net assets, which include no donor-imposed restrictions, (2) temporarily restricted net assets, which include donor-imposed restrictions that will be satisfied in the future and (3) permanently restricted net assets, which include donor-imposed restrictions that the assets be maintained permanently.
The unrestricted net assets consist of operating funds available for any purpose authorized by the Board of Trustees. Included in unrestricted net assets are funds that have been designated as endowments by the board (quasi-endowments). The board may elect to reverse the decision to designate unrestricted net assets.
Temporarily restricted net assets consist of funds arising from a gift in which the donor has stipulated, as a condition of the gift, restrictions on how or when the gift may be spent. Temporarily restricted net assets also include unspent gains on donor-restricted gifts by virtue of the Foundation’s spending policy. This policy, which was approved by the Board of Trustees, aims to protect the Foundation’s donor-designated endowments from the effects of inflation by reinvesting a portion of the earnings on these funds as if they were endowment funds. Since the reinvestment of earnings from endowments was not explicitly designated by the donors, the reinvested earnings cannot be classified as permanently restricted under GAAP.
65

Wright State University
Notes to Financial Statements (Continued)
Quasi-endowment funds may also be established by request of a University college or department in accord with the Foundation’s quasi-endowment policy adopted by the board of trustees in fiscal year 2011. The objective of this policy is to allow significantly large temporarily restricted funds to generate earnings that may be used by the requesting unit for the purpose(s) specified by the donor.
Permanently restricted net assets consist of funds arising from a gift or bequest in which the donor has stipulated, as a condition of the gift that the principal be maintained in perpetuity and only the investment income from investment of the funds be expended. Certain donor endowments also specify that a portion of the earnings from the investment be reinvested as principal, or that all income earned over a period of time be reinvested. Amounts are also transferred for specific uses from time to time, as requested by the donor.
Gifts and Contributions Gifts and contributions are recorded at their fair value on the date of receipt. All contributions are considered to be available for unrestricted use unless specifically restricted by the donor. Gifts received that are designated for future periods or restricted by the donor for specific purposes are reported as temporarily restricted or permanently restricted support that increases those net asset categories.
Contributed property is recorded at fair value at the date of donation. If donors stipulate how long the assets must be used or restrict the use of such assets for a specific purpose, the contributions are recorded as restricted support. In the absence of such stipulations, gifts of property are recorded as unrestricted support.
Investment Earnings Interest and dividends from endowment investments are credited to temporarily restricted funds and spent in compliance with donor stipulations and the Foundation’s spending policy. Interest and dividends from non-endowment investments are credited to the unrestricted fund for expenditure at the discretion of the Foundation’s Board of Trustees. Realized gains or losses are determined based on the average cost method.
Net Assets Released from Restrictions When a donor restriction expires, that is, when a stipulated time restriction ends or purpose restriction is accomplished, temporarily restricted net assets are reclassified to unrestricted net assets and reported in the consolidated statement of activities as net assets released from restrictions.
Federal Income Taxes The Foundation has been approved under the Internal Revenue Code Section 501(c)(3) as a nonprofit organization exempt from federal taxes on its normal activities.
GAAP prescribes recognition thresholds and measurement attributes for the consolidated financial statement recognition and measurement of a tax position taken or expected to be taken in a tax return. A tax position is recognized as a benefit only if it is “more likely than not” that the tax position would be sustained in a tax examination, with a tax examination being presumed to occur. The amount recognized is the largest amount of tax benefit that is greater than 50% likely of being realized on examination. For tax positions not meeting the “more likely than not” test, no tax benefit is recorded. Management has concluded that they are unaware of any tax benefits or liabilities to be recognized at June 30, 2016 and 2015, respectively.
The Foundation does not have any tax benefits recorded at June 30, 2016 and does not expect that position to significantly change in the next year. The Foundation would recognize interest and/or penalties related to income tax matters in income tax expense, if applicable, and there were no amounts accrued for interest and penalties at June 30, 2016 and 2015.
66
Wright State University
Notes to Financial Statements (Continued)
Fair Value of Financial Instruments Fair value is defined as the price that would be received for an asset or paid to transfer a liability (an exit price) in the Foundation’s principal or most advantageous market for the asset or liability in an orderly transaction between market participants on the measurement date. The carrying value of the Foundation’s financial instruments, which include cash and cash equivalents, pledges receivable, investments, accounts payable, annuity agreements and long-term debt, approximate fair value.
Estimates The preparation of financial statements in conformity with accounting principles generally accepted in the United States of America requires management to make estimates and assumptions that affect the reported amounts of assets and liabilities and disclosure of contingent assets and liabilities at the date of the financial statements and the reported amounts of revenues and expenses during the reporting period. Actual results could differ from those estimates.
Reclassifications Certain reclassifications have been made to data in the accompanying prior year consolidated financial statements to conform to the current year’s presentation. These reclassifications had no effect on net assets or the change in net assets.
B. Business and Concentrations of Credit Risk
The Foundation’s financial instruments that are exposed to various risks, such as interest rate, market and concentrations of credit risk consist primarily of cash and investments. The Foundation deposits its cash in federally insured banks. These deposits are generally in excess of the Federal Deposit Insurance Corporation’s insurance limit.
Investments are managed by a professional investment management company under an outsourced chief investment officer arrangement. The investment manager is subject to the Foundation’s investment policy, approved by the board of trustees, which contains objectives, guidelines and restrictions designed to provide for preservation of capital with an emphasis on providing current income and achieving long-term growth of the funds without undue exposure to risk. Certain funds have been pooled for ease of management and to achieve greater diversification in investments. Due to the level of uncertainty related to changes in the value of investment securities, it is at least reasonably possible the changes in risks in the near term would result in material changes in the fair value of long-term investments and net assets of the Foundation.
C. Fair Value of Financial Instruments
Fair value is the price that would be received for an asset or paid to transfer a liability (an exit price) in the Foundation’s principal or most advantageous market on the measurement date.
The fair value hierarchy established by U.S. GAAP requires an entity to maximize the use of observable inputs and minimize the use of unobservable inputs when measuring fair value. The standard describes three levels of inputs that may be used to measure fair value:
Level 1: Quoted prices for identical assets or liabilities in active markets that the entity has the ability to access as of the measurement date.
Level 2: Significant other observable inputs other than Level 1 prices such as quoted prices for similar assets or liabilities; quoted prices in markets that are not active; or other inputs that are observable or can be corroborated by observable market data.
67
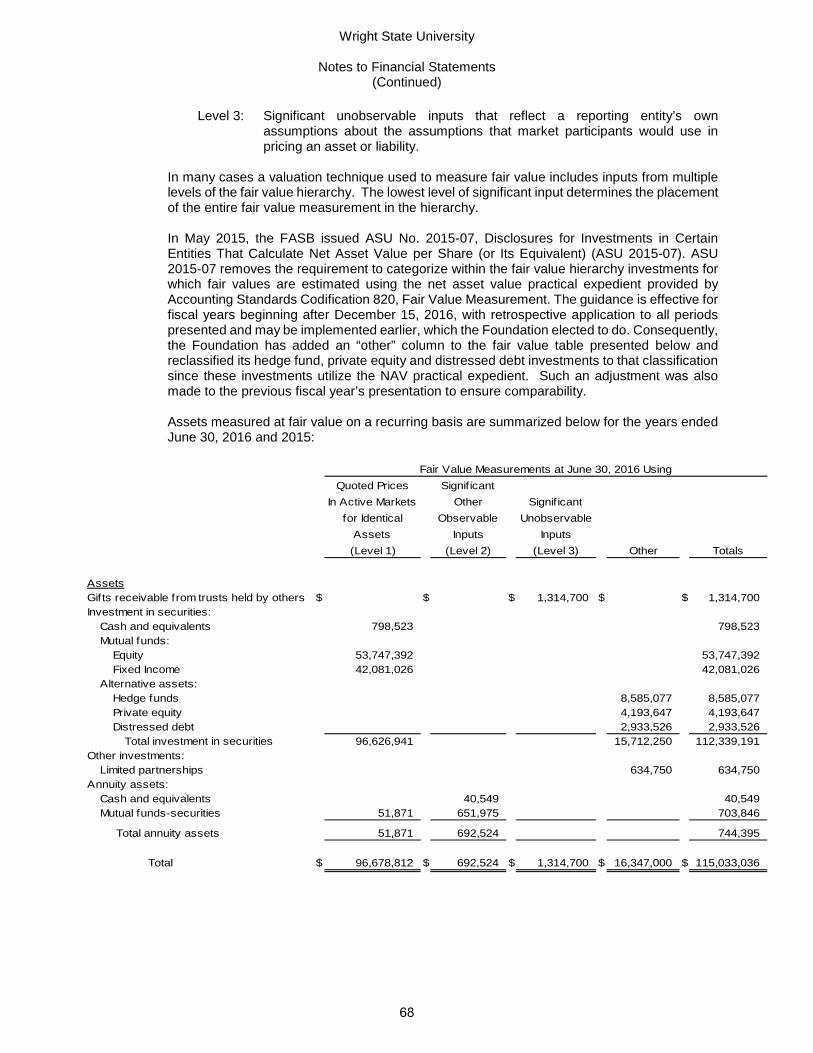
Wright State University
Notes to Financial Statements (Continued)
Level 3: Significant unobservable inputs that reflect a reporting entity’s own assumptions about the assumptions that market participants would use in pricing an asset or liability.
In many cases a valuation technique used to measure fair value includes inputs from multiple levels of the fair value hierarchy. The lowest level of significant input determines the placement of the entire fair value measurement in the hierarchy.
In May 2015, the FASB issued ASU No. 2015-07, Disclosures for Investments in Certain Entities That Calculate Net Asset Value per Share (or Its Equivalent) (ASU 2015-07). ASU 2015-07 removes the requirement to categorize within the fair value hierarchy investments for which fair values are estimated using the net asset value practical expedient provided by Accounting Standards Codification 820, Fair Value Measurement. The guidance is effective for fiscal years beginning after December 15, 2016, with retrospective application to all periods presented and may be implemented earlier, which the Foundation elected to do. Consequently, the Foundation has added an “other” column to the fair value table presented below and reclassified its hedge fund, private equity and distressed debt investments to that classification since these investments utilize the NAV practical expedient. Such an adjustment was also made to the previous fiscal year’s presentation to ensure comparability.
Assets measured at fair value on a recurring basis are summarized below for the years ended June 30, 2016 and 2015:
Quoted Prices Signif icant
In Active Markets Other Signif icant
for Identical Observable Unobservable
Assets Inputs Inputs
(Level 1) (Level 2) (Level 3) Other Totals
AssetsGifts receivable from trusts held by others $ $ $ 1,314,700 $ $ 1,314,700Investment in securities: Cash and equivalents 798,523 798,523 Mutual funds: Equity 53,747,392 53,747,392 Fixed Income 42,081,026 42,081,026 Alternative assets: Hedge funds 8,585,077 8,585,077 Private equity 4,193,647 4,193,647 Distressed debt 2,933,526 2,933,526
Total investment in securities 96,626,941 15,712,250 112,339,191Other investments: Limited partnerships 634,750 634,750Annuity assets: Cash and equivalents 40,549 40,549 Mutual funds-securities 51,871 651,975 703,846
Total annuity assets 51,871 692,524 744,395
Total $ 96,678,812 $ 692,524 $ 1,314,700 $ 16,347,000 $ 115,033,036
Fair Value Measurements at June 30, 2016 Using
68

Wright State University
Notes to Financial Statements (Continued)
Quoted Prices Signif icant
In Active Markets Other Signif icant
for Identical Observable Unobservable
Assets Inputs Inputs
(Level 1) (Level 2) (Level 3) Other Totals
AssetsGifts receivable from trusts held by others $ $ $ 1,394,640 $ $ 1,394,640Investment in securities: Cash and equivalents 7,600,000 7,600,000 Mutual funds: Equity 51,596,598 51,596,598 Fixed Income 41,549,216 41,549,216 Alternative assets: Hedge funds 11,938,497 11,938,497 Private equity 2,449,314 2,449,314 Distressed debt 2,919,589 2,919,589
Total investment in securities 100,745,814 17,307,400 118,053,214Other investments: Limited partnerships 900,614 900,614Annuity assets: Cash and equivalents 7,164 7,164 Mutual funds-securities 42,182 656,702 698,884
Total annuity assets 42,182 663,866 706,048
Total $ 100,787,996 $ 663,866 $ 1,394,640 $ 18,208,014 $ 121,054,516
Fair Value Measurements at June 30, 2015 Using
69

Wright State University
Notes to Financial Statements (Continued)
The table below presents a reconciliation and consolidated statement of activities classification of gains and losses for all assets measured at fair value on a recurring basis using significant unobservable inputs (Level 3) for the years ended June 30, 2016 and 2015:
2016Gifts Receivablefrom Trusts Held
by Others
Beginning balance, July 1 $ 1,394,640 Interest and dividends Realized gains on sales Unrealized gains included in earnings Purchases Sales Change in value of split interest agreements (79,940) Net transfers in/(out) of Level 3Ending balance, June 30 $ 1,314,700
2015Gifts Receivablefrom Trusts Held
by Others
Beginning balance, July 1 $ 1,326,100 Interest and dividends Realized gains on sales Unrealized gains included in earnings Purchases 74,440 Sales Change in value of split interest agreements (5,900) Net transfers in/(out) of Level 3Ending balance, June 30 $ 1,394,640
The fair value of gifts receivable from trusts held by others is based on a valuation model that calculates the present value of estimated residual trust value. The valuation model incorporates assumptions that market participants would use in estimating future investment earnings. Management determines the fair value based on best information available (Level 3 inputs).
Investments in securities consist primarily of mutual fund shares managed by a professional investment management company utilizing the “manager of managers” model of portfolio administration, as described in Note 11B. The fair value of mutual funds is based on quoted prices in active markets (Level 1 inputs).
For private equity, for which there is no active market, information such as historical and current performance of the underlying assets, cash flow projections, liquidity and credit premiums required by a market participant, and financial trend analysis with respect to the individual fund manager, are utilized in determining individual security valuations. Due to current market conditions as well as the limited trading activity of these securities, the market value of the securities is highly sensitive to assumption changes and market value volatility.
70

Wright State University
Notes to Financial Statements (Continued)
For hedge funds and distressed debt, for which there is no active market, information such as historical and current performance of the underlying assets, cash flow projections, liquidity and credit premiums required by a market participant, and financial trend analysis with respect to the individual fund manager, are utilized in determining individual security valuations. For the past several years, the Foundation’s hedge fund allocation has been divided between two funds. The first fund was structured as an offshore company that invests all of its capital in private placement funds and its investment objective is to seek to achieve a return somewhere between historical market equity and fixed income returns with a moderate level of risk undertaken. The fund is broadly diversified and invests in multiple hedge fund strategies including convertible bond hedging, credit hedging, distressed debt, equity market neutral, equity long/short, merger arbitrage, short biased and sovereign debt and mortgage hedging. The fund generally invests in 30-40 hedge funds and the fund of funds manager requires full transparency of each of the underlying funds’ investment positions. The Foundation was no longer subject to the fund’s initial one-year lock-up period. The valuation of this investment is based on net asset value (“NAV”). In FY16, due to performance concerns, the Foundation decided to exit this particular fund. By the end of the year, the investment had been liquidated, although approximately ten percent of the assets were escrowed pending completion of the annual audit and issuance of the fund’s financial statements. The escrowed amount is shown as a cash and equivalent in the Investment in Securities section of the first table in this Note and will be reallocated to other investments in FY17. The Foundation’s remaining hedge fund allocation is also invested in a “fund of funds” structured as an offshore company. The fund’s investment objective is to seek to achieve high returns balanced against an appropriate level of volatility and directional market exposure over a full market cycle. The fund is broadly diversified and invests in various private funds such as hedge funds that pursue hedged or other alternative investment strategies, private equity funds, hybrid funds and any other alternative investment funds, while also opportunistically investing directly in any other securities and financial instruments. The fund generally invests in 15-20 funds and the fund of funds manager requires full transparency of each of the underlying funds’ investment positions. The Foundation is no longer subject to the fund’s initial two-year lock-up period and may, therefore, request liquidation on a semi-annual basis with 95 days prior notification. At June 30, 2016, the Foundation has no significant unfunded commitments to this hedge fund allocation. The valuation of this investment is based on NAV. Approximately 53% of the Foundation’s private equity fund investment is structured as a domestic partnership in which the Foundation is a limited partner. The fund seeks to invest the capital contributed to it in a diversified pool of long-term investments in non-publically traded companies. Diversification is accomplished by investing 40-60% of committed capital in underlying funds focused on the United States, 20-40% on Europe and 0-30% on emerging markets. Capital commitments of the limited partners are payable to the partnership in installments over a 3 – 5 year period. At June 30, 2016, the Foundation’s total capital commitment of $3,500,000 was 71.4% ($2,498,908) funded. Due to the long-term commitment of capital and the unpredictability of capital calls and partnership distributions, the fund is generally considered illiquid. It is also not unusual for private equity funds to experience losses in the early years of their existence. The valuation of this investment is based on NAV. The balance of the Foundation’s investment in the private equity space is in a fund also structured as a domestic partnership in which the Foundation is a limited partner. The fund seeks to continue the investment policy of the first fund, but seeks more diversification, shorter duration and a focus on cash returns. Diversification is accomplished by investing over five sub-class targets: buyouts, venture capital, debt, real estate and real assets/infrastructure. Capital commitments of the limited partners are payable to the partnership in installments over a 3 – 5 year period. At June 30, 2016, the Foundation’s total capital commitment of $6,400,000 was 29.9% ($1,911,636) funded. Due to the long-term commitment of capital and the
71

Wright State University
Notes to Financial Statements (Continued)
unpredictability of capital calls and partnership distributions, the fund is generally considered illiquid. It is also not unusual for private equity funds to experience losses in the early years of their existence. The valuation of this investment is based on NAV.
For FY15, the Foundation’s investment in distressed debt is in the form of a fund that invests in a diversified portfolio of structured credit instruments, the majority of which are Collateralized Debt Obligation (CDO) equity and mezzanine notes. CDOs are structured finance securities that hold a diversified pool of income-generating collateral that is financed through the issuance of debt securities. CDO investors assume the first level of default risk. These notes are lowly correlated to traditional and other alternative investments, have minimal interest rate risk, and are highly transparent. The valuation of this investment is based on NAV. In FY16, the Foundation decided to exit this fund in favor of a distressed debt fund that focused on the energy sector (described below). Accordingly, a request was made to liquidate the investment, which was accomplished before year-end. However, approximately 10% of these assets were placed in escrow pending completion of the fund’s annual audit and issuance of its financial statements. The escrow is shown as a cash and equivalent in the Investment in Securities section of the first table in this Note and will be reallocated to other investments in FY17.
The Foundation’s remaining investment in distressed debt is in the form of a fund that invests directly and indirectly in below investment grade bonds and loans (and other debt and equity instruments) of U.S. and international energy companies. The fund is structured as a domestic limited partnership. The fund seeks to generate high absolute returns by investing in securities which are purchased or acquired at a significant discount to fair value and/or offer high coupon rates. The fund will maintain a flexible approach to attempt to identify the most attractive risk-adjusted returns primarily within the energy debt space primarily through: 1) below investment grade bonds and loans of U.S. energy companies which trade at a discount to fair value; 2) direct lending at attractive risk-adjusted rates to U.S. energy companies; and/or 3) smaller allocations to U.S. investment grade and emerging markets companies. The Foundation’s investment in this asset class was fully funded at June 30, 2016. The Foundation is subject to the fund’s lockup period of three years, which will end in August of 2018. Once the lockup period is over, liquidations may be requested on a semi-annual basis with a 95 days prior notice, subject to fund director consent and certain gate, holdback and suspension restrictions. The valuation of this investment is based on NAV and subject to a monthly lag.
Valuation of limited partnership shares reported as “other investments” are derived from reports issued by the general partners adjusted for capital contributions and withdrawals throughout the fiscal year. Although the fund custodians provide annual audited financial statements for each of the funds, the value of the underlying securities is difficult to ascertain as there is no active market associated with these ownership interests. The valuation of this investment is based on NAV.
Valuation of annuity assets is based on a “Default Level Matrix” developed by the custodian. Mutual funds and other instruments are classified based on analysis and review of FASB standards, together with input from securities pricing service companies, broker/dealers and investment managers regarding their pricing methodologies; discussions with clients and independent accounting firms regarding various market inputs used to determine fair value and participation in industry forums. Management believes that this custodian-developed matrix accurately interprets applicable FASB guidance with respect to the level classification defined therein (Level 2 inputs – market approach).
72
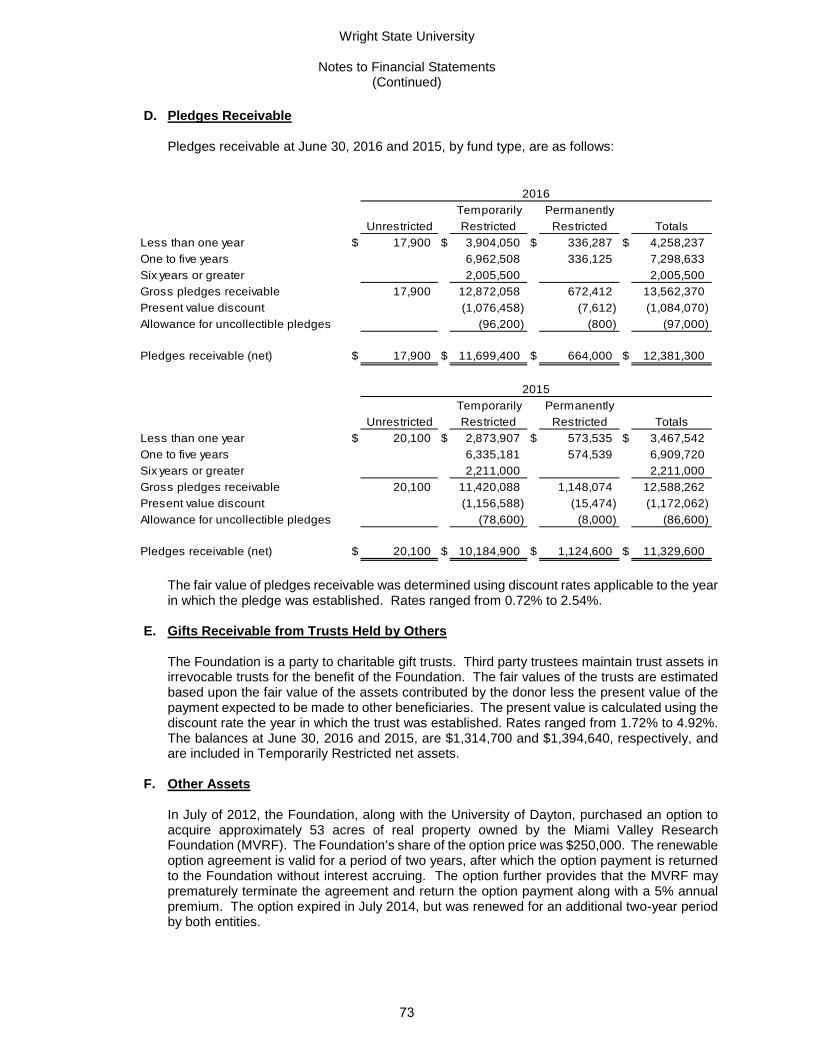
Wright State University
Notes to Financial Statements (Continued)
D. Pledges Receivable
Pledges receivable at June 30, 2016 and 2015, by fund type, are as follows:
Temporarily Permanently
Unrestricted Restricted Restricted Totals
Less than one year $ 17,900 $ 3,904,050 $ 336,287 $ 4,258,237
One to five years 6,962,508 336,125 7,298,633
Six years or greater 2,005,500 2,005,500
Gross pledges receivable 17,900 12,872,058 672,412 13,562,370
Present value discount (1,076,458) (7,612) (1,084,070)
Allowance for uncollectible pledges (96,200) (800) (97,000)
Pledges receivable (net) $ 17,900 $ 11,699,400 $ 664,000 $ 12,381,300
Temporarily Permanently
Unrestricted Restricted Restricted Totals
Less than one year $ 20,100 $ 2,873,907 $ 573,535 $ 3,467,542
One to five years 6,335,181 574,539 6,909,720
Six years or greater 2,211,000 2,211,000
Gross pledges receivable 20,100 11,420,088 1,148,074 12,588,262
Present value discount (1,156,588) (15,474) (1,172,062)
Allowance for uncollectible pledges (78,600) (8,000) (86,600)
Pledges receivable (net) $ 20,100 $ 10,184,900 $ 1,124,600 $ 11,329,600
2016
2015
The fair value of pledges receivable was determined using discount rates applicable to the year in which the pledge was established. Rates ranged from 0.72% to 2.54%.
E. Gifts Receivable from Trusts Held by Others
The Foundation is a party to charitable gift trusts. Third party trustees maintain trust assets in irrevocable trusts for the benefit of the Foundation. The fair values of the trusts are estimated based upon the fair value of the assets contributed by the donor less the present value of the payment expected to be made to other beneficiaries. The present value is calculated using the discount rate the year in which the trust was established. Rates ranged from 1.72% to 4.92%. The balances at June 30, 2016 and 2015, are $1,314,700 and $1,394,640, respectively, and are included in Temporarily Restricted net assets.
F. Other Assets
In July of 2012, the Foundation, along with the University of Dayton, purchased an option to acquire approximately 53 acres of real property owned by the Miami Valley Research Foundation (MVRF). The Foundation’s share of the option price was $250,000. The renewable option agreement is valid for a period of two years, after which the option payment is returned to the Foundation without interest accruing. The option further provides that the MVRF may prematurely terminate the agreement and return the option payment along with a 5% annual premium. The option expired in July 2014, but was renewed for an additional two-year period by both entities.
73
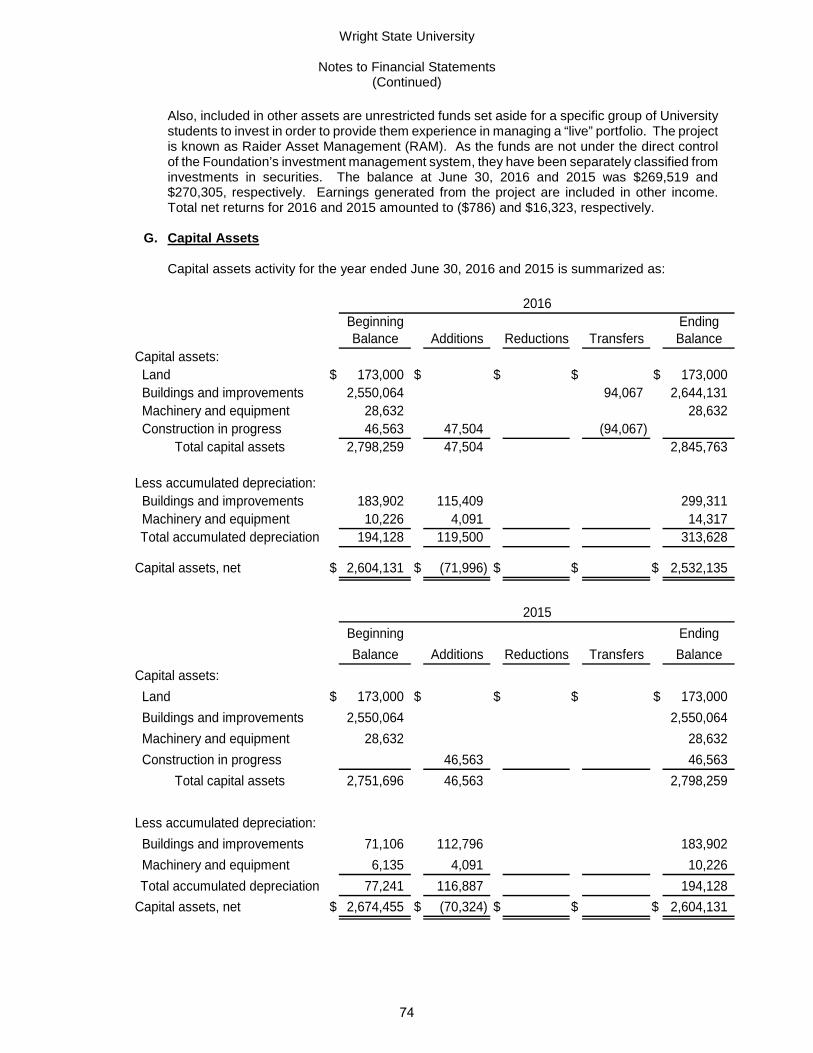
Wright State University
Notes to Financial Statements (Continued)
Also, included in other assets are unrestricted funds set aside for a specific group of University students to invest in order to provide them experience in managing a “live” portfolio. The project is known as Raider Asset Management (RAM). As the funds are not under the direct control of the Foundation’s investment management system, they have been separately classified from investments in securities. The balance at June 30, 2016 and 2015 was $269,519 and $270,305, respectively. Earnings generated from the project are included in other income. Total net returns for 2016 and 2015 amounted to ($786) and $16,323, respectively.
G. Capital Assets
Capital assets activity for the year ended June 30, 2016 and 2015 is summarized as:
Beginning EndingBalance Additions Reductions Transfers Balance
Capital assets: Land $ 173,000 $ $ $ $ 173,000 Buildings and improvements 2,550,064 94,067 2,644,131 Machinery and equipment 28,632 28,632 Construction in progress 46,563 47,504 (94,067)
Total capital assets 2,798,259 47,504 2,845,763
Less accumulated depreciation: Buildings and improvements 183,902 115,409 299,311 Machinery and equipment 10,226 4,091 14,317Total accumulated depreciation 194,128 119,500 313,628
Capital assets, net $ 2,604,131 $ (71,996) $ $ $ 2,532,135
Beginning Ending
Balance Additions Reductions Transfers Balance
Capital assets:
Land $ 173,000 $ $ $ $ 173,000
Buildings and improvements 2,550,064 2,550,064
Machinery and equipment 28,632 28,632
Construction in progress 46,563 46,563
Total capital assets 2,751,696 46,563 2,798,259
Less accumulated depreciation:
Buildings and improvements 71,106 112,796 183,902
Machinery and equipment 6,135 4,091 10,226
Total accumulated depreciation 77,241 116,887 194,128
Capital assets, net $ 2,674,455 $ (70,324) $ $ $ 2,604,131
2016
2015
74

Wright State University
Notes to Financial Statements (Continued)
H. Debt Guaranties
During fiscal year 2011, the Foundation entered into agreement with Dayton Regional STEM Schools, Incorporated (“STEM”) guarantying payments on a lease (and such other obligations imposed by the lease) related to the purchase and renovation of an existing building that is utilized by the School in fulfillment of its corporate purposes. STEM is one of ten Ohio schools offering students a relevant, real world educational experience that will prepare them for college and opportunities in the work world. Wright State University has acted as STEM’s fiscal agent as well as providing space, supplies and personnel in support of its operations. The agreement pledges unrestricted net assets of the Foundation in an amount not to exceed $3,000,000 and the designation of unrestricted net assets in the amount of one year of maximum debt service ($600,000) on bonds associated with the project. Since the guaranty may expire without being drawn upon, the total guaranty does not necessarily represent future cash requirements. As of June 30, 2016, no amounts have been recognized as a liability under the financial guaranty in the Foundation’s consolidated statement of financial position as the likelihood that STEM would be unable to fulfill its obligation in full or in part under the debt agreement is not considered to be probable.
(12) Selected Disclosures of the Wright State Applied Research Corporation (a component unit)
Wright State Applied Research Corporation (WSARC) is a separate, not-for-profit entity governed by a separate board of directors (the Board). The 8-member Board includes the University President, University Assistant Vice President for Research, Dean of the University College of Engineering and Computer Science, WSARC CEO, WSARC President, and three non-university members elected by the Board. WSARC is the contracting entity for the Wright State Research Institute, a department of the University.
A. Summary of Significant Accounting Policies
Basis of Accounting The financial statements of WSARC have been prepared on the accrual basis in accordance with accounting principles generally accepted in the United States of America.
Contract and Grant Revenue WSARC’s principal revenue is derived from sponsored research contracts, which are primarily cost plus fixed fee in nature. Sponsored research contracts are agreements for specific research, which is performed for a sponsor. WSARC recognizes sponsored research contract revenue prorated based upon the costs incurred on each sponsored research contract. The prorated revenue closely approximates the percentage of work completed for each contract. Contract and grant revenue consists of approximately 99% and 87% of government funding for 2016 and 2015, with the remainder consisting of private funding.
Receivables are reflected for both billed and unbilled amounts based upon the work completed. WSARC uses the allowance method to estimate uncollectible receivables in these two categories. The allowances, if any, are based on prior experience and management’s analysis of specific contracts. Interest is not charged on any past due balances. As of June 30, 2016 and 2015, there were no allowances.
Cash and Cash Equivalents WSARC considers all demand deposits, certificates of deposit, and money market funds with an original maturity of three months or less to be cash and cash equivalents. WSARC maintains cash balances at banks and the accounts are insured by the Federal Deposit Insurance
75

Wright State University
Notes to Financial Statements (Continued)
Corporation up to $250,000 as of June 30, 2016 and 2015. As of June 30, 2016 and 2015, WSARC had uninsured deposits of approximately $8,457,000 and $3,000,000, respectively.
Other Assets Other assets represents certain deposits, a note receivable, and unamortized portion of annual maintenance agreements.
Property and Equipment Property and equipment with an original purchase price or donated value of $5,000 or greater is capitalized at cost for purchased assets and at fair value for donated assets. The straight-line method of depreciation is used over the assets’ estimated useful lives (three to seven years for most assets, up to 40 years for buildings and improvements). The cost and related accumulated depreciation of assets disposed of are eliminated from the accounts in the year of disposal.
Impairment of Long-Lived Assets WSARC continually evaluates whether events and circumstances have occurred that indicate the remaining estimated useful life of long-lived assets may warrant revision. In evaluating whether these long-lived assets are recoverable, WSARC estimates the sum of the expected future cash flows, undiscounted and without interest charge derived from such assets over their remaining useful life. Management believes that there was no impairment of long-lived assets for the years ended June 30, 2016 and 2015.
Deferred Revenue Cash received in advance of being earned is recorded as deferred revenue. In the subsequent period, when the revenue recognition criteria are met, revenue is recognized and the deferred revenue is reduced accordingly. The state of Ohio appropriated funds to WSARC for projects and activities that commenced after June 30, 2012. At June 30, 2016 and 2015, the balance of deferred revenue relating to the state appropriation is $7,503,496 and $2,640,430, respectively. Deferred revenue also related to various other contracts is $0 at June 30, 2016 and 2015.
Net Assets Under accounting principles generally accepted in the United States of America, WSARC is required to report information regarding its financial position and activities according to three classes of net assets: unrestricted, temporarily restricted and permanently restricted. Net assets and revenue, gains, and losses are classified based on the existence or absence of donor-imposed restrictions as follows:
Unrestricted net assets: Net assets that are not subject to donor-imposed stipulations or are designated for use by WSARC’s Board of Trustees.
Temporarily restricted net assets: Net assets subject to donor-imposed stipulations that may or will be met either by actions of WSARC and/or the passage of time.
Permanently restricted net assets: Net assets subject to donor-imposed stipulations that they be maintained permanently by WSARC.
As of June 30, 2016 and 2015, there are no donor restrictions on any of the net assets of WSARC and therefore all net assets are reflected as unrestricted.
University Support of WSARC University employees provide operational, technical and administrative functions for WSARC. These services are expensed as incurred by WSARC.
76

Wright State University
Notes to Financial Statements (Continued)
Income Tax WSARC has been determined to be exempt from federal income taxes under Section 501(a) of the Internal Revenue Code of 1986 (the “Code”), as an organization described in Sections 501(c)(3) and 170(b)(l)(A)(ii) of the Code. Accordingly, no provision for taxes has been made in the financial statements.
Accounting principles generally accepted in the United States of America prescribe recognition thresholds and measurement attributes for the financial statement recognition and measurement of a tax position taken or expected to be taken in a tax return. Tax benefits will be recognized only if a tax position is more-likely-than-not sustained in a tax examination, with a tax examination being presumed to occur. The amount recognized will be the largest amount of tax benefit that is greater than 50% likely being realized on examination. For tax positions not meeting the more-likely-than-not test, no tax benefit will be recorded. Management has concluded that they are unaware of any tax benefits or liabilities to be recognized at June 30, 2016 and 2015.
WSARC would recognize interest and penalties related to unrecognized tax benefits in interest and income tax expense, respectively. WSARC has no amounts accrued for interest or penalties for the years ended June 30, 2016 and 2015. WSARC is no longer subject to U.S. federal, state and local income tax examinations by tax authorities for years before 2011. WSARC does not expect the total amount of unrecognized tax benefits to significantly change in the next 12 months.
Estimates The preparation of financial statements in conformity with accounting principles generally accepted in the United States of America requires WSARC’s management to make estimates and assumptions that affect the reported amounts of assets and liabilities at the date of the financial statements and the reported amounts of revenue and expenses during the reporting period. Actual results could differ from those estimates.
Contingencies WSARC receives significant assistance from numerous federal and state agencies in the form of grants. The disbursement of funds received under these programs generally requires compliance with terms and conditions specified in the grant agreements and are subject to audit by the grantor agencies. Any disallowed claims resulting from such audits could become a liability. Management believes that any potential disallowance of claims would not have a material effect on the financial statements.
WSARC is periodically involved as a defendant or codefendant in various matters of litigation. Management believes that the ultimate disposition of any current matters would not have a material adverse effect upon the financial statements. In addition, WSARC is a participant in an ongoing federal investigation of the University. The expected time of completion and the potential impacts of the investigation on WSARC are unknown at this time.
Reclassifications Certain amounts have been reclassified to conform prior year’s financial statements on a basis comparable to the current year’s financial statements. The reclassification had no effect on the change in net assets or total net assets.
77
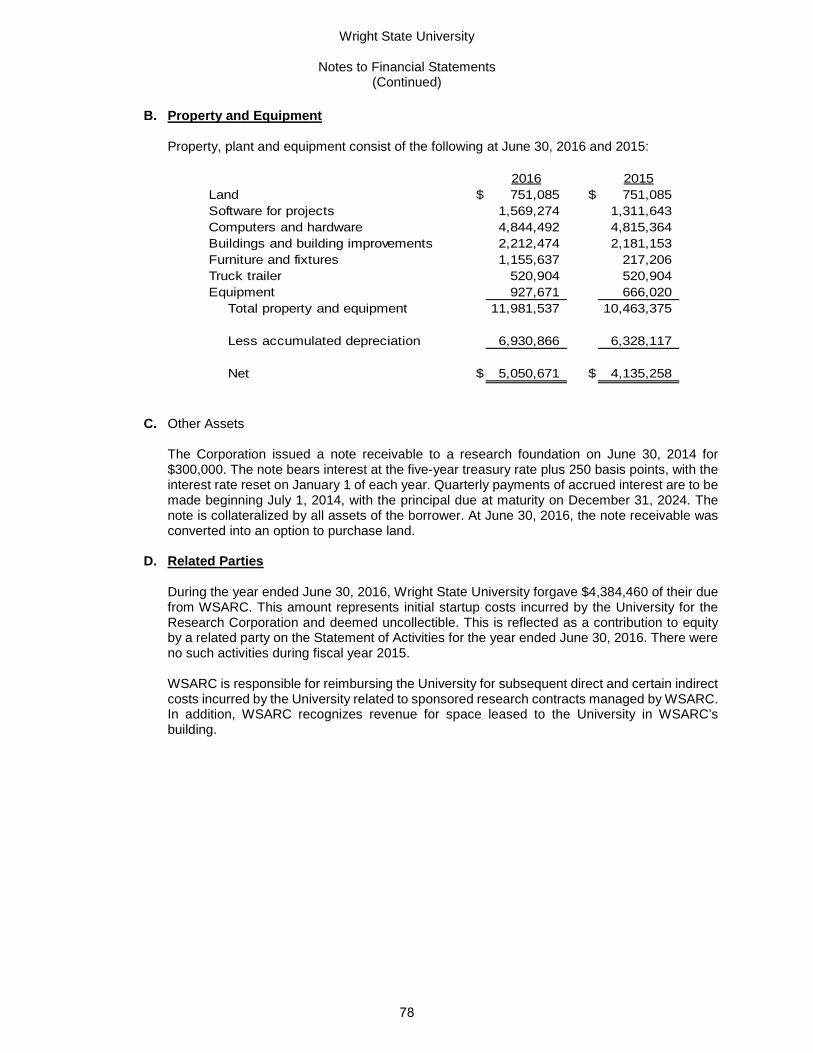
Wright State University
Notes to Financial Statements (Continued)
B. Property and Equipment
Property, plant and equipment consist of the following at June 30, 2016 and 2015:
2016 2015Land $ 751,085 $ 751,085Software for projects 1,569,274 1,311,643Computers and hardware 4,844,492 4,815,364Buildings and building improvements 2,212,474 2,181,153Furniture and fixtures 1,155,637 217,206Truck trailer 520,904 520,904Equipment 927,671 666,020
Total property and equipment 11,981,537 10,463,375
Less accumulated depreciation 6,930,866 6,328,117
Net $ 5,050,671 $ 4,135,258
C. Other Assets
The Corporation issued a note receivable to a research foundation on June 30, 2014 for $300,000. The note bears interest at the five-year treasury rate plus 250 basis points, with the interest rate reset on January 1 of each year. Quarterly payments of accrued interest are to be made beginning July 1, 2014, with the principal due at maturity on December 31, 2024. The note is collateralized by all assets of the borrower. At June 30, 2016, the note receivable was converted into an option to purchase land.
D. Related Parties
During the year ended June 30, 2016, Wright State University forgave $4,384,460 of their due from WSARC. This amount represents initial startup costs incurred by the University for the Research Corporation and deemed uncollectible. This is reflected as a contribution to equity by a related party on the Statement of Activities for the year ended June 30, 2016. There were no such activities during fiscal year 2015.
WSARC is responsible for reimbursing the University for subsequent direct and certain indirect costs incurred by the University related to sponsored research contracts managed by WSARC. In addition, WSARC recognizes revenue for space leased to the University in WSARC’s building.
78

Wright State University
Notes to Financial Statements (Continued)
The balances owed to and due from the University at June 30, 2016 and 2015, respectively, are stated below.
2016 2015Due to Wright State University
Accrued Wages $ 5,019,168 $ 7,126,6077,126,607
Due from Wright State UniversityRent 813,000Other 905,742
1,718,742
Total due to Wright State University $ 5,019,168 $ 5,407,865
E. Debt Guaranty
During fiscal year 2014, a donor made a bequest to the University of an office building in the donor’s name. The donor has a mortgage on the building of approximately $2,700,000. During fiscal year 2014, WSARC entered into an agreement with the lender guarantying the debt service payments of the mortgage. As of June 30, 2016 and 2015, no amounts were recognized as a liability under the financial guaranty in WSARC’s statement of financial position.
79

This page intentionally left blank
80
REQUIRED SUPPLEMENTARY INFORMATION
81
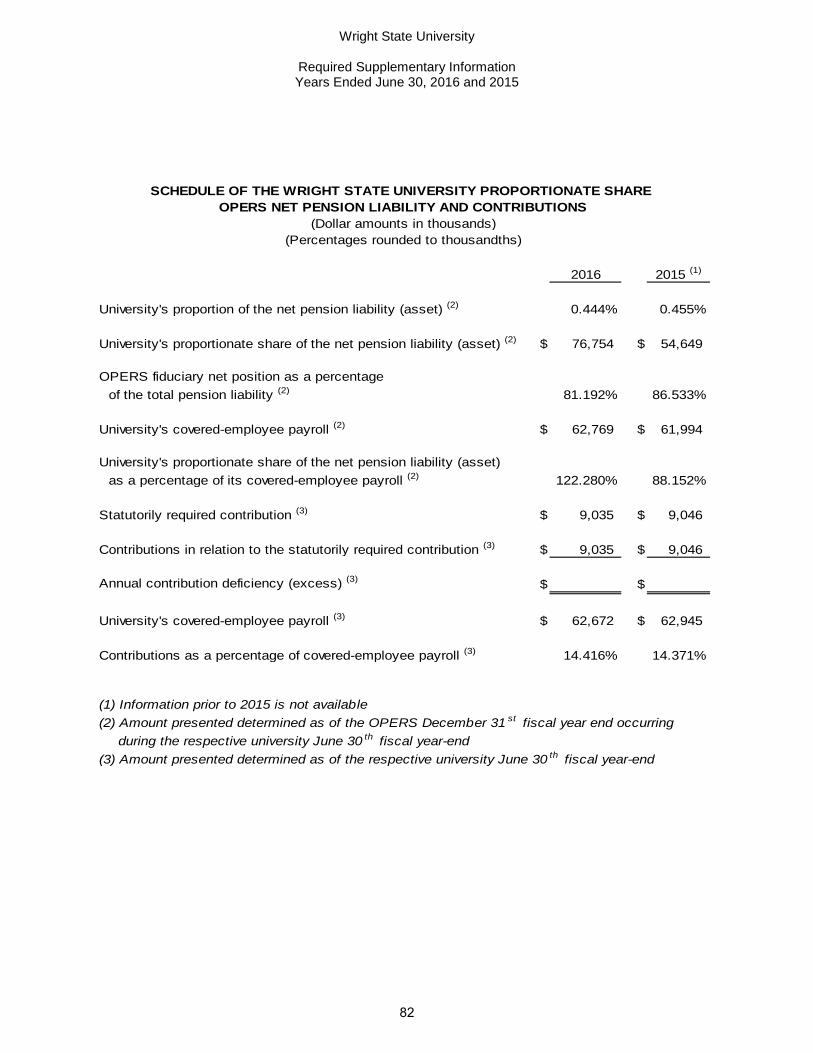
Wright State University
Required Supplementary Information Years Ended June 30, 2016 and 2015
2016 2015 (1)
University's proportion of the net pension liability (asset) (2) 0.444% 0.455%
University's proportionate share of the net pension liability (asset) (2) $ 76,754 $ 54,649
OPERS fiduciary net position as a percentage
of the total pension liability (2) 81.192% 86.533%
University's covered-employee payroll (2) $ 62,769 $ 61,994
University's proportionate share of the net pension liability (asset)
as a percentage of its covered-employee payroll (2) 122.280% 88.152%
Statutorily required contribution (3) $ 9,035 $ 9,046
Contributions in relation to the statutorily required contribution (3) $ 9,035 $ 9,046
Annual contribution deficiency (excess) (3) $ $
University's covered-employee payroll (3) $ 62,672 $ 62,945
Contributions as a percentage of covered-employee payroll (3) 14.416% 14.371%
(1) Information prior to 2015 is not available(2) Amount presented determined as of the OPERS December 31 st fiscal year end occurring
during the respective university June 30 th fiscal year-end(3) Amount presented determined as of the respective university June 30 th fiscal year-end
SCHEDULE OF THE WRIGHT STATE UNIVERSITY PROPORTIONATE SHARE OPERS NET PENSION LIABILITY AND CONTRIBUTIONS
(Dollar amounts in thousands)(Percentages rounded to thousandths)
82
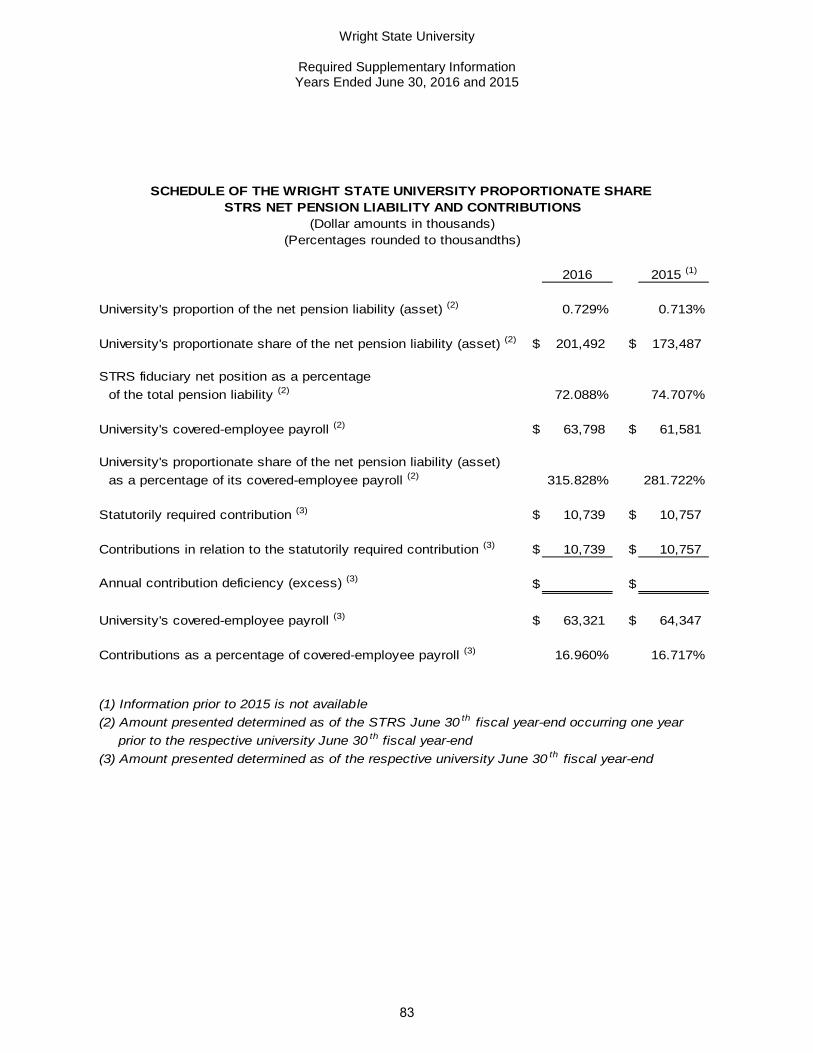
Wright State University
Required Supplementary Information Years Ended June 30, 2016 and 2015
2016 2015 (1)
University's proportion of the net pension liability (asset) (2) 0.729% 0.713%
University's proportionate share of the net pension liability (asset) (2) $ 201,492 $ 173,487
STRS fiduciary net position as a percentage
of the total pension liability (2) 72.088% 74.707%
University's covered-employee payroll (2) $ 63,798 $ 61,581
University's proportionate share of the net pension liability (asset)
as a percentage of its covered-employee payroll (2) 315.828% 281.722%
Statutorily required contribution (3) $ 10,739 $ 10,757
Contributions in relation to the statutorily required contribution (3) $ 10,739 $ 10,757
Annual contribution deficiency (excess) (3) $ $
University's covered-employee payroll (3) $ 63,321 $ 64,347
Contributions as a percentage of covered-employee payroll (3) 16.960% 16.717%
(1) Information prior to 2015 is not available(2) Amount presented determined as of the STRS June 30 th fiscal year-end occurring one year
prior to the respective university June 30 th fiscal year-end(3) Amount presented determined as of the respective university June 30 th fiscal year-end
SCHEDULE OF THE WRIGHT STATE UNIVERSITY PROPORTIONATE SHARE STRS NET PENSION LIABILITY AND CONTRIBUTIONS
(Dollar amounts in thousands)(Percentages rounded to thousandths)
83

This page intentionally left blank
84

See notes to the Schedule of Expenditures of Federal Awards. (Continued)
WRIGHT STATE UNIVERSITY
SCHEDULE OF EXPENDITURES OF FEDERAL AWARDSYEAR ENDED JUNE 30, 2016
FederalCFDA Number
or Primary Pass-through Pass-throughFederal Grant/Pass Through Grant/Program Title Grant Number Agency Agency Number Expenditures
STUDENT FINANCIAL ASSISTANCE CLUSTER
U.S. Department of Education Direct Programs -
Federal Supplemental Educational Opportunity Grant 84.007 517,420$
William D. Ford Federal Direct Loan Program 84.268 96,182,433Federal Work Study 84.033 812,728Federal Perkins Loan Outstanding Balance 84.038 11,977,687Federal Pell Grant 84.063 20,811,834
Total U.S. Department of Education Direct Programs 130,302,102
U.S. Department of Health and Human Services Direct Programs -
ARRA - Nurse Faculty Loan Program Outstanding Balance 93.264 11,444Health Professions Student Loans Outstanding Balance 93.342 12,294Loans for Disadvantaged Students Outstanding Balance 93.342 157,547Nurse Faculty Loan Program Outstanding Balance 93.264 159,161Nursing Student Loans Outstanding Balance 93.364 874,293Primary Care Loans Outstanding Balance 93.342 1,224,659
Total U.S. Department of Health and Human Services Direct Programs 2,439,398
TOTAL STUDENT FINANCIAL ASSISTANCE CLUSTER 132,741,500
85
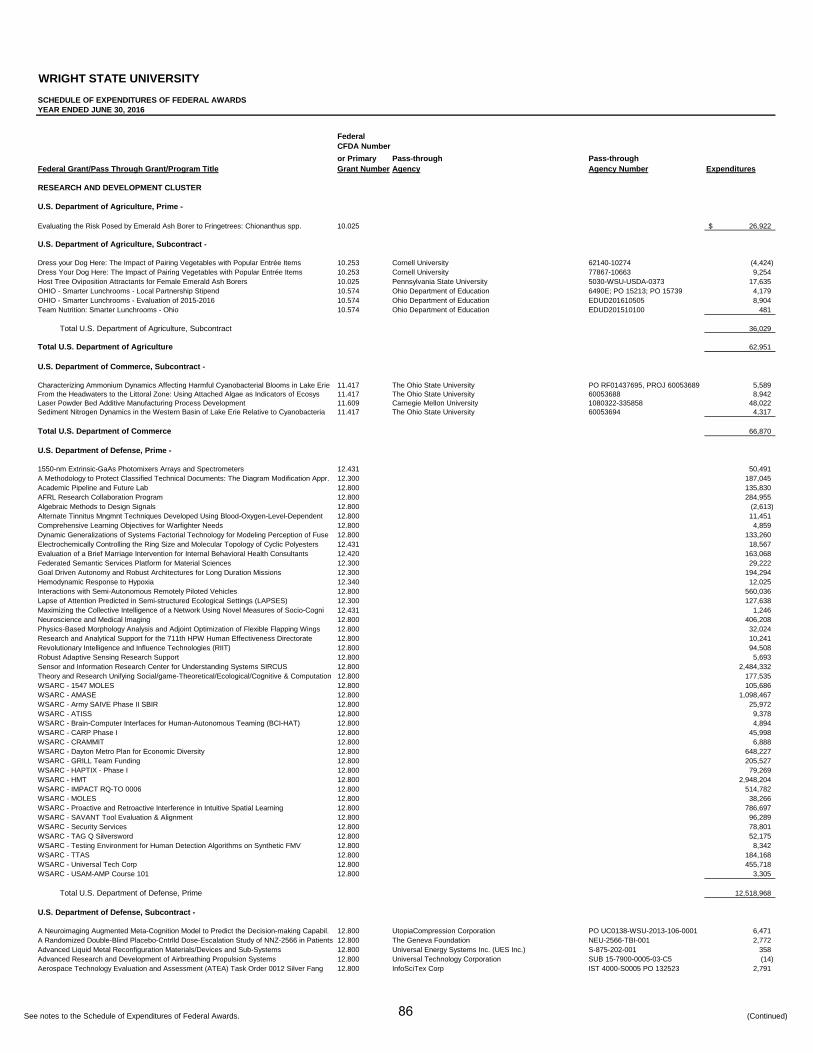
See notes to the Schedule of Expenditures of Federal Awards. (Continued)
WRIGHT STATE UNIVERSITY
SCHEDULE OF EXPENDITURES OF FEDERAL AWARDSYEAR ENDED JUNE 30, 2016
FederalCFDA Number
or Primary Pass-through Pass-throughFederal Grant/Pass Through Grant/Program Title Grant Number Agency Agency Number Expenditures
RESEARCH AND DEVELOPMENT CLUSTER
U.S. Department of Agriculture, Prime -
Evaluating the Risk Posed by Emerald Ash Borer to Fringetrees: Chionanthus spp. 10.025 26,922$
U.S. Department of Agriculture, Subcontract -
Dress your Dog Here: The Impact of Pairing Vegetables with Popular Entrée Items 10.253 Cornell University 62140-10274 (4,424)Dress Your Dog Here: The Impact of Pairing Vegetables with Popular Entrée Items 10.253 Cornell University 77867-10663 9,254Host Tree Oviposition Attractants for Female Emerald Ash Borers 10.025 Pennsylvania State University 5030-WSU-USDA-0373 17,635OHIO - Smarter Lunchrooms - Local Partnership Stipend 10.574 Ohio Department of Education 6490E; PO 15213; PO 15739 4,179OHIO - Smarter Lunchrooms - Evaluation of 2015-2016 10.574 Ohio Department of Education EDUD201610505 8,904Team Nutrition: Smarter Lunchrooms - Ohio 10.574 Ohio Department of Education EDUD201510100 481
Total U.S. Department of Agriculture, Subcontract 36,029
Total U.S. Department of Agriculture 62,951
U.S. Department of Commerce, Subcontract -
Characterizing Ammonium Dynamics Affecting Harmful Cyanobacterial Blooms in Lake Erie 11.417 The Ohio State University PO RF01437695, PROJ 60053689 5,589From the Headwaters to the Littoral Zone: Using Attached Algae as Indicators of Ecosys 11.417 The Ohio State University 60053688 8,942Laser Powder Bed Additive Manufacturing Process Development 11.609 Carnegie Mellon University 1080322-335858 48,022Sediment Nitrogen Dynamics in the Western Basin of Lake Erie Relative to Cyanobacteria 11.417 The Ohio State University 60053694 4,317
Total U.S. Department of Commerce 66,870
U.S. Department of Defense, Prime -
1550-nm Extrinsic-GaAs Photomixers Arrays and Spectrometers 12.431 50,491A Methodology to Protect Classified Technical Documents: The Diagram Modification Appr. 12.300 187,045Academic Pipeline and Future Lab 12.800 135,830AFRL Research Collaboration Program 12.800 284,955Algebraic Methods to Design Signals 12.800 (2,613)Alternate Tinnitus Mngmnt Techniques Developed Using Blood-Oxygen-Level-Dependent 12.800 11,451Comprehensive Learning Objectives for Warfighter Needs 12.800 4,859Dynamic Generalizations of Systems Factorial Technology for Modeling Perception of Fuse 12.800 133,260Electrochemically Controlling the Ring Size and Molecular Topology of Cyclic Polyesters 12.431 18,567Evaluation of a Brief Marriage Intervention for Internal Behavioral Health Consultants 12.420 163,068Federated Semantic Services Platform for Material Sciences 12.300 29,222Goal Driven Autonomy and Robust Architectures for Long Duration Missions 12.300 194,294Hemodynamic Response to Hypoxia 12.340 12,025Interactions with Semi-Autonomous Remotely Piloted Vehicles 12.800 560,036Lapse of Attention Predicted in Semi-structured Ecological Settings (LAPSES) 12.300 127,638Maximizing the Collective Intelligence of a Network Using Novel Measures of Socio-Cogni 12.431 1,246Neuroscience and Medical Imaging 12.800 406,208Physics-Based Morphology Analysis and Adjoint Optimization of Flexible Flapping Wings 12.800 32,024Research and Analytical Support for the 711th HPW Human Effectiveness Directorate 12.800 10,241Revolutionary Intelligence and Influence Technologies (RIIT) 12.800 94,508Robust Adaptive Sensing Research Support 12.800 5,693Sensor and Information Research Center for Understanding Systems SIRCUS 12.800 2,484,332Theory and Research Unifying Social/game-Theoretical/Ecological/Cognitive & Computation 12.800 177,535WSARC - 1547 MOLES 12.800 105,686WSARC - AMASE 12.800 1,098,467WSARC - Army SAIVE Phase II SBIR 12.800 25,972WSARC - ATISS 12.800 9,378WSARC - Brain-Computer Interfaces for Human-Autonomous Teaming (BCI-HAT) 12.800 4,894WSARC - CARP Phase I 12.800 45,998WSARC - CRAMMIT 12.800 6,888WSARC - Dayton Metro Plan for Economic Diversity 12.800 648,227WSARC - GRILL Team Funding 12.800 205,527WSARC - HAPTIX - Phase I 12.800 79,269WSARC - HMT 12.800 2,948,204WSARC - IMPACT RQ-TO 0006 12.800 514,782WSARC - MOLES 12.800 38,266WSARC - Proactive and Retroactive Interference in Intuitive Spatial Learning 12.800 786,697WSARC - SAVANT Tool Evaluation & Alignment 12.800 96,289WSARC - Security Services 12.800 78,801WSARC - TAG Q Silversword 12.800 52,175WSARC - Testing Environment for Human Detection Algorithms on Synthetic FMV 12.800 8,342WSARC - TTAS 12.800 184,168WSARC - Universal Tech Corp 12.800 455,718WSARC - USAM-AMP Course 101 12.800 3,305
Total U.S. Department of Defense, Prime 12,518,968
U.S. Department of Defense, Subcontract -
A Neuroimaging Augmented Meta-Cognition Model to Predict the Decision-making Capabil. 12.800 UtopiaCompression Corporation PO UC0138-WSU-2013-106-0001 6,471A Randomized Double-Blind Placebo-Cntrlld Dose-Escalation Study of NNZ-2566 in Patients 12.800 The Geneva Foundation NEU-2566-TBI-001 2,772Advanced Liquid Metal Reconfiguration Materials/Devices and Sub-Systems 12.800 Universal Energy Systems Inc. (UES Inc.) S-875-202-001 358Advanced Research and Development of Airbreathing Propulsion Systems 12.800 Universal Technology Corporation SUB 15-7900-0005-03-C5 (14)Aerospace Technology Evaluation and Assessment (ATEA) Task Order 0012 Silver Fang 12.800 InfoSciTex Corp IST 4000-S0005 PO 132523 2,791
86
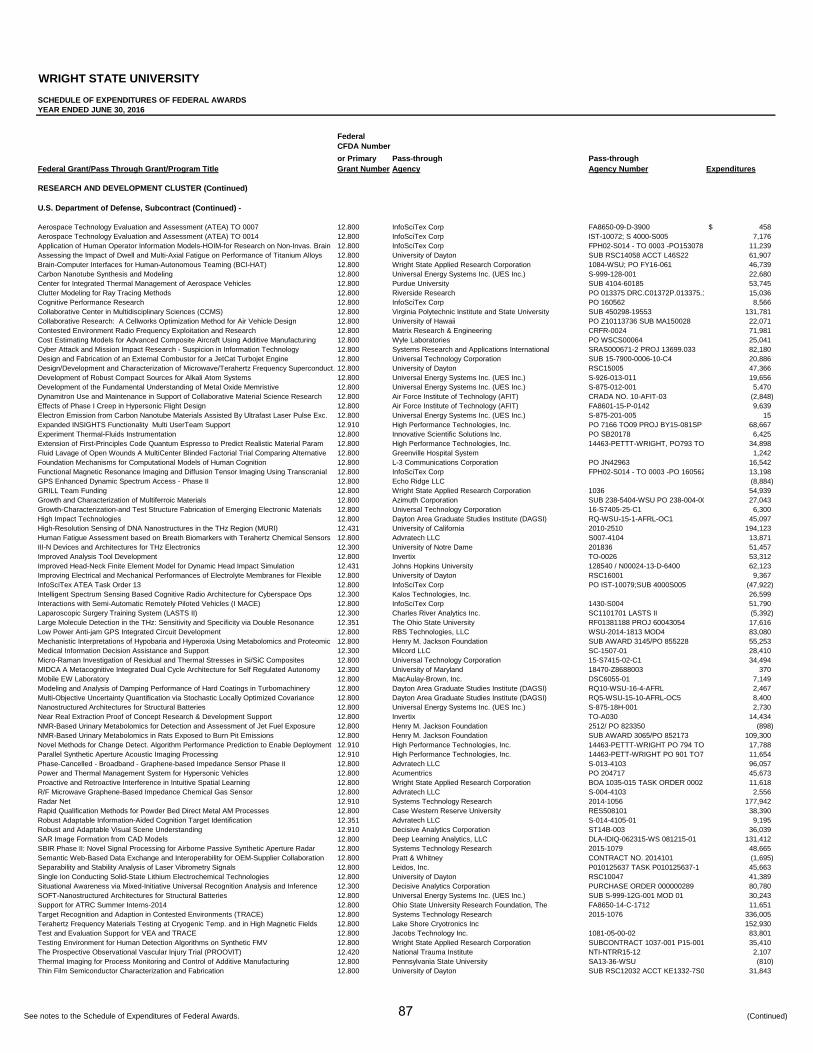
See notes to the Schedule of Expenditures of Federal Awards. (Continued)
WRIGHT STATE UNIVERSITY
SCHEDULE OF EXPENDITURES OF FEDERAL AWARDSYEAR ENDED JUNE 30, 2016
FederalCFDA Number
or Primary Pass-through Pass-throughFederal Grant/Pass Through Grant/Program Title Grant Number Agency Agency Number Expenditures
RESEARCH AND DEVELOPMENT CLUSTER (Continued)
U.S. Department of Defense, Subcontract (Continued) -
Aerospace Technology Evaluation and Assessment (ATEA) TO 0007 12.800 InfoSciTex Corp FA8650-09-D-3900 458$ Aerospace Technology Evaluation and Assessment (ATEA) TO 0014 12.800 InfoSciTex Corp IST-10072; S 4000-S005 7,176Application of Human Operator Information Models-HOIM-for Research on Non-Invas. Brain 12.800 InfoSciTex Corp FPH02-S014 - TO 0003 -PO153078 11,239Assessing the Impact of Dwell and Multi-Axial Fatigue on Performance of Titanium Alloys 12.800 University of Dayton SUB RSC14058 ACCT L46S22 61,907Brain-Computer Interfaces for Human-Autonomous Teaming (BCI-HAT) 12.800 Wright State Applied Research Corporation 1084-WSU; PO FY16-061 46,739Carbon Nanotube Synthesis and Modeling 12.800 Universal Energy Systems Inc. (UES Inc.) S-999-128-001 22,680Center for Integrated Thermal Management of Aerospace Vehicles 12.800 Purdue University SUB 4104-60185 53,745Clutter Modeling for Ray Tracing Methods 12.800 Riverside Research PO 013375 DRC.C01372P.013375.1 15,036Cognitive Performance Research 12.800 InfoSciTex Corp PO 160562 8,566Collaborative Center in Multidisciplinary Sciences (CCMS) 12.800 Virginia Polytechnic Institute and State University SUB 450298-19553 131,781Collaborative Research: A Cellworks Optimization Method for Air Vehicle Design 12.800 University of Hawaii PO Z10113736 SUB MA150028 22,071Contested Environment Radio Frequency Exploitation and Research 12.800 Matrix Research & Engineering CRFR-0024 71,981Cost Estimating Models for Advanced Composite Aircraft Using Additive Manufacturing 12.800 Wyle Laboratories PO WSCS00064 25,041Cyber Attack and Mission Impact Research - Suspicion in Information Technology 12.800 Systems Research and Applications International SRAS000671-2 PROJ 13699.033 82,180Design and Fabrication of an External Combustor for a JetCat Turbojet Engine 12.800 Universal Technology Corporation SUB 15-7900-0006-10-C4 20,886Design/Development and Characterization of Microwave/Terahertz Frequency Superconduct. 12.800 University of Dayton RSC15005 47,366Development of Robust Compact Sources for Alkali Atom Systems 12.800 Universal Energy Systems Inc. (UES Inc.) S-926-013-011 19,656Development of the Fundamental Understanding of Metal Oxide Memristive 12.800 Universal Energy Systems Inc. (UES Inc.) S-875-012-001 5,470Dynamitron Use and Maintenance in Support of Collaborative Material Science Research 12.800 Air Force Institute of Technology (AFIT) CRADA NO. 10-AFIT-03 (2,848)Effects of Phase I Creep in Hypersonic Flight Design 12.800 Air Force Institute of Technology (AFIT) FA8601-15-P-0142 9,639Electron Emission from Carbon Nanotube Materials Assisted By Ultrafast Laser Pulse Exc. 12.800 Universal Energy Systems Inc. (UES Inc.) S-875-201-005 15Expanded INSIGHTS Functionality Multi UserTeam Support 12.910 High Performance Technologies, Inc. PO 7166 TO09 PROJ BY15-081SP 68,667Experiment Thermal-Fluids Instrumentation 12.800 Innovative Scientific Solutions Inc. PO SB20178 6,425Extension of First-Principles Code Quantum Espresso to Predict Realistic Material Param 12.800 High Performance Technologies, Inc. 14463-PETTT-WRIGHT, PO793 TO 34,898Fluid Lavage of Open Wounds A MultiCenter Blinded Factorial Trial Comparing Alternative 12.800 Greenville Hospital System 1,242Foundation Mechanisms for Computational Models of Human Cognition 12.800 L-3 Communications Corporation PO JN42963 16,542Functional Magnetic Resonance Imaging and Diffusion Tensor Imaging Using Transcranial 12.800 InfoSciTex Corp FPH02-S014 - TO 0003 -PO 160562 13,198GPS Enhanced Dynamic Spectrum Access - Phase II 12.800 Echo Ridge LLC (8,884)GRILL Team Funding 12.800 Wright State Applied Research Corporation 1036 54,939Growth and Characterization of Multiferroic Materials 12.800 Azimuth Corporation SUB 238-5404-WSU PO 238-004-00 27,043Growth-Characterization-and Test Structure Fabrication of Emerging Electronic Materials 12.800 Universal Technology Corporation 16-S7405-25-C1 6,300High Impact Technologies 12.800 Dayton Area Graduate Studies Institute (DAGSI) RQ-WSU-15-1-AFRL-OC1 45,097High-Resolution Sensing of DNA Nanostructures in the THz Region (MURI) 12.431 University of California 2010-2510 194,123Human Fatigue Assessment based on Breath Biomarkers with Terahertz Chemical Sensors 12.800 Advratech LLC S007-4104 13,871III-N Devices and Architectures for THz Electronics 12.300 University of Notre Dame 201836 51,457Improved Analysis Tool Development 12.800 Invertix TO-0026 53,312Improved Head-Neck Finite Element Model for Dynamic Head Impact Simulation 12.431 Johns Hopkins University 128540 / N00024-13-D-6400 62,123Improving Electrical and Mechanical Performances of Electrolyte Membranes for Flexible 12.800 University of Dayton RSC16001 9,367InfoSciTex ATEA Task Order 13 12.800 InfoSciTex Corp PO IST-10079;SUB 4000S005 (47,922)Intelligent Spectrum Sensing Based Cognitive Radio Architecture for Cyberspace Ops 12.300 Kalos Technologies, Inc. 26,599Interactions with Semi-Automatic Remotely Piloted Vehicles (I MACE) 12.800 InfoSciTex Corp 1430-S004 51,790Laparoscopic Surgery Training System (LASTS II) 12.300 Charles River Analytics Inc. SC1101701 LASTS II (5,392)Large Molecule Detection in the THz: Sensitivity and Specificity via Double Resonance 12.351 The Ohio State University RF01381188 PROJ 60043054 17,616Low Power Anti-jam GPS Integrated Circuit Development 12.800 RBS Technologies, LLC WSU-2014-1813 MOD4 83,080Mechanistic Interpretations of Hypobaria and Hyperoxia Using Metabolomics and Proteomic 12.800 Henry M. Jackson Foundation SUB AWARD 3145/PO 855228 55,253Medical Information Decision Assistance and Support 12.300 Milcord LLC SC-1507-01 28,410Micro-Raman Investigation of Residual and Thermal Stresses in Si/SiC Composites 12.800 Universal Technology Corporation 15-S7415-02-C1 34,494MIDCA A Metacognitive Integrated Dual Cycle Architecture for Self Regulated Autonomy 12.300 University of Maryland 18470-Z8688003 370Mobile EW Laboratory 12.800 MacAulay-Brown, Inc. DSC6055-01 7,149Modeling and Analysis of Damping Performance of Hard Coatings in Turbomachinery 12.800 Dayton Area Graduate Studies Institute (DAGSI) RQ10-WSU-16-4-AFRL 2,467Multi-Objective Uncertainty Quantification via Stochastic Locally Optimized Covariance 12.800 Dayton Area Graduate Studies Institute (DAGSI) RQ5-WSU-15-10-AFRL-OC5 8,400Nanostructured Architectures for Structural Batteries 12.800 Universal Energy Systems Inc. (UES Inc.) S-875-18H-001 2,730Near Real Extraction Proof of Concept Research & Development Support 12.800 Invertix TO-A030 14,434NMR-Based Urinary Metabolomics for Detection and Assessment of Jet Fuel Exposure 12.800 Henry M. Jackson Foundation 2512/ PO 823350 (898)NMR-Based Urinary Metabolomics in Rats Exposed to Burn Pit Emissions 12.800 Henry M. Jackson Foundation SUB AWARD 3065/PO 852173 109,300Novel Methods for Change Detect. Algorithm Performance Prediction to Enable Deployment 12.910 High Performance Technologies, Inc. 14463-PETTT-WRIGHT PO 794 TO 17,788Parallel Synthetic Aperture Acoustic Imaging Processing 12.910 High Performance Technologies, Inc. 14463-PETT-WRIGHT PO 901 TO7 11,654Phase-Cancelled - Broadband - Graphene-based Impedance Sensor Phase II 12.800 Advratech LLC S-013-4103 96,057Power and Thermal Management System for Hypersonic Vehicles 12.800 Acumentrics PO 204717 45,673Proactive and Retroactive Interference in Intuitive Spatial Learning 12.800 Wright State Applied Research Corporation BOA 1035-015 TASK ORDER 0002 11,618R/F Microwave Graphene-Based Impedance Chemical Gas Sensor 12.800 Advratech LLC S-004-4103 2,556Radar Net 12.910 Systems Technology Research 2014-1056 177,942Rapid Qualification Methods for Powder Bed Direct Metal AM Processes 12.800 Case Western Reserve University RES508101 38,390Robust Adaptable Information-Aided Cognition Target Identification 12.351 Advratech LLC S-014-4105-01 9,195Robust and Adaptable Visual Scene Understanding 12.910 Decisive Analytics Corporation ST14B-003 36,039SAR Image Formation from CAD Models 12.800 Deep Learning Analytics, LLC DLA-IDIQ-062315-WS 081215-01 131,412SBIR Phase II: Novel Signal Processing for Airborne Passive Synthetic Aperture Radar 12.800 Systems Technology Research 2015-1079 48,665Semantic Web-Based Data Exchange and Interoperability for OEM-Supplier Collaboration 12.800 Pratt & Whitney CONTRACT NO. 2014101 (1,695)Separability and Stability Analysis of Laser Vibrometry Signals 12.800 Leidos, Inc. P010125637 TASK P010125637-1 45,663Single Ion Conducting Solid-State Lithium Electrochemical Technologies 12.800 University of Dayton RSC10047 41,389Situational Awareness via Mixed-Initiative Universal Recognition Analysis and Inference 12.300 Decisive Analytics Corporation PURCHASE ORDER 000000289 80,780SOFT-Nanostructured Architectures for Structural Batteries 12.800 Universal Energy Systems Inc. (UES Inc.) SUB S-999-12G-001 MOD 01 30,243Support for ATRC Summer Interns-2014 12.800 Ohio State University Research Foundation, The FA8650-14-C-1712 11,651Target Recognition and Adaption in Contested Environments (TRACE) 12.800 Systems Technology Research 2015-1076 336,005Terahertz Frequency Materials Testing at Cryogenic Temp. and in High Magnetic Fields 12.800 Lake Shore Cryotronics Inc 152,930Test and Evaluation Support for VEA and TRACE 12.800 Jacobs Technology Inc. 1081-05-00-02 83,801Testing Environment for Human Detection Algorithms on Synthetic FMV 12.800 Wright State Applied Research Corporation SUBCONTRACT 1037-001 P15-001 35,410The Prospective Observational Vascular Injury Trial (PROOVIT) 12.420 National Trauma Institute NTI-NTRR15-12 2,107Thermal Imaging for Process Monitoring and Control of Additive Manufacturing 12.800 Pennsylvania State University SA13-36-WSU (810)Thin Film Semiconductor Characterization and Fabrication 12.800 University of Dayton SUB RSC12032 ACCT KE1332-7S0 31,843
87

See notes to the Schedule of Expenditures of Federal Awards. (Continued)
WRIGHT STATE UNIVERSITY
SCHEDULE OF EXPENDITURES OF FEDERAL AWARDSYEAR ENDED JUNE 30, 2016
FederalCFDA Number
or Primary Pass-through Pass-throughFederal Grant/Pass Through Grant/Program Title Grant Number Agency Agency Number Expenditures
RESEARCH AND DEVELOPMENT CLUSTER (Continued)
U.S. Department of Defense, Subcontract (Continued) -
Treatment of Chlorinated Hydrocarbons (CHCs) and Nitroaromatic Compounds (NACs) 12.800 Air Force Institute of Technology (AFIT) FA8601-14-P-0229 7,998$ Turbine Engine Inlet Distortion Aeromechanical Investigation for AFRL-RQTI 12.800 Universal Technology Corporation 15-7900-0003-02-C4 29,827Ultrafast Laser Assisted Field Emission from Carbon Nanotube Materials 12.800 Universal Energy Systems Inc. (UES Inc.) S926-013-005 13,608Utilization of Hybrid Computing for High Throughput Identification of Beneficial Chem. 12.910 High Performance Technologies, Inc. 14463 PETTT-WRIGHT PO902, TO 11,654Visualizing Paramater Space for Network Modeling and Simulation 12.910 High Performance Technologies, Inc. PO HP0000815 TASK ORDER 006 28,262WSU/Mound Laser & Photonics Center Inc Shared Faculty Position 12.800 Mound Laser & Photonics Center Inc. 978
Total U.S. Department of Defense, Subcontract 3,279,395
Total U.S. Department of Defense 15,798,363
U.S. Department of Education, Subcontract -
ARRA - Ohio Education Research Center 84.395 The Ohio State University 60035141-WSU/PO RF01289531 59,940Facilitating Transfer of Mathematical Knowledge from Classroom to Real Life 84.305A The Ohio State University 60041905-WSU 94,174Mission HydroSci: A Virtual Environment for Next Generation Science Learning 84.305 University of Missouri C00047775-1 19,497Mission HydroScience 84.411 University of Missouri C00046299-1 14,056
Total U.S. Department of Education 187,667
U.S. Department of Energy, Subcontract -
A1N-Based Power Electronics Device Epiwafer Manufacturing 81.049 Kyma Technologies, Inc. K3730-P000-WSU-20151201 29,951Center for Geologic Storage of CO2 81.049 University of Illinois 2014-03595-03, IGCAB897 204,769Development and Application of a Hydrothermal Atomic Force Microscope 81.049 Oak Ridge National Laboratory 4000114518 63,067
Total U.S. Department of Energy 297,787
U.S. Environmental Protection Agency, Subcontract -
Analysis of Fish Tissue for Selenium 66.469 University of Wisconsin System PO 21894 (148)
U.S. Department of Health and Human Services, Prime -
Adiposity Disease Risk Factors and Lifetime Health 93.865 174,288AMP-Activated Protein Kinase and Oxygen Sensing 93.838 155,142Craniofacial Growth Prediction in Different Facial Types 93.121 362,635Discovery of Germline Genes and Regulatory Networks in Planarians 93.865 198,671Effects of Virtual Reality Simulation on Worker Emergency Evacuation of Neonates 93.226 220,354Environmental Pro-Oxidation Stressors and Immunosuppression 93.113 163,708ERK3 Kinase Signaling in Lung Cancer 93.396 299,077Field-Initiated Program 93.433 149,909Gene Regulatory Functions for the Nuclear Speckle Scaffolding Protein Son 93.859 30,025HIF1 Alpha Regulation of Trophoblast Differentiation In Vivo 93.865 262,454Isoform-Specific Regulation of the Coxsackie and Adenovirus Receptor in Polarized Epith 93.855 144,892Mechanisms of Reciprocal Inhibition Development 93.853 285,001Mechanisms Underlying Excitability Regulation of Motoneuron Types in ALS 93.853 335,993NIDA National Early Warning System Network iN3 An Innovative Approach 93.279 87,854Platelet Activating Factor and Epidermal Cytoxicity 93.837 283,091PLD2 as a GEF or as a Lipase is Central to Leukocyte Chemotaxis 93.837 450,726Pre-mRNA Processing Factors Maintain Normal Mitosis 93.859 60,485PREP Scholars 93.859 1,661Quantitative Endoscopic Imaging and Structured Light Delivery for Controlled Drug 93.286 125,522Reduced Motoneuron Excitability in Sepsis 93.853 351,330Rhesus Model for Proinflammatory Influences on Depression 93.242 153,607Role of DeltaNp63alpha in Vitamin D Mediated Cell Survival in Skin Cancer 93.393 242,599Scabies: Biology, Culture, Host Specificity and Antigens 93.855 427,556SCH: kHealth: Semantic Multisensory Mobile Approach to Personalized Asthma Care 93.865 7,856Second-site Genetic Modifiers of CTG/CAG Microsatellite Stability 93.859 307,318Signaling Mechanism of the DNA Replication Checkpoint 93.859 110,272Stress-induced Sickness During Social Separation 93.242 115,440Synaptic Function: Effects of the Nerve Injury Repair and Altered Activity 93.853 (35,828)Trending Social Media Analysis to Monitor Cannabis and Synthetic Cannabinoid Use 93.279 433,863TRPM7 and Cellular pH 93.855 336,412Updating Skeletal Maturity Methods for U.S. Children 93.846 228,856Wounding Therapy and Photocarcinogenesis 93.866 290,868
Total U.S. Department of Health and Human Services, Prime 6,761,637
U.S. Department of Health and Human Services, Subcontract -
Acid Sensing and Panic 93.242 University of Cincinnati L12-4500063686/007920 5,554African Ancestry Genomic Psychiatry Project 93.242 State Univ New York Research Foundation 1129280-72487 95,043Attention Allocation for Voluntary Smooth Eye Movements 93.867 Smith-Kettlewell Eye Research Institute PO 24721 4,006Characterizing Placebo Response to Active Treatment using Very High Dimensional Data 93.242 New York Univ Schl of Medicine PO M160019286 78,811Comparing Interventions for Opioid Dependent Patients Presenting in Medical EDs 93.279 New York Univ Schl of Medicine 15-A0-00-005065-01 34,339Comparing Interventions for Opioid Dependent Patients Presenting in Medical EDs 93.279 University of New Mexico SUBAWARD 3RN80 (3,327)DCOP Fiscal Agency Federal 93.395 Dayton Clinical Oncology Program (DCOP) 5UG1CA189957-02 819,407Developing Physics-Based Virtual Simulation Technology for NOTES 93.286 Rensselaer Polytechnic Institute RPI FUND A12296 PO117931 (21,632)Development and Validation of a Virtual Airway Skill Trainer (VAST) 93.838 Rensselaer Polytechnic Institute A12577 PO154691 73,096
88

See notes to the Schedule of Expenditures of Federal Awards. (Continued)
WRIGHT STATE UNIVERSITY
SCHEDULE OF EXPENDITURES OF FEDERAL AWARDSYEAR ENDED JUNE 30, 2016
FederalCFDA Number
or Primary Pass-through Pass-throughFederal Grant/Pass Through Grant/Program Title Grant Number Agency Agency Number Expenditures
RESEARCH AND DEVELOPMENT CLUSTER (Continued)
U.S. Department of Health and Human Services, Subcontract (Continued) -
Evaluating CareText an Automated SBIRT Follow-Up Application 93.279 Society of Teachers of Family Medicine (93)$ Evaluation of Efficacy and Safety of AB103 a CD28 Co-stimulatory Receptor Modulator 93.061 Atox Bio, Ltd. ATB-202 8,186Fixation Using Alternative Implants for the Treatment of Hip Fractures (FAITH) 93.846 University of Minnesota N000188512 1,654Genetic Epidemiology of Ocular Health and Disease 93.867 University of Texas Health Science Center at San Antonio 158385/157841 7,496Genetic Epidemiology of Ocular Health and Disease 93.867 University of Texas Rio Grande Valley 7R01ET024384-03-03 18,874Intestinal Epithelial Cell Regulation of Allergic Inflammation at Distant Sites 93.847 The Ohio State University 60047886/PO RF01432240 9,443LAR Charges for VAMC Travers 93.866 Veterans Affairs Medical Center 10,829Mechanisms of Photocarcinogenesis in Geriatric Skin 93.113 Indiana University IN4683125WSU MOD1; PO 1641122 117,283Mechanisms of Photocarcinogenesis in Geriatric Skin 93.113 Indiana University IN4683135WSU 7,131MEDTAPP Healthcare Access Initiative-Community Health Workers First 93.778 The Ohio State University 60051005/PO RF01413226 200,691MEDTAPP Healthcare Access Initiative-Community Health Workers First 93.778 The Ohio State University RF01381713/PROJ 60046085 11,518MEDTAPP Healthcare Access Initiative-Community Health Workers First EXPANSION 93.778 The Ohio State University 60051005/PO RF01424606 155,840MISTIE III: A Phase III Randomized Open Label 500-Subject Clinical Trial 93.853 Johns Hopkins University 2002018361/NCT00961532 8,857Modeling Social Behavior for Healthcare Utilization and Outcomes in Depression 93.242 Cornell University SUB 16081375 41,647Montgomery County (OH) SAMHSA 2015 Drug Court Grant 93.243 Montgomery County Common Pleas Court 9,328Non-contact THz Sensing of Corneal Hydration 93.867 University of California, Los Angeles (UCLA) 0125 G PA 247 8,760Platelet-Oriented Inhibition in New TIA (POINT) 93.061 EMMES Corporation 17,759Renal Osteodystrophy - A Fresh Approach 93.847 Kentucky University of 3200000108-16-102 PO7800003041 238Stroke Hyperglycemia Insulin Network Effort (SHINE) Trial 93.853 The Ohio State University RF01383550/ 60047417 (938)Synaptic Function: Effects of the Nerve Injury and Altered Activity 93.853 Georgia Tech Research Corporation RG574-G2 452,631The Genomic Psychiatry Cohort 93.242 University of Southern California H39730 (50)The Learning and Working During the Transition to Adulthood Rehabilitation Research 93.433 University of Massachusetts Worcester WA00373816/OSP2016123 8,918
Total U.S. Department of Health and Human Services, Subcontract 2,181,299
Total U.S. Department of Health and Human Services 8,942,936
U.S. Department of Interior, Prime -
Developing a Standardized Field Key to Distinguish Among Mallards (Anas Platyrhynchos) 15.655 43,997
U.S. Department of Interior, Subcontract -
Mercury Analysis of Environmental Samples - Federal Sources 15.608 More Than One Source of Support P0077094 3,352
Total U.S. Department of Interior 47,349
U.S. Department of Justice, Subcontract -
The Westwood Partnership to Prevent Juvenile Repeat Violent Offenders 16.609 Ohio Governor's Office of Criminal Justice Services 2014-PS-PSN-431 43,362
National Aeronautics and Space Administration, Prime -
Develop an Eyewash Capability to Treat Chemical Eye Exposure in Partial Gravity-Microgr 43.001 505Modeling of the Martian Thermosphere Ionosphere in Support of Volatile Evolution Calc. 43.001 208,885Monte Carlo Calculations of the Photochemical Escape Fluxes of O, C and N from Mars 43.001 85,907The Hydrocarbon Ion Layer in the Low Altitude Ionosphere of Saturn 43.001 46,730
Total National Aeronautics and Space Administration, Prime 342,027
National Aeronautics and Space Administration, Subcontract -
In-Process Monitoring of Additive Manufacturing 43.001 Advratech LLC 20151044 144,959MAVEN Mission 43.001 University of Colorado PO 1000013110/REF 1546525 99,419NASA Lunar Mining Robot 43.001 Ohio Space Grant Consortium OSGC CK 1589 (29)NASA STTR Phase I - Integrated Modeling and SLM Process Development Chamber 43.001 Advratech LLC PO 2015811 48,752Real-Time Geometric Analysis of Additive Manufacturing 43.001 Advratech LLC PO 2015810 16,788Verification and Validation of Adaptive Learning Control System Towards Safety Assuranc 43.001 Intelligent Automation, Inc. SUBCONTRACT 2151-1 30,398
Total National Aeronautics and Space Administration, Subcontract 340,287
Total National Aeronautics and Space Administration 682,314
National Science Foundation, Prime -
A National Model for Engineering Mathematics Education 47.076 114,550Collaborative Center for Surveillance Research 47.041 46,562Collaborative Proposal Developing a Battery of Interdisciplinary Methods for the Study 47.041 69,463Collaborative Research: RUI: Factors that Affect the Likelihood of Prejudice Confrontat 47.075 226Collaborative Research: Dimensions US-Biota São Paulo: Chemically Mediated Multi-trop 47.074 7,247Collaborative Research: GEOTRACES Arctic Section: Mercury Speciation and Cycling in t 47.050 85,314Collaborative Research: GEOTRACES: Pacific Section: Mercury Speciation Along a Zonal 47.050 5,870Collaborative Research: GOALI Integrated Control for Microstructure and Melt Pool Dime 47.041 64,869Collaborative Research: I/UCRC Center for Surveillance Research - Phase II 47.041 20,821Collaborative Research: Process Development Across Alloy Systems for Powder Bed Additi 47.041 27,930Collaborative Research: SoCS Social Media Enhanced Organization Sensemaking in Emerge47.070 1,603Collaborative Research: The Phylogeny and Evolution of World Tachinidae (DIPTERA) 47.074 52,743Collaborative RET Site - Inspiring the Next Generation of a Highly-Skilled Workforce 47.041 36,651Collaborative: TUES: Software Defined Radio Laboratory Platform for Enhancing Undergrd 47.076 121,072Contribution of Hemodynamic Shear Stress Abnormalities to Calcific Bicuspid Aortic Valv 47.041 44,104
89

See notes to the Schedule of Expenditures of Federal Awards. (Continued)
WRIGHT STATE UNIVERSITY
SCHEDULE OF EXPENDITURES OF FEDERAL AWARDSYEAR ENDED JUNE 30, 2016
FederalCFDA Number
or Primary Pass-through Pass-throughFederal Grant/Pass Through Grant/Program Title Grant Number Agency Agency Number Expenditures
RESEARCH AND DEVELOPMENT CLUSTER (Continued)
National Science Foundation, Prime (Continued) -
CPS: Synergy: Collaborative Research: Methodologies for Engineering with Plug-and-Learn 47.070 54,198$ CRII: CSR: Towards Understanding and Mitigating the Impact of Web Robot Traffic 47.070 31,773CRPA: Into the Rift: A Multimedia Experience for Advancing Ecosystem-Based Science Ed 47.076 6,859CUTE: Instructional Laboratories for Cloud Computing Education 47.076 52,410EAGER: Collaborative Research: A New Science of Visual Experience 47.041 22,315EAGER: Identification of Chemosensitive Regions in Brainstems of Herps 47.074 16,061EAGER: Intelligent Agent Incident Command System Augmentation 47.070 45,443EAGER: Novel Catalyst Design Using Hierarchical Hybrid Materials 47.041 6,457EarthCube Building Blocks: Collaborative Proposal: GeoLink - Leveraging Semantics 47.050 140,691Exploiting 3-5 Difluoro Aromatic Systems to Functionalize Poly(arylene ether)s 47.049 106,243Fifty-Seventh Mighty Conference in Graph Theory 47.049 6,345Fully Nonlinear Equations in Complex Geometry 47.049 8,232Collaborative Research: GOALI: Optimal Inpatient Discharge Planning Under Uncertainty 47.041 26,576Collaborative Research: GOALI: Warehouse Integration in Enterprise-Wide Supply Chain 47.041 16,301III: Small: TRON - Tractable Reasoning Ontologies 47.070 57,540IIS: Medium: Context-Aware Harrassment Detection on Social Media 47.070 259,543In the Footsteps of Katharine Wright: Promoting STEM Women through LEADER 47.076 46,403INSPIRE Track 1: Intrinsic Oscillations in Supramolecular Assemblies 47.041 98,052IPA Assignment of Dr. Tamera Schneider from WSU to NSF 47.075 121,975Macro-scale Friction in the Framework of the Frenkel-Kontorova Model 47.050 4,850Mechanisms of Social Buffering of Hypothalamic-Pituitary-Adrenal Responses 47.074 60,024MRI: Acquisition of High Performance Computer Cluster for Multidiscip. Computations 47.070 7,059MRI: Acquisition of Ion Torrent Personal Genome Machine to Establish High-Throughput 47.074 6,329Optimal Control of Quantum Systems: Transformative NMR and EPR Applications 47.049 68,004PFI: AIR-TT: Market Driven Innovations and Scaling up of Twitris 47.041 108,277Collaborative Research: RDE-RAD: Ohio's STEM Ability Alliance 47.076 89,076Reaction Rate Scaling in Porous Media in the Transport Controlled Regime 47.050 1,008REU Site: Data-Driven Cyber Security Research 47.070 81,956RI: Small: Developing Large Scale Distributed Syntactic Semantic and Lexical Language 47.070 78,662Roles and Regulation of Aqua/Glyceroporin in a Freeze-Tolerant Amphibian 47.074 107,033The CECS Student Success Scholarship Program: Leveraging Curricular Innovation 47.076 137,326
Total National Science Foundation, Prime 2,572,046
National Science Foundation, Subcontract -
Distance-Based Variable Selection for High-Dimensional Biological Data 47.049 Iowa State University 420-21-17A 27,769Genetic Monitoring of Arctic Migratory Waterfowl in Beringia 47.079 U.S. Civilian Research & Development Foundation (CRDF) RUB1-7094-VL-13 4,361Hazards SEES: Citizen and Physical Sensing Enabled Decision Support for Disaster Mgt 47.050 The Ohio State University PO RF01414911 PROJ 60047971 170,579Improving Pathways for STEM Retention and Graduation (IPSRG) 47.076 Central State University 8480-001/002 25,810Midwest Photonics Education Center: Proposal for an ATE Regional Center 47.076 Indian Hills Community College 20-3-9557-48 21,477Native Point Defects, Electrically-Active Impurities and Plasmonics at ZnO Interfaces 47.049 The Ohio State University RF01354806 83,172Ohio LSAMP Alliance 47.076 The Ohio State University PO RF01345710 PROJ 60042097-W 26,878Student Travel Award from Columbia University for Allison Agather 47.050 Columbia University CK 1000995159 544Supporting Scientific Practices in Elementary and Middle School Classroom 47.076 Northwestern University SP0009801-PROJ0002732 27,048
Total National Science Foundation, Subcontract 387,638
Total National Science Foundation 2,959,684
U.S. Department of Veterans Administration, Prime -
Dayton Veterans Affairs Medical Center IPA Agreement 64.103 4,386Dayton Veterans Affairs Medical Center IPA Agreement - Rapp 64.115 24,798Development of Serious Games and VR for Health Care Training - IPA 64.115 54,273Predicting-at-Admission: The Discharge Disposition of Veterans from VISN1 Medical Center 64.018 34,334Veterans Affairs Medical Center IPA Agreement - Zhang 64.115 26,509VISN 10 Simulation Consortium Simulation-Based Curricula 64.115 33,756
Total U.S. Department of Veterans Administration 178,056
TOTAL RESEARCH AND DEVELOPMENT CLUSTER 29,267,191
U.S. Department of Defense, Prime -
Southwest Ohio Region DD 12.614 1,069,752
U.S. Department of Defense, Subcontract -
Boxing Scoring Interface System For Aggression Behavior Research 12.440 Tufts University 4,649Research Trends in Defense Contracting 12.110 The Ohio State University SUBAWARD 3003175719 9,147Science Mathematics and Research for Transformation (SMART) Defense Scholarship Progr 12.800 American Society for Engineering Education 22,224Science Mathematics and Research for Transformation (SMART) Defense Scholarship Progr 12.800 American Society for Engineering Education 372Wright Brothers Institute Operations 12.800 Wright Brothers Institute Inc. (The) WBSC 7255 WSU-TE 612,647
Total U.S. Department of Defense, Subcontract 649,039
Total U.S. Department of Defense 1,718,791
90
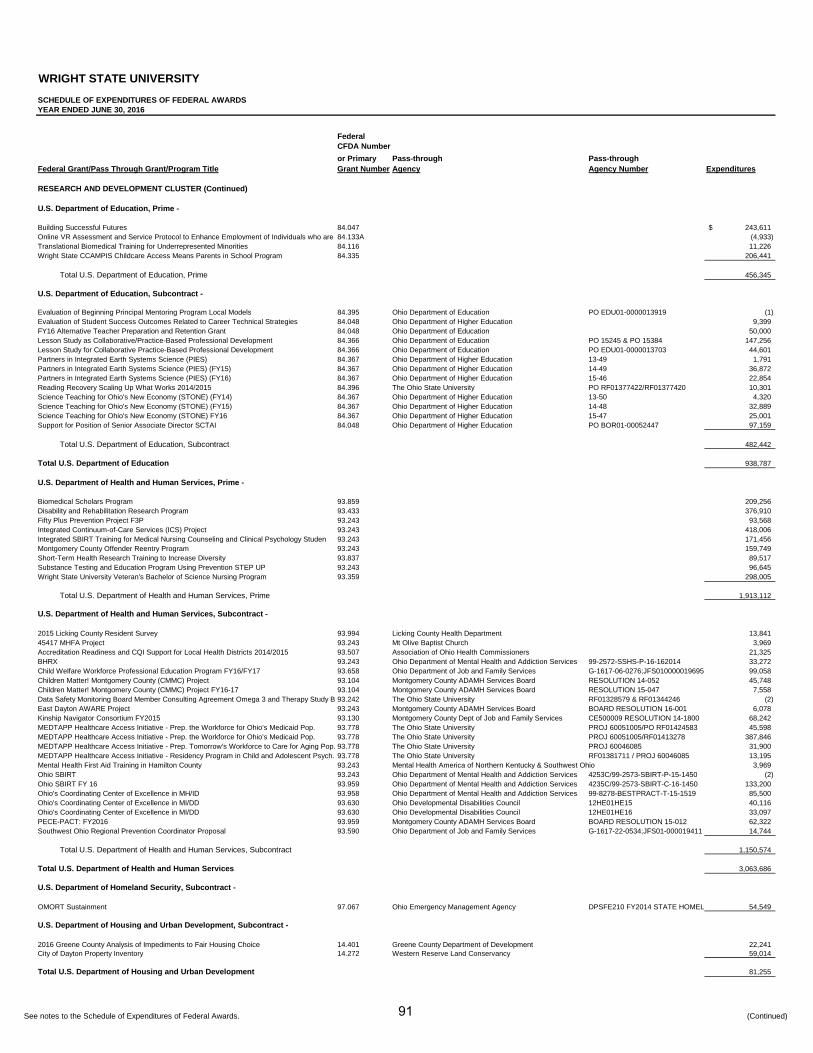
See notes to the Schedule of Expenditures of Federal Awards. (Continued)
WRIGHT STATE UNIVERSITY
SCHEDULE OF EXPENDITURES OF FEDERAL AWARDSYEAR ENDED JUNE 30, 2016
FederalCFDA Number
or Primary Pass-through Pass-throughFederal Grant/Pass Through Grant/Program Title Grant Number Agency Agency Number Expenditures
RESEARCH AND DEVELOPMENT CLUSTER (Continued)
U.S. Department of Education, Prime -
Building Successful Futures 84.047 243,611$ Online VR Assessment and Service Protocol to Enhance Employment of Individuals who are 84.133A (4,933)Translational Biomedical Training for Underrepresented Minorities 84.116 11,226Wright State CCAMPIS Childcare Access Means Parents in School Program 84.335 206,441
Total U.S. Department of Education, Prime 456,345
U.S. Department of Education, Subcontract -
Evaluation of Beginning Principal Mentoring Program Local Models 84.395 Ohio Department of Education PO EDU01-0000013919 (1)Evaluation of Student Success Outcomes Related to Career Technical Strategies 84.048 Ohio Department of Higher Education 9,399FY16 Alternative Teacher Preparation and Retention Grant 84.048 Ohio Department of Education 50,000Lesson Study as Collaborative/Practice-Based Professional Development 84.366 Ohio Department of Education PO 15245 & PO 15384 147,256Lesson Study for Collaborative Practice-Based Professional Development 84.366 Ohio Department of Education PO EDU01-0000013703 44,601Partners in Integrated Earth Systems Science (PIES) 84.367 Ohio Department of Higher Education 13-49 1,791Partners in Integrated Earth Systems Science (PIES) (FY15) 84.367 Ohio Department of Higher Education 14-49 36,872Partners in Integrated Earth Systems Science (PIES) (FY16) 84.367 Ohio Department of Higher Education 15-46 22,854Reading Recovery Scaling Up What Works 2014/2015 84.396 The Ohio State University PO RF01377422/RF01377420 10,301Science Teaching for Ohio's New Economy (STONE) (FY14) 84.367 Ohio Department of Higher Education 13-50 4,320Science Teaching for Ohio's New Economy (STONE) (FY15) 84.367 Ohio Department of Higher Education 14-48 32,889Science Teaching for Ohio's New Economy (STONE) FY16 84.367 Ohio Department of Higher Education 15-47 25,001Support for Position of Senior Associate Director SCTAI 84.048 Ohio Department of Higher Education PO BOR01-00052447 97,159
Total U.S. Department of Education, Subcontract 482,442
Total U.S. Department of Education 938,787
U.S. Department of Health and Human Services, Prime -
Biomedical Scholars Program 93.859 209,256Disability and Rehabilitation Research Program 93.433 376,910Fifty Plus Prevention Project F3P 93.243 93,568Integrated Continuum-of-Care Services (ICS) Project 93.243 418,006Integrated SBIRT Training for Medical Nursing Counseling and Clinical Psychology Studen 93.243 171,456Montgomery County Offender Reentry Program 93.243 159,749Short-Term Health Research Training to Increase Diversity 93.837 89,517Substance Testing and Education Program Using Prevention STEP UP 93.243 96,645Wright State University Veteran's Bachelor of Science Nursing Program 93.359 298,005
Total U.S. Department of Health and Human Services, Prime 1,913,112
U.S. Department of Health and Human Services, Subcontract -
2015 Licking County Resident Survey 93.994 Licking County Health Department 13,84145417 MHFA Project 93.243 Mt Olive Baptist Church 3,969Accreditation Readiness and CQI Support for Local Health Districts 2014/2015 93.507 Association of Ohio Health Commissioners 21,325BHRX 93.243 Ohio Department of Mental Health and Addiction Services 99-2572-SSHS-P-16-162014 33,272Child Welfare Workforce Professional Education Program FY16/FY17 93.658 Ohio Department of Job and Family Services G-1617-06-0276;JFS010000019695 99,058Children Matter! Montgomery County (CMMC) Project 93.104 Montgomery County ADAMH Services Board RESOLUTION 14-052 45,748Children Matter! Montgomery County (CMMC) Project FY16-17 93.104 Montgomery County ADAMH Services Board RESOLUTION 15-047 7,558Data Safety Monitoring Board Member Consulting Agreement Omega 3 and Therapy Study B 93.242 The Ohio State University RF01328579 & RF01344246 (2)East Dayton AWARE Project 93.243 Montgomery County ADAMH Services Board BOARD RESOLUTION 16-001 6,078Kinship Navigator Consortium FY2015 93.130 Montgomery County Dept of Job and Family Services CE500009 RESOLUTION 14-1800 68,242MEDTAPP Healthcare Access Initiative - Prep. the Workforce for Ohio’s Medicaid Pop. 93.778 The Ohio State University PROJ 60051005/PO RF01424583 45,598MEDTAPP Healthcare Access Initiative - Prep. the Workforce for Ohio’s Medicaid Pop. 93.778 The Ohio State University PROJ 60051005/RF01413278 387,846MEDTAPP Healthcare Access Initiative - Prep. Tomorrow's Workforce to Care for Aging Pop. 93.778 The Ohio State University PROJ 60046085 31,900MEDTAPP Healthcare Access Initiative - Residency Program in Child and Adolescent Psych. 93.778 The Ohio State University RF01381711 / PROJ 60046085 13,195Mental Health First Aid Training in Hamilton County 93.243 Mental Health America of Northern Kentucky & Southwest Ohio 3,969Ohio SBIRT 93.243 Ohio Department of Mental Health and Addiction Services 4253C/99-2573-SBIRT-P-15-1450 (2)Ohio SBIRT FY 16 93.959 Ohio Department of Mental Health and Addiction Services 4235C/99-2573-SBIRT-C-16-1450 133,200Ohio's Coordinating Center of Excellence in MH/ID 93.958 Ohio Department of Mental Health and Addiction Services 99-8278-BESTPRACT-T-15-1519 85,500Ohio's Coordinating Center of Excellence in MI/DD 93.630 Ohio Developmental Disabilities Council 12HE01HE15 40,116Ohio's Coordinating Center of Excellence in MI/DD 93.630 Ohio Developmental Disabilities Council 12HE01HE16 33,097PECE-PACT: FY2016 93.959 Montgomery County ADAMH Services Board BOARD RESOLUTION 15-012 62,322Southwest Ohio Regional Prevention Coordinator Proposal 93.590 Ohio Department of Job and Family Services G-1617-22-0534;JFS01-000019411 14,744
Total U.S. Department of Health and Human Services, Subcontract 1,150,574
Total U.S. Department of Health and Human Services 3,063,686
U.S. Department of Homeland Security, Subcontract -
OMORT Sustainment 97.067 Ohio Emergency Management Agency DPSFE210 FY2014 STATE HOMEL 54,549
U.S. Department of Housing and Urban Development, Subcontract -
2016 Greene County Analysis of Impediments to Fair Housing Choice 14.401 Greene County Department of Development 22,241City of Dayton Property Inventory 14.272 Western Reserve Land Conservancy 59,014
Total U.S. Department of Housing and Urban Development 81,255
91

See notes to the Schedule of Expenditures of Federal Awards. (Continued)
WRIGHT STATE UNIVERSITY
SCHEDULE OF EXPENDITURES OF FEDERAL AWARDSYEAR ENDED JUNE 30, 2016
FederalCFDA Number
or Primary Pass-through Pass-throughFederal Grant/Pass Through Grant/Program Title Grant Number Agency Agency Number Expenditures
U.S. Department of Labor, Subcontract -
Evaluation of Northwest State Community College's Trade Adjustment Assistance Community17.282 Northwest State Community College 34,440$ H-1B Technical Skills Training Grant FY2016 17.268 Ohio Department of Higher Education PO BOR01-0000004624 41,565NEG Sector Partnership Dislocated Worker Grant Compression Planning 17.277 Montgomery County Dept of Job and Family Services PO VB600789 2,132Study of the Local Area Composition for WIOA Designation 17.258 Area 7 Workforce Investment Board 752
Total U.S. Department of Labor 78,889
National Aeronautics and Space Administration, Prime -
Aerospace Medicine Training in the Era of Expanding Human Space Flights Beyond ISS 43.009 609,198
National Aeronautics and Space Administration, Subcontract -
African-American and Female Students in Engineering and Computer Science at WSU 43.001 Ohio Space Grant Consortium 4,684OSGC Education Scholarship 2015-2016 43.001 Ohio Space Grant Consortium 2,000OSGC Scholarship-Fellowship Program 2013/2014 43.001 Ohio Space Grant Consortium OSGC 2013-2014 (3,500)OSGC Scholarship-Fellowship Program 2014-2015 43.001 Ohio Space Grant Consortium OSGC 2014-2015 (3,500)OSGC Scholarship-Fellowship Program 2015-2016 43.001 Ohio Space Grant Consortium OSGC 2015-2016 7,500OSGC Travel Allocation Funds 2015-2016 43.001 Ohio Space Grant Consortium 73
Total National Aeronautics and Space Administration, Subcontract 7,257
Total National Aeronautics and Space Administration 616,455
National Endowment for the Humanties, Subcontract -
Public History Graduate Symposium 45.169 Ohio Humanities Council PROJECT NUMBER MO16-031 1,478Ten Years of the Dayton Literary Peace Prize: A Literary Conference 45.169 Ohio Humanities Council PROJECT NUMBER QU15-043 3,000Veterans Voices Project 2015 45.129 Ohio Humanities Council ME15-040 19,307
Total National National Endowment for the Humanities 23,785
Small Business Administration, Subcontract -
SBDC FY2015 59.037 Ohio Development Services Agency OSBG-15-206C 111,953SBDC FY2016 59.037 Ohio Development Services Agency OSBG-16-306 133,830
Total Small Business Administration 245,783
U.S. Department of State, Subcontract -
Community Partnership Grant FY2015 19.402 Global Ties U.S. 1,907Community Partnership Grant FY2016 19.402 Global Ties U.S. 345Diplomacy Begins Here Summit Grant 19.402 Global Ties U.S. 1,300National Meeting 2016 19.402 Global Ties U.S. 430
Total U.S. Department of State 3,982
U.S. Department of Transportation, Subcontract -
Public and Social Service Transportation Curriculum and Internship Program FY2016 20.215 Ohio Department of Transportation AGREEMENT 12787-K 3,000
U.S. Department of Veterans Administration, Prime -
Dayton VA Medical Center IPA Agreement - Yaklic 64.115 20,000Provision of Emergency Management Expertise - IPA James Gruenberg 64.115 15,000Provision of Emergency Management Expertise IPA - Hodge 64.115 15,000Provision of Emergency Management Expertise IPA - Rees 64.115 14,418Provision of Emergency Management Expertise IPA - Jack Smith 64.115 15,000
Total U.S. Department of Veterans Administration 79,418
TOTAL EXPENDITURES OF FEDERAL AWARDS 168,917,071$
92

See notes to the Schedule of Expenditures of Federal Awards. (Continued)
WRIGHT STATE UNIVERSITY
SCHEDULE OF EXPENDITURES OF FEDERAL AWARDSYEAR ENDED JUNE 30, 2016
Subtotals of CFDAs with Multiple Awards
Air Force Defense Research Sciences Program 12.800 635,243$ International Visitors Program (B) 19.402 3,982 Aerospace Education Services Program 43.001 7,256 Small Business Development Centers 59.037 245,783 Veterans Information and Assistance 64.115 79,418 Career and Technical Education -- Basic Grants to States 84.048 156,558 Mathematics and Science Partnerships (B) 84.366 191,857 Improving Teacher Quality State Grants (A) 84.367 123,726 Comprehensive Community Mental Health Services for 93.104 53,306 Substance Abuse and Mental Health Services-Projects of Regional and National Significance (B) 93.243 986,711 ACL National Institute on Disability, Independent Living, and Rehabilitation Research 93.433 376,910 Developmental Disabilities Basic Support and Advocacy 93.630 73,213 Medical Assistance Program 93.778 478,539 Block Grants for Prevention and Treatment of Substance 93.959 195,522
93

See notes to the Schedule of Expenditures of Federal Awards. (Continued)
WRIGHT STATE UNIVERSITY
SCHEDULE OF EXPENDITURES OF FEDERAL AWARDSYEAR ENDED JUNE 30, 2016
Schedule of Amounts Passed-Through to Subrecipients
Subrecipient NameCFDA
No. Program Title Expenditures
361 Interactive, LLC 12.800 WSARC - ATB 81,967$
361 Interactive, LLC 12.800 WSARC - HMT 194,561
361 Interactive, LLC Total 276,528
Academy for Direct Support Professionals, Inc. 93.630 Ohio's Coord Center of Excellence in Mental Illness and DD 1,580
Academy for Direct Support Professionals, Inc. Total 1,580
Advanced Geriatric Education & Consulting, LLC 93.778 MEDTAPP Hlthcr Access Init.- Prep Wokfrce for OH’s Medic Pop 20,000
Advanced Geriatric Education & Consulting, LLC Total 20,000
Advanced Technical Intelligence Center 12.800 WSARC - ATB 3,594
Advanced Technical Intelligence Center Total 3,594
Agriculture and Agri-Food Canada 47.074 Collaborative Research: The Phylog and Evol of World Tachnid 4,720
Agriculture and Agri-Food Canada Total 4,720
Air Force Institute of Technology 43.001 In-Process Monitoring of Additive Manufacturing 108,518
Air Force Institute of Technology Total 108,518
Air Force Research Laboratory 12.800 Interactions with Semi-Autonomous Remotely Piloted Vehicles (354)
Air Force Research Laboratory 12.800 Neuroscience and Medical Imaging (288)
Air Force Research Laboratory Total (642)
Allen County Board of DD 93.630 Ohio's Coord Center of Excellence in Mental Illness and DD 2,700
Allen County Board of DD Total 2,700
American College of Medical Toxicology, Inc. 93.279 National Early Warning System Network iN3 An Innov Apprch 48,990
American College of Medical Toxicology, Inc. Total 48,990
Applied Information Sciences 12.800 WSARC - HMT 253,572
Applied Information Sciences, Total 253,572
Area Agency on Aging 93.778 MEDTAPP Hlthcare Access Init.-Comm. Health Workers First 7,500
Area Agency on Aging Total 7,500
Ball Aerospace 12.800 WSARC - ATB 193,401
Ball Aerospace 12.800 WSARC - HMT 965,701
Ball Aerospace Total 1,159,102
Booz Allen Hamilton, Inc. 12.800 Interactions with Semi-Autonomous Remotely Piloted Vehicles 913
Booz Allen Hamilton, Inc. 12.800 WSARC - ATB 4,393
Booz Allen Hamilton, Inc. Total 5,306
Brigham and Women's Hospital, Inc. 93.837 PLD2 as a GEF or as a Lipase is Central to Leukocyte Chemo. 40,445
Brigham and Women's Hospital, Inc. Total 40,445
California Baptist University 47.076 A National Model for Engineering Mathematics Education 21,298
California Baptist University Total 21,298
CaravanLab LLC 47.076 CRPA: Into the Rift: A Mltmd Exper for Advncg Eco-Based Sci Ed 6,825
CaravanLab LLC Total 6,825
Case Western Reserve University 93.121 Craniofacial Growth Prediction in Different Facial Types 44,711
Case Western Reserve University Total 44,711
Central State University 47.076 In the Footsteps of Katharine Wright: Promoting STEM 7,123
Central State University Total 7,123
Cherry Street Services, Inc. 93.242 African Ancestry Genomic Psychiatry Project 4,400
Cherry Street Services, Inc. Total 4,400
Children's Hospital Medical Center 93.226 Effects of VR Sim on Worker Emergcy Evac of Neonates 80,397
Children's Hospital Medical Center Total 80,397
Clark University 12.420 Eval of a Brief Marrge Intrvtnfor Intrnl Behav. Hlth Cnslt. 69,241
Clark University Total 69,241
Columbia University 93.279 Trndng Soc. Med. Anal. to Monitor Cannab. & Synth Cannab Use 19,945
Columbia University Total 19,945
Cubic Defence Applications, Inc. 12.800 WSARC - LVC 83,525
Cubic Defence Applications, Inc. Total 83,525
Georgia Tech Research Corporation 93.853 Reduced Motoneuron Excitability in Sepsis 23,251
Georgia Tech Research Corporation Total 23,251
Henry County Board of DD 93.630 Ohio's Coord Center of Excellence in Mental Illness and DD 2,000
Henry County Board of DD Total 2,000
94
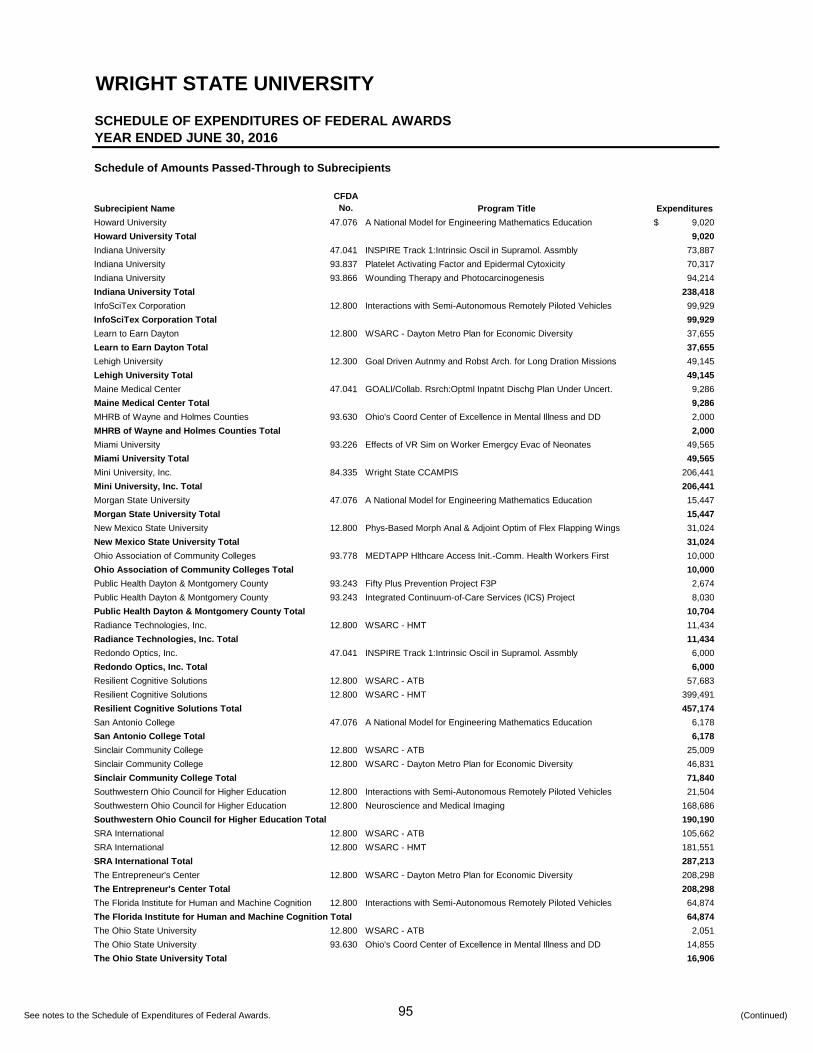
See notes to the Schedule of Expenditures of Federal Awards. (Continued)
WRIGHT STATE UNIVERSITY
SCHEDULE OF EXPENDITURES OF FEDERAL AWARDSYEAR ENDED JUNE 30, 2016
Schedule of Amounts Passed-Through to Subrecipients
Subrecipient NameCFDA
No. Program Title Expenditures
Howard University 47.076 A National Model for Engineering Mathematics Education 9,020$
Howard University Total 9,020
Indiana University 47.041 INSPIRE Track 1:Intrinsic Oscil in Supramol. Assmbly 73,887
Indiana University 93.837 Platelet Activating Factor and Epidermal Cytoxicity 70,317
Indiana University 93.866 Wounding Therapy and Photocarcinogenesis 94,214
Indiana University Total 238,418
InfoSciTex Corporation 12.800 Interactions with Semi-Autonomous Remotely Piloted Vehicles 99,929
InfoSciTex Corporation Total 99,929
Learn to Earn Dayton 12.800 WSARC - Dayton Metro Plan for Economic Diversity 37,655
Learn to Earn Dayton Total 37,655
Lehigh University 12.300 Goal Driven Autnmy and Robst Arch. for Long Dration Missions 49,145
Lehigh University Total 49,145
Maine Medical Center 47.041 GOALI/Collab. Rsrch:Optml Inpatnt Dischg Plan Under Uncert. 9,286
Maine Medical Center Total 9,286
MHRB of Wayne and Holmes Counties 93.630 Ohio's Coord Center of Excellence in Mental Illness and DD 2,000
MHRB of Wayne and Holmes Counties Total 2,000
Miami University 93.226 Effects of VR Sim on Worker Emergcy Evac of Neonates 49,565
Miami University Total 49,565
Mini University, Inc. 84.335 Wright State CCAMPIS 206,441
Mini University, Inc. Total 206,441
Morgan State University 47.076 A National Model for Engineering Mathematics Education 15,447
Morgan State University Total 15,447
New Mexico State University 12.800 Phys-Based Morph Anal & Adjoint Optim of Flex Flapping Wings 31,024
New Mexico State University Total 31,024
Ohio Association of Community Colleges 93.778 MEDTAPP Hlthcare Access Init.-Comm. Health Workers First 10,000
Ohio Association of Community Colleges Total 10,000
Public Health Dayton & Montgomery County 93.243 Fifty Plus Prevention Project F3P 2,674
Public Health Dayton & Montgomery County 93.243 Integrated Continuum-of-Care Services (ICS) Project 8,030
Public Health Dayton & Montgomery County Total 10,704
Radiance Technologies, Inc. 12.800 WSARC - HMT 11,434
Radiance Technologies, Inc. Total 11,434
Redondo Optics, Inc. 47.041 INSPIRE Track 1:Intrinsic Oscil in Supramol. Assmbly 6,000
Redondo Optics, Inc. Total 6,000
Resilient Cognitive Solutions 12.800 WSARC - ATB 57,683
Resilient Cognitive Solutions 12.800 WSARC - HMT 399,491
Resilient Cognitive Solutions Total 457,174
San Antonio College 47.076 A National Model for Engineering Mathematics Education 6,178
San Antonio College Total 6,178
Sinclair Community College 12.800 WSARC - ATB 25,009
Sinclair Community College 12.800 WSARC - Dayton Metro Plan for Economic Diversity 46,831
Sinclair Community College Total 71,840
Southwestern Ohio Council for Higher Education 12.800 Interactions with Semi-Autonomous Remotely Piloted Vehicles 21,504
Southwestern Ohio Council for Higher Education 12.800 Neuroscience and Medical Imaging 168,686
Southwestern Ohio Council for Higher Education Total 190,190
SRA International 12.800 WSARC - ATB 105,662
SRA International 12.800 WSARC - HMT 181,551
SRA International Total 287,213
The Entrepreneur's Center 12.800 WSARC - Dayton Metro Plan for Economic Diversity 208,298
The Entrepreneur's Center Total 208,298
The Florida Institute for Human and Machine Cognition 12.800 Interactions with Semi-Autonomous Remotely Piloted Vehicles 64,874
The Florida Institute for Human and Machine Cognition Total 64,874
The Ohio State University 12.800 WSARC - ATB 2,051
The Ohio State University 93.630 Ohio's Coord Center of Excellence in Mental Illness and DD 14,855
The Ohio State University Total 16,906
95
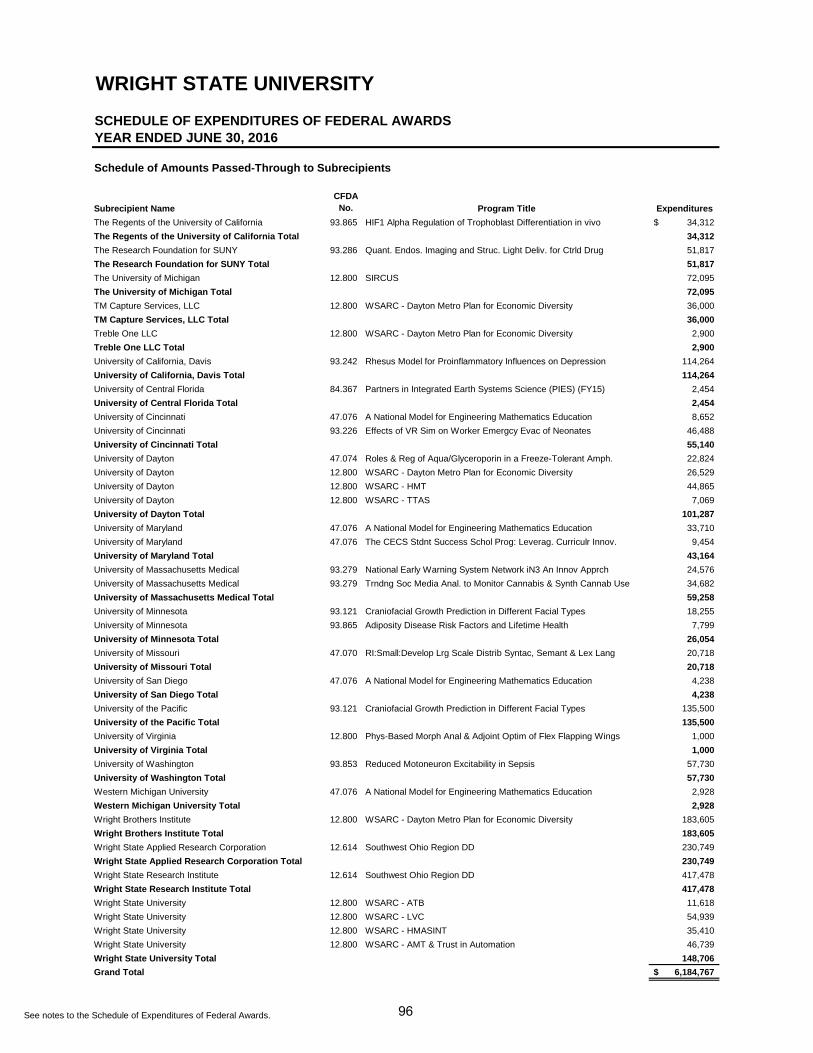
See notes to the Schedule of Expenditures of Federal Awards.
WRIGHT STATE UNIVERSITY
SCHEDULE OF EXPENDITURES OF FEDERAL AWARDSYEAR ENDED JUNE 30, 2016
Schedule of Amounts Passed-Through to Subrecipients
Subrecipient NameCFDA
No. Program Title Expenditures
The Regents of the University of California 93.865 HIF1 Alpha Regulation of Trophoblast Differentiation in vivo 34,312$
The Regents of the University of California Total 34,312
The Research Foundation for SUNY 93.286 Quant. Endos. Imaging and Struc. Light Deliv. for Ctrld Drug 51,817
The Research Foundation for SUNY Total 51,817
The University of Michigan 12.800 SIRCUS 72,095
The University of Michigan Total 72,095
TM Capture Services, LLC 12.800 WSARC - Dayton Metro Plan for Economic Diversity 36,000
TM Capture Services, LLC Total 36,000
Treble One LLC 12.800 WSARC - Dayton Metro Plan for Economic Diversity 2,900
Treble One LLC Total 2,900
University of California, Davis 93.242 Rhesus Model for Proinflammatory Influences on Depression 114,264
University of California, Davis Total 114,264
University of Central Florida 84.367 Partners in Integrated Earth Systems Science (PIES) (FY15) 2,454
University of Central Florida Total 2,454
University of Cincinnati 47.076 A National Model for Engineering Mathematics Education 8,652
University of Cincinnati 93.226 Effects of VR Sim on Worker Emergcy Evac of Neonates 46,488
University of Cincinnati Total 55,140
University of Dayton 47.074 Roles & Reg of Aqua/Glyceroporin in a Freeze-Tolerant Amph. 22,824
University of Dayton 12.800 WSARC - Dayton Metro Plan for Economic Diversity 26,529
University of Dayton 12.800 WSARC - HMT 44,865
University of Dayton 12.800 WSARC - TTAS 7,069
University of Dayton Total 101,287
University of Maryland 47.076 A National Model for Engineering Mathematics Education 33,710
University of Maryland 47.076 The CECS Stdnt Success Schol Prog: Leverag. Curriculr Innov. 9,454
University of Maryland Total 43,164
University of Massachusetts Medical 93.279 National Early Warning System Network iN3 An Innov Apprch 24,576
University of Massachusetts Medical 93.279 Trndng Soc Media Anal. to Monitor Cannabis & Synth Cannab Use 34,682
University of Massachusetts Medical Total 59,258
University of Minnesota 93.121 Craniofacial Growth Prediction in Different Facial Types 18,255
University of Minnesota 93.865 Adiposity Disease Risk Factors and Lifetime Health 7,799
University of Minnesota Total 26,054
University of Missouri 47.070 RI:Small:Develop Lrg Scale Distrib Syntac, Semant & Lex Lang 20,718
University of Missouri Total 20,718
University of San Diego 47.076 A National Model for Engineering Mathematics Education 4,238
University of San Diego Total 4,238
University of the Pacific 93.121 Craniofacial Growth Prediction in Different Facial Types 135,500
University of the Pacific Total 135,500
University of Virginia 12.800 Phys-Based Morph Anal & Adjoint Optim of Flex Flapping Wings 1,000
University of Virginia Total 1,000
University of Washington 93.853 Reduced Motoneuron Excitability in Sepsis 57,730
University of Washington Total 57,730
Western Michigan University 47.076 A National Model for Engineering Mathematics Education 2,928
Western Michigan University Total 2,928
Wright Brothers Institute 12.800 WSARC - Dayton Metro Plan for Economic Diversity 183,605
Wright Brothers Institute Total 183,605
Wright State Applied Research Corporation 12.614 Southwest Ohio Region DD 230,749
Wright State Applied Research Corporation Total 230,749
Wright State Research Institute 12.614 Southwest Ohio Region DD 417,478
Wright State Research Institute Total 417,478
Wright State University 12.800 WSARC - ATB 11,618
Wright State University 12.800 WSARC - LVC 54,939
Wright State University 12.800 WSARC - HMASINT 35,410
Wright State University 12.800 WSARC - AMT & Trust in Automation 46,739
Wright State University Total 148,706
Grand Total 6,184,767$
96

WRIGHT STATE UNIVERSITY
NOTES TO THE SCHEDULE OF EXPENDITURES OF FEDERAL AWARDS YEAR ENDED JUNE 30, 2016
A. BASIS OF PRESENTATION
The accompanying Schedule of Expenditures of Federal Awards (the “Schedule”) has been prepared using the accrual basis of accounting in accordance with the format as set forth in 2 CFR 200 (Uniform Guidance) Subpart F, Audit Requirements, issued by the United States Office of Management and Budget. The Schedule reflects the expenditures of Wright State University under programs financed by the U.S. government for the year ended June 30, 2016.
For purposes of the Schedule, expenditures of federal awards include the following:
• Direct federal awards• Federal Direct Student Loans processed by the University• Outstanding Balances of federal loan programs administered by the University• Pass-through funds received from non-Federal organizations made under federally sponsored programs
conducted by those organizations.
Awards are classified into major program and non-major program categories in accordance with the provisions of the Office of Management and Budget (OMB) 2 CFR 200 (Uniform Guidance) Subpart F, Audit Requirements. Catalog of Federal Domestic Assistance (CFDA) Numbers or Primary Grant Numbers are presented for those programs for which such numbers are available.
In addition, the discretely presented component unit Wright State Applied Research Corporation is included in the University’s financial statements and schedule of expenditures of federal awards.
The University did not elect to use the 10% de minimis cost rate as covered in §200.414 Indirect (F&A) costs.
B. FEDERAL DIRECT STUDENT LOANS
The University is responsible only for the performance of certain administrative duties with respect to the Federal Direct Student Loan program (CFDA Number 84.268).
C. FEDERAL LOAN PROGRAMS
Total loan balances outstanding of the U.S. Department of Education and the U.S. Department of Health and Human Services student financial assistance loan programs for the fiscal year are identified below:
OutstandingCFDA Balance at
Number June 30, 2016
Federal Perkins Loan Program 84.038 11,977,687$ ARRA - Nurse Faculty Loan Program 93.264 11,444 Health Professions Student Loans 93.342 12,294 Loans for Disadvantaged Students 93.342 157,547 Nurse Faculty Loan Program 93.264 159,161
Total loan expenditures and disbursements of the U.S. Department of Education student financial assistance loan programs for the fiscal year are identified below:
CFDA NUMBER Disbursements
Federal Perkins Loan Program 84.308 $ 1,367,201
97

This page intentionally left blank
98
Crowe Horwath LLP Independent Member Crowe Horwath International
INDEPENDENT AUDITOR’S REPORT ON INTERNAL CONTROL OVER FINANCIAL REPORTING AND ON COMPLIANCE AND OTHER MATTERS BASED ON AN
AUDIT OF FINANCIAL STATEMENTS PERFORMED IN ACCORDANCE WITH GOVERNMENT AUDITING STANDARDS
To the Board of Trustees Wright State University Dayton, Ohio
We have audited, in accordance with the auditing standards generally accepted in the United States of America and the standards applicable to financial audits contained in Government Auditing Standards
issued by the Comptroller General of the United States, the financial statements of the business-type activities and the aggregate discretely presented component units of Wright State University (the University) as of and for the year ended June 30, 2016, and the related notes to the financial statements, which collectively comprise the University’s basic financial statements, and have issued our report thereon dated the same date as of this report.
Internal Control Over Financial Reporting
In planning and performing our audit of the financial statements, we considered the University’s internal control over financial reporting (internal control) to determine the audit procedures that are appropriate in the circumstances for the purpose of expressing our opinions on the financial statements, but not for the purpose of expressing an opinion on the effectiveness of the University’s internal control. Accordingly, we do not express an opinion on the effectiveness of the University’s internal control.
A deficiency in internal control exists when the design or operation of a control does not allow management or employees, in the normal course of performing their assigned functions, to prevent, or detect and correct, misstatements on a timely basis. A material weakness is a deficiency, or a combination of deficiencies, in internal control, such that there is a reasonable possibility that a material misstatement of the entity’s financial statements will not be prevented, or detected and corrected on a timely basis. A significant deficiency is a deficiency, or a combination of deficiencies, in internal control that is less severe than a material weakness, yet important enough to merit attention by those charged with governance.
Our consideration of internal control was for the limited purpose described in the first paragraph of this section and was not designed to identify all deficiencies in internal control that might be material weaknesses or significant deficiencies. Given these limitations, during our audit we did not identify any deficiencies in internal control that we consider to be material weaknesses. However, material weaknesses may exist that have not been identified.
99
Compliance and Other Matters
As part of obtaining reasonable assurance about whether the University’s financial statements are free of material misstatement, we performed tests of its compliance with certain provisions of laws, regulations, contracts, and grant agreements, noncompliance with which could have a direct and material effect on the determination of financial statement amounts. However, providing an opinion on compliance with those provisions was not an objective of our audit, and accordingly, we do not express such an opinion. The results of our tests disclosed no instances of noncompliance or other matters that are required to be reported under Government Auditing Standards.
Purpose of this Report
The purpose of this report is solely to describe the scope of our testing of internal control over financial reporting and compliance and the results of that testing, and not to provide an opinion on the effectiveness of the entity’s internal control or on compliance. This report is an integral part of an audit performed in accordance with Government Auditing Standards in considering the entity’s internal control and compliance. Accordingly, this communication is not suitable for any other purpose.
Crowe Horwath LLP
Columbus, Ohio October 14, 2016
100

Crowe Horwath LLP Independent Member Crowe Horwath International
INDEPENDENT AUDITOR’S REPORT ON COMPLIANCE FOR EACH MAJOR FEDERAL PROGRAM; REPORT ON INTERNAL CONTROL OVER COMPLIANCE
To the Board of Trustees of Wright State University Dayton, Ohio
Report on Compliance for Each Major Federal Program
We have audited Wright State University’s (the University) compliance with the types of compliance requirements described in the OMB Compliance Supplement that could have a direct and material effect on each of the University’s major federal programs for the year ended June 30, 2016. The University’s major federal programs are identified in the summary of auditor’s results section of the accompanying schedule of findings and questioned costs.
Management’s Responsibility
Management is responsible for compliance with federal statutes, regulations, and the terms and conditions of its federal awards applicable to its federal programs.
Auditor’s Responsibility
Our responsibility is to express an opinion on compliance for each of the University’s major federal programs based on our audit of the types of compliance requirements referred to above. We conducted our audit of compliance in accordance with auditing standards generally accepted in the United States of America; the standards applicable to financial audits contained in Government Auditing Standards, issued by the Comptroller General of the United States; and the audit requirements of Title 2 U.S. Code of Federal Regulations Part 200, Uniform Administrative Requirements, Cost Principles, and Audit Requirements for Federal Awards (Uniform Guidance). Those standards and the Uniform Guidance require that we plan and perform the audit to obtain reasonable assurance about whether noncompliance with the types of compliance requirements referred to above that could have a direct and material effect on a major federal program occurred. An audit includes examining, on a test basis, evidence about the University’s compliance with those requirements and performing such other procedures as we considered necessary in the circumstances.
We believe that our audit provides a reasonable basis for our opinion on compliance for each major federal program. However, our audit does not provide a legal determination of the University’s compliance.
Opinion on Each Major Federal Program
In our opinion, the University complied, in all material respects, with the types of compliance requirements referred to above that could have a direct and material effect on each of its major federal programs for the year ended June 30, 2016.
101

Report on Internal Control Over Compliance
Management of the University is responsible for establishing and maintaining effective internal control over compliance with the types of compliance requirements referred to above. In planning and performing our audit of compliance, we considered the University’s internal control over compliance with the types of requirements that could have a direct and material effect on each major federal program to determine the auditing procedures that are appropriate in the circumstances for the purpose of expressing an opinion on compliance for each major federal program and to test and report on internal control over compliance in accordance with the Uniform Guidance, but not for the purpose of expressing an opinion on the effectiveness of internal control over compliance. Accordingly, we do not express an opinion on the effectiveness of the University’s internal control over compliance.
A deficiency in internal control over compliance exists when the design or operation of a control over compliance does not allow management or employees, in the normal course of performing their assigned functions, to prevent, or detect and correct, noncompliance with a type of compliance requirement of a federal program on a timely basis. A material weakness in internal control over compliance is a deficiency, or combination of deficiencies, in internal control over compliance, such that there is a reasonable possibility that material noncompliance with a type of compliance requirement of a federal program will not be prevented, or detected and corrected, on a timely basis. A significant deficiency in internal control over compliance is a deficiency, or a combination of deficiencies, in internal control over compliance with a type of compliance requirement of a federal program that is less severe than a material weakness in internal control over compliance, yet important enough to merit attention by those charged with governance.
Our consideration of internal control over compliance was for the limited purpose described in the first paragraph of this section and was not designed to identify all deficiencies in internal control over compliance that might be material weaknesses or significant deficiencies. We did not identify any deficiencies in internal control over compliance that we consider to be material weaknesses. However, material weaknesses may exist that have not been identified.
The purpose of this report on internal control over compliance is solely to describe the scope of our testing of internal control over compliance and the results of that testing based on the requirements of the Uniform Guidance. Accordingly, this report is not suitable for any other purpose.
Crowe Horwath LLP
Columbus, Ohio October 14, 2016
102

WRIGHT STATE UNIVERSITY SCHEDULE OF FINDINGS AND QUESTIONED COSTS
Year Ended June 30, 2016
PART I – SUMMARY OF AUDITORS’ RESULTS
Financial Statements Type of report the auditor issued on whether the financial statements audited were prepared in accordance with GAAP: Unmodified
Internal control over financial reporting: Material weakness(es) identified? Yes X No
Significant deficiency(ies) identified not considered to be material weaknesses? Yes X None Reported
Noncompliance material to financial statements noted? Yes X No
Federal Awards Internal control over major programs:
Material weakness(es) identified? Yes X No
Significant deficiency(ies) identified not considered to be material weakness(es)? Yes X None Reported
Type of auditors’ report issued on compliance for major federal programs: Unmodified
Any audit findings disclosed that are required to be reported in accordance with 2 CFR 200.200.516(a)? Yes X No
Identification of major programs:
Name of Federal Program Cluster
Federal Student Aid Cluster Research and Development Cluster
Dollar threshold used to distinguish between Type A and Type B programs $1,085,267
Auditee qualified as low-risk auditee? X Yes No
PART II – FINANCIAL STATEMENT FINDINGS
None
PART III – FINDINGS AND QUESTIONED COSTS – MAJOR FEDERAL AWARDS
None
Section IV - Prior Year Findings and Questioned Costs
None
103

This page intentionally left blank

wright.edu/controller
3640 Colonel Glenn Hwy.
Dayton, OH 45435
Annual Reportand
Single Audit Reports
for the year ended
June 30, 2016
Single Audit AR 18436 v10.indd 3-4 12/22/16 1:46 PM


