Page 1
Int. J. Electrochem. Sci., 16 (2021) Article Number: 211028, doi: 10.20964/2021.10.05
International Journal of
ELECTROCHEMICAL SCIENCE
www.electrochemsci.org
Anode and Cathode Flow Field Design and Optimization of
Parametric Performance of PEMFC
Duc Tran Duy1, Vinh Nguyen Duy1*, Thuy Cao Thi1, Nang Xuan Ho1, Hoa Binh Pham2
1 Faculty of Vehicle and Energy Engineering, Phenikaa University, To Huu Street, Yen Nghia Ward,
Ha Dong District, Hanoi, Vietnam 2 Faculty of Automobile, Hanoi University of Industry, Hanoi, Vietnam *E-mail: [email protected]
Received: 30 May 2021 / Accepted: 29 July 2021 / Published: 10 September 2021
Regarding pressure loss, water discharge, cell voltage enhancement, and uniform current density, the
flow field design for the evenly balanced reacting gas distribution has positively impacted scientists from
across the globe looking to enhance PEM performances fuel cells (PEMFCs). A flexible flow field for
the anode and cathode is described in this study. In the under-rib design, gas mass transfer is increased,
reducing flooding of the cathode and providing for better use of the electrocatalysts. Four different
combinations of the flow field, including the multi serpentines, single parallel, interdigitated, and pin
flow field configuration, are examined to determine the operating characteristics. These results show
that when the active area and operating conditions are identical, the combination of parallel and
interdigitated field patterns leads better performance than the other configurations due to its positive
effect for supporting water accumulation, water removal, and electrochemical reaction. Furthermore, the
parallel flow field patterns show the worst mass transfer characteristics because of the flooding and
drying of the membrane caused by uneven flow circulation.
Keywords: Polymer electrolyte fuel cell, Serpentine flow field, Under-rib convection, Flow field
configuration, Polarisation performance.
1. INTRODUCTION
In contrast to the conventional forms of energy, proton exchange membrane fuel cells (PEMFCs)
offer the promise for greener power generation [1-3]. However, because of technical issues, such as
flowfield design responding to water flooding and mass transport loss of the cathode, the implementation
of PEMFCs is still in its infancy. The flow field's overall strategy and flow channel arrangement
configuration have a powerful potential to solve the issues mentioned above. Convective flow in the
under-rib area contributes significantly to the use of the electrocatalysts effectively. Serpentine flowfield
Page 2
Int. J. Electrochem. Sci., 16 (2021) Article Number: 211028
2
(SEFF) has just been authorized for under-rib convection to impact PEMFC performance positively [4-
9]. When the gas diffusion layer (GDL) permeability is more than 10-13 m2, under-rib convection plays
a minor role. Therefore, serpentine flow fields improve PEMFC performance through more excellent
GDL permeability. In recent times, the cathode design for a single serpentine PEMFC has encouraged
strong convection flows to focus on improving water discharge, oxygen transport, and the water handling
ability of the convection-enhanced convoluted flow field acknowledged as being higher than the existing
design [10-12]. While the single serpentine flow field produces more power than the parallel flow field,
the pressure loss is more significant due to the longer length, the potential of obstruction, flooding, and
the development of slug and plug flows [4,7]. This results in decreased overall efficiency due to the
increased need for auxiliary power and increased mechanical stress due to the significant pressure
differential between the intake and outlet [8]. Additionally, the parallel gas flow channels are more
accessible to fabricate than serpentine flow fields due to their simpler architecture.
As the design mentioned in [16], this design method involves collecting pins in a particular
arrangement. These pin flow fields (PIFF) are typically round or cubical in cross-section. Reactant gases
pass via grooves surrounding pins of this kind. The reactants flow via the pathways with the least
resistance, resulting in stagnant regions and low reactant pressure drop, resulting in non-uniform reactant
distribution and reduced water removal, resulting in worse fuel cell efficiency. The parallel flow fields
(PAFF) have also been performed worldwide. In general, they may be divided into Z-type and U-type,
based on the rate of reactant gas flow at the exit, while the input remains constant. The Z-type flow field
has an input flow rate on one side and an exit flow rate on the other side of the flow field plate. Second,
in the U-type flow field, the intake and exit of the reactant gases are located on the same side of the flow
field plate [17]. The parallel flow field comprises a series of parallel channels linked to the gas intake
and outflow. In this case, the reactant gas will choose the route of least resistance.
Meanwhile, Interdigitated flow field (ITFF) is one of many kinds of flow field designs that push
reactants or products to flow past the electrode, thus improving cell efficiency by reducing concentration
polarization loss, but at the expense of a more significant pressure drop. Prior knowledge of the reactant
and water vapour distribution in a flow field aids in the design of the optimal flow field [18-19]. The
same topic research mentioned in [20] developed an unusual flow arrangement known as the ITFF flow
field, which comprises dead-ended input and outlet channels. Since reactants and products are pushed to
flow through the gas diffusion layer (GDL) to or from the catalyst layer in this flow field, water vapour
evacuation happens through convection and conduction processes in addition to diffusion. This
significantly increases the transport rate and reduces the resistance to concentration polarization by
raising the concentration of reactants at the reaction sites. At the expense of increased pressure drops
due to the flow being forced through porous media.
In conclusion, many studies have been conducted on the properties of fuel cells using a range of
flow field designs. However, all prior experiments used identical anode and cathode configurations. As
a result, they cannot optimize water management and gas distribution due to the anode's and cathode's
distinct work characteristics. This research conducted numerical studies on four PEMFC topologies
using the original parallel flow field as a starting point. As a result, dynamic models are developed on
four configurations as illustrated: configuration I (Case I) with PAFF and ITFF at the anode and cathode,
configuration II (Case II) with both PAFFs at the anode and cathode, configuration III (Case III) with
Page 3
Int. J. Electrochem. Sci., 16 (2021) Article Number: 211028
3
PAFF and PIFF at the anode and cathode, and configuration IV (Case IV) with PAFF and SEFF at the
anode and cathode, respectively. The performance of PEMFC was compared in terms of pressure drop,
condensed water discharge, maximizing of cell voltage, and uniformity of current density over the whole
surface area using simulation data for four configurations I-IV.
2. NUMERICAL MODEL
Figure 1. Schematic illustration of a computational domain for PEMFC simulation.
Fig. 1 depicts a computational schematic of a typical PEMFC design, showing bipolar plates
(BP), gas channels, GDLs, and MEA all located on 25 cm2 of area. Accordingly, hydrogen moves
through the porous gas diffusion layers to the catalyst layer, where it combines with the catalyst to form
water. Here, hydrogen ions and electrons are produced. Electrons travel via the gas diffusion layer to the
current collectors and into the electric load, while hydrogen ions diffuse through the proton exchange
membrane in the middle. Table 2 contains a summary of flowfield and other physical characteristics
used in this research.
Table 2. Physical details of parameters and properties are used in this modeling.
Physical parameters and properties
Electrical Conductivity of BP 6 W/mK
Electric conductivity of BP 10,000/Ω.m
Page 4
Int. J. Electrochem. Sci., 16 (2021) Article Number: 211028
4
Permeability of GDL 1.0e-12 m2
GDL Tortuosity 1.25
Diffusion adjustment 60 %
Thermal conductivity 0.21 W/m·K
MEA Thickness (catalyst layer) 50 μm (12.5 μm)
Thermal conductivity 0.15 W/m·K
Membrane density 2.0 g/m3 (1,100 g/mol)
Cathode exchange current density 0.02 A/cm2
Cathode transfer coefficient 0.6
Anode exchange current density 0.2 A/cm2
Anode transfer coefficient 1.2
Source terms for species transport equations, heat sources, and liquid water formation are
required for the model equations to be solved using commercial CFD software. The following table
summarises the symbols and parameters that were utilized in the simulation. Stable operating conditions
were applied, along with isothermal boundary conditions for external walls, and the assumption that the
flow in the cell was laminar was used. Ideal gas mixtures were also employed for reactant and product
flow, and the electrode was assumed to be a homogeneous, isotropic porous medium. Coupled
phenomena are simulated in PEMFCs using differential equations that describe mass, momentum,
energy, and species conservation, as well as electrical charges. This section will include all of the
equations and assumptions used to evaluate species movement and electrochemical performance in a
PEMFC, including the Continuity equation, Momentum conservation equation, Energy conservation
equation, Species transport equation: 𝜕(𝜀𝜌)
𝜕𝑡+ ∇ ∙ (𝜀𝜌 ) = 𝑆𝑚 (1)
Where ε, 𝜌, represent the porous zones porosity, species density, and velocity vector,
respectively. Sm is a source term that is nonzero on both sides except in the catalyst zones.
Eq. 2 illustrates the form of the momentum equation is: 𝜕(𝜀𝜌 )
𝜕𝑡+ ∇ ∙ (𝜀𝜌 ) = −ε∇P + ∇ ∙ (εμ∇(εμ∇ ) + 𝑆𝑢 (2)
where μ and 𝑆𝑢 are respectively fluid viscosity and source term of momentum equation.
Meanwhile, the following equation may be used to compute the energy conservation equation in
the solution domain: 𝜕(𝜀𝜌𝑐𝑝𝑇)
𝜕𝑡+ ∇ ∙ (𝜌𝑐𝑝 𝑇) = ∇ ∙ (𝑘𝑒𝑓𝑓∇T) + 𝑆𝑇 (3)
where keff denotes the effective thermal conductivity, cp is the specific heat at constant pressure,
and ST denotes the additional volumetric source term defined by:
ST = I2R + r.h − η.j + h (4)
Page 5
Int. J. Electrochem. Sci., 16 (2021) Article Number: 211028
5
where R denotes ohmic heating, r denotes the heat of water formation, j is overpotential and η.j
is electric work, and h is the net enthalpy change.
In PEMFC, hydrogen and air are used as reactants because they are regarded to be ideal gases.
The following equations explain these species transfer equations: 𝜕(𝜀Ci)
𝜕𝑡+ ∇ ∙ (𝜀 𝐶𝑖) = ∇ ∙ (Di
eff∇Ci) + Si (5)
where Ci denotes the molar concentration, Si is the additional volumetric source term of species.
Figure 2. Four flowfield configurations of PAFF and ITFF, PIFF and SEFF
Figure 3. Four combinations of various flow field types applied on the anode and cathode bipolar plates;
(a) Case I: PAFF and ITFF used at the anode and the cathode respectively, (b) Case II: both
PAFF used at the anode and the cathode, (c) Case III: PAFF and PIFF used at the anode and the
cathode respectively, (d) Case IV: both PAFF and SEFF used at the anode and the cathode
respectively.
Case I (PAFF and ITFF) Case II (PAFF and PAFF)
Case III (PAFF and PIFF) Case IV (PAFF and SEFF)
Page 6
Int. J. Electrochem. Sci., 16 (2021) Article Number: 211028
6
Figure 4. Flow field design dimensions of ITFF, PAFF, PIFF, SEFF
As shown in Fig. 2, this study used four flowfield patterns by combining PAFF and ITFF, PIFF
and SEFF. The assembly of combined flow fields is illustrated in Fig. 3.
Fig. 3 shows a model simulation of four configurations in which the PAFF was utilized at the
anode side for all cases. Meanwhile, the cathode side was applied ITFF, PAF, PIFF, and SEFF
corresponding to Case I, Case II, Case III, and Case IV, respectively. Geometric details of four flowfield
configurations used in this modelling are highlighted in Fig. 4.
Using a single domain formulation, one may examine the simulation process using the source
terms in Table 1 and analyze whether or not the hypothesized steady-state, ideal gas characteristics and
homogeneous two-phase flows are correct. Consequently, the mesh size applied to the channel and rib
areas for numerical simulation does not significantly impact. Using dense mesh GDL and MEA meshes,
along with calculating the distributions of temperature, pressure, water content, and current density at
the interface of the membrane/electrode, we found the desired mesh density for reconciling the mesh
size of the GDL and MEA (mesh). Also, the cell size in the mesh layer of the rib and channel areas was
0.4 cm in height and 1.02 mm in width, which was more significant than those of MEA and GDL
dimensions. Furthermore, the quadrilateral mesh generation technique was used to improve
computational accuracy, and the connection between nodes was balanced throughout each component.
By extrapolation, we may conclude that the total number of computational cells found across all
geometries is more than 1 million control volumes for all simulation cases. Algebraic multi-grid
determinant was used for the flowfield computation while utilizing the SIMPLE method for the solution
procedure. For the balance of the energy and mass, the convergence criteria are set at 1.2%, and the
Page 7
Int. J. Electrochem. Sci., 16 (2021) Article Number: 211028
7
maximum residual tolerance is set at 10-5. The electrochemical processes are regarded as heterogeneous
reactions, and the resultant generated water is in vapour and condensate states. The initial and boundary
conditions for all simulation cases are gathered in Table 3.
Table 3. Inlet and operating conditions used in this modeling
Inlet conditions
Mass flow rate inlet 5e-6 kg·s−1
Inlet temperature 75
Mass fraction of hydrogen 0.12
Mass fraction of water 0.88
Mass flow rate inlet 3e-5 kg·s−1
Inlet temperature 75
Mass fraction of Oxygen 0.1785
Mass fraction of water 0.15
Open circuit voltage 0.96 V
Cell temperature 75
3. RESULTS AND DISCUSSION
Mass transport and electrochemical reactions take place on both the anode and cathode sides of
the membrane. Fuel cell performance may be improved by configuring the flow field in the BPs to
respond to changing operating circumstances. PEMFC devices are most often optimized for both the
anode and cathode flow fields using the same BP design. This study aims to provide a numerical analysis
that will examine fuel cell designs' flexibility and power characteristics utilizing CASFF and SFFSB
design for BPPs and identify the most appropriate design flow field for application. The electrochemical
reaction and transport models were linked entirely with the governing equations, allowing the PEMFC
performance to be elucidated. This investigation focuses on optimizing the flowfield design concerning
the decrease in pressure drop, the free-flowing discharge of condensed water, the even current density
distribution across the active area, and the voltage increase in cell to V = 0.5 (V)
3.1. Comparison of the performance-related parameter distributions
Four flowfield designs had their distinctive characteristics evaluated at the average voltage of 0.5
(V). The pressure drop across the flow channel is reduced because of frictional and bending losses,
causing a decrease of total pressures on the anode and cathode sides. Due to the high-pressure drop in
the middle of the porous electrode, which is set up because of the enormous pressure gradient, there
Page 8
Int. J. Electrochem. Sci., 16 (2021) Article Number: 211028
8
seems to be significant cross-leakage circulation across the adjacent cells. This flow significantly
influences the performance of PEMFCs, providing convection for reactants to move to the catalyst layer,
removing the formation water from the reaction sites, and discharging reactants from the reaction sites
and electrodes.
PEMFCs may operate at atmospheric pressure or pressurized conditions. According to Yuh and
Ay [21], increasing the pressure increases cell function. Due to pressure loss inside the flow field
channels, the reactant inflow pressure is always more significant than the reactant outflow pressure.
Indeed, as shown in Fig. 5a, the total pressure at the anode side reduces along the channel from the inlet
to the outlet. There are some local pressure peaks and troughs due to the distribution of the rib channel
positions. The former appeared at the channels; meanwhile, the latter appeared at the ribs due to the
movement of inlet gases along the canals and their under-rib convection phenomenon. In order of
pressure distribution in the anode side, Case II, Case IV, Case III, and Case I. On the opposite side, the
distribution between cases is dramatically different due to the different designs of the cathode flow field.
Vinh N.D also clearly described the phenomena as the results shown in [8-9].
Consequently, the total pressure of Case III gradually decreased along the channel, and a
significant pressure change occurs in case I corresponding to the ITFF flow field. The pressure drop
across the flow channel was reduced because of frictional and bending losses, causing the total pressures
on the anode and cathode to decrease. Due to the high-pressure drop in the middle of the porous
electrode, which is set up because of the enormous pressure gradient, there seems to be significant cross-
leakage circulation across the adjacent cells. This flow significantly influences the performance of
PEMFCs, providing convection for reactants to move to the catalyst layer, removing the formation water
from the reaction sites, and discharging reactants from the reaction sites and electrodes.
Figure 5. The comparison of the total pressures on the anode (a) and the cathode side (b) between the
four flowfield configurations #I-Ⅳ at V=0.5 V
(a)
(b)
(a)
(b)
Page 9
Int. J. Electrochem. Sci., 16 (2021) Article Number: 211028
9
Figure 6. Comparing the membrane water content and liquid water activity between the four flowfield
configurations #I-IV at V=0.5 V
Under increasing total pressure, the water activity dramatically affects the membrane water
content. Because the effects of the under-rib convection absorb most of the water produced between
GDL and the rib, the membrane water content under the rib regions is more significant than that under
the neighbouring channel areas, as seen in Fig 6. Therefore, the cross-leakage flow may be described as
under-rib convection. Conversely, when overall pressure decreases, the membrane water content
increases along the flow direction. The electro-osmotic drag coefficient expresses the water movement
between the anode and the cathode (a function of the membrane water content). The net water flow per
proton must be smaller than 0 for water to be transferred from the cathode to the anode during the
diffusion process. It can be observed that the liquid water activity moves from the underside of the ribs
to the bottom of the channels, oscillating between troughs and peaks. This study's findings indicate that
the net water flow per proton is less in the outlet region under the ribs, meaning that water is transferred
from the cathode to the anode due to the preponderance of back diffusion. However, with higher channel
heights, this phenomenon improves to a certain extent, as the mass fractions of the anode and cathode
liquid water have increased. This liquid water mass percentage also varies between the peak and trough;
it grows from the input to the exit. The membrane water content of Case II is very different from the
other configurations in the center areas showing an imbalance in the water distribution of Case II.
Meanwhile, around the gas inlet areas, the membrane water content of cases 3, 4 was low, leading
to membrane drying. The flow field design of case I showed better water management than other Cases
when the difference of membrane water content was slight from the inlet to the outlet. However, there
is a small area near the outlet, and the membrane water content was minimal due to the effect of the
strong forced convection.
Page 10
Int. J. Electrochem. Sci., 16 (2021) Article Number: 211028
10
Figure 7. Comparing the temperatures on the anode and the cathode side between the four flow field #I-
IV at V = 0.5 V.
The operating temperature does have a significant effect on the operation of the fuel cell. In
addition, Increased working temperature benefits the electrochemical reaction, ionic transport rate, and
water elimination from the PEM fuel cell [22-24]. The anode and cathode temperatures of the anode side
and cathode side are indicated in Fig. 7. On the anode side, the temperature is usually lower since most
of the cathode's heat output occurs on the cathode membrane's surface. In addition, because the
temperature rises more quickly in the rib regions due to the increased heat transfer between the rib and
graphite block, the temperature beneath the rib sections is lower. Also, the temperature at the inlet falls
to the outlet due to the water's cooling as it flows. It also increases by raising the channel height since
it's easier to dissipate heat over a greater distance at a lower temperature. It can be observed that the
temperature variation between the 4 cases is quite similar due to the temperature fixation of 348 K at the
anode and cathode bipolar plate. The most significant temperature difference between regions is about
3 K. The lowest and highest temperatures are for case 4 and case 1, respectively, reflecting exothermic
reactions. The same topic research [25] pointed out that the temperature distribution at the interface
between the catalyst layer and membrane in the anode area of each material is somewhat different
throughout each flow field channel, with temperature differences between 1 and 6 K.
3.2. Comparison of the liquid water behaviours
Fig. 8 shows the average catalyst's water content at the anode and cathode sides of four cases
according to the output voltage change. Generally, the water content on the cathode side is higher than
that of the anode side due to the formation of water in the former one. After that, it is transferred through
the anode side due to the back diffusion phenomena. However, the back diffusion is not high enough to
compensate for the electro-osmotic drag in drying at the anode. The anode drying shows faster progress
than the velocity of moving water. Indeed, electro-osmotic drag forces water molecules and protons from
Page 11
Int. J. Electrochem. Sci., 16 (2021) Article Number: 211028
11
the anode to the cathode when an electric field is applied across the membrane. The transfer water level
depends on the humidification level of the membrane and increases with increasing current density [26].
This phenomenon was also well mentioned in detail in [5-12].
Figure 8. The comparison of the average water content on the anode and cathode catalysts between the
four flow field designs
As mentioned in many previous studies, an acceptable membrane water content value for a
wholly humidified environment is 14. Since it is believed that the flooding happens at a position between
λ and 14, then it is presumed that the flooding occurs at that place. Simulation findings indicate that the
average water content of the membrane was under 14 for all cases. However, the water content was
higher than 14 at some local locations. Generally, the water content in configurations I is considerably
greater than in structures I, III, and IV. Hence, in designs Ⅰ, the flooding phenomena of cathode flooding
may occur, which blocks the pores in the porous GDL and hides the active sites in the catalyst layer.
This has the effect of decreasing the power density of configurations I compared to the other designs.
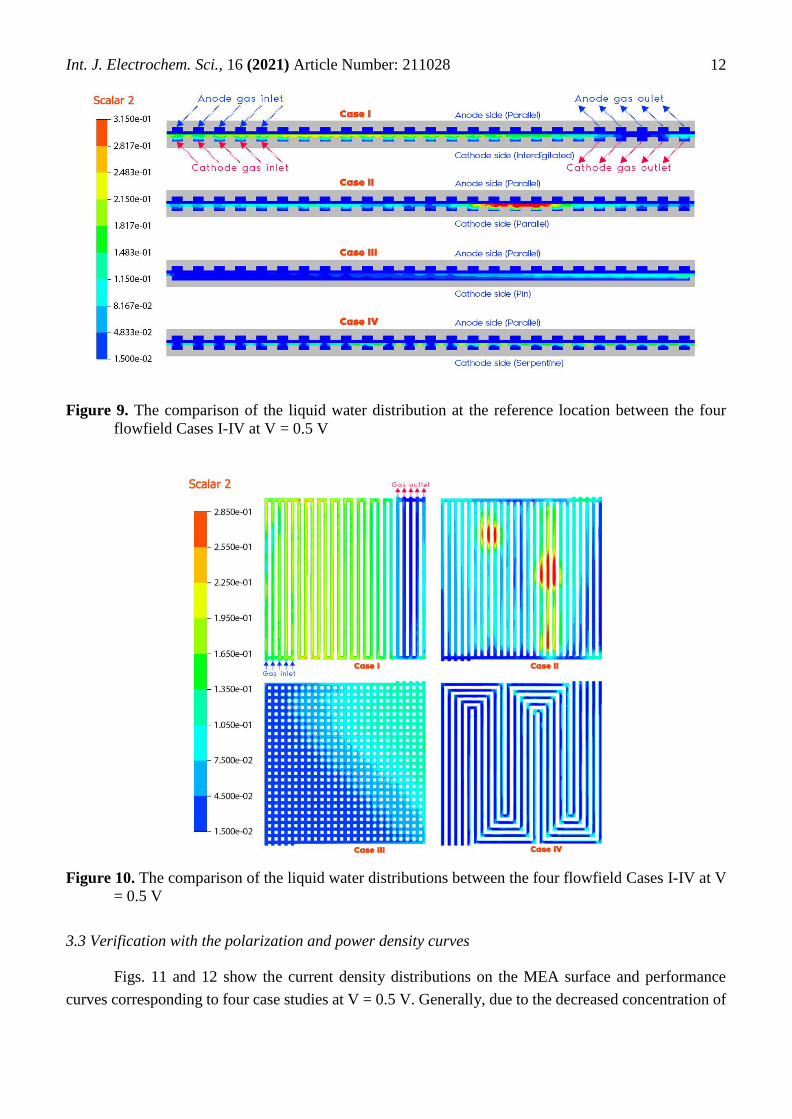
Figs. 9 and 10 show the liquid water concentrations at cathode channels and at the reference
location at the voltage of 0.5 V. From the inlet to exit and the anode side to the cathode side, liquid water
concentration increases is also undetectable while present in the anode side. The difference in water
liquid can be seen on the graph between the configurations at different points. In general, the amount of
water concentrates at the cathode side, and the anode side has shallow water content. Case III gives the
most uniform water distribution; meanwhile, in configuration II, some local areas had high water liquid,
and the water drying can be observed in the outlet area of Case I.
10.0
10.5
11.0
11.5
12.0
12.5
13.0
13.5
0.5 1 1.5 2 2.5
Ave
rage
an
od
e ca
taly
st w
ater
co
nte
nt
Current density (A)
Case I Case II Case III Case IV
10.0
11.0
12.0
13.0
14.0
15.0
16.0
0.5 1 1.5 2 2.5
Ave
rage
cat
ho
de
cata
lyst
wat
er c
on
ten
t
Current density (A)
Case I Case II Case III Case IV
Page 12
Int. J. Electrochem. Sci., 16 (2021) Article Number: 211028
12
Figure 9. The comparison of the liquid water distribution at the reference location between the four
flowfield Cases I-IV at V = 0.5 V
Figure 10. The comparison of the liquid water distributions between the four flowfield Cases I-IV at V
= 0.5 V
3.3 Verification with the polarization and power density curves
Figs. 11 and 12 show the current density distributions on the MEA surface and performance
curves corresponding to four case studies at V = 0.5 V. Generally, due to the decreased concentration of
Page 13
Int. J. Electrochem. Sci., 16 (2021) Article Number: 211028
13
reactive gases, the overall distributions' local density decreased flow direction case studies. The analysis
showed that flowfield configurations I and III had lower power densities than configurations II and IV.
The maximum power density is 1.005 W/cm2, 0.918 W/cm2, 0.833 W/cm2, and 0.473 W/cm2 correspond
to Case I, Case III, Case IV, and Case II. Bin-Tsang simulated the effect of flow field design with metal
foam to conduct the same topic research and concluded that after using improved metal foam flow field
designs, the fuel cell's performance increases compared with the structure [27]. The peak power of the
best design reached 0.96 (W). Meanwhile, Kumar [28] performed the simulation results that serpentine,
parallel, multi-parallel, and discontinuous flow channels were analyzed at PEMFC voltage values of
0.66, 0.64, 0.68, and 0.71 V at =0.5 A/cm2, respectively, to study the steady and transient behaviour of
the PEM fuel cell. The difference in power performance may be related to variations in pressure drop,
water concentrations, and membrane conductivity. Indeed, the power performance of Case I and Case
III are higher than other case studies due to the positive effect of interdigitated and pin flow fields. These
mentioned designs promote uniform water distribution throughout the surface areas to maintain a
suitable membrane water content and proton conductivity. They also contribute to the distribution of the
reaction gas to the catalyst surfaces to enhance the number of reactions; as a result, the current density
in Case I and Case III is higher and more uniform than in the other cases. In Case II, the low current
density at the center; meanwhile, the current distribution density of Case IV is consistent but small. Thus,
it is concluded that applying different flow field designs for PEMFCs can enhance their operating
characteristics. In addition, the interdigitated and pin flow field plays an excellent role in water
management and oxygen distribution on the cathode side. The parallel profile in the cathode side may
cause water flooding and reduce fuel cell performance.
Figure 11. The comparison of current density distributions between the four flow fields at V = 0.5 V
Page 14
Int. J. Electrochem. Sci., 16 (2021) Article Number: 211028
14
Figure 12. The comparison of the polarization and power density curves between the four flow fields
Case I-IV at V=0.5 V
4. CONCLUSIONS
To investigate PEMFC's parameter characteristics, parametric simulations of flow field design
of serpentine flowfield, pin flow fields, parallel flow fie, Interdigitated flow field was performed in this
research. The parameters investigated include cell voltage improvement, membrane water holding
capacity, the molar ratio of liquid water, and temperature. This study lays the groundwork for designing
the PEMFC under-rib convection flow field for maximum efficiency. The favourable effects of ITFF
enable the liquid water discharge to help keep the cell voltage and current density high. Furthermore, the
use of pin flowfield also allows the mass fraction of oxygen in the under-rib areas to be enhanced via
under-rib convection. In contrast, membrane dehydration and local water flooding may occur with
parallel and serpentine flow fields in the cathode side because water creation on the cathode side does
not travel well through the flow channel and active areas in these designs. The findings of this study are
the foundation to optimize the flow field for the anode and cathode of PEMFC.
ACKNOWLEDGEMENTS
This research is funded by PHENIKAA University under grant number 01.2020.07
References
1. M. Ji, Z. Wei, Energies, 2 (2009) 1057–1106.
2. X. Li, I. Sabir, Int. J. Hydrogen Energy, 30 (2005) 359–371.
3. J.P. Feser, A.K. Prasad, S.G. Advani, J. Power Sources, 162 (2006) 1226–1231.
Page 15
Int. J. Electrochem. Sci., 16 (2021) Article Number: 211028
15
4. VN Duy, H.M. Kim, Int. J. Electrochem. Sci., 12 (2017) 11833-11854.
5. VN Duy, J.K. Lee, K.W. Park, H.M. Kim, Mater. Sci. Forum, 804 (2015) 75-78.
6. ND. Vinh, H.M. Kim, Electrochem. Commun., 75 (2017) 64–68.
7. K. Choi, J. Ahn, J. Lee, V.N. Duy, H.M. Kim, K. Park, G. Hwang, IEEE Trans. Energy Convers.,
29 (2014) 727–734.
8. J. Lee, H.-M. Kim, T. Kim, V.N. Duy, J. Ahn, S. Park, K. Kim, J. Power Sources, 293 (2015) 447-
457.
9. ND. Vinh, H.M. Kim, Energies, 9 (2016) 1-17.
10. TD. Tran, S. Huang, D.H. Vu, V.N. Duy, Int. J. Electrochem. Sci., 13 (2018) 10480–10495.
11. V.N. Duy, K. Kim, J. Lee, J. Ahn, S. Park, T. Kim, H.M. Kim, Int. J. Electrochem. Sci., 10 (2015)
5842-5861.
12. T. Diep Tran, D. Ha Vu, S. Huang, D. Vinh Nguyen, IOP Conf. Ser. Mater. Sci. Eng., 739 (2020) 4–
9.
13. Ghanbarian, M.J. Kermani, J. Scholta, M. Abdollahzadeh, Energy Convers. Manag., 166 (2018)
281–296.
14. MZ. Chowdhury, Y.E. Akansu, Int. J. Hydrogen Energy, 42 (2017) 25686–25694.
15. S. Barati, B. Khoshandam, M.M. Ghazi, Int. J. Hydrogen Energy, (2018) 21928–21939.
16. B. Lee, K. Park, H. Kim, Int. J. Electrochem. Sci., 8 (2013) 219–234.
17. M. Ghasabehi, M. Ashrafi, M. Shams, Fuel, 285 (2021) 119194.
18. H. Liu, P. Li, D. Juarez-Robles, K. Wang, A. Hernandez-Guerrero, Front. Energy Res., 2 (2014) 1–
8.
19. K.B. Shyam Prasad, P. V. Suresh, S. Jayanti, Int. J. Hydrogen Energy, 34 (2009) 8289–8301.
20. T. V. Nguyen, J. Electrochem. Soc., 143 (1996) L103–L105.
21. Y.M. Ferng, A. Su, Int. J. Hydrogen Energy, 32 (2007) 4466–4476.
22. H.K. Esfeh, M.K.A. Hamid, Energy Procedia, 61 (2014) 2617–2620.
23. Z. Williamson, D. Kim, D.K. Chun, T. Lee, C. Squibb, Appl. Therm. Eng., 31 (2011) 3761–3767.
24. S. Wasterlain, D. Candusso, D. Hissel, F. Harel, P. Bergman, P. Menard, M. Anwar, J. Power Sources,
195 (2010) 984–993.
25. T. Wilberforce, O. Ijaodola, O. Emmanuel, J. Thompson, A.G. Olabi, M.A. Abdelkareem, E.T. Sayed,
K. Elsaid, H.M. Maghrabie, Membranes (Basel), 11 (2021) 1–21.
26. M. Ji, Z. Wei, Energies, 2 (2009) 1057–1106.
27. BT. Tsai, C.J. Tseng, Z.S. Liu, C.H. Wang, C.I. Lee, C.C. Yang, S.K. Lo, Int. J. Hydrogen Energy, 37
(2012) 13060–13066.
28. A. Kumar, R.G. Reddy, J. Power Sources, 155 (2006) 264–271.
© 2021 The Authors. Published by ESG (www.electrochemsci.org). This article is an open access
article distributed under the terms and conditions of the Creative Commons Attribution license
(http://creativecommons.org/licenses/by/4.0/).