Antenna 1 Transmitt er EISCAT-3D as a diagnostic for EISCAT-3D as a diagnostic for ionospheric heating experiments ionospheric heating experiments Michael Rietveld Michael Rietveld EISCAT Scientific Association EISCAT Scientific Association Tromsø Tromsø Norway Norway
Transcript
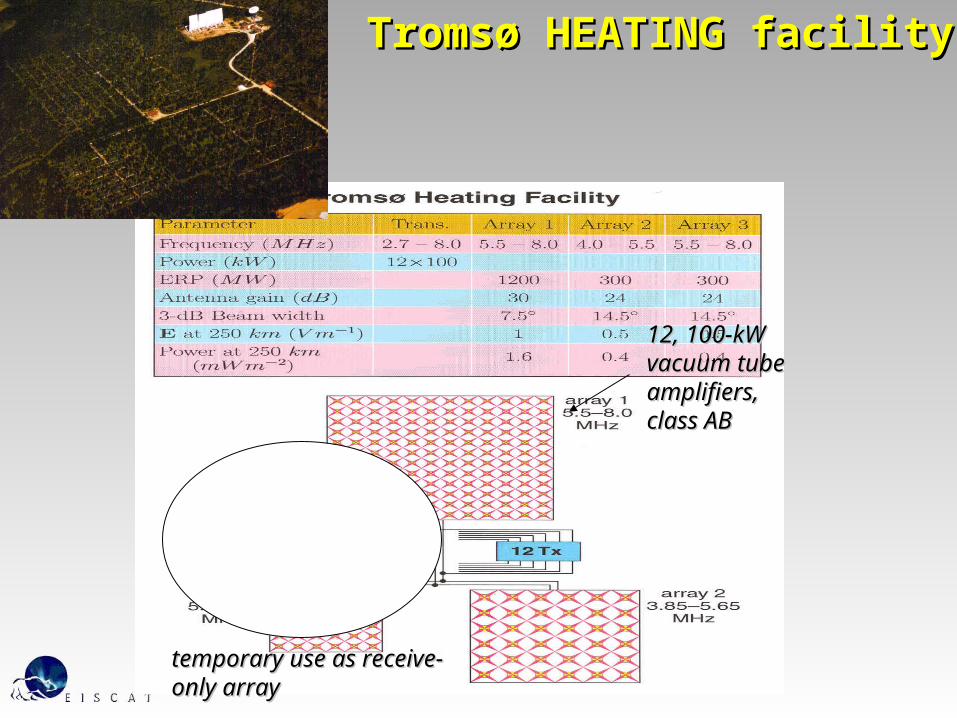
Antenna 1Transmitter
EISCAT-3D as a diagnostic for EISCAT-3D as a diagnostic for ionospheric heating experiments ionospheric heating experiments
Michael RietveldMichael Rietveld
EISCAT Scientific AssociationEISCAT Scientific Association
TromsøTromsø
NorwayNorway
Tokyo, 29-30 May 2007
Norway-Japan Symposium onPolar, Space, and Climate Research
12, 100-kW 12, 100-kW vacuum tube vacuum tube amplifiers, amplifiers, class ABclass AB
temporary use as temporary use as receive-only arrayreceive-only array
•The facility started operation in 1980The facility started operation in 1980
•It runs about 200 hours a yearIt runs about 200 hours a year
•So it can probably run another 10 years or So it can probably run another 10 years or so without major repair costs.so without major repair costs.
•The low-power RF generation and control The low-power RF generation and control software has just been upgraded (DDS software has just been upgraded (DDS synthesizers- faster frequency changes)synthesizers- faster frequency changes)
•We are investigating operation at the 2nd We are investigating operation at the 2nd gyroharmonic (2.71 MHz)gyroharmonic (2.71 MHz)
Wide-field (>beam width) radar Wide-field (>beam width) radar imaging/scanning as well as narrow field will imaging/scanning as well as narrow field will probably find new phenomena, as it did for probably find new phenomena, as it did for
optical diagnostics in 1997 optical diagnostics in 1997
1980's experiments used narrow field photometers that often were pointed to the wrong place
and so we missed out on images like this, until ALIS and DASI came along.
Topside Z-mode effect and the radio Topside Z-mode effect and the radio windowwindow
Ashrafi, Kosch et al., work in progressAshrafi, Kosch et al., work in progress
Vertically localised Vertically localised strong strong backscatterbackscatter (range bins (range bins ca. 2 km apart)ca. 2 km apart)
Horizontally localised Horizontally localised strong strong backscatterbackscatter (antenna positions (antenna positions 11°° apart, 30s in time) apart, 30s in time)
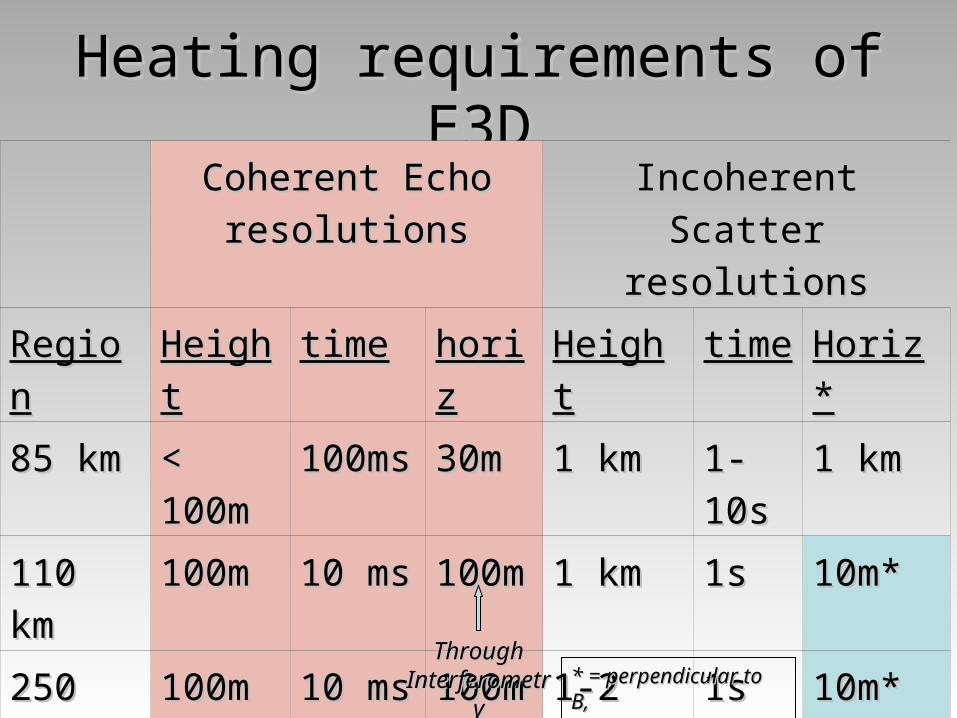
1-2 km1-2 km 1s1s 10m*10m*ThroughThroughInterferometryInterferometry * = perpendicular to B,* = perpendicular to B,
i.e. ca. 13i.e. ca. 13°tilt to south°tilt to south
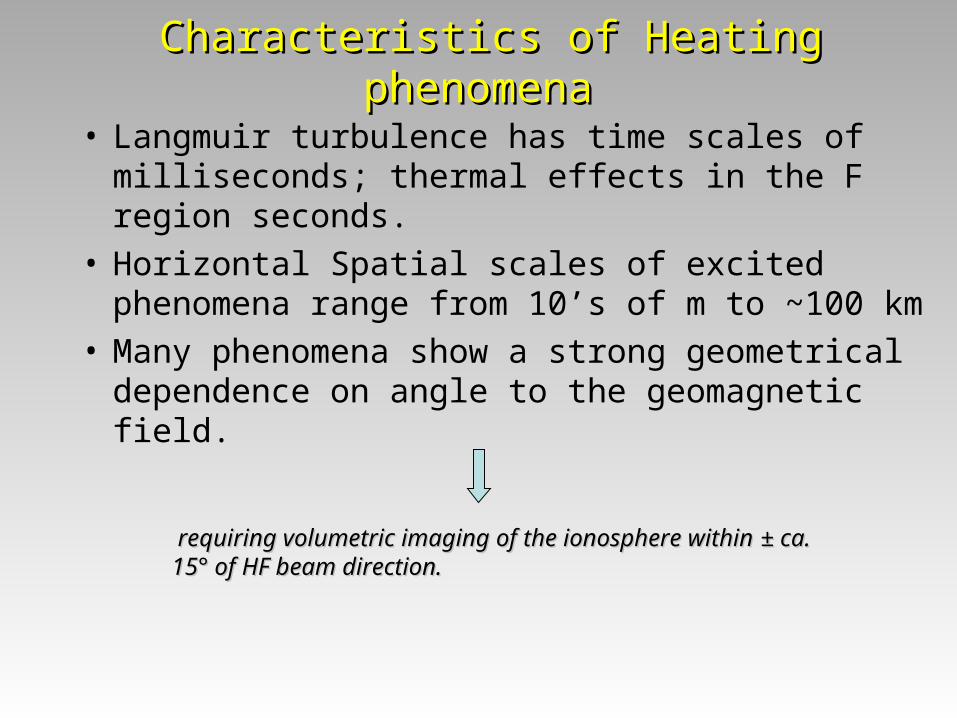
Characteristics of Heating phenomena Characteristics of Heating phenomena
• Langmuir turbulence has time scales of milliseconds; thermal effects in the F region seconds.
• Horizontal Spatial scales of excited phenomena range from 10’s of m to ~100 km
• Many phenomena show a strong geometrical dependence on angle to the geomagnetic field.
requiring volumetric imaging of the ionosphere within requiring volumetric imaging of the ionosphere within ±± ca. 15 ca. 15° ° of HF beam direction.of HF beam direction.
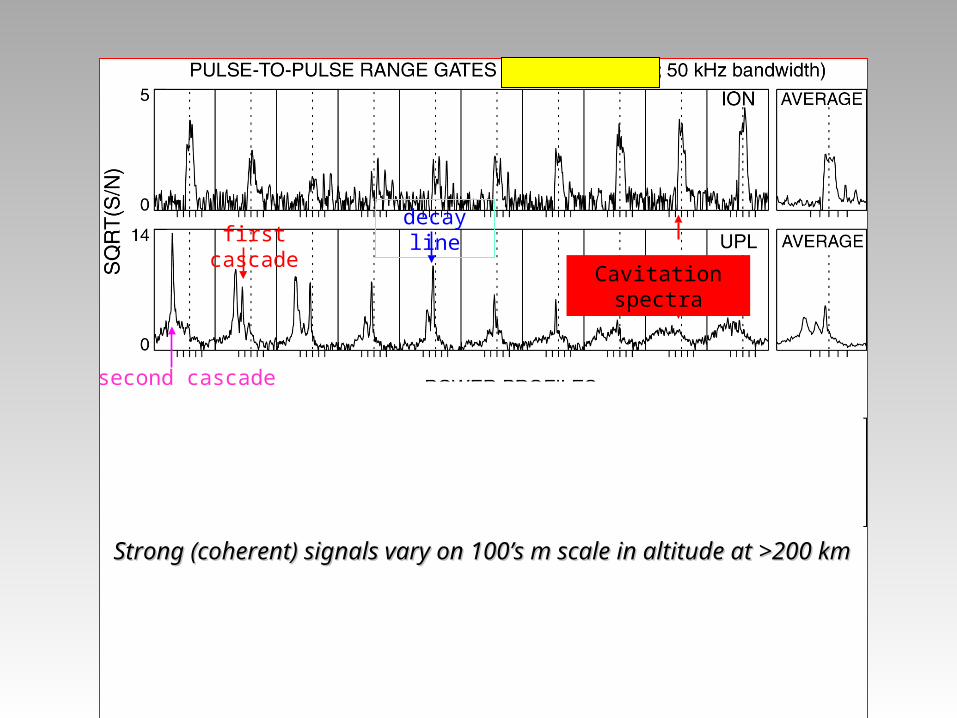
Strong (coherent) signals vary on 100’s m scale in altitude at >200 kmStrong (coherent) signals vary on 100’s m scale in altitude at >200 km
Cavitation spectra
decay linefirst cascade
second cascade
GYROHARMONIGYROHARMONICC
EffectsEffects
ca. 100 km N-S extentca. 100 km N-S extentcoherent backscatter, coherent backscatter, horizontal look. horizontal look.
Many F-region phenomena show a very Many F-region phenomena show a very strong dependence on the angle between strong dependence on the angle between the HF wave and the geomagnetic fieldthe HF wave and the geomagnetic field
For the E region (<200km) there has never been documented any such dependence.
Tokyo, 29-30 May 2007
Norway-Japan Symposium onPolar, Space, and Climate Research
Where should the E3D core be situated ?Where should the E3D core be situated ?
At/near Ramfjordmoen because:
* We can easily observe along B
* (Have common infrastructure)
Away from Ramfjordmoen because:
* Broad-band noise from faulty heater coaxial-lines can interfere with VHF measurements
* Power level changes from heater modulation can affect radar transmitter power
(Both these are merely 'annoyances' rather than 'science killers')
To measure field-alignedTo measure field-aligned
200-300 km
If the core is built elsewhere, should If the core is built elsewhere, should we:we:
move Heating or build a new heater ?move Heating or build a new heater ?
One could move the 30-yr old transmitters One could move the 30-yr old transmitters but antennas and feeds need rebuilding.but antennas and feeds need rebuilding.
If so, will we have the money ?If so, will we have the money ?