226
Anuario Estadístico de América Latina y el Caribe Statistical Yearbook for Latin America and the Caribbean 2012
| Date post: | 21-Jul-2016 |
| Category: |
Documents |
| Upload: | publicaciones-de-la-cepal-naciones-unidas |
| View: | 229 times |
| Download: | 0 times |

Anuario Estadístico de América Latina y el Caribe
Statistical Yearbook for Latin America and the Caribbean
2012
An
ua
rio
Esta
dís
tic
o d
e A
mé
rica
La
tina
y e
l Ca
ribe
Sta
tisti
ca
l Ye
arb
oo
k o
f Lat
in A
me
rica
and
th
e C
arib
be
an

CEPAL, Anuario Estadístico de América Latina y el Caribe, 2012 1
Anuario Estadístico de América Latina y el Caribe
Statistical Yearbook for Latin America and the Caribbean
2012

2 ECLAC, Statistical Yearbook for Latin America and the Caribbean, 2012
Publicación de las Naciones Unidas / United Nations PublicationISBN: 978-92-1-021088-1E-ISBN: 978-92-1-055364-3ISSN: 1014-0697LC/G.2554-PNúmero de venta / Sales No. E/S.13.II.G.1Copyright © Naciones Unidas, diciembre de 2012 / Copyright United Nations, December 2012Todos los derechos están reservados / All rights reservedImpreso en Santiago de Chile - Naciones Unidas / Printed in Santiago, Chile - United Nations
La autorización para reproducir total o parcialmente esta obra debe solicitarse al Secretario de la Junta de Publicaciones, Sede de las Naciones Unidas, Nueva York, N.Y. 10017, Estados Unidos. Los Estados miembros y sus instituciones gubernamentales pueden reproducir esta obra sin autorización previa. Solo se les solicita que mencionen la fuente e informen a las Naciones Unidas de tal reproducción.
Applications for the right to reproduce this work are welcomed and should be sent to the Secretary of the Publications Board, United Nations Headquarters, New York, N.Y. 10017, U.S.A. Member States and their governmental institutions may reproduce this work without prior authorization, but are requested to mention the source and inform the United Nations of such reproduction.
2012-867
Alicia BárcenaSecretaria Ejecutiva Executive Secretary
Antonio PradoSecretario Ejecutivo AdjuntoDeputy Executive Secretary
Luis BeccariaDirector de la División de Estadísticas
Chief, Statistics Division
Ricardo PérezDirector de la División de Documentos y Publicaciones
Chief, Documents and Publications Division
Publicación de las Naciones Unidas / United Nations PublicationNúmero de venta / Sales No. Copyright © Naciones Unidas, / Copyright United Nations, Todos los derechos están reservados / All rights reservedImpreso en Santiago de Chile - Naciones Unidas / Printed in Santiago, Chile - United Nations
CEPAL, Anuario Estadístico de América Latina y el Caribe, 2012 3
Notas explicativas
En los cuadros del presente Anuario se han empleado los siguientes signos:
El símbolo indica que el cuadro solo se presenta en versión electrónica.
Tres puntos (...) indican que los datos no están disponibles o no se pueden desglosar.
La raya (–) indica que la cantidad es nula o despreciable. El punto (.) se usa para separar los decimales.El guión (-) puesto entre cifras que expresen años, por
ejemplo 2000-2005, indica que se trata de todo el período considerado, ambos años inclusive.
Los totales que aparecen en los cuadros corresponden a la suma de los datos expuestos en cada uno de ellos, salvo indicación contraria.
Las cantidades que se refieren a agrupaciones de países corresponden al conjunto de países que aportaron información sobre ese período o año, salvo indicación contraria. Por esta razón, los años o períodos de una serie pueden no ser estrictamente comparables.
La sigla n.e.p. significa no especificado (o incluido) en otra parte.
La palabra “toneladas” indica toneladas métricas y la palabra “dólares” se refiere a dólares de los Estados Unidos, salvo indicación contraria.
Debido a que a veces se redondean las cifras, los datos parciales y los porcentajes presentados en los cuadros no siempre suman el total correspondiente.
En esta publicación, el término “país” se refiere a entidades territoriales, ya sean Estados conforme al derecho y a la práctica internacionales o territorios para los cuales se mantienen datos estadísticos en forma separada e independiente. La denominación “Antillas Neerlandesas” se refiere a la antigua entidad autónoma del Reino de los Países Bajos que se disolvió el 10 de octubre de 2010 e incluía los territorios de Curazao, San Martín, Bonaire, San Eustaquio y Saba.
Este documento debe citarse como:Comisión Económica para América Latina y el Caribe (CEPAL), Anuario Estadístico de América Latina y el Caribe, 2012 (LC/G.2554-P), Santiago de Chile, 2012. Publicación de las Naciones Unidas, N° de venta: E/S.13.II.G.1
Explanatory notes
The following symbols have been used in the tables in the Yearbook:
The symbol indicates that the table is available only in electronic form.
Three dots (...) indicate that data are not available or cannot be disaggregated.
A dash (–) indicates that the amount is zero or negligible.A point (.) is used to indicate decimals.Use of a hyphen (-) between years, e.g., 2000-2005,
indicates reference to the complete number of calendar years involved, including the beginning and end years.
The totals given in the tables correspond to the sum of the individual values shown in each table, unless otherwise stated.
The figures given for different groups of countries correspond to the set of reporting countries for that period or year, unless otherwise stated. For this reason, the years or periods in a series may not be strictly comparable.
The abbreviation n.e.s. indicates that the item in question is not elsewhere specified or included.
Reference to “tons” means metric tons, and to “dollars” means United States dollars, unless otherwise stated.
Individual figures and percentages in tables may not add up to the corresponding total, because of rounding.
In this publication, the term “country” is used to refer to territorial entities, whether these are States as understood by international law and practice or simply territories for which statistical data are maintained on a separate and independent basis. The denomination “Netherlands Antilles” refers to the former autonomous part of the Kingdom of the Netherlands which was dissolved on 10 October 2010 and includes the constituent entities of Curacao and Sint Maarten and the Netherlands municipalities of Bonaire, Sint Eustatius and Saba.
This document should be cited as:Economic Comission for Latin America and the Caribbean
(ECLAC), Statistical Yearbook for Latin America and the Caribbean, 2012 (LC/G.2554-P), Santiago, Chile, 2012. United Nations publication, Sales No. E/S.13.II.G.1
La elaboración de la presente edición del Anuario Estadístico fue coordinada por Luis Beccaria, Director de la División de Estadísticas de la Comisión Económica para América Latina y el Caribe (CEPAL), y Salvador Marconi, de la misma división. La información es fruto de la oportuna colaboración de los directores de los organismos de estadísticas y los presidentes de los bancos centrales de los países de la región. El estudio fue coordinado en el área de las estadísticas sociales y demográficas por Xavier Mancero con la colaboración de Claudio Moris. La coordinación del procesamiento de las estadísticas relativas a cuentas nacionales, balanza de pagos, comercio exterior y precios estuvo a cargo de Giovanni Savio, con la colaboración de Claudia de Camino, Carolina Cavada, Patricia Marchant, Salvador Marconi, María Alejandra Ovalle, Ernestina Pérez y Gustavo Villouta. La coordinación del área de estadísticas ambientales y de recursos naturales estuvo a cargo de Kristina Taboulchanas. Los aspectos de programación estuvieron a cargo de Iñaki González, Ricardo Vásquez y Gustavo Villouta; el diseño gráfico de la versión electrónica fue realizado por Pauline Stockins.
This year’s edition of the Statistical Yearbook was coordinated by Luis Beccaria, Chief of the Statistics Division of ECLAC, and Salvador Marconi. The information it contains was made available through the timely collaboration of the directors of statistical offices and the presidents of central banks in the countries of the region. The area of social and demographic statistics was coordinated by Xavier Mancero with the assistance of Claudio Moris. The processing of statistics relating to national accounts, balance of payments, foreign trade and prices was coordinated by Giovanni Savio, with assistance from Claudia de Camino, Carolina Cavada, Patricia Marchant, Salvador Marconi, María Alejandra Ovalle, Ernestina Pérez and Gustavo Villouta. The compilation of environmental and natural-resources statistics was coordinated by Kristina Taboulchanas. The tasks of programming were performed by Iñaki González, Ricardo Vásquez and Gustavo Villouta; the graphic design of the electronic version was prepared by Pauline Stockins.


CEPAL, Anuario Estadístico de América Latina y el Caribe, 2012 5
Índice / Contents
�Página
Page
Introducción / Introduction ........................................................................................................................................................... 19
1. Estadísticas sociales / Social statistics ..................................................................................................... 21
1.1 Población / Population .............................................................................................................................................................. 23 1.1.1 Población total / Total population ............................................................................................................................................................................ 23 1.1.2 Tasa de crecimiento de la población total, por quinquenios / Total population growth rate, by five-year periods .................................................. 24 1.1.3 Proyecciones de la población total, por quinquenios / Projected total population, by five-year periods................................................................. 25 1.1.4 Estructura de la población total, por grupos de edad / Structure of the total population, by age group .................................................................. 26 1.1.5 Relación de dependencia demográfica / Demographic dependency ratio ................................................................................................................ 27 1.1.6 Tasa de crecimiento anual de la población total, por grupos de edad / Annual growth rate of the total population, by age group ......................... 28 1.1.7 Tasa de natalidad, por quinquenios / Birth rate, by five-year periods ...................................................................................................................... 29 1.1.8 Tasa de mortalidad, por quinquenios / Mortality rate, by five-year periods ............................................................................................................. 30 1.1.9 Tasa global de fecundidad, por quinquenios / Total fertility rate, by five-year periods ........................................................................................... 31 1.1.10 Esperanza de vida al nacer según sexo, por quinquenios / Life expectancy at birth, by sex and five-year periods ................................................. 32 1.1.11 Porcentaje de población urbana / Percentage of urban population .......................................................................................................................... 33 1.1.12 Población en el área metropolitana principal / Population in the main metropolitan area ...................................................................................... 34 1.1.13 Tamaño medio de los hogares urbanos, según quintiles de ingreso / Urban households average size, by income quintile .................................... 35 1.1.14 Tipos de hogares urbanos, según sexo del jefe de hogar / Types of urban households, by sex of head of household .............................................. 36 1.1.15 Tipos de hogares urbanos, según nivel de ingreso per cápita del hogar, 2011 Types of urban households, by household per capita income level, 2011 ................................................................................................................ 37 1.1.16 Población total, por grupos de edad / Total population, by age group ..................................................................................................................... 1.1.17 Población masculina, por grupos de edad / Male population, by age group ............................................................................................................ 1.1.18 Población femenina, por grupos de edad / Female population, by age group .......................................................................................................... 1.1.19 Población en localidades de 20.000 y más habitantes y de 100.000 y más habitantes Population in localities with 20,000 or more and 100,000 or more inhabitants ..................................................................................................... 1.1.20 Población en las dos áreas metropolitanas principales / Population in the two main metropolitan areas ............................................................... 1.1.21 Población en hogares particulares, por tamaño del hogar / Population in private households, by size of household .............................................
1.2 Trabajo / Labour ............................................................................................................................................................................. 38 1.2.1 Población económicamente activa, por sexo / Economically active population, by sex .......................................................................................... 38 1.2.2 Tasa de participación en la actividad económica, por sexo / Economic participation rate, by sex ......................................................................... 39 1.2.3 Tasa de participación de la población urbana en la actividad económica, por sexo Economic participation rate of urban population, by sex ........................................................................................................................................ 40 1.2.4 Tasa de participación de la población urbana en la actividad económica, por sexo y grupos de edad, 2011 Economic participation rate of urban population, by sex and age group, 2011 ...................................................................................................... 41 1.2.5 Estructura de la población ocupada total, por sector de actividad económica Structure of the total employed population, by sector of economic activity ............................................................................................................ 42 1.2.6 Estructura de la población ocupada masculina, por sector de actividad económica Structure of the male employed population, by sector of economic activity ............................................................................................................ 1.2.7 Estructura de la población ocupada femenina, por sector de actividad económica Structure of the female employed population, by sector of economic activity ......................................................................................................... 1.2.8 Estructura de la población ocupada urbana total, por sector de actividad económica, 2011 Structure of the total urban employed population, by sector of economic activity, 2011 ........................................................................................ 43 1.2.9 Estructura de la población ocupada urbana masculina, por sector de actividad económica, 2011 Structure of the urban male employed population, by sector of economic activity, 2011 ........................................................................................ 1.2.10 Estructura de la población ocupada urbana femenina, por sector de actividad económica, 2011 Structure of the urban female employed population, by sector of economic activity, 2011 ..................................................................................... 1.2.11 Estructura de la población ocupada urbana total, por grupos ocupacionales, 2011 Structure of the total urban employed population, by occupational group, 2011 .................................................................................................... 44 1.2.12 Estructura de la población ocupada urbana masculina, por grupos ocupacionales, 2011 Structure of the urban male employed population, by occupational group, 2011 ................................................................................................... 1.2.13 Estructura de la población ocupada urbana femenina, por grupos ocupacionales, 2011 Structure of the urban female employed population, by occupational group, 2011 ................................................................................................ 1.2.14 Estructura de la población ocupada urbana total, por categoría ocupacional, 2011 Structure of the total urban employed population, by category of employment, 2011 ............................................................................................. 45 1.2.15 Estructura de la población ocupada urbana masculina, por categoría ocupacional, 2011 Structure of the male urban employed population, by category of employment, 2011 ............................................................................................ 1.2.16 Estructura de la población ocupada urbana femenina, por categoría ocupacional, 2011 Structure of the female urban employed population, by category of employment, 2011 ......................................................................................... 1.2.17 Tasa de desempleo / Unemployment rate ................................................................................................................................................................. 46 1.2.18 Tasa de desempleo abierto urbano, según sexo y grupos de edad, 2011 Urban open unemployment rate, by sex and age group, 2011 ................................................................................................................................. 47 1.2.19 Tasa de desempleo abierto urbano, según sexo y años de estudios, 2011 Urban open unemployment rate, by sex and years of schooling, 2011 .................................................................................................................... 48
1.3 Educación / Education .............................................................................................................................................................. 49 1.3.1 Tasa de alfabetización de las personas de 15 años y más de edad, por sexo / Literacy rate in the population aged 15 years and over, by sex ................ 49 1.3.2 Población urbana analfabeta, por sexo y grupos de edad, 2011 / Illiteracy in the urban population, by sex and age group, 2011 ......................... 50

6 ECLAC, Statistical Yearbook for Latin America and the Caribbean, 2012
1.3.3 Tasa neta de matrícula en el primer nivel de enseñanza / Net enrolment rate in first-level education ..................................................................... 51 1.3.4 Tasa neta de matrícula en el segundo nivel de enseñanza / Net enrolment rate in second-level education ............................................................. 52 1.3.5 Tasa bruta de matrícula en el tercer nivel de enseñanza / Gross enrolment rate in third-level education ................................................................ 53 1.3.6 Asistencia escolar en áreas urbanas, por quintiles de ingreso per cápita del hogar, según sexo y grupos de edad, 2011 School attendance in urban areas, by per capita household income quintile, by sex and age group, 2011 ............................................................ 54 1.3.7 Promedio de alumnos por maestro en el primer nivel de enseñanza Average number of pupils per teacher, in first-level education ................................................................................................................................ 55 1.3.8 Promedio de alumnos por maestro en el segundo nivel de enseñanza Average number of pupils per teacher, in second-level education ........................................................................................................................... 56 1.3.9 Gasto público en educación / Public expenditure on education ............................................................................................................................... 57 1.3.10 Matrícula en el primer nivel de enseñanza / Enrolment in first-level education....................................................................................................... 1.3.11 Matrícula en el segundo nivel de enseñanza / Enrolment in second-level education ............................................................................................... 1.3.12 Matrícula en el tercer nivel de enseñanza / Enrolment in third-level education ....................................................................................................... 1.3.13 Maestros en el primer nivel de enseñanza / Teachers in first-level education .......................................................................................................... 1.3.14 Maestros en el segundo nivel de enseñanza / Teachers in second-level education ..................................................................................................
1.4 Salud / Health .................................................................................................................................................................................. 58 1.4.1 Indicadores seleccionados de salud / Selected health indicators ............................................................................................................................ 58 1.4.2 Tasa de mortalidad infantil, por quinquenios, por sexo / Infant mortality rate, by sex, by five-year periods .......................................................... 59 1.4.3 Promedio de habitantes por médico / Average number of inhabitants per physician .............................................................................................. 60 1.4.4 Camas de hospital por cada 1.000 habitantes / Hospital beds per 1,000 inhabitants .............................................................................................. 61 1.4.5 Gasto público en salud / Public expenditure on health ............................................................................................................................................ 62 1.4.6 Médicos / Physicians ................................................................................................................................................................................................ 1.4.7 Camas de hospital / Hospital beds ............................................................................................................................................................................
1.5 Vivienda y servicios básicos / Housing and basic services ......................................................................... 63 1.5.1 Disponibilidad de servicios en las viviendas, en áreas urbanas y rurales / Services available in dwellings, urban and rural areas ...................... 63 1.5.2 Hogares por condición de tenencia de la vivienda, en áreas urbanas y rurales Occupied dwelling units, by type of tenancy, urban and rural areas ....................................................................................................................... 1.5.3 Población que utiliza fuentes mejoradas de abastecimiento de agua potable y que utiliza instalaciones de saneamiento mejoradas, en áreas urbanas y rurales / Population using an improved drinking water source and an improved sanitation facility, by urban and rural areas .......................................................................................................................................................................................... 64
1.6 Pobreza y distribución del ingreso / Poverty and income distribution .................................................. 65 1.6.1 Personas en situación de pobreza e indigencia, en áreas urbanas y rurales / Poor and indigent population, urban and rural areas ....... 65 1.6.2 Coeficiente de la brecha de pobreza e indigencia / Poverty and indigence gap coefficient ...................................................................................... 66 1.6.3 Distribución del ingreso de las personas, en áreas urbanas y rurales Distribution of national income, urban and rural areas .......................................................................................................................................... 67 1.6.4 Índice de Gini, en áreas urbanas y rurales / Gini coefficient, urban and rural areas ............................................................................................... 70
1.7 Género / Gender ........................................................................................................................................................................... 71 1.7.1 Relación de salarios entre los géneros, según años de estudios aprobados Gender wage ratio, by years of education completed .............................................................................................................................................. 71 1.7.2 Proporción de mujeres entre los empleados remunerados en el sector no agrícola Share of women in wage employment in the non-agricultural sector ...................................................................................................................... 72 1.7.3 Proporción de puestos ocupados por mujeres en el Parlamento Nacional Proportion of seats held by women in National Parliament .................................................................................................................................... 73 1.7.4 Índice de feminidad de la indigencia y de la pobreza, según zonas geográficas Femininity rate of indigence and poverty, by geographical area ............................................................................................................................. 74
2. Estadísticas económicas / Economic statistics ............................................................................... 75
2.1 Cuentas nacionales / National accounts ..................................................................................................................... 77 2.1.1 Cuentas nacionales de América Latina y el Caribe, en dólares National accounts of Latin America and the Caribbean, in dollars ........................................................................................ 77 2.1.1.1 América Latina y el Caribe: tasas de variación anual del producto interno bruto Latin America and the Caribbean: annual growth rates of gross domestic product ............................................................................................... 77 2.1.1.2 América Latina y el Caribe: tasas de variación anual del producto interno bruto por habitante Latin America and the Caribbean: annual growth rates of per capita gross domestic product .............................................................................. 78 2.1.1.3 América Latina y el Caribe: producto interno bruto total, a precios constantes de mercado Latin America and the Caribbean: gross domestic product, at constant market prices .......................................................................................... 79 2.1.1.4 América Latina y el Caribe: producto interno bruto por habitante, a precios constantes de mercado Latin America and the Caribbean: per capita gross domestic product, at constant market prices ........................................................................ 80 2.1.1.5 América Latina y el Caribe: producto interno bruto total, a precios corrientes de mercado Latin America and the Caribbean: gross domestic product, at current market prices ............................................................................................ 81 2.1.1.6 América Latina y el Caribe: producto interno bruto por habitante, a precios corrientes de mercado Latin America and the Caribbean: per capita gross domestic product, at current market prices .......................................................................... 82 2.1.1.7 América Latina y el Caribe: producto interno bruto por clase de actividad económica, a precios constantes de mercado Latin America and the Caribbean: gross domestic product, by kind of economic activity, at constant market prices ........................................... 83 2.1.1.8 América Latina y el Caribe: tasas de variación anual del producto interno bruto por clase de actividad económica Latin America and the Caribbean: annual growth rates of gross domestic product, by kind of economic activity ................................................ 83 2.1.1.9 América Latina: producto interno bruto por clase de actividad económica, a precios constantes de mercado Latin America: gross domestic product, by kind of economic activity, at constant market prices ........................................................................... 84 2.1.1.10 América Latina: tasas de variación anual del producto interno bruto por clase de actividad económica Latin America: annual growth rates of gross domestic product, by kind of economic activity ................................................................................ 84 2.1.1.11 El Caribe: producto interno bruto por clase de actividad económica, a precios constantes de mercado The Caribbean: gross domestic product, by kind of economic activity, at constant market prices .......................................................................... 85 2.1.1.12 El Caribe: tasas de variación del producto interno bruto por clase de actividad económica The Caribbean: growth rates of gross domestic product, by kind of economic activity ........................................................................................... 85

CEPAL, Anuario Estadístico de América Latina y el Caribe, 2012 7
2.1.1.13 América Latina y el Caribe: valor agregado de la agricultura, caza, silvicultura y pesca, a precios constantes de mercado Latin America and the Caribbean: aggregate value of agriculture, hunting, forestry and fishing, at constant market prices ................................ 2.1.1.14 América Latina y el Caribe: valor agregado de la explotación de minas y canteras, a precios constantes de mercado Latin America and the Caribbean: aggregate value of mining and quarrying, at constant market prices .............................................................. 2.1.1.15 América Latina y el Caribe: valor agregado de las industrias manufactureras, a precios constantes de mercado Latin America and the Caribbean: aggregate value of manufacturing, at constant market prices ......................................................................... 2.1.1.16 América Latina y el Caribe: valor agregado de los sectores de electricidad, gas y agua, a precios constantes de mercado Latin America and the Caribbean: aggregate value of the electricity, gas and water sectors, at constant market prices ...................................... 2.1.1.17 América Latina y el Caribe: valor agregado de la construcción, a precios constantes de mercado Latin America and the Caribbean: aggregate value of construction, at constant market prices ............................................................................ 2.1.1.18 América Latina y el Caribe: valor agregado del comercio al por mayor y al por menor, hoteles, bares y restaurantes, a precios constantes de mercado / Latin America and the Caribbean: aggregate value of wholesale and retail trade, hotels, bars and restaurants, at constant market prices ........................................................................................................................................... 2.1.1.19 América Latina y el Caribe: valor agregado del transporte, almacenamiento y comunicaciones, a precios constantes de mercado Latin America and the Caribbean: aggregate value of transport, storage and communications, at constant market prices .................................. 2.1.1.20 América Latina y el Caribe: valor agregado de los establecimientos financieros, seguros, bienes inmuebles y servicios prestados a las empresas, a precios constantes de mercado / Latin America and the Caribbean: aggregate value of finance, insurance, real estate and business services, at constant market prices .................................................................................................................. 2.1.1.21 América Latina y el Caribe: valor agregado de los servicios comunales, sociales y personales, a precios constantes de mercado Latin America and the Caribbean: aggregate value of community, social and personal services, at constant market prices ................................ 2.1.1.22 América Latina y el Caribe: valor agregado total de la actividad económica, a precios constantes de mercado Latin America and the Caribbean: total aggregate value of economic activity, at constant market prices ............................................................. 2.1.1.23 América Latina y el Caribe: producto interno bruto por clase de actividad económica, a precios corrientes de mercado Latin America and the Caribbean: gross domestic product, by kind of economic activity, at current market prices .............................................. 86 2.1.1.24 América Latina: producto interno bruto por clase de actividad económica, a precios corrientes de mercado Latin America: gross domestic product, by kind of economic activity, at current market prices ............................................................................. 86 2.1.1.25 El Caribe: producto interno bruto por clase de actividad económica, a precios corrientes de mercado The Caribbean: gross domestic product, by kind of economic activity, at current market prices ........................................................................... 87 2.1.1.26 América Latina y el Caribe: valor agregado de la agricultura, caza, silvicultura y pesca, a precios corrientes de mercado Latin America and the Caribbean: aggregate value of agriculture, hunting, forestry and fishing, at current market prices .................................. 2.1.1.27 América Latina y el Caribe: valor agregado de la explotación de minas y canteras, a precios corrientes de mercado Latin America and the Caribbean: aggregate value of mining and quarrying, at current market prices ................................................................ 2.1.1.28 América Latina y el Caribe: valor agregado de las industrias manufactureras, a precios corrientes de mercado Latin America and the Caribbean: aggregate value of manufacturing, at current market prices ........................................................................... 2.1.1.29 América Latina y el Caribe: valor agregado de los sectores de electricidad, gas y agua, a precios corrientes de mercado Latin America and the Caribbean: aggregate value of the electricity, gas and water sectors, at current market prices ........................................ 2.1.1.30 América Latina y el Caribe: valor agregado de la construcción, a precios corrientes de mercado Latin America and the Caribbean: aggregate value of construction, at current market prices ............................................................................... 2.1.1.31 América Latina y el Caribe: valor agregado del comercio al por mayor y al por menor, hoteles, bares y restaurantes, a precios corrientes de mercado / Latin America and the Caribbean: aggregate value of wholesale and retail trade, hotels, bars and restaurants, at current market prices ............................................................................................................................................. 2.1.1.32 América Latina y el Caribe: valor agregado del transporte, almacenamiento y comunicaciones, a precios corrientes de mercado Latin America and the Caribbean: aggregate value of transport, storage and communications, at current market prices .................................... 2.1.1.33 América Latina y el Caribe: valor agregado de los establecimientos financieros, seguros, bienes inmuebles y servicios prestados a las empresas, a precios corrientes de mercado / Latin America and the Caribbean: aggregate value of finance, insurance, real estate and business services, at current market prices ......................................................................................... 2.1.1.34 América Latina y el Caribe: valor agregado de los servicios comunales, sociales y personales, a precios corrientes de mercado Latin America and the Caribbean: aggregate value of community, social and personal services, at current market prices .................................. 2.1.1.35 América Latina y el Caribe: valor agregado total de la actividad económica, a precios corrientes de mercado Latin America and the Caribbean: aggregate value of economic activity, at current market prices ....................................................................... 2.1.1.36 América Latina: producto interno bruto por tipo de gasto, a precios constantes de mercado Latin America: gross domestic product, by type of expenditure, at constant market prices .................................................................................... 88 2.1.1.37 América Latina: tasas de variación anual del producto interno bruto por tipo de gasto, a precios constantes de mercado Latin America: annual growth rates of gross domestic product, by type of expenditure, at constant market prices ............................................... 88 2.1.1.38 América Latina y el Caribe: gasto de consumo final del gobierno general, a precios constantes de mercado Latin America and the Caribbean: final consumption expenditure by general government, at constant market prices ......................................... 2.1.1.39 América Latina y el Caribe: gasto privado de consumo final, a precios constantes de mercado Latin America and the Caribbean: private final consumption expenditure, at constant market prices ................................................................... 2.1.1.40 América Latina y el Caribe: variación de existencias, a precios constantes de mercado Latin America and the Caribbean: inventory changes, at constant market prices .................................................................................................. 2.1.1.41 América Latina y el Caribe: formación bruta de capital, a precios constantes de mercado Latin America and the Caribbean: gross capital formation, at constant market prices .......................................................................................... 2.1.1.42 América Latina y el Caribe: formación bruta de capital fijo, a precios constantes de mercado Latin America and the Caribbean: fixed gross capital formation, at constant market prices ................................................................................. 2.1.1.43 América Latina y el Caribe: formación bruta de capital fijo en construcción, a precios constantes de mercado Latin America and the Caribbean: fixed gross capital formation in construction, at constant market prices ........................................................ 2.1.1.44 América Latina y el Caribe: formación bruta de capital fijo en maquinaria, equipos y otros, a precios constantes de mercado Latin America and the Caribbean: fixed gross capital formation in machinery, equipment and other goods, at constant market prices .................... 2.1.1.45 América Latina y el Caribe: exportaciones de bienes y servicios, a precios constantes de mercado Latin America and the Caribbean: exports of goods and services, at constant market prices ................................................................................ 2.1.1.46 América Latina y el Caribe: importaciones de bienes y servicios, a precios constantes de mercado Latin America and the Caribbean: imports of goods and services, at constant market prices ................................................................................ 2.1.1.47 América Latina y el Caribe: producto interno bruto por tipo de gasto, a precios corrientes de mercado Latin America and the Caribbean: gross domestic product, by type of expenditure, at current market prices ....................................................... 2.1.1.48 América Latina: producto interno bruto por tipo de gasto, a precios corrientes de mercado Latin America: gross domestic product, by type of expenditure, at current market prices ...................................................................................... 88 2.1.1.49 EL Caribe: producto interno bruto por tipo de gasto, a precios corrientes de mercado The Caribbean: gross domestic product, by type of expenditure, at current market prices ..................................................................................... 2.1.1.50 América Latina y el Caribe: gasto de consumo final del gobierno general, a precios corrientes de mercado Latin America and the Caribbean: final consumption expenditure by general government, at current market prices ...........................................

8 ECLAC, Statistical Yearbook for Latin America and the Caribbean, 2012
2.1.1.51 América Latina y el Caribe: gasto privado de consumo final, a precios corrientes de mercado Latin America and the Caribbean: private final consumption expenditure, at current market prices .................................................................... 2.1.1.52 América Latina y el Caribe: variación de existencias, a precios corrientes de mercado Latin America and the Caribbean: inventory changes, at current market prices .................................................................................................... 2.1.1.53 América Latina y el Caribe: formación bruta de capital, a precios corrientes de mercado Latin America and the Caribbean: gross capital formation, at current market prices ............................................................................................ 2.1.1.54 América Latina y el Caribe: formación bruta de capital fijo, a precios corrientes de mercado Latin America and the Caribbean: fixed gross capital formation, at current market prices ................................................................................... 2.1.1.55 América Latina y el Caribe: formación bruta de capital fijo en construcción, a precios corrientes de mercado Latin America and the Caribbean: fixed gross capital formation in construction, at current market prices .......................................................... 2.1.1.56 América Latina y el Caribe: formación bruta de capital fijo en maquinaria, equipos y otros, a precios corrientes de mercado Latin America and the Caribbean: fixed gross capital formation in machinery, equipment, and other goods, at current market prices ................... 2.1.1.57 América Latina y el Caribe: exportaciones de bienes y servicios, a precios corrientes de mercado Latin America and the Caribbean: exports of goods and services, at current market prices .................................................................................. 2.1.1.58 América Latina y el Caribe: importaciones de bienes y servicios, a precios corrientes de mercado Latin America and the Caribbean: imports of goods and services, at current market prices.................................................................................. 2.1.1.59 América Latina y el Caribe: ingreso nacional bruto disponible, a precios constantes Latin America and the Caribbean: disposable gross national income, at constant prices ...................................................................................... 89 2.1.1.60 América Latina y el Caribe: ingreso nacional bruto disponible, a precios corrientes Latin America and the Caribbean: disposable gross national income, at current prices ........................................................................................ 90 2.1.1.61 América Latina: pagos por factores al resto del mundo, a precios corrientes Latin America: factor payments to the rest of the world, at current prices.............................................................................................................. 2.1.1.62 América Latina: transferencias corrientes netas procedentes del resto del mundo, a precios corrientes Latin America: net current transfers from the rest of the world, at current prices .................................................................................................. 2.1.1.63 América Latina y el Caribe: ahorro nacional, a precios corrientes Latin America and the Caribbean: national savings, at current prices ................................................................................................................... 91 2.1.1.64 América Latina: financiamiento de la formación interna bruta de capital, a precios corrientes Latin America: financing of gross domestic capital formation, at current prices .................................................................................................... 92 2.1.1.65 América Latina y el Caribe: grado de apertura de la economía, a precios corrientes Latin America and the Caribbean: degree of openness of the economy, at current prices ...................................................................................... 93 2.1.1.66 América Latina y el Caribe: brecha externa, a precios corrientes Latin America and the Caribbean: external debt, at current prices ........................................................................................................................ 94 2.1.1.67 América Latina y el Caribe: deflactor implícito del producto interno bruto Latin America and the Caribbean: implicit GDP deflator ....................................................................................................................................... 95 2.1.1.68 América Latina y el Caribe: discrepancia generada en el cálculo del producto interno bruto por clase de actividad económica, a precios constantes de mercado / Latin America and the Caribbean: difference in the calculation of gross domestic product by kind of economic activity, at constant market prices ........................................................................................................................................... 2.1.1.69 América Latina y el Caribe: discrepancia generada en el cálculo del producto interno bruto por clase de actividad económica, a precios corrientes de mercado / Latin America and the Caribbean: difference in the calculation of gross domestic product by kind of economic activity, at current market prices ............................................................................................................................................. 2.1.1.70 América Latina y el Caribe: discrepancia generada en el cálculo del producto interno bruto por tipo de gasto, a precios constantes de mercado / Latin America and the Caribbean: difference in the calculation of gross domestic product by type of expenditure, at constant market prices ........................................................................................................................ 2.1.1.71 América Latina y el Caribe: discrepancia generada en el cálculo del producto interno bruto por tipo de gasto, a precios corrientes de mercado / Latin America and the Caribbean: difference in the calculation of gross domestic product by type of expenditure, at current market prices .......................................................................................................................... 2.1.1.72 América Latina: producto interno bruto a precios constantes de 2005, tasas de variación media anual Latin America: gross domestic product at constant 2005 prices, average annual rates of variation ...................................................................... 2.1.1.73 América Latina: producto interno bruto por habitante a precios constantes de 2005, tasas de variación media anual Latin America: per capita gross domestic product at constant 2005 prices, average annual rates of variation ..................................................... 2.1.1.74 América Latina: consumo total a precios constantes de 2005, tasas de variación media anual Latin America: total consumption at constant 2005 prices, average annual rates of variation .............................................................................. 2.1.1.75 América Latina: formación bruta de capital fijo a precios constantes de 2005, tasas de variación media anual Latin America: gross fixed capital formation at constant 2005 prices, average annual rates of variation ............................................................. 2.1.2 Cuentas nacionales de América Latina y el Caribe por país, en moneda nacional National accounts of Latin America and the Caribbean by country, in local currency ...................................................... 2.1.2.1 Antigua y Barbuda / Antigua and Barbuda ............................................................................................................................................................ 2.1.2.1.1 Antigua y Barbuda: producto interno bruto por tipo de gasto, a precios de mercado Antigua and Barbuda: gross domestic product, by type of expenditure, at market prices ....................................................................................... 2.1.2.1.3 Antigua y Barbuda: producto interno bruto por clase de actividad económica, a precios corrientes Antigua and Barbuda: gross domestic product, by kind of economic activity, at current prices ............................................................................. 2.1.2.1.4 Antigua y Barbuda: producto interno bruto por clase de actividad económica, a precios constantes Antigua and Barbuda: gross domestic product, by kind of economic activity, at constant prices ........................................................................... 2.1.2.2 Argentina ................................................................................................................................................................................................................. 2.1.2.2.1 Argentina: producto interno bruto por tipo de gasto, a precios corrientes Argentina: gross domestic product, by type of expenditure, at current prices ......................................................................................................... 2.1.2.2.2 Argentina: producto interno bruto por tipo de gasto, a precios constantes Argentina: gross domestic product, by type of expenditure, at constant prices ....................................................................................................... 2.1.2.2.3 Argentina: producto interno bruto por clase de actividad económica, a precios corrientes Argentina: gross domestic product, by kind of economic activity, at current prices ................................................................................................ 2.1.2.2.4 Argentina: producto interno bruto por clase de actividad económica, a precios constantes Argentina: gross domestic product, by kind of economic activity, at constant prices .............................................................................................. 2.1.2.2.5 Argentina: relaciones entre los principales agregados de cuentas nacionales Argentina: relationships among main national accounts aggregates ...................................................................................................................... 2.1.2.3 Bahamas ................................................................................................................................................................................................................... 2.1.2.3.1 Bahamas: producto interno bruto por tipo de gasto, a precios corrientes Bahamas: gross domestic product, by type of expenditure, at current prices .......................................................................................................... 2.1.2.3.2 Bahamas: producto interno bruto por tipo de gasto, a precios constantes Bahamas: gross domestic product, by type of expenditure, at constant prices ........................................................................................................

CEPAL, Anuario Estadístico de América Latina y el Caribe, 2012 9
2.1.2.3.3 Bahamas: producto interno bruto por clase de actividad económica, a precios corrientes Bahamas: gross domestic product, by kind of economic activity, at current prices ................................................................................................. 2.1.2.3.4 Bahamas: producto interno bruto por clase de actividad económica, a precios constantes Bahamas: gross domestic product, by kind of economic activity, at constant prices ............................................................................................... 2.1.2.4 Barbados ................................................................................................................................................................................................................... 2.1.2.4.1 Barbados: producto interno bruto por tipo de gasto, a precios corrientes Barbados: gross domestic product, by type of expenditure, at current prices .......................................................................................................... 2.1.2.4.3 Barbados: producto interno bruto por clase de actividad económica, a precios corrientes Barbados: gross domestic product, by kind of economic activity, at current prices ................................................................................................ 2.1.2.4.4 Barbados: producto interno bruto por clase de actividad económica, a precios constantes Barbados: gross domestic product, by kind of economic activity, at constant prices .............................................................................................. 2.1.2.5 Belice / Belize ........................................................................................................................................................................................................... 2.1.2.5.1 Belice: producto interno bruto por tipo de gasto, a precios corrientes Belize: gross domestic product, by type of expenditure, at current prices ............................................................................................................... 2.1.2.5.2 Belice: producto interno bruto por tipo de gasto, a precios constantes Belize: gross domestic product, by type of expenditure, at constant prices ............................................................................................................. 2.1.2.5.3 Belice: producto interno bruto por clase de actividad económica, a precios corrientes Belize: gross domestic product, by kind of economic activity, at current prices ...................................................................................................... 2.1.2.5.4 Belice: producto interno bruto por clase de actividad económica, a precios constantes Belize: gross domestic product, by kind of economic activity, at constant prices .................................................................................................... 2.1.2.6 Bolivia (Estado Plurinacional de) / Bolivia (Plurinational State of) ........................................................................................................................ 2.1.2.6.1 Bolivia (Estado Plurinacional de): producto interno bruto por tipo de gasto, a precios corrientes Bolivia (Plurinational State of): gross domestic product, by type of expenditure, at current prices ....................................................................... 2.1.2.6.2 Bolivia (Estado Plurinacional de): producto interno bruto por tipo de gasto, a precios constantes Bolivia (Plurinational State of): gross domestic product, by type of expenditure, at constant prices ..................................................................... 2.1.2.6.3 Bolivia (Estado Plurinacional de): producto interno bruto por clase de actividad económica, a precios corrientes Bolivia (Plurinational State of): gross domestic product, by kind of economic activity, at current prices .............................................................. 2.1.2.6.4 Bolivia (Estado Plurinacional de): producto interno bruto por clase de actividad económica, a precios constantes Bolivia (Plurinational State of): gross domestic product, by kind of economic activity, at constant prices ............................................................ 2.1.2.6.5 Bolivia (Estado Plurinacional de): relaciones entre los principales agregados de cuentas nacionales Bolivia (Plurinational State of): relationships among main national accounts aggregates .................................................................................... 2.1.2.6.6 Bolivia (Estado Plurinacional de): ingresos y gastos de los hogares Bolivia (Plurinational State of): income and expenditure of households ................................................................................................................. 2.1.2.6.7 Bolivia (Estado Plurinacional de): ingresos y gastos del gobierno general Bolivia (Plurinational State of): income and expenditure of general government ................................................................................................... 2.1.2.7 Brasil / Brazil ........................................................................................................................................................................................................... 2.1.2.7.1 Brasil: producto interno bruto por tipo de gasto, a precios corrientes Brazil: gross domestic product, by type of expenditure, at current prices ............................................................................................................... 2.1.2.7.2 Brasil: producto interno bruto por tipo de gasto, a precios constantes Brazil: gross domestic product, by type of expenditure, at constant prices.............................................................................................................. 2.1.2.7.3 Brasil: producto interno bruto por clase de actividad económica, a precios corrientes Brazil: gross domestic product, by kind of economic activity, at current prices ...................................................................................................... 2.1.2.7.4 Brasil: producto interno bruto por clase de actividad económica, a precios constantes Brazil: gross domestic product, by kind of economic activity, at constant prices .................................................................................................... 2.1.2.7.5 Brasil: relaciones entre los principales agregados de cuentas nacionales Brazil: relationships among main national accounts aggregates............................................................................................................................. 2.1.2.7.6 Brasil: ingresos y gastos de los hogares Brazil: income and expenditure of households ......................................................................................................................................................... 2.1.2.7.7 Brasil: ingresos y gastos del gobierno general Brazil: income and expenditure of general government ........................................................................................................................................... 2.1.2.8 Chile ......................................................................................................................................................................................................................... 2.1.2.8.1 Chile: producto interno bruto por tipo de gasto, a precios corrientes Chile: gross domestic product, by type of expenditure, at current prices ................................................................................................................ 2.1.2.8.2 Chile: producto interno bruto por tipo de gasto, a precios constantes Chile: gross domestic product, by type of expenditure, at constant prices ............................................................................................................... 2.1.2.8.3 Chile: producto interno bruto por clase de actividad económica, a precios corrientes Chile: gross domestic product, by kind of economic activity, at current prices ....................................................................................................... 2.1.2.8.4 Chile: producto interno bruto por clase de actividad económica, a precios constantes Chile: gross domestic product, by kind of economic activity, at constant prices ..................................................................................................... 2.1.2.8.5 Chile: relaciones entre los principales agregados de cuentas nacionales Chile: relationships among main national accounts aggregates .............................................................................................................................. 2.1.2.8.6 Chile: ingresos y gastos de los hogares Chile: income and expenditure of households .......................................................................................................................................................... 2.1.2.8.7 Chile: ingresos y gastos del gobierno general Chile: income and expenditure of general government ............................................................................................................................................ 2.1.2.9 Colombia .................................................................................................................................................................................................................. 2.1.2.9.1 Colombia: producto interno bruto por tipo de gasto, a precios corrientes Colombia: gross domestic product, by type of expenditure, at current prices ......................................................................................................... 2.1.2.9.2 Colombia: producto interno bruto por tipo de gasto, a precios constantes Colombia: gross domestic product, by type of expenditure, at constant prices ....................................................................................................... 2.1.2.9.3 Colombia: producto interno bruto por clase de actividad económica, a precios corrientes Colombia: gross domestic product, by kind of economic activity, at current prices ................................................................................................ 2.1.2.9.4 Colombia: producto interno bruto por clase de actividad económica, a precios constantes Colombia: gross domestic product, by kind of economic activity, at constant prices .............................................................................................. 2.1.2.9.5 Colombia: relaciones entre los principales agregados de cuentas nacionales Colombia: relationships among main national accounts aggregates ...................................................................................................................... 2.1.2.9.6 Colombia: ingresos y gastos de los hogares Colombia: income and expenditure of households ................................................................................................................................................... 2.1.2.9.7 Colombia: ingresos y gastos del gobierno general Colombia: income and expenditure of general government .....................................................................................................................................

10 ECLAC, Statistical Yearbook for Latin America and the Caribbean, 2012
2.1.2.10 Costa Rica ................................................................................................................................................................................................................. 2.1.2.10.1 Costa Rica: producto interno bruto por tipo de gasto, a precios corrientes Costa Rica: gross domestic product, by type of expenditure, at current prices ....................................................................................................... 2.1.2.10.2 Costa Rica: producto interno bruto por tipo de gasto, a precios constantes Costa Rica: gross domestic product, by type of expenditure, at constant prices ...................................................................................................... 2.1.2.10.3 Costa Rica: producto interno bruto por clase de actividad económica, a precios corrientes Costa Rica: gross domestic product, by kind of economic activity, at current prices .............................................................................................. 2.1.2.10.4 Costa Rica: producto interno bruto por clase de actividad económica, a precios constantes Costa Rica: gross domestic product, by kind of economic activity, at constant prices ............................................................................................ 2.1.2.10.5 Costa Rica: relaciones entre los principales agregados de cuentas nacionales Costa Rica: relationships among main national accounts aggregates ..................................................................................................................... 2.1.2.10.7 Costa Rica: ingresos y gastos del gobierno general Costa Rica: income and expenditure of general government ................................................................................................................................... 2.1.2.11 Cuba ......................................................................................................................................................................................................................... 2.1.2.11.1 Cuba: producto interno bruto por tipo de gasto, a precios corrientes Cuba: gross domestic product, by type of expenditure, at current prices ................................................................................................................ 2.1.2.11.2 Cuba: producto interno bruto por tipo de gasto, a precios constantes Cuba: gross domestic product, by type of expenditure, at constant prices ............................................................................................................... 2.1.2.11.3 Cuba: producto interno bruto por clase de actividad económica, a precios corrientes Cuba: gross domestic product, by kind of economic activity, at current prices ....................................................................................................... 2.1.2.11.4 Cuba: producto interno bruto por clase de actividad económica, a precios constantes Cuba: gross domestic product, by kind of economic activity, at constant prices ..................................................................................................... 2.1.2.12 Dominica .................................................................................................................................................................................................................. 2.1.2.12.1 Dominica: producto interno bruto por tipo de gasto, a precios corrientes Dominica: gross domestic product, by type of expenditure, at current prices ......................................................................................................... 2.1.2.12.3 Dominica: producto interno bruto por clase de actividad económica, a precios corrientes Dominica: gross domestic product, by kind of economic activity, at current prices ................................................................................................ 2.1.2.12.4 Dominica: producto interno bruto por clase de actividad económica, a precios constantes Dominica: gross domestic product, by kind of economic activity, at constant prices .............................................................................................. 2.1.2.12.5 Dominica: relaciones entre los principales agregados de cuentas nacionales Dominica: relationships among main national accounts aggregates ...................................................................................................................... 2.1.2.13 Ecuador .................................................................................................................................................................................................................... 2.1.2.13.1 Ecuador: producto interno bruto por tipo de gasto, a precios corrientes Ecuador: gross domestic product, by type of expenditure, at current prices ........................................................................................................... 2.1.2.13.2 Ecuador: producto interno bruto por tipo de gasto, a precios constantes Ecuador: gross domestic product, by type of expenditure, at constant prices ......................................................................................................... 2.1.2.13.3 Ecuador: producto interno bruto por clase de actividad económica, a precios corrientes Ecuador: gross domestic product, by kind of economic activity, at current prices .................................................................................................. 2.1.2.13.4 Ecuador: producto interno bruto por clase de actividad económica, a precios constantes Ecuador: gross domestic product, by kind of economic activity, at constant prices ................................................................................................ 2.1.2.13.5 Ecuador: relaciones entre los principales agregados de cuentas nacionales Ecuador: relationships among main national accounts aggregates ........................................................................................................................ 2.1.2.13.6 Ecuador: ingresos y gastos de los hogares Ecuador: income and expenditure of households ..................................................................................................................................................... 2.1.2.13.7 Ecuador: ingresos y gastos del gobierno general Ecuador: income and expenditure of general government ....................................................................................................................................... 2.1.2.14 El Salvador ............................................................................................................................................................................................................... 2.1.2.14.1 El Salvador: producto interno bruto por tipo de gasto, a precios corrientes El Salvador: gross domestic product, by type of expenditure, at current prices ...................................................................................................... 2.1.2.14.2 El Salvador: producto interno bruto por tipo de gasto, a precios constantes El Salvador: gross domestic product, by type of expenditure, at constant prices .................................................................................................... 2.1.2.14.3 El Salvador: producto interno bruto por clase de actividad económica, a precios corrientes El Salvador: gross domestic product, by kind of economic activity, at current prices ............................................................................................. 2.1.2.14.4 El Salvador: producto interno bruto por clase de actividad económica, a precios constantes El Salvador: gross domestic product, by kind of economic activity, at constant prices ........................................................................................... 2.1.2.14.5 El Salvador: relaciones entre los principales agregados de cuentas nacionales El Salvador: relationships among main national accounts aggregates ................................................................................................................... 2.1.2.15 Granada / Grenada .................................................................................................................................................................................................. 2.1.2.15.1 Granada: producto interno bruto por tipo de gasto, a precios corrientes Grenada: gross domestic product, by type of expenditure, at current prices ........................................................................................................... 2.1.2.15.3 Granada: producto interno bruto por clase de actividad económica, a precios corrientes Grenada: gross domestic product, by kind of economic activity, at current prices .................................................................................................. 2.1.2.15.4 Granada: producto interno bruto por clase de actividad económica, a precios constantes Grenada: gross domestic product, by kind of economic activity, at constant prices ................................................................................................ 2.1.2.16 Guatemala ................................................................................................................................................................................................................. 2.1.2.16.1 Guatemala: producto interno bruto por tipo de gasto, a precios corrientes Guatemala: gross domestic product, by type of expenditure, at current prices ....................................................................................................... 2.1.2.16.2 Guatemala: producto interno bruto por tipo de gasto, a precios constantes Guatemala: gross domestic product, by type of expenditure, at constant prices ..................................................................................................... 2.1.2.16.3 Guatemala: producto interno bruto por clase de actividad económica, a precios corrientes Guatemala: gross domestic product, by kind of economic activity, at current prices .............................................................................................. 2.1.2.16.4 Guatemala: producto interno bruto por clase de actividad económica, a precios constantes Guatemala: gross domestic product, by kind of economic activity, at constant prices ............................................................................................ 2.1.2.17 Guyana ..................................................................................................................................................................................................................... 2.1.2.17.1 Guyana: producto interno bruto por tipo de gasto, a precios corrientes Guyana: gross domestic product, by type of expenditure, at current prices............................................................................................................. 2.1.2.17.2 Guyana: producto interno bruto por tipo de gasto, a precios constantes Guyana: gross domestic product, by type of expenditure, at constant prices ........................................................................................................... 2.1.2.17.3 Guyana: producto interno bruto por clase de actividad económica, a precios corrientes Guyana: gross domestic product, by kind of economic activity, at current prices ...................................................................................................

CEPAL, Anuario Estadístico de América Latina y el Caribe, 2012 11
2.1.2.17.4 Guyana: producto interno bruto por clase de actividad económica, a precios constantes Guyana: gross domestic product, by kind of economic activity, at constant prices ................................................................................................. 2.1.2.17.5 Guyana: relaciones entre los principales agregados de cuentas nacionales Guyana: relationships among main national accounts aggregates .......................................................................................................................... 2.1.2.18 Haití / Haiti .............................................................................................................................................................................................................. 2.1.2.18.1 Haití: producto interno bruto por tipo de gasto, a precios corrientes Haiti: gross domestic product, by type of expenditure, at current prices ................................................................................................................. 2.1.2.18.2 Haití: producto interno bruto por tipo de gasto, a precios constantes Haiti: gross domestic product, by type of expenditure, at constant prices ............................................................................................................... 2.1.2.18.3 Haití: producto interno bruto por clase de actividad económica, a precios corrientes Haiti: gross domestic product, by kind of economic activity, at current prices ....................................................................................................... 2.1.2.18.4 Haití: producto interno bruto por clase de actividad económica, a precios constantes Haiti: gross domestic product, by kind of economic activity, at constant prices...................................................................................................... 2.1.2.19 Honduras .................................................................................................................................................................................................................. 2.1.2.19.1 Honduras: producto interno bruto por tipo de gasto, a precios corrientes Honduras: gross domestic product, by type of expenditure, at current prices ......................................................................................................... 2.1.2.19.2 Honduras: producto interno bruto por tipo de gasto, a precios constantes Honduras: gross domestic product, by type of expenditure, at constant prices ....................................................................................................... 2.1.2.19.3 Honduras: producto interno bruto por clase de actividad económica, a precios corrientes Honduras: gross domestic product, by kind of economic activity, at current prices ................................................................................................ 2.1.2.19.4 Honduras: producto interno bruto por clase de actividad económica, a precios constantes Honduras: gross domestic product, by kind of economic activity, at constant prices .............................................................................................. 2.1.2.19.5 Honduras: relaciones entre los principales agregados de cuentas nacionales Honduras: relationships among main national accounts aggregates ...................................................................................................................... 2.1.2.19.6 Honduras: ingresos y gastos de los hogares Honduras: income and expenditure of households ................................................................................................................................................... 2.1.2.19.7 Honduras: ingresos y gastos del gobierno general Honduras: income and expenditure of general government ..................................................................................................................................... 2.1.2.20 Jamaica .................................................................................................................................................................................................................... 2.1.2.20.1 Jamaica: producto interno bruto por tipo de gasto, a precios corrientes Jamaica: gross domestic product, by type of expenditure, at current prices ............................................................................................................ 2.1.2.20.2 Jamaica: producto interno bruto por tipo de gasto, a precios constantes Jamaica: gross domestic product, by type of expenditure, at constant prices .......................................................................................................... 2.1.2.20.3 Jamaica: producto interno bruto por clase de actividad económica, a precios corrientes Jamaica: gross domestic product, by kind of economic activity, at current prices .................................................................................................. 2.1.2.20.4 Jamaica: producto interno bruto por clase de actividad económica, a precios constantes Jamaica: gross domestic product, by kind of economic activity, at constant prices ................................................................................................ 2.1.2.20.5 Jamaica: relaciones entre los principales agregados de cuentas nacionales Jamaica: relationships among main national accounts aggregates ......................................................................................................................... 2.1.2.21 México / Mexico ...................................................................................................................................................................................................... 2.1.2.21.1 México: producto interno bruto por tipo de gasto, a precios corrientes Mexico: gross domestic product, by type of expenditure, at current prices ............................................................................................................. 2.1.2.21.2 México: producto interno bruto por tipo de gasto, a precios constantes Mexico: gross domestic product, by type of expenditure, at constant prices............................................................................................................ 2.1.2.21.3 México: producto interno bruto por clase de actividad económica, a precios corrientes Mexico: gross domestic product, by kind of economic activity, at current prices .................................................................................................... 2.1.2.21.4 México: producto interno bruto por clase de actividad económica, a precios constantes Mexico: gross domestic product, by kind of economic activity, at constant prices .................................................................................................. 2.1.2.21.5 México: relaciones entre los principales agregados de cuentas nacionales Mexico: relationships among main national accounts aggregates ........................................................................................................................... 2.1.2.21.6 México: ingresos y gastos de los hogares Mexico: income and expenditure of households ....................................................................................................................................................... 2.1.2.21.7 México: ingresos y gastos del gobierno general Mexico: income and expenditure of general government ......................................................................................................................................... 2.1.2.22 Nicaragua ................................................................................................................................................................................................................. 2.1.2.22.1 Nicaragua: producto interno bruto por tipo de gasto, a precios corrientes Nicaragua: gross domestic product, by type of expenditure, at current prices ........................................................................................................ 2.1.2.22.2 Nicaragua: producto interno bruto por tipo de gasto, a precios constantes Nicaragua: gross domestic product, by type of expenditure, at constant prices ...................................................................................................... 2.1.2.22.3 Nicaragua: producto interno bruto por clase de actividad económica, a precios corrientes Nicaragua: gross domestic product, by kind of economic activity, at current prices ............................................................................................... 2.1.2.22.4 Nicaragua: producto interno bruto por clase de actividad económica, a precios constantes Nicaragua: gross domestic product, by kind of economic activity, at constant prices ............................................................................................. 2.1.2.22.5 Nicaragua: relaciones entre los principales agregados de cuentas nacionales Nicaragua: relationships among main national accounts aggregates ..................................................................................................................... 2.1.2.23 Panamá / Panama ..................................................................................................................................................................................................... 2.1.2.23.1 Panamá: producto interno bruto por tipo de gasto, a precios corrientes Panama: gross domestic product, by type of expenditure, at current prices ............................................................................................................ 2.1.2.23.2 Panamá: producto interno bruto por tipo de gasto, a precios constantes Panama: gross domestic product, by type of expenditure, at constant prices .......................................................................................................... 2.1.2.23.3 Panamá: producto interno bruto por clase de actividad económica, a precios corrientes Panama: gross domestic product, by kind of economic activity, at current prices ................................................................................................... 2.1.2.23.4 Panamá: producto interno bruto por clase de actividad económica, a precios constantes Panama: gross domestic product, by kind of economic activity, at constant prices ................................................................................................. 2.1.2.23.5 Panamá: relaciones entre los principales agregados de cuentas nacionales Panama: relationships among main national accounts aggregates ......................................................................................................................... 2.1.2.23.7 Panamá: ingresos y gastos del gobierno general Panama: income and expenditure of general government........................................................................................................................................

12 ECLAC, Statistical Yearbook for Latin America and the Caribbean, 2012
2.1.2.24 Paraguay ................................................................................................................................................................................................................... 2.1.2.24.1 Paraguay: producto interno bruto por tipo de gasto, a precios corrientes Paraguay: gross domestic product, by type of expenditure, at current prices .......................................................................................................... 2.1.2.24.2 Paraguay: producto interno bruto por tipo de gasto, a precios constantes Paraguay: gross domestic product, by type of expenditure, at constant prices ........................................................................................................ 2.1.2.24.3 Paraguay: producto interno bruto por clase de actividad económica, a precios corrientes Paraguay: gross domestic product, by kind of economic activity, at current prices ................................................................................................ 2.1.2.24.4 Paraguay: producto interno bruto por clase de actividad económica, a precios constantes Paraguay: gross domestic product, by kind of economic activity, at constant prices .............................................................................................. 2.1.2.24.5 Paraguay: relaciones entre los principales agregados de cuentas nacionales Paraguay: relationships among main national accounts aggregates ....................................................................................................................... 2.1.2.24.6 Paraguay: ingresos y gastos de los hogares Paraguay: income and expenditure of households ................................................................................................................................................... 2.1.2.24.7 Paraguay: ingresos y gastos del gobierno general Paraguay: income and expenditure of general government ..................................................................................................................................... 2.1.2.25 Perú / Peru ................................................................................................................................................................................................................ 2.1.2.25.1 Perú: producto interno bruto por tipo de gasto, a precios corrientes Peru: gross domestic product, by type of expenditure, at current prices .................................................................................................................. 2.1.2.25.2 Perú: producto interno bruto por tipo de gasto, a precios constantes Peru: gross domestic product, by type of expenditure, at constant prices ................................................................................................................ 2.1.2.25.3 Perú: producto interno bruto por clase de actividad económica, a precios corrientes Peru: gross domestic product, by kind of economic activity, at current prices ........................................................................................................ 2.1.2.25.4 Perú: producto interno bruto por clase de actividad económica, a precios constantes Peru: gross domestic product, by kind of economic activity, at constant prices ...................................................................................................... 2.1.2.25.5 Perú: relaciones entre los principales agregados de cuentas nacionales Peru: relationships among main national accounts aggregates ............................................................................................................................... 2.1.2.25.6 Perú: ingresos y gastos de los hogares Peru: income and expenditure of households ........................................................................................................................................................... 2.1.2.25.7 Perú: ingresos y gastos del gobierno general Peru: income and expenditure of general government ............................................................................................................................................. 2.1.2.26 República Dominicana / Dominican Republic ......................................................................................................................................................... 2.1.2.26.1 República Dominicana: producto interno bruto por tipo de gasto, a precios corrientes Dominican Republic: gross domestic product, by type of expenditure, at current prices ........................................................................................ 2.1.2.26.2 República Dominicana: producto interno bruto por tipo de gasto, a precios constantes Dominican Republic: gross domestic product, by type of expenditure, at constant prices ...................................................................................... 2.1.2.26.3 República Dominicana: producto interno bruto por clase de actividad económica, a precios corrientes Dominican Republic: gross domestic product, by kind of economic activity, at current prices ............................................................................... 2.1.2.26.4 República Dominicana: producto interno bruto por clase de actividad económica, a precios constantes Dominican Republic: gross domestic product, by kind of economic activity, at constant prices ............................................................................. 2.1.2.27 Saint Kitts y Nevis / Saint Kitts and Nevis ............................................................................................................................................................... 2.1.2.27.1 Saint Kitts y Nevis: producto interno bruto por tipo de gasto, a precios corrientes Saint Kitts and Nevis: gross domestic product, by type of expenditure, at current prices ........................................................................................ 2.1.2.27.3 Saint Kitts y Nevis: producto interno bruto por clase de actividad económica, a precios corrientes Saint Kitts and Nevis: gross domestic product, by kind of economic activity, at current prices .............................................................................. 2.1.2.27.4 Saint Kitts y Nevis: producto interno bruto por clase de actividad económica, a precios constantes Saint Kitts and Nevis: gross domestic product, by kind of economic activity, at constant prices ............................................................................ 2.1.2.27.5 Saint Kitts y Nevis: relaciones entre los principales agregados de cuentas nacionales Saint Kitts and Nevis: relationships among main national accounts aggregates ..................................................................................................... 2.1.2.28 San Vicente y las Granadinas / Saint Vincent and the Grenadines ........................................................................................................................... 2.1.2.28.1 San Vicente y las Granadinas: producto interno bruto por tipo de gasto, a precios corrientes Saint Vincent and the Grenadines: gross domestic product, by type of expenditure, at current prices .................................................................... 2.1.2.28.3 San Vicente y las Granadinas: producto interno bruto por clase de actividad económica, a precios corrientes Saint Vincent and the Grenadines: gross domestic product, by kind of economic activity, at current prices .......................................................... 2.1.2.28.4 San Vicente y las Granadinas: producto interno bruto por clase de actividad económica, a precios constantes Saint Vincent and the Grenadines: gross domestic product, by kind of economic activity, at constant prices ........................................................ 2.1.2.29 Santa Lucía / Saint Lucia .......................................................................................................................................................................................... 2.1.2.29.1 Santa Lucía: producto interno bruto por tipo de gasto, a precios corrientes Saint Lucia: gross domestic product, by type of expenditure, at current prices ....................................................................................................... 2.1.2.29.3 Santa Lucía: producto interno bruto por clase de actividad económica, a precios corrientes Saint Lucia: gross domestic product, by kind of economic activity, at current prices ............................................................................................. 2.1.2.29.4 Santa Lucía: producto interno bruto por clase de actividad económica, a precios constantes Saint Lucia: gross domestic product, by kind of economic activity, at constant prices ........................................................................................... 2.1.2.30 Suriname ................................................................................................................................................................................................................... 2.1.2.30.1 Suriname: producto interno bruto por tipo de gasto, a precios corrientes Suriname: gross domestic product, by type of expenditure, at current prices .......................................................................................................... 2.1.2.30.2 Suriname: producto interno bruto por tipo de gasto, a precios constantes Suriname: gross domestic product, by type of expenditure, at constant prices ........................................................................................................ 2.1.2.30.3 Suriname: producto interno bruto por clase de actividad económica, a precios corrientes Suriname: gross domestic product, by kind of economic activity, at current prices ................................................................................................ 2.1.2.30.4 Suriname: producto interno bruto por clase de actividad económica, a precios constantes Suriname: gross domestic product, by kind of economic activity, at constant prices .............................................................................................. 2.1.2.30.5 Suriname: relaciones entre los principales agregados de cuentas nacionales Suriname: relationships among main national accounts aggregates ....................................................................................................................... 2.1.2.31 Trinidad y Tabago / Trinidad and Tobago ................................................................................................................................................................ 2.1.2.31.1 Trinidad y Tabago: producto interno bruto por tipo de gasto, a precios corrientes Trinidad and Tobago: gross domestic product, by type of expenditure, at current prices ........................................................................................ 2.1.2.31.2 Trinidad y Tabago: producto interno bruto por tipo de gasto, a precios constantes Trinidad and Tobago: gross domestic product, by type of expenditure, at constant prices ...................................................................................... 2.1.2.31.3 Trinidad y Tabago: producto interno bruto por clase de actividad económica, a precios corrientes Trinidad and Tobago: gross domestic product, by kind of economic activity, at current prices ..............................................................................
CEPAL, Anuario Estadístico de América Latina y el Caribe, 2012 13
2.1.2.31.4 Trinidad y Tabago: producto interno bruto por clase de actividad económica, a precios constantes Trinidad and Tobago: gross domestic product, by kind of economic activity, at constant prices ............................................................................ 2.1.2.31.5 Trinidad y Tabago: relaciones entre los principales agregados de cuentas nacionales Trinidad and Tobago: relationships among main national accounts aggregates ..................................................................................................... 2.1.2.32 Uruguay .................................................................................................................................................................................................................... 2.1.2.32.1 Uruguay: producto interno bruto por tipo de gasto, a precios corrientes Uruguay: gross domestic product, by type of expenditure, at current prices ........................................................................................................... 2.1.2.32.2 Uruguay: producto interno bruto por tipo de gasto, a precios constantes Uruguay: gross domestic product, by type of expenditure, at constant prices ......................................................................................................... 2.1.2.32.3 Uruguay: producto interno bruto por clase de actividad económica, a precios corrientes Uruguay: gross domestic product, by kind of economic activity, at current prices ................................................................................................. 2.1.2.32.4 Uruguay: producto interno bruto por clase de actividad económica, a precios constantes Uruguay: gross domestic product, by kind of economic activity, at constant prices................................................................................................ 2.1.2.32.5 Uruguay: relaciones entre los principales agregados de cuentas nacionales Uruguay: relationships among main national accounts aggregates ........................................................................................................................ 2.1.2.32.7 Uruguay: ingresos y gastos del gobierno general Uruguay: income and expenditure of general government ...................................................................................................................................... 2.1.2.33 Venezuela (República Bolivariana de) / Venezuela (Bolivarian Republic of) .......................................................................................................... 2.1.2.33.1 Venezuela (República Bolivariana de): producto interno bruto por tipo de gasto, a precios corrientes Venezuela (Bolivarian Republic of): gross domestic product, by type of expenditure, at current prices ................................................................. 2.1.2.33.2 Venezuela (República Bolivariana de): producto interno bruto por tipo de gasto, a precios constantes Venezuela (Bolivarian Republic of): gross domestic product, by type of expenditure, at constant prices ............................................................... 2.1.2.33.3 Venezuela (República Bolivariana de): producto interno bruto por clase de actividad económica, a precios corrientes Venezuela (Bolivarian Republic of): gross domestic product, by kind of economic activity, at current prices ........................................................ 2.1.2.33.4 Venezuela (República Bolivariana de): producto interno bruto por clase de actividad económica, a precios constantes Venezuela (Bolivarian Republic of): gross domestic product, by kind of economic activity, at constant prices ...................................................... 2.1.2.33.5 Venezuela (República Bolivariana de): relaciones entre los principales agregados de cuentas nacionales Venezuela (Bolivarian Republic of): relationships among main national accounts aggregates .............................................................................. 2.1.2.33.6 Venezuela (República Bolivariana de): ingresos y gastos de los hogares Venezuela (Bolivarian Republic of): income and expenditure of households .......................................................................................................... 2.1.2.33.7 Venezuela (República Bolivariana de): ingresos y gastos del gobierno general Venezuela (Bolivarian Republic of): income and expenditure of general government ............................................................................................
2.2 Sector externo / External sector ........................................................................................................................................ 96 2.2.1 Balanza de pagos / Balance of payments....................................................................................................................................... 96 2.2.1.1 América Latina y el Caribe / Latin America and the Caribbean .............................................................................................................................. 96 2.2.1.2 América Latina / Latin America ............................................................................................................................................................................... 97 2.2.1.3 El Caribe / The Caribbean ........................................................................................................................................................................................ 98 2.2.1.4 Asociación Latinoamericana de Integración (ALADI) / Latin American Integration Association (LAIA) .............................................................. 2.2.1.5 Comunidad Andina / Andean Community ............................................................................................................................................................... 2.2.1.6 Mercado Común del Sur (MERCOSUR) / Common Market of the Southern Cone (MERCOSUR) ....................................................................... 2.2.1.7 Mercado Común Centroamericano (MCCA) / Central American Common Market (CACM) ................................................................................. 2.2.1.8 Antigua y Barbuda / Antigua and Barbuda ............................................................................................................................................................. 2.2.1.9 Argentina .................................................................................................................................................................................................................. 2.2.1.10 Bahamas ................................................................................................................................................................................................................... 2.2.1.11 Barbados ................................................................................................................................................................................................................... 2.2.1.12 Belice / Belize ........................................................................................................................................................................................................... 2.2.1.13 Bolivia (Estado Plurinacional de) / Bolivia (Plurinational State of) ........................................................................................................................ 2.2.1.14 Brasil / Brazil ............................................................................................................................................................................................................ 2.2.1.15 Chile ......................................................................................................................................................................................................................... 2.2.1.16 Colombia .................................................................................................................................................................................................................. 2.2.1.17 Costa Rica ................................................................................................................................................................................................................. 2.2.1.18 Cuba .......................................................................................................................................................................................................................... 2.2.1.19 Dominica .................................................................................................................................................................................................................. 2.2.1.20 Ecuador ..................................................................................................................................................................................................................... 2.2.1.21 El Salvador ............................................................................................................................................................................................................... 2.2.1.22 Granada / Grenada ................................................................................................................................................................................................... 2.2.1.23 Guatemala ................................................................................................................................................................................................................. 2.2.1.24 Guyana ...................................................................................................................................................................................................................... 2.2.1.25 Haití / Haiti ............................................................................................................................................................................................................... 2.2.1.26 Honduras ................................................................................................................................................................................................................... 2.2.1.27 Jamaica ..................................................................................................................................................................................................................... 2.2.1.28 México / Mexico ....................................................................................................................................................................................................... 2.2.1.29 Nicaragua .................................................................................................................................................................................................................. 2.2.1.30 Panamá / Panama ..................................................................................................................................................................................................... 2.2.1.31 Paraguay ................................................................................................................................................................................................................... 2.2.1.32 Perú / Peru ................................................................................................................................................................................................................ 2.2.1.33 República Dominicana / Dominican Republic ......................................................................................................................................................... 2.2.1.34 Saint Kitts y Nevis / Saint Kitts and Nevis .............................................................................................................................................................. 2.2.1.35 San Vicente y las Granadinas / Saint Vincent and the Grenadines ........................................................................................................................... 2.2.1.36 Santa Lucía / Saint Lucia .......................................................................................................................................................................................... 2.2.1.37 Suriname ................................................................................................................................................................................................................... 2.2.1.38 Trinidad y Tabago / Trinidad and Tobago ................................................................................................................................................................ 2.2.1.39 Uruguay .................................................................................................................................................................................................................... 2.2.1.40 Venezuela (República Bolivariana de) / Venezuela (Bolivarian Republic of) .......................................................................................................... 2.2.1.41 América Latina y el Caribe: principales componentes de la balanza de pagos Latin America and the Caribbean: main balance of payments components ............................................................................................................ 99

14 ECLAC, Statistical Yearbook for Latin America and the Caribbean, 2012
2.2.2 Comercio exterior de bienes y servicios / External trade of goods and services ............................................................... 101 2.2.2.1 Exportaciones de productos primarios según su participación en el total Exports of primary products as percentage of total exports ..................................................................................................................................... 101 2.2.2.2 Exportaciones de productos manufacturados según su participación en el total Exports of manufactured products as percentage of total exports ........................................................................................................................... 102 2.2.2.3 Exportaciones totales FOB por grupos de productos: productos primarios Total exports f.o.b., by product group: primary products ......................................................................................................................................... 103 2.2.2.4 Exportaciones totales FOB por grupos de productos: productos manufacturados Total exports f.o.b., by product group: manufactured products ................................................................................................................................ 104 2.2.2.5 América Latina y el Caribe: exportación de los 10 productos principales conforme a la CUCI Rev.1, según participación porcentual en cada año / Latin America and the Caribbean: exports of the 10 leading products (SITC, Rev.1), by their percentage share each year ................................................................................................................. 105 2.2.2.6 Asociación Latinoamericana de Integración: exportación de los 10 productos principales conforme a la CUCI Rev.1, según participación porcentual en cada año / Latin American Integration Association: exports of the 10 leading products (SITC, Rev.1), by their percentage share each year ................................................................................................................. 106 2.2.2.7 Comunidad Andina: exportación de los 10 productos principales conforme a la CUCI Rev.1, según participación porcentual en cada año / Andean Community: exports of the 10 leading products (SITC, Rev.1), by their percentage share each year ................................................................................................................. 107 2.2.2.8 Mercado Común Centroamericano: exportación de los 10 productos principales conforme a la CUCI Rev.1, según participación porcentual en cada año / Central American Common Market: exports of the 10 leading products (SITC, Rev.1), by their percentage share each year ................................................................................................................. 108 2.2.2.9 Mercado Común del Sur: exportación de los 10 productos principales conforme a la CUCI Rev.1, según participación porcentual en cada año / Common Market of the South: exports of the 10 leading products (SITC, Rev.1), by their percentage share each year ................................................................................................................. 109 2.2.2.10 Mercado Común del Sur, Bolivia (Estado Plurinacional de) y Chile: exportación de los 10 productos principales conforme a la CUCI Rev.1, según participación porcentual en cada año / Common Market of the South, Plurinational State of Bolivia and Chile: exports of the 10 leading products (SITC, Rev.1), by their percentage share each year ........................ 110 2.2.2.11 Argentina: exportación de los 10 productos principales conforme a la CUCI Rev.1, según participación porcentual en cada año Argentina: exports of the 10 leading products (SITC, Rev.1), by their percentage share each year ........................................................................ 2.2.2.12 Barbados: exportación de los 10 productos principales conforme a la CUCI Rev.1, según participación porcentual en cada año Barbados: exports of the 10 leading products (SITC, Rev.1), by their percentage share each year ........................................................................ 2.2.2.13 Belice: exportación de los 10 productos principales conforme a la CUCI Rev.1, según participación porcentual en cada año Belize: exports of the 10 leading products (SITC, Rev.1), by their percentage share each year .............................................................................. 2.2.2.14 Bolivia (Estado Plurinacional de): exportación de los 10 productos principales conforme a la CUCI Rev.1, según participación porcentual en cada año / Bolivia (Plurinational State of): exports of the 10 leading products (SITC, Rev.1), by their percentage share each year ................................................................................................................................... 2.2.2.15 Brasil: exportación de los 10 productos principales conforme a la CUCI Rev.1, según participación porcentual en cada año Brazil: exports of the 10 leading products (SITC, Rev.1), by their percentage share each year .............................................................................. 2.2.2.16 Chile: exportación de los 10 productos principales conforme a la CUCI Rev.1, según participación porcentual en cada año Chile: exports of the 10 leading products (SITC, Rev.1), by their percentage share each year ............................................................................... 2.2.2.17 Colombia: exportación de los 10 productos principales conforme a la CUCI Rev.1, según participación porcentual en cada año Colombia: exports of the 10 leading products (SITC, Rev.1), by their percentage share each year ........................................................................ 2.2.2.18 Costa Rica: exportación de los 10 productos principales conforme a la CUCI Rev.1, según participación porcentual en cada año Costa Rica: exports of the 10 leading products (SITC, Rev.1), by their percentage share each year ...................................................................... 2.2.2.19 Cuba: exportación de los 10 productos principales conforme a la CUCI Rev.1, según participación porcentual en cada año Cuba: exports of the 10 leading products (SITC, Rev.1), by their percentage share each year ............................................................................... 2.2.2.20 Dominica: exportación de los 10 productos principales conforme a la CUCI Rev.1, según participación porcentual en cada año Dominica: exports of the 10 leading products (SITC, Rev.1), by their percentage share each year ........................................................................ 2.2.2.21 Ecuador: exportación de los 10 productos principales conforme a la CUCI Rev.1, según participación porcentual en cada año Ecuador: exports of the 10 leading products (SITC, Rev.1), by their percentage share each year .......................................................................... 2.2.2.22 El Salvador: exportación de los 10 productos principales conforme a la CUCI Rev.1, según participación porcentual en cada año El Salvador: exports of the 10 leading products (SITC, Rev.1), by their percentage share each year ..................................................................... 2.2.2.23 Guatemala: exportación de los 10 productos principales conforme a la CUCI Rev.1, según participación porcentual en cada año Guatemala: exports of the 10 leading products (SITC, Rev.1), by their percentage share each year ............................................................................. 2.2.2.24 Honduras: exportación de los 10 productos principales conforme a la CUCI Rev.1, según participación porcentual en cada año Honduras: exports of the 10 leading products (SITC, Rev.1), by their percentage share each year .............................................................................. 2.2.2.25 Jamaica: exportación de los 10 productos principales conforme a la CUCI Rev.1, según participación porcentual en cada año Jamaica: exports of the 10 leading products (SITC, Rev.1), by their percentage share each year .................................................................................. 2.2.2.26 México: exportación de los 10 productos principales conforme a la CUCI Rev.1, según participación porcentual en cada año Mexico: exports of the 10 leading products (SITC, Rev.1), by their percentage share each year ................................................................................... 2.2.2.27 Nicaragua: exportación de los 10 productos principales conforme a la CUCI Rev.1, según participación porcentual en cada año Nicaragua: exports of the 10 leading products (SITC, Rev.1), by their percentage share each year .............................................................................. 2.2.2.28 Panamá: exportación de los 10 productos principales conforme a la CUCI Rev.1, según participación porcentual en cada año Panama: exports of the 10 leading products (SITC, Rev.1), by their percentage share each year .................................................................................. 2.2.2.29 Paraguay: exportación de los 10 productos principales conforme a la CUCI Rev.1, según participación porcentual en cada año Paraguay: exports of the 10 leading products (SITC, Rev.1), by their percentage share each year ................................................................................ 2.2.2.30 Perú: exportación de los 10 productos principales conforme a la CUCI Rev.1, según participación porcentual en cada año Peru: exports of the 10 leading products (SITC, Rev.1), by their percentage share each year ................................................................................ 2.2.2.31 Trinidad y Tabago: exportación de los 10 productos principales conforme a la CUCI Rev.1, según participación porcentual en cada año Trinidad and Tobago: exports of the 10 leading products (SITC, Rev.1), by their percentage share each year ...................................................... 2.2.2.32 Uruguay: exportación de los 10 productos principales conforme a la CUCI Rev.1, según participación porcentual en cada año Uruguay: exports of the 10 leading products (SITC, Rev.1), by their percentage share each year ......................................................................... 2.2.2.33 Venezuela (República Bolivariana de): exportación de los 10 productos principales conforme a la CUCI Rev.1, según participación porcentual en cada año / Venezuela (Bolivarian Republic of): exports of the 10 leading products (SITC, Rev.1), by their percentage share each year ................................................................................................................. 2.2.2.34 Exportaciones de bienes según sectores de actividad económica: agricultura, caza, silvicultura y pesca Exports of goods by sector of economic activity: agriculture, hunting, forestry and fishing ................................................................................... 2.2.2.35 Exportaciones de bienes según sectores de actividad económica: explotación de minas y canteras Exports of goods by sector of economic activity: mining and quarrying .................................................................................................................
CEPAL, Anuario Estadístico de América Latina y el Caribe, 2012 15
2.2.2.36 Exportaciones de bienes según sectores de actividad económica: industrias de alimentos, bebidas y tabaco Exports of goods by sector of economic activity: food, beverage and tobacco industries ....................................................................................... 2.2.2.37 Exportaciones de bienes según sectores de actividad económica: otras industrias, principalmente de bienes de consumo no duraderos Exports of goods by sector of economic activity: other manufacturing industries, mainly of non-durable consumer goods ................................. 2.2.2.38 Exportaciones de bienes según sectores de actividad económica: industrias, principalmente de bienes intermedios Exports of goods by sector of economic activity: manufacturing industries, mainly of intermediate goods ........................................................... 2.2.2.39 Exportaciones de bienes según sectores de actividad económica: industrias metalmecánicas Exports of goods by sector of economic activity: metal manufactures and machinery industries ........................................................................... 2.2.2.40 Importaciones de bienes por grandes categorías económicas: bienes de consumo Imports of goods by broad economic categories: consumer goods .......................................................................................................................... 2.2.2.41 Importaciones de bienes por grandes categorías económicas: bienes intermedios Imports of goods by broad economic categories: intermediate goods ..................................................................................................................... 2.2.2.42 Importaciones de bienes por grandes categorías económicas: bienes de capital Imports of goods by broad economic categories: capital goods .............................................................................................................................. 2.2.2.43 Importaciones de bienes por grandes categorías económicas: carburantes Imports of goods by broad economic categories: fuels and lubricants .................................................................................................................... 2.2.2.44 Importaciones de bienes por grandes categorías económicas: vehículos automotores de pasajeros Imports of goods by broad economic categories: passenger motor vehicles ........................................................................................................... 2.2.2.45 Exportaciones intrarregionales / Intraregional exports ............................................................................................................................................ 111 2.2.2.46 Importaciones intrarregionales / Intraregional imports ........................................................................................................................................... 112 2.2.2.47 Comercio intrarregional total de bienes, 1995 / Total intraregional trade in goods, 1995 ...................................................................................... 2.2.2.48 Comercio intrarregional total de bienes, 2000 / Total intraregional trade in goods, 2000 ...................................................................................... 2.2.2.49 Comercio intrarregional total de bienes, 2004 / Total intraregional trade in goods, 2004 ...................................................................................... 2.2.2.50 Comercio intrarregional total de bienes, 2005 / Total intraregional trade in goods, 2005 ...................................................................................... 2.2.2.51 Comercio intrarregional total de bienes, 2006 / Total intraregional trade in goods, 2006 ...................................................................................... 2.2.2.52 Comercio intrarregional total de bienes, 2007 / Total intraregional trade in goods, 2007 ...................................................................................... 2.2.2.53 Comercio intrarregional total de bienes, 2008 / Total intraregional trade in goods, 2008 ...................................................................................... 2.2.2.54 Comercio intrarregional total de bienes, 2009 / Total intraregional trade in goods, 2009 ...................................................................................... 2.2.2.55 Comercio intrarregional total de bienes, 2010 / Total intraregional trade in goods, 2010 ...................................................................................... 2.2.2.56 Comercio intrarregional total de bienes, 2011 / Total intraregional trade in goods, 2011 ...................................................................................... 113 2.2.2.57 América Latina y el Caribe: exportaciones totales de bienes FOB Latin America and the Caribbean: exports of goods, f.o.b. ...................................................................................................................................... 2.2.2.58 América Latina y el Caribe: importaciones totales de bienes, FOB Latin America and the Caribbean: imports of goods, f.o.b. ..................................................................................................................................... 2.2.2.59 América Latina y el Caribe: exportaciones totales de servicios Latin America and the Caribbean: exports of services. ........................................................................................................................................... 2.2.2.60 América Latina y el Caribe: importaciones totales de servicios Latin America and the Caribbean: imports of services ............................................................................................................................................ 2.2.2.61 América Latina y el Caribe: exportaciones de servicios de transporte Latin America and the Caribbean: exports of transportation services .................................................................................................................... 2.2.2.62 América Latina y el Caribe: importaciones de servicios de transporte Latin America and the Caribbean: imports of transportation services .................................................................................................................... 2.2.2.63 América Latina y el Caribe: exportaciones de servicios de viajes Latin America and the Caribbean: exports of travel services .................................................................................................................................. 2.2.2.64 América Latina y el Caribe: importaciones de servicios de viajes Latin America and the Caribbean: imports of travel services ................................................................................................................................. 2.2.2.65 América Latina y el Caribe: exportaciones de otros servicios Latin America and the Caribbean: exports of other services ................................................................................................................................... 2.2.2.66 América Latina y el Caribe: importaciones de otros servicios Latin America and the Caribbean: imports of other services .................................................................................................................................. 2.2.2.67 América Latina y el Caribe: valor de las exportaciones totales de bienes y servicios Latin America and the Caribbean: exports of goods and services ........................................................................................................................... 115 2.2.2.68 América Latina y el Caribe: valor de las importaciones totales de bienes y servicios Latin America and the Caribbean: imports of goods and services .......................................................................................................................... 116
2.2.3 Indicadores del sector externo / External sector indicators ..................................................................................................... 117 2.2.3.1 América Latina y el Caribe: saldo en cuenta corriente Latin America and the Caribbean: balance on current account .............................................................................................................................. 2.2.3.2 América Latina y el Caribe: saldo en cuenta corriente como porcentaje del producto interno bruto Latin America and the Caribbean: balance on current account as percentage of GDP.......................................................................................... 117 2.2.3.3 América Latina y el Caribe: saldo de bienes / Latin America and the Caribbean: balance on goods .................................................................... 2.2.3.4 América Latina y el Caribe: saldo de servicios / Latin America and the Caribbean: balance on services ............................................................. 2.2.3.5 América Latina y el Caribe: saldo en renta / Latin America and the Caribbean: balance on income ..................................................................... 2.2.3.6 América Latina y el Caribe: saldo de transferencias corrientes Latin America and the Caribbean: balance on current transfers ............................................................................................................................ 2.2.3.7 América Latina y el Caribe: índices del quántum de las exportaciones de bienes FOB Latin America and the Caribbean: volume indices for exports of goods, f.o.b. ...................................................................................................... 2.2.3.8 América Latina y el Caribe: índices del quántum de las importaciones de bienes FOB Latin America and the Caribbean: volume indices for imports of goods, f.o.b. ....................................................................................................... 2.2.3.9 América Latina y el Caribe: índices del valor unitario de las exportaciones de bienes FOB Latin America and the Caribbean: unit value indices for exports of goods, f.o.b. ................................................................................................... 2.2.3.10 América Latina y el Caribe: índices del valor unitario de las exportaciones de bienes y servicios Latin America and the Caribbean: unit value indices for exports of goods and services ........................................................................................ 2.2.3.11 América Latina y el Caribe: índices del valor unitario de las importaciones de bienes FOB Latin America and the Caribbean: unit value indices for imports of goods, f.o.b. .................................................................................................. 2.2.3.12 América Latina y el Caribe: índices del valor unitario de las importaciones de bienes y servicios Latin America and the Caribbean: unit value indices for imports of goods and services ....................................................................................... 2.2.3.13 América Latina y el Caribe: índices de la relación de precios del intercambio de bienes FOB Latin America and the Caribbean: terms of trade indices for goods, f.o.b. ............................................................................................................. 118

16 ECLAC, Statistical Yearbook for Latin America and the Caribbean, 2012
2.2.3.14 América Latina y el Caribe: índices de la relación de precios del intercambio de bienes y servicios Latin America and the Caribbean: terms of trade indices for goods and services .................................................................................................. 2.2.3.15 América Latina y el Caribe: índices del poder de compra de las exportaciones de bienes Latin America and the Caribbean: purchasing power indices of exports of goods ................................................................................................. 2.2.3.16 América Latina y el Caribe: índices del poder de compra de las exportaciones de bienes y servicios Latin America and the Caribbean: purchasing power indices of exports of goods and services ............................................................................ 2.2.3.17 América Latina y el Caribe: precios de los principales productos básicos de exportación Latin America and the Caribbean: prices of leading export commodities ............................................................................................................... 2.2.3.18 América Latina y el Caribe: índices de precios de los principales productos básicos de exportación Latin America and the Caribbean: price indices of leading export commodities .................................................................................................... 119
2.2.4 Financiamiento y deuda externa / Financing and external debt .............................................................................................. 120 2.2.4.1 América Latina y el Caribe: relación entre la renta neta y las exportaciones de bienes y servicios Latin America and the Caribbean: ratio of net income to exports of goods and services ....................................................................................... 120 2.2.4.2 América Latina y el Caribe: ingreso neto de capitales y transferencia de recursos, 1980-2011 Latin America and the Caribbean: net capital inflow and resource transfers, 1980-2011 ...................................................................................... 121 2.2.4.3 América Latina y el Caribe: transferencia neta de recursos Latin America and the Caribbean: net resource transfers ....................................................................................................................................... 2.2.4.4 América Latina y el Caribe: inversión extranjera directa neta Latin America and the Caribbean: net foreign direct investment ............................................................................................................................ 122 2.2.4.5 América Latina y el Caribe: deuda externa total Latin America and the Caribbean: total external debt ............................................................................................................................................. 123 2.2.4.6 América Latina y el Caribe: deuda externa total como porcentaje del producto interno bruto Latin America and the Caribbean: total external debt as percentage of GDP ........................................................................................................ 124 2.2.4.7 América Latina y el Caribe: reservas internacionales Latin America and the Caribbean: international reserves ....................................................................................................................................... 2.2.4.8 América Latina y el Caribe: reservas internacionales, 2009 Latin America and the Caribbean: international reserves, 2009 ............................................................................................................................. 2.2.4.9 América Latina y el Caribe: reservas internacionales, 2010 Latin America and the Caribbean: international reserves, 2010 ............................................................................................................................. 2.2.4.10 América Latina y el Caribe: reservas internacionales, 2011 Latin America and the Caribbean: international reserves, 2011 .............................................................................................................................
2.3 Precios / Prices .............................................................................................................................................................................. 125
2.3.1 Precios al consumidor / Consumer prices ..................................................................................................................................... 125 2.3.1.1 Índices anuales de precios al consumidor: nivel general / Annual consumer price indices: general level ............................................................. 125 2.3.1.2 Índices anuales de precios al consumidor: alimentos / Annual consumer price indices: foods .............................................................................. 2.3.1.3 Índices anuales de precios al consumidor: otras agrupaciones / Annual consumer price indices: other groupings ................................................ 2.3.1.4 Índices anuales de precios al consumidor: subyacente / Annual consumer price indices: core inflation ................................................................ 2.3.1.5 Índices anuales de precios al consumidor: bienes y servicios transables Annual consumer price indices: tradable goods and services ................................................................................................................................. 2.3.1.6 Índices anuales de precios al consumidor: bienes y servicios no transables Annual consumer price indices: non-tradable goods and services .......................................................................................................................... 2.3.1.7 Variaciones del índice de precios al consumidor: nivel general / Variations in the consumer price index: general level ....................................... 126 2.3.1.8 Variaciones del índice de precios al consumidor: alimentos / Variations in the consumer price index: foods ........................................................ 2.3.1.9 Variaciones del índice de precios al consumidor: otras agrupaciones / Variations in the consumer price index: other groupings ......................... 2.3.1.10 Variaciones del índice de precios al consumidor: subyacente / Variations in the consumer price index: core inflation ......................................... 2.3.1.11 Variaciones del índice de precios al consumidor: bienes y servicios transables Variations in the consumer price index: tradable goods and services ..................................................................................................................... 2.3.1.12 Variaciones del índice de precios al consumidor: bienes y servicios no transables Variations in the consumer price index: non-tradable goods and services .............................................................................................................. 2.3.1.13 Variaciones del índice de precios al consumidor: diciembre a diciembre Variations in the consumer price index: December to December ............................................................................................................................ 127
2.3.2 Precios mayoristas / Wholesale prices ........................................................................................................................................... 2.3.2.1 Índices anuales de precios mayoristas / Annual wholesale price indices .................................................................................................. 2.3.2.2 Variaciones de los índices anuales de precios mayoristas / Variations in wholesale price annual indices ..............................................................
2.4 Estadísticas sectoriales / Sectoral statistics ............................................................................................................
2.4.1 Agricultura / Agriculture...................................................................................................................................................................... 2.4.1.1 Índices de producción agrícola / Agricultural production indices ........................................................................................................................... 2.4.1.2 Índices de producción agrícola por habitante / Agricultural production indices per capita .................................................................................... 2.4.1.3 Índices de producción de alimentos / Food production indices ................................................................................................................................ 2.4.1.4 Índices de producción de alimentos por habitante / Food production indices per capita ........................................................................................ 2.4.1.5 Producción de algodón con semillas / Seed cotton production ................................................................................................................................ 2.4.1.6 Producción de arroz / Rice production ..................................................................................................................................................................... 2.4.1.7 Producción de banano y plátano / Banana and plantain production ........................................................................................................................ 2.4.1.8 Producción de café / Coffee production .................................................................................................................................................................... 2.4.1.9 Producción de caña de azúcar / Sugar cane production ........................................................................................................................................... 2.4.1.10 Producción de frijoles secos / Dried bean production .............................................................................................................................................. 2.4.1.11 Producción de semillas de girasol / Sunflower seed production ............................................................................................................................... 2.4.1.12 Producción de maíz / Maize production ................................................................................................................................................................... 2.4.1.13 Producción de yuca (mandioca) / Cassava production ........................................................................................................................................... 2.4.1.14 Producción de soja / Soybean production ................................................................................................................................................................. 2.4.1.15 Producción de sorgo / Sorghum production .............................................................................................................................................................. 2.4.1.16 Producción de trigo / Wheat production ...................................................................................................................................................................
2.4.2 Minería y manufactura / Mining and manufacturing .................................................................................................................... 2.4.2.1 Producción de cemento / Cement production ........................................................................................................................................................... 2.4.2.2 Producción de fertilizantes / Fertilizer production ...................................................................................................................................................

CEPAL, Anuario Estadístico de América Latina y el Caribe, 2012 17
2.4.2.3 Producción de acero / Steel production .................................................................................................................................................................... 2.4.2.4 Producción de laminados planos / Flat-rolled product production .......................................................................................................................... 2.4.2.5 Producción de laminados no planos / Non-flat-rolled product production ............................................................................................................... 2.4.2.6 Producción de automotores para pasajeros / Passenger motor vehicle production .................................................................................................. 2.4.2.7 Producción de automotores comerciales / Commercial vehicle production ............................................................................................................. 2.4.2.8 Producción de bauxita / Bauxite production ............................................................................................................................................................. 2.4.2.9 Producción de cobre / Copper production ................................................................................................................................................................ 2.4.2.10 Producción de zinc / Zinc production ....................................................................................................................................................................... 2.4.2.11 Producción de estaño / Tin production ..................................................................................................................................................................... 2.4.2.12 Producción de carbón / Coal production .................................................................................................................................................................. 2.4.2.13 Producción de petróleo / Petroleum production ....................................................................................................................................................... 2.4.2.14 Producción de gasolina / Gasoline production ......................................................................................................................................................... 2.4.2.15 Producción de gas / Gas production ......................................................................................................................................................................... 2.4.2.16 Producción de hierro / Iron production .................................................................................................................................................................... 2.4.2.17 Producción de alambrón / Wire rod production ........................................................................................................................................................ 2.4.2.18 Producción de arrabio / Pig iron production ............................................................................................................................................................
3. Estadísticas ambientales / Environmental statistics ..................................................................
3.1 Biota / Biota ......................................................................................................................................................................................
3.1.1 Áreas protegidas / Protected areas .................................................................................................................................................. 3.1.1.1 Superficie de áreas terrestres protegidas / Terrestrial protected areas ..................................................................................................................... 3.1.1.2 Superficie de áreas marinas protegidas / Protected marine areas ............................................................................................................................ 3.1.1.3 Proporción de las áreas terrestres y marinas protegidas / Proportion of terrestrial and marine protected areas .................................................... 3.1.1.4 Proporción de las áreas terrestres protegidas / Proportion of terrestrial protected areas ........................................................................................ 3.1.1.5 Proporción de las áreas marinas protegidas / Proportion of marine protected areas ...............................................................................................
3.2 Agua / Water .....................................................................................................................................................................................
3.2.1 Reservas/Extracción / Stocks/Extraction ....................................................................................................................................... 3.2.1.1 Proporción del total de recursos hídricos utilizados / Proportion of total water resources used .............................................................................
3.3 Mares y borde costero / Seas and coastal areas ...................................................................................................
3.3.1 Área territorial marina / Marine territorial area.............................................................................................................................. 3.3.1.1 Área territorial marina total / Total marine territorial area .......................................................................................................................
3.3.2 Pesca / Fisheries ................................................................................................................................................................................... 3.3.2.1 Extracción pesquera / Fish extraction ...................................................................................................................................................................... 3.3.2.2 Extracción de las principales pesquerías / Extraction by main fisheries ..................................................................................................................
3.3.3 Acuicultura / Aquaculture ................................................................................................................................................................................. 3.3.3.1 Producción acuícola / Aquiculture production ....................................................................................................................................................... 3.3.3.2 Volumen de la producción acuícola / Volume of aquaculture production ................................................................................................................
3.4 Tierras y suelos / Lands and soils....................................................................................................................................
3.4.1 Superficie / Area ....................................................................................................................................................................................
3.4.1.1 Superficie del país / Area of country ..........................................................................................................................................................
3.4.2 Bosque / Forest ..................................................................................................................................................................................... 3.4.2.1 Superficie de bosque y proporción de la superficie cubierta por bosques Forest area and proportion of land area covered by forest ...................................................................................................................................... 3.4.2.2 Superficie de bosque natural, proporción de la superficie terrestre y de la superficie de bosque Natural forest area, proportion of land area and proportion of forested area ......................................................................................................... 3.4.2.3 Superficie de plantaciones forestales y proporción de la superficie de bosque Forest plantations area and proportion of the forested area ....................................................................................................................................
3.4.3 Uso de la tierra / Land use .................................................................................................................................................................. 3.4.3.1 Superficie agrícola / Agricultural area ..................................................................................................................................................................... 3.4.3.2 Superficie de tierras arables / Area of arable land ................................................................................................................................................... 3.4.3.3 Superficie de tierras destinadas a cultivos permanentes / Area of permanent cropland ........................................................................................... 3.4.3.4 Superficie de praderas y pastos permanentes / Area of permanent pastureland ...................................................................................................... 3.4.3.5 Superficie regada / Irrigated area ............................................................................................................................................................................. 3.4.3.6 Superficie cosechada de algodón con semillas / Seed cotton, area harvested.......................................................................................................... 3.4.3.7 Superficie cosechada de arroz / Rice, area harvested ............................................................................................................................................... 3.4.3.8 Superficie cosechada de café / Coffee, area harvested ............................................................................................................................................. 3.4.3.9 Superficie cosechada de caña de azúcar / Sugar cane, area harvested .................................................................................................................... 3.4.3.10 Superficie cosechada de frijoles secos / Dried beans, area harvested ..................................................................................................................... 3.4.3.11 Superficie cosechada de semilla de girasol / Sunflower seed, area harvested.......................................................................................................... 3.4.3.12 Superficie cosechada de maíz / Maize, area harvested ............................................................................................................................................ 3.4.3.13 Superficie cosechada de yuca (mandioca) / Cassava, area harvested...................................................................................................................... 3.4.3.14 Superficie cosechada de soja / Soybeans, area harvested ........................................................................................................................................ 3.4.3.15 Superficie cosechada de sorgo / Sorghum, area harvested ....................................................................................................................................... 3.4.3.16 Superficie cosechada de trigo / Wheat, area harvested ............................................................................................................................................
3.4.4 Uso de agroquímicos / Agrochemical use ..................................................................................................................................... 3.4.4.1 Intensidad de uso de fertilizantes / Fertilizer use intensity ....................................................................................................................................... 3.4.4.2 Consumo de fertilizantes / Fertilizer consumption ................................................................................................................................................... 3.4.4.3 Consumo de plaguicidas: fungicidas y bactericidas / Pesticide consumption: fungicides and bactericides ............................................................ 3.4.4.4 Consumo de plaguicidas: herbicidas / Pesticide consumption: herbicides .............................................................................................................. 3.4.4.5 Consumo de plaguicidas: insecticidas / Pesticide consumption: insecticides ..........................................................................................................
18 ECLAC, Statistical Yearbook for Latin America and the Caribbean, 2012
3.5 Energía / Energy ............................................................................................................................................................................
3.5.1 Producción y consumo / Production and consumption ............................................................................................................. 3.5.1.1 Intensidad energética del producto interno bruto / Energy intensity of gross domestic product ............................................................................. 3.5.1.2 Producción de energía primaria y secundaria / Production of primary and secondary energy ................................................................................ 3.5.1.3 Consumo de energía primaria y secundaria / Consumption of primary and secondary energy ............................................................................... 3.5.1.4 Oferta de energía renovable / Supply of renewable energy....................................................................................................................................... 3.5.1.5 Oferta de energía no renovable / Supply of non-renewable energy ..........................................................................................................................
3.5.2 Energía eléctrica / Electric energy .................................................................................................................................................... 3.5.2.1 Consumo de energía eléctrica / Consumption of electric power .............................................................................................................................. 3.5.2.2 Capacidad instalada para producir energía eléctrica / Installed capacity for producing electricity .........................................................................
3.6 Aire y atmósfera / Air and atmosphere .........................................................................................................................
3.6.1 Sustancias agotadoras de la capa de ozono / Ozono depleting substances ....................................................................... 3.6.1.1 Consumo de todas las sustancias que agotan la capa de ozono (SAO) / Consumption of all ozone-depleting substances (ODS) ..........................
3.6.2 Gases con efecto invernadero (GEI) / Greenhouse gases (GHG) ............................................................................................ 3.6.2.1 Emisiones y absorciones de dióxido de carbono (CO2) / Carbon dioxide (CO2) emissions and absorptions ......................................................... 3.6.2.2 Emisiones de dióxido de carbono (CO2) / Carbon dioxide (CO2) emissions ........................................................................................................... 3.6.2.3 Emisiones de dióxido de carbono (CO2) por habitante / Carbon dioxide (CO2) emissions per capita .................................................................... 3.6.2.4 Emisiones de dióxido de carbono (CO2) por cada 1.000 dólares de producto interno bruto Carbon dioxide (CO2) emissions per US$ 1,000 of gross domestic product ............................................................................................................ 3.6.2.5 Emisiones de metano (CH4) / Methane (CH4) emissions ......................................................................................................................................... 3.6.2.6 Emisiones de óxido nitroso (N2O) / Nitrous oxide (N2O) emissions ........................................................................................................................
3.7 Desastres naturales / Natural disasters .......................................................................................................................
3.7.1 Desastres naturales / Natural disasters .......................................................................................................................................... 3.7.1.1 Ocurrencia e impactos de desastres naturales / Occurence and impacts of natural disasters ..................................................................................
3.8 Transporte / Transport...............................................................................................................................................................
3.8.1 Transporte / Transport.......................................................................................................................................................................... 3.8.1.1 Parque automotor por habitante / Motor-vehicle fleet per capita ............................................................................................................................. 3.8.1.2 Parque automotor / Motor-vehicle fleet ................................................................................................................................................................... 3.8.1.3 Longitud de la red de carreteras / Length of the road network ................................................................................................................................. 3.8.1.4 Longitud de la red ferroviaria / Length of the railway network ................................................................................................................................ 3.8.1.5 Tráfico aéreo: pasajeros-kilómetros / Air traffic: passengers-kilometres ................................................................................................................. 3.8.1.6 Tráfico aéreo: kilómetros volados / Air traffic: kilometres flown ............................................................................................................................. 3.8.1.7 Tráfico aéreo: toneladas-kilómetros de carga / Air traffic: ton-kilometres of freight ...............................................................................................
3.9 Gestión ambiental / Environmental management .................................................................................................
3.9.1 Gestión ambiental / Environmental management ........................................................................................................................ 3.9.1.1 Empresas certificadas ISO 14001 / ISO 14001-certified enterprises ....................................................................................................................... 3.9.1.2 Empresas certificadas ISO 14001, por cada 1.000 millones de dólares del PIB ISO 14001-certified enterprises per billion dollars of GDP .................................................................................................................................... 3.9.1.3 Acuerdos multilaterales ambientales / Multilateral environmental agreements.......................................................................................................
Notas técnicas / Technical notes ........................................................................................................................................... 129 1 Estadísticas sociales / Social statistics ..................................................................................................................................................................... 131 2 Estadísticas económicas / Economic statistics ......................................................................................................................................................... 147 3 Estadísticas ambientales / Environmental statistics .................................................................................................................................................. 181
Fuentes / Sources ..................................................................................................................................................................................... 203
Publicaciones de la CEPAL / ECLAC publications ............................................................................................. 221
Introducción Introduction
�
CEPAL, Anuario Estadístico de América Latina y el Caribe, 2012 19
El Anuario Estadístico de América Latina y el Caribe responde a las demandas de los usuarios que requieren información estadística confiable y rigurosa para el análisis de la situación económica, social y ambiental de la región. Se ha incluido en esta edición información que se encontraba disponible hasta mediados de diciembre de 2012. La estructura de la presente edición del Anuario Estadístico es similar a la de 2011, pues no se han introducido modificaciones en términos de contenidos o diseño. El Anuario tiene cuatro capítulos. En el primero se presentan los indicadores demográficos y sociales, y refleja el esfuerzo especial realizado para incluir la dimensión de género y el tema de la pobreza en la información estadística. En el segundo capítulo se reúnen las estadísticas económicas de comercio internacional, balanza de pagos y precios internos, así como las cuentas nacionales (expresadas en moneda nacional y en dólares). En el tercer capítulo se presenta la información cuantitativa disponible sobre el medio ambiente. En este caso, se prioriza la información proveniente de fuentes internacionales. Los datos disponibles y recopilados por la CEPAL correspondientes a este tercer capítulo se publican exclusivamente en versión electrónica. La abundante información —a menudo diferente y a veces contradictoria— a la que los usuarios pueden acceder obliga a prestar particular atención a las fichas técnicas, donde se documenta el origen de los datos, su definición y cobertura. Esta referencia se presenta en el cuarto capítulo, sobre metodología y metadatos, que complementa la información más específica que figura en las notas al pie de los cuadros.
The Statistical Yearbook for Latin America and the Caribbean seeks to respond to the demands of users who require reliable and sound statistical information in order to analyse the economic, social and environmental situation of the region. This year’s edition includes information available up to mid-December 2012.
This edition of the Statistical Yearbook is similar in structure to the 2011 edition as no significant changes have been made in terms of content or design.
The Yearbook comprises four chapters. The first covers demographic and social indicators and continues to reflect special efforts to mainstream the gender perspective in statistical information and to encompass poverty-related topics. The second chapter presents economic statistics relating to trade, the balance of payments and domestic prices, as well as national accounts. The statistical series are expressed in domestic currency and constant dollars. The third chapter provides the quantitative information available on the environment. Here, priority is given to data from international sources. The electronic version also includes the data available and compiled by the Economic Commission for Latin America and the Caribbean (ECLAC) for this chapter. Given the abundance of different, sometimes conflicting, data now accessible to researchers, special attention must be paid to the data sheets on which the source of the data, their definition and coverage are specified. This information is presented in the fourth chapter, which deals with methodology and metadata, supplementing the more specific information contained in the footnotes to each of the tables in this Yearbook.

20 ECLAC, Statistical Yearbook for Latin America and the Caribbean, 2012
Como ocurre desde 2005, las versiones impresa y electrónica del Anuario no son exactamente iguales. En la versión impresa se reúne una selección de cuadros orientados a brindar información estadística desde la perspectiva regional, privilegiando la comparabilidad internacional de los datos, como es el caso de la información sobre pobreza y sobre cuentas nacionales en dólares elaboradas por la CEPAL. Asimismo, se ofrece al usuario información sobre la situación de los países de la región en relación con las prioridades de la comunidad regional e internacional, en el marco de los Objetivos de Desarrollo del Milenio. La versión electrónica de este Anuario está también en CD-ROM y en línea, en el sitio web de la CEPAL; en ella se incluye un mayor número de cuadros que brindan información más detallada —y sobre un período histórico mucho más amplio— acerca de la situación económica, social y ambiental de cada país. Cada vez que fue posible garantizar la homogeneidad de las series de tiempo, los datos presentados en la versión electrónica cubren también una mayor cantidad de años. Para facilitar la consulta, los cuadros se presentan en un índice único, disponible en ambas versiones del Anuario. La CEPAL priorizará su labor de difusión de información estadística oportuna a través de CEPALSTAT. En este portal de información, que fue objeto de un profundo proceso de modernización durante 2012, se incluye un conjunto de bases de datos temáticas que cubren diferentes aspectos (sociales, cuentas nacionales, ambientales, género, actividades productivas y comercio exterior, entre otros) que se actualizan periódicamente; los usuarios pueden obtener cuadros estadísticos y gráficos en diferentes formatos, con una elevada velocidad de procesamiento y dentro de un esquema de servicios en línea (web services). Es posible acceder a CEPALSTAT a través del sitio web de la CEPAL (http://www.cepal.org/estadisticas/). Se solicita a los usuarios hacer llegar sus observaciones sobre el diseño y el contenido del Anuario Estadístico de América Latina y el Caribe a la siguiente dirección electrónica: [email protected].
As has been the case since 2005, there are some differences between the printed and electronic versions of the Yearbook. The printed version contains a selection of tables providing statistical information from the regional perspective, with emphasis on the international comparability of data, such as the national accounts statistics in dollars prepared by ECLAC. In addition, information is provided on the progress made by the countries of the region towards achieving the objectives defined by the regional and international community in the framework of the Millennium Development Goals. The electronic version, available on CD-ROM and through the ECLAC website, includes a greater number of tables —and over a much longer period— with more detailed information on each country’s economic, environmental and social situation.
Wherever it was possible to ensure homogeneity of the time series, the data presented in the electronic version cover a greater number of years. For ease of reference, the tables are listed in a single index available in both versions of the Yearbook. ECLAC also disseminates statistical information through its information portal, CEPALSTAT. This portal underwent a thorough modernization in 2012 and contains a series of thematic databases covering a variety of issues (social, national accounts, the environment, gender affairs, productive activities, and external trade, among others), which are updated regularly. Researchers may use these data to generate statistical tables and charts in different formats, with rapid processing via web services. Access to CEPALSTAT is available through the ECLAC website at www.cepal.org/estadisticas/.
Users are invited to submit any comments on the design and content of the Statistical Yearbook for Latin America and the Caribbean to the following e-mail address: [email protected].

1. Estadísticas sociales Social statistics
�
CEPAL, Anuario Estadístico de América Latina y el Caribe, 2012 21


CE
PA
L, Anuario E
stadístico de Am
érica Latina y el Caribe, 2012
23 1.1 POBLACIÓN / POPULATION
1.1.1 POBLACIÓN TOTAL TOTAL POPULATION
(Miles de personas, a mitad de cada año / Thousands of persons, at mid-year)
País 2010 2011 2012 2013 2014 2015 Country
Anguila 15 16 16 16 16 17 Anguilla Antigua y Barbuda 89 90 91 91 92 93 Antigua and Barbuda Antiguas Antillas Neerlandesas 201 203 205 206 207 208 Former Netherlands AntillesArgentina 40 370 40 719 41 072 41 425 41 775 42 119 Argentina Aruba 107 108 109 109 109 109 Aruba Bahamas 343 347 351 355 359 363 Bahamas Barbados 273 274 275 275 276 276 Barbados Belice 312 318 324 331 337 344 Belize Bolivia (Estado Plurinacional de) 9 995 10 147 10 299 10 449 10 598 10 746 Bolivia (Plurinational State of) Brasil 195 153 196 812 198 423 199 985 201 497 202 956 Brazil Chile 17 149 17 303 17 454 17 603 17 748 17 889 Chile Colombia 46 448 47 093 47 735 48 374 49 007 49 633 Colombia Costa Rica 4 669 4 734 4 798 4 860 4 920 4 978 Costa Rica Cuba 11 298 11 297 11 295 11 291 11 287 11 281 Cuba Dominica 68 68 68 68 68 68 Dominica Ecuador 14 490 14 688 14 883 15 075 15 263 15 446 Ecuador El Salvador 6 218 6 252 6 288 6 326 6 365 6 405 El Salvador Granada 104 105 105 106 106 107 Grenada Guatemala 14 334 14 688 15 051 15 419 15 790 16 158 Guatemala Guyana 754 756 758 759 761 763 Guyana Haití 9 884 10 009 10 135 10 261 10 386 10 510 Haiti Honduras 7 619 7 769 7 922 8 075 8 228 8 378 Honduras Islas Caimán 56 57 57 58 58 59 Cayman Islands Islas Turcas y Caicos 38 39 40 40 40 41 Turks and Caicos Islands Islas Vírgenes Británicas 23 23 24 24 24 24 British Virgin Islands Islas Vírgenes de los Estados Unidos 109 109 109 108 108 108 United States Virgin Islands Jamaica 2 741 2 751 2 761 2 771 2 781 2 790 Jamaica México 112 364 113 591 114 800 115 988 117 150 118 283 Mexico Montserrat 6 6 6 6 6 6 Montserrat Nicaragua 5 813 5 894 5 979 6 066 6 152 6 236 Nicaragua Panamá 3 474 3 528 3 582 3 635 3 688 3 741 Panama Paraguay 6 458 6 567 6 675 6 782 6 888 6 993 Paraguay Perú 29 272 29 605 29 948 30 297 30 647 30 994 Peru Puerto Rico 3 749 3 746 3 743 3 742 3 742 3 742 Puerto Rico República Dominicana 9 907 10 036 10 164 10 291 10 416 10 539 Dominican Republic Saint Kitts y Nevis 52 53 54 54 55 56 Saint Kitts and Nevis San Vicente y las Granadinas 109 109 109 109 109 109 Saint Vincent and the Grenadines Santa Lucía 174 176 178 180 181 183 Saint Lucia Suriname 525 529 534 539 543 548 Suriname Trinidad y Tabago 1 341 1 346 1 351 1 355 1 359 1 363 Trinidad and Tobago Uruguay 3 373 3 384 3 395 3 407 3 418 3 430 Uruguay Venezuela (República Bolivariana de) 29 039 29 492 29 943 30 390 30 831 31 267 Venezuela (Bolivarian Republic of) América Latina y el Caribe a b 590 082 596 629 603 174 609 686 616 119 622 437 Latin America and the Caribbean a b
América Latina c 577 326 583 607 589 840 595 998 602 055 607 982 Latin America c
El Caribe a d 41 646 41 930 42 212 42 493 42 769 43 041 The Caribbean a d
a Se listan separadamente solo aquellos países o áreas con 100.000 o más habitantes en 2010; el resto se incluye en los agregados regionales pero no se lista separadamente, por lo tanto, estos agregados regionales no corresponden a la suma de los países.
b Incluye 46 países. Véanse las notas técnicas.c Incluye 20 países. Véanse las notas técnicas.d Incluye 24 países. Véanse las notas técnicas.
a Only those countries or areas with 100,000 inhabitants or more in 2010 are listed separately; the rest are included in the regional groups; thus, the regional aggregates are not equal to the sum of the countries listed separately.
b Includes 46 countries. See technical notes.c Includes 20 countries. See technical notes.d Includes 24 countries. See technical notes.
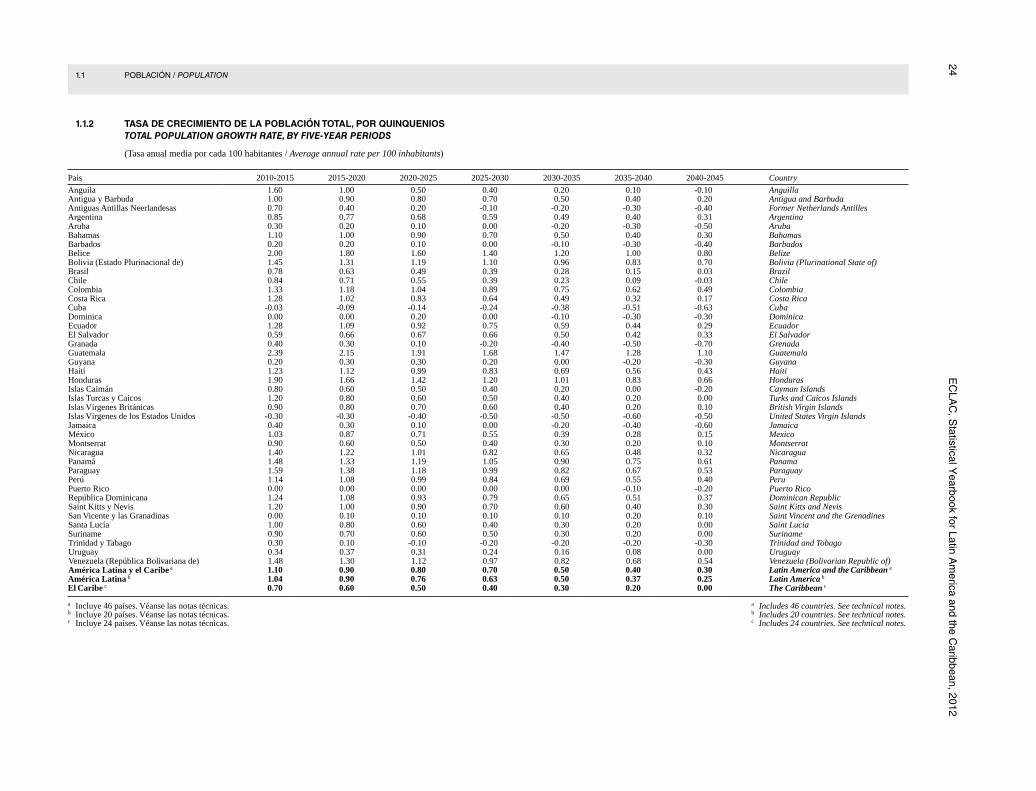
24 E
CLA
C, S
tatistical Yearbook for Latin A
merica and the C
aribbean, 2012 1.1 POBLACIÓN / POPULATION
1.1.2 TASA DE CRECIMIENTO DE LA POBLACIÓN TOTAL, POR QUINQUENIOS TOTAL POPULATION GROWTH RATE, BY FIVE-YEAR PERIODS
(Tasa anual media por cada 100 habitantes / Average annual rate per 100 inhabitants)
País 2010-2015 2015-2020 2020-2025 2025-2030 2030-2035 2035-2040 2040-2045 Country
Anguila 1.60 1.00 0.50 0.40 0.20 0.10 -0.10 Anguilla Antigua y Barbuda 1.00 0.90 0.80 0.70 0.50 0.40 0.20 Antigua and Barbuda Antiguas Antillas Neerlandesas 0.70 0.40 0.20 -0.10 -0.20 -0.30 -0.40 Former Netherlands AntillesArgentina 0.85 0.77 0.68 0.59 0.49 0.40 0.31 Argentina Aruba 0.30 0.20 0.10 0.00 -0.20 -0.30 -0.50 Aruba Bahamas 1.10 1.00 0.90 0.70 0.50 0.40 0.30 Bahamas Barbados 0.20 0.20 0.10 0.00 -0.10 -0.30 -0.40 Barbados Belice 2.00 1.80 1.60 1.40 1.20 1.00 0.80 Belize Bolivia (Estado Plurinacional de) 1.45 1.31 1.19 1.10 0.96 0.83 0.70 Bolivia (Plurinational State of) Brasil 0.78 0.63 0.49 0.39 0.28 0.15 0.03 Brazil Chile 0.84 0.71 0.55 0.39 0.23 0.09 -0.03 Chile Colombia 1.33 1.18 1.04 0.89 0.75 0.62 0.49 Colombia Costa Rica 1.28 1.02 0.83 0.64 0.49 0.32 0.17 Costa Rica Cuba -0.03 -0.09 -0.14 -0.24 -0.38 -0.51 -0.63 Cuba Dominica 0.00 0.00 0.20 0.00 -0.10 -0.30 -0.30 Dominica Ecuador 1.28 1.09 0.92 0.75 0.59 0.44 0.29 Ecuador El Salvador 0.59 0.66 0.67 0.66 0.50 0.42 0.33 El Salvador Granada 0.40 0.30 0.10 -0.20 -0.40 -0.50 -0.70 Grenada Guatemala 2.39 2.15 1.91 1.68 1.47 1.28 1.10 Guatemala Guyana 0.20 0.30 0.30 0.20 0.00 -0.20 -0.30 Guyana Haití 1.23 1.12 0.99 0.83 0.69 0.56 0.43 Haiti Honduras 1.90 1.66 1.42 1.20 1.01 0.83 0.66 Honduras Islas Caimán 0.80 0.60 0.50 0.40 0.20 0.00 -0.20 Cayman Islands Islas Turcas y Caicos 1.20 0.80 0.60 0.50 0.40 0.20 0.00 Turks and Caicos Islands Islas Vírgenes Británicas 0.90 0.80 0.70 0.60 0.40 0.20 0.10 British Virgin Islands Islas Vírgenes de los Estados Unidos -0.30 -0.30 -0.40 -0.50 -0.50 -0.60 -0.50 United States Virgin Islands Jamaica 0.40 0.30 0.10 0.00 -0.20 -0.40 -0.60 Jamaica México 1.03 0.87 0.71 0.55 0.39 0.28 0.15 Mexico Montserrat 0.90 0.60 0.50 0.40 0.30 0.20 0.10 Montserrat Nicaragua 1.40 1.22 1.01 0.82 0.65 0.48 0.32 Nicaragua Panamá 1.48 1.33 1.19 1.05 0.90 0.75 0.61 Panama Paraguay 1.59 1.38 1.18 0.99 0.82 0.67 0.53 Paraguay Perú 1.14 1.08 0.99 0.84 0.69 0.55 0.40 Peru Puerto Rico 0.00 0.00 0.00 0.00 0.00 -0.10 -0.20 Puerto Rico República Dominicana 1.24 1.08 0.93 0.79 0.65 0.51 0.37 Dominican Republic Saint Kitts y Nevis 1.20 1.00 0.90 0.70 0.60 0.40 0.30 Saint Kitts and Nevis San Vicente y las Granadinas 0.00 0.10 0.10 0.10 0.10 0.20 0.10 Saint Vincent and the Grenadines Santa Lucía 1.00 0.80 0.60 0.40 0.30 0.20 0.00 Saint Lucia Suriname 0.90 0.70 0.60 0.50 0.30 0.20 0.00 Suriname Trinidad y Tabago 0.30 0.10 -0.10 -0.20 -0.20 -0.20 -0.30 Trinidad and Tobago Uruguay 0.34 0.37 0.31 0.24 0.16 0.08 0.00 Uruguay Venezuela (República Bolivariana de) 1.48 1.30 1.12 0.97 0.82 0.68 0.54 Venezuela (Bolivarian Republic of) América Latina y el Caribe a 1.10 0.90 0.80 0.70 0.50 0.40 0.30 Latin America and the Caribbean a
América Latina b 1.04 0.90 0.76 0.63 0.50 0.37 0.25 Latin America b
El Caribe c 0.70 0.60 0.50 0.40 0.30 0.20 0.00 The Caribbean c
a Incluye 46 países. Véanse las notas técnicas.b Incluye 20 países. Véanse las notas técnicas.c Incluye 24 países. Véanse las notas técnicas.
a Includes 46 countries. See technical notes.b Includes 20 countries. See technical notes.c Includes 24 countries. See technical notes.
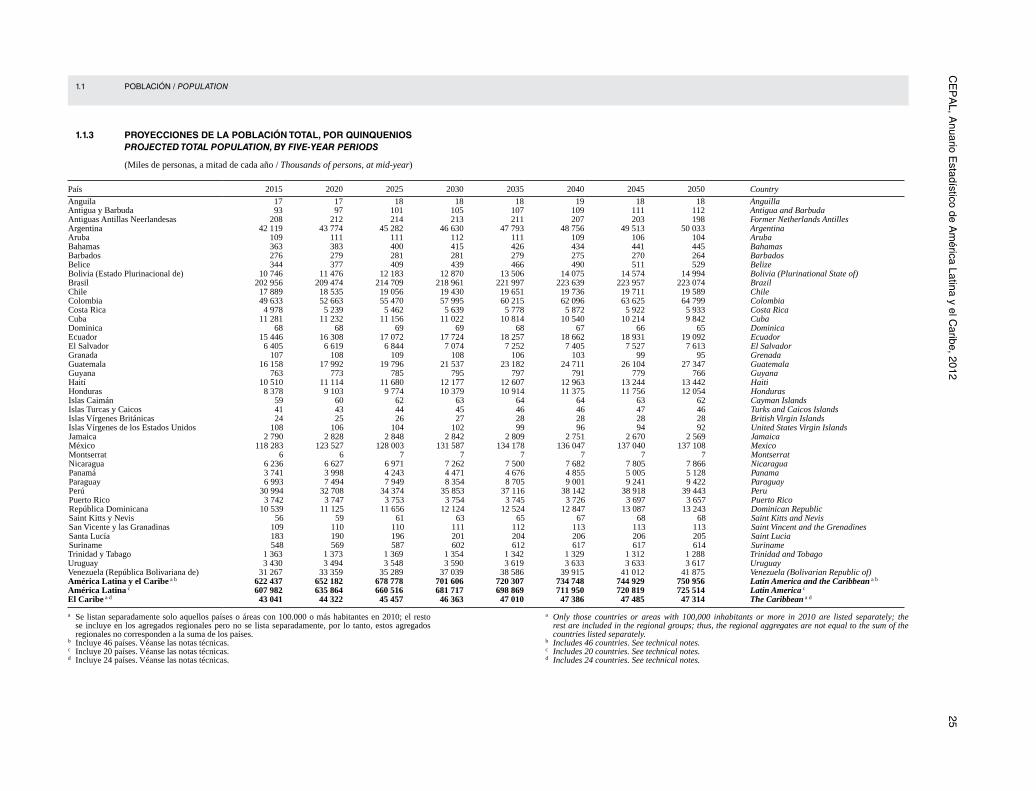
CE
PA
L, Anuario E
stadístico de Am
érica Latina y el Caribe, 2012
25 1.1 POBLACIÓN / POPULATION
1.1.3 PROYECCIONES DE LA POBLACIÓN TOTAL, POR QUINQUENIOS PROJECTED TOTAL POPULATION, BY FIVE-YEAR PERIODS
(Miles de personas, a mitad de cada año / Thousands of persons, at mid-year)
País 2015 2020 2025 2030 2035 2040 2045 2050 Country
Anguila 17 17 18 18 18 19 18 18 Anguilla Antigua y Barbuda 93 97 101 105 107 109 111 112 Antigua and Barbuda Antiguas Antillas Neerlandesas 208 212 214 213 211 207 203 198 Former Netherlands AntillesArgentina 42 119 43 774 45 282 46 630 47 793 48 756 49 513 50 033 Argentina Aruba 109 111 111 112 111 109 106 104 Aruba Bahamas 363 383 400 415 426 434 441 445 Bahamas Barbados 276 279 281 281 279 275 270 264 Barbados Belice 344 377 409 439 466 490 511 529 Belize Bolivia (Estado Plurinacional de) 10 746 11 476 12 183 12 870 13 506 14 075 14 574 14 994 Bolivia (Plurinational State of) Brasil 202 956 209 474 214 709 218 961 221 997 223 639 223 957 223 074 Brazil Chile 17 889 18 535 19 056 19 430 19 651 19 736 19 711 19 589 Chile Colombia 49 633 52 663 55 470 57 995 60 215 62 096 63 625 64 799 Colombia Costa Rica 4 978 5 239 5 462 5 639 5 778 5 872 5 922 5 933 Costa Rica Cuba 11 281 11 232 11 156 11 022 10 814 10 540 10 214 9 842 Cuba Dominica 68 68 69 69 68 67 66 65 Dominica Ecuador 15 446 16 308 17 072 17 724 18 257 18 662 18 931 19 092 Ecuador El Salvador 6 405 6 619 6 844 7 074 7 252 7 405 7 527 7 613 El Salvador Granada 107 108 109 108 106 103 99 95 Grenada Guatemala 16 158 17 992 19 796 21 537 23 182 24 711 26 104 27 347 Guatemala Guyana 763 773 785 795 797 791 779 766 Guyana Haití 10 510 11 114 11 680 12 177 12 607 12 963 13 244 13 442 Haiti Honduras 8 378 9 103 9 774 10 379 10 914 11 375 11 756 12 054 Honduras Islas Caimán 59 60 62 63 64 64 63 62 Cayman Islands Islas Turcas y Caicos 41 43 44 45 46 46 47 46 Turks and Caicos Islands Islas Vírgenes Británicas 24 25 26 27 28 28 28 28 British Virgin Islands Islas Vírgenes de los Estados Unidos 108 106 104 102 99 96 94 92 United States Virgin Islands Jamaica 2 790 2 828 2 848 2 842 2 809 2 751 2 670 2 569 Jamaica México 118 283 123 527 128 003 131 587 134 178 136 047 137 040 137 108 Mexico Montserrat 6 6 7 7 7 7 7 7 Montserrat Nicaragua 6 236 6 627 6 971 7 262 7 500 7 682 7 805 7 866 Nicaragua Panamá 3 741 3 998 4 243 4 471 4 676 4 855 5 005 5 128 Panama Paraguay 6 993 7 494 7 949 8 354 8 705 9 001 9 241 9 422 Paraguay Perú 30 994 32 708 34 374 35 853 37 116 38 142 38 918 39 443 Peru Puerto Rico 3 742 3 747 3 753 3 754 3 745 3 726 3 697 3 657 Puerto Rico República Dominicana 10 539 11 125 11 656 12 124 12 524 12 847 13 087 13 243 Dominican Republic Saint Kitts y Nevis 56 59 61 63 65 67 68 68 Saint Kitts and Nevis San Vicente y las Granadinas 109 110 110 111 112 113 113 113 Saint Vincent and the Grenadines Santa Lucía 183 190 196 201 204 206 206 205 Saint Lucia Suriname 548 569 587 602 612 617 617 614 Suriname Trinidad y Tabago 1 363 1 373 1 369 1 354 1 342 1 329 1 312 1 288 Trinidad and Tobago Uruguay 3 430 3 494 3 548 3 590 3 619 3 633 3 633 3 617 Uruguay Venezuela (República Bolivariana de) 31 267 33 359 35 289 37 039 38 586 39 915 41 012 41 875 Venezuela (Bolivarian Republic of) América Latina y el Caribe a b 622 437 652 182 678 778 701 606 720 307 734 748 744 929 750 956 Latin America and the Caribbean a b
América Latina c 607 982 635 864 660 516 681 717 698 869 711 950 720 819 725 514 Latin America c
El Caribe a d 43 041 44 322 45 457 46 363 47 010 47 386 47 485 47 314 The Caribbean a d
a Se listan separadamente solo aquellos países o áreas con 100.000 o más habitantes en 2010; el resto se incluye en los agregados regionales pero no se lista separadamente, por lo tanto, estos agregados regionales no corresponden a la suma de los países.
b Incluye 46 países. Véanse las notas técnicas.c Incluye 20 países. Véanse las notas técnicas.d Incluye 24 países. Véanse las notas técnicas.
a Only those countries or areas with 100,000 inhabitants or more in 2010 are listed separately; the rest are included in the regional groups; thus, the regional aggregates are not equal to the sum of the countries listed separately.
b Includes 46 countries. See technical notes.c Includes 20 countries. See technical notes.d Includes 24 countries. See technical notes.

26 E
CLA
C, S
tatistical Yearbook for Latin A
merica and the C
aribbean, 2012 1.1 POBLACIÓN / POPULATION
1.1.4 ESTRUCTURA DE LA POBLACIÓN TOTAL, POR GRUPOS DE EDAD STRUCTURE OF THE TOTAL POPULATION, BY AGE GROUPS
(Porcentaje de la población total / Percentage of total population)
País 2010 2020 2030 2040
Country 0-14 15-34 35-49 50-64 65 y más
65 and over 0-14 15-34 35-49 50-64 65 y más 65 and over 0-14 15-34 35-49 50-64 65 y más
65 and over 0-14 15-34 35-49 50-64 65 y más 65 and over
Antiguas Antillas Neerlandesas 20.8 24.5 25.5 18.8 10.4 18.4 20.3 24.8 22.3 14.1 15.2 17.6 23.7 23.1 20.2 13.3 19.4 16.4 24.8 26.1
Former Netherlands Antilles
Argentina 25.0 32.7 18.0 13.8 10.5 23.1 30.5 20.4 14.2 11.9 20.8 28.6 20.7 16.4 13.6 18.7 27.2 20.1 18.3 15.6 Argentina Aruba 19.2 26.0 25.5 19.8 9.5 16.3 26.7 18.4 24.6 14.0 16.0 23.6 19.1 19.7 21.6 15.4 22.0 20.4 17.1 25.1 Aruba Bahamas 22.5 33.5 22.7 14.5 6.8 20.5 29.9 21.7 18.1 9.9 18.7 25.7 22.6 18.3 14.7 16.8 24.7 20.4 19.5 18.6 Bahamas Barbados 17.4 28.8 23.5 18.9 11.4 15.7 26.0 21.2 22.0 15.0 15.3 22.0 21.0 20.5 21.1 14.7 21.1 19.0 20.3 25.0 Barbados Belice 35.0 37.0 16.5 7.6 4.0 30.3 36.5 17.6 10.9 4.7 26.8 33.0 20.5 12.4 7.3 22.7 30.9 21.2 15.0 10.2 Belize Bolivia (Estado Plurinacional de) 35.8 34.8 15.6 9.0 4.8 31.1 35.6 17.2 10.3 5.8 26.7 34.2 19.5 12.2 7.3 23.0 31.7 21.3 14.4 9.7
Bolivia (Plurinational State of)
Brasil 25.5 34.5 20.3 12.8 6.9 20.1 32.2 22.2 15.9 9.6 17.0 28.7 22.6 18.0 13.7 15.4 24.2 22.0 20.7 17.7 Brazil Chile 22.3 31.8 21.7 15.1 9.2 20.2 29.6 19.8 18.3 12.2 18.6 25.7 21.4 17.5 16.9 17.2 24.5 19.6 18.4 20.3 Chile Colombia 28.8 34.3 19.5 11.9 5.6 25.4 32.3 19.6 14.7 8.0 22.5 30.1 20.3 15.7 11.4 20.1 28.2 20.2 17.0 14.6 Colombia Costa Rica 25.3 35.7 20.0 12.5 6.5 21.9 32.6 20.6 15.9 9.0 19.7 28.1 22.5 16.4 13.3 17.9 25.8 20.6 19.1 16.6 Costa Rica Cuba 17.3 27.0 26.9 16.5 12.3 14.8 25.5 20.4 23.0 16.3 13.8 21.7 19.6 22.9 22.1 13.1 20.1 18.7 19.0 29.2 Cuba Ecuador 30.6 34.0 17.7 11.1 6.7 26.1 33.5 18.5 13.1 8.8 23.0 31.4 19.7 14.5 11.4 20.5 28.6 20.9 16.0 14.0 Ecuador El Salvador 31.5 34.6 16.4 10.2 7.3 27.2 35.3 17.1 11.7 8.7 25.0 31.7 20.0 13.2 10.2 21.5 29.7 21.6 14.7 12.3 El Salvador Granada 27.5 39.3 16.0 9.9 7.2 26.2 34.6 18.8 12.8 7.6 22.3 29.1 23.6 13.5 11.4 18.0 28.5 18.2 21.2 14.1 Grenada Guatemala 41.5 34.5 12.4 7.2 4.4 37.0 36.0 14.6 7.5 5.0 31.8 36.5 17.1 9.1 5.5 26.8 35.1 19.7 11.6 6.8 Guatemala Guyana 33.6 33.1 19.2 9.8 4.3 23.7 36.9 18.8 14.2 6.3 22.5 33.0 18.2 16.3 10.1 19.4 25.7 24.8 15.4 14.6 Guyana Haití 35.9 37.0 14.5 8.3 4.4 32.1 36.2 17.2 9.6 5.0 28.4 34.1 20.2 11.0 6.3 25.0 32.2 20.3 14.6 7.9 Haiti Honduras 36.8 36.9 14.3 7.7 4.3 31.8 36.8 17.0 9.2 5.2 27.0 34.6 20.3 11.4 6.7 22.6 32.1 21.5 14.8 9.0 Honduras Islas Vírgenes de los Estados Unidos 20.2 25.6 19.3 20.5 14.4 17.9 26.9 14.2 20.1 20.9 17.0 24.3 18.1 14.9 25.7 15.6 23.6 19.5 14.9 26.5
United States Virgin Islands
Jamaica 29.1 31.7 20.0 11.4 7.8 24.8 32.5 17.5 15.8 9.3 22.3 30.0 18.3 16.3 13.1 19.3 27.0 20.3 15.7 17.8 Jamaica México 27.9 34.2 19.8 11.5 6.6 23.3 31.5 21.6 14.6 9.0 20.0 28.4 20.9 18.2 12.4 18.3 25.2 20.5 18.7 17.3 Mexico Nicaragua 34.5 37.7 15.1 8.2 4.6 30.2 35.4 18.1 10.4 5.8 25.7 32.5 20.8 12.7 8.3 22.0 30.4 20.5 16.1 11.0 Nicaragua Panamá 29.0 32.8 20.0 11.6 6.7 25.5 31.7 19.7 14.4 8.6 22.8 30.2 19.5 16.0 11.5 20.5 28.3 20.0 16.4 14.9 Panama Paraguay 33.5 36.1 15.4 9.8 5.2 29.5 35.5 17.6 10.8 6.6 25.8 33.2 20.6 12.0 8.5 22.8 30.9 20.8 15.4 10.1 Paraguay Perú 29.9 35.4 18.2 10.5 6.0 25.9 33.8 19.8 12.9 7.6 22.6 31.2 20.8 15.2 10.1 20.3 28.5 21.0 17.1 13.2 Peru Puerto Rico 21.0 29.8 19.8 16.6 12.8 18.8 28.1 20.1 17.5 15.6 16.7 25.8 20.4 18.4 18.8 15.2 23.7 19.9 19.3 21.9 Puerto Rico República Dominicana 31.4 34.5 17.5 10.5 6.1 28.1 33.3 18.3 12.8 7.6 24.6 31.6 19.5 14.1 10.2 21.9 29.7 19.8 15.7 12.9 Dominican Republic San Vicente y las Granadinas 26.5 34.7 20.1 12.0 6.8 23.0 32.3 20.0 16.7 8.0 19.7 29.7 20.9 17.0 12.6 17.4 27.4 21.3 18.4 15.5
Saint Vincent and the Grenadines
Santa Lucía 25.9 36.6 19.8 11.0 6.7 23.0 32.9 21.2 15.1 7.8 19.3 28.6 23.6 16.9 11.6 16.5 26.5 21.1 20.3 15.7 Saint Lucia Suriname 28.6 32.5 20.9 11.6 6.5 24.1 32.2 20.2 15.8 7.7 21.6 30.1 20.5 16.5 11.3 19.2 27.0 21.0 17.8 14.9 Suriname Trinidad y Tabago 20.6 36.3 21.6 14.5 7.0 19.8 28.8 23.6 18.2 9.7 16.7 24.9 24.3 19.0 15.0 15.4 24.6 17.8 23.7 18.5 Trinidad and Tobago Uruguay 22.5 29.3 19.0 15.3 13.9 20.5 28.7 19.5 16.4 15.0 19.0 27.1 19.7 17.3 17.0 17.8 25.3 20.2 17.7 19.0 Uruguay Venezuela (República Bolivariana de) 29.5 34.8 18.6 11.5 5.6 26.3 32.8 19.5 13.6 7.8 23.1 30.7 20.7 14.9 10.6 20.5 28.9 20.3 17.0 13.3
Venezuela (Bolivarian Republic of)
América Latina y el Caribe a 27.9 34.1 19.2 11.9 6.9 24.1 32.3 20.2 14.5 8.9 21.2 29.7 20.8 16.2 12.1 18.8 27.2 20.6 17.8 15.5
Latin America and the
Caribbean a
América Latina b 27.7 34.2 19.2 12.0 6.9 23.6 32.3 20.6 14.5 9.0 20.6 29.6 21.1 16.5 12.2 18.6 26.7 20.9 18.2 15.6 Latin America b
El Caribe c 26.6 32.0 20.3 12.7 8.4 23.7 31.1 18.9 16.0 10.4 21.3 28.7 20.0 16.3 13.7 19.3 26.8 19.7 17.0 17.2 The Caribbean c
a Incluye 46 países. Véanse las notas técnicas.b Incluye 20 países. Véanse las notas técnicas.c Incluye 24 países. Véanse las notas técnicas.
a Includes 46 countries. See technical notes.b Includes 20 countries. See technical notes.c Includes 24 countries. See technical notes.
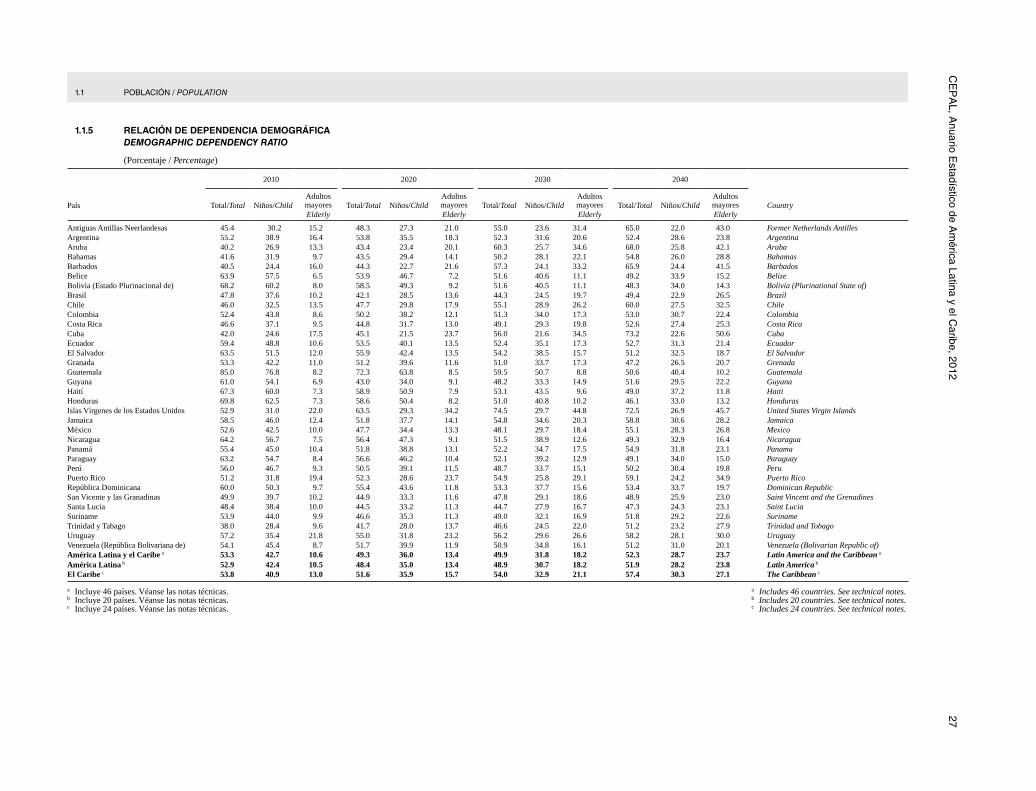
CE
PA
L, Anuario E
stadístico de Am
érica Latina y el Caribe, 2012
27 1.1 POBLACIÓN / POPULATION
1.1.5 RELACIÓN DE DEPENDENCIA DEMOGRÁFICA DEMOGRAPHIC DEPENDENCY RATIO
(Porcentaje / Percentage)
2010 2020 2030 2040
País Total/Total Niños/ChildAdultos mayoresElderly
Total/Total Niños/ChildAdultos mayoresElderly
Total/Total Niños/ChildAdultos mayoresElderly
Total/Total Niños/ChildAdultos mayoresElderly
Country
Antiguas Antillas Neerlandesas 45.4 30.2 15.2 48.3 27.3 21.0 55.0 23.6 31.4 65.0 22.0 43.0 Former Netherlands AntillesArgentina 55.2 38.9 16.4 53.8 35.5 18.3 52.3 31.6 20.6 52.4 28.6 23.8 Argentina Aruba 40.2 26.9 13.3 43.4 23.4 20.1 60.3 25.7 34.6 68.0 25.8 42.1 Aruba Bahamas 41.6 31.9 9.7 43.5 29.4 14.1 50.2 28.1 22.1 54.8 26.0 28.8 Bahamas Barbados 40.5 24.4 16.0 44.3 22.7 21.6 57.3 24.1 33.2 65.9 24.4 41.5 Barbados Belice 63.9 57.5 6.5 53.9 46.7 7.2 51.6 40.6 11.1 49.2 33.9 15.2 Belize Bolivia (Estado Plurinacional de) 68.2 60.2 8.0 58.5 49.3 9.2 51.6 40.5 11.1 48.3 34.0 14.3 Bolivia (Plurinational State of) Brasil 47.8 37.6 10.2 42.1 28.5 13.6 44.3 24.5 19.7 49.4 22.9 26.5 Brazil Chile 46.0 32.5 13.5 47.7 29.8 17.9 55.1 28.9 26.2 60.0 27.5 32.5 Chile Colombia 52.4 43.8 8.6 50.2 38.2 12.1 51.3 34.0 17.3 53.0 30.7 22.4 Colombia Costa Rica 46.6 37.1 9.5 44.8 31.7 13.0 49.1 29.3 19.8 52.6 27.4 25.3 Costa Rica Cuba 42.0 24.6 17.5 45.1 21.5 23.7 56.0 21.6 34.5 73.2 22.6 50.6 Cuba Ecuador 59.4 48.8 10.6 53.5 40.1 13.5 52.4 35.1 17.3 52.7 31.3 21.4 Ecuador El Salvador 63.5 51.5 12.0 55.9 42.4 13.5 54.2 38.5 15.7 51.2 32.5 18.7 El Salvador Granada 53.3 42.2 11.0 51.2 39.6 11.6 51.0 33.7 17.3 47.2 26.5 20.7 Grenada Guatemala 85.0 76.8 8.2 72.3 63.8 8.5 59.5 50.7 8.8 50.6 40.4 10.2 Guatemala Guyana 61.0 54.1 6.9 43.0 34.0 9.1 48.2 33.3 14.9 51.6 29.5 22.2 Guyana Haití 67.3 60.0 7.3 58.9 50.9 7.9 53.1 43.5 9.6 49.0 37.2 11.8 Haiti Honduras 69.8 62.5 7.3 58.6 50.4 8.2 51.0 40.8 10.2 46.1 33.0 13.2 Honduras Islas Vírgenes de los Estados Unidos 52.9 31.0 22.0 63.5 29.3 34.2 74.5 29.7 44.8 72.5 26.9 45.7 United States Virgin Islands Jamaica 58.5 46.0 12.4 51.8 37.7 14.1 54.8 34.6 20.3 58.8 30.6 28.2 Jamaica México 52.6 42.5 10.0 47.7 34.4 13.3 48.1 29.7 18.4 55.1 28.3 26.8 Mexico Nicaragua 64.2 56.7 7.5 56.4 47.3 9.1 51.5 38.9 12.6 49.3 32.9 16.4 Nicaragua Panamá 55.4 45.0 10.4 51.8 38.8 13.1 52.2 34.7 17.5 54.9 31.8 23.1 Panama Paraguay 63.2 54.7 8.4 56.6 46.2 10.4 52.1 39.2 12.9 49.1 34.0 15.0 Paraguay Perú 56.0 46.7 9.3 50.5 39.1 11.5 48.7 33.7 15.1 50.2 30.4 19.8 Peru Puerto Rico 51.2 31.8 19.4 52.3 28.6 23.7 54.9 25.8 29.1 59.1 24.2 34.9 Puerto Rico República Dominicana 60.0 50.3 9.7 55.4 43.6 11.8 53.3 37.7 15.6 53.4 33.7 19.7 Dominican Republic San Vicente y las Granadinas 49.9 39.7 10.2 44.9 33.3 11.6 47.8 29.1 18.6 48.9 25.9 23.0 Saint Vincent and the Grenadines Santa Lucía 48.4 38.4 10.0 44.5 33.2 11.3 44.7 27.9 16.7 47.3 24.3 23.1 Saint Lucia Suriname 53.9 44.0 9.9 46.6 35.3 11.3 49.0 32.1 16.9 51.8 29.2 22.6 Suriname Trinidad y Tabago 38.0 28.4 9.6 41.7 28.0 13.7 46.6 24.5 22.0 51.2 23.2 27.9 Trinidad and Tobago Uruguay 57.2 35.4 21.8 55.0 31.8 23.2 56.2 29.6 26.6 58.2 28.1 30.0 Uruguay Venezuela (República Bolivariana de) 54.1 45.4 8.7 51.7 39.9 11.9 50.9 34.8 16.1 51.2 31.0 20.1 Venezuela (Bolivarian Republic of) América Latina y el Caribe a 53.3 42.7 10.6 49.3 36.0 13.4 49.9 31.8 18.2 52.3 28.7 23.7 Latin America and the Caribbean a
América Latina b 52.9 42.4 10.5 48.4 35.0 13.4 48.9 30.7 18.2 51.9 28.2 23.8 Latin America b
El Caribe c 53.8 40.9 13.0 51.6 35.9 15.7 54.0 32.9 21.1 57.4 30.3 27.1 The Caribbean c
a Incluye 46 países. Véanse las notas técnicas.b Incluye 20 países. Véanse las notas técnicas.c Incluye 24 países. Véanse las notas técnicas.
a Includes 46 countries. See technical notes.b Includes 20 countries. See technical notes.c Includes 24 countries. See technical notes.

28 E
CLA
C, S
tatistical Yearbook for Latin A
merica and the C
aribbean, 2012 1.1 POBLACIÓN / POPULATION
1.1.6 TASA DE CRECIMIENTO ANUAL DE LA POBLACIÓN TOTAL, POR GRUPOS DE EDAD ANNUAL GROWTH RATE OF THE TOTAL POPULATION, BY AGE GROUPS
(Tasa anual media por cada 1.000 habitantes / Average annual rate per thousands inhabitants)
País 0-14 15-59 60 y más/60 and over
Country 2000-2025 2025-2050 2000-2025 2025-2050 2000-2025 2025-2050
Antiguas Antillas Neerlandesas -2.2 -4.3 2.4 -0.3 34.2 6.8 Former Netherlands Antilles
Argentina 0.5 -4.1 11.1 2.2 18.5 19.4 Argentina
Bahamas -0.6 0.1 9.7 2.0 37.2 21.4 Bahamas
Barbados -8.9 -4.5 -1.7 -10.4 27.9 10.4 Barbados
Belice -3.7 -0.8 20.8 3.2 35.5 37.7 Belize
Bolivia (Estado Plurinacional de) 5.8 -5.0 23.6 9.9 31.8 34.0 Bolivia (Plurinational State of)
Brasil 2.6 -4.5 9.6 -1.1 37.2 22.9 Brazil
Chile 0.0 -3.5 8.9 2.8 33.2 15.4 Chile
Colombia 2.0 -3.7 14.9 4.6 40.8 26.0 Colombia
Costa Rica -2.0 -4.5 15.7 0.3 43.3 25.3 Costa Rica
Cuba -9.3 -4.8 -1.9 -8.4 26.2 9.0 Cuba
Ecuador -0.6 -4.8 16.6 2.7 37.5 29.2 Ecuador
El Salvador 1.6 -4.0 19.1 5.4 29.9 34.3 El Salvador
Guatemala 9.8 -2.8 29.3 13.9 32.6 41.9 Guatemala
Guyana -15.7 -23.7 -3.1 -20.8 28.2 15.4 Guyana
Haití 4.8 -2.5 21.3 10.7 30.7 38.2 Haiti
Honduras 4.7 -2.7 26.6 9.5 40.3 38.9 Honduras
Jamaica -3.1 -0.6 11.9 2.3 25.8 26.5 Jamaica
México -3.3 -7.7 13.2 -0.5 37.7 28.4 Mexico
Nicaragua 7.0 -4.1 28.0 11.4 41.8 41.4 Nicaragua
Panamá 3.7 -3.6 15.5 4.8 37.5 25.0 Panama
Paraguay 11.0 -3.2 24.7 13.0 43.8 33.2 Paraguay
Perú -1.6 -4.9 16.2 3.6 35.2 28.9 Peru
Puerto Rico -2.2 -2.9 5.5 -1.7 21.4 13.9 Puerto Rico
República Dominicana 0.3 -4.4 14.4 4.0 39.4 27.6 Dominican Republic
Santa Lucía -4.9 -4.8 10.4 -1.9 25.3 26.0 Saint Lucia
Suriname -14.6 -9.9 5.2 -10.2 24.3 27.3 Suriname
Trinidad y Tabago -7.4 -7.0 1.5 -9.6 33.8 18.6 Trinidad and Tobago
Uruguay -0.3 -4.1 7.1 1.6 11.7 13.3 Uruguay Venezuela (República Bolivariana de) 1.0 -4.8 16.6 4.4 42.4 26.8 Venezuela (Bolivarian Republic of)

CE
PA
L, Anuario E
stadístico de Am
érica Latina y el Caribe, 2012
29 1.1 POBLACIÓN / POPULATION
1.1.7 TASA DE NATALIDAD, POR QUINQUENIOS BIRTH RATE, BY FIVE-YEAR PERIODS
(Tasa bruta por cada 1.000 habitantes / Crude birth rate per thousands inhabitants)
País 2010-2015 2015-2020 2020-2025 2025-2030 2030-2035 2035-2040 2040-2045 Country Antiguas Antillas Neerlandesas 13.1 11.7 10.2 9.0 8.6 8.9 9.4 Former Netherlands AntillesArgentina 16.7 15.8 14.7 13.8 13.1 12.5 11.9 Argentina Aruba 11.1 11.0 11.0 10.8 10.1 9.7 9.7 Aruba Bahamas 15.2 14.4 13.5 12.5 11.6 11.1 10.9 Bahamas Barbados 10.9 10.7 10.4 10.0 9.7 9.6 9.6 Barbados Belice 24.0 22.5 20.6 18.5 16.7 15.4 14.5 Belize Bolivia (Estado Plurinacional de) 24.6 22.3 20.3 18.4 16.8 15.3 14.0 Bolivia (Plurinational State of) Brasil 14.6 13.4 12.4 11.9 11.2 10.6 10.1 Brazil Chile 14.0 13.1 12.2 11.2 10.4 9.8 9.6 Chile Colombia 19.4 18.2 17.0 15.9 14.9 14.1 13.4 Colombia Costa Rica 14.6 13.3 12.5 11.8 11.1 10.5 10.0 Costa Rica Cuba 9.9 9.6 9.1 8.6 8.1 7.9 7.8 Cuba Ecuador 19.6 17.9 16.3 15.0 13.8 12.7 11.8 Ecuador El Salvador 19.8 18.5 16.8 15.1 13.6 13.0 12.5 El Salvador Granada 19.3 18.0 15.6 13.4 12.1 11.7 11.3 Grenada Guatemala 30.5 27.7 25.1 22.7 20.4 18.5 16.8 Guatemala Guyana 17.5 17.0 16.8 15.7 13.8 12.0 11.1 Guyana Haití 25.4 23.1 20.8 18.8 17.1 15.6 14.4 Haiti Honduras 25.3 22.7 20.2 18.1 16.2 14.7 13.4 Honduras Islas Vírgenes de los Estados Unidos 12.1 11.8 11.6 10.9 10.1 9.7 9.6 United States Virgin Islands Jamaica 17.9 17.1 16.0 14.6 13.3 12.3 11.7 Jamaica México 17.3 15.7 14.4 13.2 12.1 11.6 11.1 Mexico Nicaragua 23.2 21.1 19.0 17.1 15.6 14.3 13.1 Nicaragua Panamá 19.4 18.2 17.1 16.1 15.0 14.1 13.2 Panama Paraguay 22.8 20.7 18.7 17.0 15.5 14.3 13.3 Paraguay Perú 19.8 18.3 17.0 15.7 14.6 13.5 12.6 Peru Puerto Rico 12.9 12.1 11.3 10.7 10.2 9.9 9.6 Puerto Rico República Dominicana 21.2 19.7 18.3 17.0 15.9 14.8 13.9 Dominican Republic San Vicente y las Granadinas 16.4 15.0 13.8 12.7 11.9 11.4 11.0 Saint Vincent and the Grenadines Santa Lucía 16.9 15.3 13.6 12.2 11.3 10.7 10.3 Saint Lucia Suriname 17.8 16.6 15.6 14.7 13.6 12.5 11.8 Suriname Trinidad y Tabago 14.3 12.9 11.3 10.4 10.3 10.5 10.4 Trinidad and Tobago Uruguay 14.4 13.9 13.3 12.6 12.0 11.4 10.9 Uruguay Venezuela (República Bolivariana de) 19.8 18.3 16.9 15.7 14.6 13.7 12.9 Venezuela (Bolivarian Republic of) América Latina y el Caribe a 17.8 16.5 15.3 14.2 13.2 12.4 11.8 Latin America and the Caribbean a
América Latina b 17.5 16.1 14.9 13.9 13.0 12.3 11.6 Latin America b
El Caribe c 17.5 16.4 15.4 14.4 13.5 12.8 12.1 The Caribbean c
a Incluye 46 países. Véanse las notas técnicas.b Incluye 20 países. Véanse las notas técnicas.c Incluye 24 países. Véanse las notas técnicas.
a Includes 46 countries. See technical notes.b Includes 20 countries. See technical notes.c Includes 24 countries. See technical notes.
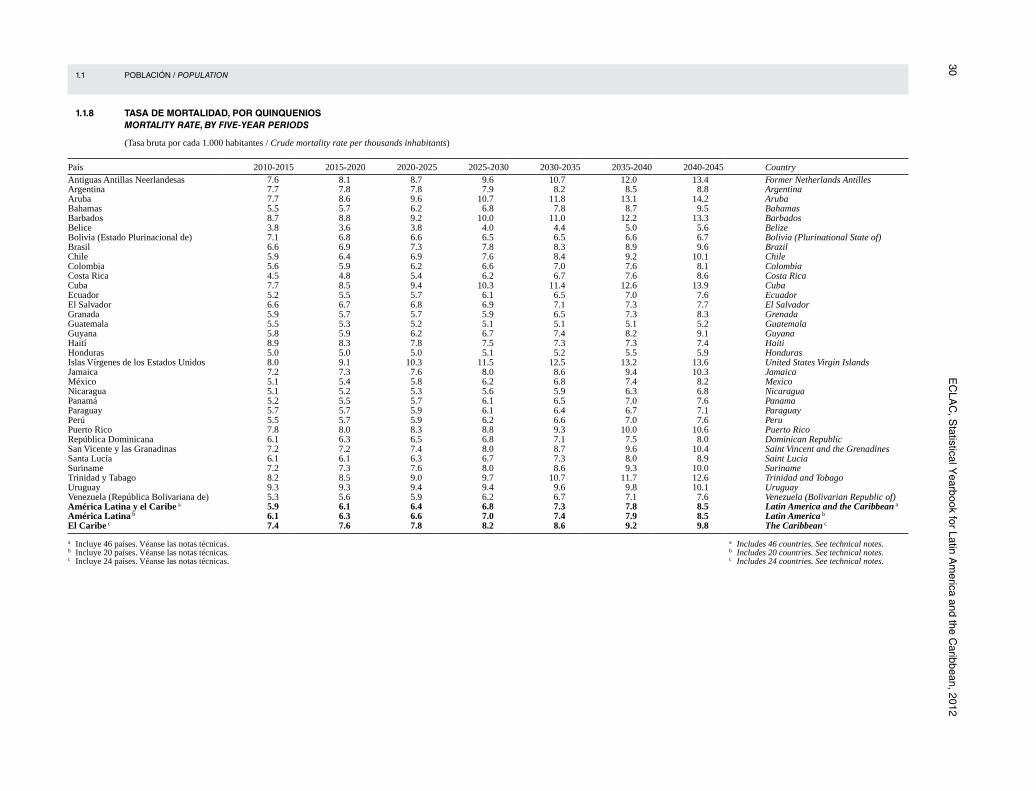
30 E
CLA
C, S
tatistical Yearbook for Latin A
merica and the C
aribbean, 2012 1.1 POBLACIÓN / POPULATION
1.1.8 TASA DE MORTALIDAD, POR QUINQUENIOS MORTALITY RATE, BY FIVE-YEAR PERIODS
(Tasa bruta por cada 1.000 habitantes / Crude mortality rate per thousands inhabitants)
País 2010-2015 2015-2020 2020-2025 2025-2030 2030-2035 2035-2040 2040-2045 Country Antiguas Antillas Neerlandesas 7.6 8.1 8.7 9.6 10.7 12.0 13.4 Former Netherlands AntillesArgentina 7.7 7.8 7.8 7.9 8.2 8.5 8.8 Argentina Aruba 7.7 8.6 9.6 10.7 11.8 13.1 14.2 Aruba Bahamas 5.5 5.7 6.2 6.8 7.8 8.7 9.5 Bahamas Barbados 8.7 8.8 9.2 10.0 11.0 12.2 13.3 Barbados Belice 3.8 3.6 3.8 4.0 4.4 5.0 5.6 Belize Bolivia (Estado Plurinacional de) 7.1 6.8 6.6 6.5 6.5 6.6 6.7 Bolivia (Plurinational State of) Brasil 6.6 6.9 7.3 7.8 8.3 8.9 9.6 Brazil Chile 5.9 6.4 6.9 7.6 8.4 9.2 10.1 Chile Colombia 5.6 5.9 6.2 6.6 7.0 7.6 8.1 Colombia Costa Rica 4.5 4.8 5.4 6.2 6.7 7.6 8.6 Costa Rica Cuba 7.7 8.5 9.4 10.3 11.4 12.6 13.9 Cuba Ecuador 5.2 5.5 5.7 6.1 6.5 7.0 7.6 Ecuador El Salvador 6.6 6.7 6.8 6.9 7.1 7.3 7.7 El Salvador Granada 5.9 5.7 5.7 5.9 6.5 7.3 8.3 Grenada Guatemala 5.5 5.3 5.2 5.1 5.1 5.1 5.2 Guatemala Guyana 5.8 5.9 6.2 6.7 7.4 8.2 9.1 Guyana Haití 8.9 8.3 7.8 7.5 7.3 7.3 7.4 Haiti Honduras 5.0 5.0 5.0 5.1 5.2 5.5 5.9 Honduras Islas Vírgenes de los Estados Unidos 8.0 9.1 10.3 11.5 12.5 13.2 13.6 United States Virgin Islands Jamaica 7.2 7.3 7.6 8.0 8.6 9.4 10.3 Jamaica México 5.1 5.4 5.8 6.2 6.8 7.4 8.2 Mexico Nicaragua 5.1 5.2 5.3 5.6 5.9 6.3 6.8 Nicaragua Panamá 5.2 5.5 5.7 6.1 6.5 7.0 7.6 Panama Paraguay 5.7 5.7 5.9 6.1 6.4 6.7 7.1 Paraguay Perú 5.5 5.7 5.9 6.2 6.6 7.0 7.6 Peru Puerto Rico 7.8 8.0 8.3 8.8 9.3 10.0 10.6 Puerto Rico República Dominicana 6.1 6.3 6.5 6.8 7.1 7.5 8.0 Dominican Republic San Vicente y las Granadinas 7.2 7.2 7.4 8.0 8.7 9.6 10.4 Saint Vincent and the Grenadines Santa Lucía 6.1 6.1 6.3 6.7 7.3 8.0 8.9 Saint Lucia Suriname 7.2 7.3 7.6 8.0 8.6 9.3 10.0 Suriname Trinidad y Tabago 8.2 8.5 9.0 9.7 10.7 11.7 12.6 Trinidad and Tobago Uruguay 9.3 9.3 9.4 9.4 9.6 9.8 10.1 Uruguay Venezuela (República Bolivariana de) 5.3 5.6 5.9 6.2 6.7 7.1 7.6 Venezuela (Bolivarian Republic of) América Latina y el Caribe a 5.9 6.1 6.4 6.8 7.3 7.8 8.5 Latin America and the Caribbean a
América Latina b 6.1 6.3 6.6 7.0 7.4 7.9 8.5 Latin America b
El Caribe c 7.4 7.6 7.8 8.2 8.6 9.2 9.8 The Caribbean c
a Incluye 46 países. Véanse las notas técnicas.b Incluye 20 países. Véanse las notas técnicas.c Incluye 24 países. Véanse las notas técnicas.
a Includes 46 countries. See technical notes.b Includes 20 countries. See technical notes.c Includes 24 countries. See technical notes.

CE
PA
L, Anuario E
stadístico de Am
érica Latina y el Caribe, 2012
31 1.1 POBLACIÓN / POPULATION
1.1.9 TASA GLOBAL DE FECUNDIDAD, POR QUINQUENIOS TOTAL FERTILITY RATE, BY FIVE-YEAR PERIODS
(Número de hijos por mujer / Number of children per woman)
País 2010-2015 2015-2020 2020-2025 2025-2030 2030-2035 2035-2040 2040-2045 Country Antiguas Antillas Neerlandesas 1.9 1.8 1.8 1.8 1.8 1.8 1.8 Former Netherlands AntillesArgentina 2.2 2.1 2.0 2.0 1.9 1.9 1.8 Argentina Aruba 1.7 1.6 1.6 1.7 1.7 1.7 1.8 Aruba Bahamas 1.9 1.9 1.8 1.8 1.8 1.8 1.8 Bahamas Barbados 1.6 1.6 1.7 1.7 1.7 1.8 1.8 Barbados Belice 2.7 2.5 2.3 2.2 2.1 2.0 1.9 Belize Bolivia (Estado Plurinacional de) 3.1 2.7 2.5 2.2 2.1 1.9 1.8 Bolivia (Plurinational State of) Brasil 1.8 1.7 1.6 1.6 1.6 1.7 1.7 Brazil Chile 1.8 1.8 1.7 1.7 1.6 1.6 1.6 Chile Colombia 2.4 2.3 2.2 2.1 2.1 2.0 2.0 Colombia Costa Rica 1.7 1.6 1.6 1.6 1.7 1.7 1.7 Costa Rica Cuba 1.5 1.5 1.5 1.6 1.6 1.6 1.6 Cuba Ecuador 2.4 2.2 2.1 1.9 1.9 1.8 1.7 Ecuador El Salvador 2.2 2.0 1.9 1.8 1.7 1.7 1.8 El Salvador Granada 2.2 2.1 2.0 1.9 1.8 1.8 1.7 Grenada Guatemala 3.7 3.3 2.9 2.6 2.4 2.2 2.0 Guatemala Guyana 2.2 2.1 2.0 1.9 1.8 1.8 1.8 Guyana Haití 3.1 2.8 2.5 2.3 2.1 1.9 1.9 Haiti Honduras 2.9 2.6 2.4 2.2 2.0 1.9 1.8 Honduras Islas Vírgenes de los Estados Unidos 1.9 1.9 1.8 1.7 1.7 1.7 1.7 United States Virgin Islands Jamaica 2.3 2.2 2.1 2.0 1.9 1.9 1.8 Jamaica México 2.1 1.9 1.8 1.8 1.7 1.7 1.8 Mexico Nicaragua 2.5 2.4 2.2 2.1 2.0 1.9 1.8 Nicaragua Panamá 2.5 2.4 2.3 2.2 2.1 2.0 1.9 Panama Paraguay 2.7 2.5 2.2 2.1 1.9 1.9 1.8 Paraguay Perú 2.4 2.3 2.2 2.1 2.0 1.9 1.8 Peru Puerto Rico 1.8 1.7 1.7 1.7 1.7 1.7 1.7 Puerto Rico República Dominicana 2.5 2.4 2.3 2.2 2.1 2.0 2.0 Dominican Republic San Vicente y las Granadinas 2.0 1.9 1.8 1.7 1.7 1.6 1.6 Saint Vincent and the Grenadines Santa Lucía 1.9 1.8 1.7 1.6 1.6 1.6 1.6 Saint Lucia Suriname 2.3 2.1 2.0 2.0 1.9 1.8 1.8 Suriname Trinidad y Tabago 1.6 1.6 1.6 1.6 1.7 1.7 1.7 Trinidad and Tobago Uruguay 2.0 2.0 1.9 1.9 1.8 1.8 1.8 Uruguay Venezuela (República Bolivariana de) 2.4 2.3 2.2 2.1 2.0 1.9 1.9 Venezuela (Bolivarian Republic of) América Latina y el Caribe a 2.2 2.1 2.0 1.9 1.8 1.8 1.8 Latin America and the Caribbean aAmérica Latina b 2.1 2.0 1.9 1.9 1.8 1.8 1.8 Latin America b
El Caribe c 2.3 2.2 2.1 2.0 1.9 1.9 1.9 The Caribbean c
a Incluye 46 países. Véanse las notas técnicas.b Incluye 20 países. Véanse las notas técnicas.c Incluye 24 países. Véanse las notas técnicas.
a Includes 46 countries. See technical notes.b Includes 20 countries. See technical notes.c Includes 24 countries. See technical notes.

32 E
CLA
C, S
tatistical Yearbook for Latin A
merica and the C
aribbean, 2012 1.1 POBLACIÓN / POPULATION
1.1.10 ESPERANZA DE VIDA AL NACER SEGÚN SEXO, POR QUINQUENIOS LIFE EXPECTANCY AT BIRTH, BY SEX AND FIVE-YEAR PERIODS
(Años, promedio / Years, average)
País2010-2015 2020-2025 2030-2035 2040-2045
CountryAmbos sexosBoth sexes
HombresMen
MujeresWomen
Ambos sexosBoth sexes
HombresMen
MujeresWomen
Ambos sexosBoth sexes
HombresMen
MujeresWomen
Ambos sexosBoth sexes
HombresMen
MujeresWomen
Antiguas Antillas Neerlandesas 76.8 73.5 79.9 78.1 75.0 80.9 79.2 76.4 81.8 80.2 77.6 82.6 Former Netherlands AntillesArgentina 76.0 72.2 79.8 77.5 73.6 81.3 78.9 75.1 82.7 80.2 76.4 84.0 Argentina Aruba 75.5 73.0 77.8 76.7 74.3 78.9 78.1 75.6 80.3 79.4 76.9 81.5 Aruba Bahamas 75.9 72.7 78.9 78.3 75.0 81.4 79.3 76.3 82.1 80.6 77.6 83.5 Bahamas Barbados 77.1 73.9 80.3 78.5 75.4 81.5 79.7 76.7 82.7 80.8 77.9 83.7 Barbados Belice 76.3 74.9 77.8 78.1 76.4 79.8 78.9 77.2 80.7 79.6 78.0 81.3 Belize Bolivia (Estado Plurinacional de) 67.0 64.7 69.3 69.9 67.6 72.4 72.8 70.3 75.2 75.3 72.8 77.9 Bolivia (Plurinational State of) Brasil 73.2 69.4 77.0 75.2 71.5 79.0 77.1 73.4 80.7 78.7 75.2 82.4 Brazil Chile 78.9 75.8 82.0 80.0 76.8 83.1 80.9 77.7 84.1 81.8 78.6 85.1 Chile Colombia 73.8 70.2 77.4 75.4 72.0 78.8 76.9 73.7 80.2 78.3 75.3 81.5 Colombia Costa Rica 79.1 76.7 81.6 80.0 77.6 82.6 80.8 78.4 83.5 81.7 79.1 84.4 Costa Rica Cuba 79.2 77.1 81.2 80.1 78.0 82.2 80.9 78.8 83.0 81.7 79.6 83.8 Cuba Ecuador 75.6 72.7 78.7 77.0 74.1 80.0 78.3 75.3 81.3 79.5 76.5 82.5 Ecuador El Salvador 72.3 67.4 76.8 74.0 69.3 78.5 75.7 71.1 80.1 77.3 72.8 81.6 El Salvador Granada 76.2 74.5 77.7 77.7 75.9 79.3 79.0 77.2 80.7 80.1 78.3 81.9 Grenada Guatemala 71.3 67.7 74.8 73.3 69.8 77.0 75.4 71.7 78.9 77.3 73.6 80.8 Guatemala Guyana 70.3 67.2 73.5 73.2 70.1 76.3 75.0 72.1 78.0 76.5 73.7 79.4 Guyana Haití 62.1 60.1 64.1 66.0 63.8 68.2 69.6 67.3 71.9 72.8 70.5 75.2 Haiti Honduras 72.8 70.5 75.4 74.7 72.2 77.2 76.4 73.9 78.9 78.0 75.5 80.7 Honduras Islas Vírgenes de los Estados Unidos 79.6 76.5 82.6 80.8 77.7 83.6 82.0 78.8 84.6 83.0 79.9 85.6 United States Virgin Islands Jamaica 73.5 70.9 76.0 74.8 72.4 77.2 76.0 73.8 78.1 77.3 75.3 79.3 Jamaica México 76.5 74.0 78.9 78.0 75.6 80.4 79.3 77.0 81.7 80.6 78.3 83.2 Mexico Nicaragua 72.7 69.7 75.8 74.5 71.4 77.7 76.2 73.0 79.4 77.7 74.5 81.5 Nicaragua Panamá 76.3 73.6 79.0 77.6 74.8 80.4 78.8 75.9 81.8 79.9 77.0 83.0 Panama Paraguay 72.4 70.2 74.5 73.8 71.7 76.1 75.3 73.1 77.5 76.6 74.5 79.0 Paraguay Perú 74.0 71.3 76.7 75.6 72.8 78.4 77.1 74.3 79.9 78.4 75.7 81.4 Peru Puerto Rico 79.3 75.4 83.2 80.5 76.7 84.2 81.6 77.9 85.2 82.6 79.0 86.1 Puerto Rico República Dominicana 72.7 69.7 76.0 74.3 71.2 77.6 75.8 72.6 79.1 77.1 74.0 80.6 Dominican Republic San Vicente y las Granadinas 72.6 70.5 74.7 74.2 72.1 76.3 75.5 73.5 77.7 76.8 74.7 78.9 Saint Vincent and the Grenadines Santa Lucía 74.9 72.2 77.5 76.5 73.6 79.1 77.9 75.0 80.6 79.2 76.4 81.8 Saint Lucia Suriname 70.9 67.8 74.2 72.9 70.0 75.9 74.3 71.6 77.2 75.7 73.0 78.5 Suriname Trinidad y Tabago 70.4 66.9 73.8 72.6 69.2 75.8 74.3 71.0 77.3 75.6 72.5 78.6 Trinidad and Tobago Uruguay 77.0 73.3 80.5 78.5 74.9 81.8 79.8 76.4 83.1 81.1 77.8 84.2 Uruguay Venezuela (República Bolivariana de) 74.5 71.5 77.6 76.1 73.0 79.2 77.5 74.5 80.7 78.9 75.9 82.2 Venezuela (Bolivarian Republic of) América Latina y el Caribe a 74.7 71.6 77.8 76.5 73.5 79.5 78.0 75.1 81.0 79.3 76.4 82.2 Latin America and the Caribbean aAmérica Latina b 74.2 71.0 77.5 75.9 72.8 79.2 77.5 74.4 80.7 79.0 75.9 82.2 Latin America bEl Caribe c 72.7 70.3 75.1 74.5 72.0 77.0 76.2 73.7 78.7 77.6 75.1 80.0 The Caribbean c
a Incluye 46 países. Véanse las notas técnicas.b Incluye 20 países. Véanse las notas técnicas.c Incluye 24 países. Véanse las notas técnicas.
a Includes 46 countries. See technical notes.b Includes 20 countries. See technical notes.c Includes 24 countries. See technical notes.

CE
PA
L, Anuario E
stadístico de Am
érica Latina y el Caribe, 2012
33 1.1 POBLACIÓN / POPULATION
1.1.11 PORCENTAJE DE POBLACIÓN URBANA a
PERCENTAGE OF URBAN POPULATION a
(Porcentaje de la población total / Percentage of total population)
País 2010 2015 2020 2025 2030 2035 2040 Country Anguila 100.0 100.0 100.0 100.0 100.0 100.0 100.0 Anguilla Antigua y Barbuda 29.9 29.8 30.5 31.9 33.7 35.5 37.3 Antigua and Barbuda Antiguas Antillas Neerlandesas 93.2 94.1 94.8 95.2 95.5 95.9 96.2 Former Netherlands AntillesArgentina 93.1 94.0 94.7 95.6 96.6 97.3 97.9 Argentina Aruba 46.8 47.2 48.0 49.1 50.4 52.1 54.0 Aruba Bahamas 84.1 85.0 85.9 86.8 87.7 88.5 89.2 Bahamas Barbados 43.9 46.4 48.8 51.0 53.2 55.3 57.4 Barbados Belice 45.0 44.0 43.8 44.2 45.3 47.1 49.0 Belize Bolivia (Estado Plurinacional de) 66.4 68.3 70.0 71.5 72.7 73.8 74.7 Bolivia (Plurinational State of) Brasil 85.0 86.2 87.0 87.6 88.1 88.4 88.6 Brazil Chile 87.5 88.3 89.0 89.4 89.7 89.7 89.6 Chile Colombia 78.5 80.1 81.5 82.6 83.5 84.3 84.9 Colombia Costa Rica 66.0 68.8 71.0 72.7 73.9 74.7 75.1 Costa Rica Cuba 77.4 78.6 79.6 80.6 81.5 82.3 83.0 Cuba Dominica 67.1 67.7 68.7 70.1 71.6 73.1 74.6 Dominica Ecuador 65.0 67.0 68.7 70.3 71.6 72.8 73.8 Ecuador El Salvador 60.3 62.6 64.7 66.6 66.8 66.9 67.0 El Salvador Granada 38.8 40.5 42.4 44.4 46.5 48.6 50.7 Grenada Guatemala 57.2 63.6 68.7 72.3 74.8 76.4 77.4 Guatemala Guyana 28.3 28.8 29.7 31.0 32.8 34.7 36.5 Guyana Haití 45.3 48.5 51.3 53.8 53.7 53.5 53.3 Haiti Honduras 50.5 53.1 55.7 58.2 60.6 62.9 64.9 Honduras Islas Caimán 100.0 100.0 100.0 100.0 100.0 100.0 100.0 Cayman Islands Islas Turcas y Caicos 93.3 95.3 96.5 97.1 97.4 97.7 97.9 Turks and Caicos Islands Islas Vírgenes Británicas 40.4 41.5 43.1 45.0 47.0 49.0 51.0 British Virgin Islands Islas Vírgenes de los Estados Unidos 95.3 96.0 96.5 96.8 97.0 97.3 97.5 United States Virgin Islands Jamaica 52.0 52.4 53.3 54.7 56.6 58.9 61.1 Jamaica México 78.0 79.4 80.7 81.8 82.8 83.7 84.4 Mexico Montserrat 14.1 14.8 15.7 16.8 18.0 19.4 20.8 Montserrat Nicaragua 58.3 59.6 60.8 62.0 63.1 64.1 65.0 Nicaragua Panamá 68.7 71.2 73.1 74.6 75.7 76.6 77.2 Panama Paraguay 61.4 64.1 66.5 68.6 70.4 71.9 73.2 Paraguay Perú 73.4 73.9 74.5 75.1 75.4 75.6 75.9 Peru Puerto Rico 98.8 99.2 99.4 99.5 99.5 99.6 99.6 Puerto Rico República Dominicana 68.6 71.1 73.1 74.6 75.8 76.7 77.3 Dominican Republic Saint Kitts y Nevis 31.9 32.4 33.4 34.9 36.8 38.7 40.6 Saint Kitts and Nevis San Vicente y las Granadinas 48.9 50.9 52.9 54.9 56.9 59.0 60.9 Saint Vincent and the Grenadines Santa Lucía 18.3 14.9 12.9 11.9 11.7 12.3 13.1 Saint Lucia Suriname 69.3 71.3 73.1 74.8 76.3 77.7 79.0 Suriname Trinidad y Tabago 13.4 14.8 16.1 17.4 18.8 20.2 21.8 Trinidad and Tobago Uruguay 92.4 92.8 93.1 93.4 93.6 93.7 93.9 Uruguay Venezuela (República Bolivariana de) 93.6 94.0 94.3 94.4 94.4 94.5 94.5 Venezuela (Bolivarian Republic of) América Latina y el Caribe b 78.8 80.2 81.5 82.5 83.4 84.3 85.1 Latin America and the Caribbean bAmérica Latina c 79.5 80.9 82.0 82.9 83.6 84.1 84.6 Latin America c
El Caribe d 66.6 68.8 70.8 72.5 74.0 75.5 77.0 The Caribbean d
a The definition of the term “urban” corresponds to that used in each country.b Includes 46 countries. See technical notes.c Includes 20 countries. See technical notes.d Includes 24 countries. See technical notes.
a La definición del término “urbano” corresponde a la utilizada en cada país.b Incluye 46 países. Véanse las notas técnicas.c Incluye 20 países. Véanse las notas técnicas.d Incluye 24 países. Véanse las notas técnicas.

34 E
CLA
C, S
tatistical Yearbook for Latin A
merica and the C
aribbean, 2012 1.1 POBLACIÓN / POPULATION
1.1.12 POBLACIÓN EN EL ÁREA METROPOLITANA PRINCIPAL a
POPULATION IN THE MAIN METROPOLITAN AREA a
País Área metropolitana principal
Porcentaje de la poblaciónPercentage of total population
Tasa de crecimiento de la población / Population
growth rate(Tasa anual media)
(Average annual rate)
Main metropolitan area Country
1990 b 2000 b 1990-2000
Antigua y Barbuda St. John’s ... 36.9 ... St. John’s Antigua and Barbuda Argentina Gran Buenos Aires 34.5 33.2 1.2 Greater Buenos Aires Argentina Bahamas Nassau 67.6 71.4 2.4 Nassau Bahamas Barbados c Bridgetown 44.8 50.7 1.7 Bridgetown Barbados c
Belice Ciudad Belice 26.5 21.2 1.1 Belize City Belize Bolivia (Estado Plurinacional de) La Paz 17.4 17.2 2.6 La Paz Bolivia (Plurinational State of) Brasil São Paulo 10.1 10.1 1.6 São Paulo Brazil Chile Santiago 35.8 35.7 1.3 Santiago Chile Colombia Bogotá 15.8 16.3 2.1 Bogotá Colombia Costa Rica San José ... 27.1 3.3 San José Costa Rica Cuba La Habana ... 19.7 0.7 Havana Cuba Dominica Roseau ... 36.6 ... Roseau Dominica Ecuador Guayaquil 16.4 17.9 2.8 Guayaquil Ecuador El Salvador San Salvador 20.4 21.6 2.2 San Salvador El Salvador Granada d St. George’s ... 38.3 ... St. George’s Grenada d
Guatemala Ciudad de Guatemala 19.0 19.1 3.6 Guatemala City Guatemala Guyana Georgetown ... 40.0 ... Georgetown Guyana Haití Puerto Príncipe ... 22.9 ... Port-au-Prince Haiti Honduras Tegucigalpa ... 12.5 ... Tegucigalpa Honduras Jamaica Kingston 24.6 25.9 1.3 Kingston Jamaica México Ciudad de México 18.6 18.0 1.5 Mexico City Mexico Nicaragua Managua 19.8 19.2 1.3 Managua Nicaragua Panamá Ciudad de Panamá 36.3 45.1 3.6 Panama City Panama Paraguay Asunción 28.3 31.1 3.1 Asunción Paraguay Perú Lima 28.8 31.0 2.0 Lima Peru República Dominicana Santo Domingo 22.1 25.3 3.2 Santo Domingo Dominican Republic Saint Kitts y Nevis Basseterre ... 31.6 ... Basseterre Saint Kitts and Nevis San Vicente y las Granadinas Kingstown 24.3 24.6 0.7 Kingstown Saint Vincent and the Grenadines Santa Lucía Castries 45.9 38.3 0.9 Castries Saint Lucia Suriname Paramaribo 25.0 57.3 1.1 Paramaribo Suriname Trinidad y Tabago Puerto España ... 4.2 ... Port of Spain Trinidad and Tobago Uruguay Montevideo 50.3 47.4 -0.4 Montevideo Uruguay Venezuela (República Bolivariana de) Caracas 15.3 12.5 0.3 Caracas Venezuela (Bolivarian Republic of)
a Se consideró como área metropolitana la superficie de la ciudad central más las zonas de alta densidad de su entorno.
b Los datos se refieren a los años en que se realizaron los censos de población y vivienda en cada país, esto es, alrededor del año que encabeza la columna.
c Corresponde a las parroquias de St. Michael y St. James.d Corresponde a la parroquia de St. George.
a Metropolitan area refers to the city in question plus the high density zones in its environments.b The data refer to the years in which population and housing censuses were conducted in each country; i.e.,
around the year at the top of the column.c Corresponds to the Parishes of St. Michael and St. James.d Corresponds to the Parish of St. George.

CE
PA
L, Anuario E
stadístico de Am
érica Latina y el Caribe, 2012
35
a Veintiocho aglomeraciones urbanas.b Treinta y una aglomeraciones urbanas.c A partir de 2002 las cifras de ingresos no son comparables con las de años anteriores debido a la
aplicación de nuevos criterios metodológicos desarrollados por el Departamento Administrativo Nacional de Estadística (DANE) y el Departamento Nacional de Planeación (DNP) en el marco de la Misión para el empalme de las series de empleo, pobreza y desigualdad (MESEP).
d Las cifras desde 2004 en adelante no son estrictamente comparables con las anteriores, debido a cambios metodológicos efectuados por el INEI.
e A partir de 1998 el diseño muestral de la encuesta no permite el desglose urbano-rural. Por lo tanto, las cifras corresponden al total nacional.
a Twenty-eight urban agglomerations.b Thirty-one urban agglomerations.c From 2002 on, the income figures are not comparable with those of earlier years, owing to the
application of new methodological criteria developed by the National Administrative Department of Statistics (DANE) and the National Planning Department (DNP) in the framework of the Misión para el empalme de las series de empleo, pobreza y desigualdad (MESEP).
d Figures from 2004 on are not strictly comparable with those of previous years, owing to methodological changes introduced by the National Institute of Statistics and Informatics.
e Since 1998, the survey’s sample design does not allow for the rural-urban breakdown. Thus, the data correspond to the national total.
1.1 POBLACIÓN / POPULATION
1.1.13 TAMAÑO MEDIO DE LOS HOGARES URBANOS, SEGÚN QUINTILES DE INGRESO URBAN HOUSEHOLDS AVERAGE SIZE, BY INCOME QUINTILE
(Personas / Persons)
País Año / Year Quintiles de ingreso familiar / Quintile of household income
CountryTotal 1 2 3 4 5
Argentina 1999 a 3.5 4.9 3.8 3.2 2.9 2.6 Argentina 2011 b 3.2 4.3 3.4 3.1 2.8 2.3
Bolivia (Estado Plurinacional de) 1999 4.3 5.2 4.7 4.4 3.8 3.4 Bolivia (Plurinational State of) 2009 3.9 4.6 4.3 4.1 3.7 2.8
Brasil 2001 3.6 4.5 4.0 3.3 3.2 2.8 Brazil 2011 3.1 4.0 3.5 2.8 2.8 2.5
Chile 2000 3.8 4.7 4.3 3.8 3.3 3.0 Chile 2011 3.4 4.1 3.7 3.3 3.2 2.7
Colombia 1999 4.1 4.8 4.6 4.2 3.8 3.2 Colombia 2011 c 3.5 4.4 3.9 3.5 3.1 2.6
Costa Rica 1999 4.0 4.6 4.3 4.1 3.8 3.1 Costa Rica 2011 3.4 4.0 3.6 3.6 3.2 2.7
Ecuador 1999 4.4 5.0 4.8 4.4 4.1 3.4 Ecuador 2011 3.7 4.4 4.2 3.8 3.5 2.8
El Salvador 1999 4.2 4.8 4.5 4.2 3.9 3.3 El Salvador 2010 3.7 4.5 4.0 3.8 3.4 2.9
Guatemala 1998 4.8 6.2 5.1 4.9 4.1 3.5 Guatemala 2006 4.4 5.5 4.8 4.6 3.8 3.3
Honduras 1999 4.8 5.6 5.4 5.0 4.3 3.7 Honduras 2010 4.3 4.9 4.8 4.4 4.0 3.4
México 2000 4.0 5.0 4.3 4.0 3.5 3.1 Mexico 2010 3.7 4.8 4.2 3.7 3.3 2.6
Nicaragua 2001 5.1 5.9 5.7 5.1 4.7 3.9 Nicaragua 2009 4.5 5.2 5.0 4.5 4.1 3.5
Panamá 1999 3.9 4.7 4.4 3.9 3.4 2.9 Panama 2011 3.4 4.0 3.9 3.5 2.9 2.5
Paraguay 1999 4.3 5.4 4.9 4.4 3.9 3.2 Paraguay 2011 3.9 4.4 4.3 3.9 3.8 3.2
Perú 2001 4.5 5.3 5.0 4.7 4.2 3.3 Peru 2011 d 4.0 4.5 4.4 4.1 3.8 3.0
República Dominicana 2002 3.9 4.4 4.2 3.8 3.6 3.3 Dominican Republic 2011 3.6 3.9 3.9 3.7 3.4 3.0
Uruguay 1999 3.2 4.6 3.5 2.9 2.6 2.3 Uruguay 2011 2.8 4.0 3.1 2.7 2.4 2.0
Venezuela (República Bolivariana de) 1999 e 4.7 5.3 5.3 4.9 4.5 3.7 Venezuela (Bolivarian Republic of) 2011 e 4.1 4.8 4.6 4.1 3.7 3.1

36 E
CLA
C, S
tatistical Yearbook for Latin A
merica and the C
aribbean, 2012 1.1 POBLACIÓN / POPULATION
1.1.14 TIPOS DE HOGARES URBANOS, SEGÚN SEXO DEL JEFE DE HOGAR TYPES OF URBAN HOUSEHOLDS, BY SEX OF HEAD OF HOUSEHOLD
(Porcentaje del total de hogares / Percentage of total households)
PaísAñoYear
Total hogaresTotal households
UnipersonalOne person
Nuclear-biparentalNuclear-both parent
Nuclear-monoparentalNuclear-single parent
Nuclear-sin hijosNuclear-no children
Extenso y compuestoExtended and composite
CountryHombres
Men MujeresWomen
HombresMen
MujeresWomen
HombresMen
MujeresWomen
HombresMen
MujeresWomen
HombresMen
MujeresWomen
HombresMen
MujeresWomen
Argentina 1999 a 72.4 27.6 37.7 62.3 97.4 2.6 16.3 83.7 95.0 5.0 60.1 39.9 Argentina 2011 b 65.0 35.0 41.2 58.8 88.9 11.1 17.1 82.9 86.7 13.3 54.9 45.1
Bolivia (Estado Plurinacional de) 1999 79.1 20.9 57.8 42.2 98.4 1.6 17.5 82.5 100.0 … 62.8 37.2 Bolivia (Plurinational State of) 2009 73.5 26.5 60.8 39.2 96.3 3.7 19.2 80.8 95.0 5.0 58.4 41.6
Brasil 2001 73.7 26.3 46.5 53.5 96.6 3.4 11.2 88.8 95.5 4.5 59.3 40.7 Brazil 2011 61.3 38.7 45.8 54.2 80.9 19.1 11.1 88.9 80.4 19.6 49.8 50.2
Chile 2000 75.7 24.3 44.5 55.5 96.1 3.9 14.6 85.4 94.1 5.9 63.0 37.0 Chile 2011 59.5 40.5 43.6 56.4 84.2 15.8 10.8 89.2 82.7 17.3 53.3 46.7
Colombia 1999 71.2 28.8 53.4 46.6 97.4 2.6 12.4 87.6 95.9 4.1 59.9 40.1 Colombia 2011 c 64.5 35.5 56.5 43.5 92.3 7.7 11.3 88.7 90.0 10.0 54.2 45.8
Costa Rica 1999 72.1 27.9 48.1 51.9 96.4 3.6 9.3 90.7 95.1 4.9 58.5 41.5 Costa Rica 2011 61.3 38.7 39.5 60.5 90.3 9.7 8.9 91.1 84.5 15.5 51.6 48.4
Ecuador 1999 79.9 20.1 65.8 34.2 97.8 2.2 16.9 83.1 97.2 2.8 70.9 29.1 Ecuador 2011 71.7 28.3 53.4 46.6 96.3 3.7 13.8 86.2 96.5 3.5 65.3 34.7
El Salvador 2001 64.7 35.3 53.6 46.4 94.5 5.5 10.5 89.5 91.5 8.5 52.9 47.1 El Salvador 2010 62.5 37.5 56.0 44.0 91.6 8.4 11.1 88.9 89.1 10.9 47.8 52.2
Guatemala 1998 75.7 24.3 48.2 51.8 98.9 1.1 11.3 88.7 98.2 1.8 65.9 34.1 Guatemala 2006 74.5 25.5 48.1 51.9 98.8 1.2 9.8 90.2 98.5 1.5 63.2 36.8
Honduras 1999 69.7 30.3 62.5 37.5 97.6 2.4 8.9 91.1 96.6 3.4 59.2 40.8 Honduras 2010 62.3 37.7 61.3 38.7 91.1 8.9 12.4 87.6 92.6 7.4 48.5 51.5
México 2000 80.4 19.6 52.0 48.0 99.4 0.6 13.5 86.5 98.7 1.3 63.7 36.3 Mexico 2010 72.9 27.1 50.8 49.2 95.9 4.1 12.5 87.5 94.8 5.2 63.8 36.2
Nicaragua 2001 65.1 34.9 56.0 44.0 93.8 6.2 9.3 90.7 96.9 3.1 53.4 46.6 Nicaragua 2009 58.3 41.7 55.2 44.8 86.5 13.5 12.4 87.6 81.1 18.9 45.9 54.1
Panamá 1999 70.4 29.6 59.8 40.2 95.3 4.7 13.5 86.5 93.1 6.9 61.6 38.4 Panama 2011 64.9 35.1 58.0 42.0 90.2 9.8 11.0 89.0 88.6 11.4 53.0 47.0
Paraguay 2001 70.4 29.6 57.9 42.1 93.4 6.6 14.2 85.8 81.1 18.9 60.6 39.4 Paraguay 2011 66.4 33.6 54.8 45.2 88.1 11.9 16.0 84.0 86.2 13.8 53.8 46.2
Perú 2001 77.9 22.1 64.5 35.5 98.2 1.8 20.8 79.2 95.6 4.4 69.6 30.4 Peru 2011 d 72.5 27.5 55.8 44.2 95.5 4.5 17.3 82.7 93.8 6.2 65.2 34.8
República Dominicana 2002 65.8 34.2 55.1 44.9 94.7 5.3 11.7 88.3 89.4 10.6 53.2 46.8 Dominican Republic 2011 61.8 38.2 56.3 43.7 92.6 7.4 13.6 86.4 93.4 6.6 49.3 50.7
Uruguay 1999 69.5 30.5 34.3 65.7 94.7 5.3 14.2 85.8 92.2 7.8 62.1 37.9 Uruguay 2011 58.9 41.1 42.4 57.6 80.9 19.1 13.1 86.9 78.8 21.2 50.8 49.2
Venezuela (República Bolivariana de) 1999 e 72.8 27.2 64.4 35.6 95.5 4.5 12.6 87.4 95.1 4.9 62.2 37.8 Venezuela (Bolivarian Republic of) 2011 e 64.1 35.9 66.0 34.0 87.5 12.5 13.9 86.1 86.3 13.7 52.7 47.3
a Veintiocho aglomeraciones urbanas.b Treinta y una aglomeraciones urbanas.c A partir de 2002 las cifras de ingresos no son comparables con las de años anteriores
debido a la aplicación de nuevos criterios metodológicos desarrollados por el Departamento Administrativo Nacional de Estadística (DANE) y el Departamento Nacional de Planeación (DNP) en el marco de la Misión para el empalme de las series de empleo, pobreza y desigualdad (MESEP).
d Las cifras desde 2004 en adelante no son estrictamente comparables con las anteriores, debido a cambios metodológicos efectuados por el INEI.
e A partir de 1998 el diseño muestral de la encuesta no permite el desglose urbano-rural. Por lo tanto, las cifras corresponden al total nacional.
a Twenty-eight urban agglomerations.b Thirty-one urban agglomerations.c From 2002 on, the income figures are not comparable with those of earlier years,
owing to the application of new methodological criteria developed by the National Administrative Department of Statistics (DANE) and the National Planning Department (DNP) in the framework of the Misión para el empalme de las series de empleo, pobreza y desigualdad (MESEP).
d Figures from 2004 on are not strictly comparable with those of previous years, owing to methodological changes introduced by the National Institute of Statistics and Informatics.
e Since 1998, the survey’s sample design does not allow for the rural-urban breakdown. Thus, the data correspond to the national total.

CE
PA
L, Anuario E
stadístico de Am
érica Latina y el Caribe, 2012
37 1.1 POBLACIÓN / POPULATION
1.1.15 TIPOS DE HOGARES URBANOS, SEGÚN NIVEL DE INGRESO PER CÁPITA DEL HOGAR, 2011 a
TYPES OF URBAN HOUSEHOLDS, BY HOUSEHOLD PER CAPITA INCOME LEVEL, 2011 a
(Porcentaje del total de hogares en cada quintil / Percentage of total number of households in each quintile)
País
Unipersonal / One person Nuclear-biparental Nuclear-both parent
Nuclear-monoparentalNuclear-single parent
Nuclear-sin hijosNuclear-no children
Extenso y compuestoExtended and composite
CountryQuintiles de ingresoIncome quintiles
Quintiles de ingresoIncome quintiles
Quintiles de ingresoIncome quintiles
Quintiles de ingresoIncome quintiles
Quintiles de ingresoIncome quintiles
Quintil 1Quintile 1
Quintil 3Quintile 3
Quintil 5Quintile 5
Quintil 1Quintile 1
Quintil 3Quintile 3
Quintil 5Quintile 5
Quintil 1Quintile 1
Quintil 3Quintile 3
Quintil 5Quintile 5
Quintil 1Quintile 1
Quintil 3Quintile 3
Quintil 5Quintile 5
Quintil 1Quintile 1
Quintil 3Quintile 3
Quintil 5Quintile 5
Argentina b 8.6 18.8 31.3 44.4 38.4 28.4 16.6 11.2 9.4 4.8 12.4 22.6 25.6 19.2 8.3 Argentina b
Bolivia (Estado Plurinacional de) 5.6 8.4 25.8 55.2 52.4 29.4 18.5 12.5 14.0 2.6 4.1 13.3 18.1 22.6 17.4 Bolivia (Plurinational State of) Brasil 5.4 18.8 23.1 50.0 33.6 30.9 16.4 10.7 9.5 5.2 15.8 22.8 23.0 21.1 13.7 Brazil Chile 4.4 12.0 20.8 34.8 33.6 34.3 21.5 13.5 11.4 4.4 11.2 16.8 34.8 29.7 16.8 Chile Colombia c 5.5 9.1 26.4 38.2 37.0 27.8 18.0 14.6 12.1 3.4 7.3 14.3 34.9 32.0 19.4 Colombia c
Costa Rica 7.9 6.2 20.9 41.3 39.3 31.7 16.3 16.3 15.5 6.8 9.0 16.3 27.8 29.1 15.5 Costa Rica Ecuador 5.8 8.0 20.5 37.6 38.7 33.3 13.8 13.4 11.5 6.0 7.9 16.2 36.7 32.1 18.5 Ecuador El Salvador 5.1 8.4 16.4 40.1 37.5 32.4 14.5 13.2 13.9 4.8 6.1 12.5 35.4 34.8 24.8 El Salvador Guatemala 3.1 4.3 13.0 55.4 48.2 39.9 12.1 12.6 11.1 3.1 4.4 14.2 26.3 30.6 21.8 Guatemala Honduras 3.4 5.8 12.8 38.5 35.0 32.1 11.5 11.3 11.5 3.3 3.8 9.8 43.4 44.1 33.9 Honduras México 2.0 7.7 26.0 50.3 43.0 31.6 9.7 12.2 11.8 3.5 9.5 16.1 34.6 27.5 14.5 Mexico Nicaragua 2.6 2.9 11.0 40.4 36.2 36.8 14.6 12.5 15.2 1.9 4.2 8.2 40.6 44.3 28.8 Nicaragua Panamá 10.9 7.9 26.5 38.4 38.5 28.3 17.3 15.9 9.8 5.1 9.0 18.7 28.3 28.8 16.7 Panama Paraguay 8.6 8.3 14.5 40.5 39.7 39.3 13.9 11.7 7.6 7.3 7.1 12.0 29.6 33.2 26.5 Paraguay Perú d 5.6 6.0 20.6 44.5 42.2 35.4 13.7 10.9 12.1 5.4 5.6 9.7 30.8 35.2 22.2 Peru d
República Dominicana 11.0 11.6 17.7 21.5 34.6 35.4 23.2 15.0 11.5 4.1 6.1 13.5 40.1 32.8 21.9 Dominican Republic Uruguay 7.0 18.1 39.9 42.7 34.3 20.7 17.5 12.1 8.8 6.0 18.5 23.5 26.7 17.0 7.1 Uruguay
Venezuela (República Bolivariana de) e 5.9 5.0 18.9 40.7 39.6 29.0 15.3 11.8 10.4 2.3 5.3 11.6 35.8 38.2 30.1 Venezuela (Bolivarian Republic of) e
a Data refer to 2011 or to the nearest available year.b Thirty-one urban agglomerations.c From 2002 on, the income figures are not comparable with those of earlier years, owing to the
application of new methodological criteria developed by the National Administrative Department of Statistics (DANE) and the National Planning Department (DNP) in the framework of the Misión para el empalme de las series de empleo, pobreza y desigualdad (MESEP).
d Figures from 2004 on are not strictly comparable with those of previous years, owing to methodological changes introduced by the National Institute of Statistics and Informatics.
e Since 1998, the survey’s sample design does not allow for the rural-urban breakdown. Thus, the data correspond to the national total.
a Los datos se refieren al 2011 o al año más cercano.b Treinta y una aglomeraciones urbanas.c A partir de 2002 las cifras de ingresos no son comparables con las de años anteriores
debido a la aplicación de nuevos criterios metodológicos desarrollados por el Departamento Administrativo Nacional de Estadística (DANE) y el Departamento Nacional de Planeación (DNP) en el marco de la Misión para el empalme de las series de empleo, pobreza y desigualdad (MESEP).
d Las cifras desde 2004 en adelante no son estrictamente comparables con las anteriores, debido a cambios metodológicos efectuados por el INEI.
e A partir de 1998 el diseño muestral de la encuesta no permite el desglose urbano-rural. Por lo tanto, las cifras corresponden al total nacional.
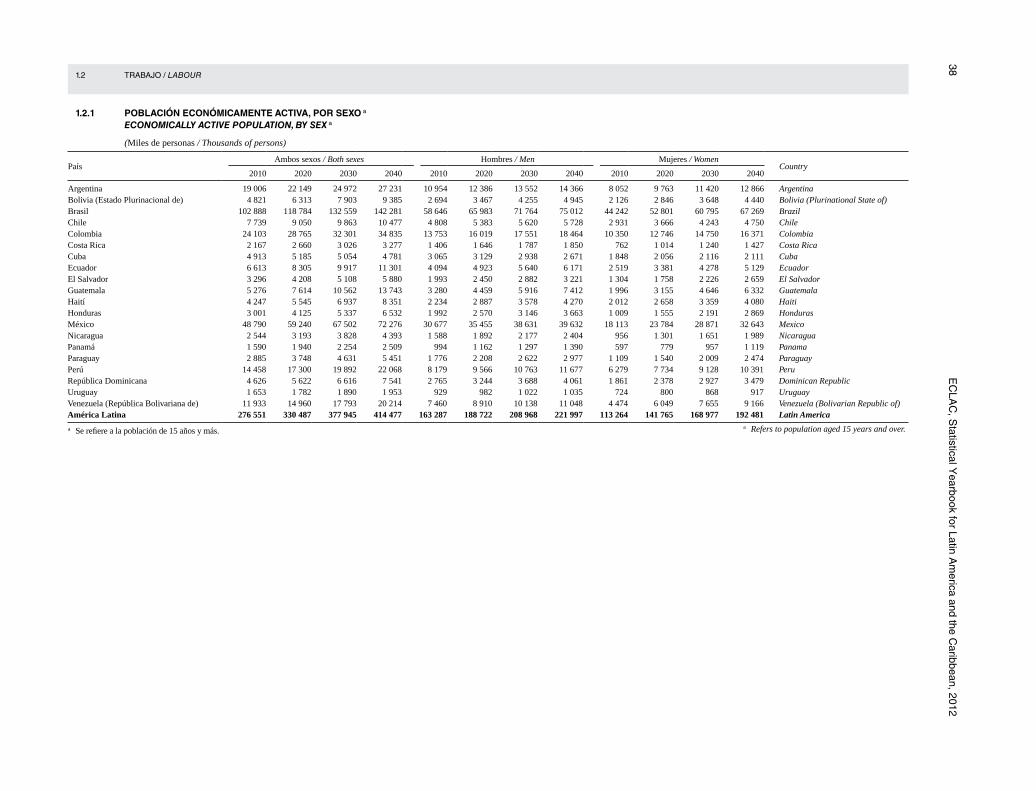
38 E
CLA
C, S
tatistical Yearbook for Latin A
merica and the C
aribbean, 2012 1.2 TRABAJO / LABOUR
1.2.1 POBLACIÓN ECONÓMICAMENTE ACTIVA, POR SEXO a
ECONOMICALLY ACTIVE POPULATION, BY SEX a
(Miles de personas / Thousands of persons)
PaísAmbos sexos / Both sexes Hombres / Men Mujeres / Women
Country2010 2020 2030 2040 2010 2020 2030 2040 2010 2020 2030 2040
Argentina 19 006 22 149 24 972 27 231 10 954 12 386 13 552 14 366 8 052 9 763 11 420 12 866 Argentina Bolivia (Estado Plurinacional de) 4 821 6 313 7 903 9 385 2 694 3 467 4 255 4 945 2 126 2 846 3 648 4 440 Bolivia (Plurinational State of) Brasil 102 888 118 784 132 559 142 281 58 646 65 983 71 764 75 012 44 242 52 801 60 795 67 269 Brazil Chile 7 739 9 050 9 863 10 477 4 808 5 383 5 620 5 728 2 931 3 666 4 243 4 750 Chile Colombia 24 103 28 765 32 301 34 835 13 753 16 019 17 551 18 464 10 350 12 746 14 750 16 371 Colombia Costa Rica 2 167 2 660 3 026 3 277 1 406 1 646 1 787 1 850 762 1 014 1 240 1 427 Costa Rica Cuba 4 913 5 185 5 054 4 781 3 065 3 129 2 938 2 671 1 848 2 056 2 116 2 111 Cuba Ecuador 6 613 8 305 9 917 11 301 4 094 4 923 5 640 6 171 2 519 3 381 4 278 5 129 Ecuador El Salvador 3 296 4 208 5 108 5 880 1 993 2 450 2 882 3 221 1 304 1 758 2 226 2 659 El Salvador Guatemala 5 276 7 614 10 562 13 743 3 280 4 459 5 916 7 412 1 996 3 155 4 646 6 332 Guatemala Haití 4 247 5 545 6 937 8 351 2 234 2 887 3 578 4 270 2 012 2 658 3 359 4 080 Haiti Honduras 3 001 4 125 5 337 6 532 1 992 2 570 3 146 3 663 1 009 1 555 2 191 2 869 Honduras México 48 790 59 240 67 502 72 276 30 677 35 455 38 631 39 632 18 113 23 784 28 871 32 643 Mexico Nicaragua 2 544 3 193 3 828 4 393 1 588 1 892 2 177 2 404 956 1 301 1 651 1 989 Nicaragua Panamá 1 590 1 940 2 254 2 509 994 1 162 1 297 1 390 597 779 957 1 119 Panama Paraguay 2 885 3 748 4 631 5 451 1 776 2 208 2 622 2 977 1 109 1 540 2 009 2 474 Paraguay Perú 14 458 17 300 19 892 22 068 8 179 9 566 10 763 11 677 6 279 7 734 9 128 10 391 Peru República Dominicana 4 626 5 622 6 616 7 541 2 765 3 244 3 688 4 061 1 861 2 378 2 927 3 479 Dominican Republic Uruguay 1 653 1 782 1 890 1 953 929 982 1 022 1 035 724 800 868 917 Uruguay Venezuela (República Bolivariana de) 11 933 14 960 17 793 20 214 7 460 8 910 10 138 11 048 4 474 6 049 7 655 9 166 Venezuela (Bolivarian Republic of) América Latina 276 551 330 487 377 945 414 477 163 287 188 722 208 968 221 997 113 264 141 765 168 977 192 481 Latin America
a Refers to population aged 15 years and over.a Se refiere a la población de 15 años y más.
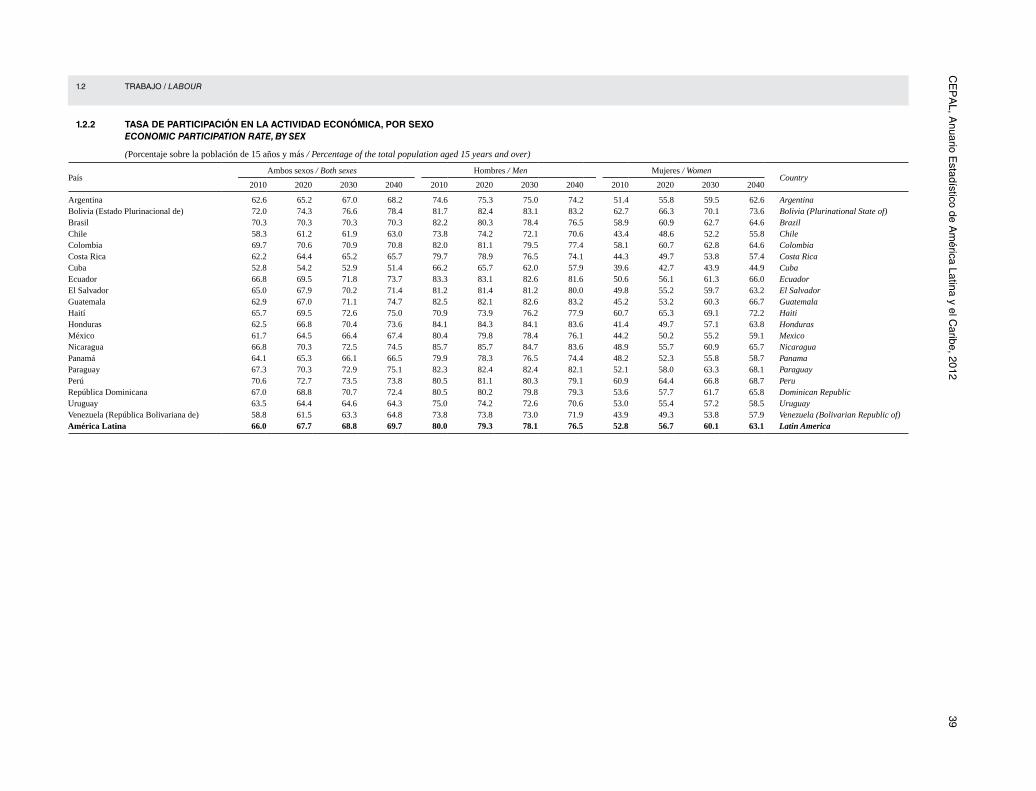
CE
PA
L, Anuario E
stadístico de Am
érica Latina y el Caribe, 2012
39 1.2 TRABAJO / LABOUR
1.2.2 TASA DE PARTICIPACIÓN EN LA ACTIVIDAD ECONÓMICA, POR SEXO ECONOMIC PARTICIPATION RATE, BY SEX
(Porcentaje sobre la población de 15 años y más / Percentage of the total population aged 15 years and over)
País Ambos sexos / Both sexes Hombres / Men Mujeres / Women
Country 2010 2020 2030 2040 2010 2020 2030 2040 2010 2020 2030 2040
Argentina 62.6 65.2 67.0 68.2 74.6 75.3 75.0 74.2 51.4 55.8 59.5 62.6 Argentina Bolivia (Estado Plurinacional de) 72.0 74.3 76.6 78.4 81.7 82.4 83.1 83.2 62.7 66.3 70.1 73.6 Bolivia (Plurinational State of) Brasil 70.3 70.3 70.3 70.3 82.2 80.3 78.4 76.5 58.9 60.9 62.7 64.6 Brazil Chile 58.3 61.2 61.9 63.0 73.8 74.2 72.1 70.6 43.4 48.6 52.2 55.8 Chile Colombia 69.7 70.6 70.9 70.8 82.0 81.1 79.5 77.4 58.1 60.7 62.8 64.6 Colombia Costa Rica 62.2 64.4 65.2 65.7 79.7 78.9 76.5 74.1 44.3 49.7 53.8 57.4 Costa Rica Cuba 52.8 54.2 52.9 51.4 66.2 65.7 62.0 57.9 39.6 42.7 43.9 44.9 Cuba Ecuador 66.8 69.5 71.8 73.7 83.3 83.1 82.6 81.6 50.6 56.1 61.3 66.0 Ecuador El Salvador 65.0 67.9 70.2 71.4 81.2 81.4 81.2 80.0 49.8 55.2 59.7 63.2 El Salvador Guatemala 62.9 67.0 71.1 74.7 82.5 82.1 82.6 83.2 45.2 53.2 60.3 66.7 Guatemala Haití 65.7 69.5 72.6 75.0 70.9 73.9 76.2 77.9 60.7 65.3 69.1 72.2 Haiti Honduras 62.5 66.8 70.4 73.6 84.1 84.3 84.1 83.6 41.4 49.7 57.1 63.8 Honduras México 61.7 64.5 66.4 67.4 80.4 79.8 78.4 76.1 44.2 50.2 55.2 59.1 Mexico Nicaragua 66.8 70.3 72.5 74.5 85.7 85.7 84.7 83.6 48.9 55.7 60.9 65.7 Nicaragua Panamá 64.1 65.3 66.1 66.5 79.9 78.3 76.5 74.4 48.2 52.3 55.8 58.7 Panama Paraguay 67.3 70.3 72.9 75.1 82.3 82.4 82.4 82.1 52.1 58.0 63.3 68.1 Paraguay Perú 70.6 72.7 73.5 73.8 80.5 81.1 80.3 79.1 60.9 64.4 66.8 68.7 Peru República Dominicana 67.0 68.8 70.7 72.4 80.5 80.2 79.8 79.3 53.6 57.7 61.7 65.8 Dominican Republic Uruguay 63.5 64.4 64.6 64.3 75.0 74.2 72.6 70.6 53.0 55.4 57.2 58.5 Uruguay Venezuela (República Bolivariana de) 58.8 61.5 63.3 64.8 73.8 73.8 73.0 71.9 43.9 49.3 53.8 57.9 Venezuela (Bolivarian Republic of) América Latina 66.0 67.7 68.8 69.7 80.0 79.3 78.1 76.5 52.8 56.7 60.1 63.1 Latin America

40 E
CLA
C, S
tatistical Yearbook for Latin A
merica and the C
aribbean, 2012 1.2 TRABAJO / LABOUR
1.2.3 TASA DE PARTICIPACIÓN DE LA POBLACIÓN URBANA EN LA ACTIVIDAD ECONÓMICA, POR SEXO a
ECONOMIC PARTICIPATION RATE OF URBAN POPULATION, BY SEX a
(Tasa refinada / Refined rate)
PaísAmbos sexos / Both sexes Hombres / Men Mujeres / Women
Country2000 2005 2011 2000 2005 2011 2000 2005 2011
Argentina 57.7 b 61.5 b 60.7 c 73.6 b 75.2 b 74.4 c 43.9 b 49.5 b 48.2 c Argentina Bolivia (Estado Plurinacional de) 64.2 67.9 67.4 74.9 78.6 77.1 54.4 58.4 58.3 Bolivia (Plurinational State of) Brasil 65.5 67.8 65.7 79.4 79.7 77.4 53.2 57.2 55.2 Brazil Chile 56.9 58.5 56.8 73.2 72.9 70.2 42.3 45.4 45.2 Chile Colombia 65.5 66.3 d 69.7 d 78.7 78.4 d 80.1 d 54.6 55.5 d 60.4 d Colombia Costa Rica 60.9 62.5 62.6 79.1 78.2 76.7 44.9 47.9 50.3 Costa Rica Ecuador 67.5 67.2 62.5 82.4 81.0 76.7 53.7 54.1 49.6 Ecuador El Salvador 61.5 61.4 62.6 75.1 74.4 75.5 50.8 50.9 52.4 El Salvador Guatemala 71.0 68.2 ... 85.2 84.6 ... 58.4 54.6 ... Guatemala Honduras 66.4 60.8 61.0 82.0 76.1 74.1 53.7 48.4 50.3 Honduras México 59.9 62.7 62.3 80.9 80.2 79.1 41.5 47.1 47.1 Mexico Nicaragua 66.0 63.2 62.9 82.8 78.6 77.4 51.6 50.3 50.8 Nicaragua Panamá 62.9 63.7 63.2 77.1 77.7 77.7 50.2 51.2 50.4 Panama Paraguay 68.1 69.6 67.8 81.3 82.1 79.3 56.7 58.7 57.4 Paraguay Perú 64.7 70.8 e 70.9 e 75.2 80.7 e 80.0 e 55.1 61.8 e 62.5 e Peru República Dominicana ... 57.5 58.9 ... 72.8 71.3 ... 43.2 47.6 Dominican Republic Uruguay 60.6 59.6 65.7 73.3 70.7 75.3 49.6 50.3 57.2 Uruguay Venezuela (República Bolivariana de) f 65.7 66.3 64.7 83.5 81.1 78.8 47.9 51.7 50.8 Venezuela (Bolivarian Republic of) f
a Los datos se refieren al año más cercano al que encabeza la columna.b Veintiocho aglomeraciones urbanas.c Treinta y una aglomeraciones urbanas.d Desde 2002 en adelante, las cifras de ingresos no son comparables con las de años anteriores, debido
a la aplicación de nuevos criterios metodológicos elaborados por el Departamento Administrativo Nacional de Estadística (DANE) y el Departamento Nacional de Planeación (DNP) en el marco de la Misión para el empalme de las series de empleo, pobreza y desigualdad (MESEP).
e Las cifras desde 2004 en adelante no son estrictamente comparables con las anteriores, debido a cambios metodológicos efectuados por el INEI.
f A partir de 1998 el diseño muestral de la encuesta no permite el desglose urbano-rural. Por lo tanto, las cifras corresponden al total nacional.
a Data refer to the years nearest to the one heading the column.b Twenty-eight urban agglomerations.c Thirty-one urban agglomerations.d From 2002 on, the figures for income are not comparable with those of earlier years, owing
to new methodological criteria applied by the National Administrative Department of Statistics (DANE) and the National Planning Department (DNP) in the framework of the Mission for the splicing of employment, poverty and inequality series (MESEP).
e Figures from 2004 on are not strictly comparable with those of previous years, owing to methodological changes introduced by the National Institute of Statistics and Informatics.
f Since 1998, the survey’s sample design does not allow for the rural-urban breakdown. Thus, the data correspond to the national total.

CE
PA
L, Anuario E
stadístico de Am
érica Latina y el Caribe, 2012
41 1.2 TRABAJO / LABOUR
1.2.4 TASA DE PARTICIPACIÓN DE LA POBLACIÓN URBANA EN LA ACTIVIDAD ECONÓMICA, POR SEXO Y GRUPOS DE EDAD, 2011 a
ECONOMIC PARTICIPATION RATE OF URBAN POPULATION, BY SEX AND AGE GROUP, 2011 a
(Tasa específica / Specific rate)
PaísAmbos sexos / Both sexes Hombres / Men Mujeres / Women
Country15-24 25-34 35-44 45-59
60 y más60 and over
15-24 25-34 35-44 45-59 60 y más
60 and over 15-24 25-34 35-44 45-59
60 y más60 and over
Argentina b 40.9 79.8 82.4 77.7 26.1 49.6 93.5 96.9 92.5 40.2 32.1 66.7 69.1 64.0 16.3 Argentina b
Bolivia (Estado Plurinacional de) 44.6 81.8 85.7 82.7 45.0 48.8 94.4 96.4 95.3 58.8 40.5 70.5 74.8 71.5 33.3 Bolivia (Plurinational State of) Brasil 59.3 83.1 82.4 70.1 23.6 66.1 93.3 94.3 85.4 36.1 52.4 73.6 71.9 57.0 14.2 Brazil Chile 35.2 77.9 79.4 72.7 25.6 41.4 89.4 94.3 92.3 40.7 28.8 67.2 66.7 56.5 14.9 Chile Colombia c 54.2 87.0 87.4 78.7 33.5 60.2 96.5 97.2 92.8 48.1 48.2 78.2 79.0 66.6 22.2 Colombia c
Costa Rica 47.0 84.9 82.1 71.4 23.4 54.0 95.2 96.9 91.4 40.5 40.2 75.1 69.1 54.5 11.8 Costa Rica Ecuador 40.1 80.8 81.3 75.6 38.9 50.7 94.7 98.3 94.5 52.9 29.7 67.8 67.7 58.8 26.9 Ecuador El Salvador 43.0 79.8 83.4 73.7 37.0 52.2 94.4 96.9 92.9 50.1 34.5 68.6 72.2 60.8 27.6 El Salvador Guatemala 59.2 78.8 79.8 75.2 44.4 71.4 96.8 98.5 95.1 63.5 48.2 64.3 65.4 59.1 28.6 Guatemala Honduras 46.5 75.5 79.5 72.7 38.4 56.9 91.3 90.9 91.1 52.7 36.9 63.1 70.4 58.6 28.2 Honduras México 47.5 77.2 78.4 71.2 31.5 59.0 95.5 97.6 92.9 47.6 35.5 60.9 61.9 52.5 18.5 Mexico Nicaragua 45.8 78.3 81.9 74.3 34.1 58.5 94.2 95.7 89.5 51.2 34.1 64.5 71.8 61.8 22.8 NicaraguaPanamá 43.5 80.4 83.2 76.7 22.4 56.3 97.0 97.2 93.4 33.0 31.5 65.9 70.7 62.2 13.9 Panama Paraguay 55.9 83.5 82.9 76.0 36.6 61.6 95.1 98.1 92.6 48.6 50.3 73.0 69.7 61.4 26.4 Paraguay Perú d 56.7 83.2 86.5 83.5 46.1 62.5 92.7 96.4 94.8 58.4 50.9 74.1 78.1 73.8 34.8 Peru d
República Dominicana 41.8 75.9 77.9 69.8 31.9 50.2 88.2 91.9 87.2 47.6 33.5 64.0 66.3 55.6 17.7 Dominican Republic Uruguay 54.1 88.5 89.0 82.7 25.0 61.0 95.5 96.8 92.9 35.3 46.7 81.8 82.0 73.9 17.9 Uruguay Venezuela (República Bolivariana de) e 42.6 80.8 85.0 75.4 35.2 54.7 94.6 97.4 92.1 51.2 30.1 66.8 72.6 59.2 21.0 Venezuela (Bolivarian Republic of) e
a Data refer to 2011 or to the nearest available year.b Thirty-one urban agglomerations.c From 2002 on, the figures for income are not comparable with those of earlier years, owing to new
methodological criteria applied by the National Administrative Department of Statistics (DANE) and the National Planning Department (DNP) in the framework of the Mission for the splicing of employment, poverty and inequality series (MESEP).
d Figures from 2004 on are not strictly comparable with those of previous years, owing to methodological changes introduced by the National Institute of Statistics and Informatics.
e Since 1998, the survey’s sample design does not allow for the rural-urban breakdown. Thus, the data correspond to the national total.
a Los datos se refieren al 2011 o al año más cercano.b Treinta y una aglomeraciones urbanas.c Desde 2002 en adelante, las cifras de ingresos no son comparables con las de años anteriores,
debido a la aplicación de nuevos criterios metodológicos elaborados por el Departamento Administrativo Nacional de Estadística (DANE) y el Departamento Nacional de Planeación (DNP) en el marco de la Misión para el empalme de las series de empleo, pobreza y desigualdad (MESEP).
d Las cifras desde 2004 en adelante no son estrictamente comparables con las anteriores, debido a cambios metodológicos efectuados por el INEI.
e A partir de 1998 el diseño muestral de la encuesta no permite el desglose urbano-rural. Por lo tanto, las cifras corresponden al total nacional.
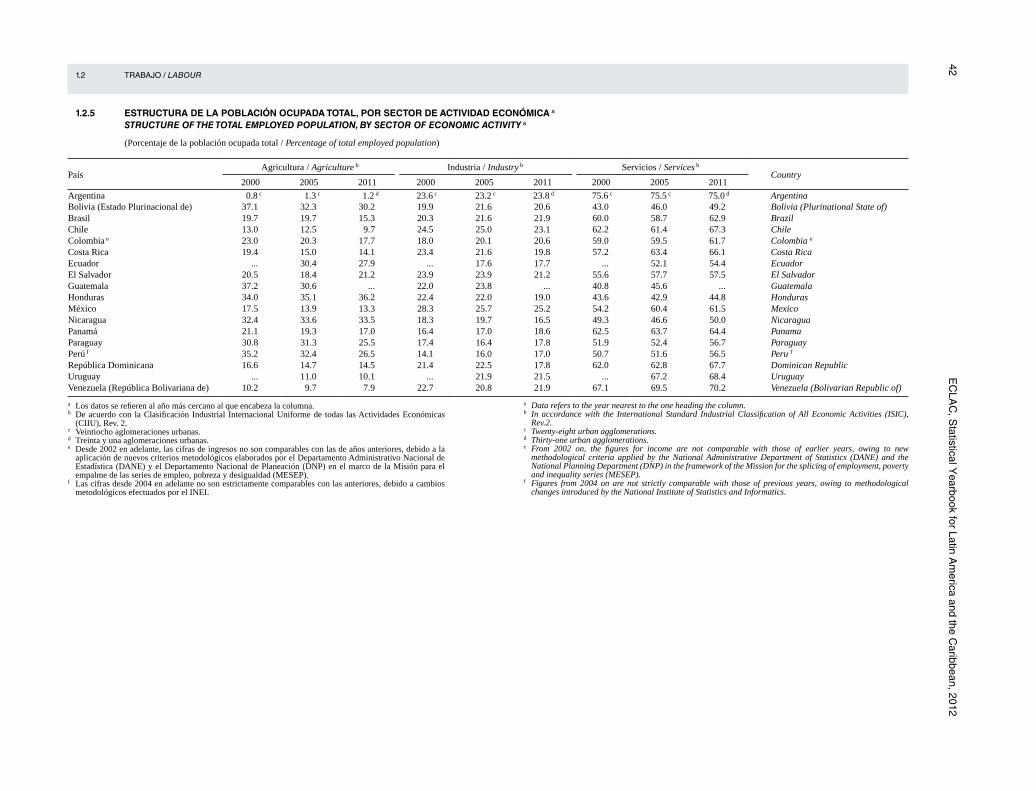
42 E
CLA
C, S
tatistical Yearbook for Latin A
merica and the C
aribbean, 2012 1.2 TRABAJO / LABOUR
1.2.5 ESTRUCTURA DE LA POBLACIÓN OCUPADA TOTAL, POR SECTOR DE ACTIVIDAD ECONÓMICA a
STRUCTURE OF THE TOTAL EMPLOYED POPULATION, BY SECTOR OF ECONOMIC ACTIVITY a
(Porcentaje de la población ocupada total / Percentage of total employed population)
País Agricultura / Agriculture b Industria / Industry b Servicios / Services b
Country 2000 2005 2011 2000 2005 2011 2000 2005 2011
Argentina 0.8 c 1.3 c 1.2 d 23.6 c 23.2 c 23.8 d 75.6 c 75.5 c 75.0 d Argentina Bolivia (Estado Plurinacional de) 37.1 32.3 30.2 19.9 21.6 20.6 43.0 46.0 49.2 Bolivia (Plurinational State of) Brasil 19.7 19.7 15.3 20.3 21.6 21.9 60.0 58.7 62.9 Brazil Chile 13.0 12.5 9.7 24.5 25.0 23.1 62.2 61.4 67.3 Chile Colombia e 23.0 20.3 17.7 18.0 20.1 20.6 59.0 59.5 61.7 Colombia e
Costa Rica 19.4 15.0 14.1 23.4 21.6 19.8 57.2 63.4 66.1 Costa Rica Ecuador ... 30.4 27.9 ... 17.6 17.7 ... 52.1 54.4 Ecuador El Salvador 20.5 18.4 21.2 23.9 23.9 21.2 55.6 57.7 57.5 El Salvador Guatemala 37.2 30.6 ... 22.0 23.8 ... 40.8 45.6 ... Guatemala Honduras 34.0 35.1 36.2 22.4 22.0 19.0 43.6 42.9 44.8 Honduras México 17.5 13.9 13.3 28.3 25.7 25.2 54.2 60.4 61.5 Mexico Nicaragua 32.4 33.6 33.5 18.3 19.7 16.5 49.3 46.6 50.0 Nicaragua Panamá 21.1 19.3 17.0 16.4 17.0 18.6 62.5 63.7 64.4 Panama Paraguay 30.8 31.3 25.5 17.4 16.4 17.8 51.9 52.4 56.7 Paraguay Perú f 35.2 32.4 26.5 14.1 16.0 17.0 50.7 51.6 56.5 Peru f
República Dominicana 16.6 14.7 14.5 21.4 22.5 17.8 62.0 62.8 67.7 Dominican Republic Uruguay ... 11.0 10.1 ... 21.9 21.5 ... 67.2 68.4 Uruguay Venezuela (República Bolivariana de) 10.2 9.7 7.9 22.7 20.8 21.9 67.1 69.5 70.2 Venezuela (Bolivarian Republic of)
a Los datos se refieren al año más cercano al que encabeza la columna.b De acuerdo con la Clasificación Industrial Internacional Uniforme de todas las Actividades Económicas
(CIIU), Rev. 2. c Veintiocho aglomeraciones urbanas.d Treinta y una aglomeraciones urbanas.e Desde 2002 en adelante, las cifras de ingresos no son comparables con las de años anteriores, debido a la
aplicación de nuevos criterios metodológicos elaborados por el Departamento Administrativo Nacional de Estadística (DANE) y el Departamento Nacional de Planeación (DNP) en el marco de la Misión para el empalme de las series de empleo, pobreza y desigualdad (MESEP).
f Las cifras desde 2004 en adelante no son estrictamente comparables con las anteriores, debido a cambios metodológicos efectuados por el INEI.
a Data refers to the year nearest to the one heading the column.b In accordance with the International Standard Industrial Classification of All Economic Activities (ISIC),
Rev.2.c Twenty-eight urban agglomerations.d Thirty-one urban agglomerations.e From 2002 on, the figures for income are not comparable with those of earlier years, owing to new
methodological criteria applied by the National Administrative Department of Statistics (DANE) and the National Planning Department (DNP) in the framework of the Mission for the splicing of employment, poverty and inequality series (MESEP).
f Figures from 2004 on are not strictly comparable with those of previous years, owing to methodological changes introduced by the National Institute of Statistics and Informatics.
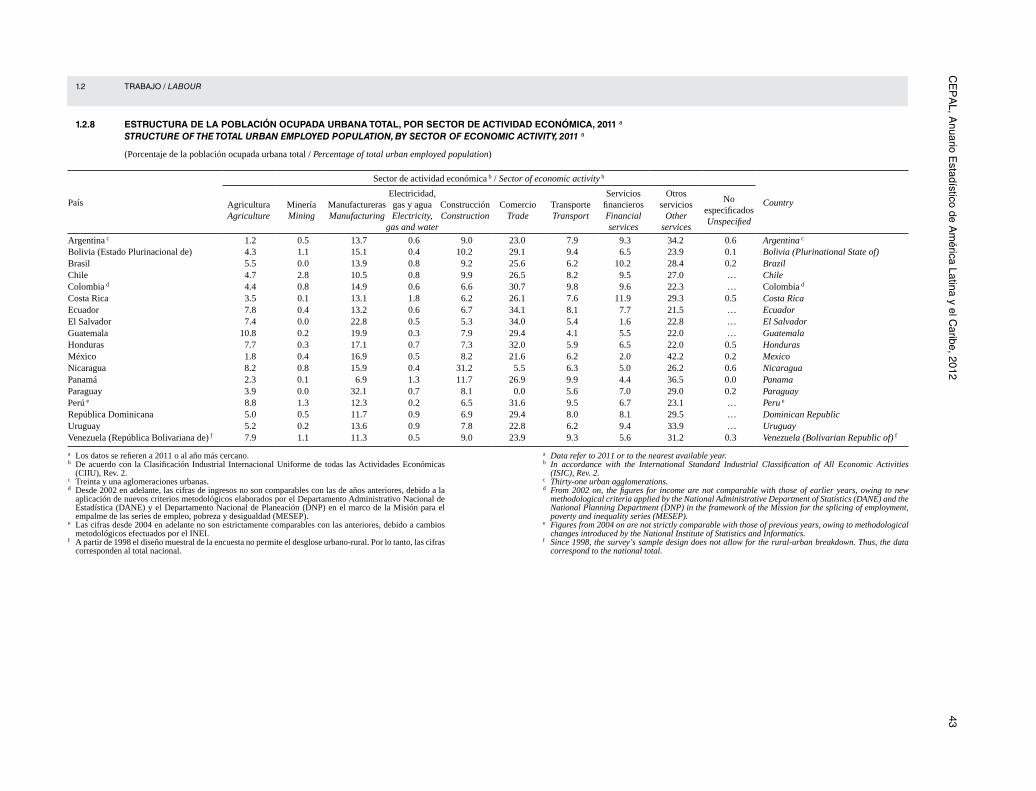
CE
PA
L, Anuario E
stadístico de Am
érica Latina y el Caribe, 2012
43 1.2 TRABAJO / LABOUR
1.2.8 ESTRUCTURA DE LA POBLACIÓN OCUPADA URBANA TOTAL, POR SECTOR DE ACTIVIDAD ECONÓMICA, 2011 a
STRUCTURE OF THE TOTAL URBAN EMPLOYED POPULATION, BY SECTOR OF ECONOMIC ACTIVITY, 2011 a
(Porcentaje de la población ocupada urbana total / Percentage of total urban employed population)
País
Sector de actividad económica b / Sector of economic activity b
CountryAgriculturaAgriculture
MineríaMining
ManufacturerasManufacturing
Electricidad, gas y aguaElectricity,
gas and water
ConstrucciónConstruction
ComercioTrade
TransporteTransport
Servicios financierosFinancial services
Otros servicios
Other services
No especificadosUnspecified
Argentina c 1.2 0.5 13.7 0.6 9.0 23.0 7.9 9.3 34.2 0.6 Argentina c
Bolivia (Estado Plurinacional de) 4.3 1.1 15.1 0.4 10.2 29.1 9.4 6.5 23.9 0.1 Bolivia (Plurinational State of) Brasil 5.5 0.0 13.9 0.8 9.2 25.6 6.2 10.2 28.4 0.2 Brazil Chile 4.7 2.8 10.5 0.8 9.9 26.5 8.2 9.5 27.0 … Chile Colombia d 4.4 0.8 14.9 0.6 6.6 30.7 9.8 9.6 22.3 … Colombia d
Costa Rica 3.5 0.1 13.1 1.8 6.2 26.1 7.6 11.9 29.3 0.5 Costa Rica Ecuador 7.8 0.4 13.2 0.6 6.7 34.1 8.1 7.7 21.5 … Ecuador El Salvador 7.4 0.0 22.8 0.5 5.3 34.0 5.4 1.6 22.8 … El Salvador Guatemala 10.8 0.2 19.9 0.3 7.9 29.4 4.1 5.5 22.0 … Guatemala Honduras 7.7 0.3 17.1 0.7 7.3 32.0 5.9 6.5 22.0 0.5 Honduras México 1.8 0.4 16.9 0.5 8.2 21.6 6.2 2.0 42.2 0.2 Mexico Nicaragua 8.2 0.8 15.9 0.4 31.2 5.5 6.3 5.0 26.2 0.6 NicaraguaPanamá 2.3 0.1 6.9 1.3 11.7 26.9 9.9 4.4 36.5 0.0 Panama Paraguay 3.9 0.0 32.1 0.7 8.1 0.0 5.6 7.0 29.0 0.2 Paraguay Perú e 8.8 1.3 12.3 0.2 6.5 31.6 9.5 6.7 23.1 … Peru e
República Dominicana 5.0 0.5 11.7 0.9 6.9 29.4 8.0 8.1 29.5 … Dominican Republic Uruguay 5.2 0.2 13.6 0.9 7.8 22.8 6.2 9.4 33.9 … Uruguay Venezuela (República Bolivariana de) f 7.9 1.1 11.3 0.5 9.0 23.9 9.3 5.6 31.2 0.3 Venezuela (Bolivarian Republic of) f
a Los datos se refieren a 2011 o al año más cercano.b De acuerdo con la Clasificación Industrial Internacional Uniforme de todas las Actividades Económicas
(CIIU), Rev. 2. c Treinta y una aglomeraciones urbanas.d Desde 2002 en adelante, las cifras de ingresos no son comparables con las de años anteriores, debido a la
aplicación de nuevos criterios metodológicos elaborados por el Departamento Administrativo Nacional de Estadística (DANE) y el Departamento Nacional de Planeación (DNP) en el marco de la Misión para el empalme de las series de empleo, pobreza y desigualdad (MESEP).
e Las cifras desde 2004 en adelante no son estrictamente comparables con las anteriores, debido a cambios metodológicos efectuados por el INEI.
f A partir de 1998 el diseño muestral de la encuesta no permite el desglose urbano-rural. Por lo tanto, las cifras corresponden al total nacional.
a Data refer to 2011 or to the nearest available year.b In accordance with the International Standard Industrial Classification of All Economic Activities
(ISIC), Rev. 2.c Thirty-one urban agglomerations.d From 2002 on, the figures for income are not comparable with those of earlier years, owing to new
methodological criteria applied by the National Administrative Department of Statistics (DANE) and the National Planning Department (DNP) in the framework of the Mission for the splicing of employment, poverty and inequality series (MESEP).
e Figures from 2004 on are not strictly comparable with those of previous years, owing to methodological changes introduced by the National Institute of Statistics and Informatics.
f Since 1998, the survey’s sample design does not allow for the rural-urban breakdown. Thus, the data correspond to the national total.

44 E
CLA
C, S
tatistical Yearbook for Latin A
merica and the C
aribbean, 2012 1.2 TRABAJO / LABOUR
1.2.11 ESTRUCTURA DE LA POBLACIÓN OCUPADA URBANA TOTAL, POR GRUPOS OCUPACIONALES, 2011 a
STRUCTURE OF THE TOTAL URBAN EMPLOYED POPULATION, BY OCCUPATIONAL GROUP, 2011 a
(Porcentaje del total de la población ocupada urbana / Percentage of the total urban employed population)
PaísOcupaciones b / Ocupations b
Country1 2 3 4 5 6 7 8 9 0
Bolivia (Estado Plurinacional de) 1.4 10.3 10.5 5.6 25.0 3.8 23.0 8.3 12.0 0.1 Bolivia (Plurinational State of)
Chile 5.2 12.5 8.1 8.6 16.4 2.5 14.6 9.0 22.8 0.3 Chile
Costa Rica 3.5 12.8 16.3 9.8 16.1 1.3 10.1 8.1 21.6 0.0 Costa Rica
Ecuador 1.6 9.5 6.6 8.8 26.1 3.4 15.1 8.9 19.5 0.6 Ecuador
El Salvador 1.5 5.8 9.1 6.5 24.4 2.8 15.5 8.2 26.1 0.1 El Salvador
Panamá 7.5 12.7 10.5 9.1 20.2 1.2 13.1 8.4 17.3 0.0 Panama
Paraguay 5.2 9.6 9.7 7.1 23.2 3.9 17.1 5.9 18.1 0.3 Paraguay
Perú c 0.7 9.3 8.6 7.4 19.5 4.6 10.2 11.4 27.3 1.1 Peru c
República Dominicana 3.8 7.8 8.4 8.8 21.7 3.0 15.2 9.4 20.8 1.0 Dominican Republic
Uruguay 6.5 10.8 7.3 14.1 15.2 2.3 13.8 7.8 21.3 0.7 Uruguay
a Data refer to 2011 or to the nearest available year.b In accordance with the International Standard Classification of Occupations (ISCO, 1988) of
ILO. See technical notes.c Figures from 2004 on are not strictly comparable with those of previous years, owing to
methodological changes introduced by the National Institute of Statistics and Informatics.
a Los datos se refieren a 2011 o al año más cercano.b De acuerdo con la Clasificación Internacional Uniforme de Ocupaciones (CIUO) de la OIT
(1988). Véanse las notas técnicas.c Las cifras desde 2004 en adelante no son estrictamente comparables con las anteriores, debido
a cambios metodológicos efectuados por el INEI.

CE
PA
L, Anuario E
stadístico de Am
érica Latina y el Caribe, 2012
45 1.2 TRABAJO / LABOUR
1.2.14 ESTRUCTURA DE LA POBLACIÓN OCUPADA URBANA TOTAL, POR CATEGORÍA OCUPACIONAL, 2011 a
STRUCTURE OF THE TOTAL URBAN EMPLOYED POPULATION, BY CATEGORY OF EMPLOYMENT, 2011 a
(Porcentaje del total de la población ocupada urbana / Percentage of total urban employed population)
PaísEmpleadores Employers
Asalariados Employees
Cuenta propiaSelf-employed
Servicio domésticoDomestic service
Familiares y/o no remunerados Unpaid and/or family workers
Country
Argentina b 4.5 70.5 17.9 6.4 0.7 Argentina b
Bolivia (Estado Plurinacional de) 5.5 51.5 32.1 3.7 7.1 Bolivia (Plurinational State of) Brasil 3.7 66.3 21.0 7.7 1.3 Brazil Chile 1.9 72.4 19.7 5.7 0.4 Chile Colombia c 5.0 45.5 42.4 3.9 3.3 Colombia c
Costa Rica 4.1 70.5 17.2 7.5 0.7 Costa Rica Ecuador 3.6 55.9 32.3 2.7 5.4 Ecuador El Salvador 4.4 57.5 28.7 3.8 5.6 El Salvador Guatemala 5.3 56.6 25.5 3.9 8.8 Guatemala Honduras 3.8 52.4 33.3 4.0 6.5 Honduras Nicaragua 7.3 75.2 10.7 3.7 3.1 NicaraguaMéxico 1.0 52.4 36.7 4.6 4.7 Mexico Panamá 3.5 73.0 17.9 5.0 0.6 Panama Paraguay 6.2 58.9 24.4 7.4 2.9 Paraguay Perú d 5.7 50.6 34.0 3.5 6.3 Peru d
República Dominicana 3.7 50.6 38.4 5.9 1.5 Dominican Republic Uruguay 4.6 66.9 20.6 7.0 0.9 Uruguay Venezuela (República Bolivariana de) e 3.5 56.0 38.5 1.2 0.9 Venezuela (Bolivarian Republic of) e
a Los datos se refieren al 2011 o al año más cercano.b Treinta y una aglomeraciones urbanas.c Desde 2002 en adelante, las cifras de ingresos no son comparables con las de años anteriores, debido
a la aplicación de nuevos criterios metodológicos elaborados por el Departamento Administrativo Nacional de Estadística (DANE) y el Departamento Nacional de Planeación (DNP) en el marco de la Misión para el empalme de las series de empleo, pobreza y desigualdad (MESEP).
d Las cifras desde 2004 en adelante no son estrictamente comparables con las anteriores, debido a cambios metodológicos efectuados por el INEI.
e A partir de 1998 el diseño muestral de la encuesta no permite el desglose urbano-rural. Por lo tanto, las cifras corresponden al total nacional.
a Data refer to 2011 or to the nearest available year.b Thirty-one urban agglomerations.c From 2002 on, the figures for income are not comparable with those of earlier years, owing to new
methodological criteria applied by the National Administrative Department of Statistics (DANE) and the National Planning Department (DNP) in the framework of the Mission for the splicing of employment, poverty and inequality series (MESEP).
d Figures from 2004 on are not strictly comparable with those of previous years, owing to methodological changes introduced by the National Institute of Statistics and Informatics.
e Since 1998, the survey’s sample design does not allow for the rural-urban breakdown. Thus, the data correspond to the national total.
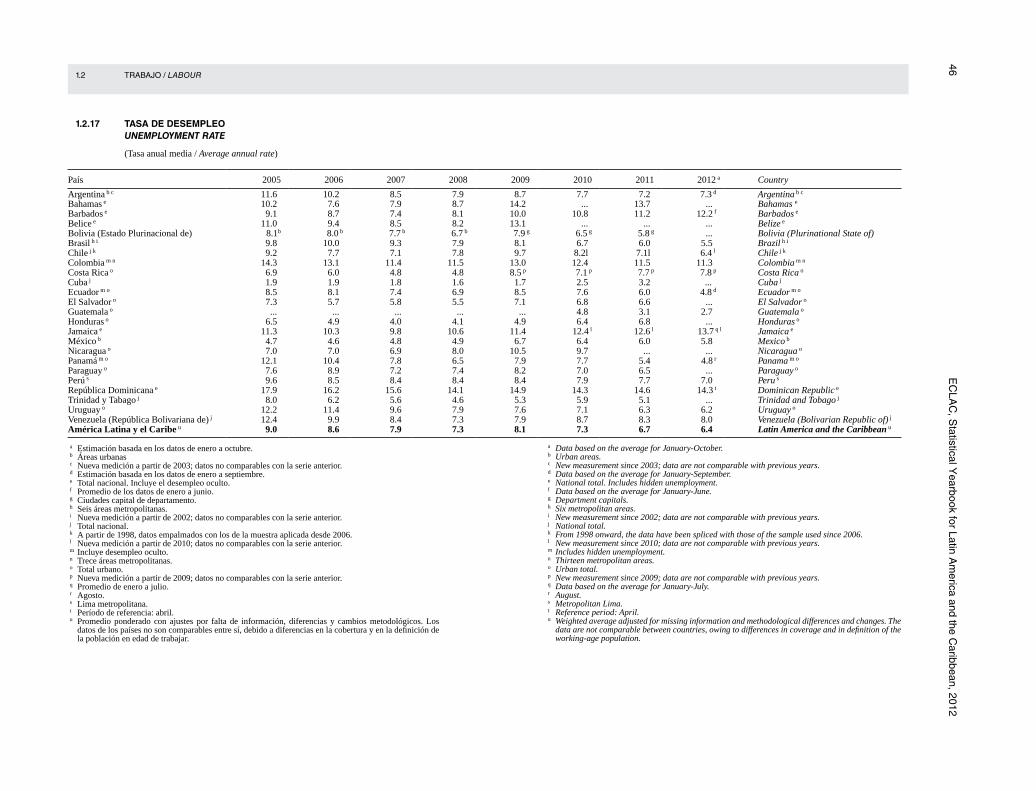
46 E
CLA
C, S
tatistical Yearbook for Latin A
merica and the C
aribbean, 2012 1.2 TRABAJO / LABOUR
1.2.17 TASA DE DESEMPLEO UNEMPLOYMENT RATE
(Tasa anual media / Average annual rate)
País 2005 2006 2007 2008 2009 2010 2011 2012 a Country
Argentina b c 11.6 10.2 8.5 7.9 8.7 7.7 7.2 7.3 d Argentina b c
Bahamas e 10.2 7.6 7.9 8.7 14.2 ... 13.7 ... Bahamas e
Barbados e 9.1 8.7 7.4 8.1 10.0 10.8 11.2 12.2 f Barbados e
Belice e 11.0 9.4 8.5 8.2 13.1 ... ... ... Belize e
Bolivia (Estado Plurinacional de) 8.1b 8.0 b 7.7 b 6.7 b 7.9 g 6.5 g 5.8 g ... Bolivia (Plurinational State of)
Brasil h i 9.8 10.0 9.3 7.9 8.1 6.7 6.0 5.5 Brazil h i
Chile j k 9.2 7.7 7.1 7.8 9.7 8.2l 7.1l 6.4 l Chile j k
Colombia m n 14.3 13.1 11.4 11.5 13.0 12.4 11.5 11.3 Colombia m n
Costa Rica o 6.9 6.0 4.8 4.8 8.5 p 7.1 p 7.7 p 7.8 p Costa Rica o
Cuba j 1.9 1.9 1.8 1.6 1.7 2.5 3.2 ... Cuba j
Ecuador m o 8.5 8.1 7.4 6.9 8.5 7.6 6.0 4.8 d Ecuador m o
El Salvador o 7.3 5.7 5.8 5.5 7.1 6.8 6.6 ... El Salvador o
Guatemala o ... ... ... ... ... 4.8 3.1 2.7 Guatemala o
Honduras o 6.5 4.9 4.0 4.1 4.9 6.4 6.8 ... Honduras o
Jamaica e 11.3 10.3 9.8 10.6 11.4 12.4 l 12.6 l 13.7 q l Jamaica e
México b 4.7 4.6 4.8 4.9 6.7 6.4 6.0 5.8 Mexico b
Nicaragua o 7.0 7.0 6.9 8.0 10.5 9.7 ... ... Nicaragua o
Panamá m o 12.1 10.4 7.8 6.5 7.9 7.7 5.4 4.8 r Panama m o
Paraguay o 7.6 8.9 7.2 7.4 8.2 7.0 6.5 ... Paraguay o
Perú s 9.6 8.5 8.4 8.4 8.4 7.9 7.7 7.0 Peru s
República Dominicana e 17.9 16.2 15.6 14.1 14.9 14.3 14.6 14.3 t Dominican Republic e
Trinidad y Tabago j 8.0 6.2 5.6 4.6 5.3 5.9 5.1 ... Trinidad and Tobago j
Uruguay o 12.2 11.4 9.6 7.9 7.6 7.1 6.3 6.2 Uruguay o
Venezuela (República Bolivariana de) j 12.4 9.9 8.4 7.3 7.9 8.7 8.3 8.0 Venezuela (Bolivarian Republic of) j
América Latina y el Caribe u 9.0 8.6 7.9 7.3 8.1 7.3 6.7 6.4 Latin America and the Caribbean u
a Estimación basada en los datos de enero a octubre.b Áreas urbanasc Nueva medición a partir de 2003; datos no comparables con la serie anterior.d Estimación basada en los datos de enero a septiembre.e Total nacional. Incluye el desempleo oculto.f Promedio de los datos de enero a junio.g Ciudades capital de departamento.h Seis áreas metropolitanas.i Nueva medición a partir de 2002; datos no comparables con la serie anterior.j Total nacional.k A partir de 1998, datos empalmados con los de la muestra aplicada desde 2006.l Nueva medición a partir de 2010; datos no comparables con la serie anterior.m Incluye desempleo oculto.n Trece áreas metropolitanas.o Total urbano.p Nueva medición a partir de 2009; datos no comparables con la serie anterior.q Promedio de enero a julio.r Agosto.s Lima metropolitana.t Período de referencia: abril.u Promedio ponderado con ajustes por falta de información, diferencias y cambios metodológicos. Los
datos de los países no son comparables entre sí, debido a diferencias en la cobertura y en la definición de la población en edad de trabajar.
a Data based on the average for January-October.b Urban areas.c New measurement since 2003; data are not comparable with previous years.d Data based on the average for January-September.e National total. Includes hidden unemployment.f Data based on the average for January-June.g Department capitals.h Six metropolitan areas.i New measurement since 2002; data are not comparable with previous years.j National total.k From 1998 onward, the data have been spliced with those of the sample used since 2006.l New measurement since 2010; data are not comparable with previous years.m Includes hidden unemployment.n Thirteen metropolitan areas.o Urban total.p New measurement since 2009; data are not comparable with previous years.q Data based on the average for January-July.r August.s Metropolitan Lima.t Reference period: April.u Weighted average adjusted for missing information and methodological differences and changes. The
data are not comparable between countries, owing to differences in coverage and in definition of the working-age population.

CE
PA
L, Anuario E
stadístico de Am
érica Latina y el Caribe, 2012
47 1.2 TRABAJO / LABOUR
1.2.18 TASA DE DESEMPLEO ABIERTO URBANO SEGÚN SEXO Y GRUPOS DE EDAD, 2011 a
URBAN OPEN UNEMPLOYMENT RATE, BY SEX AND AGE GROUP, 2011 a
(Porcentaje / Percentage)
País SexoGrupos de edad / Age groups
Sex CountryTotal 15-24 25-34 35-44 45 y más /45 and over
Argentina b Ambos sexos 7.2 18.7 7.1 4.5 4.1 Both sexes Argentina b
Hombres 6.2 16.5 5.4 3.6 4.0 Men Mujeres 8.5 22.2 9.5 5.6 4.2 Women
Bolivia (Estado Plurinacional de) Ambos sexos 4.8 8.6 5.4 3.2 2.6 Both sexes Bolivia (Plurinational State of) Hombres 3.6 6.4 4.3 2.0 2.4 Men Mujeres 6.2 11.2 6.7 4.9 3.0 Women
Brasil Ambos sexos 7.4 16.8 7.4 4.9 3.1 Both sexes Brazil Hombres 5.5 13.7 4.6 3.3 2.5 Men Mujeres 9.8 20.7 10.6 6.8 3.9 Women
Chile Ambos sexos 7.8 20.2 8.2 5.8 4.2 Both sexes Chile Hombres 6.6 17.6 7.0 4.0 3.5 Men Mujeres 9.6 24.1 9.7 7.9 5.1 Women
Colombia c Ambos sexos 11.8 24.2 11.8 7.9 7.1 Both sexes Colombia c
Hombres 9.6 20.2 8.5 5.6 6.9 MenMujeres 14.4 29.1 15.6 10.3 7.3 Women
Costa Rica Ambos sexos 7.7 17.3 8.6 4.9 3.4 Both sexes Costa Rica Hombres 6.3 15.4 5.9 3.1 3.6 Men Mujeres 9.7 19.8 11.9 7.0 3.2 Women
Ecuador Ambos sexos 5.1 13.0 6.6 2.5 2.0 Both sexes Ecuador Hombres 4.3 11.5 4.8 1.6 2.0 Men Mujeres 6.1 15.5 9.0 3.6 2.0 Women
El Salvador Ambos sexos 6.8 15.4 6.8 3.7 3.7 Both sexes El Salvador Hombres 8.3 15.7 7.4 5.2 6.2 Men Mujeres 5.1 14.9 6.2 2.0 0.9 Women
Guatemala Ambos sexos 2.7 5.4 2.4 1.4 1.2 Both sexes Guatemala Hombres 2.4 4.5 2.4 1.1 1.3 Men Mujeres 3.1 6.7 2.3 1.8 1.0 Women
Honduras Ambos sexos 6.5 12.7 7.3 3.7 2.4 Both sexes Honduras Hombres 5.9 10.6 5.9 3.5 3.2 Men Mujeres 7.2 15.7 9.0 3.9 1.4 Women
México Ambos sexos 6.3 12.8 6.2 3.6 4.4 Both sexes Mexico Hombres 7.6 14.3 6.9 4.2 6.3 Men Mujeres 4.3 10.1 5.4 2.9 1.3 Women
Nicaragua Ambos sexos 8.4 15.5 8.8 5.8 3.9 Both sexes Nicaragua Hombres 9.2 15.1 9.4 6.7 5.3 Men Mujeres 7.3 16.2 8.0 4.8 2.2 Women
Panamá Ambos sexos 5.4 15.6 6.1 2.6 2.3 Both sexes Panama Hombres 5.3 14.7 5.3 2.0 3.3 Men Mujeres 5.4 17.1 7.0 3.4 1.0 Women
Paraguay Ambos sexos 6.4 15.8 4.5 3.0 3.3 Both sexes Paraguay Hombres 4.9 11.7 2.7 2.8 3.1 Men Mujeres 8.3 20.7 6.7 3.2 3.5 Women
Perú d Ambos sexos 4.8 12.1 4.6 2.2 2.4 Both sexes Peru d
Hombres 4.5 12.3 3.7 1.8 2.2 Men Mujeres 5.2 11.9 5.8 2.7 2.6 Women
República Dominicana Ambos sexos 7.0 14.1 8.5 5.0 2.4 Both sexes Dominican Republic Hombres 5.7 11.0 6.7 4.8 2.0 Men Mujeres 8.7 18.7 11.0 5.3 2.8 Women
Uruguay Ambos sexos 6.3 18.0 6.0 3.7 2.9 Both sexes Uruguay Hombres 4.9 15.4 3.9 2.2 2.2 Men Mujeres 7.8 21.6 8.3 5.2 3.7 Women
Venezuela (República Bolivariana de) e Ambos sexos 7.8 16.5 8.9 4.9 4.3 Both sexes Venezuela (Bolivarian Republic of) eHombres 7.0 14.0 7.3 4.5 4.6 Men Mujeres 9.1 21.2 11.3 5.4 3.9 Women
a Los datos se refieren al 2011 o al año más cercano.b Treinta y una aglomeraciones urbanas.c Desde 2002 en adelante, las cifras de ingresos no son comparables con las de años anteriores, debido
a la aplicación de nuevos criterios metodológicos elaborados por el Departamento Administrativo Nacional de Estadística (DANE) y el Departamento Nacional de Planeación (DNP) en el marco de la Misión para el empalme de las series de empleo, pobreza y desigualdad (MESEP).
d Las cifras desde 2004 en adelante no son estrictamente comparables con las anteriores, debido a cambios metodológicos efectuados por el INEI.
e A partir de 1998 el diseño muestral de la encuesta no permite el desglose urbano-rural. Por lo tanto, las cifras corresponden al total nacional.
b Data refers to 2011 or the nearest available year.b Thirty-one urban agglomerations.c From 2002 on, the figures for income are not comparable with those of earlier years, owing to new
methodological criteria applied by the National Administrative Department of Statistics (DANE) and the National Planning Department (DNP) in the framework of the Mission for the splicing of employment, poverty and inequality series (MESEP).
d Figures from 2004 on are not strictly comparable with those of previous years, owing to methodological changes introduced by the National Institute of Statistics and Informatics.
e Since 1998, the survey’s sample design does not allow for the rural-urban breakdown. Thus, the data correspond to the national total.

48 E
CLA
C, S
tatistical Yearbook for Latin A
merica and the C
aribbean, 2012 1.2 TRABAJO / LABOUR
1.2.19 TASA DE DESEMPLEO ABIERTO URBANO, SEGÚN SEXO Y AÑOS DE ESTUDIOS, 2011 a
URBAN OPEN UNEMPLOYMENT RATE, BY SEX AND YEARS OF SCHOOLING, 2011 a
(Tasa anual media / Average annual rate)
País SexoAños de estudio / Years of schooling
Sex CountryTotal 0-5 6-9 10-12 13 y más / 13 and over
Argentina b Ambos sexos 7.2 9.3 7.7 8.1 5.5 Both sexes Argentina b
Hombres 6.2 9.7 7.2 6.6 4.2 Men Mujeres 8.5 8.4 8.5 10.5 6.7 Women
Bolivia (Estado Plurinacional de) Ambos sexos 4.8 3.8 4.0 5.1 5.5 Both sexes Bolivia (Plurinational State of) Hombres 3.6 3.2 2.1 3.6 4.9 Men Mujeres 6.2 4.4 6.7 7.7 6.3 Women
Brasil Ambos sexos 7.4 5.9 9.9 8.3 4.3 Both sexes Brazil Hombres 5.5 4.6 7.4 5.7 3.2 Men Mujeres 9.8 8.2 13.8 11.2 5.1 Women
Chile Ambos sexos 7.8 6.3 8.1 9.0 6.2 Both sexes Chile Hombres 6.6 4.4 6.3 7.4 5.6 Men Mujeres 9.6 9.4 10.8 11.1 6.8 Women
Colombia c Ambos sexos 11.8 8.7 12.3 14.6 10.8 Both sexes Colombia c
Hombres 9.6 7.4 10.0 11.5 9.2 Men Mujeres 14.4 10.5 15.3 18.3 12.3 Women
Costa Rica Ambos sexos 7.7 8.9 8.8 8.8 4.9 Both sexes Costa Rica Hombres 6.3 7.4 7.4 6.3 3.8 Men Mujeres 9.7 11.6 11.0 11.9 6.1 Women
Ecuador Ambos sexos 5.1 2.6 6.2 6.7 5.0 Both sexes Ecuador Hombres 4.3 2.3 4.9 5.6 4.3 Men Mujeres 6.1 3.0 8.3 8.4 5.8 Women
El Salvador Ambos sexos 6.8 5.0 6.3 9.1 6.4 Both sexes El Salvador Hombres 8.3 8.1 8.2 8.8 7.8 Men Mujeres 5.1 1.9 3.7 9.5 5.1 Women
Guatemala Ambos sexos 2.7 1.7 2.9 4.5 2.2 Both sexes Guatemala Hombres 2.4 1.3 2.5 4.2 2.4 Men Mujeres 3.1 2.2 3.5 4.8 1.8 Women
Honduras Ambos sexos 6.5 3.5 5.5 9.7 7.8 Both sexes Honduras Hombres 5.9 3.3 6.0 8.2 6.1 Men Mujeres 7.2 3.7 4.6 11.0 9.5 Women
México Ambos sexos 6.3 6.3 6.7 6.3 5.6 Both sexes Mexico Hombres 7.6 9.4 8.2 7.4 5.6 Men Mujeres 4.3 1.5 4.1 4.6 5.5 Women
Nicaragua Ambos sexos 8.4 6.2 9.2 9.4 8.8 Both sexes Nicaragua Hombres 9.2 7.7 10.6 9.6 8.2 Men Mujeres 7.3 4.3 7.0 9.2 9.4 Women
Panamá Ambos sexos 5.4 4.2 5.3 7.4 3.5 Both sexes Panama Hombres 5.3 5.4 5.6 6.8 3.0 Men Mujeres 5.4 1.8 4.8 8.4 3.8 Women
Paraguay Ambos sexos 6.4 4.8 5.4 7.8 6.4 Both sexes Paraguay Hombres 4.9 4.0 4.7 5.8 4.3 Men Mujeres 8.3 5.9 6.4 10.8 8.3 Women
Perú d Ambos sexos 4.8 2.6 5.7 5.6 4.8 Both sexes Peru d
Hombres 4.5 2.9 6.6 4.8 4.0 Men Mujeres 5.2 2.3 4.7 6.8 5.6 Women
República Dominicana Ambos sexos 7.0 4.3 7.0 7.8 8.0 Both sexes Dominican Republic Hombres 5.7 4.3 5.5 6.3 6.8 Men Mujeres 8.7 4.5 9.6 9.8 8.9 Women
Uruguay Ambos sexos 6.3 5.5 7.5 6.6 4.2 Both sexes Uruguay Hombres 4.9 4.3 5.5 5.1 3.6 Men Mujeres 7.8 7.8 10.6 8.3 4.7 Women
Venezuela (República Bolivariana de) e Ambos sexos 7.8 6.1 6.5 8.3 9.5 Both sexes Venezuela (Bolivarian Republic of) e
Hombres 7.0 5.9 6.4 7.7 8.0 Men Mujeres 9.1 6.9 6.8 9.4 10.8 Women
a Los datos se refieren al 2011 o al año más cercano. b Treinta y una aglomeraciones urbanas.c Desde 2002 en adelante, las cifras de ingresos no son comparables con las de años anteriores, debido a la
aplicación de nuevos criterios metodológicos elaborados por el Departamento Administrativo Nacional de Estadística (DANE) y el Departamento Nacional de Planeación (DNP) en el marco de la Misión para el empalme de las series de empleo, pobreza y desigualdad (MESEP).
d Las cifras desde 2004 en adelante no son estrictamente comparables con las anteriores, debido a cambios metodológicos efectuados por el INEI.
e A partir de 1998 el diseño muestral de la encuesta no permite el desglose urbano-rural. Por lo tanto, las cifras corresponden al total nacional.
a Data refer to 2011 or to the nearest available year.b Thirty-one urban agglomerations.c From 2002 on, the figures for income are not comparable with those of earlier years, owing to new
methodological criteria applied by the National Administrative Department of Statistics (DANE) and the National Planning Department (DNP) in the framework of the Mission for the splicing of employment, poverty and inequality series (MESEP).
d Figures from 2004 on are not strictly comparable with those of previous years, owing to methodological changes introduced by the National Institute of Statistics and Informatics.
e Since 1998, the survey’s sample design does not allow for the rural-urban breakdown. Thus, the data correspond to the national total.

CE
PA
L, Anuario E
stadístico de Am
érica Latina y el Caribe, 2012
49
a Los datos se refieren al año más cercano al que encabeza la columna.b Estimaciones del Instituto de Estadística de la UNESCO.c Incluye 41 países. Veánse las notas técnicas.
a Data refers to the year nearest to the one heading the column.b Estimates of the UNESCO Institute for Statistics.c Includes 41 countries. See technical notes.
1.3 EDUCACIÓN / EDUCATION
1.3.1 TASA DE ALFABETIZACIÓN DE LAS PERSONAS DE 15 AÑOS Y MAS DE EDAD, POR SEXO a
LITERACY RATE IN THE POPULATION AGED 15 YEARS AND OVER, BY SEX a
(Porcentaje de la población de 15 y más años de edad / Percentage of the population aged 15 years and over)
País Ambos sexos / Both sexes Hombres / Men Mujeres / Women
Country 2000 2005 2010 2000 2005 2010 2000 2005 2010
Antigua y Barbuda 99.0 ... 99.0 b 98.4 ... 98.4 b 99.4 ... 99.4 b Antigua and Barbuda Antiguas Antillas Neerlandesas b ... ... 96.5 ... ... 96.5 ... ... 96.4 Former Netherlands Antilles b
Argentina 97.2 ... 97.8 b 97.2 ... 97.8 b 97.2 ... 97.8 b Argentina Aruba 97.3 ... 96.8 97.5 ... 96.9 97.1 ... 96.7 Aruba Bolivia (Estado Plurinacional de) 86.7 90.7 91.2 93.1 96.0 95.8 80.7 86.0 86.8 Bolivia (Plurinational State of) Brasil 86.4 89.6 90.3 86.2 89.4 90.2 86.5 89.9 90.4 Brazil Chile ... ... 98.6 ... 98.6 98.6 ... ... 98.5 Chile Colombia ... 92.8 93.4 ... 92.8 93.3 ... 92.9 93.5 Colombia Costa Rica 94.9 ... 96.2 b 94.7 ... 95.9 b 95.1 ... 96.4 b Costa Rica Cuba b ... ... 99.8 ... ... 99.8 ... ... 99.8 Cuba b
Ecuador 91.0 84.2 91.9 92.3 ... 93.3 89.7 81.7 90.5 Ecuador El Salvador ... 83.6 84.5 ... 86.7 87.1 ... 81.0 82.3 El Salvador Guatemala b ... ... 75.2 ... ... 80.6 ... ... 70.3 Guatemala b
Haití b ... 48.7 ... ... 53.4 ... ... 44.6 ... Haiti b
Honduras 80.0 83.6 84.8 79.8 83.7 84.8 80.2 83.5 84.7 Honduras Islas Caimán ... 98.9 ... ... 98.7 ... ... 99.0 ... Cayman Islands Jamaica b ... ... 86.6 ... ... 81.6 ... ... 91.4 Jamaica b
México 90.5 91.6 93.1 92.6 93.2 94.4 88.7 90.2 91.9 Mexico Nicaragua 76.7 78.0 ... 76.8 78.1 ... 76.6 77.9 ... Nicaragua Panamá 91.9 ... 94.1 92.5 ... 94.7 91.2 ... 93.5 Panama Paraguay ... 94.6 93.9 ... 95.7 94.8 ... 93.5 92.9 Paraguay Perú ... 87.9 ... ... 93.7 ... ... 82.5 ... Peru Puerto Rico b ... ... 90.4 ... ... 89.8 ... ... 91.0 Puerto Rico b
República Dominicana ... 88.2 89.5 ... 88.2 89.4 ... 88.3 89.7 Dominican Republic Suriname ... ... 94.7 ... 95.5 95.4 ... ... 94.0 Suriname Trinidad y Tabago b ... ... 98.8 ... ... 99.2 ... ... 98.4 Trinidad and Tobago b
Uruguay ... 97.8 98.1 ... 97.4 97.6 ... 98.1 98.5 Uruguay Venezuela (República Bolivariana de) 93.0 95.2 95.5 93.3 95.4 95.7 92.7 94.9 95.4 Venezuela (Bolivarian Republic of) América Latina y el Caribe c 89.7 91.4 91.4 90.6 92.1 92.1 89.0 90.7 90.7 Latin America and the Caribbean c

50 E
CLA
C, S
tatistical Yearbook for Latin A
merica and the C
aribbean, 2012 1.3 EDUCACIÓN / EDUCATION
1.3.2 POBLACIÓN URBANA ANALFABETA, POR SEXO Y GRUPOS DE EDAD, 2011 a
ILLITERACY IN THE URBAN POPULATION, BY SEX AND AGE GROUP, 2011 a
(Porcentaje de población en cada grupo de edad / Percentage of population in each age group)
País SexoGrupos de edad / Age groups
Sex CountryTotal 15-24 25-34 35-44 45-59 60 y más / 60 and over
Argentina b Ambos sexos 0.9 0.5 0.5 0.6 0.9 2.3 Both sexes Argentina b
Hombres 0.9 0.6 0.5 0.6 1.0 1.9 Men Mujeres 1.0 0.4 0.5 0.6 0.8 2.6 Women
Bolivia (Estado Plurinacional de) Ambos sexos 4.7 0.3 1.8 3.1 8.1 20.5 Both sexes Bolivia (Plurinational State of) Hombres 2.1 0.1 1.5 1.2 3.7 8.5 Men Mujeres 7.1 0.5 2.1 5.2 12.0 30.8 Women
Brasil Ambos sexos 6.5 1.1 2.5 4.6 7.6 20.6 Both sexes Brazil Hombres 6.3 1.6 3.2 5.3 7.6 18.3 Men Mujeres 6.7 0.7 1.9 3.9 7.6 22.3 Women
Chile Ambos sexos 2.5 0.6 0.8 1.3 2.5 7.3 Both sexes Chile Hombres 2.2 0.8 0.8 1.8 2.5 5.9 Men Mujeres 2.7 0.4 0.7 0.9 2.6 8.4 Women
Colombia c Ambos sexos 4.2 1.1 1.7 2.9 5.1 14.2 Both sexes Colombia c
Hombres 4.0 1.4 1.9 3.1 4.9 12.6 Men Mujeres 4.4 0.8 1.4 2.6 5.2 15.4 Women
Ecuador Ambos sexos 11.4 3.5 6.4 7.6 11.8 18.8 Both sexes Ecuador Hombres 8.8 4.2 7.6 5.8 8.7 13.5 Men Mujeres 13.7 2.7 5.3 9.1 14.2 22.9 Women
El Salvador Ambos sexos 9.9 2.1 4.5 7.9 13.6 29.7 Both sexes El Salvador Hombres 7.0 2.0 4.0 6.2 9.1 20.7 Men Mujeres 12.1 2.1 4.9 9.3 16.7 36.1 Women
Guatemala Ambos sexos 14.0 5.5 8.5 13.4 22.7 36.0 Both sexes Guatemala Hombres 9.0 3.8 5.6 7.6 12.5 27.2 Men Mujeres 18.2 6.9 10.8 17.9 30.8 43.3 Women
Honduras Ambos sexos 7.8 1.9 4.4 5.3 10.2 28.2 Both sexes Honduras Hombres 7.0 2.0 5.4 5.1 9.3 23.5 Men Mujeres 8.5 1.8 3.6 5.5 10.9 31.5 Women
México Ambos sexos 3.7 1.0 1.6 2.2 4.1 12.9 Both sexes Mexico Hombres 2.9 1.2 1.8 1.8 2.8 9.9 Men Mujeres 4.4 0.8 1.4 2.6 5.3 15.3 Women
Nicaragua Ambos sexos 9.0 3.4 6.2 6.3 12.0 30.0 Both sexes Nicaragua Hombres 8.0 3.9 6.4 4.5 9.7 28.6 Men Mujeres 9.9 2.8 6.0 7.7 14.0 30.9 Women
Paraguay Ambos sexos 3.1 0.9 1.2 1.9 2.7 12.3 Both sexes Paraguay Hombres 2.6 1.3 0.9 2.1 2.1 9.3 Men Mujeres 3.5 0.5 1.5 1.7 3.2 14.8 Women
Perú d Ambos sexos 4.9 0.9 1.6 2.5 4.9 17.0 Both sexes Peru d
Hombres 2.5 0.9 1.2 1.1 2.1 8.1 Men Mujeres 7.1 0.9 1.9 3.7 7.3 25.3 Women
República Dominicana Ambos sexos 6.6 1.8 3.9 5.0 9.5 18.1 Both sexes Dominican Republic Hombres 6.2 2.7 4.2 5.0 8.8 14.7 Men Mujeres 7.0 0.9 3.5 5.0 10.1 21.2 Women
Uruguay Ambos sexos 1.6 1.1 1.2 1.1 1.2 2.8 Both sexes Uruguay Hombres 1.8 1.4 1.4 1.4 1.5 3.4 Men Mujeres 1.3 0.9 0.9 0.8 1.0 2.5 Women
Venezuela (República Bolivariana de) e Ambos sexos 4.2 1.4 1.9 2.5 4.4 15.4 Both sexes Venezuela (Bolivarian Republic of) e
Hombres 4.0 1.7 2.5 3.2 4.2 12.9 Men Mujeres 4.3 1.0 1.4 1.9 4.6 17.7 Women
a Los datos se refieren a 2011 o al año más cercano.b Treinta y una aglomeraciones urbanas.c Desde 2002 en adelante, las cifras de ingresos no son comparables con las de años anteriores,
debido a la aplicación de nuevos criterios metodológicos elaborados por el Departamento Administrativo Nacional de Estadística (DANE) y el Departamento Nacional de Planeación (DNP) en el marco de la Misión para el empalme de las series de empleo, pobreza y desigualdad (MESEP).
d Las cifras desde 2004 en adelante no son estrictamente comparables con las anteriores, debido a cambios metodológicos efectuados por el INEI.
e A partir de 1998 el diseño muestral de la encuesta no permite el desglose urbano-rural. Por lo tanto, las cifras corresponden al total nacional.
a Data refer to 2011 or to the nearest available year.b Thirty-one urban agglomerations.c From 2002 on, the figures for income are not comparable with those of earlier years, owing to new
methodological criteria applied by the National Administrative Department of Statistics (DANE) and the National Planning Department (DNP) in the framework of the Mission for the splicing of employment, poverty and inequality series (MESEP).
d Figures from 2004 on are not strictly comparable with those of previous years, owing to methodological changes introduced by the National Institute of Statistics and Informatics.
e Since 1998, the survey’s sample design does not allow for the rural-urban breakdown. Thus, the data correspond to the national total.

CE
PA
L, Anuario E
stadístico de Am
érica Latina y el Caribe, 2012
51 1.3 EDUCACIÓN / EDUCATION
1.3.3 TASA NETA DE MATRÍCULA EN EL PRIMER NIVEL DE ENSEÑANZA NET ENROLMENT RATE IN FIRST-LEVEL EDUCATION
(Porcentajes / Percentages)
País 2000 2005 2007 2008 2009 2010 2011 Country
Anguila a ... 88.6 89.4 92.7 ... ... ... Anguilla a
Antigua y Barbuda ... ... 90.2 a 90.1 89.2 86.7 85.6 Antigua and Barbuda Argentina 99.4 99.1 99.1 99.4 ... ... ... Argentina
Aruba 98.6 97.3 98.6 97.5 94.5 99.7 ... Aruba Bahamas 86.9 a 95.3 98.4 98.7 96.9 97.5 ... Bahamas Barbados 94.7 91.0 93.4 95.0 b ... ... ... Barbados Belice 88.5 91.8 93.5 92.6 93.9 94.7 94.9 Belize Bolivia (Estado Plurinacional de) 94.8 ... 94.2 ... 90.7 88.0 ... Bolivia (Plurinational State of) Brasil 91.7 94.4 ... ... ... ... ... Brazil Chile ... ... 95.1 95.5 93.6 94.4 ... Chile Colombia 93.9 a 93.1 90.4 90.2 89.7 88.1 87.1 Colombia Cuba 96.5 94.7 98.2 98.8 99.1 99.2 98.2 Cuba Dominica 94.9 91.1 90.4 a 91.3 94.1 91.8 ... Dominica Ecuador 98.0 97.4 96.9 99.1 a 98.6 ... ... Ecuador El Salvador ... 92.9 93.1 93.1 93.0 93.7 94.3 El Salvador Granada 81.2 a ... 90.2 90.9 87.0 83.3 a ... Grenada Guatemala 85.5 93.6 95.4 95.4 96.9 95.8 ... Guatemala Guyana ... ... ... 84.9 78.5 80.6 82.7 Guyana Honduras 88.8 91.8 93.2 96.1 96.5 95.8 97.3 Honduras Islas Vírgenes Británicas 94.9 a 95.1 a 93.3 b ... 93.5 a 86.8 b ... British Virgin Islands Jamaica 92.5 88.3 a 81.3 82.8 82.5 82.0 ... Jamaica México 97.3 97.8 97.9 98.0 98.0 97.9 ... Mexico Montserrat b ... 96.3 92.3 ... ... ... ... Montserrat b
Nicaragua 79.2 88.0 91.5 92.8 ... 92.5 ... Nicaragua Panamá 97.6 98.5 98.3 98.3 96.6 98.0 96.9 Panama Paraguay 97.4 94.4 90.1 87.5 85.1 83.6 ... Paraguay Perú 97.6 96.9 96.8 95.4 94.5 95.4 94.5 Peru República Dominicana 83.5 82.7 86.8 83.3 89.6 90.2 89.4 Dominican Republic Saint Kitts y Nevis 94.5 94.7 a 86.9 80.1 89.3 83.2 84.5 Saint Kitts and Nevis San Vicente y las Granadinas 97.0 a 96.1 95.4 94.7 94.6 93.9 ... Saint Vincent and the Grenadines Santa Lucía 95.4 a 91.3 92.8 90.8 89.8 88.2 87.3 Saint Lucia Suriname ... 90.0 84.6 88.7 90.9 ... ... Suriname Trinidad y Tabago 89.2 86.4 b 93.5 91.5 93.0 b 93.9 ... Trinidad and Tobago Uruguay ... 97.4 ... 99.0 99.1 99.5 ... Uruguay Venezuela (República Bolivariana de) 87.5 91.3 92.4 ... 92.2 92.5 92.7 Venezuela (Bolivarian Republic of) América Latina y el Caribe c 92.7 94.1 94.2 94.0 93.9 a 93.9 a ... Latin America and the Caribbean c
a Estimaciones del Instituto de Estadística de la UNESCO.b Estimación nacional.c Incluye 41 países. Véanse las notas técnicas.
a Estimates of the UNESCO Institute for Statistics.b National estimate.c Includes 41 countries. See technical notes.

52 E
CLA
C, S
tatistical Yearbook for Latin A
merica and the C
aribbean, 2012 1.3 EDUCACIÓN / EDUCATION
1.3.4 TASA NETA DE MATRÍCULA EN EL SEGUNDO NIVEL DE ENSEÑANZA NET ENROLMENT RATE IN SECOND-LEVEL EDUCATION
(Porcentajes / Percentages)
País 2000 2005 2007 2008 2009 2010 2011 Country
Anguila a 98.7 80.8 75.6 78.0 ... ... ... Anguilla a
Antigua y Barbuda 70.0 a ... ... ... 86.2 84.9 80.5 Antigua and Barbuda Argentina ... ... ... ... 82.2 ... ... Argentina Aruba 77.2 74.8 77.7 70.7 73.1 ... ... Aruba Bahamas 74.7 a 83.2 85.7 85.5 84.9 85.3 ... Bahamas Barbados 92.9 90.5 89.9 86.2 b 82.7 b 84.1 b 88.9 Barbados Belice a 56.1 ... ... ... ... ... ... Belize a
Bolivia (Estado Plurinacional de) ... ... 69.8 68.7 ... ... ... Bolivia (Plurinational State of) Chile ... ... 84.9 84.3 82.6 84.2 ... Chile Colombia ... 63.4 a 70.3 71.2 73.6 74.4 76.0 Colombia Cuba 80.3 84.8 84.7 83.7 82.2 85.5 86.6 Cuba Dominica 83.7 92.5 a 88.0 a 86.9 a 81.6 a 83.9 a 84.6 a Dominica Ecuador 47.3 54.7 58.7 ... ... 73.5 ... Ecuador El Salvador 44.4 a 52.5 a 52.3 53.4 55.1 57.6 60.0 El Salvador Granada ... 84.0 a 87.1 a 90.7 ... ... ... Grenada Guatemala 26.9 a 35.4 a ... 39.8 41.8 46.1 ... Guatemala Islas Turcas y Caicos a ... 70.2 ... ... ... ... ... Turks and Caicos Islands a
Islas Vírgenes Británicas a 79.6 88.2 83.9 ... ... ... ... British Virgin Islands a
Jamaica 77.6 a 83.5 a ... ... ... 83.6 ... Jamaica México 56.8 a 66.7 68.9 69.9 70.5 71.5 ... Mexico Montserrat b ... ... 95.6 ... ... ... ... Montserrat b
Nicaragua 35.0 43.2 ... ... ... 45.8 ... Nicaragua Panamá 61.0 a 63.7 ... 65.7 65.9 68.7 68.1 Panama Paraguay ... 57.5 58.4 59.6 60.0 61.1 ... Paraguay Perú 65.8 69.9 75.5 76.0 78.4 77.6 77.6 Peru República Dominicana 40.2 52.5 60.9 59.4 62.8 62.3 62.1 Dominican Republic Saint Kitts y Nevis 88.3 a 80.3 a 84.5 91.2 90.5 88.3 b 85.8 Saint Kitts and Nevis San Vicente y las Granadinas 67.9 a 76.4 a ... 90.4 88.9 85.2 ... Saint Vincent and the Grenadines Santa Lucía a 61.8 67.3 77.6 80.8 84.4 85.3 ... Saint Lucia a
Trinidad y Tabago a 66.4 ... ... ... ... ... ... Trinidad and Tobago a
Uruguay ... ... 67.8 69.6 ... 72.1 ... Uruguay Venezuela (República Bolivariana de) 50.9 63.0 68.8 69.9 71.6 71.8 72.8 Venezuela (Bolivarian Republic of) América Latina y el Caribe c 67.2 a 71.9 a 72.8 a 72.9 a 73.5 a 73.5 ... Latin America and the Caribbean c
a Estimaciones del Instituto de Estadística de la UNESCO.b Estimación nacional.c Incluye 41 países. Véanse las notas técnicas.
a Estimates of the UNESCO Institute for Statistics.b National estimate.c Includes 41 countries. See technical notes.

CE
PA
L, Anuario E
stadístico de Am
érica Latina y el Caribe, 2012
53 1.3 EDUCACIÓN / EDUCATION
1.3.5 TASA BRUTA DE MATRÍCULA EN EL TERCER NIVEL DE ENSEÑANZA GROSS ENROLMENT RATE IN THIRD-LEVEL EDUCATION
(Porcentajes / Percentages)
País 2000 2005 2007 2008 2009 2010 2011 Country
Anguila a ... 3.3 5.1 5.0 ... ... ... Anguilla a
Antigua y Barbuda ... ... ... ... 14.9 16.4 14.5 b Antigua and Barbuda Argentina 53.1 a 64.0 66.7 68.7 71.2 ... ... Argentina Aruba 29.8 31.5 31.8 31.2 29.8 30.7 ... Aruba Barbados 40.6 ... 57.2 ... 71.6 65.9 61.8 Barbados Belice ... 15.6 17.7 18.7 21.9 21.4 21.4 Belize Bolivia (Estado Plurinacional de) 35.5 ... 38.6 b ... ... ... ... Bolivia (Plurinational State of) Brasil 16.1 25.6 ... ... ... ... ... Brazil Chile 37.3 47.8 52.3 55.0 59.2 66.1 ... Chile Colombia 24.0 30.0 33.1 35.5 37.1 39.1 42.9 Colombia Costa Rica ... 25.6 a ... ... ... ... 43.0 Costa Rica Cuba 22.1 62.0 106.0 118.1 115.0 95.2 80.4 Cuba Ecuador ... ... ... 39.8 ... ... ... Ecuador El Salvador 20.9 21.3 22.0 22.6 23.0 23.4 ... El Salvador Granada ... ... ... ... 52.8 ... ... Grenada Guatemala ... ... 17.8 ... ... ... ... Guatemala Guyana ... 11.0 11.7 11.4 11.0 11.9 12.0 Guyana Honduras 15.0 ... ... 18.8 b ... 20.6 ... Honduras Islas Vírgenes Británicas a 51.7 75.5 ... ... 64.2 ... ... British Virgin Islands Jamaica 15.4 20.2 ... 25.3 25.2 26.0 ... Jamaica México 19.8 24.5 25.8 26.6 27.0 28.0 ... Mexico Panamá 43.9 43.8 44.6 44.7 44.6 45.7 ... Panama Paraguay 15.8 25.5 28.7 34.1 36.6 34.6 ... Paraguay Perú ... 33.7 a ... ... ... 43.0 ... Peru a
Puerto Rico ... ... 71.3 77.5 80.9 86.0 86.2 Puerto Rico Saint Kitts y Nevis ... ... ... 18.2 ... ... ... Saint Kitts and Nevis Santa Lucía ... 13.0 8.3 14.8 16.0 11.3 15.1 Saint Lucia Trinidad y Tabago 5.9 11.5 a ... ... ... ... ... Trinidad and Tobago Uruguay 34.4 45.4 63.8 64.6 63.3 63.2 ... Uruguay Venezuela (República Bolivariana de) 28.3 ... ... 78.4 78.1 ... ... Venezuela (Bolivarian Republic of) América Latina y el Caribe c 22.8 30.9 35.5 38.4 39.5 40.6 ... Latin America and the Caribbean c
a Estimaciones del Instituto de Estadística de la UNESCO.b Estimación nacional.c Incluye 41 países. Véanse las notas técnicas.
a Estimates of the UNESCO Institute for Statistics.b National estimate.c Includes 41 countries. See technical notes.

54 E
CLA
C, S
tatistical Yearbook for Latin A
merica and the C
aribbean, 2012 1.3 EDUCACIÓN / EDUCATION
1.3.6 ASISTENCIA ESCOLAR EN ÁREAS URBANAS, POR QUINTILES DE INGRESO PER CÁPITA DEL HOGAR, SEGÚN SEXO Y GRUPOS DE EDAD, 2011 a
SCHOOL ATTENDANCE IN URBAN AREAS, BY PER CAPITA HOUSEHOLD INCOME QUINTILE, BY SEX AND AGE GROUPS, 2011 a
(Porcentaje de la población de la misma edad / Percentage of the population of the same age)
País SexoQuintil 1/ Quintile 1 Quintil 3/ Quintile 3 Quintil 5/ Quintile 5
Sex Country7-12 13-19 20-24 7-12 13-19 20-24 7-12 13-19 20-24
Argentina b Ambos sexos 99.4 79.4 27.8 99.4 81.9 39.4 98.7 88.2 56.5 Both sexes Argentina b
Hombres 99.4 79.2 24.0 99.2 79.7 31.9 98.3 84.5 53.2 MenMujeres 99.5 79.7 31.0 99.6 84.3 46.4 99.1 92.4 60.8 Women
Bolivia (Estado Plurinacional de) Ambos sexos 99.0 91.9 53.9 98.9 83.0 42.3 98.3 86.8 46.3 Both sexes Bolivia (Plurinational State of) Hombres 99.0 93.1 57.9 100.0 86.3 41.4 99.2 88.9 49.3 MenMujeres 99.1 90.4 50.0 97.5 79.8 43.2 97.2 84.3 43.0 Women
Brasil Ambos sexos 98.5 77.4 15.6 99.3 75.2 19.0 99.6 85.2 44.0 Both sexes Brazil Hombres 98.2 78.3 16.0 99.3 74.7 17.1 99.5 83.7 41.5 MenMujeres 98.7 76.4 15.3 99.3 75.8 21.0 99.6 86.8 46.8 Women
Chile Ambos sexos 99.4 81.9 29.2 99.6 78.3 31.6 98.7 89.7 66.7 Both sexes Chile Hombres 99.4 82.7 29.0 99.4 80.0 31.9 97.8 89.6 67.3 MenMujeres 99.5 81.2 29.4 99.9 76.4 31.2 99.6 89.8 66.1 Women
Colombia c Ambos sexos 96.3 72.6 15.2 97.5 73.4 23.7 97.1 84.5 48.7 Both sexes Colombia c
Hombres 95.7 73.7 16.0 97.2 73.2 22.0 97.6 84.6 49.1 MenMujeres 96.8 71.5 14.6 97.9 73.7 25.4 96.6 84.4 48.2 Women
Costa Rica Ambos sexos 99.4 76.4 29.4 100.0 85.9 46.7 100.0 94.6 69.9 Both sexes Costa Rica Hombres 99.7 72.8 29.9 100.0 83.8 42.8 100.0 95.9 64.7 MenMujeres 99.1 79.4 29.0 100.0 88.2 50.3 100.0 93.5 75.6 Women
Ecuador Ambos sexos 98.4 79.8 33.7 99.8 80.0 34.2 100.0 87.8 57.4 Both sexes Ecuador Hombres 97.7 83.0 38.5 99.8 75.0 30.5 100.0 87.2 50.9 MenMujeres 99.2 76.6 29.8 99.8 85.0 38.1 100.0 88.3 63.7 Women
El Salvador Ambos sexos 94.2 70.0 8.1 98.5 78.4 22.0 99.0 87.4 49.9 Both sexes El Salvador Hombres 94.3 73.4 8.4 98.3 78.2 17.8 98.5 87.9 45.0 MenMujeres 94.2 66.7 7.8 98.8 78.6 25.4 99.6 86.9 54.5 Women
Guatemala Ambos sexos 87.1 55.7 7.6 94.7 61.3 15.8 98.7 84.4 44.5 Both sexes Guatemala Hombres 88.4 66.9 11.3 93.9 61.1 15.3 97.6 85.8 45.8 MenMujeres 85.7 45.6 5.1 95.6 61.5 16.2 99.7 83.3 43.5 Women
Honduras Ambos sexos 95.0 63.5 16.9 96.6 70.3 26.3 90.7 80.1 48.2 Both sexes Honduras Hombres 92.3 60.4 14.8 95.9 66.2 24.3 91.3 85.1 47.4 MenMujeres 97.6 66.9 18.3 97.3 74.5 27.7 90.0 75.2 48.8 Women
México Ambos sexos 96.2 62.8 12.3 99.8 70.6 27.4 99.5 85.2 47.8 Both sexes Mexico Hombres 96.8 62.2 15.1 99.9 68.2 28.8 99.3 87.1 48.3 MenMujeres 95.5 63.5 9.8 99.6 73.3 26.1 99.6 83.1 47.3 Women
Nicaragua Ambos sexos 93.1 69.7 21.8 97.1 64.8 25.7 96.3 81.6 41.5 Both sexes Nicaragua Hombres 92.3 68.0 21.7 98.8 63.9 24.1 97.6 77.9 37.6 MenMujeres 94.1 71.4 21.9 95.0 65.7 27.3 95.1 85.6 44.6 Women
Panamá Ambos sexos 98.9 78.5 24.3 98.8 80.0 32.4 99.6 89.5 49.3 Both sexes Panama Hombres 98.8 77.8 22.2 99.2 79.7 26.3 100.0 85.8 44.6 MenMujeres 99.1 79.2 25.7 98.3 80.2 38.4 99.2 94.1 53.2 Women
Paraguay Ambos sexos 98.5 76.4 24.0 99.5 80.7 42.8 100.0 85.9 62.3 Both sexes Paraguay Hombres 98.0 72.8 13.9 99.2 82.2 36.0 100.0 89.6 64.4 MenMujeres 99.0 80.1 33.3 100.0 79.4 48.1 100.0 82.4 59.7 Women
Perú d Ambos sexos 86.3 64.4 22.4 90.4 62.1 29.1 90.8 70.0 44.6 Both sexes Peru d
Hombres 86.5 64.7 29.7 90.0 64.2 28.0 90.6 67.7 45.1 MenMujeres 86.1 64.2 16.3 90.8 60.0 30.2 90.9 72.6 44.0 Women
República Dominicana Ambos sexos 97.1 83.4 43.3 96.5 79.0 38.1 98.2 79.8 58.2 Both sexes Dominican Republic Hombres 97.5 84.5 37.9 95.4 78.2 30.7 97.1 73.9 49.5 MenMujeres 96.6 82.3 48.0 97.8 80.0 44.2 99.5 86.7 67.5 Women
Uruguay Ambos sexos 98.7 64.9 9.8 99.3 76.3 29.8 99.6 93.0 67.2 Both sexes Uruguay Hombres 98.5 61.5 8.1 99.2 71.2 25.5 99.8 91.7 63.0 MenMujeres 98.9 68.4 11.2 99.5 82.2 34.4 99.3 9.5 72.1 Women
Venezuela (República Bolivariana de) e Ambos sexos 97.1 73.9 31.4 98.4 77.1 39.1 99.2 80.9 47.7 Both sexes Venezuela (Bolivarian Republic of) e
Hombres 97.1 72.3 26.9 98.2 75.9 32.8 99.2 77.9 43.4 MenMujeres 97.1 75.4 34.9 98.7 78.2 45.4 99.2 84.7 53.0 Women
a Los datos se refieren al 2011 o al año más cercano.b Treinta y una aglomeraciones urbanas.c A partir de 2002, las cifras de ingresos no son comparables con las de años anteriores debido a la aplicación de
nuevos criterios metodológicos desarrollados por el Departamento Administrativo Nacional de Estadística (DANE) y el Departamento Nacional de Planeación (DNP) en el marco de la Misión para el empalme de las series de empleo, pobreza y desigualdad (MESEP).
d Las cifras desde 2004 en adelante no son estrictamente comparables con las anteriores, debido a cambios metodológicos efectuados por el INEI.
e A partir de 1998 el diseño muestral de la encuesta no permite el desglose urbano-rural. Por lo tanto, las cifras corresponden al total nacional.
a Data refer to 2011 or to the nearest available year.b Thirty-one urban agglomerations.c From 2002 on, the income figures are not comparable with those of earlier years, owing to the application of
new methodological criteria developed by the National Administrative Department of Statistics (DANE) and the National Planning Department (DNP) in the framework of the Misión para el empalme de las series de empleo, pobreza y desigualdad (MESEP).
d Figures from 2004 on are not strictly comparable with those of previous years, owing to methodological changes introduced by the National Institute of Statistics and Informatics.
e Since 1998, the survey’s sample design does not allow for the rural-urban breakdown. Thus, the data correspond to the national total.

CE
PA
L, Anuario E
stadístico de Am
érica Latina y el Caribe, 2012
55 1.3 EDUCACIÓN / EDUCATION
1.3.7 PROMEDIO DE ALUMNOS POR MAESTRO EN EL PRIMER NIVEL DE ENSEÑANZA AVERAGE NUMBER OF PUPILS PER TEACHER, IN FIRST-LEVEL EDUCATION
(Número de alumnos por maestro / Number of pupils per teacher)
País 2000 2005 2007 2008 2009 2010 2011 Country
Anguila 20 15 16 14 14 14 ... Anguilla Antigua y Barbuda 19 ... 22 17 16 15 15 Antigua and Barbuda Argentina 19 17 16 16 ... ... ... Argentina Aruba 19 18 17 17 17 17 ... Aruba Bahamas 15 a 15 a 15 16 13 14 ... Bahamas Barbados 18 a 15 15 13 b 14 b 13 b 13 b Barbados Belice 23 24 23 23 23 22 22 Belize Bolivia (Estado Plurinacional de) 25 a ... 24 ... ... ... ... Bolivia (Plurinational State of) Brasil 25 21 24 23 23 22 ... Brazil Chile 32 26 25 25 23 23 ... Chile Colombia 26 28 30 29 29 28 28 Colombia Costa Rica 25 21 19 19 18 18 17 Costa Rica Cuba 11 10 10 10 9 9 9 Cuba Dominica 20 18 17 17 16 16 16 Dominica Ecuador 23 23 23 ... 17 b 19 ... Ecuador El Salvador ... 43 40 33 31 ... 30 El Salvador Granada 20 ... 16 23 17 16 ... Grenada Guatemala 33 31 30 29 28 27 ... Guatemala Guyana 26 28 26 26 26 25 25 Guyana Honduras 34 ... ... 33 34 ... ... Honduras Islas Caimán 14 13 11 12 ... ... 12 Cayman Islands Islas Turcas y Caicos a 18 15 ... ... ... ... ... Turks and Caicos Islands a
Islas Vírgenes Británicas 17 15 14 ... 13 13 ... British Virgin Islands Jamaica 34 a 28 a ... ... ... 21 ... Jamaica México 27 28 28 28 28 28 ... Mexico Montserrat 19 20 16 ... 13 ... ... Montserrat Nicaragua 36 34 31 29 ... 30 ... Nicaragua Panamá 25 24 25 24 24 23 23 Panama Perú 29 23 22 21 20 20 20 Peru República Dominicana 31 24 24 b 20 25 26 25 Dominican Republic Saint Kitts y Nevis 19 18 17 16 14 14 13 Saint Kitts and Nevis San Vicente y las Granadinas 19 a 18 a 17 17 17 16 ... Saint Vincent and the Grenadines Santa Lucía 23 22 23 21 20 19 18 Saint Lucia Suriname ... 19 13 16 15 ... ... Suriname Trinidad y Tabago 21 17 b 16 17 b 18 b 18 b ... Trinidad and Tobago Uruguay 21 20 16 15 14 14 ... Uruguay América Latina y el Caribe c 25 23 23 23 22 22 ... Latin America and the Caribbean c
a Estimaciones del Instituto de Estadística de la UNESCO.b Estimación nacional.c Incluye 41 países. Véanse las notas técnicas.
a Estimates of the UNESCO Institute for Statistics.b National estimate.c Includes 41 countries. See technical notes.

56 E
CLA
C, S
tatistical Yearbook for Latin A
merica and the C
aribbean, 2012 1.3 EDUCACIÓN / EDUCATION
1.3.8 PROMEDIO DE ALUMNOS POR MAESTRO EN EL SEGUNDO NIVEL DE ENSEÑANZA AVERAGE NUMBER OF PUPILS PER TEACHER, IN SECOND-LEVEL EDUCATION
(Número de alumnos por maestro / Number of pupils per teacher)
País 2000 2005 2007 2008 2009 2010 2011 Country
Anguila 17 a 12 a 10 ... ... ... ... Anguilla Antigua y Barbuda 13 ... ... ... 13 12 12 Antigua and Barbuda Argentina 11 14 12 11 ... ... ... Argentina Aruba 16 a 14 14 13 13 14 ... Aruba Bahamas ... 14 12 13 12 12 ... Bahamas Barbados a 17 16 ... ... ... ... ... Barbados a
Belice 23 19 a 17 17 17 17 16 Belize Bolivia (Estado Plurinacional de) 22 a ... 18 ... ... ... ... Bolivia (Plurinational State of) Brasil 22 15 19 17 17 17 ... Brazil Chile 29 25 24 23 22 22 ... Chile Colombia 19 26 25 26 27 27 26 Colombia Costa Rica 19 a ... 18 b 16 16 16 15 Costa Rica Cuba 12 11 10 10 10 9 9 Cuba Dominica 21 15 16 14 14 13 12 Dominica Ecuador 14 a 14 b 15 ... ... 11 ... Ecuador El Salvador ... 29 b 27 26 24 ... 26 El Salvador Granada ... 23 b 20 19 16 15 ... Grenada Guatemala 14 16 16 17 16 14 ... Guatemala Guyana ... 18 a 22 21 22 21 21 Guyana Islas Caimán 9 10 a ... 9 ... ... 9 Cayman Islands Islas Turcas y Caicos a 8 9 ... ... ... ... ... Turks and Caicos Islands a
Islas Vírgenes Británicas 10 a 9 9 ... 9 9 ... British Virgin Islands Jamaica 19 a 18 a 20 ... ... 15 ... Jamaica México 17 18 18 18 18 18 ... Mexico Montserrat 11 11 12 ... 13 ... ... Montserrat Nicaragua 32 b 34 31 29 ... 31 ... Nicaragua Panamá 16 16 15 15 15 15 15 Panama Paraguay a 12 ... ... ... ... ... ... Paraguay a
Perú ... 15 16 16 17 16 16 Peru República Dominicana ... 26 29 b 24 27 28 29 Dominican Republic Saint Kitts y Nevis 14 10 a 10 11 10 9 b 9 Saint Kitts and Nevis San Vicente y las Granadinas 24 a 18 a 20 19 13 17 ... Saint Vincent and the Grenadines Santa Lucía 18 17 17 16 16 b 16 b 15 b Saint Lucia Suriname ... 14 14 13 a 13 ... ... Suriname Trinidad y Tabago a 21 ... ... 14 ... ... ... Trinidad and Tobago a
Uruguay 15 15 14 13 12 11 ... Uruguay América Latina y el Caribe c 19 16 18 17 17 16 ... Latin America and the Caribbean c
a Estimaciones del Instituto de Estadística de la UNESCO.b Estimación nacional.c Incluye 41 países. Véanse las notas técnicas.
a Estimates of the UNESCO Institute for Statistics.b National estimate.c Includes 41 countries. See technical notes.

CE
PA
L, Anuario E
stadístico de Am
érica Latina y el Caribe, 2012
57 1.3 EDUCACIÓN / EDUCATION
1.3.9 GASTO PÚBLICO EN EDUCACIÓN PUBLIC EXPENDITURE ON EDUCATION
(Porcentaje del producto interno bruto / Percentage of gross domestic product)
País 2000 2005 2007 2008 2009 2010 2011 Country
Anguila ... ... ... 3.5 ... ... ... Anguilla Antigua y Barbuda ... ... ... ... 2.5 ... ... Antigua and Barbuda Argentina 4.6 a ... 4.9 5.4 6.0 ... ... Argentina Aruba 4.8 ... 4.8 5.0 5.9 ... ... Aruba Bahamas a 2.8 ... ... ... ... ... ... Bahamas a
Barbados 5.6 6.9 6.9 6.7 6.7 7.5 ... Barbados Belice 5.0 ... ... 5.7 6.1 6.6 ... Belize Bolivia (Estado Plurinacional de) 5.5 ... ... ... ... ... ... Bolivia (Plurinational State of) Brasil 4.0 4.5 5.1 5.4 5.6 ... ... Brazil Chile 3.9 3.3 3.2 3.8 4.2 4.2 ... Chile Colombia 3.5 4.0 4.1 3.9 4.7 4.8 4.5 Colombia Costa Rica 4.4 ... 4.7 5.0 6.3 ... ... Costa Rica Cuba 7.7 10.6 11.9 14.1 13.1 12.9 ... Cuba Dominica ... ... 3.3 3.8 3.5 3.5 ... Dominica Ecuador 1.3 ... ... ... ... 4.9 ... Ecuador El Salvador 2.5 2.7 3.1 b 3.7 ... 3.2 3.4 El Salvador Guatemala ... ... 3.0 3.2 ... 2.8 ... Guatemala Guyana ... ... 3.8 ... 3.4 3.7 ... Guyana Islas Vírgenes Británicas ... ... 3.6 ... 4.0 4.3 ... British Virgin Islands Jamaica 5.0 4.6 5.3 5.9 6.0 6.1 ... Jamaica México 4.9 5.0 4.8 4.9 5.3 ... ... Mexico Montserrat ... ... 6.2 6.0 5.8 ... ... Montserrat Nicaragua 3.9 ... ... ... ... 6.0 ... Nicaragua Panamá 5.0 ... ... 3.8 ... ... 3.6 Panama Paraguay 5.3 ... 4.0 ... ... 4.1 ... Paraguay Perú ... 2.7 2.5 2.7 3.0 2.7 2.6 Peru República Dominicana 1.9 a ... 2.2 ... ... ... ... Dominican Republic Saint Kitts y Nevis 5.2 4.1 4.2 ... ... ... ... Saint Kitts and Nevis San Vicente y las Granadinas 7.9 6.3 5.7 ... 5.7 5.1 ... Saint Vincent and the Grenadines Santa Lucía 7.1 a 5.5 ... 5.6 3.9 4.4 b 4.4 Saint Lucia Trinidad y Tabago a 3.8 ... ... ... ... ... ... Trinidad and Tobago a
Uruguay 2.4 2.7 ... ... ... ... ... Uruguay Venezuela (República Bolivariana de) ... ... 3.6 ... ... ... ... Venezuela (Bolivarian Republic of)
a Estimaciones del Instituto de Estadística de la UNESCO.b Estimación nacional.
a Estimates of the UNESCO Institute for Statistics.b National estimate.

58 E
CLA
C, S
tatistical Yearbook for Latin A
merica and the C
aribbean, 2012
a Estimación ajustada por el UNICEF, la OMS y el UNFPA.b Estimaciones calculadas por el UNICEF.c Estimaciones calculadas por la FAO.d Los datos corresponden al año más reciente disponible.e Incluye 33 países.
a Adjusted estimate by UNICEF, WHO and UNFPA.b UNICEF estimates.c FAO estimates.d Data correspond to the most recent available year.e Includes 33 countries.
1.4 SALUD / HEALTH
1.4.1 INDICADORES SELECCIONADOS DE SALUD SELECTED HEALTH INDICATORS
País
Tasa de mortalidad materna a
(por 100 000 nacidos vivos)
Partos atendidos por
personal calificado (%)
Tasa de mortalidad en menores de 5
años b
(por 1000 nacidos vivos)
Malnutrición infantil b
(% de menores de 5 años)Under weight for age
(% of children under 5)
Niños de 1 año vacunados contra el
sarampión (%)
Población por debajo del nivel
mínimo de consumo de energía
alimentaria (%) c
Disponibilidad de
energía alimentaria
(Kcal/día por persona) c
CountryMaternal
mortality rate a
(per 100 000 live births)
Births attended by
trained personnel (%)
Under 5 mortality rate b
(per 1000 live
births)
Bajo peso para la edad Child
malnutrition b
Baja talla para la edadChild
malnutrition b
One-year-old children immunized
against measles
(%)
Population below minimum level of dietary
energy consumption
(%) c
Dietary energysupply
(Kcal/day per person) c
2010 2010 d 2011 2010 d 2010 2010-2012 2010-2012Antigua y Barbuda … 100 8 … … 98 21 2 413 Antigua and BarbudaAntiguas Antillas Neerlandesas … … … … … … <5 2 446 Former Netherlands Antilles Argentina 77 98 14 2 8 99 <5 2 420 ArgentinaBahamas 47 99 16 … … 94 7 2 471 BahamasBarbados 51 100 20 … … 85 <5 2 517 BarbadosBelice 53 95 17 5 22 98 7 2 237 BelizeBolivia (Estado Plurinacional de) 190 71 51 5 27 79 24 2 207 Bolivia (Plurinational State of)Brasil 56 97 16 2 7 99 7 2 427 BrazilChile 25 100 9 0.5 2 93 <5 2 429 ChileColombia 92 98 18 3 13 88 13 2 333 ColombiaCosta Rica 40 99 10 1 6 83 7 2 432 Costa RicaCuba 73 100 6 … … 99 <5 2 457 CubaDominica … 100 12 … … 99 <5 2 414 DominicaEcuador 110 98 23 6 .. 98 18 2 232 EcuadorEl Salvador 81 96 15 7 21 92 12 2 254 El SalvadorGranada … 99 13 … … 95 18 2 419 GrenadaGuatemala 120 51 30 13 48 93 30 2 088 GuatemalaGuyana 280 92 36 11 20 95 5 2 375 GuyanaHaití 350 26 70 19 30 59 45 2 294 HaitiHonduras 100 67 21 9 30 99 10 2 188 HondurasIslas Vírgenes Británicas … 100 … … … … … … British Virgin IslandsIslas Turcas y Caicos … 100 23 … … … … … Turks and Caicos IslandsJamaica 110 98 18 2 6 88 9 2 404 JamaicaMéxico 50 94 16 3 16 95 <5 2 362 MexicoNicaragua 95 74 26 6 23 99 20 2 239 NicaraguaPanamá 92 86 20 4 19 95 10 2 288 PanamaParaguay 99 82 22 3 18 94 26 2 325 ParaguayPerú 67 84 18 5 28 94 11 2 238 PeruPuerto Rico 20 … … … … … … … Puerto RicoRepública Dominicana 150 98 25 3 10 79 15 2 342 Dominican RepublicSaint Kitts y Nevis … 100 7 … … 99 14 2 413 Saint Kitts and NevisSan Vicente y las Granadinas … 99 21 … … 99 <5 2 441 Saint Vincent and the GrenadinesSanta Lucía … 100 16 … … 95 15 2 430 Saint LuciaSuriname 130 90 30 8 11 89 11 2 380 SurinameTrinidad y Tabago 46 98 28 … … 92 9 2 434 Trinidad and TobagoUruguay 29 100 11 .. … 95 <5 2 403 UruguayVenezuela (República Bolivariana de) 92 95 15 4 16 79 <5 2 334 Venezuela (Bolivarian Republic of)América Latina y el Caribe e 81 86 19 6 … 93 8 2 363 Latin America and the Caribbean e
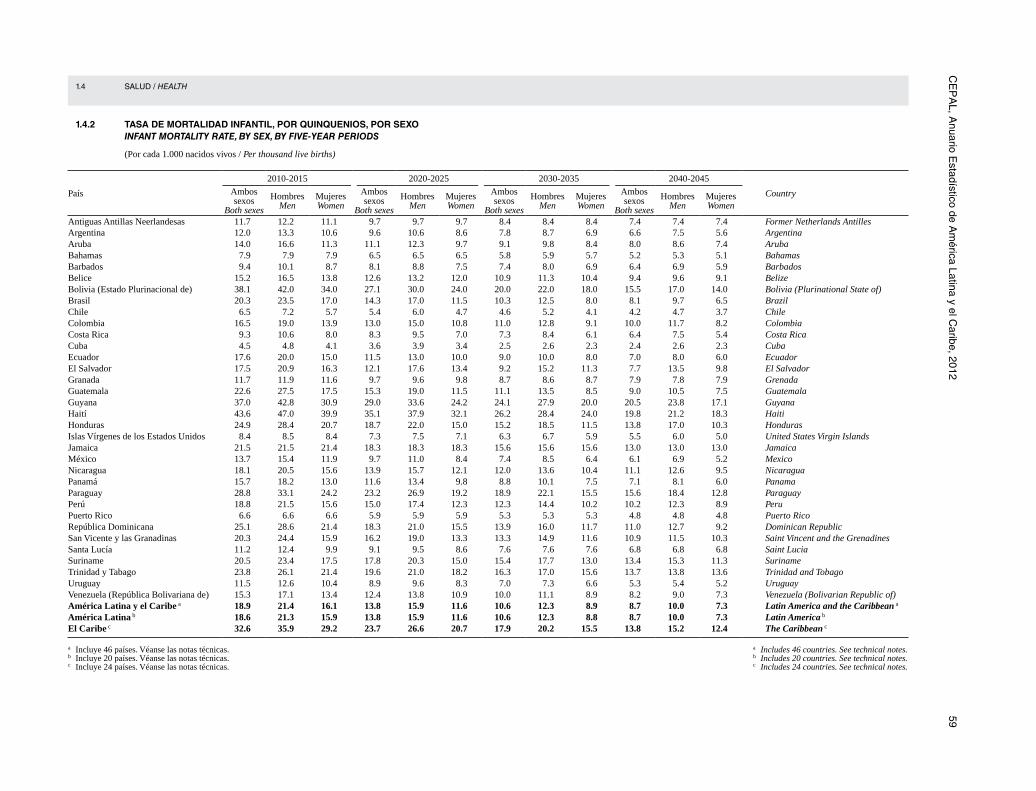
CE
PA
L, Anuario E
stadístico de Am
érica Latina y el Caribe, 2012
59 1.4 SALUD / HEALTH
1.4.2 TASA DE MORTALIDAD INFANTIL, POR QUINQUENIOS, POR SEXO INFANT MORTALITY RATE, BY SEX, BY FIVE-YEAR PERIODS
(Por cada 1.000 nacidos vivos / Per thousand live births)
País
2010-2015 2020-2025 2030-2035 2040-2045
Country Ambos sexos
Both sexes
HombresMen
MujeresWomen
Ambos sexos
Both sexes
HombresMen
MujeresWomen
Ambos sexos
Both sexes
HombresMen
MujeresWomen
Ambos sexos
Both sexes
HombresMen
MujeresWomen
Antiguas Antillas Neerlandesas 11.7 12.2 11.1 9.7 9.7 9.7 8.4 8.4 8.4 7.4 7.4 7.4 Former Netherlands Antilles Argentina 12.0 13.3 10.6 9.6 10.6 8.6 7.8 8.7 6.9 6.6 7.5 5.6 Argentina Aruba 14.0 16.6 11.3 11.1 12.3 9.7 9.1 9.8 8.4 8.0 8.6 7.4 Aruba Bahamas 7.9 7.9 7.9 6.5 6.5 6.5 5.8 5.9 5.7 5.2 5.3 5.1 Bahamas Barbados 9.4 10.1 8.7 8.1 8.8 7.5 7.4 8.0 6.9 6.4 6.9 5.9 Barbados Belice 15.2 16.5 13.8 12.6 13.2 12.0 10.9 11.3 10.4 9.4 9.6 9.1 Belize Bolivia (Estado Plurinacional de) 38.1 42.0 34.0 27.1 30.0 24.0 20.0 22.0 18.0 15.5 17.0 14.0 Bolivia (Plurinational State of) Brasil 20.3 23.5 17.0 14.3 17.0 11.5 10.3 12.5 8.0 8.1 9.7 6.5 Brazil Chile 6.5 7.2 5.7 5.4 6.0 4.7 4.6 5.2 4.1 4.2 4.7 3.7 Chile Colombia 16.5 19.0 13.9 13.0 15.0 10.8 11.0 12.8 9.1 10.0 11.7 8.2 Colombia Costa Rica 9.3 10.6 8.0 8.3 9.5 7.0 7.3 8.4 6.1 6.4 7.5 5.4 Costa Rica Cuba 4.5 4.8 4.1 3.6 3.9 3.4 2.5 2.6 2.3 2.4 2.6 2.3 Cuba Ecuador 17.6 20.0 15.0 11.5 13.0 10.0 9.0 10.0 8.0 7.0 8.0 6.0 Ecuador El Salvador 17.5 20.9 16.3 12.1 17.6 13.4 9.2 15.2 11.3 7.7 13.5 9.8 El Salvador Granada 11.7 11.9 11.6 9.7 9.6 9.8 8.7 8.6 8.7 7.9 7.8 7.9 Grenada Guatemala 22.6 27.5 17.5 15.3 19.0 11.5 11.1 13.5 8.5 9.0 10.5 7.5 Guatemala Guyana 37.0 42.8 30.9 29.0 33.6 24.2 24.1 27.9 20.0 20.5 23.8 17.1 Guyana Haití 43.6 47.0 39.9 35.1 37.9 32.1 26.2 28.4 24.0 19.8 21.2 18.3 Haiti Honduras 24.9 28.4 20.7 18.7 22.0 15.0 15.2 18.5 11.5 13.8 17.0 10.3 Honduras Islas Vírgenes de los Estados Unidos 8.4 8.5 8.4 7.3 7.5 7.1 6.3 6.7 5.9 5.5 6.0 5.0 United States Virgin Islands Jamaica 21.5 21.5 21.4 18.3 18.3 18.3 15.6 15.6 15.6 13.0 13.0 13.0 Jamaica México 13.7 15.4 11.9 9.7 11.0 8.4 7.4 8.5 6.4 6.1 6.9 5.2 Mexico Nicaragua 18.1 20.5 15.6 13.9 15.7 12.1 12.0 13.6 10.4 11.1 12.6 9.5 Nicaragua Panamá 15.7 18.2 13.0 11.6 13.4 9.8 8.8 10.1 7.5 7.1 8.1 6.0 Panama Paraguay 28.8 33.1 24.2 23.2 26.9 19.2 18.9 22.1 15.5 15.6 18.4 12.8 Paraguay Perú 18.8 21.5 15.6 15.0 17.4 12.3 12.3 14.4 10.2 10.2 12.3 8.9 Peru Puerto Rico 6.6 6.6 6.6 5.9 5.9 5.9 5.3 5.3 5.3 4.8 4.8 4.8 Puerto Rico República Dominicana 25.1 28.6 21.4 18.3 21.0 15.5 13.9 16.0 11.7 11.0 12.7 9.2 Dominican Republic San Vicente y las Granadinas 20.3 24.4 15.9 16.2 19.0 13.3 13.3 14.9 11.6 10.9 11.5 10.3 Saint Vincent and the Grenadines Santa Lucía 11.2 12.4 9.9 9.1 9.5 8.6 7.6 7.6 7.6 6.8 6.8 6.8 Saint Lucia Suriname 20.5 23.4 17.5 17.8 20.3 15.0 15.4 17.7 13.0 13.4 15.3 11.3 Suriname Trinidad y Tabago 23.8 26.1 21.4 19.6 21.0 18.2 16.3 17.0 15.6 13.7 13.8 13.6 Trinidad and Tobago Uruguay 11.5 12.6 10.4 8.9 9.6 8.3 7.0 7.3 6.6 5.3 5.4 5.2 Uruguay Venezuela (República Bolivariana de) 15.3 17.1 13.4 12.4 13.8 10.9 10.0 11.1 8.9 8.2 9.0 7.3 Venezuela (Bolivarian Republic of) América Latina y el Caribe a 18.9 21.4 16.1 13.8 15.9 11.6 10.6 12.3 8.9 8.7 10.0 7.3 Latin America and the Caribbean a
América Latina b 18.6 21.3 15.9 13.8 15.9 11.6 10.6 12.3 8.8 8.7 10.0 7.3 Latin America b
El Caribe c 32.6 35.9 29.2 23.7 26.6 20.7 17.9 20.2 15.5 13.8 15.2 12.4 The Caribbean c
a Incluye 46 países. Véanse las notas técnicas.b Incluye 20 países. Véanse las notas técnicas.c Incluye 24 países. Véanse las notas técnicas.
a Includes 46 countries. See technical notes.b Includes 20 countries. See technical notes.c Includes 24 countries. See technical notes.

60 E
CLA
C, S
tatistical Yearbook for Latin A
merica and the C
aribbean, 2012 1.4 SALUD / HEALTH
1.4.3 PROMEDIO DE HABITANTES POR MÉDICO AVERAGE NUMBER OF INHABITANTS PER PHYSICIAN
(Número de habitantes / Number of inhabitants)
País 2000 2005 2007 2008 2009 2010 2011 Country Argentina a ... 319 325 b ... ... ... ... Argentina a
Aruba 772 701 664 660 642 ... ... Aruba Bahamas ... ... 363 352 ... ... ... Bahamas Barbados 90 106 114 113 103 ... ... Barbados
Belice 998 1 128 1 145 1 155 ... ... ... Belize Bolivia (Estado Plurinacional de) ... 5 173 c 2 348 1 968 ... ... ... Bolivia (Plurinational State of) Brasil ... 853 771 721 695 672 700 Brazil
Chile 848 d 780 d 765 d 757 d 747 d 729 d 701 Chile Colombia 785 716 676 805 829 ... ... Colombia Costa Rica 613 558 520 475 457 441 432 Costa Rica Cuba 169 160 156 152 151 148 144 Cuba Dominica ... 1 466 1 801 1 217 ... ... ... Dominica
Ecuador e 785 910 f 632 636 605 ... ... Ecuador e
El Salvador ... 1 228 1 217 1 261 1 181 1 112 ... El Salvador Granada 1 238 1 253 899 g 864 g 833 g 804 h g ... Grenada Guatemala 6 571 i 4 062 j 5 129 j 5 220 j 4 871 j ... ... Guatemala Guyana 2 600 2 006 1 928 1 485 1 482 ... ... Guyana Honduras k 1 076 1 016 ... ... ... ... ... Honduras k
Islas Caimán 479 688 372 354 390 335 300 Cayman Islands Islas Turcas y Caicos l ... 1 607 ... ... ... ... ... Turks and Caicos Islands l
México m 583 538 n 495 n 486 n 477 n 471 477 Mexico m
Montserrat 1 233 1 400 1 461 1 469 1 179 1 187 1 198 Montserrat Nicaragua 2 526 2 567 2 327 1 500 ... ... ... Nicaragua Panamá 768 719 735 693 730 678 636 Panama Paraguay 1 089 o 1 609 p 1 529 q 1 408 p 1 241 p 1 241 p 888 Paraguay Perú ... ... 678 ... ... 598 585 h Peru Puerto Rico ... 383 430 r ... ... 398 ... Puerto Rico República Dominicana ... 875 ... 824 730 715 ... Dominican Republic Saint Kitts y Nevis 1 002 911 841 1 002 1 101 ... ... Saint Kitts and Nevis San Vicente y las Granadinas 1 740 1 265 1 185 1 456 1 438 1 402 ... Saint Vincent and the Grenadines Santa Lucía 1 708 ... ... ... ... ... ... Saint Lucia Suriname 1 450 4 458 s ... 1 820 t 1 036 940 ... Suriname Trinidad y Tabago u 1 013 875 912 767 ... ... ... Trinidad and Tobago u
Uruguay 269 248 240 235 230 224 ... Uruguay Venezuela (República Bolivariana de) v 684 ... ... ... ... ... ... Venezuela (Bolivarian Republic of) v
a Estimación realizada por el Observatorio de Recursos Humanos en Salud (OPS/OMS). Se interpreta como la cantidad de personas de 20 años y más con educación universitaria completa.
b Se reitera el dato de 2005, ya que no se dispone de información actualizada.c Tres servicios departamentales de salud no presentaron su reporte al Sistema Nacional de Información en Salud
(SNIS).d Médicos inscritos en el Colegio Médico y que trabajan en el país.e Incluye a médicos a tiempo parcial o de llamada.f No incluye a médicos residentes ni rurales, por cuanto no son de especialidades.g El Ministerio de Salud comenzó a registrar a los médicos que trabajan en el sector público y privado.h Preliminar.i Solo información del Instituto Guatemalteco de Seguridad Social.j Corresponde a información del Instituto Guatemalteco de Seguridad Social y el Ministerio de Salud Pública y
Asistencia Social.k Colegiados.l Solo sector público.m Se refiere al número de personal médico del sector público y de las unidades médicas privadas con servicios de
hospitalización. Dentro de este dato se incluye a los médicos generales y especialistas, los pasantes de medicina e internos de pregrado, así como a los residentes y odontólogos.
n La cifra de médicos no incluye datos de la Secretaría de la Defensa Nacional (SEDENA), ya que dicha institución no proporcionó información.
o Proyección del Censo Nacional de Recursos Humanos para la Salud 1985.p Los datos corresponden exclusivamente al sector público (Ministerio de Salud y Bienestar Social).q Datos disponibles a junio de 2007.r Médicos y especialistas que están certificados para ejercer como médicos; cada tres años fiscales.s Incluye solo médicos especialistas.t Sector privado.u Dato provisorio.v Corresponde a personal asistencial y contratado.
a Estimate by the Observatory of Human Resources for Health (PAHO-WHO). Corresponds to the number of people aged 20 years and over who have completed universitary-level education.
b The data for 2005 are repeated because no updated information was available.c Three departamental health services did not submit their reports to SNIS.d Physicians belonging to the Medical Association and working in the country.e Includes part-time physicians and physicians on call.f Does not include resident or rural physicians.g The Ministry of Health started recording physicians in the public sector as well as all those working in the private sector.h Preliminary estimate.i Information from the Guatemalan Social Securty Institute only.j Corresponds to information from the Guatemalan Social Security Institute, Ministry of Public Health and Social
Welfare.k Professional health personnel.l Public sector only.m Refers to the number of medical personnel in the public sector and private medical facilities offering hospitalization
services. This figure includes general physicians and specialists, medical interns and undergraduate interns, as well as residents and dentists.
n The figure for physicians does not include data from Secretariat of Defence (SEDENA), which did not provide any information.
o Projection from the National Census of Human Resources for Health 1985.p The data correspond to the public sector only (Ministry of Public Health and Social Welfare).q Data available to June 2007.r Physicians and specialists who are certified medical practitioners; every three fiscal years.s Includes medical specialists only.t Private sector.u Provisional data.v Social welfare personnel and contractual staff.

CE
PA
L, Anuario E
stadístico de Am
érica Latina y el Caribe, 2012
61 1.4 SALUD / HEALTH
1.4.4 CAMAS DE HOSPITAL POR CADA 1.000 HABITANTES HOSPITAL BEDS PER 1,000 INHABITANTS
(Número de camas / Number of beds)
País 2000 2005 2007 2008 2009 2010 2011 Country Argentina a 2.1 ... ... ... ... 2.1 ... Argentina aAruba 3.4 3.0 3.0 2.7 ... ... ... Aruba Bahamas ... ... 3.0 3.0 ... ... ... Bahamas Barbados ... 2.3 ... ... ... ... ... Barbados Belice ... 1.3 1.2 1.2 ... ... ... Belize Bolivia (Estado Plurinacional de) b 1.0 1.1 1.1 1.1 1.1 1.1 ... Bolivia (Plurinational State of) b
Chile 2.0 c 1.7 c 1.6 c 1.6 c 1.6 c 1.4 1.5 ChileColombia ... 0.7 1.0 1.1 1.2 ... ... Colombia Costa Rica 1.5 1.3 1.3 1.2 1.2 1.2 1.2 Costa Rica Cuba 6.6 6.2 6.1 6.0 5.9 5.9 5.1 Cuba Dominica 3.3 3.9 3.3 4.2 ... ... ... Dominica Ecuador d 1.6 1.6 1.5 1.5 1.6 ... ... Ecuador dEl Salvador ... 0.8 0.8 0.8 0.8 0.8 ... El Salvador
Granada 4.3 3.5 3.5 3.7 3.7 3.6 e ... Grenada Guatemala 0.2 f 4.2 g 0.6 g 0.6 g 0.6 g ... ... Guatemala Guyana 4.3 2.5 2.5 2.5 ... ... ... Guyana Honduras h 0.7 0.7 0.7 ... ... ... ... Honduras hIslas Caimán 3.0 i 2.3 i 1.8 i 1.8 i 1.8 i 1.8 1.8 Cayman IslandsIslas Turcas y Caicos 2.3 1.4 ... ... ... ... ... Turks and Caicos Islands
Jamaica j 1.4 ... ... ... ... ... ... Jamaica jMéxico k 1.8 1.7 l 1.6 l 1.6 l 1.6 l 1.6 1.6 Mexico k
Nicaragua 0.9 0.8 0.9 0.9 ... ... ... Nicaragua Panamá m 2.4 2.1 2.2 2.3 2.4 2.2 2.2 Panama mParaguay 1.1 n 1.1 n 1.1 n 1.1 n 1.1 n 1.1 n 1.2 ParaguayPerú ... 1.5 1.6 1.6 1.5 1.5 1.5 Peru
Puerto Rico ... 2.4 o 2.2 o 2.3 o 2.3 o 2.3 2.4 Puerto RicoRepública Dominicana 1.1 1.0 1.0 1.0 1.0 1.0 ... Dominican Republic
Saint Kitts y Nevis 5.3 3.7 4.4 4.3 4.3 4.6 ... Saint Kitts and Nevis San Vicente y las Granadinas 1.9 1.7 1.7 1.7 1.8 1.8 ... Saint Vincent and the Grenadines Santa Lucía 1.8 ... ... ... ... ... ... Saint Lucia Suriname 3.6 p 3.2 p 3.2 p 3.2 p 3.2 p 3.2 ... SurinameTrinidad y Tabago 3.3 2.7 2.5 2.6 ... ... ... Trinidad and Tobago Uruguay 1.9 1.8 1.9 1.9 ... 1.8 ... Uruguay Venezuela (República Bolivariana de) q ... 0.8 0.8 1.1 ... ... ... Venezuela (Bolivarian Republic of) q
a Se refiere solo a los establecimientos del subsector oficial y corresponde al indicador “promedio de camas disponibles” que se define como la cantidad de camas realmente instaladas en un establecimiento, en condiciones de uso para la atención de pacientes internados, independientemente de que estén o no ocupadas.
b El número de camas se tomó de todos los establecimientos (puestos, centros de salud, hospitales básicos, hospitales generales e institutos especializados).
c Camas en establecimientos del Sistema Nacional de Servicios de Salud (SNSS), otras instituciones públicas y de establecimientos privados.
d Número de camas hospitalarias disponibles realmente instaladas en el hospital en condiciones de uso para la atención de pacientes hospitalizados, independientemente de que estén o no ocupadas.
e Preliminar.f Solo información del Instituto Guatemalteco de Seguridad Social.g Corresponde a información del Instituto Guatemalteco de Seguridad Social y del Ministerio de Salud Pública y Asistencia
Social.h Corresponde a la Secretaría de Salud y el Instituto Hondureño de Seguridad Social.i Corresponde solo a camas de hospitales públicos.j Dotación promedio de camas.k Se refiere al número de camas del sector público y de las unidades médicas privadas con servicios de hospitalización; es
decir que el dato refleja el total de camas existentes, sea que se ubiquen en el área de urgencia, de hospitalización u otra área dentro de la unidad médica. Asimismo, no se trata de camas disponibles solo en hospitales, ya que la información se entrega de manera agregada.
l La cifra de camas no incluye datos de la Secretaría de la Defensa Nacional (SEDENA), ya que dicha institución no proporcionó información.
m Incluye camas para recién nacidos.n Corresponde al Ministerio de Salud Pública y Bienestar Social, Instituto de Previsión Social (Seguridad Social), Hospital de
Clínicas, Hospital Central de las Fuerzas Armadas y Policlínico Policial Rigoberto Caballero. No incluye datos del sector privado.o Número de camas en uso en los hospitales por año fiscal (julio a junio).p Se refiere solo a los cinco hospitales de Paramaribo.q Solo camas funcionales.
a Refers to the establishments in the official subsector and corresponds to the indicator “average beds available”, which is defined as the number of beds physically present in the hospital and suitable for the care of hospitalized patients, regardless of whether they are occupied.
b The number of beds refers to all institutions (health posts, health centres, basic hospitals, general hospitals and specialized institutions).
c Beds in the National Health System (SNSS) facilities, other public institutions and private establishments.d Number of available hospital beds physically present in the hospital and suitable for the care of hospitalized
patients, regardless of whether they are occupied.e Preliminary figure.f Information from the Guatemalan Social Securty Institute only.g Corresponds to information from the Guatemalan Social Security Institute, Ministry of Public Health and
Social Welfare.h Corresponds to the Department of Health and the Honduran Social Security Institute only.i Corresponds to beds in public hospitals only.j Average number of beds.k Refers to the number of beds in the public sector and private medical facilities offering hospitalization
services; in other words, the figure reflects the total number of beds in existence, be they in emergency rooms, regular wards or other areas within a medical unit. The information is provided in the aggregate form, and therefore does not refer only to hospital beds.
l The figure for hospital beds does not include figures from the Secretariat of Defence (SEDENA), which did not provide any information.
m Includes beds for newborn infants.n Corresponds to the Ministry of Public Health and Social Welfare, Social Security Institute, Hospital de
Clínicas, Armed Forces, Central Hospital and Police Force Poly “Rigoberto Caballero”. Does not include data from the private sector.
o Number of beds in use in hospitals per fiscal year (July to June).p Refers only to the five hospitals in Paramaribo.q Only beds in working order.

62 E
CLA
C, S
tatistical Yearbook for Latin A
merica and the C
aribbean, 2012 1.4 SALUD / HEALTH
1.4.5 GASTO TOTAL EN SALUD TOTAL EXPENDITURE ON HEALTH
(Porcentaje del producto interno bruto / Percentage of gross domestic product)
País 2000 2005 2006 2007 2008 2009 2010 Country
Antigua y Barbuda 4.8 4.7 4.5 4.5 4.3 4.8 6.0 Antigua and Barbuda Argentina 9.2 8.5 8.5 8.4 8.4 9.5 8.1 Argentina Bahamas 5.9 7.0 8.0 8.1 8.4 8.3 7.9 Bahamas Barbados 6.3 7.0 7.1 7.0 7.1 5.9 8.0 Barbados Belice 4.0 4.4 4.4 4.8 4.8 5.5 5.2 Belize Bolivia (Estado Plurinacional de) 6.1 5.6 4.8 4.7 4.9 5.1 4.8 Bolivia (Plurinational State of) Brasil 7.2 8.2 8.5 8.5 8.3 8.8 9.0 Brazil Chile 8.3 6.9 6.6 6.9 7.5 8.4 8.0 Chile Colombia 7.3 7.5 7.3 7.2 6.9 7.6 7.6 Colombia Costa Rica 6.5 7.7 7.8 8.4 9.4 10.5 10.9 Costa Rica Cuba 6.1 8.0 7.6 10.4 10.8 12.1 10.6 Cuba Dominica 5.9 6.0 6.1 6.1 6.0 6.2 7.4 Dominica Ecuador 4.2 6.6 6.7 7.0 7.0 8.8 8.1 Ecuador El Salvador 8.0 7.1 6.6 6.3 6.2 6.8 6.9 El Salvador Granada 6.6 6.1 6.4 6.1 5.9 6.2 5.9 Grenada Guatemala 5.5 6.2 7.4 7.2 7.0 6.9 6.9 Guatemala Guyana 5.6 9.2 6.0 5.3 6.0 6.2 5.4 Guyana Haití 6.1 4.4 5.7 5.6 5.4 6.1 6.9 Haiti Honduras 5.4 5.8 5.7 5.9 6.1 7.0 6.8 Honduras Jamaica 5.5 4.1 4.2 4.9 5.2 4.9 4.8 Jamaica México 5.1 5.9 5.7 5.8 5.9 6.5 6.3 Mexico Nicaragua 7.0 7.9 8.2 9.1 9.3 9.6 9.1 Nicaragua Panamá 7.8 7.5 7.0 6.7 7.3 8.1 8.1 Panama Paraguay 9.4 6.5 6.6 6.1 6.0 6.6 5.9 Paraguay Perú 4.7 4.5 4.5 5.1 5.8 5.3 5.1 Peru República Dominicana 6.4 5.5 5.6 5.4 5.7 5.9 6.2 Dominican Republic Saint Kitts y Nevis 5.5 4.4 5.3 5.4 5.0 5.2 6.7 Saint Kitts and Nevis San Vicente y las Granadinas 3.7 3.7 3.9 3.9 4.6 4.6 4.5 Saint Vincent and the Grenadines Santa Lucía 5.1 6.0 7.3 7.2 8.1 8.4 8.7 Saint Lucia Suriname 8.0 6.8 7.7 7.3 6.8 7.5 7.0 Suriname Trinidad y Tabago 3.9 5.7 5.0 4.8 4.5 5.8 5.7 Trinidad and Tobago Uruguay 8.5 8.3 8.3 7.9 7.7 8.4 8.4 Uruguay Venezuela (República Bolivariana de) 5.7 5.4 5.7 5.8 5.4 6.0 4.9 Venezuela (Bolivarian Republic of)

CE
PA
L, Anuario E
stadístico de Am
érica Latina y el Caribe, 2012
631.5 VIVIENDA Y SERVICIOS BÁSICOS / HOUSING AND BASIC SERVICES
1.5.1 DISPONIBILIDAD DE SERVICIOS EN LAS VIVIENDAS, EN ÁREAS URBANAS Y RURALES a
SERVICES AVAILABLE IN DWELLINGS, URBAN AND RURAL AREAS a
(Porcentaje respecto del total de hogares urbanos / As a percentage of the total urban households)
País Área geográficaAgua por tubería / Piped water Alumbrado eléctrico / Electricity
Sistema de eliminación de excretas Sewerage system
Geographical area Country
2000 2010 2000 2010 2000 2010
Argentina Urbana 98.7 b 99.6 c 99.5 b ... 61.3 b 66.9 c Urban Argentina Bolivia (Estado Plurinacional de) Nacional 71.2 67.6 70.9 86.8 33.8 56.0 National Bolivia (Plurinational State of)
Urbana 90.6 86.2 97.8 98.9 51.4 66.8 Urban Rural 38.8 31.6 25.7 63.5 4.3 18.6 Rural
Brasil Nacional 83.1 89.4 96.0 99.3 51.0 60.1 National Brazil Urbana 88.5 92.5 99.2 99.9 54.4 63.6 Urban Rural 52.3 70.1 77.6 95.8 22.4 34.7 Rural
Chile Nacional 93.4 96.8 95.8 98.9 83.2 93.7 National Chile Urbana 98.8 99.4 98.8 99.6 91.1 97.9 Urban Rural 58.6 79.2 75.9 94.1 31.8 65.8 Rural
Colombia d Nacional 89.2 89.3 94.4 96.8 82.4 85.5 National Colombia d
Urbana 97.9 95.0 99.3 99.8 93.7 91.3 Urban Rural 73.8 70.1 85.8 86.7 62.5 65.8 Rural
Costa Rica Nacional 98.2 99.0 98.1 99.1 62.5 58.3 National Costa Rica Urbana 99.6 99.8 99.5 100.0 46.0 38.0 Urban Rural 96.0 97.8 95.9 97.7 87.3 92.8 Rural
Ecuador Nacional ... 79.4 ... 95.5 ... 75.7 National Ecuador Urbana 91.4 92.4 98.0 98.4 67.5 86.4 Urban Rural ... 54.0 ... 89.9 ... 54.6 Rural
El Salvador Nacional 72.1 63.2 82.1 80.8 44.7 44.9 National El Salvador Urbana 75.9 70.4 93.4 88.9 66.8 59.5 Urban Rural 65.7 49.2 63.1 65.4 7.4 14.0 Rural
Guatemala Nacional 72.7 84.6 75.8 81.8 50.2 43.9 National Guatemala Urbana 93.8 90.0 96.5 93.7 87.4 68.4 Urban Rural 58.7 78.3 62.2 68.0 25.7 15.4 Rural
Honduras Nacional 87.6 86.8 69.0 79.2 43.4 45.3 National Honduras Urbana 93.7 94.8 96.4 98.7 59.3 66.1 Urban Rural 81.9 79.2 43.6 60.5 28.5 25.3 Rural
México Nacional 91.0 92.3 96.0 98.5 78.7 86.2 National Mexico Urbana 96.4 96.8 98.1 99.4 94.0 91.4 Urban Rural 81.4 84.0 92.2 96.8 52.0 76.4 Rural
Nicaragua Nacional 64.2 65.9 72.2 77.7 17.3 23.3 National Nicaragua Urbana 83.6 89.8 91.8 97.9 27.0 36.3 Urban Rural 33.4 29.4 41.0 46.6 2.0 3.3 Rural
Paraguay Nacional 52.7 70.9 91.0 98.2 13.8 18.0 National Paraguay Urbana 61.4 68.0 97.9 99.6 17.7 16.6 Urban Rural 41.3 75.1 82.0 96.3 8.6 20.1 Rural
Perú e Nacional 65.8 76.0 69.9 89.7 52.2 74.3 National Peru e
Urbana 78.3 88.8 92.1 98.4 71.5 84.6 Urban Rural 42.5 38.4 28.2 64.2 15.9 44.0 Rural
República Dominicana Nacional 72.6 72.3 ... 96.1 31.1 35.3 National Dominican Republic Urbana 85.8 82.0 ... 99.0 36.2 33.6 Urban Rural 47.8 52.1 ... 89.9 21.5 38.7 Rural
Uruguay Nacional ... 95.8 ... 98.6 ... 67.4 National Uruguay Urbana 97.8 96.9 99.5 99.5 62.1 65.3 Urban Rural ... 82.5 ... 87.4 ... 92.2 Rural
Venezuela (República Bolivariana de) f Nacional 94.1 94.9 98.8 99.6 88.6 93.3 National Venezuela (Bolivarian Republic of) f
a Los datos se refieren al año más cercano al que encabeza la columna.b Veintiocho aglomeraciones urbanas.c Treinta y una aglomeraciones urbanas.d A partir de 2002, las cifras de ingresos no son comparables con las de años anteriores debido a la aplicación
de nuevos criterios metodológicos desarrollados por el Departamento Administrativo Nacional de Estadística (DANE) y el Departamento Nacional de Planeación (DNP) en el marco de la Misión para el empalme de las series de empleo, pobreza y desigualdad (MESEP).
e Las cifras desde 2004 en adelante no son estrictamente comparables con las anteriores, debido a cambios metodológicos efectuados por el INEI.
f A partir de 1998 el diseño muestral de la encuesta no permite el desglose urbano-rural. Por lo tanto, las cifras corresponden al total nacional.
a Data refer to the year nearest to the one heading the column.b Twenty-eight urban agglomerations.c Thirty-one urban agglomerations.d From 2002 on, the income figures are not comparable with those of earlier years, owing to the application of
new methodological criteria developed by the National Administrative Department of Statistics (DANE) and the National Planning Department (DNP) in the framework of the Misión para el empalme de las series de empleo, pobreza y desigualdad (MESEP).
e Figures from 2004 on are not strictly comparable with those of previous years, owing to methodological changes introduced by the National Institute of Statistics and Informatics.
f Since 1998, the survey’s sample design does not allow for the rural-urban breakdown. Thus, the data correspond to the national total.
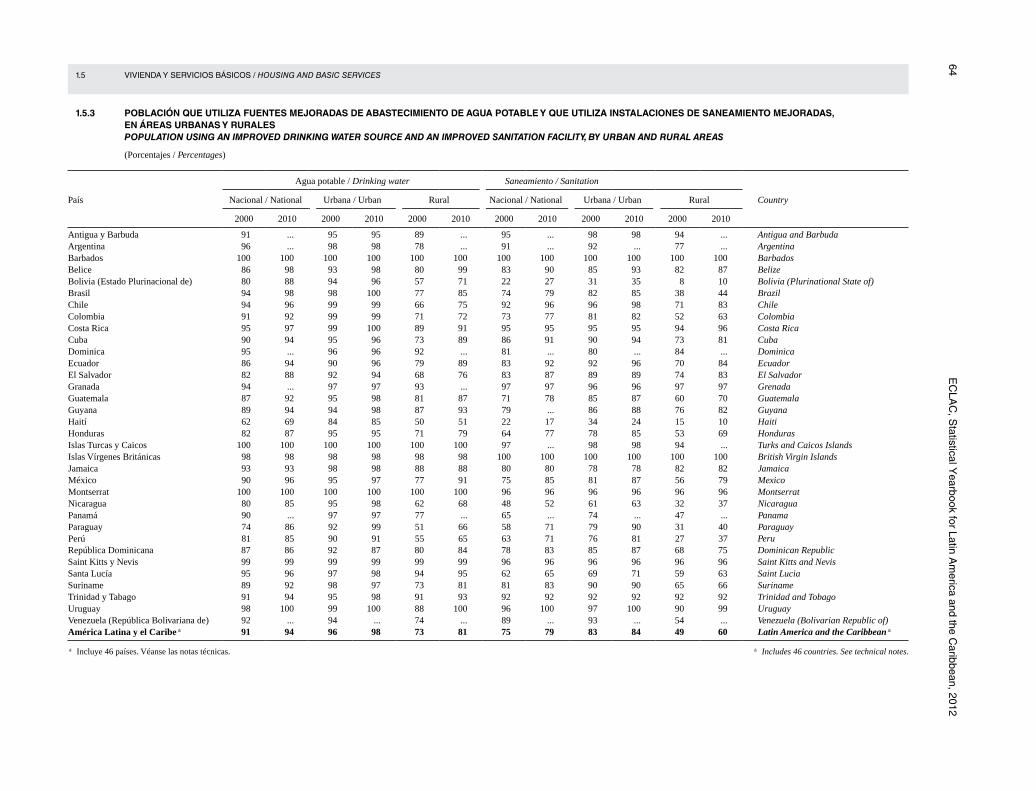
64 E
CLA
C, S
tatistical Yearbook for Latin A
merica and the C
aribbean, 2012 1.5 VIVIENDA Y SERVICIOS BÁSICOS / HOUSING AND BASIC SERVICES
1.5.3 POBLACIÓN QUE UTILIZA FUENTES MEJORADAS DE ABASTECIMIENTO DE AGUA POTABLE Y QUE UTILIZA INSTALACIONES DE SANEAMIENTO MEJORADAS, EN ÁREAS URBANAS Y RURALES POPULATION USING AN IMPROVED DRINKING WATER SOURCE AND AN IMPROVED SANITATION FACILITY, BY URBAN AND RURAL AREAS
(Porcentajes / Percentages)
País
Agua potable / Drinking water Saneamiento / Sanitation
CountryNacional / National Urbana / Urban Rural Nacional / National Urbana / Urban Rural
2000 2010 2000 2010 2000 2010 2000 2010 2000 2010 2000 2010
Antigua y Barbuda 91 ... 95 95 89 ... 95 ... 98 98 94 ... Antigua and Barbuda Argentina 96 ... 98 98 78 ... 91 ... 92 ... 77 ... Argentina Barbados 100 100 100 100 100 100 100 100 100 100 100 100 Barbados Belice 86 98 93 98 80 99 83 90 85 93 82 87 Belize Bolivia (Estado Plurinacional de) 80 88 94 96 57 71 22 27 31 35 8 10 Bolivia (Plurinational State of) Brasil 94 98 98 100 77 85 74 79 82 85 38 44 Brazil Chile 94 96 99 99 66 75 92 96 96 98 71 83 Chile Colombia 91 92 99 99 71 72 73 77 81 82 52 63 Colombia Costa Rica 95 97 99 100 89 91 95 95 95 95 94 96 Costa Rica Cuba 90 94 95 96 73 89 86 91 90 94 73 81 Cuba Dominica 95 ... 96 96 92 ... 81 ... 80 ... 84 ... Dominica Ecuador 86 94 90 96 79 89 83 92 92 96 70 84 Ecuador El Salvador 82 88 92 94 68 76 83 87 89 89 74 83 El Salvador Granada 94 ... 97 97 93 ... 97 97 96 96 97 97 Grenada Guatemala 87 92 95 98 81 87 71 78 85 87 60 70 Guatemala Guyana 89 94 94 98 87 93 79 ... 86 88 76 82 Guyana Haití 62 69 84 85 50 51 22 17 34 24 15 10 Haiti Honduras 82 87 95 95 71 79 64 77 78 85 53 69 Honduras Islas Turcas y Caicos 100 100 100 100 100 100 97 ... 98 98 94 ... Turks and Caicos Islands Islas Vírgenes Británicas 98 98 98 98 98 98 100 100 100 100 100 100 British Virgin Islands Jamaica 93 93 98 98 88 88 80 80 78 78 82 82 Jamaica México 90 96 95 97 77 91 75 85 81 87 56 79 Mexico Montserrat 100 100 100 100 100 100 96 96 96 96 96 96 Montserrat Nicaragua 80 85 95 98 62 68 48 52 61 63 32 37 Nicaragua Panamá 90 ... 97 97 77 ... 65 ... 74 ... 47 ... Panama Paraguay 74 86 92 99 51 66 58 71 79 90 31 40 Paraguay Perú 81 85 90 91 55 65 63 71 76 81 27 37 Peru República Dominicana 87 86 92 87 80 84 78 83 85 87 68 75 Dominican Republic Saint Kitts y Nevis 99 99 99 99 99 99 96 96 96 96 96 96 Saint Kitts and Nevis Santa Lucía 95 96 97 98 94 95 62 65 69 71 59 63 Saint Lucia Suriname 89 92 98 97 73 81 81 83 90 90 65 66 Suriname Trinidad y Tabago 91 94 95 98 91 93 92 92 92 92 92 92 Trinidad and Tobago Uruguay 98 100 99 100 88 100 96 100 97 100 90 99 Uruguay Venezuela (República Bolivariana de) 92 ... 94 ... 74 ... 89 ... 93 ... 54 ... Venezuela (Bolivarian Republic of) América Latina y el Caribe a 91 94 96 98 73 81 75 79 83 84 49 60 Latin America and the Caribbean a
a Incluye 46 países. Véanse las notas técnicas. a Includes 46 countries. See technical notes.

CE
PA
L, Anuario E
stadístico de Am
érica Latina y el Caribe, 2012
65 1.6 POBREZA Y DISTRIBUCIÓN DEL INGRESO / POVERTY AND INCOME DISTRIBUTION
1.6.1 PERSONAS EN SITUACIÓN DE POBREZA E INDIGENCIA, EN ÁREAS URBANAS Y RURALES POOR AND INDIGENT POPULATION, URBAN AND RURAL AREAS
(Porcentaje del total de personas / Percentage of total population)
PaísAños Years
Pobreza / Poverty a Indigencia / Extreme poverty
CountryNacional National
Urbano / UrbanTotal área rural Total rural area
Nacional National
Urbano / UrbanTotal área rural Total rural area Total área urbana
Total urban area Área metropolitana Metropolitan area
Resto área urbana Other urban area
Total área urbana Total urban area
Área metropolitana Metropolitan area
Resto área urbana Other urban area
Argentina 1999 ... 23.7 b 19.7 28.5 ... ... 6.6 b 4.8 8.8 ... Argentina 2011 ... 5.7 c 5.0 6.4 ... ... 1.9 c 1.7 2.1 ...
Bolivia (Estado Plurinacional de) 1999 60.6 48.7 43.4 57.7 80.7 36.4 19.8 17.3 23.9 64.6 Bolivia (Plurinational State of) 2009 42.4 32.6 32.6 ... 61.5 22.4 11.9 11.9 ... 43.0
Brasil 2001 37.5 34.1 ... ... 55.2 13.2 10.4 ... ... 28.0 Brazil 2011 20.9 18.2 ... ... 36.1 6.1 4.5 ... ... 14.9
Chile 2000 20.2 19.7 14.4 23.4 23.7 5.6 5.1 3.9 6.0 8.4 Chile 2011 11.0 11.3 8.7 13.1 8.7 3.1 3.0 2.5 3.4 3.8
Colombia 1999 54.9 50.6 43.1 53.1 61.8 26.8 21.9 19.6 22.7 34.6 Colombia
2011 d 34.2 30.5 13.2 35.3 46.2 10.6 7.1 2.0 8.5 22.2Costa Rica 1999 20.3 18.1 17.5 18.7 22.3 7.8 5.4 4.3 6.5 9.8 Costa Rica
2011 18.8 18.3 16.6 25.9 19.6 7.3 6.0 4.8 11.2 9.5Ecuador 1999 ... 63.5 ... ... ... ... 31.3 ... ... ... Ecuador
2011 35.4 32.4 ... ... 41.4 13.9 10.1 ... ... 21.3El Salvador 2001 48.9 39.4 32.1 47.7 62.4 22.1 14.3 9.9 19.2 33.3 El Salvador
2010 46.6 41.1 29.7 49.3 55.8 16.7 12.7 6.4 17.2 23.5Guatemala 2002 60.2 45.3 ... ... 68.0 30.9 18.1 ... ... 37.6 Guatemala
2006 54.8 42.0 ... ... 66.5 29.1 14.8 ... ... 42.2Honduras 1999 79.7 71.7 64.4 78.8 86.3 56.8 42.9 33.7 51.9 68.0 Honduras
2010 67.4 56.3 46.2 64.2 76.5 42.8 26.0 18.3 31.9 56.8México 2000 41.1 32.3 ... ... 54.7 15.2 6.6 ... ... 28.5 Mexico
2010 36.3 32.3 ... ... 42.9 13.3 8.5 ... ... 21.3Nicaragua 2001 69.4 63.9 50.9 72.2 77.1 42.5 33.5 24.6 39.2 55.2 Nicaragua
2009 58.3 52.9 47.8 56.2 65.4 29.5 20.9 17.8 22.9 40.9Panamá 1999 ... 19.5 ... ... ... ... 5.5 ... ... ... Panama
2011 25.3 15.5 ... ... 43.6 12.4 4.7 ... ... 26.8Paraguay 2001 59.7 50.1 42.7 59.0 70.9 31.3 18.3 10.6 27.7 46.3 Paraguay
2011 49.6 42.9 42.0 44.3 59.3 28.0 18.2 16.5 21.0 42.1Perú 2001 54.7 42.0 ... ... 78.4 24.4 9.9 ... ... 51.3 Peru
2011 e 27.8 18.0 ... ... 56.1 6.3 1.4 ... ... 20.5República Dominicana 2002 47.1 42.4 ... ... 55.9 20.7 16.5 ... ... 28.6 Dominican Republic
2011 42.2 40.8 ... ... 44.9 20.3 18.2 ... ... 24.7Uruguay 1999 ... 9.4 9.8 9.0 ... ... 1.8 1.9 1.6 ... Uruguay
2011 6.5 6.7 8.5 5.3 4.1 1.1 1.1 1.7 0.6 0.6Venezuela (República Bolivariana de) f 1999 49.4 ... ... ... ... 21.7 ... ... ... ... Venezuela (Bolivarian Republic of) f
2011 29.5 ... ... ... ... 11.7 ... ... ... ...América Latina g 1999 43.8 37.1 ... ... 64.1 18.6 12.0 ... ... 38.7 Latin America g
2011 29.4 24.2 ... ... 49.8 11.5 7.2 ... ... 28.8
a Incluye a las personas bajo la línea de indigencia o en situación de extrema pobreza.b Veintiocho aglomeraciones urbanas.c Treinta y una aglomeraciones urbanas.d A partir de 2002, las cifras de ingresos no son comparables con las de años anteriores debido a la aplicación
de nuevos criterios metodológicos desarrollados por el Departamento Administrativo Nacional de Estadística (DANE) y el Departamento Nacional de Planeación (DNP) en el marco de la Misión para el empalme de las series de empleo, pobreza y desigualdad (MESEP).
e Las cifras desde 2004 en adelante no son estrictamente comparables con las anteriores, debido a cambios metodológicos efectuados por el INEI.
f A partir de 1998 el diseño muestral de la encuesta no permite el desglose urbano-rural. Por lo tanto, las cifras corresponden al total nacional.
g Estimación basada en 19 países: Argentina, Estado Plurinacional de Bolivia, Brasil, Chile, Colombia, Costa Rica, Ecuador, El Salvador, Guatemala, Haití, Honduras, México, Nicaragua, Panamá, Paraguay, Perú, República Bolivariana de Venezuela, República Dominicana y Uruguay.
a Includes those living below the poverty line or in extreme poverty.b Twenty-eight urban agglomerations.c Thirty-one urban agglomerations.d From 2002 on, the income figures are not comparable with those of earlier years, owing to the application of
new methodological criteria developed by the National Administrative Department of Statistics (DANE) and the National Planning Department (DNP) in the framework of the Misión para el empalme de las series de empleo, pobreza y desigualdad (MESEP).
e Figures from 2004 on are not strictly comparable with those of previous years, owing to methodological changes introduced by the National Institute of Statistics and Informatics.
f Since 1998, the survey’s sample design does not allow for the rural-urban breakdown. Thus, the data correspond to the national total.
g Estimate based on 19 countries: Argentina, Bolivarian Republic of Venezuela, Plurinational State of Bolivia, Brazil, Chile, Colombia, Costa Rica, Ecuador, El Salvador, Guatemala, Haiti, Honduras, Mexico, Nicaragua, Panama, Paraguay, Peru, Dominican Republic and Uruguay.
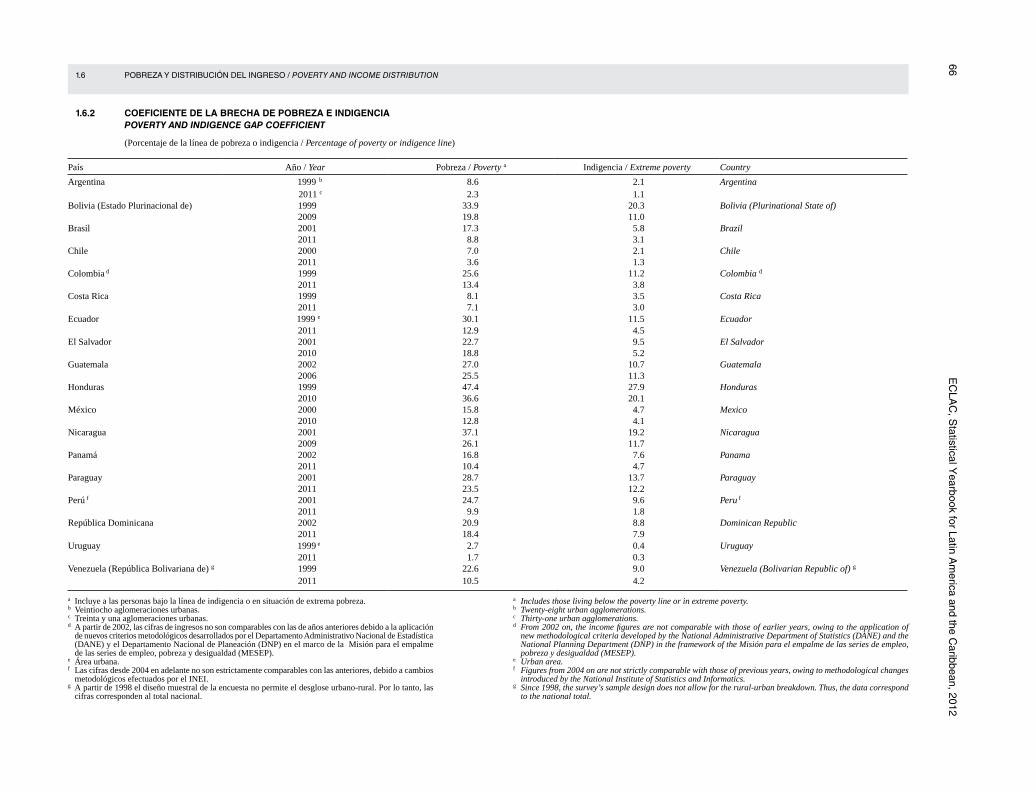
66 E
CLA
C, S
tatistical Yearbook for Latin A
merica and the C
aribbean, 2012 1.6 POBREZA Y DISTRIBUCIÓN DEL INGRESO / POVERTY AND INCOME DISTRIBUTION
1.6.2 COEFICIENTE DE LA BRECHA DE POBREZA E INDIGENCIA POVERTY AND INDIGENCE GAP COEFFICIENT
(Porcentaje de la línea de pobreza o indigencia / Percentage of poverty or indigence line)
País Año / Year Pobreza / Poverty a Indigencia / Extreme poverty Country
Argentina 1999 b 8.6 2.1 Argentina 2011 c 2.3 1.1
Bolivia (Estado Plurinacional de) 1999 33.9 20.3 Bolivia (Plurinational State of) 2009 19.8 11.0
Brasil 2001 17.3 5.8 Brazil 2011 8.8 3.1
Chile 2000 7.0 2.1 Chile 2011 3.6 1.3
Colombia d 1999 25.6 11.2 Colombia d
2011 13.4 3.8Costa Rica 1999 8.1 3.5 Costa Rica
2011 7.1 3.0Ecuador 1999 e 30.1 11.5 Ecuador
2011 12.9 4.5El Salvador 2001 22.7 9.5 El Salvador
2010 18.8 5.2Guatemala 2002 27.0 10.7 Guatemala
2006 25.5 11.3Honduras 1999 47.4 27.9 Honduras
2010 36.6 20.1México 2000 15.8 4.7 Mexico
2010 12.8 4.1Nicaragua 2001 37.1 19.2 Nicaragua
2009 26.1 11.7Panamá 2002 16.8 7.6 Panama
2011 10.4 4.7Paraguay 2001 28.7 13.7 Paraguay
2011 23.5 12.2Perú f 2001 24.7 9.6 Peru f
2011 9.9 1.8República Dominicana 2002 20.9 8.8 Dominican Republic
2011 18.4 7.9Uruguay 1999 e 2.7 0.4 Uruguay
2011 1.7 0.3Venezuela (República Bolivariana de) g 1999 22.6 9.0 Venezuela (Bolivarian Republic of) g
2011 10.5 4.2
a Incluye a las personas bajo la línea de indigencia o en situación de extrema pobreza.b Veintiocho aglomeraciones urbanas.c Treinta y una aglomeraciones urbanas.d A partir de 2002, las cifras de ingresos no son comparables con las de años anteriores debido a la aplicación
de nuevos criterios metodológicos desarrollados por el Departamento Administrativo Nacional de Estadística (DANE) y el Departamento Nacional de Planeación (DNP) en el marco de la Misión para el empalme de las series de empleo, pobreza y desigualdad (MESEP).
e Área urbana.f Las cifras desde 2004 en adelante no son estrictamente comparables con las anteriores, debido a cambios
metodológicos efectuados por el INEI.g A partir de 1998 el diseño muestral de la encuesta no permite el desglose urbano-rural. Por lo tanto, las
cifras corresponden al total nacional.
a Includes those living below the poverty line or in extreme poverty.b Twenty-eight urban agglomerations.c Thirty-one urban agglomerations.d From 2002 on, the income figures are not comparable with those of earlier years, owing to the application of
new methodological criteria developed by the National Administrative Department of Statistics (DANE) and the National Planning Department (DNP) in the framework of the Misión para el empalme de las series de empleo, pobreza y desigualdad (MESEP).
e Urban area.f Figures from 2004 on are not strictly comparable with those of previous years, owing to methodological changes
introduced by the National Institute of Statistics and Informatics.g Since 1998, the survey’s sample design does not allow for the rural-urban breakdown. Thus, the data correspond
to the national total.
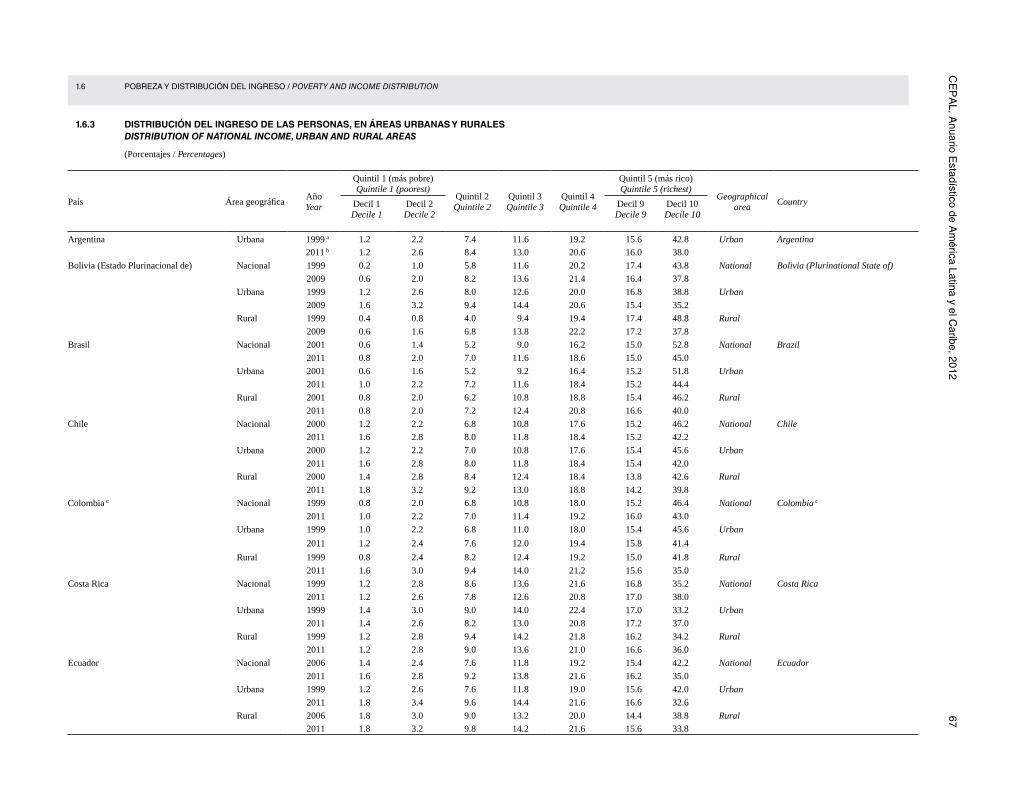
CE
PA
L, Anuario E
stadístico de Am
érica Latina y el Caribe, 2012
67 1.6 POBREZA Y DISTRIBUCIÓN DEL INGRESO / POVERTY AND INCOME DISTRIBUTION
1.6.3 DISTRIBUCIÓN DEL INGRESO DE LAS PERSONAS, EN ÁREAS URBANAS Y RURALES DISTRIBUTION OF NATIONAL INCOME, URBAN AND RURAL AREAS
(Porcentajes / Percentages)
País Área geográficaAñoYear
Quintil 1 (más pobre)Quintile 1 (poorest)
Quintil 2Quintile 2
Quintil 3Quintile 3
Quintil 4Quintile 4
Quintil 5 (más rico)Quintile 5 (richest)
Geographical area
CountryDecil 1Decile 1
Decil 2Decile 2
Decil 9Decile 9
Decil 10Decile 10
Argentina Urbana 1999 a 1.2 2.2 7.4 11.6 19.2 15.6 42.8 Urban Argentina
2011 b 1.2 2.6 8.4 13.0 20.6 16.0 38.0
Bolivia (Estado Plurinacional de) Nacional 1999 0.2 1.0 5.8 11.6 20.2 17.4 43.8 National Bolivia (Plurinational State of)
2009 0.6 2.0 8.2 13.6 21.4 16.4 37.8
Urbana 1999 1.2 2.6 8.0 12.6 20.0 16.8 38.8 Urban
2009 1.6 3.2 9.4 14.4 20.6 15.4 35.2
Rural 1999 0.4 0.8 4.0 9.4 19.4 17.4 48.8 Rural
2009 0.6 1.6 6.8 13.8 22.2 17.2 37.8
Brasil Nacional 2001 0.6 1.4 5.2 9.0 16.2 15.0 52.8 National Brazil
2011 0.8 2.0 7.0 11.6 18.6 15.0 45.0
Urbana 2001 0.6 1.6 5.2 9.2 16.4 15.2 51.8 Urban
2011 1.0 2.2 7.2 11.6 18.4 15.2 44.4
Rural 2001 0.8 2.0 6.2 10.8 18.8 15.4 46.2 Rural
2011 0.8 2.0 7.2 12.4 20.8 16.6 40.0
Chile Nacional 2000 1.2 2.2 6.8 10.8 17.6 15.2 46.2 National Chile
2011 1.6 2.8 8.0 11.8 18.4 15.2 42.2
Urbana 2000 1.2 2.2 7.0 10.8 17.6 15.4 45.6 Urban
2011 1.6 2.8 8.0 11.8 18.4 15.4 42.0
Rural 2000 1.4 2.8 8.4 12.4 18.4 13.8 42.6 Rural
2011 1.8 3.2 9.2 13.0 18.8 14.2 39.8
Colombia c Nacional 1999 0.8 2.0 6.8 10.8 18.0 15.2 46.4 National Colombia c
2011 1.0 2.2 7.0 11.4 19.2 16.0 43.0
Urbana 1999 1.0 2.2 6.8 11.0 18.0 15.4 45.6 Urban
2011 1.2 2.4 7.6 12.0 19.4 15.8 41.4
Rural 1999 0.8 2.4 8.2 12.4 19.2 15.0 41.8 Rural
2011 1.6 3.0 9.4 14.0 21.2 15.6 35.0
Costa Rica Nacional 1999 1.2 2.8 8.6 13.6 21.6 16.8 35.2 National Costa Rica
2011 1.2 2.6 7.8 12.6 20.8 17.0 38.0
Urbana 1999 1.4 3.0 9.0 14.0 22.4 17.0 33.2 Urban
2011 1.4 2.6 8.2 13.0 20.8 17.2 37.0
Rural 1999 1.2 2.8 9.4 14.2 21.8 16.2 34.2 Rural
2011 1.2 2.8 9.0 13.6 21.0 16.6 36.0
Ecuador Nacional 2006 1.4 2.4 7.6 11.8 19.2 15.4 42.2 National Ecuador
2011 1.6 2.8 9.2 13.8 21.6 16.2 35.0
Urbana 1999 1.2 2.6 7.6 11.8 19.0 15.6 42.0 Urban
2011 1.8 3.4 9.6 14.4 21.6 16.6 32.6
Rural 2006 1.8 3.0 9.0 13.2 20.0 14.4 38.8 Rural
2011 1.8 3.2 9.8 14.2 21.6 15.6 33.8

68 E
CLA
C, S
tatistical Yearbook for Latin A
merica and the C
aribbean, 2012 1.6 POBREZA Y DISTRIBUCIÓN DEL INGRESO / POVERTY AND INCOME DISTRIBUTION
1.6.3 DISTRIBUCIÓN DEL INGRESO DE LAS PERSONAS, EN ÁREAS URBANAS Y RURALES (continuación) DISTRIBUTION OF NATIONAL INCOME, URBAN AND RURAL AREAS (continued)
(Porcentajes / Percentages)
País Área geográficaAñoYear
Quintil 1 (más pobre)Quintile 1 (poorest)
Quintil 2Quintile 2
Quintil 3Quintile 3
Quintil 4Quintile 4
Quintil 5 (más rico)Quintile 5 (richest)
Geographical area
CountryDecil 1Decile 1
Decil 2Decile 2
Decil 9Decile 9
Decil 10Decile 10
El Salvador Nacional 2001 0.8 2.0 7.4 12.6 20.8 17.0 39.4 National El Salvador
2010 1.6 3.0 9.2 14.0 21.6 16.4 34.2
Urbana 2001 1.4 2.8 8.6 13.4 21.0 16.6 36.0 Urban
2010 2.0 3.4 9.8 14.6 21.6 16.4 32.2
Rural 2001 1.0 2.4 8.6 14.4 22.6 17.2 34.2 Rural
2010 2.0 3.4 10.4 15.6 22.6 16.2 29.8
Guatemala Nacional 2002 1.4 2.4 7.0 11.2 19.4 16.4 42.2 National Guatemala
2006 1.0 1.8 6.2 10.4 17.8 15.2 47.4
Urbana 2002 1.2 2.4 7.6 12.2 20.0 15.8 40.8 Urban
2006 1.2 2.4 7.2 11.2 18.2 15.4 44.4
Rural 2002 1.8 3.2 9.2 12.8 19.8 16.6 36.8 Rural
2006 1.4 2.4 7.4 12.2 19.2 15.2 42.2
Honduras Nacional 1999 0.8 1.8 6.6 11.2 19.4 16.6 43.8 National Honduras
2010 0.8 1.6 6.0 11.2 20.0 17.0 43.4
Urbana 1999 1.2 2.4 7.6 12.4 20.0 16.4 40.0 Urban
2010 1.2 2.6 8.2 12.8 20.6 16.4 38.0
Rural 1999 1.0 2.4 7.8 12.6 20.4 16.2 39.2 Rural
2010 1.2 2.0 6.4 11.0 19.0 16.2 44.2
México Nacional 2000 1.2 2.2 7.2 11.6 19.0 15.8 43.2 National Mexico
2010 1.6 2.8 8.6 13.2 20.4 16.0 37.4
Urbana 2000 2.0 3.0 8.4 12.2 19.2 15.6 39.8 Urban
2010 2.0 3.2 9.2 13.4 20.4 15.6 36.2
Rural 2000 1.4 2.4 7.0 11.0 17.6 14.6 46.0 Rural
2010 1.8 3.2 9.4 14.2 21.2 15.8 34.6
Nicaragua Nacional 2001 0.6 1.8 6.6 11.0 18.2 15.2 46.4 National Nicaragua
2009 1.4 2.8 8.6 13.8 20.8 16.0 36.8
Urbana 2001 1.0 2.2 7.2 11.2 18.2 14.2 46.0 Urban
2009 1.8 3.2 9.8 14.0 20.8 16.0 34.4
Rural 2001 0.6 2.2 8.0 13.2 21.8 16.4 37.6 Rural
2009 1.4 2.8 9.0 14.0 21.6 15.8 35.2
Panamá Nacional 2002 0.8 1.6 6.2 11.2 19.8 17.0 43.4 National Panama
2011 1.0 2.0 7.6 12.8 20.6 16.0 40.2
Urbana 1999 1.2 2.6 7.8 12.8 20.6 17.0 38.0 Urban
2011 1.6 2.8 9.0 13.4 19.8 15.2 38.2
Rural 2002 1.0 1.8 6.6 11.4 20.0 17.0 42.4 Rural
2011 1.2 2.2 7.2 12.4 21.4 17.4 38.6
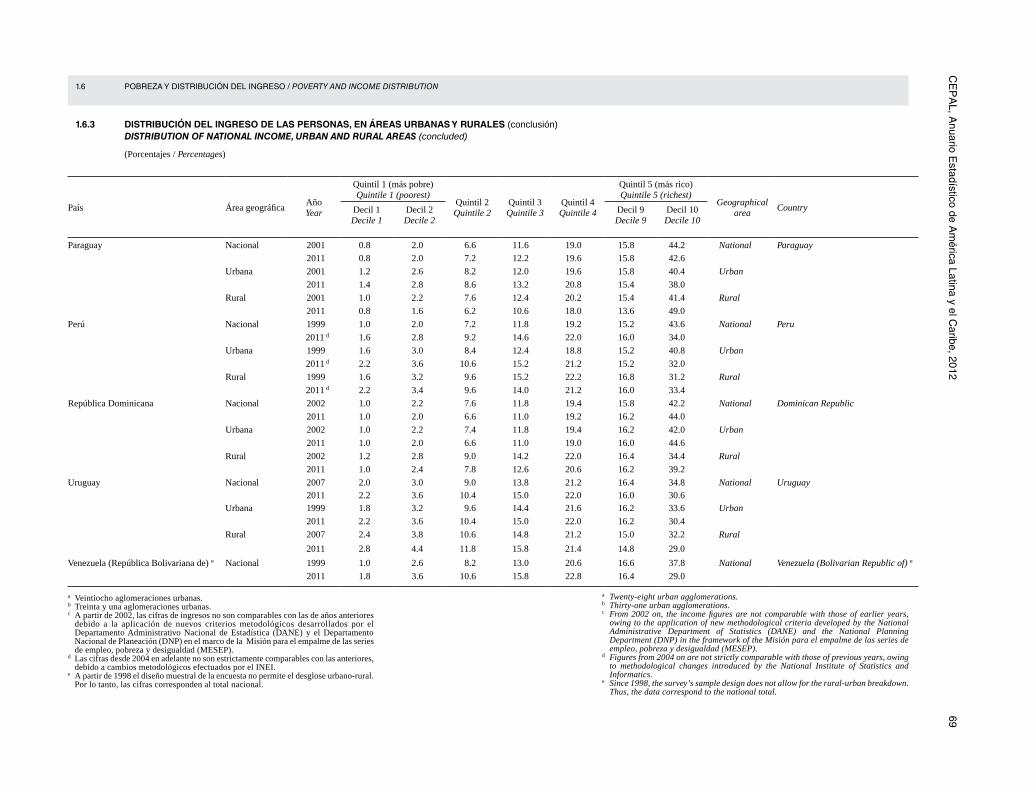
CE
PA
L, Anuario E
stadístico de Am
érica Latina y el Caribe, 2012
69 1.6 POBREZA Y DISTRIBUCIÓN DEL INGRESO / POVERTY AND INCOME DISTRIBUTION
1.6.3 DISTRIBUCIÓN DEL INGRESO DE LAS PERSONAS, EN ÁREAS URBANAS Y RURALES (conclusión) DISTRIBUTION OF NATIONAL INCOME, URBAN AND RURAL AREAS (concluded)
(Porcentajes / Percentages)
País Área geográficaAñoYear
Quintil 1 (más pobre)Quintile 1 (poorest)
Quintil 2Quintile 2
Quintil 3Quintile 3
Quintil 4Quintile 4
Quintil 5 (más rico)Quintile 5 (richest)
Geographical area
CountryDecil 1Decile 1
Decil 2Decile 2
Decil 9Decile 9
Decil 10Decile 10
Paraguay Nacional 2001 0.8 2.0 6.6 11.6 19.0 15.8 44.2 National Paraguay
2011 0.8 2.0 7.2 12.2 19.6 15.8 42.6
Urbana 2001 1.2 2.6 8.2 12.0 19.6 15.8 40.4 Urban
2011 1.4 2.8 8.6 13.2 20.8 15.4 38.0
Rural 2001 1.0 2.2 7.6 12.4 20.2 15.4 41.4 Rural
2011 0.8 1.6 6.2 10.6 18.0 13.6 49.0
Perú Nacional 1999 1.0 2.0 7.2 11.8 19.2 15.2 43.6 National Peru
2011 d 1.6 2.8 9.2 14.6 22.0 16.0 34.0
Urbana 1999 1.6 3.0 8.4 12.4 18.8 15.2 40.8 Urban
2011 d 2.2 3.6 10.6 15.2 21.2 15.2 32.0
Rural 1999 1.6 3.2 9.6 15.2 22.2 16.8 31.2 Rural
2011 d 2.2 3.4 9.6 14.0 21.2 16.0 33.4
República Dominicana Nacional 2002 1.0 2.2 7.6 11.8 19.4 15.8 42.2 National Dominican Republic
2011 1.0 2.0 6.6 11.0 19.2 16.2 44.0
Urbana 2002 1.0 2.2 7.4 11.8 19.4 16.2 42.0 Urban
2011 1.0 2.0 6.6 11.0 19.0 16.0 44.6
Rural 2002 1.2 2.8 9.0 14.2 22.0 16.4 34.4 Rural
2011 1.0 2.4 7.8 12.6 20.6 16.2 39.2
Uruguay Nacional 2007 2.0 3.0 9.0 13.8 21.2 16.4 34.8 National Uruguay 2011 2.2 3.6 10.4 15.0 22.0 16.0 30.6
Urbana 1999 1.8 3.2 9.6 14.4 21.6 16.2 33.6 Urban
2011 2.2 3.6 10.4 15.0 22.0 16.2 30.4
Rural 2007 2.4 3.8 10.6 14.8 21.2 15.0 32.2 Rural
2011 2.8 4.4 11.8 15.8 21.4 14.8 29.0
Venezuela (República Bolivariana de) e Nacional 1999 1.0 2.6 8.2 13.0 20.6 16.6 37.8 National Venezuela (Bolivarian Republic of) e
2011 1.8 3.6 10.6 15.8 22.8 16.4 29.0
a Veintiocho aglomeraciones urbanas.b Treinta y una aglomeraciones urbanas.c A partir de 2002, las cifras de ingresos no son comparables con las de años anteriores
debido a la aplicación de nuevos criterios metodológicos desarrollados por el Departamento Administrativo Nacional de Estadística (DANE) y el Departamento Nacional de Planeación (DNP) en el marco de la Misión para el empalme de las series de empleo, pobreza y desigualdad (MESEP).
d Las cifras desde 2004 en adelante no son estrictamente comparables con las anteriores, debido a cambios metodológicos efectuados por el INEI.
e A partir de 1998 el diseño muestral de la encuesta no permite el desglose urbano-rural. Por lo tanto, las cifras corresponden al total nacional.
a Twenty-eight urban agglomerations.b Thirty-one urban agglomerations.c From 2002 on, the income figures are not comparable with those of earlier years,
owing to the application of new methodological criteria developed by the National Administrative Department of Statistics (DANE) and the National Planning Department (DNP) in the framework of the Misión para el empalme de las series de empleo, pobreza y desigualdad (MESEP).
d Figures from 2004 on are not strictly comparable with those of previous years, owing to methodological changes introduced by the National Institute of Statistics and Informatics.
e Since 1998, the survey’s sample design does not allow for the rural-urban breakdown. Thus, the data correspond to the national total.

70 E
CLA
C, S
tatistical Yearbook for Latin A
merica and the C
aribbean, 2012 1.6 POBREZA Y DISTRIBUCIÓN DEL INGRESO / POVERTY AND INCOME DISTRIBUTION
1.6.4 ÍNDICE DE GINI, EN ÁREAS URBANAS Y RURALES a
GINI COEFFICIENT, URBAN AND RURAL AREAS a
(Valores entre 0 y 1 / Values between 0 and 1)
País Año / Year Nacional / National Urbana / Urban Rural Country
Argentina 1999 b ... 0.539 ... Argentina 2011 c ... 0.492 ...
Bolivia (Estado Plurinacional de) 1999 0.586 0.504 0.640 Bolivia (Plurinational State of) 2009 0.508 0.450 0.524
Brasil 2001 0.639 0.628 0.581 Brazil 2011 0.559 0.550 0.532
Chile 2000 0.564 0.558 0.511 Chile 2011 0.516 0.515 0.478
Colombia 1999 0.572 0.564 0.525 Colombia 2011 d 0.545 0.522 0.456
Costa Rica 1999 0.473 0.454 0.457 Costa Rica 2011 0.503 0.493 0.473
Ecuador 1999 ... 0.526 ... Ecuador 2011 0.460 0.434 0.437
El Salvador 2001 0.525 0.477 0.477 El Salvador 2010 0.454 0.424 0.402
Guatemala 2002 0.542 0.525 0.472 Guatemala 2006 0.585 0.547 0.526
Honduras 1999 0.564 0.517 0.512 Honduras 2010 0.567 0.492 0.560
México 2000 0.542 0.493 0.553 Mexico 2010 0.481 0.456 0.450
Nicaragua 2001 0.579 0.561 0.507 Nicaragua 2009 0.478 0.443 0.462
Panamá 2002 0.567 0.515 0.553 Panama 2011 0.531 0.485 0.527
Paraguay 2001 0.558 0.511 0.524 Paraguay 2011 0.546 0.487 0.596
Perú 2001 0.525 0.477 0.439 Peru 2011 e 0.452 0.406 0.432
República Dominicana 2002 0.537 0.535 0.464 Dominican Republic 2011 0.558 0.565 0.512
Uruguay 1999 ... 0.440 ... Uruguay 2011 0.402 0.402 0.359
Venezuela (República Bolivariana de) f 1999 0.498 ... ... Venezuela (Bolivarian Republic of) f 2011 0.397 ... ...
a Incluye a las personas con cero ingreso.b Veintiocho aglomeraciones urbanas.c Treinta y una aglomeraciones urbanas.d A partir de 2002, las cifras de ingresos no son comparables con las de años anteriores debido a la aplicación
de nuevos criterios metodológicos desarrollados por el Departamento Administrativo Nacional de Estadística (DANE) y el Departamento Nacional de Planeación (DNP) en el marco de la Misión para el empalme de las series de empleo, pobreza y desigualdad (MESEP).
e Las cifras desde 2004 en adelante no son estrictamente comparables con las anteriores, debido a cambios metodológicos efectuados por el INEI.
f A partir de 1998 el diseño muestral de la encuesta no permite el desglose urbano-rural. Por lo tanto, las cifras corresponden al total nacional.
a Includes persons with no income.b Twenty-eight urban agglomerations.c Thirty-one urban agglomerations.d From 2002 on, the income figures are not comparable with those of earlier years, owing to the
application of new methodological criteria developed by the National Administrative Department of Statistics (DANE) and the National Planning Department (DNP) in the framework of the Misión para el empalme de las series de empleo, pobreza y desigualdad (MESEP).
e Figures from 2004 on are not strictly comparable with those of previous years, owing to methodological changes introduced by the National Institute of Statistics and Informatics.
f Since 1998, the survey’s sample design does not allow for the rural-urban breakdown. Thus, the data correspond to the national total.

CE
PA
L, Anuario E
stadístico de Am
érica Latina y el Caribe, 2012
71 1.7 GÉNERO / GENDER
1.7.1 RELACIÓN DE SALARIOS ENTRE LOS GÉNEROS, SEGÚN AÑOS DE ESTUDIOS APROBADOS GENDER WAGE RATIO, BY YEARS OF EDUCATION COMPLETED
(Porcentajes / Percentages)
País
Años de estudios aprobados / Years of education completed
CountryAñosYears
Total 0-5 6-9 10-12 13 y más
13 and over
Argentina 1999 a 88.5 86.8 71.8 81.7 74.3 Argentina 2011 b 89.2 86.0 72.1 78.0 81.5
Bolivia (Estado Plurinacional de) 1999 82.1 64.2 48.0 65.6 82.4 Bolivia (Plurinational State of) 2009 79.7 68.3 66.4 75.5 81.7
Brasil 2001 76.1 66.3 62.8 62.7 60.9 Brazil 2011 81.6 73.2 71.3 67.9 70.5
Chile 2000 74.3 90.4 79.5 76.2 62.3 Chile 2011 80.1 80.4 80.5 76.5 69.0
Colombia c 1999 86.7 84.6 83.7 81.9 79.1 Colombia c 2011 90.3 78.7 80.0 78.3 81.0
Costa Rica 1999 83.4 73.4 69.1 77.5 73.6 Costa Rica 2011 94.6 69.9 79.5 85.4 86.0
Ecuador 1999 92.3 64.6 64.6 91.1 81.5 Ecuador 2011 95.6 79.7 75.3 83.4 89.0
El Salvador 2001 87.2 76.3 74.5 86.5 80.2 El Salvador 2010 94.7 89.4 81.4 85.4 89.3
Guatemala 2002 82.1 90.9 83.0 71.8 85.7 Guatemala 2006 83.4 103.6 73.9 82.8 62.8
Honduras 1999 77.8 73.6 66.4 76.1 77.1 Honduras 2010 94.4 89.3 84.8 85.1 85.6
México 2000 72.0 59.8 84.8 81.7 58.3 Mexico 2010 79.3 72.3 73.4 77.7 69.2
Nicaragua 2001 83.1 76.2 73.6 72.6 72.8 Nicaragua 2009 89.7 95.6 81.3 79.8 78.4
Panamá 2002 89.1 64.9 61.7 84.5 73.9 Panama 2011 89.0 65.2 71.1 81.6 75.7
Paraguay 2001 81.2 67.0 81.5 84.0 67.6 Paraguay 2011 85.8 78.3 70.7 84.2 76.6
Perú 2001 79.7 78.6 83.4 83.1 71.9 Peru 2011 d 74.9 71.1 63.3 72.0 73.3
República Dominicana 2002 86.9 52.8 70.2 83.9 85.4 Dominican Republic 2011 90.0 58.4 60.5 72.8 84.0
Uruguay 1999 79.9 68.0 70.8 71.8 67.7 Uruguay 2011 83.6 60.5 64.8 71.4 77.5
Venezuela (República Bolivariana de) e 1999 91.6 81.3 72.1 76.5 76.7 Venezuela (Bolivarian Republic of) e
2011 98.0 79.3 80.2 87.8 89.0
a Twenty-eight urban agglomerations.b Thirty-one urban agglomerations.c From 2002 on, the income figures are not comparable with those of earlier years, owing to the
application of new methodological criteria developed by the National Administrative Department of Statistics (DANE) and the National Planning Department (DNP) in the framework of the Misión para el empalme de las series de empleo, pobreza y desigualdad (MESEP).
d Figures from 2004 on are not strictly comparable with those of previous years, owing to methodological changes introduced by the National Institute of Statistics and Informatics.
e Since 1998, the survey’s sample design does not allow for the rural-urban breakdown. Thus, the data correspond to the national total.
a Veintiocho aglomeraciones urbanas.b Treinta y una aglomeraciones urbanas.c A partir de 2002, las cifras de ingresos no son comparables con las de años anteriores debido a la
aplicación de nuevos criterios metodológicos desarrollados por el Departamento Administrativo Nacional de Estadística (DANE) y el Departamento Nacional de Planeación (DNP) en el marco de la Misión para el empalme de las series de empleo, pobreza y desigualdad (MESEP).
d Las cifras desde 2004 en adelante no son estrictamente comparables con las anteriores, debido a cambios metodológicos efectuados por el INEI.
e A partir de 1998 el diseño muestral de la encuesta no permite el desglose urbano-rural. Por lo tanto, las cifras corresponden al total nacional.

72 E
CLA
C, S
tatistical Yearbook for Latin A
merica and the C
aribbean, 2012 1.7 GÉNERO / GENDER
1.7.2 PROPORCIÓN DE MUJERES ENTRE LOS EMPLEADOS REMUNERADOS EN EL SECTOR NO AGRÍCOLA SHARE OF WOMEN IN WAGE EMPLOYMENT IN THE NON-AGRICULTURAL SECTOR
(Porcentajes / Percentages)
País 2000 2005 2006 2007 2008 2009 2010 a Country
Antigua y Barbuda a b ... 50.6 50.6 50.6 50.6 ... ... Antigua and Barbuda a b
Antiguas Antillas Neerlandesas 49.9 a c 51.9 d e 51.2 d e 51.8 d e 51.0 d e ... ... Former Netherlands Antilles Argentina a 42.6 45.1 45.0 ... ... ... ... Argentina a
Aruba a 48.3 ... ... 48.6 ... ... ... Aruba a
Bahamas ... 50.0 a b 49.7 a b 48.8 a b 49.2 d e 50.2 d e ... Bahamas Barbados 49.9 a c 52.0 d b 51.2 d b 50.4 d b 50.7 d b ... ... Barbados Belice ... 36.5 a c 35.9 d e 37.7 d e ... ... ... Belize
Bolivia (Estado Plurinacional de) c 38.6 d 37.7 d 42.4 d 38.1 d ... 36.5 a ... Bolivia (Plurinational State of) c
Brasil 40.3 a 41.5 d 41.8 d 41.6 d ... ... ... Brazil
Chile 32.8 a 34.4 d b 34.9 a 35.5 a 36.2 a 36.9 d e 37.6 Chile
Colombia a 48.8 47.4 46.6 47.5 47.5 46.3 46.4 Colombia a
Costa Rica a 39.3 39.6 40.7 41.1 41.5 42.8 43.3 Costa Rica a
Cuba a 43.3 42.6 42.7 43.7 43.4 44.8 44.8 Cuba a
Ecuador 39.3 d c 40.2 a f 38.7 a f ... ... ... ... Ecuador El Salvador a 49.1 48.5 48.6 48.0 ... ... ... El Salvador a
Honduras ... 41.5 a 42.2 d c 41.9 c d ... ... ... Honduras Islas Caimán 51.2 d e 49.5 d e 49.4 a c 49.3 a c 50.5 a c ... ... Cayman Islands Islas Turcas y Caicos a c ... 41.6 40.5 38.1 ... ... ... Turks and Caicos Islands a c
Islas Vírgenes Británicas a e 49.8 49.1 ... ... ... ... ... British Virgin Islands a e
Jamaica a c 45.0 45.6 45.8 46.3 48.2 ... ... Jamaica a c
México a 37.3 39.1 39.3 39.4 39.4 39.7 39.4 Mexico a
Nicaragua ... 38.3 a c 38.6 a c 38.1 d e ... ... ... Nicaragua
Panamá a 43.0 43.4 42.5 43.1 42.2 42.1 42.9 Panama a
Paraguay 39.3 d e 40.1d e 38.7 d e 40.2 a 39.5 a ... ... Paraguay Perú a 33.3 35.1 34.9 36.8 37.5 ... ... Peru a
Puerto Rico 39.6 a 40.5 d c 40.8 d c 41.5 d c 41.7 d c 43.8 a c 46.3 c Puerto Rico República Dominicana 37.3 d c 37.7 a 39.3 a 38.8 a ... 40.6 a 41.8 Dominican Republic Santa Lucía a c 49.4 ... ... ... ... ... ... Saint Lucia a c
Suriname a ... ... ... ... ... ... 36.3 Suriname a
Trinidad y Tabago a 40.0 43.9 ... ... ... ... ... Trinidad and Tobago a
Uruguay 46.4 a 48.8 d c 45.1d c 45.5 d c ... ... ... Uruguay
Venezuela (República Bolivariana de) a b 39.8 41.6 41.0 41.4 41.6 ... ... Venezuela (Bolivarian Republic of) a b
a La cifra es producida y divulgada por el país (considera el dato ajustado por el país con el fin de hacerlo coincidir con los estándares internacionales).
b Empleo total en el sector no agrícola.c Empleo total pagado.d La cifra es estimada por el organismo internacional cuando un dato de país para un año específico o para una serie
de años no está disponible, o cuando existen múltiples fuentes de información o hay cuestionamientos a la calidad de los datos. Las estimaciones están basadas en datos nacionales tales como encuestas o registros administrativos u otras fuentes de información, pero utilizando la misma variable para realizar la estimación.
e Empleo total.f Áreas urbanas.
a The figure is the one produced and disseminated by the country (including data adjusted by the country to meet international standards).
b Total employment in non-agricultural sector.c Total paid employment.d The figure is estimated by the international agency, when corresponding country data on a specific year or set of
years are not available, or when multiple sources exist, or there are issues of data quality. Estimates are based on national data, such as surveys or administrative records, or other sources but on the same variable being estimated.
e Total employment.f Urban areas.
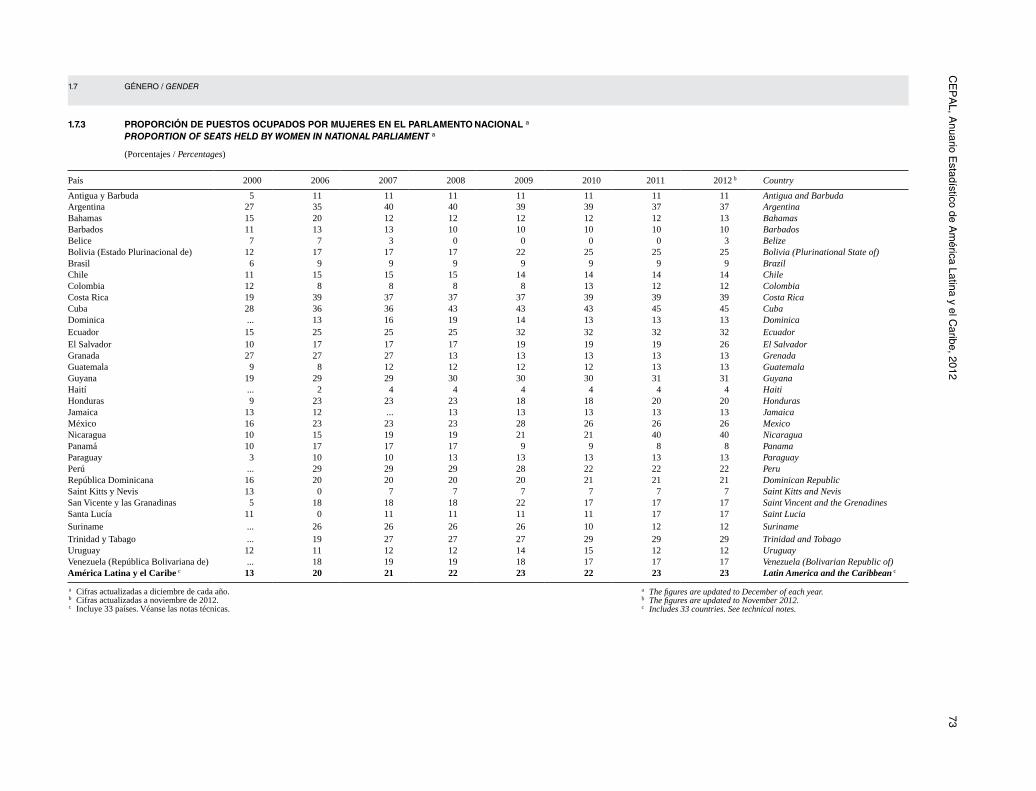
CE
PA
L, Anuario E
stadístico de Am
érica Latina y el Caribe, 2012
731.7 GÉNERO / GENDER
1.7.3 PROPORCIÓN DE PUESTOS OCUPADOS POR MUJERES EN EL PARLAMENTO NACIONAL a
PROPORTION OF SEATS HELD BY WOMEN IN NATIONAL PARLIAMENT a
(Porcentajes / Percentages)
País 2000 2006 2007 2008 2009 2010 2011 2012 b Country
Antigua y Barbuda 5 11 11 11 11 11 11 11 Antigua and Barbuda Argentina 27 35 40 40 39 39 37 37 Argentina Bahamas 15 20 12 12 12 12 12 13 Bahamas Barbados 11 13 13 10 10 10 10 10 Barbados Belice 7 7 3 0 0 0 0 3 Belize Bolivia (Estado Plurinacional de) 12 17 17 17 22 25 25 25 Bolivia (Plurinational State of) Brasil 6 9 9 9 9 9 9 9 Brazil Chile 11 15 15 15 14 14 14 14 Chile Colombia 12 8 8 8 8 13 12 12 Colombia Costa Rica 19 39 37 37 37 39 39 39 Costa Rica Cuba 28 36 36 43 43 43 45 45 Cuba Dominica ... 13 16 19 14 13 13 13 Dominica Ecuador 15 25 25 25 32 32 32 32 Ecuador El Salvador 10 17 17 17 19 19 19 26 El Salvador Granada 27 27 27 13 13 13 13 13 Grenada Guatemala 9 8 12 12 12 12 13 13 Guatemala Guyana 19 29 29 30 30 30 31 31 Guyana Haití ... 2 4 4 4 4 4 4 Haiti Honduras 9 23 23 23 18 18 20 20 Honduras Jamaica 13 12 ... 13 13 13 13 13 Jamaica México 16 23 23 23 28 26 26 26 Mexico Nicaragua 10 15 19 19 21 21 40 40 Nicaragua Panamá 10 17 17 17 9 9 8 8 Panama Paraguay 3 10 10 13 13 13 13 13 Paraguay Perú ... 29 29 29 28 22 22 22 Peru República Dominicana 16 20 20 20 20 21 21 21 Dominican Republic Saint Kitts y Nevis 13 0 7 7 7 7 7 7 Saint Kitts and Nevis San Vicente y las Granadinas 5 18 18 18 22 17 17 17 Saint Vincent and the Grenadines Santa Lucía 11 0 11 11 11 11 17 17 Saint Lucia Suriname ... 26 26 26 26 10 12 12 Suriname Trinidad y Tabago ... 19 27 27 27 29 29 29 Trinidad and Tobago Uruguay 12 11 12 12 14 15 12 12 Uruguay Venezuela (República Bolivariana de) ... 18 19 19 18 17 17 17 Venezuela (Bolivarian Republic of) América Latina y el Caribe c 13 20 21 22 23 22 23 23 Latin America and the Caribbean c
a Cifras actualizadas a diciembre de cada año.b Cifras actualizadas a noviembre de 2012.c Incluye 33 países. Véanse las notas técnicas.
a The figures are updated to December of each year.b The figures are updated to November 2012.c Includes 33 countries. See technical notes.

74 E
CLA
C, S
tatistical Yearbook for Latin A
merica and the C
aribbean, 2012 1.7 GÉNERO / GENDER
1.7.4 ÍNDICE DE FEMINIDAD DE LA INDIGENCIA Y DE LA POBREZA, SEGÚN ZONAS GEOGRÁFICAS FEMININITY RATE OF INDIGENCE AND POVERTY, BY GEOGRAPHICAL AREA
(Índice / Index)
País Año / YearPobreza / Poverty Indigencia / Extreme poverty
CountryNacional / National Urbana / Urban Rural Nacional / National Urbana / Urban Rural
Argentina 1999 a ... 112.0 ... ... 118.1 ... Argentina 2011 b ... 135.6 ... ... 127.5 ...
Bolivia (Estado Plurinacional de) 1999 105.2 106.8 104.0 107.7 113.8 105.6 Bolivia (Plurinational State of) 2009 110.8 113.3 105.8 107.5 114.5 100.8
Brasil 2001 104.2 106.3 104.8 103.7 108.1 106.8 Brazil 2011 112.2 116.8 107.8 118.7 131.2 110.5
Chile 2000 109.1 108.5 115.6 114.7 116.3 114.7 Chile 2011 147.7 148.5 136.5 155.6 158.0 145.9
Colombia 1999 105.0 103.5 109.8 109.0 109.9 113.3 Colombia 2011 c 114.6 115.5 119.8 122.0 130.7 127.8
Costa Rica 1999 128.2 134.6 125.1 141.1 168.4 132.6 Costa Rica 2011 124.5 130.3 116.6 125.9 139.4 116.3
Ecuador 1999 ... 104.5 ... ... 111.1 ... Ecuador 2011 112.5 110.9 117.3 120.2 126.6 118.3
El Salvador 2001 106.4 111.4 104.0 104.2 110.7 103.4 El Salvador 2010 104.4 107.8 102.8 99.8 105.8 98.5
Honduras 1999 100.6 103.0 100.4 104.8 112.3 104.2 Honduras 2010 101.0 108.1 99.3 98.4 115.5 97.7
México 2000 104.7 103.3 106.1 107.2 103.3 108.2 Mexico 2010 105.9 107.2 104.1 105.0 111.2 100.6
Nicaragua 2001 103.1 106.3 101.9 104.6 110.4 105.2 Nicaragua 2009 104.3 107.9 102.4 102.3 112.1 100.8
Panamá 2002 109.7 115.9 111.0 112.0 130.0 113.6 Panama 2011 117.9 130.3 115.9 122.3 158.5 120.4
Paraguay 2001 102.5 104.3 105.1 95.5 105.7 98.9 Paraguay 2011 104.9 107.9 104.7 105.1 115.2 105.7
Perú 2001 104.8 105.9 105.0 107.0 112.9 107.2 Peru 2011 d 109.2 112.7 110.2 109.0 117.4 113.3
República Dominicana 2002 117.3 117.9 121.0 129.4 134.0 133.2 Dominican Republic 2011 131.6 129.5 137.2 153.7 154.1 160.5
Uruguay 1999 ... 104.2 ... ... 108.0 ... Uruguay 2011 134.7 134.6 128.1 152.4 151.3 159.5
Venezuela (República Bolivariana de) e 1999 110.1 ... ... 116.0 ... ... Venezuela (Bolivarian Republic of) e
2011 119.9 ... ... 132.0 ... ...
a Veintiocho aglomeraciones urbanas.b Treinta y una aglomeraciones urbanas.c A partir de 2002, las cifras de ingresos no son comparables con las de años anteriores debido a la
aplicación de nuevos criterios metodológicos desarrollados por el Departamento Administrativo Nacional de Estadística (DANE) y el Departamento Nacional de Planeación (DNP) en el marco de la Misión para el empalme de las series de empleo, pobreza y desigualdad (MESEP).
d Las cifras desde 2004 en adelante no son estrictamente comparables con las anteriores, debido a cambios metodológicos efectuados por el INEI.
e A partir de 1998 el diseño muestral de la encuesta no permite el desglose urbano-rural. Por lo tanto, las cifras corresponden al total nacional.
a Twenty-eight urban agglomerations.b Thirty-one urban agglomerations.c From 2002 on, the figures for income are not strictly comparable with those of earlier years, owing to
new methodological criteria applied by the National Administrative Department of Statistics (DANE) and the National Planning Department (DNP) in the framework of the Mission for the splicing of employment, poverty and inequality series (MESEP).
d Figures from 2004 on are not strictly comparable with those of previous years, owing to methodological changes introduced by the National Institute of Statistics and Informatics.
e Since 1998, the survey’s sample design does not allow for the rural-urban breakdown. Thus, the data correspond to the national total.

2. Estadísticas económicas Economic statistics
�
CEPAL, Anuario Estadístico de América Latina y el Caribe, 2012 75


CE
PA
L, Anuario E
stadístico de Am
érica Latina y el Caribe, 2012
77 2.1 CUENTAS NACIONALES / NATIONAL ACCOUNTS 2.1.1 CUENTAS NACIONALES DE AMÉRICA LATINA Y EL CARIBE, EN DÓLARES / NATIONAL ACCOUNTS OF LATIN AMERICA AND THE CARIBBEAN, IN DOLLARS
2.1.1.1 AMÉRICA LATINA Y EL CARIBE: TASAS DE VARIACIÓN ANUAL DEL PRODUCTO INTERNO BRUTO LATIN AMERICA AND THE CARIBBEAN: ANNUAL GROWTH RATES OF GROSS DOMESTIC PRODUCT
(Porcentajes / Percentages)
Países y regiones 2004 2005 2006 2007 2008 2009 2010 2011 Countries and regions
Antigua y Barbuda 4.9 6.1 13.5 9.6 0.0 -11.9 -7.9 -5.0 Antigua and Barbuda Argentina 9.0 9.2 8.5 8.7 6.8 0.9 9.2 8.9 Argentina Bahamas 0.9 3.4 2.5 1.4 -2.3 -4.9 0.2 1.6 Bahamas Barbados 1.4 4.0 5.7 1.7 0.1 -3.7 0.2 0.4 Barbados Belice 4.6 3.0 4.7 1.3 3.6 -0.0 2.7 2.3 Belize Bolivia (Estado Plurinacional de) 4.2 4.4 4.8 4.6 6.1 3.4 4.1 5.2 Bolivia (Plurinational State of) Brasil 5.7 3.2 4.0 6.1 5.2 -0.3 7.5 2.7 Brazil Chile 6.0 5.6 4.6 4.6 3.7 -1.0 6.1 6.0 Chile Colombia 5.3 4.7 6.7 6.9 3.5 1.7 4.0 5.9 Colombia Costa Rica 4.3 5.9 8.8 7.9 2.7 -1.0 4.7 4.2 Costa Rica Cuba 5.8 11.2 12.1 7.3 4.1 1.4 2.4 2.7 Cuba Dominica 3.3 -0.5 4.4 6.0 7.7 -0.7 0.9 -0.3 Dominica Ecuador 8.2 5.3 4.4 2.2 6.4 1.0 3.3 8.0 Ecuador El Salvador 1.9 3.6 3.9 3.8 1.3 -3.1 1.4 1.5 El Salvador Granada -1.0 13.5 -3.9 5.9 1.0 -6.6 -0.0 1.0 Grenada Guatemala 3.2 3.3 5.4 6.3 3.3 0.5 2.9 3.9 Guatemala Guyana 1.6 -2.0 5.1 7.0 2.0 3.3 4.4 5.4 Guyana Haití -3.5 1.8 2.3 3.3 0.8 2.9 -5.4 5.6 Haiti Honduras 6.2 6.1 6.6 6.2 4.2 -2.1 2.8 3.6 Honduras Jamaica 1.3 0.9 2.9 1.4 -0.8 -3.5 -1.5 1.3 Jamaica México 4.1 3.3 5.1 3.4 1.2 -6.0 5.6 3.9 Mexico Nicaragua 5.3 4.3 4.2 5.0 2.9 -1.4 3.1 5.1 Nicaragua Panamá 7.5 7.2 8.5 12.1 10.1 3.9 7.5 10.8 Panama Paraguay 4.1 2.1 4.8 5.4 6.4 -4.0 13.1 4.4 Paraguay Perú 5.0 6.8 7.7 8.9 9.8 0.9 8.8 6.9 Peru República Dominicana 1.3 9.3 10.7 8.5 5.3 3.5 7.8 4.5 Dominican Republic Saint Kitts y Nevis 4.4 9.9 4.7 2.8 4.7 -6.9 -2.4 2.1 Saint Kitts and Nevis San Vicente y las Granadinas 4.2 2.5 7.7 3.4 1.4 -2.2 -2.8 0.1 Saint Vincent and the Grenadines Santa Lucía 8.4 -1.9 9.3 1.5 5.3 0.1 0.4 1.3 Saint Lucia Suriname 0.5 7.2 11.4 4.0 3.1 7.7 7.3 4.4 Suriname Trinidad y Tabago 8.0 5.4 14.4 4.6 2.3 -3.0 -0.0 -1.4 Trinidad and Tobago Uruguay 11.8 6.6 4.1 6.5 7.2 2.4 8.9 5.7 Uruguay Venezuela (República Bolivariana de) 18.3 10.3 9.9 8.8 5.3 -3.2 -1.5 4.2 Venezuela (Bolivarian Republic of) América Latina y el Caribe 5.8 4.6 5.6 5.6 4.0 -1.9 5.9 4.3 Latin America and the Caribbean América Latina 5.9 4.6 5.5 5.6 4.0 -1.9 6.0 4.3 Latin America El Caribe 3.7 3.5 7.7 3.2 0.8 -3.1 -0.1 0.4 The Caribbean

78 E
CLA
C, S
tatistical Yearbook for Latin A
merica and the C
aribbean, 2012 2.1 CUENTAS NACIONALES / NATIONAL ACCOUNTS 2.1.1 CUENTAS NACIONALES DE AMÉRICA LATINA Y EL CARIBE, EN DÓLARES / NATIONAL ACCOUNTS OF LATIN AMERICA AND THE CARIBBEAN, IN DOLLARS
2.1.1.2 AMÉRICA LATINA Y EL CARIBE: TASAS DE VARIACIÓN ANUAL DEL PRODUCTO INTERNO BRUTO POR HABITANTE LATIN AMERICA AND THE CARIBBEAN: ANNUAL GROWTH RATES OF PER CAPITA GROSS DOMESTIC PRODUCT
(Porcentajes / Percentages)
Países y regiones 2004 2005 2006 2007 2008 2009 2010 2011 Countries and regions
Antigua y Barbuda 3.5 4.8 12.2 8.4 -1.1 -12.8 -8.9 -6.0 Antigua and Barbuda Argentina 8.0 8.2 7.5 7.7 5.8 -0.0 8.2 7.9 Argentina Bahamas -0.6 1.9 1.0 -0.0 -3.7 -6.2 -1.1 0.4 Bahamas Barbados 1.2 3.8 5.5 1.5 -0.1 -3.9 0.0 0.2 Barbados Belice 2.3 0.8 2.4 -0.8 1.5 -2.0 0.7 0.3 Belize Bolivia (Estado Plurinacional de) 2.3 2.6 3.0 2.8 4.4 1.7 2.5 3.6 Bolivia (Plurinational State of) Brasil 4.5 2.0 2.9 5.1 4.2 -1.2 6.6 1.9 Brazil Chile 4.9 4.5 3.5 3.6 2.7 -2.0 5.1 5.0 Chile Colombia 3.7 3.1 5.1 5.3 2.0 0.2 2.6 4.5 Colombia Costa Rica 2.4 4.1 7.0 6.2 1.2 -2.5 3.2 2.8 Costa Rica Cuba 5.6 11.0 12.0 7.2 4.1 1.5 2.4 2.7 Cuba Dominica 3.4 -0.2 4.8 6.4 8.1 -0.3 1.2 -0.2 Dominica Ecuador 6.4 3.6 2.8 0.6 4.8 -0.4 1.8 6.5 Ecuador El Salvador 1.5 3.1 3.5 3.4 0.8 -3.6 0.8 0.9 El Salvador Granada -1.3 13.2 -4.1 5.6 0.7 -6.9 -0.4 0.6 Grenada Guatemala 0.6 0.7 2.8 3.7 0.8 -1.9 0.4 1.4 Guatemala Guyana 1.2 -2.3 4.8 6.8 1.8 3.1 4.2 5.2 Guyana Haití -4.9 0.4 0.9 2.0 -0.4 1.6 -6.6 4.3 Haiti Honduras 4.1 3.9 4.5 4.1 2.2 -4.0 0.8 1.6 Honduras Jamaica 0.6 0.3 2.3 1.0 -1.2 -3.8 -1.9 0.9 Jamaica México 2.8 2.0 3.8 2.1 0.0 -7.1 4.4 2.8 Mexico Nicaragua 4.0 2.9 2.8 3.7 1.6 -2.7 1.8 3.6 Nicaragua Panamá 5.6 5.3 6.7 10.2 8.3 2.2 5.8 9.1 Panama Paraguay 2.1 0.2 2.9 3.5 4.5 -5.6 11.2 2.6 Paraguay Perú 3.7 5.6 6.5 7.7 8.6 -0.2 7.6 5.7 Peru República Dominicana -0.2 7.7 9.1 7.0 3.8 2.1 6.3 3.1 Dominican Republic Saint Kitts y Nevis 3.0 8.5 3.3 1.4 3.4 -8.1 -3.6 0.9 Saint Kitts and Nevis San Vicente y las Granadinas 4.0 2.3 7.5 3.2 1.3 -2.3 -2.8 0.1 Saint Vincent and the Grenadines Santa Lucía 7.4 -2.9 8.2 0.4 4.2 -0.9 -0.6 0.3 Saint Lucia Suriname -0.8 5.9 10.1 2.9 2.1 6.7 6.3 3.5 Suriname Trinidad y Tabago 7.6 5.0 14.0 4.2 1.9 -3.4 -0.4 -1.7 Trinidad and Tobago Uruguay 11.7 6.5 3.9 6.3 6.8 2.1 8.5 5.4 Uruguay Venezuela (República Bolivariana de) 16.2 8.4 8.0 6.9 3.5 -4.8 -3.0 2.6 Venezuela (Bolivarian Republic of) América Latina y el Caribe 4.5 3.3 4.3 4.4 2.8 -3.0 4.8 3.2 Latin America and the Caribbean América Latina 4.5 3.3 4.3 4.4 2.8 -3.0 4.9 3.2 Latin America
El Caribe 3.0 2.9 7.0 2.6 0.2 -3.6 -0.6 -0.1 The Caribbean

CE
PA
L, Anuario E
stadístico de Am
érica Latina y el Caribe, 2012
79 2.1 CUENTAS NACIONALES / NATIONAL ACCOUNTS 2.1.1 CUENTAS NACIONALES DE AMÉRICA LATINA Y EL CARIBE, EN DÓLARES / NATIONAL ACCOUNTS OF LATIN AMERICA AND THE CARIBBEAN, IN DOLLARS
2.1.1.3 AMÉRICA LATINA Y EL CARIBE: PRODUCTO INTERNO BRUTO TOTAL, A PRECIOS CONSTANTES DE MERCADO LATIN AMERICA AND THE CARIBBEAN: GROSS DOMESTIC PRODUCT, AT CONSTANT MARKET PRICES
(Millones de dólares a precios constantes de 2005 / Millions of dollars at constant 2005 prices)
Países y regiones 2004 2005 2006 2007 2008 2009 2010 2011 Countries and regions
Antigua y Barbuda 944.2 1 002.0 1 137.6 1 247.2 1 247.6 1 099.6 1 012.7 961.6 Antigua and Barbuda Argentina 167 794.2 183 195.9 198 705.4 215 900.1 230 491.5 232 451.3 253 746.0 276 252.1 Argentina Bahamas 7 453.2 7 706.2 7 900.2 8 014.4 7 828.2 7 447.8 7 461.1 7 582.6 Bahamas Barbados 3 757.9 3 908.1 4 130.7 4 200.5 4 203.9 4 046.5 4 055.3 4 073.5 Barbados Belice 1 082.1 1 114.9 1 166.8 1 182.4 1 225.5 1 225.1 1 258.7 1 288.3 Belize Bolivia (Estado Plurinacional de) 9 144.8 9 549.1 10 007.2 10 464.0 11 107.3 11 480.2 11 954.0 12 572.5 Bolivia (Plurinational State of) Brasil 855 027.9 882 044.0 916 946.7 972 801.7 1 023 111.1 1 019 737.7 1 096 561.5 1 126 528.4 Brazil Chile 117 852.1 124 404.0 130 114.1 136 099.7 141 084.2 139 621.9 148 132.2 157 002.6 Chile Colombia 139 978.4 146 566.5 156 382.8 167 174.2 173 103.6 175 962.5 183 003.1 193 825.9 Colombia Costa Rica 18 855.0 19 964.9 21 717.8 23 441.1 24 081.5 23 836.9 24 952.4 25 999.0 Costa Rica Cuba 38 348.1 42 643.8 47 789.2 51 259.3 53 370.1 54 143.3 55 436.5 56 938.9 Cuba Dominica 363.3 361.6 377.6 400.1 430.8 427.9 432.0 430.7 Dominica Ecuador 39 421.2 41 507.1 43 334.9 44 283.9 47 099.1 47 585.0 49 141.2 53 064.4 Ecuador El Salvador 16 505.7 17 093.8 17 762.5 18 444.5 18 679.6 18 094.3 18 341.3 18 611.1 El Salvador Granada 617.1 700.5 673.5 713.4 720.7 673.1 672.8 679.4 Grenada Guatemala 26 352.2 27 211.2 28 675.1 30 482.8 31 483.0 31 648.6 32 569.6 33 839.4 Guatemala Guyana 1 341.6 1 315.4 1 382.9 1 480.0 1 509.3 1 559.3 1 627.5 1 716.0 Guyana Haití 4 080.8 4 154.3 4 247.9 4 389.9 4 426.9 4 554.3 4 307.7 4 548.5 Haiti Honduras 9 200.3 9 757.0 10 397.8 11 041.2 11 508.4 11 263.3 11 575.6 11 995.0 Honduras Jamaica 11 139.7 11 239.3 11 562.1 11 727.9 11 632.4 11 227.7 11 058.3 11 199.0 Jamaica México 819 260.4 846 094.1 888 896.1 918 793.7 929 982.6 874 207.4 923 077.2 959 175.2 Mexico Nicaragua 6 061.7 6 321.3 6 583.8 6 914.9 7 115.5 7 012.5 7 232.7 7 598.0 Nicaragua Panamá 14 427.2 15 464.7 16 783.5 18 816.4 20 720.2 21 519.2 23 122.8 25 631.4 Panama Paraguay 8 552.2 8 734.7 9 154.5 9 650.9 10 264.6 9 857.5 11 148.2 11 635.5 Paraguay Perú 74 315.6 79 388.9 85 534.0 93 119.6 102 209.3 103 139.3 112 194.9 119 972.3 Peru República Dominicana 30 698.8 33 542.3 37 121.7 40 267.6 42 383.9 43 847.9 47 246.6 49 364.7 Dominican Republic Saint Kitts y Nevis 488.3 536.4 561.5 577.0 604.0 562.4 548.8 560.6 Saint Kitts and Nevis San Vicente y las Granadinas 538.2 551.4 593.7 613.7 622.5 608.7 591.9 592.7 Saint Vincent and the Grenadines Santa Lucía 926.1 908.6 993.0 1 007.8 1 061.5 1 062.9 1 067.2 1 080.8 Saint Lucia Suriname 1 284.1 1 376.0 1 532.3 1 593.8 1 642.4 1 769.2 1 897.6 1 981.2 Suriname Trinidad y Tabago 15 166.5 15 982.4 18 285.2 19 130.7 19 569.6 18 982.0 18 977.5 18 717.3 Trinidad and Tobago Uruguay 16 284.2 17 362.9 18 074.5 19 256.8 20 638.7 21 137.7 23 017.9 24 330.0 Uruguay Venezuela (República Bolivariana de) 131 903.8 145 513.5 159 878.8 173 873.9 183 050.7 177 188.9 174 550.9 181 840.9 Venezuela (Bolivarian Republic of) América Latina y el Caribe 2 589 167.0 2 707 216.9 2 858 405.4 3 018 365.2 3 138 210.3 3 078 982.0 3 261 973.3 3 401 589.4 Latin America and the Caribbean América Latina 2 544 064.7 2 660 514.1 2 808 108.3 2 966 476.4 3 085 911.8 3 028 289.7 3 211 312.1 3 350 725.7 Latin America El Caribe 45 102.3 46 702.7 50 297.1 51 888.8 52 298.5 50 692.3 50 661.2 50 863.7 The Caribbean

80 E
CLA
C, S
tatistical Yearbook for Latin A
merica and the C
aribbean, 2012 2.1 CUENTAS NACIONALES / NATIONAL ACCOUNTS 2.1.1 CUENTAS NACIONALES DE AMÉRICA LATINA Y EL CARIBE, EN DÓLARES / NATIONAL ACCOUNTS OF LATIN AMERICA AND THE CARIBBEAN, IN DOLLARS
2.1.1.4 AMÉRICA LATINA Y EL CARIBE: PRODUCTO INTERNO BRUTO POR HABITANTE, A PRECIOS CONSTANTES DE MERCADO LATIN AMERICA AND THE CARIBBEAN: PER CAPITA GROSS DOMESTIC PRODUCT, AT CONSTANT MARKET PRICES
(Dólares a precios constantes de 2005 / Dollars at constant 2005 prices)
Países y regiones 2004 2005 2006 2007 2008 2009 2010 2011 Countries and regions
Antigua y Barbuda 11 398.6 11 940.2 13 391.4 14 512.8 14 359.4 12 523.9 11 415.4 10 730.5 Antigua and Barbuda Argentina 4 380.4 4 739.7 5 095.5 5 488.1 5 808.5 5 807.7 6 285.5 6 784.3 Argentina Bahamas 23 680.5 24 130.3 24 378.3 24 370.3 23 461.5 22 011.5 21 760.2 21 840.8 Bahamas Barbados 13 920.9 14 447.5 15 239.1 15 464.8 15 445.4 14 836.1 14 836.4 14 870.7 Barbados Belice 3 936.9 3 968.2 4 064.8 4 033.6 4 095.3 4 011.6 4 039.1 4 052.1 Belize Bolivia (Estado Plurinacional de) 1 011.1 1 037.0 1 068.0 1 098.1 1 146.8 1 166.6 1 196.1 1 239.0 Bolivia (Plurinational State of) Brasil 4 645.6 4 738.5 4 873.9 5 120.1 5 335.3 5 270.7 5 619.0 5 723.9 Brazil Chile 7 289.0 7 613.8 7 882.4 8 163.5 8 381.1 8 216.6 8 637.9 9 073.7 Chile Colombia 3 291.2 3 393.8 3 567.0 3 757.0 3 833.9 3 841.9 3 939.9 4 115.8 Colombia Costa Rica 4 441.1 4 621.2 4 943.4 5 250.5 5 311.2 5 179.5 5 344.7 5 492.2 Costa Rica Cuba 3 400.9 3 776.2 4 227.7 4 533.5 4 721.0 4 791.0 4 906.6 5 040.3 Cuba Dominica 5 258.7 5 246.3 5 497.0 5 847.0 6 320.6 6 300.4 6 375.4 6 364.8 Dominica Ecuador 2 977.2 3 085.0 3 171.0 3 191.4 3 344.1 3 330.2 3 391.3 3 612.7 Ecuador El Salvador 2 729.3 2 814.8 2 912.3 3 010.6 3 034.7 2 925.2 2 949.8 2 976.7 El Salvador Granada 6 023.2 6 818.7 6 536.2 6 901.3 6 948.5 6 465.8 6 439.0 6 476.8 Grenada Guatemala 2 130.5 2 146.3 2 206.6 2 288.6 2 306.3 2 262.4 2 272.2 2 303.9 Guatemala Guyana 1 803.9 1 762.8 1 848.0 1 973.2 2 008.1 2 070.8 2 157.1 2 269.7 Guyana Haití 447.0 448.6 452.4 461.4 459.4 466.6 435.8 454.4 Haiti Honduras 1 360.7 1 414.3 1 477.2 1 537.5 1 571.0 1 507.4 1 519.3 1 543.9 Honduras Jamaica 4 180.2 4 191.2 4 288.1 4 329.2 4 276.2 4 111.6 4 034.3 4 070.5 Jamaica México 7 829.1 7 987.0 8 289.9 8 465.9 8 467.7 7 867.9 8 215.1 8 444.1 Mexico Nicaragua 1 125.6 1 158.7 1 191.5 1 235.9 1 256.0 1 222.3 1 244.2 1 289.1 Nicaragua Panamá 4 593.5 4 837.8 5 160.3 5 687.8 6 159.7 6 293.8 6 656.3 7 265.0 Panama Paraguay 1 476.3 1 479.4 1 521.9 1 575.2 1 645.5 1 552.7 1 726.3 1 771.9 Paraguay Perú 2 711.9 2 863.2 3 049.9 3 284.7 3 567.5 3 562.1 3 832.9 4 052.4 Peru República Dominicana 3 368.8 3 627.7 3 957.7 4 233.0 4 394.3 4 484.9 4 769.0 4 918.8 Dominican Republic Saint Kitts y Nevis 10 058.1 10 908.6 11 272.1 11 435.3 11 820.1 10 866.7 10 473.4 10 566.8 Saint Kitts and Nevis San Vicente y las Granadinas 4 957.2 5 070.4 5 451.2 5 627.5 5 702.1 5 570.5 5 413.7 5 419.9 Saint Vincent and the Grenadines Santa Lucía 5 659.6 5 497.3 5 945.9 5 970.8 6 221.1 6 163.2 6 123.7 6 139.3 Saint Lucia Suriname 2 603.4 2 755.9 3 034.8 3 124.2 3 188.8 3 403.2 3 617.0 3 742.3 Suriname Trinidad y Tabago 11 572.0 12 150.3 13 848.1 14 430.9 14 702.5 14 204.4 14 146.9 13 902.3 Trinidad and Tobago Uruguay 4 904.3 5 221.4 5 424.5 5 763.9 6 158.4 6 286.5 6 823.7 7 189.8 Uruguay Venezuela (República Bolivariana de) 5 022.7 5 444.6 5 880.0 6 287.1 6 509.6 6 199.4 6 011.0 6 165.8 Venezuela (Bolivarian Republic of) América Latina y el Caribe 4 751.8 4 906.9 5 118.6 5 342.1 5 491.4 5 328.2 5 583.5 5 760.2 Latin America and the Caribbean América Latina 4 726.7 4 881.4 5 089.9 5 314.0 5 465.0 5 303.3 5 562.4 5 741.4 Latin America El Caribe 6 785.2 6 978.7 7 468.5 7 659.4 7 676.6 7 400.5 7 356.7 7 347.3 The Caribbean

CE
PA
L, Anuario E
stadístico de Am
érica Latina y el Caribe, 2012
81 2.1 CUENTAS NACIONALES / NATIONAL ACCOUNTS 2.1.1 CUENTAS NACIONALES DE AMÉRICA LATINA Y EL CARIBE, EN DÓLARES / NATIONAL ACCOUNTS OF LATIN AMERICA AND THE CARIBBEAN, IN DOLLARS
2.1.1.5 AMÉRICA LATINA Y EL CARIBE: PRODUCTO INTERNO BRUTO TOTAL, A PRECIOS CORRIENTES DE MERCADO LATIN AMERICA AND THE CARIBBEAN: GROSS DOMESTIC PRODUCT, AT CURRENT MARKET PRICES
(Millones de dólares / Millions of dollars)
Países y regiones 2004 2005 2006 2007 2008 2009 2010 2011 Countries and regions
Antigua y Barbuda 905.1 1 002.0 1 141.4 1 295.8 1 354.6 1 214.3 1 153.8 1 118.3 Antigua and Barbuda Argentina 153 129.5 183 195.9 214 267.4 262 450.8 328 468.7 308 739.7 370 263.5 448 165.3 Argentina Bahamas 7 094.4 7 706.2 7 965.6 8 319.0 8 246.7 7 717.1 7 771.3 7 787.5 Bahamas Barbados 3 494.6 3 908.1 4 196.6 4 483.2 4 343.7 4 396.7 4 245.2 4 313.0 Barbados Belice 1 056.3 1 114.9 1 213.0 1 276.8 1 358.7 1 343.7 1 392.8 1 449.1 Belize Bolivia (Estado Plurinacional de) 8 773.2 9 549.1 11 451.8 13 120.1 16 674.3 17 340.0 19 649.7 23 948.7 Bolivia (Plurinational State of) Brasil 663 732.8 882 044.0 1 089 252.7 1 366 852.6 1 653 535.1 1 620 163.7 2 143 034.3 2 476 651.2 Brazil Chile 100 630.9 124 404.0 154 412.4 172 868.5 179 626.7 172 590.6 216 308.9 248 585.2 Chile Colombia 117 081.7 146 566.5 162 590.1 207 416.7 243 982.6 232 900.7 286 398.2 333 160.5 Colombia Costa Rica 18 595.3 19 964.9 22 526.5 26 322.0 29 837.9 29 382.7 36 217.5 40 869.8 Costa Rica Cuba 38 203.0 42 643.8 52 743.0 58 603.6 60 806.0 62 078.6 64 328.2 68 233.9 Cuba Dominica 367.0 361.6 387.7 418.8 462.2 481.3 471.9 484.1 Dominica Ecuador 36 591.7 41 507.1 46 802.0 51 007.8 61 762.6 61 550.4 67 856.5 78 188.9 Ecuador El Salvador 15 798.3 17 093.8 18 550.7 20 104.9 21 431.0 20 661.0 21 427.9 23 054.1 El Salvador Granada 602.3 700.5 704.8 763.9 832.4 775.5 783.6 816.1 Grenada Guatemala 23 965.3 27 211.2 30 231.1 34 113.1 39 136.3 37 733.8 41 340.5 46 898.3 Guatemala Guyana 1 256.3 1 315.4 1 458.4 1 740.3 1 922.6 2 025.6 2 259.3 2 576.6 Guyana Haití 3 660.5 4 154.3 4 879.7 5 971.3 6 417.0 6 470.3 6 634.6 7 346.2 Haiti Honduras 8 871.0 9 757.0 10 917.5 12 361.3 13 881.7 14 175.7 15 400.3 17 446.7 Honduras Jamaica 10 173.2 11 239.3 11 927.7 12 795.6 13 751.8 12 150.5 13 230.7 14 457.4 Jamaica México 758 577.5 846 094.1 949 066.4 1 033 175.8 1 091 982.3 880 101.2 1 032 553.4 1 150 731.3 Mexico Nicaragua 5 792.9 6 321.3 6 786.3 7 446.6 8 221.7 8 062.2 8 427.0 9 317.3 Nicaragua Panamá 14 179.3 15 464.7 17 137.0 19 793.7 23 001.6 24 162.9 27 053.0 31 315.8 Panama Paraguay 8 033.9 8 734.7 10 646.2 13 795.0 18 503.4 15 933.7 20 047.5 25 543.6 Paraguay Perú 69 700.9 79 388.9 92 319.0 107 523.9 129 107.2 130 143.8 157 437.6 180 759.9 Peru República Dominicana 21 582.2 33 542.3 35 660.4 41 013.1 45 522.9 46 597.6 51 576.2 55 433.3 Dominican Republic Saint Kitts y Nevis 497.5 536.4 629.5 689.5 740.1 688.7 673.2 697.3 Saint Kitts and Nevis San Vicente y las Granadinas 522.5 551.4 611.0 684.7 699.1 672.3 674.8 688.0 Saint Vincent and the Grenadines Santa Lucía 858.3 908.6 1 018.1 1 132.4 1 174.9 1 173.9 1 208.8 1 219.1 Saint Lucia Suriname 1 113.6 1 376.0 1 610.5 1 850.2 2 305.3 2 178.7 2 432.1 2 511.0 Suriname Trinidad y Tabago 13 280.4 15 982.4 18 369.1 21 642.2 27 870.1 19 661.8 20 854.9 22 448.7 Trinidad and Tobago Uruguay 13 811.3 17 362.9 19 579.5 23 410.6 30 366.2 30 497.0 39 412.0 46 709.8 Uruguay Venezuela (República Bolivariana de) 112 451.6 145 513.5 183 477.5 230 364.0 315 600.2 329 419.0 239 620.4 316 482.2 Venezuela (Bolivarian Republic of) América Latina y el Caribe 2 234 384.1 2 707 216.9 3 184 530.7 3 764 807.5 4 382 927.5 4 103 184.5 4 922 139.5 5 689 408.2 Latin America and the Caribbean América Latina 2 193 162.6 2 660 514.1 3 133 297.3 3 707 715.2 4 317 865.4 4 048 704.6 4 864 987.2 5 628 842.0 Latin America El Caribe 41 221.5 46 702.7 51 233.4 57 092.3 65 062.1 54 479.9 57 152.3 60 566.2 The Caribbean
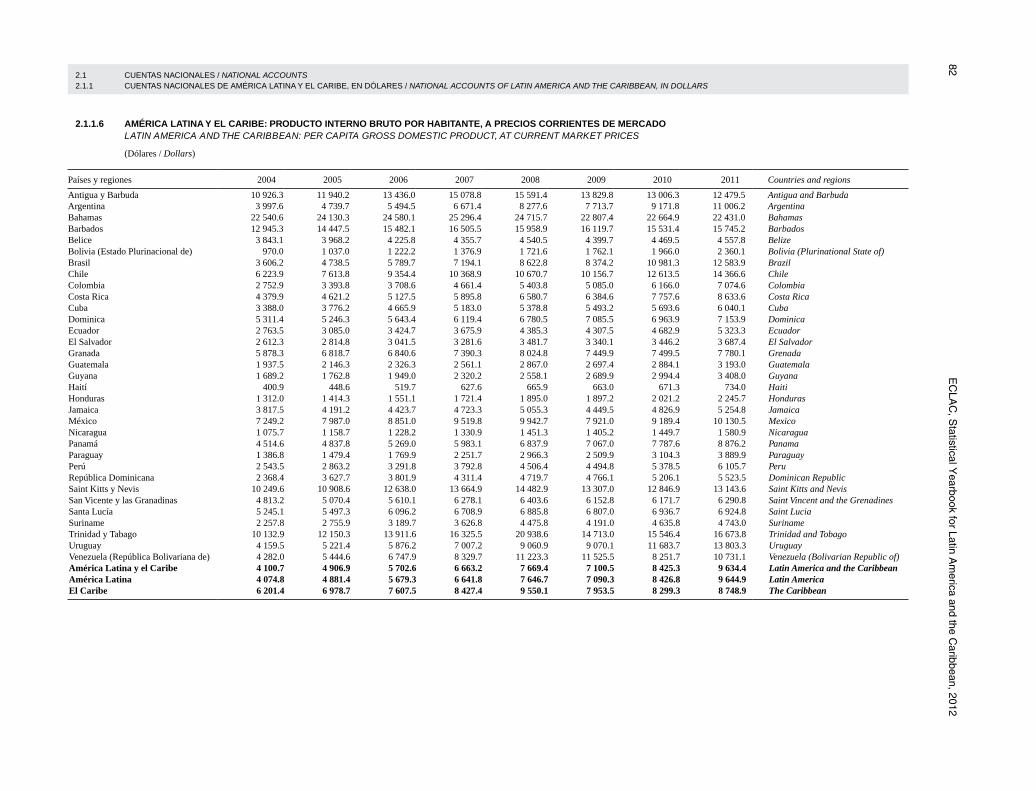
82 E
CLA
C, S
tatistical Yearbook for Latin A
merica and the C
aribbean, 2012 2.1 CUENTAS NACIONALES / NATIONAL ACCOUNTS 2.1.1 CUENTAS NACIONALES DE AMÉRICA LATINA Y EL CARIBE, EN DÓLARES / NATIONAL ACCOUNTS OF LATIN AMERICA AND THE CARIBBEAN, IN DOLLARS
2.1.1.6 AMÉRICA LATINA Y EL CARIBE: PRODUCTO INTERNO BRUTO POR HABITANTE, A PRECIOS CORRIENTES DE MERCADO LATIN AMERICA AND THE CARIBBEAN: PER CAPITA GROSS DOMESTIC PRODUCT, AT CURRENT MARKET PRICES
(Dólares / Dollars)
Países y regiones 2004 2005 2006 2007 2008 2009 2010 2011 Countries and regions
Antigua y Barbuda 10 926.3 11 940.2 13 436.0 15 078.8 15 591.4 13 829.8 13 006.3 12 479.5 Antigua and Barbuda Argentina 3 997.6 4 739.7 5 494.5 6 671.4 8 277.6 7 713.7 9 171.8 11 006.2 Argentina Bahamas 22 540.6 24 130.3 24 580.1 25 296.4 24 715.7 22 807.4 22 664.9 22 431.0 Bahamas Barbados 12 945.3 14 447.5 15 482.1 16 505.5 15 958.9 16 119.7 15 531.4 15 745.2 Barbados Belice 3 843.1 3 968.2 4 225.8 4 355.7 4 540.5 4 399.7 4 469.5 4 557.8 Belize Bolivia (Estado Plurinacional de) 970.0 1 037.0 1 222.2 1 376.9 1 721.6 1 762.1 1 966.0 2 360.1 Bolivia (Plurinational State of) Brasil 3 606.2 4 738.5 5 789.7 7 194.1 8 622.8 8 374.2 10 981.3 12 583.9 Brazil Chile 6 223.9 7 613.8 9 354.4 10 368.9 10 670.7 10 156.7 12 613.5 14 366.6 Chile Colombia 2 752.9 3 393.8 3 708.6 4 661.4 5 403.8 5 085.0 6 166.0 7 074.6 Colombia Costa Rica 4 379.9 4 621.2 5 127.5 5 895.8 6 580.7 6 384.6 7 757.6 8 633.6 Costa Rica Cuba 3 388.0 3 776.2 4 665.9 5 183.0 5 378.8 5 493.2 5 693.6 6 040.1 Cuba Dominica 5 311.4 5 246.3 5 643.4 6 119.4 6 780.5 7 085.5 6 963.9 7 153.9 Dominica Ecuador 2 763.5 3 085.0 3 424.7 3 675.9 4 385.3 4 307.5 4 682.9 5 323.3 Ecuador El Salvador 2 612.3 2 814.8 3 041.5 3 281.6 3 481.7 3 340.1 3 446.2 3 687.4 El Salvador Granada 5 878.3 6 818.7 6 840.6 7 390.3 8 024.8 7 449.9 7 499.5 7 780.1 Grenada Guatemala 1 937.5 2 146.3 2 326.3 2 561.1 2 867.0 2 697.4 2 884.1 3 193.0 Guatemala Guyana 1 689.2 1 762.8 1 949.0 2 320.2 2 558.1 2 689.9 2 994.4 3 408.0 Guyana Haití 400.9 448.6 519.7 627.6 665.9 663.0 671.3 734.0 Haiti Honduras 1 312.0 1 414.3 1 551.1 1 721.4 1 895.0 1 897.2 2 021.2 2 245.7 Honduras Jamaica 3 817.5 4 191.2 4 423.7 4 723.3 5 055.3 4 449.5 4 826.9 5 254.8 Jamaica México 7 249.2 7 987.0 8 851.0 9 519.8 9 942.7 7 921.0 9 189.4 10 130.5 Mexico Nicaragua 1 075.7 1 158.7 1 228.2 1 330.9 1 451.3 1 405.2 1 449.7 1 580.9 Nicaragua Panamá 4 514.6 4 837.8 5 269.0 5 983.1 6 837.9 7 067.0 7 787.6 8 876.2 Panama Paraguay 1 386.8 1 479.4 1 769.9 2 251.7 2 966.3 2 509.9 3 104.3 3 889.9 Paraguay Perú 2 543.5 2 863.2 3 291.8 3 792.8 4 506.4 4 494.8 5 378.5 6 105.7 Peru República Dominicana 2 368.4 3 627.7 3 801.9 4 311.4 4 719.7 4 766.1 5 206.1 5 523.5 Dominican Republic Saint Kitts y Nevis 10 249.6 10 908.6 12 638.0 13 664.9 14 482.9 13 307.0 12 846.9 13 143.6 Saint Kitts and Nevis San Vicente y las Granadinas 4 813.2 5 070.4 5 610.1 6 278.1 6 403.6 6 152.8 6 171.7 6 290.8 Saint Vincent and the Grenadines Santa Lucía 5 245.1 5 497.3 6 096.2 6 708.9 6 885.8 6 807.0 6 936.7 6 924.8 Saint Lucia Suriname 2 257.8 2 755.9 3 189.7 3 626.8 4 475.8 4 191.0 4 635.8 4 743.0 Suriname Trinidad y Tabago 10 132.9 12 150.3 13 911.6 16 325.5 20 938.6 14 713.0 15 546.4 16 673.8 Trinidad and Tobago Uruguay 4 159.5 5 221.4 5 876.2 7 007.2 9 060.9 9 070.1 11 683.7 13 803.3 Uruguay Venezuela (República Bolivariana de) 4 282.0 5 444.6 6 747.9 8 329.7 11 223.3 11 525.5 8 251.7 10 731.1 Venezuela (Bolivarian Republic of) América Latina y el Caribe 4 100.7 4 906.9 5 702.6 6 663.2 7 669.4 7 100.5 8 425.3 9 634.4 Latin America and the Caribbean América Latina 4 074.8 4 881.4 5 679.3 6 641.8 7 646.7 7 090.3 8 426.8 9 644.9 Latin America El Caribe 6 201.4 6 978.7 7 607.5 8 427.4 9 550.1 7 953.5 8 299.3 8 748.9 The Caribbean
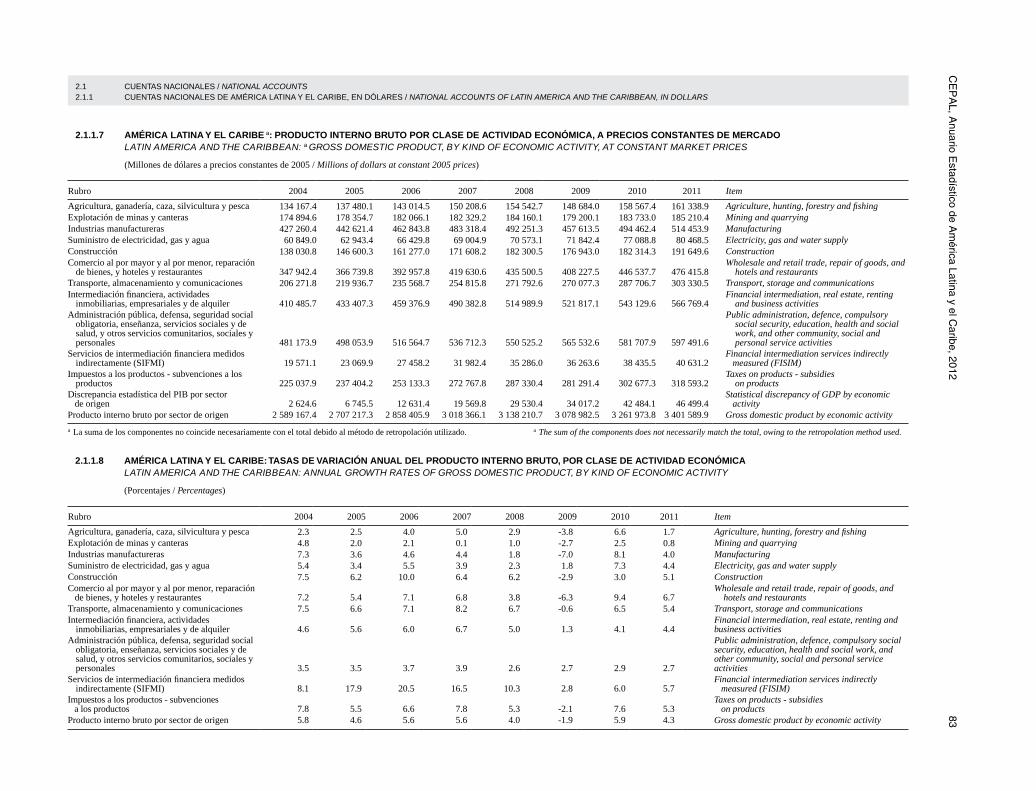
CE
PA
L, Anuario E
stadístico de Am
érica Latina y el Caribe, 2012
83
a La suma de los componentes no coincide necesariamente con el total debido al método de retropolación utilizado. a The sum of the components does not necessarily match the total, owing to the retropolation method used.
2.1 CUENTAS NACIONALES / NATIONAL ACCOUNTS 2.1.1 CUENTAS NACIONALES DE AMÉRICA LATINA Y EL CARIBE, EN DÓLARES / NATIONAL ACCOUNTS OF LATIN AMERICA AND THE CARIBBEAN, IN DOLLARS
2.1.1.7 AMÉRICA LATINA Y EL CARIBE a: PRODUCTO INTERNO BRUTO POR CLASE DE ACTIVIDAD ECONÓMICA, A PRECIOS CONSTANTES DE MERCADO LATIN AMERICA AND THE CARIBBEAN: a GROSS DOMESTIC PRODUCT, BY KIND OF ECONOMIC ACTIVITY, AT CONSTANT MARKET PRICES
(Millones de dólares a precios constantes de 2005 / Millions of dollars at constant 2005 prices)
Rubro 2004 2005 2006 2007 2008 2009 2010 2011 Item
Agricultura, ganadería, caza, silvicultura y pesca 134 167.4 137 480.1 143 014.5 150 208.6 154 542.7 148 684.0 158 567.4 161 338.9 Agriculture, hunting, forestry and fishing Explotación de minas y canteras 174 894.6 178 354.7 182 066.1 182 329.2 184 160.1 179 200.1 183 733.0 185 210.4 Mining and quarrying Industrias manufactureras 427 260.4 442 621.4 462 843.8 483 318.4 492 251.3 457 613.5 494 462.4 514 453.9 Manufacturing Suministro de electricidad, gas y agua 60 849.0 62 943.4 66 429.8 69 004.9 70 573.1 71 842.4 77 088.8 80 468.5 Electricity, gas and water supply Construcción 138 030.8 146 600.3 161 277.0 171 608.2 182 300.5 176 943.0 182 314.3 191 649.6 Construction Comercio al por mayor y al por menor, reparación
de bienes, y hoteles y restaurantes 347 942.4 366 739.8 392 957.8 419 630.6 435 500.5 408 227.5 446 537.7 476 415.8Wholesale and retail trade, repair of goods, and
hotels and restaurants Transporte, almacenamiento y comunicaciones 206 271.8 219 936.7 235 568.7 254 815.8 271 792.6 270 077.3 287 706.7 303 330.5 Transport, storage and communications Intermediación financiera, actividades
inmobiliarias, empresariales y de alquiler 410 485.7 433 407.3 459 376.9 490 382.8 514 989.9 521 817.1 543 129.6 566 769.4Financial intermediation, real estate, renting
and business activities Administración pública, defensa, seguridad social
obligatoria, enseñanza, servicios sociales y de salud, y otros servicios comunitarios, sociales y personales 481 173.9 498 053.9 516 564.7 536 712.3 550 525.2 565 532.6 581 707.9 597 491.6
Public administration, defence, compulsory social security, education, health and social work, and other community, social and personal service activities
Servicios de intermediación financiera medidos indirectamente (SIFMI) 19 571.1 23 069.9 27 458.2 31 982.4 35 286.0 36 263.6 38 435.5 40 631.2
Financial intermediation services indirectly measured (FISIM)
Impuestos a los productos - subvenciones a los productos 225 037.9 237 404.2 253 133.3 272 767.8 287 330.4 281 291.4 302 677.3 318 593.2
Taxes on products - subsidies on products
Discrepancia estadística del PIB por sector de origen 2 624.6 6 745.5 12 631.4 19 569.8 29 530.4 34 017.2 42 484.1 46 499.4
Statistical discrepancy of GDP by economic activity
Producto interno bruto por sector de origen 2 589 167.4 2 707 217.3 2 858 405.9 3 018 366.1 3 138 210.7 3 078 982.5 3 261 973.8 3 401 589.9 Gross domestic product by economic activity
2.1.1.8 AMÉRICA LATINA Y EL CARIBE: TASAS DE VARIACIÓN ANUAL DEL PRODUCTO INTERNO BRUTO, POR CLASE DE ACTIVIDAD ECONÓMICA LATIN AMERICA AND THE CARIBBEAN: ANNUAL GROWTH RATES OF GROSS DOMESTIC PRODUCT, BY KIND OF ECONOMIC ACTIVITY
(Porcentajes / Percentages)
Rubro 2004 2005 2006 2007 2008 2009 2010 2011 Item
Agricultura, ganadería, caza, silvicultura y pesca 2.3 2.5 4.0 5.0 2.9 -3.8 6.6 1.7 Agriculture, hunting, forestry and fishing Explotación de minas y canteras 4.8 2.0 2.1 0.1 1.0 -2.7 2.5 0.8 Mining and quarrying Industrias manufactureras 7.3 3.6 4.6 4.4 1.8 -7.0 8.1 4.0 Manufacturing Suministro de electricidad, gas y agua 5.4 3.4 5.5 3.9 2.3 1.8 7.3 4.4 Electricity, gas and water supply Construcción 7.5 6.2 10.0 6.4 6.2 -2.9 3.0 5.1 Construction Comercio al por mayor y al por menor, reparación de bienes, y hoteles y restaurantes 7.2 5.4 7.1 6.8 3.8 -6.3 9.4 6.7
Wholesale and retail trade, repair of goods, and hotels and restaurants
Transporte, almacenamiento y comunicaciones 7.5 6.6 7.1 8.2 6.7 -0.6 6.5 5.4 Transport, storage and communications Intermediación financiera, actividades
inmobiliarias, empresariales y de alquiler 4.6 5.6 6.0 6.7 5.0 1.3 4.1 4.4Financial intermediation, real estate, renting and business activities
Administración pública, defensa, seguridad social obligatoria, enseñanza, servicios sociales y de salud, y otros servicios comunitarios, sociales y personales 3.5 3.5 3.7 3.9 2.6 2.7 2.9 2.7
Public administration, defence, compulsory social security, education, health and social work, and other community, social and personal service activities
Servicios de intermediación financiera medidos indirectamente (SIFMI) 8.1 17.9 20.5 16.5 10.3 2.8 6.0 5.7
Financial intermediation services indirectly measured (FISIM)
Impuestos a los productos - subvenciones a los productos 7.8 5.5 6.6 7.8 5.3 -2.1 7.6 5.3
Taxes on products - subsidies on products
Producto interno bruto por sector de origen 5.8 4.6 5.6 5.6 4.0 -1.9 5.9 4.3 Gross domestic product by economic activity

84 E
CLA
C, S
tatistical Yearbook for Latin A
merica and the C
aribbean, 2012
a La suma de los componentes no coincide necesariamente con el total debido al método de retropolación utilizado. a The sum of the components does not necessarily match the total, owing to the retropolation method used.
2.1 CUENTAS NACIONALES / NATIONAL ACCOUNTS 2.1.1 CUENTAS NACIONALES DE AMÉRICA LATINA Y EL CARIBE, EN DÓLARES / NATIONAL ACCOUNTS OF LATIN AMERICA AND THE CARIBBEAN, IN DOLLARS
2.1.1.9 AMÉRICA LATINA a: PRODUCTO INTERNO BRUTO POR CLASE DE ACTIVIDAD ECONÓMICA, A PRECIOS CONSTANTES DE MERCADO LATIN AMERICA: a GROSS DOMESTIC PRODUCT, BY KIND OF ECONOMIC ACTIVITY, AT CONSTANT MARKET PRICES
(Millones de dólares a precios constantes de 2005 / Millions of dollars at constant 2005 prices)
Rubro 2004 2005 2006 2007 2008 2009 2010 2011 Item
Agricultura, ganadería, caza, silvicultura y pesca 132 491.1 135 939.3 141 356.5 148 621.5 152 986.0 147 047.3 156 886.8 159 577.0 Agriculture, hunting, forestry and fishing Explotación de minas y canteras 167 159.2 170 194.8 172 110.9 172 188.8 174 030.2 169 046.6 173 401.9 174 809.1 Mining and quarrying Industrias manufactureras 424 368.5 439 624.9 459 678.6 480 049.5 488 975.3 454 391.5 491 245.8 511 201.1 Manufacturing Suministro de electricidad, gas y agua 59 901.0 61 955.9 65 401.0 67 943.7 69 475.8 70 728.2 75 962.6 79 344.8 Electricity, gas and water supply Construcción 135 078.9 143 202.1 157 649.9 168 064.4 178 625.4 173 552.0 179 297.0 188 712.6 Construction Comercio al por mayor y al por menor, reparación
de bienes, y hoteles y restaurantes 340 047.7 358 450.9 384 066.6 410 346.7 426 037.9 399 559.1 438 044.5 467 844.4Wholesale and retail trade, repair of goods, and
hotels and restaurants Transporte, almacenamiento y comunicaciones 202 536.2 216 018.5 231 497.9 250 655.9 267 591.9 265 947.6 283 698.1 299 306.4 Transport, storage and communications Intermediación financiera, actividades inmobiliarias,
empresariales y de alquiler 402 353.7 425 154.8 451 011.1 481 408.8 505 921.3 513 025.0 534 145.8 557 664.1Financial intermediation, real estate, renting and
business activities Administración pública, defensa, seguridad social
obligatoria, enseñanza, servicios sociales y de salud, y otros servicios comunitarios, sociales y personales 474 465.3 491 301.9 509 742.7 529 696.7 543 469.9 558 483.6 574 581.9 590 333.8
Public administration, defence, compulsory social security, education, health and social work, and other community, social and personal service activities
Servicios de intermediación financiera medidos indirectamente (SIFMI) 18 052.2 21 533.1 25 891.5 30 281.1 33 533.4 34 564.0 36 753.2 38 914.5
Financial intermediation services indirectly measured (FISIM)
Impuestos a los productos - subvenciones a los productos 223 261.2 235 661.4 251 020.4 270 538.4 285 108.3 279 305.3 300 578.4 316 627.6
Taxes on products - subsidies on products
Discrepancia estadística del PIB por sector de origen 454.5 4 543.3 10 464.6 17 244.0 27 223.6 31 767.9 40 223.0 44 219.8 Statistical discrepancy of GDP by economic activity Producto interno bruto por sector de origen 2 544 065.1 2 660 514.6 2 808 108.7 2 966 477.2 3 085 912.2 3 028 290.2 3 211 312.6 3 350 726.2 Gross domestic product by economic activity
2.1.1.10 AMÉRICA LATINA: TASAS DE VARIACIÓN ANUAL DEL PRODUCTO INTERNO BRUTO, POR CLASE DE ACTIVIDAD ECONÓMICA LATIN AMERICA: ANNUAL GROWTH RATES OF GROSS DOMESTIC PRODUCT, BY KIND OF ECONOMIC ACTIVITY
(Porcentajes / Percentages)
Rubro 2004 2005 2006 2007 2008 2009 2010 2011 Item
Agricultura, ganadería, caza, silvicultura y pesca 2.4 2.6 4.0 5.1 2.9 -3.9 6.7 1.7 Agriculture, hunting, forestry and fishing Explotación de minas y canteras 4.7 1.8 1.1 0.0 1.1 -2.9 2.6 0.8 Mining and quarrying Industrias manufactureras 7.3 3.6 4.6 4.4 1.9 -7.1 8.1 4.1 Manufacturing Suministro de electricidad, gas y agua 5.5 3.4 5.6 3.9 2.3 1.8 7.4 4.5 Electricity, gas and water supply Construcción 7.6 6.0 10.1 6.6 6.3 -2.8 3.3 5.3 Construction Comercio al por mayor y al por menor, reparación
de bienes, y hoteles y restaurantes 7.4 5.4 7.1 6.8 3.8 -6.2 9.6 6.8Wholesale and retail trade, repair of goods, and
hotels and restaurants Transporte, almacenamiento y comunicaciones 7.6 6.7 7.2 8.3 6.8 -0.6 6.7 5.5 Transport, storage and communications Intermediación financiera, actividades inmobiliarias,
empresariales y de alquiler 4.6 5.7 6.1 6.7 5.1 1.4 4.1 4.4Financial intermediation, real estate, renting and
business activities Administración pública, defensa, seguridad social
obligatoria, enseñanza, servicios sociales y de salud, y otros servicios comunitarios, sociales y personales 3.6 3.5 3.8 3.9 2.6 2.8 2.9 2.7
Public administration, defence, compulsory social security, education, health and social work, and other community, social and personal service activities
Servicios de intermediación financiera medidos indirectamente (SIFMI) 8.1 19.3 21.8 17.0 10.7 3.1 6.3 5.9
Financial intermediation services indirectly measured (FISIM)
Impuestos a los productos - subvenciones a los productos 7.8 5.6 6.5 7.8 5.4 -2.0 7.6 5.3
Taxes on products - subsidies on products
Producto interno bruto por sector de origen 5.9 4.6 5.5 5.6 4.0 -1.9 6.0 4.3 Gross domestic product by economic activity

CE
PA
L, Anuario E
stadístico de Am
érica Latina y el Caribe, 2012
85
a La suma de los componentes no coincide necesariamente con el total debido al método de retropolación utilizado. a The sum of the components does not necessarily match the total, owing to the retropolation method used.
2.1 CUENTAS NACIONALES / NATIONAL ACCOUNTS 2.1.1 CUENTAS NACIONALES DE AMÉRICA LATINA Y EL CARIBE, EN DÓLARES / NATIONAL ACCOUNTS OF LATIN AMERICA AND THE CARIBBEAN, IN DOLLARS
2.1.1.11 EL CARIBE a: PRODUCTO INTERNO BRUTO POR CLASE DE ACTIVIDAD ECONÓMICA, A PRECIOS CONSTANTES DE MERCADO THE CARIBBEAN: a GROSS DOMESTIC PRODUCT, BY KIND OF ECONOMIC ACTIVITY, AT CONSTANT MARKET PRICES
(Millones de dólares a precios constantes de 2005 / Millions of dollars at constant 2005 prices)
Rubro 2004 2005 2006 2007 2008 2009 2010 2011 Item
Agricultura, ganadería, caza, silvicultura y pesca 1 676.3 1 540.8 1 658.1 1 587.1 1 556.7 1 636.7 1 680.6 1 761.9 Agriculture, hunting, forestry and fishing Explotación de minas y canteras 7 735.3 8 159.9 9 955.1 10 140.3 10 129.9 10 153.5 10 331.1 10 401.2 Mining and quarrying Industrias manufactureras 2 891.9 2 996.5 3 165.2 3 268.8 3 276.0 3 221.9 3 216.6 3 252.8 Manufacturing Suministro de electricidad, gas y agua 948.0 987.5 1 028.8 1 061.2 1 097.3 1 114.3 1 126.1 1 123.7 Electricity, gas and water supply Construcción 2 951.9 3 398.2 3 627.0 3 543.8 3 675.1 3 391.0 3 017.3 2 937.0 Construction Comercio al por mayor y al por menor, reparación
de bienes, y hoteles y restaurantes 7 894.7 8 289.0 8 891.2 9 283.9 9 462.6 8 668.4 8 493.2 8 571.3Wholesale and retail trade, repair of goods, and hotels
and restaurants Transporte, almacenamiento y comunicaciones 3 735.5 3 918.1 4 070.8 4 160.0 4 200.8 4 129.7 4 008.7 4 024.2 Transport, storage and communications Intermediación financiera, actividades inmobiliarias,
empresariales y de alquiler 8 132.0 8 252.5 8 365.8 8 974.0 9 068.7 8 792.1 8 983.8 9 105.3Financial intermediation, real estate, renting and
business activities Administración pública, defensa, seguridad social
obligatoria, enseñanza, servicios sociales y de salud, y otros servicios comunitarios, sociales y personales 6 708.6 6 752.0 6 822.1 7 015.7 7 055.3 7 049.0 7 126.0 7 157.8
Public administration, defence, compulsory social security, education, health and social work, and other community, social and personal service activities
Servicios de intermediación financiera medidos indirectamente (SIFMI) 1 518.9 1 536.8 1 566.7 1 701.3 1 752.6 1 699.6 1 682.3 1 716.8
Financial intermediation services indirectly measured (FISIM)
Impuestos a los productos - subvenciones a los productos 1 776.7 1 742.8 2 112.9 2 229.5 2 222.0 1 986.0 2 098.9 1 965.6
Taxes on products - subsidies on products
Discrepancia estadística del PIB por sector de origen 2 170.1 2 202.2 2 166.8 2 325.9 2 306.7 2 249.4 2 261.1 2 279.6 Statistical discrepancy of GDP by economic activity Producto interno bruto por sector de origen 45 102.3 46 702.8 50 297.2 51 888.8 52 298.5 50 692.3 50 661.3 50 863.7 Gross domestic product by economic activity
2.1.1.12 EL CARIBE: TASAS DE VARIACIÓN DEL PRODUCTO INTERNO BRUTO, POR CLASE DE ACTIVIDAD ECONÓMICA THE CARIBBEAN: GROWTH RATES OF GROSS DOMESTIC PRODUCT, BY KIND OF ECONOMIC ACTIVITY
(Porcentajes / Percentages)
Rubro 2004 2005 2006 2007 2008 2009 2010 2011 Item
Agricultura, ganadería, caza, silvicultura y pesca -7.0 -8.1 7.6 -4.3 -1.9 5.1 2.7 4.8 Agriculture, hunting, forestry and fishing Explotación de minas y canteras 7.8 5.5 22.0 1.9 -0.1 0.2 1.7 0.7 Mining and quarrying Industrias manufactureras 5.5 3.6 5.6 3.3 0.2 -1.7 -0.2 1.1 Manufacturing Suministro de electricidad, gas y agua 2.5 4.2 4.2 3.1 3.4 1.5 1.1 -0.2 Electricity, gas and water supply Construcción 3.6 15.1 6.7 -2.3 3.7 -7.7 -11.0 -2.7 Construction Comercio al por mayor y al por menor, reparación
de bienes, y hoteles y restaurantes 1.7 5.0 7.3 4.4 1.9 -8.4 -2.0 0.9Wholesale and retail trade, repair of goods, and hotels
and restaurants Transporte, almacenamiento y comunicaciones 2.6 4.9 3.9 2.2 1.0 -1.7 -2.9 0.4 Transport, storage and communications Intermediación financiera, actividades inmobiliarias,
empresariales y de alquiler 6.9 1.5 1.4 7.3 1.1 -3.0 2.2 1.4Financial intermediation, real estate, renting and
business activities Administración pública, defensa, seguridad social
obligatoria, enseñanza, servicios sociales y de salud, y otros servicios comunitarios, sociales y personales 2.7 0.6 1.0 2.8 0.6 -0.1 1.1 0.4
Public administration, defence, compulsory social security, education, health and social work, and other community, social and personal service activities
Servicios de intermediación financiera medidos indirectamente (SIFMI) 7.2 1.2 1.9 8.6 3.0 -3.0 -1.0 2.0
Financial intermediation services indirectly measured (FISIM)
Impuestos a los productos - subvenciones a los productos 10.4 -1.9 21.2 5.5 -0.3 -10.6 5.7 -6.3
Taxes on products - subsidies on products
Producto interno bruto por sector de origen 3.7 3.5 7.7 3.2 0.8 -3.1 -0.1 0.4 Gross domestic product by economic activity

86 E
CLA
C, S
tatistical Yearbook for Latin A
merica and the C
aribbean, 2012
a La suma de los componentes no coincide necesariamente con el total debido al método de retropolación utilizado. a The sum of the components does not necessarily match the total, owing to the retropolation method used.
2.1 CUENTAS NACIONALES / NATIONAL ACCOUNTS 2.1.1 CUENTAS NACIONALES DE AMÉRICA LATINA Y EL CARIBE, EN DÓLARES / NATIONAL ACCOUNTS OF LATIN AMERICA AND THE CARIBBEAN, IN DOLLARS
2.1.1.23 AMÉRICA LATINA Y EL CARIBE a: PRODUCTO INTERNO BRUTO POR CLASE DE ACTIVIDAD ECONÓMICA, A PRECIOS CORRIENTES DE MERCADO LATIN AMERICA AND THE CARIBBEAN: a GROSS DOMESTIC PRODUCT, BY KIND OF ECONOMIC ACTIVITY, AT CURRENT MARKET PRICES (Millones de dólares / Millions of dollars)
Rubro 2004 2005 2006 2007 2008 2009 2010 2011 Item
Agricultura, ganadería, caza, silvicultura y pesca 125 027.4 137 480.1 154 225.5 187 182.7 227 519.9 211 718.1 251 194.2 264 001.3 Agriculture, hunting, forestry and fishing Explotación de minas y canteras 133 989.6 178 354.7 238 171.5 266 263.1 336 862.3 224 209.4 316 645.5 316 308.9 Mining and quarrying Industrias manufactureras 380 303.2 442 621.4 508 720.1 587 421.1 668 913.5 619 791.6 726 188.0 729 323.0 Manufacturing Suministro de electricidad, gas y agua 51 382.7 62 943.4 73 059.6 84 873.5 91 640.8 84 595.3 104 901.6 109 718.7 Electricity, gas and water supply Construcción 120 547.3 146 600.3 178 558.2 215 517.5 258 353.3 250 690.5 283 373.9 288 916.8 Construction Comercio al por mayor y al por menor,
reparación de bienes, y hoteles y restaurantes 306 202.3 366 739.8 427 415.7 509 140.0 596 091.8 556 376.7 656 013.9 660 889.8Wholesale and retail trade, repair of goods, and
hotels and restaurants Transporte, almacenamiento y comunicaciones 179 474.9 219 936.7 253 325.8 299 370.6 341 172.9 317 277.8 373 428.1 379 173.3 Transport, storage and communications Intermediación financiera, actividades
inmobiliarias, empresariales y de alquiler 352 275.3 433 407.3 495 428.3 586 354.1 653 822.2 632 177.4 738 262.7 776 419.4Financial intermediation, real estate, renting and
business activities Administración pública, defensa, seguridad
social obligatoria, enseñanza, servicios sociales y de salud, y otros servicios comunitarios, sociales y personales 404 936.5 498 053.9 593 806.7 711 232.5 836 620.5 850 507.4 1 007 404.3 1 059 863.6
Public administration, defence, compulsory social security, education, health and social work, and other community, social and personal service activities
Servicios de intermediación financiera medidos indirectamente (SIFMI) 15 006.6 23 138.5 27 913.8 34 186.6 38 588.8 35 860.2 38 187.5 35 658.8
Financial intermediation services indirectly measured (FISIM)
Impuestos a los productos - subvenciones a los productos 192 008.9 239 583.3 282 561.0 343 443.2 404 110.9 384 068.3 491 887.6 532 577.4
Taxes on products - subsidies on products
Discrepancia estadística del PIB por sector de origen 3 242.8 4 634.9 7 171.5 8 195.6 6 409.0 7 638.6 10 569.2 613 175.9
Statistical discrepancy of GDP by economic activity
Producto interno bruto por sector de origen 2 234 384.4 2 707 217.3 3 184 530.0 3 764 807.2 4 382 928.4 4 103 190.8 4 921 681.6 5 694 709.3 Gross domestic product by economic activity
a La suma de los componentes no coincide necesariamente con el total debido al método de retropolación utilizado. a The sum of the components does not necessarily match the total, owing to the retropolation method used.
2.1.1.24 AMÉRICA LATINA a: PRODUCTO INTERNO BRUTO POR CLASE DE ACTIVIDAD ECONÓMICA, A PRECIOS CORRIENTES DE MERCADO LATIN AMERICA: a GROSS DOMESTIC PRODUCT, BY KIND OF ECONOMIC ACTIVITY, AT CURRENT MARKET PRICES (Millones de dólares / Millions of dollars)
Rubro 2004 2005 2006 2007 2008 2009 2010 2011 Item
Agricultura, ganadería, caza, silvicultura y pesca 123 547.7 135 939.3 152 538.0 185 535.3 225 646.0 209 972.1 249 570.5 262 212.4 Agriculture, hunting, forestry and fishing Explotación de minas y canteras 128 087.9 170 194.8 228 627.2 255 467.0 321 754.6 216 174.4 306 895.5 305 381.6 Mining and quarrying Industrias manufactureras 377 292.7 439 624.9 505 385.2 583 799.3 665 031.3 616 473.9 723 459.1 726 311.6 Manufacturing Suministro de electricidad, gas y agua 50 461.7 61 955.9 72 033.5 83 706.3 90 394.7 83 412.1 103 726.1 108 474.4 Electricity, gas and water supply Construcción 117 805.9 143 202.1 174 693.5 211 233.6 253 389.1 246 245.0 279 652.2 285 225.7 Construction Comercio al por mayor y al por menor, reparación de bienes, y hoteles y restaurantes 298 839.4 358 450.9 418 260.9 499 174.9 585 151.5 546 820.5 646 583.0 651 160.6
Wholesale and retail trade, repair of goods, and hotels and restaurants
Transporte, almacenamiento y comunicaciones 175 888.2 216 018.5 249 476.1 294 751.0 336 594.1 313 055.6 369 362.4 375 011.0 Transport, storage and communications Intermediación financiera, actividades inmobiliarias, empresariales y de alquiler 344 630.0 425 154.8 486 610.6 576 445.6 643 463.7 622 658.5 728 750.1 766 492.2
Financial intermediation, real estate, renting and business activities
Administración pública, defensa, seguridad social obligatoria, enseñanza, servicios sociales y de salud, y otros servicios comunitarios, sociales y personales 398 592.4 491 301.9 586 592.6 703 206.7 827 530.0 841 873.7 998 860.2 1 050 747.6
Public administration, defence, compulsory social security, education, health and social work, and other community, social and personal service activities
Servicios de intermediación financiera medidos indirectamente (SIFMI) 13 536.7 21 533.1 26 156.4 32 163.4 36 289.7 33 699.2 35 982.8 33 386.9
Financial intermediation services indirectly measured (FISIM)
Impuestos a los productos - subvenciones a los productos 188 320.8 235 661.4 278 078.6 338 414.3 398 785.1 379 409.3 486 913.6 527 328.8
Taxes on products - subsidies on products
Discrepancia estadística del PIB por sector de origen 3 232.9 4 543.3 7 156.8 8 144.5 6 415.9 6 308.8 6 734.0 609 184.1
Statistical discrepancy of GDP by economic activity
Producto interno bruto por sector de origen 2 193 162.9 2 660 514.6 3 133 296.6 3 707 715.0 4 317 866.2 4 048 704.6 4 864 523.9 5 634 143.1 Gross domestic product by economic activity

CE
PA
L, Anuario E
stadístico de Am
érica Latina y el Caribe, 2012
87
a La suma de los componentes no coincide necesariamente con el total debido al método de retropolación utilizado. a The sum of the components does not necessarily match the total, owing to the retropolation method used.
2.1 CUENTAS NACIONALES / NATIONAL ACCOUNTS 2.1.1 CUENTAS NACIONALES DE AMÉRICA LATINA Y EL CARIBE, EN DÓLARES / NATIONAL ACCOUNTS OF LATIN AMERICA AND THE CARIBBEAN, IN DOLLARS
2.1.1.25 EL CARIBE a: PRODUCTO INTERNO BRUTO POR CLASE DE ACTIVIDAD ECONÓMICA, A PRECIOS CORRIENTES DE MERCADO THE CARIBBEAN a: GROSS DOMESTIC PRODUCT, BY KIND OF ECONOMIC ACTIVITY, AT CURRENT MARKET PRICES
(Millones de dólares / Millions of dollars)
Rubro 2004 2005 2006 2007 2008 2009 2010 2011 Item
Agricultura, ganadería, caza, silvicultura y pesca 1 479.7 1 540.8 1 687.5 1 647.4 1 874.0 1 746.0 1 623.8 1 788.9 Agriculture, hunting, forestry and fishing Explotación de minas y canteras 5 901.6 8 159.9 9 544.3 10 796.1 15 107.7 8 035.1 9 750.0 10 927.3 Mining and quarrying Industrias manufactureras 3 010.6 2 996.5 3 334.9 3 621.7 3 882.1 3 317.8 2 728.8 3 011.4 Manufacturing Suministro de electricidad, gas y agua 921.0 987.5 1 026.1 1 167.2 1 246.1 1 183.2 1 175.5 1 244.3 Electricity, gas and water supply Construcción 2 741.4 3 398.2 3 864.7 4 283.9 4 964.2 4 445.5 3 721.7 3 691.1 Construction Comercio al por mayor y al por menor, reparación de
bienes, y hoteles y restaurantes 7 362.9 8 289.0 9 154.8 9 965.1 10 940.3 9 556.2 9 430.9 9 729.2Wholesale and retail trade, repair of goods, and
hotels and restaurants Transporte, almacenamiento y comunicaciones 3 586.7 3 918.1 3 849.6 4 619.6 4 578.7 4 222.3 4 065.7 4 162.3 Transport, storage and communications Intermediación financiera, actividades inmobiliarias,
empresariales y de alquiler 7 645.3 8 252.5 8 817.7 9 908.5 10 358.6 9 519.0 9 512.6 9 927.2Financial intermediation, real estate, renting and
business activities Administración pública, defensa, seguridad social
obligatoria, enseñanza, servicios sociales y de salud, y otros servicios comunitarios, sociales y personales 6 344.1 6 752.0 7 214.1 8 025.8 9 090.5 8 633.7 8 544.1 9 116.0
Public administration, defence, compulsory social security, education, health and social work, and other community, social and personal service activities
Servicios de intermediación financiera medidos indirectamente (SIFMI) 1 469.9 1 605.4 1 757.4 2 023.2 2 299.1 2 161.0 2 204.7 2 271.9
Financial intermediation services indirectly measured (FISIM)
Impuestos a los productos - subvenciones a los productos 3 688.1 3 922.0 4 482.4 5 028.9 5 325.8 4 659.0 4 974.0 5 248.6
Taxes on products - subsidies on products
Discrepancia estadística del PIB por sector de origen 9.9 91.6 14.6 51.1 -6.9 1 329.8 3 835.2 3 991.8 Statistical discrepancy of GDP by economic activity Producto interno bruto por sector de origen 41 221.5 46 702.8 51 233.4 57 092.2 65 062.1 54 486.3 57 157.7 60 566.2 Gross domestic product by economic activity

88 E
CLA
C, S
tatistical Yearbook for Latin A
merica and the C
aribbean, 2012
a La suma de los componentes no coincide necesariamente con el total debido al método de retropolación utilizado.
a La suma de los componentes no coincide necesariamente con el total debido al método de retropolación utilizado.
a The sum of the components does not necessarily match the total, owing to the retropolation method used.
a The sum of the components does not necessarily match the total, owing to the retropolation method used.
2.1 CUENTAS NACIONALES / NATIONAL ACCOUNTS 2.1.1 CUENTAS NACIONALES DE AMÉRICA LATINA Y EL CARIBE, EN DÓLARES / NATIONAL ACCOUNTS OF LATIN AMERICA AND THE CARIBBEAN, IN DOLLARS
2.1.1.36 AMÉRICA LATINA a: PRODUCTO INTERNO BRUTO POR TIPO DE GASTO, A PRECIOS CONSTANTES DE MERCADO LATIN AMERICA: a GROSS DOMESTIC PRODUCT, BY TYPE OF EXPENDITURE, AT CONSTANT MARKET PRICES
(Millones de dólares a precios constantes de 2005 / Millions of dollars at constant 2005 prices)
Rubro 2004 2005 2006 2007 2008 2009 2010 2011 Item
Gasto de consumo final 1 963 052.3 2 065 844.4 2 182 703.3 2 314 113.5 2 406 835.9 2 406 352.5 2 545 501.5 2 617 640.3 Final consumption expenditure Formación bruta de capital 499 269.2 537 381.3 598 396.6 666 084.9 727 931.7 636 904.9 732 768.7 787 084.1 Gross capital formation Exportaciones de bienes y servicios 596 973.1 644 130.3 687 371.8 725 580.4 737 977.7 668 791.1 746 104.8 778 421.6 Exports of goods and services Importaciones de bienes y servicios 527 749.1 587 067.3 671 919.5 759 295.0 820 073.3 698 327.2 857 388.9 933 866.2 Imports of goods and services Discrepancia estadística 12 519.2 225.5 11 556.1 19 992.5 33 239.8 14 568.4 44 325.9 101 445.9 Statistical discrepancy Producto interno bruto por sector de origen 2 544 064.7 2 660 514.1 2 808 108.3 2 966 476.4 3 085 911.8 3 028 289.7 3 211 312.1 3 350 725.7 Gross domestic product by economic activity
2.1.1.37 AMÉRICA LATINA: TASAS DE VARIACIÓN ANUAL DEL PRODUCTO INTERNO BRUTO POR TIPO DE GASTO, A PRECIOS CONSTANTES DE MERCADO LATIN AMERICA: ANNUAL GROWTH RATES OF GROSS DOMESTIC PRODUCT, BY TYPE OF EXPENDITURE, AT CONSTANT MARKET PRICES
(Porcentajes / Percentages)
Rubro 2004 2005 2006 2007 2008 2009 2010 2011 Item
Gasto de consumo final 4.9 5.2 5.7 6.0 4.0 -0.0 5.8 4.8 Final consumption expenditure Formación bruta de capital 11.2 7.6 11.4 11.3 9.3 -12.5 15.1 8.3 Gross capital formation Exportaciones de bienes y servicios 12.5 7.9 6.7 5.6 1.7 -9.4 11.6 6.3 Exports of goods and services Importaciones de bienes y servicios 14.2 11.2 14.5 13.0 8.0 -14.8 22.8 10.4 Imports of goods and services Discrepancia estadística -7.4 -98.2 -203.9 72.6 66.3 -56.2 204.3 1.1 Statistical discrepancy Producto interno bruto por sector de origen 5.9 4.6 5.5 5.6 4.0 -1.9 6.0 4.3 Gross domestic product by economic activity
2.1.1.48 AMÉRICA LATINA a: PRODUCTO INTERNO BRUTO POR TIPO DE GASTO, A PRECIOS CORRIENTES DE MERCADO LATIN AMERICA: a GROSS DOMESTIC PRODUCT, BY TYPE OF EXPENDITURE, AT CURRENT MARKET PRICES
(Millones de dólares / Millions of dollars)
Rubro 2004 2005 2006 2007 2008 2009 2010 2011 Item
Gasto de consumo final 1 702 815.8 2 065 844.4 2 396 304.5 2 843 516.5 3 304 480.3 3 226 073.7 3 812 541.1 4 327 260.9 Final consumption expenditure Formación bruta de capital 448 856.2 537 381.3 669 630.1 828 645.9 1 020 555.6 827 517.6 1 055 771.4 1 237 751.2 Gross capital formation Exportaciones de bienes y servicios 535 499.5 644 130.3 760 409.3 862 216.1 994 754.2 794 431.8 1 000 427.3 1 210 321.0 Exports of goods and services Importaciones de bienes y servicios 494 214.9 587 067.3 694 118.8 827 846.0 1 001 924.8 799 318.6 1 003 777.7 1 215 423.7 Imports of goods and services Discrepancia estadística 206.0 225.5 1 072.1 1 182.7 0.1 0.0 25.1 68 932.6 Statistical discrepancy Producto interno bruto por sector de origen 2 193 162.6 2 660 514.1 3 133 297.3 3 707 715.2 4 317 865.4 4 048 704.6 4 864 987.2 5 628 842.0 Gross domestic product by economic activity

CE
PA
L, Anuario E
stadístico de Am
érica Latina y el Caribe, 2012
89 2.1 CUENTAS NACIONALES / NATIONAL ACCOUNTS 2.1.1 CUENTAS NACIONALES DE AMÉRICA LATINA Y EL CARIBE, EN DÓLARES / NATIONAL ACCOUNTS OF LATIN AMERICA AND THE CARIBBEAN, IN DOLLARS
2.1.1.59 AMÉRICA LATINA Y EL CARIBE: INGRESO NACIONAL BRUTO DISPONIBLE, A PRECIOS CONSTANTES LATIN AMERICA AND THE CARIBBEAN: DISPOSABLE GROSS NATIONAL INCOME, AT CONSTANT PRICES
(Millones de dólares a precios constantes de 2005/ Millions of dollars al constant 2005 prices)
Países y regiones 2004 2005 2006 2007 2008 2009 2010 2011 Countries and regions
Antigua y Barbuda ... ... ... ... ... ... ... ... Antigua and Barbuda Argentina 159 545.1 176 375.4 195 757.6 215 634.7 235 847.3 231 792.4 253 673.9 281 118.9 Argentina Bahamas ... ... ... ... ... ... ... ... Bahamas Barbados ... ... ... ... ... ... ... ... Barbados Belice ... ... ... ... ... ... ... ... Belize Bolivia (Estado Plurinacional de) 9 091.6 9 756.8 11 163.8 11 989.5 12 939.1 12 868.7 13 738.8 15 048.1 Bolivia (Plurinational State of) Brasil 832 238.3 859 634.3 903 896.9 965 398.7 1 019 308.2 1 012 409.7 1 111 432.0 1 158 095.8 Brazil Chile 106 065.0 115 821.0 129 513.5 137 971.1 140 033.8 138 307.4 159 666.3 169 789.8 Chile Colombia 137 425.9 145 187.7 156 181.5 168 060.3 176 049.5 174 227.5 183 475.6 197 956.2 Colombia Costa Rica 18 844.3 20 026.8 21 819.1 22 838.4 23 563.6 23 074.4 24 487.6 25 334.2 Costa Rica Cuba 38 013.6 41 643.4 48 057.2 50 576.6 ... ... ... ... Cuba Dominica ... ... ... ... ... ... ... ... Dominica Ecuador 38 552.5 42 353.1 45 442.5 46 655.8 51 183.1 49 689.3 52 555.3 58 151.3 Ecuador El Salvador 18 697.8 19 638.3 20 640.0 21 354.6 21 306.3 20 666.1 20 683.4 20 843.8 El Salvador Granada ... ... ... ... ... ... ... ... Grenada Guatemala 29 286.4 30 302.9 31 984.2 33 808.1 34 364.4 34 870.5 35 662.9 36 513.3 Guatemala Guyana ... ... ... ... ... ... ... ... Guyana Haití 5 131.7 5 409.1 5 540.5 5 775.7 5 512.5 5 853.5 6 756.6 6 323.7 Haiti Honduras 10 042.1 11 192.5 11 947.7 12 698.4 12 751.9 12 837.4 13 201.7 13 835.5 Honduras Jamaica ... ... ... ... ... ... ... ... Jamaica México 823 863.4 853 193.5 898 333.7 929 582.7 943 753.4 861 398.8 927 573.6 978 176.3 Mexico Nicaragua 6 644.9 6 979.4 7 278.6 7 626.5 7 683.8 7 844.0 8 040.4 8 344.7 Nicaragua Panamá 13 804.3 14 580.8 15 499.5 17 832.6 18 867.0 19 902.2 21 056.3 23 194.6 Panama Paraguay 8 825.5 8 900.6 9 437.1 10 126.5 11 219.8 10 726.4 11 983.1 13 086.4 Paraguay Perú 70 711.2 76 096.1 85 386.4 94 223.9 101 259.8 100 933.2 112 453.9 122 997.7 Peru República Dominicana 31 512.2 34 337.2 37 981.5 41 084.2 43 044.8 45 290.0 48 147.6 49 378.1 Dominican Republic Saint Kitts y Nevis ... ... ... ... ... ... ... ... Saint Kitts and Nevis San Vicente y las Granadinas ... ... ... ... ... ... ... ... Saint Vincent and the Grenadines Santa Lucía ... ... ... ... ... ... ... ... Saint Lucia Suriname ... ... ... ... ... ... ... ... Suriname Trinidad y Tabago ... ... ... ... ... ... ... ... Trinidad and Tobago Uruguay 16 092.2 17 012.5 17 697.3 18 863.1 20 195.2 20 736.2 22 683.0 24 230.2 Uruguay Venezuela (República Bolivariana de) 114 995.7 143 249.5 169 349.5 191 523.4 214 640.1 182 841.7 186 515.4 207 489.5 Venezuela (Bolivarian Republic of) América Latina y el Caribe ... ... ... ... ... ... ... ... Latin America and the Caribbean América Latina 2 489 383.7 2 631 691.1 2 822 908.0 3 003 624.8 3 093 523.7 2 966 269.6 3 213 787.4 3 409 908.1 Latin America El Caribe ... ... ... ... ... ... ... ... The Caribbean
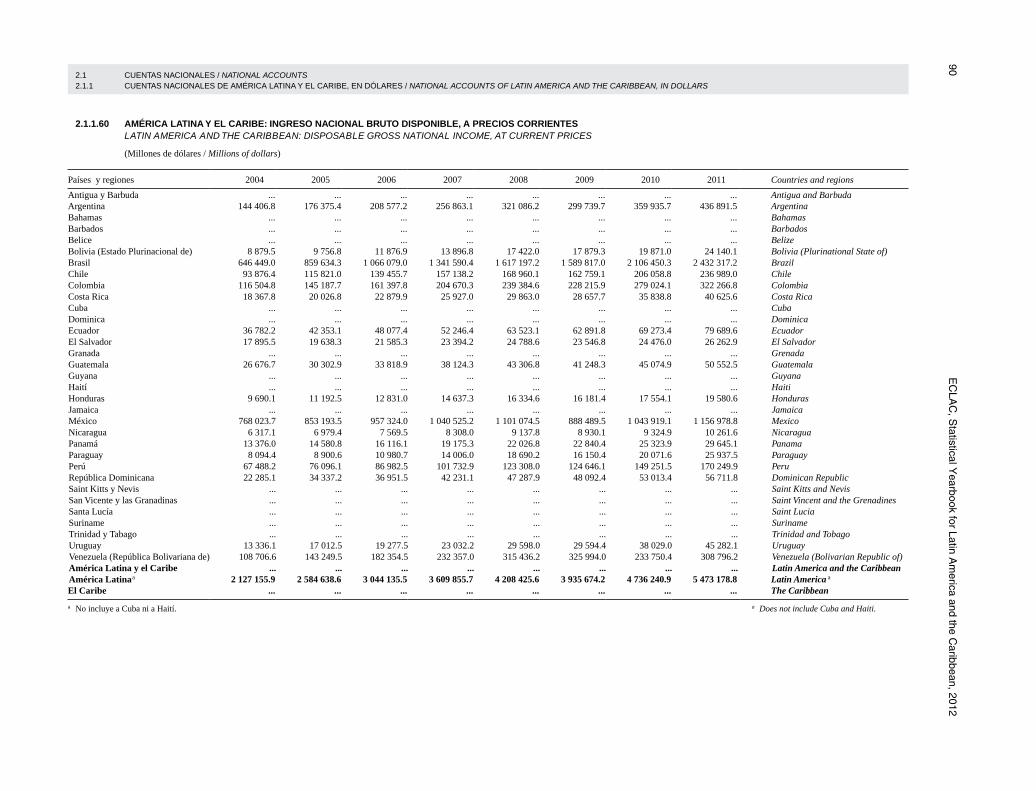
90 E
CLA
C, S
tatistical Yearbook for Latin A
merica and the C
aribbean, 2012 2.1 CUENTAS NACIONALES / NATIONAL ACCOUNTS 2.1.1 CUENTAS NACIONALES DE AMÉRICA LATINA Y EL CARIBE, EN DÓLARES / NATIONAL ACCOUNTS OF LATIN AMERICA AND THE CARIBBEAN, IN DOLLARS
2.1.1.60 AMÉRICA LATINA Y EL CARIBE: INGRESO NACIONAL BRUTO DISPONIBLE, A PRECIOS CORRIENTES LATIN AMERICA AND THE CARIBBEAN: DISPOSABLE GROSS NATIONAL INCOME, AT CURRENT PRICES
(Millones de dólares / Millions of dollars)
Países y regiones 2004 2005 2006 2007 2008 2009 2010 2011 Countries and regions
Antigua y Barbuda ... ... ... ... ... ... ... ... Antigua and Barbuda Argentina 144 406.8 176 375.4 208 577.2 256 863.1 321 086.2 299 739.7 359 935.7 436 891.5 Argentina Bahamas ... ... ... ... ... ... ... ... Bahamas Barbados ... ... ... ... ... ... ... ... Barbados Belice ... ... ... ... ... ... ... ... Belize Bolivia (Estado Plurinacional de) 8 879.5 9 756.8 11 876.9 13 896.8 17 422.0 17 879.3 19 871.0 24 140.1 Bolivia (Plurinational State of) Brasil 646 449.0 859 634.3 1 066 079.0 1 341 590.4 1 617 197.2 1 589 817.0 2 106 450.3 2 432 317.2 Brazil Chile 93 876.4 115 821.0 139 455.7 157 138.2 168 960.1 162 759.1 206 058.8 236 989.0 Chile Colombia 116 504.8 145 187.7 161 397.8 204 670.3 239 384.6 228 215.9 279 024.1 322 266.8 Colombia Costa Rica 18 367.8 20 026.8 22 879.9 25 927.0 29 863.0 28 657.7 35 838.8 40 625.6 Costa Rica Cuba ... ... ... ... ... ... ... ... Cuba Dominica ... ... ... ... ... ... ... ... Dominica Ecuador 36 782.2 42 353.1 48 077.4 52 246.4 63 523.1 62 891.8 69 273.4 79 689.6 Ecuador El Salvador 17 895.5 19 638.3 21 585.3 23 394.2 24 788.6 23 546.8 24 476.0 26 262.9 El Salvador Granada ... ... ... ... ... ... ... ... Grenada Guatemala 26 676.7 30 302.9 33 818.9 38 124.3 43 306.8 41 248.3 45 074.9 50 552.5 Guatemala Guyana ... ... ... ... ... ... ... ... Guyana Haití ... ... ... ... ... ... ... ... Haiti Honduras 9 690.1 11 192.5 12 831.0 14 637.3 16 334.6 16 181.4 17 554.1 19 580.6 Honduras Jamaica ... ... ... ... ... ... ... ... Jamaica México 768 023.7 853 193.5 957 324.0 1 040 525.2 1 101 074.5 888 489.5 1 043 919.1 1 156 978.8 Mexico Nicaragua 6 317.1 6 979.4 7 569.5 8 308.0 9 137.8 8 930.1 9 324.9 10 261.6 Nicaragua Panamá 13 376.0 14 580.8 16 116.1 19 175.3 22 026.8 22 840.4 25 323.9 29 645.1 Panama Paraguay 8 094.4 8 900.6 10 980.7 14 006.0 18 690.2 16 150.4 20 071.6 25 937.5 Paraguay Perú 67 488.2 76 096.1 86 982.5 101 732.9 123 308.0 124 646.1 149 251.5 170 249.9 Peru República Dominicana 22 285.1 34 337.2 36 951.5 42 231.1 47 287.9 48 092.4 53 013.4 56 711.8 Dominican Republic Saint Kitts y Nevis ... ... ... ... ... ... ... ... Saint Kitts and Nevis San Vicente y las Granadinas ... ... ... ... ... ... ... ... Saint Vincent and the Grenadines Santa Lucía ... ... ... ... ... ... ... ... Saint Lucia Suriname ... ... ... ... ... ... ... ... Suriname Trinidad y Tabago ... ... ... ... ... ... ... ... Trinidad and Tobago Uruguay 13 336.1 17 012.5 19 277.5 23 032.2 29 598.0 29 594.4 38 029.0 45 282.1 Uruguay Venezuela (República Bolivariana de) 108 706.6 143 249.5 182 354.5 232 357.0 315 436.2 325 994.0 233 750.4 308 796.2 Venezuela (Bolivarian Republic of) América Latina y el Caribe ... ... ... ... ... ... ... ... Latin America and the Caribbean América Latina a 2 127 155.9 2 584 638.6 3 044 135.5 3 609 855.7 4 208 425.6 3 935 674.2 4 736 240.9 5 473 178.8 Latin America a
El Caribe ... ... ... ... ... ... ... ... The Caribbean
a No incluye a Cuba ni a Haití. a Does not include Cuba and Haiti.

CE
PA
L, Anuario E
stadístico de Am
érica Latina y el Caribe, 2012
91 2.1 CUENTAS NACIONALES / NATIONAL ACCOUNTS 2.1.1 CUENTAS NACIONALES DE AMÉRICA LATINA Y EL CARIBE, EN DÓLARES / NATIONAL ACCOUNTS OF LATIN AMERICA AND THE CARIBBEAN, IN DOLLARS
2.1.1.63 AMÉRICA LATINA Y EL CARIBE: AHORRO NACIONAL, A PRECIOS CORRIENTES LATIN AMERICA AND THE CARIBBEAN: NATIONAL SAVING, AT CURRENT PRICES
(Millones de dólares / Millions of dollars)
Países y regiones 2004 2005 2006 2007 2008 2009 2010 2011 Countries and regions
Antigua y Barbuda ... ... ... ... ... ... ... ... Antigua and Barbuda Argentina 31 872.6 43 512.6 57 112.2 70 901.4 89 263.3 73 915.4 93 360.2 116 908.0 Argentina Bahamas ... ... ... ... ... ... ... ... Bahamas Barbados ... ... ... ... ... ... ... ... Barbados Belice ... ... ... ... ... ... ... ... Belize Bolivia (Estado Plurinacional de) 1 291.5 1 922.4 2 881.0 3 498.7 4 918.1 3 688.6 4 310.4 5 222.0 Bolivia (Plurinational State of) Brasil 125 292.7 156 926.4 196 156.1 252 062.3 313 997.6 264 703.1 386 448.1 436 069.0 Brazil Chile 23 339.9 30 294.5 38 969.9 43 502.8 40 829.3 38 396.7 54 207.6 58 047.1 Chile Colombia 21 851.0 27 751.5 33 437.6 41 784.4 50 605.3 47 303.0 54 385.7 68 168.9 Colombia Costa Rica 3 509.6 3 879.8 4 928.3 4 846.0 5 441.7 4 210.5 5 996.1 6 244.3 Costa Rica Cuba ... ... ... ... ... ... ... ... Cuba Dominica ... ... ... ... ... ... ... ... Dominica Ecuador 6 912.0 9 455.4 12 250.7 13 271.4 18 035.3 15 564.0 16 850.7 22 067.7 Ecuador El Salvador 1 917.8 2 127.5 2 356.4 2 062.8 1 725.5 2 463.4 2 276.6 2 205.9 El Salvador Granada ... ... ... ... ... ... ... ... Grenada Guatemala 3 831.4 4 129.7 4 771.3 5 320.2 4 738.8 4 932.9 5 126.3 4 941.3 Guatemala Guyana ... ... ... ... ... ... ... ... Guyana Haití ... ... ... ... ... ... ... ... Haiti Honduras 1 953.2 2 404.9 2 690.3 3 045.3 2 878.6 2 255.9 2 699.7 3 212.8 Honduras Jamaica ... ... ... ... ... ... ... ... Jamaica México 182 449.4 198 300.0 241 597.2 262 662.4 276 418.7 201 354.1 243 704.1 276 286.0 Mexico Nicaragua 709.3 852.7 950.8 975.4 713.9 1 092.8 1 063.7 1 122.9 Nicaragua Panamá 1 648.7 1 817.2 2 872.2 3 215.3 3 842.6 6 006.6 4 045.0 4 645.4 Panama Paraguay 1 479.3 1 502.4 1 952.4 2 352.7 2 716.6 2 265.2 2 599.4 3 936.7 Paraguay Perú 12 571.4 15 361.4 21 415.6 26 195.7 29 885.9 28 299.6 38 080.2 45 525.3 Peru República Dominicana 4 260.2 5 064.7 5 275.9 5 594.4 3 816.0 4 576.7 4 167.3 4 610.5 Dominican Republic Saint Kitts y Nevis ... ... ... ... ... ... ... ... Saint Kitts and Nevis San Vicente y las Granadinas ... ... ... ... ... ... ... ... Saint Vincent and the Grenadines Santa Lucía ... ... ... ... ... ... ... ... Saint Lucia Suriname ... ... ... ... ... ... ... ... Suriname Trinidad y Tabago ... ... ... ... ... ... ... ... Trinidad and Tobago Uruguay 2 554.2 3 115.3 3 418.4 4 350.7 5 318.4 5 573.3 6 574.9 7 748.1 Uruguay Venezuela (República Bolivariana de) 40 031.7 58 921.0 75 857.7 87 237.5 118 938.3 91 015.0 64 719.6 97 635.0 Venezuela (Bolivarian Republic of) América Latina y el Caribe ... ... ... ... ... ... ... ... Latin America and the Caribbean América Latina a 467 476.0 567 339.3 708 893.9 832 879.3 974 083.9 797 616.8 990 615.7 1 164 596.9 Latin America a
El Caribe ... ... ... ... ... ... ... ... The Caribbean
a No incluye a Cuba ni a Haití. a Does not include Cuba and Haiti.

92 E
CLA
C, S
tatistical Yearbook for Latin A
merica and the C
aribbean, 2012 2.1 CUENTAS NACIONALES / NATIONAL ACCOUNTS 2.1.1 CUENTAS NACIONALES DE AMÉRICA LATINA Y EL CARIBE, EN DÓLARES / NATIONAL ACCOUNTS OF LATIN AMERICA AND THE CARIBBEAN, IN DOLLARS
2.1.1.64 AMÉRICA LATINA a: FINANCIAMIENTO DE LA FORMACIÓN INTERNA BRUTA DE CAPITAL, A PRECIOS CORRIENTES LATIN AMERICA: a FINANCING OF GROSS DOMESTIC CAPITAL FORMATION, AT CURRENT PRICES
(Millones de dólares / Millions of dollars)
Rubro 2004 2005 2006 2007 2008 2009 2010 2011 Item
Ahorro interno 491 619.2 596 416.8 740 432.9 866 164.0 1 016 300.7 842 098.4 1 048 399.1 1 244 680.0 Domestic saving Pagos netos de factores al resto del mundo -66 342.0 -79 016.9 -91 955.8 -96 174.3 -105 395.7 -98 244.2 -113 715.2 -137 203.6 Net factor payments to the rest of the world Transferencias corrientes netas 42 198.8 49 939.4 60 416.8 62 889.6 63 179.0 53 762.7 55 931.8 57 120.5 Net current transfers Ahorro nacional 467 476.0 567 339.3 708 893.9 832 879.3 974 083.9 797 616.8 990 615.7 1 164 596.9 National saving Ahorro externo -22 982.8 -35 691.8 -46 881.7 -12 020.5 35 594.7 21 167.6 56 793.1 71 097.7 External savingFormación bruta de capital 444 493.2 531 647.5 662 012.2 820 858.8 1 009 678.6 818 784.4 1 047 408.7 1 235 694.6 Gross capital formation
a No incluye a Cuba ni a Haití. a Does not include Cuba and Haiti.
2.1.1.64 AMÉRICA LATINA a: FINANCIAMIENTO DE LA FORMACIÓN INTERNA BRUTA DE CAPITAL, A PRECIOS CORRIENTES LATIN AMERICA: a FINANCING OF GROSS DOMESTIC CAPITAL FORMATION, AT CURRENT PRICES
(Porcentajes del PIB / Percentages of GDP)
Rubro 2004 2005 2006 2007 2008 2009 2010 2011 Item
Ahorro interno 22.9 22.8 24.1 23.8 23.9 21.2 21.9 22.4 Domestic savingPagos netos de factores al resto del mundo -3.1 -3.0 -3.0 -2.6 -2.5 -2.5 -2.4 -2.5 Net factor payments to the rest of the world Transferencias corrientes netas 2.0 1.9 2.0 1.7 1.5 1.4 1.2 1.0 Net current transfers Ahorro nacional 21.7 21.7 23.0 22.9 22.9 20.0 20.7 21.0 National savingAhorro externo -1.1 -1.4 -1.5 -0.3 0.8 0.5 1.2 1.3 External savingFormación bruta de capital 20.7 20.3 21.5 22.5 23.8 20.6 21.8 22.3 Gross capital formation
a No incluye a Cuba ni a Haití. a Does not include Cuba and Haiti.

CE
PA
L, Anuario E
stadístico de Am
érica Latina y el Caribe, 2012
93 2.1 CUENTAS NACIONALES / NATIONAL ACCOUNTS 2.1.1 CUENTAS NACIONALES DE AMÉRICA LATINA Y EL CARIBE, EN DÓLARES / NATIONAL ACCOUNTS OF LATIN AMERICA AND THE CARIBBEAN, IN DOLLARS
2.1.1.65 AMÉRICA LATINA Y EL CARIBE: GRADO DE APERTURA DE LA ECONOMÍA, A PRECIOS CORRIENTES LATIN AMERICA AND THE CARIBBEAN: DEGREE OF OPENNESS OF THE ECONOMY, AT CURRENT PRICES
(Porcentajes del PIB / Percentages of GDP)
Países y regiones 2004 2005 2006 2007 2008 2009 2010 2011 Countries and regions
Antigua y Barbuda 124.4 122.6 119.7 116.8 115.7 104.4 104.3 105.6 Antigua and Barbuda Argentina 44.1 44.3 44.0 45.0 45.1 37.4 40.1 41.4 Argentina Bahamas 87.1 93.2 100.1 100.7 100.0 88.7 91.6 100.0 Bahamas Barbados 90.7 95.4 97.0 95.0 104.1 88.7 96.6 101.6 Barbados Belice 109.2 117.3 123.2 121.6 132.1 ... ... ... Belize Bolivia (Estado Plurinacional de) 57.5 67.6 74.5 76.1 82.9 68.6 75.5 82.5 Bolivia (Plurinational State of) Brasil 29.0 26.6 25.8 25.2 27.1 22.1 22.8 24.5 Brazil Chile 68.3 70.0 72.1 75.9 81.0 66.5 70.0 72.8 Chile Colombia 35.9 35.6 38.2 36.3 38.1 34.3 33.9 39.1 Colombia Costa Rica 95.7 102.5 104.4 102.2 100.6 84.0 78.4 79.0 Costa Rica Cuba 31.3 39.4 37.2 38.0 44.9 32.6 39.8 ... Cuba Dominica 83.0 90.0 88.5 91.7 97.3 87.5 91.6 88.2 Dominica Ecuador 50.7 56.1 59.7 62.6 68.1 53.6 62.8 65.9 Ecuador El Salvador 71.3 69.8 71.8 74.2 76.6 61.9 69.1 75.4 El Salvador Granada 85.8 77.8 80.1 81.9 77.1 69.0 69.7 70.6 Grenada Guatemala 69.1 66.0 66.8 67.9 64.1 57.1 62.1 65.0 Guatemala Guyana ... ... ... ... ... ... ... ... Guyana Haití 59.4 57.0 59.5 52.2 56.9 57.0 74.5 68.8 Haiti Honduras 135.5 136.5 133.1 135.1 135.7 100.5 108.5 116.3 Honduras Jamaica 89.3 90.5 100.8 101.3 113.6 86.7 80.9 84.7 Jamaica México 55.1 55.8 57.4 57.6 58.5 56.9 62.0 64.9 Mexico Nicaragua 67.2 71.6 76.8 82.8 88.8 78.9 90.9 101.6 Nicaragua Panamá 131.5 144.5 146.2 155.1 161.2 148.9 148.8 168.2 Panama Paraguay 94.9 103.4 107.5 103.2 104.2 96.0 106.2 99.0 Paraguay Perú 39.3 44.3 48.4 51.4 53.4 43.7 47.9 52.5 Peru República Dominicana 83.9 65.5 68.0 66.7 64.7 52.5 57.2 60.3 Dominican Republic Saint Kitts y Nevis 87.5 94.5 88.4 82.9 85.9 77.4 80.9 77.9 Saint Kitts and Nevis San Vicente y las Granadinas 87.4 89.2 88.0 89.7 91.7 86.3 84.9 83.2 Saint Vincent and the Grenadines Santa Lucía 112.4 123.2 112.7 106.4 115.4 101.5 117.0 113.4 Saint Lucia Suriname ... ... ... ... ... ... ... ... Suriname Trinidad y Tabago 93.8 104.8 118.7 ... ... ... ... ... Trinidad and Tobago Uruguay 59.9 58.9 62.0 59.2 65.2 55.2 52.9 54.4 Uruguay Venezuela (República Bolivariana de) 55.4 60.1 58.7 56.2 51.8 38.5 46.1 49.6 Venezuela (Bolivarian Republic of) América Latina y el Caribe a 47.7 47.1 47.3 45.7 46.4 39.5 41.3 43.2 Latin America and the Caribbean a
América Latina 47.0 46.3 46.4 45.6 46.2 39.4 41.2 43.1 Latin America El Caribe a 86.8 92.2 100.5 55.3 53.6 46.4 47.7 49.3 The Caribbean a
a Comprende los países que figuran en el presente cuadro. a Includes the countries shown in this table.
2.1 CUENTAS NACIONALES / NATIONAL ACCOUNTS 2.1.1 CUENTAS NACIONALES DE AMÉRICA LATINA Y EL CARIBE, EN DÓLARES / NATIONAL ACCOUNTS OF LATIN AMERICA AND THE CARIBBEAN, IN DOLLARS
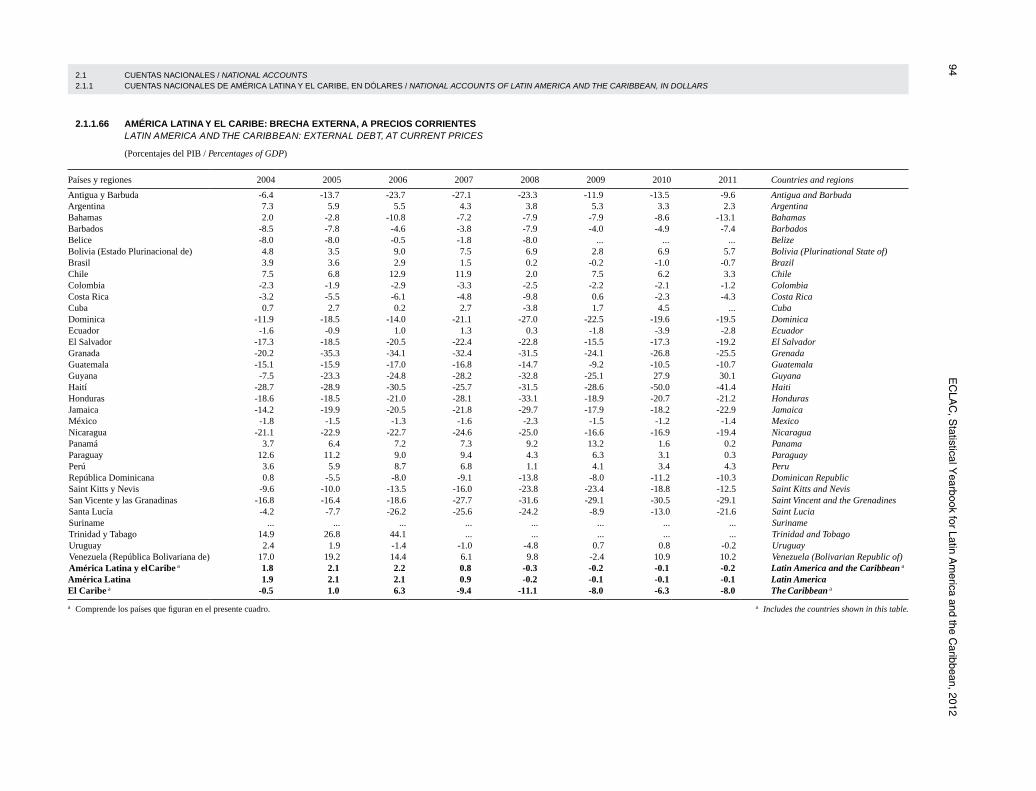
94 E
CLA
C, S
tatistical Yearbook for Latin A
merica and the C
aribbean, 2012 2.1 CUENTAS NACIONALES / NATIONAL ACCOUNTS 2.1.1 CUENTAS NACIONALES DE AMÉRICA LATINA Y EL CARIBE, EN DÓLARES / NATIONAL ACCOUNTS OF LATIN AMERICA AND THE CARIBBEAN, IN DOLLARS
2.1.1.66 AMÉRICA LATINA Y EL CARIBE: BRECHA EXTERNA, A PRECIOS CORRIENTES LATIN AMERICA AND THE CARIBBEAN: EXTERNAL DEBT, AT CURRENT PRICES
(Porcentajes del PIB / Percentages of GDP)
Países y regiones 2004 2005 2006 2007 2008 2009 2010 2011 Countries and regions
Antigua y Barbuda -6.4 -13.7 -23.7 -27.1 -23.3 -11.9 -13.5 -9.6 Antigua and Barbuda Argentina 7.3 5.9 5.5 4.3 3.8 5.3 3.3 2.3 Argentina Bahamas 2.0 -2.8 -10.8 -7.2 -7.9 -7.9 -8.6 -13.1 Bahamas Barbados -8.5 -7.8 -4.6 -3.8 -7.9 -4.0 -4.9 -7.4 Barbados Belice -8.0 -8.0 -0.5 -1.8 -8.0 ... ... ... Belize Bolivia (Estado Plurinacional de) 4.8 3.5 9.0 7.5 6.9 2.8 6.9 5.7 Bolivia (Plurinational State of) Brasil 3.9 3.6 2.9 1.5 0.2 -0.2 -1.0 -0.7 Brazil Chile 7.5 6.8 12.9 11.9 2.0 7.5 6.2 3.3 Chile Colombia -2.3 -1.9 -2.9 -3.3 -2.5 -2.2 -2.1 -1.2 Colombia Costa Rica -3.2 -5.5 -6.1 -4.8 -9.8 0.6 -2.3 -4.3 Costa Rica Cuba 0.7 2.7 0.2 2.7 -3.8 1.7 4.5 ... Cuba Dominica -11.9 -18.5 -14.0 -21.1 -27.0 -22.5 -19.6 -19.5 Dominica Ecuador -1.6 -0.9 1.0 1.3 0.3 -1.8 -3.9 -2.8 Ecuador El Salvador -17.3 -18.5 -20.5 -22.4 -22.8 -15.5 -17.3 -19.2 El Salvador Granada -20.2 -35.3 -34.1 -32.4 -31.5 -24.1 -26.8 -25.5 Grenada Guatemala -15.1 -15.9 -17.0 -16.8 -14.7 -9.2 -10.5 -10.7 Guatemala Guyana -7.5 -23.3 -24.8 -28.2 -32.8 -25.1 27.9 30.1 Guyana Haití -28.7 -28.9 -30.5 -25.7 -31.5 -28.6 -50.0 -41.4 Haiti Honduras -18.6 -18.5 -21.0 -28.1 -33.1 -18.9 -20.7 -21.2 Honduras Jamaica -14.2 -19.9 -20.5 -21.8 -29.7 -17.9 -18.2 -22.9 Jamaica México -1.8 -1.5 -1.3 -1.6 -2.3 -1.5 -1.2 -1.4 Mexico Nicaragua -21.1 -22.9 -22.7 -24.6 -25.0 -16.6 -16.9 -19.4 Nicaragua Panamá 3.7 6.4 7.2 7.3 9.2 13.2 1.6 0.2 Panama Paraguay 12.6 11.2 9.0 9.4 4.3 6.3 3.1 0.3 Paraguay Perú 3.6 5.9 8.7 6.8 1.1 4.1 3.4 4.3 Peru República Dominicana 0.8 -5.5 -8.0 -9.1 -13.8 -8.0 -11.2 -10.3 Dominican Republic Saint Kitts y Nevis -9.6 -10.0 -13.5 -16.0 -23.8 -23.4 -18.8 -12.5 Saint Kitts and Nevis San Vicente y las Granadinas -16.8 -16.4 -18.6 -27.7 -31.6 -29.1 -30.5 -29.1 Saint Vincent and the Grenadines Santa Lucía -4.2 -7.7 -26.2 -25.6 -24.2 -8.9 -13.0 -21.6 Saint Lucia Suriname ... ... ... ... ... ... ... ... Suriname Trinidad y Tabago 14.9 26.8 44.1 ... ... ... ... ... Trinidad and Tobago Uruguay 2.4 1.9 -1.4 -1.0 -4.8 0.7 0.8 -0.2 Uruguay Venezuela (República Bolivariana de) 17.0 19.2 14.4 6.1 9.8 -2.4 10.9 10.2 Venezuela (Bolivarian Republic of) América Latina y el Caribe a 1.8 2.1 2.2 0.8 -0.3 -0.2 -0.1 -0.2 Latin America and the Caribbean a
América Latina 1.9 2.1 2.1 0.9 -0.2 -0.1 -0.1 -0.1 Latin America
El Caribe a -0.5 1.0 6.3 -9.4 -11.1 -8.0 -6.3 -8.0 The Caribbean a
a Comprende los países que figuran en el presente cuadro. a Includes the countries shown in this table.

CE
PA
L, Anuario E
stadístico de Am
érica Latina y el Caribe, 2012
95 2.1 CUENTAS NACIONALES / NATIONAL ACCOUNTS 2.1.1 CUENTAS NACIONALES DE AMÉRICA LATINA Y EL CARIBE, EN DÓLARES / NATIONAL ACCOUNTS OF LATIN AMERICA AND THE CARIBBEAN, IN DOLLARS
2.1.1.67 AMÉRICA LATINA Y EL CARIBE: DEFLACTOR IMPLÍCITO DEL PRODUCTO INTERNO BRUTO LATIN AMERICA AND THE CARIBBEAN: IMPLICIT GDP DEFLATOR
(Año base 2005=100 / Year base 2005=100)
Países y regiones 2004 2005 2006 2007 2008 2009 2010 2011 Countries and regions
Antigua y Barbuda 95.9 100.0 100.3 103.9 108.6 110.4 113.9 116.3 Antigua and Barbuda Argentina 91.9 100.0 113.4 129.6 154.3 169.7 195.8 229.6 Argentina Bahamas 95.2 100.0 100.8 103.8 105.3 103.6 104.2 102.7 Bahamas Barbados 93.0 100.0 101.6 106.7 103.3 108.7 104.7 105.9 Barbados Belice 97.6 100.0 104.0 108.0 110.9 109.7 110.7 112.5 Belize Bolivia (Estado Plurinacional de) 94.4 100.0 113.7 122.0 134.7 131.5 143.0 163.8 Bolivia (Plurinational State of) Brasil 93.3 100.0 106.1 112.4 121.7 130.5 141.2 151.1 Brazil Chile 93.0 100.0 112.4 118.6 118.8 123.9 133.1 136.8 Chile Colombia 94.7 100.0 105.8 111.1 119.5 123.6 128.0 136.9 Colombia Costa Rica 90.4 100.0 111.0 121.4 136.5 147.9 159.7 166.4 Costa Rica Cuba 99.6 100.0 110.4 114.3 113.9 114.7 116.0 119.8 Cuba Dominica 101.0 100.0 102.7 104.7 107.3 112.5 109.2 112.4 Dominica Ecuador 92.8 100.0 108.0 115.2 131.1 129.3 138.1 147.3 Ecuador El Salvador 95.7 100.0 104.4 109.0 114.7 114.2 116.8 123.9 El Salvador Granada 97.6 100.0 104.7 107.1 115.5 115.2 116.5 120.1 Grenada Guatemala 94.7 100.0 105.0 112.5 123.1 127.5 134.0 141.3 Guatemala Guyana 92.9 100.0 105.6 119.0 129.8 132.5 141.4 153.3 Guyana Haití 85.0 100.0 114.8 124.0 139.9 144.7 151.5 161.8 Haiti Honduras 93.2 100.0 105.3 112.3 121.1 126.3 133.5 145.9 Honduras Jamaica 89.7 100.0 108.9 121.2 137.7 152.7 167.5 178.0 Jamaica México 95.9 100.0 106.8 112.8 119.9 124.8 129.7 136.8 Mexico Nicaragua 91.0 100.0 108.2 118.7 133.8 139.7 148.7 164.3 Nicaragua Panamá 98.3 100.0 102.1 105.2 111.0 112.3 117.0 122.2 Panama Paraguay 90.8 100.0 106.1 116.4 127.3 129.9 137.8 148.9 Paraguay Perú 97.1 100.0 107.2 109.6 112.1 115.3 120.3 125.9 Peru República Dominicana 97.4 100.0 105.4 111.4 122.3 125.9 132.4 141.2 Dominican Republic Saint Kitts y Nevis 101.9 100.0 112.1 119.5 122.5 122.5 122.7 124.4 Saint Kitts and Nevis San Vicente y las Granadinas 97.1 100.0 102.9 111.6 112.3 110.5 114.0 116.1 Saint Vincent and the Grenadines Santa Lucía 92.7 100.0 102.5 112.4 110.7 110.4 113.3 112.8 Saint Lucia Suriname 86.8 100.0 105.6 116.7 141.0 123.7 128.8 151.6 Suriname Trinidad y Tabago 87.6 100.0 100.7 113.6 142.2 104.0 111.2 122.0 Trinidad and Tobago Uruguay 99.5 100.0 106.5 116.6 125.9 133.0 140.3 151.5 Uruguay Venezuela (República Bolivariana de) 77.2 100.0 117.9 136.1 177.1 191.0 278.8 357.2 Venezuela (Bolivarian Republic of) América Latina y el Caribe 93.5 100.0 107.9 115.4 126.5 133.5 146.6 160.8 Latin America and the CaribbeanAmérica Latina 93.6 100.0 108.0 115.4 126.5 133.7 147.0 161.2 Latin America El Caribe 91.0 100.0 103.3 113.0 128.7 117.6 123.9 131.7 The Caribbean
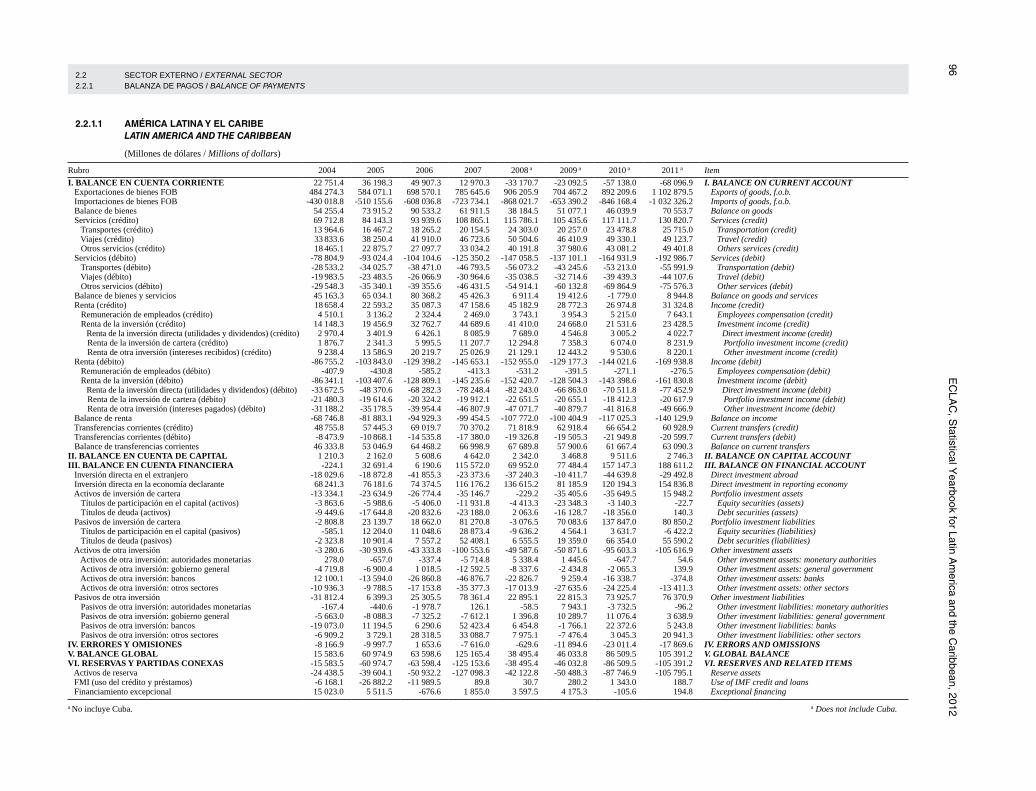
96 E
CLA
C, S
tatistical Yearbook for Latin A
merica and the C
aribbean, 2012 2.2 SECTOR EXTERNO / EXTERNAL SECTOR 2.2.1 BALANZA DE PAGOS / BALANCE OF PAYMENTS
2.2.1.1 AMÉRICA LATINA Y EL CARIBE LATIN AMERICA AND THE CARIBBEAN
(Millones de dólares / Millions of dollars)
Rubro 2004 2005 2006 2007 2008 a 2009 a 2010 a 2011 a Item
I. BALANCE EN CUENTA CORRIENTE 22 751.4 36 198.3 49 907.3 12 970.3 -33 170.7 -23 092.5 -57 138.0 -68 096.9 I. BALANCE ON CURRENT ACCOUNT Exportaciones de bienes FOB 484 274.3 584 071.1 698 570.1 785 645.6 906 205.9 704 467.2 892 209.6 1 102 879.5 Exports of goods, f.o.b. Importaciones de bienes FOB -430 018.8 -510 155.6 -608 036.8 -723 734.1 -868 021.7 -653 390.2 -846 168.4 -1 032 326.2 Imports of goods, f.o.b. Balance de bienes 54 255.4 73 915.2 90 533.2 61 911.5 38 184.5 51 077.1 46 039.9 70 553.7 Balance on goods Servicios (crédito) 69 712.8 84 143.3 93 939.6 108 865.1 115 786.1 105 435.6 117 111.7 130 820.7 Services (credit) Transportes (crédito) 13 964.6 16 467.2 18 265.2 20 154.5 24 303.0 20 257.0 23 478.8 25 715.0 Transportation (credit) Viajes (crédito) 33 833.6 38 250.4 41 910.0 46 723.6 50 504.6 46 410.9 49 330.1 49 123.7 Travel (credit) Otros servicios (crédito) 18 465.1 22 875.7 27 097.7 33 034.2 40 191.8 37 980.6 43 081.2 49 401.8 Others services (credit) Servicios (débito) -78 804.9 -93 024.4 -104 104.6 -125 350.2 -147 058.5 -137 101.1 -164 931.9 -192 986.7 Services (debit) Transportes (débito) -28 533.2 -34 025.7 -38 471.0 -46 793.5 -56 073.2 -43 245.6 -53 213.0 -55 991.9 Transportation (debit) Viajes (débito) -19 983.5 -23 483.5 -26 066.9 -30 964.6 -35 038.5 -32 714.6 -39 439.3 -44 107.6 Travel (debit) Otros servicios (débito) -29 548.3 -35 340.1 -39 355.6 -46 431.5 -54 914.1 -60 132.8 -69 864.9 -75 576.3 Other services (debit) Balance de bienes y servicios 45 163.3 65 034.1 80 368.2 45 426.3 6 911.4 19 412.6 -1 779.0 8 944.8 Balance on goods and services Renta (crédito) 18 658.4 22 593.2 35 087.3 47 158.6 45 182.9 28 772.3 26 974.8 31 324.8 Income (credit) Remuneración de empleados (crédito) 4 510.1 3 136.2 2 324.4 2 469.0 3 743.1 3 954.3 5 215.0 7 643.1 Employees compensation (credit) Renta de la inversión (crédito) 14 148.3 19 456.9 32 762.7 44 689.6 41 410.0 24 668.0 21 531.6 23 428.5 Investment income (credit) Renta de la inversión directa (utilidades y dividendos) (crédito) 2 970.4 3 401.9 6 426.1 8 085.9 7 689.0 4 546.8 3 005.2 4 022.7 Direct investment income (credit) Renta de la inversión de cartera (crédito) 1 876.7 2 341.3 5 995.5 11 207.7 12 294.8 7 358.3 6 074.0 8 231.9 Portfolio investment income (credit) Renta de otra inversión (intereses recibidos) (crédito) 9 238.4 13 586.9 20 219.7 25 026.9 21 129.1 12 443.2 9 530.6 8 220.1 Other investment income (credit) Renta (débito) -86 755.2 -103 843.0 -129 398.2 -145 653.1 -152 955.0 -129 177.3 -144 021.6 -169 938.8 Income (debit) Remuneración de empleados (débito) -407.9 -430.8 -585.2 -413.3 -531.2 -391.5 -271.1 -276.5 Employees compensation (debit) Renta de la inversión (débito) -86 341.1 -103 407.6 -128 809.1 -145 235.6 -152 420.7 -128 504.3 -143 398.6 -161 830.8 Investment income (debit) Renta de la inversión directa (utilidades y dividendos) (débito) -33 672.5 -48 370.6 -68 282.3 -78 248.4 -82 243.0 -66 863.0 -70 511.8 -77 452.9 Direct investment income (debit) Renta de la inversión de cartera (débito) -21 480.3 -19 614.6 -20 324.2 -19 912.1 -22 651.5 -20 655.1 -18 412.3 -20 617.9 Portfolio investment income (debit) Renta de otra inversión (intereses pagados) (débito) -31 188.2 -35 178.5 -39 954.4 -46 807.9 -47 071.7 -40 879.7 -41 816.8 -49 666.9 Other investment income (debit) Balance de renta -68 746.8 -81 883.1 -94 929.3 -99 454.5 -107 772.0 -100 404.9 -117 025.3 -140 129.9 Balance on income Transferencias corrientes (crédito) 48 755.8 57 445.3 69 019.7 70 370.2 71 818.9 62 918.4 66 654.2 60 928.9 Current transfers (credit) Transferencias corrientes (débito) -8 473.9 -10 868.1 -14 535.8 -17 380.0 -19 326.8 -19 505.3 -21 949.8 -20 599.7 Current transfers (debit) Balance de transferencias corrientes 46 333.8 53 046.9 64 468.2 66 998.9 67 689.8 57 900.6 61 667.4 63 090.3 Balance on current transfers II. BALANCE EN CUENTA DE CAPITAL 1 210.3 2 162.0 5 608.6 4 642.0 2 342.0 3 468.8 9 511.6 2 746.3 II. BALANCE ON CAPITAL ACCOUNT III. BALANCE EN CUENTA FINANCIERA -224.1 32 691.4 6 190.6 115 572.0 69 952.0 77 484.4 157 147.3 188 611.2 III. BALANCE ON FINANCIAL ACCOUNT Inversión directa en el extranjero -18 029.6 -18 872.8 -41 855.3 -23 373.6 -37 240.3 -10 411.7 -44 639.8 -29 492.8 Direct investment abroad Inversión directa en la economía declarante 68 241.3 76 181.6 74 374.5 116 176.2 136 615.2 81 185.9 120 194.3 154 836.8 Direct investment in reporting economy Activos de inversión de cartera -13 334.1 -23 634.9 -26 774.4 -35 146.7 -229.2 -35 405.6 -35 649.5 15 948.2 Portfolio investment assets Títulos de participación en el capital (activos) -3 863.6 -5 988.6 -5 406.0 -11 931.8 -4 413.3 -23 348.3 -3 140.3 -22.7 Equity securities (assets) Títulos de deuda (activos) -9 449.6 -17 644.8 -20 832.6 -23 188.0 2 063.6 -16 128.7 -18 356.0 140.3 Debt securities (assets) Pasivos de inversión de cartera -2 808.8 23 139.7 18 662.0 81 270.8 -3 076.5 70 083.6 137 847.0 80 850.2 Portfolio investment liabilities Títulos de participación en el capital (pasivos) -585.1 12 204.0 11 048.6 28 873.4 -9 636.2 4 564.1 3 631.7 -6 422.2 Equity securities (liabilities) Títulos de deuda (pasivos) -2 323.8 10 901.4 7 557.2 52 408.1 6 555.5 19 359.0 66 354.0 55 590.2 Debt securities (liabilities) Activos de otra inversión -3 280.6 -30 939.6 -43 333.8 -100 553.6 -49 587.6 -50 871.6 -95 603.3 -105 616.9 Other investment assets Activos de otra inversión: autoridades monetarias 278.0 -657.0 -337.4 -5 714.8 5 338.4 1 445.6 -647.7 54.6 Other investment assets: monetary authorities Activos de otra inversión: gobierno general -4 719.8 -6 900.4 1 018.5 -12 592.5 -8 337.6 -2 434.8 -2 065.3 139.9 Other investment assets: general government Activos de otra inversión: bancos 12 100.1 -13 594.0 -26 860.8 -46 876.7 -22 826.7 9 259.4 -16 338.7 -374.8 Other investment assets: banks Activos de otra inversión: otros sectores -10 936.3 -9 788.5 -17 153.8 -35 377.3 -17 013.9 -27 635.6 -24 225.4 -13 411.3 Other investment assets: other sectors Pasivos de otra inversión -31 812.4 6 399.3 25 305.5 78 361.4 22 895.1 22 815.3 73 925.7 76 370.9 Other investment liabilities Pasivos de otra inversión: autoridades monetarias -167.4 -440.6 -1 978.7 126.1 -58.5 7 943.1 -3 732.5 -96.2 Other investment liabilities: monetary authorities Pasivos de otra inversión: gobierno general -5 663.0 -8 088.3 -7 325.2 -7 612.1 1 396.8 10 289.7 11 076.4 3 638.9 Other investment liabilities: general government Pasivos de otra inversión: bancos -19 073.0 11 194.5 6 290.6 52 423.4 6 454.8 -1 766.1 22 372.6 5 243.8 Other investment liabilities: banks Pasivos de otra inversión: otros sectores -6 909.2 3 729.1 28 318.5 33 088.7 7 975.1 -7 476.4 3 045.3 20 941.3 Other investment liabilities: other sectors IV. ERRORES Y OMISIONES -8 166.9 -9 997.7 1 653.6 -7 616.0 -629.6 -11 894.6 -23 011.4 -17 869.6 IV. ERRORS AND OMISSIONS V. BALANCE GLOBAL 15 583.6 60 974.9 63 598.6 125 165.4 38 495.4 46 033.8 86 509.5 105 391.2 V. GLOBAL BALANCE VI. RESERVAS Y PARTIDAS CONEXAS -15 583.5 -60 974.7 -63 598.4 -125 153.6 -38 495.4 -46 032.8 -86 509.5 -105 391.2 VI. RESERVES AND RELATED ITEMS Activos de reserva -24 438.5 -39 604.1 -50 932.2 -127 098.3 -42 122.8 -50 488.3 -87 746.9 -105 795.1 Reserve assets FMI (uso del crédito y préstamos) -6 168.1 -26 882.2 -11 989.5 89.8 30.7 280.2 1 343.0 188.7 Use of IMF credit and loans Financiamiento excepcional 15 023.0 5 511.5 -676.6 1 855.0 3 597.5 4 175.3 -105.6 194.8 Exceptional financing
a Does not include Cuba.a No incluye Cuba.
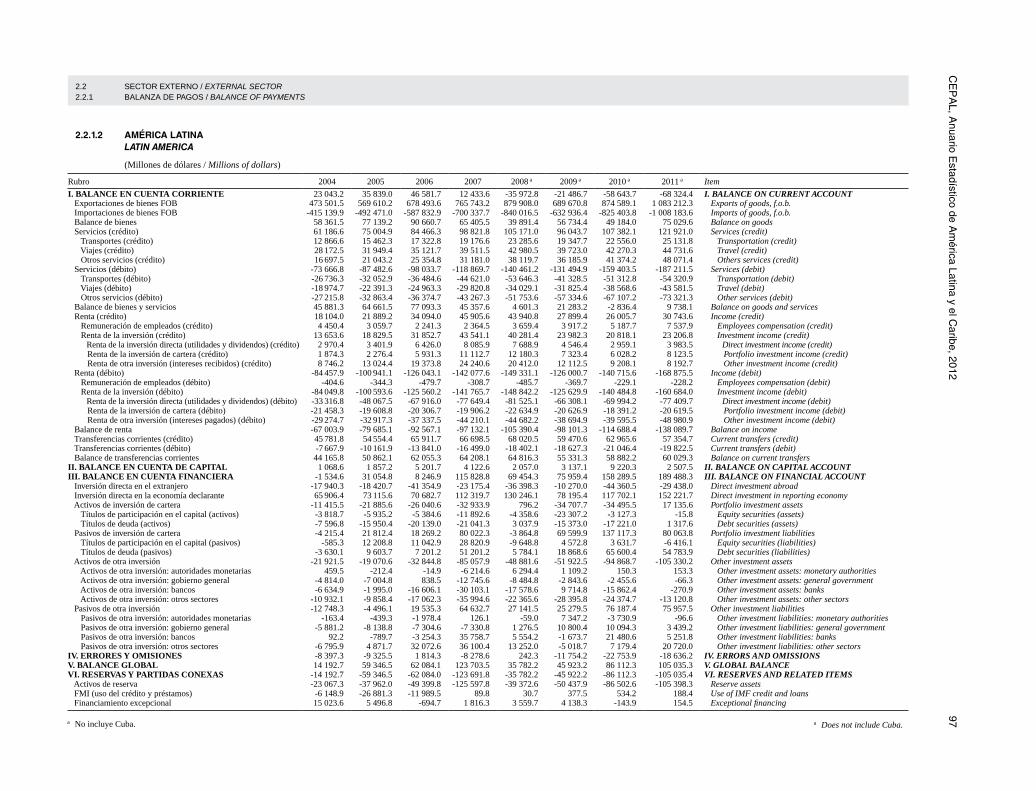
CE
PA
L, Anuario E
stadístico de Am
érica Latina y el Caribe, 2012
97 2.2 SECTOR EXTERNO / EXTERNAL SECTOR 2.2.1 BALANZA DE PAGOS / BALANCE OF PAYMENTS
2.2.1.2 AMÉRICA LATINA LATIN AMERICA
(Millones de dólares / Millions of dollars)
Rubro 2004 2005 2006 2007 2008 a 2009 a 2010 a 2011 a Item
I. BALANCE EN CUENTA CORRIENTE 23 043.2 35 839.0 46 581.7 12 433.6 -35 972.8 -21 486.7 -58 643.7 -68 324.4 I. BALANCE ON CURRENT ACCOUNT Exportaciones de bienes FOB 473 501.5 569 610.2 678 493.6 765 743.2 879 908.0 689 670.8 874 589.1 1 083 212.3 Exports of goods, f.o.b. Importaciones de bienes FOB -415 139.9 -492 471.0 -587 832.9 -700 337.7 -840 016.5 -632 936.4 -825 403.8 -1 008 183.6 Imports of goods, f.o.b. Balance de bienes 58 361.5 77 139.2 90 660.7 65 405.5 39 891.4 56 734.4 49 184.0 75 029.6 Balance on goods Servicios (crédito) 61 186.6 75 004.9 84 466.3 98 821.8 105 171.0 96 043.7 107 382.1 121 921.0 Services (credit) Transportes (crédito) 12 866.6 15 462.3 17 322.8 19 176.6 23 285.6 19 347.7 22 556.0 25 131.8 Transportation (credit) Viajes (crédito) 28 172.5 31 949.4 35 121.7 39 511.5 42 980.5 39 723.0 42 270.3 44 731.6 Travel (credit) Otros servicios (crédito) 16 697.5 21 043.2 25 354.8 31 181.0 38 119.7 36 185.9 41 374.2 48 071.4 Others services (credit) Servicios (débito) -73 666.8 -87 482.6 -98 033.7 -118 869.7 -140 461.2 -131 494.9 -159 403.5 -187 211.5 Services (debit) Transportes (débito) -26 736.3 -32 052.9 -36 484.6 -44 621.0 -53 646.3 -41 328.5 -51 312.8 -54 320.9 Transportation (debit) Viajes (débito) -18 974.7 -22 391.3 -24 963.3 -29 820.8 -34 029.1 -31 825.4 -38 568.6 -43 581.5 Travel (debit) Otros servicios (débito) -27 215.8 -32 863.4 -36 374.7 -43 267.3 -51 753.6 -57 334.6 -67 107.2 -73 321.3 Other services (debit) Balance de bienes y servicios 45 881.3 64 661.5 77 093.3 45 357.6 4 601.3 21 283.2 -2 836.4 9 738.1 Balance on goods and services Renta (crédito) 18 104.0 21 889.2 34 094.0 45 905.6 43 940.8 27 899.4 26 005.7 30 743.6 Income (credit) Remuneración de empleados (crédito) 4 450.4 3 059.7 2 241.3 2 364.5 3 659.4 3 917.2 5 187.7 7 537.9 Employees compensation (credit) Renta de la inversión (crédito) 13 653.6 18 829.5 31 852.7 43 541.1 40 281.4 23 982.3 20 818.1 23 206.8 Investment income (credit) Renta de la inversión directa (utilidades y dividendos) (crédito) 2 970.4 3 401.9 6 426.0 8 085.9 7 688.9 4 546.4 2 959.1 3 983.5 Direct investment income (credit) Renta de la inversión de cartera (crédito) 1 874.3 2 276.4 5 931.3 11 112.7 12 180.3 7 323.4 6 028.2 8 123.5 Portfolio investment income (credit) Renta de otra inversión (intereses recibidos) (crédito) 8 746.2 13 024.4 19 373.8 24 240.6 20 412.0 12 112.5 9 208.1 8 192.7 Other investment income (credit) Renta (débito) -84 457.9 -100 941.1 -126 043.1 -142 077.6 -149 331.1 -126 000.7 -140 715.6 -168 875.5 Income (debit) Remuneración de empleados (débito) -404.6 -344.3 -479.7 -308.7 -485.7 -369.7 -229.1 -228.2 Employees compensation (debit) Renta de la inversión (débito) -84 049.8 -100 593.6 -125 560.2 -141 765.7 -148 842.2 -125 629.9 -140 484.8 -160 684.0 Investment income (debit) Renta de la inversión directa (utilidades y dividendos) (débito) -33 316.8 -48 067.5 -67 916.0 -77 649.4 -81 525.1 -66 308.1 -69 994.2 -77 409.7 Direct investment income (debit) Renta de la inversión de cartera (débito) -21 458.3 -19 608.8 -20 306.7 -19 906.2 -22 634.9 -20 626.9 -18 391.2 -20 619.5 Portfolio investment income (debit) Renta de otra inversión (intereses pagados) (débito) -29 274.7 -32 917.3 -37 337.5 -44 210.1 -44 682.2 -38 694.9 -39 595.5 -48 980.9 Other investment income (debit) Balance de renta -67 003.9 -79 685.1 -92 567.1 -97 132.1 -105 390.4 -98 101.3 -114 688.4 -138 089.7 Balance on income Transferencias corrientes (crédito) 45 781.8 54 554.4 65 911.7 66 698.5 68 020.5 59 470.6 62 965.6 57 354.7 Current transfers (credit) Transferencias corrientes (débito) -7 667.9 -10 161.9 -13 841.0 -16 499.0 -18 402.1 -18 627.3 -21 046.4 -19 822.5 Current transfers (debit) Balance de transferencias corrientes 44 165.8 50 862.1 62 055.3 64 208.1 64 816.3 55 331.3 58 882.2 60 029.3 Balance on current transfers II. BALANCE EN CUENTA DE CAPITAL 1 068.6 1 857.2 5 201.7 4 122.6 2 057.0 3 137.1 9 220.3 2 507.5 II. BALANCE ON CAPITAL ACCOUNT III. BALANCE EN CUENTA FINANCIERA -1 534.6 31 054.8 8 246.9 115 828.8 69 454.3 75 959.4 158 289.5 189 488.3 III. BALANCE ON FINANCIAL ACCOUNT Inversión directa en el extranjero -17 940.3 -18 420.7 -41 354.9 -23 175.4 -36 398.3 -10 270.0 -44 360.5 -29 438.0 Direct investment abroad Inversión directa en la economía declarante 65 906.4 73 115.6 70 682.7 112 319.7 130 246.1 78 195.4 117 702.1 152 221.7 Direct investment in reporting economy Activos de inversión de cartera -11 415.5 -21 885.6 -26 040.6 -32 933.9 796.2 -34 707.7 -34 495.5 17 135.6 Portfolio investment assets Títulos de participación en el capital (activos) -3 818.7 -5 935.2 -5 384.6 -11 892.6 -4 358.6 -23 307.2 -3 127.3 -15.8 Equity securities (assets) Títulos de deuda (activos) -7 596.8 -15 950.4 -20 139.0 -21 041.3 3 037.9 -15 373.0 -17 221.0 1 317.6 Debt securities (assets) Pasivos de inversión de cartera -4 215.4 21 812.4 18 269.2 80 022.3 -3 864.8 69 599.9 137 117.3 80 063.8 Portfolio investment liabilities Títulos de participación en el capital (pasivos) -585.3 12 208.8 11 042.9 28 820.9 -9 648.8 4 572.8 3 631.7 -6 416.1 Equity securities (liabilities) Títulos de deuda (pasivos) -3 630.1 9 603.7 7 201.2 51 201.2 5 784.1 18 868.6 65 600.4 54 783.9 Debt securities (liabilities) Activos de otra inversión -21 921.5 -19 070.6 -32 844.8 -85 057.9 -48 881.6 -51 922.5 -94 868.7 -105 330.2 Other investment assets Activos de otra inversión: autoridades monetarias 459.5 -212.4 -14.9 -6 214.6 6 294.4 1 109.2 150.3 153.3 Other investment assets: monetary authorities Activos de otra inversión: gobierno general -4 814.0 -7 004.8 838.5 -12 745.6 -8 484.8 -2 843.6 -2 455.6 -66.3 Other investment assets: general government Activos de otra inversión: bancos -6 634.9 -1 995.0 -16 606.1 -30 103.1 -17 578.6 9 714.8 -15 862.4 -270.9 Other investment assets: banks Activos de otra inversión: otros sectores -10 932.1 -9 858.4 -17 062.3 -35 994.6 -22 365.6 -28 395.8 -24 374.7 -13 120.8 Other investment assets: other sectors Pasivos de otra inversión -12 748.3 -4 496.1 19 535.3 64 632.7 27 141.5 25 279.5 76 187.4 75 957.5 Other investment liabilities Pasivos de otra inversión: autoridades monetarias -163.4 -439.3 -1 978.4 126.1 -59.0 7 347.2 -3 730.9 -96.6 Other investment liabilities: monetary authorities Pasivos de otra inversión: gobierno general -5 881.2 -8 138.8 -7 304.6 -7 330.8 1 276.5 10 800.4 10 094.3 3 439.2 Other investment liabilities: general government Pasivos de otra inversión: bancos 92.2 -789.7 -3 254.3 35 758.7 5 554.2 -1 673.7 21 480.6 5 251.8 Other investment liabilities: banks Pasivos de otra inversión: otros sectores -6 795.9 4 871.7 32 072.6 36 100.4 13 252.0 -5 018.7 7 179.4 20 720.0 Other investment liabilities: other sectors IV. ERRORES Y OMISIONES -8 397.3 -9 325.5 1 814.3 -8 278.6 242.3 -11 754.2 -22 753.9 -18 636.2 IV. ERRORS AND OMISSIONS V. BALANCE GLOBAL 14 192.7 59 346.5 62 084.1 123 703.5 35 782.2 45 923.2 86 112.3 105 035.3 V. GLOBAL BALANCE VI. RESERVAS Y PARTIDAS CONEXAS -14 192.7 -59 346.5 -62 084.0 -123 691.8 -35 782.2 -45 922.2 -86 112.3 -105 035.4 VI. RESERVES AND RELATED ITEMS Activos de reserva -23 067.3 -37 962.0 -49 399.8 -125 597.8 -39 372.6 -50 437.9 -86 502.6 -105 398.3 Reserve assets FMI (uso del crédito y préstamos) -6 148.9 -26 881.3 -11 989.5 89.8 30.7 377.5 534.2 188.4 Use of IMF credit and loans Financiamiento excepcional 15 023.6 5 496.8 -694.7 1 816.3 3 559.7 4 138.3 -143.9 154.5 Exceptional financing
a No incluye Cuba. a Does not include Cuba.

98 E
CLA
C, S
tatistical Yearbook for Latin A
merica and the C
aribbean, 2012 2.2 SECTOR EXTERNO / EXTERNAL SECTOR 2.2.1 BALANZA DE PAGOS / BALANCE OF PAYMENTS
2.2.1.3 EL CARIBE THE CARIBBEAN
(Millones de dólares / Millions of dollars)
Rubro 2004 2005 2006 2007 2008 2009 2010 2011 Item
I. BALANCE EN CUENTA CORRIENTE -291.7 359.3 3 325.5 536.8 2 802.1 -1 605.8 1 505.7 227.4 I. BALANCE ON CURRENT ACCOUNT Exportaciones de bienes FOB 10 772.8 14 460.9 20 076.5 19 902.4 26 297.9 14 796.4 17 620.5 19 667.2 Exports of goods, f.o.b. Importaciones de bienes FOB -14 878.9 -17 684.6 -20 203.9 -23 396.4 -28 005.2 -20 453.8 -20 764.6 -24 142.5 Imports of goods, f.o.b. Balance de bienes -4 106.1 -3 224.0 -127.5 -3 494.0 -1 706.9 -5 657.3 -3 144.1 -4 475.9 Balance on goods Servicios (crédito) 8 526.2 9 138.4 9 473.4 10 043.3 10 615.0 9 391.9 9 729.6 8 899.7 Services (credit) Transportes (crédito) 1 098.0 1 004.9 942.4 977.9 1 017.4 909.3 922.9 583.2 Transportation (credit) Viajes (crédito) 5 661.1 6 301.0 6 788.3 7 212.1 7 524.1 6 687.9 7 059.9 4 392.1 Travel (credit) Otros servicios (crédito) 1 767.5 1 832.5 1 742.9 1 853.2 2 072.1 1 794.8 1 707.1 1 330.3 Others services (credit) Servicios (débito) -5 138.1 -5 541.8 -6 070.9 -6 480.6 -6 597.3 -5 606.2 -5 528.4 -5 775.2 Services (debit) Transportes (débito) -1 797.0 -1 972.7 -1 986.4 -2 172.5 -2 426.9 -1 917.1 -1 900.2 -1 671.0 Transportation (debit) Viajes (débito) -1 008.8 -1 092.2 -1 103.6 -1 143.8 -1 009.4 -889.2 -870.7 -526.1 Travel (debit) Otros servicios (débito) -2 332.5 -2 476.8 -2 980.9 -3 164.2 -3 160.5 -2 798.2 -2 757.7 -2 255.0 Other services (debit) Balance de bienes y servicios -718.0 372.6 3 274.9 68.7 2 310.2 -1 870.6 1 057.4 -793.3 Balance on goods and services Renta (crédito) 554.4 704.0 993.3 1 253.0 1 242.1 872.9 969.1 581.2 Income (credit) Remuneración de empleados (crédito) 59.7 76.5 83.2 104.5 83.7 37.1 27.3 105.2 Employees compensation (credit) Renta de la inversión (crédito) 494.8 627.5 910.0 1 148.5 1 128.6 685.8 713.6 221.7 Investment income (credit) Renta de la inversión directa (utilidades y dividendos) (crédito) – – – – 0.1 0.4 46.1 39.2 Direct investment income (credit) Renta de la inversión de cartera (crédito) 2.5 64.8 64.2 95.1 114.4 34.9 45.8 108.4 Portfolio investment income (credit) Renta de otra inversión (intereses recibidos) (crédito) 492.3 562.6 845.8 786.3 717.1 330.7 322.5 27.3 Other investment income (credit) Renta (débito) -2 297.3 -2 902.0 -3 355.1 -3 575.5 -3 623.9 -3 176.5 -3 306.0 -1 063.3 Income (debit) Remuneración de empleados (débito) -3.3 -86.5 -105.6 -104.6 -45.4 -21.8 -42.0 -48.2 Employees compensation (debit) Renta de la inversión (débito) -2 291.3 -2 814.0 -3 248.8 -3 469.9 -3 578.5 -2 874.5 -2 913.8 -1 146.7 Investment income (debit) Renta de la inversión directa (utilidades y dividendos) (débito) -355.7 -303.1 -366.3 -599.0 -717.9 -554.9 -517.7 -43.2 Direct investment income (debit) Renta de la inversión de cartera (débito) -22.1 -5.8 -17.5 -5.9 -16.6 -28.2 -21.1 1.6 Portfolio investment income (debit) Renta de otra inversión (intereses pagados) (débito) -1 913.5 -2 261.2 -2 616.9 -2 597.8 -2 389.5 -2 184.8 -2 221.3 -685.9 Other investment income (debit) Balance de renta -1 742.8 -2 197.9 -2 362.2 -2 322.5 -2 381.6 -2 303.6 -2 336.9 -2 040.3 Balance on income Transferencias corrientes (crédito) 2 974.0 2 890.9 3 107.9 3 671.7 3 798.5 3 447.8 3 688.6 3 574.2 Current transfers (credit) Transferencias corrientes (débito) -806.0 -706.2 -694.8 -881.0 -924.7 -878.0 -903.4 -777.3 Current transfers (debit) Balance de transferencias corrientes 2 168.0 2 184.8 2 412.9 2 790.7 2 873.5 2 569.3 2 785.2 3 061.0 Balance on current transfers II. BALANCE EN CUENTA DE CAPITAL 141.6 304.8 406.9 519.4 285.0 331.7 291.3 238.8 II. BALANCE ON CAPITAL ACCOUNT III. BALANCE EN CUENTA FINANCIERA 1 310.5 1 636.6 -2 056.3 -256.8 497.7 1 525.0 -1 142.2 -877.1 III. BALANCE ON FINANCIAL ACCOUNT Inversión directa en el extranjero -89.3 -452.1 -500.4 -198.2 -842.0 -141.7 -279.2 -54.7 Direct investment abroad Inversión directa en la economía declarante 2 334.9 3 066.0 3 691.8 3 856.6 6 369.1 2 990.4 2 492.2 2 615.1 Direct investment in reporting economy Activos de inversión de cartera -1 918.7 -1 749.2 -733.8 -2 212.8 -1 025.4 -697.9 -1 154.0 -1 187.4 Portfolio investment assets Títulos de participación en el capital (activos) -44.9 -53.4 -21.5 -39.2 -54.7 -41.1 -13.1 -6.9 Equity securities (assets) Títulos de deuda (activos) -1 852.9 -1 694.4 -693.6 -2 146.8 -974.3 -755.7 -1 135.0 -1 177.3 Debt securities (assets) Pasivos de inversión de cartera 1 406.6 1 327.3 392.8 1 248.5 788.3 483.6 729.7 786.3 Portfolio investment liabilities Títulos de participación en el capital (pasivos) 0.2 -4.8 5.6 52.5 12.7 -8.7 – -6.1 Equity securities (liabilities) Títulos de deuda (pasivos) 1 306.3 1 297.8 356.0 1 206.9 771.4 490.5 753.6 806.3 Debt securities (liabilities) Activos de otra inversión 18 640.9 -11 869.0 -10 489.0 -15 495.7 -705.9 1 050.9 -734.6 -286.7 Other investment assets Activos de otra inversión: autoridades monetarias -181.6 -444.6 -322.5 499.8 -956.0 336.4 -798.0 -98.6 Other investment assets: monetary authorities Activos de otra inversión: gobierno general 94.2 104.4 180.1 153.2 147.2 408.7 390.4 206.2 Other investment assets: general government Activos de otra inversión: bancos 18 735.0 -11 599.0 -10 254.8 -16 773.6 -5 248.1 -455.4 -476.3 -104.0 Other investment assets: banks Activos de otra inversión: otros sectores -4.2 69.9 -91.5 617.2 5 351.7 760.2 149.3 -290.5 Other investment assets: other sectors Pasivos de otra inversión -19 064.1 10 895.4 5 770.3 13 728.6 -4 246.4 -2 464.2 -2 261.7 413.4 Other investment liabilities Pasivos de otra inversión: autoridades monetarias -4.0 -1.3 -0.3 – 0.5 595.9 -1.6 0.4 Other investment liabilities: monetary authorities Pasivos de otra inversión: gobierno general 218.1 50.5 -20.6 -281.3 120.3 -510.7 982.0 199.7 Other investment liabilities: general government Pasivos de otra inversión: bancos -19 165.2 11 984.1 9 544.9 16 664.7 900.5 -92.3 892.1 -8.0 Other investment liabilities: banks Pasivos de otra inversión: otros sectores -113.2 -1 142.6 -3 754.1 -3 011.7 -5 276.9 -2 457.7 -4 134.1 221.3 Other investment liabilities: other sectors IV. ERRORES Y OMISIONES 230.5 -672.2 -160.8 662.6 -871.9 -140.3 -257.5 766.6 IV. ERRORS AND OMISSIONS V. BALANCE GLOBAL 1 390.8 1 628.4 1 514.5 1 461.9 2 713.2 110.6 397.2 355.9 V. GLOBAL BALANCE VI. RESERVAS Y PARTIDAS CONEXAS -1 390.8 -1 628.2 -1 514.4 -1 461.8 -2 713.2 -110.6 -397.2 -355.9 VI. RESERVES AND RELATED ITEMS Activos de reserva -1 371.1 -1 642.0 -1 532.5 -1 500.5 -2 750.2 -50.3 -1 244.3 -396.8 Reserve assets FMI (uso del crédito y préstamos) -19.2 -0.9 – – – -97.3 808.8 0.3 Use of IMF credit and loans Financiamiento excepcional -0.6 14.7 18.1 38.7 37.8 37.0 38.4 40.4 Exceptional financing

CE
PA
L, Anuario E
stadístico de Am
érica Latina y el Caribe, 2012
99 2.2 SECTOR EXTERNO / EXTERNAL SECTOR 2.2.1 BALANZA DE PAGOS / BALANCE OF PAYMENTS
2.2.1.41 AMÉRICA LATINA Y EL CARIBE: PRINCIPALES COMPONENTES DE LA BALANZA DE PAGOS LATIN AMERICA AND THE CARIBBEAN: MAIN BALANCE OF PAYMENTS COMPONENTS
(Millones de dólares / Millions of dollars)
País
Balance de bienes y servicios Balance on goods and services
Balance de rentaBalance on income
Balance de transferencias corrientes Balance on current transfers
Balance de cuenta corriente Balance on current account Country
2009 2010 2011 2009 2010 2011 2009 2010 2011 2009 2010 2011
Antigua y Barbuda -144.9 -156.3 -112.4 -50.8 -31.9 -31.7 26.7 21.7 22.3 -169.0 -166.5 -121.8 Antigua and Barbuda Argentina 17 468.9 13 166.0 11 271.8 -9 011.6 -9 938.9 -10 814.7 11.5 -397.5 -462.4 8 469.0 2 829.6 -5.3 Argentina Bahamas -669.9 -574.7 -809.4a -152.2 -233.7 -218.2a 13.5 -2.6 -19.0a -808.6 -811.0 -1 046.6a Bahamas Barbados -119.9 -264.1 -427.3 -140.1 -121.3 -101.6 42.3 19.8 23.2 -217.6 -365.6 -505.8 Barbados Belice -54.0 51.1 38.7 -108.3 -154.9 -135.9 79.4 91.8 80.1 -82.8 -11.9 -17.2 Belize Bolivia (Estado Plurinacional de) 206.4 747.3 345.8 -673.8 -860.1 -985.8 1 213.2 1 081.4 1 177.2 745.8 968.6 537.2 Bolivia (Plurinational State of) Brasil 6 044.4 -10 687.0 -8 145.0 -33 684.2 -39 486.0 -47 319.0 3 337.5 2 902.0 2 985.0 -24 302.3 -47 272.0 -52 481.0 Brazil Chile 13 349.6 13 518.6 8 376.0 -11 394.7 -14 765.2 -14 014.6 1 563.2 4 515.2 2 418.4 3 518.1 3 268.6 -3 220.2 Chile Colombia -275.2 -1 383.6 851.1 -9 297.8 -11 848.8 -15 766.6 4 613.0 4 474.7 4 937.6 -4 960.0 -8 757.7 -9 977.9 Colombia Costa Rica 149.0 -902.5 -1 914.5 -1 083.7 -745.2 -584.4 358.7 366.4 322.9 -576.0 -1 281.2 -2 175.9 Costa Rica Cuba ... ... ... ... ... ... ... ... ... ... ... ... Cuba Dominica -108.1 -81.6 -91.5 -13.7 -9.3 -8.4 19.3 19.6 19.8 -102.4 -71.3 -80.2 Dominica Ecuador -1 138.2 -3 042.4 -1 739.0 -1 373.8 -1 042.2 -1 222.8 2 647.8 2 474.9 2 740.4 135.7 -1 609.7 -221.4 Ecuador El Salvador -3 198.0 -3 705.9 -4 432.0 -556.0 -550.6 -632.2 3 441.8 3 598.6 3 842.6 -312.2 -657.9 -1 221.7 El Salvador Granada -186.8 -210.9 -198.4 -66.1 -51.5 -47.6 39.7 31.9 31.3 -213.2 -230.5 -214.8 Grenada Guatemala -3 507.0 -4 360.7 -5 109.9b -1 111.1 -1 211.2 -1 553.1b 4 625.6 4 945.6 5 207.4b 7.5 -626.3 -1 455.6b Guatemala Guyana -502.0 -629.9 -778.3 -17.0 12.8 -9.3 300.0 370.8 414.6 -220.0 -246.4 -373.0 Guyana Haití -1 874.6 -3 273.5 -2 711.1b 12.8 21.4 40.1b 1 635.2 3 096.8 2 643.2b -226.6 -155.2 -27.8b Haiti Honduras -2 624.6 -3 117.4 -3 606.5 -530.1 -598.0 -955.2 2 639.0 2 760.5 3 058.5 -515.6 -954.8 -1 503.2 Honduras Jamaica -2 318.0 -2 449.4 -3 563.2 -667.9 -494.6 -548.3 1 858.4 2 010.0 2 042.6 -1 127.5 -934.0 -2 068.9 Jamaica México -13 504.6 -13 280.2 -15 370.4 -13 142.8 -11 317.9 -16 561.3 21 531.2 21 504.2 22 901.5 -5 116.3 -3 093.9 -9 030.2 Mexico Nicaragua -1 643.0 -1 780.9 -2 246.4 -250.5 -274.9 -247.3 1 118.4 1 172.8 1 191.6 -775.1 -883.0 -1 302.1 Nicaragua Panamá 1 143.5 -1 132.7 -2 221.7 -1 448.8 -1 858.5 -1 799.4 126.3 129.4 128.7 -179.0 -2 861.8 -3 892.4 Panama Paraguay -148.9 -677.7 -664.1 -302.2 -533.4 -307.0 518.9 557.5 700.9 67.7 -653.6 -270.2 Paraguay Perú 4 774.8 4 404.0 7 169.3 -8 385.1 -11 212.1 -13 709.6 2 887.4 3 026.0 3 199.6 -722.9 -3 782.1 -3 340.7 Peru República Dominicana -3 825.7 -5 766.7 -5 777.5 -1 720.8 -1 686.4 -2 127.5 3 215.6 3 123.6 3 406.0 -2 330.9 -4 329.5 -4 499.0 Dominican Republic Saint Kitts y Nevis -161.4 -126.4 -110.9b -34.8 -34.2 -31.0b 45.2 45.9 45.6b -151.1 -114.6 -96.3b Saint Kitts and Nevis San Vicente y las Granadinas -195.7 -205.6 -214.0 -13.0 -17.4 -16.2 11.4 10.0 9.8 -197.3 -213.0 -220.4 Saint Vincent and the Grenadines Santa Lucía -104.0 -148.8 -169.7b -48.3 -41.0 -40.2b 12.4 15.2 20.3b -139.8 -174.6 -189.6b Saint Lucia Suriname 110.2 668.6 425.9 5.3 -102.1 -262.1 94.0 86.5 87.3 209.5 653.0 251.1 Suriname Trinidad y Tabago 2 583.8 5 185.3 5 217.3 -996.7 -1 057.8 -589.7 27.0 64.6 283.2 1 614.1 4 192.1 4 910.8 Trinidad and Tobago Uruguay 426.3 497.6 -2.8 -1 013.0 -1 478.6 -1 565.3 138.0 118.0 126.1 -448.6 -863.0 -1 442.0 Uruguay Venezuela (República Bolivariana de) 9 460.0 17 941.0 35 665.0 -3 134.0 -5 302.0 -7 964.0 -291.0 -568.0 -496.0 6 035.0 12 071.0 27 205.0 Venezuela (Bolivarian Republic of) América Latina y el Caribe a 19 412.6 -1 779.0 8 944.8 -100 404.9 -117 025.3 -140 129.9 57 900.6 61 667.4 63 090.3 -23 092.5 -57 138.0 -68 096.9 Latin America and the Caribbean a
América Latina a 21 283.2 -2 836.4 9 738.1 -98 101.3 -114 688.4 -138 089.7 55 331.3 58 882.2 60 029.3 -21 486.7 -58 643.7 -68 324.4 Latin America a
El Caribe a -1 870.6 1 057.4 -793.3 -2 303.6 -2 336.9 -2 040.3 2 569.3 2 785.2 3 061.0 -1 605.8 1 505.7 227.4 The Caribbean a
a Comprende los países que figuran en el presente cuadro. a Includes the countries shown in this table.

100 E
CLA
C, S
tatistical Yearbook for Latin A
merica and the C
aribbean, 2012 2.2 SECTOR EXTERNO / EXTERNAL SECTOR 2.2.1 BALANZA DE PAGOS / BALANCE OF PAYMENTS
2.2.1.41 AMÉRICA LATINA Y EL CARIBE: PRINCIPALES COMPONENTES DE LA BALANZA DE PAGOS (conclusión)
LATIN AMERICA AND THE CARIBBEAN: MAIN BALANCE OF PAYMENTS COMPONENTS (concluded)
(Millones de dólares / Millions of dollars)
PaísCuenta capital y financiera
Capital and financial account Balance global Overall balance
Activos de reserva Reserve assets
FMI (uso del crédito y préstamos) y financiamiento excepcional
Use of IMF credit and loans and exceptional financing
Country
2009 2010 2011 2009 2010 2011 2009 2010 2011 2009 2010 2011
Antigua y Barbuda 158.9 178.5 115.1 -10.2 12.1 -6.7 29.8 -31.0 6.7 -19.6 18.9 – Antigua and Barbuda Argentina -8 885.0 1 327.7 -6 102.5 -416.1 4 157.3 -6 107.9 -1 326.7 -4 157.3 6 107.9 – – – Argentina Bahamas 1 061.5 855.5 1 146.6a 253.0 44.5 100.0a -253.0 -44.5 -100.0a – – ... Bahamas Barbados 242.5 399.5 473.3 24.9 33.9 -32.5 -24.9 -33.9 32.5 – – – Barbados Belice 130.1 16.3 9.5 47.3 4.3 -7.7 -47.3 -4.3 7.7 – – ... Belize Bolivia (Estado Plurinacional de) -488.3 -45.6 1 622.8 325.2 923.0 2 160.0 -325.2 -923.0 -2 160.0 – ... ... Bolivia (Plurinational State of) Brasil 70 953.2 96 373.0 111 118.0 46 651.0 49 101.0 58 637.0 -46 651.0 -49 101.0 -58 637.0 – – – Brazil Chile -1 870.3 -245.5 17 410.3 1 647.7 3 023.1 14 190.1 -1 647.7 -3 023.1 -14 190.1 – – – Chile Colombia 6 307.2 11 893.3 13 722.3 1 347.2 3 135.7 3 744.4 -1 347.2 -3 135.7 -3 744.4 – – – Colombia Costa Rica 836.5 1 842.3 2 308.3 260.5 561.1 132.4 -260.5 -561.1 -132.4 – – – Costa Rica Cuba ... ... ... ... ... ... ... ... ... ... ... ... Cuba Dominica 123.2 72.5 76.4 20.8 1.3 -3.8 -8.5 -1.3 3.6 -12.3 – 0.2 Dominica Ecuador -2 782.9 397.4 493.4 -2 647.2 -1 212.3 272.0 681.0 1 170.0 -335.6 – – – Ecuador El Salvador 734.8 363.1 807.4 422.6 -294.8 -414.2 -422.6 294.8 414.2 – – – El Salvador Granada 239.0 220.8 205.5 25.8 -9.6 -9.3 -8.3 9.6 9.3 -17.5 – – Grenada Guatemala 465.3 1 303.2 1 661.5b 472.8 676.9 205.9b -472.8 -676.9 -205.9b ... ... ... Guatemala Guyana 454.0 362.9 358.0 234.0 116.5 -15.0 -271.0 -154.9 -25.4 – – – Guyana Haití 76.2 1 139.3 164.8b -150.5 984.1 137.0b -239.9 -844.9 -137.0b 64.8 123.8 ... Haiti Honduras 91.3 1 523.4 1 560.1 -424.2 568.6 56.9 353.6 -592.2 -81.0 – – – Honduras Jamaica 1 098.2 585.9 1 863.7 -29.3 -348.1 -205.2 29.3 -431.4 205.0 – 779.5 – Jamaica México 9 644.7 23 709.1 37 210.0 4 528.4 20 615.3 28 179.9 -4 528.4 -20 615.3 -28 179.9 – – – Mexico Nicaragua 956.0 1 054.7 1 329.2 180.9 171.7 27.1 -259.1 -221.7 -72.7 38.0 19.6 15.6 Nicaragua Panamá 784.7 3 313.4 3 545.3 605.7 451.6 -347.1 -605.7 -451.6 347.1 – – – Panama Paraguay 848.7 972.9 1 054.2 916.4 319.3 784.0 -915.2 -319.2 -784.1 – – – Paraguay Perú 1 730.2 14 954.9 8 032.2 1 007.4 11 172.9 4 691.4 -1 043.5 -11 191.9 -4 724.2 – – ... Peru República Dominicana 2 736.9 4 387.3 4 653.0 406.0 57.8 154.0 -637.8 -452.5 -330.8 274.7 390.8 172.8 Dominican Republic Saint Kitts y Nevis 177.1 147.4 141.6b 26.0 32.8 45.3b -13.3 -32.8 -45.3b -12.7 – – Saint Kitts and Nevis San Vicente y las Granadinas 202.0 238.3 192.0 4.7 25.2 -28.4 7.7 -35.6 28.4 -12.4 10.4 – Saint Vincent and the Grenadines Santa Lucía 173.0 206.4 218.6b 33.2 31.7 29.0b -10.3 -31.7 -29.2b -22.8 – 0.2b Saint Lucia Suriname -16.4 -618.8 -77.4 193.1 34.2 173.8 -193.1 -34.2 -173.8 – – – Suriname Trinidad y Tabago -2 326.7 -3 773.7 -4 594.5 -712.6 418.4 316.3 712.6 -418.4 -316.3 – ... ... Trinidad and Tobago Uruguay 2 037.0 502.1 4 006.5 1 588.4 -360.8 2 564.4 -1 588.3 360.8 -2 564.4 -0.1 – – Uruguay Venezuela (República Bolivariana de) -16 834.0 -20 010.0 -31 237.0 -10 799.0 -7 939.0 -4 032.0 10 799.0 7 939.0 4 012.0 – – ... Venezuela (Bolivarian Republic of) América Latina y el Caribe a 69 058.6 143 647.4 173 487.9 46 033.8 86 509.5 105 391.2 -50 488.3 -87 746.9 -105 795.1 280.2 1 343.0 188.7 Latin America and the Caribbean a
América Latina a 67 342.3 144 756.0 173 359.6 45 923.2 86 112.3 105 035.3 -50 437.9 -86 502.6 -105 398.3 377.5 534.2 188.4 Latin America a
El Caribe a 1 716.4 -1 108.5 128.4 110.6 397.2 355.9 -50.3 -1 244.3 -396.8 -97.3 808.8 0.3 The Caribbean a
a Comprende los países que figuran en el presente cuadro. a Includes the countries shown in this table.

CE
PA
L, Anuario E
stadístico de Am
érica Latina y el Caribe, 2012
101 2.2 SECTOR EXTERNO / EXTERNAL SECTOR 2.2.2 COMERCIO EXTERIOR DE BIENES Y SERVICIOS / EXTERNAL TRADE OF GOODS AND SERVICES
2.2.2.1 EXPORTACIONES DE PRODUCTOS PRIMARIOS SEGÚN SU PARTICIPACIÓN EN EL TOTAL EXPORTS OF PRIMARY PRODUCTS AS PERCENTAGE OF TOTAL EXPORTS
(Porcentajes del valor total de las exportaciones FOB de bienes / Percentages of the total value of exports of goods f.o.b. )
País 2004 2005 2006 2007 2008 2009 2010 2011 Country
Argentina 71.2 69.3 68.2 69.1 69.1 68.0 67.8 68.5 Argentina Barbados a 44.4 59.9 54.2 52.6 52.0 29.2 28.3 65.4 Barbados a
Belice 85.0 a 85.1 a 95.9 a 91.6 a 98.6 98.6 98.6 ... Belize Bolivia (Estado Plurinacional de) 86.7 89.4 89.8 91.9 92.8 92.9 92.6 95.5 Bolivia (Plurinational State of) Brasil 47.0 47.3 49.5 51.7 55.4 60.9 63.6 66.2 Brazil Chile 86.8 86.3 89.0 89.6 88.0 88.2 89.6 89.2 Chile Colombia 62.9 65.3 64.4 60.8 68.5 72.6 77.9 82.5 Colombia Costa Rica 37.3 36.2 35.6 35.4 37.6 37.6 39.8 40.6 Costa Rica Cuba 78.5 73.4 73.2 52.4 b 50.4 b 41.3 b ... ... Cuba Ecuador 90.7 91.0 90.4 90.2 91.3 90.8 90.2 92.0 Ecuador El Salvador 40.1 42.5 43.6 45.4 45.3 47.0 38.0 41.3 El Salvador Guatemala 58.2 60.2 65.1 62.1 62.8 66.3 65.3 67.6 Guatemala Guyana 75.8 81.1 a 81.9 a 79.6 a 90.4 a 92.8 a 93.3 a 88.9 a Guyana Haití ... ... ... ... ... ... ... ... Haiti Honduras 63.6 64.2 70.7 71.4 70.7 66.5 79.9 84.8 Honduras Jamaica a 31.5 31.9 40.4 41.9 37.7 48.3 56.1 ... Jamaica a
México c 20.2 23.0 24.3 25.0 27.1 24.9 25.3 29.3 Mexico c
Nicaragua 89.4 89.6 91.3 90.2 89.9 90.9 93.7 95.0 Nicaragua Panamá 90.0 90.9 90.1 89.3 91.3 90.7 ... ... Panama Paraguay 87.3 82.9 84.1 89.1 92.1 89.3 89.3 89.3 Paraguay Perú 83.1 85.3 88.0 87.6 86.6 87.8 89.1 89.3 Peru República Dominicana 20.5 21.2 24.3 21.3 28.7 27.6 32.3 33.2 Dominican Republic Trinidad y Tabago 64.0 73.8 79.1 71.5 a 74.9 a 79.7 a 68.1 ... Trinidad and Tobago Uruguay 68.4 68.5 68.7 68.9 71.3 74.8 74.3 ... Uruguay Venezuela (República Bolivariana de) 86.9 90.6 89.6 d 91.3 d 92.3 d 93.1 d 94.8 d 95.5 d Venezuela (Bolivarian Republic of) Total 46.3 49.8 51.7 52.8 56.8 56.4 57.3 60.7 Total ALADI e 46.2 49.6 51.3 52.6 56.7 56.3 57.3 60.9 LAIA e
Comunidad Andina f 76.1 78.5 79.6 77.8 80.8 82.3 85.1 87.3 Andean Community f
MERCOSUR g 54.1 53.5 54.9 56.9 59.8 63.5 65.3 67.1 MERCOSUR g
MERCOSUR, Bolivia (Estado Plurinacional de) y Chile h 60.5 60.2 63.1 64.8 65.9 68.6 70.4 71.8 MERCOSUR, Bolivia (Plurinational State of) and Chile h
MCCA i 48.8 49.3 50.1 50.7 52.9 53.5 54.9 58.4 CACM i
Otros países j 45.2 53.8 60.9 56.9 62.1 62.7 57.8 36.7 Other countries j
a Incluye las reexportaciones.b No incluye níquel ni petróleo.c Incluye bienes transformados por el proceso de maquila.d Las exportaciones de petróleo de la República Bolivariana de Venezuela corresponden a las exportaciones
totales de petróleo informadas por el banco central del país, así como de la distribución de exportaciones petroleras informada en los Anuarios de PDVSA.
e Argentina, Bolivia (Estado Plurinacional de), Brasil, Chile, Colombia, Cuba, Ecuador, México, Paraguay, Perú, Uruguay y Venezuela (República Bolivariana de).
f Bolivia (Estado Plurinacional de), Colombia, Ecuador, y Perú.g Argentina, Brasil, Paraguay y Uruguay.h Argentina, Brasil, Paraguay, Uruguay más Bolivia (Estado Plurinacional de) y Chile.i Costa Rica, El Salvador, Guatemala, Honduras y Nicaragua.j Barbados, Belice, Guyana, Haití, Jamaica, Panamá, República Dominicana y Trinidad y Tabago.
a Includes re-exports.b Does not include nickel or oil.c Includes goods processed under maquila arrangements.d Petroleum exports by the Bolivarian Republic of Venezuela correspond to total petroleum exports reported by
the central bank and the distribution of oil exports reported in PDVSA yearbooks.e Argentina, Bolivarian Republic of Venezuela, Brazil, Chile, Colombia, Cuba, Ecuador, Mexico, Paraguay,
Peru, Plurinational State of Bolivia and Uruguay.f Colombia, Ecuador, Peru and Plurinational State of Bolivia.g Argentina, Brazil, Paraguay and Uruguay.h Argentina, Brazil, Paraguay, Uruguay plus Chile and Plurinational State of Bolivia.i Costa Rica, El Salvador, Guatemala, Honduras and Nicaragua.j Barbados, Belize, Dominican Republic, Guyana, Haiti, Jamaica, Panama and Trinidad and Tobago.

102 E
CLA
C, S
tatistical Yearbook for Latin A
merica and the C
aribbean, 2012 2.2 SECTOR EXTERNO / EXTERNAL SECTOR 2.2.2 COMERCIO EXTERIOR DE BIENES Y SERVICIOS / EXTERNAL TRADE OF GOODS AND SERVICES
2.2.2.2 EXPORTACIONES DE PRODUCTOS MANUFACTURADOS SEGÚN SU PARTICIPACIÓN EN EL TOTAL EXPORTS OF MANUFACTURED PRODUCTS AS PERCENTAGE OF TOTAL EXPORTS
(Porcentajes del valor total de las exportaciones FOB de bienes/Percentages of the total value of exports of goods, f.o.b.)
País 2004 2005 2006 2007 2008 2009 2010 2011 Country
Argentina 28.8 30.7 31.8 30.9 30.9 32.0 32.2 31.5 Argentina Barbados a 55.6 40.1 45.8 47.4 48.0 70.8 71.7 34.6 Barbados a
Belice 15.0 a 14.9 a 4.1 a 8.4 a 1.4 1.4 1.4 ... Belize Bolivia (Estado Plurinacional de) 13.3 10.6 10.2 8.1 7.2 7.1 7.4 4.5 Bolivia (Plurinational State of) Brasil 53.0 52.7 50.5 48.3 44.6 39.1 36.4 33.8 Brazil Chile 13.2 13.7 11.0 10.4 12.0 11.8 10.4 10.8 Chile Colombia 37.1 34.7 35.6 39.2 31.5 27.4 22.1 17.5 Colombia Costa Rica 62.7 63.8 64.4 64.6 62.4 62.4 60.2 59.4 Costa Rica Cuba 21.5 26.6 26.8 47.6 b 49.6 b 58.7 b ... ... Cuba Ecuador 9.3 9.0 9.6 9.8 8.7 9.2 9.8 8.0 Ecuador El Salvador 59.9 57.5 56.4 54.6 54.7 53.0 62.0 58.7 El Salvador Guatemala 41.8 39.8 34.9 37.9 37.2 33.7 34.7 32.4 Guatemala Guyana 24.2 18.9 a 18.1 a 20.4 a 9.6 a 7.2 a 6.7 a 11.1 a Guyana Haití ... ... ... ... ... ... ... ... Haiti Honduras 36.4 35.8 29.3 28.6 29.3 33.5 20.1 15.2 Honduras Jamaica a 68.5 68.1 59.6 58.1 62.3 51.7 43.9 ... Jamaica a
México c 79.8 77.0 75.7 75.0 72.9 75.1 74.7 70.7 Mexico c
Nicaragua 10.6 10.4 8.7 9.8 10.1 9.1 6.3 5.0 Nicaragua Panamá 10.0 9.1 9.9 10.7 8.7 9.3 ... ... Panama Paraguay 12.7 17.1 15.9 10.9 7.9 10.7 10.7 10.7 Paraguay Perú 16.9 14.7 12.0 12.4 13.4 12.2 10.9 10.7 Peru República Dominicana 79.5 78.8 75.7 78.7 71.3 72.4 67.7 66.8 Dominican Republic Trinidad y Tabago 36.0 26.2 20.9 28.5 a 25.1 a 20.3 a 31.9 ... Trinidad and Tobago Uruguay 31.6 31.5 31.3 31.1 28.7 25.2 25.7 ... Uruguay Venezuela (República Bolivariana de) 13.1 9.4 10.4 8.7 7.7 6.9 5.2 4.5 Venezuela (Bolivarian Republic of) Total 53.7 50.2 48.3 47.2 43.2 43.6 42.7 39.3 Total ALADI d 53.8 50.4 48.7 47.4 43.3 43.7 42.7 39.1 LAIA d
Comunidad Andina e 23.9 21.5 20.4 22.2 19.2 17.7 14.9 12.7 Andean Community e
MERCOSUR f 45.9 46.5 45.1 43.1 40.2 36.5 34.7 32.9 MERCOSUR f
MERCOSUR, Bolivia (Estado Plurinacional de) y Chile g 39.5 39.8 36.9 35.2 34.1 31.4 29.6 28.2 MERCOSUR, Bolivia (Plurinational State of) and Chile g
MCCA h 51.2 50.7 49.9 49.3 47.1 46.5 45.1 41.6 CACM h
Otros países i 54.8 46.2 39.1 43.1 37.9 37.3 42.2 63.3 Other countries i
a Incluye las reexportaciones.b No incluye níquel ni petróleo.c Incluye bienes transformados por el proceso de maquila.d Argentina, Bolivia (Estado Plurinacional de), Brasil, Chile, Colombia, Cuba, Ecuador, México, Paraguay,
Perú, Uruguay y Venezuela (República Bolivariana de).e Bolivia (Estado Plurinacional de), Colombia, Ecuador, y Perú.f Argentina, Brasil, Paraguay y Uruguay.g Argentina, Brasil, Paraguay, Uruguay más Bolivia (Estado Plurinacional de) y Chile.h Costa Rica, El Salvador, Guatemala, Honduras y Nicaragua.i Barbados, Belice, Guyana, Haití, Jamaica, Panamá, República Dominicana y Trinidad y Tabago.
a Includes re-exports.b Does not include nickel or oil.c Includes goods processed under maquila arrangements.d Argentina, Bolivarian Republic of Venezuela, Brazil, Chile, Colombia, Cuba, Ecuador, Mexico,
Paraguay, Peru, Plurinational State of Bolivia and Uruguay.e Colombia, Ecuador, Peru and Plurinational State of Bolivia.f Argentina, Brazil, Paraguay and Uruguay.g Argentina, Brazil, Paraguay, Uruguay plus Chile and Plurinational State of Bolivia.h Costa Rica, El Salvador, Guatemala, Honduras and Nicaragua.i Barbados, Belize, Dominican Republic, Guyana, Haiti, Jamaica, Panama and Trinidad and Tobago.

CE
PA
L, Anuario E
stadístico de Am
érica Latina y el Caribe, 2012
103 2.2 SECTOR EXTERNO / EXTERNAL SECTOR 2.2.2 COMERCIO EXTERIOR DE BIENES Y SERVICIOS / EXTERNAL TRADE OF GOODS AND SERVICES
2.2.2.3 EXPORTACIONES TOTALES FOB POR GRUPOS DE PRODUCTOS: PRODUCTOS PRIMARIOS TOTAL EXPORTS f.o.b., BY PRODUCT GROUP: PRIMARY PRODUCTS
(Millones de dólares/Millions of dollars)
País 2004 2005 2006 2007 2008 2009 2010 2011 Country
Argentina 24 621.3 27 605.9 31 747.6 38 685.7 48 411.1 37 865.6 46 223.8 57 513.9 Argentina Barbados a 96.2 306.1 345.1 172.9 335.7 124.1 110.7 490.0 Barbados a
Belice 184.6 a 182.0 a 270.0 a 256.1 a 290.9 246.2 278.2 ... Belize Bolivia (Estado Plurinacional de) 1 963.1 2 617.9 3 790.5 4 468.4 6 451.7 5 030.9 6 527.7 8 764.4 Bolivia (Plurinational State of) Brasil 45 301.1 55 979.2 68 077.8 82 878.3 109 629.5 93 164.2 128 820.6 169 468.4 Brazil Chile 26 802.7 33 318.0 49 720.5 58 910.6 60 798.8 44 050.8 60 380.8 72 004.9 Chile Colombia 10 565.2 13 833.1 15 697.2 18 236.7 25 776.6 23 835.6 30 909.5 46 319.5 Colombia Costa Rica 2 219.2 2 414.8 2 579.9 3 157.2 3 500.0 3 207.9 3 688.3 4 145.1 Costa Rica Cuba 1 830.0 1 583.9 2 139.6 833.2 b 719.6 b 631.1 b ... ... Cuba Ecuador 7 032.2 9 193.9 11 506.0 12 924.7 17 187.8 12 588.2 15 775.1 20 546.4 Ecuador El Salvador 590.8 704.8 832.3 988.0 1 188.3 1 085.3 1 277.2 1 698.1 El Salvador Guatemala 1 704.7 2 032.3 2 082.0 2 811.0 3 374.3 3 309.2 3 785.4 4 771.0 Guatemala Guyana 411.9 449.1 a 470.3 a 643.6 a 759.0 a 741.8 a 884.9 a 949.4 a Guyana Haití ... ... ... ... ... ... ... ... Haiti Honduras 1 024.8 1 209.3 1 327.9 1 707.8 2 196.6 1 748.6 2 064.8 3 304.4 Honduras Jamaica a 455.3 492.6 818.3 959.2 943.7 673.1 790.0 ... Jamaica a
México c 38 187.4 49 200.0 60 759.1 67 848.9 79 027.2 57 155.6 75 524.6 102 379.7 Mexico c
Nicaragua 650.4 740.3 692.8 1 076.5 1 336.5 1 266.6 1 731.4 2 167.5 Nicaragua Panamá 801.6 876.5 920.2 1 000.9 1 044.9 553.2 ... ... Panama Paraguay 1 419.6 1 500.6 1 602.8 2 444.7 4 042.6 2 827.3 4 050.2 4 926.0 Paraguay Perú 10 043.6 15 210.3 19 997.4 23 484.8 26 359.0 22 746.9 30 778.8 39 891.1 Peru República Dominicana 1 250.0 1 331.9 1 647.0 1 229.0 1 841.0 1 209.2 1 540.4 2 030.9 Dominican Republic Trinidad y Tabago 4 173.2 7 092.8 11 090.6 9 584.7 a 13 980.8 a 7 567.2 a 8 158.3 ... Trinidad and Tobago Uruguay 2 003.8 2 332.3 2 741.6 3 110.7 4 244.3 4 026.0 5 011.6 ... Uruguay Venezuela (República Bolivariana de) 29 210.1 46 556.3 48 936.2 d 52 885.0 d 86 091.0 d 51 954.5 d 60 775.3 d 85 712.5 d Venezuela (Bolivarian Republic of) Total 212 542.8 276 763.9 339 792.7 390 298.6 499 530.9 377 609.1 489 087.6 627 083.2 Total ALADI e 198 980.1 258 931.4 316 716.3 366 711.7 468 739.2 355 876.7 464 778.0 607 526.8 LAIA e
Comunidad Andina f 29 604.1 40 855.2 50 991.1 59 114.6 75 775.1 64 201.6 83 991.1 115 521.4 Andean Community f
MERCOSUR g 73 345.8 87 418.0 104 169.8 127 119.4 166 327.5 137 883.1 184 106.2 231 908.3 MERCOSUR g
MERCOSUR, Bolivia (Estado Plurinacional de) y Chile h 102 111.6 123 353.9 157 680.8 190 498.4 233 578.0 186 964.8 251 014.7 312 677.6 MERCOSUR, Bolivia (Plurinational State of) and Chile h
MCCA i 6 189.9 7 101.5 7 514.9 9 740.5 11 595.7 10 617.6 12 547.1 16 086.1 CACM i
Otros países j 6 960.9 10 281.9 15 091.2 13 202.8 18 437.0 10 373.0 10 877.6 2 520.9 Other countries j
a Incluye las reexportaciones.b No incluye níquel ni petróleo.c Incluye bienes transformados por el proceso de maquila.d Las exportaciones de petróleo de la República Bolivariana de Venezuela corresponden a las exportaciones
totales de petróleo informadas por el banco central del país, así como de la distribución de exportaciones petroleras informada en los Anuarios de PDVSA.
e Argentina, Bolivia (Estado Plurinacional de), Brasil, Chile, Colombia, Cuba, Ecuador, México, Paraguay, Perú, Uruguay y Venezuela (República Bolivariana de).
f Bolivia (Estado Plurinacional de), Colombia, Ecuador, y Perú.g Argentina, Brasil, Paraguay y Uruguay.h Argentina, Brasil, Paraguay, Uruguay más Bolivia (Estado Plurinacional de) y Chile.i Costa Rica, El Salvador, Guatemala, Honduras y Nicaragua.j Barbados, Belice, Guyana, Haití, Jamaica, Panamá, República Dominicana y Trinidad y Tabago.
a Includes re-exports.b Does not include nickel or oil.c Includes goods processed under maquila arrangements.d Petroleum exports by the Bolivarian Republic of Venezuela correspond to total petroleum exports reported by
the central bank and the distribution of oil exports reported in PDVSA yearbooks.e Argentina, Bolivarian Republic of Venezuela, Brazil, Chile, Colombia, Cuba, Ecuador, Mexico, Paraguay,
Peru, Plurinational State of Bolivia and Uruguay.f Colombia, Ecuador, Peru and Plurinational State of Bolivia.g Argentina, Brazil, Paraguay and Uruguay.h Argentina, Brazil, Paraguay, Uruguay plus Chile and Plurinational State of Bolivia.i Costa Rica, El Salvador, Guatemala, Honduras and Nicaragua.j Barbados, Belize, Dominican Republic, Guyana, Haiti, Jamaica, Panama and Trinidad and Tobago.

104 E
CLA
C, S
tatistical Yearbook for Latin A
merica and the C
aribbean, 2012 2.2 SECTOR EXTERNO / EXTERNAL SECTOR 2.2.2 COMERCIO EXTERIOR DE BIENES Y SERVICIOS / EXTERNAL TRADE OF GOODS AND SERVICES
2.2.2.4 EXPORTACIONES TOTALES FOB POR GRUPOS DE PRODUCTOS: PRODUCTOS MANUFACTURADOS TOTAL EXPORTS f.o.b., BY PRODUCT GROUP: MANUFACTURED PRODUCTS
(Millones de dólares/Millions of dollars)
País 2004 2005 2006 2007 2008 2009 2010 2011 Country
Argentina 9 953.4 12 229.6 14 797.5 17 293.7 21 606.7 17 805.6 21 962.7 26 435.6 Argentina Barbados a 120.3 204.6 291.2 155.9 309.4 301.3 280.2 259.7 Barbados a
Belice 32.6 a 31.8 a 11.7 a 23.3 a 4.2 3.5 3.9 ... Belize Bolivia (Estado Plurinacional de) 302.0 311.6 432.6 391.8 501.0 386.5 523.4 417.2 Bolivia (Plurinational State of) Brasil 51 172.1 62 326.8 69 388.9 77 381.6 88 311.1 59 828.6 73 817.2 86 568.5 Brazil Chile 4 091.7 5 277.3 6 160.1 6 827.8 8 285.9 5 866.5 7 040.2 8 760.7 Chile Colombia 6 222.5 7 356.9 8 676.8 11 774.2 11 848.8 9 014.1 8 751.8 9 853.6 Colombia Costa Rica 3 733.3 4 250.4 4 674.7 5 770.2 5 812.5 5 325.4 5 582.6 6 072.3 Costa Rica Cuba 502.0 575.4 784.9 755.8 b 707.2 b 896.3 b ... ... Cuba Ecuador 720.5 906.0 1 221.7 1 396.4 1 630.3 1 274.6 1 714.6 1 775.6 Ecuador El Salvador 883.4 952.6 1 078.7 1 190.6 1 432.3 1 224.5 2 087.5 2 409.5 El Salvador Guatemala 1 223.2 1 345.6 1 115.5 1 716.2 2 001.7 1 683.2 2 009.1 2 284.1 Guatemala Guyana 131.3 104.7 a 103.9 a 164.5 a 80.5 a 57.6 a 63.9 a 118.4 a Guyana Haití ... ... ... ... ... ... ... ... Haiti Honduras 586.0 673.8 551.6 683.5 909.6 879.5 519.5 592.4 Honduras Jamaica a 988.9 1 050.0 1 206.8 1 328.1 1 557.1 719.8 618.3 ... Jamaica a
México c 150 993.4 165 005.8 189 128.0 203 970.9 212 236.0 172 393.4 222 648.2 247 079.6 Mexico c
Nicaragua 77.1 85.8 65.7 117.3 150.6 126.2 116.0 113.2 Nicaragua Panamá 88.7 87.3 101.6 119.6 99.9 56.8 ... ... Panama Paraguay 206.9 310.1 303.5 300.4 347.3 339.7 483.5 591.4 Paraguay Perú 2 039.4 2 614.3 2 739.4 3 338.5 4 066.3 3 157.9 3 756.1 4 795.4 Peru República Dominicana 4 862.4 4 950.7 5 143.2 4 545.2 4 580.5 3 165.1 3 226.3 4 081.6 Dominican Republic Trinidad y Tabago 2 342.9 2 518.2 2 927.7 3 827.0 a 4 689.8 a 1 928.7 a 3 812.9 ... Trinidad and Tobago Uruguay 926.9 1 072.1 1 247.7 1 403.6 1 704.6 1 359.4 1 729.0 ... Uruguay Venezuela (República Bolivariana de) 4 415.6 4 819.3 5 693.8 5 016.2 7 183.4 3 826.1 3 336.7 4 061.7 Venezuela (Bolivarian Republic of) Total 246 616.5 279 060.7 317 847.2 349 492.3 380 056.7 291 620.3 364 083.6 406 270.5 Total ALADI d 231 546.4 262 805.2 300 574.9 329 850.9 358 428.6 276 148.7 345 763.4 390 339.3 LAIA d
Comunidad Andina e 9 284.4 11 188.8 13 070.5 16 900.9 18 046.4 13 833.1 14 745.9 16 841.8 Andean Community e
MERCOSUR f 62 259.3 75 938.6 85 737.6 96 379.3 111 969.7 79 333.3 97 992.4 113 595.5 MERCOSUR f
MERCOSUR, Bolivia (Estado Plurinacional de) y Chile g 66 653.0 81 527.5 92 330.3 103 598.9 120 756.6 85 586.3 105 556.0 122 773.4 MERCOSUR, Bolivia (Plurinational State of) and Chile g
MCCA h 6 503.0 7 308.2 7 486.2 9 477.8 10 306.7 9 238.8 10 314.7 11 471.5 CACM h
Otros países i 8 435.8 8 842.6 9 682.2 9 999.1 11 240.9 6 175.2 7 941.6 4 341.3 Other countries i
a Incluye las reexportaciones.b No incluye níquel ni petróleo.c Incluye bienes transformados por el proceso de maquila.d Argentina, Bolivia (Estado Plurinacional de), Brasil, Chile, Colombia, Cuba, Ecuador, México, Paraguay,
Perú, Uruguay y Venezuela (República Bolivariana de).e Bolivia (Estado Plurinacional de), Colombia, Ecuador, y Perú.f Argentina, Brasil, Paraguay y Uruguay.g Argentina, Brasil, Paraguay, Uruguay más Bolivia (Estado Plurinacional de) y Chile.h Costa Rica, El Salvador, Guatemala, Honduras y Nicaragua.i Barbados, Belice, Guyana, Haití, Jamaica, Panamá, República Dominicana y Trinidad y Tabago.
a Includes re-exports.b Does not include nickel or oil.c Includes goods processed under maquila arrangements.d Argentina, Bolivarian Republic of Venezuela, Brazil, Chile, Colombia, Cuba, Ecuador, Mexico, Paraguay,
Peru, Plurinational State of Bolivia and Uruguay.e Colombia, Ecuador, Peru and Plurinational State of Bolivia.f Argentina, Brazil, Paraguay and Uruguay.g Argentina, Brazil, Paraguay, Uruguay plus Chile and Plurinational State of Bolivia.h Costa Rica, El Salvador, Guatemala, Honduras and Nicaragua.i Barbados, Belize, Dominican Republic, Guyana, Haiti, Jamaica, Panama and Trinidad and Tobago.

CE
PA
L, Anuario E
stadístico de Am
érica Latina y el Caribe, 2012
105 2.2 SECTOR EXTERNO / EXTERNAL SECTOR 2.2.2 COMERCIO EXTERIOR DE BIENES Y SERVICIOS / EXTERNAL TRADE OF GOODS AND SERVICES
2.2.2.5 AMÉRICA LATINA Y EL CARIBE: EXPORTACIÓN DE LOS 10 PRODUCTOS PRINCIPALES CONFORME A LA CUCI REV.1, SEGÚN PARTICIPACIÓN PORCENTUAL EN CADA AÑO a b c LATIN AMERICA AND THE CARIBBEAN: EXPORTS OF THE 10 LEADING PRODUCTS (SITC, REV.1), BY THEIR PERCENTAGE SHARE EACH YEAR a b c
(Productos principales/Leading products)
2004 2005 2006 2007 2008 2009 2010 e f 2011 e f g
33101 Petróleos crudos 11.9 14.5 15.9 15.4 17.4 14.3 15.2 17.2 Crude petroleum2813 Mineral de hierro y sus concentrados (excepto piritas de
hierro tostadas)... ... ... ... 1.9 2.0 3.7 4.4 Iron ore and concentrates (except roasted iron pyrites)
7321 Vehículos automotores, montados o sin montar, para pasajeros (que no sean ni autobuses ni vehículos para usos especiales)
3.4 3.3 3.7 3.6 3.4 3.2 3.7 3.5 Passenger motor cars (other than buses or special vehicles), whether or not assembled
3320 Productos derivados del petróleo 3.8 4.7 3.2 2.7 5.2 4.1 3.3 3.4 Petroleum products68212 Cobre refinado (incluido el refundido) 2.1 2.2 3.1 3.1 2.7 2.6 3.0 2.8 Refined copper (including remelted)97101 Oro (incluso oro platinado) no monetario, en bruto
semilabrado o en polvo... ... ... ... ... ... ... 2.4 Gold (incl. platinum-plated gold) non-monetary,
unwrought, semi-manufactured or dust2214 Soya (excepto la harina fina y gruesa) 1.7 1.5 ... 1.5 2.0 2.2 2.2 2.3 Soybeans (excluding flour and meal)28311 Mineral y concentrados de cobre ... 1.6 2.4 2.7 2.0 1.9 2.4 2.2 Ores and concentrates of copper7241 Aparatos receptores de televisión, con o sin gramófono o radio 1.7 1.9 2.6 3.0 2.6 2.8 2.5 1.8 Television broadcast receivers, whether or not combined
with gramophone or radio73289 Otras partes para vehículos automotores, salvo motocicletas 1.9 1.8 1.8 2.1 ... ... 1.6 1.6 Other parts for motor vehicles other than for motorcycles0813 Tortas y harinas de semillas oleaginosas y otros residuos de
aceite vegetal1.6 ... ... ... 1.4 2.0 ... ... Oil seed cake and meal and other vegetable oil residues
7143 Máquinas de estadística que calculan a base de tarjetas perforadas o cintas
2.4 1.7 1.5 ... ... ... ... ... Statistical machines, e.g., calculating from punched cards or tape
72491 Aparatos eléctricos para telefonía y telegrafía alámbricas ... ... ... 1.6 2.0 2.5 2.2 ... Electrical line telephone and telegraph equipment72499 Otro equipo para telecomunicaciones ... 1.9 1.9 ... ... ... ... ... Other telecommunications equipment7323 Camiones y camionetas (incluso coches ambulancias, etc.),
montados o sin montar1.5 ... 1.6 1.5 ... ... ... ... Lorries and trucks (including ambulances, etc.), whether
or not assembledTotal de los productos principales (porcentajes) 32.0 35.1 37.7 37.2 40.6 37.6 39.8 41.6 Average share of leading products (percentages)Exportaciones al mundo (millones de dólares) 452 546.6 549 032.6 650 317.9 733 246.6 872 368.4 664 091.1 847 496.2 1 026 173.5 Exports to the world market (millions of dollars)
a Argentina, Barbados, Belice, Brasil, Chile, Colombia, Costa Rica, Cuba, Dominica, Ecuador, El Salvador, Estado Plurinacional de Bolivia, Guatemala, Honduras, Jamaica, México, Nicaragua, Panamá, Paraguay, Perú, República Bolivariana de Venezuela, Trinidad y Tabago y Uruguay.
b Los datos que aporta México incluyen los bienes transformados por el proceso de la maquila.c Las exportaciones de petróleo de la República Bolivariana de Venezuela a partir del año 2006
corresponden a las exportaciones totales de petróleo informadas por el banco central del país, así como de la distribución de exportaciones petroleras informada en los Anuarios de PDVSA.
d Los países del Caribe (Barbados, Belice, Dominica, Jamaica, Panamá y Trinidad y Tabago) pueden incluir a partir del año 2004 las reexportaciones. Ver detalle en cuadro país correspondiente.
e Información no disponible para Cuba.f Información no disponible para Panamá.g Información no disponible para Belice, Dominica, Jamaica, Trinidad y Tabago y Uruguay.
a Argentina, Barbados, Belize, Bolivarian Republic of Venezuela, Brazil, Chile, Colombia, Costa Rica, Cuba, Dominica, Ecuador, El Salvador, Guatemala, Honduras, Jamaica, Mexico, Nicaragua, Panama, Paraguay, Peru, Plurinational State of Bolivia, Trinidad and Tobago and Uruguay.
b The data supplied by Mexico include goods processed under maquila arrangements.c From 2006 on, petroleum exports by the Bolivarian Republic of Venezuela correspond to total
petroleum exports reported by the central bank and the distribution of oil exports reported in PDVSA yearbooks.
d As from 2004, the figures relating to Panama and some Caribbean countries (Barbados, Belize, Dominica, Jamaica, and Trinidad and Tobago) may include reexports. For further details see the table of the relevant country.
e Information not available for Cuba.f Information not available for Panama.g Information not available for Belize, Dominica, Jamaica,Trinidad and Tobago and Uruguay.

106 E
CLA
C, S
tatistical Yearbook for Latin A
merica and the C
aribbean, 2012 2.2 SECTOR EXTERNO / EXTERNAL SECTOR 2.2.2 COMERCIO EXTERIOR DE BIENES Y SERVICIOS / EXTERNAL TRADE OF GOODS AND SERVICES
2.2.2.6 ASOCIACIÓN LATINOAMERICANA DE INTEGRACIÓN: EXPORTACIÓN DE LOS 10 PRODUCTOS PRINCIPALES CONFORME A LA CUCI REV.1, SEGÚN PARTICIPACIÓN PORCENTUAL EN CADA AÑO a b c
LATIN AMERICAN INTEGRATION ASSOCIATION: EXPORTS OF THE 10 LEADING PRODUCTS (SITC, REV. 1), BY THEIR PERCENTAGE SHARE EACH YEAR a b c
(Productos principales/Leading products)
2004 2005 2006 2007 2008 2009 2010 d 2011 d e
33101 Petróleos crudos 12.2 14.9 16.4 15.9 18.0 14.8 15.7 17.7 Crude petroleum
2813 Mineral de hierro y sus concentrados (excepto piritas de hierro tostadas)
... ... ... ... 2.0 2.1 3.8 4.5 Iron ore and concentrates (except roasted iron pyrites)
7321 Vehículos automotores, montados o sin montar, para pasajeros (que no sean ni autobuses ni vehículos para usos especiales)
3.5 3.5 3.9 3.8 3.5 3.3 3.9 3.6 Passenger motor cars (other than buses or special vehicles), whether or not assembled
3320 Productos derivados del petróleo 3.7 4.3 2.6 2.5 4.8 4.0 3.0 3.4 Petroleum products
68212 Cobre refinado (incluido el refundido) 2.2 2.3 3.2 3.3 2.9 2.7 3.2 2.9 Refined copper (including remelted)
97101 Oro (incluso oro platinado) no monetario, en bruto semilabrado o en polvo
... ... ... ... ... ... ... 2.4 Gold (incl. platinum-plated gold) non-monetary, unwrought, semi-manufactured or dust
2214 Soya (excepto la harina fina y gruesa) 1.8 1.6 ... 1.6 2.1 2.3 2.3 2.4 Soybeans (excluding flour and meal)
28311 Mineral y concentrados de cobre ... 1.7 2.5 2.8 2.1 2.0 2.5 2.2 Ores and concentrates of copper
7241 Aparatos receptores de televisión, con o sin gramófono o radio
1.8 2.0 2.7 3.1 2.7 2.9 2.6 1.9 Television broadcast receivers, whether or not combined with gramophone or radio
73289 Otras partes para vehículos automotores, salvo motocicletas
2.0 1.9 1.9 2.2 ... ... 1.7 1.7 Other parts for motor vehicles other than for motorcycles
0813 Tortas y harinas de semillas oleaginosas y otros residuos de aceite vegetal
1.7 ... ... ... 1.5 2.1 ... ... Oil seed cake and meal and other vegetable oil residues
7143 Máquinas de estadística que calculan a base de tarjetas perforadas o cintas
2.5 1.8 1.5 ... ... ... ... ... Statistical machines, e.g., calculating from punched cards or tape
72491 Aparatos eléctricos para telefonía y telegrafía alámbricas ... ... ... 1.7 2.1 2.6 2.3 ... Electrical line telephone and telegraph equipment
72499 Otro equipo para telecomunicaciones ... 2.0 2.0 ... ... ... ... ... Other telecommunications equipment
7323 Camiones y camionetas (incluso coches ambulancias, etc.), montados o sin montar
1.5 ... 1.6 1.6 ... ... ... ... Lorries and trucks (including ambulances, etc.), whether or not assembled
Total de los productos principales (porcentajes) 32.9 36.0 38.3 38.5 41.7 38.8 41.0 42.7 Average share of leading products (percentages)
Exportaciones al mundo (millones de dólares) 430 526.6 521 736.6 617 291.0 696 562.8 827 167.9 632 025.3 810 541.5 997 866.1 Exports to the world market (millions of dollars)
a Argentina, Bolivia, Brasil, Chile, Colombia, Cuba, Ecuador, México, Paraguay, Perú, República Bolivariana de Venezuela y Uruguay.
b A partir de 1992 los datos que aporta México incluyen los bienes transformados por el proceso de la maquila.
c Las exportaciones de petróleo de la República Bolivariana de Venezuela a partir del año 2006 corresponden a las exportaciones totales de petróleo informadas por el banco central del país, así como de la distribución de exportaciones petroleras informada en los Anuarios de PDVSA.
d Información no disponible para Cuba.e Información no disponible para Uruguay.
a Argentina, Bolivarian Republic of Venezuela, Bolivia, Brazil, Chile, Colombia, Cuba, Ecuador, Mexico, Paraguay, Peru and Uruguay.
b Starting from 1992, the data supplied by Mexico include goods processed under maquila arrangements
c From 2006 on, petroleum exports by the Bolivarian Republic of Venezuela correspond to total petroleum exports reported by the central bank and the distribution of oil exports reported in PDVSA yearbooks.
d Information not available for Cuba.e Information not available for Uruguay.

CE
PA
L, Anuario E
stadístico de Am
érica Latina y el Caribe, 2012
107 2.2 SECTOR EXTERNO / EXTERNAL SECTOR 2.2.2 COMERCIO EXTERIOR DE BIENES Y SERVICIOS / EXTERNAL TRADE OF GOODS AND SERVICES
2.2.2.7 COMUNIDAD ANDINA: EXPORTACIÓN DE LOS 10 PRODUCTOS PRINCIPALES CONFORME A LA CUCI REV.1, SEGÚN PARTICIPACIÓN PORCENTUAL EN CADA AÑO a
ANDEAN COMMUNITY: EXPORTS OF THE 10 LEADING PRODUCTS (SITC, REV. 1), BY THEIR PERCENTAGE SHARE EACH YEAR a
(Productos principales/Leading products)
2004 2005 2006 2007 2008 2009 2010 2011
33101 Petróleos crudos 18.2 18.7 19.2 18.2 21.5 18.5 22.7 26.2 Crude petroleum97101 Oro (incluso oro platinado) no monetario, en bruto
semilabrado o en polvo7.3 7.2 7.2 6.3 6.9 10.6 9.9 9.6 Gold (incl. platinum-plated gold) non-monetary,
unwrought, semi-manufactured or dust3320 Productos derivados del petróleo 5.1 6.0 5.3 5.4 6.3 5.1 5.9 6.4 Petroleum products28311 Mineral y concentrados de cobre 2.8 2.9 4.5 6.0 5.2 5.0 6.2 5.9 Ores and concentrates of copper3214 Carbón (antracita, hullas) 4.5 4.7 4.4 4.4 4.9 6.7 5.6 5.8 Coal (anthracite, bituminous)3411 Gas, natural ... ... 2.6 2.6 3.3 2.5 2.8 4.0 Natural gas0711 Café verde o tostado y sucedáneos del café que
contengan café3.2 2.9 3.1 2.3 2.7 2.7 2.8 3.1 Coffee, green or roasted, and coffee substitutes
containing coffee0513 Plátanos (incluso bananas) frescos 3.7 3.1 2.7 2.5 2.4 3.6 2.8 2.3 Bananas including plantains, fresh68212 Cobre refinado (incluido el refundido) 3.3 3.6 4.6 3.2 2.9 2.3 2.6 2.0 Refined copper (including remelted)2835 Mineral de zinc y sus concentrados ... ... 3.6 3.9 2.2 2.3 2.4 1.6 Ores and concentrates of zinc0814 Harina de carne (incluso el residuo de grasas) y harina de
pescado, impropios para la alimentación humana2.5 ... ... ... ... ... ... ... Meat meal, including tankage, and fish meal, unfit for
human consumption28393 Minerales de titanio, vanadio, molibdeno, tántalo, zirconio, y
sus concentrados... 2.5 ... ... ... ... ... ... Ores and concentrates of titanium, vanadium,
molybdenum, tantalum, zirconium29271 Flores y capullos cortados para adornos 2.7 2.5 ... ... ... ... ... ... Cut flowers and buds for ornamental purposesTotal de los productos principales (porcentajes) 53.3 54.1 57.2 54.8 58.3 59.3 63.7 66.9 Average share of leading products (percentages)Exportaciones al mundo (millones de dólares) 38 888.6 52 043.9 64 061.7 76 015.6 93 821.5 78 034.6 98 737.0 132 363.3 Exports to the world market (millions of dollars)
a Bolivia (Estado Plurinacional de), Colombia, Ecuador y Perú a Colombia, Ecuador, Peru and Plurinational State of Bolivia.

108 E
CLA
C, S
tatistical Yearbook for Latin A
merica and the C
aribbean, 2012 2.2 SECTOR EXTERNO / EXTERNAL SECTOR 2.2.2 COMERCIO EXTERIOR DE BIENES Y SERVICIOS / EXTERNAL TRADE OF GOODS AND SERVICES
2.2.2.8 MERCADO COMÚN CENTROAMERICANO: EXPORTACIÓN DE LOS 10 PRODUCTOS PRINCIPALES CONFORME A LA CUCI REV.1, SEGÚN PARTICIPACIÓN PORCENTUAL EN CADA AÑO a
CENTRAL AMERICAN COMMON MARKET: EXPORTS OF THE 10 LEADING PRODUCTS (SITC, REV.1), BY THEIR PERCENTAGE SHARE EACH YEAR a
(Productos principales/Leading products)
2004 2005 2006 2007 2008 2009 2010 2011
0711 Café verde o tostado y sucedáneos del café que contengan café 8.2 9.1 9.8 8.9 9.5 9.1 9.7 13.9 Coffee, green or roasted, and coffee substitutes containing coffee7293 Válvulas y tubos electrónicos (de cátodo caliente, etc.), células
fotoeléctricas, transistores, etc.2.1 5.6 8.2 7.6 4.9 4.4 4.2 6.9 Thermionic, etc. valves and tubes, photocells, transistors, etc.
0513 Plátanos (incluso bananas) frescos 7.5 6.2 6.8 6.1 5.5 6.6 5.6 6.0 Bananas including plantains, fresh0611 Azúcar de remolacha y de caña, sin refinar (excepto los
jarabes)1.9 2.3 2.8 2.6 2.3 3.2 4.2 3.2 Raw sugar, beet and cane (not including syrups)
86171 Instrumentos y aparatos de medicina, etc. (excepto los electromédicos)
3.8 3.5 3.9 3.4 2.8 3.5 3.4 3.1 Medical instruments and appliances, etc. (excluding electromedical)
05195 Frutas tropicales frescas con excepción de plátanos 2.1 2.3 2.9 2.6 2.7 3.1 3.0 2.6 Tropical fruit other than bananas, fresh97101 Oro (incluso oro platinado) no monetario, en bruto semilabrado
o en polvo... ... ... ... ... ... 2.1 2.4 Gold (incl. platinum-plated gold) non-monetary, unwrought,
semi-manufactured or dust8930 Artículos de materias plásticas artificiales, n.e.p. ... 2.3 1.6 1.5 1.7 ... 1.6 2.1 Articles of artificial plastic materials, n.e.s.5417 Medicamentos 3.3 3.0 ... 2.7 2.6 2.9 2.4 1.9 Medicaments0111 Carne de ganado vacuno, fresca, refrigerada o congelada ... ... ... ... ... ... ... 1.5 Meat of bovine animals, fresh, chilled or frozen0313 Crustáceos y moluscos, frescos, refrigerados, congelados,
salados o desecados1.5 ... 1.6 ... ... ... ... ... Crustacea and molluscs, fresh, chilled, salted or dried
07524 Nuez moscada, macis y cardamomos ... ... ... ... ... 1.5 ... ... Nutmeg, mace and cardamoms33101 Petróleos crudos 1.4 1.6 ... ... ... ... ... ... Crude petroleum4222 Aceite de palma ... ... ... ... 1.7 ... ... ... Palm oil71492 Piezas de máquinas de oficina, n.e.p. 7.1 4.7 4.2 5.3 4.8 6.2 3.8 ... Parts of office machinery, n.e.s.7231 Hilos y cables con aislante ... ... 1.7 2.0 ... ... ... ... Insulated wire and cable89293 Sellos de correo y similares, billetes de banco, títulos de
acciones, etc. sin emitir... ... ... ... ... 1.8 ... ... Unissued postage and similar stamps, banknotes, similar
documents of title etc.Total de los productos principales (porcentajes) 38.9 40.6 43.5 42.7 38.5 42.3 40.0 43.6 Average share of leading products (percentages)Exportaciones al mundo (millones de dólares) 12 692.7 14 409.8 15 001.2 19 218.3 21 902.3 19 856.5 22 861.8 27 557.7 Exports to the world market (millions of dollars)
a Costa Rica, El Salvador, Guatemala, Honduras y Nicaragua. a Costa Rica, El Salvador, Guatemala, Honduras and Nicaragua.

CE
PA
L, Anuario E
stadístico de Am
érica Latina y el Caribe, 2012
109 2.2 SECTOR EXTERNO / EXTERNAL SECTOR 2.2.2 COMERCIO EXTERIOR DE BIENES Y SERVICIOS / EXTERNAL TRADE OF GOODS AND SERVICES
2.2.2.9 MERCADO COMÚN DEL SUR: EXPORTACIÓN DE LOS 10 PRODUCTOS PRINCIPALES CONFORME A LA CUCI REV.1, SEGÚN PARTICIPACIÓN PORCENTUAL EN CADA AÑO a
COMMON MARKET OF THE SOUTH: EXPORTS OF THE 10 LEADING PRODUCTS (SITC, REV.1), BY THEIR PERCENTAGE SHARE EACH YEAR a
(Productos principales/Leading products)
2004 2005 2006 2007 2008 2009 2010 2011 b
2813 Mineral de hierro y sus concentrados (excepto piritas de hierro tostadas)
3.5 4.5 4.7 4.7 5.9 6.1 10.2 12.1 Iron ore and concentrates (except roasted iron pyrites)
2214 Soya (excepto la harina fina y gruesa) 5.8 5.1 4.2 5.0 6.2 6.6 6.5 7.0 Soybeans (excluding flour and meal)33101 Petróleos crudos 3.5 4.1 4.9 4.0 5.5 5.4 6.7 6.3 Crude petroleum0813 Tortas y harinas de semillas oleaginosas y otros residuos de
aceite vegetal5.3 4.2 2.4 2.7 4.4 6.0 4.7 4.7 Oil seed cake and meal and other vegetable oil residues
3320 Productos derivados del petróleo 4.4 4.8 5.2 5.1 5.1 3.8 3.4 3.6 Petroleum products0611 Azúcar de remolacha y de caña, sin refinar (excepto los jarabes) ... ... 2.1 ... ... 2.8 3.3 3.4 Raw sugar, beet and cane (not including syrups)7321 Vehículos automotores, montados o sin montar, para pasajeros
(que no sean ni autobuses ni vehículos para usos especiales)2.5 2.7 3.2 3.1 2.8 2.8 3.0 2.6 Passenger motor cars (other than buses or special
vehicles), whether or not assembled0711 Café verde o tostado y sucedáneos del café que
contengan café... 1.6 ... ... ... 1.7 1.8 2.3 Coffee, green or roasted, and coffee substitutes
containing coffee0114 Aves de corral, muertas o limpias (incluso sus despojos,
excepto el hígado), frescas, refrigeradas o congeladas2.0 2.1 1.6 2.0 2.2 2.3 2.1 2.1 Poultry, killed or dressed (including poultry offals other
than liver), fresh, chilled or frozen4212 Aceite de soya 1.8 ... ... 2.1 1.9 ... ... 1.6 Soya bean oil0111 Carne de ganado vacuno, fresca, refrigerada o congelada 2.6 ... 2.4 2.1 2.1 ... ... ... Meat of bovine animals, fresh, chilled or frozen25172 Pulpa de madera al sulfato blanqueada, con excepción
de la soluble... ... ... ... ... ... 1.6 ... Sulphate wood pulp, bleached, other than dissolving
grades72499 Otro equipo para telecomunicaciones ... 1.7 ... ... ... ... ... ... Other telecommunications equipment7341 Aeronaves más pesadas que el aire 2.4 2.0 1.7 2.1 2.0 1.8 ... ... Aircraft, heavier-than-airTotal de los productos principales (porcentajes) 33.8 32.8 32.4 32.9 38.1 39.3 43.3 45.7 Average share of leading products (percentages)
Exportaciones al mundo (millones de dólares) 135 605.1 163 356.6 189 907.3 223 498.7 278 297.2 217 216.3 282 098.6 345 503.7 Exports to the world market (millions of dollars)
a Argentina, Brasil, Paraguay y Uruguay.b Información no disponible para Uruguay.
a Argentina, Brazil, Paraguay and Uruguay.b Information not available for Uruguay.

110 E
CLA
C, S
tatistical Yearbook for Latin A
merica and the C
aribbean, 2012 2.2 SECTOR EXTERNO / EXTERNAL SECTOR 2.2.2 COMERCIO EXTERIOR DE BIENES Y SERVICIOS / EXTERNAL TRADE OF GOODS AND SERVICES
2.2.2.10 MERCADO COMÚN DEL SUR, BOLIVIA (ESTADO PLURINACIONAL DE ) Y CHILE: EXPORTACIÓN DE LOS 10 PRODUCTOS PRINCIPALES CONFORME A LA CUCI REV.1, SEGÚN PARTICIPACIÓN PORCENTUAL EN CADA AÑO a
COMMON MARKET OF THE SOUTH, PLURINATIONAL STATE OF BOLIVIA AND CHILE: EXPORTS OF THE 10 LEADING PRODUCTS (SITC, REV.1), BY THEIR PERCENTAGE SHARE EACH YEAR a
(Productos principales/Leading products)
2004 2005 2006 2007 2008 2009 2010 2011 b
2813 Mineral de hierro y sus concentrados (excepto piritas de hierro tostadas)
2.8 3.6 3.6 3.6 4.7 4.9 8.4 10.0 Iron ore and concentrates (except roasted iron pyrites)
68212 Cobre refinado (incluido el refundido) 5.0 5.0 6.8 6.9 5.9 5.7 6.5 6.1 Refined copper (including remelted)2214 Soya (excepto la harina fina y gruesa) 4.6 4.0 3.2 3.8 4.9 5.3 5.1 5.5 Soybeans (excluding flour and meal)33101 Petróleos crudos 2.9 3.4 3.9 3.1 4.4 4.4 5.3 5.0 Crude petroleum0813 Tortas y harinas de semillas oleaginosas y otros residuos de
aceite vegetal4.4 3.5 1.9 2.2 3.5 4.9 3.8 3.8 Oil seed cake and meal and other vegetable oil
residues28311 Mineral y concentrados de cobre 2.9 3.5 5.1 5.1 3.6 3.2 3.9 3.3 Ores and concentrates of copper3320 Productos derivados del petróleo 3.6 4.2 4.4 4.2 4.3 3.0 2.7 2.9 Petroleum products0611 Azúcar de remolacha y de caña, sin refinar (excepto los
jarabes)... ... 1.6 ... ... 2.2 2.6 2.7 Raw sugar, beet and cane (not including syrups)
7321 Vehículos automotores, montados o sin montar, para pasajeros (que no sean ni autobuses ni vehículos para usos especiales)
2.0 2.1 2.4 2.3 2.2 2.2 2.3 2.1 Passenger motor cars (other than buses or special vehicles), whether or not assembled
0711 Café verde o tostado y sucedáneos del café que contengan café
... ... ... ... ... ... ... 1.8 Coffee, green or roasted, and coffee substitutes containing coffee
0111 Carne de ganado vacuno, fresca, refrigerada o congelada 2.1 ... 1.8 ... 1.6 ... ... ... Meat of bovine animals, fresh, chilled or frozen0114 Aves de corral, muertas o limpias (incluso sus despojos,
excepto el hígado), frescas, refrigeradas o congeladas... 1.7 ... ... 1.7 1.8 ... ... Poultry, killed or dressed (including poultry offals
other than liver), fresh, chilled or frozen25172 Pulpa de madera al sulfato blanqueada, con excepción
de la soluble... ... ... ... ... ... 1.9 ... Sulphate wood pulp, bleached, other than dissolving
grades4212 Aceite de soya ... ... ... 1.6 ... ... ... ... Soya bean oil7341 Aeronaves más pesadas que el aire 1.9 1.6 ... 1.6 ... ... ... ... Aircraft, heavier-than-airTotal de los productos principales (porcentajes) 32.2 32.6 34.7 34.4 36.8 37.6 42.5 43.2 Average share of leading products (percentages)
Exportaciones al mundo (millones de dólares) 168 764.6 204 881.3 250 011.0 294 097.4 354 334.6 272 551.0 356 570.8 435 451.0 Exports to the world market (millions of dollars)
a Argentina, Brasil, Paraguay, Uruguay más Bolivia (Estado Plurinacional de), y Chile.b Información no disponible para Uruguay.
a Argentina, Brazil, Paraguay, Uruguay plus Chile and Plurinational State of Bolivia.b Information not available for Uruguay.

CE
PA
L, Anuario E
stadístico de Am
érica Latina y el Caribe, 2012
111 2.2 SECTOR EXTERNO / EXTERNAL SECTOR 2.2.2 COMERCIO EXTERIOR DE BIENES Y SERVICIOS / EXTERNAL TRADE OF GOODS AND SERVICES
2.2.2.45 EXPORTACIONES INTRARREGIONALES INTRAREGIONAL EXPORTS
(Porcentajes de las exportaciones intrarregionales con respecto a las exportaciones totales, calculadas sobre la base de las exportaciones FOB Percentages of intraregional exports with respect to total exports calculated on the basis of f.o.b. exports)
País 2004 2005 2006 2007 2008 2009 2010 2011 Country
Argentina 40.4 39.9 42.1 40.3 39.4 42.3 41.8 40.7 Argentina Bolivia (Estado Plurinacional de) 65.3 67.4 65.6 62.4 65.0 59.6 60.2 59.9 Bolivia (Plurinational State of) Brasil 23.1 25.1 25.9 24.7 23.5 20.9 21.8 20.6 Brazil Chile 17.8 17.2 16.8 16.7 19.4 18.1 17.1 16.3 Chile Colombia 33.3 33.5 31.1 36.0 35.8 30.7 26.6 27.9 Colombia Cuba 22.2 26.1 23.8 44.5 a 44.9 a 49.0 a ... ... Cuba Ecuador 34.4 30.8 27.4 33.8 35.8 42.1 39.4 33.1 Ecuador México b 3.3 4.5 5.0 6.0 7.0 6.4 7.0 7.5 Mexico b
Paraguay 59.4 57.8 59.3 63.1 68.9 69.6 67.9 65.7 Paraguay Perú 19.7 20.9 20.6 21.0 21.0 15.6 16.9 17.4 Peru Uruguay 36.3 34.6 36.9 40.6 40.3 38.9 42.3 ... Uruguay Venezuela (República Bolivariana de) 18.1 13.4 12.5 c 12.0 c 12.3 c 12.8 c 13.3 c 11.4 c Venezuela (Bolivarian Republic of) Total de la ALADI 16.0 16.8 17.1 18.0 18.9 18.1 18.1 17.7 Total LAIA Costa Rica 25.7 24.9 18.4 24.7 28.3 26.5 28.4 29.1 Costa Rica El Salvador 64.9 64.8 63.7 66.4 65.8 66.9 56.9 54.8 El Salvador Guatemala 55.8 52.4 47.1 54.5 55.3 52.4 55.1 51.6 Guatemala Honduras 26.5 24.1 19.0 31.2 37.5 25.1 24.5 28.0 Honduras Nicaragua 41.9 43.4 23.0 44.8 43.6 47.9 41.8 39.6 Nicaragua Total del MCCA 38.2 36.9 30.6 38.5 41.8 39.0 40.0 39.4 Total CACM Bahamas d 1.3 0.9 2.6 2.1 4.2 2.2 4.3 3.5 Bahamas d
Barbados d 27.1 17.6 16.5 39.5 15.4 20.7 23.8 28.3 Barbados d
Belice 14.0 d 16.2 d 25.4 d 37.7 d 26.1 10.7 15.3 ... Belize
Guyana 19.1 19.4 d 18.5 d 20.0 d 15.1 d 14.6 d 19.8 d 24.1 d Guyana Haití ... ... ... ... ... ... ... ... Haiti
Jamaica d 5.2 4.0 3.6 3.3 3.9 6.4 5.4 ... Jamaica d
Panamá 17.1 19.0 18.7 16.2 16.0 18.6 ... ... Panama República Dominicana 4.7 d 4.7 7.2 11.8 14.3 20.3 23.4 24.6 Dominican Republic Suriname 11.0 d 10.1d 10.6 d 9.0 d 13.9 d ... 15.0 16.2 d Suriname Trinidad y Tabago 17.1 25.9 20.2 19.9 d 26.2 d 19.4 d 26.2 d ... Trinidad and Tobago Total de la región 16.4 17.3 17.3 18.4 19.5 18.7 18.8 18.3 Total region
a No incluye níquel ni petróleo.b Incluye bienes transformados por el proceso de maquila.c Las exportaciones de petróleo de la República Bolivariana de Venezuela
corresponden a las exportaciones totales de petróleo informadas por el banco central del país, así como a la distribución de exportaciones petroleras informada en los anuarios de Petróleos de Venezuela S.A. (PDVSA).
d Incluye las reexportaciones.
a Does not include nickel and petroleum.b Includes goods processed under maquila arrangements.c Petroleum exports by the Bolivarian Republic of Venezuela
correspond to total petroleum exports reported by the central bank and the distribution of oil exports reported in PDVSA yearbooks.
d Includes re-exports.

112 E
CLA
C, S
tatistical Yearbook for Latin A
merica and the C
aribbean, 2012 2.2 SECTOR EXTERNO / EXTERNAL SECTOR 2.2.2 COMERCIO EXTERIOR DE BIENES Y SERVICIOS / EXTERNAL TRADE OF GOODS AND SERVICES
2.2.2.46 IMPORTACIONES INTRARREGIONALES INTRAREGIONAL IMPORTS
(Porcentajes de las importaciones intrarregionales con respecto a las importaciones totales Percentages of intraregional imports with respect to total imports)
País 2004 2005 2006 2007 2008 2009 2010 2011 Country
Argentina 44.6 47.4 46.3 44.9 45.1 45.9 45.0 42.4 Argentina Bolivia (Estado Plurinacional de) 72.8 71.2 56.6 52.4 54.5 54.1 57.2 49.5 Bolivia (Plurinational State of) Brasil 15.7 15.7 17.0 16.9 16.1 16.9 16.7 15.4 Brazil Chile 38.4 38.1 34.6 31.0 29.8 28.9 29.0 27.7 Chile Colombia 28.3 32.3 33.7 33.3 28.3 27.3 28.3 28.4 Colombia Cuba 36.8 38.6 23.6 22.5 39.4 43.1 45.0 47.6 Cuba Ecuador 40.8 41.1 37.4 35.0 43.0 33.9 32.4 30.1 Ecuador México 5.2 5.1 5.2 4.7 4.4 3.6 3.6 3.0 Mexico Paraguay 52.3 48.0 51.6 50.5 51.7 50.8 48.0 45.8 Paraguay Perú 42.4 45.2 43.5 38.4 35.8 33.6 31.7 31.9 Peru Uruguay 60.4 53.3 60.5 50.6 50.9 52.2 47.5 46.7 Uruguay Venezuela (República Bolivariana de) 35.0 36.2 36.0 40.7 41.1 39.7 32.8 32.5 Venezuela (Bolivarian Republic of) Total de la ALADI 18.0 19.3 19.5 19.9 20.3 19.3 18.9 18.2 Total LAIA Costa Rica 24.9 25.9 22.7 26.0 27.7 24.2 24.5 22.9 Costa Rica El Salvador 36.4 40.9 28.6 38.2 43.2 42.1 41.1 38.5 El Salvador Guatemala 29.8 33.8 27.4 30.7 33.0 32.6 31.2 30.4 Guatemala Honduras 22.9 25.0 20.7 25.3 28.2 31.2 28.5 28.6 Honduras Nicaragua 50.5 50.5 43.1 46.9 47.8 50.9 48.5 53.1 Nicaragua Total del MCCA 30.1 32.6 26.4 31.2 33.6 33.2 32.1 31.6 Total CACM Bahamas 14.6 22.4 19.3 6.7 2.5 5.3 11.4 7.6 Bahamas Barbados 28.4 42.3 44.3 32.2 45.0 31.4 34.0 9.3 Barbados Belice 25.0 21.9 25.9 26.6 25.2 24.0 22.2 17.0 Belize Guyana 42.2 57.1 56.3 42.3 44.2 24.6 36.8 17.0 Guyana Haití 19.8 24.9 30.8 32.7 32.2 35.7 30.2 33.3 Haiti Jamaica 23.0 33.9 35.3 30.2 40.6 39.1 39.8 28.8 Jamaica Panamá 15.1 11.9 9.9 9.7 9.2 10.1 10.4 9.7 Panama República Dominicana 25.3 28.0 24.5 24.9 29.0 25.4 24.2 23.9 Dominican Republic Suriname 22.1 38.1 44.6 31.4 48.2 25.6 31.4 10.6 Suriname Trinidad y Tabago 21.0 31.2 29.0 31.1 23.4 18.6 20.9 31.4 Trinidad and Tobago Total de la región 19.0 20.5 20.0 20.3 20.7 19.6 19.3 18.5 Total region

CE
PA
L, Anuario E
stadístico de Am
érica Latina y el Caribe, 2012
113 2.2 SECTOR EXTERNO / EXTERNAL SECTOR 2.2.2 COMERCIO EXTERIOR DE BIENES Y SERVICIOS / EXTERNAL TRADE OF GOODS AND SERVICES
2.2.2.56 COMERCIO INTRARREGIONAL TOTAL DE BIENES, 2011 TOTAL INTRAREGIONAL TRADE IN GOODS, 2011
(Sobre la base de las exportaciones FOB en millones de dólares / Based on exports f.o.b. in millions of dollars)
Destino
Origen
Argentina
Bolivia (Estado
Plurinacional de)Bolivia
(Plurinational State of)
BrasilBrazil Chile Colombia Cuba Ecuador México
Mexico Paraguay PerúPeru Uruguay
Venezuela (República
Bolivariana de)Venezuela
(Bolivarian Republic of)
Total ALADILAIA
Costa Rica
El Salvador Guatemala
Origin
Destination
Argentina – 757.3 17 344.8 4 839.7 1 811.9 112.7 484.9 921.2 1 367.0 1 809.9 1 995.3 1 869.8 33 314.5 139.5 14.8 99.6 Argentina Bolivia (Estado Plurinacional de) 1 071.8 – 3 034.0 157.2 253.5 0.8 82.3 54.3 26.8 466.1 7.2 291.3 5 445.3 1.0 0.3 0.4
Bolivia (Plurinational State of)
Brasil 22 709.3 1 511.4 – 5 418.0 2 577.4 550.1 933.1 4 000.3 2 968.5 2 262.9 2 174.6 4 591.8 49 697.4 307.4 165.9 251.1 Brazil Chile 1 308.9 377.8 4 481.6 – 974.0 45.0 563.0 1 950.3 160.0 1 786.6 166.4 692.5 12 506.1 247.5 49.2 100.7 Chile Colombia 301.1 139.3 1 360.7 2 189.6 – 40.2 1 896.8 701.6 12.7 1 389.7 21.9 1 739.5 9 793.1 431.4 445.0 558.2 Colombia Cuba ... ... ... ... ... ... ... ... ... ... ... ... ... ... ... ... Cuba Ecuador 89.1 22.7 89.8 1 106.2 1 025.5 12.4 – 98.5 1.7 1 766.2 53.0 1 474.5 5 739.6 16.6 225.7 118.9 Ecuador México a 1 958.1 119.4 4 891.3 2 072.0 5 632.6 356.6 832.0 – 122.2 1 286.4 270.9 1 661.1 19 202.6 998.0 667.1 1 787.2 Mexico a
Paraguay 972.6 55.8 782.9 488.6 21.8 0.3 8.4 9.8 – 114.2 1 061.6 91.5 3 607.5 0.9 1.4 1.0 Paraguay Perú 189.1 438.0 1 235.9 1 963.4 1 029.3 14.3 799.7 419.1 10.1 – 43.3 906.8 7 049.0 63.7 28.0 58.5 Peru Uruguay ... ... ... ... ... ... ... ... ... ... ... ... ... ... ... ... Uruguay Venezuela (República Bolivariana de) b 69.3 0.7 1 507.1 161.2 259.0 3 787.0 573.2 118.0 0.5 116.6 376.8 – 6 969.4 76.7 0.4 65.7
Venezuela (Bolivarian Republic of) b
Total de la ALADI 28 669.3 3 422.4 34 728.1 18 395.9 13 585.0 4 919.4 6 173.4 8 273.1 4 669.5 10 998.6 6 171.0 13 318.8 153 324.5 2 282.7 1 597.8 3 041.3 Total LAIA Costa Rica 23.8 1.3 32.9 23.0 44.5 21.8 36.6 312.6 0.8 14.5 3.8 57.4 573.0 – 272.5 393.8 Costa Rica El Salvador 0.4 1.2 4.6 30.1 1.9 7.1 4.1 81.7 0.2 2.2 0.2 10.9 144.6 212.3 – 725.4 El Salvador Guatemala 5.9 0.3 7.4 108.6 23.1 9.9 10.6 367.4 0.5 43.0 1.7 57.6 636.0 402.5 1 040.9 – Guatemala Honduras 1.2 0.3 4.6 9.0 18.8 0.1 6.4 110.0 – 4.9 – 40.5 195.8 124.7 284.8 239.8 Honduras Nicaragua 0.1 0.2 1.5 8.3 7.7 2.1 5.0 88.7 – 0.8 0.2 302.6 417.2 117.4 198.9 71.0 Nicaragua Total del MCCA 31.4 3.3 51.0 179.0 96.0 41.0 62.7 960.4 1.5 65.4 5.9 469.0 1 966.6 856.9 1 797.1 1 430.0 Total CACM Bahamas c 5.5 0.5 3.5 0.4 1.1 – 0.2 0.9 1.5 1.0 3.3 – 17.9 – 0.4 0.7 Bahamas c
Barbados c – – 0.5 0.1 0.1 0.3 – 0.4 0.2 – – 0.3 1.9 0.2 0.1 0.1 Barbados c
Belice ... ... ... ... ... ... ... ... ... ... ... ... ... ... ... ... Belize
Guyana c – – 0.8 0.2 1.2 0.1 3.1 6.3 – – 2.8 81.9 96.4 0.4 – – Guyana c
Haití ... ... ... ... ... ... ... ... ... ... ... ... ... ... ... ... Haiti Jamaica ... ... ... ... ... ... ... ... ... ... ... ... ... ... ... ... Jamaica Panamá ... ... ... ... ... ... ... ... ... ... ... ... ... ... ... ... Panama República Dominicana 8.8 0.3 4.0 18.5 14.1 35.1 10.3 29.8 0.4 6.0 1.9 80.2 209.4 21.2 4.1 47.4 Dominican Republic Suriname c 9.4 0.1 8.6 – 0.5 0.2 2.5 1.6 0.1 0.1 0.1 3.9 27.1 – – – Suriname c
Trinidad y Tabago ... ... ... ... ... ... ... ... ... ... ... ... ... ... ... ... Trinidad and Tobago Total de la región d 28 724.4 3 426.6 34 796.5 18 594.1 13 698.0 4 996.1 6 252.2 9 272.5 4 673.2 11 071.1 6 185.0 13 954.1 155 643.8 3 161.4 3 399.5 4 519.5 Total region d
Mundo d 67 720.3 6 916.0 226 140.0 67 150.7 48 224.1 10 493.2 20 747.0 307 686.0 10 196.8 34 709.6 13 242.5 42 967.9 856 194.1 13 821.5 8 823.3 14 861.2 World d
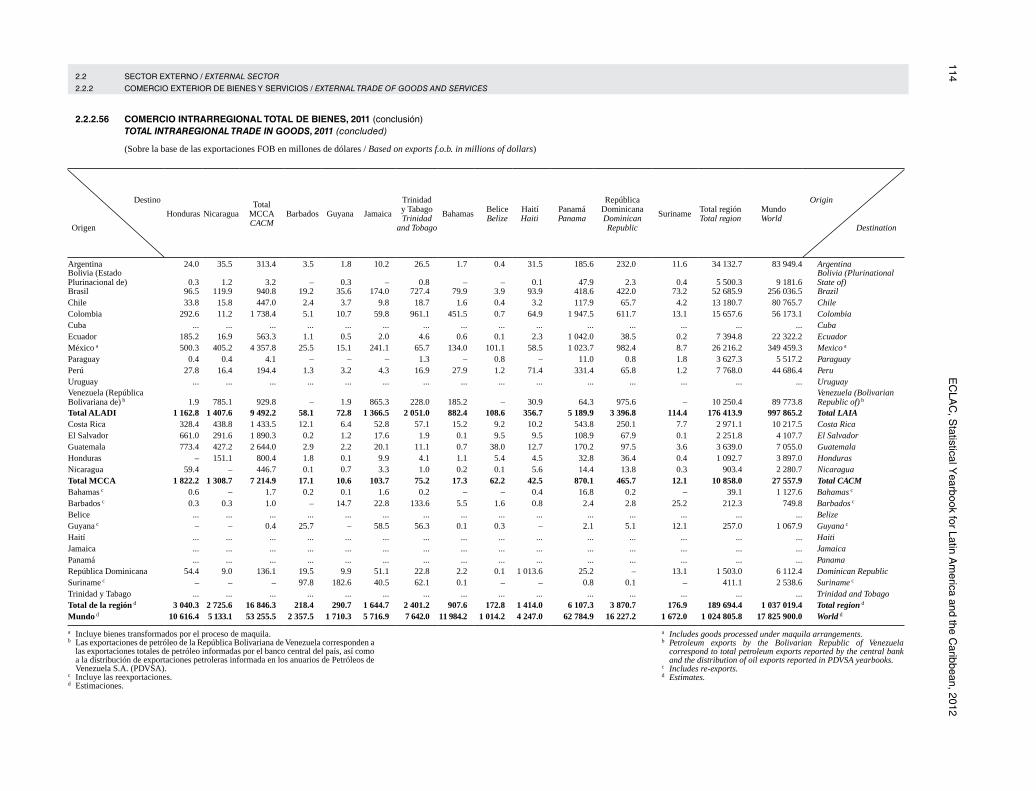
114 E
CLA
C, S
tatistical Yearbook for Latin A
merica and the C
aribbean, 2012 2.2 SECTOR EXTERNO / EXTERNAL SECTOR 2.2.2 COMERCIO EXTERIOR DE BIENES Y SERVICIOS / EXTERNAL TRADE OF GOODS AND SERVICES
2.2.2.56 COMERCIO INTRARREGIONAL TOTAL DE BIENES, 2011 (conclusión) TOTAL INTRAREGIONAL TRADE IN GOODS, 2011 (concluded)
(Sobre la base de las exportaciones FOB en millones de dólares / Based on exports f.o.b. in millions of dollars)
Destino
Origen
Honduras Nicaragua Total
MCCACACM
Barbados Guyana Jamaica
Trinidad y Tabago Trinidad
and Tobago
Bahamas Belice HaitíBelize Haiti
PanamáPanama
República DominicanaDominican Republic
Suriname Total región Total region
MundoWorld
Origin
Destination
Argentina 24.0 35.5 313.4 3.5 1.8 10.2 26.5 1.7 0.4 31.5 185.6 232.0 11.6 34 132.7 83 949.4 Argentina Bolivia (Estado Plurinacional de) 0.3 1.2 3.2 – 0.3 – 0.8 – – 0.1 47.9 2.3 0.4 5 500.3 9 181.6
Bolivia (Plurinational State of)
Brasil 96.5 119.9 940.8 19.2 35.6 174.0 727.4 79.9 3.9 93.9 418.6 422.0 73.2 52 685.9 256 036.5 Brazil Chile 33.8 15.8 447.0 2.4 3.7 9.8 18.7 1.6 0.4 3.2 117.9 65.7 4.2 13 180.7 80 765.7 Chile Colombia 292.6 11.2 1 738.4 5.1 10.7 59.8 961.1 451.5 0.7 64.9 1 947.5 611.7 13.1 15 657.6 56 173.1 Colombia Cuba ... ... ... ... ... ... ... ... ... ... ... ... ... ... ... Cuba Ecuador 185.2 16.9 563.3 1.1 0.5 2.0 4.6 0.6 0.1 2.3 1 042.0 38.5 0.2 7 394.8 22 322.2 Ecuador México a 500.3 405.2 4 357.8 25.5 15.1 241.1 65.7 134.0 101.1 58.5 1 023.7 982.4 8.7 26 216.2 349 459.3 Mexico a
Paraguay 0.4 0.4 4.1 – – – 1.3 – 0.8 – 11.0 0.8 1.8 3 627.3 5 517.2 Paraguay Perú 27.8 16.4 194.4 1.3 3.2 4.3 16.9 27.9 1.2 71.4 331.4 65.8 1.2 7 768.0 44 686.4 Peru Uruguay ... ... ... ... ... ... ... ... ... ... ... ... ... ... ... Uruguay Venezuela (República Bolivariana de) b 1.9 785.1 929.8 – 1.9 865.3 228.0 185.2 – 30.9 64.3 975.6 – 10 250.4 89 773.8
Venezuela (Bolivarian Republic of) b
Total ALADI 1 162.8 1 407.6 9 492.2 58.1 72.8 1 366.5 2 051.0 882.4 108.6 356.7 5 189.9 3 396.8 114.4 176 413.9 997 865.2 Total LAIA Costa Rica 328.4 438.8 1 433.5 12.1 6.4 52.8 57.1 15.2 9.2 10.2 543.8 250.1 7.7 2 971.1 10 217.5 Costa Rica El Salvador 661.0 291.6 1 890.3 0.2 1.2 17.6 1.9 0.1 9.5 9.5 108.9 67.9 0.1 2 251.8 4 107.7 El Salvador Guatemala 773.4 427.2 2 644.0 2.9 2.2 20.1 11.1 0.7 38.0 12.7 170.2 97.5 3.6 3 639.0 7 055.0 Guatemala Honduras – 151.1 800.4 1.8 0.1 9.9 4.1 1.1 5.4 4.5 32.8 36.4 0.4 1 092.7 3 897.0 Honduras Nicaragua 59.4 – 446.7 0.1 0.7 3.3 1.0 0.2 0.1 5.6 14.4 13.8 0.3 903.4 2 280.7 Nicaragua Total MCCA 1 822.2 1 308.7 7 214.9 17.1 10.6 103.7 75.2 17.3 62.2 42.5 870.1 465.7 12.1 10 858.0 27 557.9 Total CACM Bahamas c 0.6 – 1.7 0.2 0.1 1.6 0.2 – – 0.4 16.8 0.2 – 39.1 1 127.6 Bahamas c
Barbados c 0.3 0.3 1.0 – 14.7 22.8 133.6 5.5 1.6 0.8 2.4 2.8 25.2 212.3 749.8 Barbados c
Belice ... ... ... ... ... ... ... ... ... ... ... ... ... ... ... Belize
Guyana c – – 0.4 25.7 – 58.5 56.3 0.1 0.3 – 2.1 5.1 12.1 257.0 1 067.9 Guyana c
Haití ... ... ... ... ... ... ... ... ... ... ... ... ... ... ... Haiti Jamaica ... ... ... ... ... ... ... ... ... ... ... ... ... ... ... Jamaica Panamá ... ... ... ... ... ... ... ... ... ... ... ... ... ... ... Panama República Dominicana 54.4 9.0 136.1 19.5 9.9 51.1 22.8 2.2 0.1 1 013.6 25.2 – 13.1 1 503.0 6 112.4 Dominican Republic Suriname c – – – 97.8 182.6 40.5 62.1 0.1 – – 0.8 0.1 – 411.1 2 538.6 Suriname c
Trinidad y Tabago ... ... ... ... ... ... ... ... ... ... ... ... ... ... ... Trinidad and Tobago Total de la región d 3 040.3 2 725.6 16 846.3 218.4 290.7 1 644.7 2 401.2 907.6 172.8 1 414.0 6 107.3 3 870.7 176.9 189 694.4 1 037 019.4 Total region d
Mundo d 10 616.4 5 133.1 53 255.5 2 357.5 1 710.3 5 716.9 7 642.0 11 984.2 1 014.2 4 247.0 62 784.9 16 227.2 1 672.0 1 024 805.8 17 825 900.0 World d
a Incluye bienes transformados por el proceso de maquila.b Las exportaciones de petróleo de la República Bolivariana de Venezuela corresponden a
las exportaciones totales de petróleo informadas por el banco central del país, así como a la distribución de exportaciones petroleras informada en los anuarios de Petróleos de Venezuela S.A. (PDVSA).
c Incluye las reexportaciones. d Estimaciones.
a Includes goods processed under maquila arrangements.b Petroleum exports by the Bolivarian Republic of Venezuela
correspond to total petroleum exports reported by the central bank and the distribution of oil exports reported in PDVSA yearbooks.
c Includes re-exports.d Estimates.

CE
PA
L, Anuario E
stadístico de Am
érica Latina y el Caribe, 2012
115 2.2 SECTOR EXTERNO / EXTERNAL SECTOR 2.2.2 COMERCIO EXTERIOR DE BIENES Y SERVICIOS / EXTERNAL TRADE OF GOODS AND SERVICES
2.2.2.67 AMÉRICA LATINA Y EL CARIBE: VALOR DE LAS EXPORTACIONES TOTALES DE BIENES Y SERVICIOS LATIN AMERICA AND THE CARIBBEAN: EXPORTS OF GOODS AND SERVICES
(Millones de dólares / Millions of dollars)
País 2004 2005 2006 2007 2008 2009 2010 2011 Country
Antigua y Barbuda 525.1 534.2 539.6 575.5 621.2 728.2 523.9 551.9 Antigua and Barbuda Argentina 39 863.8 47 021.2 54 569.1 66 343.4 82 174.6 66 698.4 81 219.9 98 567.1 Argentina Bahamas 2 721.5 3 034.8 3 130.3 3 401.2 3 847.0 3 061.5 3 196.0 3 310.2 Bahamas Barbados 1 517.0 1 709.6 1 938.2 2 041.0 2 088.6 1 810.3 1 886.2 1 853.6 Barbados Belice 543.7 627.0 790.0 823.7 866.6 728.3 829.6 904.0 Belize Bolivia (Estado Plurinacional de) 2 582.2 3 315.5 4 428.2 5 003.5 7 024.8 5 475.8 7 159.1 9 132.8 Bolivia (Plurinational State of) Brasil 109 058.8 134 355.9 157 283.2 184 603.3 228 393.0 180 723.1 233 515.0 294 250.0 Brazil Chile 39 091.9 49 140.8 67 241.2 77 591.0 75 248.5 63 955.5 81 727.7 93 817.8 Chile Colombia 19 482.3 24 397.0 28 558.0 34 212.7 42 671.2 38 227.3 45 313.6 62 577.4 Colombia Costa Rica 8 611.5 9 720.7 11 073.4 12 851.7 13 703.0 12 499.1 13 836.2 15 355.5 Costa Rica Cuba 5 630.0 8 919.3 9 834.0 12 022.0 ... ... ... ... Cuba Dominica 130.5 129.4 144.3 147.9 162.3 156.6 183.1 181.3 Dominica Ecuador 8 981.7 11 479.8 14 212.6 16 070.2 20 902.4 15 748.5 19 609.3 24 669.8 Ecuador El Salvador 4 290.3 4 410.6 4 798.0 5 203.7 5 761.0 4 792.6 5 552.5 6 475.0 El Salvador Granada 197.7 148.8 162.3 188.9 189.8 174.2 167.4 182.4 Grenada Guatemala 6 205.6 6 767.4 7 600.9 8 714.3 9 719.5 9 219.9 10 827.1 12 875.9 Guatemala Guyana 744.9 698.7 732.7 870.9 1 014.0 938.0 1 133.0 1 426.4 Guyana Haití 509.8 605.1 689.1 789.9 833.0 929.6 802.4 1 090.4 Haiti Honduras 5 178.5 5 747.6 6 021.5 6 564.3 7 110.1 5 778.1 6 763.5 8 287.1 Honduras Jamaica 3 898.8 3 994.0 4 782.3 5 069.1 5 539.1 4 038.3 4 004.4 4 311.3 Jamaica México 201 903.7 230 299.3 266 146.3 289 375.2 309 382.5 244 471.8 313 796.6 365 243.4 Mexico Nicaragua 1 654.8 1 962.6 2 277.5 2 559.8 3 057.6 2 950.3 3 730.5 4 716.5 Nicaragua Panamá 8 873.6 10 606.5 12 475.5 14 057.4 17 220.5 17 562.3 18 749.7 24 098.9 Panama Paraguay 3 488.8 4 007.7 5 199.2 6 614.0 8 948.2 7 299.0 9 993.1 12 305.2 Paraguay Perú 14 802.4 19 656.9 26 490.2 31 246.1 34 667.3 30 597.1 39 257.6 50 632.9 Peru República Dominicana 9 439.8 10 057.9 11 152.7 11 985.1 11 698.7 10 318.8 11 907.4 13 877.1 Dominican Republic Saint Kitts y Nevis 194.0 226.7 235.7 230.7 230.1 185.6 209.0 229.6 Saint Kitts and Nevis San Vicente y las Granadinas 184.5 200.5 212.0 212.2 210.2 192.3 183.6 186.7 Saint Vincent and the Grenadines Santa Lucía 464.2 524.9 440.2 457.1 529.3 543.9 629.0 614.3 Saint Lucia Suriname 923.4 1 201.5 1 411.1 1 612.4 1 992.7 1 691.0 2 325.3 2 667.5 Suriname Trinidad y Tabago 7 253.7 10 569.2 15 031.1 14 315.1 19 622.1 9 940.0 12 079.8 12 147.6 Trinidad and Tobago Uruguay 4 256.6 5 085.4 5 787.2 6 933.4 9 372.2 8 637.3 10 607.8 12 701.5 Uruguay Venezuela (República Bolivariana de) 40 782.0 57 058.0 67 122.0 71 824.0 97 191.0 59 830.0 67 602.0 94 459.0 Venezuela (Bolivarian Republic of) América Latina y el Caribe a 553 987.1 668 214.4 792 509.8 894 510.7 1 021 991.9 809 902.8 1 009 321.3 1 233 700.2 Latin America and the Caribbean a
América Latina a 534 688.1 644 615.1 762 959.9 864 565.0 985 079.0 785 714.5 981 971.2 1 205 133.3 Latin America a
El Caribe a 19 299.0 23 599.3 29 549.9 29 945.8 36 912.9 24 188.3 27 350.1 28 566.9 The Caribbean a
a Comprende los países que figuran en el presente cuadro. a Includes the countries shown in this table.

116 E
CLA
C, S
tatistical Yearbook for Latin A
merica and the C
aribbean, 2012 2.2 SECTOR EXTERNO / EXTERNAL SECTOR 2.2.2 COMERCIO EXTERIOR DE BIENES Y SERVICIOS / EXTERNAL TRADE OF GOODS AND SERVICES
2.2.2.68 AMÉRICA LATINA Y EL CARIBE: VALOR DE LAS IMPORTACIONES TOTALES DE BIENES Y SERVICIOS LATIN AMERICA AND THE CARIBBEAN: IMPORTS OF GOODS AND SERVICES
(Millones de dólares / Millions of dollars)
País 2004 2005 2006 2007 2008 2009 2010 2011 Country
Antigua y Barbuda 584.0 671.0 806.6 923.1 943.1 873.1 680.1 664.3 Antigua and Barbuda Argentina 27 930.2 34 926.1 41 111.4 53 400.3 68 036.1 49 229.5 68 053.9 87 295.4 Argentina Bahamas 3 138.1 3 567.5 4 338.2 4 535.9 4 601.9 3 731.4 3 770.7 4 119.6 Bahamas Barbados 1 819.8 2 014.6 2 131.4 2 213.3 2 435.5 1 930.2 2 150.3 2 281.0 Barbados Belice 627.8 715.0 764.1 810.2 957.8 782.3 778.6 865.3 Belize Bolivia (Estado Plurinacional de) 2 364.1 2 961.9 3 560.0 4 274.1 5 781.2 5 269.4 6 411.8 8 787.0 Bolivia (Plurinational State of) Brasil 80 095.8 97 961.6 120 467.0 157 790.4 220 247.1 174 678.7 244 202.0 302 395.0 Brazil Chile 29 739.9 38 666.7 45 169.0 54 781.9 70 382.1 50 605.9 68 209.1 85 441.8 Chile Colombia 19 816.3 24 903.9 30 353.2 37 443.9 44 772.7 38 502.5 46 697.1 61 726.3 Colombia Costa Rica 9 175.4 10 763.5 12 449.5 14 103.0 16 515.4 12 350.1 14 738.7 17 270.0 Costa Rica Cuba 5 838.0 7 779.3 9 709.0 10 375.0 ... ... ... ... Cuba Dominica 174.1 195.8 198.6 236.3 287.3 264.7 264.7 272.8 Dominica Ecuador 9 651.4 11 851.4 13 749.0 15 618.7 20 925.1 16 886.8 22 651.7 26 408.8 Ecuador El Salvador 7 029.4 7 576.7 8 598.1 9 709.6 10 650.9 7 990.6 9 258.4 10 907.0 El Salvador Granada 319.1 396.2 402.4 436.4 452.1 361.0 378.3 380.8 Grenada Guatemala 10 081.4 11 099.8 12 712.8 14 511.4 15 570.2 12 726.9 15 187.5 17 985.8 Guatemala Guyana 799.4 984.5 1 130.4 1 335.6 1 649.0 1 441.0 1 762.9 2 204.7 Guyana Haití 1 546.5 1 852.9 2 141.6 2 384.5 2 853.8 2 804.2 4 075.9 3 801.5 Haiti Honduras 6 676.1 7 473.4 8 338.9 9 956.5 11 690.9 8 402.6 9 880.9 11 893.5 Honduras Jamaica 5 264.0 5 967.5 7 098.1 8 485.6 9 913.9 6 356.3 6 453.8 7 874.5 Jamaica México 216 588.7 243 259.5 278 891.4 306 013.2 334 138.1 257 976.4 327 076.8 380 613.8 Mexico Nicaragua 2 866.4 3 404.3 3 905.8 4 645.7 5 481.1 4 593.3 5 511.4 6 962.9 Nicaragua Panamá 9 073.5 10 744.4 11 917.3 14 999.4 18 758.3 16 418.8 19 882.4 26 320.6 Panama Paraguay 3 406.3 4 157.7 5 406.0 6 648.3 9 453.7 7 447.9 10 670.8 12 969.2 Paraguay Perú 12 529.9 15 205.1 18 241.4 23 934.6 34 153.6 25 822.3 34 853.6 43 463.5 Peru República Dominicana 9 101.2 11 325.8 13 731.2 15 369.4 17 982.3 14 144.5 17 674.1 19 654.6 Dominican Republic Saint Kitts y Nevis 241.6 280.1 320.7 341.2 406.0 347.1 335.3 340.6 Saint Kitts and Nevis San Vicente y las Granadinas 272.2 291.2 325.9 402.1 430.8 388.2 389.2 400.7 Saint Vincent and the Grenadines Santa Lucía 500.3 594.8 706.7 747.4 820.3 648.0 777.8 784.0 Saint Lucia Suriname 1 011.1 1 282.8 1 171.9 1 362.7 1 756.8 1 580.8 1 656.9 2 241.6 Suriname Trinidad y Tabago 5 265.5 6 265.3 6 880.0 8 047.3 9 948.0 7 356.2 6 894.5 7 487.8 Trinidad and Tobago Uruguay 3 778.3 4 692.7 5 877.1 6 775.4 10 333.0 8 211.0 10 110.2 12 704.3 Uruguay Venezuela (República Bolivariana de) 21 518.0 29 347.0 39 537.0 56 472.0 62 752.0 50 370.0 49 661.0 58 794.0 Venezuela (Bolivarian Republic of) América Latina y el Caribe a 508 823.7 603 180.0 712 141.4 849 084.3 1 015 080.2 790 491.4 1 011 100.3 1 225 312.9 Latin America and the Caribbean a
América Latina a 488 806.7 579 953.7 685 866.6 819 207.3 980 477.7 764 431.3 984 807.3 1 195 395.1 Latin America a
El Caribe a 20 017.0 23 226.3 26 274.9 29 877.0 34 602.5 26 060.0 26 293.0 29 917.7 The Caribbean a
a Comprende los países que figuran en el presente cuadro. a Includes the countries shown in this table.

CE
PA
L, Anuario E
stadístico de Am
érica Latina y el Caribe, 2012
117 2.2 SECTOR EXTERNO / EXTERNAL SECTOR 2.2.3 INDICADORES DEL SECTOR EXTERNO / EXTERNAL SECTOR INDICATORS
2.2.3.2 AMÉRICA LATINA Y EL CARIBE: SALDO EN CUENTA CORRIENTE COMO PORCENTAJE DEL PRODUCTO INTERNO BRUTO LATIN AMERICA AND THE CARIBBEAN: BALANCE ON CURRENT ACCOUNT AS A PERCENTAGE OF GDP
(Porcentajes del PIB / Percentages of GDP)
País 2004 2005 2006 2007 2008 2009 2010 2011 Country
Antigua y Barbuda -10.5 -17.1 -25.6 -29.8 -26.4 -13.9 -14.4 -10.9 Antigua and Barbuda Argentina 2.1 2.9 3.6 2.8 2.1 2.7 0.8 0.0 Argentina Bahamas -4.3 -8.4 -17.2 -15.8 -10.6 -10.5 -10.4 -13.4 Bahamas Barbados -9.6 -9.4 -6.0 -4.1 -9.7 -4.9 -8.6 -11.7 Barbados Belice -14.7 -13.6 -2.1 -4.1 -10.7 -6.2 -0.9 -1.2 Belize Bolivia (Estado Plurinacional de) 3.7 5.9 11.3 11.5 11.9 4.3 4.9 2.2 Bolivia (Plurinational State of) Brasil 1.8 1.6 1.3 0.1 -1.7 -1.5 -2.2 -2.1 Brazil Chile 2.6 1.5 4.6 4.1 -3.2 2.0 1.5 -1.3 Chile Colombia -0.8 -1.3 -1.8 -2.9 -2.7 -2.1 -3.1 -3.0 Colombia Costa Rica -4.3 -4.9 -4.5 -6.3 -9.3 -2.0 -3.5 -5.3 Costa Rica Cuba 0.3 0.3 -0.4 0.8 ... ... ... ... Cuba Dominica -16.0 -21.0 -12.9 -20.8 -26.9 -21.3 -15.1 -16.6 Dominica Ecuador -1.5 1.3 4.2 3.7 3.0 0.3 -2.8 -0.3 Ecuador El Salvador -4.1 -3.6 -4.1 -6.1 -7.1 -1.5 -3.1 -5.3 El Salvador Granada -10.9 -27.6 -32.2 -34.6 -33.0 -27.5 -29.4 -26.3 Grenada Guatemala -4.9 -4.6 -5.0 -5.2 -4.3 0.0 -1.5 -3.1 Guatemala Guyana -1.6 -12.0 -17.2 -10.9 -16.7 -10.9 -10.9 -14.5 Guyana Haití -1.5 0.2 -1.7 -1.3 -4.5 -3.5 -2.3 -0.4 Haiti Honduras -7.6 -3.0 -3.7 -9.0 -15.3 -3.6 -6.2 -8.6 Honduras Jamaica -4.9 -9.5 -9.9 -15.9 -20.3 -9.3 -7.1 -14.3 Jamaica México -0.7 -0.7 -0.5 -0.9 -1.4 -0.6 -0.3 -0.8 Mexico Nicaragua -11.9 -12.4 -12.5 -16.4 -18.3 -9.6 -10.5 -14.0 Nicaragua Panamá -7.1 -6.6 -2.7 -7.9 -10.9 -0.7 -10.8 -12.5 Panama Paraguay 1.8 0.2 1.2 1.3 -1.7 0.4 -3.3 -1.1 Paraguay Perú 0.1 1.5 3.2 1.4 -4.1 -0.6 -2.4 -1.8 Peru República Dominicana 4.8 -1.4 -3.6 -5.3 -9.9 -5.0 -8.4 -8.1 Dominican Republic Saint Kitts y Nevis -13.7 -12.1 -13.5 -16.1 -23.7 -21.9 -17.0 -13.8 Saint Kitts and Nevis San Vicente y las Granadinas -19.5 -18.5 -19.5 -28.3 -32.9 -29.4 -31.6 -32.0 Saint Vincent and the Grenadines Santa Lucía -10.6 -14.3 -30.4 -30.4 -29.5 -11.9 -14.4 -15.6 Saint Lucia Suriname -12.3 -7.2 13.7 18.1 14.9 9.6 26.8 10.0 Suriname Trinidad y Tabago 12.4 22.5 39.6 24.8 30.6 8.2 20.1 21.9 Trinidad and Tobago Uruguay 0.0 0.2 -2.0 -0.9 -5.7 -1.5 -2.2 -3.1 Uruguay Venezuela (República Bolivariana de) 13.8 17.5 14.4 7.5 10.9 1.8 5.0 8.6 Venezuela (Bolivarian Republic of) América Latina y el Caribe a 1.0 1.3 1.6 0.3 -0.8 -0.6 -1.2 -1.2 Latin America and the Caribbean a
América Latina a 1.1 1.3 1.5 0.3 -0.8 -0.5 -1.2 -1.2 Latin America a
El Caribe a -0.7 0.8 6.5 0.9 4.3 -2.9 2.6 0.4 The Caribbean a
a Includes the countries shown in this table.a Comprende los países que figuran en el presente cuadro.

118 E
CLA
C, S
tatistical Yearbook for Latin A
merica and the C
aribbean, 2012 2.2 SECTOR EXTERNO / EXTERNAL SECTOR 2.2.3 INDICADORES DEL SECTOR EXTERNO / EXTERNAL SECTOR INDICATORS
2.2.3.13 AMÉRICA LATINA Y EL CARIBE: ÍNDICES DE LA RELACIÓN DE PRECIOS DEL INTERCAMBIO DE BIENES FOB LATIN AMERICA AND THE CARIBBEAN: TERMS OF TRADE INDICES FOR GOODS, f.o.b.
(Índices año base 2005 / Indices base year 2005)
País 2004 2005 2006 2007 2008 2009 2010 2011 Country
Argentina 102.2 100.0 106.0 110.0 124.6 118.9 118.4 126.3 Argentina Bolivia (Estado Plurinacional de) 93.0 100.0 125.0 127.0 128.7 124.6 140.9 156.4 Bolivia (Plurinational State of) Brasil 98.7 100.0 105.3 107.5 111.3 108.7 126.1 136.1 Brazil Chile 89.3 100.0 131.1 135.6 117.9 119.3 146.0 146.9 Chile Colombia 92.2 100.0 103.8 112.1 124.4 107.0 121.0 135.4 Colombia Costa Rica 104.0 100.0 97.1 96.1 92.5 95.6 91.8 88.4 Costa Rica Cuba 102.7 100.0 126.3 132.9 ... ... ... ... Cuba Ecuador 89.3 100.0 107.3 110.3 121.1 107.2 118.0 129.8 Ecuador El Salvador 100.0 100.0 98.7 97.7 95.0 98.1 94.4 94.4 El Salvador Guatemala 100.9 100.0 98.1 96.3 93.8 101.8 101.3 100.4 Guatemala Haití 103.8 100.0 96.2 93.5 67.2 87.0 84.1 69.8 Haiti Honduras 100.0 100.0 95.4 93.6 87.9 94.0 96.6 104.7 Honduras México 98.1 100.0 100.5 101.4 102.2 90.8 97.7 104.7 Mexico Nicaragua 101.4 100.0 97.6 96.6 92.4 101.3 102.2 101.8 Nicaragua Panamá 101.9 100.0 97.1 96.2 91.8 96.3 94.4 92.4 Panama Paraguay 107.1 100.0 98.1 102.7 110.2 107.8 107.8 110.3 Paraguay Perú 93.2 100.0 127.3 132.0 114.4 108.1 127.7 143.9 Peru República Dominicana 101.0 100.0 99.0 102.3 97.7 105.7 101.8 96.5 Dominican Republic Uruguay 110.1 100.0 97.6 97.8 103.7 106.8 110.2 112.2 Uruguay Venezuela (República Bolivariana de) 76.5 100.0 119.4 130.9 161.6 117.6 139.8 168.1 Venezuela (Bolivarian Republic of) América Latina a 95.3 100.0 106.8 109.6 113.0 103.3 113.4 122.3 Latin America a
a Includes the countries shown in this table.a Comprende los países que figuran en el presente cuadro.
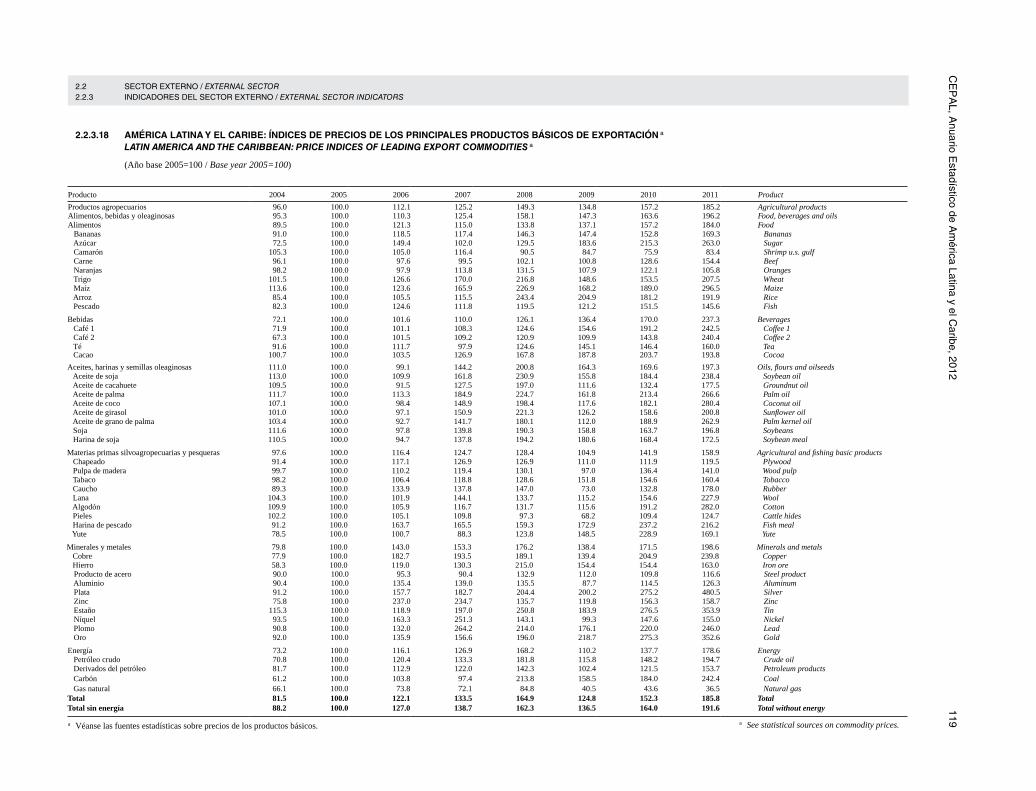
CE
PA
L, Anuario E
stadístico de Am
érica Latina y el Caribe, 2012
119 2.2 SECTOR EXTERNO / EXTERNAL SECTOR 2.2.3 INDICADORES DEL SECTOR EXTERNO / EXTERNAL SECTOR INDICATORS
2.2.3.18 AMÉRICA LATINA Y EL CARIBE: ÍNDICES DE PRECIOS DE LOS PRINCIPALES PRODUCTOS BÁSICOS DE EXPORTACIÓN a
LATIN AMERICA AND THE CARIBBEAN: PRICE INDICES OF LEADING EXPORT COMMODITIES a
(Año base 2005=100 / Base year 2005=100)
Producto 2004 2005 2006 2007 2008 2009 2010 2011 Product
Productos agropecuarios 96.0 100.0 112.1 125.2 149.3 134.8 157.2 185.2 Agricultural products Alimentos, bebidas y oleaginosas 95.3 100.0 110.3 125.4 158.1 147.3 163.6 196.2 Food, beverages and oils Alimentos 89.5 100.0 121.3 115.0 133.8 137.1 157.2 184.0 Food Bananas 91.0 100.0 118.5 117.4 146.3 147.4 152.8 169.3 Bananas Azúcar 72.5 100.0 149.4 102.0 129.5 183.6 215.3 263.0 Sugar Camarón 105.3 100.0 105.0 116.4 90.5 84.7 75.9 83.4 Shrimp u.s. gulf Carne 96.1 100.0 97.6 99.5 102.1 100.8 128.6 154.4 Beef Naranjas 98.2 100.0 97.9 113.8 131.5 107.9 122.1 105.8 Oranges Trigo 101.5 100.0 126.6 170.0 216.8 148.6 153.5 207.5 Wheat Maíz 113.6 100.0 123.6 165.9 226.9 168.2 189.0 296.5 Maize Arroz 85.4 100.0 105.5 115.5 243.4 204.9 181.2 191.9 Rice Pescado 82.3 100.0 124.6 111.8 119.5 121.2 151.5 145.6 Fish
Bebidas 72.1 100.0 101.6 110.0 126.1 136.4 170.0 237.3 Beverages Café 1 71.9 100.0 101.1 108.3 124.6 154.6 191.2 242.5 Coffee 1 Café 2 67.3 100.0 101.5 109.2 120.9 109.9 143.8 240.4 Coffee 2 Té 91.6 100.0 111.7 97.9 124.6 145.1 146.4 160.0 Tea Cacao 100.7 100.0 103.5 126.9 167.8 187.8 203.7 193.8 Cocoa
Aceites, harinas y semillas oleaginosas 111.0 100.0 99.1 144.2 200.8 164.3 169.6 197.3 Oils, flours and oilseeds Aceite de soja 113.0 100.0 109.9 161.8 230.9 155.8 184.4 238.4 Soybean oil Aceite de cacahuete 109.5 100.0 91.5 127.5 197.0 111.6 132.4 177.5 Groundnut oil Aceite de palma 111.7 100.0 113.3 184.9 224.7 161.8 213.4 266.6 Palm oil Aceite de coco 107.1 100.0 98.4 148.9 198.4 117.6 182.1 280.4 Coconut oil Aceite de girasol 101.0 100.0 97.1 150.9 221.3 126.2 158.6 200.8 Sunflower oil Aceite de grano de palma 103.4 100.0 92.7 141.7 180.1 112.0 188.9 262.9 Palm kernel oil Soja 111.6 100.0 97.8 139.8 190.3 158.8 163.7 196.8 Soybeans Harina de soja 110.5 100.0 94.7 137.8 194.2 180.6 168.4 172.5 Soybean meal
Materias primas silvoagropecuarias y pesqueras 97.6 100.0 116.4 124.7 128.4 104.9 141.9 158.9 Agricultural and fishing basic products Chapeado 91.4 100.0 117.1 126.9 126.9 111.0 111.9 119.5 Plywood Pulpa de madera 99.7 100.0 110.2 119.4 130.1 97.0 136.4 141.0 Wood pulp Tabaco 98.2 100.0 106.4 118.8 128.6 151.8 154.6 160.4 Tobacco Caucho 89.3 100.0 133.9 137.8 147.0 73.0 132.8 178.0 Rubber Lana 104.3 100.0 101.9 144.1 133.7 115.2 154.6 227.9 Wool Algodón 109.9 100.0 105.9 116.7 131.7 115.6 191.2 282.0 Cotton Pieles 102.2 100.0 105.1 109.8 97.3 68.2 109.4 124.7 Cattle hides Harina de pescado 91.2 100.0 163.7 165.5 159.3 172.9 237.2 216.2 Fish meal Yute 78.5 100.0 100.7 88.3 123.8 148.5 228.9 169.1 Yute
Minerales y metales 79.8 100.0 143.0 153.3 176.2 138.4 171.5 198.6 Minerals and metals Cobre 77.9 100.0 182.7 193.5 189.1 139.4 204.9 239.8 Copper Hierro 58.3 100.0 119.0 130.3 215.0 154.4 154.4 163.0 Iron ore Producto de acero 90.0 100.0 95.3 90.4 132.9 112.0 109.8 116.6 Steel product Aluminio 90.4 100.0 135.4 139.0 135.5 87.7 114.5 126.3 Aluminum Plata 91.2 100.0 157.7 182.7 204.4 200.2 275.2 480.5 Silver Zinc 75.8 100.0 237.0 234.7 135.7 119.8 156.3 158.7 Zinc Estaño 115.3 100.0 118.9 197.0 250.8 183.9 276.5 353.9 Tin Níquel 93.5 100.0 163.3 251.3 143.1 99.3 147.6 155.0 Nickel Plomo 90.8 100.0 132.0 264.2 214.0 176.1 220.0 246.0 Lead Oro 92.0 100.0 135.9 156.6 196.0 218.7 275.3 352.6 Gold
Energía 73.2 100.0 116.1 126.9 168.2 110.2 137.7 178.6 Energy Petróleo crudo 70.8 100.0 120.4 133.3 181.8 115.8 148.2 194.7 Crude oil Derivados del petróleo 81.7 100.0 112.9 122.0 142.3 102.4 121.5 153.7 Petroleum products Carbón 61.2 100.0 103.8 97.4 213.8 158.5 184.0 242.4 Coal Gas natural 66.1 100.0 73.8 72.1 84.8 40.5 43.6 36.5 Natural gas Total 81.5 100.0 122.1 133.5 164.9 124.8 152.3 185.8 Total Total sin energía 88.2 100.0 127.0 138.7 162.3 136.5 164.0 191.6 Total without energy
a Véanse las fuentes estadísticas sobre precios de los productos básicos. a See statistical sources on commodity prices.

120 E
CLA
C, S
tatistical Yearbook for Latin A
merica and the C
aribbean, 2012 2.2 SECTOR EXTERNO / EXTERNAL SECTOR 2.2.4 FINANCIAMIENTO Y DEUDA EXTERNA / FINANCING AND EXTERNAL DEBT
2.2.4.1 AMÉRICA LATINA Y EL CARIBE: RELACIÓN ENTRE LA RENTA NETA Y LAS EXPORTACIONES DE BIENES Y SERVICIOS LATIN AMERICA AND THE CARIBBEAN: RATIO OF NET INCOME TO EXPORTS OF GOODS AND SERVICES
(Porcentajes / Percentages)
País 2004 2005 2006 2007 2008 2009 2010 2011 Country
Antigua y Barbuda -8.71 -7.94 -8.66 -9.15 -9.71 -6.98 -6.09 -5.74 Antigua and Barbuda Argentina -23.29 -15.53 -11.27 -8.96 -9.19 -13.51 -12.24 -10.97 Argentina Bahamas -5.19 -6.70 -6.96 -6.80 -2.02 -4.97 -7.31 -6.59 Bahamas Barbados -8.04 -7.47 -7.31 -3.26 -5.81 -7.74 -6.43 -5.48 Barbados Belice -21.47 -18.25 -15.86 -19.30 -19.06 -14.87 -18.67 -15.04 Belize Bolivia (Estado Plurinacional de) -14.90 -11.35 -8.97 -9.78 -7.64 -12.31 -12.01 -10.79 Bolivia (Plurinational State of) Brasil -18.82 -19.33 -17.47 -15.87 -17.76 -18.64 -16.91 -16.08 Brazil Chile -20.02 -21.09 -27.31 -24.31 -18.07 -17.82 -18.07 -14.94 Chile Colombia -22.08 -22.38 -20.78 -23.27 -23.69 -24.32 -26.15 -25.20 Colombia Costa Rica -5.11 -2.15 0.04 -6.73 -3.04 -8.67 -5.39 -3.81 Costa Rica Cuba -11.55 -7.10 -6.28 -7.99 ... ... ... ... Cuba Dominica -25.55 -22.40 -10.40 -13.26 -11.30 -8.72 -5.09 -4.65 Dominica Ecuador -20.48 -15.81 -12.87 -12.10 -6.94 -8.72 -5.31 -4.96 Ecuador El Salvador -10.67 -11.12 -9.12 -8.77 -6.75 -11.60 -9.92 -9.76 El Salvador Granada -32.97 -19.01 -17.74 -22.79 -24.76 -37.97 -30.74 -26.11 Grenada Guatemala -6.61 -7.16 -8.95 -9.67 -9.65 -12.05 -11.19 -12.06 Guatemala Guyana -5.29 -5.58 -9.42 -1.29 -1.46 -1.81 1.13 -0.65 Guyana Haití -2.34 -5.79 0.96 0.28 0.67 1.38 2.67 3.68 Haiti Honduras -8.62 -8.00 -8.91 -6.02 -7.32 -9.17 -8.84 -11.53 Honduras Jamaica -14.94 -16.93 -12.87 -13.05 -10.26 -16.54 -12.35 -12.72 Jamaica México -4.61 -6.53 -6.65 -6.58 -5.29 -5.38 -3.61 -4.53 Mexico Nicaragua -13.95 -10.15 -9.66 -8.33 -7.32 -8.49 -7.37 -5.24 Nicaragua Panamá -11.50 -10.61 -10.43 -8.92 -8.75 -8.25 -9.91 -7.47 Panama Paraguay -3.83 -1.44 -1.76 -2.45 -2.54 -4.14 -5.34 -2.49 Paraguay Perú -24.63 -25.77 -28.39 -26.56 -25.22 -27.40 -28.56 -27.08 Peru República Dominicana -19.33 -18.91 -16.61 -18.22 -14.94 -16.68 -14.16 -15.33 Dominican Republic Saint Kitts y Nevis -20.06 -15.50 -13.72 -13.00 -14.10 -18.77 -16.35 -13.49 Saint Kitts and Nevis San Vicente y las Granadinas -15.45 -14.76 -12.12 -11.37 -10.87 -6.77 -9.49 -8.68 Saint Vincent and the Grenadines Santa Lucía -14.86 -13.81 -12.38 -14.87 -13.58 -8.87 -6.52 -6.54 Saint Lucia Suriname -6.81 -3.37 -3.81 0.51 1.04 0.31 -4.39 -9.83 Suriname Trinidad y Tabago -5.48 -7.19 -6.23 -6.73 -6.13 -10.03 -8.76 -4.85 Trinidad and Tobago Uruguay -13.81 -9.72 -7.40 -7.44 -9.78 -11.73 -13.94 -12.32 Uruguay Venezuela (República Bolivariana de) -9.01 -3.86 -1.56 3.55 0.42 -5.24 -7.84 -8.43 Venezuela (Bolivarian Republic of) América Latina y el Caribe -12.41 -12.25 -11.98 -11.12 -10.55 -12.40 -11.59 -11.36 Latin America and the Caribbean
América Latina -12.53 -12.36 -12.13 -11.23 -10.70 -12.49 -11.68 -11.46 Latin America El Caribe -9.03 -9.31 -7.99 -7.76 -6.45 -9.52 -8.54 -7.14 The Caribbean
a Comprende los países que figuran en el presente cuadro. a Includes the countries shown in this table.
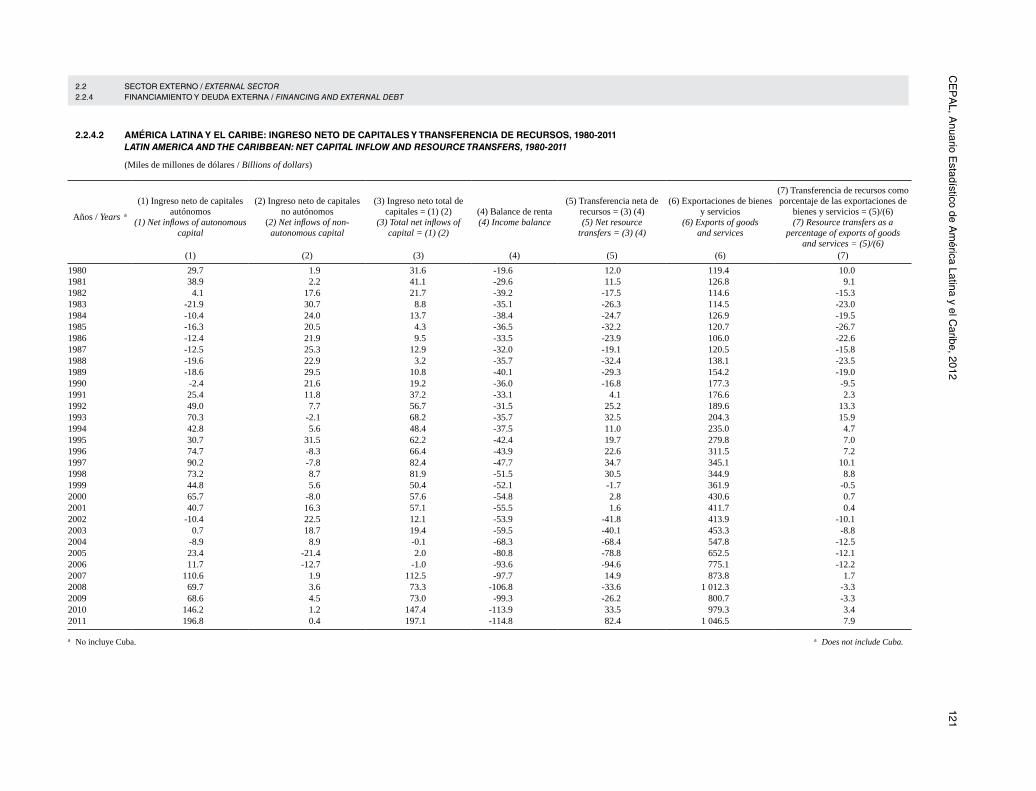
CE
PA
L, Anuario E
stadístico de Am
érica Latina y el Caribe, 2012
121 2.2 SECTOR EXTERNO / EXTERNAL SECTOR 2.2.4 FINANCIAMIENTO Y DEUDA EXTERNA / FINANCING AND EXTERNAL DEBT
2.2.4.2 AMÉRICA LATINA Y EL CARIBE: INGRESO NETO DE CAPITALES Y TRANSFERENCIA DE RECURSOS, 1980-2011 LATIN AMERICA AND THE CARIBBEAN: NET CAPITAL INFLOW AND RESOURCE TRANSFERS, 1980-2011
(Miles de millones de dólares / Billions of dollars)
Años / Years a(1) Ingreso neto de capitales
autónomos (1) Net inflows of autonomous
capital
(2) Ingreso neto de capitales no autónomos
(2) Net inflows of non-autonomous capital
(3) Ingreso neto total de capitales = (1) (2)
(3) Total net inflows of capital = (1) (2)
(4) Balance de renta (4) Income balance
(5) Transferencia neta de recursos = (3) (4) (5) Net resource
transfers = (3) (4)
(6) Exportaciones de bienes y servicios
(6) Exports of goods and services
(7) Transferencia de recursos como porcentaje de las exportaciones de
bienes y servicios = (5)/(6) (7) Resource transfers as a
percentage of exports of goods and services = (5)/(6)
(1) (2) (3) (4) (5) (6) (7)
1980 29.7 1.9 31.6 -19.6 12.0 119.4 10.01981 38.9 2.2 41.1 -29.6 11.5 126.8 9.11982 4.1 17.6 21.7 -39.2 -17.5 114.6 -15.31983 -21.9 30.7 8.8 -35.1 -26.3 114.5 -23.01984 -10.4 24.0 13.7 -38.4 -24.7 126.9 -19.51985 -16.3 20.5 4.3 -36.5 -32.2 120.7 -26.71986 -12.4 21.9 9.5 -33.5 -23.9 106.0 -22.61987 -12.5 25.3 12.9 -32.0 -19.1 120.5 -15.81988 -19.6 22.9 3.2 -35.7 -32.4 138.1 -23.51989 -18.6 29.5 10.8 -40.1 -29.3 154.2 -19.01990 -2.4 21.6 19.2 -36.0 -16.8 177.3 -9.51991 25.4 11.8 37.2 -33.1 4.1 176.6 2.31992 49.0 7.7 56.7 -31.5 25.2 189.6 13.31993 70.3 -2.1 68.2 -35.7 32.5 204.3 15.91994 42.8 5.6 48.4 -37.5 11.0 235.0 4.71995 30.7 31.5 62.2 -42.4 19.7 279.8 7.01996 74.7 -8.3 66.4 -43.9 22.6 311.5 7.21997 90.2 -7.8 82.4 -47.7 34.7 345.1 10.11998 73.2 8.7 81.9 -51.5 30.5 344.9 8.81999 44.8 5.6 50.4 -52.1 -1.7 361.9 -0.52000 65.7 -8.0 57.6 -54.8 2.8 430.6 0.72001 40.7 16.3 57.1 -55.5 1.6 411.7 0.42002 -10.4 22.5 12.1 -53.9 -41.8 413.9 -10.12003 0.7 18.7 19.4 -59.5 -40.1 453.3 -8.82004 -8.9 8.9 -0.1 -68.3 -68.4 547.8 -12.52005 23.4 -21.4 2.0 -80.8 -78.8 652.5 -12.12006 11.7 -12.7 -1.0 -93.6 -94.6 775.1 -12.22007 110.6 1.9 112.5 -97.7 14.9 873.8 1.72008 69.7 3.6 73.3 -106.8 -33.6 1 012.3 -3.32009 68.6 4.5 73.0 -99.3 -26.2 800.7 -3.32010 146.2 1.2 147.4 -113.9 33.5 979.3 3.42011 196.8 0.4 197.1 -114.8 82.4 1 046.5 7.9
a Does not include Cuba.a No incluye Cuba.

122 E
CLA
C, S
tatistical Yearbook for Latin A
merica and the C
aribbean, 2012
a Comprende los países que figuran en el presente cuadro. a Includes the countries shown in this table.
2.2 SECTOR EXTERNO / EXTERNAL SECTOR 2.2.4 FINANCIAMIENTO Y DEUDA EXTERNA / FINANCING AND EXTERNAL DEBT
2.2.4.4 AMÉRICA LATINA Y EL CARIBE: INVERSIÓN EXTRANJERA DIRECTA NETA LATIN AMERICA AND THE CARIBBEAN: NET FOREIGN DIRECT INVESTMENT
(Millones de dólares / Millions of dollars)
País 2004 2005 2006 2007 2008 2009 2010 2011 Country
Antigua y Barbuda 80.4 221.0 358.8 338.2 174.2 80.7 96.7 59.4 Antigua and Barbuda Argentina 3 448.7 3 954.2 3 098.6 4 968.9 8 334.6 3 307.2 6 090.3 5 591.9 Argentina Bahamas 273.6 562.8 706.4 746.2 860.2 664.0 861.5 900.0 Bahamas Barbados -16.0 118.5 200.3 255.6 222.7 218.1 ... ... Barbados Belice 111.4 125.9 108.3 139.4 166.9 108.4 96.1 89.4 Belize Bolivia (Estado Plurinacional de) 82.6 -290.8 284.5 362.3 507.6 425.7 671.8 858.9 Bolivia (Plurinational State of) Brasil 8 338.9 12 549.6 -9 380.3 27 518.2 24 601.1 36 032.8 36 917.0 67 690.0 Brazil Chile 5 096.4 4 961.7 5 214.4 7 720.0 6 366.8 5 654.4 6 351.1 5 476.9 Chile Colombia 2 873.2 5 590.0 5 557.7 8 136.0 8 365.7 4 049.0 184.0 5 446.9 Colombia Costa Rica 733.3 904.0 1 371.0 1 633.7 2 072.3 1 339.0 1 440.9 2 098.9 Costa Rica Cuba ... ... ... ... ... ... ... ... Cuba Dominica 26.2 19.2 25.9 40.5 56.6 41.3 24.3 24.9 Dominica Ecuador 836.9 493.4 271.4 194.2 1 006.3 321.4 158.0 584.6 Ecuador El Salvador 365.9 398.2 267.5 1 455.2 823.6 365.8 116.6 385.5 El Salvador Granada 65.0 70.2 89.8 156.6 142.2 102.6 60.2 39.6 Grenada Guatemala 254.8 470.0 551.6 719.8 737.4 573.7 782.4 967.5 Guatemala Guyana 30.0 76.8 102.4 110.3 178.0 164.0 269.7 307.8 Guyana Haití 5.9 26.0 160.6 74.5 29.8 38.0 150.0 ... Haiti Honduras 552.9 598.8 668.5 926.1 1 007.3 522.5 798.8 1 007.7 Honduras Jamaica 541.6 581.5 796.8 751.5 1 360.7 479.8 169.5 180.3 Jamaica México 20 389.0 17 899.4 14 248.0 23 057.0 25 731.4 8 940.1 6 637.6 10 608.4 Mexico Nicaragua 250.0 241.1 286.8 381.7 626.1 434.2 508.0 967.9 Nicaragua Panamá 1 019.1 917.6 2 547.3 1 898.6 2 146.7 1 259.3 2 350.1 2 789.8 Panama Paraguay 31.7 47.1 166.5 178.2 271.6 193.5 339.7 483.4 Paraguay Perú 1 599.0 2 578.7 3 466.5 5 425.4 6 187.9 5 165.3 7 062.4 8 119.3 Peru República Dominicana 909.0 1 122.7 1 084.6 1 667.4 2 870.0 2 165.4 1 896.3 2 371.1 Dominican Republic Saint Kitts y Nevis 55.8 93.0 110.4 134.5 177.9 130.8 120.4 142.0 Saint Kitts and Nevis San Vicente y las Granadinas 65.7 40.1 109.1 130.5 159.2 97.1 102.9 135.1 Saint Vincent and the Grenadines Santa Lucía 76.5 78.2 233.9 271.9 161.2 146.4 110.0 75.8 Saint Lucia Suriname -37.3 28.0 -163.4 -246.7 -233.6 -93.4 -247.7 72.9 Suriname Trinidad y Tabago 972.7 598.7 512.7 830.0 2 100.8 709.1 549.4 533.2 Trinidad and Tobago Uruguay 314.7 811.1 1 494.5 1 240.1 2 116.6 1 512.2 2 348.8 2 206.1 Uruguay Venezuela (República Bolivariana de) 864.0 1 422.0 -2 032.0 1 587.0 45.0 -4 374.0 -1 462.0 5 129.0 Venezuela (Bolivarian Republic of) América Latina y el Caribe a 50 211.7 57 308.7 32 519.2 92 802.7 99 374.9 70 774.2 75 554.6 125 344.0 Latin America and the Caribbean a
América Latina a 47 966.0 54 694.9 29 327.8 89 144.3 93 847.8 67 925.4 73 341.6 122 783.7 Latin America a
El Caribe a 2 245.6 2 613.9 3 191.4 3 658.4 5 527.1 2 848.7 2 212.9 2 560.4 The Caribbean a

CE
PA
L, Anuario E
stadístico de Am
érica Latina y el Caribe, 2012
123 2.2 SECTOR EXTERNO / EXTERNAL SECTOR 2.2.4 FINANCIAMIENTO Y DEUDA EXTERNA / FINANCING AND EXTERNAL DEBT
2.2.4.5 AMÉRICA LATINA Y EL CARIBE: DEUDA EXTERNA TOTAL LATIN AMERICA AND THE CARIBBEAN: TOTAL EXTERNAL DEBT
(Saldo a fines de año en millones de dólares / Year-end balance, in millions of dollars)
País 2004 2005 2006 2007 2008 2009 2010 2011 CountryAntigua y Barbuda 532.0 317.4 320.5 480.5 435.8 415.7 431.5 444.2 Antigua and Barbuda Argentina 171 205.3 113 798.9 108 863.9 124 559.5 124 922.8 116 414.7 128 618.1 ... Argentina Bahamas a 345.2 337.5 334.0 336.8 443.1 766.6 897.9 ... Bahamas a
Barbados 2 434.6 2 695.4 2 990.8 3 130.2 3 486.8 4 009.4 4 484.6 ... Barbados Belice a 912.7 969.7 985.0 972.7 957.7 1 015.6 1 009.2 ... Belize a
Bolivia (Estado Plurinacional de) 7 561.5 7 665.7 6 277.8 5 403.2 5 929.8 5 801.2 5 874.5 5 935.9 Bolivia (Plurinational State of) Brasil 201 373.0 169 451.0 172 589.0 193 219.0 198 340.0 198 192.0 256 803.7 291 648.2 Brazil Chile 43 515.0 46 210.6 49 497.0 55 733.0 64 318.0 74 041.0 73 578.0 77 090.0 Chile Colombia 39 497.5 38 506.5 40 102.7 44 553.3 46 368.8 53 718.8 64 723.4 68 893.4 Colombia Costa Rica 5 765.3 6 763.3 7 186.4 8 444.3 9 105.3 8 173.6 9 123.4 9 042.6 Costa Rica Cuba b 5 806.0 5 898.2 7 793.7 8 908.2 ... ... ... ... Cuba b
Dominica a 208.6 221.0 224.6 241.1 234.3 221.9 241.7 247.6 Dominica aEcuador 17 210.6 17 237.2 17 099.4 17 444.6 16 899.5 13 498.3 13 895.3 13 929.3 Ecuador El Salvador 8 210.5 8 876.8 9 692.3 9 349.1 9 994.2 9 881.8 9 698.4 9 818.9 El Salvador Granada a 331.2 401.3 481.0 468.9 481.4 512.4 537.7 513.6 Grenada aGuatemala a 3 843.9 3 723.2 3 958.3 4 226.0 4 382.4 4 927.6 5 562.0 5 530.9 Guatemala a
Guyana a 1 071.2 1 214.6 1 043.0 718.6 833.7 936.6 1 042.9 1 110.9 Guyana a
Haití a 1 375.9 1 334.9 1 484.2 1 628.1 1 917.4 1 272.3 353.3 549.4 Haiti aHonduras 6 022.7 5 134.6 3 934.9 3 190.0 3 464.0 3 344.9 3 772.6 3 911.0 Honduras Jamaica a 5 120.4 5 375.5 5 795.6 6 122.7 6 343.7 6 594.3 8 389.5 8 389.5 Jamaica a
México 130 925.4 128 247.7 119 084.3 127 668.8 128 850.8 165 131.9 196 702.3 206 096.2 Mexico Nicaragua a 5 390.6 5 347.5 4 526.7 3 384.6 3 511.5 3 660.9 3 876.4 3 989.3 Nicaragua a
Panamá a 7 219.2 7 579.7 7 788.3 8 275.6 8 477.3 10 150.2 10 438.5 10 618.3 Panama a
Paraguay 2 901.3 2 700.1 2 739.4 2 868.3 3 256.2 3 154.2 3 718.0 3 588.4 Paraguay Perú 31 243.9 28 656.6 28 897.5 32 894.4 34 838.2 35 157.3 43 673.9 46 040.0 Peru República Dominicana a 6 379.7 5 847.1 6 295.5 6 555.6 7 218.8 8 214.6 9 946.9 10 303.8 Dominican Republic a
Saint Kitts y Nevis 317.1 298.8 310.4 313.0 328.4 306.3 302.3 290.0 Saint Kitts and Nevis San Vicente y las Granadinas 218.9 231.3 220.0 218.9 234.7 260.9 305.5 303.5 Saint Vincent and the Grenadines Santa Lucía 344.0 387.6 404.0 415.4 364.0 375.0 393.0 370.4 Saint Lucia Suriname a 384.2 390.3 391.1 297.9 319.3 269.1 333.9 ... Suriname aTrinidad y Tabago a 1 364.0 1 329.4 1 261.0 1 392.3 1 445.0 1 422.0 1 561.0 ... Trinidad and Tobago a
Uruguay 11 593.1 11 417.7 10 559.6 12 218.2 12 021.0 14 064.4 14 468.0 15 588.0 Uruguay Venezuela (República Bolivariana de) 43 679.0 46 427.0 44 735.0 53 855.0 53 757.0 69 494.0 80 831.0 91 228.0 Venezuela (Bolivarian Republic of) América Latina y el Caribe 764 303.3 674 994.1 667 866.9 739 487.8 753 480.8 815 399.5 955 588.4 … Latin America and the Caribbean América Latina 750 719.3 660 824.3 653 105.9 724 378.8 737 573.0 798 293.7 935 657.7 … Latin America El Caribe 13 583.9 14 169.8 14 761.1 15 109.0 15 907.8 17 105.8 19 930.7 … The Caribbean
a Deuda externa pública.b Deuda externa pública. A partir de 2004 la deuda activa no incluye la deuda inmovilizada.
a Public external debt.b Public external debt. From 2004 on refers only to active external debt; excludes other external debt.

124 E
CLA
C, S
tatistical Yearbook for Latin A
merica and the C
aribbean, 2012 2.2 SECTOR EXTERNO / EXTERNAL SECTOR 2.2.4 FINANCIAMIENTO Y DEUDA EXTERNA / FINANCING AND EXTERNAL DEBT
2.2.4.6 AMÉRICA LATINA Y EL CARIBE: DEUDA EXTERNA TOTAL COMO PORCENTAJE DEL PRODUCTO INTERNO BRUTO LATIN AMERICA AND THE CARIBBEAN: TOTAL EXTERNAL DEBT AS A PERCENTAGE OF GDP
(Porcentajes / Percentages)
País 2004 2005 2006 2007 2008 2009 2010 2011 CountryAntigua y Barbuda 58.8 31.7 28.1 37.1 32.2 34.2 37.4 39.7 Antigua and Barbuda Argentina 111.8 62.1 50.8 47.5 38.0 37.7 34.7 ... Argentina Bahamas a 4.9 4.4 4.2 4.0 5.4 9.9 11.6 ... Bahamas a
Barbados 69.7 69.0 71.3 69.8 80.3 91.2 105.6 ... Barbados Belice a 86.4 87.0 81.2 76.2 70.5 75.6 72.3 ... Belize a
Bolivia (Estado Plurinacional de) 86.2 80.3 54.8 41.2 35.6 33.5 29.9 24.8 Bolivia (Plurinational State of) Brasil 30.3 19.2 15.8 14.1 12.0 12.2 12.0 11.8 Brazil Chile 43.2 37.1 32.1 32.2 35.8 42.9 34.0 31.0 Chile Colombia 33.7 26.3 24.7 21.5 19.0 23.1 22.6 20.7 Colombia Costa Rica 31.0 33.9 31.9 32.1 30.5 27.8 25.2 22.1 Costa Rica Cuba b 15.2 13.8 14.8 15.2 ... ... ... ... Cuba b
Dominica a 56.8 61.1 57.9 57.6 50.7 46.1 51.2 51.1 Dominica aEcuador 52.7 46.7 41.0 38.3 31.2 25.9 24.0 21.3 Ecuador El Salvador 52.0 51.9 52.2 46.5 46.6 47.8 45.3 42.6 El Salvador
Granada a 55.0 57.3 68.2 61.4 57.8 66.1 68.6 62.9 Grenada aGuatemala a 16.0 13.7 13.1 12.4 11.2 13.1 13.5 11.8 Guatemala a
Guyana a 85.3 92.3 71.5 41.3 43.4 46.2 46.2 43.1 Guyana a
Haití a 37.6 32.1 30.4 27.3 29.9 19.7 5.3 7.5 Haiti aHonduras 67.9 52.6 36.0 25.8 25.0 23.6 24.5 22.4 Honduras Jamaica a 50.3 47.8 48.6 47.9 46.1 54.3 63.4 58.0 Jamaica a
México 17.3 15.2 12.5 12.4 11.8 18.8 19.1 17.9 Mexico Nicaragua a 93.1 84.6 66.7 45.5 42.7 45.4 46.0 42.8 Nicaragua a
Panamá a 50.9 49.0 45.4 41.8 36.9 42.0 39.3 34.2 Panama a
Paraguay 36.1 30.9 25.7 20.8 17.6 19.8 18.5 14.0 Paraguay Perú 44.8 36.1 31.3 30.6 27.0 27.0 27.7 25.5 Peru República Dominicana a 29.6 17.4 17.7 16.0 15.9 17.6 19.3 18.5 Dominican Republic a
Saint Kitts y Nevis 63.7 55.7 49.3 45.4 44.4 44.5 44.9 41.6 Saint Kitts and Nevis San Vicente y las Granadinas 41.9 42.0 36.0 32.0 33.6 38.4 44.9 44.1 Saint Vincent and the Grenadines Santa Lucía 40.1 42.7 39.7 36.7 31.0 31.9 32.5 30.4 Saint Lucia Suriname a 34.5 28.4 24.3 16.1 13.8 12.4 13.7 ... Suriname aTrinidad y Tabago a 10.3 8.3 6.9 6.4 5.2 7.2 7.5 ... Trinidad and Tobago a
Uruguay 83.9 65.8 53.9 52.2 39.6 46.1 36.7 33.4 Uruguay Venezuela (República Bolivariana de) 38.8 31.9 24.4 23.4 17.0 21.1 33.7 28.9 Venezuela (Bolivarian Republic of) América Latina y el Caribe 34.3 25.0 21.0 19.7 17.5 20.2 19.7 ... Latin America and the Caribbean América Latina 34.3 24.9 20.9 19.6 17.4 20.1 19.5 ... Latin America El Caribe 33.0 30.3 28.8 26.5 24.5 31.4 34.9 ... The Caribbean
a Deuda externa pública.b Deuda externa pública. A partir de 2004 la deuda activa no incluye la deuda inmovilizada..
a Public external debt.b Public external debt. From 2004 refers only to active external debt; excludes other external debt.

CE
PA
L, Anuario E
stadístico de Am
érica Latina y el Caribe, 2012
125 2.3 PRECIOS / PRICES 2.3.1 PRECIOS AL CONSUMIDOR / CONSUMER PRICES
2.3.1.1 ÍNDICES ANUALES DE PRECIOS AL CONSUMIDOR: NIVEL GENERAL ANNUAL CONSUMER PRICE INDICES: GENERAL LEVEL
(Año base 2005=100 / Base year 2005=100)
País 2002 2003 2004 2005 2006 2007 2008 2009 2010 2011 CountryAntigua y Barbuda 94.1 96.0 97.9 100.0 101.8 103.2 108.7 108.1 111.8 115.6 Antigua and Barbuda Argentina a 77.0 87.3 91.2 100.0 110.9 120.7 131.1 139.3 153.8 168.9 Argentina aBahamas b 94.1 96.9 98.1 100.0 101.8 104.4 109.1 111.3 112.5 116.2 Bahamas b
Barbados c 91.5 93.0 94.3 100.0 107.3 111.6 120.7 125.1 132.4 144.9 Barbados cBelice 91.2 93.6 96.5 100.0 104.2 106.6 113.5 112.2 113.2 115.1 BelizeBolivia (Estado Plurinacional de) d 87.9 90.8 94.9 100.0 104.3 113.4 129.2 133.6 136.9 150.4 Bolivia (Plurinational State of) d Brasil e 76.5 87.8 93.6 100.0 104.2 108.0 114.1 119.7 125.7 134.1 Brazil eChile f 93.4 96.0 97.0 100.0 103.4 107.9 117.4 119.1 122.0 126.1 Chile f
Colombia g 83.9 89.9 95.2 100.0 104.3 110.1 117.8 122.7 125.5 129.8 Colombia gCosta Rica h 71.5 78.2 87.9 100.0 111.5 121.9 138.3 149.1 157.6 165.2 Costa Rica h
Cuba i 97.4 99.4 97.2 100.0 105.1 112.5 114.4 113.0 114.5 116.0 Cuba i
Dominica 94.7 96.0 98.3 100.0 102.6 105.9 112.7 112.7 116.3 119.0 DominicaEcuador j 88.3 95.3 97.9 100.0 103.3 105.7 114.5 120.4 124.7 130.3 Ecuador jEl Salvador k 89.5 91.5 95.5 100.0 104.0 108.8 116.7 117.3 118.4 124.5 El Salvador k
Granada 92.5 94.5 96.6 100.0 104.3 108.3 117.0 116.6 120.6 124.3 GrenadaGuatemala l 80.7 85.2 91.7 100.0 106.6 113.8 126.8 129.1 134.1 142.4 Guatemala l
Guyana 84.3 89.4 93.5 100.0 106.7 119.7 129.4 133.2 138.2 145.0 GuyanaHaití m 52.2 69.4 86.4 100.0 113.1 122.7 141.8 141.7 149.9 162.4 Haiti mHonduras n 78.9 85.0 91.9 100.0 105.6 112.9 125.8 132.7 138.9 148.3 Honduras nJamaica o 69.5 76.5 86.9 100.0 108.5 118.6 144.7 158.6 178.6 192.0 Jamaica oMéxico p 87.9 91.9 96.2 100.0 103.6 107.7 113.3 119.3 124.2 128.5 Mexico pNicaragua q 80.1 84.3 91.4 100.0 110.0 121.7 145.6 150.0 158.8 172.3 Nicaragua q
Panamá r 96.2 97.5 97.2 100.0 102.5 106.7 116.1 118.9 123.0 130.3 Panama r
Paraguay s 78.6 89.7 93.6 100.0 109.6 118.5 130.5 133.9 140.2 151.7 Paraguay s
Perú t 92.8 94.9 98.4 100.0 102.0 103.8 109.8 113.0 114.8 118.6 Peru t
República Dominicana u 49.7 63.4 96.0 100.0 107.6 114.2 126.3 128.2 136.3 147.8 Dominican Republic u
Saint Kitts y Nevis 92.5 94.5 96.5 100.0 108.5 113.4 119.4 121.8 122.6 131.3 Saint Kitts and NevisSan Vicente y las Granadinas 93.9 94.9 96.2 100.0 102.4 105.3 111.1 110.9 114.5 117.7 Saint Vincent and the Grenadines
Santa Lucíav 93.9 94.9 96.3 100.0 103.0 110.2 121.3 121.8 122.7 126.6 Saint Lucia vSuriname w 72.3 83.7 91.6 100.0 111.3 118.5 135.8 135.7 145.1 170.8 Suriname w
Trinidad y Tabago x 86.9 90.2 93.6 100.0 108.2 116.9 130.9 140.1 154.8 162.7 Trinidad and Tobago x
Uruguay y 73.3 87.5 95.5 100.0 106.4 115.0 124.1 132.9 141.8 z 153.2 z Uruguay yVenezuela (República Bolivariana de) aa 54.0 70.8 86.2 100.0 113.7 134.9 177.3 228.0 294.3 374.2 Venezuela (Bolivarian Republic of) aa
a Ciudad Autónoma de Buenos Aires y Gran Buenos Aires.b Bahamas.c Barbados.d Ciudades de Sucre, La Paz, Cochabamba, Oruro, Potosí, Tarija, Santa Cruz de la Sierra, Trinidad y Cobija.e Brasil.f Gran Santiago (provincia de Santiago, comuna de Puente Alto y comuna de San Bernardo) hasta 2009;
nacional a partir de 2010.g Colombia.h Gran Área Metropolitana de Costa Rica.i Cuba.j Ecuador.k El Salvador.l Guatemala.m Puerto Príncipe y nueve departamentos urbanos.n Toda el área urbana del país.o Jamaica.p México.q Área metropolitana de Managua.r Área urbana de Panamá y San Miguelito.s Asunción.t Lima Metropolitana.u República Dominicana.v Castries.w Paramaribo.x Trinidad y Tabago.y Montevideo.z A partir de diciembre de 2010 Montevideo y resto urbano.aa Área Metropolitana de Caracas.
a Autonomous City of Buenos Aires and Greater Buenos Aires.b Bahamas.c Barbados.d Cities of Sucre, La Paz, Cochabamba, Oruro, Potosí, Tarija, Santa Cruz de la Sierra, Trinidad and Cobija.e Brazil.f Greater Santiago (Santiago province and municipalities of Puente Alto and San Bernardo) until 2009;
national figures since 2010.g Colombia.h Greater Metropolitan area of Costa Rica.i Cuba.j Ecuador.k El Salvador.l Guatemala.m Port-au-Prince and nine urban departments.n All urban areas nationwide.o Jamaica.p Mexico.q Metropolitan area of Managua.r Urban area of Panama and San Miguelito.s Asunción.t Metropolitan Lima.u Dominican Republic.v Castries.w Paramaribo.x Trinidad and Tobago.y Montevideo.z From December 2010, Montevideo and other urban areas.aa Metropolitan area of Caracas.

126 E
CLA
C, S
tatistical Yearbook for Latin A
merica and the C
aribbean, 2012 2.3 PRECIOS / PRICES 2.3.1 PRECIOS AL CONSUMIDOR / CONSUMER PRICES
2.3.1.7 VARIACIONES DEL ÍNDICE DE PRECIOS AL CONSUMIDOR: NIVEL GENERAL VARIATIONS IN THE CONSUMER PRICE INDEX: GENERAL LEVEL (Tasas anuales medias / Average annual rates)
País 2002 2003 2004 2005 2006 2007 2008 2009 2010 2011 CountryAntigua y Barbuda 2.4 1.9 2.5 1.9 1.8 1.4 5.3 -0.6 3.4 3.5 Antigua and BarbudaArgentina a 25.9 13.4 4.4 9.6 10.9 8.8 8.6 6.3 10.5 9.8 Argentina a
Bahamas b 2.1 3.0 1.2 1.8 1.9 2.5 4.4 1.3 1.8 3.3 Bahamas b
Barbados c 0.2 1.6 1.1 6.4 7.3 4.0 8.1 3.6 5.8 9.4 Barbados c
Belice 2.2 2.6 3.1 3.6 4.2 2.3 6.4 -1.1 0.9 1.7 BelizeBolivia (Estado Plurinacional de) d 0.9 3.3 4.4 5.4 4.3 8.7 14.0 3.3 2.5 9.9 Bolivia (Plurinational State of) d
Brasil e 8.5 14.7 6.6 6.9 4.2 3.6 5.7 4.9 5.0 6.6 Brazil e
Chile f 2.5 2.8 1.1 3.1 3.4 4.4 8.7 1.5 1.5 3.0 Chile f
Colombia g 6.3 7.1 5.9 5.1 4.3 5.5 7.0 4.2 2.3 3.4 Colombia g
Costa Rica h 9.2 9.4 12.3 13.8 11.5 9.4 13.4 7.8 5.7 4.9 Costa Rica h
Cuba i -5.2 2.0 -2.2 2.8 5.1 7.1 1.6 -1.2 1.3 1.4 Cuba i
Dominica 1.1 1.6 0.6 -4.5 2.3 3.2 5.3 1.1 3.0 2.9 DominicaEcuador j 12.5 7.9 2.8 2.1 3.3 2.3 8.4 5.2 3.6 4.5 Ecuador j
El Salvador k 1.9 2.1 4.4 4.7 4.0 4.6 7.3 0.5 0.9 5.1 El Salvador k
Granada 1.1 2.2 2.3 3.5 4.3 3.9 8.0 -0.3 3.4 2.9 GrenadaGuatemala l 8.1 5.6 7.6 9.1 6.6 6.8 11.4 1.9 3.9 6.2 Guatemala l
Guyana 5.3 6.0 4.7 6.9 6.7 12.2 8.1 2.9 3.8 5.0 GuyanaHaití m 9.9 39.3 22.8 15.1 13.2 8.5 15.5 0.0 5.7 8.3 Haiti m
Honduras n 7.7 7.7 8.1 8.8 5.6 6.9 11.4 5.5 4.7 6.8 Honduras n
Jamaica o 7.1 10.3 13.6 15.3 8.6 6.2 21.8 9.4 13.1 10.6 Jamaica o
México p 5.0 4.5 4.7 4.0 3.6 4.0 5.1 5.3 4.2 3.4 Mexico p
Nicaragua q 4.0 5.1 8.4 9.4 10.0 10.7 19.6 3.0 5.9 8.5 Nicaragua q
Panamá r 1.1 1.4 1.6 0.9 2.5 4.2 8.8 2.4 3.5 5.9 Panama r
Paraguay s 10.5 14.2 4.3 6.8 9.6 8.1 10.1 2.6 4.8 8.2 Paraguay s
Perú t 0.2 2.3 3.7 1.6 2.0 1.8 5.8 2.9 1.5 3.4 Peru t
República Dominicana u 5.2 27.5 51.5 4.2 7.6 6.1 10.6 1.4 6.3 8.5 Dominican Republic u
Saint Kitts y Nevis 2.0 2.1 2.1 3.6 8.5 4.5 5.3 2.1 0.6 5.8 Saint Kitts and NevisSanta Lucía v -0.3 1.0 1.5 3.9 6.9 2.2 5.9 1.5 1.9 1.4 Saint Lucia v
San Vicente y las Granadinas 1.9 0.2 3.0 3.7 3.0 6.9 10.1 0.4 0.7 3.1 Saint Vincent and the GrenadinesSuriname w 15.9 23.7 9.4 9.2 11.3 6.5 14.6 -0.1 5.1 19.8 Suriname w
Trinidad y Tabago x 4.2 3.8 3.7 6.9 8.2 8.0 12.0 7.0 10.5 5.1 Trinidad and Tobago x
Uruguay y 14.0 19.4 9.2 4.7 6.4 8.1 7.9 7.1 6.7 z 8.1 z Uruguay y
Venezuela (República Bolivariana de) aa 22.4 31.1 21.7 16.0 13.7 18.7 31.4 28.6 29.1 27.1 Venezuela (Bolivarian Republic of) aa
America Latina y el Caribe 8.4 11.2 7.2 6.4 5.4 5.5 8.2 5.6 5.8 6.7 Latin America and the CaribbeanAmerica Latina 8.5 11.2 7.2 6.4 5.4 5.5 8.2 5.6 5.8 6.7 Latin AmericaEl Caribe 5.8 6.0 7.2 9.8 7.6 6.7 14.6 5.7 8.7 8.2 The Caribbean
a Autonomous City of Buenos Aires and Greater Buenos Aires.b Bahamas.c Barbados.d Cities of Sucre, La Paz, Cochabamba, Oruro, Potosí, Tarija, Santa Cruz de la Sierra, Trinidad and Cobija.e Brazil.f Greater Santiago (Santiago province and municipalities of Puente Alto and San Bernardo) until 2009; national figures
since 2010.g Colombia.h Greater Metropolitan area of Costa Rica.i Cuba.j Ecuador.k El Salvador.l Guatemala.m Port-au-Prince and nine urban departments.n All urban areas nationwide.o Jamaica.p Mexico.q Metropolitan area of Managua.r Urban area of Panama and San Miguelito.s Asunción.t Metropolitan Lima.u Dominican Republic.v Castries.w Paramaribo.x Trinidad and Tobago.y Montevideo.z From December 2010, Montevideo and other urban areas.aa Metropolitan area of Caracas.
a Ciudad Autónoma de Buenos Aires y Gran Buenos Aires.b Bahamas.c Barbados.d Ciudades de Sucre, La Paz, Cochabamba, Oruro, Potosí, Tarija, Santa Cruz de la Sierra, Trinidad y Cobija.e Brasil.f Gran Santiago (provincia de Santiago, comuna de Puente Alto y comuna de San Bernardo) hasta 2009; nacional a partir de 2010.g Colombia.h Gran Área Metropolitana de Costa Rica.i Cuba.j Ecuador.k El Salvador.l Guatemala.m Puerto Príncipe y nueve departamentos urbanos.n Toda el área urbana del país.o Jamaica.p México.q Área metropolitana de Managua.r Área urbana de Panamá y San Miguelito.s Asunción.t Lima Metropolitana.u República Dominicana.v Castries.w Paramaribo.x Trinidad y Tabago.y Montevideo.z A partir de diciembre de 2010 Montevideo y resto urbano.aa Área Metropolitana de Caracas.

CE
PA
L, Anuario E
stadístico de Am
érica Latina y el Caribe, 2012
127 2.3 PRECIOS / PRICES 2.3.1 PRECIOS AL CONSUMIDOR / CONSUMER PRICES
2.3.1.13 VARIACIONES DEL ÍNDICE DE PRECIOS AL CONSUMIDOR: DICIEMBRE A DICIEMBRE VARIATIONS IN THE CONSUMER PRICE INDEX: DECEMBER TO DECEMBER (Tasas anuales medias / Average annual rates)
País 2002 2003 2004 2005 2006 2007 2008 2009 2010 2011 CountryAntigua y Barbuda 2.5 1.8 2.8 2.5 0.0 5.2 0.7 2.4 2.9 3.9 Antigua and BarbudaArgentina a 41.0 3.7 6.1 12.3 9.8 8.5 7.2 7.7 10.9 8.0 Argentina a
Bahamas b 1.9 2.4 1.9 1.2 2.3 2.8 4.6 1.3 1.4 3.2 Bahamas b
Barbados c 0.9 0.3 4.3 7.4 5.9 2.8 7.3 4.4 6.5 9.1 Barbados c
Belice d 3.2 2.3 3.1 4.2 2.9 4.1 4.4 -0.4 0.0 2.6 Belize dBolivia (Estado Plurinacional de) e 2.5 3.9 4.6 4.9 4.9 11.7 11.8 0.3 7.2 6.0 Bolivia (Plurinational State of) e
Brasil f 12.5 9.3 7.6 5.7 3.1 4.5 5.9 4.3 5.9 5.4 Brazil f
Chile g 2.8 1.1 2.4 3.7 2.6 7.8 7.1 -1.4 3.0 3.5 Chile g
Colombia h 7.0 6.5 5.5 4.9 4.5 5.7 7.7 2.0 3.2 3.1 Colombia h
Costa Rica i 9.7 9.9 13.1 14.1 9.4 10.8 13.9 4.0 5.8 3.5 Costa Rica i
Cuba 7.3 -3.8 2.9 3.7 5.7 10.6 0.0 0.0 1.5 0.3 CubaDominica j 0.5 2.8 -7.2 2.7 1.8 6.0 2.0 3.3 2.3 1.3 Dominica j
Ecuador k 9.4 6.1 1.9 3.1 2.9 3.3 8.8 4.3 3.3 4.7 Ecuador k
El Salvador 2.8 2.5 5.4 4.3 4.9 4.9 5.5 -0.2 2.1 5.1 El SalvadorGranada l 2.3 1.6 2.5 6.2 1.7 7.4 5.2 -2.3 4.2 3.5 Grenada l
Guatemala 6.3 5.9 9.2 8.6 5.8 8.7 9.4 -0.3 5.4 5.7 GuatemalaGuyana m 6.0 5.0 5.5 8.2 4.2 14.1 6.4 3.6 4.5 3.3 Guyana mHaití n 14.8 40.4 20.2 15.4 10.2 9.3 17.0 2.1 6.2 7.8 Haiti n
Honduras o 8.1 6.8 9.2 7.7 5.3 8.9 10.8 3.0 6.5 5.0 Honduras o
Jamaica p 7.3 14.1 13.7 12.9 5.8 16.8 16.9 10.2 11.8 5.1 Jamaica p
México q 5.7 4.0 5.2 3.3 4.1 3.8 6.5 3.6 4.4 1.9 Mexico q
Nicaragua r 4.0 6.6 8.9 9.6 10.2 16.2 12.7 1.8 9.1 6.1 Nicaragua r
Panamá s 1.9 1.5 1.5 3.4 2.2 6.4 6.8 1.9 4.9 5.2 Panama s
Paraguay t 14.6 9.3 2.8 9.9 12.5 6.0 7.5 1.9 7.2 4.2 Paraguay t
Perú u 1.5 2.5 3.5 1.5 1.1 3.9 6.7 0.2 2.1 4.0 Peru u
República Dominicana 10.5 42.7 28.7 7.5 5.0 8.9 4.5 5.7 6.3 7.5 Dominican RepublicSaint Kitts y Nevis v 1.7 3.0 1.6 6.2 8.0 2.9 6.5 1.2 5.2 2.9 Saint Kitts and Nevis vSanta Lucía -0.7 0.5 3.5 5.2 -0.5 6.8 3.4 -3.1 4.2 4.8 Saint Lucia
San Vicente y las Granadinas w 2.4 2.2 1.7 3.9 4.8 8.3 8.7 -1.6 0.7 4.9 Saint Vincent and the Grenadines wSuriname x 29.3 ... ... 15.8 4.7 8.3 9.4 1.3 10.3 15.3 Suriname x
Trinidad y Tabago y 4.3 3.0 5.6 7.2 9.1 7.6 14.5 1.3 13.4 4.1 Trinidad and Tobago y
Uruguay z 25.9 10.2 7.6 4.9 6.4 8.5 9.2 5.9 6.9 aa 7.4 aa Uruguay z
Venezuela (República Bolivariana de) ab 31.2 27.1 19.2 14.4 17.0 22.5 31.9 26.9 27.4 24.0 Venezuela (Bolivarian Republic of) ab
America Latina y el Caribe 12.1 8.3 7.4 6.1 5.0 6.5 8.2 4.6 6.5 5.5 Latin America and the CaribbeanAmerica Latina 12.1 8.3 7.3 6.1 5.0 6.4 8.2 4.6 6.4 5.5 Latin AmericaEl Caribe 7.0 7.3 7.8 9.7 5.7 11.5 12.3 5.0 9.2 5.3 The Caribbean
a Ciudad Autónoma de Buenos Aires y Gran Buenos Aires.b Bahamas.c Barbados.d Corresponde al mes de noviembre de cada año, dado el esquema de publicación del país.e Ciudades de Sucre, La Paz, Cochabamba, Oruro, Potosí, Tarija, Santa Cruz de la Sierra, Trinidad y Cobija.f Brasil.g Gran Santiago (provincia de Santiago, comuna de Puente Alto y comuna de San Bernardo) hasta 2009; nacional a partir de 2010.h Colombia.i Gran Área Metropolitana de Costa Rica.j Cuba.k Ecuador.l El Salvador.m Guatemala.n Puerto Príncipe y nueve departamentos urbanos.o Toda el área urbana del país.p Jamaica.q México.r Área metropolitana de Managua.s Área urbana de Panamá y San Miguelito.t Asunción.u Lima Metropolitana.v República Dominicana.w Castries.x Paramaribo.y Trinidad y Tabago.z Montevideo.aa A partir de diciembre de 2010, Montevideo y resto urbano.ab Área Metropolitana de Caracas.
a Autonomous City of Buenos Aires and Greater Buenos Aires.b Bahamas.c Barbados.d For the month of November each year, given the country’s publication scheme.e Cities of Sucre, La Paz, Cochabamba, Oruro, Potosí, Tarija, Santa Cruz de la Sierra, Trinidad and Cobija.f Brazil.g Greater Santiago (Santiago province and municipalities of Puente Alto and San Bernardo) until 2009; national figures since 2010.h Colombia.i Greater Metropolitan area of Costa Rica.j Cuba.k Ecuador.l El Salvador.m Guatemala.n Port-au-Prince and nine urban departments.o All urban areas nationwide.p Jamaica.q Mexico.r Metropolitan Area of Managua.s Urban area of Panama and San Miguelito.t Asunción.u Metropolitan Lima.v Dominican Republic.w Castries.x Paramaribo.y Trinidad and Tobago.z Montevideo.aa From December 2010, Montevideo and other urban areas.ab Metropolitan area of Caracas.

CEPAL, Anuario Estadístico de América Latina y el Caribe, 2012 129
Notas técnicas / Technical notes
�


CEPAL, Anuario Estadístico de América Latina y el Caribe, 2012 131
1. Estadísticas sociales
�
En este capítulo se presentan estadísticas sociales, elaboradas tanto por la CEPAL como por los organismos internacionales especializados, extraídas principalmente de encuestas de hogares y, en menor medida, de los censos de población y vivienda y de los registros administrativos. Las estadísticas se organizan en siete áreas temáticas: población, trabajo, educación, salud, vivienda y servicios básicos, pobreza y distribución del ingreso, y género. Estas áreas temáticas corresponden a algunas de las principales divisiones de las funciones de política asignadas comúnmente a distintos ministerios en los países (trabajo, educación, salud, vivienda) o a esferas de la política intersectorial (población, pobreza y distribución del ingreso, y género). En la medida de lo posible, los indicadores han sido desagregados según distintas dimensiones (sexo, grupos de edad, áreas geográficas y niveles de ingreso, entre otras) para destacar las desigualdades socioeconómicas que caracterizan a la región.
Asimismo, se presentan algunos cuadros con indicadores que permiten hacer el seguimiento de los objetivos de desarrollo convenidos internacionalmente, incluidos los que figuran en la Declaración del Milenio, aprobada en septiembre de 2000 por la Asamblea General de las Naciones Unidas.
En esta publicación, el término “país” se refiere a entidades territoriales, ya sean Estados conforme al derecho y la práctica internacionales o territorios sobre los cuales se mantienen datos estadísticos en forma separada e independiente1.
Es posible consultar información estadística adicional en la Base de Datos y Publicaciones Estadísticas (CEPALSTAT) de la CEPAL [en línea] http://websie. eclac.cl/infest/ajax/cepalstat.asp?carpeta=estadisticas.
1 La denominación “Antillas Neerlandesas” se refiere a la antigua entidad autónoma del Reino de los Países Bajos, que se disolvió el 10 de octubre de 2010 e incluía los territorios de Curazao, San Martín, Bonaire, San Eustaquio y Saba.
1. Social statistics
This chapter offers social statistics prepared by ECLAC and by specialized international agencies, deriving mainly from household censuses and, to a lesser extent, from population and housing censuses and administrative records. The statistics are grouped into seven subject areas: population, labour, education, health, housing and basic services, poverty, income distribution and gender. These subject areas correspond to some of the main divisions of policy functions commonly assigned to different national ministries (labour, education, health, housing) as well as to spheres of intersectoral policy (population, poverty, income distribution and gender). To the extent possible, the indicators have been disaggregated according to different dimensions such as sex, age group, geographical area and income level, to highlight the socio-economic inequalities that characterize the region.
The chapter also contains tables with indicators that can be used to monitor implementation of internationally agreed development goals, including those set forth in the Millennium Declaration, adopted in September 2000 by the United Nations General Assembly.
As used in this publication, the term “country” refers to a territorial entity that is either a State as understood by international law and practice or a territorial entity that is not a State but for which statistical data are maintained on a separate and independent basis.1
Further statistical information may be obtained from the Commission’s CEPALSTAT Databases and Statistical Publications [online] http://websie. eclac.cl/infest/ajax/cepalstat.asp?carpeta=estadisticas.
1 The denomination “Netherlands Antilles” refers to the former autonomous part of the Kingdom of the Netherlands which was dissolved on 10 October 2010 and includes the constituent entities of Curacao and Sint Maarten and the Netherlands municipalities of Bonaire, Sint Eustatius and Saba.
132 ECLAC, Statistical Yearbook for Latin America and the Caribbean, 2012
�1.1 Población
Las series sobre los indicadores de población corresponden en su mayoría a las estimaciones y proyecciones que realizan el Centro Latinoamericano y Caribeño de Demografía (CELADE) - División de Población de la CEPAL y la División de Población de las Naciones Unidas. La preparación de estas estimaciones de población para el período 1950-2010, Revisión 2011, incorpora la nueva información sobre el dinamismo demográfico del pasado de cada país o área y las proyecciones de población para el período 2010-2050, y considera la formulación detallada de los futuros patrones o tendencias de las variables biodemográficas de fecundidad, mortalidad y migración internacional. La futura población de cada país o área se proyecta a partir de la población estimada al 1 de julio de 2010. Debido a que los datos de población no siempre están disponibles a esa fecha, la estimación se deriva de los datos más recientes de población disponibles en cada país, normalmente obtenidos de censos de población y vivienda, estadísticas vitales, encuestas demográficas y registros de población, y se proyecta a 2010 empleando las tendencias de las variables biodemográficas señaladas anteriormente entre la fecha de referencia con datos de población disponibles y el 1 de julio de 2010. Todas las series desplegadas corresponden a la hipótesis de fecundidad media, recomendada para comparaciones internacionales y entre ambos períodos, 1950-2010 y 2010-2050.
En el plano geográfico, la información proporcionada por el CELADE-División de Población de la CEPAL cubre 20 países de América Latina: Argentina, Bolivia (Estado Plurinacional de), Brasil, Chile, Colombia, Costa Rica, Cuba, Ecuador, El Salvador, Guatemala, Haití, Honduras, México, Nicaragua, Panamá, Paraguay, Perú, República Dominicana, Uruguay y Venezuela (República Bolivariana de).
La información proporcionada por la División de Población de las Naciones Unidas cubre 46 países y territorios de América Latina y el Caribe que conforman las subregiones de Centroamérica, América del Sur y el Caribe. No se considera América del Norte.
Centroamérica (8): Belice, Costa Rica, El Salvador, Guatemala, Honduras, México, Nicaragua y Panamá.
América del Sur (14): Argentina, Bolivia (Estado Plurinacional de), Brasil, Chile, Colombia, Ecuador, Guyana, Guayana Francesa, Islas Malvinas (Falkland Islands), Paraguay, Perú, Suriname, Uruguay y Venezuela (República Bolivariana de).
El Caribe (24): Anguila, Antigua y Barbuda, antiguas Antillas Neerlandesas, Aruba, Bahamas, Barbados, Cuba, Dominica, Granada, Guadalupe, Haití, Islas Caimán, Islas Turcas y Caicos, Islas Vírgenes Británicas, Islas Vírgenes de los Estados Unidos, Jamaica, Martinica, Monserrat, Puerto Rico, República Dominicana, Saint Kitts y Nevis, San Vicente y las Granadinas, Santa Lucía y Trinidad y Tabago.
1.1 Population
Most of the population indicator series are estimates and projections prepared by the Latin American and Caribbean Demographic Centre (CELADE) - Population Division of ECLAC and by the United Nations Population Division. The population estimates for the period 1950-2010, Revision 2011, include the new data on past population growth for each country or area and the population projections for the period 2010-2050. They also offer a detailed breakdown of future patterns or tendencies of the following biodemographic variables: fertility, mortality and international migration. The future population of each country or area is projected on the basis of the estimated population at 1 July 2010. Because population data are not always available as at that date, estimates are derived from the most recent population data available in each country, which are normally obtained from population and housing censuses, vital statistics records, demographic surveys and population records. The estimates are projected to 2010 on the basis of the aforementioned biodemographic variables between the reference date, with available population data, and 1 July 2010. All the series shown correspond to the medium-fertility scenario, recommended for comparisons among countries and between the two periods, 1950-2010 and 2010-2050.
In terms of geography, the information from CELADE covers 20 countries of Latin America. Argentina, Bolivarian Republic of Venezuela, Brazil, Chile, Colombia, Costa Rica, Cuba, Dominican Republic, Ecuador, El Salvador, Guatemala, Haiti, Honduras, Mexico, Nicaragua, Panama, Paraguay, Peru, Plurinational State of Bolivia and Uruguay.
The information provided by the United Nations Population Division covers 46 countries and territories of Latin America and the Caribbean, which make up the subregions of Central America, South America and the Caribbean. North America is not included.
Central America (8): Belize, Costa Rica, El Salvador, Guatemala, Honduras, Mexico, Nicaragua and Panama.
South America (14): Argentina, Bolivarian Republic of Venezuela, Brazil, Chile, Colombia, Ecuador, Falkland Islands (Malvinas), French Guiana, Guyana, Paraguay, Peru, Plurinational State of Bolivia, Suriname and Uruguay.
The Caribbean (24): Anguilla, Antigua and Barbuda, Aruba, Bahamas, Barbados, British Virgin Islands, Cayman Islands, Cuba, Dominica, Dominican Republic, Grenada, Guadeloupe, Haiti, Jamaica, Martinique, Montserrat, Netherlands Antilles, Puerto Rico, Saint Kitts and Nevis, Saint Lucia, Saint Vincent and the Grenadines, Turks and Caicos Islands, Trinidad and Tobago, and the United States Virgin Islands.

CEPAL, Anuario Estadístico de América Latina y el Caribe, 2012 133
Es importante destacar que los totales de la región de América Latina y el Caribe y de la subregión del Caribe provenientes de la División de Población de las Naciones Unidas no corresponden a la suma de los países y territorios desplegados separadamente en el Anuario Estadístico por tres razones:i) Se listan separadamente solo aquellos países o áreas
con 100.000 o más habitantes en 2010; el resto se incluye en los agregados regionales, pero no se listan separadamente, por lo tanto, los agregados regionales no corresponden a la suma de los países listados.
ii) Aquellos países cubiertos por el CELADE-División de Población de la CEPAL no se vuelven a desplegar separadamente.
iii) Solo se listan separadamente los Estados miembros y asociados de la CEPAL.Tasa de crecimiento de la población total. Representa
el cociente entre el incremento medio anual total durante un período determinado y la población del mismo período, expresado por cada 100 habitantes.
Relación de dependencia demográfica. Representa la dependencia demográfica de algunos grupos específicos de edad sobre la población de entre 15 y 64 años. La dependencia total es la relación entre la suma de los grupos de población de entre 0 y 14 años y de 65 años y más sobre la población de entre 15 y 64 años de edad. Niños: relación entre la población de entre 0 y 14 años sobre la población de entre 15 y 64 años de edad. Adultos: relación de la población de 65 años y más sobre la población de entre 15 y 64 años de edad.
Tasa bruta de natalidad. Representa el número de personas nacidas vivas por cada 1.000 habitantes. Es el cociente entre el número medio anual de nacimientos ocurridos durante un período determinado y la población media del mismo período, expresado por 1.000.
Tasa bruta de mortalidad. Representa el número de defunciones por cada 1.000 habitantes. Es el cociente entre el número medio anual de defunciones ocurridas durante un período determinado y la población media del mismo período, expresado por 1.000.
Tasa global de fecundidad. Representa el número de hijos que en promedio tendría una mujer de una cohorte hipotética de mujeres que durante su vida fértil tuvieran sus hijos de acuerdo con las tasas de fecundidad por edades del período en estudio y no estuvieran expuestas a riesgos de mortalidad desde el nacimiento hasta la finalización del período fértil.
Esperanza de vida al nacer. Representa la duración media de la vida de los individuos que integran una cohorte hipotética de nacimientos, sometidos en todas las edades a los riesgos de mortalidad del período en estudio.
Población en el área metropolitana principal. La información de este rubro proviene de los censos de población y vivienda de la ronda de 2000. Se incluyen un conjunto de indicadores que muestran la importancia relativa de la
It should be noted that the totals for the region of Latin America and the Caribbean and the subregion of the Caribbean provided by the United Nations Population Division do not correspond to the sum of those for the countries and territories listed separately in the Statistical Yearbook, for three reasons:
(i) Only those countries or regions with 100,000 or more inhabitants in 2010 are listed separately; the remainder are included in the regional aggregates but are not listed separately; therefore, the regional aggregates do not correspond to the sum of the countries listed.
(ii) Those countries covered by CELADE are not relisted separately.
(iii) Only ECLAC member States and associated members are listed separately.Total population growth rate. The ratio of the total
mean annual growth of a population in a given period of time to the population in this same period, expressed for each 100 inhabitants.
Demographic dependency ratio. The demographic dependency of specific age groups on the population aged between 15 and 64. The total dependency is the ratio of the population groups aged between 0 and 14 plus those aged 65 or more to the population aged between 15 and 64. Children: ratio of the population aged between 0 and 14 to the population aged between 15 and 64. Adults: ratio of the population aged 65 and older to the population aged between 15 and 64.
Crude birth rate. The number of live births per 1,000 inhabitants. The ratio of the mean annual number of births over a given period of time to the mean population during the same period, expressed per 1,000.
Crude mortality rate. The number of deaths per 1,000 inhabitants. The ratio of the mean annual number of deaths over a given period of time to the mean population during the same period, expressed per 1,000.
Total fertility rate. The total fertility rate measures the average number of children who would be born to a woman belonging to a hypothetical cohort of females whose reproductive performance over their entire reproductive period was in accordance with the age fertility rates for the years in question; it is further supposed that the women have not been exposed to mortality risks from the time of birth up until the end of their reproductive period.
Life expectancy at birth. Life expectancy at birth is the mean length of life of individuals from a hypothetical cohort of births whose members have been subject since birth to the mortality risks of the period in question.
Population in the main metropolitan area. The information in this section is derived from the population and housing censuses of the 2000 round. It includes a series of indicators that show the relative weight of the population in localities of

134 ECLAC, Statistical Yearbook for Latin America and the Caribbean, 2012
población en localidades de distinto tamaño y el crecimiento que estas han experimentado en los últimos decenios. Dada la dificultad de comparar la información entre países debido a la falta de uniformidad en las definiciones y a las diferencias en la forma de identificar las aglomeraciones urbanas, se presentan además los datos sobre la distribución espacial, desagregando la población según el tamaño de las localidades de residencia, de acuerdo con los últimos censos de población. Se consideró como área metropolitana la superficie de la ciudad central más las zonas de alta densidad de su entorno.
Tamaño medio de los hogares urbanos según quintil de ingreso. La información para el cálculo de este indicador proviene de las encuestas de hogares proporcionadas por los países, y es procesada por la División de Estadísticas de la CEPAL. Ello impone ciertas restricciones debido a que no todos los países realizan encuestas periódicamente y, en algunos casos, la cobertura geográfica se limita a las áreas urbanas.
El indicador corresponde al número medio de personas por hogar en las zonas urbanas. El quintil de ingreso corresponde al ingreso de los hogares ordenados por quintil de ingreso per cápita. El quintil 1 corresponde a los hogares más pobres y el quintil 5 a los hogares más ricos.
La definición de hogar comúnmente utilizada en las encuestas de hogares corresponde a “una persona o conjunto de personas emparentadas o no entre sí, que residen habitualmente en la vivienda y se asocian para atender sus necesidades de alimentos y de otros bienes y servicios esenciales”.
Clasificación de hogares. Utilizando la variable relación de parentesco entre los miembros que integran un hogar en relación con la persona identificada como “jefe del hogar”, se definieron tipos de hogares en los cuales se estudiaron características especiales, como el sexo del jefe del hogar y el estrato de ingresos correspondiente.
Los tipos de hogares definidos de acuerdo con la presencia o ausencia de determinados miembros del hogar son:i) hogar unipersonal, integrado por una sola persona;
ii) hogar nuclear biparental, integrado por el padre y la madre (pareja unida o casada legalmente) y uno o más hijos;
iii) hogar nuclear monoparental, integrado por uno de los padres y uno o más hijos;
iv) hogar nuclear sin hijos, integrado por la pareja unida o casada legalmente sin hijos, y
v) hogar extenso o compuesto, que corresponde a cualquiera de los tipos definidos anteriormente, más uno o más parientes o no parientes del jefe de hogar.
Los cuadros 1.1.16 a 1.1.21 no se incluyen en la versión impresa, pero pueden encontrarse en el CDROM, así como en la versión publicada en Internet.
different sizes and the growth they have experienced in recent decades. Given the difficulty of comparing the information for different countries due to the lack of uniformity in the definitions and to differences in the way urban agglomerations are identified, data on spatial distribution are also presented on the basis of a breakdown of the population according to the size of localities of residence, based on the latest population censuses. Metropolitan area was considered to refer to the area comprised by the central city plus the nearby high-density areas.
Average size of urban households, by income quintile. The date used to calculate this indicator come from the household surveys provided by the countries and is processed by the Statistics Division of ECLAC. This imposes certain constraints owing to the fact that not all countries conduct regular censuses and, in some cases, geographic coverage is limited to urban areas.
The indicator corresponds to the average number of persons per household in urban areas. The income quintile corresponds to household income according to per capital income quintile. Quintile 1 corresponds to the poorest households and quintile 5 to the wealthiest households.
For the purpose of household surveys, household is commonly defined as “a person or group of persons, whether related or not, who normally reside together in a housing unit and combine to provide themselves with food and other essential goods and services”.
Categorization of households. A number of categories of households were defined based on the kinship relationship between the members of a household and the designated “head of household”. Various characteristics of these different types of households, such as the sex of the head of household and the relevant income stratum, were then examined.
The following types of households were identified on the basis of their composition:(i) single-person household: a household composed of
one person;(ii) two-parent nuclear household: a household composed
of a father and mother (a free union or a legally married couple) and one or more children;
(iii) single-parent nuclear household: a household composed of one parent and one or more children;
(iv) childless nuclear household: a household composed of a couple, whether living in free union or legally married, with no children;
(v) extended or composite household: a household corresponding to any of the above categories which also includes one or more relatives or non-relatives of the head of household.
Tables 1.1.16 to 1.1.21 are not included in the printed version, but they are available on CD-ROM as well as in the version published online.

CEPAL, Anuario Estadístico de América Latina y el Caribe, 2012 135
�1.2 Trabajo
En esta sección se presentan datos provenientes de diferentes fuentes de información que determinan las características específicas de los datos. Las proyecciones de población corresponden a las series revisadas por el CELADE-División de Población de la CEPAL a partir de 1990, mediante la aplicación de una metodología que permite aprovechar la información recopilada en los censos y encuestas de hogares2.
Por otra parte, se utiliza la información de las encuestas de hogares de los países, procesadas por la División de Estadísticas de la CEPAL, para describir y caracterizar la fuerza de trabajo. Esto impone ciertas restricciones, debido a que no todos los países realizan encuestas periódicamente y, en algunos casos, la cobertura geográfica se limita a las áreas urbanas. Sobre la base de esas encuestas, se presenta un conjunto de indicadores de empleo referidos exclusivamente a las áreas urbanas y calculados a partir de una población económicamente activa (PEA) de 15 años y más. Esto se ha hecho con el objeto de homogeneizar la información, dado que las encuestas nacionales difieren en cuanto a la cobertura geográfica y los límites mínimos de edad para la determinación de la PEA.
También se emplea información proveniente de las fuentes oficiales de los países, recopilada por la División de Desarrollo Económico de la CEPAL para elaborar sus principales publicaciones de carácter económico.
Proyecciones de la PEA. Esta información proviene de las proyecciones realizadas por el CELADE-División de Población de la CEPAL y permiten mostrar las tendencias de la PEA de 15 años y más, y las tasas de participación en la actividad económica.
Se considera población económicamente activa al conjunto de personas que están dispuestas a aportar su trabajo para la producción de bienes y servicios económicos. Se han homogeneizado tanto los límites de edad como la definición de la PEA.
Tasa de participación en la actividad económica. Esta información proviene de las encuestas de hogares. Se presentan las tasas clasificadas por sexo que corresponden al cociente entre la PEA de 15 años y más y la población total de esa misma edad de cada sexo, multiplicada por 100.
2 Véanse detalles metodológicos en Centro Latinoamericano y Caribeño de Demografía (CELADE) - División de Población de la CEPAL, “Población económicamente activa”, Observatorio Demográfico, Nº 2 (LC/G.2337-P), Santiago de Chile, octubre de 2006. Publicación de las Naciones Unidas, Nº de venta: E/S.07.II.G.28.
1.2 Labour
This section provides data from various sources, each of which imparts certain specific characteristics to the corresponding information. The population projections correspond to the series revised by the Latin American and Caribbean Demographic Centre (CELADE) - Population Division of ECLAC from 1990 on, based on a methodology that permits the utilization of information compiled in censuses and household surveys.2
In addition, the information from the household surveys conducted by the respective countries, processed by the Statistics Division of ECLAC, is used to describe and characterize the labour force. This imposes certain constraints owing to the fact that not all countries conduct periodic censuses and, in some cases, geographic coverage is limited to urban areas. Based on these surveys, a number of employment indicators are presented. These indicators refer exclusively to urban areas and have been calculated for an economically active population (EAP) aged 15 and over. This procedure has been used in the interests of comparability, since the countries’ surveys differ in terms of their geographic coverage and the lower age limits used for defining the EAP.
In addition, ECLAC uses information from the countries’ official sources, gathered by its Economic Development Division, in the preparation of its main economic publications.
EAP projections. This information comes from the projections conducted by CELADE and provides an indication of trends in the EAP aged 15 and above as well as economic participation rates.
The EAP is considered to be the total number of persons willing to supply their labour for the production of economic goods and services. Age limits and the definition of the EAP have been standardized.
Participation in economic activity. This information is derived from household surveys. Participation rates, given by sex, represent the ratio between the EAP aged 15 or over and the male and female populations in that same age group, multiplied by 100.
2 For methodological details, see: Latin American and Caribbean Demographic Centre (CELADE) - Population Division of ECLAC, Demographic Observatory No. 2, Economically Active Population (LC/G.2337-P), Santiago, Chile, October 2006. United Nations publication, sales No. E/S.07.II.G.28.

136 ECLAC, Statistical Yearbook for Latin America and the Caribbean, 2012
Ocupación por rama de actividad económica. Se tabula de acuerdo con las nueve grandes divisiones de la Clasificación Industrial Internacional Uniforme de Todas las Actividades Económicas, Rev. 2. Se presenta la estructura porcentual de los ocupados por rama o sector de actividad, en términos generales y por sexo.
Ocupación por grupos ocupacionales. Esta información proviene de las encuestas de hogares. Se clasifica de acuerdo con los principales grupos de ocupación de la Clasificación Internacional Uniforme de Ocupaciones (CIUO) de la Organización Internacional del Trabajo (OIT) (1988): grupo 1: miembros del poder ejecutivo y de los cuerpos legislativos y personal directivo de la administración pública y de empresas; grupo 2: profesionales científicos e intelectuales; grupo 3: técnicos y profesionales de nivel medio; grupo 4: empleados de oficina; grupo 5: trabajadores de los servicios y vendedores de comercios y mercados; grupo 6: agricultores y trabajadores calificados agropecuarios y pesqueros; grupo 7: oficiales, operarios y artesanos de artes mecánicas y de otros oficios; grupo 8: operadores de instalaciones y máquinas y montadores; grupo 9: trabajadores no calificados, y grupo 0: fuerzas armadas. La información del cuadro correspondiente incluye solo a los países cuyas encuestas de hogares son compatibles con la CIUO-88.
Ocupación por categoría ocupacional. Esta información proviene de las encuestas de hogares. Se clasificó en cuatro grupos homogéneos: empleadores, asalariados, trabajadores por cuenta propia y personal de servicio doméstico. Asimismo, se presenta la estructura porcentual de la población ocupada, clasificada en dichas categorías, en términos generales y por sexo.
Tasa de desempleo. Estas cifras provienen de las fuentes oficiales de los países. En esta tasa se considera la población desocupada en un determinado período, es decir, aquellos que están cesantes pero han intentado emplearse, y los que buscan trabajo por primera vez dentro de la población económicamente activa. Debe tenerse presente que las cifras corresponden a distintos períodos, debido a que los años de referencia utilizados con respecto al empleo o desempleo en las encuestas nacionales varían de un país a otro. Los datos corresponden a las tasas de desempleo abierto a nivel nacional, a menos que se indique la inclusión del desempleo oculto o que corresponda a cobertura urbana. Tasa de desempleo abierto urbano según sexo y grupos de edad. Esta información proviene de las encuestas de hogares. El indicador resulta del cociente entre la población desocupada urbana de 15 años y más, por grupos de edad y sexo, y la PEA urbana de 15 años y más, por los grupos de edad y sexo respectivos. Este es un indicador representativo del indicador de los Objetivos de Desarrollo del Milenio tasa de desempleo juvenil entre 15 y 24 años de edad. Aunque el indicador se visualiza en la estructura, no forma parte de la lista oficial de los indicadores de los ODM, vigente a partir de enero de 2008. Sin embargo, la CEPAL ha considerado relevante mantener un indicador complementario para monitorear la meta 1B, debido a la persistente necesidad
Employment by kind of economic activity. This information is derived from household surveys and has been tabulated on the basis of the nine major divisions of the International Standard Industrial Classification of All Economic Activities, Rev. 2. The occupational structure is given in percentages by kind of activity, for the total working population and by sex.
Employment by occupational group. This information is derived from household surveys. Employment is broken down into the major occupational groups of the ILO International Standard Classification of Occupations (ISCO), 1988 edition: group 1 Legislators, senior officials and managers; group 2 Professionals; group 3 Technicians and associate professionals; group 4 Clerks; group 5 Service workers and shop and market sales workers; group 6 Skilled agricultural and fishery workers; group 7 Craft and related trade workers; group 8 Plant and machine operators and assemblers; group 9 Elementary occupations; group 0 Armed forces. The information in the corresponding table includes only those countries whose household surveys are compatible with ISCO-1988.
Employment by category of employment. This information is derived from household surveys. Employment is disaggregated by occupational category on the basis of four standardized groups: employers, wage earners, own-account workers and domestic staff. The distribution of the employed population among these categories is given in percentages, for the total working population and by sex.
Unemployment rate. These figures come from official sources in the countries. This rate comprises the unemployed population in a given period —that is, those who are jobless but have attempted to find employment and those among the EAP who are seeking work for the first time. It should be recalled that the figures correspond to different periods, because the reference years used for employment and unemployment in national surveys vary from one country to the next. The data correspond to the open unemployment rate and the urban employment rate, unless it is indicated that hidden unemployment is included or that coverage is nationwide.
Urban open unemployment rate, by sex and age group. This information is derived from the household surveys. The indicator is the ratio of the urban unemployed population aged 15 or over, disaggregated by age group and sex, and the EAP aged 15 or over, also disaggregated by age group and sex. This is a proxy indicator for the discontinued Millennium Development Goals indicator on the proportion of unemployed youth between the ages of 15 and 24. Although this indicator is apparent in the structure, it does not figure on the official list of Millennium Development Goal indicators in use since January 2008. Nevertheless, ECLAC deems it worthwhile to maintain a complementary indicator to monitor target 1B, owing to the persistent need to “develop and implement

CEPAL, Anuario Estadístico de América Latina y el Caribe, 2012 137
de “elaborar y aplicar estrategias que proporcionen a los jóvenes un trabajo digno y productivo”.
Tasa de desempleo abierto urbano, según sexo y años de estudios. Estas cifras provienen de las encuestas de hogares. El indicador resulta del cociente entre la población desocupada urbana de 15 años y más, por cada grupo de años de escolaridad y sexo determinado y la PEA urbana de 15 años y más, por cada grupo de años de escolaridad y sexo respectivamente.
Los cuadros 1.2.6, 1.2.7, 1.2.9, 1.2.10, 1.2.12, 1.2.13, 1.2.15 y 1.2.16 no se incluyen en la versión impresa; sin embargo, pueden encontrarse en el CDROM, así como en la versión publicada en Internet.
�1.3 Educación
En esta sección se suministran datos sobre el nivel educativo de la población potencialmente disponible para el mercado de trabajo, la capacidad del sistema educativo para incorporar a los segmentos de la población en edad escolar, y los recursos humanos y materiales invertidos en la educación. Las fuentes principales de información son el Instituto de Estadística de la Organización de las Naciones Unidas para la Educación, la Ciencia y la Cultura (UNESCO) y la División de Estadísticas de la CEPAL.
Tasa de alfabetización de adultos. Es el porcentaje de mayores de 15 años que son capaces de leer y escribir, con entendimiento, un relato simple y breve de su vida cotidiana.
Matrícula en cada nivel de enseñanza. Los datos sobre matrícula se compilaron de acuerdo con la nueva Clasificación Internacional Normalizada de la Educación de 1997 (CINE, 1997). Para su medición se ha adoptado la tasa neta de matrícula, que representa la relación entre el total de matriculados en edad escolar oficial en cada uno de los niveles de enseñanza y la población total en edad escolar oficial para cada nivel (excepto en el caso de la educación terciaria, para la cual se consideró la tasa bruta de matrícula). En la comparación internacional de estos datos debe tenerse en cuenta que los países no guardan uniformidad con respecto a los programas y extensión de cada nivel.
Según la definición de la UNESCO, la enseñanza de segundo nivel es la que se imparte en las escuelas de enseñanza general, normal y vocacional. Mientras que el título obtenido en las primeras permite el ingreso al tercer nivel, ello no es necesariamente así en el caso de las otras dos. La enseñanza de tercer nivel es aquella para cuya admisión se exige como condición mínima haber cursado con éxito el segundo nivel o estar en condiciones de demostrar la posesión de conocimientos equivalentes. En la comparación de los datos de matrícula en el tercer nivel deberá considerarse el posible
strategies for decent and productive work for youth”.
Urban open unemployment rate, by sex and years of schooling. This information comes from the household surveys. The indicator is derived from the ratio of the urban unemployed population aged 15 or over, disaggregated by years of schooling and sex, to the EAP aged 15 or over, also disaggregated by years of school and sex.
Tables 1.2.6, 1.2.7, 1.2.9, 1.2.10, 1.2.12, 1.2.13, 1.2.15 and 1.2.16 are not included in the printed version, but they are available on CD-ROM as well as in the version published online.
1.3 Education
This section provides data on the educational level of the population potentially available for the labour market, the educational system’s capacity to incorporate school-age population segments and the human and material resources invested in education. The main sources of information are the Institute for Statistics of the United Nations Educational, Scientific and Cultural Organization (UNESCO) and the Statistics Division of ECLAC.
Adult literacy rate. Percentage of persons aged 15 or over able to read, understand and write a brief, simple recital of facts related to daily life.
Enrolment at each level of education. Enrolment data has been compiled in accordance with the new International Standard Classification of Education 1997 (ISCED, 1997). The measurement used for this variable is the net school enrolment rate, which is the ratio of the total number of pupils of official school age enrolled in each level of education to the total population of official school age (except in the case of tertiary education, for which the gross school enrolment rate is used). Any comparison of these data across countries should take into account that countries vary with respect to the content and the length of each level.
As defined by UNESCO, second-level education is the instruction provided in general education schools, teacher training schools and vocational schools. A diploma awarded by a general education or teaching training school makes it possible to enter the third level, but this is not necessarily true of vocational schools. Third-level education is education for admission to which it is necessary, as a minimum condition, to have successfully completed the second level or to be able to demonstrate the possession of equivalent knowledge. Comparisons of data on enrolment in third-level education

138 ECLAC, Statistical Yearbook for Latin America and the Caribbean, 2012
�1.4 Salud
Los indicadores de salud presentados en el primer cuadro de este capítulo provienen de cuatro fuentes internacionales: el Fondo de las Naciones Unidas para la Infancia (UNICEF), la Organización Mundial de la Salud (OMS), el Fondo de Población de las Naciones Unidas (UNFPA) y la Organización de las Naciones Unidas para la Agricultura y la Alimentación (FAO). Los indicadores seleccionados son los siguientes:
Mortalidad materna. Indicador calculado por el UNICEF. Se define como el número de mujeres fallecidas anualmente por causas relacionadas con el embarazo, el parto y el puerperio, por cada 100.000 nacidos vivos.
efecto de las diferencias en la proporción de estudiantes de tiempo parcial, así como las variaciones entre los países en cuanto al tipo de instituciones educativas que se consideran de tercer nivel.
Gasto público en educación. Se ha tomado como indicador el porcentaje del producto interno bruto, en moneda nacional y a precios corrientes de mercado, destinado a educación.
La UNESCO considera el agregado regional “América Latina y el Caribe”, que comprende 41 países y territorios: Anguila, Antigua y Barbuda, antiguas Antillas Neerlandesas, Argentina, Aruba, Bahamas, Barbados, Belice, Bermuda, Bolivia (Estado Plurinacional de), Brasil, Chile, Colombia, Costa Rica, Cuba, Dominica, Ecuador, El Salvador, Granada, Guatemala, Guyana, Haití, Honduras, Islas Caimán, Islas Turcas y Caicos, Islas Vírgenes Británicas, Jamaica, México, Monserrat, Nicaragua, Panamá, Paraguay, Perú, República Dominicana, Saint Kitts y Nevis, Santa Lucía, San Vicente y las Granadinas, Suriname, Trinidad y Tabago, Uruguay y Venezuela (República Bolivariana de).
Tanto la población urbana analfabeta por sexo y grupos de edad como la asistencia escolar en áreas urbanas, por quintiles de ingreso per cápita del hogar según sexo y grupos de edad provienen de tabulaciones especiales de las encuestas de hogares. Como se sabe, esto impone ciertas restricciones debido a que no todos los países realizan encuestas periódicamente y en algunos casos la cobertura geográfica se limita a las áreas urbanas. El quintil de ingreso corresponde al ingreso de los hogares ordenados por quintil de ingreso per cápita. El quintil 1 corresponde a los hogares más pobres y el quintil 5 a los hogares más ricos.
Los cuadros 1.3.10 a 1.3.14 no se incluyen en la versión impresa; sin embargo, pueden encontrarse en el CDROM y en la versión publicada en Internet.
should take into account the possible effect of differences in the proportion of part-time students and of variations among countries as to what types of institutions are considered to provide third-level education.
Public expenditure on education. The indicator used is the percentage of the gross domestic product, expressed in local currency at current market prices, allocated to education.
UNESCO takes into account the regional aggregate for Latin America and the Caribbean, which comprises 41 countries and territories: Anguilla, Antigua and Barbuda, Argentina, Aruba, Bahamas, Barbados, Belize, Bermuda, Bolivarian Republic of Venezuela, Brazil, British Virgin Islands, Cayman Islands, Chile, Colombia, Costa Rica, Cuba, Dominica, Dominican Republic, Ecuador, El Salvador, Grenada, Guatemala, Guyana, Haiti, Honduras, Jamaica, Mexico, Montserrat, Netherlands Antilles, Nicaragua, Panama, Paraguay, Peru, Plurinational State of Bolivia, Saint Kitts and Nevis, Saint Lucia, Saint Vincent and the Grenadines, Suriname, Trinidad and Tobago, Turks and Caicos Islands and Uruguay.
Illiteracy in the urban population, by sex and age group, as well as school attendance in urban areas, by per capita household income quintile and by sex and age group, are based on special tabulations of data from household surveys. As is known, this imposes certain constraints owing to the fact that not all countries conduct periodic censuses and, in some cases, geographic coverage is limited to urban areas. The income quintile corresponds to household income according to per capital income quintile. Quintile 1 corresponds to the poorest households and quintile 5 to the wealthiest households.
Tables 1.3.10 to 1.3.14 are not included in the printed version, but they are available on CD-ROM as well as in the version published online.
1.4 Health
The health indicators presented in table 1 of this chapter come from four international sources. the United Nations Children’s Fund (UNICEF), the World Health Organization (WHO), the United Nations Population Fund (UNFPA) and the Food and Agriculture Organization of the United Nations (FAO). The selected indicators are as follows:
Maternal mortality. An indicator calculated by UNICEF, maternal mortality is defined as the number of women who die per year from pregnancy- or childbirth-related causes, per 100,000 live births.

CEPAL, Anuario Estadístico de América Latina y el Caribe, 2012 139
Births attended by specialized personnel. The number of births attended by doctors, nurses, midwives, personnel trained to administer primary healthcare or trained traditional midwives as a percentage of the total number of births, as estimated by indirect means.
Child mortality (under 5 years of age). This indicator is calculated by the Inter-agency Group for Child Mortality Estimation (IGME), comprising the United Nations Children’s Fund (UNICEF), the World Health Organization (WHO), the World Bank and the Population Division of the United Nations. It estimates the probability of death occurring before five years of age on the basis of data drawn from vital statistics, population censuses and sampling surveys. The shortcomings of the estimation methods used by each such source are taken into account, as are the values in use at the national and international levels. The preparation of estimates that will be comparable across countries posed difficulties in this case, owing to the varying characteristics of the sources used and differences in the methodologies and measurement criteria applied.
Child malnutrition by weight. This indicator, calculated by UNICEF and WHO, corresponds to the percentage of underweight (measured by weight-for-age: less than -2 standard deviations of the WHO child growth standards median) among children aged 0-5 years.
Child malnutrition by height. This indicator, calculated by UNICEF and WHO, corresponds to the percentage of stunting (measured by height-for-age: less than -2 standard deviations of WHO child growth standards median) among children aged 0-5 years.
Proportion of one-year-old children immunized against measles. This indicator, calculated by UNICEF and WHO, is used in monitoring target 4A of the Millennium Development Goals, which relates to reducing the under-five mortality rate.
Proportion of the population below the minimum level of dietary energy consumption. Data on undernourished persons, that is, those whose food consumption remains permanently below the minimum dietary energy requirement for living a healthy life and engaging in light physical activity, come from FAO.
Dietary energy supply. Estimates by FAO indicating the dietary energy supply in kilocalories per person per day.
This chapter also contains tables on the following indicators:
Infant mortality. Corresponds to the estimates and projections prepared by the Latin American and Caribbean Demographic Centre (CELADE) - Population Division of ECLAC and the United Nations Population Division. The infant mortality rates used are based on the infant mortality rates from the life tables implicit in the population estimates and projections prepared by the same international organizations. Infant mortality is defined as the probability of
Partos atendidos por personal calificado. Es la relación porcentual entre los partos atendidos por médicos, enfermeras, matronas y agentes calificados de atención primaria de salud o matronas tradicionales capacitadas, y el total de nacimientos estimados por métodos indirectos.
Mortalidad de niños menores de 5 años. Este indicador lo calcula el Grupo Interinstitucional para la Estimación de la Mortalidad Infantil (IGME) conformado por el UNICEF, la OMS, el Banco Mundial y la División de Población de las Naciones Unidas. Corresponde a estimaciones de la probabilidad de muerte antes de los 5 años basadas en datos provenientes de estadísticas vitales, censos de población y encuestas por muestreo. En este caso, se toman en cuenta las deficiencias de los métodos empleados en cada fuente y los valores adoptados a nivel nacional e internacional. Las estimaciones comparables entre países presentaron dificultades, debido a las características de las fuentes y a las diferencias de metodología y criterios de medición.
Malnutrición infantil medida por el peso. Este indicador, calculado por el UNICEF y la OMS, corresponde al porcentaje de desnutrición global (niños menores de 5 años cuyo peso para la edad es inferior a dos desviaciones estándar de la mediana del patrón de crecimiento infantil de la OMS.
Malnutrición infantil medida por la estatura. Este indicador, calculado por el UNICEF y la OMS, corresponde al porcentaje de desnutrición crónica (niños menores de 5 años cuya estatura para la edad es inferior a dos desviaciones estándar de la mediana del patrón de crecimiento infantil de la OMS).
Porcentaje de niños de 1 año vacunados contra el sarampión. Indicador calculado por el UNICEF y la OMS que se utiliza para el monitoreo de la meta 4A de los Objetivos de Desarrollo del Milenio, relativa a la reducción de la mortalidad en la niñez
Porcentaje de población por debajo del nivel mínimo de consumo de energía alimentaria. Los datos sobre personas subalimentadas, cuyo consumo de energía alimentaria es permanentemente inferior a las necesidades mínimas de energía alimentaria para llevar una vida sana y realizar una actividad física liviana, provienen de la FAO.
Disponibilidad de energía alimentaria. Corresponde a las estimaciones de la FAO que indican el suministro de energía alimentaria en kilocalorías por día por persona.
En este capítulo se presentan, además, cuadros sobre los siguientes indicadores:
Mortalidad infantil. Corresponde a las estimaciones y proyecciones que realiza, por una parte, el CELADE-División de Población de la CEPAL y la División de Población de las Naciones Unidas. Se adoptan las tasas de mortalidad infantil de las tablas de mortalidad implícitas en las estimaciones y proyecciones de población elaboradas por las mismas organizaciones internacionales. Se define como la probabilidad que tiene un nacido vivo de morir antes de cumplir 1 año de vida. En

140 ECLAC, Statistical Yearbook for Latin America and the Caribbean, 2012
la práctica, se define como el cociente entre las defunciones de menores de 1 año ocurridas en un lapso de tiempo y los nacimientos ocurridos en el mismo lapso, expresado por 1.000 nacidos vivos. Generalmente, las cifras se extraen de las estadísticas de registros vitales, aunque debe tenerse en cuenta el subregistro de los nacimientos y las defunciones, así como su falta de precisión.
La cobertura geográfica para este indicador es la misma utilizada en el capítulo de población para los agregados de América Latina (20 países); América Latina y el Caribe (46 países y territorios), y el Caribe (24 países y territorios).
Un aporte importante es la información proporcionada por las oficinas nacionales de estadística de los países, en relación con los siguientes indicadores:
Médicos. Con respecto a la información sobre el número de médicos, es necesario tener presente que no existen métodos de recopilación uniformes entre los países ni dentro de un mismo país a lo largo del tiempo. En algunos países, la información solo se refiere a los médicos que trabajan para los ministerios de salud o en instituciones hospitalarias. En otros, en cambio, las cifras se obtienen de informes de los establecimientos hospitalarios. Debido a que estos profesionales trabajan jornadas parciales en diferentes centros asistenciales, es posible que se los incluya más de una vez en la estadística final. Por ello, la comparación de los valores de este indicador entre países y entre distintos momentos en un mismo país, debe hacerse con cautela, y debe complementarse y controlarse sobre la base del comportamiento de otros indicadores del acceso potencial de la población a los servicios de salud.
Número de habitantes por médico. Este indicador es calculado por la División de Estadísticas de la CEPAL a partir de la información sobre médicos recopilada por las oficinas nacionales de estadística de los países y la población estimada por el CELADE-División de Población de la CEPAL y la División de Población de las Naciones Unidas.
Camas de hospital. Se entiende por cama de hospital aquella instalada en una institución hospitalaria en la que hay personal y equipos necesarios para que el paciente hospitalizado pueda utilizarla durante las 24 horas del día. La calidad de esta información depende de la estructura del sistema de prestación de servicios de salud. Cuando un organismo o ministerio tiene el control sobre la mayoría de los hospitales, suele ser más fácil obtener datos completos y comparables; no es así cuando varias instituciones, públicas o privadas, comparten esta responsabilidad.
Camas de hospital por cada 1.000 habitantes. Indicador calculado por la División de Estadísticas de la CEPAL a partir de la información sobre camas recopilada por las oficinas nacionales de estadística de los países y la población estimada por el CELADEDivisión de Población de la CEPAL y la División de Población de las Naciones Unidas.
a live-born dying before reaching the age of one. In practice, it is defined as the ratio of deaths of infants under one year of age, occurring within a given period, to the number of births occurring in the same period, expressed per 1,000 live births. In general, the figures are taken from vital statistics records, which frequently under-record both births and deaths or fail to record them with the same accuracy.
The geographic coverage of this indicator is the same as the coverage used in the chapter on population for the aggregates for Latin America (20 countries), Latin America and the Caribbean (46 countries and territories) and the Caribbean (24 countries and territories).
The information provided by the national statistical offices of the countries relative to the following indicators is a significant contribution:
Doctors. With regard to the information on the number of doctors, it should be noted that compilation methods are not uniform either from one country to another or within a single country over time. In some countries, the information covers only those doctors who work for the ministry of health or in hospitals. In others, the figures are obtained from reports issued by hospitals, and since doctors often work part-time in various medical centres, they may be counted more than once in the final statistics. For these reasons, caution must be exercised in comparing the values shown for this indicator, both between countries and at different times within the same country. Such comparisons should be supplemented by and checked against trends in other indicators of the population’s potential access to health services.
Number of inhabitants per doctor. This indicator is calculated by the Statistics Division of ECLAC on the basis of information on doctors compiled by the national statistical offices of the countries and the population estimated by the Latin American and Caribbean Demographic Centre (CELADE) - Population Division of ECLAC and the United Nations Population Division.
Hospital beds. The term “hospital bed” is understood to mean a bed in an institution providing hospital care and having the staff and equipment needed to care for hospitalized patients 24 hours a day. The quality of this information depends on the structure of the health service system. When a particular body or ministry has authority over most of the hospitals, it is usually easier to obtain complete and comparable data than when this responsibility is shared by many institutions, whether public or private.
Hospital beds per 1,000 inhabitants. This indicator is calculated by the Statistics Division of ECLAC on the basis of information on doctors compiled at the national statistical offices of the countries and the population estimated by the Latin American and Caribbean Demographic Centre (CELADE) – Population Division of ECLAC and the United Nations Population Division.

CEPAL, Anuario Estadístico de América Latina y el Caribe, 2012 141
Total expenditure on health. Generally speaking, the figures represent total expenditure on health as a percentage of gross domestic product. The data are national figures compiled by WHO.
Tables 1.4.6 and 1.4.7 are not included in the printed version, but they are available on CD-ROM as well as in the version published online.
1.5 Housing and basic services
This section includes statistics and indicators on the characteristics of the housing of the Latin American and Caribbean population and on the basic services available to them. The data on water and sanitation calculated by the Statistics Division of ECLAC (on the basis of information from the household surveys) are not comparable with those provided by CELADE (on the basis of information from the national censuses) and by the WHO/UNICEF Joint Monitoring Programme (JMP) for Water Supply and Sanitation (on the basis of demographic and health surveys, world health surveys, multiple indicator cluster surveys and assessment questionnaires and other sources). With the data on water and sanitation, an attempt has been made to unify definitions and reduce the differences among the measurement methods used by the countries; by contrast, WHO/UNICEF data are used for worldwide monitoring of target 7C of the Millennium Development Goals, which relates to reducing the proportion of people without sustainable access to safe drinking water and basic sanitation services.
Services available in dwellings, urban and rural areas. These data are calculated by the Statistics Division of ECLAC on the basis of information from household surveys conducted in the countries. This corresponds to the percentage of homes with access to three basis services:
(i) Drinking water or piped water: water supplied through the general distribution network with a hook-up either inside or outside of the dwelling, but within the property. The problems of establishing an operative definition are much more complex in the rural sector, and this affects the reliability of the data for that sector.
(ii) Sewage disposal systems: Includes sewerage systems. An estimate is also included of the population residing in urban areas where there are networks of public facilities for the disposal of human waste and other sewage.
(iii) Public lighting: Dwellings that have electric lighting and access to public lighting.
Gasto total en salud. En general, las cifras representan el gasto total en salud expresado como porcentaje del producto interno bruto. Corresponde a cifras nacionales recopiladas por la OMS.
Los cuadros 1.4.6 y 1.4.7 no se presentan en la versión impresa; sin embargo, pueden encontrarse en el CDROM, así como en la versión publicada en Internet.
�1.5 Vivienda y servicios básicos
En esta sección se incluyen estadísticas e indicadores sobre las características de las viviendas de la población que reside en los países de América Latina y el Caribe, y de los servicios básicos a su disposición. Los datos sobre agua y saneamiento calculados por la División de Estadísticas de la CEPAL (sobre la base de información proveniente de encuestas de hogares), por el CELADE-División de Población de la CEPAL (sobre la base de información proveniente de los censos nacionales) y por el Programa Conjunto de Monitoreo del Abastecimiento de Agua y del Saneamiento del UNICEF y la OMS (sobre la base de encuestas de demografía y salud, encuestas mundiales de salud, encuestas sobre la base de indicadores múltiples y cuestionarios de evaluación, y otras fuentes) no son comparables entre sí. Mientras los primeros intentan unificar las definiciones entre los países disminuyendo las diferencias, el último realiza un proceso de estimación internacional con el fin de monitorear la meta 7C de los Objetivos de Desarrollo del Milenio, relativa a la reducción del porcentaje de personas que carecen de acceso al agua potable y a servicios básicos de saneamiento.
Disponibilidad de servicios en las viviendas, en áreas urbanas y rurales. Estos datos son calculados por la División de Estadísticas de la CEPAL sobre la base de información proveniente de encuestas de hogares de los países. Corresponde al porcentaje de hogares con acceso a tres servicios básicos:i) Agua potable o agua por cañería: agua suministrada por
la red general de distribución con conexión por cañería por dentro o por fuera de la vivienda, pero dentro de la propiedad. Los problemas de definición operativa son mucho más complejos en el sector rural, lo que afecta la confiabilidad de los datos de ese sector.
ii) Sistema de eliminación de excretas: comprende el sistema de alcantarillado; también se incluye una estimación de la población que reside en las áreas urbanas, donde existen redes públicas de instalaciones de excretas y aguas servidas.
iii) Alumbrado eléctrico: viviendas que cuentan con instalación de luz eléctrica y tienen acceso a alumbrado público.

142 ECLAC, Statistical Yearbook for Latin America and the Caribbean, 2012
Unidades de viviendas según tipo de tenencia, en áreas urbanas y rurales. Información procesada de censos nacionales recopilados por el CELADE-División de Población de la CEPAL.
Unidad de vivienda. El término designa el local de habitación o vivienda destinado a alojar un hogar particular, aunque en el momento de recoger los datos pueda haber estado ocupado por más de un hogar particular. También se incluyen locales que, aun cuando no hayan sido originalmente concebidos para alojar hogares particulares, de hecho lo hacen.
Tipo de tenencia. Se refiere al tipo de convenio según el cual un hogar ocupa una vivienda, ya sea en propiedad, arriendo o de acuerdo con algún otro sistema.
Población que utiliza fuentes mejoradas de abastecimiento de agua potable e infraestructuras de saneamiento mejoradas, en áreas urbanas y rurales. Estimaciones calculadas por el Programa Conjunto de Monitoreo del Abastecimiento de Agua y del Saneamiento. Incorpora una definición internacional estandarizada del acceso a ambos servicios en la población.
El agregado regional América Latina y el Caribe comprende 46 países y territorios: Anguila, Antigua y Barbuda, antiguas Antillas Neerlandesas, Argentina, Aruba, Bahamas, Barbados, Belice, Bolivia (Estado Plurinacional de), Brasil, Chile, Colombia, Costa Rica, Cuba, Dominica, Ecuador, El Salvador, Granada, Guadalupe, Guatemala, Guyana, Guayana Francesa, Haití, Honduras, Islas Vírgenes Británicas, Islas Caimán, Islas Malvinas (Falkland Islands), Islas Turcas y Caicos, Islas Vírgenes de los Estados Unidos, Jamaica, Martinica, México, Montserrat, Nicaragua, Panamá, Paraguay, Perú, Puerto Rico, República Dominicana, Saint Kitts y Nevis, Santa Lucía, San Vicente y las Granadinas, Suriname, Trinidad y Tabago, Uruguay y Venezuela (República Bolivariana de).
El cuadro 1.5.2, elaborado sobre la base de datos provenientes de censos nacionales recopilados por el CELADE-División de Población de la CEPAL, no figura en la versión impresa; sin embargo, puede encontrarse en el CDROM, así como en la versión publicada en Internet.
Housing units, by type of tenancy, urban and rural areas. Information processed in national censuses and collected by CELADE.
Dwelling unit. This term refers to dwellings or living quarters intended to house one private household, even though at the time when the data were collected it may have been occupied by more than one private household. Also included are premises which, although not originally intended as private dwelling units, are in fact occupied as such.
Type of housing tenure. Refers to the type of agreement under which a household occupies a dwelling, be it ownership, tenancy or some other system.
Population using improved drinking-water sources and improved sanitation infrastructure in urban and rural areas. These estimates are calculated by the Joint Monitoring Programme on Water Supply and Sanitation. It incorporates a standardized international definition of the population’s access to both services.
The regional aggregate for Latin America and the Caribbean includes 46 countries and territories: Anguilla, Antigua and Barbuda, Argentina, Aruba, Bahamas, Barbados, Belize, Bolivarian Republic of Venezuela, Brazil, British Virgin Islands, Cayman Islands, Chile, Colombia, Costa Rica, Cuba, Dominica, Dominican Republic, Ecuador, El Salvador, Falkland Islands (Malvinas), French Guiana, Grenada, Guadeloupe, Guatemala, Guyana, Haiti, Honduras, Jamaica, Martinique, Mexico, Montserrat, Netherlands Antilles, Nicaragua, Panama, Paraguay, Peru, Plurinational State of Bolivia, Puerto Rico, Saint Kitts and Nevis, Saint Lucia, Saint Vincent and the Grenadines, Suriname, Trinidad and Tobago, Turks and Caicos Islands, United States Virgin Islands and Uruguay.
Table 1.5.2, prepared using the database with information from national censuses compiled by CELADE, is not included in the printed version but are available on CD-ROM as well as in the version published online.

CEPAL, Anuario Estadístico de América Latina y el Caribe, 2012 143
1.6 Poverty and income distribution
The poverty, indigence and income distribution indices contained in this publication were calculated by the Statistics Division of ECLAC on the basis of information obtained from household surveys. This imposes certain constraints owing to the fact that not all countries conduct periodic censuses and, in some cases, geographic coverage is limited to urban areas.
The estimates of extreme poverty were prepared by ECLAC using the income method, which is based on the calculation of poverty and indigence lines. These lines represent the level of income required by a household in order to meet the basic needs of all its members. The basket for measuring poverty is constructed on the basis of a basket of staple foods —taking into account eating habits and the actual availability and prices of food in each country and geographical area— which meets the nutritional requirements of the population. In most cases, data concerning the structure of household consumption, of both food and other goods and services, are from national household-budget surveys conducted by the countries in the 1980s.
To the value of this basket was then added the sum required by households to meet their basic non-food needs, to calculate the total value of the poverty line. This was done by multiplying the value of the indigence line by a factor that varies between rural to urban areas. The poverty estimates up to 2006 use a factor of 2.0 for urban areas and 1.75 for rural areas. For estimates from 2007 onwards, the factor is variable and depends on the respective trends in prices for foods and for other goods and services.
The values of the indigence and poverty lines are updated each year using cumulative variations in the consumer price index (CPI). Until December 2006, the same variation was applied to both lines. Since 2007, however, the indigence line has been adjusted to reflect changes in the foodstuffs component of the CPI, whereas the part of the poverty line that corresponds to non-food spending is adjusted to reflect changes in that component of the CPI.
The percentages of households and persons classified as poor and as indigent were obtained by comparing the value of the two budgets against the total per capita income of each household. These indices are therefore influenced not only by the extent of poverty in each area,
�1.6 Pobreza y distribución
del ingresoLos índices de pobreza, indigencia y distribución del ingreso que figuran en esta publicación fueron elaborados por la División de Estadísticas de la CEPAL sobre la base de información proporcionada por las encuestas de hogares. Esto impone ciertas restricciones debido a que no todos los países realizan encuestas periódicamente y, en algunos casos, la cobertura geográfica se limita a las áreas urbanas.
Las estimaciones sobre pobreza absoluta fueron realizadas por la CEPAL mediante el método del ingreso, que se basa en el cálculo de las líneas de pobreza e indigencia. Estas representan el nivel de ingreso que permite a cada hogar satisfacer las necesidades básicas de todos sus miembros. La canasta básica para la medición de la pobreza se construye sobre la base de una canasta básica de alimentos, que abarca los bienes que se precisarían para cubrir las necesidades nutricionales de la población, tomando en consideración los hábitos de consumo, la disponibilidad efectiva de alimentos y sus precios, correspondientes a cada país y zona geográfica. En la mayoría de los casos, la información sobre la estructura del consumo de los hogares, tanto de alimentos como de otros bienes y servicios, proviene de las encuestas de presupuestos familiares llevadas a cabo en los países durante la década de 1980.
A este valor, la “línea de indigencia”, se agrega el monto requerido por los hogares para satisfacer las necesidades básicas no alimentarias, a fin de calcular el valor total de la línea de pobreza. Para ello, se multiplica la línea de indigencia por un factor, que toma valores distintos entre áreas urbanas y rurales. En las estimaciones de pobreza hasta 2006, se utiliza un factor de 2 para las zonas urbanas y de 1,75 para las rurales. En las estimaciones efectuadas a partir de 2007, dicho factor es variable y depende de la diferencia entre la evolución de los precios de los alimentos y del resto de bienes y servicios.
El valor de las líneas de indigencia y pobreza se actualiza cada año de acuerdo con la variación acumulada del índice de precios al consumidor (IPC). En las estimaciones hasta diciembre de 2006 se aplica la misma variación a ambas líneas. A partir de 2007, la línea de indigencia se actualiza mediante la variación del IPC de los alimentos, mientras que la parte de la línea de pobreza que corresponde al gasto en bienes no alimentarios se actualiza mediante la variación del IPC correspondiente.
Los porcentajes de hogares y de población pobre e indigente se obtuvieron contrastando el valor de ambos presupuestos con el ingreso total per cápita de cada hogar. Los índices nacionales de pobreza e indigencia se calcularon como promedios ponderados de los respectivos índices de

144 ECLAC, Statistical Yearbook for Latin America and the Caribbean, 2012
but also by its incidence in terms of the total national population.
Poor and indigent population, urban and rural areas. Poverty: the percentage of the population whose income is below the cost of two basic food baskets. Includes people living in situations of indigence. Indigence: the percentage of the population whose income is the cost of a basket of staple foods.
Poverty and indigence gap. This indicator measures the relative income deficit of poor (or indigent) groups in relation to the poverty (or indigence) line. The poverty gap is considered more complete than the headcount index because it takes into account not only the proportion of poor people but also how far they are below the poverty line; in other words, it adds information on the degree of poverty.
Distribution of national income, urban and rural areas. This is an estimate of the share of total national income received by each 20% (quintile) of the population, from the poorest to the wealthiest, on the basis of the average per capita income of the households to which they belong. Quintile 1 corresponds to the poorest segment of the population and quintile 5 to the wealthiest segment.
Gini coefficient. The Gini coefficient is used to measure income distribution. Its values range from 0 to 1, where 0 is equal to absolute equity and 1 to absolute inequity.
cada área geográfica, razón por la cual en ellos influyen tanto la incidencia de la pobreza en cada área como su importancia relativa en la población total de cada país.
Personas en situación de pobreza e indigencia en áreas urbanas y rurales. Pobreza: corresponde al porcentaje de personas cuyo ingreso es inferior al doble de una canasta básica de alimentos. Incluye a las personas en situación de indigencia. Indigencia: corresponde al porcentaje de personas cuyo ingreso es inferior al costo de una canasta básica de alimentos.
Coeficiente de la brecha de pobreza e indigencia. Este indicador mide el déficit relativo de los ingresos de los pobres (o indigentes) con respecto al valor de la línea de pobreza (o indigencia). El coeficiente de la brecha de pobreza se considera más completo que el índice de recuento porque no solo toma en cuenta la proporción de personas pobres sino también la diferencia entre sus ingresos y la línea de pobreza; es decir, añade información acerca de la profundidad de la pobreza.
Distribución del ingreso de las personas, en áreas urbanas y rurales. Es la estimación de la proporción del ingreso nacional total recibido por cada 20% (quintil) de las personas, ordenadas desde las más pobres hasta las más ricas, sobre la base de los ingresos per cápita medios de los hogares de pertenencia. El quintil 1 corresponde a la parte de la población más pobre y el quintil 5 a la parte de la población más rica.
Índice de Gini. Se utiliza para medir la distribución del ingreso. Es un índice que toma valores en el rango [0,1], donde el valor 0 corresponde a la equidad absoluta y el valor 1 a la inequidad absoluta.
�1.7 GéneroEn esta sección del Anuario se presentan dos indicadores oficiales para el monitoreo del tercer Objetivo de Desarrollo del Milenio, “promover la igualdad de género y el empoderamiento de la mujer”, así como un indicador sobre la desigualdad salarial entre hombres y mujeres. Las fuentes principales de información son las encuestas de hogares de la División de Estadísticas de la CEPAL y otros organismos internacionales.
Relación de salarios entre los sexos, según años de estudios aprobados. Proporción del salario medio de las mujeres asalariadas urbanas, de 20 a 49 años de edad, que trabajan 35 horas y más por semana, respecto del salario de los hombres de iguales características. El indicador es calculado por la División de Estadísticas de la CEPAL.
1.7 GenderThis section of the Yearbook presents two official indicators used for monitoring the third Millennium Development Goal, “promote gender equality and empower women”, and an indicator on wage inequality between men and women The main sources of information are the household surveys of the Statistics Division of ECLAC and other international agencies.
Inter-gender wage ratio, by years of education completed. Refers to the ratio of the average pay rate of urban women wage earners between 20 and 49 years of age who work 35 hours or more per week to the pay rate of men with the same characteristics. This indicator is calculated by the Statistics Division of ECLAC.
CEPAL, Anuario Estadístico de América Latina y el Caribe, 2012 145
Proporción de mujeres entre los empleados asalariados en el sector no agrícola. Estos datos son recopilados por la OIT, sobre la base de datos aportados por los países. La División de Estadística de las Naciones Unidas compila las series internacionales y los agregados regionales y globales en el sitio web de los indicadores de los Objetivos de Desarrollo del Milenio.
Proporción de puestos ocupados por mujeres en el parlamento nacional. Los parlamentos nacionales proporcionan sus datos a la Unión Interparlamentaria (UIP). La División de Estadística de las Naciones Unidas, en el sitio web de los indicadores de los Objetivos de Desarrollo del Milenio, compila las series internacionales y los agregados regionales y globales. Para realizar comparaciones internacionales la UIP utiliza generalmente solo la cámara baja o única.
Índice de feminidad de la pobreza y la indigencia. El índice corresponde al cociente (multiplicado por 100) entre las tasas de pobreza de las mujeres y las de los hombres, en el grupo etario de 20 a 59 años.
Este índice refleja las disparidades en la incidencia de la pobreza y la indigencia entre mujeres y hombres. Un valor superior a 1 indica que la pobreza o indigencia afecta en mayor grado a las mujeres que a los hombres; un valor inferior a 1 indica la situación contraria. El indicador es calculado por la División de Estadísticas de la CEPAL.
Share of women in wage employment in the non- agricultural sector. This information is collected by the International Labour Organization (ILO) on the basis of data reported by the countries. The Millennium Development Goals website of the United Nations Statistics Division compiles international series and regional and global aggregates.
Proportion of seats held by women in national Parliament. National parliaments pass on this information to the Inter- Parliamentary Union (IPU) at least once a year, and particularly when there has been a significant change. In its turn, the Millennium Development Goals website of the United Nations Statistics Division regularly compiles international series and regional and global aggregates. IPU usually employs data relating to the lower or single chamber for the purposes of international comparison.
Femininity index of poverty and indigence. This index is the ratio between the poverty rates for women and men, multiplied by 100, in the 20-59 age group.
It reflects the disparities in poverty and indigence rates between men and women. A value higher than one indicates that poverty and indigence are more prevalent among women than among men, while the opposite is true of a value below one. This indicator is calculated by the Statistics Division of ECLAC.


CEPAL, Anuario Estadístico de América Latina y el Caribe, 2012 147
2. Estadísticas económicas
�En el capítulo sobre estadísticas económicas se presentan fundamentalmente los instrumentos estadísticos de síntesis que describen la evolución del sector real y del sector externo, es decir, las cuentas nacionales y la balanza de pagos, así como también algunas estadísticas básicas sectoriales y otras relativas a los precios internos.
La sección de cuentas nacionales se subdivide en dos partes: en la primera figuran las series de agregados macroeconómicos regionales que tienen como referencia el año 2005; en la segunda, se presentan —únicamente en medios electrónicos— las series de cuentas nacionales de América Latina y el Caribe, por país, expresadas en moneda nacional.
La sección de estadísticas sobre el sector externo contiene información de la balanza de pagos y del comercio exterior de bienes y servicios, así como también de los principales indicadores derivados. Asimismo, se incluye información sobre el financiamiento y el endeudamiento externo de los países de la región.
En la tercera sección se presentan los indicadores de evolución de los precios internos y en la cuarta se reportan las estadísticas sectoriales relacionadas principalmente con la agricultura, la minería y la industria manufacturera, que en esta versión no registra variaciones respecto del Anuario estadístico 2010 en términos de actualización.
En esta versión la información contenida en la sección Precios (2.3) corresponde a una cobertura más amplia de países; de esa manera, en términos de la cobertura regional que se presenta en el Anuario, tanto las estadísticas de cuentas nacionales como las de precios y las del sector externo se presentan de acuerdo a los siguientes grupos de países:
2. Economic statistics
Basically, the chapter on economic statistics deals with synthetic statistical instruments which describe developments in the real sector and the external sector, that is, national accounts and the balance of payments, as well as basic sectoral statistics and domestic price data.
The section on national accounts is divided into two parts: the first sets out the series of regional macroeconomic aggregates, which use 2005 as the base year; the second —in electronic format only— presents the series of national accounts of Latin America and the Caribbean, by country, expressed in local currency.
The section on external sector statistics contains information on the balance of payments and the external trade in goods and services as well as the main derived indicators. It also contains information on the financing and external indebtedness of the countries of the region.
The third section presents indicators on domestic price movements and the fourth reports on sectoral statistics relating mainly to agriculture, mining and manufacturing, which have not been updated with respect to the Statistical Yearbook 2010.
In this version of the Yearbook the information contained in the Prices (2.3) section incorporates a broader range of countries; accordingly, in terms of the regional coverage, the statistics for both the national accounts and prices and the external sector are given by groups of countries as follows:

148 ECLAC, Statistical Yearbook for Latin America and the Caribbean, 2012
América Latina: ArgentinaBolivia (Estado Plurinacional de)BrasilChileColombiaCosta RicaCubaEcuadorEl SalvadorGuatemalaHaitíHondurasMéxicoNicaraguaPanamáParaguayPerúRepública DominicanaUruguayVenezuela (República Bolivariana de)
El Caribe:Antigua y BarbudaBahamasBarbadosBeliceDominicaGranadaGuyanaJamaicaSaint Kitts y NevisSan Vicente y las GranadinasSanta LucíaSurinameTrinidad y Tabago
América Latina y el Caribe:Constituye la suma de las dos agrupaciones anteriores.
Cuando la cobertura geográfica no coincide con la indicada, se especifica en una nota al pie de cuadro.
�2.1 Cuentas nacionales
En 1993, el Consejo Económico y Social de las Naciones Unidas recomendó utilizar el Sistema de Cuentas Nacionales de 1993 (SCN 1993) en la elaboración de las estimaciones oficiales de cuentas nacionales1. Los progresos con respecto a ese objetivo son significativos, sin embargo, a la fecha no todos los países de la región han incorporado estas recomendaciones metodológicas en el proceso de cálculo de las variables y agregados de cuentas nacionales (véase el cuadro 1).
1 Resolución 1993/5 de 12 de julio de 1993.
Latin America: ArgentinaBolivia (Plurinational State of)BrazilChile Colombia Costa Rica Cuba EcuadorEl Salvador Guatemala Haiti Honduras Mexico Nicaragua Panama Paraguay PeruDominican RepublicUruguayVenezuela (Bolivarian Republic of)
The Caribbean:Antigua and BarbudaBahamas Barbados Belize Dominica Grenada Guyana JamaicaSaint Kitts and NevisSaint Vincent and the GrenadinesSaint LuciaSurinameTrinidad and Tobago
Latin America and the Caribbean:The sum of the above two groupings.
Where geographical coverage does not coincide with these groupings, it is specified in the footnotes of the respective table.
2.1 National accounts
In 1993, the United Nations Economic and Social Council recommended the use of the System of National Accounts 1993 (1993 SNA) when preparing official national accounts estimates.1 Although significant progress has been made towards fulfilment of this objective, not all countries in the region have yet incorporated these methodological recommendations into their calculations of national account variables and aggregates (see table 1).
1 Resolution 1993/5, 12 July 1993.
CEPAL, Anuario Estadístico de América Latina y el Caribe, 2012 149
La adopción por parte de los países del SCN 1993 implica que los conceptos y clasificaciones que figuran en los cuadros sobre cuentas nacionales corresponden, por lo general, a dichas recomendaciones2. En línea con esa metodología, se puede advertir que gran parte de los países ha incorporado la tercera revisión de la Clasificación Industrial Internacional Uniforme de todas las actividades económicas (CIIU, Rev. 3)3. Cabe señalar además que algunos países, incluso han adoptado versiones más actualizadas como la CIIU, Rev 3.1 y la CIIU, Rev 4.
Para mantener el principio de comparabilidad internacional, y teniendo en cuenta que las cuentas nacionales tienen distintos grados de desarrollo y uniformidad en los países de la región, se han seleccionado las estimaciones de los agregados de uso más generalizado en los cálculos nacionales y que son importantes para el análisis económico. Asimismo, el detalle de las respectivas clasificaciones se ha simplificado para presentar los datos por países en la forma más homogénea posible, a fin de obtener las estimaciones correspondientes a América Latina y el Caribe y facilitar el uso e interpretación de los datos por parte de los usuarios.
La base de valoración de las distintas estimaciones se indica en los respectivos cuadros, señalándose si están expresadas a precios de mercado, a precios corrientes o a precios constantes. Cuando en un cuadro no consta la base de valoración, se entiende que las series de datos están medidas a precios de mercado.
Los valores a precios de mercado se diferencian de los valores a costo de factores por incluir los impuestos indirectos netos de subsidios. Los valores a precios corrientes indican que los flujos de bienes y servicios están valorados a los precios del año en que se realizaron las transacciones; los valores a precios constantes representan flujos de bienes y servicios valuados a los precios que tenían en el año considerado como base de referencia.
Corresponde aclarar que los componentes del gasto final están valorados a precios de comprador, en tanto que en las series los valores agregados sectoriales están medidos a precios de productor. Los valores de comprador se refieren al valor de los bienes y servicios en el punto de entrega al comprador, es decir, se agrega al valor de productor los márgenes de distribución y de transporte. Los valores de productor corresponden al valor de los bienes en el establecimiento de los productores y el valor agregado de cada actividad a precio de productor es igual al valor de la correspondiente producción bruta a precio de productor menos el valor a precio de comprador del respectivo consumo intermedio.
2 Naciones Unidas, Sistema de Cuentas Nacionales, 1993 (ST/ESA/STAT/ SER.F/2Rev.4), Nueva York, 1993. Publicación de las Naciones Unidas, Nº de venta: S.94.XVII.4.
3 Naciones Unidas, Clasificación Industrial Internacional Uniforme de todas las actividades económicas, revisión 3 [en línea] http://unstats.un.org/unsd/ cr/registry/regcst.asp?Cl=2&Lg=3.
The adoption by the countries of 1993 SNA implies that the headings and specifications used in the tables on national accounts correspond, in general, to those recommendations.2 In keeping with that methodology, most of the countries have incorporated the third revision of the International Standard Industrial Classification of All Economic Activities (ISIC, Rev. 3).3 Notably, some countries have even adopted newer versions, such as ISIC, Rev 3.1and ISIC, Rev 4.
In order to uphold the principle of international comparability, and bearing in mind that national accounts show varying degrees of development and uniformity in the countries of the region, the estimates selected for inclusion concern those aggregates most commonly used in the countries’ national calculations which are of importance as economic indicators. The respective classifications have also been simplified to permit data by country to be presented as homogeneously as possible in order to obtain estimates for Latin America and the Caribbean as a whole and facilitate the use and interpretation of the data by users.
The valuation basis of the different estimates is given in the respective tables, indicating whether they are expressed in market prices, in current prices or constant prices. When the valuation basis for a table is not shown, it is understood that the data series are measured at market prices.
The values at market prices differ from the values at factor cost in that they include net indirect taxes on subsidies. Values at current prices indicate that the flows of goods and services are valued at the prices for the year when the transactions were made; values in constant prices represent flows of goods and services which are valued at their prices in the year taken as the base year.
It should be noted that the components of final expenditure are valued at purchasers’ prices, while the series of the sectoral added values are measured at producers’ prices. Purchasers’ values refer to the value of the goods and services at the point of delivery to the purchaser, i.e., after the addition to the producers’ value of distribution and transport margins. Producers’ values correspond to the value of the goods at the production site, and the added value of each activity at producers’ prices is equal to the value of the corresponding gross output at producers’ prices less the value at purchasers’ prices of the respective intermediate consumption.
2 United Nations, System of National Accounts, 1993 (ST/ESA/STAT/SER.F/2/Rev.4), New York, 1993. United Nations publication, Sales No. E.94.XVII.4.
3 United Nations, International Standard Industrial Classification of All Economic Activities Rev. 3 [online] http://unstats.un.org/unsd/cr/registry/regcst.asp?Cl=2&Top=2&Lg=1.

150 ECLAC, Statistical Yearbook for Latin America and the Caribbean, 2012
Cuando se considera la economía en su conjunto, la parte de los impuestos sobre los productos menos las subvenciones se incluyen en las utilizaciones de bienes y servicios, pero no en el valor agregado de cada sector. Para mantener los equilibrios contables, a la suma del valor agregado de los sectores de la economía deben añadirse los impuestos sobre los productos menos las subvenciones para obtener un monto similar al de la agregación de sus componentes por el lado del gasto4. Cuando se trata del producto total de la economía y agregados similares, las expresiones “a precios de mercado” y “a valores de comprador” son equivalentes y se usan indistintamente.
Cuadro 1 AMÉRICA LATINA Y EL CARIBE: SISTEMA DE CUENTAS
NACIONALES, BASE MÁS RECIENTE
PaísSistema de cuentas nacionales
(SCN) utilizadoAntigua y Barbuda SCN-1968Argentina SCN-1993Bahamas SCN-1993Barbados SCN-1968Belice SCN-1993Bolivia (Estado Plurinacional de) SCN-1968Brasil SCN-1993Chile SCN-1993Colombia SCN-1993Costa Rica SCN-1993Cuba SCN-1993Dominica SCN-1993Ecuador SCN-1993El Salvador SCN-1968Granada SCN-1993Guatemala SCN-1993Guyana SCN-1968Haití SCN-1968Honduras SCN-1993Jamaica SCN-1993México SCN-1993Nicaragua SCN-1993Panamá SCN-1993Paraguay SCN-1993Perú SCN-1993República Dominicana SCN-1993Santa Lucía SCN-1993Saint Kitts y Nevis SCN-1993San Vicente y las Granadinas SCN-1968Suriname SCN-1993Trinidad y Tabago SCN-1993Uruguay SCN-1993Venezuela (República Bolivariana de) SCN-1993
Fuente: Comisión Económica para América Latina y el Caribe (CEPAL), sobre la base de información oficial de los países.
4 En el caso de los países que aplican el SCN, Rev. 3, se añaden a la suma de los valores agregados sectoriales los derechos de importación, incluido el impuesto al valor agregado neto en los países que lo presentan por separado, y se resta los Servicios de Intermediación Financiera Medidos Indirectamente (SIFMI) para calcular el producto interno bruto total. En el caso de los países que mantienen la anterior revisión del SCN, ambos conceptos están comprendidos en los valores agregados sectoriales.
For the economy as a whole, the portion of taxes on goods minus subsidies is included under the use of goods and services, but not included in the value added registered for each sector. In order to balance the books, the total taxes on goods minus subsidies should be added to the value added figures for all the sectors of the economy, thus giving a result similar to the sum obtained by adding together the components by type of expenditure.4 In reference to the total output of the economy and similar aggregates, the expressions “at market prices” and “at purchasers’ prices” are equivalent and are used interchangeably.
Table 1 LATIN AMERICA AND THE CARIBBEAN: SYSTEM OF NATIONAL
ACCOUNTS, MOST RECENT BASE YEAR
CountrySystem of national accounts
(SNA) employedAntigua and Barbuda SNA-1968Argentina SNA-1993Bahamas SNA-1993Barbados SNA-1968Belize SNA-1993Bolivia (Plurinational State of) SNA-1968Brazil SNA-1993Chile SNA-1993Colombia SNA-1993Costa Rica SNA-1993Cuba SNA-1993Dominica SNA-1993Ecuador SNA-1993El Salvador SNA-1968Grenada SNA-1968Guatemala SNA-1993Guyana SNA-1993Haiti SNA-1968Honduras SNA-1993Jamaica SNA-1993Mexico SNA-1993Nicaragua SNA-1993Panama SNA-1993Paraguay SNA-1993Peru SNA-1993Dominican Republic SNA-1993Saint Lucia SNA-1968Saint Kitts and Nevis SNA-1993Saint Vincent and the Grenadines SNA-1968Suriname SNA-1993Trinidad and Tobago SNA-1993Uruguay SNA-1993Venezuela (Bolivarian Republic of) SNA-1993
Source: Economic Commission for Latin America and the Caribbean (ECLAC), on the basis of official information from the countries.
4 For the countries that apply SNA, Rev. 3, import duties, including the net value added tax for those countries that present it separately, are added to the sum of the sectoral values added and the financial intermediation services indirectly measured (FISIM) are deducted to obtain the total gross domestic product. For countries using the previous revision of SNA, both items are included in the sectoral values added.
CEPAL, Anuario Estadístico de América Latina y el Caribe, 2012 151
�
Las series de agregados macroeconómicos regionales que se presentan en esta sección tienen como referencia el año 2005. El año de referencia de las cuentas regionales, de carácter estadístico y metodológico a la vez, responde a la necesidad de adaptar las cuentas nacionales a fin de describir de la mejor manera posible las modificaciones estructurales más recientes de la economía regional. Se reportan algunos cuadros con información histórica a partir de 19505.
Metodología
En el caso de América Latina y el Caribe cabe señalar que, en estricto rigor, la CEPAL no efectúa un cambio de base de las cuentas nacionales, sino una traslación de la referencia de las series regionales al año 2005.
La metodología adoptada para elaborar las cuentas nacionales de la región a precios constantes de 2005 consiste en retropolar y proyectar los valores de 2005 con los respectivos índices del producto real obtenidos de las series oficiales, aplicados al total y a cada una de las grandes divisiones de la CIIU. Esto produce una discrepancia que consta explícitamente en el cuadro correspondiente.
Una de las ventajas que presenta este esquema metodológico (recomendado por el SCN 1993) es que permite replicar las tasas de crecimiento históricas del PIB global calculadas por los países y, por ende, su inmediata identificación y correspondencia con los datos en monedas nacionales.
El procedimiento utilizado para calcular el equilibrio final de bienes y servicios a nivel regional fue similar. Una vez expresados en dólares al tipo de cambio vigente los valores correspondientes al año 2005 consignados en moneda nacional por los países, estos se retropolaron y proyectaron a partir de los respectivos índices del producto real derivados de las series oficiales, aplicados al total y a cada uno de los componentes del gasto. Al igual que en el caso anterior, se produce una discrepancia que se explicita en el cuadro correspondiente.
La información utilizada para la elaboración de los agregados macroeconómicos regionales es producida por cada uno de los países de América Latina y el Caribe y dada a conocer por la oficina nacional de estadística o el banco central correspondiente. Como se señaló, en América Latina y el Caribe hay países que aún no han adoptado las recomendaciones metodológicas del SCN 1993; otros, utilizan 5 Las series completas expresadas en dólares de 2000 desde 1950 están
disponibles en el Cuaderno Estadístico, N° 37 (LC/G.2415-P/E), Santiago de Chile. Publicación de las Naciones Unidas, N° de venta: S.09.II.G.72.
2.1.1 Cuentas nacionales de América Latina y el Caribe, en dólares
2.1.1 National accounts of Latin America and the Caribbean, in dollars
The series of regional macroeconomic aggregates covered in this section take 2005 as the base year. The reference year for the regional accounts, which is both statistical and methodological, arises from the need to adapt national accounts in order to describe the most recent structural adjustments in the regional economy as accurately as possible. Some tables are shown with historical data starting from 1950.5
Methodology
In the case of Latin America and the Caribbean, it should be noted that, strictly speaking, ECLAC has not changed the base for national accounts, but rather has transferred the reference of the regional series to the year 2005.
The methodology adopted for preparing the region’s national accounts at constant 2005 prices consists of back-extrapolating and projecting 2005 values with the respective real output indices obtained from the official series, applied to the total and to each of the broad ISIC divisions. This produces a discrepancy which is explicitly included in the corresponding table.
One of the advantages of this methodology (which is recommended by 1993 SNA) is that replicates the historical growth rates of overall GDP calculated by the countries, so that they are immediately identifiable and consistent with data in national currency.
A similar procedure was used to calculate the final balance of goods and services at the regional level. Once expressed in dollars at the current rate of exchange, the values corresponding to the year 2005 recorded by the countries in local currency were back-extrapolated and projected using the respective real output indices derived from the official series, applied to total expenditure and to each component of expenditure. As in the previous case, this produced a discrepancy which was explicitly included in the corresponding tables.
The information used for preparing regional macroeconomic aggregates is produced by each of the countries of Latin America and the Caribbean and published by the national statistical office or central bank. As indicated earlier, some Latin American and Caribbean countries have not yet adopted the methodological recommendations of 1993 SNA; others use a statistical base year far removed from the current
5 The full series starting 1950 expressed in dollars at constant 2000 prices are available in Cuaderno Estadístico, No. 37 (LC/G.2415-P/E), Santiago, Chile. United Nations publication, Sales No. S.09.II.G.72.

152 ECLAC, Statistical Yearbook for Latin America and the Caribbean, 2012
como año de referencia de sus cuentas una base estadística alejada de la estructura actual de su economía (ponderación y precios). Asimismo, algunos países que declaran haber adoptado las recomendaciones del SCN 1993 no disponen de una estimación completa de los cuadros básicos del sistema, como ocurre con el PIB por clase de actividad económica y el equilibrio entre la oferta y la demanda global de bienes y servicios, por lo que fue necesario efectuar algunas estimaciones, fundamentalmente para homogeneizar los niveles de desagregación y apertura sectorial o un determinado componente del gasto, como es el caso de la desagregación de la formación bruta de capital fijo en construcción y maquinaria y la variación de existencias.
Tipos de cambio
La mayoría de las publicaciones que contienen las series de cuentas nacionales de varios países expresadas en una moneda común suelen utilizar como factor de conversión el tipo de cambio promedio de sus transacciones de comercio exterior. Sin embargo, esta práctica no cuenta con una aceptación generalizada. Las principales críticas están relacionadas con la conversión a una moneda común de las variables de cuentas nacionales que miden resultados de actividades internas (producción, consumo, inversión).
A partir de un análisis de las distintas opciones y considerando las ventajas y desventajas para la elaboración de las series regionales que se presentan en esta sección, se optó por utilizar como tasa de conversión el tipo de cambio que refleja el promedio de unidades monetarias nacionales por un dólar de los Estados Unidos en el período de referencia. Dicha tasa (rf) es notificada por los países y difundida por el Fondo Monetario Internacional en su publicación Estadísticas financieras internacionales.
Entre las ventajas de utilizar esa tasa de conversión cabe señalar su disponibilidad y oportunidad, pues las series anuales e infraanuales de las rf se difunden oportunamente. La CEPAL ha utilizado estos tipos de cambio para presentar series agregadas a nivel regional, expresadas en dólares corrientes.
Los índices implícitos del producto interno bruto que se presentan en el Anuario estadístico tienen como año de referencia 2005.
Es importante señalar que las dos series regionales, una expresada en dólares corrientes y la otra en dólares constantes de 2005, no permiten calcular directamente los deflactores implícitos como en el caso de las variables expresadas en moneda nacional, pues esos índices varían simultáneamente por la modificación del tipo de cambio y del nivel de precios internos. Para obtener una mejor aproximación a los deflactores implícitos que reflejen las variaciones de los precios internos de las economías, se presentan los cálculos después de dividir los valores de las series en dólares a precios corrientes y tipos de cambio “constante” (año 2005) para los valores de las series en dólares expresadas a precios constantes de 2005.
structure of their economy (weighting and prices) for their accounts. Moreover, a number of countries which report having adopted the recommendations of 1993 SNA do not have a complete estimate of the basic tables of the system, such as those on GDP by type of economic activity and the balance between supply of and overall demand for goods and services; thus, some estimates had to be made, basically in order to homogenize levels of disaggregation and sectoral openness or a given component of expenditure, as in the case of the disaggregation of gross fixed capital formation in construction and machinery and the variation in stocks.
Exchange rates
As a rule, most of the publications that contain the national accounts series of the different countries expressed in a common currency use as a conversion factor the average rate of exchange at which they conduct their foreign trade transactions. This practice is not universally accepted, however. The main criticisms levelled against it relate to the conversion to a common currency of national account variables which measure results of domestic activities (production, consumption, investment).
Bearing in mind the advantages and disadvantages of the different options for the preparation of the regional series that are presented in this section, the conversion rate used here is the exchange rate that denotes the average number of national monetary units per United States dollar in the reference period. This rate (rf) is reported by the countries and disseminated by the International Monetary Fund in its publication International Financial Statistics.
The advantages of this conversion rate include promptness and availability, since annual and infra-annual series of rf are disseminated on a timely basis. ECLAC has been using these exchange rates to present aggregated series at the regional level, expressed in current dollars.
The reference year for the implicit GDP indices presented in the Statistical Yearbook is 2005.
The two regional series —one expressed in current dollars and the other in constant 2005 dollars— cannot be used to calculate implicit deflators directly, as variables expressed in national currency can, since these indices undergo simultaneous variations caused by fluctuations in the exchange rate and in domestic prices. A closer approximation of the implicit deflators that reflect the variations in domestic prices is obtained by presenting the calculations obtained by dividing the values of the series expressed in current dollars and constant exchange rates (2005) by the values of the series expressed in constant 2005 prices.
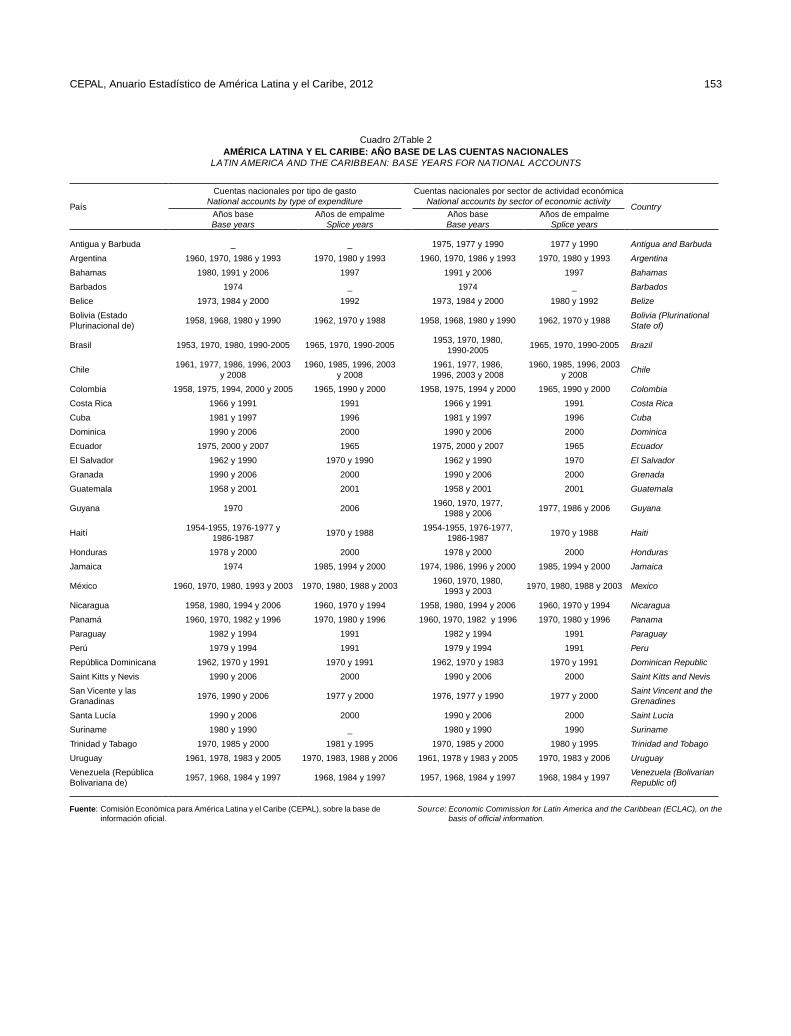
CEPAL, Anuario Estadístico de América Latina y el Caribe, 2012 153
Cuadro 2/Table 2 AMÉRICA LATINA Y EL CARIBE: AÑO BASE DE LAS CUENTAS NACIONALES
LATIN AMERICA AND THE CARIBBEAN: BASE YEARS FOR NATIONAL ACCOUNTS
País
Cuentas nacionales por tipo de gastoNational accounts by type of expenditure
Cuentas nacionales por sector de actividad económicaNational accounts by sector of economic activity
CountryAños baseBase years
Años de empalmeSplice years
Años baseBase years
Años de empalmeSplice years
Antigua y Barbuda _ _ 1975, 1977 y 1990 1977 y 1990 Antigua and Barbuda
Argentina 1960, 1970, 1986 y 1993 1970, 1980 y 1993 1960, 1970, 1986 y 1993 1970, 1980 y 1993 Argentina
Bahamas 1980, 1991 y 2006 1997 1991 y 2006 1997 Bahamas
Barbados 1974 _ 1974 _ Barbados
Belice 1973, 1984 y 2000 1992 1973, 1984 y 2000 1980 y 1992 Belize
Bolivia (Estado Plurinacional de)
1958, 1968, 1980 y 1990 1962, 1970 y 1988 1958, 1968, 1980 y 1990 1962, 1970 y 1988Bolivia (Plurinational State of)
Brasil 1953, 1970, 1980, 1990-2005 1965, 1970, 1990-20051953, 1970, 1980,
1990-20051965, 1970, 1990-2005 Brazil
Chile1961, 1977, 1986, 1996, 2003
y 20081960, 1985, 1996, 2003
y 20081961, 1977, 1986, 1996, 2003 y 2008
1960, 1985, 1996, 2003 y 2008
Chile
Colombia 1958, 1975, 1994, 2000 y 2005 1965, 1990 y 2000 1958, 1975, 1994 y 2000 1965, 1990 y 2000 Colombia
Costa Rica 1966 y 1991 1991 1966 y 1991 1991 Costa Rica
Cuba 1981 y 1997 1996 1981 y 1997 1996 Cuba
Dominica 1990 y 2006 2000 1990 y 2006 2000 Dominica
Ecuador 1975, 2000 y 2007 1965 1975, 2000 y 2007 1965 Ecuador
El Salvador 1962 y 1990 1970 y 1990 1962 y 1990 1970 El Salvador
Granada 1990 y 2006 2000 1990 y 2006 2000 Grenada
Guatemala 1958 y 2001 2001 1958 y 2001 2001 Guatemala
Guyana 1970 20061960, 1970, 1977,
1988 y 20061977, 1986 y 2006 Guyana
Haití1954-1955, 1976-1977 y
1986-19871970 y 1988
1954-1955, 1976-1977, 1986-1987
1970 y 1988 Haiti
Honduras 1978 y 2000 2000 1978 y 2000 2000 Honduras
Jamaica 1974 1985, 1994 y 2000 1974, 1986, 1996 y 2000 1985, 1994 y 2000 Jamaica
México 1960, 1970, 1980, 1993 y 2003 1970, 1980, 1988 y 20031960, 1970, 1980,
1993 y 20031970, 1980, 1988 y 2003 Mexico
Nicaragua 1958, 1980, 1994 y 2006 1960, 1970 y 1994 1958, 1980, 1994 y 2006 1960, 1970 y 1994 Nicaragua
Panamá 1960, 1970, 1982 y 1996 1970, 1980 y 1996 1960, 1970, 1982 y 1996 1970, 1980 y 1996 Panama
Paraguay 1982 y 1994 1991 1982 y 1994 1991 Paraguay
Perú 1979 y 1994 1991 1979 y 1994 1991 Peru
República Dominicana 1962, 1970 y 1991 1970 y 1991 1962, 1970 y 1983 1970 y 1991 Dominican Republic
Saint Kitts y Nevis 1990 y 2006 2000 1990 y 2006 2000 Saint Kitts and Nevis
San Vicente y las Granadinas
1976, 1990 y 2006 1977 y 2000 1976, 1977 y 1990 1977 y 2000Saint Vincent and the Grenadines
Santa Lucía 1990 y 2006 2000 1990 y 2006 2000 Saint Lucia
Suriname 1980 y 1990 _ 1980 y 1990 1990 Suriname
Trinidad y Tabago 1970, 1985 y 2000 1981 y 1995 1970, 1985 y 2000 1980 y 1995 Trinidad and Tobago
Uruguay 1961, 1978, 1983 y 2005 1970, 1983, 1988 y 2006 1961, 1978 y 1983 y 2005 1970, 1983 y 2006 Uruguay
Venezuela (República Bolivariana de)
1957, 1968, 1984 y 1997 1968, 1984 y 1997 1957, 1968, 1984 y 1997 1968, 1984 y 1997Venezuela (Bolivarian Republic of)
Fuente: Comisión Económica para América Latina y el Caribe (CEPAL), sobre la base de información oficial.
Source: Economic Commission for Latin America and the Caribbean (ECLAC), on the basis of official information.

154 ECLAC, Statistical Yearbook for Latin America and the Caribbean, 2012
�2.1.2 Cuentas nacionales de América Latina y el Caribe, por país,
en moneda nacional
Igual que en las ediciones anteriores, el segundo grupo de cuadros de cuentas nacionales de este Anuario (que se reportan únicamente en soporte electrónico) contiene las estimaciones que los países miembros de la región pusieron a disposición de la CEPAL a la fecha de cierre de esta publicación. Estas estimaciones están referidas al producto interno bruto por tipo de gasto y por clase de actividad económica, a precios corrientes y a precios constantes, y a las transacciones de ingresos y gastos corrientes del gobierno general y de los hogares. En un cuadro de resumen de cada país se presentan las relaciones entre los principales agregados de las cuentas nacionales a precios corrientes.
La información actualizada se obtuvo gracias a la valiosa y permanente cooperación de las oficinas de cuentas nacionales de los países y de quienes entregan la información a través de medios electrónicos.
La presentación de los datos continúa efectuándose de manera uniforme y, a medida que se dispone de la información necesaria, se van adaptando las series de todos los países de acuerdo a las clasificaciones propuestas en el SCN 1993 y a la CIIU, Rev. 3.
Salvo en lo relativo a la forma de la presentación, las series de datos son calculadas oficialmente por cada país. Se han mantenido los criterios propios de valoración de los países, así como los distintos períodos base elegidos para las estimaciones a precios constantes y las diferencias conceptuales, de alcance o cobertura, derivadas de la aplicación práctica de las recomendaciones internacionales y que se señalan en los respectivos cuadros.
�2.2 Sector externo
Las series que se incluyen en esta sección contienen información sobre la balanza de pagos y el comercio exterior, así como sobre sus principales indicadores. Además, se presenta información sobre el financiamiento y el endeudamiento externo. Los datos están expresados en dólares corrientes y en índices con base en el año 2005.
A continuación se detallan los aspectos metodológicos de la información publicada. Cabe señalar que las cifras
2.1.2 National accounts of Latin America and the Caribbean by country, in local currency
As in the case of former editions, the second group of national account tables presented in this Yearbook (reported in electronic version only) contains the estimates that member countries of the region provided to ECLAC by the date of closure of this publication. These estimates relate to GDP by type of expenditure and by category of economic activity, at current prices and constant prices, and general government and household current income and expenditure transactions. A summary table for each country shows the relationship between the principal national account aggregates at current prices.
The updated information was obtained thanks to the constant, invaluable cooperation of the national accounts offices in the countries, which provide information mainly through the use of electronic media.
The data continue to be presented in a uniform manner and, as information becomes available, the series of all the countries are adapted in line with the classifications proposed in 1993 SNA and in ISIC, Rev. 3.
The data series provided are calculated officially by each country, although they are presented in a different format. Each country’s own valuation criteria have been maintained, together with the different base periods chosen for estimates in constant prices and the conceptual differences or differences in scope or coverage deriving from the practical application of international recommendations. Such differences are indicated in the relevant tables.
2.2 External sector
The series included in this section contain information on the balance of payments and foreign trade as well as the main indicators thereof. In addition, information is provided on financing and external borrowing. The data are expressed in current dollars and in indices with 2005 as the base year.
The methodology used to calculate the published information is described below. It should be noted that

CEPAL, Anuario Estadístico de América Latina y el Caribe, 2012 155
del comercio exterior registradas en la balanza de pagos no coinciden necesariamente con los datos calculados sobre la base de las cifras del Banco de Datos del Comercio Exterior de América Latina y el Caribe (BADECEL), ya que estas últimas no fueron objeto de ajustes por el comercio no registrado o por la existencia de zonas francas y de bienes para transformación (industria maquiladora). Además, se observan diferencias en la valoración de las exportaciones e importaciones de bienes, pues mientras que en la balanza de pagos están expresadas en valores FOB, los datos de las importaciones almacenados en el BADECEL están en valores CIF, con excepción de las cifras correspondientes a México y a Venezuela (República Bolivariana de) (cuyas importaciones se registran en valores FOB)6. • En el Anuario Estadístico se reportan las balanzas
de pagos de los países de América Latina y el Caribe con información desagregada según la quinta edición del Manual de balanza de pagos del Fondo Monetario Internacional (FMI). La información abarca 33 países de la región y cubre el período comprendido entre 1980 y el último año disponible (2009, en este caso). Las variables están expresadas en dólares corrientes y la información proviene de fuentes nacionales y del FMI.
• Por otra parte, la División de Estadística y Proyecciones Económicas de la CEPAL mantiene el BADECEL, que contiene datos de las exportaciones en valores FOB y de las importaciones en valores CIF de 25 países de América Latina, el Caribe y América del Norte. La información se presenta bajo las clasificaciones de la CUCI, Rev. 1, 2, 3 y 4, y la CIIU, Rev. 2 con una desagregación máxima de cinco dígitos. La frecuencia de los datos es anual; el valor está expresado en miles de dólares y el volumen, en toneladas. Para cada partida se presenta además el país copartícipe en el comercio. La información de base proviene de las aduanas de los países y es recolectada por organismos como la Asociación Latinoamericana de Integración (ALADI); la Secretaría Permanente del Tratado General de Integración Económica Centroamericana (SIECA); la Comunidad Andina y la División de Estadística de las Naciones Unidas, que recopilan a su vez la información de los distintos países y luego la suministran a la CEPAL para su incorporación en el BADECEL.
• Las cifras de comercio que figuran en la balanza de pagos no coinciden necesariamente con los totales que se publican según las cifras almacenadas en el BADECEL, pues estas últimas no contienen los ajustes que efectúan los organismos compiladores de la balanza de pagos y que incluyen el comercio no registrado, ya sea por la existencia de zonas francas y de bienes para transformación (industria maquiladora) o por
6 Esta consideración se refiere fundamentalmente a las cifras presentadas en los cuadros de la sección 2.2.2.
foreign trade figures recorded in the balance of payments do not necessarily coincide with those based on the figures obtained from the Foreign Trade Data Bank for Latin America and the Caribbean (BADECEL), since the latter are not adjusted for unregistered trade or for the existence of free zones and goods for in- bond processing (maquila industry). Moreover, there are differences in the valuation of exports and imports of goods, since these are expressed in the balance of payments on an f.o.b. basis, whereas the import data stored in BADECEL are given on a c.i.f. basis, with the exception of figures relating to Mexico and the Bolivarian Republic of Venezuela (whose imports are registered f.o.b.).6
• The Statistical Yearbook reports the balances of payments of the countries of Latin America and the Caribbean using information disaggregated according to the fifth edition of the Balance of Payments Manual published by the International monetary Fund (IMF). The information covers 33 countries of the region and spans the period between 1980 and the latest year available (2009, in this case). The variables are expressed in current dollars and the information comes from national sources and IMF.
• The Division of Statistics and Economic Projection of ECLAC maintains BADECEL, which contains export data in f.o.b. values and import data in c.i.f. values for 25 countries of Latin America, the Caribbean and North America. The information is presented under the classifications of SITC Rev. 1, 2, 3 and 4, and ISIC Rev. 2 with a maximum disaggregation of five digits. The data are annual; values are expressed in thousands of dollars and volumes in tons. The partner country in the trade transaction is also presented under each item. The base information comes from customs organizations in the countries and is compiled by agencies such as the Latin American Integration Association (LAIA); the Secretariat for Central American Economic Integration (SIECA); the Andean Community and the United Nations Statistics Division, which collect information from the various countries and provide it to ECLAC to be incorporated into BADECEL.
• The trade figures shown in the balance of payments may not coincide with the total published using figures stored in BADECEL, since the latter do not contain adjustments made by agencies that prepare balances of payments and which include trade that is unregistered, either because it is transacted in free and in-bond processing zones (maquila) or because it consists of contraband. In the balance of payments, merchandise import and export
6 This consideration refers basically to the figures reported in the tables of section 2.2.2.

156 ECLAC, Statistical Yearbook for Latin America and the Caribbean, 2012
contrabando u otro tipo de ajustes. Cabe aclarar que en la balanza de pagos, los datos de las exportaciones y las importaciones de bienes están expresados en valores FOB, excepto los datos de importaciones provenientes del BADECEL, que se registran en valor CIF.
• En el Anuario Estadístico se publican además las series del PIB por tipo de gasto, en las que aparecen series de exportaciones e importaciones de bienes y servicios que se generan en las series de cuentas nacionales oficiales de cada país. En este caso, las exportaciones de bienes se expresan en valores FOB y el total de las importaciones de bienes, en valores CIF. Asimismo, en el Anuario se reportan las exportaciones e importaciones de bienes y servicios expresadas en moneda nacional y en dólares, a precios corrientes y a precios constantes (los agregados macroeconómicos regionales se expresan en dólares constantes de 2005).
• En el cuadro 3 se presentan los metadatos de las exportaciones e importaciones de bienes y servicios, según las distintas fuentes de información (la balanza de pagos, el comercio exterior y las cuentas nacionales) y se detallan algunos atributos metodológicos que explican sus posibles diferencias.
Cuadro 3 / Table 3 CARACTERÍSTICAS DE LA INFORMACIÓN SOBRE EL SECTOR EXTERNO
CHARACTERISTICS OF INFORMATION ON THE EXTERNAL SECTOR
CaracterísticasCharacteristics
Banco de datos de comercio exteriorExternal Trade Data Bank
Banco de datos de la balanza de pagosBalance of Payments Data Bank
Banco de datos de cuentas nacionalesNational Accounts Database
ExportacionesExports
ImportacionesImports
ExportacionesExports
ImportacionesImports
ExportacionesExports
ImportacionesImports
BienesGoods
ServiciosServices
BienesGoods
ServiciosServices
BienesGoods
ServiciosServices
BienesGoods
ServiciosServices
BienesGoods
ServiciosServices
BienesGoods
ServiciosServices
DisponibilidadAvailability
X X X X X X X X X X
X X
ValoraciónValuation
FOBf.o.b.
CIF (excepto en los casos de México y la República Bolivariana de Venezuela, que se expresan en FOB)c.i.f. (except data for Bolivarian Republic of Venezuela and Mexico, which are expressed f.o.b.)
FOBf.o.b.
FOBf.o.b.
FOBf.o.b.
CIF (a nivel total) c.i.f. (at aggregate
level)
MonedaCurrency
DólaresDollars
DólaresDollars
DólaresDollars
DólaresDollars
Series de países en moneda nacional y series regionales en dólares a precios corrientes y constantes a
Country series in national currency and regional series in current and constant dollars a
Período de cobertura y frecuenciaPeriod and frequency
Anual entre 1970 y 2010, dependiendo del paísAnnual between 1970 and 2010, depending on the country
Anual entre 1980 y 2010Annual between 1980 and 2010
AnualEn moneda nacional: 1950-2010En dólares: 1950-2010AnnualNational currency: 1950-2010Dollars: 1950-2010
data are expressed f.o.b., except from import data from BADECEL, which are registered c.i.f.
• The Statistical Yearbook also gives GDP series by type of expenditure, which include series of imports and exports of goods and services generated from each country’s official national accounts series. In this case, goods exports are given f.o.b. and total goods imports, c.i.f. The Yearbook reports imports and exports of goods and services in national currency and in dollars, and at constant prices and at current prices (regional macroeconomic aggregates are expressed in constant 2005 dollars).
• Table 3 contains the metadata for imports and exports of goods and services, by information source (balance of payments, external trade and national accounts) and shows some methodological attributes that account for possible differences.

CEPAL, Anuario Estadístico de América Latina y el Caribe, 2012 157
CaracterísticasCharacteristics
Banco de datos de comercio exteriorExternal Trade Data Bank
Banco de datos de la balanza de pagosBalance of Payments Data Bank
Banco de datos de cuentas nacionalesNational Accounts Database
CoberturaCoverage
Comercio de bienes registrado por las aduanas de los países y recolectado por la ALADI, la SIECA y la base de datos COMTRADE e incluido luego en la BADECEL. No cubre necesariamente el universo de los intercambios de bienes (excluye por lo general el comercio no registrado de bienes y los ajustes).Goods trade registered by customs in the countries, compiled by LAIA, SIECA and the COMTRADE database, then included in BADECEL. Does not necessarily cover the entire universe of goods transactions (usually excludes unregistered merchandise trade and adjustments).
Comercio de bienes registrado por la aduana más los ajustes, como:• Bienesparatransformación(maquila)• Reparacionesdebienes• Bienesadquiridosenpuertopormedios
de transporte• Oronomonetario• Comercionoregistrado(contrabando)• Reexportaciones• OtrosnoespecificadosComercio de servicios (incluye transportes, viajes y otros servicios)Goods trade registered by customs plus adjustments such as:• Goods for processing (maquila)• Repairs of goods• Goods acquired in port by mediums of
transport• Non-monetary gold• Unregistered trade (contraband)• Re-exports• Other unspecifiedServices trade (includes transport, travel and other services)
Universo del comercio de bienes y serviciosUniverse of trade in goods and services
DesagregaciónDisaggregation
Por productoBy productPor país copartícipeBy partner country
Por lo general, se reportan únicamente los totales. Algunos países informan desgloses en función de la importacia de determinados productos (por ejemplo, el petróleo).Usually only totals reported. Some countries report a breakdown as a function of the importance of certain products (such as oil) in their economies.
En la base expresada en moneda nacional, se presentan los bienes y servicios desagregados en la medida que los países así lo difundan. En la base expresada en dólares, se presentan los bienes y servicios agregados.In national currency, goods and services are presented disaggregated to the extent that the countries break them down. In dollars, goods and services are presented as aggregates.
ClasificadoresClassifiers
CUCI Rev. 1, 2 y 3SITC Rev 1, 2 and 3CIIU Rev. 2ISIC Rev. 2
Los bienes se trata como agregado. Los serviciosseclasificandeacuerdoal“Manualde estadisticas de comercio internacional de servicios”.Goods are handled as aggregates. Services are classified according to the Manual on Statistics of International Trade in Services.
CIIU, Rev. 3ISIC, Rev.3
Referencias teóricas y metodológicasTheoretical and methodological references
Estadísticas del comercio internacional demercancías.Conceptoydefiniciones.Clasificacionesestadísticasinternacionalesincorporadas en el banco de datos del comercio exterior de América Latina y el Caribe de la CEPAL (Rev. 2).Statistics on international merchandise trade. Concept and definitions. International statistical classifications incorporated into the External Trade Data Bank for Latin America and the Caribbean of ECLAC (Rev. 2).
Los aspectos conceptuales y metodológicos referentes a las exportaciones e importaciones de bienes y servicios en la balanza de pagos se reportan en la quinta edición del Manual de balanza de pagos.Conceptual and methodological aspects referring to exports and imports of goods and services in the fifth edition of the Balance of Payments Manual.
Los aspectos conceptuales y metodológicos referentes a las exportaciones e importaciones de bienes y servicios en las cuentas nacionales se reportan en el SCN 1993. Conceptual and methodological aspects referring to exports and imports of goods and services in the national accounts reported under 1993 SNA.
Cálculos de la División de Estadísticas y Proyecciones Económicas de la CEPAL, medidas de valor corriente, volumen, precio y otros indicadores.Calculations by the Statistics and Economic Projections Division of ECLAC, measures of current value, volume, price and other indicators published by ECLAC.
La base de datos contiene información a precios corrientes exclusivamente. The database contains information in current prices only.
Se publica información a precios corrientes. Se calculan los índices de precios y de volumen para los bienes, los servicios y para el total de las exportaciones e importaciones.Information is published in current prices. Volume and price indices are calculated for goods, services and total exports and imports.
Se publica información en dólares a precios corrientes y a precios constantes de 2000.Information is published in dollars at current prices and at constant 2000 prices.
Cuadro 3 (conclusión)Table 3 (concluded)
Fuente: Comisión Económica para América Latina y el Caribe (CEPAL).a En las cuentas nacionales de América Latina y el Caribe que elabora la Comisión
Económica para América Latina y el Caribe (CEPAL), se reportan las exportaciones y las importaciones de bienes y servicios expresadas en dólares, transformando los valores de esas variables en moneda nacional con el tipo de cambio rf publicado por el Fondo Monetario Internacional (FMI).
b Asociación Latinoamericana de Integración.c Secretaría Permanente del Tratado General de Integración Económica
Centroamericana.d Base de datos estadísticos sobre el comercio de mercaderías.e Banco de Datos del Comercio Exterior de América Latina y el Caribe.
Source: Economic Commission for Latin America and the Caribbean (ECLAC).a The national accounts for Latin America and the Caribbean prepared by the Economic
Commission for Latin America and the Caribbean (ECLAC) use the exchange rate published by the International Monetary Fund (IMF) to change local-currency values of imports and exports of goods and services into dollars.
b Latin American Integration Association.c Secretariat for Central American Economic Integration.d Statistical database on merchandise trade.e External Trade Data Bank for Latin America and the Caribbean.
158 ECLAC, Statistical Yearbook for Latin America and the Caribbean, 2012
La balanza de pagos es un estado estadístico que resume sistemáticamente las transacciones económicas entre una economía y el resto del mundo en un período específico. Las transacciones que tienen lugar entre residentes y no residentes incluyen las que se refieren a bienes, servicios y renta, las que involucran activos y pasivos financieros con relación al resto del mundo y las transacciones unilaterales.
Los conceptos que abarca la balanza de pagos y los métodos para alcanzar un cierto grado de homogeneidad y comparabilidad han ido perfeccionándose gracias a recomendaciones formuladas en las distintas versiones del Manual de balanza de pagos del Fondo Monetario Internacional (FMI). La delimitación conceptual de la economía, los principios básicos de valoración y el momento de registro, el tipo de transacciones que pueden considerarse para elaborar la balanza, la relación entre la balanza de pagos y el Sistema de Cuentas Nacionales (SCN) y, naturalmente, entre la balanza de pagos y la posición de inversión extranjera, son temas cuyo tratamiento metodológico merece especial atención.
En esta edición del Anuario se incluyen los datos de la balanza de pagos, desglosados conforme a los componentes analíticos de la quinta edición del Manual.
Clasificación utilizada en la presentación analítica de la quinta edición del Manual de balanza de pagos
En la presentación analítica, los componentes de la balanza de pagos se clasifican en cinco categorías principales de datos: I. La cuenta corriente, que comprende bienes y servicios,
renta y transferencias corrientes.II. La cuenta de capital, que se refiere a transferencias
de capital y adquisición/enajenación de activos no financieros no producidos.
III. La cuenta financiera, que se refiere a activos y pasivos financieros.
IV. La cuenta de errores y omisiones, que compensa las sobrestimaciones o subestimaciones de los componentes de los grupos anteriores, y
V. La cuenta de reservas y partidas conexas, que se refiere a los activos de reserva, el uso del crédito y préstamos del FMI, los pasivos que constituyen reservas de autoridades extranjeras y el financiamiento excepcional.
A efectos analíticos, se incorpora una sexta categoría (número V en los cuadros) denominada balanza global, que incluye todos los componentes de la cuenta corriente, cuenta de capital, cuenta financiera y cuenta de errores y omisiones. Ese balance es igual a la suma neta, con signo contrario, de los componentes de la cuenta de reservas y partidas conexas (número VI en los cuadros).
�2.2.1 Balanza de pagos 2.2.1 Balance of payments
The balance of payments is a statistical statement which systematically sums up the economic transactions between a given economy and the rest of the world over a specific period. The transactions that take place between residents and non-residents cover goods, services and income, including financial assets and liabilities with respect to the rest of the world and unrequited transfers.
The concepts included in the balance of payments and the methods for achieving a certain degree of uniformity and comparability have been refined over time by the recommendations formulated by the International Monetary Fund (IMF) in different versions of its Balance of Payments Manual. Special attention should be paid to the methodological treatment of questions such as the conceptual delimitation of the economy, the basic principles of valuation and time of registration, the type of transactions that may be considered for constructing the balance, the relationship between the balance of payments and the System of National Accounts (SNA) and, of course, between the balance of payments and the foreign investment position.
This volume of the Yearbook includes balance of payments data broken down in accordance with the analytical components of the fifth edition of the Balance of Payments Manual.
Classification used in the analytical presentation of the fifth edition of the IMF Balance of Payments Manual.
In the analytical presentation, the components of the balance of payments are grouped under five main types of accounts:I. The current account, which includes goods and services,
income and current transfers.II. The capital account, which refers to capital transfers
and the acquisition/disposal of non-produced, non- financial assets.
III. The financial account, which registers financial assets/liabilities.
IV. The errors and omissions account, which contains offsets for over- or under estimates of components of the above accounts, and
V. The reserves and related items account, which refers to reserve assets, the use of IMF credit and loans, liabilities constituting foreign authorities’ reserves and exceptional financing.
For analytical purposes, a sixth category (designated as roman numeral “V” in the tables) has been established. This entry, called the global balance, includes all the components of the current, capital, financial and errors and omissions accounts. This balance can be measured more easily as the net sum (with the opposite sign) of the components of the reserves and related items account (roman numeral “VI” in the tables).
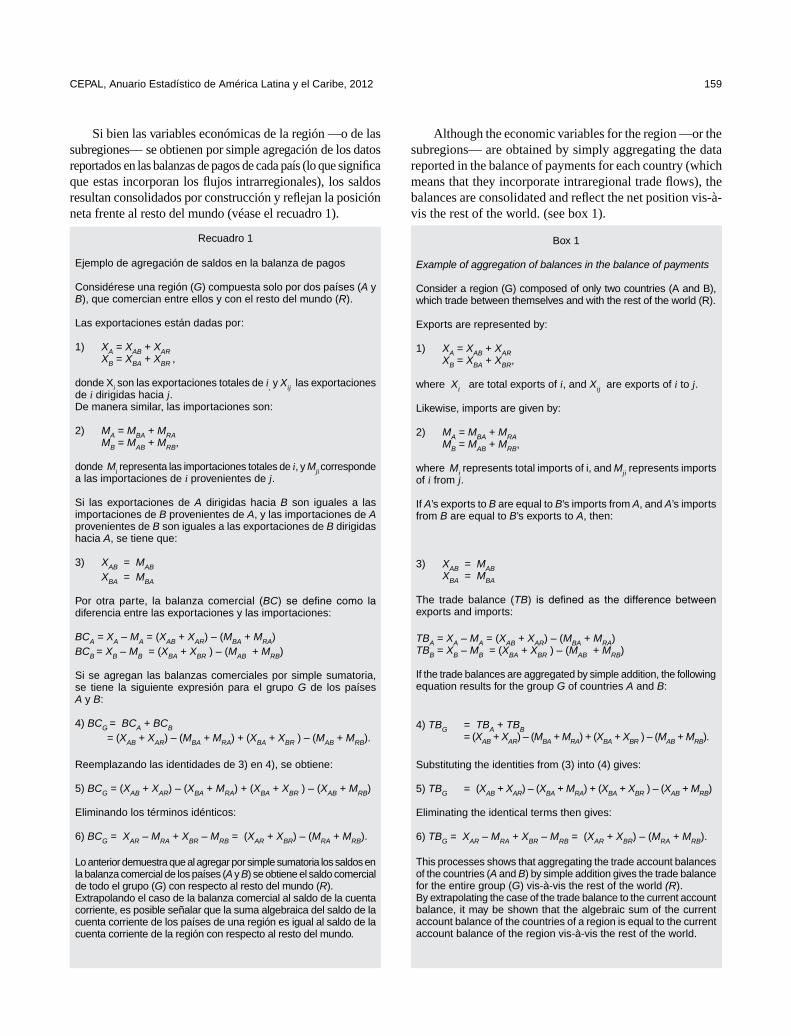
CEPAL, Anuario Estadístico de América Latina y el Caribe, 2012 159
Si bien las variables económicas de la región —o de las subregiones— se obtienen por simple agregación de los datos reportados en las balanzas de pagos de cada país (lo que significa que estas incorporan los flujos intrarregionales), los saldos resultan consolidados por construcción y reflejan la posición neta frente al resto del mundo (véase el recuadro 1).
Recuadro 1
Ejemplo de agregación de saldos en la balanza de pagos
Considérese una región (G) compuesta solo por dos países (A y B), que comercian entre ellos y con el resto del mundo (R).
Las exportaciones están dadas por:
1) XA = XAB + XAR XB = XBA + XBR ,
donde Xi son las exportaciones totales de i, y Xij las exportaciones de i dirigidas hacia j.De manera similar, las importaciones son:
2) MA = MBA + MRA MB = MAB + MRB,
donde Mi representa las importaciones totales de i, y Mji corresponde a las importaciones de i provenientes de j.
Si las exportaciones de A dirigidas hacia B son iguales a las importaciones de B provenientes de A, y las importaciones de A provenientes de B son iguales a las exportaciones de B dirigidas hacia A, se tiene que:
3) XAB = MAB
XBA = MBA
Por otra parte, la balanza comercial (BC) se define como ladiferencia entre las exportaciones y las importaciones:
BCA = XA – MA = (XAB + XAR) – (MBA + MRA)BCB = XB – MB = (XBA + XBR ) – (MAB + MRB)
Si se agregan las balanzas comerciales por simple sumatoria, se tiene la siguiente expresión para el grupo G de los países A y B:
4) BCG = BCA + BCB = (XAB + XAR) – (MBA + MRA) + (XBA + XBR ) – (MAB + MRB).
Reemplazando las identidades de 3) en 4), se obtiene:
5) BCG = (XAB + XAR) – (XBA + MRA) + (XBA + XBR ) – (XAB + MRB)
Eliminando los términos idénticos:
6) BCG = XAR – MRA + XBR – MRB = (XAR + XBR) – (MRA + MRB).
Lo anterior demuestra que al agregar por simple sumatoria los saldos en la balanza comercial de los países (A y B) se obtiene el saldo comercial de todo el grupo (G) con respecto al resto del mundo (R).Extrapolando el caso de la balanza comercial al saldo de la cuenta corriente, es posible señalar que la suma algebraica del saldo de la cuenta corriente de los países de una región es igual al saldo de la cuenta corriente de la región con respecto al resto del mundo.
Although the economic variables for the region —or the subregions— are obtained by simply aggregating the data reported in the balance of payments for each country (which means that they incorporate intraregional trade flows), the balances are consolidated and reflect the net position vis-à-vis the rest of the world. (see box 1).
Box 1
Example of aggregation of balances in the balance of payments
Consider a region (G) composed of only two countries (A and B), which trade between themselves and with the rest of the world (R).
Exports are represented by:
1) XA = XAB + XAR XB = XBA + XBR,
where Xi are total exports of i, and Xij are exports of i to j.
Likewise, imports are given by:
2) MA = MBA + MRA MB = MAB + MRB,
where Mi represents total imports of i, and Mji represents imports of i from j.
If A’s exports to B are equal to B’s imports from A, and A’s imports from B are equal to B’s exports to A, then:
3) XAB = MAB XBA = MBA
The trade balance (TB) is defined as the difference betweenexports and imports:
TBA = XA – MA = (XAB + XAR) – (MBA + MRA)TBB = XB – MB = (XBA + XBR ) – (MAB + MRB)
If the trade balances are aggregated by simple addition, the following equation results for the group G of countries A and B:
4) TBG = TBA + TBB = (XAB + XAR) – (MBA + MRA) + (XBA + XBR ) – (MAB + MRB).
Substituting the identities from (3) into (4) gives:
5) TBG = (XAB + XAR) – (XBA + MRA) + (XBA + XBR ) – (XAB + MRB)
Eliminating the identical terms then gives:
6) TBG = XAR – MRA + XBR – MRB = (XAR + XBR) – (MRA + MRB).
This processes shows that aggregating the trade account balances of the countries (A and B) by simple addition gives the trade balance for the entire group (G) vis-à-vis the rest of the world (R).By extrapolating the case of the trade balance to the current account balance, it may be shown that the algebraic sum of the current account balance of the countries of a region is equal to the current account balance of the region vis-à-vis the rest of the world.

160 ECLAC, Statistical Yearbook for Latin America and the Caribbean, 2012
Principales conceptos
Cuenta corriente
En la cuenta corriente se registran todas las transacciones en valores económicos, salvo recursos financieros, que tienen lugar entre entidades residentes y no residentes; asimismo, se registran los asientos compensatorios de los valores económicos corrientes que se suministren o adquieran sin un quid pro quo. Concretamente, las clasificaciones principales son: bienes, servicios, renta y transferencias corrientes.
Bienes y servicios
Bienes
Mercancías generales: comprenden la mayoría de los bienes muebles que los residentes exportan a no residentes, o importan de ellos, dando lugar, salvo algunas excepciones especificadas, a un traspaso de propiedad (efectivo o imputado).
Bienes para transformación: comprenden la exportación (o importación, en la economía compiladora) de bienes que cruzan la frontera para ser transformados en el extranjero y la reimportación (o exportación, en la economía compiladora) subsiguiente de dichos bienes, valorados en cifras brutas antes y después de su transformación. Esta partida constituye una excepción al criterio de traspaso de propiedad.
Reparaciones de bienes: comprenden las reparaciones de bienes efectuadas para no residentes o recibidas de ellos en embarcaciones y aeronaves, entre otros. Si bien el movimiento físico de estos bienes es similar al descrito en el párrafo 154 del Manual de balanza de pagos, las reparaciones deben valorarse según el precio (derechos pagados o recibidos) de las mismas y no según el valor bruto de los bienes antes y después de las reparaciones.
Bienes adquiridos en puerto por medios de transporte: comprenden todos los bienes (como combustibles, víveres, pertrechos y suministros) que las empresas residentes/no residentes de transporte —aéreo y marítimo, entre otros— adquieren en el extranjero/en la economía compiladora. Esta clasificación no cubre los servicios auxiliares prestados (remolque y mantenimiento, entre otros), que se clasifican en la categoría transporte.
Oro no monetario: comprenden las exportaciones e importaciones de todo el oro que no esté en poder de las autoridades como activo de reserva (oro monetario).
Servicios
Transportes: abarcan la mayoría de los servicios prestados por residentes a no residentes, y viceversa, que se incluían en las partidas embarques y otros transportes de la cuarta edición del Manual de balanza de pagos. En la quinta edición se excluye el seguro de fletes, que forma parte de los servicios de seguros. Los transportes incluyen el
Main concepts
Current account
The current account covers all transactions (other than those of financial items) that involve economic values and occur between resident and non-resident entities. It also covers offsets to current economic values provided or acquired without a quid pro quo. Specifically, the major classifications are goods and services, income and current transfers.
Goods and services
Goods
General merchandise covers most movable goods that are exported to, or imported from, non-residents by residents and that, with a few specified exceptions, undergo actual or imputed changes in ownership.
Goods for processing covers exports (or imports, in the compiling economy) of goods crossing the border for processing abroad and subsequent re-import (or export, in the compiling economy) of the goods, which are valued on a gross basis before and after processing. This item is an exception to the change of ownership principle.
Repairs on goods covers repair activity on goods provided to or received from non-residents on ships, aircraft, etc. Although the physical movement of these goods is similar to that described in paragraph 154 of the Manual, the repairs are valued at the prices (fees paid or received) of the repairs rather than at the gross values of the goods before and after repairs are made.
Goods procured in ports by carriers covers all goods (such as fuels, provisions, stores and supplies) that resident/non-resident carriers —air, shipping, etc.— procure abroad (in the compiling economy). This classification does not cover the provision of auxiliary services (towing, maintenance, etc.), which are covered under transportation.
Non-monetary gold covers exports and imports of all gold that is not held as a reserve asset (monetary gold) by the authorities.
Services
Transportation covers most of the services performed by residents for non-residents and vice versa that were included in shipment and other transportation in the fourth edition of the Manual. In the fifth edition, however, freight insurance is included under insurance services rather than under transportation. Transportation includes freight and
CEPAL, Anuario Estadístico de América Latina y el Caribe, 2012 161
transporte de carga y de pasajeros por todos los medios, así como otros servicios de distribución y auxiliares, incluido el arrendamiento de equipo de transporte tripulado, con ciertas excepciones indicadas en los capítulos X, XI y XIII del Manual de balanza de pagos.
Viajes: comprenden bienes y servicios —incluidos los relacionados con la salud y la educación— adquiridos en una economía por viajeros no residentes (incluidos los excursionistas) para fines de negocios y para uso personal durante su estancia (inferior a un año) en esa economía. En viajes no se incluyen los servicios de transporte internacional de pasajeros, que forman parte de transportes. Los estudiantes y las personas que están en tratamiento médico se tratan como viajeros, independientemente de la duración de su estancia, en tanto que otros individuos —personal militar y de embajadas y trabajadores no residentes— no se consideran viajeros. No obstante, los gastos incurridos por los trabajadores no residentes se incluyen en viajes, mientras que los del personal militar y de embajadas se incluyen en servicios del gobierno, no incluidos en otra parte (n.i.o.p.).
Otros servicios
En esta categoría se incluyen:Servicios de comunicaciones, que abarcan las transacciones
de comunicaciones entre residentes y no residentes, incluidos los servicios postales, de mensajería y de telecomunicaciones (transmisión de sonido, imagen y otra información por diferentes medios, así como el mantenimiento pertinente proporcionado por residentes a no residentes y viceversa).
Servicios de construcción, que incluyen las obras de proyectos de construcción e instalación realizadas, con carácter temporal, en el extranjero/en la economía compiladora o en enclaves extraterritoriales por empresas residentes/no residentes y su personal. En este concepto no se incluyen las obras realizadas por una filial extranjera de una empresa residente o una oficina local no constituida en sociedad que sea equivalente, siempre y cuando satisfaga ciertos criterios a una filial extranjera.
Servicios de seguros, que comprenden la contratación de seguros de no residentes con aseguradoras residentes y viceversa, incluidos los seguros de fletes (de bienes exportados e importados), los servicios correspondientes a otras clases de seguros directos (de vida y otros) y los servicios correspondientes a reaseguros.
Servicios financieros (salvo los relacionados con las empresas aseguradoras y las cajas de pensiones), que abarcan los servicios de intermediación financiera y los servicios auxiliares entre residentes y no residentes. Se incluyen las comisiones y los derechos relacionados con cartas de crédito, líneas de crédito, arrendamiento financiero, transacciones en divisas, crédito al consumidor y a las empresas, corretaje, colocación y suscripción de valores, e instrumentos de cobertura de riesgo de diferentes clases, entre otros. En los
passenger transportation by all modes of transportation and other distributive and auxiliary services, including rentals of transportation equipment together with a crew. Certain exceptions are noted in chapters X, XI and XIII of the Manual.
Travel covers goods and services —including those related to health and education— acquired from an economy by non-resident travellers (including excursionists) for business purposes and personal use during their visits (of less than one year) in that economy. Travel excludes international passenger services, which are included in transportation. Students and medical patients are treated as travellers, regardless of their length of stay. Certain other individuals —military and embassy personnel and non-resident workers— are not regarded as travellers. However, expenditures by non-resident workers are included in travel, while those of military and embassy personnel are included in government services, not included elsewhere (n.i.e.).
Other services
This category includes the following:Communications services, which covers communications
transactions between residents and non-residents. Such services comprise postal, courier and telecommunications services (transmission of sound, images and other information by various modes and associated maintenance provided by/ for residents by/for non-residents).
Construction services, which covers construction and installation project work that is, on a temporary basis, performed abroad/in the compiling economy or in offshore enclaves by resident/non-resident enterprises and their personnel. This does not include work undertaken by a foreign affiliate of a resident enterprise or by an unincorporated site office which, if it meets certain criteria, is equivalent to a foreign affiliate.
Insurance services, which covers the provision of insurance to non-residents by resident insurance enterprises and vice versa. This item comprises services provided for freight insurance (on goods exported and imported), services provided for other types of direct insurance (including life and non-life) and services provided for reinsurance.
Financial services (other than those related to insurance enterprises and pension funds), which covers financial intermediation services and auxiliary services conducted between residents and non-residents. This category includes commissions and fees for letters of credit, lines of credit, financial leasing services, foreign exchange transactions, consumer and business credit services, brokerage services, underwriting services, arrangements for various forms of hedging instruments, etc. Auxiliary services include
162 ECLAC, Statistical Yearbook for Latin America and the Caribbean, 2012
servicios auxiliares se incluyen los servicios de operación y reglamentación de los mercados financieros, y servicios de custodia de valores, entre otros.
Servicios de informática y de información, que abarcan las transacciones entre residentes y no residentes relacionadas con el asesoramiento en soporte técnico (hardware), aplicación de soporte lógico (software), servicios de información (procesamiento de datos, bases de datos y agencias noticiosas) y mantenimiento y reparación de computadores y equipo conexo.
Regalías y derechos de licencia, que comprenden ingresos (exportación) y pagos (importación) de residentes y no residentes por: i) el uso autorizado de activos intangibles no financieros no producidos y derechos de propiedad como marcas registradas, derechos de autor, patentes, procesos, técnicas, diseños, derechos de fabricación y concesiones, entre otros, y ii) el uso, mediante convenios de licencia, de originales o prototipos producidos, como manuscritos y películas, entre otros.
Otros servicios empresariales prestados por residentes a no residentes y viceversa, que se refieren a servicios de compraventa y otros servicios relacionados con el comercio, servicios de arrendamiento de explotación y servicios empresariales, profesionales y técnicos varios.
Servicios personales, culturales y recreativos, que abarcan:i) servicios audiovisuales y conexos yii) otros servicios culturales prestados por residentes a no
residentes y viceversa.En el inciso i) se incluyen servicios relacionados con
la producción de películas cinematográficas o videocintas, programas de radio y televisión y grabaciones musicales. Por ejemplo, los alquileres y honorarios percibidos por artistas, productores, entre otros, por sus producciones y por la venta de derechos de distribución a los medios de comunicación. En el inciso ii) se incluyen otros servicios personales, culturales y recreativos, como los relacionados con bibliotecas, museos y otras actividades culturales y deportivas.
Servicios de gobierno, n.i.o.p., que incluyen todos los servicios (como los gastos incurridos por embajadas y consulados) relacionados con sectores gubernamentales u organismos internacionales y regionales y no clasificados en otras partidas.
Renta
Remuneración de asalariados: abarca los salarios, sueldos y otras prestaciones en efectivo o en especie, incluidos los de los trabajadores fronterizos, de temporada y otros no residentes (como el personal local de embajadas).
Renta de la inversión: comprende los ingresos y pagos de la renta derivados, respectivamente, de las tenencias de activos financieros de residentes frente al exterior y de pasivos frente a no residentes, que se divide en renta de la inversión directa, renta de la inversión de cartera y renta de
financial-market operational and regulatory services, security custody services, etc.
Computer and information services, which covers resident/non-resident transactions related to hardware consultancy, software implementation, information services (data processing, databases, news agencies) and maintenance and repair of computers and related equipment.
Royalties and licence fees, which covers receipts (exports) and payments (imports) of residents and non- residents for: (i) the authorized use of intangible non- produced, non-financial assets and proprietary rights such as trademarks, copyrights, patents, processes, techniques, designs, manufacturing rights, franchises, etc., and (ii) the use, through licensing agreements, of produced originals or prototypes, such as manuscripts, films, etc.
Other business services provided by residents to non- residents and vice versa, which covers merchanting and other trade-related services; operational leasing services; and miscellaneous business, professional and technical services.
Personal, cultural, and recreational services, which covers:(i) audiovisual and related services, and(ii) other cultural services provided by residents to
non-residents and vice versa.Included under (i) are services associated with the
production of motion pictures on film or video tape, radio and television programmes, and musical recordings. Examples of these services are rentals and fees received by actors, producers, etc., for productions and for distribution rights sold to the media. Included under (ii) are other personal, cultural and recreational services, such as those associated with libraries, museums and other cultural and sporting activities.
Government services, n.i.e., which covers all services (such as expenditures of embassies and consulates) associated with government sectors or international and regional organizations which are not classified under other items.
Income
Compensation of employees covers wages, salaries and other benefits, in cash or in kind, and includes those of border, seasonal and other non-resident workers (e.g., local staff of embassies).
Investment income covers receipts and payments of income associated, respectively, with holdings of external financial assets by residents and with liabilities to non-residents. Investment income consists of direct investment income, portfolio investment income and other investment

CEPAL, Anuario Estadístico de América Latina y el Caribe, 2012 163
otra inversión. El componente inversión directa se desglosa en renta procedente de acciones y otras participaciones de capital (dividendos, utilidades de sucursales y utilidades reinvertidas) y en renta procedente de la deuda (intereses); la renta de la inversión de cartera se desglosa también en renta procedente de acciones y otras participaciones de capital (dividendos) y renta procedente de la deuda (intereses); en renta de otra inversión se registran los intereses devengados por otra inversión (como préstamos) y, en principio, la renta imputada a las unidades familiares procedente de su participación neta de capital en las reservas de los seguros de vida y en las cajas de pensiones.
Transferencias corrientes
Las transferencias corrientes se distinguen de las transferencias de capital, que se incluyen en la cuenta de capital y financiera para guardar la uniformidad con el tratamiento de las transferencias que hace el SCN. Las transferencias son los asientos compensatorios de los traspasos de propiedad de recursos reales o financieros entre residentes y no residentes, ya sea en forma voluntaria u obligatoria, que no entrañan un quid pro quo en valor económico.
En las transferencias corrientes se distinguen las del gobierno general (como las de cooperación internacional corriente entre diferentes gobiernos, pagos de impuestos corrientes sobre la renta y el patrimonio) y otras transferencias (como remesas de trabajadores, primas —menos cargos por servicio— e indemnizaciones de seguros excepto los de vida). En el capítulo XV del Manual de balanza de pagos se examina en forma detallada la distinción entre transferencias corrientes y transferencias de capital.
Cuenta de capital
Los componentes principales de la cuenta de capital son las transferencias de capital y la adquisición/enajenación de activos no financieros no producidos. Las transferencias de capital son aquellas en las que tiene lugar un traspaso de propiedad de un activo fijo, un traspaso de fondos vinculado o condicionado a la adquisición o enajenación de un activo fijo, o la condonación de un pasivo por parte de un acreedor sin que se reciba a cambio una contrapartida.
Las transferencias de capital se dividen en i) las del gobierno general (que a su vez se subdividen en condonación de deudas y otras) y ii) las de otros sectores, haciéndose el desglose en transferencias de emigrantes, condonación de deudas y otras.
Cuenta financiera
La clasificación de los componentes de la cuenta financiera se basa en los siguientes criterios:
Todos los componentes se clasifican según la clase de inversión o haciéndose un desglose funcional (inversión directa, inversión de cartera, otra inversión).
income. The direct investment component is broken down into income on equity (dividends, branch profits and reinvested earnings) and income on debt (interest); portfolio investment income is broken down into income on equity (dividends) and income on debt (interest); other investment income covers interest earned on other capital (loans, etc.) and, in principle, imputed income to households from net equity in life insurance reserves and in pension funds.
Current transfers
Current transfers are distinguished from capital transfers, which are included in the capital and financial account in accordance with the SNA treatment of transfers. Transfers are the offsets to changes, which take place between residents and non-residents, in ownership of real resources or financial items and, whether the changes are voluntary or compulsory, do not involve a quid pro quo in economic value.
Current transfers include those of general government (e.g., current international cooperation between different Governments, payments of current taxes on income and wealth, etc.) and other transfers (e.g., workers’ remittances, premiums —less service charges— and claims on non- life insurance). Chapter XV of the Manual contains a full discussion of the distinction between current transfers and capital transfers.
Capital account
The major components of the capital account are capital transfers and acquisition/disposal of non-produced, non-financial assets. Capital transfers consist of those involving transfers of ownership of fixed assets; transfers of funds linked to, or conditional upon, acquisition or disposal of fixed assets; or cancellation, without any counterparts being received in return, of liabilities by creditors.
Capital transfers include two components: (i) general government, subdivided into debt forgiveness and other, and (ii) other, subdivided into migrants’ transfers, debt forgiveness, and other transfers.
Financial account
The classification of the components of the financial account is based on the following criteria:
All components are classified according to type of investment or by functional breakdown (direct investment, portfolio investment, other investment).
164 ECLAC, Statistical Yearbook for Latin America and the Caribbean, 2012
Para la categoría inversión directa se hace la distinción según la dirección (en el extranjero o en la economía declarante); para los componentes acciones y otras participaciones de capital y otro capital, dentro de esta categoría, se hace el desglose de activos y pasivos.
En inversión de cartera y otra inversión se hace la distinción habitual entre activos y pasivos. Cobra particular importancia en inversión de cartera y otra inversión la distinción por clases de instrumentos (títulos de participación en el capital, títulos de deuda, créditos comerciales, préstamos, moneda y depósitos, otros activos o pasivos). Se incluye en inversión de cartera los instrumentos tradicionales y nuevos del mercado monetario y otros instrumentos financieros básicos y derivados.
En inversión de cartera y otra inversión se hace la distinción por sectores de acreedores internos, en el caso de los activos, o por sectores de deudores internos, en el caso de los pasivos, a efectos de facilitar la vinculación con las cuentas de renta, la posición de inversión internacional, el SCN y otros sistemas estadísticos.
La distinción tradicional entre activos y pasivos a largo y a corto plazo, basada en un plazo contractual original de más de un año o de un año o menos, se efectúa solamente en otra inversión. En los últimos años, este desglose ha perdido importancia para muchas transacciones internas e internacionales; en consecuencia, tanto en el SCN como en el Manual de balanza de pagos se da menos importancia a la diferencia entre largo y corto plazo que en ediciones anteriores. Sin embargo, debido a que el vencimiento sigue siendo relevante para fines específicos —como el análisis de la deuda externa—, esta distinción se mantiene en el Manual de balanza de pagos para otra inversión.
Inversión directa es una categoría que refleja el interés duradero de una entidad residente de una economía (inversionista directo) en una entidad residente de otra economía (empresa de inversión directa), y abarca todas las transacciones entre inversionistas directos y empresas de inversión directa. Es decir, la inversión directa abarca la transacción inicial entre las dos partes y todas las transacciones subsiguientes que tienen lugar entre ellas y entre empresas filiales, constituidas o no en sociedad. Las transacciones de inversión directa (en el extranjero y en la economía declarante) se subclasifican en acciones y otras participaciones de capital, utilidades reinvertidas y otro capital (transacciones entre empresas afiliadas). En el caso de las acciones y otras participaciones de capital y de otro capital, se hace la distinción entre activos y pasivos frente a empresas filiales y frente a inversionistas directos. Las transacciones entre bancos filiales y entre otros intermediarios financieros filiales se limitan al capital en acciones y al que está relacionado con la deuda permanente.
Inversión de cartera comprende las transacciones en títulos de participación en el capital y títulos de deuda. Los
For the category of direct investment, there are directional distinctions (abroad or in the reporting economy) and, for the equity capital and other capital components within this category, asset/liability distinctions.
For the categories of portfolio investment and other investment, the customary asset/liability distinctions are made. Particularly significant for portfolio investment and other investment is the distinction by type of instrument (equity or debt securities, trade credits, loans, currency and deposits, other assets or liabilities). Traditional and new money market and other financial instruments and derivatives are included in portfolio investment.
For portfolio investment and other investment, there are distinctions by sector of the domestic creditor for assets and by sector of the domestic debtor for liabilities. These distinctions serve to facilitate links with the income accounts, the international investment position, the SNA and other statistical systems.
The traditional distinction between long- and short- term assets and liabilities, which is based on original contractual maturity of more than one year or one year or less, applies only to other investment. In recent years, the significance of this distinction has clearly diminished for many domestic and international transactions. Consequently, the long- and short-term distinction is accorded less importance in the SNA and in the Manual than in previous editions. However, because the maturity factor remains relevant for specific purposes —analysis of external debt, for example— it is retained in the Manual for other investment.
Direct investment, which reflects the lasting interest of a resident entity in one economy (direct investor) in an entity resident in another economy (direct investment enterprise), covers all transactions between direct investors and direct investment enterprises. Thus, direct investment covers the initial transaction between the two and all subsequent transactions between them and among affiliated enterprises, both incorporated and unincorporated. Direct investment transactions (abroad and in the reporting economy) are subclassified into equity capital, reinvested earnings and other capital (inter-company transactions). For equity capital and other capital, a distinction is made between claims on and liabilities to affiliated enterprises and to direct investors. Transactions between affiliated banks and between other affiliated financial intermediaries are limited to equity and permanent debt capital.
Portfolio investment covers transactions in equity securities and debt securities; the latter are subdivided into bonds and

CEPAL, Anuario Estadístico de América Latina y el Caribe, 2012 165
títulos de deuda están subdivididos en bonos y pagarés, instrumentos del mercado monetario e instrumentos financieros derivados (como las opciones), siempre que estos últimos generen activos y pasivos financieros. Se incluyen, asimismo, varios instrumentos financieros nuevos en las clasificaciones de instrumentos (se excluyen las transacciones clasificadas como inversión directa y activos de reserva).
Otra inversión incluye créditos comerciales a corto y largo plazo; préstamos, moneda y depósitos (transferibles y otros, como depósitos de ahorro y a plazo, acciones de asociaciones de ahorro y préstamo, acciones de cooperativas de crédito); otras cuentas por cobrar y por pagar (se excluyen las transacciones clasificadas como inversión directa y los pasivos que constituyen reservas de actividades extranjeras).
Errores y omisiones netos
Al aplicar los criterios recomendados en el Manual de balanza de pagos, se obtiene un conjunto coherente de asientos con signo positivo y negativo cuyo total neto es teóricamente igual a cero. En la práctica, sin embargo, una vez sumados todos los asientos, la balanza de pagos casi siempre arroja un crédito neto o un débito neto. Este saldo se debe a errores y omisiones en la compilación de las estadísticas, algunos de los cuales pueden tener relación con recomendaciones para una aproximación práctica a los criterios establecidos.
Por regla general, en el estado de balanza de pagos se presenta una partida separada de errores y omisiones netos, que algunos compiladores denominan partida equilibradora o discrepancia estadística, para compensar toda sobrestimación o subestimación de los componentes registrados. Así, si el saldo de estos componentes refleja un crédito, la partida de errores y omisiones netos aparece como un débito de igual valor, y viceversa.
Como algunos de los errores y omisiones que se producen al compilar los datos suelen compensarse entre sí, la magnitud de la partida residual no es necesariamente un indicio de la exactitud global del estado. Aun así, cuando el residuo neto es grande, es difícil interpretar un estado.
Reservas y partidas conexas
Las reservas y partidas conexas incluyen los activos de reserva, el uso del crédito y los préstamos del FMI y el financiamiento excepcional.
Los activos de reserva comprenden las transacciones de los activos que las autoridades monetarias de una economía consideran disponibles para atender necesidades de financiamiento de la balanza de pagos y, en algunos casos, otras necesidades. Tal disponibilidad, en principio, no guarda estrecha relación con criterios formales tales como los de propiedad o moneda de denominación. Esta categoría se divide en oro monetario, derechos especiales de giro (DEG), posición de reserva en el FMI, activos en divisas (moneda, depósitos y valores) y otros activos.
notes, money market instruments and financial derivatives (such as options) when the derivatives generate financial claims and liabilities. Various new financial instruments are covered under appropriate instrument classifications (transactions covered under direct investment and reserve assets are excluded).
Other investment covers short- and long-term trade credits, loans; currency and deposits (transferable and other —such as savings and term deposits, savings and loan shares, shares in credit unions, etc.); and other accounts receivable and payable. Transactions covered under direct investment and liabilities constituting foreign authorities’ reserves are excluded.
Net errors and omissions
Application of the principles recommended in the Manual should result in a consistent body of positive and negative entries with a net (conceptual) total of zero. In practice, however, when all actual entries are totalled, the resulting balance will almost inevitably show a net credit or a net debit. That balance is the result of errors and omissions in the compilation of statements. Some of the errors and omissions may be related to recommendations for practical approximation to principles.
In balance-of-payments statements, the standard practice is to show a separate item for net errors and omissions. Labelled by some compilers as a balancing item or statistical discrepancy, this item is intended as an offset to the overstatement or understatement of the recorded components. Thus, if the balance of those components is a credit, the item for net errors and omissions will be shown as a debit of equal value, and vice versa.
Usually, some of the errors and omissions that occur in the course of compilation offset one another. Therefore, the size of the residual item does not necessarily provide any indication of the overall accuracy of the statement. Nonetheless, interpretation of the statement is hampered by a large net residual.
Reserves and related items
Reserves and related items include reserve assets, use of Fund credit, loans from the Fund, and exceptional financing.
Reserve assets cover transactions in those assets which the monetary authorities of an economy consider to be available for use in meeting balance of payments and, in some instances, other needs. Such availability is not linked, in principle, to formal criteria such as ownership or currency of denomination. The items covered are monetary gold, SDRs, reserve position in the Fund, foreign exchange assets (currency, deposits and securities) and other claims.

166 ECLAC, Statistical Yearbook for Latin America and the Caribbean, 2012
Oro monetario: comprende las variaciones netas en las reservas de oro de la autoridad monetaria central.
Derechos especiales de giro (DEG): comprenden las variaciones netas en las tenencias de derechos especiales de giro.
Posición de reserva en el FMI: es la variación positiva del total de las compras que el país puede efectuar en el tramo de reserva más toda deuda del FMI contraída en virtud de un convenio de préstamo cuyo reembolso puede obtener fácilmente el país miembro.
Activos en divisas: comprenden los activos clasificados en el rubro “divisas” de la serie de datos sobre “liquidez internacional” publicada por el FMI en la publicación Estadísticas financieras internacionales.
Otros activos: incluye todos los demás activos que forman la categoría de activos de reserva.
La cobertura e identificación de los componentes de los activos de reserva están relacionadas con un concepto analítico; son en parte resultado de una decisión razonada y no siempre se prestan a la aplicación de criterios objetivos y formales ni a clasificaciones bien delimitadas respecto de la condicionalidad y otras consideraciones. A diferencia de la cuarta edición del Manual de balanza de pagos, en la quinta edición se excluyen las variaciones de valoración de los activos de reserva y sus contrapartidas. También se excluyen la asignación y cancelación de DEG, la monetización y desmonetización del oro y los asientos de contrapartida. Estas variaciones, que no constituyen transacciones, figuran en la posición de inversión internacional.
Uso del crédito y préstamos del FMI: incluye las compras y recompras en los tramos de crédito de la cuenta de recursos generales del FMI, y los empréstitos netos en el marco del servicio de ajuste estructural (SAE), el servicio reforzado de ajuste estructural (SRAE) y el fondo fiduciario.
El uso de los recursos del FMI está sujeto al principio relativo a la necesidad, el cual —conforme al Convenio Constitutivo del FMI— está vinculado a la posición de la balanza de pagos de un país miembro, a su posición de reserva o a la evolución de sus reservas. Para determinar la necesidad, se debe hacer una clara distinción entre: i) Las transacciones que figuran por encima de la línea
y que se consideran autónomas o que tienen su propia razón de ser y que de esa manera provocan o dan como resultado un déficit o superávit de pagos global, y
ii) Las que aparecen por debajo de la línea, consideradas acomodaticias o que financian dicho déficit o superávit. Aunque esa distinción entre grupos de transacciones entraña juicios subjetivos, presenta una medida del déficit o del superávit e indica las necesidades de financiamiento y/o los ajustes de política requeridos para corregir el desequilibrio.
Financiamiento excepcional: se refiere a las transacciones efectuadas por las autoridades para financiar necesidades de
Monetary gold covers net variations in the gold reserves of the central monetary authority.
Special drawing rights (SDRs) covers net variations in holdings of special drawing rights.
Reserve position in the Fund is the positive variation in total reserve tranche purchases that a member may draw upon plus any indebtedness of the Fund under loan agreements that are readily repayable to the member.
Foreign exchange assets covers claims that are shown as the foreign exchange component of the series for international liquidity published by the Fund in International Financial Statistics.
Other claims includes all claims not included in the above headings which constitute reserve assets.
The coverage and identification of reserve asset components are linked to an analytical concept, are in part judgmental, and are not always amenable to the application of objective, formal criteria or clear rankings as to conditionality or other considerations. In contrast to the treatment in the fourth edition of the Manual, valuation changes in reserve assets are excluded, along with counterparts to such changes, in the fifth edition. Also excluded are the allocation/cancellation of SDRs, the monetization/demonetization of gold, and counterpart entries. These changes, which do not constitute transactions, are reflected in the international investment position.
Use of Fund credit and loans from the Fund includes purchases and re-purchases of credit tranches in the Fund’s General Resources Account and net credits within the framework of the Structural Adjustment Facility (SAF), the Enhanced Structural Adjustment Facility (ESAF) and the Trust Fund.
The use of IMF resources is subject to a conceptual requirement of need, which —in accordance with the Articles of Agreement of the International Monetary Fund— is linked to a member country’s balance-of- payments position, its reserve position or changes in its reserves. The determination of need requires that a clear distinction be drawn between:(i) Above-the-line transactions that are considered to be
autonomous or to have been undertaken for their own sake and thus give rise to an overall payments deficit or surplus, and
(ii) Below-the-line items considered to be accommodating or financing the deficit or surplus. While such a distinction between groups of transactions involves a degree of judgment, it nonetheless presents a measure of the deficit or surplus and indicates financing needs and/or policy adjustments required to correct the imbalance.
Exceptional financing refers to transactions undertaken by the authorities for balance-of-payments reasons and includes

CEPAL, Anuario Estadístico de América Latina y el Caribe, 2012 167
balanza de pagos e incluye la obtención de recursos en préstamos del exterior, los atrasos de pagos y la condonación de deudas.
El concepto de financiamiento excepcional y su trato contable en la balanza de pagos ha evolucionado desde la publicación de la cuarta edición del Manual de balanza de pagos, cobrando en los últimos años cada vez más importancia para las operaciones, las estadísticas y los países miembros del FMI. Como alternativa, o en combinación con la utilización de los activos de reserva y el uso del crédito y préstamos del FMI, el financiamiento excepcional denota cualquier otro mecanismo empleado por las autoridades (u otros sectores inducidos por las autoridades) de una economía para financiar las necesidades de balanza de pagos.
En esta sección, dedicada a las estadísticas del sector externo, se presentan las cifras del comercio exterior de bienes y servicios. En relación con el comercio de bienes, los datos se compilaron sobre la base de las estadísticas oficiales del comercio exterior de los respectivos países registrados en el BADECEL. Los datos de las exportaciones de bienes están en valores FOB, mientras que los de las importaciones de bienes están en valores CIF, con excepción de las cifras correspondientes a México y Venezuela (República Bolivariana de) (cuyas importaciones se registran en valores FOB).
El total correspondiente al conjunto de la región (sin incluir a Haití, sobre el cual no se dispone de información), se calculó agrupando los datos por países.
Los valores de las exportaciones e importaciones totales al mundo están expresados en valor FOB e incluyen algunas correcciones como se menciona al inicio del punto 2.2, por lo que los totales no siempre coinciden con los extraídos del BADECEL.
Las cifras del comercio de servicios se desagregan según las principales categorías del quinto Manual de balanza de pagos del FMI, esto es transporte, viajes y otros servicios.
Clasificación de las exportaciones e importaciones de bienes
Exportaciones de productos primarios y manufacturadosLos datos que se presentan en esta sección del Anuario
se compilaron sobre la base de las estadísticas oficiales del comercio exterior de los respectivos países registrados en el BADECEL.
the procurement of resources in the form of external loans, payments arrears and debt forgiveness.
The concept of exceptional financing and the related balance-of-payments accounting treatment have evolved since the fourth edition of the Manual was published and have assumed increased importance for IMF operations, statistics and member countries in recent years. As an alternative to, or in conjunction with, the use of reserve assets, and of Fund credit and loans, exceptional financing denotes any other arrangements made by authorities (or by other sectors fostered by authorities) of an economy to cover balance-of payments requirements.
�2.2.2 Comercio exterior de bienes
y servicios2.2.2 External trade of goods
and services
This section on external sector statistics presents the figures relating to external trade of goods and services. In relation to trade in goods, the data were compiled on the basis of official foreign trade statistics of the relevant countries listed in the Foreign Trade Data Bank for Latin America and the Caribbean (BADECEL). The data on the export of goods are given on an f.o.b. basis while imports of goods are quoted on a c.i.f. basis, with the exception of the figures for the Bolivarian Republic of Venezuela and Mexico (whose imports are recorded f.o.b.).
The total for the region as a whole (excluding Haiti, for which no information is available) was obtained by grouping data by country.
Total values for worldwide exports and imports are expressed on an f.o.b. basis and include some adjustments as noted at the beginning of section 2.2, which accounts for the fact that the totals do not always match those taken from BADECEL.
The figures of trade in services are broken down in accordance with the main categories contained in the fifth edition of the IMF Balance of Payments Manual; i.e., transport, travel and other services.
Classification of exports and imports of goods
Exports of primary products and manufacturesThe data given in this section of the Yearbook were
compiled on the basis of official foreign trade statistics of the respective countries registered in BADECEL.

168 ECLAC, Statistical Yearbook for Latin America and the Caribbean, 2012
El criterio adoptado para clasificar tanto los productos primarios como los manufacturados corresponde al que utiliza la División de Estadística de las Naciones Unidas para presentar los datos del comercio exterior mundial por regiones económicas. Para ello se agrupan las secciones de la CUCI modificada de la manera siguiente:
A. Productos primarios
Comprende el total de las secciones:
0. Productos alimenticios y animales vivos
1. Bebidas y tabaco
2. Materiales crudos no comestibles, excepto los combustibles
3. Combustibles y lubricantes, minerales y productos conexos
4. Aceites, grasas y ceras de origen animal y vegetal
9. Mercancías y operaciones no clasificadas en otro rubro de la CUCI.
Se incluye además el capítulo 68 denominado metales no ferrosos.
B. Productos manufacturados
Comprende el total de las secciones:
5. Productos químicos y conexos, n.e.p.
6. Artículos manufacturados, clasificados principalmente según el material (excluido el capítulo 68: metales no ferrosos)
7. Maquinaria y equipo de transporte
8. Artículos manufacturados diversos
Las importaciones de bienes se presentan según las tres clases básicas del SCN. El criterio para definir esta clasificación se basa en la reestructuración parcial de las 19 categorías de las Grandes Categorías Económicas (GCE) de las Naciones Unidas7. Así, se obtienen totales aproximados de los bienes de capital, los bienes intermedios y los bienes de consumo. Por otra parte, dada la importancia que tienen en el comercio internacional se presentan separadamente los carburantes para motores (categoría 321*8) y los vehículos automotores de pasajeros (categoría 51*). Se excluye la gran categoría 7, “Bienes no especificados en otra partida”, por
7 Naciones Unidas, Clasificación por Grandes Categorías Económicas, serie M, Nº 53, Nueva York, 1971.
8 Las referencias a la clasificación en GCE se señalan con un asterisco para evitar el riesgo de confusión con las secciones, capítulos y grupos numerados de la CUCI, modificada.
The criterion adopted for classifying both primary products and manufactured goods is that used by the United Nations Statistics Division in presenting world foreign trade data by economic regions. For this purpose, the sections of the Standard International Trade Classification (SITC) have been used, modified as follows:
A. Primary products
This group includes all the products in the following sections:
0. Food and live animals chiefly for food
1. Beverages and tobacco
2. Crude materials, non-edible, except fuels
3. Mineral fuels, lubricants and related materials
4. Animal and vegetable oils, fats and waxes
9. Commodities and transactions not classified elsewhere in the SITC.
Division 68 —non-ferrous metals— is also included.
B. Manufactured goods
This group includes all the products in the following sections:
5. Chemicals and related products, n.e.c.
6. Manufactured goods classified chiefly by material (excluding division 68: non-ferrous metals)
7. Machinery and transport equipment
8. Miscellaneous manufactured articles
Imports of goods are presented according to the three basic classes used in the System of National Accounts (SNA). The approach used in defining this classification was based on a partial reorganization of the 19 categories of the United Nations Classification by Broad Economic Categories.7 On this basis, approximate totals have been obtained for capital goods, intermediate goods and consumer goods. In view of the important role in international trade played by motor spirit (category 321*8) and passenger motor cars (category 51*), these categories are presented separately. Broad category 7, “Goods not elsewhere specified,” is not
7 United Nations, Classification by Broad Economic Categories, series M, No. 53, New York, 1971.
8 References to the Classification by Broad Economic Categories are marked with an asterisk to eliminate the risk of confusion with the numbered sections, divisions and groups of SITC, revised.

CEPAL, Anuario Estadístico de América Latina y el Caribe, 2012 169
no ser considerada en ninguna de las tres clases básicas que se definen a continuación:
1. Bienes de capital
Suma de categorías: 41* Bienes de capital (excepto el equipo de transporte)
521* Material de transporte, industrial
2. Bienes intermedios
Suma de categorías:121* Alimentos y bebidas, elaborados, destinados
principalmente a la industria111* Alimentos y bebidas, básicos, destinados
principalmente a la industria2* Suministros industriales no especificados en otra
partida31* Combustibles y lubricantes, básicos322* Combustibles y lubricantes, elaborados (excluidos
los carburantes)42* Piezas y accesorios para maquinaria y otro equipo
de capital (excepto el equipo de transporte)53* Piezas y accesorios para equipo de transporte
3. Bienes de consumo
Suma de categorías:112* Alimentos y bebidas, básicos, destinados
principalmente al consumo en los hogares122* Alimentos y bebidas, elaborados, destinados
principalmente al consumo en los hogares522* Material de transporte no industrial6* Artículos de consumo no especificados en otra
partidaEn cuanto a las exportaciones, además de la presentación
tradicional en que se consideran dos grandes grupos definidos según la CUCI como productos primarios y productos manufacturados, se ha incluido información según la Clasificación Industrial Internacional Uniforme de todas las actividades económicas (CIIU, Rev. 2). Estas estadísticas tienen por objeto ilustrar las transacciones comerciales de acuerdo con las tres grandes divisiones (1 dígito) de la CIIU, Rev. 2, vinculadas con los bienes transportables, que son: Gran división 1. Agricultura, caza, silvicultura y pesca; Gran división 2. Explotación de minas y canteras, y Gran división 3. Industrias manufactureras.
Las grandes divisiones 1 y 2 figuran individualmente como un todo. En cambio, en el caso de la gran división 3, se ha preferido presentar estadísticas que reflejen en forma más específica la clase de actividad económica que genera los bienes; en consecuencia, se han creado cuatro categorías agregándose las siguientes agrupaciones (3 dígitos):
included since it is not covered by any of the three basic SNA categories, which are defined as follows:
1. Capital goods
Sum of categories: 41* Machinery and other capital equipment (except transport) 521* Transport equipment, industrial
2. Intermediate goods
Sum of categories:121* Food and beverages, processed, mainly for
industry111* Food and beverages, primary, mainly for
industry2* Industrial supplies not elsewhere specified
31* Fuels and lubricants, primary322* Fuels and lubricants, processed (other than motor
spirit)42* Parts and accessories for machinery and other
capital equipment (except transport equipment)53* Parts and accessories for transport equipment
3. Consumer goods
Sum of categories:112* Food and beverages, primary, mainly for home
consumption122* Food and beverages, processed, mainly for home
consumption522* Non-industrial transport equipment6* Consumer goods not elsewhere specified
In the case of exports, in addition to their presentation in the traditional format, which distinguishes between two broad groups defined, on the basis of SITC, as primary products and manufactured products, data organized on the basis of the International Standard Industrial Classification of All Economic Activities (ISIC, Rev. 2) have also been included. These statistics are intended to provide information about commercial transactions in terms of the three ISIC, Rev. 2, major divisions (1 digit), relating to transportable goods, which are: Major Division 1: Agriculture, Hunting, Forestry and Fishing; Major Division 2: Mining and Quarrying, and Major Division 3: Manufacturing.
Major Divisions 1 and 2 each appear as one unit. In the case of Major Division 3, however, it has been deemed appropriate to prevent statistics which provide a more specific indication of the class of economic activity that generates the goods; thus, four categories have been created by aggregating the following groups (three digits):

170 ECLAC, Statistical Yearbook for Latin America and the Caribbean, 2012
Industria de alimentos, bebidas y tabaco
311-312 Fabricación de productos alimenticios, excepto bebidas 313 Industria de bebidas
314 Industria del tabaco
Otras industrias, principalmente de bienes de consumo no duraderos
321 Fabricación de textiles 322 Fabricación de prendas de vestir, excepto
calzado 323 Industria del cuero y productos de cuero, y
sucedáneos de cuero y pieles, excepto el calzado y otras prendas de vestir
324 Fabricación de calzado, excepto el de caucho vulcanizado o moldeado o de plástico
332 Fabricación de muebles y accesorios, excepto los que son principalmente metálicos
342 Imprentas, editoriales e industrias conexas 390 Otras industrias manufactureras
Industrias, principalmente de bienes intermedios
331 Industria de la madera y productos de madera y de corcho, excepto muebles
341 Fabricación de papel y productos de papel 351 Fabricación de sustancias químicas industriales 352 Fabricación de otros productos químicos 353 Refinerías de petróleo 354 Fabricación de productos diversos derivados
del petróleo y del carbón 355 Fabricación de productos de caucho 356 Fabricación de productos de plástico, n.e.p. 361 Fabricación de objetos de barro, loza y
porcelana 362 Fabricación de vidrio y productos de vidrio 369 Fabricación de otros productos minerales no
metálicos 371 Industrias básicas de hierro y acero 372 Industrias básicas de metales no ferrosos
Industrias metalmecánicas
381 Fabricación de productos metálicos, exceptuando maquinaria y equipo
382 Construcción de maquinaria, exceptuando la eléctrica
383 Construcción de maquinaria, aparatos, accesorios y suministros eléctricos
384 Construcción de material de transporte 385 Fabricación de equipo profesional y científico,
instrumentos de medida y de control n.e.p., y aparatos fotográficos e instrumentos de óptica
Manufacture of food, beverages and tobacco
311-312 Food manufacturing, except beverages
313 Beverage industries 314 Tobacco manufactures
Other manufacturing, mainly of non-durable consumer goods
321 Manufacture of textiles 322 Manufacturing of wearing apparel, except
footwear 323 Manufacture of leather and products of leather,
leather substitutes and fur, except footwear and wearing apparel
324 Manufacture of footwear, except vulcanized or moulded rubber or plastic footwear
332 Manufacture of furniture and fixtures, except primarily of metal
342 Printing, publishing and allied industries
390 Other manufacturing industries
Manufacturing, mainly of intermediate goods
331 Manufacture of wood and wood and cork products, except furniture
341 Manufacture of paper and paper products 351 Manufacture of industrial chemicals 352 Manufacture of other chemical products 353 Petroleum refineries 354 Manufacture of miscellaneous products of
petroleum and coal 355 Manufacture of rubber products 356 Manufacture of plastic products, n.e.c. 361 Manufacture of pottery, china and earthenware
362 Manufacture of glass and glass products 369 Manufacture of other non-metallic mineral
products 371 Iron and steel basic industries 372 Non-ferrous metal basic industries
Manufacture of fabricated metal products, machinery and equipment 381 Manufacture of fabricated metal products, except
machinery and equipment 382 Manufacture of machinery except electrical
383 Manufacture of electrical machinery, apparatus, appliances and supplies
384 Manufacture of transport equipment 385 Manufacture of professional and scientific, and
measuring and controlling equipment, n.e.c. and of photographic and optical goods

CEPAL, Anuario Estadístico de América Latina y el Caribe, 2012 171
Cabe señalar que la cobertura de la información que se presenta —según la CIIU, Rev. 2— acerca de Barbados, Belice, Dominica, Jamaica, Panamá y Trinidad y Tabago no es completa, debido a que estos países no disponen en algunos casos de datos lo suficientemente desagregados según la CUCI, lo que impide establecer una adecuada correlación con la CIIU, Rev. 2.
De este modo, por una parte se ha procurado introducir una clasificación universal, apta para el análisis económico desde el punto de vista del uso que se da a los bienes importados y por otra, brindar información básica para examinar la evolución de la estructura de las exportaciones de bienes según el origen de la actividad que los genera, fenómeno que en buena medida refleja el progreso tecnológico de un país.
Además, para dar una concepción más amplia de los principales productos de exportación de cada país, se han seleccionado los diez más importantes según la magnitud de su valor. Estos pueden ser variables de un año a otro, en la medida que se produzcan importantes cambios en los volúmenes y en los precios relativos de las exportaciones o que aparezcan nuevos productos exportables que desplacen a los seleccionados anteriormente.
�2.2.3 Indicadores del sector
externo
Los índices del comercio exterior con base en el año 2005 cubren los bienes y los servicios y son el resultado del trabajo efectuado en la División de Estadística y Proyecciones Económicas de la CEPAL en 2005 con motivo del cambio de año base de las series estadísticas que publica la Comisión.
Índices del comercio de bienes
En el caso de las exportaciones e importaciones de bienes se calcularon los índices de valor (IVX, IVM), de volumen (IQX, IQM) y de valor unitario (IVUX, IVUM).
La información utilizada proviene del BADECEL, de fuentes nacionales (bancos centrales o institutos de estadística) y de fuentes internacionales como organizaciones especializadas y organismos internacionales (División de Estadística de las Naciones Unidas, Conferencia de las Naciones Unidas sobre Comercio y Desarrollo (UNCTAD), FMI, Banco Mundial y Organización de Países Exportadores de Petróleo (OPEP)).
Índices de valor
Los índices de valor se calcularon a partir de las series expresadas en dólares corrientes de las exportaciones e importaciones de bienes registradas en la balanza de pagos. Xt MtIVX = 100 * IVM = 100 * Xo Mo
For Barbados, Belize, Dominica, Jamaica, Panama and Trinidad and Tobago, the coverage of the information presented —according to ISIC, Rev. 2— is incomplete because not all of the data for these countries are sufficiently disaggregated according to SITC, and therefore cannot be properly correlated with ISIC, Rev. 2.
By this means, an attempt has been made, on the one hand, to introduce a universal system of classification geared to the purposes of economic analysis from the standpoint of the use to which merchandise imports are put and, on the other hand, to provide basic information for use in examining trends in the structure of merchandise exports in terms of the activity that produces them, which to a large extent reflects the technological progress made in a country.
In addition, in order to provide a broader picture of the main exports of each country, the 10 exports which were most important in terms of value have been selected. These may vary from year to year as major changes occur in export volumes and relative prices or as new exportable products overshadow those selected previously.
2.2.3 External sector indicators
External trade indices with 2005 as the base year cover goods and services and are the result of calculations produced in 2005 by the Statistics and Economic Projections Division of ECLAC to reflect the change in the base year used in the statistical series published by the Commission.
Indices of trade in goods
In the case of exports and imports of goods, the value indices (VIX, VIM), volume indices (QIX, QIM) and unit value indices (XUVI, MUVI) were calculated.
The information used was taken from the External Trade Data Bank for Latin America and the Caribbean (BADECEL), national sources (central banks or statistical institutes) and international sources, such as specialized agencies and international bodies (United Nations Statistical Division, UNCTAD, IMF, World Bank and the Organization of Petroleum Exporting Countries (OPEC)).
Value indices
Value indices were based on the series expressed in current dollars of exports and imports of goods recorded in the balance of payments. Xt MtVIX = 100 * VIM = 100 * Xo Mo

172 ECLAC, Statistical Yearbook for Latin America and the Caribbean, 2012
donde “X” y “M” son respectivamente las exportaciones y las importaciones de bienes; “t” el año corriente; y, “o” el año base (al efecto, 2005).
Índices de valor unitario
Los índices de valor unitario se calcularon a partir de la información registrada en el BADECEL y, en casos particulares, de fuentes nacionales; son índices tipo Paasche, esto es:
Pxt*Qxt Pmt*QmtIVUX = 100 * IVUM = 100 * Pxo*Qxt Pmo*Qmt
donde Pxt y Pmt son los precios en el período t de las canastas de exportación e importación, respectivamente; Qxt y Qmt son los volúmenes exportados e importados en el período t.
Se construyeron muestras de bienes exportados e importados para los períodos 1970-1989 y 1990-2004 con año base 1980 y 2000, respectivamente, con el propósito de reflejar los cambios en la estructura de comercio a través del tiempo.
En el proceso se presentaron casos en los que la información del BADECEL tuvo que complementarse con información adicional pues en algunos países una parte considerable del comercio no se registra ni contabiliza en los registros administrativos, ya sea por la existencia de zonas francas, por el comercio de maquila o por el contrabando. Por otra parte, existen partidas significativas en el volumen de comercio de algunos países para los que no se cuenta con información sobre su volumen por lo que se utilizaron precios internacionales representativos.
Índices de volumen
Los índices de volumen (IQ) se obtienen deflactando las series en valores corrientes por los índices de valor unitario.
Xt/IVUXt Mt/IVUMtIQX = 100* IQM = 100* Xo/IVUXo Mo/IVUMo
Índices deflactores de servicios
La desagregación de los servicios en precio y cantidad es una tarea compleja pues generalmente no se dispone de datos que permitan calcular estos índices. Sin embargo, dado el interés que reviste este tipo de análisis, en la CEPAL se calculan deflactores para el comercio internacional de servicios.
Los índices de valor unitario de servicios calculados por la CEPAL tienen como año base 2005 y se desagregan según el esquema analítico de la quinta edición del Manual de balanza de pagos del FMI en transporte, viajes y otros servicios. Esto plantea la aplicación de una metodología particular según la naturaleza del servicio.
where “X” and “M” represent exports and imports of goods, respectively, “t” represents the current year and “o”, the base year (in this instance, 2005).
Unit value indices
The unit value indices were based on information recorded in BADECEL and, in particular cases, on national sources; they are Paasche-type indices, that is:
Pxt*Qxt Pmt*QmtXUVI = 100 * MUVI = 100 * Pxo*Qxt Pmo*Qmt
where Pxt and Pmt are the prices in period t of the export and import baskets, respectively, and Qxt and Qmt are the volumes exported and imported during period t.
Samples of goods exported and imported were constructed for the periods 1970-1989 and 1990-2004 with base year 1980 and 2000, respectively, in order to reflect the changes in trade structure over time.
In the process, cases arose in which the data from BADECEL had to be supplemented with additional information, as in some countries a substantial proportion of trade is not recorded and accounted for in the administrative registers, either because of the existence of free zones or maquila trade, or as a result of smuggling. Moreover, some countries lack data on the volume of trade in significant items, for which proxy international prices are used.
Volume indices
Volume indices (QI) are obtained by deflating the series in current values with the unit value indices.
Xt/XUVIt Mt/MUVItQIX = 100* QIM = 100* Xo/XUVIo Mo/MUVIo
Deflator indices for services
It is difficult to disaggregate services into price and quantity, since data for calculating such indices are not usually available. Nevertheless, in view of the interest in this type of analysis within ECLAC, deflators have been calculated for the international trade in services.
Unit value indices for services calculated by ECLAC use 2005 as the base year and are broken down, in line with the analytical method set out in the fifth edition of the IMF Balance of Payments Manual, into transport, travel and other services. This calls for the application of a particular methodology, depending on the nature of the service.
CEPAL, Anuario Estadístico de América Latina y el Caribe, 2012 173
Transporte
En el caso del transporte, se utilizan varias fuentes de información y se desagrega en transporte marítimo, aéreo y otros. En el caso del transporte marítimo se utiliza la información de fletes publicada en Review of Maritime Transport de la UNCTAD, donde además se distinguen las tarifas por tipo de flete (liner, charter o tanker). Se aplican los índices de precios según el tipo de bienes comercializados por cada país, y se distingue entre productos básicos, manufacturados y petróleo. En el caso del transporte aéreo, se utilizan índices de precios publicados por la Organización de Aviación Civil Internacional (OACI) e índices de pasajes aéreos publicados por el Departamento de Comercio de los Estados Unidos.
Viajes
El valor que se registra en los créditos de viajes fue deflactado por un índice que incorpora la inflación interna y la variación del tipo de cambio nominal de los países. El valor registrado en débitos de viajes fue deflactado por un índice que comprende la inflación y la variación del tipo de cambio nominal de los países industrializados y los países receptores de turismo.
Las fuentes de información para estas estimaciones son los índices de precios al consumidor que calculan los países, el tipo de cambio nominal medio de la moneda local respecto del dólar que publica el FMI en el tipo de cambio rf.
Otros servicios
En lo que se refiere al rubro otros servicios, los créditos se deflactaron por el mismo índice de los créditos de viajes mientras que el valor de los débitos se deflactó por el índice de precios al por mayor de los países industrializados.
De esta manera se obtuvieron series en valores constantes e índices de volumen (año base 2005=100,0) para el total de servicios.
Índices deflactores de servicios de factores y transferencias
Para completar el cálculo de la cuenta corriente a precios constantes se utilizó el índice implícito de las importaciones de bienes y servicios como deflactor del saldo de la renta de factores y de las transferencias corrientes.
Relación de precios del intercambio
La relación de precios del intercambio se define como: IVUXTT = 100* IVUM
Se pueden calcular los índices de términos del intercambio ya sea para bienes como para el agregado de bienes y servicios.
Transport
In the case of transport, various sources of information are used and the data broken down into maritime, air and other transport. In the case of maritime transport, the freight information used is taken from the UNCTAD Review of Maritime Transport, which also distinguishes between rates per type of freight arrangement (liner, charter or tanker). The price indices used depend on the type of goods marketed by each country, with distinctions between commodities, manufactured goods and oil. In the case of air transport, price indices published by the International Civil Aviation Organization and air passage indices published by the United States Department of Commerce are used.
Travel
The value for travel credits was deflated by an index that incorporates countries’ domestic inflation and the variation in their nominal exchange rate. The value for travel debits was deflated by an index based on inflation and the variation in the nominal exchange rate in the industrialized countries and the tourism-receiving countries.
The sources of information for these estimates are the consumer price indices calculated by the countries and the average nominal exchange rate of the local currency against the United States dollar, as published by IMF under the exchange-rate rf series.
Other services
With respect to the category “other services”, the credits are deflated by the same index as the travel credits, while the value of debits was deflated using the wholesale price index of the industrialized countries.
In this way, series in constant values and volume indices (base year 2005=100.0) were obtained for total services.
Deflator indices of factor services and transfers
In order to complete the current account calculation at constant prices, the implicit index of imports of goods and services was used as a deflator for the factor income and current transfers balances.
Terms of trade
The terms of trade are defined as:
XUVITT = 100* MUVI
Terms of trade indices may be calculated either for goods or for the aggregate of goods and services.

174 ECLAC, Statistical Yearbook for Latin America and the Caribbean, 2012
La deflación de las variables de la cuenta corriente mediante distintos índices exige introducir una variable de ajuste para conciliar dicha cuenta a precios constantes. Convencionalmente, esta variable se denomina efecto de la relación de precios del intercambio; su exacta definición depende, obviamente, del tipo de deflactores que se apliquen a las transacciones de la cuenta corriente. En el ejercicio que se presenta se adoptó el índice implícito de las importaciones de bienes y servicios para deflactar las variables financieras y las transferencias corrientes. Por consiguiente, el efecto de la relación de intercambio se expresa en la siguiente fórmula:
IVUXbysERI = XBS vcte * [ -1] IVUMbys
Donde:ERI: efecto de la relación de precios del intercambio XBSvcte: exportaciones de bienes y servicios a precios constantes IVUXbys: índice de valor unitario de exportaciones de bienes y serviciosIVUMbys: índice de valor unitario de importaciones de bienes y servicios
En esta ecuación, el efecto de la relación de precios del intercambio teóricamente mide el volumen de importaciones que podría financiarse con el valor de una unidad de exportaciones a precios del año base. Por su parte, el volumen total de importaciones que puede financiarse con el volumen total de las exportaciones (XBSvcte* [IVUXbys / IVUMbys]) se define como el poder de compra de las exportaciones. Puede deducirse, por lo tanto, que el efecto de la relación del intercambio es igual a la diferencia entre el poder de compra de las exportaciones y el volumen efectivamente exportado. Así pues, ambas variables son equivalentes solo en el caso en que la relación de precios del intercambio es igual a la unidad.
Cálculo del índice de precios de los productos básicos de exportación de América Latina y el Caribe
Para el cambio de año base de los índices de precios de los productos básicos se estableció una canasta de productos básicos representativa de las exportaciones de los países de América Latina y el Caribe. En efecto, se consideraron las exportaciones de la región para 2005 tomando en cuenta los siguientes países: Anguila, Antigua y Barbuda, Argentina, Aruba, Bahamas, Barbados, Belice, Bolivia (Estado Plurinacional de), Brasil, Chile, Colombia, Costa Rica, Cuba, Dominica, Ecuador, El Salvador, Granada, Guatemala, Guyana, Haití, Honduras, Jamaica, México, Nicaragua, Panamá, Paraguay, Perú, República Dominicana, Suriname, Trinidad y Tabago, Uruguay y Venezuela (República Bolivariana de), así como la disponibilidad de cotizaciones internacionales de los productos seleccionados.
Para armar la canasta de referencia se recurrió al COMTRADE, una base de datos de comercio exterior que contiene información sobre exportaciones de bienes
In order to deflate current account variables using different indices, an adjustment variable must be introduced to reconcile that account at constant prices. Traditionally, this variable is labelled the terms of trade effect; obviously, its exact definition depends on the type of deflators that are applied to the current account transactions. In the exercise presented, the implicit index of imports of goods and services was used to deflate the financial variables and current transfers. Accordingly, the terms of trade effect is expressed in the following formula:
XUVIg&sETT = XGS vct * [ -1] MUVIg&s
Where:ETT is the effect of the terms of trade XGSvct are exports of goods and services at constant pricesXUVIg&s is the export unit value index of goods and servicesMUVIg&s is the import unit value index of goods and services
In this equation, the terms of trade effect theoretically measures the volume of imports that could be financed with the value of one unit of exports in base year prices. In turn, the total volume of imports that could be financed with the total volume of exports (XGSvct* [XUVIg&s / MUVIg&s]) is defined as the purchasing power of exports. It may therefore be inferred that the terms of trade effect is equal to the difference between the purchasing power of exports and the volume actually exported. Thus, the two variables are equivalent only with unitary terms of trade.
Calculation of the price index for the export commodities of Latin America and the Caribbean
For the change in the base year for commodity price indices, a representative basket of commodity exports was constructed for the countries of Latin America and the Caribbean. The region’s exports for 2005 were used as the basis, for the following countries and territories: Anguilla, Antigua and Barbuda, Argentina, Aruba, Bahamas, Barbados, Belize, Bolivarian Republic of Venezuela, Brazil, Chile, Colombia, Costa Rica, Cuba, Dominica, Dominican Republic, Ecuador, El Salvador, Grenada, Guatemala, Guyana, Haiti, Honduras, Jamaica, Mexico, Nicaragua, Panama, Paraguay, Peru, Plurinational State of Bolivia, Suriname, Trinidad and Tobago and Uruguay, in addition to the availability of international market prices for the selected goods.
In assembling the basket of goods, reference was made to the United Nations Commodity Trade Statistics database (COMTRADE), an external trade database containing
CEPAL, Anuario Estadístico de América Latina y el Caribe, 2012 175
(FOB) e importaciones de bienes (CIF) según distintas clasificaciones.
Se sumaron todas las partidas correspondientes a una misma definición ordenadas de mayor a menor, según el valor de las exportaciones. Para determinar los principales productos de exportación hubo que recurrir a aproximaciones, debido a la diversidad de tipos de un mismo producto, como en el caso del café. Para obtener los precios de los distintos productos básicos, se consideró la cotización internacional publicada por organismos como la UNCTAD, el FMI, el Banco Mundial y la OPEP.
Para el cálculo, se logró definir un número de 44 productos que, en conjunto, cubren el 47% de las exportaciones totales de América Latina y el Caribe en 2005. Además de estos productos, se identificaron otros productos para los cuales no se cuenta con cotizaciones internacionales y que representan un 10% de las exportaciones totales. Finalmente, se estableció una canasta distinta de productos manufacturados que tiene una ponderación del 43% sobre el total de exportaciones de bienes de la región.
Índice de precios de los productos básicos
Los índices se calculan a partir de las series de precios de productos básicos según información proporcionada por diferentes organismos internacionales y agencias especializadas.
IPPB= Precio PBi/Precio PBo(o: año base 2005)
El índice de precios del conjunto seleccionado de bienes de exportación de América Latina y el Caribe refleja la tendencia de las cotizaciones en el mercado mundial de los productos básicos de la región.
El índice utiliza la fórmula de Laspeyres según los ponderadores de la canasta base que corresponden al valor exportado por la región de cada uno de los productos considerados, expresados como porcentaje del total de los 44 productos. Es decir, el valor total de los 44 productos se hace igual a 100 y se calcula la participación de cada producto considerado en el valor total de la muestra.
�2.2.4 Financiamiento y deuda
externa
Las cifras que se presentan en esta sección corresponden a las siguientes definiciones:
Deuda externa total: comprende el total de la deuda pública externa, la deuda privada garantizada por el sector público
information on goods exports (f.o.b.) and goods imports (c.i.f.) classified in a number of ways.
All items corresponding to a given definition were added together, in decreasing order of export value. Approximations had to be used in determining the principal export products, owing to the diversity of types within a given product, as in the case of coffee. To obtain the prices of the various commodities, international prices published by bodies such as UNCTAD, IMF, the World Bank and OPEC were taken into account.
Definitions were produced of a group of 44 products which, as a whole, make up 47% of the total exports of Latin America and the Caribbean for 2005. In addition, other products were identified for which international prices are not available and which represent 10% of total exports. Lastly, a separate basket of manufactured products was established, accounting for 43% of total goods exports for the region.
Commodity price index
The indices are calculated on the basis of commodity price series according to information from various international bodies and specialized agencies.
CMP= CMi price/CMo price(o: base year 2005)
The price index for the selected set of Latin American and Caribbean export goods shows the price trend on world markets for commodities from the region.
The index uses the Laspeyres formula according to the weighting factors of the basic basket which, for each of the products considered, correspond to the value exported by the region, expressed as a percentage of the total for the 44 products. That is, the total value of the 44 products is made equal to 100 and the proportion of each product in the total value of the sample is calculated.
2.2.4 Financing and external debt
The figures reported in this section correspond to the following definitions:
Total external debt comprises the total external public debt, publicly guaranteed private-sector debt, and medium-,

176 ECLAC, Statistical Yearbook for Latin America and the Caribbean, 2012
y la deuda privada de mediano, largo y corto plazo, más la deuda con el FMI.
Transferencia neta de recursos: equivale al ingreso neto de capitales (autónomos y no autónomos) más (+) errores y omisiones, menos (-) las utilidades e intereses netos, estos últimos en términos devengados.
Renta neta: se refiere al saldo entre créditos y débitos de renta.
Inversión extranjera directa neta: incluye la inversión directa en el extranjero y la inversión directa en la economía declarante.
Tenencia de reservas internacionales: constituye una categoría especial de capital que trata de reflejar en forma aproximada la liquidez internacional de un país en un determinado momento teniendo en cuenta los criterios básicos que son el “control efectivo” y la “disponibilidad de uso” de los activos. Al respecto, el FMI recomienda adoptar como criterio de control efectivo que “los únicos activos que se clasifican como parte de las reservas son los activos sobre el exterior que efectivamente pertenezcan a las autoridades centrales”; sin embargo, no se descartan situaciones en que ese control pudiera ampliarse mediante políticas monetarias para estimular una colaboración del sector privado en esta materia.
Según el criterio de disponibilidad de uso (posibilidad de que las autoridades que posean los activos puedan disponer de ellos de inmediato), el oro, los DEG y las posiciones de reservas en el FMI constituyen la máxima forma de liquidez. Sin embargo, este se considera un enfoque excesivamente riguroso en la definición de las reservas. Un criterio más flexible consiste en examinar si existe un razonable grado de seguridad de que, en caso necesario, se pueda contar con las condiciones para utilizar el activo en la institucionalidad vigente.
En resumen, no hay una definición rígida del concepto de reservas. En todo caso, cabe señalar que el concepto de reservas en los cuadros sobre “tenencias” incluye el oro monetario, los DEG, la posición de reserva en el FMI y las divisas.
Debido a los problemas de definición de las reservas internacionales mencionados y a la valorización del oro, los niveles de tenencias de reservas publicados en otras fuentes no se consideran estrictamente comparables con las cifras publicadas en este Anuario.
La porción de oro de las reservas publicadas en este Anuario se valora uniformemente a los precios en Londres al final de cada año. Asimismo, las tenencias de reservas a finales de cada año se expresan también en función del número de meses de importaciones de bienes y servicios que podrían financiarse con ellas, considerando el valor medio de las importaciones de cada año.
long- and short-term private debt, plus debt owed to the International Monetary Fund (IMF).
Net transfer of resources is equivalent to net capital inflows (autonomous and non-autonomous) plus (+) errors and omissions, less (-) net earnings and interest (calculated on an accrual basis).
Net income refers to the balance between credits and debits on the income account.
Net foreign direct investment includes direct investment abroad and direct investment in the reporting economy.
International reserve holdings constitute a special category of capital intended to provide an approximate indication of a particular country’s international liquidity at a given time, bearing in mind the basic criteria of effective control and availability for use. In this regard, IMF recommends that the question of effective control be based on the criterion that “only foreign claims actually owned by the central authorities would be found to form part of the reserves”, although it is recognized that there may be situations where such control could be broadened by means of monetary policies designed to elicit the collaboration of the private sector in this respect.
Using the criterion of “availability for use” (i.e., the possibility that the authorities possessing the assets can make use of them immediately), gold, special drawing rights (SDR) and IMF reserve positions are the most unconditional form of liquidity. However, this is considered to be an excessively rigorous criterion for the definition of reserves. A more flexible approach is to consider whether there is a reasonable degree of certainty that, should the need arise, the necessary conditions for using the asset within the existing institutional structure could be satisfied.
In sum, there is no strict definition of the concept of reserves. In the case at hand, it should be noted that the concept of reserves used in the tables on “holdings” includes monetary gold, SDRs, IMF reserve position and foreign exchange.
Owing to these problems in defining international reserves and to the valuation of gold, the levels of reserve holdings published in other sources are not considered to be strictly comparable with the figures published in the Yearbook.
The gold portion of the reserves published in this Yearbook is uniformly valued at the London price at the end of each year. In addition, the reserve holdings at the end of each year are also expressed in terms of the number of months of imports of goods and services that they would finance, based on the mean value of imports in each year.

CEPAL, Anuario Estadístico de América Latina y el Caribe, 2012 177
�2.3 Precios
Índices de precios al consumidor. Representan en general el nivel, relativo al período base (igual a 100), de una canasta representativa de bienes y servicios adquirida por un hogar medio. Con respecto a los países que calcularon sus índices de precios al consumidor con una base distinta a la de 2005, se procedió a uniformar la base utilizando un procedimiento aritmético. Así pues, las series de un considerable número de países se elaboraron efectuando empalmes con índices de distinta base y, en algunos casos, fue necesario vincular índices de diferente cobertura ya sea desde el punto de vista geográfico o según los estratos socioeconómicos investigados. En todo caso, la tendencia general de estos índices constituye una buena pauta para analizar la evolución de los precios al consumidor.
Índice de precios al consumidor subyacente. En varios países los bancos centrales se preocupan por el efecto que producen algunos precios de los bienes y servicios finales de carácter volátil sobre el índice de precios al consumidor (IPC), pues esto puede dar lugar a interpretaciones sesgadas del proceso inflacionario, afectando las expectativas de los agentes económicos y la conducción de la política monetaria. En esa perspectiva, lo relevante son las variaciones de precios que perduran en el largo plazo, es decir, la tendencia del crecimiento de los precios conocida como inflación subyacente.
En términos generales, mediante los cálculos de inflación subyacente se intenta estimar un nivel general de precios que incorpore un alisamiento de las fluctuaciones de corto plazo o una eliminación de ciertas series individuales como, por ejemplo, la de los precios de bienes y servicios considerados volátiles. En algunos trabajos se han planteado diversas formas de estimación, que abarcan desde la eliminación de algunos productos de la canasta hasta la utilización de técnicas estadísticas en la determinación de la serie.
Con respecto a los criterios de eliminación, en general, no se registra ningún criterio teórico ni estadístico para seleccionar los bienes y servicios que se excluyen, como tampoco una metodología específica para tal fin. En gran medida, la selección ha dependido de la percepción particular sobre los precios más variables o del tipo de shocks de precios relativos que cada país ha podido identificar. De este modo, se definió la inflación subyacente como el índice de precios que excluye los precios de los bienes y servicios considerados volátiles. Para implementar el cálculo que se reporta en el Anuario, se excluyeron los índices de alimentos y bebidas, gastos de la vivienda y gastos de transporte, pues estos dos últimos, incorporan combustibles derivados del petróleo.
Índice de precios al consumidor transable y no transable. El cálculo del índice de precios al consumidor para bienes transables y para bienes no transables, se fundamenta
2.3 Prices
Consumer price indices. Generally speaking, these represent the level, relative to the base period (equal to 100), of a representative basket of goods and services acquired by an average household. For those countries which calculated their consumer price indices using a base year other than 2005, the base was standardized arithmetically. The series for a considerable number of countries were thus prepared by splicing indices with different base years and, in some cases, it was necessary to link indices having different geographic or socioeconomic coverages. Nonetheless, the general trend of these indices constitutes a good frame of reference for analysing movements in consumer prices.
Index of core consumer prices. The central banks of several countries take into account the effect on the consumer price index (CPI) of some final goods and services whose prices tend to be volatile, since this can lead to biased interpretations of inflation and can misinform the expectations of economic agents and the management of monetary policy. From this standpoint, the most significant price variations are those that last over time, i.e., the growth trend of prices known as core inflation.
Generally speaking, calculations of core inflation attempt to estimate a general level of prices by smoothing out short-term fluctuations or eliminating certain individual series, such as goods and services whose prices are considered to be volatile. Various forms of estimation have been proposed, ranging from the elimination of certain products from the basket to the use of statistical techniques in determining the series.
No specific methodology or theoretical or statistical technique is normally used to select the goods and services to be excluded. The selection largely depends on each country’s perception of the most variable prices or type of relative price shocks to which it is vulnerable. Core inflation was thus defined as a price index that excludes the prices of goods and services considered to be volatile. For the calculation reported in the Yearbook, price indices of foods and beverages were excluded, as were housing expenses and transport, since these incorporate oil-based fuels.
Tradable and non-tradable consumer price index. The calculation of the tradable and non-tradable consumer price index is based on the distinction between goods and
178 ECLAC, Statistical Yearbook for Latin America and the Caribbean, 2012
principalmente en la distinción entre los bienes susceptibles de ser comercializados internacionalmente y los que solo se pueden consumir dentro de la economía en la que son producidos, no pudiéndose importar ni exportar. Por ello, se propone calcular una desagregación para el índice de precios al consumidor en transables y no transables. Los criterios de clasificación entre unos y otros están supeditados a las diferencias comparativas que existen de un país a otro y a las barreras naturales o artificiales que afectan la movilidad internacional de los bienes y servicios. Al no disponerse de una desagregación mayor para el IPC para todos los países, se optó por una convención que considera como transables aquellas agregaciones que corresponden a los bienes (alimentos y bebidas, vestuario y calzado, y equipamiento de la vivienda) y como no transables, las que corresponden a los servicios (gastos de la vivienda, la salud, el transporte, las comunicaciones, la educación y la recreación, los restaurantes y hoteles, y otros bienes y servicios, que a su vez incluye seguros, servicios financieros y cuidados personales, entre otros).
Índices del nivel general de precios mayoristas por país. Es uno de los indicadores económicos mensuales calculados por las oficinas de estadística de los países. Su objetivo es comparar los precios de los bienes de una canasta fija en un período con la misma canasta en un período base. Los bienes que integran la canasta y la etapa de registro de los precios difieren considerablemente de un país a otro.
�2.4 Estadísticas sectoriales
Las estadísticas sectoriales brindan información sobre el comportamiento del sector real de la economía en términos de volúmenes físicos. Permiten describir la evolución anual de los sectores analizados, eliminando el efecto que tiene la variación de los precios.
Se presenta información para 34 variables que describen la dinámica de la producción mediante indicadores de volumen o de la evolución de sus niveles. Estas variables han sido seleccionadas de acuerdo con criterios que responden a la necesidad de analizar los principales patrones productivos y comerciales de los países de la región. A modo de ejemplo, cabe mencionar los productos energéticos y sus derivados (petróleo, gas, carbón, gasolina); productos agrícolas y agroindustriales (arroz, trigo, maíz, soja, azúcar, entre otros) y algunos productos relacionados con los insumos o la producción de ciertas actividades, como la textil (algodón), la metalmecánica (laminados), la construcción (cemento), la química y la siderurgia (hierro, carbón, zinc, bauxita, cobre, acero). Asimismo, se presentan indicadores sintéticos de desempeño, entre otros, de la producción agrícola y de la producción de alimentos.
services that can be traded internationally and those that can be consumed only in the economy in which they are produced, but not imported or exported. Accordingly, the consumer price index is disaggregated into tradables and non-tradables. The criteria for classifying goods and services as either tradable or non-tradable depend on comparative differences between countries and on natural or man-made barriers to their international movement. Since the CPI is not disaggregated at a higher level in all the countries, a convention was adopted by which goods (food and drink, clothing and footwear and domestic equipment) are considered to be tradable and services, such as housing expenditures, health care, transport, communications, education and recreation, restaurants and hotels and other goods and services including, in turn, insurance, financial services and personal care, among others, are considered to be non-tradable.
Indices of the general level of wholesale prices in each country. This is one of the monthly indicators calculated by the national statistical offices. Their purpose is to compare the prices of goods in a fixed basket in a given period with the same basket in a base period. The goods included in the basket and the point at which the prices are measured differ considerably from country to country.
2.4 Sectoral statistics
Sectoral statistics provide information on the behaviour of the real sector of the economy in terms of physical volumes. They can be used to describe the annual development of the sectors analysed, thus eliminating the effect of price variation.
The information is presented for 34 variables, selected to describe the dynamics of production using volume indicators or changes in levels. The variables have been selected according to criteria that help to analyse the main productive and trade patterns of the countries of the region. For example, there are statistics on energy products and their derivatives (oil, gas, coal, and gasoline); agricultural and agroindustrial products that are important for food security (rice, wheat, corn, sorghum, soy, sugar and others); and products related to the inputs or production of certain activities such as textiles (cotton), metalworking (laminated products), construction (cement), chemicals and the iron and steel industry (iron, coal, zinc, bauxite, copper and steel). There are also synthetic indicators for the performance of agricultural output and foodstuffs production.

CEPAL, Anuario Estadístico de América Latina y el Caribe, 2012 179
Cabe destacar que todos los cuadros de esta sección —cuya información no ha sido actualizada en esta versión del Anuario— se presentan solo en la versión electrónica.
Agricultura
En esta sección se presenta información sobre índices agregados de volumen físico de producción. Se incluye información sobre la producción de cereales, algunas legumbres y frutas, que pueden considerarse una muestra representativa de los principales cultivos de la región.
La fuente de información para los cuadros de esta sección corresponde a la base de datos estadísticos de la FAO (FAOSTAT), de la Organización de las Naciones Unidas para la Alimentación y la Agricultura (FAO). Los datos sobre cultivos se refieren a la producción realmente cosechada en los campos o huertos, sin contar las pérdidas durante la recolección y la trilla, ni la parte que no fue recolectada por alguna razón. La producción comprende, por ende, la cantidad del producto vendido en el mercado (producción comercializada) más la consumida o utilizada por los productores (autoconsumo). Cuando se trata de cultivos de cereales como arroz, trigo o maíz, los datos de producción se refieren exclusivamente a la producción de grano seco, salvo la producción destinada a forraje9.
Además de presentar cifras sobre volúmenes de producción, se incluyen cuatro índices de producción, que dan cuenta de su variación en relación con el período base correspondiente al trienio 1999-2001. Estos cálculos se realizan con el índice de cantidad de Laspeyres. Las cantidades producidas de cada cultivo se ponderan por la media de los precios internacionales de los productos básicos en el período 1999-2001 (período base), se suman las correspondientes a cada año y se calcula el cociente entre esta cifra y la suma global media para el período base.
Minería y manufactura
En esta sección se presenta información sobre la producción de los principales minerales metálicos y sobre algunos recursos naturales importantes para el desarrollo del sector energético, como el petróleo y el gas natural. También se presentan los volúmenes de algunas manufacturas seleccionadas que tienen una gran incidencia productiva y comercial en los países de la región, entre otros, los de la producción de acero y de cemento, y la fabricación de vehículos automotores.
Para la elaboración de los cuadros sobre la producción de bauxita, cobre, estaño y zinc se ha recopilado información del Anuario Estadístico Mundial de Metales, publicación anual de la Oficina Mundial de Estadísticas del Metal. Los datos sobre
9 Véase más información sobre las definiciones de cada uno de los productos agrícolas considerados en esta sección en [en línea] http://www.fao.org/economic/ ess/methodology/methodology-systems/crops-statistics-concepts-definitions- and-classifications/en/.
The tables in this section are presented in electronic format only.
Agriculture
This section also includes aggregate indices of the physical volume of production. Information is included on the production of cereals and some vegetables and fruits, which may be considered a representative sample of the region’s main crops.
The main source of this information is the online database FAOSTAT of the Food and Agriculture Organization of the United Nations (FAO). The crop data refer to production actually harvested in the fields or orchards, without counting losses during collection and threshing, or any part not collected for whatever reason. Production thus includes the quantity of product sold on the market (marketed production) plus whatever was consumed or used by the producers (own consumption). When the crops are cereals such as rice, wheat or corn, the production data refer exclusively to dry grain production, except for production for animal feed.9
In addition to providing figures on production volume, section 2.4 includes four indices of production, which show changes in relation to the three-year base period 1999-2001. These indices were prepared using the Laspeyres quantity index. The production quantities for each crop were weighted by the average international commodity prices for the period 1999-2001 (the base period), the figures for each year were added together and the ratio was calculated between these figures and the average global sum for the base period.
Mining and manufacturing
This section contains information on the production of the main metallic minerals and other natural resources important for the development of the energy sector, such as oil and natural gas. It also includes the volumes of some selected manufactures which have a large productive and trade impact on the countries of the region, including steel and cement production, refining of oil derivatives and the manufacture of motor vehicles.
The tables on production of bauxite, copper, tin and zinc were prepared using information from the World Metal Statistics Yearbook, an annual publication of the World Bureau of Metal Statistics. The data on iron and
9 For additional information on the definition of each of the agricultural products considered in this section, see [online] www.fao.org/economic/ess/ methodology/methodology-systems/crops-statistics-concepts-definitions- and-classifications/en/.

180 ECLAC, Statistical Yearbook for Latin America and the Caribbean, 2012
hierro y materiales relacionados fueron suministrados por el Instituto Latinoamericano del Fierro y el Acero (ILAFA), organismo que agrupa a las empresas mineras y siderúrgicas más importantes de los principales países productores de estos metales en la región. La información sobre producción de acero proviene del Instituto Internacional del Hierro y del Acero (IISI). Las series estadísticas sobre productos energéticos, como carbón, petróleo, gas y gasolina provienen del Sistema de Información Económico-Energética (SIEE) de la Organización Latinoamericana de Energía (OLADE). El cuadro sobre producción de fertilizantes tiene como fuente a la FAO. Las estadísticas sobre producción de cemento provienen de la División de Estadística de las Naciones Unidas. Los datos sobre producción automotriz provienen de la asociación internacional de fabricantes de vehículos a motor, Organización Internacional de Constructores de Automóviles (OICA).
related metals were supplied by the Latin American Iron and Steel Institute (ILAFA), an organization of the largest mining and steel companies in the main countries producing these metals in the region. The data on steel production come from the International Iron and Steel Institute (IISI). The statistical series on energy products such as coal, oil, gas and petrol are from the Economic and Energy Information System (SIEE) of the Latin American Energy Organization (OLADE). The source of the table on production of fertilizers is the Food and Agriculture Organization of the United Nations (FAO). The statistics on cement production are from the United Nations Statistics Division. The data on motor vehicle production were provided by associations of motor vehicle producers and the International Organization of Motor Vehicle Manufacturers (OICA).

CEPAL, Anuario Estadístico de América Latina y el Caribe, 2012 181
3. Estadísticas ambientales
�
La dimensión ambiental del desarrollo requiere información estadística de calidad, oportuna y sistemática, que permita orientar las decisiones de política hacia las áreas o sectores de mayor necesidad, establecer prioridades y evaluar sus efectos.
Sin embargo, las estadísticas y los indicadores ambientales constituyen un área incipiente en pleno desarrollo, que intenta responder a la creciente demanda de información ambiental (estadísticas, indicadores y cuentas ambientales). En América Latina y el Caribe es notoria la escasez de series estadísticas ambientales y la situación en los países es heterogénea, tanto en lo que respecta a la capacidad de producir las estadísticas como a la calidad de la información resultante. Con el fin de superar progresivamente esta situación y avanzar como región hacia la producción y armonización de las estadísticas ambientales es preciso consolidar las instituciones y desarrollar capacidades técnicas nacionales.
Esta tarea es ardua, sobre todo debido a la transversalidad, complejidad y naturaleza dinámica de los fenómenos ambientales, que cubren múltiples disciplinas y especialidades (aire, agua, mares, tierra, uso del suelo, energía y residuos, entre otras).
Cabe señalar que las variables que tienen mayor relación con aspectos económicos (agricultura, energía) presentan series con mayor cobertura temporal que aquellas puramente ambientales (calidad de aire, biodiversidad).
Además de recopilar y publicar estadísticas ambientales a escala regional, la División de Estadísticas de la CEPAL realiza esfuerzos para sistematizar y difundir conocimientos y metodologías, crear sinergias e impulsar el trabajo de redes regionales, contribuyendo a que los países se involucren en la
3. Environmental statistics
The environmental dimension of development calls for timely, systematic, high-quality statistical information to guide policy decisions for the areas or sectors in most need, establish priorities and evaluate their effects.
Environmental statistics and indicators, however, constitute a rapidly emerging area, which seeks to respond to the growing demand for environmental information (statistics, indicators and environmental accounts). In Latin America and the Caribbean, environmental statistical series are notoriously scarce and the different countries present a mixed picture both in terms of their capacity to produce environmental statistics and in terms of the quality of the information produced. To gradually remedy this situation and move forward as a region towards the production and harmonization of environmental statistics, it will be necessary to build solid institutions and develop technical skills at the national level.
This is no easy task, mainly due to the cross-cutting, complex and dynamic nature of environmental phenomena, which encompass multiple disciplines and specialities (such as air, water, seas, land, land use, energy and waste).
Variables that are more closely related with economic activities, such as agriculture and energy, offer statistical series that cover larger periods than those covered by purely environmental ones such as air quality and biodiversity.
As well as compiling and publishing environmental statistics at the regional level, the Statistics Division of ECLAC strives to systematize and disseminate knowledge and methodologies, generate synergies and promote the work of regional networks, helping countries to systematically

182 ECLAC, Statistical Yearbook for Latin America and the Caribbean, 2012
producción y publicación sistemática de series estadísticas e indicadores ambientales1.
Se trata de un esfuerzo orientado a seleccionar estadísticas sobre las áreas temáticas ambientales relevantes para la región y sobre las que se dispone de información de calidad. Se espera que este se enriquezca progresivamente con información de otras áreas (calidad del agua, tratamiento de residuos y ordenamiento territorial, entre otras).
En este capítulo se incluye información proveniente de fuentes internacionales y nacionales2; cabe señalar que en esta versión del Anuario, las estadísticas de fuentes nacionales no presentan actualización.
En este capítulo se presenta información correspondiente a los 33 países de América Latina y el Caribe miembros de la CEPAL; los agregados de América Latina y el Caribe incluyen a todos ellos, a menos que se indique lo contrario3. Se estructura de acuerdo con la clasificación de las estadísticas y los indicadores ambientales contenidos en CEPALSTAT.
A continuación figuran los principales conceptos y variables utilizados, así como información metodológica que permite una correcta interpretación de los cuadros. El alto grado de complejidad de los temas cubiertos impide una descripción exhaustiva de cada uno, por lo que se presentan solo los elementos esenciales. Para mayor detalle, el usuario puede consultar los metadatos disponibles en CEPALSTAT.
1 Para mayor información, véase [en línea] http://www.cepal.org/deype/statambiental.
2 Las estadísticas provenientes de fuentes internacionales seleccionadas para este capítulo se publican además en CEPALSTAT http://www.cepal.org/ estadisticas/.
3 América Latina: Argentina, Bolivia (Estado Plurinacional de), Brasil, Chile, Colombia, Costa Rica, Cuba, Ecuador, El Salvador, Guatemala, Haití, Honduras, México, Nicaragua, Panamá, Paraguay, Perú, República Dominicana, Uruguay y Venezuela (República Bolivariana de). El Caribe: Antigua y Barbuda, Bahamas, Barbados, Belice, Dominica, Granada, Guyana, Jamaica, Saint Kitts y Nevis, San Vicente y las Granadinas, Santa Lucía, Suriname y Trinidad y Tabago. América Latina y el Caribe es la suma de las dos agrupaciones.
�3.1 Biota
Las estadísticas sobre proporción de las áreas terrestres y marinas protegidas provienen de la Base Mundial de Datos sobre Áreas Protegidas de la Unión Internacional para la Conservación de la Naturaleza y del Centro Mundial de Vigilancia de la Conservación del Programa de las Naciones Unidas para el Medio Ambiente (PNUMA).
Proporción de áreas terrestres y marinas protegidas.Corresponde al indicador 7.6 del séptimo Objetivo de Desarrollo del Milenio. Este indicador se calcula como el cociente entre la superficie de áreas protegidas (terrestres y marinas) y la superficie territorial total del país (terrestre y marina).
produce and publish series of environmental indicators and statistics.1
This represents an effort to select environmental and natural-resource statistics that are important to the region and for which reliable information is available. Ultimately, it is hoped that this will be progressively enriched with information from other areas (such as water quality, waste treatment and land-use planning).
This chapter presents information from national and international sources.2 Statistics from national sources are not updated in this year’s edition of the Yearbook.
This chapter presents information for the 33 countries of Latin America and the Caribbean that are members of ECLAC; aggregates for Latin America and the Caribbean include these 33 countries, unless otherwise indicated.3 The chapter is structured so as to maintain consistency with the environmental statistics and indicators classification used in CEPALSTAT.
Definitions of the main concepts and variables are provided below, together with methodological information which will enable the reader to interpret the tables correctly. The complexity of the issues makes it impossible to provide an exhaustive description for each variable; thus only the essential elements are presented. For further information, the user is invited to refer to the metadata available in CEPALSTAT.
1 For more information, see [online] http://www.cepal.org/deype/default.asp?idioma=IN.
2 The statistics from international sources selected for this chapter are also published at CEPALSTAT [online] http://www.cepal.org/estadisticas/.
3 Latin America: Argentina, Bolivarian Republic of Venezuela, Brazil, Chile, Costa Rica, Cuba, Dominican Republic, Ecuador, El Salvador, Guatemala, Haiti, Honduras, Mexico, Nicaragua, Panama, Paraguay, Peru, Plurinational State of Bolivia and Uruguay. The Caribbean: Antigua and Barbuda, Bahamas, Barbados, Belize, Dominica, Grenada, Guyana, Jamaica, Saint Kitts and Nevis, Saint Vincent and the Grenadines, Saint Lucia, Suriname and Trinidad and Tobago. Latin America and the Caribbean represents the sum of the two groups.
3.1 Biota
Statistics on the proportion of terrestrial and marine protected areas come from the World Database on Protected Areas of the International Union for Conservation of Nature and the United Nations Environment Programme-World Conservation Monitoring Centre (UNEP-WCMC).
Proportion of terrestrial and marine protected areas. This corresponds to indicator 7.6 of Millennium Development Goal 7. This indicator was calculated as the ratio of protected areas (terrestrial and marine) to the total area of the country (terrestrial and marine).
CEPAL, Anuario Estadístico de América Latina y el Caribe, 2012 183
Área protegida. Se refiere al área terrestre o marina especialmente dedicada a la protección y mantenimiento de la diversidad biológica, así como de los recursos naturales y culturales asociados, administradas de acuerdo con criterios legales u otro medio eficaz. Todas las áreas protegidas consideradas corresponden a algunas de las siguientes seis categorías definidas por la Unión Mundial para la Naturaleza (UICN), según sus objetivos de manejo:
I. Reservas naturales estrictas/áreas naturales silvestres: protección con fines científicos o para la conservación de la naturaleza.
II. Parques nacionales: protección de ecosistemas y fines de recreación.
III. Monumentos naturales: conservación de características naturales específicas.
IV. Áreas de manejo de hábitat y especies: conservación con intervención en la gestión.
V. Paisajes terrestres y marinos protegidos: conservación de paisajes terrestres y marinos y fines recreativos.
VI. Áreas protegidas con manejo de recursos: uso sostenible de los ecosistemas naturales.
Áreas marinas protegidas. Corresponde a cualquier área intermareal o submareal, junto con las aguas que la bañan, la flora y fauna asociadas y sus características históricas y culturales, que haya sido designada por ley u otro instrumento eficaz para proteger parcial o totalmente el medio que alberga. Todas las áreas consideradas corresponden a alguna de las seis categorías definidas por la UICN.
La información de áreas terrestres y marinas protegidas se obtiene por lo general de registros administrativos, sumando las superficies que se encuentran declaradas como tal oficialmente, según las diversas tipologías de cada país. Cabe señalar que en algunos casos, las cifras se corrigen mediante procedimientos tecnológicos de mayor eficiencia y complejidad, como los sistemas de información geográfica (SIG).
�3.2 Agua
La información de esta sección proviene del sistema de información global sobre el uso de agua en la agricultura y el medio rural (AQUASTAT) de la Organización de las Naciones Unidas para la Alimentación y la Agricultura (FAO).
Proporción del total de recursos hídricos utilizados. Corresponde al indicador 7.5 del séptimo Objetivo de Desarrollo del Milenio. El indicador muestra el volumen total de aguas subterráneas y superficiales utilizadas para uso humano en los principales sectores (agrícola, doméstico e industrial)
Protected area. An area of land or sea especially dedicated to the protection and maintenance of biological diversity, and of natural and associated cultural resources, and managed through legal or other effective means. All protected areas considered correspond to some of the following six categories defined by the International Union for Conservation of Nature and Natural Resources (IUCN), based on its management objectives:
I. Strict nature reserve/wilderness area: protected area for science or wilderness conservation.
II. National parks: ecosystem protection and recreation.
III. Natural monuments: conservation of specific natural features.
IV. Habitat/species management area: conservation through management intervention.
V. Protected landscape/seascape: landscape/seascape conservation and recreation.
VI. Protected area with resource management: sustainable use of natural ecosystems.
Marine protected areas. Refers to any area of intertidal or subtidal terrain, together with its overlapping water and associated flora, fauna, historical and cultural features, which has been designated by law or other effective means to protect part or all of the enclosed environment. All areas considered correspond to one of the six categories defined by IUCN.
The information on terrestial and marine protected areas is generally obtained from administrative records by adding up the areas the individual countries have designated as protected, according to the various typologies they use. It should be borne in mind that in some cases the figures are adjusted using more complex and efficient technological procedures, such as Geographical Information Systems (GIS).
3.2 Water
The information in this section comes from the Information System on Water and Agriculture (AQUASTAT) of the Food and Agriculture Organization of the United Nations (FAO).
Proportion of total water resources used. This corresponds to indicator 7.5 of Millennium Development Goal 7. The indicator shows the total volume of groundwater and surface water withdrawn for human use in the main sectors (agricultural, domestic and industrial), with respect to the

184 ECLAC, Statistical Yearbook for Latin America and the Caribbean, 2012
respecto del volumen total de agua disponible, a lo largo del ciclo hidrológico a escala nacional o regional. Se calcula como el cociente entre el volumen total del agua renovable utilizada en un período de tiempo determinado (numerador), dividido por el volumen total de agua renovable disponible en el mismo período de tiempo (denominador).
Extracción de agua. Corresponde a la utilización del recurso hídrico y se calcula de acuerdo al uso de los tres principales sectores: agrícola, doméstico e industrial.
Disponibilidad de los recursos hídricos renovables. Corresponde a la suma de los recursos hídricos renovables internos y las corrientes procedentes del exterior del país o región.
Recursos hídricos renovables internos. Se define como el promedio anual del flujo de los ríos y la recarga de agua subterránea, generados por las precipitaciones endógenas para un determinado país o región.
La información sobre la extracción de agua se obtiene por lo general de encuestas de uso de agua y registros administrativos. Las estadísticas sobre disponibilidad de agua renovable se obtienen a partir de los balances hídricos nacionales, estaciones hidrológicas y meteorológicas, así como de estimaciones realizadas por las autoridades nacionales y regionales de agua.
�3.3 Mares y borde costero
Las estadísticas sobre el área marina territorial provienen de la Base Mundial de Datos sobre Áreas Protegidas de la Unión Internacional para la Conservación de la Naturaleza y del Centro Mundial de Vigilancia de la Conservación del PNUMA. Las estadísticas sobre extracción pesquera y producción acuícola provienen de la base de datos de producción pesquera y acuícola mundial del Departamento de Pesca y Acuicultura de la FAO. Las estadísticas sobre extracción de las principales pesquerías y volumen de producción acuícola publicadas en la versión electrónica del Anuario fueron proporcionadas directamente por los países de la región.
Área marina territorial. Esta variable corresponde a las franjas de aguas costeras que se extienden hasta 12 millas náuticas desde la línea de base (por lo general el límite medio del nivel de la marea baja) de un país costero.
Extracción pesquera. Se presenta el total de extracción por país e incluye la extracción en aguas continentales y marinas. Se consideran, entre otras, las siguientes especies: crustáceos, moluscos, peces de agua dulce y marinos, plantas acuáticas.
total volume of water available through the hydrological cycle at the national or regional level. It is calculated as the ratio between total volume of renewable water resources used in a given period (numerator) and the total volume of renewable water available in the same period (denominator).
Water extraction. This corresponds to the use of water resources and is calculated as use by the three main sectors: agricultural, domestic and industrial.
Available renewable water resources. This is the sum of internal renewable water resources and flows of water entering the country and/or region.
Internal renewable water resources. These are defined as the average annual flow of rivers and recharge of groundwater for a given country or region generated from endogenous precipitation.
The information on water extraction is usually obtained from water-use surveys and administrative records. Statistics on available renewable water resources come from national water balances, water and weather stations, and estimates made by national and regional water authorities.
3.3 Seas and coastal areas
Statistics on marine areas come from the World Database on Protected Areas of the International Union for Conservation of Nature and the United Nations Environment Programme-World Conservation Monitoring Centre (UNEP-WCMC).Statistics on fish extraction and aquaculture production come from the databases on global capture and aquaculture of the FAO Fisheries and Aquaculture Department. The statistics on extraction by main fisheries and volume of aquaculture production published in the electronic version of the Yearbook were provided directly by the countries of the region.
Marine areas. This variable corresponds to those stretches of coastal water extending for 12 nautical miles seaward of the baseline (usually the average low-water line) of a coastal country.
Extraction by fisheries. This is the total extracted by country and includes extraction from continental and marine waters. It includes crustaceans, mollusks, saltwater and freshwater fish and aquatic plants, among other species.

CEPAL, Anuario Estadístico de América Latina y el Caribe, 2012 185
En general, las cifras de esta variable se obtienen de censos de pescadores, encuestas especializadas y registros administrativos de las declaraciones de captura de las embarcaciones en las estaciones pesqueras.
Producción acuícola. La acuicultura es la cría y cultivo de los organismos acuáticos, ya sean peces, moluscos, crustáceos o plantas acuáticas. El cultivo supone algún tipo de intervención en el proceso para incrementar la producción —entre otros, la alimentación y la protección contra los depredadores— y la propiedad individual o colectiva del stock explotado. El volumen de la producción acuícola total cubre la acuicultura de agua dulce y la acuicultura marina.
Se considera la producción en peso vivo, es decir, el peso nominal de los organismos acuáticos en el momento de la captura. Esta información se obtiene, por lo general, de registros de producción, inventarios y estimaciones.
�3.4 Tierras y suelos
Las series estadísticas y los indicadores presentados en esta sección provienen de la FAO, tanto de la base de datos estadísticos en línea FAOSTAT, como de las estadísticas e indicadores publicados por el Departamento Forestal, a través del Programa Mundial de Evaluación de los Recursos Forestales4.
En esta sección se presentan estadísticas relacionadas con el uso de la tierra y los bosques y con el empleo de agroquímicos.
Entre los aspectos más relevantes relacionados con las estadísticas de tierras y suelos figuran la interacción de las actividades humanas que se llevan a cabo en esta área y el cambio en el uso de la tierra a lo largo de los años, tanto a raíz de fenómenos antrópicos como naturales.
Superficie total del país. Incluye las superficies ocupadas por las masas de aguas continentales (principales ríos y lagos) y la superficie terrestre total de un país.
Superficie terrestre. Es la superficie total de las tierras del país, con exclusión de las superficies ocupadas por las masas de aguas continentales (principales ríos y lagos).
4 La evaluación de los recursos forestales se basa en información suministrada por los países y abarca información obtenida a partir de los datos de inventarios existentes, así como de investigaciones sobre los procesos de cambio que se han verificado en la cubierta de la tierra y de una serie de estudios sobre la interacción entre la población y los bosques. Esta evaluación se publica aproximadamente cada 5 o 10 años. La última actualización disponible corresponde a 2010.
In general, the figures for this variable are obtained through fishery censuses, specialized surveys and administrative records coming from the catches declared by fishing vessels at fishing stations.
Aquaculture production. Aquaculture is the breeding and farming of aquatic organisms, including fish, molluscs, crustaceans and aquatic plants. Farming implies some type of intervention in the process in order to increase production, such as feeding and protection against predators. Farming also implies individual or collective ownership of the exploited stock. The volume of total aquacultural production covers both fresh water aquaculture and marine aquaculture.
Production is reported as live weight, which is the nominal weight of aquatic organisms at the time of capture. In general, this information is obtained from production records, inventories and estimates.
3.4 Land and soils
The statistics and indicators presented in this section are from the Food and Agriculture Organization of the United Nations, from both the FAOSTAT online statistical database as well as the statistics and indicators published by the Forestry Department through its Global Forest Resources Assessment Programme.4
This section contains statistics on land and forest use and on the application of agrochemical products.
Two of the most important issues reflected in land and soil statistics are the interaction between human activity and land use and how land use changes over time as a result of both anthropic and natural phenomena.
Total area of the country. Includes area submerged by inland water bodies (major rivers and lakes) as well as total land area.
Land area. Total land area of a country, excluding the area covered by inland water bodies (major rivers and lakes).
4 The global forest resources assessment is based on information supplied by the countries and includes information obtained from data relating to existing inventories, as well as from research on the processes of change that have occurred in land coverage and through a series of studies on the interaction between human populations and forests. This assessment is published approximately every 5 or 10 years. The last available assessment corresponds to 2010.

186 ECLAC, Statistical Yearbook for Latin America and the Caribbean, 2012
Superficie aguas continentales. Es la superficie de cuerpos de aguas que se encuentran sobre o debajo de la superficie de la tierra, alejados de las zonas costeras (excepto por las desembocaduras de los ríos y otras corrientes de agua). Las aguas continentales incluyen ríos, lagos, reservorios, humedales y sistemas salinos de interior.
Superficie agrícola. Corresponde a la suma de la superficie de tierras arables, tierras destinadas a cultivos permanentes y praderas y pastos permanentes.
Superficie de tierras arables. Comprende las tierras destinadas a cultivos temporales (las que producen dos cosechas se toman en cuenta solo una vez), las praderas temporales para corte o pastoreo, las tierras dedicadas a huertas comerciales o huertos y las tierras temporalmente en barbecho por menos de cinco años. No se incluye la tierra abandonada como resultado del cultivo migratorio.
Superficie de tierras destinadas a cultivos permanentes. Se refiere a las tierras dedicadas a cultivos que ocupan el terreno durante largos períodos y no necesitan ser replantados después de cada cosecha, como el cacao, el café y el caucho. Esta categoría incluye las tierras ocupadas por arbustos destinados a la producción de flores, árboles frutales, nogales y vides, y excluye las tierras plantadas con árboles destinados a la producción de leña o madera.
Superficie de praderas y pastos permanentes. Terrenos utilizados permanentemente (por cinco o más años) para forrajes herbáceos, ya sean cultivados o silvestres (praderas o tierras de pastoreo silvestres).
Superficie regada. Se refiere a las superficies equipadas con infraestructura para abastecer de agua a los cultivos. Estas comprenden las áreas con control parcial o total de la distribución del agua, las superficies regadas por derivación de crecidas y las zonas bajas o inundables donde se controla el agua disponible. Cabe señalar que las definiciones de riego varían de un país a otro.
Las estadísticas de superficie agrícola se obtienen, por lo general, de levantamientos censales agrícolas, encuestas y estudios, así como de la interpretación digital de imágenes satelitales.
En esta sección se presenta —únicamente en soporte electrónico— un conjunto de cuadros que describen la superficie cosechada de algunos de los principales cultivos de la región, como algodón, arroz, café, caña de azúcar, maíz, soja y trigo5.
Las estadísticas sobre bosques tienen un interés fundamental para evaluar la situación de los recursos naturales y del medio ambiente debido a la importancia de las funciones ecológicas y los servicios ambientales que brindan estos ecosistemas. Asimismo, los bosques proporcionan una amplia gama de
5 Para mayor información sobre las definiciones de cada uno de estos productos agrícolas, véase [en línea] http://www.fao.org/economic/ess/methodology/methodology- systems/crops-statistics-concepts-definitions-and-classifications/en/.
Inland water area. The area of surface or underground bodies of water, inland from the coast (except for the mouths of rivers and other waterways). Inland waters include rivers, lakes, reservoirs, wetlands and inland saline systems.
Agricultural area. Corresponds to the sum of the area of arable land, land used for permanent crops and land under permanent pasture.
Area of arable land. Comprises the land used for seasonal crops (double-harvested areas are counted only once), seasonal meadows for mowing or pasture, land used for market or kitchen gardens and land temporarily lying fallow (less than five years). Land that is abandoned due to migrant farming is not included in this category.
Area of permanent cropland. This refers to the land used for crops that occupy the land for long periods and need not be replanted after each harvest, such as cocoa, coffee and rubber. This category includes land under flowering shrubs, fruit trees, nut trees and vines, but excludes land under trees grown for fuel wood or timber.
Area of permanent meadows and pastures. Land used permanently (five years or more) for herbaceous forage crops, either cultivated or growing wild (wild prairies or grazing land).
Area irrigated. Refers to areas equipped with infrastructure to provide water to crops. These include areas equipped for full or partial control of irrigation, spate irrigation areas, and low or flood-prone areas where available water is controlled. Note that definitions of irrigation vary from one country to another.
The statistics on agricultural area are usually obtained from agricultural censuses, surveys and studies, and from the digital interpretation of satellite images.
In the CD-ROM and online versions, this section includes a series of tables that describe the harvested areas of some of the principal crops in the region, such as cotton, rice, coffee, sugar cane, maize, soy and wheat.5
Forest statistics are crucial for assessing the state of natural resources and the environment, in view of the important ecological and environmental services that forest ecosystems provide. Moreover, forests provide a wide range of essential goods, such as wood, food, medicines and recreation. Thus,
5 For further information on the definition of each of these agricultural products, see [online]: http://www.fao.org/economic/ess/methodology/methodology-systems/ crops-statistics-concepts-definitions-and-classifications/en/.

CEPAL, Anuario Estadístico de América Latina y el Caribe, 2012 187
bienes esenciales, como madera, alimentos, medicinas y recreación. Por ende, conocer su estado y evolución reciente es esencial para una gestión sostenible.
En esta sección se incluye la proporción de la superficie cubierta por bosques, que corresponde al indicador 7.1 del séptimo Objetivo de Desarrollo del Milenio.
Bosque. Tierra que se extiende por más de 0,5 hectáreas, dotada de árboles de una altura superior a 5 metros y una cubierta de copas superior al 10%, o de árboles capaces de alcanzar esta altura in situ. Comprende los bosques naturales y las plantaciones forestales, así como los bosques utilizados fundamentalmente con fines de producción, conservación o usos múltiples. No incluye la tierra sometida a un uso predominantemente agrícola o urbano.
Bosque natural. Los bosques naturales son bosques compuestos por especies indígenas (nativas) no plantadas por el ser humano. En otras palabras, se excluyen las plantaciones forestales. La información correspondiente a 1990, 2000, 2005 y 2010, sobre la superficie de bosque natural se calculó a partir de la diferencia entre la superficie total de bosque y la de plantaciones forestales.
Plantaciones. Bosques de especies introducidas, y en algunos casos de especies indígenas, establecidos mediante plantación, siembra o ambos, en un proceso de forestación o reforestación orientado principalmente a la producción de madera y bienes no madereros o al suministro de servicios ambientales.
En el caso de estos conceptos se ha calculado la variación acumulada, es decir la proporción en que se ha modificado su superficie en un período de tiempo determinado, y su variación media anual, que corresponde a la variación del período dividida por el número de años comprendidos. Es importante tener en cuenta que no se trata de la variación efectiva año tras año, sino de una tasa media anual.
Asimismo, se ha calculado la proporción de bosque natural y de plantaciones forestales sobre la superficie total de bosque y la proporción de bosque total y bosque natural sobre la superficie territorial del país.
Aunque el uso de plaguicidas y fertilizantes en las técnicas agrícolas modernas es fundamental para aumentar la producción, es necesario tener en cuenta que su aplicación conduce a una mayor contaminación química del suelo, el agua y la biota, lo que afecta la estabilidad de los ecosistemas y los mecanismos de control natural de las enfermedades y de las infecciones por insectos. Con respecto a la salud humana, el uso de plaguicidas puede acarrear enfermedades oncológicas, pulmonares y hematológicas, así como también malformaciones de nacimiento y deficiencias del sistema inmunológico. Estos efectos son causados principalmente por el contacto con la piel, la inhalación y la ingestión y el consumo de alimentos y agua contaminados con esas sustancias.
Las cifras sobre consumo de fertilizantes y plaguicidas se refieren al consumo nacional, que se obtiene de registros
knowing their current condition and recent evolution is essential for their sustainable management.
This section includes information on forest-covered land area, which corresponds to indicator 7.1 of Millennium Development Goal 7.
Forest. Land spanning more than 0.5 hectares with trees taller than 5 metres and a canopy cover of more than 10%, or trees able to reach these thresholds in situ. This includes natural and planted forests as well as forests used principally for production, conservation or multiple purposes. It does not include land that is predominantly under agricultural or urban use.
Natural forest. Natural forests are forests consisting of native species that were not planted by human beings. In other words, they exclude forest plantations. Information presented for 1990, 2000, 2005 and 2009 on natural forest land area was obtained by subtracting the area of planted forests from total forest area.
Plantations. Forests consisting of introduced species and, in some cases, indigenous species that have been planted or sown or both during afforestation or reforestation, mainly geared towards the production of wood, non-wood products or the provision of environmental services.
The calculations for these categories have been made on the basis of cumulative change, that is, the extent to which the respective area has been altered over a given period, and of annual average variation, calculated as the variation over the period divided by the number of years it covers. It should be borne in mind that the figures do not represent actual year-on-year change but an average annual rate.
The calculations also show natural forest and plantations as proportions of total forest area and total forest and natural forest as proportions of the country’s total surface area.
While the use of pesticides and fertilizers in modern agricultural techniques is fundamental for increasing agricultural production, it must be borne in mind that their application leads to greater contamination of the soil, water and biota, with secondary effects on the stability of ecosystems and the mechanisms for natural control of disease and infection by insects. As for human health, the use of pesticides may cause oncological, pulmonary and haematological diseases, as well as birth defects and immune system deficiencies. These effects are mainly the result of skin contact, inhalation and ingestion and the consumption of food and water contaminated with these substances.
Figures relating to the consumption of fertilizers and pesticides refer to national consumption, which is obtained

188 ECLAC, Statistical Yearbook for Latin America and the Caribbean, 2012
administrativos o estimaciones. En la mayoría de los casos, se utiliza el consumo aparente, es decir, la producción nacional más las importaciones menos las exportaciones.
A partir de 2002, la metodología para calcular el consumo de fertilizantes fue revisada. En ese sentido, de acuerdo con la nueva metodología el consumo aparente es igual a la producción más las importaciones menos exportaciones y menos los usos no agrícolas6.
Fertilizantes. Sustancias orgánicas e inorgánicas cuyos elementos químicos permiten estimular el desarrollo de las plantas y mejorar la fertilidad del suelo. Los nutrientes de los fertilizantes inorgánicos o minerales son sales inorgánicas, obtenidas por extracción, procesos físicos y químicos o ambos. Los tres nutrientes principales de las plantas son el nitrógeno, el fósforo y el potasio. El consumo de fertilizantes se calcula sumando los volúmenes de fertilizantes nitrogenados, fosfatados y potásicos, expresados en términos de nutrientes vegetales (N, P2O5 y K2O), en toneladas métricas de nutrientes de plantas consumidas por los países.
Intensidad de uso de fertilizantes. Este indicador muestra el consumo total de fertilizantes respecto de la superficie de tierras de uso agrícola en el país. Un valor mayor del indicador significa más cantidad de fertilizantes utilizada por cada hectárea de tierra agrícola. Se calcula como el cociente entre el consumo total de fertilizantes en un período de tiempo determinado (numerador), dividido por la superficie total agrícola, en el mismo período de tiempo (denominador).
Plaguicidas. Cualquier sustancia o mezcla de sustancias destinada a prevenir, destruir o controlar cualquier plaga —incluidos los vectores de enfermedades humanas o de los animales, y las especies vegetales o animales indeseables que causan perjuicio o que interfieren de cualquier forma en la producción, elaboración, almacenamiento, transporte o comercialización de alimentos, productos agrícolas, madera y productos de madera o alimentos para animales— o que pueden administrarse a los animales para combatir insectos, arácnidos u otras plagas en o sobre sus cuerpos. Incluyen sustancias destinadas a utilizarse como reguladoras del crecimiento de plantas, defoliantes, desecantes, agentes para reducir la densidad de la fruta o para evitar su caída prematura y las sustancias aplicadas a los cultivos antes o después de la cosecha para proteger el producto contra el deterioro durante el almacenamiento y transporte.
6 Para mayor información sobre la metodología revisada, véase [en línea] http://faostat. fao.org/DesktopDefault.aspx?PageID=575&lang=es.
�3.5 Energía
En esta sección se incluye principalmente información proveniente de la Organización Latinoamericana de Energía
from administrative records or estimates. In most cases, apparent consumption is used, that is, national production plus imports minus exports.
Since 2002, a revised methodology has been used to calculate fertilizer consumption. Under the new method, consumption equals production plus imports, minus exports, minus non-agricultural use.6
Fertilizers. These are organic and inorganic substances whose chemicals stimulate plant development and improve soil fertility. Nutrients from inorganic or mineral fertilizers are inorganic salts obtained by extraction and/or through physical and chemical processes. The three main plant nutrients are nitrogen, phosphorus and potassium. The consumption of fertilizers is obtained by adding the volumes of nitrate, phosphate and potassium fertilizers, expressed in terms of vegetable nutrients (N, P2O5 and K2O), in metric tons of plant nutrients consumed by countries.
Fertilizer use intensity. This indicator shows total consumption of fertilizers with respect to the surface area of agricultural land in the country. The higher the value of the indicator, the more fertilizer being used per hectare of agricultural land. It is calculated as the ratio of total fertilizer consumption in a given period (numerator) to the total agricultural area in the same period (denominator).
Pesticides. Any substance or mixture of substances designed to prevent, destroy or control any pest, including vectors of human or animal diseases, undesirable plant or animal species that harms or interferes in any way with the production, processing, storage, transport or marketing of food products, agricultural products, wood and wood products. Includes substances administered to animals to combat insects, arachnids or other pests in or on their bodies; substances intended for use as plant growth regulators, namely, defoliants, desiccants, agents designed to reduce fruit density or agents designed to avert premature fruit fall; and substances applied to crops pre- or post-harvest to protect against deterioration during storage and transport.
6 For further information on the revised methodology, see [online]: http://faostat.fao.org/DesktopDefault.aspx?PageID=575&lang=en.
The information included in this section comes mainly from the Latin American Energy Organization (OLADE).
3.5 Energy

CEPAL, Anuario Estadístico de América Latina y el Caribe, 2012 189
(OLADE). Para el cálculo de algunos indicadores se utilizó además información de la División de Estadística y Proyecciones Económicas y de la División de Recursos Naturales e Infraestructura de la CEPAL.
Por lo general, las estadísticas de energía se presentan en el marco del balance energético que contabiliza los flujos físicos por los cuales la energía (por tipo de fuente: primaria y secundaria) se produce, se intercambia con el exterior, se transforma y se consume por sectores económicos, es decir, muestra el conjunto de relaciones de equilibrio entre la oferta y la demanda, todo calculado en una unidad común (física o energética), dentro de un territorio (generalmente un país o región) y para un período determinado (en general un año). En este contexto, se seleccionaron algunos indicadores clave que se describen a continuación.
Energía primaria. Corresponde a las distintas fuentes de energía, tal como se obtienen en la naturaleza, ya sea en forma directa (como en el caso de la energía hidráulica, eólica y solar, la leña y otros combustibles vegetales) o después de un proceso de extracción (como en el caso del petróleo, el carbón mineral, la geoenergía, entre otros).
Energía secundaria. Corresponde a los diferentes productos energéticos que provienen de la transformación de productos energéticos primarios; su destino son los diversos sectores del consumo y/u otros centros de transformación (como en el caso de las gasolinas, la electricidad y el gas licuado, entre otros).
Producción de energía primaria. Se refiere a la producción de productos o fuentes energéticas que se encuentran en su estado natural, por ejemplo, leña, gas natural, bagazo e hidroelectricidad. Asimismo, se refiere a la cantidad de combustible extraído o producido, calculado después de cualquier operación de eliminación de material inerte. Generalmente, se incluye la energía consumida en el proceso de producción, así como la oferta a otros productores de energía para transformación u otros usos.
Producción de energía secundaria. Corresponde a aquellos productos o fuentes energéticas que son el resultado de la transformación de productos energéticos primarios como los derivados del refinamiento y procesamiento del petróleo (queroseno y diesel, entre otros).
Consumo de energía primaria. Corresponde a la producción más las importaciones menos las exportaciones más los cambios en las reservas y menos las pérdidas por distribución de todos los productos energéticos primarios.
Consumo de energía secundaria. Corresponde a la producción más las importaciones menos las exportaciones más los cambios en las reservas y menos las pérdidas por distribución de todos los productos energéticos secundarios (que son el resultado de la transformación de productos energéticos primarios).
Consumo total de energía. También conocido como consumo final, corresponde a toda la energía consumida para
In calculating some indicators, data was drawn from the Divisions of Statistics and Economic Projections and Natural Resources and Infrastructure of ECLAC.
Usually, energy statistics are presented in a framework of the energy balance that accounts for physical flows by which energy (by source type – primary or secondary) is produced, interacts externally, is transformed and consumed by economic sectors. In other words, it is a sampling of the set of balancing relationships between supply and demand, calculated as a single unit (physical or energy unit), within a territory (usually a country or region) and over a specific period of time (usually one year). In this context, several key indicators have been selected and are described below.
Primary energy. Refers to different energy sources found in their natural state, whether directly (such as hydraulic, wind and solar energy, wood and other plant fuels), or obtained by a process of extraction (oil, coal and geothermal energy, among others).
Secondary energy. Refers to different energy products that come from the transformation of primary energy products; these are channelled to various consumer sectors and/or other conversion centres, as is the case of gasolines, electricity and liquid gas, among others.
Primary energy production. This refers to the production of energy products or sources found in their natural states, for example, wood, natural gas, bagasse and hydroelectricity. In addition, it refers to the amount of fuel extracted or produced, calculated after any operation to eliminate inert material. Generally, it includes the energy consumed in the production process as well as the supply to other energy producers for conversion or other uses.
Secondary energy production. This refers to energy products or sources which are the result of the conversion of primary energy products, such as all those derived from petroleum refining and processing, including kerosene and diesel.
Primary energy consumption. This refers to production plus imports minus exports plus changes in stocks less distribution losses of all primary energy products.
Secondary energy consumption. This refers to production plus imports less exports plus changes in stocks less distribution losses of all secondary energy products (which are the result of the conversion of primary energy products).
Total energy consumption. Also known as final consumption, this refers to all energy consumed for purposes

190 ECLAC, Statistical Yearbook for Latin America and the Caribbean, 2012
fines distintos a la transformación o producción de energía. Este consumo incluye productos primarios y secundarios, pero solo aquellos destinados al consumo final. Se incluye también la energía destinada a las actividades de extracción y producción de energía que no forma parte del proceso de transformación.
Oferta total de energía. Corresponde a la sumatoria de las ofertas de energía primaria y secundaria, menos la producción de energía secundaria. Este segundo término se incorpora para evitar la doble contabilización de la energía utilizada en el proceso de producción de energía secundaria. De igual modo, corresponde a la sumatoria de la oferta de fuentes de energías renovables y no renovables.
Oferta de energía renovable. Corresponde a la oferta de las siguientes fuentes energéticas: hidroenergía (a gran y pequeña escala), geotermia, dendroenergía (porción de biomasa leñosa de consumo sostenible), bioenergía sostenible no relacionada con la madera y otras fuentes como energía eólica y solar.
Oferta de energía no renovable. Corresponde principalmente a la oferta de hidrocarburos (petróleo, carbón y gas natural), energía nuclear y leña, cuyo uso no es sostenible.
Intensidad energética del PIB. Este indicador mide la relación que existe entre la cantidad de energía consumida y el PIB. En la medida que este indicador aumenta se incrementa la cantidad de energía requerida para producir una unidad monetaria de producción económica. La relevancia de este indicador radica en que un incremento del consumo energético para alcanzar un PIB mayor se traduce en una presión sobre los recursos naturales y efectos ambientales mayores. Este indicador se calculó como el cociente entre el consumo total de energía y el PIB en dólares a precios constantes de 2005.
Hidrocarburos. Constituyen un grupo de compuestos orgánicos que contienen principalmente carbono e hidrógeno. Son los compuestos orgánicos más simples y pueden ser considerados como las sustancias principales de las que derivan todos los demás compuestos orgánicos. Se llama hidrocarburos al grupo compuesto por el gas natural, el carbón, el petróleo y sus derivados.
Energía eléctrica. Corresponde a la energía transmitida por electrones en movimiento. Se incluye la energía eléctrica generada con cualquier fuente energética, sea primaria o secundaria, en centrales hidroeléctricas, termoeléctricas, termonucleares, geotérmicas, eólicas o fotovoltaicas.
Capacidad instalada para producir energía eléctrica. Corresponde a la capacidad máxima establecida de todos los generadores disponibles. Es importante considerar que la capacidad instalada probablemente será mayor que la cantidad de energía eléctrica producida, pues las plantas no siempre operan a su máxima capacidad debido a razones de demanda u oferta.
La gran mayoría de los datos presentados en esta sección corresponden a registros administrativos. Sin embargo, en algunas ocasiones se utilizan estimaciones para determinar la participación por sector.
other than the conversion or production of energy. This consumption includes primary and secondary products, but only those intended for final consumption. It also includes that portion of energy that supports energy extraction and production activities, but that are not part of the conversion process.
Total energy supply. This corresponds to the sum of the supplies of primary and secondary energy less the production of secondary energy. This second term is incorporated to avoid double counting of energy used in the secondary energy production process. This is also the sum of supply from renewable and non-renewable energy sources.
Renewable energy supply. This refers to the supply of the following energy sources: hydroenergy (large and small scale), geothermal energy, wood energy (portion of wood biomass destined for sustainable use), non-wood-related sustainable bioenergy and other sources, such as wind and solar energy.
Supply of non-renewable energy. Refers primarily to the supply of hydrocarbons (oil, coal and natural gas), nuclear energy and firewood whose use is not sustainable.
Energy intensity of GDP. This indicator measures the relationship between the amount of energy consumed and GDP. The higher the value of this indicator, the greater the amount of energy required to produce one monetary unit of economic output. This indicator is important insofar as any increase in energy consumption to achieve higher GDP implies pressure on natural resources and a stronger environmental impact. This indicator is calculated as the ratio of total energy consumption to GDP in dollars expressed at constant 2005 prices .
Hydrocarbons. These are a group of organic compounds that contain principally carbon and hydrogen. They are the simplest organic compounds and may be considered the main substances from which all other organic compounds are derived. The term hydrocarbon is used to refer to the group composed of natural gas, coal, petroleum and their derivatives.
Electrical energy. Refers to energy transmitted by electrons in motion. It includes electric energy generated at any energy source, whether primary or secondary, at hydroelectric, thermoelectric, thermonuclear, geothermal, wind or photovoltaic centres.
Installed capacity for producing electricity. This is the maximum installed capacity of all available generators. It is important to note that installed capacity will probably be greater than the quantity of electric power produced, since plants do not always operate at full capacity owing to supply or demand factors.
Most of the data presented in this section come from administrative records. However, estimates are sometimes used to work out the share for each sector.

CEPAL, Anuario Estadístico de América Latina y el Caribe, 2012 191
�3.6 Aire y atmósfera
La información sobre el consumo de todas las sustancias que agotan la capa de ozono proviene de la Secretaría del Ozono del PNUMA. Las estadísticas sobre emisiones de dióxido de carbono (CO2) totales provienen del sitio oficial para los indicadores de los Objetivos de Desarrollo del Milenio de las Naciones Unidas. Las estadísticas sobre emisiones y absorciones de CO2, y emisiones de CH4 y N2O fueron proporcionadas directamente por los países de la región. Finalmente, las estadísticas sobre población y PIB provienen de la CEPAL.
Consumo de todas las sustancias que agotan la capa de ozono. Corresponde al consumo de las sustancias definidas por el Protocolo de Montreal como sustancias que contienen cloro o bromo que destruyen la capa de ozono estratosférico. Las sustancias controladas por el Protocolo de Montreal incluyen clorofluorocarbonos (CFC), halones, otros CFC completamente halogenados, tetracloruro de carbono, tricloroetano (metilcloroformo), hidroclorofluorocarbonos (HCFC), hidrobromofluorocarbonos (HBFC), bromoclorometano y bromuro de metilo (metilbromuro) medidos en función de su consumo total en toneladas de potencial de agotamiento del ozono (PAO)7. Estas se calculan multiplicando las toneladas de cada sustancia por un factor específico de cada una de ellas.
La producción y el consumo de estas sustancias constituyen la causa principal de la reducción del ozono estratosférico, lo cual impide filtrar los nocivos rayos ultravioleta que afectan a las personas y a otros seres vivos. Se ha hecho un seguimiento de estas sustancias desde la entrada en vigor del Protocolo de Montreal en 1987. A continuación se definen los tres principales compuestos químicos que destruyen la capa de ozono.
Clorofluorocarbonos (CFC). Productos químicos inertes, no tóxicos, que se licuan fácilmente. Se emplean en los sistemas de refrigeración, aire acondicionado, envasado y aislamiento o como solventes y propulsores de aerosoles. Dado que los CFC no se destruyen en las capas inferiores de la atmósfera se desplazan hacia las capas superiores, donde sus componentes clorados destruyen el ozono. En el Protocolo de Montreal, los CFC corresponden al grupo I del anexo A, en el que se identifican las siguientes sustancias controladas: CFC-11, CFC-12, CFC-113, CFC-114 y CFC-115.
7 El potencial de agotamiento del ozono es un número que se refiere a la cantidad de destrucción de ozono estratosférico causado por una sustancia. Es la razón entre el impacto sobre el ozono causado por una sustancia determinada y el impacto causado por una masa similar de CFC-11 (el potencial de agotamiento del CFC-11 está definido como 1).
3.6 Air and atmosphere
Information on the consumption of ozone-depleting substances was obtained from the UNEP Ozone Secretariat. The statistics on total carbon dioxide (CO2) emissions come from the official website of the indicators of the Millennium Development Goals of the United Nations. The statistics on emissions and absorption of CO2, and on emissions of CH4 and N2O, were provided directly by the countries of the region. Lastly, the statistics on population and GDP come from ECLAC.
Consumption of all ozone-depleting substances. This corresponds to consumption of the substances defined under the Montreal Protocol as containing stratospheric-ozone-depleting chlorine or bromine. The substances controlled under the Montreal Protocol include chlorofluorocarbons (CFCs), halons, other fully halogenated CFCs, carbon tetrachloride, trichloroethane (methyl chloroform) hydrochlorofluorocarbons (HCFCs), hydrobromofluorocarbons (HBFCs), bromochloromethane and methyl bromides (bromomethane), measured in terms of total consumption in tons of ozone-depleting potential (ODP).7 These are calculated by multiplying tons of the respective substance by a specific factor for each.
The production and consumption of these substances are the main causes of stratospheric ozone reduction, which prevents the filtering of ultraviolet rays harmful to humans and other living organisms. These substances have been monitored since the Montreal Protocol entered into force in 1987. There follows a definition of the three major ozone-destroying chemical compounds.
Chlorofluorocarbons (CFCs). Inert, non-toxic chemical products, which are easily liquefied. They are used in refrigeration and air conditioning systems, in packaging and insulation or as solvents and aerosol propellants. Since CFCs are not destroyed in the lower layers of the atmosphere, they rise towards the upper layers where their chlorate components destroy the ozone. In the Montreal Protocol, CFCs fall under group I of annex A, which identifies the following controlled substances: CFC-11, CFC-12, CFC-113, CFC-114 and CFC-115.
7 Ozone-depleting potential is a number that refers to the level of stratospheric ozone destruction caused by a substance. It is expressed as the ratio between the impact on ozone caused by a given substance and the impact caused by a similar mass of CFC-11 (the depletion potential of CFC-11 is defined as 1).
192 ECLAC, Statistical Yearbook for Latin America and the Caribbean, 2012
Hidroclorofluorocarbonos (HCFC). Compuestos generalmente ut i l izados como sust i tutos de los clorofluorocarbonos (CFC) en los sistemas de refrigeración, debido a que su efecto en el agotamiento de la capa de ozono es menor. En el Protocolo de Montreal, los HCFC corresponden al grupo I del anexo C.
Bromuro de metilo (metilbromuro). Sustancia química compuesta por carbono, hidrógeno y bromo, que se utiliza principalmente como plaguicida agrícola y sustancia fumigadora y que posee un elevado potencial de agotamiento del ozono. En el Protocolo de Montreal el bromuro de metilo corresponde al grupo I del anexo E.
Las cifras correspondientes a estas tres variables se obtienen de registros administrativos. Por lo general, se utiliza el concepto de consumo aparente, es decir, se estima el consumo real sobre la base de la producción, importación y exportación de las distintas sustancias.
Emisiones de gases de efecto invernadero. Corresponde a estadísticas de emisiones de gases de efecto invernadero desglosadas por fuentes emisoras de los siguientes compuestos: dióxido de carbono (CO2), metano (CH4) y óxido nitroso (N2O). Para el caso del CO2 se presenta
además información sobre absorciones por sumideros de gases de efecto invernadero.
Emisiones de CO2 totales, por habitante y por cada 1.000 dólares del PIB. Corresponde al indicador 7.2 del séptimo Objetivo de Desarrollo del Milenio. El indicador muestra solamente las emisiones de CO2 generadas por la quema de combustibles fósiles y la producción de cemento. El indicador de emisiones de CO2 por habitante se obtiene dividiendo las emisiones de CO2 por la población del respectivo país. El indicador de PIB se obtiene dividiendo las emisiones de CO2 por el PIB en dólares a precios constantes de 2005.
Las estadísticas de emisiones de CO2 producto de la quema de combustibles fósiles y la producción de cemento se obtienen a partir de estimaciones derivadas de las estadísticas de energía publicadas por la División de Estadística de las Naciones Unidas.
Producto interno bruto (PIB). El PIB corresponde al valor del flujo neto de bienes y servicios producidos en un país durante un período de referencia determinado. Los valores a precios constantes representan flujos de bienes y servicios que están valorados a los precios que los países tenían en el año que se ha tomado como base.
Efecto invernadero. La acumulación de los gases de efecto invernadero (CO2, CH4 y N2O, entre los principales) provoca el calentamiento de la atmósfera de la tierra, que actúa como el techo de vidrio de un invernadero. Este fenómeno, que permite el paso de los rayos solares y el calentamiento de la superficie terrestre pero impide la pérdida de radiación térmica, se considera el principal causante del cambio climático.
Hydrochlorofluorocarbons (HCFCs). Compounds usually used as substitutes for CFCs in refrigeration systems, since they have a lower impact on the depletion of the ozone layer. In the Montreal Protocol, HCFCs are listed in group I of annex C.
Methyl bromide. A chemical substance made up of carbon, hydrogen and bromine, which is used mainly as a pesticide in agriculture and a fumigant and which has a high ozone-depleting potential. In the Montreal Protocol, methyl bromide is covered in group I of annex E.
The figures for these three variables are obtained from administrative records. The concept generally used is apparent consumption, which is calculated on the basis of production, imports + exports of the different substances.
Greenhouse gas (GHG) emissions. This section provides statistics on emissions of greenhouse gases, broken down by source of emission of the following compounds: carbon dioxide (CO2), methane (CH4), and nitrous oxide (N2O). In the case of CO2, information is also provided on sequestration by greenhouse gas sinks.
CO2 emissions, total, per capita and per US$ 1,000 of GDP. This corresponds to indicator 7.2 of Millennium Development Goal 7, and shows only emissions of CO2 from fossil fuel burning and cement production. The indicator CO2 emissions per capita is calculated by dividing CO2 emissions by the population of the respective country. CO2 emissions by GDP is obtained by dividing CO2 emissions by GDP in dollars at constant 2005 prices.
The statistics on CO2 emissions from fossil fuel burning and cement production are estimates derived from energy statistics published by the United Nations Statistics Division.
Gross domestic product (GDP). GDP is the net value of the goods and services produced by a country in a given reference period. Values at constant prices represent flows of goods and services valued at the prices the countries recorded in the base year.
Greenhouse effect. The accumulation of greenhouse gases (the main ones being CO2, CH4 and N2O) warms the Earth’s atmosphere, acting like the glass roof of a greenhouse. This phenomenon allows the sun’s rays to pass through and warm the surface of the earth but prevents loss of thermal radiation, and is thus considered to be the principal cause of climate change.

CEPAL, Anuario Estadístico de América Latina y el Caribe, 2012 193
Emisiones. Liberación de gases de efecto invernadero y/o de sus precursores en la atmósfera, en una zona y por un período determinado.
Absorciones. Absorción de los gases de efecto invernadero y/o de sus precursores de la atmósfera, por medio de un sumidero8.
Dióxido de carbono (CO2). Gas incoloro, inodoro y no venenoso que se desprende de la quema de combustibles fósiles y que normalmente forma parte del aire ambiente. También se produce en la respiración de los organismos vivos (plantas y animales). Se lo considera el principal gas de efecto invernadero. También se denomina anhídrido carbónico.
Metano (CH4). Hidrocarburo gaseoso, incoloro, inflamable y no venenoso, que se forma por la descomposición anaeróbica de los compuestos orgánicos. El metano es un gas de efecto invernadero.
Óxido nitroso (N2O). Gas relativamente inerte que se produce como resultado de la actividad microbiana en el suelo, la utilización de fertilizantes nitrogenados y la quema de leña, entre otros. Este compuesto puede contribuir al efecto invernadero y al agotamiento del ozono.
Según la metodología del Grupo Intergubernamental de Expertos sobre el Cambio Climático (IPCC) de 2006, las estimaciones de emisiones y absorciones de gases de efecto invernadero se dividen en cinco sectores principales: energía; procesos industriales y uso de productos; agricultura, silvicultura y otros usos de la tierra; desechos, y otras fuentes de emisiones. Cada sector comprende categorías individuales (por ejemplo, transporte) y subcategorías (por ejemplo, automóviles).
En general, para el cálculo de estas variables se utiliza la metodología del IPCC 2006 para los inventarios nacionales de gases de efecto invernadero. En su forma más simple, esta metodología corresponde a una estimación indirecta de las emisiones y absorciones de los distintos sectores, de acuerdo con factores de emisión y absorción por unidad de consumo o producción, que se calcula como la sumatoria del producto de la unidad de producción de cada sector por el coeficiente que cuantifique las emisiones o absorciones asociados con cada gas, por unidad de actividad9.
8 Todo proceso, actividad o mecanismo que elimine de la atmósfera un gas de efecto invernadero, un aerosol o un precursor de un gas de efecto invernadero.
9 Para más información, véanse las “Directrices del IPCC de 2006 para los inventarios nacionales de gases de efecto invernadero” [en línea] http://www.ipcc-nggip. iges.or.jp/public/2006gl/spanish/index.html.
Emissions. The release of greenhouse gases or their precursors, or both, into the atmosphere in a particular area and during a given period.
Absorptions. The absorption of greenhouse gases or their precursors, or both, from the atmosphere by means of a sink.8
Carbon dioxide (CO2). A colourless, odourless, nontoxic gas released by combustion of fossil fuels and normally present in the air. It is also produced by the respiration of living organisms (plants and animals). It is considered to be the principal greenhouse gas. Also referred to as carbonic anhydride.
Methane (CH4). A gaseous, colourless, flammable and non-toxic hydrocarbon, which is formed in the anaerobic decomposition of organic compounds. Methane is a greenhouse gas.
Nitrous oxide (N2O). A relatively inert gas produced as a result of microbial activity in the soil, the use of nitrate fertilizers, wood-burning and so forth. This compound can contribute to the greenhouse effect and ozone depletion.
The 2006 guidelines of the Intergovernmental Panel on Climate Change (IPCC) divide estimates of greenhouse gas emissions and absorptions into five main sectors: energy; industrial processes and product use; agriculture, forestry and other land uses; waste; and other sources of emissions. Each area comprises individual categories (such as transport) and subcategories, (such as automobiles).
In general, the 2006 IPCC Guidelines for National Greenhouse Gas Inventories were used to calculate these variables. In its basic form, this methodology consists of an indirect estimate of emissions and absorptions from different sectors, on the basis of emission and absorption factors per unit of consumption or production, calculated as the sum of the output of each sector’s production unit multiplied by the emission or absorption.9
8 Any process, activity or mechanism that removes a greenhouse gas, aerosol or a precursor of a greenhouse gas from the atmosphere.
9 For further information, see “2006 IPCC Guidelines for National Greenhouse Gas Inventories” [online]://www.ipcc-nggip.iges.or.jp/public/2006gl/ index.html.

194 ECLAC, Statistical Yearbook for Latin America and the Caribbean, 2012
�3.7 Desastres naturales
Las series estadísticas presentadas en esta sección provienen de la base de datos de desastres (EM-DAT) del Centro para la Investigación de la Epidemiología de los Desastres (CRED)10.
Se presenta información sobre nueve desastres naturales, clasificados en cuatro grupos de acuerdo con el CRED: geofísicos (terremotos, erupciones volcánicas y desplazamientos de masa seca), meteorológicos (tormentas), hidrológicos (inundaciones y desplazamientos de masa húmeda) y climatológicos (temperaturas extremas, sequías e incendios). La importancia de estos eventos radica no solo en los daños que provocan en los recursos naturales y el medio ambiente en general, sino también en los efectos directos que tienen en los seres humanos.
Desastre. Un desastre es un evento calamitoso y repentino que trastorna seriamente el funcionamiento de una comunidad o sociedad y causa pérdidas humanas, materiales, económicas o ambientales que desbordan la capacidad de la comunidad o sociedad afectada para hacer frente a la situación con sus propios recursos.
Terremoto. Es el resultado de una liberación repentina de energía almacenada en la corteza terrestre que crea ondas sísmicas y provoca un desplazamiento del terreno. Su origen puede ser tectónico o volcánico.
Erupción volcánica. Comprende toda la actividad volcánica. Se considera actividad volcánica tanto el transporte de magma y gases a la superficie de la tierra (que puede ir acompañada de temblores y erupciones), como la interacción del magma y el agua (por ejemplo, las aguas subterráneas y los lagos de cráter) por debajo de la superficie de la tierra, lo que puede provocar erupciones freáticas. Dependiendo de la composición del magma, las erupciones pueden ser explosivas o efusivas, y dar lugar a caída de rocas, caída de ceniza, flujos de lava, flujos piroclásticos y emisión de gases.
Desplazamiento de masa seca. Comprende todo desplazamiento hacia abajo (vertical o inclinado en dirección al pie de una ladera) de un volumen importante de material litológico o de escombros, cuyos principales agentes detonantes son la gravedad y el agua. Pueden producirse por actividad sísmica, lluvias, erupciones volcánicas o impactos antropogénicos (erosión, actividades mineras y extracción de gas). Se consideran cuatro subtipos de desplazamientos de masa: los desprendimientos de rocas, las avalanchas, los deslizamientos de tierra y los hundimientos.10 La base de datos EM-DAT contiene datos esenciales sobre los principales
acontecimientos y los efectos de más de 17.000 desastres masivos en el mundo desde 1900. Está formada por datos de organismos de las Naciones Unidas, organizaciones no gubernamentales, empresas de seguros, institutos de investigación, la prensa y otras fuentes.
3.7 Natural disasters
The statistical series presented in this section are drawn from the Emergency Disasters Database (EM-DAT) of the Centre for Research on the Epidemiology of Disasters (CRED).10
Information is provided for nine types of natural disaster, which CRED classifies into four subgroups: geophysical (earthquakes, volcanic eruptions and dry mass movement), meteorological (storms), hydrological (flooding and wet mass movement) and weather (extreme temperatures, drought and fire). These kinds of incidents are important not only in terms of the damage they cause to natural resources and the environment as a whole, but also in terms of their direct impact on human beings.
Disaster. A disaster is a sudden, calamitous event, that causes serious upheaval in the functioning of a community or society, also causing loss of life and economic or environmental assets to such an extent that a community or society is incapable of responding using solely its own resources.
Earthquake. Earthquakes are the result of a sudden release of energy stored in the Earth’s crust, which creates seismic waves and causes land displacement. Earthquakes can be either tectonic or volcanic in origin.
Volcanic eruption. Refers to all volcanic activity, both the transport of magma and gases to the Earth’s surface (which may be accompanied by tremors and eruptions), and the interaction between magma and water underneath the Earth’s surface (for example, subterranean water and craterlakes), which can trigger phreatic eruptions. Depending on the magma’s composition, these eruptions may be either explosive or effusive and may cause rock slides, volcanic ash, lava flows, pyroclastic flows and gas emissions.
Dry mass movement. Refers to all downward slides (either vertical or downhill) of significant amounts of lithological material or debris, triggered primarily by gravity and water. Causes include seismic activity, rain, volcanic eruptions or anthropogenic impacts (erosion, mining and gas extraction). There are four subtypes of mass displacement: rockfall, avalanches, landslides and subsidence.
10 EM-DAT provides essential data on the main events and the effects of more than 17,000 large-scale disasters that have occurred in the world since 1900. The database is based on data from United Nations bodies, non-governmental organizations, insurance companies, research institutes, the press and other sources.

CEPAL, Anuario Estadístico de América Latina y el Caribe, 2012 195
Tormenta. Fenómeno meteorológico producido por variaciones en la temperatura de la atmósfera, que se manifiesta con viento, grandes nubes, violentas precipitaciones acompañadas de rayos, truenos y relámpagos. Se consideran tres subtipos de tormentas: las tormentas locales, los ciclones tropicales y los ciclones extratropicales (tormentas de invierno).
Inundación. Proceso durante el cual parte de la superficie terrestre queda cubierta temporalmente de agua ante el aumento significativo del nivel de un curso de agua, un lago, una reserva o una región costera (marejadas).
Desplazamiento de masa húmeda. Comprende todo desplazamiento hacia abajo (vertical o inclinado en dirección al pie de una ladera) de un volumen importante de material litológico o de escombros, cuyos principales agentes detonantes son la gravedad y el agua. Pueden producirse por saturación de agua en el suelo o degradación del permafrost. Se consideran cuatro subtipos de desplazamientos de masa: los desprendimientos de rocas, las avalanchas, los deslizamientos de tierra y los hundimientos.
Temperaturas extremas. Se consideran tres subtipos: las olas de calor, las olas de frío y las tormentas de invierno (inviernos extremos). Una ola de calor corresponde a un período prolongado de calor excesivo, a veces acompañado por humedad, en comparación con los patrones climatológicos normales de una región dada. Una ola de frío puede ser un período prolongado de frío excesivo o la incursión repentina de aire muy frío en una zona extensa. Las tormentas de invierno o inviernos extremos generan impactos a causa de la nieve y el hielo.
Sequía. Corresponde a un déficit de lluvias durante un período de tiempo prolongado (una temporada, un año o varios años) en relación con la media estadística multianual de la región en cuestión.
Incendio. Se refiere al fuego incontrolado, usualmente en áreas silvestres. Incluye dos subtipos de incendios: forestales y de tierras.
Para cada uno de los desastres naturales se presenta el número de eventos ocurridos, el número total de personas afectadas y las pérdidas humanas.
Número de eventos. Corresponde a la cantidad de desastres ocurridos en el período, en este caso, un año.
Personas afectadas. Da cuenta de la población que requiere asistencia básica inmediata, incluidos alimento, agua, abrigo, saneamiento y asistencia médica en un período de emergencia provocado por un desastre natural. Corresponde a la sumatoria del total de heridos, personas sin casa y afectados.
Pérdidas humanas. Incluye a las personas confirmadas como muertas o que se encuentran desaparecidas y presumiblemente muertas a causa del desastre natural.
El CRED contabiliza como desastre aquel evento que cumple al menos uno de los siguientes criterios:
Storms. Meteorological events caused by variations in atmospheric temperatures that manifest themselves through wind, large clouds, violent thunderstorms and lightning. There are three subtypes of storm: local storms, tropical cyclones and extratropical cyclones (winter storms).
Flooding. This refers to the temporary flooding of land surface as a result of a significant rise of water level in a water course, lake, reservoir or coastal area (ocean swell).
Wet mass movement. Downward slides (either vertical or downhill) of significant amounts of lithological material or debris, triggered primarily by gravity and water. Causes include soil saturated with water and degradation of the permafrost. There are four subtypes of mass displacement: rockfall, avalanches, landslides and subsidence.
Extreme temperatures. There are three subtypes: heatwaves, coldwaves and winter storms (extreme winters). A heatwave is an extended period of heat that exceeds the normal temperatures for a region, sometimes accompanied by humidity. A coldwave can be an extended period of excessively cold temperatures or a sudden burst of very cold air over an extended area. Snow and ice from winter storms and extreme winters cause impacts.
Drought. Refers to a rainfall deficit over an extended period of time, such as a season, a year or several years, as determined by multiyear statistical rainfall averages for the region in question.
Wildfires. Refers to uncontrolled fires, usually in wilderness areas. Includes two subtypes: forest and land fires.
For each type of natural disaster, the number of incidents, the total number of persons affected and human losses are provided.
Number of incidents. Refers to the number of disasters over a period of time; in this case, one year.
Persons affected. The number of persons affected refers to the population in need of immediate basic assistance, including food, water, shelter, sanitation and medical attention, during an emergency period following a natural disaster. Corresponds to the sum of all persons injured, left homeless or otherwise affected.
Human losses. Refers to those confirmed dead or those missing and presumed dead as a result of the natural disaster.
CRED records an incident as a disaster if it meets at least one of the following criteria:

196 ECLAC, Statistical Yearbook for Latin America and the Caribbean, 2012
• 10 o más personas consideradas muertas• 100 personas consideradas afectadas• Declaración de estado de emergencia• Solicitud de asistencia internacional
Atendiendo a un criterio geográfico, para el cálculo subregional, Cuba, Haití y la República Dominicana se consideraron parte del Caribe, y Belice se consideró parte de América Latina.
En el cálculo de las sumatorias subregionales y regionales, cada vez que un país no disponía de información para un año, se consideró un valor igual a 0.
El CRED, mediante la asignación de un único código a cada evento, permite evitar la doble (o múltiple) contabilización en las agregaciones regionales o subregionales. Por ejemplo, en el caso de una tormenta que afecte a varios países del Caribe, el agregado regional lo reportará como un solo evento.
�3.8 TransporteLa información presentada en esta sección proviene de la Asociación Latinoamericana de Ferrocarriles (ALAF), la Organización de Aviación Civil Internacional (OACI), la Federación Internacional de Carreteras y la Base de Estadísticas e Indicadores Sociales en CEPALSTAT de la CEPAL.
Estas series permiten mostrar la tendencia y posibles influencias de estos factores en el medio ambiente en general y la contaminación atmosférica en particular.
Parque automotor. Corresponde a todos los vehículos inscritos (matriculados) que existen en un año, menos las bajas producidas (vehículos sacados de circulación). Se incluyen autos particulares, autobuses y minibuses, camiones y camionetas, semirremolques y motocicletas. También se conoce con los nombres de parque vehicular y parque de vehículos.
Parque automotor por habitante. Corresponde al número de vehículos inscritos por cada 100 habitantes del respectivo país.
Longitud de la red de carreteras. Corresponde a la longitud total de los distintos caminos de un país.
Red ferroviaria. Se refiere al total de líneas ferroviarias en operación en cada uno de los países. Incluye las líneas electrificadas y las utilizadas tanto para el transporte de carga como de pasajeros.
Tráfico aéreo: pasajeros-kilómetros. Corresponde a la suma de los productos obtenidos al multiplicar el número de pasajeros transportados en cada etapa de vuelo por la longitud de la etapa; la cifra resultante es igual al número de kilómetros recorridos por los pasajeros.
Tráfico aéreo: kilómetros volados. Es la suma de los productos obtenidos al multiplicar el número de vuelos efectuados en cada etapa de vuelo por la longitud de la etapa.
• 10 or more persons reported dead• 100 persons reported affected• State of emergency declared• International assistance requested
Geographical criteria were applied that consider Cuba, Haiti and the Dominican Republic as part of the Caribbean, and Belize as part of Latin America.
In arriving at subregional and regional totals, the number of disasters was considered to be zero whenever a country did not have information available for a given year.
CRED assigns a unique code to each incident, thereby preventing double (or multiple) entry in the regional or subregional aggregates. For example, in the event of a storm that affects several Caribbean countries, the regional aggregates will report it as a single incident.
3.8 TransportThe information presented in this section comes from the Latin American Railways Association (ALAF), the International Civil Aviation Organization (ICAO), the International Road Federation (IRF) and the social statistics and indicators database in CEPALSTAT of ECLAC.
These series show trends and their possible influences on the environment as a whole and atmospheric pollution in particular.
Vehicle fleet. This refers to all registered vehicles existing in a given year less the reductions that have occurred (vehicles removed from circulation). It includes private cars, buses and minibuses, trucks and pickup trucks, semi-trailers and motorcycles. Also referred to as vehicle stock.
Vehicle fleet per capita. This corresponds to the number of vehicles registered per 100 inhabitants of the respective country.
Length of the road network. Refers to the total length of all roadways within a country.
Rail network. Refers to the total number of railways in operation in each country. Includes electric railways and those used for transporting both cargo and passengers.
Air traffic: passenger-kilometres. The sum of the products obtained by multiplying the number of passengers transported in each stage of a flight by the length of that stage; the resulting figure is equal to the number of kilometers travelled by the passengers.
Air traffic: kilometres flown. The sum of the products obtained by multiplying the number of flights made in each stage of a flight by the length of the stage.

CEPAL, Anuario Estadístico de América Latina y el Caribe, 2012 197
Tráfico aéreo: toneladas de carga-kilómetros. Corresponde a la suma de los productos obtenidos al multiplicar el número de toneladas de carga transportadas en cada etapa de vuelo por la longitud de la etapa.
�
3.9 Gestión ambiental
En esta sección se presentan estadísticas provenientes de la Organización Internacional de Normalización (ISO), de la División de Estadística y Proyecciones Económicas de la CEPAL, de los sitios web oficiales de cada uno de los acuerdos y del sitio web oficial de las Naciones Unidas sobre tratados.
Empresas certificadas ISO 14001. La norma internacional ISO 14001 es parte de la familia ISO 14000. Esta norma se aplica para cualquier empresa, sea cual sea su actividad, tamaño o país de operación, que pone en práctica un sistema de gestión ambiental, sobre la base del cumplimiento de la legislación nacional y el mejoramiento continuo de su desempeño. Su aplicación adecuada permite obtener esta certificación ambiental reconocida internacionalmente.
Las empresas que reciben la certificación ISO 14001 lo hacen respecto de su propio sistema de gestión ambiental, mediante la realización de auditorías ambientales diseñadas para evaluar el desempeño ambiental de la empresa.
Se presenta información sobre el número de empresas certificadas con ISO 14001 y el cociente entre el número de empresas certificadas y el PIB en dólares constantes de 2005. Este indicador se utiliza para poner el número absoluto de certificaciones en relación con el tamaño de la economía del país, a falta de estadísticas sobre el universo relevante, o sea, el número de empresas significativas por sector económico o su facturación anual.
Acuerdos multilaterales ambientales. Los acuerdos multilaterales ambientales corresponden a respuestas de política cuyo objetivo es proteger los bienes y servicios ambientales de cada país que tienen efectos globales. Estos acuerdos permiten establecer mecanismos de cooperación internacional e integrar la dimensión ambiental al desarrollo, respondiendo a los diversos problemas ambientales de escala global. Estos acuerdos constituyen una fuente importante de derecho ambiental internacional y contribuyen a la generación de las políticas de cada Estado en este tema.
En el contexto del derecho internacional y la práctica de los tratados, un acuerdo multilateral es sinónimo de convención, tratado y protocolo, teniendo las mismas características jurídicas.
El término “tratado multilateral” corresponde a una expresión genérica, que abarca todos los instrumentos
Air traffic: cargo ton-kilometres. The sum of the products obtained by multiplying the number of tons of cargo transported in each stage of a flight by the length of the stage.
3.9 Environmental management
This section presents statistics from the International Standards Organization, the ECLAC Statistics and Economic Projections Division, the official websites of each agreement and the official United Nations website on treaties.
ISO 14001 certified companies. The ISO 14001 is part of the ISO 14000 family. The standard applies to any company, irrespective of its activity, size or country of operation, that implements an environmental management system based on compliance with national legislation and ongoing performance improvement. This internationally recognized environmental certification is awarded for proper implementation of such polices and practices.
Companies obtain ISO 14001 certification on the basis of their own environmental management systems, which undergo environmental audits to evaluate their environmental performance.
Data is provided on the number of ISO 14001-certified companies and the ratio of certified companies to GDP, in dollars at constant 2005 prices. This indicator is used to state the absolute number of certifications relative to the size of a country’s economy in the absence of statistics about the relative universe; that is, the number of significant companies per economic sector or their annual sales figures.
Multilateral environmental agreements. These represent attempts to provide policy responses aimed at protecting environmental goods and services that are possessed by individual countries but have global impact. Such agreements make it possible to set up international cooperation mechanisms and mainstream environmental considerations in development, thus responding to diverse global-scale environmental problems. They represent a significant source of international environmental law and help States to establish policies in this area.
In the context of international law and treaty implementation, a multilateral agreement is synonymous with a convention, treaty or protocol, and has the same legal characteristics.
The term “multilateral agreement” is a generic term encompassing all instruments that are binding under

198 ECLAC, Statistical Yearbook for Latin America and the Caribbean, 2012
vinculantes con arreglo al derecho internacional, cualquiera sea su designación formal, concertados entre dos o más personas jurídicas internacionales. En la Convención de Viena sobre el derecho de los tratados de 1969 se define un tratado como un acuerdo internacional celebrado por escrito entre Estados y regido por el derecho internacional, ya conste en un instrumento único o en dos o más instrumentos conexos y cualquiera que sea su denominación particular. No existe una norma internacional respecto de cuándo un acuerdo internacional debe denominarse tratado, convención o acuerdo11.
Los Estados pueden convertirse en parte en un acuerdo multilateral por medio de los siguientes mecanismos:
Firma. La firma de un acuerdo es la primera manifestación política donde un Estado indica su intención de adoptar las medidas adecuadas para expresar su consentimiento y adquirir las obligaciones jurídicas emanadas del acuerdo en el futuro, mediante su ratificación, aceptación o aprobación. Esto concede a los Estados el tiempo necesario para incorporar el acuerdo en el plano nacional y para promulgar la legislación que se requiere para su aplicación interna. Generalmente se establece una fecha límite para la firma de un acuerdo después de la cual la firma ya no será posible. Una vez que el acuerdo se cierra para la firma, un Estado puede hacerse parte directamente por medio de la adhesión.
Ratificación, aceptación o aprobación. La ratificación, aceptación y aprobación (conforme a las cláusulas de cada acuerdo) corresponden a los modos más comunes en que un Estado puede llegar a ser parte de un acuerdo multilateral. Generalmente, hay un plazo límite en el cual se requiere que un Estado ratifique, acepte o apruebe un acuerdo que ha firmado. Una vez ratificado, aceptado o aprobado, el Estado acepta los derechos y obligaciones jurídicas que de ellos emanan. La fecha de entrada en vigor de un acuerdo es el momento en que pasa a ser jurídicamente vinculante para el Estado que lo suscribe.
Adhesión. La adhesión es el acto por el cual un Estado que no ha firmado una convención expresa su consentimiento de llegar a ser parte de ella depositando un instrumento de adhesión. La adhesión tiene los mismos efectos jurídicos que la ratificación, la aceptación o la aprobación. La emplean generalmente los Estados que desean expresar su consentimiento para obligarse según los términos un acuerdo cuando ha concluido el plazo para la firma. Muchas convenciones ambientales están abiertas a la adhesión desde el día siguiente a la fecha de cierre del período de firma, como se establece en el párrafo 1 del artículo 24 del Protocolo de Kyoto de la Convención Marco de las Naciones Unidas sobre el Cambio Climático, de 1997, entre otras.
11 Para mayor información sobre los tratados en general, véase el sitio web oficial sobre tratados de las Naciones Unidas [en línea] http://untreaty.un.org, y en particular sobre el derecho y la práctica de los tratados, véase Naciones Unidas, Manual de Tratados, sección de tratados de la Oficina de Asuntos Jurídicos, 2001. Publicación de las Naciones Unidas, Nº de venta: S.02.V.2.
international law, whatever their formal designation, signed by two or more international legal entities. The Vienna Convention on the Law of Treaties of 1969 defines a treaty as “an international agreement concluded between States in written form and governed by international law, whether embodied in a single instrument or in two or more related instruments and whatever its particular designation”. There is no international rule as to when an international accord should be designated a treaty or a convention or agreement.11
States may become parties to a convention or treaty in the following ways:
Signature. The signing of an agreement is the first step whereby a State indicates its intention to take the necessary measures to express its consent and assume the legal obligations arising from the convention at a later date, through its: ratification, acceptance or approval. This gives States the time to incorporate the convention at the national level and to promulgate the necessary national legislation for domestic implementation. Multilateral treaties usually provide that they will be open for signature only until a specified date, after which signature will no longer be possible. Once a treaty is closed for signature, a State may become a party to it by means of accession.
Ratification, acceptance or approval. Ratification, acceptance or approval (pursuant to the terms of each convention) are the most common means by which a State can become a party to a multilateral agreement. Usually, there is a deadline by which a State is required to ratify, accept or approve an agreement it has signed. Once a State has ratified, accepted or approved a convention, it assumes the legal obligations and rights contained therein. The date of entry into force of a convention is the moment it becomes legally binding for the State that is party to it.
Accession. Accession is the act whereby a State that has not signed a convention expresses its consent to become a party to it by depositing an “instrument of accession.” Accession has the same legal effect as ratification, acceptance or approval. Accession is the means usually employed by States wishing to consent to be bound under the terms of a convention after the deadline for signature has passed. Many environmental conventions are open for accession from the day following the closure of the period of signature, for example, as established in article 24, paragraph 1 of the Kyoto Protocol to the 1997 United Nations Framework Convention on Climate Change.
11 For more general information about the treaties, see the United Nations official website on treaties [online] http://untreaty.un.org, and for information specifically related to the law and practice of the treaties, see the United Nations Manual on Treaties, treaty section of the Office of Legal Affairs, 2001. United Nations publication, sales No. S.02.V.2
CEPAL, Anuario Estadístico de América Latina y el Caribe, 2012 199
En el cuadro se presenta información sobre los principales acuerdos ambientales multilaterales. Su orden de presentación atiende al año en que fue aprobado, año que puede coincidir con el año en que el acuerdo fue abierto para su firma, cuando procede.
Para cada acuerdo se presenta el año en que los países de la región firmaron el acuerdo y el año en el cual se hicieron parte de este (por medio de la ratificación, aceptación, aprobación o adhesión).
Los acuerdos multilaterales ambientales sobre los que se presenta información son los siguientes:• Convención de Ramsar relativa a los humedales de
importancia internacional, especialmente como hábitat de aves acuáticas: está orientada a detener la progresiva ocupación y desaparición de los humedales, en la actualidad y en el futuro, reconociendo sus fundamentales funciones ecológicas y su valor económico, cultural, científico y recreativo. Esta convención fue aprobada en 1971 y entró en vigor el 21 de diciembre de 1975.
• Convenio sobre la protección del patrimonio mundial, cultural y natural: está orientado a fomentar la identificación, protección y preservación del patrimonio cultural y natural de todo el mundo considerado valioso para la humanidad. Este Convenio fue impulsado por la Organización de las Naciones Unidas para la Educación, la Ciencia y la Cultura (UNESCO), aprobado en 1972 y entró en vigor el 15 de diciembre de 1975.
• Convención sobre el Comercio Internacional de Especies Amenazadas de Fauna y Flora Silvestres (CITES): su propósito es proteger ciertas especies en peligro de sobreexplotación debido al sistema de comercio internacional (importación y exportación). Esta convención fue aprobada en 1973 y entró en vigor el 1 de julio de 1975.
• Convención sobre la conservación de las especies migratorias de animales silvestres: su fin es proteger a las especies de animales silvestres que migran a través de los límites nacionales. Esta convención fue aprobada en 1979 y entró en vigor el 1 de noviembre de 1983.
• Convención de las Naciones Unidas sobre el Derecho del Mar: está orientada a establecer un nuevo régimen jurídico para los mares y océanos que facilite las comunicaciones y fomente el uso con fines pacíficos de los mares y océanos y la utilización equitativa y eficiente de sus recursos. Esta convención fue aprobada en 1982 y entró en vigor el 16 de noviembre de 1994.
• Convenio de Viena para la protección de la capa de ozono: su fin es proteger la salud humana y el medio ambiente de los efectos negativos producidos por las modificaciones de la capa de ozono. Este convenio fue aprobado en 1985 y entró en vigor el 22 de septiembre de 1988.
• Protocolo de Montreal relativo a las sustancias que agotan la capa de ozono: está destinado a proteger
The table contains data on the major multilateral environmental agreements. Data is presented in order by the year the agreement was approved, which could be the same as the year it was open for signing, as the case may be.
With respect to each agreement, the table shows the year in which the countries of the region signed and the year in which they became party to it (through ratification, acceptance, approval or accession).
Information is presented for the following multilateral environmental conventions:• The Ramsar Convention on Wetlands of International
Importance, especially as Waterfowl Habitat, whose main objective is to halt the progressive occupation and disappearance of wetlands now and in the future, recognizing their fundamental ecological functions and their economic, cultural, scientific and recreational value. This convention was adopted in 1971 and entered into force on 21 December 1975.
• The Convention Concerning the Protection of the World Cultural and Natural Heritage, which seeks to promote the identification, protection and preservation of cultural and natural heritage throughout the world that is considered of value for humanity. This Convention was brokered by the United Nations Educational, Scientific and Cultural Organization (UNESCO). It was adopted in 1972 and entered into force on 15 December 1975.
• The Convention on the International Trade in Endangered Species of Wild Fauna and Flora (CITES), whose purpose is to protect certain species that are in danger of overexploitation as a result of the system of international trade (import-export). This convention was adopted in 1973 and entered into force on 1 July 1975.
• The Convention on the Conservation of Migratory Species of Wild Animals, which aims to protect wild animal species that migrate across national boundaries. This convention was adopted in 1979 and entered into force on 1 November 1983.
• The United Nations Convention on the Law of the Sea, which seeks to establish a new legal regime for seas and oceans that facilitates communications and promotes the use of seas and oceans for peaceful purposes and the equitable and efficient use of their resources. This convention was adopted in 1982 and entered into force on 16 November 1994.
• The Vienna Convention for the Protection of the Ozone Layer, which aims to protect human health and the environment against the negative effects of changes in the ozone layer. This convention was adopted in 1985 and entered into force on 22 September 1988.
• The Montreal Protocol on Substances that Deplete the Ozone Layer, whose objective is to protect the ozone

200 ECLAC, Statistical Yearbook for Latin America and the Caribbean, 2012
la capa de ozono tomando medidas precautorias para controlar las emisiones globales de las sustancias que provocan su disminución. Este protocolo fue aprobado en 1987 y entró en vigor el 1 de enero de 1989.
• Convenio de Basilea sobre el control de los movimientos transfronterizos de los desechos peligrosos y su eliminación: su propósito es reducir el movimiento transfronterizo de los desechos peligrosos y su eliminación, en una forma que sea coherente con un manejo eficiente y ambientalmente adecuado de estos desechos. Este convenio fue aprobado en 1989 y entró en vigor en 1992.
• Convenio sobre la Diversidad Biológica: su fin es fomentar el uso sostenible de los componentes de la biodiversidad y una distribución equitativa de los beneficios generados por la utilización de los recursos genéticos. Este convenio fue aprobado en 1992 y entró en vigor el 29 de diciembre de 1993.
• Convención Marco de las Naciones Unidas sobre el Cambio Climático (CMNUCC): su fin es estabilizar las concentraciones de los gases de efecto invernadero en la atmósfera a un nivel que evite interferencias antrópicas peligrosas en el sistema climático. Esta convención fue aprobada en 1992 y entró en vigor en 1994.
• Convención de las Naciones Unidas de Lucha contra la Desertificación en los países afectados por sequía grave o desertificación, en particular en África: tiene por objeto combatir la desertificación y mitigar los efectos de la sequía en los países afectados. Esta convención fue aprobada en 1994 y entró en vigor el 26 de diciembre de 1996.
• Protocolo de Kyoto de la Convención Marco de las Naciones Unidas sobre el Cambio Climático: establece compromisos que fijan objetivos cuantificados y programados en el tiempo de reducción de emisiones de gases de efecto invernadero. Este protocolo fue aprobado en 1997 y entró en vigor el 16 de febrero de 2005.
• Convenio de Rotterdam sobre el procedimiento de consentimiento fundamentado previo aplicable a ciertos plaguicidas y productos químicos peligrosos objeto de comercio internacional: su propósito es fomentar la responsabilidad compartida y los esfuerzos conjuntos en la esfera del comercio internacional de ciertos compuestos químicos peligroso y plaguicidas, a fin de proteger la vida humana y el medio ambiente. Este convenio fue aprobado en 1998 y entró en vigor el 24 de febrero de 2004.
• Protocolo de Cartagena sobre Seguridad de la Biotecnología del Convenio sobre la Diversidad Biológica: tiene como propósito contribuir a garantizar un nivel adecuado de protección en la esfera de la transferencia, manipulación y utilización segura de los organismos vivos modificados resultantes de la
layer by taking precautionary measures to control global emissions of substances that cause its depletion. This protocol was adopted in 1987 and entered into force on 1 January 1989.
• The Basel Convention on the Control of Transboundary Movements of Hazardous Wastes and their Disposal, which aims to reduce cross-border movements and disposal of hazardous wastes, consistently with the principles of efficient and environmentally sound waste management. This Convention was adopted in 1989 and entered into force in 1992.
• The United Nations Convention on Biological Diversity, which is intended to promote the sustainable use of the components of biodiversity and to foster the equitable distribution of the benefits generated by the use of genetic resources. This convention was adopted in 1992 and entered into force on 29 December 1993.
• The United Nations Framework Convention on Climate Change (UNFCCC), whose aim is to stabilize greenhouse gas concentrations in the atmosphere at a level that would prevent dangerous anthropogenic interference with the climate system. This convention was adopted in 1992 and entered into force in 1994.
• The United Nations Convention to Combat Desertification in Those Countries Experiencing Serious Drought and or Desertification, particularly in Africa, which seeks to combat desertification and mitigate the effects of drought in affected countries. This convention was adopted in 1994 and entered into force on 26 December 1996.
• The Kyoto Protocol to the United Nations Framework Convention on Climate Change, which establishes commitments setting quantified and time-bound objectives for reducing greenhouse gas emissions. The protocol was adopted in 1998 and entered into force on 16 February 2005.
• The Rotterdam Convention on the Prior Informed Consent Procedure for Certain Hazardous Chemicals and Pesticides in International Trade, whose objective is to promote shared responsibility and joint efforts in the sphere of international trade in certain hazardous chemical compounds and pesticides in order to protect human life and the environment. This convention was adopted in 1998 and entered into force on 24 February 2004.
• The Cartagena Protocol on Biosafety to the Convention on Biological Diversity, which seeks to help guarantee an appropriate level of protection in the transfer, manipulation and safe use of modified living organisms resulting from modern biotechnology (genetically modified organisms or GMOs), that can have adverse

CEPAL, Anuario Estadístico de América Latina y el Caribe, 2012 201
biotecnología moderna (organismos genéticamente modificados) que puedan tener efectos adversos en la conservación y la utilización sostenible de la diversidad biológica, teniendo también en cuenta los riesgos para la salud humana y centrándose concretamente en los movimientos transfronterizos. Este protocolo fue aprobado en 2000 y entró en vigor el 11 de septiembre de 2003.
• Convenio de Estocolmo sobre contaminantes orgánicos persistentes: teniendo presente el criterio de precaución, consagrado en el principio 15 de la Declaración de Río sobre el Medio Ambiente y el Desarrollo, el objetivo del Convenio de Estocolmo es proteger la salud humana y el medio ambiente frente a los contaminantes orgánicos persistentes. Este convenio fue aprobado en 2001 y entró en vigor el 17 de mayo de 2004.
effects on the conservation and sustainable use of biological diversity, bearing in mind also the risks for human health and focusing specifically on transboundary movements.This Protocol was adopted in 2000 and entered into force on 11 September 2003.
• The Stockholm Convention on Persistent Organic Pollutants, whose purpose is to protect human health and the environment against persistent organic pollutants, bearing in mind the precautionary approach enshrined in principle 15 of the Rio Declaration. This Convention was adopted in 2001 and entered into force on 17 May 2004.

CEPAL, Anuario Estadístico de América Latina y el Caribe, 2012 203
Fuentes / Sources
�


CEPAL, Anuario Estadístico de América Latina y el Caribe, 2012 205
1. Estadísticas sociales/Social statistics
�
1.1 Población/Population
Centro Latinoamericano y Caribeño de Demografía (CELADE) - División de Población de la CEPAL/Latin American and Caribbean Demographic Centre (CELADE) - Population Division of ECLAC. Revisión 2011. Base de datos de población/The 2011 revision. Population database.División de Población de Naciones Unidas/United Nations Population Division: Panorama de la población mundial: revisión 2010. Base de datos de población/World Population Prospects: The 2010 Revision. Population Database. (Cuadros/Tables 1.1.1 al/through 1.1.10 y/and 1.1.16 al/through 1.1.18)División de Población de Naciones Unidas/United Nations Population Division: Panorama de urbanización mundial. Revisión 2011. Base de datos/World Urbanization Prospects: The 2011 Revision. Population Database. (Cuadro/Table 1.1.11)El envejecimiento de la población 1950-2050, Boletín Demográfico, N° 72 (LC/G.2211-P), Santiago de Chile, julio de 2003/Population ageing 1950-2050, Demographic Bulletin, No. 72 (LC/G.2211-P), Santiago, Chile, July 2003. (Cuadros/Tables 1.1.12, 1.1.19 y/and 1.1.20)Comisión Económica para América Latina y el Caribe (CEPAL), División de Estadísticas, Unidad de Estadísticas Sociales, sobre la base de tabulaciones especiales de encuestas de hogares de los respectivos países/Economic Commission for Latin America and the Caribbean (ECLAC), Statistics Division, Social Statistics Unit, on the basis of special tabulations of data from household surveys conducted in the respective countries.
(Cuadros/Tables 1.1.13 al/through 1.1.15 y/and 1.1.21)

206 ECLAC, Statistical Yearbook for Latin America and the Caribbean, 2012
1.2 Trabajo/Labour
Centro Latinoamericano y Caribeño de Demografía (CELADE) - División de Población de la CEPAL/Latin American and Caribbean Demographic Centre (CELADE) - Population Division of ECLAC: Observatorio Demográfico N° 2. Población económicamente activa 1990-2030/Demographic Observatory No. 2. Economically Active Population 1990-2030.
(Cuadros/Tables 1.2.1 y/and 1.2.2)Comisión Económica para América Latina y el Caribe (CEPAL), División de Estadísticas, Unidad de Estadísticas Sociales,
sobre la base de tabulaciones especiales de encuestas de hogares de los respectivos países/Economic Commission for Latin America and the Caribbean (ECLAC), Statistics Division, Social Statistics Unit, on the basis of special tabulations of data from household surveys conducted in the respective countries.
(Cuadros/Tables 1.2.3 al/through 1.2.16, 1.2.18 y/and 1.2.19)Comisión Económica para América Latina y el Caribe (CEPAL), División de Desarrollo Económico/Economic Commission
for Latin America and the Caribbean (ECLAC), Economic Development Division, sobre la base de datos oficiales nacionales proporcionados por las oficinas nacionales de estadística de los países/on the basis of official national data provided by the national statistical offices of the countries.
(Cuadro/Table 1.2.17)
1.3 Educación/Education
Comisión Económica para América Latina y el Caribe (CEPAL), División de Estadísticas, Unidad de Estadísticas Sociales, sobre la base de tabulaciones especiales de encuestas de hogares de los respectivos países/Economic Commission for Latin America and the Caribbean (ECLAC), Statistics Division, Social Statistics Unit, on the basis of special tabulations of data from household surveys conducted in the respective countries.
(Cuadros/Tables 1.3.2 y/and 1.3.6)Instituto de Estadística de la Organización de las Naciones Unidas para la Educación, la Ciencia y la Cultura (UNESCO)/
United Nations Educational, Scientific and Cultural Organization (UNESCO), Institute for Statistics. (Cuadros/Tables 1.3.1, 1.3.3 al/through 1.3.5, 1.3.7 al/through 1.3.14)
1.4 Salud/Health
A. Fuentes generales/General sources
Centro Latinoamericano y Caribeño de Demografía (CELADE) - División de Población de la CEPAL/Latin American and Caribbean Demographic Centre (CELADE) - Population Division of ECLAC. Revisión 2011. Base de datos de población/ The 2011 Revision. Population database.
Naciones Unidas, División de Población/United Nations Population Division: Panorama de la población mundial: revisión 2010. Base de datos de población/World Population Prospects: The 2010 Revision. Population Database.
(Cuadro/Table 1.4.2)Fondo de las Naciones Unidas para la Infancia (UNICEF)/United Nations Children Fund (UNICEF), Monitoreando la situación
de niños y mujeres. Bases de datos del final de la década. Nutrición infantil/Monitoring the Situation of Children and Women. End-decade database. Child nutrition.
Organización de las Naciones Unidas para la Alimentación y la Agricultura (FAO), Base de datos en línea: Estadísticas sobre seguridad alimentaria/Food and Agriculture Organization of the United Nations (FAO), Online database: Food Security Statistics.
Organización Mundial de la Salud (OMS), Fondo de las Naciones Unidas para la Infancia (UNICEF), Fondo de Población de las Naciones Unidas (UNFPA) y Banco Mundial, Trends in Maternal Mortality: 1990 to 2010/World Health Organization (WHO), United Nations Children’s Fund (UNICEF), United Nations Population Fund (UNFPA) and World Bank, Trends in Maternal Mortality: 1990 to 2010.
(Cuadros/Tables 1.4.1 y/and 1.4.5).
CEPAL, Anuario Estadístico de América Latina y el Caribe, 2012 207
B. Fuentes por países/Sources by country
Antiguas Antillas Neerlandesas/Former Netherlands Antilles: Central Bureau of Statistics, información en Internet/information from Internet, 2006.
Argentina: Instituto Nacional de Estadística y Censos, información directa/direct information, 2011.Aruba: Central Bureau of Statistics, información directa/direct information, 2011.Bahamas: Government of the Bahamas, Department of Statistics, información directa/direct information, 2011.Barbados: Barbados Statistical Service, información directa/direct information, 2011.Belice/Belize: Statistical Institute of Belize, información directa/direct information, 2010.Bolivia (Estado Plurinacional de)/Bolivia (Plurinational State of): Instituto Nacional de Estadística, información directa/
direct information, 2011.Brasil/Brazil: Instituto Brasileño de Geografía y Estadística, información directa/direct information, 2012. Chile: Instituto Nacional de Estadísticas, información directa/direct information, 2012.Colombia: Departamento Administrativo Nacional de Estadística, información en Internet/information from Internet, 2010. Costa Rica: Instituto Nacional de Estadística y Censos, información directa/direct information, 2012.Cuba: Oficina Nacional de Estadística, información directa/direct information, 2012.Dominica: Central Statistical Office, información directa/direct information, 2009.Ecuador: Instituto Nacional de Estadística y Censos, información directa/direct information, 2011.El Salvador: Dirección General de Estadística y Censos, información directa/direct information, 2011.Granada/Grenada: Government of Grenada, Central Statistical Office and Ministry of Health, información directa/direct
information, 2011.Guatemala: Instituto Nacional de Estadística, información directa/direct information, 2010.Guyana: Government of Guyana. Bureau of Statistics, información directa/direct information, 2010.Honduras: Instituto Nacional de Estadística, información directa/direct information, 2008.Islas Caimán/Cayman Islands: Economic and Statistics Office, información directa/direct information, 2012.Islas Turcas y Caicos/Turks and Caicos Islands: Statistical Office, Department of Economic Planning and Statistics, información
directa/direct information, 2007.Jamaica: Statistical Institute of Jamaica, Department of Statistics, información directa/direct information, 2005.México/Mexico: Instituto Nacional de Estadística, Geografía e Informática; Dirección General de Información en Salud,
Secretaría de Salud, información directa/direct information, 2012.Montserrat: Statistical Office, información directa/direct information, 2012.Nicaragua: Instituto Nacional de Información de Desarrollo, información directa/direct information, 2009.Panamá/Panama: Contraloría General de la República, Sección de Estadísticas Sociales, información directa/direct
information, 2012.Paraguay: Dirección General de Estadísticas y Censos, información directa/direct information, 2012.Perú/Peru: Instituto Nacional de Estadística e Informática, información directa/direct information, 2012.Puerto Rico: Instituto de Estadísticas de Puerto Rico, información directa/direct information, 2012.República Dominicana/Dominican Republic: Oficina Nacional de Estadística, información directa/direct information, 2011.Saint Kitts y Nevis/Saint Kitts and Nevis: Statistical Office, información directa/direct information, 2011.Santa Lucía/Saint Lucia: Statistical Department, información en Internet/information from Internet, 2006.San Vicente y las Granadinas/Saint Vincent and the Grenadines: Statistical Office, información directa/direct information, 2012.Suriname: Foundation General Bureau of Statistics, información directa/direct information, 2012.Trinidad y Tabago/Trinidad and Tobago: Government of Trinidad and Tobago, Central Statistical Office, información directa/
direct information, 2009.Uruguay: Instituto Nacional de Estadística, información directa/direct information, 2011.Venezuela (República Bolivariana de)/Venezuela (Bolivarian Republic of): Instituto Nacional de Estadística, información
directa/direct information, 2012. (Cuadros/Tables 1.4.3 al/through 1.4.4 y/and 1.4.6 al/through 1.4.7)

208 ECLAC, Statistical Yearbook for Latin America and the Caribbean, 2012
1.5 Vivienda y servicios básicos/Housing and basic services
Centro Latinoamericano y Caribeño de Demografía (CELADE) - División de Población de la CEPAL/Latin American and Caribbean Demographic Centre (CELADE) - Population Division of ECLAC: censos nacionales disponibles para los años alrededor de 1980, 1990 y 2000/national censuses, around 1980, 1990 and 2000.
(Cuadro/Table 1.5.2)Comisión Económica para América Latina y el Caribe (CEPAL), División de Estadísticas, Unidad de Estadísticas Sociales,
sobre la base de tabulaciones especiales de encuestas de hogares de los respectivos países/Economic Commission for Latin America and the Caribbean (ECLAC), Statistics Division, Social Statistics Unit, on the basis of special tabulations of data from household surveys conducted in the respective countries.
(Cuadro/Table 1.5.1)Organización Mundial de la Salud (OMS)/World Health Organization (WHO) - Fondo de las Naciones Unidas para la Infancia
(UNICEF)/United Nations Children’s Fund (UNICEF). Programa Conjunto de Monitoreo del Abastecimiento de Agua y del Saneamiento/Joint Monitoring Programme for Water Supply and Sanitation.
(Cuadro/Table 1.5.3)
1.6 Pobreza y distribución del ingreso/Poverty and income distribution
Comisión Económica para América Latina y el Caribe (CEPAL), División de Estadísticas, Unidad de Estadísticas Sociales, sobre la base de tabulaciones especiales de encuestas de hogares de los respectivos países/Economic Commission for Latin America and the Caribbean (ECLAC), Statistics Division, Social Statistics Unit, on the basis of special tabulations of data from household surveys conducted in the respective countries.
(Cuadros/ Tables 1.6.1 al/through 1.6.4)
1.7 Género/Gender
Comisión Económica para América Latina y el Caribe (CEPAL), División de Estadísticas, Unidad de Estadísticas Sociales, sobre la base de tabulaciones especiales de encuestas de hogares de los respectivos países/Economic Commission for Latin America and the Caribbean (ECLAC), Statistics Division, Social Statistics Unit, on the basis of special tabulations of data from household surveys conducted in the respective countries.
(Cuadros/Tables 1.7.1 y/and 1.7.4)Naciones Unidas, División de Estadísticas/United Nations Statistics Division: Base de datos de indicadores de los Objetivos
de Desarrollo del Milenio/Millennium Indicators Database. (Cuadro/Table 1.7.2)Unión Interparlamentaria (UIP)/Inter-Parliamentary Union (IPU), información proporcionada por los parlamentos nacionales/
information supplied by national parliaments. (Cuadro/Table 1.7.3)

CEPAL, Anuario Estadístico de América Latina y el Caribe, 2012 209
Por lo general, los institutos nacionales de estadística y los bancos centrales de América Latina y el Caribe que tienen bajo su responsabilidad la elaboración de las cuentas nacionales difunden sus resultados anuales y trimestrales a través de sus sitios web, a los que la CEPAL tuvo acceso para obtener las series de cuentas nacionales expresadas en moneda nacional.
2. Estadísticas económicas/Economic statistics
�
National statistical institutes and central banks in Latin America and the Caribbean which are responsible for preparing national accounts generally publish their annual and quarterly results on their websites, which ECLAC accessed in order to obtain the national accounts series expressed in national currencies.
B. Fuentes por países/Sources by country
Antigua y Barbuda/Antigua and Barbuda: Eastern Caribbean Central Bank, National Accounts Statistics.Argentina: Ministerio de Economía y Obras y Servicios Públicos, Sistema de Cuentas Nacionales de Argentina. Bahamas: The Central Bank of The Bahamas.Barbados: Barbados Statistical Service.Belice/Belize: Central Statistical Office.Bolivia (Estado Plurinacional de)/Bolivia (Plurinational State of): Instituto Nacional de Estadística, Sistema de Cuentas
Nacionales. Brasil/Brazil: Instituto Brasileño de Geografía y Estadística (IBGE), Sistema de Contas Nacionais.Chile: Banco Central de Chile, Anuario de cuentas nacionales.Colombia: Departamento Administrativo Nacional de Estadística (DANE). Costa Rica: Banco Central de Costa Rica, Cuentas Nacionales.Cuba: Oficina Nacional de Estadísticas (ONE), Anuario estadístico. Dominica: Eastern Caribbean Central Bank, National Accounts Statistics. Ecuador: Banco Central del Ecuador, Cuentas Nacionales.
2.1 Cuentas nacionales/National accounts
A. Fuentes generales/General sources
210 ECLAC, Statistical Yearbook for Latin America and the Caribbean, 2012
El Salvador: Banco Central de Reserva de El Salvador.Granada/Grenada: Eastern Caribbean Central Bank, National Accounts Statistics. Guatemala: Banco de Guatemala, Boletín estadístico, trimestral/quarterly. Guyana: Bank of Guyana.Haití/Haiti: Institut haïtien de statistique et d’informatique. Honduras: Banco Central de Honduras.Jamaica: The Statistical Institute of Jamaica.México/Mexico: Instituto Nacional de Estadística, Geografía e Informática (INEGI), Sistema de Cuentas Nacionales de México.Nicaragua: Banco Central de Nicaragua. Panamá/Panama: Instituto Nacional de Estadística y Censo.Paraguay: Banco Central del Paraguay, Sistema de Cuentas Nacionales del Paraguay.Perú/Peru: Instituto Nacional de Estadística e Informática.República Dominicana/Dominican Republic: Banco Central de la República Dominicana.Saint Kitts y Nevis/Saint Kitts and Nevis: Eastern Caribbean Central Bank, National Accounts Statistics.San Vicente y las Granadinas/Saint Vincent and the Grenadines: Eastern Caribbean Central Bank, National Accounts Statistics. Santa Lucía/Saint Lucia: Eastern Caribbean Central Bank, National Accounts Statistics.Suriname: Algemeen Bureau voor de Statistiek.Trinidad y Tabago/Trinidad and Tobago: Central Statistical Office. Uruguay: Banco Central del Uruguay.Venezuela (República Bolivariana de)/Venezuela (Bolivarian Republic of): Banco Central de Venezuela.
2.2 Sector externo/External sector
A. Fuentes generales/General sources
Asociación Latinoamericana de Integración (ALADI)/Latin American Integration Association, Estadísticas de comercio exterior/Foreign trade statistics.
Banco Mundial/World Bank, World Debt Tables, External Debt of Developing Countries.Clasificaciones estadísticas internacionales incorporadas en el banco de datos del comercio exterior de América Latina y
el Caribe de la CEPAL; revisión 3, serie Cuadernos estadísticos, Nº 36 (LC/G.2390-P), 2008/International statistical classifications included in the ECLAC Foreign Trade Data Bank for Latin America and the Caribbean (BADECEL), rev. 3. Cuadernos estadísticos series, No. 36 (LC/G.2390-P), 2008.
Comisión Económica para América Latina y el Caribe (CEPAL), División de Estadísticas, Banco de Datos del Comercio Exterior de América Latina y el Caribe (BADECEL). Contiene información sobre el comercio exterior de los países a partir de 1970, suministrada en soporte electrónico por la Asociación Latinoamericana de Integración (ALADI) y la Secretaría Permanente del Tratado General de Integración Económica Centroamericana (SIECA) y, en algunos casos, por los propios países. Esta base de datos se completó con información sobre los siguientes países y territorios: Antigua y Barbuda, antiguas Antillas Neerlandesas, Bahamas, Barbados, Belice, Dominica, Granada, Guadalupe, Guyana, Haití, Islas Caimán, Islas Vírgenes de los Estados Unidos, Jamaica, Martinica, Montserrat, Panamá, República Dominicana, San Vicente y las Granadinas, Santa Lucía y Trinidad y Tabago. La información fue suministrada por los propios países y por la División de Estadística de las Naciones Unidas / Economic Commission for Latin America and the Caribbean (ECLAC), Statistics Division, External Trade Data Bank for Latin America and the Caribbean (BADECEL). Contains foreign trade information on each of the countries concerned from 1970 on, provided in digital form by the Latin American Integration Association (LAIA) and by the Permanent Secretariat of the General Treaty on Central American Economic Integration (SIECA) and, in some cases, by the countries themselves. The database has also been supplemented with information on the following countries and territories: Antigua and Barbuda, Bahamas, Barbados, Belize, Cayman Islands, Dominica, Dominican Republic, Grenada, Guadeloupe, Guyana, Haiti, Jamaica, Martinique, Montserrat, the former Netherlands Antilles, Panama, Saint Lucia, Saint Vincent and the Grenadines, Trinidad and Tobago, United States Virgin Islands. Information was supplied by the countries in question and by the United Nations Statistics Division.
Conferencia de las Naciones Unidas sobre Comercio y Desarrollo (UNCTAD)/United Nations Conference on Trade and Development (UNCTAD), Manual de estadísticas del comercio internacional/Handbook of International Trade and

CEPAL, Anuario Estadístico de América Latina y el Caribe, 2012 211
development Statistics, Boletín mensual de precios de productos básicos/Monthly Commodity Price Bulletin, El transporte marítimo/Review of Maritime Transport.
United States Department of Commerce, Bureau of Economic Analysis, National Economic Accounts, Price Indexes for Exports and Imports of Goods and Services by Type of Product, Energy Information Administration, International Petroleum Information Page.
United States Department of Labor, Bureau of Labor Statistics, “US import and export price news release”, Economic News Release.Fondo Monetario Internacional (FMI)/International Monetary Fund (IMF), Estadísticas de balanza de pagos/Balance of
Payments Statistics, Estadísticas financieras internacionales/International Financial Statistics, Direction of Trade Statistics CD-ROM.
Fondo Monetario Internacional (FMI)/International Monetary Fund (IMF), Manual de balanza de pagos, quinta edición,1993/ Balance of Payments Manual, fifth edition, 1993; Balance of Payments Textbook, 1996.
Naciones Unidas/United Nations, International Trade Statistics Yearbook, Commodity Trade Database (COMTRADE)/Boletín de estadísticas mensuales/Monthly Bulletin of Statistics.
Organización de Aviación Civil Internacional (OACI), Estadísticas Mundiales de Aviación Civil, varios números/International Civil Aviation Organization (ICAO), Civil Aviation Statistics of the World, several issues.
Organización de Cooperación y Desarrollo Económicos (OCDE)/Organisation for Economic Co-operation and Development(OECD), Monthly Statistics of Foreign Trade, OECD Economic Outlook.
Organización de las Naciones Unidas para la Alimentación y la Agricultura (FAO), Anuario FAO de comercio y Boletín trimestral FAO de estadísticas/Food and Agriculture Organization of the United Nations (FAO), FAO Trade Yearbook and FAO Quarterly Bulletin of Statistics.
Organización de Países Exportadores de Petróleo (OPEP)/Organization of Petroleum-Exporting Countries (OPEC), OPEC Bulletin. Petroleum Intelligence Group, Petroleum Market Intelligence, Nueva York/New York.
Secretaría Permanente del Tratado General de Integración Económica Centroamericana (SIECA)/Permanent Secretariat of the General Treaty on Central American Economic Integration, Anuario estadístico centroamericano de comercio exterior. The Mining Journal Ltd., Mining Journal, Reino Unido/United Kingdom.
B. Fuentes por países/Sources by country
Argentina: Instituto Nacional de Estadística y Censos (INDEC), Ministerio de Economía (MECON), información oficial publicada en el sitio web/official information published on the website.
Barbados: Statistical Service, Monthly and Quarterly Digest of Statistics and Abstract of Statistics.Bolivia (Estado Plurinacional de)/Bolivia (Plurinational State of): Banco Central de Bolivia, Boletín Estadístico, información
oficial publicada en el sitio web/official information published on the website; Instituto Nacional de Estadística, Anuario de comercio exterior de la República.
Brasil/Brazil: Banco Central do Brasil, información oficial publicada en el sitio web/official information published on the website; Instituto Nacional de Estadística, Anuario de comercio exterior. FUNCEX Fundacao centro de estudos do comercio exterior. FUNCEX data.
Chile: Banco Central de Chile, información oficial publicada en el sitio web/official information published on the website. Colombia: Banco de la República de Colombia, información oficial publicada en el sitio web/official information published
on the website; Departamento Administrativo Nacional de Estadística (DANE).Costa Rica: Banco Central, información oficial publicada en el sitio web/official information published on the website;
Dirección General de Estadística y Censos. Cuba: Oficina Nacional de Estadísticas de la República de Cuba.Ecuador: Banco Central del Ecuador, información oficial publicada en el sitio web/official information published on the website. El Salvador: Banco Central de Reserva de El Salvador, información oficial publicada en el sitio web/official information
published on the website; Dirección General de Estadística y Censos.Guatemala: Banco de Guatemala, información oficial publicada en el sitio web/official information published on the website. Guyana: Statistical Bureau, Annual Account Relating to External Trade.Haití/Haiti: Administration générale des douanes, Annuaire du commerce extérieur d’Haïti/Banque de la République
d’Haïti.Honduras: Banco Central de Honduras, información oficial publicada en el sitio web/official information published on the
website; Dirección General de Estadística y Censos, Comercio exterior de Honduras.Jamaica: Bank of Jamaica, información oficial publicada en el sitio web/official information published on the website.

212 ECLAC, Statistical Yearbook for Latin America and the Caribbean, 2012
México/Mexico: Instituto Nacional de Estadística, Geografía e Informática; Secretaría de Programación y Presupuesto; Banco de México, información oficial publicada en el sitio web/official information published on the website.
Nicaragua: Banco Central de Nicaragua, información oficial publicada en el sitio web/official information published on the website.Panamá/Panama: Contraloría General de la República, Instituto Nacional de Estadística y Censos, información oficial
publicada en el sitio web/official information published on the website.Paraguay: Banco Central del Paraguay, información oficial publicada en el sitio web/official information published on the website.Perú/Peru: Banco Central de Reserva del Perú, información oficial publicada en el sitio web/official information published
on the website. República Dominicana/Dominican Republic: Banco Central de la República Dominicana, información oficial publicada en
el sitio web/official information published on the website.Trinidad y Tabago/Trinidad and Tobago: Central Bank of Trinidad and Tobago, Central Statistics Office, información oficial
publicada en el sitio web/official information published on the website.Uruguay: Banco Central del Uruguay, información oficial publicada en el sitio web/official information published on the website. Venezuela (República Bolivariana de)/Venezuela (Bolivarian Republic of): Banco Central de Venezuela, información oficial
publicada en el sitio web/official information published on the website.
C. Fuentes estadísticas sobre precios de los productos básicos/Statistical sources on commodity prices
Bananas Centroamérica y Ecuador, Precio de importación FOB puertos de los Estados Unidos/Central America and Ecuador, US importer’s price f.o.b. US ports (c/lb), UNCTAD
Azúcar/Sugar Promedio de los precios diarios del Convenio Internacional del Azúcar, FOB puertos del Caribe/average International Sugar Agreement (ISA) daily prices, f.o.b. Caribbean ports (cents/lb), UNCTAD
Camarón/Shrimp: US gulf Fondo Monetario Internacional, dólares/lb/International Monetary Fund dollars/lbCarne/Beef Australia y Nueva Zelandia, precio de importación de carne congelada deshuesada en los
Estados Unidos, FOB puerto de entrada/Australia and New Zealand, frozen boneless United States import price, f.o.b. entry port cents/lb, UNCTAD
Naranjas/Oranges (Exportadores mediterráneos) Navel, precio de importación indicativo CEE, CIF París, dólares/tonelada métrica, Banco Mundial/(Mediterranean exporters) navel, EEC indicative import price, c.i.f. Paris,US$/mt World Bank
Trigo/Wheat Estados Unidos, hard red winter Nº 2 (ordinario), FOB Golfo de México dólares/tonelada/United States, No. 2, hard red winter (ord.) f.o.b. gulf US dollars/ton, UNCTAD
Maíz/Maize Estados Unidos, dólar/tonelada métrica/United States, US dollars/metric ton, IMF Arroz/Rice Tailandés, blanco, 5% quebrantados, FOB Bangkok dólares/tonelada/ Thailand, white milled
5% broken, nominal price quotes, f.o.b. Bangkok dollars/ton, UNCTADPescado/ Fish Salmón noruego fresco, de criadero, precio de exportación (NorStat) dólares/kilo, Fondo Monetario
Internacional/Fresh Norwegian Salmon, farm bred, export price (NorStat) US$/kg, IMFCafé 1/Coffee 1 Arábicas colombianos suaves, franco muelle Nueva York/Colombian mild arabicas, ex-dock
New York, cents/lb. UNCTADCafé 2/Coffee 2 Arábicas brasileños y otros arábicas naturales, franco muelle Nueva York/Brazilian and other
natural arabicas, ex-dock New York, cents/lb, UNCTADTé/Tea Reino Unido, Fondo Monetario Internacional/United Kingdom (cents/kg), IMFCacao/Cocoa Promedio de las cotizaciones diarias del cacao en grano, Nueva York/Londres/Average of
daily prices, cocoa beans, New York/London, cents/lb, UNCTADAceite de soja/Soybean oil Países Bajos, FOB franco fábrica (dólares/tonelada)/The Netherlands, f.o.b. ex-mill
(US dollars/ton), UNCTADAceite de cacahuate Todos los orígenes, CIF Rotterdam dólares/toneladaGroundnut oil Any origin, c.i.f. Rotterdam US dollars/tonne, UNCTADAceite de palma/Palm oil Principalmente de Indonesia, 5% ffa (ácido graso libre), CIF puertos europeos del noroeste
dólares/tonelada/Mainly Indonesia, 5% ffa, c.i.f. N.W. European ports US dollars/tonne. UNCTADAceite de coco/Coconut oil Filipinas, CIF Rotterdam dólares/tonelada/Philippines, c.i.f. Rotterdam United States dollars/
tonne, UNCTADAceite de girasol/Sunflower oil Unión Europea, FOB, puertos europeos del noroeste EU, f.o.b., N.W. European ports,
US dollars/tonne. UNCTAD
CEPAL, Anuario Estadístico de América Latina y el Caribe, 2012 213
Aceite de grano de palma/ Malasia, CIF Rotterdam dólares/toneladaPalm kernel oil Malaysia c.i.f. Rotterdam US dollars/tonne, UNCTADSoja/Soybeans Estados Unidos, N° 2 amarilla, CIF Rotterdam dólares/tonelada/United States, No. 2 yellow,
c.i.f. Rotterdam US dollars/ton, UNCTADHarina de soja/ Soybean flour 44/45% proteína, Hamburgo, FOB franco fábrica dólares/tonelada Hamburg, 44/45% protein,
f.o.b. ex-mill US dollars/ton, UNCTADChapeado/Plywood Asia sudoriental, lauan, 3 capas, 182 cm x 91 cm x 4 mm, precio al por mayor en Tokio/
South-East Asia, Lauan, 3- ply, 182 cm x 91 cm x 4 mm, wholesale price spot Tokyo. US cents/sheet, UNCTAD
Pulpa de madera/ Wood pulp Suecia puertos Mar del Norte (US dólares/tonelada métrica) Sweden, North Sea ports (dollars/metric ton), IMF
Tabaco/Tobacco Sin elaborar, Estados Unidos, de importación general/Unmanufactured, United States import unit value cents/lb, UNCTAD
Caucho/Rubber Caucho (todos los orígenes), caucho corrugado ahumado (RSS) nº 1, en balas, Rubber Traders Association (RTA), al contado, Nueva York/Rubber (any origin), Ribbed Smoked Sheet (RSS) no. 1, in bales, Rubber Traders Association (RTA), spot, New York (UScents/kg,) UNCTAD
Lana/Wool Australia:48: lana burda dólares de los Estados Unidos/toneladas/Australia:48: coarse, US dollars/ton, IMF
Algodón/Cotton Índice A (m 1-3/32”), U.S. Memphis/Orleáns/Texas, cotizaciones de C/F Far East (lejano oriente)/United States Memphis/Orleans/Texas, Midd.1-3/32”, CFR Far Eastern quotations (cents/lb), UNCTAD
Pieles/Cattle hides Precio mayorista de Chicago, Estados Unidos, pieles pesadas de novillos FOB - punto de embarque/United States, Chicago, packer’s heavy native steers, f.o.b. shipping point US cents/lb, UNCTAD
Harina de pescado/ Fish meal 64/65% proteína, Bremen, precio franco transportista, dólares/tonelada 64/65% protein, Bremen, free carrier price, dollars/ton, UNCTAD
Yute/Jute Bangladesh, FOB mongla bwd dólares/tonelada/Bangladesh, f.o.b. mongla bwd. US dollars/ton, UNCTAD
Cobre/Copper Grado A, electrolíticos, barras de alambre/cátodos, bolsa de metales de Londres, al contado/London metal exchange, grade A, electrolytic wire bars/cathodes cash £/lb, UNCTAD
Mineral de hierro/Iron ore Brasil a Europa, Vale 64,5% contenido fe, FOB/Brazilian to Europe Vale, 64.5% fe, content f.o.b. (cents/Fe unit), UNCTAD
Producto de acero/ Índice de precios del acero Japón, Banco Mundial/Steel index Japan (2000=100), World Bank Steel product Aluminio/Aluminium Primera calidad, Bolsa de Metales de Londres, al contado/London Metal Exchange, high
grade, cash cents/lb, UNCTADPlata/Silver Nueva York, refinada, 99,9%, handy & harman cents/onza troy, Fondo Monetario Internacional/
Handy & Harman, 99.9% grade refined, New York cents/troy ounce, IMFZinc Calidad superior especial, Bolsa de Metales de Londres, precio en efectivo/London Metal
Exchange, special high grade, cash settlement cents/lb, UNCTADEstaño/Tin Bolsa de Metales de Londres, al contado/London Metal Exchange, cash, c/lb UNCTADNíquel/Nickel Canadá, dólares/tonelada métrica/Canada, US dollars/metric ton, IMFPlomo/Lead Bolsa de Metales de Londres, al contado/London Metal Exchange, cash cents/lb, UNCTADOro/Gold Fino, 99,5%, cotizaciones de la tarde en Londres dólares/onza troy, Fondo Monetario
Internacional/London, 99.5% fine, afternoon fixing US dollars/troy ounce, IMFPetróleo crudo/Crude oil Petróleo crudo, promedio simple de Dubai/Brent/Texas (dólares/barril) Crude petroleum,
average of Dubai/Brent/Texas equally weighted (US dollars/barrel) UNCTADGasolina sin plomo/Unleaded Gasolina para motores, regular sin plomo nominal (dólares/galón)/Motor gasoline Unleaded
regular nominal (Dollars per Gallon) U.S. Energy Information Administration (EIA)Carbón/Coal Australia, dólares/tonelada métrica Fondo Monetario Internacional/Australia, US dollars/
metric ton, IMFGas natural/Natural gas Estados Unidos, precio contado en Henry Hub dólares/mmbtu, Banco Mundial/United States
spot price at Henry Hub, Louisiana $/mmbtu, World Bank

214 ECLAC, Statistical Yearbook for Latin America and the Caribbean, 2012
2.3 Precios/Prices
A. Fuentes generales/General sources
Fondo Monetario Internacional (FMI), Estadísticas financieras internacionales/International Monetary Fund (IMF), International Financial Statistics.
Organización Internacional del Trabajo (OIT), Anuarios/International Labour Organization (ILO), Yearbooks.
B. Fuentes por países/Sources by country
Antigua y Barbuda/Antigua and Barbuda: Eastern Caribbean Central Bank, información directa/direct information.Argentina: Ministerio de Economía, Hacienda y Finanzas, Boletín semanal de economía/weekly economic bulletin; Instituto
Nacional de Estadística y Censos, Indec informa (boletín mensual/monthly bulletin). Barbados: Barbados Statistical Service, Monthly Digest of Statistics.Bahamas: Central Bank of The Bahamas, índice de precios al consumidor/Consumer price index.Belice/Belize: Central Statistical Office, información directa/direct information.Bolivia (Estado Plurinacional de)/Bolivia (Plurinational State of): Instituto Nacional de Estadística, Departamento de
Estadísticas Económicas, División de Precios, información directa/direct information.Brasil/Brazil: Instituto Brasileño de Geografía e Estadística, información directa/direct information: Instituto Brasileño de
Economía, Fundação Getúlio Vargas, Revista conjuntura econômica.Chile: Instituto Nacional de Estadística, información directa mensual/Consumer price index and direct monthly information.Colombia: Departamento Administrativo Nacional de Estadística, Índice de precios al consumidor (boletín mensual/monthly
bulletin); Banco de la República, Revista del Banco de la República, boletín mensual/monthly bulletin.Costa Rica: Instituto Nacional de Estadística y Censos, información directa/direct information.Cuba: Oficina Nacional de Estadística e Información, información directa/direct information.Dominica: Eastern Caribbean Central Bank, información directa/direct information.Ecuador: Instituto Nacional de Estadística y Censos, índice de precios al consumidor/consumer price index. El Salvador: Dirección General de Estadística y Censos, información directa/direct information.Granada/Grenada: Eastern Caribbean Central Bank, información directa/direct information.Guatemala: Instituto Nacional de Estadística, información directa/direct information.Guyana: Central Statistical Office, información directa/direct information.Haití/Haiti: Institut haïtien de statistique, Département des études économiques, Bulletin trimestriel de statistique; Bulletin
de la banque de la République d’Haïti e información directa/and direct information.Honduras: Banco Central de Honduras, Departamento de Estudios Económicos, índices de precios al consumidor e información
directa/consumer price indices and direct information.Jamaica: Statistical Institute of Jamaica. Department of Statistics, Consumer Price Indices (monthly bulletin).México/Mexico: Instituto Nacional de Estadística, Geografía e Informática; Secretaría de Programación y Presupuesto; Banco
de México, información oficial publicada en el sitio web/official information published on the website.Nicaragua: Banco Central de Nicaragua, índices de precios al consumidor e información directa/consumer price indices and
direct information.Panamá/Panama: Contraloría General de la República, Instituto Nacional de Estadística y Censo, información directa
mensual/direct monthly information.Paraguay: Banco Central del Paraguay, Departamento de Estudios Económicos, División de precios y mercado interno e
información directa/and direct information.Perú/Peru: Instituto Nacional de Estadística e Informática, índices de precios al consumidor (boletín mensual) e información
directa/Consumer price indices (monthly bulletin) and direct information.República Dominicana/Dominican Republic: Banco Central de la República Dominicana, Boletín mensual e información
directa/Monthly bulletin and direct information.Saint Kitts y Nevis/Saint Kitts and Nevis: Eastern Caribbean Central Bank, información directa/direct information.Santa Lucía/Saint Lucia: Eastern Caribbean Central Bank, información directa/direct information.San Vicente y las Granadinas/Saint Vincent and the Grenadines: Eastern Caribbean Central Bank, información directa/direct information.Suriname: Central Statistical Office, información directa/direct information.

CEPAL, Anuario Estadístico de América Latina y el Caribe, 2012 215
Trinidad y Tabago/Trinidad and Tobago: Central Statistical Office, Quarterly Economic Report; Central Bank of Trinidad and Tobago, Monthly Statistical Digest.
Uruguay: Instituto Nacional de Estadísticas, información directa/ direct information.Venezuela (República Bolivariana de)/Venezuela (Bolivarian Republic of): Banco Central de Venezuela, información directa/
direct information.
2.4 Estadísticas sectoriales/Sectoral statistics
Agricultura/AgricultureOrganización de las Naciones Unidas para la Alimentación y la Agricultura (FAO), Base de datos estadísticos en línea
FAOSTAT/Food and Agriculture Organization of the United Nations (FAO), FAO online Statistical Database FAOSTAT.
Minería y manufactura/Mining and manufactureDivisión de Estadística de las Naciones Unidas, Base de datos estadísticos en línea/United Nations Statistics Division
(UNSD), online Statistical Database.Instituto Latinoamericano del Fierro y el Acero (ILAFA)/Latin American Iron and Steel Institute. Instituto Internacional del Hierro y del Acero/International Iron and Steel Institute (IISI).Oficina Mundial de Estadísticas del Metal, Anuario Estadístico Mundial de Metales/World Bureau of Metal Statistics, World Metal Statistics Yearbook.Organización de las Naciones Unidas para la Alimentación y la Agricultura (FAO), Base de datos estadísticos en línea FAOSTAT/
Food and Agriculture Organization of the United Nations (FAO), FAO online Statistical Database FAOSTAT.Organización Internacional de Fabricantes de Vehículos de Motor/The International Organization of Motor Vehicle Manufacturers (OICA).Organización Latinoamericana de Energía (OLADE), Sistema de Información Económica-Energética (SIEE)/Latin American
Energy Organization (OLADE), Energy-Economic Information System.


CEPAL, Anuario Estadístico de América Latina y el Caribe, 2012 217
3. Estadísticas ambientales Environmental statistics
�
El capítulo de estadísticas ambientales contiene series estadísticas e indicadores obtenidos de dos tipos distintos de fuentes: organismos internacionales y organismos oficiales de los países. Las series estadísticas cuya fuente corresponde a organismos internacionales se publican además en la Base de Estadísticas e Indicadores Ambientales de CEPALSTAT de la Comisión Económica para América Latina y el Caribe (CEPAL). Las primeras abarcan las bases de datos de los organismos internacionales y sus publicaciones. La selección de este tipo de fuente responde a la gran cantidad de información que ofrecen algunos organismos, como resultado de sus procesos de compilación, validación y producción de estadísticas especializadas. La información de fuente nacional es proporcionada directamente por las instituciones oficiales responsables de las estadísticas ambientales en los países de la región. Estas series estadísticas no han sido actualizadas en esta versión del Anuario. A continuación se listan los organismos oficiales responsables de las series estadísticas de fuente nacional:
The chapter on environmental statistics contains statistical series and indicators obtained from two types of sources: international organizations and official bodies in the countries. The statistical series from international agencies sources are published in the Environmental Statistics and Indicators Databases in CEPALSTAT, of the Economic Commission for Latin America and the Caribbean (ECLAC).
The first type of source includes the databases of international organizations and their publications. This source was chosen because of the large volume of information provided by a number of organizations that compile, validate and produce specialized statistics.
Information from national sources is provided directly by the official institutions responsible for environmental statistics in the countries of the region. These series have not been updated in this version of the Yearbook.
There follows a list of the official agencies responsible for nationally-sourced statistical series:
Argentina: Instituto Nacional de Estadística y Censos (INDEC)/Secretaría de Ambiente y Desarrollo Sustentable. Belice/Belize: Ministry of Natural Resources and the Environment (MNREI).Bolivia (Estado Plurinacional de)/Bolivia (Plurinational State of): Instituto Nacional de Estadística (INE). Brasil/Brazil: Instituto Brasileño de Geografía y Estadística (IBGE).Chile: Instituto Nacional de Estadísticas (INE).Colombia: Departamento Administrativo Nacional de Estadística (DANE).Costa Rica: Instituto Nacional de Estadística y Censos (INEC)/Ministerio de Ambiente y Energía (MINAE).

218 ECLAC, Statistical Yearbook for Latin America and the Caribbean, 2012
Cuba: Oficina Nacional de Estadísticas (ONE).Ecuador: Instituto Nacional de Estadística y Censos (INEC).El Salvador: Ministerio de Ambiente y Recursos Naturales (MARN). Guatemala: Instituto Nacional de Estadística (INE).Honduras: Instituto Nacional de Estadística (INE).México/Mexico: Secretaría de Medio Ambiente y Recursos Naturales (SEMARNAT). Nicaragua: Ministerio del Ambiente y los Recursos Naturales (MARENA). Panamá/Panama: Contraloría General de la República, Dirección de Estadística y Censos. Paraguay: Dirección General de Estadística, Encuestas y Censos (DGEEC).Perú/Peru: Instituto Nacional de Estadística e Informática (INEI).República Dominicana/Dominican Republic: Secretaría de Estado de Medio Ambiente y Recursos Naturales. Uruguay: Instituto Nacional de Estadística (INE).Venezuela (República Bolivariana de)/Venezuela (Bolivarian Republic of): Instituto Nacional de Estadística (INE).
A continuación se presentan las fuentes utilizadas en cada sección del capítulo de estadísticas ambientales.
The following sections present the sources used in the environment statistics chapter.
3.1 Biota/BiotaUnión Internacional para la Conservación de la Naturaleza y Centro Mundial de Vigilancia de la Conservación del Programa
de las Naciones Unidas para el Medio Ambiente (PNUMA), Base de Datos Mundial sobre Áreas Protegidas, Cambridge, Reino Unido/International Union for Conservation of Nature (IUCN) and United Nations Environment Programme-World Conservation Monitoring Centre (UNEP-WCMC), The World Database on Protected Areas (WDPA), Cambridge, United Kingdom.
3.2 Agua/WaterOrganización de las Naciones Unidas para la Alimentación y la Agricultura (FAO), Sistema estadístico sobre el agua en la
agricultura (AQUASTAT)/Food and Agriculture Organization of the United Nations (FAO), Information System on Water and Agriculture AQUASTAT.
3.3 Mares y borde costero/Seas and coastal areasOrganización de las Naciones Unidas para la Alimentación y la Agricultura (FAO), Departamento de Pesca y Acuicultura,
base de datos de producción pesquera y acuícola mundial/Food and Agriculture Organization of the United Nations (FAO), Fisheries and Aquaculture Department, dataset of global capture and aquaculture production.
Organismos oficiales de los países de la región, información suministrada directamente a la División de Estadísticas de la CEPAL/Data from official bodies of the countries of the region, provided directly to the Statistics Division of ECLAC.
Unión Internacional para la Conservación de la Naturaleza y Centro Mundial de Vigilancia de la Conservación del Programa de las Naciones Unidas para el Medio Ambiente (PNUMA), Base de Datos Mundial sobre Áreas Protegidas, Cambridge, Reino Unido/International Union for Conservation of Nature (IUCN) and United Nations Environment Programme- World Conservation Monitoring Centre (UNEP-WCMC), The World Database on Protected Areas (WDPA), Cambridge, United Kingdom.
3.4 Tierras y suelos/Lands and soilsOrganización de las Naciones Unidas para la Alimentación y la Agricultura (FAO), Base de datos estadísticos sustantivos de
la Organización (FAOSTAT)/ Food and Agriculture Organization of the United Nations (FAO), Corporate Database for Substantive Statistical Data (FAOSTAT).
Organización de las Naciones Unidas para la Alimentación y la Agricultura (FAO), Programa de Evaluación de los Recursos Forestales Mundiales (FRA) 2010/Food and Agriculture Organization of the United Nations (FAO), Global Forest Resources Assessment 2010.

CEPAL, Anuario Estadístico de América Latina y el Caribe, 2012 219
3.5 Energía/EnergyComisión Económica para América Latina y el Caribe (CEPAL), División de Recursos Naturales e Infraestructura, Unidad
de Recursos Naturales y Energía/Economic Commission for Latin America and the Caribbean (ECLAC), Natural Resources and Infrastructure Division, Natural Resources and Energy Unit.
Comisión Económica para América Latina y el Caribe (CEPAL), Base de Estadísticas e Indicadores Económicos en CEPALSTAT/Economic Commission for Latin America and the Caribbean (ECLAC), Economic Statistics and Indicators Databases in CEPALSTAT.
Organización Latinoamericana de Energía (OLADE), Sistema de Información Económica-Energética (SIEE)/Latin American Energy Organization (OLADE), Energy-Economic Information System.
3.6 Aire y atmósfera/Air and atmosphere
Comisión Económica para América Latina y el Caribe (CEPAL), Base de Estadísticas e Indicadores Económicos en CEPALSTAT/Economic Commission for Latin America and the Caribbean (ECLAC), Economic Statistics and Indicators Databases in CEPALSTAT.
Comisión Económica para América Latina y el Caribe (CEPAL), Base de Estadísticas e Indicadores Sociales en CEPALSTAT/ Economic Commission for Latin America and the Caribbean (ECLAC), Social Statistics and Indicators Databases in CEPALSTAT.
Naciones Unidas, Base de datos de los indicadores de los Objetivos de Desarrollo del Milenio/United Nations, official Millennium Development Goals Indicators database.
Organismos oficiales de los países de la región, información suministrada directamente a la División de Estadísticas de la CEPAL/Data from official bodies of the countries of the region, provided directly to the Statistics Division of ECLAC.
Programa de las Naciones Unidas para el Medio Ambiente (PNUMA), Secretaría del Ozono, Centro de Acceso de Datos/United Nations Environment Programme (UNEP), Ozone Secretariat, Data Access Centre.
3.7 Desastres naturales/Natural disastersUniversidad Católica de Lovaina, Centro para la Investigación de la Epidemiología de los Desastres (CRED), base de datos
internacional de desastres (EM-DAT)/ Catholic University of Louvain, Centre for Research on the Epidemiology of Disasters (CRED), International Disaster Database (EM-DAT).
3.8 Transporte/TransportAsociación Latinoamericana de Ferrocarriles (ALAF)/Latin American Railways Association.Comisión Económica para América Latina y el Caribe (CEPAL), Base de Estadísticas e Indicadores Sociales en CEPALSTAT/
Economic Commission for Latin America and the Caribbean (ECLAC), Social Statistics and Indicators Databases in CEPALSTAT.
Federación Internacional de Caminos, Estadísticas mundiales sobre caminos/International Road Federation (IRF), World Road Statistics (WRS).
Organismos oficiales de los países de la región, suministrada directamente a la División de Estadísticas de la CEPAL/Data from official bodies of the countries of the region, provided directly to the Statistics Division of ECLAC.
Organización de Aviación Civil Internacional (OACI)/International Civil Aviation Organization (ICAO).
3.9 Gestión ambiental/Environmental managementColección de Tratados de las Naciones Unidas/United Nations Treaty Collection.Comisión Económica para América Latina y el Caribe (CEPAL), Base de Estadísticas e Indicadores Económicos en
CEPALSTAT/Economic Commission for Latin America and the Caribbean (ECLAC), Economic Statistics and Indicators Databases in CEPALSTAT.
Convención de las Naciones Unidas sobre el Derecho del Mar/United Nations Convention on the Law of the Sea. Convención de las Naciones Unidas de Lucha contra la Desertificación en los países afectados por sequía grave o desertificación,
en particular en África/ United Nations Convention to Combat Desertification in those Countries Experiencing Serious Drought and/or Desertification, particularly in Africa.
220 ECLAC, Statistical Yearbook for Latin America and the Caribbean, 2012
Convención relativa a los humedales de importancia internacional, especialmente como hábitat de aves acuáticas/Convention on Wetlands of International Importance especially as Waterfowl Habitat.
Convención Marco de las Naciones Unidas sobre el Cambio Climático/United Nations Framework Convention on Climate Change.
Convención sobre el Comercio Internacional de Especies Amenazadas de Fauna y Flora Silvestres (CITES)/Convention on International Trade in Endangered Species of Wild Fauna and Flora (CITES).
Convención sobre la conservación de las especies migratorias de animales silvestres/Convention on the Conservation of Migratory Species of Wild Animals.
Convenio de Basilea sobre el control de los movimientos transfronterizos de los desechos peligrosos y su eliminación/Basel Convention on the Control of Transboundary Movements of Hazardous Wastes and their Disposal.
Convenio de Estocolmo sobre contaminantes orgánicos persistentes/Stockholm Convention on Persistent Organic Pollutants.Convenio de Rotterdam sobre el procedimiento de consentimiento fundamentado previo aplicable a ciertos plaguicidas y
productos químicos peligrosos objeto de comercio internacional/Rotterdam Convention on the Prior Informed Consent Procedure for Certain Hazardous Chemicals and Pesticides in International Trade.
Convenio de Viena para la protección de la capa de ozono/Vienna Convention for the Protection of the Ozone Layer. Convenio sobre la protección del patrimonio mundial, cultural y natural/Convention Concerning the Protection of the World
Cultural and Natural Heritage; World Heritage Convention.Convenio sobre la Diversidad Biológica/Convention on Biological Diversity.Organización Internacional de Normalización (ISO), Encuesta ISO/International Organization for Standardization (ISO),
The ISO Survey.Protocolo de Cartagena sobre Seguridad de la Biotecnología del Convenio sobre la Diversidad Biológica/Cartagena Protocol
on Biosafety to the Convention on Biological Diversity; Biosafety Protocol.Protocolo de Kyoto de la Convención Marco de las Naciones Unidas sobre el Cambio Climático/Kyoto Protocol to the United
Nations Framework Convention on Climate Change.Protocolo de Montreal relativo a las sustancias que agotan la capa de ozono/Montreal Protocol on Substances that Deplete
the Ozone Layer.

Publicaciones de la CEPAL / ECLAC publications Comisión Económica para América Latina y el Caribe / Economic Commission for Latin America and the Caribbean
Casilla 179-D, Santiago de Chile. E-mail: [email protected] Véalas en: www.cepal.org/publicaciones
Publications may be accessed at: www.eclac.org
Revista CEPAL / CEPAL Review La Revista se inició en 1976 como parte del Programa de Publicaciones de la Comisión Económica para América Latina y el Caribe, con el propósito de contribuir al examen de los problemas del desarrollo socioeconómico de la región. Las opiniones expresadas en los artículos firmados, incluidas las colaboraciones de los funcionarios de la Secretaría, son las de los autores y, por lo tanto, no reflejan necesariamente los puntos de vista de la Organización.
La Revista CEPAL se publica en español e inglés tres veces por año. Los precios de suscripción anual vigentes son de US$ 30 para la versión en español y US$ 35 para la versión en inglés. El precio por
ejemplar suelto es de US$ 15 para ambas versiones. Los precios de suscripción por dos años son de US$ 50 para la versión en español y US$ 60 para la versión en inglés. CEPAL Review first appeared in 1976 as part of the Publications Programme of the Economic Commission for Latin America and the Caribbean, its aim being to make a contribution to the study of the economic and social development problems of the region. The views expressed in signed articles, including those by Secretariat staff members, are those of the authors and therefore do not necessarily reflect the point of view of the Organization.
CEPAL Review is published in Spanish and English versions three times a year. Annual subscription costs are US$ 30 for the Spanish version and US$ 35 for the English version. The price of single issues is US$ 15 for
both versions. The cost of a two-year subscription is US$ 50 for the Spanish version and US$ 60 for the English version.
Informes periódicos institucionales / Annual reports Todos disponibles para años anteriores / Issues for previous years also available • Informe macroeconómico de América Latina y el Caribe, junio de 2012, 86 p. • Macroeconomic Report on Latin America and the Caribbean - June 2012, 80 p. • Balance preliminar de las economías de América Latina y el Caribe 2011, 184 p. Preliminary Overview of the Economies of Latin America and the Caribbean 2011, 164 p. • Estudio económico de América Latina y el Caribe 2012. Documento informativo, 104 p. Economic Survey of Latin America and the Caribbean 2012. Briefing paper, 100 p. • Panorama de la inserción internacional de América Latina y el Caribe 2011-2012. Documento informativo, 178 p. Latin America and the Caribbean in the World Economy 2011-2012. Briefing paper, 60 p. • Panorama social de América Latina, 2011, 252 p. Social Panorama of Latin America, 2011, 242 p. • La inversión extranjera directa en América Latina y el Caribe 2011, 200 p. Foreign direct Investment in Latin America and the Caribbean 2011, 184 p. • Anuario estadístico de América Latina y el Caribe / Statistical Yearbook for Latin America and the Caribbean, 2011, 220 p.
Libros de la CEPAL 114 China y América Latina y el Caribe. Hacia una relación económica y comercial estratégica, Osvaldo Rosales y Mikio Kuwayama,
2012, 258 p. 114 China and Latin America and the Caribbean Building a strategic economic and trade relationship, Osvaldo Rosales y
Mikio Kuwayama, 2012, 244 p.

113 Competitividad, sostenibilidad e inclusión social en la agricultura: Nuevas direcciones en el diseño de políticas en América Latina y el Caribe, Octavio Sotomayor, Adrián Rodríguez y Mônica Rodrigues, 2012, 352 p.
112 El desarrollo inclusivo en América Latina y el Caribe. Ensayos sobre políticas de convergencia productiva para la igualdad, Ricardo Infante (editor), 2011, 384 p.
111 Protección social inclusiva en América Latina. Una mirada integral, un enfoque de derechos, Simone Cecchini y Rodrigo Martínez, 2011, 284 p.
110 Envejecimiento en América Latina. Sistema de pensiones y protección social integral, Antonio Prado y Ana Sojo (eds.), 2010, 304 p. 109 Modeling Public Policies in Latin America and the Caribbean, Carlos de Miguel, José Durán Lima, Paolo Giordiano, Julio Guzmán,
Andrés Schuschny and Masazaku Watanuki (eds.), 2011, 322 p. 108 Alianzas público-privadas. Para una nueva visión estratégica del desarrollo, Robert Devlin y Graciela Moguillansky, 2010, 196 p. 107 Políticas de apoyo a las pymes en América Latina. Entre avances innovadores y desafíos institucionales, Carlos Ferraro y Giovanni
Stumpo, 2010, 392 p. 106 Temas controversiales en negociaciones comerciales Norte-Sur, Osvaldo Rosales V. y Sebastián Sáez C. (compiladores), 2011, 322 p. 105 Regulation, Worker Protection and Active Labour-Market Policies in Latin America, Jürgen Weller (ed.), 2009, 236 p. 104 La República Dominicana en 2030: hacia una sociedad cohesionada, Víctor Godínez y Jorge Máttar (coords.), 2009, 582 p. 103 L’Amérique latine et les Caraïbes au seuil du troisième millénaire, 2009, 138 p. 102 Migración interna y desarrollo en América Latina entre 1980 y 2005, Jorge Rodríguez y Gustavo Busso, 2009, 272 p. 101 Claves de la innovación social en América Latina y el Caribe, Adolfo Rodríguez Herrera y Hernán Alvarado Ugarte, 2009, 236 p.
Copublicaciones recientes / Recent co-publications Sentido de pertenencia en sociedades fragmentadas. América Latina desde una perspectiva global, Martín Hopenhayn y Ana Sojo (comps.),
CEPAL/Siglo Veintiuno, Argentina, 2011. Las clases medias en América Latina. Retrospectiva y nuevas tendencias, Rolando Franco, Martín Hopenhayn y Arturo León (eds.),
CEPAL/Siglo XXI, México, 2010. Innovation and Economic Development. The Impact of Information and Communication Technologies in Latin America, Mario Cimoli,
André Hofman and Nanno Mulder, ECLAC/Edward Elgar Publishing, United Kingdom, 2010. Sesenta años de la CEPAL. Textos seleccionados del decenio 1998-2008, Ricardo Bielschowsky (comp.), CEPAL/Siglo Veintiuno, Argentina, 2010. El nuevo escenario laboral latinoamericano. Regulación, protección y políticas activas en los mercados de trabajo, Jürgen Weller (ed.),
CEPAL/Siglo Veintiuno, Argentina, 2010. Internacionalización y expansión de las empresas eléctricas españolas en América Latina, Patricio Rozas, CEPAL/Lom, Chile, 2009. Gobernanza corporativa y desarrollo de mercados de capitales en América Latina, Georgina Núñez, Andrés Oneto y Germano M. de Paula
(coords.), CEPAL/Mayol, Colombia, 2009.
Coediciones recientes / Recent co-editions Reforma fiscal en América Latina. ¿Qué fiscalidad para qué desarrollo?, Alicia Bárcena y Narcís Serra (editores), CEPAL/SEGIB/CIDOB,
Chile, 2012. La sostenibilidad del desarrollo a 20 años de la Cumbre para la Tierra. Avances, brechas y lineamientos estratégicos para América Latina y
el Caribe, CEPAL/Naciones Unidas, 2012. Sustainable development 20 years on from the Earth Summit. Progress, gaps and strategic guidelines for Latin America and the
Caribbean, ECLAC/United Nations, 2012. Perspectivas económicas de América Latina 2012.Transformación del Estado para el desarrollo, CEPAL/OCDE, 2011. Latin America Outlook 2012. Transforming the State for Development, ECLAC/OECD, 2011. Perspectives économiques de l’Amérique latine 2012. Transformation de l’État et Développement, CEPALC/OCDE, 2012. Breeding Latin American Tigers. Operational principles for rehabilitating industrial policies, Robert Devlin and
Graciela Moguillansky, ECLAC/World Bank, 2011. Espacios iberoamericanos: Hacia una nueva arquitectura del Estado para el desarrollo, CEPAL/SEGIB, 2011. Espaços ibero-americanos: A uma nova arquitetura do Estado para o desenvolvimento. CEPAL/SEGIB, 2011. Perspectivas de la agricultura y del desarrollo rural en las Américas: una mirada hacia América Latina y el Caribe, CEPAL/FAO/IICA, 2011. The Oulook for Agriculture and Rural Development in the Americas: A Perspective on Latin America and the Caribbean,
ECLAC/FAO/IICA, 2011. Pobreza infantil en América Latina y el Caribe, CEPAL/UNICEF, Chile, 2010. Espacios iberoamericanos: vínculos entre universidades y empresas para el desarrollo tecnológico, CEPAL/SEGIB, 2010 Espaços ibero-Americanos: vínculos entre universidades e empresas para o desenvolvimento tecnológico, CEPAL/SEGIB, 2010. Clases medias y desarrollo en América Latina, Alicia Bárcena y Narcís Serra (eds.), CEPAL/SEGIB/CIDOB, Chile, 2010.

Cuadernos de la CEPAL 100 Construyendo autonomía. Compromiso e indicadores de género, Karina Batthyáni Dighiero, 2012, 338 p. 99 Si no se cuenta, no cuenta, Diane Alméras y Coral Calderón Magaña (coords.), 2012, 394 p. 98 Macroeconomic cooperation for uncertain times: The REDIMA experience, Rodrigo Cárcamo-Díaz, 2012,164 p. 97 El financiamiento de la infraestructura: Propuestas para el desarrollo sostenible de una política sectorial, Patricio Rozas Balbontín, José
Luis Bonifaz y Gustavo Guerra-García, 2012, 414 p. 96 Una mirada a la crisis desde los márgenes, Sonia Montaño (coord.), 2011, 102 p. 95 Programas de transferencias condicionadas. Balance de la experiencia reciente en América Latina y el Caribe, Simone Cecchini y Aldo
Madariaga, 2011, 226 p. 95 Conditional cash transfer programmes. The recent experience in Latin America and the Caribbean, Simone Cecchini and Aldo
Madariaga, 2011, 220 p. 94 El cuidado en acción. Entre el derecho y el trabajo, Sonia Montaño Virreira y Coral Calderón Magaña (coords.), 2010, 236 p. 93 Privilegiadas y discriminadas. Las trabajadoras del sector financiero, Flavia Marco Navarro y María Nieves Rico Ibáñez (eds.),
2009, 300 p.
Cuadernos estadísticos de la CEPAL 40 América Latina y el Caribe: Índices de precios al consumidor: Solo disponible en CD, 2012. 39 América Latina y el Caribe: indicadores macroeconómicos del turismo. Solo disponible en CD, 2010. 38 Indicadores ambientales de América Latina y el Caribe, 2009. Solo disponible en CD, 2010. 37 América Latina y el Caribe: Series históricas de estadísticas económicas 1950-2008. Solo disponible en CD, 2009. 36 Clasificaciones estadísticas internacionales incorporadas en el Banco de Datos de Comercio Exterior de América Latina y el Caribe de la
CEPAL (Revisión 3). Solo disponible en CD, 2008.
Observatorio demográfico / Demographic Observatory Edición bilingüe (español e inglés) que proporciona información estadística actualizada, referente a estimaciones y proyecciones de población de los países de América Latina y el Caribe. Incluye también indicadores demográficos de interés, tales como tasas de natalidad, mortalidad, esperanza de vida al nacer, distribución de la población, etc.
El Observatorio aparece dos veces al año, en los meses de enero y julio. Suscripción anual: US$ 25. Valor por cada ejemplar: US$ 15. Bilingual publication (Spanish and English) proving up-to-date estimates and projections of the populations of the Latin American and Caribbean countries. Also includes various demographic indicators of interest such as fertility and mortality rates, life expectancy, measures of population distribution, etc.
The Observatory appears twice a year in January and July. Annual subscription: US$ 25. Per issue: US$ 15.
Notas de población Revista especializada que publica artículos e informes acerca de las investigaciones más recientes sobre la dinámica demográfica en la región, en español, con resúmenes en español e inglés. También incluye información sobre actividades científicas y profesionales en el campo de población.
La revista se publica desde 1973 y aparece dos veces al año, en junio y diciembre. Suscripción anual: US$ 20. Valor por cada ejemplar: US$ 12.
Specialized journal which publishes articles and reports on recent studies of demographic dynamics in the region, in Spanish with abstracts in Spanish and English. Also includes information on scientific and professional activities in the field of population.
Published since 1973, the journal appears twice a year in June and December. Annual subscription: US$ 20. Per issue: US$ 12.
Series de la CEPAL Comercio internacional / Desarrollo productivo / Desarrollo territorial / Estudios estadísticos y prospectivos / Estudios y perspectivas (Bogotá, Brasilia, Buenos Aires, México, Montevideo) / Studies and Perspectives (The Caribbean, Washington) / Financiamiento del desarrollo / Gestión pública / Informes y estudios especiales / Macroeconomía del desarrollo / Manuales / Medio ambiente y desarrollo / Mujer y desarrollo / Población y desarrollo / Políticas sociales / Recursos naturales e infraestructura / Seminarios y conferencias. Véase el listado completo en: www.cepal.org/publicaciones / A complete listing is available at: www.cepal.org/publicaciones

Las publicaciones de la Comisión Económica para América Latina y el Caribe (CEPAL) y las del Instituto Latinoamericano y del Caribe de Planificación Económica y Social (ILPES) se pueden adquirir a los distribuidores locales o directamente a través de:
Publicaciones de las Naciones Unidas Publicaciones de las Naciones Unidas 2 United Nations Plaza, Room DC2-853 Sección de Ventas Nueva York, NY, 10017 Palais des Nations Estados Unidos 1211 Ginebra 10 Tel. (1 800)253-9646 Fax (1 212)963-3489 Suiza E-mail: [email protected] Tel. (41 22)917-2613 Fax (41 22)917-0027 Unidad de Distribución Comisión Económica para América Latina y el Caribe (CEPAL) Av. Dag Hammarskjöld 3477, Vitacura 7630412 Santiago Chile Tel. (56 2)210-2056 Fax (56 2)210-2069 E-mail: [email protected]
Publications of the Economic Commission for Latin America and the Caribbean (ECLAC) and those of the Latin American and the Caribbean Institute for Economic and Social Planning (ILPES) can be ordered from your local distributor or directly through:
United Nations Publications United Nations Publications 2 United Nations Plaza, Room DC2-853 Sales Sections New York, NY, 10017 Palais des Nations USA 1211 Geneva 10 Tel. (1 800)253-9646 Fax (1 212)963-3489 Switzerland E-mail: [email protected] Tel. (41 22)917-2613 Fax (41 22)917-0027 Distribution Unit Economic Commission for Latin America and the Caribbean (ECLAC) Av. Dag Hammarskjöld 3477, Vitacura 7630412 Santiago Chile Tel. (56 2)210-2056 Fax (56 2)210-2069 E-mail: [email protected]

Publicación de las Naciones UnidasISBN 978-92-1-021088-1
E-ISBN 978-92-1-055364-3S1200867 - Diciembre de 2012
ISSN 1014-0697Número de venta E/S.13.II.G.1
Copyright © Naciones Unidas 2012Impreso en Santiago de Chile
www.cepal.org
COMISIÓN ECONÓMICA PARA AMÉRICA LATINA Y EL CARIBE (CEPAL)
ECONOMIC COMMISSION FOR LATIN AMERICA AND THE CARIBBEAN (ECLAC)
An
ua
rio
Esta
dís
tic
o d
e A
mé
rica
La
tina
y e
l Ca
ribe
Sta
tisti
ca
l Ye
arb
oo
k o
f Lat
in A
me
rica
and
th
e C
arib
be
an


![anuario estadístico 2013 - aluminiocaiama.org · anuario estadístico 2013 13 consumo doméstico evolución del consumo por producto [ton] producto chapas y rollos laminados estándar](https://static.documents.pub/doc/80x56/5f18673f6004897edc08091a/anuario-estadstico-2013-anuario-estadstico-2013-13-consumo-domstico-evolucin.jpg)


