+ All Categories
Home > Documents > Anuario 2011 bis - aluminiocaiama.org · Anuario Estadístico 2011 Saldo de la balanza comercial de...

Anuario 2011 bis - aluminiocaiama.org · Anuario Estadístico 2011 Saldo de la balanza comercial de...

Date post: 31-Aug-2019
Category:
Upload: others
View: 1 times
Download: 0 times
Share this document with a friend
34
Industria del Aluminio en Argentina Anuario Estadístico 2011 Saldo de la balanza comercial de la industria del aluminio +501 millones de us$ Puerto Madero - Ciudad Autónoma de Buenos Aires Consumo “per capita” 5,7 kilos/hab. Variación interanual del consumo doméstico +9,7%
Transcript

Industria del Aluminio en Argentina

Anuario Estadístico 2011

Saldo de la balanza comercial de la industria del

aluminio

+501millonesde us$

Puerto Madero - Ciudad Autónoma de Buenos Aires

Consumo“per capita”

5,7kilos/hab.

Variación interanual del consumodoméstico

+9,7%

Aluminum Industry in Argentina

2011 Statistical Yearbook

Aluminum industry foreign trade

balance

+501million us$

Puerto Madero - Ciudad Autónoma de Buenos Aires

“Per capita” consumption

5,7kilos/inhab.

Inter-annual variation of domestic

consumption

+9,7%

3Anuario Estadístico 2011

Anuario estadístico 2011

Editorial .............................................................................................................................................................................. 5

Consumo doméstico

Consumo total por origen ................................................................................................................................................... 7

Consumo total por producto y sector ................................................................................................................................. 9

Evolución del consumo total ............................................................................................................................................... 11

Evolución del consumo por producto .................................................................................................................................. 13

Evolución del consumo por sector ....................................................................................................................................... 15

Evolución del consumo “per capita” .................................................................................................................................... 17

Comercio exterior

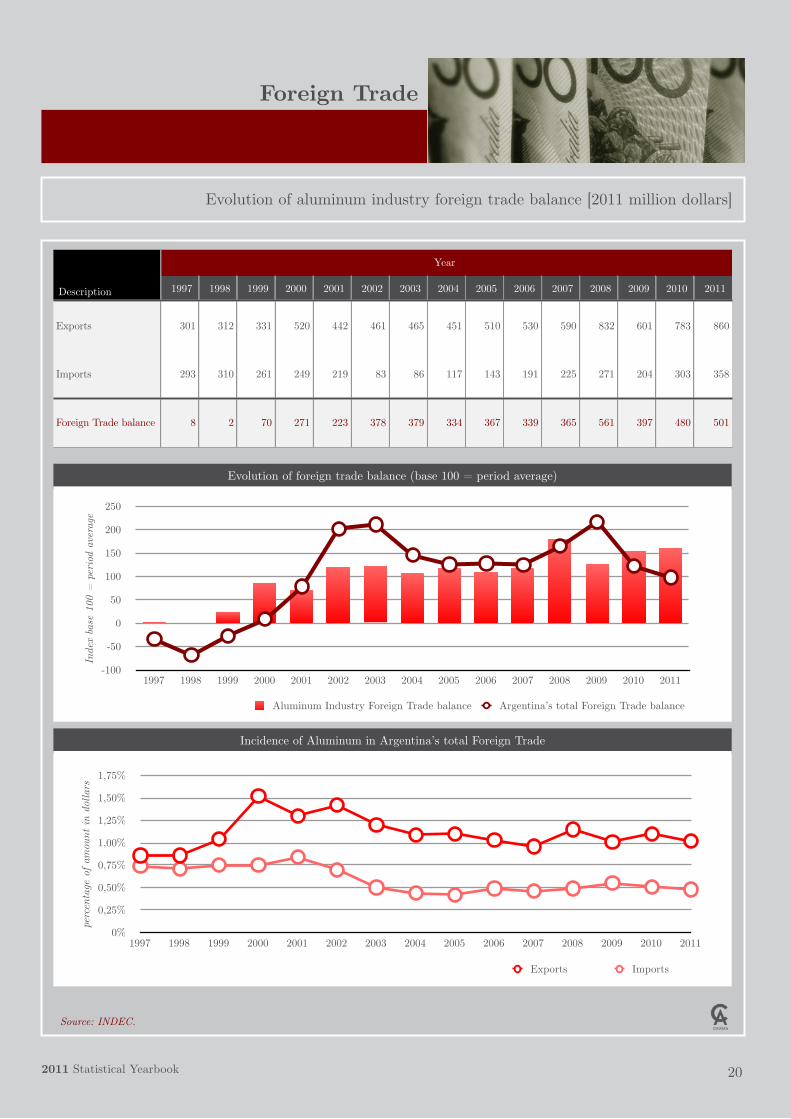
Evolución del saldo comercial de la industria del aluminio ................................................................................................. 19

Evolución de las exportaciones ........................................................................................................................................... 21

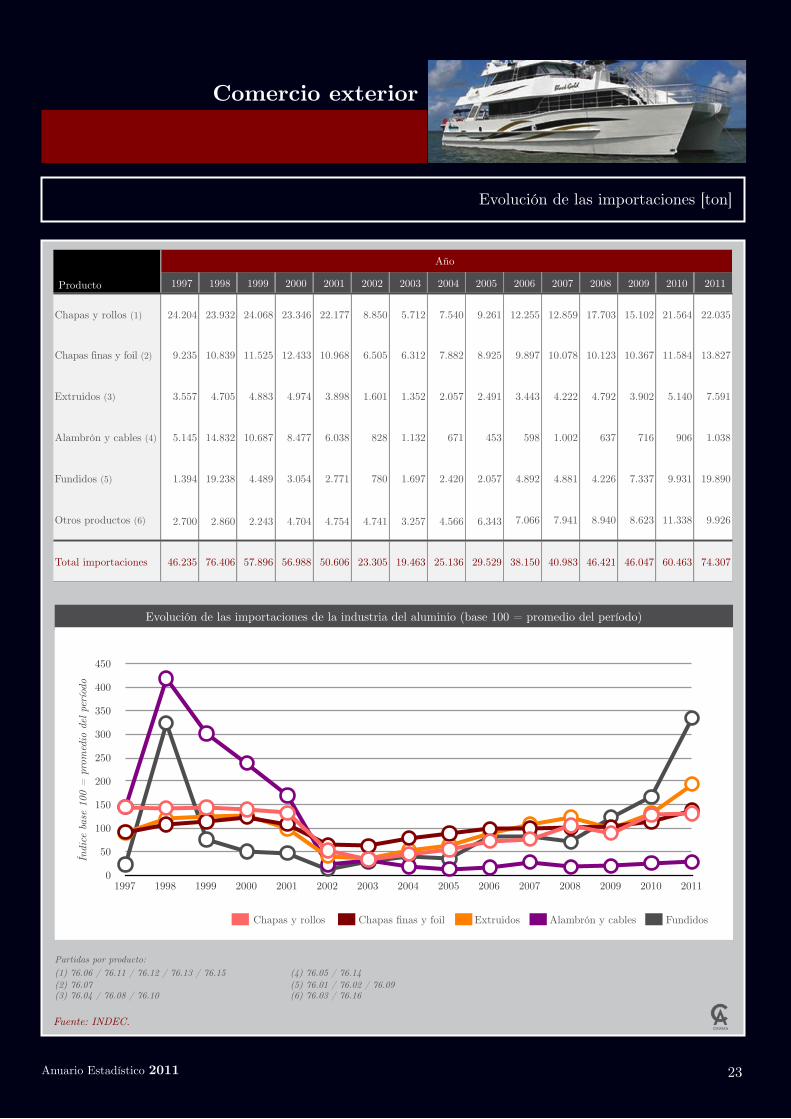
Evolución de las importaciones ........................................................................................................................................... 23

Indicadores económicos

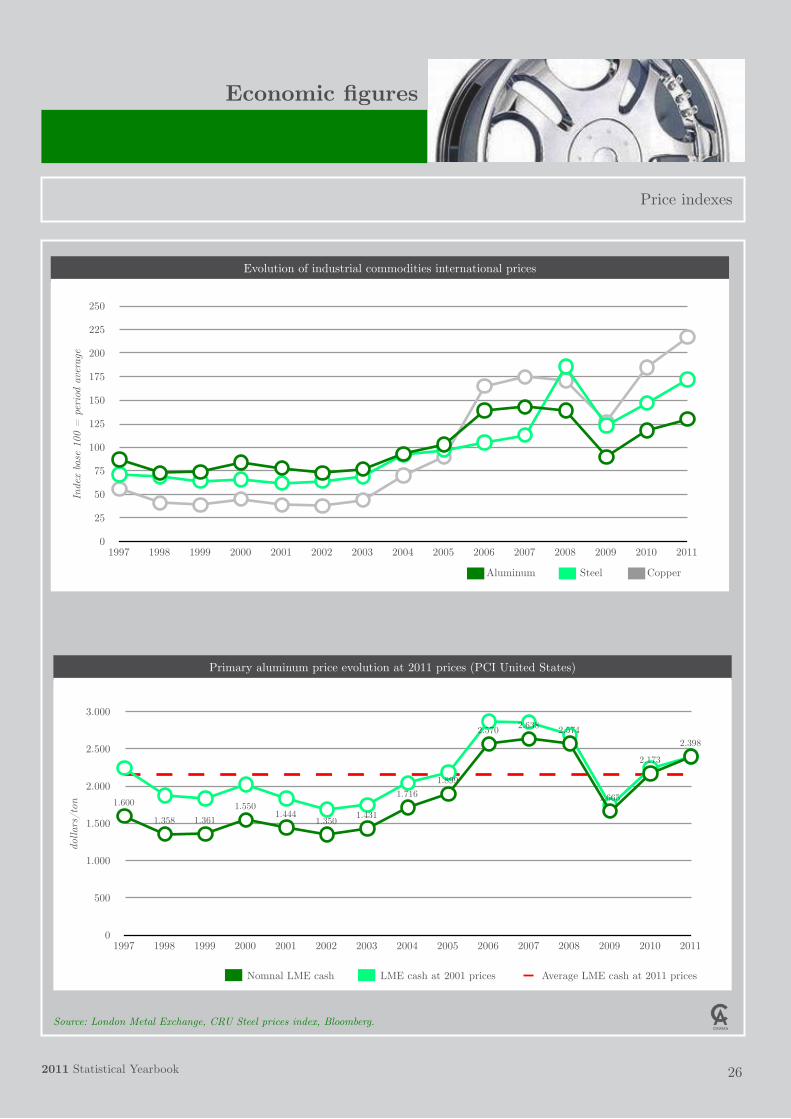
Indicadores de precios ......................................................................................................................................................... 25

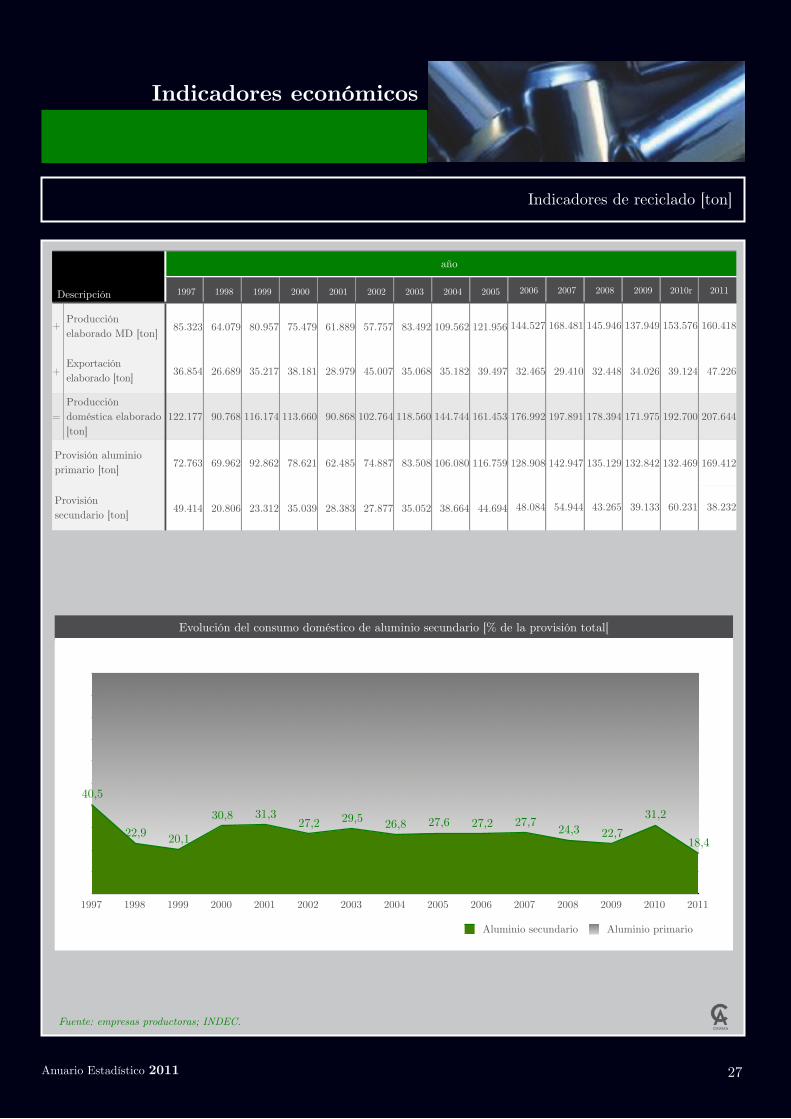
Indicadores de reciclado ...................................................................................................................................................... 27

Institucional

Organización de CAIAMA .................................................................................................................................................. 29

Criterios para la clasificación de productos ......................................................................................................................... 31

Índice

42011 Statistical Yearbook

2011 Statistical Yearbook

Editorial .............................................................................................................................................................................. 6

Aluminum domestic consumption

Total consumption by origin ............................................................................................................................................... 8

Total consumption by product and end-use market ............................................................................................................ 10

Evolution of total consumption ........................................................................................................................................... 12

Evolution of consumption by product ................................................................................................................................. 14

Evolution of consumption by end-use market ..................................................................................................................... 16

Evolution of “per capita” consumption ................................................................................................................................ 18

Foreign trade

Evolution of aluminum industry foreign trade balance ....................................................................................................... 20

Evolution of exports ............................................................................................................................................................ 22

Evolution of imports ........................................................................................................................................................... 24

Economic figures

Price indexes ....................................................................................................................................................................... 26

Recycling indexes ................................................................................................................................................................ 28

Institutional

CAIAMA organization ........................................................................................................................................................ 30

Criteria for product classification ........................................................................................................................................ 32

Index

Un año récordEl año 2011 marcó avances importantes en materia de consumo

doméstico, producción y saldo de la balanza comercial.

El consumo doméstico alcanzó un nuevo récord con casi 235.000 toneladas, lo que lleva el consumo “per capita” a cerca de 6 kilos por habitante por año, lejos todavía de los valores de los países más desarrollados, pero duplicando los valores promedio de las años anteriores a la crisis 2001.

Probablemente los próximos anuarios muestren un retroceso con respecto a este año, ya que se produjo un freno en la economía mundial con posibles consecuencias en nuestro país, y es justamente donde toda nuestra información estadística será de utilidad.

En la edición 2010 del anuario decíamos que estábamos preparando varios cambios para continuar ofreciendo mucho más que datos. Gracias al aporte de los socios de la Cámara hemos realizado algunas mejoras al anuario, y también a los reportes periódicos que ofrecemos. Próximamente entregaremos un monitoreo detallado de las operaciones de exportación e importación, y presentaremos la información del consumo domestico con mayor nivel de desagregación, separando los consumos de materia prima, productos elaborados, y productos terminados.

Renovamos con esta edición la convicción que contar con información útil, precisa y consistente brinda ventajas en las decisiones estratégicas de las empresas del sector, y de todos aquellos que estén pensando en participar del mercado del aluminio.

Subcomisión de Estadísticas de CAIAMA

5Anuario Estadístico 2011

Editorial

A record yearYear 2011 marked important advances in the figures of domestic

consumption, production and positive results in balance of trade.

The domestic consumption reached a new record with almost 235,000 tons, which represents consumption “per capita” of near 6 kilos by inhabitant per year, however still very far from the values of the developed countries, but duplicating the average results of the years previous to crisis 2001.

Probably the next yearbooks will show a backward movement with respect to this year, considering the difficult situation that is facing the world-wide economy, what most likely is going to affect our market place, and is exactly the right moment where all our statistical information will become deeply useful.

In the edition 2010 of the yearbook we said that we were preparing several changes to continue offering much more data. Thanks to the contribution of the partners of the Association we have made some improvements to this issue, and also to the periodic reports that we offer, also, very soon, we will give to our members’ detailed information on the operations of exports and imports that are related to our sector.

Besides we will present the information regarding the domestic consumption, with a greater level of detail, specifically breaking down that figure into: raw material, semi fabricated products, and finished products.

We renewed, with this edition, the conviction that the availability of accurate, consistent and definitively useful information, offers advantages for the strategic decisions of the companies of our sector, and also helps to know more about our industry to those that are evaluating becoming part of the aluminium family.

CAIAMA’s Statistics Subcommission

Editorial

62011 Statistical Yearbook

7

Producto

Chapas y rollos

Chapas finas y foil

Extruidos

Alambrón y cables

Fundidos

Otros productos

Consumo total

Consumo deproducción nacional

ImportacionesConsumo total del mercado doméstico

variación respectoal año 2010

21.180 22.035 43.215 5,5%

8.420 13.827 22.247 4,9%

52.766 7.591 60.357 17,7%

32.930 1.038 33.968 22,3%

44.152 19.890 64.042 6,2%

970 9.926 10.896 -12,8%

160.418 74.307 234.725 9,7%

Consumo total por producto Consumo total por origen

Otros4,6%

Chapas finas9,5%

Alambrón y cables14,5%

Chapas y rollos18,4%

Extruidos25,7%

Fundidos27,3%

Importación31,7%

Producción nacional68,3%

Anuario Estadístico 2011

Fuente: empresas productoras; INDEC.

Consumo doméstico

Consumo total por origen [ton]

Product

Plates, sheets and strip

Foil

Extruded products

Wires, rod and cables

Castings

Other products

Total consumption

Domestic origin consumption

ImportsTotal domesticconsumption

Variation vs. year 2010

21.180 22.035 43.215 5,5%

8.420 13.827 22.247 4,9%

52.766 7.591 60.357 17,7%

32.930 1.038 33.968 22,3%

44.152 19.890 64.042 6,2%

970 9.926 10.896 -12,8%

160.418 74.307 234.725 9,7%

Total consumption by product Total consumption by origin

Others4,6%

Foil9,5%

Wires, rod and cables14,5%

Plates, sheets and strip18,4%

Extruded products25,7%

Castings27,3%

Imports31,7%

Domestic origin68,3%

Source: producers; INDEC.

Domestic consumption

Total consumption by origin [ton]

82011 Statistical Yearbook

9Anuario Estadístico 2011

Fuente: empresas productoras; INDEC.

Consumo doméstico

Consumo total por producto y sector [ton]

Consumo total por sector Consumo total por sector (detalle “Otros”)

Otros sectores14,1%

Máquinas y equipos31,2%

Acerías24,0%

Bienes de consumo30,7%

Industria eléctrica15,7%

Transporte17,5%

Construcción civil20,7%

Otros24,2%

Envases21,9%

ProductoProducto

Chapas y rollos

Chapas finas y foil

Extruidos

Alambrón y cables

Fundidos

Otros productos

Consumo total

participación

SectorSectorSectorSectorSectorSectorSectorSectorConsumo

totalparticipa-

ción Construc-ción civil

Envases TransporteIndustria eléctrica

Bienes de consumo

Máquinas y equipos

AceríasOtros

sectores

Consumo total

participa-ción

1.520 26.602 2.820 42 5.624 5.893 0 714 43.215 18,4%

3.636 16.087 1.161 99 764 135 0 365 22.247 9,5%

39.740 0 2.561 418 6.881 8.343 0 2.414 60.357 25,7%

0 0 0 32.323 0 0 1.487 158 33.968 14,5%

3.659 2.913 34.325 4.021 3.062 3.342 12.176 544 64.042 27,3%

0 5.852 114 0 1.113 0 0 3.817 10.896 4,6%

48.555 51.454 40.981 36.903 17.444 17.713 13.663 8.012 234.725 100,0%

20,7% 21,9% 17,5% 15,7% 7,4% 7,5% 5,8% 3,4% 100,0%

Source: producers; INDEC.

Domestic consumption

Total consumption by product and end-use market [ton]

Total consumption by end-use market Total consumption by end-use market (detail “others”)

Other markets14,1%

Machinery & Equipment31,2%

Steelwork24,0%

Consumer durables30,7%

Electric Industry15,7%

Transportation17,5%

Building & Construction20,7%

Others24,2%

Packaging21,9%

ProductProduct

Plates, sheets and strip

Foil

Extruded products

Wires, rod and cables

Castings

Other products

Total consumption

share

End-use marketEnd-use marketEnd-use marketEnd-use marketEnd-use marketEnd-use marketEnd-use marketEnd-use marketTotal

consumptionshare

Building &Construction

PackagingTranspor-

tationElectric Industry

Consumer Durables

Machinery & Equipment

SteelworkOther

markets

Total consumption

share

1.520 26.602 2.820 42 5.624 5.893 0 714 43.215 18,4%

3.636 16.087 1.161 99 764 135 0 365 22.247 9,5%

39.740 0 2.561 418 6.881 8.343 0 2.414 60.357 25,7%

0 0 0 32.323 0 0 1.487 158 33.968 14,5%

3.659 2.913 34.325 4.021 3.062 3.342 12.176 544 64.042 27,3%

0 5.852 114 0 1.113 0 0 3.817 10.896 4,6%

48.555 51.454 40.981 36.903 17.444 17.713 13.663 8.012 234.725 100,0%

20,7% 21,9% 17,5% 15,7% 7,4% 7,5% 5,8% 3,4% 100,0%

102011 Statistical Yearbook

11Anuario Estadístico 2011

Fuente: empresas productoras; INDEC.

Consumo doméstico

Evolución del consumo total [ton]

Evolución del consumo total del mercado doméstico

0

50.000

100.000

150.000

200.000

250.000

1997 1998 1999 2000 2001 2002 2003 2004 2005 2006 2007 2008 2009 2010 2011

ton

Producción nacional Importaciones Consumo total

Evolución de la participación de la industria nacional en el consumo total del mercado doméstico [%]

1997 1998 1999 2000 2001 2002 2003 2004 2005 2006 2007 2008 2009 2010 2011

64,9 61,8

51,857,0 55,0

72,5

81,1 81,3 80,3 79,0 80,275,7 73,0 72,1

68,3

Producción nacional Importaciones

Domestic consumption

Evolution of total consumption [ton]

Evolution of total consumption in the domestic market

Evolution of domestic production share in total consumption in the domestic market [%]

122011 Statistical Yearbook

Source: producers; INDEC.

0

50.000

100.000

150.000

200.000

250.000

1997 1998 1999 2000 2001 2002 2003 2004 2005 2006 2007 2008 2009 2010 2011

ton

Domestic production Imports Total consumption

1997 1998 1999 2000 2001 2002 2003 2004 2005 2006 2007 2008 2009 2010 2011

64,9 61,8

51,857,0 55,0

72,5

81,1 81,3 80,3 79,0 80,275,7 73,0 72,1

68,3

Domestic production Imports

13Anuario Estadístico 2011

Fuente: empresas productoras; INDEC.

Consumo doméstico

Evolución del consumo por producto [ton]

Evolución del consumo doméstico por producto (base 100 = 1998)

ProductoProducto

Chapas y rollos

Chapas finas y foil

Extruidos

Alambrón y cables

Fundidos

Otros productos

Consumo total

añoañoañoañoañoañoañoañoañoañoañoañoañoañoaño

1997 1998 1999 2000 2001 2002 2003 2004 2005 2006 2007 2008 2009 2010 2011

36.182 33.142 33.060 32.309 29.291 16.658 17.668 20.996 24.091 27.655 30.158 34.310 31.545 40.952 43.215

20.040 17.445 18.960 20.601 18.315 14.691 14.567 17.388 19.645 20.184 21.477 19.524 18.727 21.217 22.247

27.755 31.546 29.365 27.803 23.502 12.947 18.930 29.191 34.554 41.300 50.450 51.791 38.994 51.294 60.357

17.457 24.953 28.015 14.621 12.085 6.378 11.874 17.236 16.411 28.487 34.729 22.472 34.109 27.780 33.968

26.953 29.749 27.223 31.931 24.124 26.262 35.538 43.866 48.871 56.612 63.034 53.315 50.469 60.306 64.042

3.171 3.650 2.230 5.202 5.178 4.126 4.378 6.021 7.913 8.439 9.616 10.955 10.152 12.490 10.896

131.558 140.485 138.853 132.467 112.495 81.062 102.955 134.698 151.485 182.677 209.464 192.367 183.996 214.039 234.725

0

50

100

150

200

250

1997 1998 1999 2000 2001 2002 2003 2004 2005 2006 2007 2008 2009 2010 2011

Índi

ce b

ase

100

= 1

998

Chapas y rollos Chapas finas y foil Extruidos Alambrón y cables Fundidos

Domestic consumption

Evolution of consumption by product [ton]

Evolution of domestic consumption by product (base 100 = 1998)

ProductProduct

Plates, sheets and strip

Foil

Extruded products

Wires, rod and cables

Castings

Other products

Total consumption

yearyearyearyearyearyearyearyearyearyearyearyearyearyearyear

1997 1998 1999 2000 2001 2002 2003 2004 2005 2006 2007 2008 2009 2010 2011

36.182 33.142 33.060 32.309 29.291 16.658 17.668 20.996 24.091 27.655 30.158 34.310 31.545 40.952 43.215

20.040 17.445 18.960 20.601 18.315 14.691 14.567 17.388 19.645 20.184 21.477 19.524 18.727 21.217 22.247

27.755 31.546 29.365 27.803 23.502 12.947 18.930 29.191 34.554 41.300 50.450 51.791 38.994 51.294 60.357

17.457 24.953 28.015 14.621 12.085 6.378 11.874 17.236 16.411 28.487 34.729 22.472 34.109 27.780 33.968

26.953 29.749 27.223 31.931 24.124 26.262 35.538 43.866 48.871 56.612 63.034 53.315 50.469 60.306 64.042

3.171 3.650 2.230 5.202 5.178 4.126 4.378 6.021 7.913 8.439 9.616 10.955 10.152 12.490 10.896

131.558 140.485 138.853 132.467 112.495 81.062 102.955 134.698 151.485 182.677 209.464 192.367 183.996 214.039 234.725

0

50

100

150

200

250

1997 1998 1999 2000 2001 2002 2003 2004 2005 2006 2007 2008 2009 2010 2011

Inde

x ba

se 1

00 =

199

8

Plates, sheets and strip Foil Extruded products Wires, rod and cables Castinngs

142011 Statistical Yearbook

Source: producers; INDEC.

15Anuario Estadístico 2011

Fuente: empresas productoras; INDEC.

Consumo doméstico

Evolución del consumo por sector [ton]

Evolución del consumo doméstico por sector (base 100 = 1998)

ProductoProducto

Construcción civil

Envases

Transporte

Industria eléctrica

Bienes de consumo

Máquinas y equipos

Acerías

Otros sectores

Consumo total

añoañoañoañoañoañoañoañoañoañoañoañoañoañoaño

1997 1998 1999 2000 2001 2002 2003 2004 2005 2006 2007 2008 2009 2010 2011

30.385 33.652 29.489 29.614 25.261 15.028 18.482 25.723 30.267 33.392 42.833 39.785 32.291 40.726 48.555

33.801 30.495 34.419 34.815 34.699 23.051 22.095 25.574 31.226 34.932 36.035 40.324 41.693 48.600 51.454

18.605 17.936 16.340 19.089 15.357 14.751 19.646 28.594 31.061 35.768 39.891 39.121 31.440 40.034 40.981

19.856 29.100 31.417 15.978 12.839 6.358 12.433 18.315 17.811 30.282 35.965 23.800 36.645 30.367 36.903

12.107 11.799 9.996 11.144 7.974 5.090 8.509 9.989 12.153 13.490 15.223 15.176 12.805 15.803 17.444

5.047 5.046 6.260 6.701 5.949 3.422 5.871 9.341 10.487 13.122 14.734 13.634 12.072 16.053 17.713

7.234 6.990 6.110 10.366 7.529 11.065 13.023 12.936 14.047 17.260 19.417 13.259 11.011 14.074 13.663

4.523 5.467 4.822 4.760 2.887 2.297 2.896 4.226 4.433 4.431 5.366 7.268 6.039 8.382 8.012

131.558 140.485 138.853 132.467 112.495 81.062 102.955 134.698 151.485 182.677 209.464 192.367 183.996 214.039 234.725

0

50

100

150

200

250

1997 1998 1999 2000 2001 2002 2003 2004 2005 2006 2007 2008 2009 2010 2011

Índi

ce b

ase

100

= 1

998

Construcción civil Envases Transporte Industria eléctrica Bienes de consumo

Domestic consumption

Evolution of consumption by end-use market [ton]

Evolution of domestic consumption by end-use market (base 100 = 1998)

ProductProductBuilding &Construction

Packaging

Transportation

Electric Industry

Consumer Durables

Machinery &Equipment

Steelwork

Other markets

Total consumption

yearyearyearyearyearyearyearyearyearyearyearyearyearyearyear

1997 1998 1999 2000 2001 2002 2003 2004 2005 2006 2007 2008 2009 2010 2011

30.385 33.652 29.489 29.614 25.261 15.028 18.482 25.723 30.267 33.392 42.833 39.785 32.291 40.726 48.555

33.801 30.495 34.419 34.815 34.699 23.051 22.095 25.574 31.226 34.932 36.035 40.324 41.693 48.600 51.454

18.605 17.936 16.340 19.089 15.357 14.751 19.646 28.594 31.061 35.768 39.891 39.121 31.440 40.034 40.981

19.856 29.100 31.417 15.978 12.839 6.358 12.433 18.315 17.811 30.282 35.965 23.800 36.645 30.367 36.903

12.107 11.799 9.996 11.144 7.974 5.090 8.509 9.989 12.153 13.490 15.223 15.176 12.805 15.803 17.444

5.047 5.046 6.260 6.701 5.949 3.422 5.871 9.341 10.487 13.122 14.734 13.634 12.072 16.053 17.713

7.234 6.990 6.110 10.366 7.529 11.065 13.023 12.936 14.047 17.260 19.417 13.259 11.011 14.074 13.663

4.523 5.467 4.822 4.760 2.887 2.297 2.896 4.226 4.433 4.431 5.366 7.268 6.039 8.382 8.012

131.558 140.485 138.853 132.467 112.495 81.062 102.955 134.698 151.485 182.677 209.464 192.367 183.996 214.039 234.725

0

50

100

150

200

250

1997 1998 1999 2000 2001 2002 2003 2004 2005 2006 2007 2008 2009 2010 2011

Inde

x ba

se 1

00 =

199

8

Building & Construction Packaging Transportation Electric industry Consumer durables

162011 Statistical Yearbook

Source: producers; INDEC.

17Anuario Estadístico 2011

Fuente: empresas productoras; INDEC.

Consumo doméstico

Evolución del consumo “per capita” [ton]

DescripciónDescripciónDescripciónDescripción

+Producciónprimario [ton]

+ Importaciónprimario [ton]

± Variación de stockprimario [ton]

+ Importación elaborado [ton]

+ Recuperaciónsecundario [ton]

- Exportaciónprimario [ton]

- Exportación elaborado [ton]

= Consumo doméstico aparente [ton]

Población[millones de habitantes]Población[millones de habitantes]

Consumo “per capita” [kilos/habitante]Consumo “per capita” [kilos/habitante]

añoañoañoañoañoañoañoañoañoañoañoañoañoañoaño

1997 1998 1999 2000 2001 2002 2003 2004 2005 2006 2007 2008 2009 2010r 2011

183.724 185.140 204.600 263.744 245.052 268.806 272.252 271.675 270.580 277.779 292.700 399.715 406.700 417.056 420.255

1.394 19.238 4.348 2.632 2.520 624 1.590 2.163 1.543 4.164 4.149 3.592 3.440 3.519 13.833

n/d n/d -2.859 -2.736 35 -6.600 -11.123 2.509 -13.719 12.276 -1.551 20.607 -14.000 -3.019 -3.546

44.841 57.168 53.548 54.356 48.086 22.681 17.873 22.973 27.986 33.986 36.834 42.829 42.620 56.944 60.477

49.414 20.806 23.312 35.039 28.383 27.877 35.052 38.664 44.694 48.084 54.944 43.265 39.133 60.231 38.232

110.961 115.178 123.596 187.859 182.532 200.519 199.866 163.084 168.511 131.070 151.459 243.009 288.521 287.606 254.392

36.854 26.689 35.217 38.181 28.979 45.007 35.068 35.182 39.497 32.465 29.410 32.448 34.026 39.124 47.226

131.558 140.485 129.854 132.467 112.495 81.062 102.956 134.700 150.514 188.202 209.309 193.337 183.346 214.039 234.725

35,6 36,0 36,4 36,8 37,2 37,5 37,9 38,2 38,6 39,0 39,4 39,8 40,1 40,5 40,9

3,7 3,9 3,6 3,6 3,0 2,2 2,7 3,5 3,9 4,8 5,3 4,9 4,6 5,3 5,7

Evolución del consumo doméstico “per capita”

0

1

2

3

4

5

6

7

8

1997 1998 1999 2000 2001 2002 2003 2004 2005 2006 2007 2008 2009 2010r 20110

75.000

150.000

225.000

300.000

kilo

s/ha

bita

nte

tone

lada

s

Consumo per capita Consumo absoluto

Domestic consumption

Evolution of “per capita” consumption [ton]

DescriptionDescriptionDescriptionDescription

+Ingot production[ton]

+ Imports of ingots [ton]

± Ingot inventorychange [ton]

+ Imports of millproducts [ton]

+ Recovery ofsecondary [ton]

- Exports of ingots [ton]

- Exports of millproducts [ton]

= Domestic apparent consumption [ton]

Population[million inhabitants]Population[million inhabitants]

“Per capita” consump-tion [kilos/inhabitant]“Per capita” consump-tion [kilos/inhabitant]

yearyearyearyearyearyearyearyearyearyearyearyearyearyearyear

1997 1998 1999 2000 2001 2002 2003 2004 2005 2006 2007 2008 2009 2010r 2011

183.724 185.140 204.600 263.744 245.052 268.806 272.252 271.675 270.580 277.779 292.700 399.715 406.700 417.056 420.255

1.394 19.238 4.348 2.632 2.520 624 1.590 2.163 1.543 4.164 4.149 3.592 3.440 3.519 13.833

n/d n/d -2.859 -2.736 35 -6.600 -11.123 2.509 -13.719 12.276 -1.551 20.607 -14.000 -3.019 -3.546

44.841 57.168 53.548 54.356 48.086 22.681 17.873 22.973 27.986 33.986 36.834 42.829 42.620 56.944 60.477

49.414 20.806 23.312 35.039 28.383 27.877 35.052 38.664 44.694 48.084 54.944 43.265 39.133 60.231 38.232

110.961 115.178 123.596 187.859 182.532 200.519 199.866 163.084 168.511 131.070 151.459 243.009 288.521 287.606 254.392

36.854 26.689 35.217 38.181 28.979 45.007 35.068 35.182 39.497 32.465 29.410 32.448 34.026 39.124 47.226

131.558 140.485 129.854 132.467 112.495 81.062 102.956 134.700 150.514 188.202 209.309 193.337 183.346 214.039 234.725

35,6 36,0 36,4 36,8 37,2 37,5 37,9 38,2 38,6 39,0 39,4 39,8 40,1 40,5 40,9

3,7 3,9 3,6 3,6 3,0 2,2 2,7 3,5 3,9 4,8 5,3 4,9 4,6 5,3 5,7

Evolution of “per capita” consumption

0

1

2

3

4

5

6

7

8

1997 1998 1999 2000 2001 2002 2003 2004 2005 2006 2007 2008 2009 2010r 20110

75.000

150.000

225.000

300.000

kilo

s/in

habi

tant

tons

Per capita consumption Absolute consumption

182011 Statistical Yearbook

Source: producers; INDEC.

19Anuario Estadístico 2011

Comercio exterior

Evolución del saldo comercial de la industria del aluminio [millones de dólares de 2011]

Fuente: INDEC.Fuente: INDEC.

Descripción

AñoAñoAñoAñoAñoAñoAñoAñoAñoAñoAñoAñoAñoAñoAño

Descripción 1997 1998 1999 2000 2001 2002 2003 2004 2005 2006 2007 2008 2009 2010 2011

Exportaciones 301 312 331 520 442 461 465 451 510 530 590 832 601 783 860

Importaciones 293 310 261 249 219 83 86 117 143 191 225 271 204 303 358

Saldo comercial 8 2 70 271 223 378 379 334 367 339 365 561 397 480 501

Evolución del saldo comercial (base 100 = promedio del período)

-100

-50

0

50

100

150

200

250

1997 1998 1999 2000 2001 2002 2003 2004 2005 2006 2007 2008 2009 2010 2011Índi

ce b

ase

100

= p

rom

edio

del p

erío

do

Saldo comercial industria aluminio Saldo comercial total Argentina

Incidencia de la industria del aluminio en el intercambio comercial total Argentina

0%

0,25%

0,50%

0,75%

1,00%

1,25%

1,50%

1,75%

1997 1998 1999 2000 2001 2002 2003 2004 2005 2006 2007 2008 2009 2010 2011

porc

enta

je d

el m

onto

en

dóla

res

Exportaciones Importaciones

Foreign Trade

Evolution of aluminum industry foreign trade balance [2011 million dollars]

Source: INDEC.

Description

YearYearYearYearYearYearYearYearYearYearYearYearYearYearYear

Description 1997 1998 1999 2000 2001 2002 2003 2004 2005 2006 2007 2008 2009 2010 2011

Exports 301 312 331 520 442 461 465 451 510 530 590 832 601 783 860

Imports 293 310 261 249 219 83 86 117 143 191 225 271 204 303 358

Foreign Trade balance 8 2 70 271 223 378 379 334 367 339 365 561 397 480 501

Evolution of foreign trade balance (base 100 = period average)

-100

-50

0

50

100

150

200

250

1997 1998 1999 2000 2001 2002 2003 2004 2005 2006 2007 2008 2009 2010 2011

Inde

x ba

se 1

00 =

per

iod

aver

age

Aluminum Industry Foreign Trade balance Argentina’s total Foreign Trade balance

Incidence of Aluminum in Argentina’s total Foreign Trade

0%

0,25%

0,50%

0,75%

1,00%

1,25%

1,50%

1,75%

1997 1998 1999 2000 2001 2002 2003 2004 2005 2006 2007 2008 2009 2010 2011

perc

enta

ge o

f am

ount

in d

olla

rs

Exports Imports

202011 Statistical Yearbook

21Anuario Estadístico 2011

Comercio exterior

Evolución de las exportaciones [ton]

Fuente: INDEC.

Partidas por producto:(1) 76.06 / 76.11 / 76.12 / 76.13 / 76.15 (4) 76.05 / 76.14(2) 76.07 (5) 76.01 / 76.02 / 76.09(3) 76.04 / 76.08 / 76.10 (6) 76.03 / 76.16

Producto

AñoAñoAñoAñoAñoAñoAñoAñoAñoAñoAñoAñoAñoAñoAño

Producto 1997 1998 1999 2000 2001 2002 2003 2004 2005 2006 2007 2008 2009 2010 2011

Chapas y rollos (1) 4.742 3.905 1.907 3.547 3.825 3.888 5.029 4.114 4.753 5.277 4.264 5.061 6.192 6.431 5.949

Chapas finas y foil (2) 2.329 3.068 3.390 4.567 4.351 3.145 3.524 3.761 3.693 3.695 2.733 1.924 1.696 2.290 2.749

Extruidos (3) 739 678 763 622 1.135 1.649 2.894 2.889 1.818 2.484 2.936 3.916 2.838 4.402 3.893

Alambrón y cables (4) 20.910 30.998 25.115 25.208 12.640 24.733 21.777 22.926 28.113 19.023 18.118 19.888 20.668 23.916 32.366

Fundidos (5) 118.645 94.251 127.180 191.623 189.168 211.517 200.973 163.821 168.970 132.297 152.171 243.698 289.930 288.615 255.806

Otros productos (6) 450 1.067 458 472 392 594 737 756 661 759 647 970 1.091 1.076 855

Total exportaciones 147.815 133.967 158.813 226.040 211.511 245.526 234.934 198.266 208.008 163.535 180.869 275.457 322.415 326.730 301.619

Evolución de las exportaciones de la industria del aluminio (base 100 = promedio del período)

0

25

50

75

100

125

150

175

200

225

1997 1998 1999 2000 2001 2002 2003 2004 2005 2006 2007 2008 2009 2010 2011

Índi

ce b

ase

100

= p

rom

edio

del p

erío

do

Chapas y rollos Chapas finas y foil Extruidos Alambrón y cables Fundidos

Foreign Trade

Evolution of exports [ton]

Source: INDEC.

Headings by product:(1) 76.06 / 76.11 / 76.12 / 76.13 / 76.15 (4) 76.05 / 76.14(2) 76.07 (5) 76.01 / 76.02 / 76.09(3) 76.04 / 76.08 / 76.10 (6) 76.03 / 76.16

Product

YearYearYearYearYearYearYearYearYearYearYearYearYearYearYear

Product 1997 1998 1999 2000 2001 2002 2003 2004 2005 2006 2007 2008 2009 2010 2011

Plates, sheets and strip (1)

4.742 3.905 1.907 3.547 3.825 3.888 5.029 4.114 4.753 5.277 4.264 5.061 6.192 6.431 5.949

Foil (2) 2.329 3.068 3.390 4.567 4.351 3.145 3.524 3.761 3.693 3.695 2.733 1.924 1.696 2.290 2.749

Extruded products (3) 739 678 763 622 1.135 1.649 2.894 2.889 1.818 2.484 2.936 3.916 2.838 4.402 3.893

Wires, rod andcables (4)

20.910 30.998 25.115 25.208 12.640 24.733 21.777 22.926 28.113 19.023 18.118 19.888 20.668 23.916 32.366

Castings (5) 118.645 94.251 127.180 191.623 189.168 211.517 200.973 163.821 168.970 132.297 152.171 243.698 289.930 288.615 255.806

Other products (6) 450 1.067 458 472 392 594 737 756 661 759 647 970 1.091 1.076 855

Total exports 147.815 133.967 158.813 226.040 211.511 245.526 234.934 198.266 208.008 163.535 180.869 275.457 322.415 326.730 301.619

Evolution of Aluminum industry exports (base 100 = period average)

0

25

50

75

100

125

150

175

200

225

1997 1998 1999 2000 2001 2002 2003 2004 2005 2006 2007 2008 2009 2010 2011

Inde

x ba

se 1

00 =

per

iod

aver

age

Plates, sheets and strip Foil Extruded products Wires, rod and cables Castings

222011 Statistical Yearbook

23Anuario Estadístico 2011

Comercio exterior

Evolución de las importaciones [ton]

Fuente: INDEC.

Partidas por producto:(1) 76.06 / 76.11 / 76.12 / 76.13 / 76.15 (4) 76.05 / 76.14(2) 76.07 (5) 76.01 / 76.02 / 76.09(3) 76.04 / 76.08 / 76.10 (6) 76.03 / 76.16

Producto

AñoAñoAñoAñoAñoAñoAñoAñoAñoAñoAñoAñoAñoAñoAño

Producto 1997 1998 1999 2000 2001 2002 2003 2004 2005 2006 2007 2008 2009 2010 2011

Chapas y rollos (1) 24.204 23.932 24.068 23.346 22.177 8.850 5.712 7.540 9.261 12.255 12.859 17.703 15.102 21.564 22.035

Chapas finas y foil (2) 9.235 10.839 11.525 12.433 10.968 6.505 6.312 7.882 8.925 9.897 10.078 10.123 10.367 11.584 13.827

Extruidos (3) 3.557 4.705 4.883 4.974 3.898 1.601 1.352 2.057 2.491 3.443 4.222 4.792 3.902 5.140 7.591

Alambrón y cables (4) 5.145 14.832 10.687 8.477 6.038 828 1.132 671 453 598 1.002 637 716 906 1.038

Fundidos (5) 1.394 19.238 4.489 3.054 2.771 780 1.697 2.420 2.057 4.892 4.881 4.226 7.337 9.931 19.890

Otros productos (6) 2.700 2.860 2.243 4.704 4.754 4.741 3.257 4.566 6.343 7.066 7.941 8.940 8.623 11.338 9.926

Total importaciones 46.235 76.406 57.896 56.988 50.606 23.305 19.463 25.136 29.529 38.150 40.983 46.421 46.047 60.463 74.307

Evolución de las importaciones de la industria del aluminio (base 100 = promedio del período)

0

50

100

150

200

250

300

350

400

450

1997 1998 1999 2000 2001 2002 2003 2004 2005 2006 2007 2008 2009 2010 2011

Índi

ce b

ase

100

= p

rom

edio

del p

erío

do

Chapas y rollos Chapas finas y foil Extruidos Alambrón y cables Fundidos

Foreign Trade

Evolution of imports [ton]

Source: INDEC.

Headings by product:(1) 76.06 / 76.11 / 76.12 / 76.13 / 76.15 (4) 76.05 / 76.14(2) 76.07 (5) 76.01 / 76.02 / 76.09(3) 76.04 / 76.08 / 76.10 (6) 76.03 / 76.16

Product

YearYearYearYearYearYearYearYearYearYearYearYearYearYearYear

Product 1997 1998 1999 2000 2001 2002 2003 2004 2005 2006 2007 2008 2009 2010 2011

Plates, sheets and strip (1)

24.204 23.932 24.068 23.346 22.177 8.850 5.712 7.540 9.261 12.255 12.859 17.703 15.102 21.564 22.035

Foil (2) 9.235 10.839 11.525 12.433 10.968 6.505 6.312 7.882 8.925 9.897 10.078 10.123 10.367 11.584 13.827

Extruded products (3) 3.557 4.705 4.883 4.974 3.898 1.601 1.352 2.057 2.491 3.443 4.222 4.792 3.902 5.140 7.591

Wires, rod andcables (4)

5.145 14.832 10.687 8.477 6.038 828 1.132 671 453 598 1.002 637 716 906 1.038

Castings (5) 1.394 19.238 4.489 3.054 2.771 780 1.697 2.420 2.057 4.892 4.881 4.226 7.337 9.931 19.890

Other products (6) 2.700 2.860 2.243 4.704 4.754 4.741 3.257 4.566 6.343 7.066 7.941 8.940 8.623 11.338 9.926

Total imports 46.235 76.406 57.896 56.988 50.606 23.305 19.463 25.136 29.529 38.150 40.983 46.421 46.047 60.463 74.307

Evolution of Aluminum industry imports (base 100 = period average)

0

50

100

150

200

250

300

350

400

450

1997 1998 1999 2000 2001 2002 2003 2004 2005 2006 2007 2008 2009 2010 2011

Inde

x ba

se 1

00 =

per

iod

aver

age

Plates, sheets and strip Foil Extruded products Wires, rod and cables Castings

242011 Statistical Yearbook

25Anuario Estadístico 2011

Indicadores económicos

Indicadores de precios

Fuente: London Metal Exchange, CRU Steel prices index, Bloomberg.

Evolución de los precios internacionales de commodities industriales

Evolución del precio del aluminio primario a precios constantes 2011 (IPC Estados Unidos)

0

25

50

75

100

125

150

175

200

225

250

1997 1998 1999 2000 2001 2002 2003 2004 2005 2006 2007 2008 2009 2010 2011

Índi

ce b

ase

100

= p

rom

edio

del p

erío

do

Aluminio Acero Cobre

0

500

1.000

1.500

2.000

2.500

3.000

1997 1998 1999 2000 2001 2002 2003 2004 2005 2006 2007 2008 2009 2010 2011

1.600

1.358 1.3611.550

1.4441.350 1.431

1.7161.899

2.570 2.638 2.574

1.665

2.173

2.398

dóla

res/

ton

LME cash nominal LME cash a precios 2011 Promedio LME cash a precios 2011

Economic figures

Price indexes

Source: London Metal Exchange, CRU Steel prices index, Bloomberg.

Evolution of industrial commodities international prices

Primary aluminum price evolution at 2011 prices (PCI United States)

0

25

50

75

100

125

150

175

200

225

250

1997 1998 1999 2000 2001 2002 2003 2004 2005 2006 2007 2008 2009 2010 2011

Inde

x ba

se 1

00 =

per

iod

aver

age

Aluminum Steel Copper

0

500

1.000

1.500

2.000

2.500

3.000

1997 1998 1999 2000 2001 2002 2003 2004 2005 2006 2007 2008 2009 2010 2011

1.600

1.358 1.3611.550

1.4441.350 1.431

1.7161.899

2.570 2.638 2.574

1.665

2.173

2.398

dolla

rs/t

on

Nomnal LME cash LME cash at 2001 prices Average LME cash at 2011 prices

262011 Statistical Yearbook

27Anuario Estadístico 2011

Fuente: empresas productoras; INDEC.

Indicadores económicos

Indicadores de reciclado [ton]

DescripciónDescripciónDescripciónDescripción

+ Producciónelaborado MD [ton]

+Exportaciónelaborado [ton]

=Producción doméstica elaborado [ton]

Provisión aluminio primario [ton]Provisión aluminio primario [ton]

Provisiónsecundario [ton]Provisiónsecundario [ton]

añoañoañoañoañoañoañoañoañoañoañoañoañoañoaño

1997 1998 1999 2000 2001 2002 2003 2004 2005 2006 2007 2008 2009 2010r 2011

85.323 64.079 80.957 75.479 61.889 57.757 83.492 109.562 121.956 144.527 168.481 145.946 137.949 153.576 160.418

36.854 26.689 35.217 38.181 28.979 45.007 35.068 35.182 39.497 32.465 29.410 32.448 34.026 39.124 47.226

122.177 90.768 116.174 113.660 90.868 102.764 118.560 144.744 161.453 176.992 197.891 178.394 171.975 192.700 207.644

72.763 69.962 92.862 78.621 62.485 74.887 83.508 106.080 116.759 128.908 142.947 135.129 132.842 132.469 169.412

49.414 20.806 23.312 35.039 28.383 27.877 35.052 38.664 44.694 48.084 54.944 43.265 39.133 60.231 38.232

Evolución del consumo doméstico de aluminio secundario [% de la provisión total[

1997 1998 1999 2000 2001 2002 2003 2004 2005 2006 2007 2008 2009 2010 2011

40,5

22,9 20,1

30,8 31,327,2 29,5 26,8 27,6 27,2 27,7 24,3 22,7

31,2

18,4

Aluminio secundario Aluminio primario

Fuente: empresas productoras; INDEC.

Economic figures

Recycling indexes [ton]

DescriptionDescriptionDescriptionDescription

+ Production of mill products to DM [ton]

+Exports of millproducts [ton]

=Domestic productionof mill products [ton]

Primary ingot provision [ton]Primary ingot provision [ton]

Secondary ingotprovision [ton]Secondary ingotprovision [ton]

yearyearyearyearyearyearyearyearyearyearyearyearyearyearyear

1997 1998 1999 2000 2001 2002 2003 2004 2005 2006 2007 2008 2009 2010r 2011

85.323 64.079 80.957 75.479 61.889 57.757 83.492 109.562 121.956 144.527 168.481 145.946 137.949 153.576 160.418

36.854 26.689 35.217 38.181 28.979 45.007 35.068 35.182 39.497 32.465 29.410 32.448 34.026 39.124 47.226

122.177 90.768 116.174 113.660 90.868 102.764 118.560 144.744 161.453 176.992 197.891 178.394 171.975 192.700 207.644

72.763 69.962 92.862 78.621 62.485 74.887 83.508 106.080 116.759 128.908 142.947 135.129 132.842 132.469 169.412

49.414 20.806 23.312 35.039 28.383 27.877 35.052 38.664 44.694 48.084 54.944 43.265 39.133 60.231 38.232

Evolution of domestic consumption of secondary aluminium [% of total provision]

1997 1998 1999 2000 2001 2002 2003 2004 2005 2006 2007 2008 2009 2010 2011

40,5

22,9 20,1

30,8 31,327,2 29,5 26,8 27,6 27,2 27,7 24,3 22,7

31,2

18,4

Seondary ingot Primary ingot

282011 Statistical Yearbook

29Anuario Estadístico 2011

Institucional

Organización de CAIAMA

Comisión directivaPresidente ........................................................................................................ Lic. Héctor Cañete TUBAPLASVicepresidente 1 ............................................................................................... Lic. Jorge García Arias ALUAR DIVISIÓN ELABORADOSVicepresidente 2 ............................................................................................... Dr. Jorge L. Fernández METALES DEL TALARVicepresidente 3 ............................................................................................... Cdr. Ricardo J. Wagner HYDRO ALUMINIUM ARGENTINAVicepresidente 4 ............................................................................................... Lic. Marcelo Maffei ALUAR ALUMINIO ARGENTINOSecretario ......................................................................................................... Sr. Luis M. Costa FUNDICIÓN Y LAMINACIÓN LUIS COSTAProsecretario .................................................................................................... Cdr. Norberto Fedele LAMINACIÓN PAULISTA ARGENTINATesorero ........................................................................................................... Dr. Jorge H. Losa ALUMINIUNProtesorero ....................................................................................................... Ing. Elio Lamanna INOFERVocales titulares ............................................................................................... Sr. José Caudarella ALUOEST .............................................................................................. Sr. Antonio Bacero SICAMAR METALES .............................................................................................. Lic. Cecilia Urrea FLAMIA .............................................................................................. Sr. Rogelio Ceresato ALCEMAR .............................................................................................. Sr. Manuel Carbone ALUMINIUM MANUFACTURERS EXPRESS .............................................................................................. Ing. Helvio Bonilauri  FAPIM .............................................................................................. Ing. Rubén Yantorno EXAL ARGENTINA .............................................................................................. Ing. Claudio De Luca REXAM ARGENTINA .............................................................................................. Dr. Daniel Volpe ANODIZADO CALIFORNIA .............................................................................................. Sr. Alfredo Vanini ALUEX .............................................................................................. Arq. Margarita Casanova GIESSE GROUP ARGENTINA .............................................................................................. Sr. Vicente Labate MONT PATVocales suplentes ............................................................................................. Ing. Santiago Lonardi DLSA ............................................................................................. Sr. Jorge Lentino OBRAS METÁLICAS ............................................................................................. Sr. Luis A. Maglione METAL VENETA ............................................................................................. Ing. Enrique Sagripanti HEIL TRAILER INTERNATIONALRevisores de cuentas titulares .......................................................................... Sr. Leonardo Monteleone QUIMING . ......................................................................... Sr. Luciano Principi MADEXARevisores de cuentas suplentes ......................................................................... Sr. Ricardo Caccia ALENEX ......................................................................... Ing. Héctor Dall’O ARCOLANA ......................................................................... Sr. Vicente Miele GRUPO MAX

Ramas de sociosEnvases ............................................................................................................ Ing. Hugo Della Ninna AKAPOLExtrusión ......................................................................................................... Ing. Roberto Bossi ALCEMARRecubrimientos ................................................................................................ Dr. Daniel Volpe ANODIZADO CALIFORNIARefinadores ...................................................................................................... Sr. Antonio Bacero SICAMAR METALES

SubcomisionesComercio Exterior y Mercosur ......................................................................... Lic. Jorge García Arias ALUAR DIVISIÓN ELABORADOSCiencia, Tecnología y Capacitación .................................................................. Dr. Carlos Castellano CAIAMAPublicaciones y exposiciones ............................................................................ Ing. Héctor Bottinelli CAIAMA

AsesoríasContable e impositiva ...................................................................................... Dr. Fernando Piovano CAIAMADesarrollo de productos ................................................................................... Lic. Marcelo Maffei ALUAR ALUMINIO ARGENTINOJurídica y laboral ............................................................................................. Dr. Carlos Echezarreta CAIAMALetrada ............................................................................................................ Dr. Carlos Echezarreta CAIAMA ........................................................................................................... Dr. Eduardo Zamorano CAIAMATécnica ............................................................................................................ Ing. Mauricio Gurski CAIAMA

Institutional

CAIAMA organization

BoardPresident .......................................................................................................... Lic. Héctor Cañete TUBAPLAS1st Vice-president ............................................................................................ Lic. Jorge García Arias ALUAR DIVISIÓN ELABORADOS2nd Vice-president ........................................................................................... Dr. Jorge L. Fernández METALES DEL TALAR3rd Vice-president ............................................................................................ Acc. Ricardo J. Wagner HYDRO ALUMINIUM ARGENTINA4th Vice-president ............................................................................................ Lic. Marcelo Maffei ALUAR ALUMINIO ARGENTINOSecretary .......................................................................................................... Mr. Luis M. Costa FUNDICIÓN Y LAMINACIÓN LUIS COSTAPro-secretary .................................................................................................... Acc. Norberto Fedele LAMINACIÓN PAULISTA ARGENTINATreasurer .......................................................................................................... Dr. Jorge H. Losa ALUMINIUNPro-treasurer .................................................................................................... Eng. Elio Lamanna INOFERHolding representatives .................................................................................... Mr. José Caudarella ALUOEST ................................................................................... Mr. Antonio Bacero SICAMAR METALES ................................................................................... Lic. Cecilia Urrea FLAMIA ................................................................................... Mr. Rogelio Ceresato ALCEMAR ................................................................................... Mr. Manuel Carbone ALUMINIUM MANUFACTURERS EXPRESS ................................................................................... Eng. Helvio Bonilauri  FAPIM ................................................................................... Eng. Rubén Yantorno EXAL ARGENTINA ................................................................................... Eng. Claudio De Luca REXAM ARGENTINA ................................................................................... Dr. Daniel Volpe ANODIZADO CALIFORNIA ................................................................................... Mr. Alfredo Vanini ALUEX ................................................................................... Arc. Margarita Casanova GIESSE GROUP ARGENTINA ................................................................................... Mr. Vicente Labate MONT PATSubstitute representatives ................................................................................ Eng. Santiago Lonardi DLSA ................................................................................ Mr. Jorge Lentino OBRAS METÁLICAS ................................................................................ Mr. Luis A. Maglione METAL VENETA ................................................................................ Eng. Enrique Sagripanti HEIL TRAILER INTERNATIONALHolding accounts auditors ................................................................................ Mr. Leonardo Monteleone QUIMING ................................................................................ Mr. Luciano Principi MADEXASubstitute accounts auditors ............................................................................ Mr. Ricardo Caccia ALENEX ........................................................................... Eng. Héctor Dall’O ARCOLANA ........................................................................... Mr. Vicente Miele GRUPO MAX

Associates’ committeesPackaging ......................................................................................................... Eng. Hugo Della Ninna AKAPOLExtruded products ........................................................................................... Eng. Roberto Bossi ALCEMARCoatings ........................................................................................................... Dr. Daniel Volpe ANODIZADO CALIFORNIARefiners ............................................................................................................ Mr. Antonio Bacero SICAMAR METALES

Sub-committeesForeign Trade and Mercosur ............................................................................ Lic. Jorge García Arias ALUAR DIVISIÓN ELABORADOSScience, Technology and Instruction ................................................................ Dr. Carlos Castellano CAIAMAPress and Expositions ...................................................................................... Eng. Héctor Bottinelli CAIAMA

AdvisersAccountings and taxes ..................................................................................... Dr. Fernando Piovano CAIAMAProduct development ....................................................................................... Lic. Marcelo Maffei ALUAR ALUMINIO ARGENTINOLaw and labor .................................................................................................. Dr. Carlos Echezarreta CAIAMALegal ................................................................................................................ Dr. Carlos Echezarreta CAIAMA ............................................................................................................... Dr. Eduardo Zamorano CAIAMATechnical .......................................................................................................... Eng. Mauricio Gurski CAIAMA

302011 Statistical Yearbook

31Anuario Estadístico 2011

Institucional

Criterios para la clasificación de productos

Laminación Extrusión Fundición

Construcción civil

Envases

Transporte

Industria eléctrica

Bienes de consumo

Máquinas y equipos

Acerías

Otros

Flejes para cielorrados; chapas para techos; membranas para techos; chapas

para recubrir frentes; chapas de uso arquitectónico; chapas antideslizantes;

paneles compuestos.

Perfiles para puertas y ventanas;perfiles para aplicaciones arquitectónicas;

perfiles para cielorrasos; perfiles para carteles.

Chapas aluminizadas, piezas fundidas para radiadores para calefacción.

Hojas delgadas (foil) desnudas y compuestas para envases de alimentos, cigarrillos, etc.; tejos para aerosoles y

pomos; chapas para envases de bebidas; chapas para tapas de envases y botellas.

(no hay productos identificados) (no hay productos identificados)

Chapas para camiones tanque; chapas para carrocería; flejes y foil (hojas

delgadas) para calefactores y radiadores de vehículos; chapas para señales viales.

Tubos para radiadores; perfiles para puertas y ventanillas de ómnibus y carrocerías; perfiles para pisos de

camiones.

Llantas de automóviles; pistones, blocks y tapas de motor; autopartes fundidas;

chapas aluminizadas.

Chapas para transformadores; compuestos para telefonía; foil paracapacitores; chapas para artefactos y

luminaria.

Perfiles para carcazas de motores eléctricos; perfiles para disipadores para

electrónica; perfiles para “bus bars”; perfiles para luminarias.

Cables a partir de colada continua; piezas fundidas para industria

eléctrica.

Chapas para heladeras y artículos del hogar; chapas para menaje; hojas

delgadas para bandejas descartables; hojas delgadas para uso hogareño; chapas para antenas parabólicas de

televisión; flejes para ojalillos.

Perfiles para antenas de televisión; tubos para heladeras; perfiles para mástiles de

veleros; tubos parabicicletas; tubos para muebles; perfiles

para escaleras de aluminio; perfiles para exhibidores refrigerados.

Mesas y sillas de aluminio fundido; menaje fundido; piezas fundidas para

decoración.

Flejes para tubos de riego; flejes para intercambiadores de calor; chapas para

tanques de almacenamiento; chapas para calderería; foil para aislación; chapas para

bandejas para pescado y panaderías.

Tubos para riego; perfiles para uso industrial.

Piezas fundidas para maquinariaindustrial; moldes fundidos; placas

modelos.

(no hay productos identificados) (no hay productos identificados)Posta; granalla; conos; estrellas;

lingotes; alambrón.

Chapas para chapa patente; todo producto no incluido entre los

anteriores.

Barras para tornería; tubos para remaches rápidos; todo producto no

incluido entre los anteriores.

Alambre de soldadura; polvo para pintura y explosivos; polvo para

fabricación de productos químicos; todo producto no incluido entre los

anteriores.

Institutional

Criteria for product classification

Rolling Extrusion Casting

Building and Construction

Packaging

Transportation

Electric Industry

Consumer Durables

Machinery andEquipment

Steelwork

Others

Ceiling coils; ceiling sheet; roof coating; architectural use sheet; anti-slip sheet;

composite panel.

Doors and windows profiles; architectural application profiles; ceiling profiles;

signboard profilesAluminized sheet; radiator cast parts.

Foil, backed and not backed for packaging of food, cigarettes, etc.; slugs for aerosols and tubes; can stock; sheets

for bottle caps.

(no identified products) (no identified products)

Sheets for tank trucks; sheets for bodywork; coils and foil for radiators;

road sign sheets.

Radiator tubes; busses windows and doors profiles; truck floor profiles.

Automobile rims; pistons; engine blocks; engine covers; cast parts for automobiles;

aluminized sheet.

Transformer and capacitor sheets; foil for telephonic composites; sheets for electrical and lighting appliances.

Electric engine housing profiles; electronic dissipating devices profiles; bus bars; profiles for electrical and lighting

appliances.

Continuous cast cables; cats parts for electric industry.

Sheets for refrigerators and other home appliances; cookware sheet; foil for semi-rigid containers; household foil; sheet for

parabolic TV antennas; coils for shoe eyelets.

TV antennas profiles; refrigerator tubes; sailboat mast profiles; bicycle profiles;

furniture tubes; ladder profiles; refrigerated exhibitors profiles.

Cast chairs and tables; cast cookware; cast decoration parts.

Coils for irrigation piping; industrial heat exchanger coils; tank sheet; caldron sheet; coils for insulation; fish and bakery tray

sheet.

Irrigation piping tubes; industrial use profiles.

Cast parts for industrial machinery; cast molds.

(no identified products) (no identified products) Products for steel deoxidization.

Car plate sheets; every product not included above.

Every product not included above.Welding wire; paint and explosive

powders; chemical product powders; every product not included above.

322011 Statistical Yearbook

Aluminum Industry in Argentina

2011 Statistical Yearbook

Cámara Argentina de la Industria del Aluminio y Metales AfinesParaná 467 1st floor, offices 3 and 4. (1017) Ciudad autónoma de Buenos Aires - Argentina

(+5411) 4371-1987/4301www.aluminiocaiama.org

Industria del Aluminio en Argentina

Anuario Estadístico 2011

Cámara Argentina de la Industria del Aluminio y Metales AfinesParaná 467 1er piso, oficinas 3 y 4. (1017) Ciudad autónoma de Buenos Aires - Argentina

(+5411) 4371-1987/4301www.aluminiocaiama.org


Recommended