57
AP Econ F14 Week#3
| Date post: | 24-Dec-2015 |
| Category: |
Documents |
| Upload: | frederick-cook |
| View: | 216 times |
| Download: | 0 times |

AP Econ F14
Week#3

Economics 9/15/14 http://mrmilewski.com
• OBJECTIVE: Examine Supply, Demand and Market Equilibrium. AP Macro-I.D
• Language objective: SWBAT define essential vocabulary on Demand, write notes on the Law of Demand and also write answers to questions and read about Supply.
• I. Journal#9-Review Homework-Do now: Vocabulary terms-notes on the Law of Demand
• II. Homework -Questions #1, 2, and 3 on page 66. Problem #1 on
page 66. Read pages 53-56.

Vocabulary
• Demand• Law of Demand• Diminishing marginal utility• Income Effect• Substitution Effect• Demand Curve• Normal goods• Inferior goods• Substitute good• Complimentary good
What is demand?
• Demand – the desire, ability, and willingness to buy a product.
• Law of Demand – the quantity demanded of a good or service varies inversely with its price.

Demand Schedule
• demand schedule - a listing that shows the various quantities demanded of a particular product at all prices that might prevail in the market at a given time.
Demand Curve
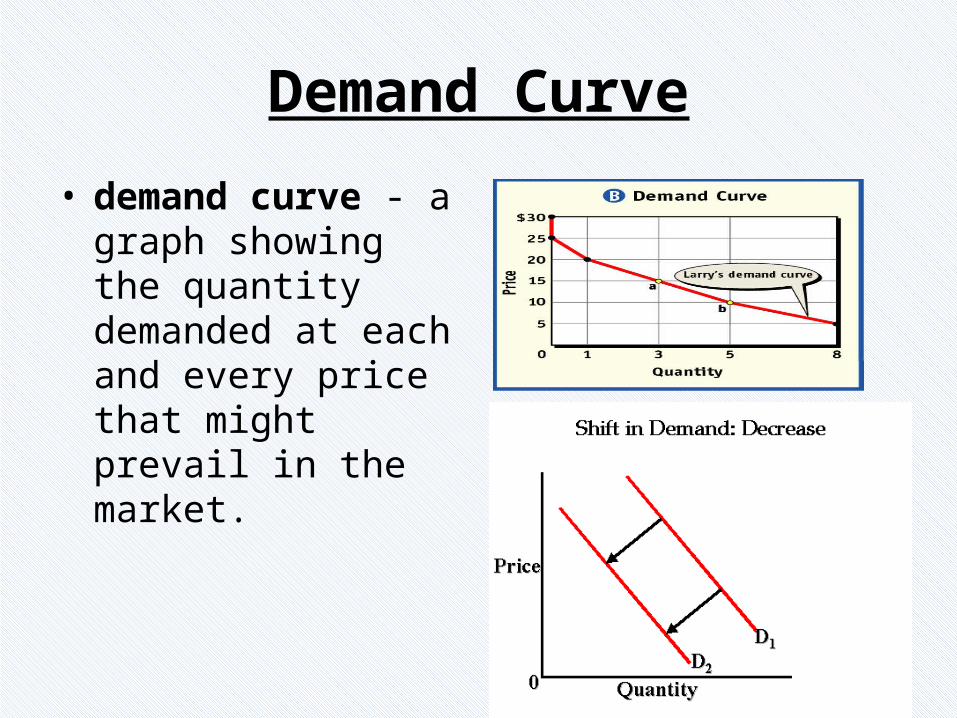
• demand curve - a graph showing the quantity demanded at each and every price that might prevail in the market.
PRACTICE
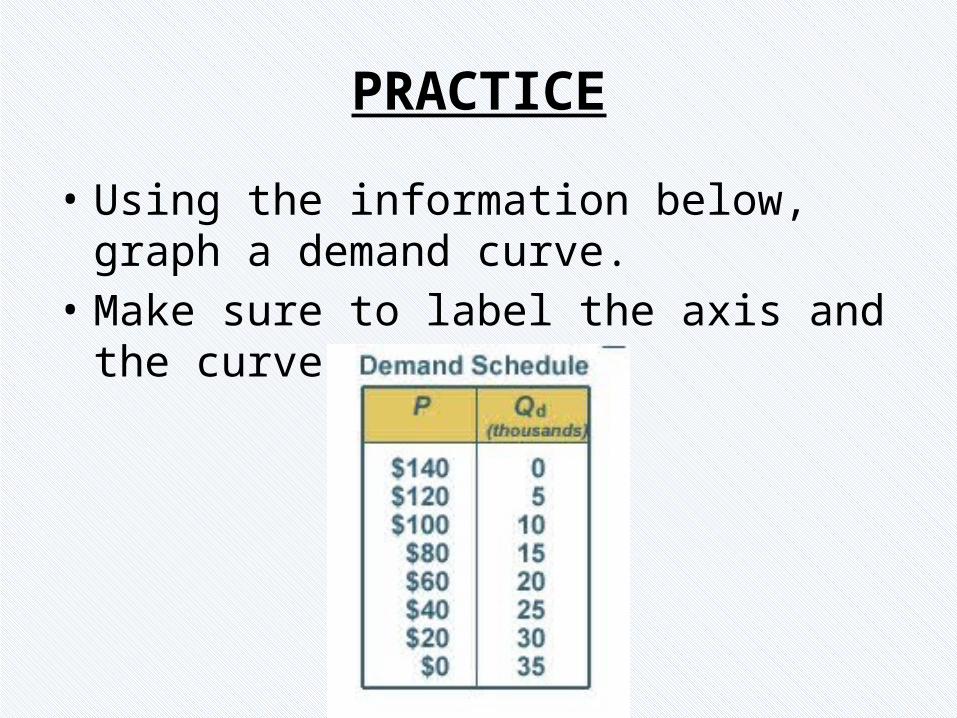
• Using the information below, graph a demand curve.
• Make sure to label the axis and the curve!

Simplistic view of demand
• As price increases, demand decreases
• As price decreases, demand increases
• This is an inverse relationship (Law of Demand)
• When an inverse relationship is graphed, the slope is negative
• Demand Curve
Marginal Utility
• Utility – the amount of usefulness or satisfaction that someone gets from the extra use of a product
• Marginal utility – the extra usefulness or satisfaction a person gets from acquiring or using one more unit of a product
Diminishing Marginal Utility
• The more and more of a product we acquire, the extra satisfaction we get from using additional quantities of a product begins to diminish.
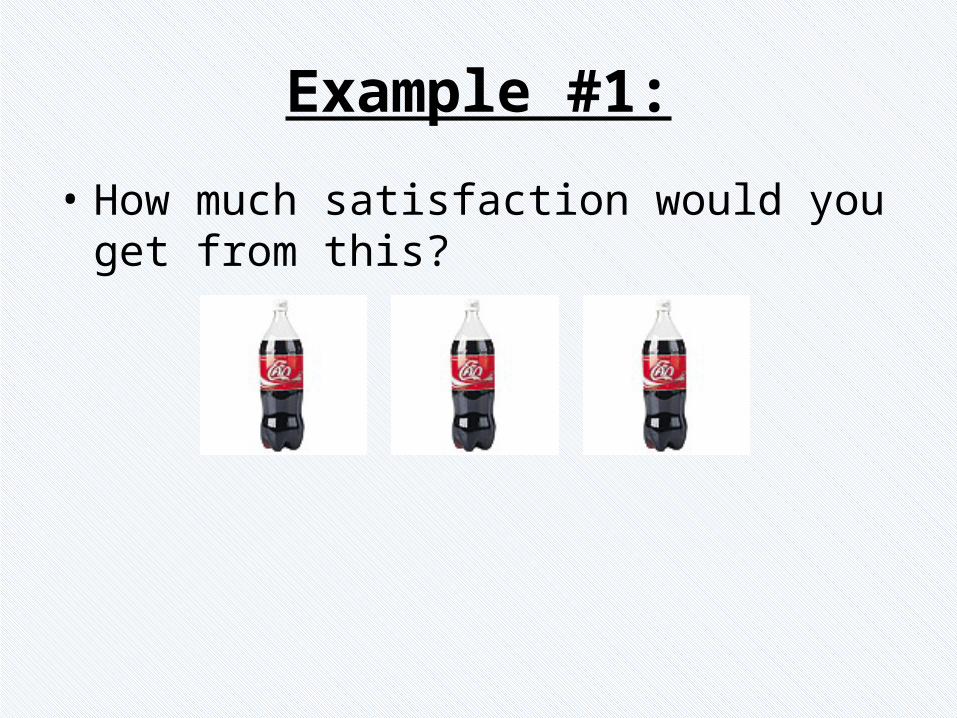
Example #1:
• How much satisfaction would you get from this?

Economics 9/16/14 http://mrmilewski.com
• OBJECTIVE: Examine Supply, Demand and Market Equilibrium. AP Macro-I.D
• Language objective: SWBAT define essential vocabulary on Demand, write notes on the Law of Demand and also write answers to questions and read about Supply.
• I. Journal #10-Review Homework-Do now: Income is a determinant for a change in
demand. How do inferior and superior goods affect demand?
-Continue notes on the Demand• II. Homework: Vocab words from Supply page 53 through page 56.
Demand Changes
• Change in quantity demanded – movement along the demand curve
• Change in demand – shift in the demand curve

Change in Demand v. Change in Quantity Demanded
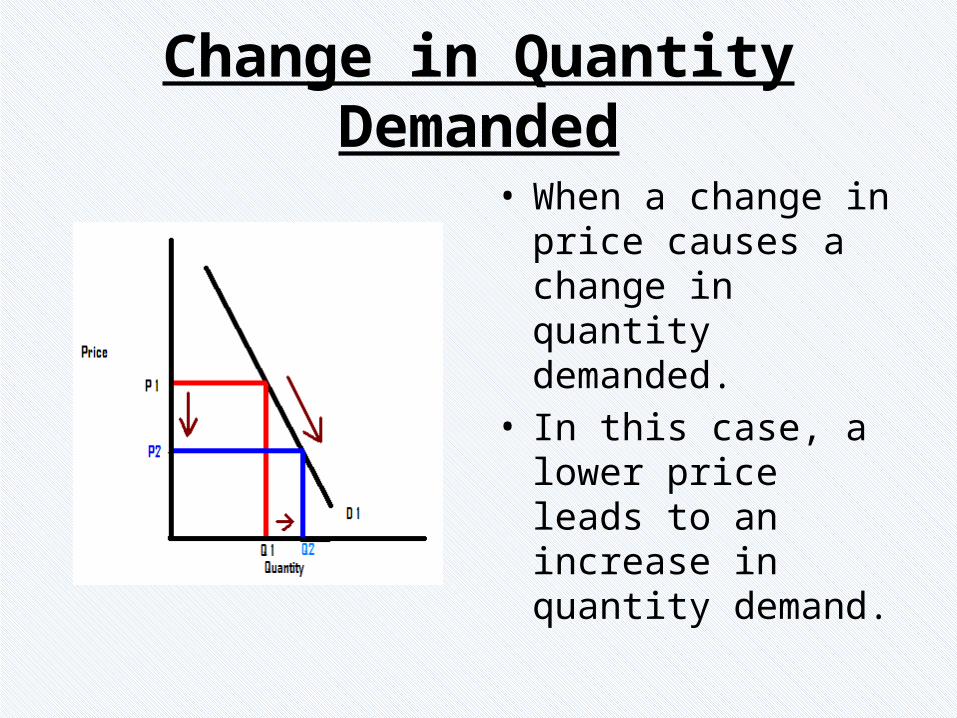
Change in Quantity Demanded
• When a change in price causes a change in quantity demanded.
• In this case, a lower price leads to an increase in quantity demand.
Change in quantity demanded
• Income effect – the change in quantity demanded because of a change in price alters consumers’ real income.
• Substitution effect – the change in quantity demanded because of a change in the relative price of a product

Example of the income effect
• If the price of a movie drops from $9 to $3, you might see more films because you have to work 2/3 less than you did before to see one movie.
• When the price of goods and services drop and your income stays the same, you can buy more. It has a similar effect of a pay raise if prices remain the same.
Example of the substitution effect
• If Wendy’s raised the price of their $.99 extra value menu to $1.99 you may choose to substitute Wendy’s food with McDonalds $1.00 menu.
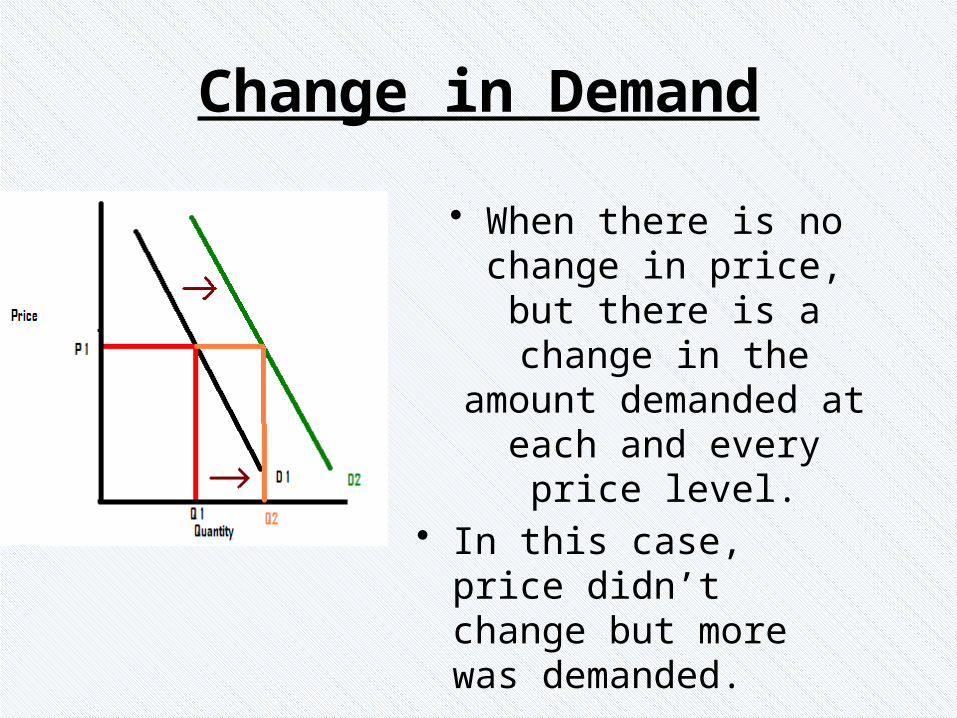
Change in Demand
• When there is no change in price, but there is a change in the amount demanded at each and every price level.
• In this case, price didn’t change but more was demanded.

Change in Demand
• Consumer income – as income goes up, the amount of goods and services you can buy also goes up
• Consumer tastes – advertising, news reports, and style changes cause consumers to demand more or less of a product
• Substitutes – products that can be used in place of other products i.e. butter/margarine
• Complements – goods that increase our use of other goods
• Change in expectations – the willingness to buy more or less of a product based on future predictions
• Number of consumers – as more consumers enter the market demand curve will shift to the right & vice versa.

Complements• What are the complements
for Tony the Tiger?• If Larry’s Foodland put
milk on sale, what might this do to Tony the Tiger?
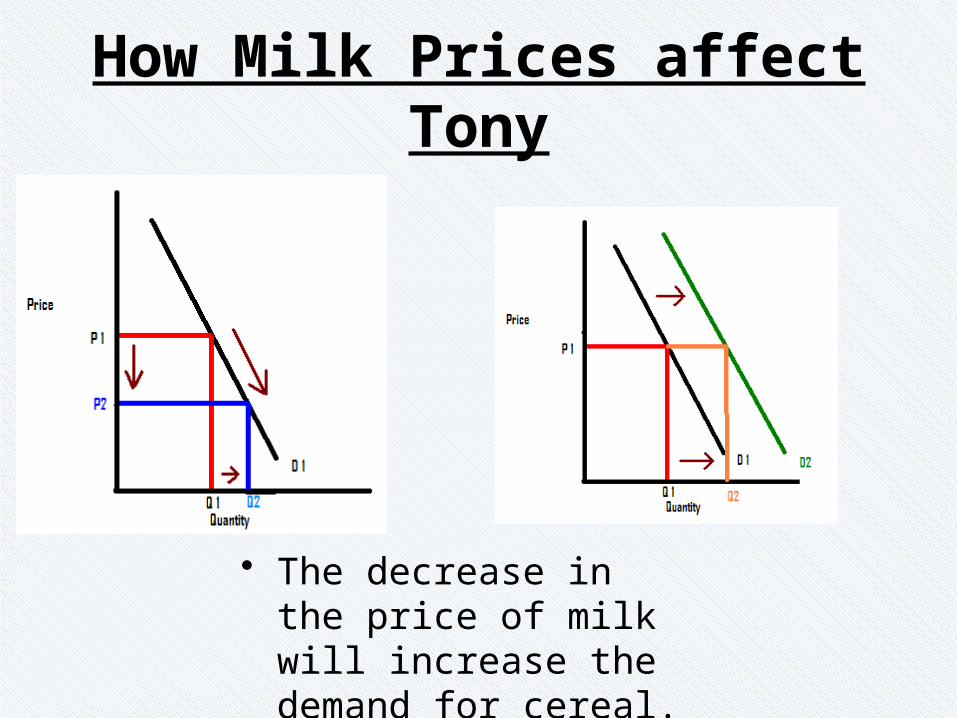
How Milk Prices affect Tony
• The decrease in the price of milk will increase the demand for cereal.
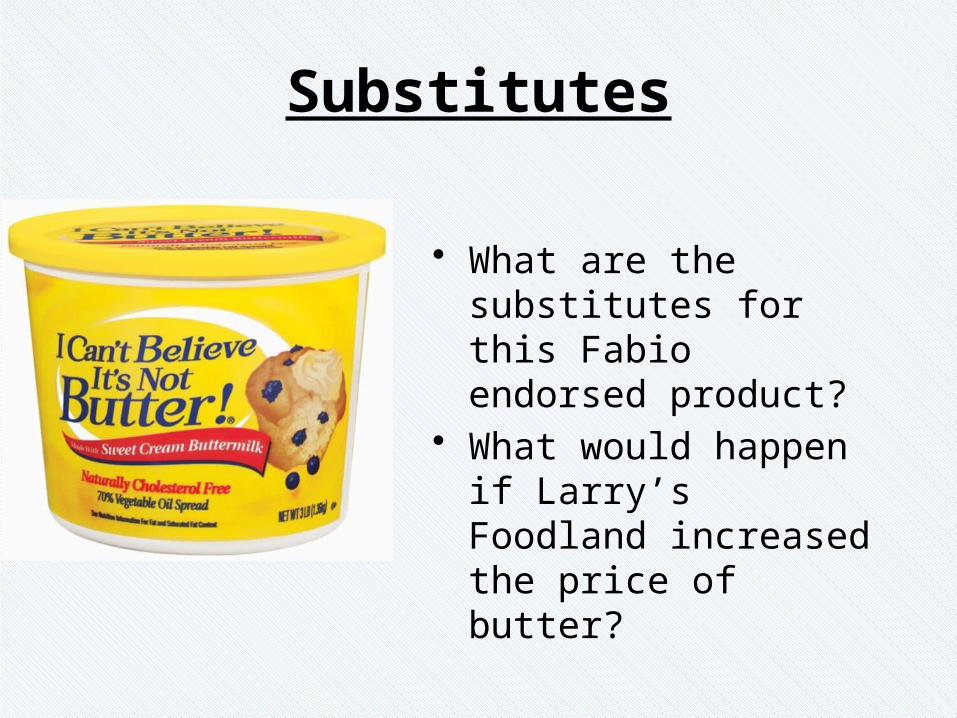
Substitutes
• What are the substitutes for this Fabio endorsed product?
• What would happen if Larry’s Foodland increased the price of butter?
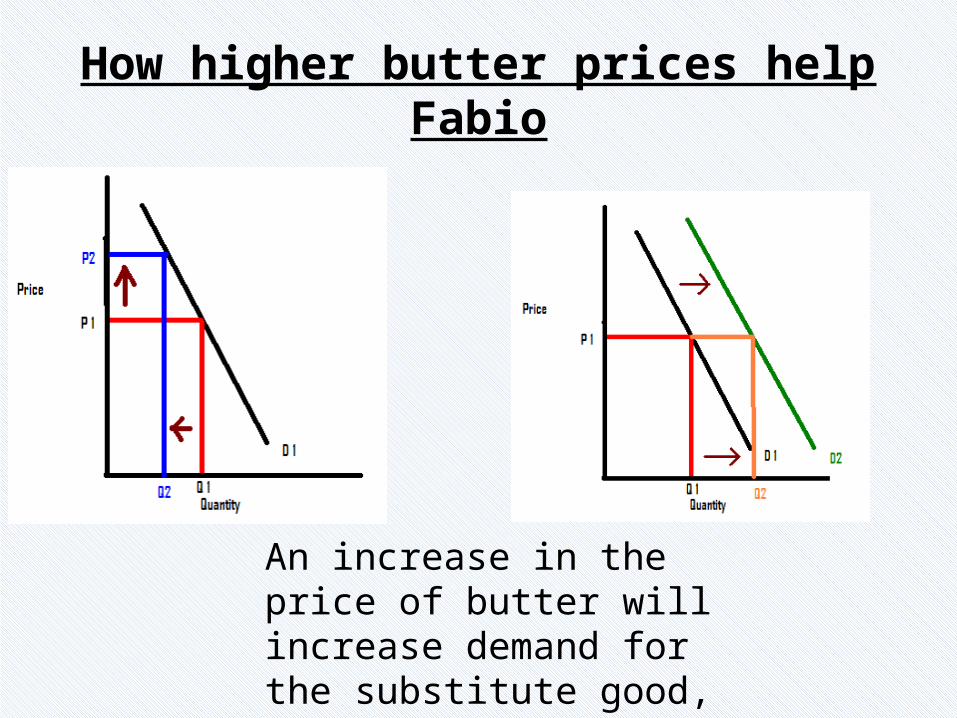
How higher butter prices help Fabio
An increase in the price of butter will increase demand for the substitute good, “I Can’t Believe It’s Not Butter”

Homework Tonight
• Vocabulary words for Supply (page 53-56)

Economics 9/17/14 http://mrmilewski.com
• OBJECTIVE: Examine Supply, Demand and Market Equilibrium. AP Macro-I.D
• Language objective: SWBAT define essential vocabulary on Supply, write notes on the Law of Supply and also read and write answers to questions about Supply.
• I. Journal#11-Review Vocabulary-Do now: List the five Determinants of Demand and give an example of each one.
• II. Homework -Questions #4 through 8 on page 66. Problem #2 on
page 66. Read pages 56-61, Market Equilibrium.• III. Constitution Day
Law of Supply
• The principle that suppliers will normally offer more for sale at higher prices and less at lower prices.
• As price goes up, quantity produced also goes up

Supply Curve• At high prices more will
be supplied. At lower prices, less will be supplied.
• Price and quantity supplied are directly related.
• The drawing to the right is a typical supply curve.
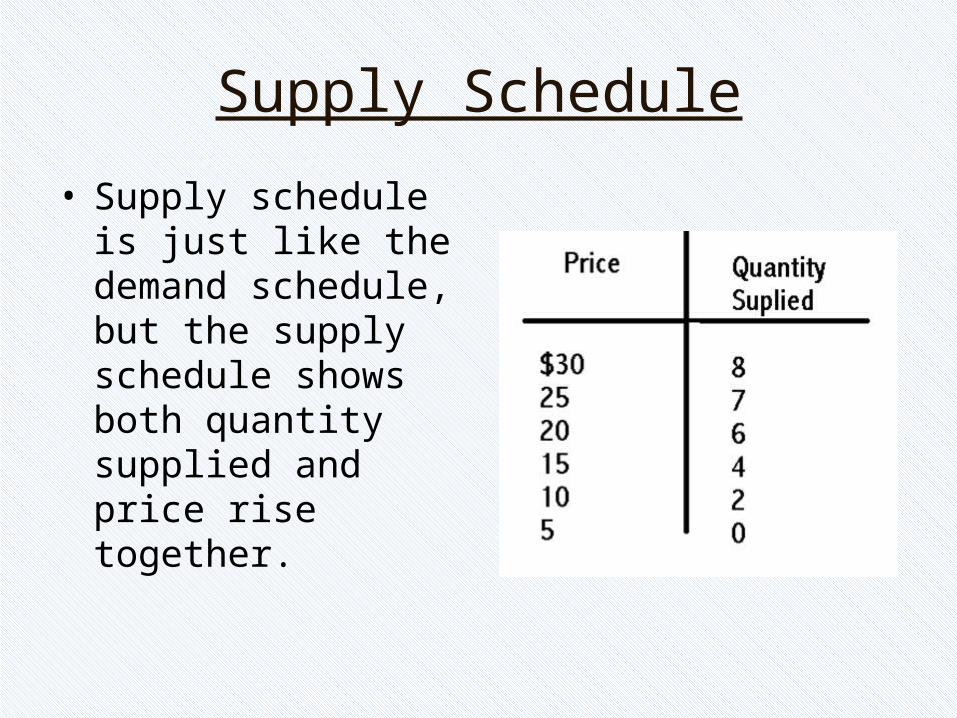
Supply Schedule
• Supply schedule is just like the demand schedule, but the supply schedule shows both quantity supplied and price rise together.
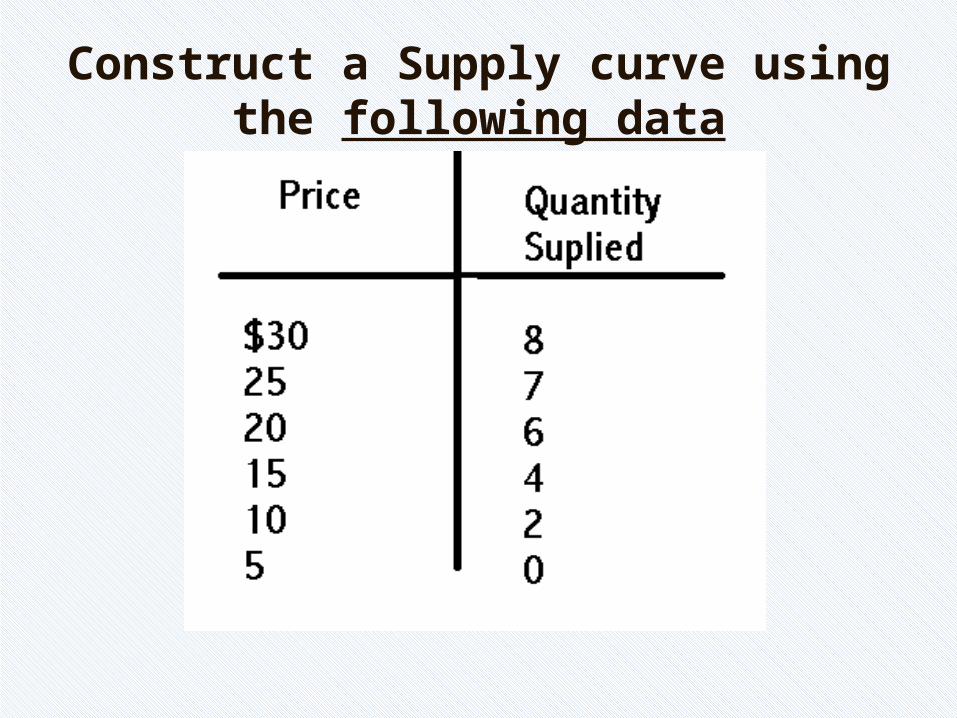
Construct a Supply curve using the following data
On your supply curve
• Label the point where price is $15 and quantity supplied 4 units as point a.
• Next label the point where price is $20 and quantity supplied is 6 units as point b.
• Movement from point a to point b, or to any other point along the supply curve is movement in quantity supplied.
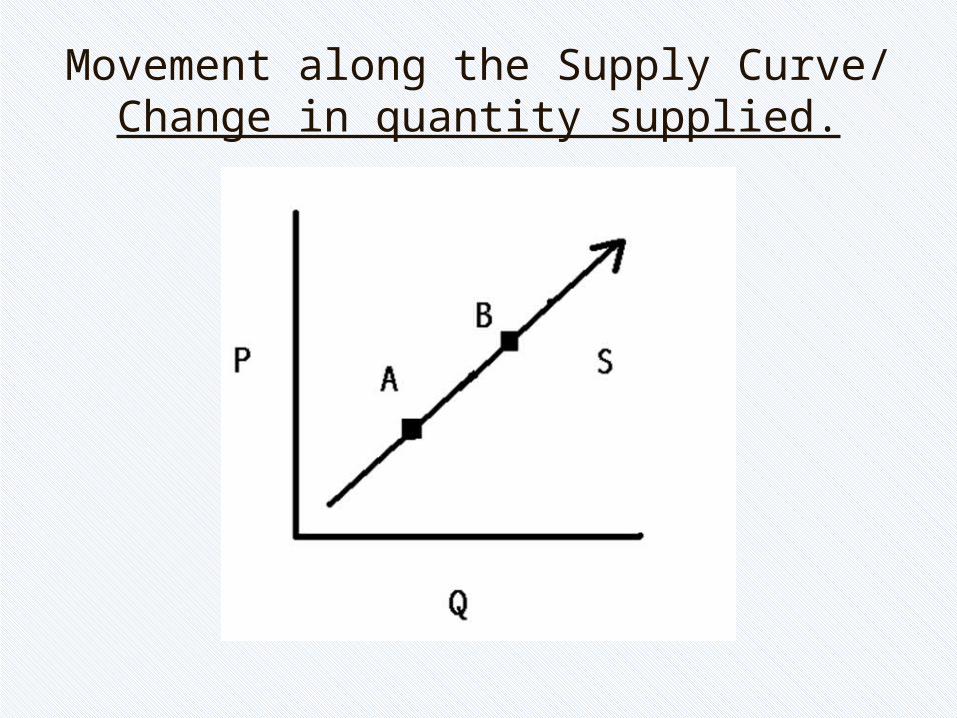
Movement along the Supply Curve/ Change in quantity supplied.

Change in supply• A change in supply
occurs when something happens to cause suppliers to offer different amounts of products for each price in the market.
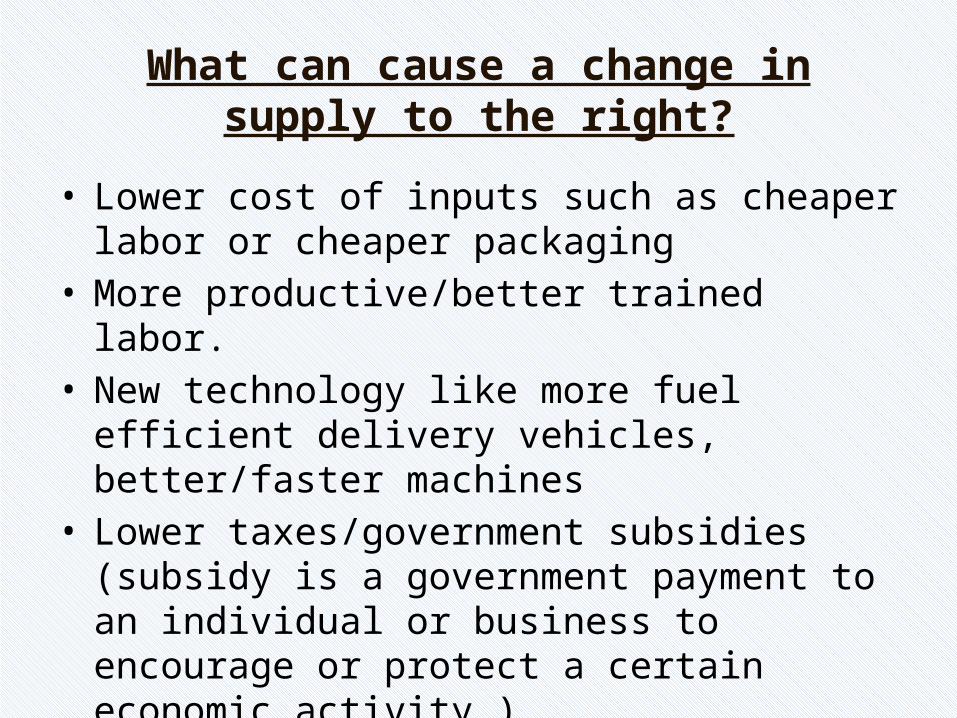
What can cause a change in supply to the right?
• Lower cost of inputs such as cheaper labor or cheaper packaging
• More productive/better trained labor.• New technology like more fuel efficient delivery
vehicles, better/faster machines• Lower taxes/government subsidies (subsidy is a
government payment to an individual or business to encourage or protect a certain economic activity.)
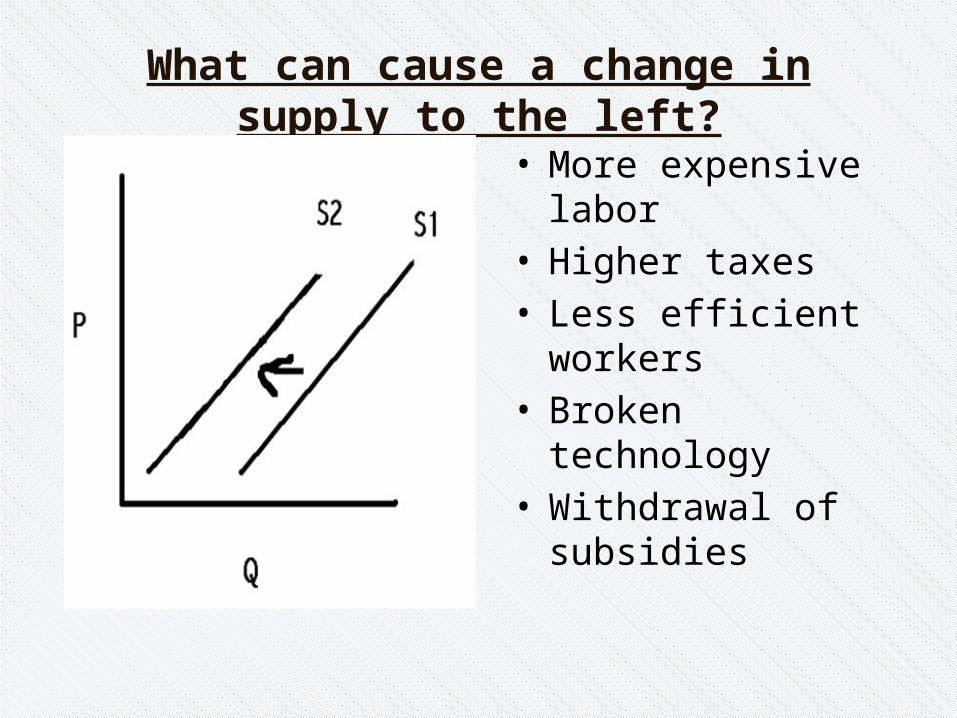
What can cause a change in supply to the left?
• More expensive labor• Higher taxes• Less efficient workers• Broken technology• Withdrawal of subsidies

Homework Tonight
• Questions #4 through 8 on page 66. Problem #2 on page 66.
• Read pages 56-61, Market Equilibrium.
Economics 9/18/14 http://mrmilewski.com
• OBJECTIVE: Examine Supply, Demand and Market Equilibrium. AP Macro-I.D
• Language objective: SWBAT define essential vocabulary on Equilibrium, write notes on the Market Equilibrium and also read and write answers to questions about changes in Demand and Supply.
• I. Journal#12-Review Homework-Do now: List the Determinants of Supply and give an example of each one.
• II. Homework -Questions #9 and 10 on page 66 and Problems # 3-5.

Equilibrium Price and Quantity• Equilibrium Quantity:
Where the supply and demand curves intersect is where the quantity demanded equals the quantity supplied.
• Equilibrium Price: The price where quantity demanded equals quantity supplied.
Surplus & Shortage
• Surplus – a situation in which the quantity supplied is greater than the quantity demanded at a given price.
• Shortage – a situation in which the quantity demanded is greater than the quantity supplied at a given price.
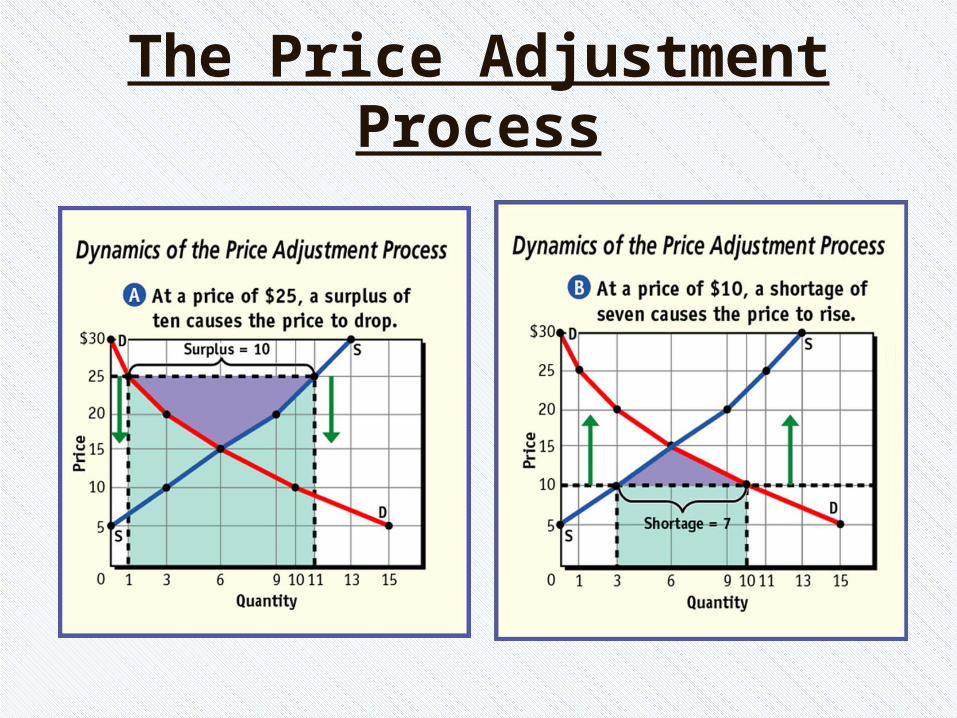
The Price Adjustment Process
Explaining and Predicting Prices
• Economists use market models to explain how the world around us works and predict how certain events such as changes in prices might occur.
• A change in price is normally the result of a change in supply, a change in demand, or changes in both.

Changes in Supply• When demand remains constant, and supply
increases, equilibrium price is lowered but equilibrium quantity is increased.
• When demand remains constant, and supply decreases, equilibrium price rises while equilibrium quantity decreases.

Supply Increase/Demand Decrease
• Supply increases and demand decreases:a. Equilibrium price will drop b. Equilibrium quantity will increase if supply’s
increase is greater than demand’s decrease.c. Equilibrium quantity will decrease if demand’s
decrease is greater than the increase in supply.
Supply Decrease/Demand Increase• Supply decreases and demand increases:
a. Equilibrium price will rise b. Equilibrium quantity will increase if supply’s
increase is greater than demand’s decrease.c. Equilibrium quantity will decrease if demand’s
decrease is greater than the increase in supply.

Homework Tonight
• Homework: • Questions #9 and 10 on
page 66 and Problems # 3-5.
• Read pages 61-64
Economics 9/19/14 http://mrmilewski.com
• OBJECTIVE: Examine Supply, Demand and Market Equilibrium. AP Macro-I.D
• Language objective: SWBAT define essential vocabulary on Price Ceilings and Price Floors, write notes on both and also read and write answers to questions about changes in Demand and Supply.
• I. Journal#12-Review Homework-Do now: Complete the Quiz in Figure 3.6 on page 57.
(Don’t look at the answers until you have answered the questions.)• II. Homework
-Work on study guide.

Supply Increase/Demand Decrease
• Supply increases and demand decreases:a. Equilibrium price will drop b. Equilibrium quantity is indeterminate.
Equilibrium quantity will increase if supply’s increase is greater than demand’s decrease. Equilibrium quantity will decrease if demand’s decrease is greater than the increase in supply.

Supply Decrease/Demand Increase
• Supply decreases and demand increases:a. Equilibrium price will rise b. Equilibrium quantity is indeterminate.
Equilibrium quantity will decrease if supply’s decrease is larger than demand’s increase. Equilibrium quantity will increase if demand’s increase is greater than the decrease in supply.

Supply Increase/Demand Increase
• Supply increases and demand increases:a. Equilibrium price is indeterminate.
Equilibrium price will fall if the increase in supply is greater than the increase in demand. Equilibrium price will rise if the increase in demand is greater than the increase in supply.
b. Equilibrium quantity will increase if both supply and demand increase.

Supply Decrease/Demand Decrease
• Supply decreases and demand decreases:a. Equilibrium price is indeterminate.
Equilibrium price will rise if the decrease in supply is greater than the decrease in demand. Equilibrium price will fall if the decrease in demand is greater than the decrease in supply.
b. Equilibrium quantity will fall if both supply and demand decreases.
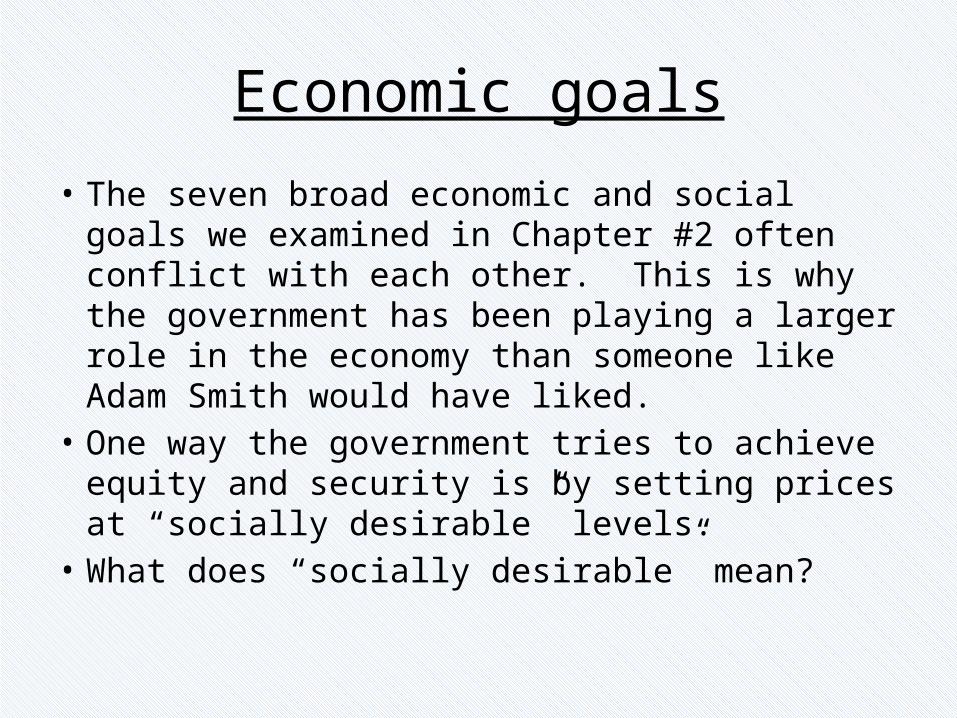
Economic goals
• The seven broad economic and social goals we examined in Chapter #2 often conflict with each other. This is why the government has been playing a larger role in the economy than someone like Adam Smith would have liked.
• One way the government tries to achieve equity and security is by setting prices at “socially desirable” levels.
• What does “socially desirable” mean?

Distorting Market Outcomes
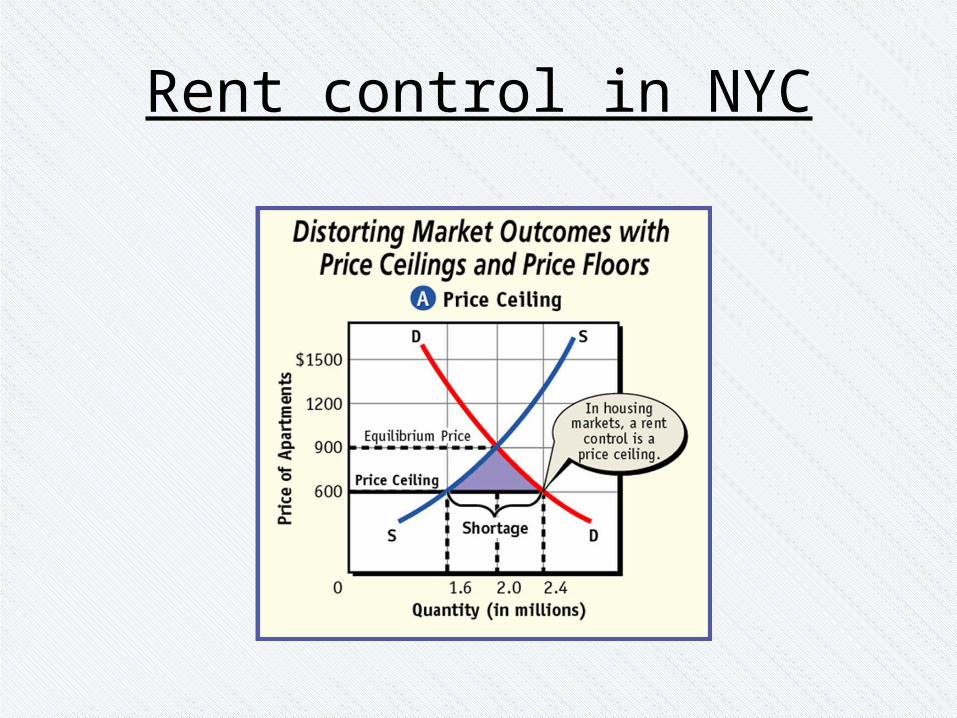
• Price ceiling – a maximum legal price that can be charged for a product.
• Price ceilings can be found in places like NYC who put rent controls on housing in an attempt to make it affordable.
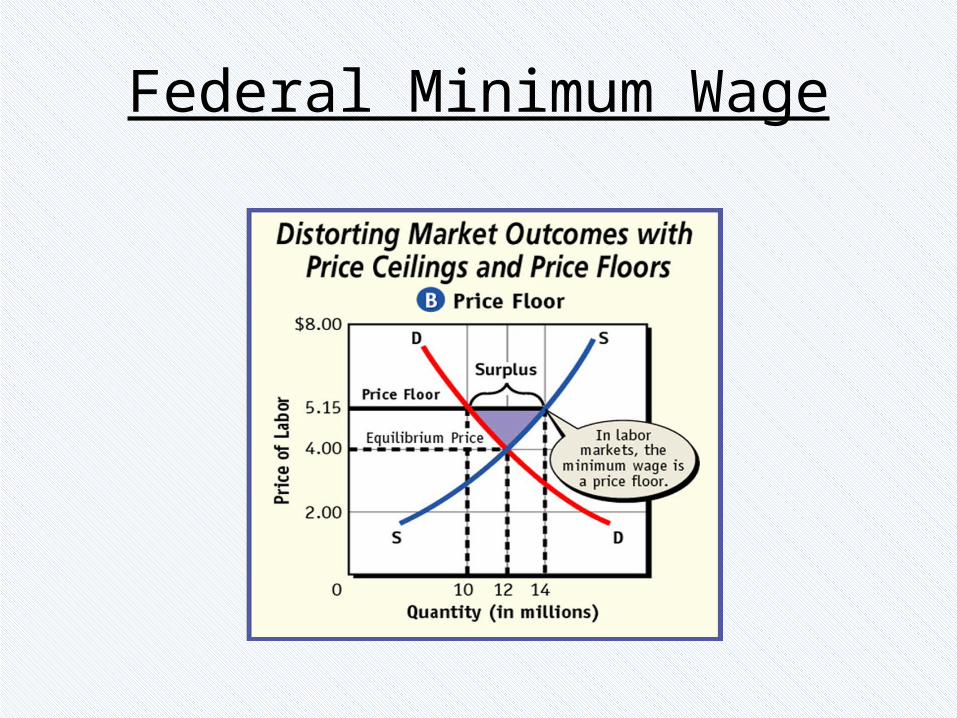
• Price floor – the lowest legal price that can be paid for a good or service.
• Minimum wage – the lowest legal wage that can be paid to most workers is an example of a price floor.

Rent control
• For example, without rent controls the equilibrium price for housing in NYC might be $900 per month. At this price, suppliers would be willing to provide 2 million units of housing.
• REMINDERS: Law of Demand – as price drops quantity demanded increases.Law of Supply – as price drops quantity supplied decreases.
• If NYC were to put a price ceiling of $600 per month on rent, what would happen to quantity demanded? What about quantity supplied?
Rent control in NYC
Federal Minimum Wage

Homework Tonight
• Work on study guide for test on Tuesday, 9/23.


