63
Ambient Air Monitoring of Methyl Bromide GOOD PRACTICE GUIDE FOR AMBIENT AIR MONITORING OF METHYL BROMIDE AT FUMIGATION SITES IN NEW ZEALAND Final 13 December 2012
Ambient Air Monitoring of Methyl Bromide
GOOD PRACTICE GUIDE FOR AMBIENT AIR MONITORING OF METHYL BROMIDE AT FUMIGATION SITES IN NEW ZEALAND
Final
13 December 2012
The SKM logo trade mark is a registered trade mark of Sinclair Knight Merz Pty Ltd.
Ambient Air Monitoring of Methyl Bromide
GOOD PRACTICE GUIDE FOR AMBIENT AIR MONITORING OF METHYL BROMIDE AT FUMIGATION SITES IN NEW ZEALAND
Final
13 December 2012
Sinclair Knight Merz Level 3, 86 Customhouse Quay, PO Box 10-283 Wellington, New Zealand Tel: +64 4 473 4265 Fax: +64 4 473 3369 Web: www.globalskm.com
COPYRIGHT: The concepts and information contained in this document are the property of Sinclair Knight Merz Limited. Use or copying of this document in whole or in part without the written permission of Sinclair Knight Merz constitutes an infringement of copyright.
LIMITATION: This report has been prepared on behalf of and for the exclusive use of Sinclair Knight Merz Limited’s Client, and is subject to and issued in connection with the provisions of the agreement between Sinclair Knight Merz and its Client. Sinclair Knight Merz accepts no liability or responsibility whatsoever for or in respect of any use of or reliance upon this report by any third party.
SINCLAIR KNIGHT MERZ
PAGE i
Contents
1. Introduction 3
1.1 Purpose of the Good Practice Guide 3
1.1. Scope 3
1.2. Target Audience 4
1.3. Good Practice 4
1.4. Stakeholders in Methyl Bromide Reduction (STIMBR) 4
2. Fumigation Activities and Legislative Considerations 6
2.1. Fumigation Activities 6
2.2. Legislative Considerations 6
3. Ambient Air Monitoring Method Selection 9
3.1. Introduction 9
3.2. Photo-Ionisation Detectors (PIDs) 9
3.2.1. Applicability of PIDs 9
3.2.2. Limitations of PIDs 10
3.3. Gas Detection Tubes 11
3.3.1. Applicability of Gas Detection Tubes 11
3.3.2. Limitations of Gas Detection Tubes 11
3.4. Alternative Methods for On-Site Analysis of Methyl Bromide 12
3.4.1. Applicability 12
3.4.2. Limitations 12
3.5. Ambient Air Sampling Methods for Laboratory Analysis of Methyl Bromide 12
3.6. General Advice on Instrument Selection 13
4. Site Selection 15
4.1. Site Numbers and Selection 15
4.1.1. The effect of land use activities on monitoring 16
4.2. Geometric Considerations and Buffer Zones 17
4.3. Locations over Water 19
4.4. Topography (Geographic Location) 19
4.5. Climate and Meteorology 20
4.6. Site Selection Checklist 22
5. Sampling and Data Recording 25
5.1. Introduction 25
5.2. EPA Data Collection Requirements 25
5.3. Pre-Sampling 26
5.4. During Sampling 28

SINCLAIR KNIGHT MERZ
PAGE ii
5.5. Post-Sampling and Sample Handling 29
5.6. Further Information 32
5.6.1. Calibration 32
5.6.2. Data Logging 32
5.6.3. Quality assurance and quality control (QA/QC) 32
5.6.4. Instrument Use 33
6. Presentation of Results 35
6.1. Introduction 35
6.2. Meteorological Data 35
6.3. Results of Monitoring 36
6.4. Calculation of Time-Averaged Methyl Bromide Concentrations 39
6.4.1. Calculating 1-hour and 24-hour Averages 39
6.4.2. Calculating Annual Averages 40
6.4.3. Reporting Averages 42
6.5. Conclusion of Results 42
7. References 43
Appendix A Ambient Monitoring Field Data Sheets 44
Appendix B Case Study: Monitoring Method 54
SINCLAIR KNIGHT MERZ
PAGE 1
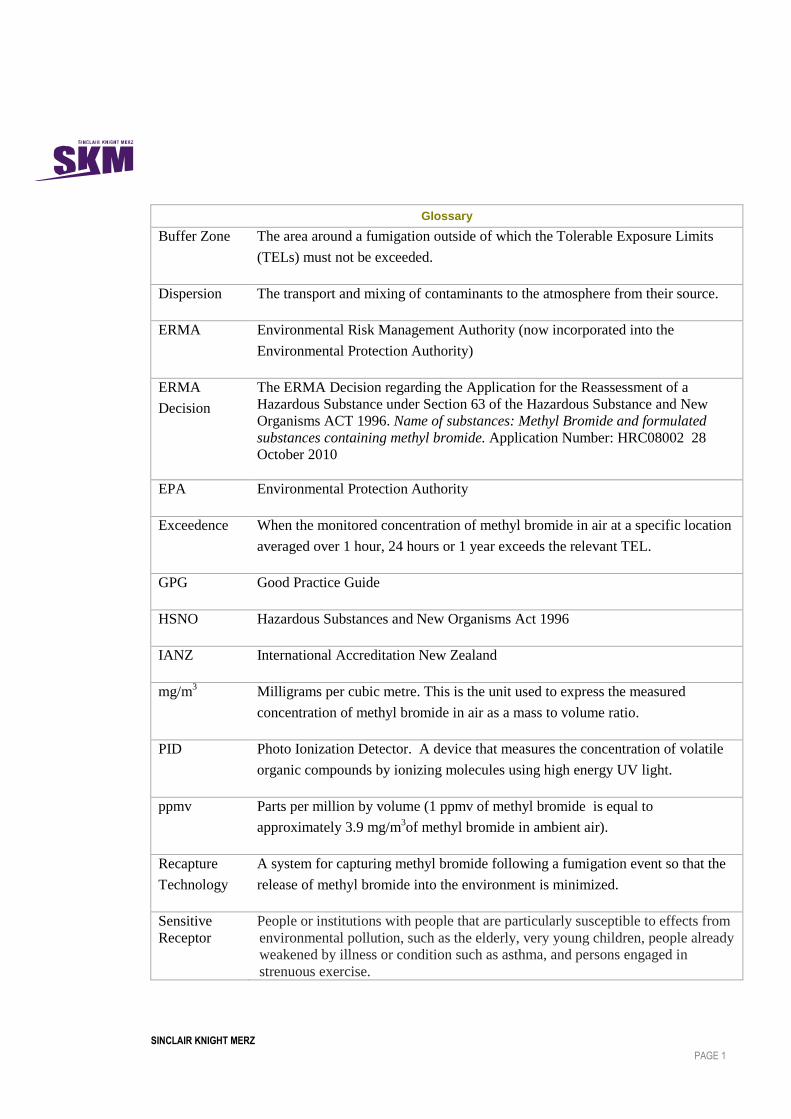
Glossary
Buffer Zone The area around a fumigation outside of which the Tolerable Exposure Limits
(TELs) must not be exceeded.
Dispersion The transport and mixing of contaminants to the atmosphere from their source.
ERMA Environmental Risk Management Authority (now incorporated into the
Environmental Protection Authority)
ERMA
Decision
The ERMA Decision regarding the Application for the Reassessment of a
Hazardous Substance under Section 63 of the Hazardous Substance and New
Organisms ACT 1996. Name of substances: Methyl Bromide and formulated
substances containing methyl bromide. Application Number: HRC08002 28
October 2010
EPA Environmental Protection Authority
Exceedence When the monitored concentration of methyl bromide in air at a specific location
averaged over 1 hour, 24 hours or 1 year exceeds the relevant TEL.
GPG Good Practice Guide
HSNO Hazardous Substances and New Organisms Act 1996
IANZ International Accreditation New Zealand
mg/m3
Milligrams per cubic metre. This is the unit used to express the measured
concentration of methyl bromide in air as a mass to volume ratio.
PID Photo Ionization Detector. A device that measures the concentration of volatile
organic compounds by ionizing molecules using high energy UV light.
ppmv Parts per million by volume (1 ppmv of methyl bromide is equal to
approximately 3.9 mg/m3of methyl bromide in ambient air).
Recapture
Technology
A system for capturing methyl bromide following a fumigation event so that the
release of methyl bromide into the environment is minimized.
Sensitive
Receptor
People or institutions with people that are particularly susceptible to effects from
environmental pollution, such as the elderly, very young children, people already
weakened by illness or condition such as asthma, and persons engaged in
strenuous exercise.

PAGE 2
Glossary
TELs Tolerable Exposure Limits are the time based (1 hour, 24 hour or 1 year) average
concentrations of methyl bromide that are not to be exceeded beyond the buffer
zone.
WES-TWA Workplace Exposure Standard – Time Weighted Average
PAGE 3
1. Introduction
1.1 Purpose of the Good Practice Guide
The purpose of this Good Practice Guide (GPG) is to provide guidance to fumigators, monitoring
technicians and port authorities concerning ambient air monitoring for methyl bromide during
fumigation venting in New Zealand.
This GPG has been prepared to assist in compliance with the monitoring controls set out in the
Environmental Risk Management Authority (ERMA) Decision1 (the Decision) for reassessment of
methyl bromide and the continued systematic and robust collection of valid data on methyl bromide
concentrations in air at the landward security/property boundary or buffer zone of the site under
investigation during fumigation venting.
1.1. Scope
This GPG has been prepared to provide a standard for the measurement of methyl bromide
concentrations in the air and the management of monitoring data. The GPG has been designed to
ensure that monitoring data and management is carried out:
Correctly - air quality monitoring is of a high quality and free from errors (measurement
precision and accuracy);
Consistently - data is correctly recorded, analyzed, processed, reported and archived following
good monitoring practice principles;
Efficiently - suppliers and users of methyl bromide ambient air quality data have easy and
rapid access to methods, procedures and new developments; and
Cost effectively – appropriate information is obtained at the least cost.
The GPG describes:
Typical methyl bromide fumigation activities and sites where fumigations are undertaken;
Methyl bromide ambient air monitoring methods and equipment;
The criteria to consider for the selection of appropriate ambient air monitoring locations at the
boundary of a site or buffer zone where the methyl bromide fumigation is being carried out;
1 Environmental Risk Management Authority Decision
Application for the Reassessment of a Hazardous Substance under Section 63 of the Hazardous Substance and New Organisms ACT 1996 Name of substances: Methyl Bromide and formulated substances containing methyl bromide. Application Number: HRC08002 28 October 2010
PAGE 4
Monitoring techniques to be followed including calibration of equipment, sampling data to be
recorded, sampling periods, QA/QC checks; and
How the data collected from the monitoring of a methyl bromide fumigation should be
reported.
This GPG is intended for use whenever methyl bromide is being used without recapture technology
including but not limited to ports, container yards and transportation terminals and excluding soil
fumigations. It is expected that at times of fumigant introduction and ventilation that buffer zones
as set out in the ERMA Decision will be in place and of appropriate scale to prevent public access
and shall meet the conditions set out in the Decision. This GPG is designed to provide guidance on
monitoring the concentration of fumigant at the landward boundary of the buffer zone rather than
within it. While this GPG addresses multiple methods to achieve compliant monitoring it is focused
on monitoring using non-methyl bromide-specific real time sampling methods.
Specific methods recommended here are photo-ionization detectors (PIDs), particularly in
combination with methyl-bromide specific gas monitoring tubes.
Other methyl bromide-specific monitoring methods such as USEPA Compendium Methods TO-15
(TO-15) and TO-17 (TO-17) are also discussed, but it is understood that the expense of these
methods make them impractical for fumigation monitoring to meet the requirements of the
Decision.
This GPG is not intended for use in relation to fumigation cells or fumigant capture installations.
1.2. Target Audience
This GPG is intended for use by all parties responsible for the ambient air monitoring of methyl
bromide fumigation venting. This may include but is not limited to fumigators, health and safety
inspectors, compliance officers, port authorities, and environmental or air quality technicians.
1.3. Good Practice
This GPG is considered as “Good Practice” for ambient air monitoring of methyl bromide and may
require a higher level of performance than that required by the HSNO regulations and decisions. In
order to clarify what is mandatory the reader is referred to the Conditions set out in the ERMA
Decision.
1.4. Stakeholders in Methyl Bromide Reduction (STIMBR)
STIMBR is an incorporated society which brings together industry, government and research
organisations, and individuals with the aim of providing a united voice in support of initiatives
aimed at enhancing market access and biosecurity clearances for goods and products while

PAGE 5
reducing the release of methyl bromide into the atmosphere and seeking the long term reduction in
its use.
The group provides an interface between users of methyl bromide, fumigators applying treatments,
government departments concerned with reducing the use of ozone depleting substances,
researchers seeking alternative treatments and strategies, and other affected parties. This GPG was
commissioned by STIMBR in response to the ERMA Decision.
PAGE 6
2. Fumigation Activities and Legislative Considerations
2.1. Fumigation Activities
This GPG is intended to offer guidance for the monitoring of methyl bromide in ambient air during
methyl bromide fumigation activities in accordance with the ERMA decision. As such, the
guidance applies to the monitoring of ambient air concentrations of methyl bromide at the landward
boundary of buffer zones or controlled areas for any application of methyl bromide that does not
utilize recapture technology, excluding fumigation of soils. These applications include fumigation
of the following:
Shipping containers: fumigation of products of any type within closed shipping containers;
Tarpaulin enclosures: fumigation of products of any type enclosed within gas tight tarpaulins
or covers, sealed to hard sealed ground surface with tape, sandbags, water snakes or similar;
and,
Ships holds: fumigation of products of any type within closed holds of ships.
These three types of fumigation may differ from one another in size by an order of magnitude in
terms of mass of product and fumigant used. Total methyl bromide fumigant quantity per shipping
container is almost always less than 10 kg, while within a tarpaulin enclosure it may exceed 100 kg
of fumigant, and a ship‟s hold may require a tonne or more. These quantities vary not only with
the volume of the enclosure, but also with bio-security standards of the importing country, the
nature of the product being treated, and temperature. Fumigant concentrations commonly require a
methyl bromide concentration ranging between 46 to 120 grams per cubic metre, or roughly 12,000
to 30,000 parts per million over the gross volume of the enclosure.
2.2. Legislative Considerations
The relevant air quality guidelines and exposure limits for public exposure to methyl bromide at the
time of this report are discussed in this section. The ERMA decision set Tolerable Exposure Limits
(TELs) to prevent adverse effect to human health from methyl bromide during fumigations. These
TELs cannot be exceeded outside the buffer zone established around the fumigation activity. The
TELs were established for 1-hour, 24-hour and annual averaging periods, and are provided in
Table 1 below. The TELs are based on epidemiological and exposure studies undertaken by
toxicologists, and are designed to protect the most sensitive members of the population from
adverse effects from exposure to methyl bromide. No adverse effects on human health are
expected below these limits.

PAGE 7
Table 1 Tolerable Exposure Limits (TELs) for Methyl Bromide in Air
Averaging Period TEL Concentration
Parts per million (ppm) Milligrams per cubic metre (mg/m3)
TELair (annual) 0.0013 0.005
TELair (24 hour) 0.333 1.3
TELair (1 hour) 1 3.9
In addition to the TELs, the Department of Labour has set a Workplace Exposure Standard as a
time weighted average (WES-TWA) over an eight hour day to protect workers from excessive
exposure to methyl bromide. The WES-TWA for methyl bromide is 5 ppm (19 mg/m3) as an 8-
hour average2. This standard is applicable to workers within the fumigation and buffer zones of a
fumigation activity, but is not applicable to public exposure which is necessarily more stringent to
protect sensitive members of populations.
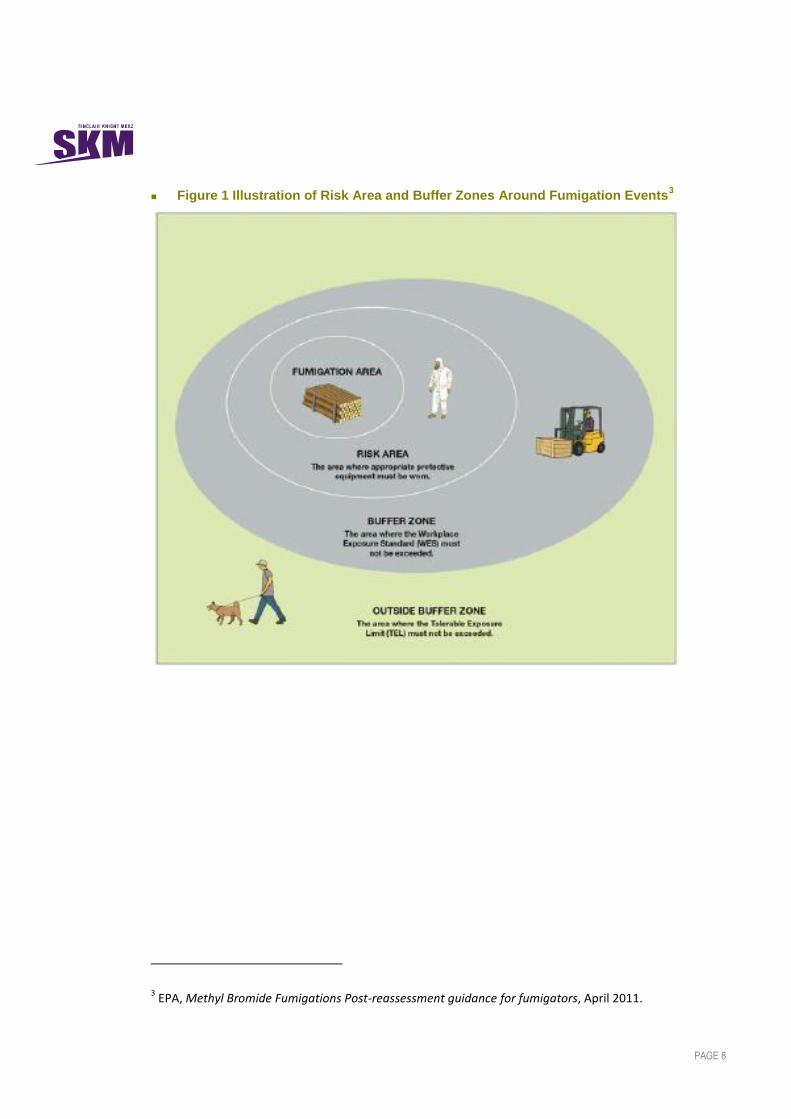
A conceptual illustration of a buffer zone around a fumigation event is shown in Figure 1, and
shows the Risk Area in which personal protective equipment for methyl bromide must be worn, a
buffer zone in which the WES-TWA for methyl bromide applies, and outside the buffer zone where
the TELs for air apply. This monitoring guide is designed to confirm that the TELs for methyl
bromide are not exceeded outside the boundary of the buffer zone during fumigation events.
2 Department of Labour, Workplace Exposure Standards and Biological Exposure Indices, September 2010.
PAGE 8
Figure 1 Illustration of Risk Area and Buffer Zones Around Fumigation Events3
3 EPA, Methyl Bromide Fumigations Post-reassessment guidance for fumigators, April 2011.
PAGE 9
3. Ambient Air Monitoring Method Selection
3.1. Introduction
A variety of methods are available for measuring contaminants in ambient air, with an equally wide
variation in cost and precision. Specific monitoring methods should be selected based on the
purpose, objectives and budget of the monitoring programme. This section discusses methods for
monitoring methyl bromide in ambient air and provides details concerning methodologies
historically used for the monitoring of methyl bromide fumigations in New Zealand. Each
subsection provides an overview of the methodology, advice on where and when this method is
applicable for use, and the limitations associated with each method. Descriptions of methyl
bromide monitoring equipment are presented here as examples only and do not limit monitoring
staff to the use of this equipment. Alternative methods not mentioned here may exist or be
developed over time, and may be used assuming they meet minimum requirements of instrument
sensitivity and response time. Choosing the appropriate monitoring equipment is critical for
achieving the aims of the monitoring program.
3.2. Photo-Ionisation Detectors (PIDs)
Photo-ionisation Detectors (PIDs) are the most commonly used instruments for monitoring methyl
bromide during fumigation events in New Zealand. PIDs are used to measure concentration of
volatile organic compounds (VOCs), using an ultra violet lamp producing high energy photons to
break down gas molecules into positively charged ions. The electrical current produced in the
reaction becomes the signal output for the unit, providing a direct reading of concentration in near
real-time.
3.2.1. Applicability of PIDs
PIDs can be used to directly detect a wide range of VOCs, including methyl bromide. PIDs are not
specific to any one compound, and so have limited application in environments where there may be
a mixture of VOCs4. However, the relatively low cost and ease of use make them a preferred
option for screening monitoring. The primary advantages of using PIDs for monitoring methyl
bromide include:
Relatively low cost;
Robust for field use;
Direct reading and quick response time;
4 VOCs commonly found in air include: paints, solvents, fuels, components in exhaust fumes and timber
preservatives.
PAGE 10
Small size for portability and ease of handling; and
Simplicity of operation.
PIDs are the most readily available and commonly used instruments for monitoring methyl
bromide in ambient air for these reasons. PIDs are typically calibrated with an isobutylene
calibration gas, and have experimentally determined response factors for other compounds. For
example, a typical response factor for methyl bromide relative to isobutylene is 1.7, meaning a
reading of 1 ppm on a PID calibrated to isobutylene would equate to 1.7 ppm of methyl bromide
(assuming the response is due solely to methyl bromide and there is no interference from other
VOCs).
PIDs must be calibrated no more than 3 months prior to use, and must be checked using zero and
span gases before and after the sampling event. Hydrocarbon-free air should be used as the zero
gas. 21% oxygen in nitrogen is commonly used but may be difficult to obtain, therefore ambient
air passed through a charcoal scrubber can be used and is recommended. Isobutylene is commonly
used as the span gas (a premixed cylinder of isobutylene in nitrogen). The span gas should be at
80% of the full scale of the PID measurement range, and ideally the range should encompass the
expected concentrations.
3.2.2. Limitations of PIDs
Limitations of using PIDs for methyl bromide monitoring include:
Instrument response is not specific to methyl bromide - other VOCs in the air may influence
readings
Limited range of detection ( a typical lower detection limit for PIDs is 0.1 ppm); and,
Sensitivity to moisture.
Despite the ease of use of PIDs, the primary drawback is that they are not specific to methyl
bromide, and so a positive reading is not necessarily an indication that methyl bromide is present.
This is particularly relevant when monitoring in an area where there are other potential sources of
VOCs which could be detected by the instrument. For this reason, a positive reading by a PID
should be confirmed with a methyl bromide-specific analysis, such as gas detection tubes.
Alternatively a grab sample can be taken with a canister or extracted through an adsorbtion
cartridge to be analysed by GC or GC-MS at an off-site laboratory.
PIDs are also sensitive to moisture in the monitoring environment. Condensation of moisture on
the lamp can be a cause of instrument drift and may result in a false positive reading. On the other
hand, inlet filters designed to remove precipitation from the gas stream can accumulate water
droplets and partially scrub out methyl bromide from the sample, resulting in lower concentrations.
PAGE 11
Any methyl bromide monitoring conducted using PIDs should be carried out in conjunction with
methyl bromide-specific gas detection tubes to verify that a positive reading is not due to
instrument drift, moisture interference, or detection of other VOCs. When using gas detection
tubes or a grab sample for verification of a positive PID reading, the sample must be taken at the
same location and the same time in which the PID shows a positive reading.
3.3. Gas Detection Tubes
Gas detection tubes are thin glass tubes with calibration scales printed on them to enable direct
reading of concentrations of the substance being measured. Each tube contains a matrix (e.g. silica
gel, alumina) which binds selected detection reagents that are sensitive to the target substance in
order to produce a distinct layer of color change. The tubes are hermetically sealed at both ends.
After snapping off the sealed ends, a known volume of sample air is drawn through the detector
tube manually by a hand-held pump.
3.3.1. Applicability of Gas Detection Tubes
In the context of monitoring methyl bromide fumigation events, gas detection tubes are primarily
used for spot-checking instrument readings of PIDs. The applicability of using methyl bromide-
specific gas detection tubes include:
On-site measurements can be performed easily at any time and place, and within a short time;
Easy-to-check direct reading;
Extensive measuring range (based on tube type and sample volume);
No calibration required; and
Long shelf-life with excellent long-term stability if appropriately stored.
The simplicity of this method makes it easy to use and does not require a highly trained operator.
The easy-to-check readings reduce potential operator error and can give quick and accurate results.
Detection ranges can be easily adjusted by selecting different tube types and by altering air
volumes sampled. The tubes are pre-calibrated and do not require complicated calibration
procedures required for other methods. Methyl bromide-specific tubes have an accuracy of 10% for
measurements of 0.1 to 0.4 parts per million (ppm).
3.3.2. Limitations of Gas Detection Tubes
The main disadvantage of gas detection tubes is that they only provide a snapshot analysis at one
location for the time that the sample is drawn (typically less than a few minutes), and so are not
applicable for the continuous monitoring required for methyl bromide fumigations. In theory a
series of tubes could be drawn by a monitoring technician throughout the course of a fumigation
PAGE 12
ventilation. However, the expense and resource demand make them unrealistic for these
monitoring purposes on their own.
3.4. Alternative Methods for On-Site Analysis of Methyl Bromide
There are a variety of analytical methods capable of measuring methyl bromide in real time at
ambient-air concentrations. In addition to monitoring methyl bromide specifically, these methods
generally have a much greater sensitivity and can detect lower concentrations compared to PIDs.
However these methods require a significant cost for purchase or rental of equipment relative to
PIDs, and also require a much higher level of operator training. The analytical methods currently
in use include:
Electrochemical sensors;
Gas Chromatography (GC);
Gas Chromatography-Mass Spectrometry (GC-MS); and,
Fourier Transform Infrared spectroscopy (FTIR);
3.4.1. Applicability
Specificity to methyl bromide;
Are accurate down to ppb levels;
Real-time logged data easily downloaded and interrogated; and
GC, GC-MS and FTIR are capable of measuring a wide range of VOCs other than methyl
bromide.
3.4.2. Limitations
Significantly greater cost in instrument purchase, maintenance and consumables;
The instruments are less portable than other methods; and,
The instruments are significantly more complex and require a higher degree of operator
training.
The specificity of these analytical methods to methyl bromide, together with their lower detection
limit, makes them an attractive alternative to PIDs. However the large initial capital outlay, cost of
maintenance and operation, and training of operators in the use of the instrumentation make them
unlikely alternatives to using PIDs for fumigation monitoring at this time.
3.5. Ambient Air Sampling Methods for Laboratory Analysis of Methyl Bromide
These methods entail collection of a sample of ambient air in the field followed by laboratory
analysis by GC, GC-ECD or GC-MS. Typically, a known volume of air is pumped through a
PAGE 13
sorbent trap5, or a whole-air sample is collected in a Tedlar bag
6 (or equivalent) or evacuated steel
canister over a known period of time. The usefulness of this method is that the sampling
techniques are relatively simple, and it is not necessary to purchase the analytical equipment.
Using an International Accreditation New Zealand (IANZ) certified laboratory for sample analysis
provides some guarantee of data quality. A primary disadvantage of these methods is that they
entail a significant delay between the collection of the sample and the obtaining of results.
Furthermore the expense of the analysis would limit the number of samples during fumigation, and
is therefore not appropriate for the high time-resolved measurements that fumigation requires (i.e.,
every three minutes). These methods are most appropriate for collecting time-averaged samples
(for example over the course of a fumigation event), or for verification of a positive PID reading (in
a similar capacity as gas detection tubes).
Following the MfE guidelines, “hazardous air pollutants” should be measured using USEPA
sampling methodologies7. The applicable USEPA methods for VOCs are:
Compendium Method TO-17, an active sampling method onto mixed bed charcoal tubes with
a detection limit of 0.2 to 25 parts per billion in air (ppb). This method allows complete
speciation of the volatiles captured on the sample tube, thereby pinpointing the concentration
of methyl bromide (and other compounds collected).
Other suitable USEPA methodologies are TO-14A and TO-15 which refer to the collection of
a gaseous sample into a specially prepared canister. This method has recently become more
realistic with canister supply and analysis now available in New Zealand and alleviates the
need to cool the samples as required for Method TO-17.
These sampling methods can provide time-averaged measurements of methyl bromide by sampling
at a constant rate over the time period being investigated (e.g., 1-hour, 8-hour, or 24-hour
averages), and may be useful for determining the average ambient concentrations of methyl
bromide over the course of a fumigation event. However, the use of this method without a real-
time analyzer will make it impossible to confirm concentrations and determine when monitoring
should stop as per the ERMA Decision.
3.6. General Advice on Instrument Selection
Although monitoring objectives are the major factor to consider, resource constraints and the
availability of skilled staff must also be considered. More advanced systems can provide
increasingly refined data, but are usually more complex and difficult to handle. Overall the
5 A glass tube containing an adsorbent material such as activated carbon or tenax for trapping VOCs in ambient air 6 Bags designed for collection of gas samples for subsequent analysis 7 Good-practice guide for air quality monitoring and data management, Ministry for the Environment, New Zealand, April 2009
PAGE 14
following combination of instruments and techniques appear to be the best balance of application
and cost although they may not be applicable depending on the nature of the fumigation site:
Handheld PIDs for boundary monitoring where there are expected to be no significant sources
of VOCs, apart from methyl bromide. These instruments are preferable due to their low cost,
and access to local supply, repair and calibration within New Zealand.
Methyl bromide-specific gas detection tubes should be used alongside PIDs to confirm the
presence of methyl bromide when significant and sustained readings are displayed on the PID.
In the event that a fumigation is occurring in an area that has been shown to have a high
background concentration of VOCs that interfere with measurement of methyl bromide with
PIDs, ambient air sampling methods followed by laboratory analysis as described in Section
3.5 should be used in combination with the PIDs.
A portable, affordable, durable and reliable methyl bromide-specific monitor would be preferable
to a PID. However, at present there is not a monitor that can meet these requirements.
A combination of PIDs and detection tubes can allow fumigation operators at difficult locations to
control fumigation venting if venting is required in poor dispersion conditions and the operator
feels the TEL could be breached. There is a wide variety of PIDs on the market. However, many
are not appropriate for these monitoring purposes. Users must be careful in their selection of a PID
to ensure that sensitivity, resolution, data logging capabilities and reliability conform to good
practice requirements.
PAGE 15
4. Site Selection
The selection of a monitoring site or location can have an effect on the resulting measurements of
contaminant levels and on achieving the monitoring objectives. The monitoring location must be
located where humans have the potential to be affected.
4.1. Site Numbers and Selection
sensitivity of the surrounding receiving environment, land use activities, local topography,
meteorological conditions of the area and the height and size of the fumigation point of ventilation.
Monitoring sites should be placed in locations at the buffer zone boundary where the highest likely
concentrations of methyl bromide would be expected.
EPA guidance8 recommends that three monitoring sites be selected when monitoring is initially
undertaken at a fumigation site. One site should be designated as a „worst-case‟ site and located at
the boundary of the buffer zone in the downwind direction, with the other two sites located on
either side to account for variation in wind direction of plus or minus 45 degrees. Alternatively,
one of the monitoring sites may be placed on the boundary of the buffer zone in the direction of
the nearest sensitive location, such as a residence or other place where the public may be. A good
rule of thumb is to use three downwind monitoring sites for the first couple of fumigations at a site
unless sensitive receptors, complex terrain or weather conditions dictate the need for more
locations. The number of locations should vary depending on the sensitivity of the surrounding
area, the size and scale of the fumigation operation and the influence of local topography.
Once a site has been monitored during fumigation events and it has been shown that the ambient air
concentrations have not exceeded the TELs during fumigations, then the number of monitoring
sites may be reduced based on site specific monitoring experience. For fumigations using less than
7 kg of methyl bromide one monitor may be sufficient (depending on forecasted wind conditions
and topographical influences) in a downwind direction. For fumigations using more than 7 kg of
methyl bromide, a minimum of two monitoring locations is suggested downwind from the
fumigation site. If sensitive locations are near the buffer zone then additional monitoring sites may
be needed at the buffer zone boundary in the direction of the sensitive sites. If monitoring has
previously been undertaken at the site, refer to the site‟s sampling location map if available and
utilize previous sampling locations taking into consideration the guidance set out in this document
or add another location if applicable. If a site specific map is not available one should be prepared
and should remain onsite.
8 EPA, Methyl Bromide Fumigations Post Reassessment Guidance for Fumigations, April 2011.
PAGE 16
4.1.1. The effect of land use activities on monitoring
This relates to the effect of human activities and vegetation in the area surrounding the fumigation
site. This includes the location of buildings and their height, location of trees, roads and other
sources of VOCs (e.g. paints, solvents, etc) in the vicinity which could affect PID measurements.
Ideally the site should not be unduly influenced by sources that are not being investigated. A
survey should be carried out to document the land-use activities within one kilometre radius of the
fumigation site. This could also include possible emission sources from large stands of trees or
marshland. The survey should record the location of industries, and residential properties and other
sensitive receptors. Sensitive receptors include schools, childcare centres, kindergartens, homes for
the elderly, medical centres, hospitals and possibly parks. Sensitivity may also vary with time of
day or night and with weather conditions. District Plan Zoning maps can be used to qualify the type
of activities expected in the immediate area.
Industries and uncovered log stacks that could release VOCs to air which can interfere with
monitoring when using PIDs should be identified. Such industries include panel and paint shops,
timber treatment plants, service stations, oil terminals, joiners, and sites with small boilers. These
sites should be recorded on a location map for the area around a monitoring site. In addition, if
PIDs are used for monitoring, roads need to be considered as they may present a source of VOC
emissions from vehicles operating or parked on the road. The storage of treated timber may be a
significant source of interfering solvents. These activities should be avoided if practicable when
selecting a monitoring location using PIDs.
Buildings, trees and walls located close to monitoring sites restrict airflows and as such should be
avoided. Free airflow around the sampling inlet is necessary to ensure representative sampling; for
this reason, sampling in a stagnant or sheltered micro-environment should be avoided. The
“Australia/New Zealand Standard AS/NZS 3580.1.1:2007 Method for sampling and analysis of
ambient air, Part 1.1: Guide to siting air monitoring equipment” provides guidance on the
separation distances that a monitoring location should be situated in respect to nearby buildings,
trees and walls. Figure 2 illustrates the separation distances required for an ambient monitoring site
under this standard.
PAGE 17
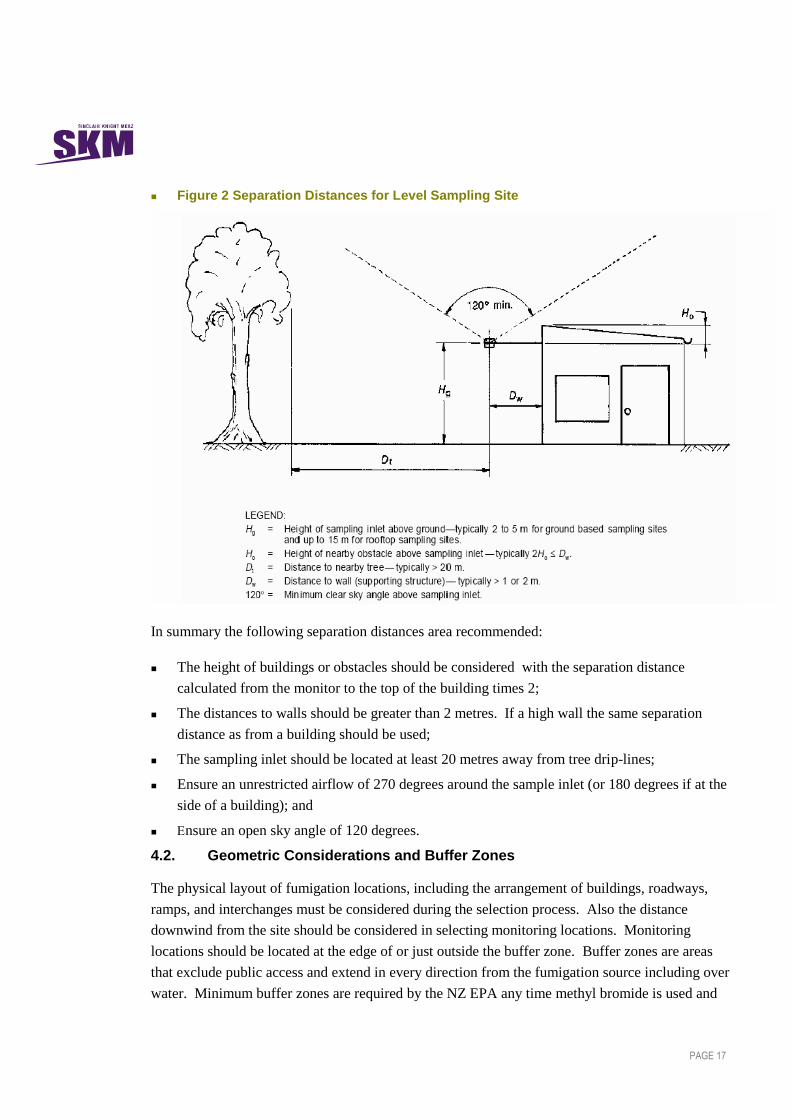
Figure 2 Separation Distances for Level Sampling Site
In summary the following separation distances area recommended:
The height of buildings or obstacles should be considered with the separation distance
calculated from the monitor to the top of the building times 2;
The distances to walls should be greater than 2 metres. If a high wall the same separation
distance as from a building should be used;
The sampling inlet should be located at least 20 metres away from tree drip-lines;
Ensure an unrestricted airflow of 270 degrees around the sample inlet (or 180 degrees if at the
side of a building); and
nsure an open sky angle of 120 degrees.
4.2. Geometric Considerations and Buffer Zones
The physical layout of fumigation locations, including the arrangement of buildings, roadways,
ramps, and interchanges must be considered during the selection process. Also the distance
downwind from the site should be considered in selecting monitoring locations. Monitoring
locations should be located at the edge of or just outside the buffer zone. Buffer zones are areas
that exclude public access and extend in every direction from the fumigation source including over
water. Minimum buffer zones are required by the NZ EPA any time methyl bromide is used and
PAGE 18
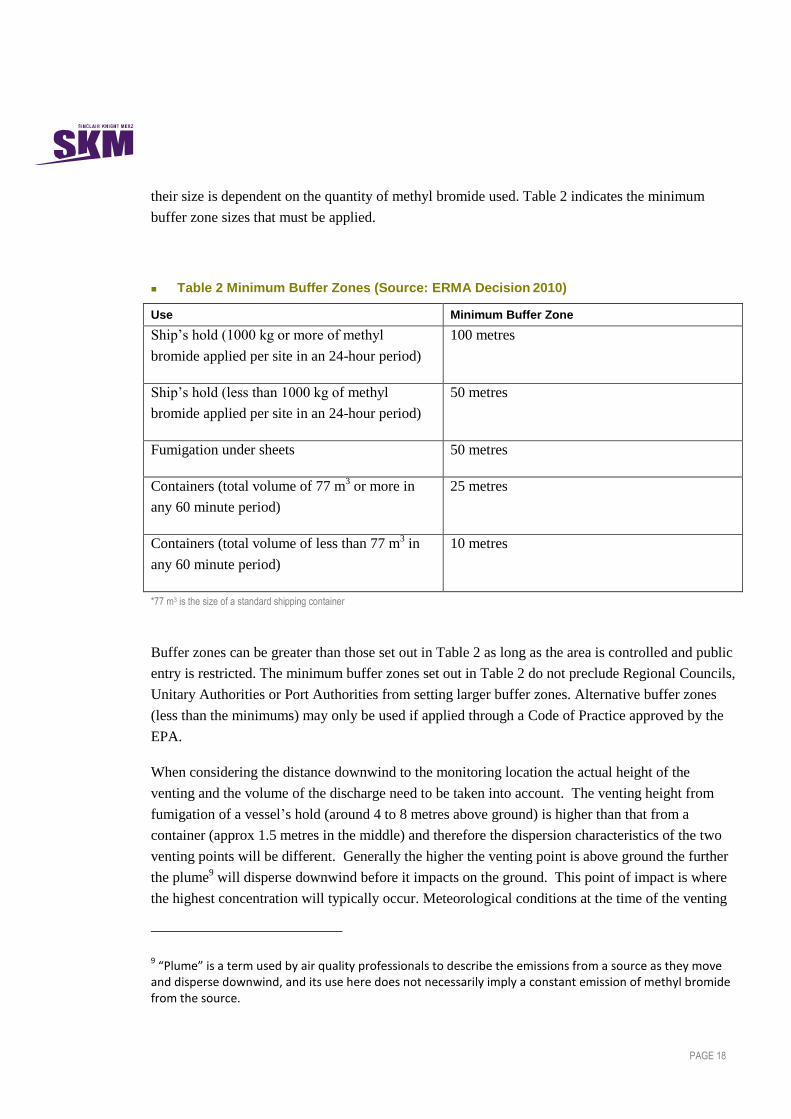
their size is dependent on the quantity of methyl bromide used. Table 2 indicates the minimum
buffer zone sizes that must be applied.
Table 2 Minimum Buffer Zones (Source: ERMA Decision 2010)
Use Minimum Buffer Zone
Ship‟s hold (1000 kg or more of methyl
bromide applied per site in an 24-hour period)
100 metres
Ship‟s hold (less than 1000 kg of methyl
bromide applied per site in an 24-hour period)
50 metres
Fumigation under sheets 50 metres
Containers (total volume of 77 m3 or more in
any 60 minute period)
25 metres
Containers (total volume of less than 77 m3 in
any 60 minute period)
10 metres
*77 m3 is the size of a standard shipping container
Buffer zones can be greater than those set out in Table 2 as long as the area is controlled and public
entry is restricted. The minimum buffer zones set out in Table 2 do not preclude Regional Councils,
Unitary Authorities or Port Authorities from setting larger buffer zones. Alternative buffer zones
(less than the minimums) may only be used if applied through a Code of Practice approved by the
EPA.
When considering the distance downwind to the monitoring location the actual height of the
venting and the volume of the discharge need to be taken into account. The venting height from
fumigation of a vessel‟s hold (around 4 to 8 metres above ground) is higher than that from a
container (approx 1.5 metres in the middle) and therefore the dispersion characteristics of the two
venting points will be different. Generally the higher the venting point is above ground the further
the plume9 will disperse downwind before it impacts on the ground. This point of impact is where
the highest concentration will typically occur. Meteorological conditions at the time of the venting
9 “Plume” is a term used by air quality professionals to describe the emissions from a source as they move
and disperse downwind, and its use here does not necessarily imply a constant emission of methyl bromide from the source.
PAGE 19
should also be considered as they will have an effect on how the plume behaves. In some locations
the ideal monitoring location may be located beyond the restricted area. In these cases two
monitors may be needed: one at the controlled area and one at the area of predicted highest
concentrations directly downwind.
4.3. Locations over Water
Locations over water that may be affected by methyl bromide fumigation releases include marina,
boat moorings and wharves. As it is not always practical to monitor at the buffer zone boundaries
provided in Table 2 when they occur over water, monitoring sites should be selected at the nearest
appropriate downwind location outside the buffer zone that is either on land or on an accessible
wharf. It is possible that moored boats near the buffer zone may be occupied during the fumigation
events, in which case it may be necessary to monitor at these locations.
4.4. Topography (Geographic Location)
The dispersion of methyl bromide from a fumigation site can be significantly altered by local
topographical features. Land features of the areas surrounding a fumigation site need to be
considered when selecting the number and location of monitoring sites. If the area is
predominately flat the influence of topography on dispersion of the ventilated fumigant is low. For
sites located in valleys, or next to steeply rising ground the effects of the terrain needs to be
considered when selecting monitoring sites. Valleys tend to channel the air flow and wind and
restricting horizontal dispersion. Concentrations can be the highest due to the poor dispersion
conditions and if the public are living or working in the base of valleys a monitoring location must
be selected to measure methyl bromide concentrations in this area. However if there are no persons
residing, working or likely to be in the area for extended periods on the valley floor, monitoring
locations may be better sited at residential properties part way up the valley wall.
Shorelines tend to produce frequent changes in airflow due to the land sea effect and as a result the
air can be more turbulent and the air flow can be subject to “sea breezes” and “land breezes”
depending on the time of day. In light winds the wind direction could shift 180 degrees during a
venting and illustrates the need for both upwind and downwind monitoring locations.
Monitoring sites on ridges should be avoided as they tend to be in clear air and can significantly
under estimate the high concentrations that occur in the valley floor.
Local meteorological effects are often tied to local geography, e.g., nearby mountains or coastal
locations. Consequently, selection of monitoring locations must include an assessment of the large-
scale geography, in addition to local-scale topography.
PAGE 20
4.5. Climate and Meteorology
The prevailing weather conditions and local topography will strongly influence the dispersion of air
contaminants in the atmosphere. Weather conditions are one of the most important factors
affecting spatial and temporal distributions of air contaminants, especially for short-term air
dispersion as associated with fumigation ventilation. Unusual weather conditions might lead to
higher or lower ambient air concentrations than would occur under normal weather conditions. For
example, inversion conditions would tend to restrict dispersion and result in higher ambient air
concentrations whereas an unstable atmosphere or high winds would increase dispersion.
Meteorological records should be reviewed to assess the following important parameters:
Prevailing seasonal wind direction;
Night and day-time wind patterns; and
Cold air flow wind directions.
Horizontal wind mixing in air has profound influences on the dispersion of methyl bromide
ventilated from a fumigation site. Consequently it has an influence on the selection of monitoring
locations. It is desirable to monitor at multiple points downwind concentrations of methyl bromide
and to take into account the wind speed and direction on the day that the monitoring occurs. As a
result a number of pre-determined sites will need to be selected for the site based on prevailing
wind directions and other atmospheric conditions, with the actual sites selected on the day of
monitoring.
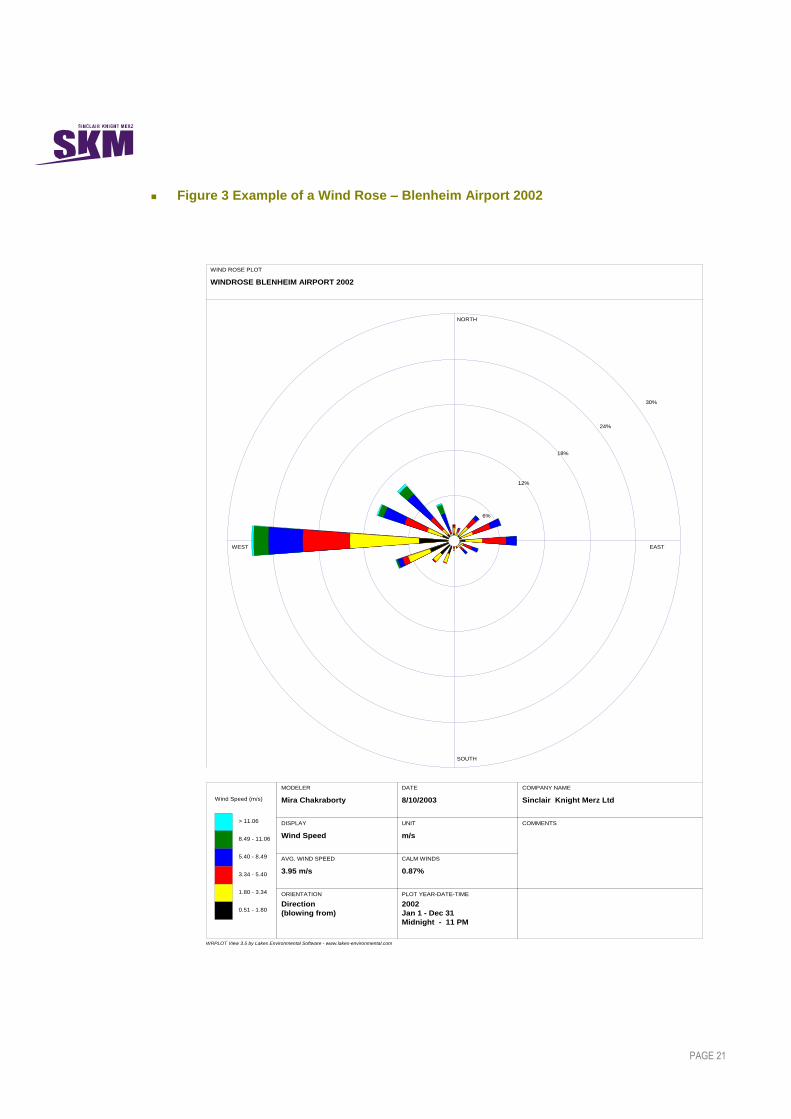
The use of a published windrose (see Figure 5 for an example of a windrose) which shows for the
frequency of wind from that direction over the measurement period (in this example one year) and
the relative wind speeds for that direction over 16 sectors around the compass. A relevant
windrose should be used in the initial monitoring location selection process and should be updated
yearly.
Wind roses for New Zealand sites can be found at:
http://www.windfinder.com/windstats/windstatistic_map_new_zealand.htm
Some fumigation sites may not have good quality site specific meteorological data windroses, and
if a data from nearby location is used) then care must be taken as the conditions could be vastly
different even over a short distance. Based on the ERMA Decision wind direction and speed must
be recorded every 3 minutes during the fumigation venting.
If the fumigation site has complicated geography and weather conditions, specialist help should be
obtained to select appropriate sampling sites and to advise what sites are the best under a variety of
weather conditions.
PAGE 21
Figure 3 Example of a Wind Rose – Blenheim Airport 2002
WIND ROSE PLOT
WINDROSE BLENHEIM AIRPORT 2002
NORTH
SOUTH
WEST EAST
6%
12%
18%
24%
30%
Wind Speed (m/s)
> 11.06
8.49 - 11.06
5.40 - 8.49
3.34 - 5.40
1.80 - 3.34
0.51 - 1.80
COMPANY NAME
Sinclair Knight Merz Ltd
MODELER
Mira Chakraborty
PLOT YEAR-DATE-TIME
2002
Jan 1 - Dec 31
Midnight - 11 PM
DATE
8/10/2003
DISPLAY
Wind Speed
UNIT
m/s
CALM WINDS
0.87%
AVG. WIND SPEED
3.95 m/s
COMMENTS
ORIENTATION
Direction
(blowing from)
WRPLOT View 3.5 by Lakes Environmental Software - www.lakes-environmental.com

PAGE 22
4.6. Site Selection Checklist
A number of quick checks should be carried out when selecting a monitoring location and include
the following:
1) On a map of the area, determine distances from fumigation location to site boundary and to
nearest land-use activities and sensitive receptors. Mark out the required buffer zone on the
map as dictated by EPA requirements in Table 2, and consider options for monitoring near the
boundary;
2) Avoid sites that are adjacent to buildings, leafy vegetation, or walls as they could have
restricted airflows and in some cases can adsorb or absorb contaminants in air or release their
own contaminants;
3) If monitoring with PIDs, avoid sites near industry, large stands of trees, roads, uncovered log
stacks or activities that release VOCs as these monitoring devices cannot differentiate total
VOCs from methyl bromide and hence may result in higher concentrations being measured.
Pre-fumigation monitoring should be undertaken to determine if existing sources of VOCs are
likely to cause interference;
4) Determine the land-use activities in the area surrounding the fumigation site and identify any
potentially sensitive activities or areas close to the boundary where monitoring should occur;
5) Determine the prevailing wind directions and speeds for the area and preselect a number of
sampling locations that can be used depending on the wind direction on the day of monitoring.
These locations will be refined closer to the time of ventilation dependent on the forecast;
6) Estimate the height and size of the fumigation ventilation. As a general rule, the larger the
venting and the higher the venting point the further distant from the fumigation site the
monitoring locations should be located;
7) Determine based on the terrain of the area where cold air drainage flows will occur and the
direction of those flows and select the monitoring locations on the downward side of cold air
flows;
8) Avoid sites that could be affected by terrain features, e.g. close in to steep sided hills, on ridge
tops, and in small valley systems of a main valley where recirculation could occur;
9) For areas near the coast land sea breezes should be considered which could require both
upwind and downwind monitoring locations; and,
10) If the site has an established monitoring history compare the historical monitoring sites to
predicted wind direction to determine if these sites are appropriate for the current monitoring
event.
PAGE 23
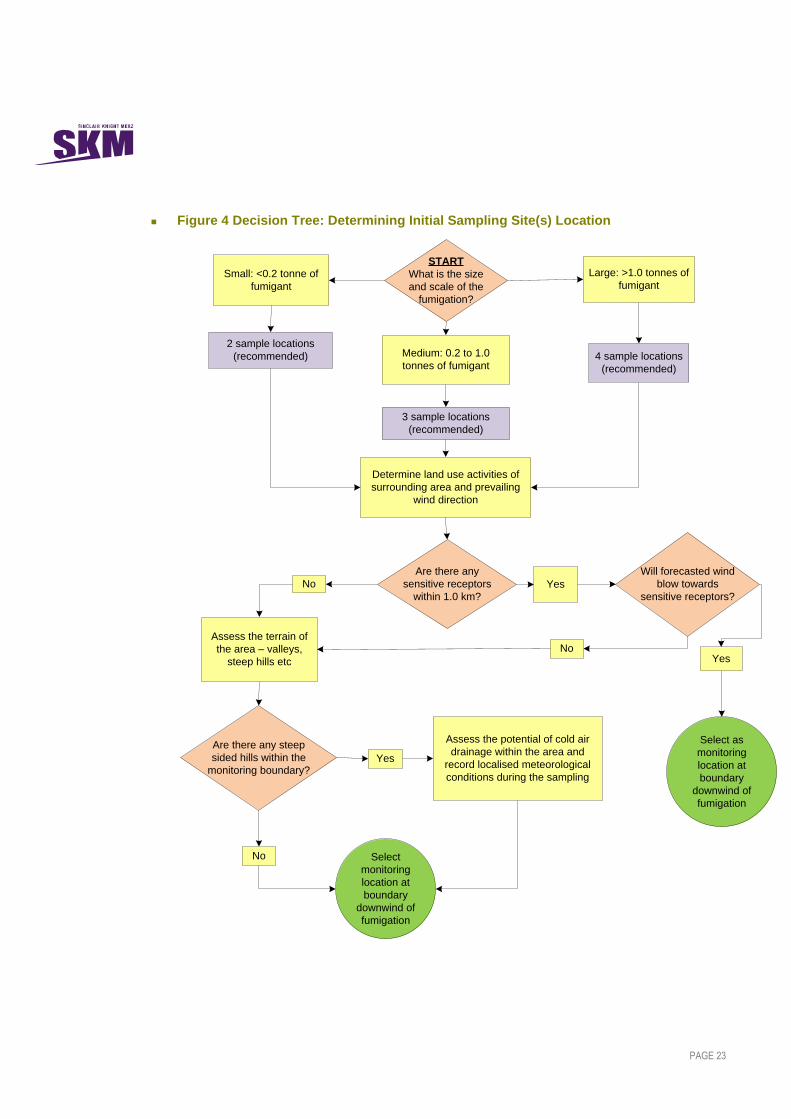
Figure 4 Decision Tree: Determining Initial Sampling Site(s) Location
3 sample locations
(recommended)
Determine land use activities of
surrounding area and prevailing
wind direction
Small: <0.2 tonne of
fumigant
START
What is the size
and scale of the
fumigation?
2 sample locations
(recommended) 4 sample locations
(recommended)
Large: >1.0 tonnes of
fumigant
Medium: 0.2 to 1.0
tonnes of fumigant
YesNo
YesNo
Are there any steep
sided hills within the
monitoring boundary?Yes
Assess the potential of cold air
drainage within the area and
record localised meteorological
conditions during the sampling
No
Are there any
sensitive receptors
within 1.0 km?
Will forecasted wind
blow towards
sensitive receptors?
Assess the terrain of
the area – valleys,
steep hills etc
Select as
monitoring
location at
boundary
downwind of
fumigation
Select
monitoring
location at
boundary
downwind of
fumigation
PAGE 24
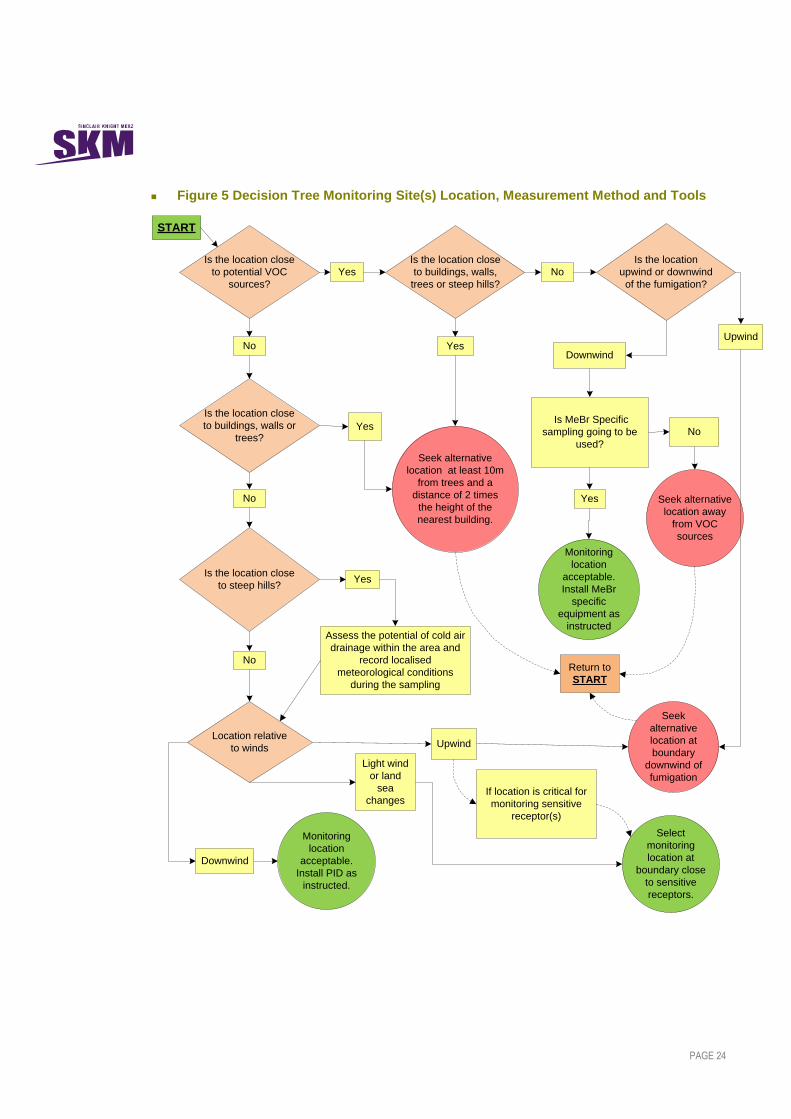
Figure 5 Decision Tree Monitoring Site(s) Location, Measurement Method and Tools
Is the location close
to potential VOC
sources?
No
Yes
Monitoring
location
acceptable.
Install PID as
instructed.
Seek
alternative
location at
boundary
downwind of
fumigation
Is the location close
to buildings, walls or
trees?
No
Yes
Is the location close
to steep hills?
No
Location relative
to winds Upwind
Seek alternative
location at least 10m
from trees and a
distance of 2 times
the height of the
nearest building.
Is the location close
to buildings, walls,
trees or steep hills?
Yes
No
Is MeBr Specific
sampling going to be
used?
Yes
No
Seek alternative
location away
from VOC
sources
Monitoring
location
acceptable.
Install MeBr
specific
equipment as
instructed
Is the location
upwind or downwind
of the fumigation?
Downwind
Downwind
Upwind
Yes
START
Assess the potential of cold air
drainage within the area and
record localised
meteorological conditions
during the sampling
Return to
START
Light wind
or land
sea
changes
Select
monitoring
location at
boundary close
to sensitive
receptors.
If location is critical for
monitoring sensitive
receptor(s)
PAGE 25
5. Sampling and Data Recording
5.1. Introduction
This section details the importance of recording data collected before, during, and after sampling,
and data produced by real time analysers. Field Sampling Data Sheets for sampling techniques
discussed in this document are presented in Appendix A; and are referred to in this section as the
“data sheet”. Subsection 5.5 presents a flow diagram for this section. An example of an ambient air
monitoring programme carried out during a methyl bromide fumigation ventilation in NZ is
included as Appendix B.
5.2. EPA Data Collection Requirements
New controls were added for methyl bromide use that directly relate to monitoring during
fumigation venting following the ERMA Decision. The requirements for collecting data during
methyl bromide fumigations are found in Table C2 of Appendix C of the Decision. This
information is summarised in

PAGE 26
Table 3 below.
The Decision goes on to state that data collection for fumigation without MeBr recapture must be
begun at or before the start of the ventilation and continue until the exposure level is below 0.05
ppm for at least 15 minutes where 7 kg or more of methyl bromide is applied in a one-hour period,
or for 3 minutes where less than 7 kg of methyl bromide is applied in a one hour period.
PAGE 27
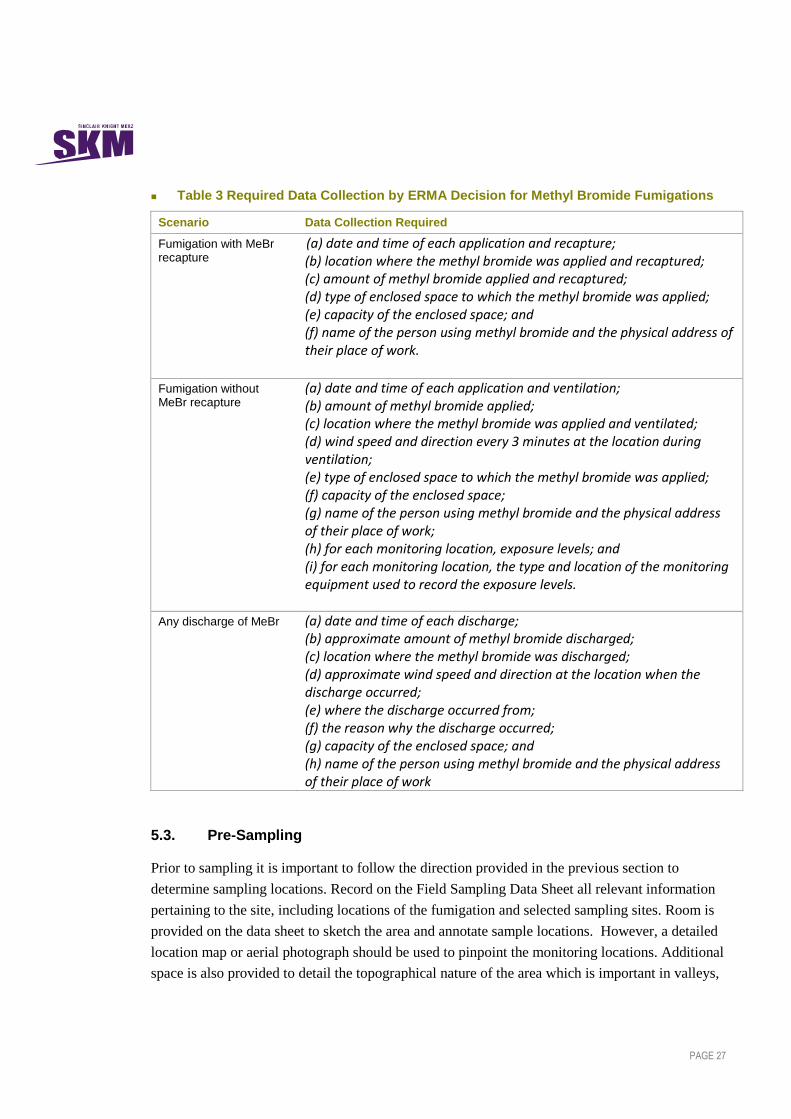
Table 3 Required Data Collection by ERMA Decision for Methyl Bromide Fumigations
Scenario Data Collection Required
Fumigation with MeBr recapture
(a) date and time of each application and recapture; (b) location where the methyl bromide was applied and recaptured; (c) amount of methyl bromide applied and recaptured; (d) type of enclosed space to which the methyl bromide was applied; (e) capacity of the enclosed space; and (f) name of the person using methyl bromide and the physical address of their place of work.
Fumigation without MeBr recapture
(a) date and time of each application and ventilation; (b) amount of methyl bromide applied; (c) location where the methyl bromide was applied and ventilated; (d) wind speed and direction every 3 minutes at the location during ventilation; (e) type of enclosed space to which the methyl bromide was applied; (f) capacity of the enclosed space; (g) name of the person using methyl bromide and the physical address of their place of work; (h) for each monitoring location, exposure levels; and (i) for each monitoring location, the type and location of the monitoring equipment used to record the exposure levels.
Any discharge of MeBr (a) date and time of each discharge; (b) approximate amount of methyl bromide discharged; (c) location where the methyl bromide was discharged; (d) approximate wind speed and direction at the location when the discharge occurred; (e) where the discharge occurred from; (f) the reason why the discharge occurred; (g) capacity of the enclosed space; and (h) name of the person using methyl bromide and the physical address of their place of work
5.3. Pre-Sampling
Prior to sampling it is important to follow the direction provided in the previous section to
determine sampling locations. Record on the Field Sampling Data Sheet all relevant information
pertaining to the site, including locations of the fumigation and selected sampling sites. Room is
provided on the data sheet to sketch the area and annotate sample locations. However, a detailed
location map or aerial photograph should be used to pinpoint the monitoring locations. Additional
space is also provided to detail the topographical nature of the area which is important in valleys,
PAGE 28
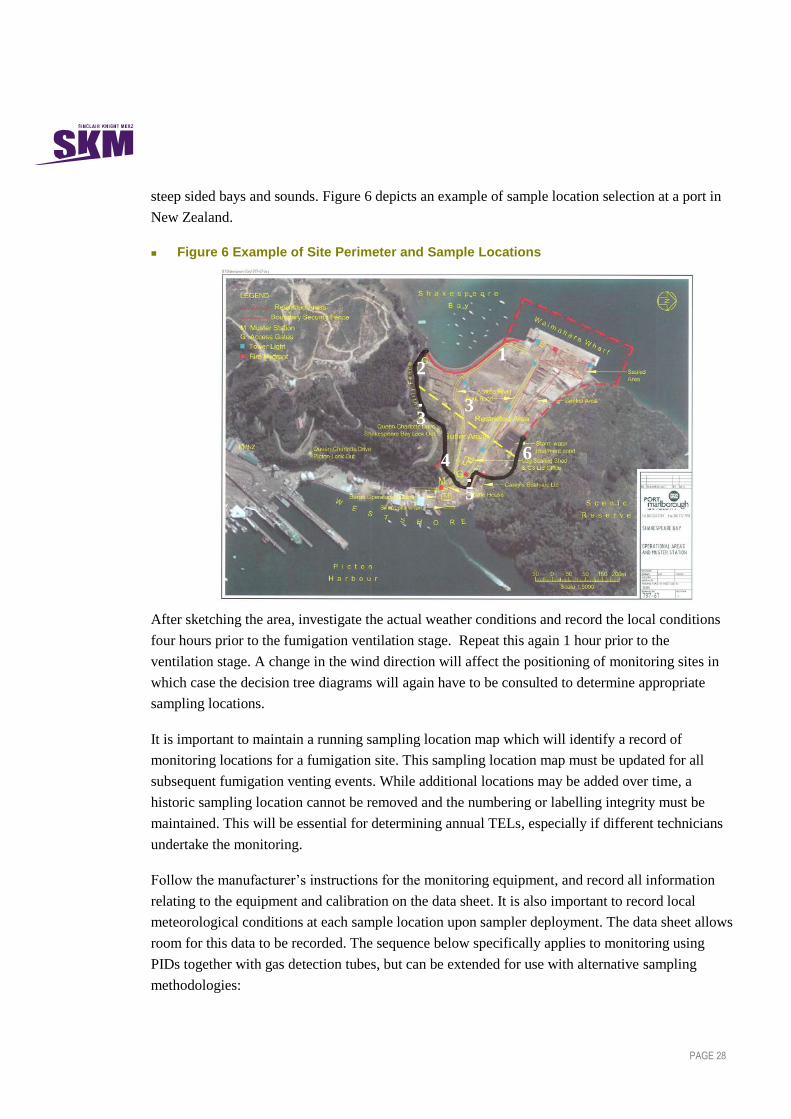
steep sided bays and sounds. Figure 6 depicts an example of sample location selection at a port in
New Zealand.
Figure 6 Example of Site Perimeter and Sample Locations
After sketching the area, investigate the actual weather conditions and record the local conditions
four hours prior to the fumigation ventilation stage. Repeat this again 1 hour prior to the
ventilation stage. A change in the wind direction will affect the positioning of monitoring sites in
which case the decision tree diagrams will again have to be consulted to determine appropriate
sampling locations.
It is important to maintain a running sampling location map which will identify a record of
monitoring locations for a fumigation site. This sampling location map must be updated for all
subsequent fumigation venting events. While additional locations may be added over time, a
historic sampling location cannot be removed and the numbering or labelling integrity must be
maintained. This will be essential for determining annual TELs, especially if different technicians
undertake the monitoring.
Follow the manufacturer‟s instructions for the monitoring equipment, and record all information
relating to the equipment and calibration on the data sheet. It is also important to record local
meteorological conditions at each sample location upon sampler deployment. The data sheet allows
room for this data to be recorded. The sequence below specifically applies to monitoring using
PIDs together with gas detection tubes, but can be extended for use with alternative sampling
methodologies:
3
1
4
2
6
3
5
PAGE 29
1) On arrival at the site designate an operations centre/clean-up area, and perform a zero and span
check on all instruments by applying a certified calibration gas for 5 to 10 seconds, and a
charcoal filter for reading zero air. If the instrument reading is outside of ±10% of the span
gas concentration, or are not reading zero for the zero gas, then perform a full calibration.
Record calibration checks and any full calibrations performed on the data sheet for each unit.
2) Install the sampling inlet of all monitoring equipment as far as possible at 1.5m above local
ground level at the pre-determined sampling locations unless topography and fumigation
ventilation points dictate a more appropriate height.
3) Install instruments at the pre-determined sample locations and begin monitoring at least 15
minutes prior to the beginning of the venting stage of the fumigation. Record sample/sampler
number(s), location(s) and sampling start time(s).
5.4. During Sampling
1) Run all the sampling equipment prior to, during, and following the fumigation venting stage.
Note the venting time(s). If using active samplers such as sorbent tubes or canisters, sample for
1 hour per sample, after which additional tubes/canisters should be used for subsequent one
hour periods.
2) During monitoring the technician must “walk the perimeter” a minimum of once an hour, and
preferably two to three times, checking all sampling equipment for errors, battery life and peak
readings. Unless monitors are linked for remote monitoring, technicians should record the peak
reading and reset peak readings (if possible) during each walk around. During this time it is
also important to measure and record the meteorological conditions at each sampling location,
either by handheld anemometer or by estimating wind speeds (estimating wind speeds should
only be undertaken by an experienced technician).
3) If during sampling a PID displays readings that indicate the presence of VOCs, then a gas
detection tube should be used to confirm that the reading is methyl bromide and not another
VOC or due to instrument drift. If the methyl bromide gas detection tube does not show a
positive result, and the PID continues to record concentrations above zero, a carbon filter
should be attached to the instrument inlet for 5 to 10 seconds to discount the presence of other
VOCs, thereby indicating instrument drift. A backup PID can also help confirm drift and can
be used to replace an instrument that has drifted and needs to be cleaned and re-calibrated prior
to being re-deployed.
4) During the monitoring period note any significant events that may positively or negatively
affect or influence the sampling results, e.g. the presence of vehicle exhaust fumes or the
presence of volatile organic compounds (VOCs) including any nearby treated timber or log
stacks.
PAGE 30
5) Once venting is completed note the time that the ventilation stopped. Monitoring shall
continue until the concentrations of methyl bromide are below 0.05 ppm for at least 15 minutes
if the fumigation used more than 7 kg of methyl bromide or for three minutes if the fumigation
used less than 7 kg. Return to the designated clean-up area for post-sampling calibration
checks. If active sampling methods are being used due to VOC interference a good rule of
thumb is to continue monitoring one hour following the last ventilation of a log stack or
container or two hours following a ship‟s hold.
5.5. Post-Sampling and Sample Handling
At the end of the sampling period all active sampling equipment (apart from gas detection tubes
and pumps) should be checked in accordance with the method used. Checks are as follows:
Methyl bromide specific real time samplers – refer to the manufacturers instruction for
performing post sampling calibrations or checks;
PIDs – Check the instrument against calibration gas used in the initial pre-sampling calibration
to determine calibration drift over the sampling period;
Methyl bromide specific active sampling method (e.g. USEPA method TO-17) – Check the
flow rate through the whole sampling system prior to dismantling. The end flow rate must be
within 10% of the start flow rate to meet the quality requirements set out in the method; and,
USEPA method TO-15 – No checks required from the operator, however, data relating to the
vacuum of the evacuated cylinder will be recorded.
Sample and data handling is a critical stage of the sampling protocol. Data from PIDs or other real-
time sampling devices should be downloaded immediately after post sample checks and the data
stored in a secure non-volatile memory for future interrogation. It is advisable to store the data in at
least two systems to protect against loss or corruption (a printed hard copy provides added
security). If another analyzer not addressed in this section is used please refer to the applicable
method and operation instructions to ensure the quality requirements are met.
Active samples collected in the field requiring further analysis should be handled as follows:
All samples must be clearly identified
After each sample is collected a “chain of custody” form should be filled in detailing all
information relating to the sample and analysis required. One copy should be included with the
samples and one retained and filed.
If method TO-17 is used samples should be immediately sealed and placed on ice to reduce
volatilisation of methyl bromide or other VOCs collected on the media.

PAGE 31
It is important to maintain the samples below the boiling point of the target compound, hence
an accredited local laboratory should be selected to reduce shipping times and the possibility
of exposure to elevated temperatures.
It is common practice to place an ambient temperature logger in the shipping case in order to
determine the maximum temperature to which the samples have been exposed.
Only IANZ accredited laboratories should be used for analysis unless another form of quality
assurance is available.
PAGE 32
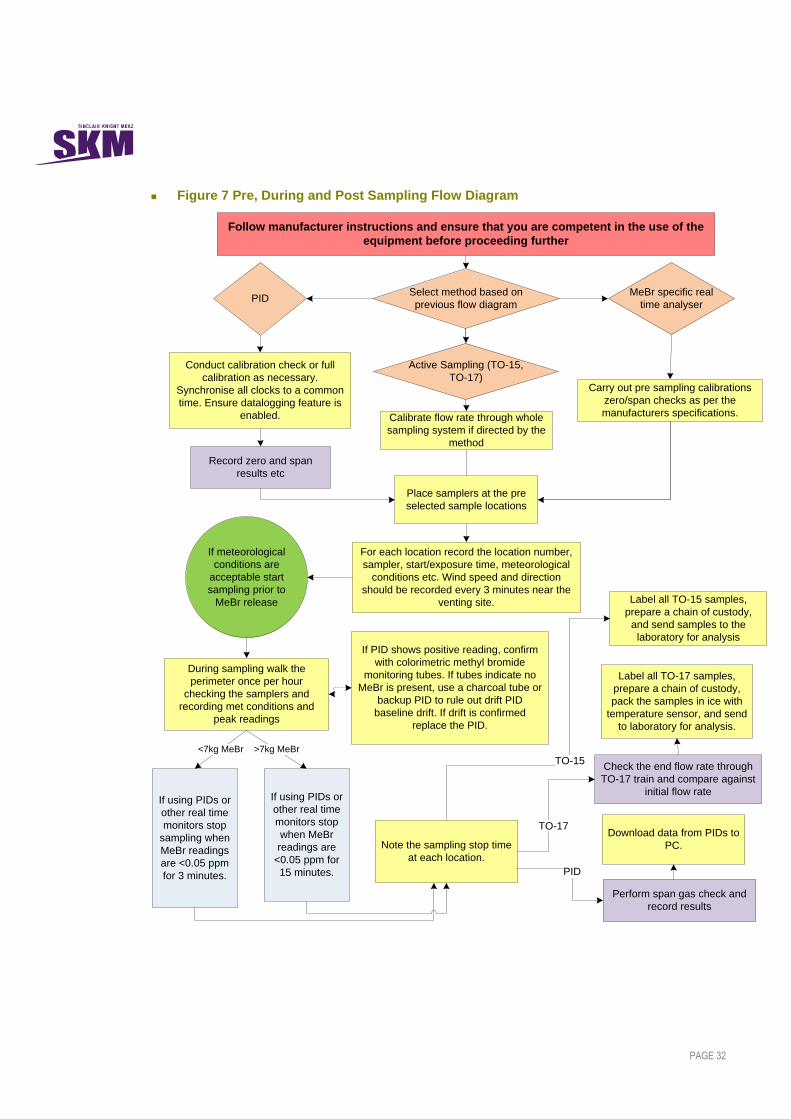
Figure 7 Pre, During and Post Sampling Flow Diagram
Place samplers at the pre
selected sample locations
Conduct calibration check or full
calibration as necessary.
Synchronise all clocks to a common
time. Ensure datalogging feature is
enabled.
PID
Record zero and span
results etc
Calibrate flow rate through whole
sampling system if directed by the
method
If meteorological
conditions are
acceptable start
sampling prior to
MeBr release
Active Sampling (TO-15,
TO-17)
For each location record the location number,
sampler, start/exposure time, meteorological
conditions etc. Wind speed and direction
should be recorded every 3 minutes near the
venting site.
Follow manufacturer instructions and ensure that you are competent in the use of the
equipment before proceeding further
Select method based on
previous flow diagram
During sampling walk the
perimeter once per hour
checking the samplers and
recording met conditions and
peak readings
Note the sampling stop time
at each location.
If PID shows positive reading, confirm
with colorimetric methyl bromide
monitoring tubes. If tubes indicate no
MeBr is present, use a charcoal tube or
backup PID to rule out drift PID
baseline drift. If drift is confirmed
replace the PID.
Perform span gas check and
record results
Check the end flow rate through
TO-17 train and compare against
initial flow rate
TO-17
PID
Download data from PIDs to
PC.
MeBr specific real
time analyser
Label all TO-17 samples,
prepare a chain of custody,
pack the samples in ice with
temperature sensor, and send
to laboratory for analysis.
Label all TO-15 samples,
prepare a chain of custody,
and send samples to the
laboratory for analysis
TO-15
If using PIDs or
other real time
monitors stop
sampling when
MeBr readings
are <0.05 ppm
for 3 minutes.
If using PIDs or
other real time
monitors stop
when MeBr
readings are
<0.05 ppm for
15 minutes.
>7kg MeBr<7kg MeBr
Carry out pre sampling calibrations
zero/span checks as per the
manufacturers specifications.
PAGE 33
5.6. Further Information
5.6.1. Calibration
Most air quality monitoring equipment (including data loggers) must be calibrated at specified
intervals to minimise instrument bias and drift. A record of the calibration procedures and history
should be kept and be available upon request. Good data quality depends on adequate calibration of
the equipment. For an analytical instrument for measuring compounds in air, a calibration involves
setting the reading of a monitor to the known concentration of a compound in a calibration
standard. A calibration check may be performed to confirm that the calibration for that instrument
is still valid within a permitted range of variance (typically ±10% of the calibration gas value).
Calibrations should be conducted in accordance with manufacturer‟s recommendations for the
instrument. PIDs shall be calibrated within no more than three months prior to use.
Calibration checks shall be adopted along with any specific requirements for the particular standard
monitoring method used. Span and zero checks should be conducted relatively frequently (some
modern equipment has an automated facility allowing this to occur every 24 hours, otherwise it
should be carried out at least once a month or prior to a sampling episode/event), but in general
these cannot replace true multi-point calibrations. If the zero and span checks are greater than 10%
of the reference gas then the instrument shall be calibrated prior to use.
5.6.2. Data Logging
Wherever possible, air quality data should be recorded automatically, with as high a time resolution
as is practicable. Data loggers should be configured to provide data as 1-minute averages and shall
log data no less than every three minutes. The data is to be downloaded from the loggers either
manually or via telemetry on an event basis (depending on data logger capacity). The raw data
should then be saved on disk, archived, and a copy transferred to PC for quality assurance. In
general, averaging and processing should occur later, rather than within the data logger to preserve
the resolution of the raw data. Data should be averaged to rolling 1-hour and 24-hour values for
reporting purposes.
5.6.3. Quality assurance and quality control (QA/QC)
Quality assurance and quality control (QA/QC) is an essential part of any air monitoring system. It
is a programme of activities that ensures that measurements meet defined and appropriate standards
of quality, with a stated level of confidence. QA/QC activities ensure that measurements comply
with relevant guidelines specific to the data quality objectives for the monitoring programme. In
other words, QA/QC ensures that data are fit for the purpose. This includes but is not limited to:
Measurements are accurate, precise and credible;
PAGE 34
Data are representative of ambient or exposure conditions;
Results are comparable and traceable;
Measurements are consistent over time; and,
Meteorological conditions recorded.
5.6.4. Instrument Use
Even the best maintained instruments can fail during monitoring events and it is important to know
what to do if an instrument does fail during fumigation ventilation. This section discusses steps to
take to help avoid faults and actions to take if a fault does occur. While this section is only directly
applicable to PIDs and sampling pumps, the concepts behind these recommendations can be
applied to other equipment used to monitor methyl bromide in ambient air.
Hiring equipment
If the equipment required to monitor fumigation ventilation is hired from an equipment supplier, it
is important to let the supplier know that you will be monitoring for compliance purposes and at
very low concentrations of methyl bromide. Ask the supplier to provide the most recently serviced
equipment available including any calibration documentation and data download cables if
applicable. An additional pump or PID should be hired to have on hand should an instrument fail or
drift. A good rule of thumb is to have an additional PID for every two to three locations that will be
monitored and a single replacement pump if method TO-17 is used for monitoring.
Calibration
Equipment shipped from a vendor should be checked at the earliest opportunity to ensure that all
the equipment is in working order prior to going on-site. For PIDs and other real time samplers
both pre and post zero and span calibration checks are required to meet quality assurance
requirements. Generally suppliers will calibrate the instrument prior to dispatch so in these cases a
simple zero and span gas calibration check will provide a suitable level of confidence. Make
certain there is adequate calibration gas (e.g. isobutylene) to perform the pre and post calibration
checks for all instruments used in the monitoring. If the zero and span checks are greater than 10%
of the reference gas then the instrument shall be recalibrated prior to use. Remember that the
automatic correction factor of 1.7 for methyl bromide may be active and will return a 170 ppmv
reading when using 100 ppm reference gas.
Batteries
All equipment should be checked to ensure battery life is sufficient to monitor both prior to and
following the fumigation venting. Extra battery packs should be ordered if the fumigation
PAGE 35
ventilation event could potentially continue beyond the battery life of the instrument or pump. If
the battery life is less than 90% the batteries should be replaced or charged as per the
manufacturer‟s recommendations.
Equipment failure
If equipment does fail during or prior to fumigation venting the ventilation should be delayed until
the fault can be repaired or the equipment can be replaced.
Instrument drift
PIDs are susceptible to drift caused by moisture and should be interrogated immediately if drift is
suspected. It is vitally important that the instrument is replaced as soon as practicable if drift is
suspected.

PAGE 36
6. Presentation of Results
6.1. Introduction
This section discusses the presentation of data collected before, during and after sampling and data
collected by PIDs and by other sampling methods. Included are examples of tables which may be
used to present meteorological data and ambient air sampling results and data processing guidance.
For further guidance on data processing and rolling average calculation refer to the MFE Good
Practice Guide for Air Quality Monitoring and Data Management 200910
, the ERMA Decision and
the document Methyl bromide fumigations, Post-reassessment guidance for fumigators: EPA New
Zealand, April 2011.
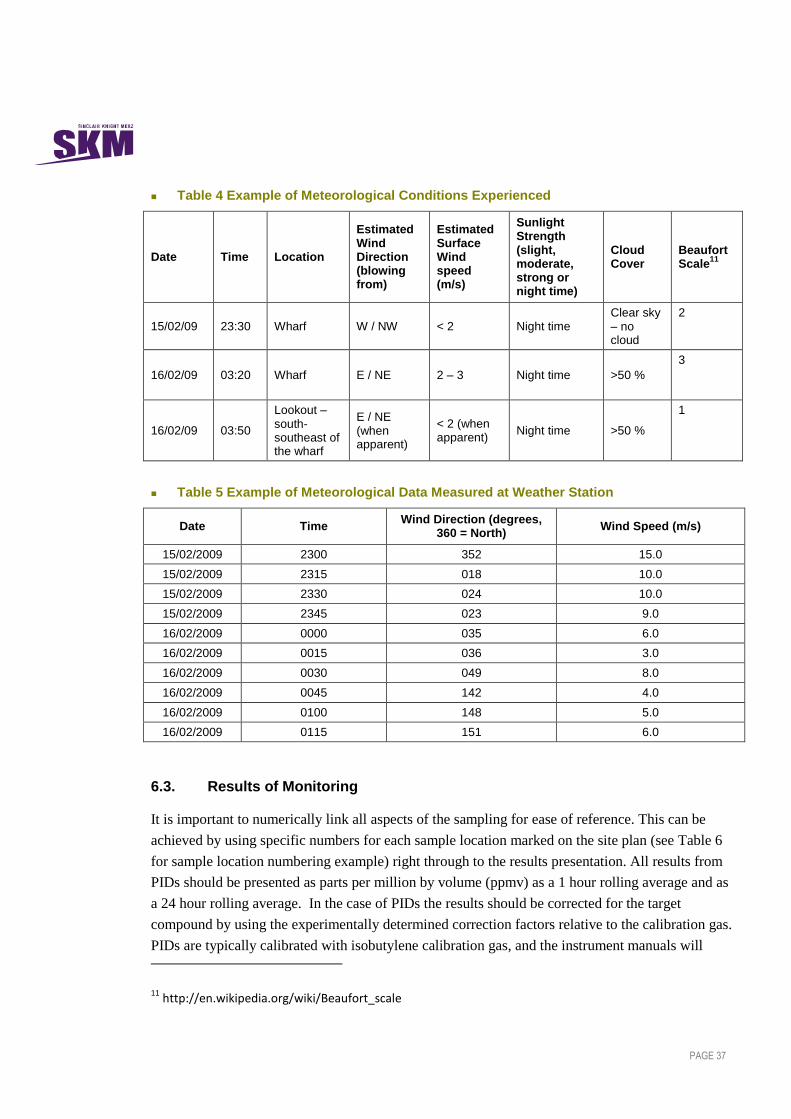
6.2. Meteorological Data
Meteorological conditions observed, measured and recorded during the sampling period are
important in helping to interpret concentrations measured at specific locations. Data such as wind
direction, wind speed, sunlight strength and cloud cover are important. There are generally two
separate meteorological data sets collected on site during fumigation:
Data recorded manually by visual and portable electronic observations (useful for localised
conditions at sample locations); and
Data recorded automatically by electronic observations at an established meteorological site
(useful for large scale conditions).
Data sets are important and should be collected and presented in the final fumigation monitoring
report. Tables 4 and 5 are examples of how the meteorological data may be presented.
Meteorological data must be collected every three minutes during the ventilation but can be
reported in a variety of averaging times.
10 Good Practice Guide for air quality monitoring and data management: Ministry for the Environment 2009.
PAGE 37
Table 4 Example of Meteorological Conditions Experienced
Date Time Location
Estimated Wind Direction (blowing from)
Estimated Surface Wind speed (m/s)
Sunlight Strength (slight, moderate, strong or night time)
Cloud Cover
Beaufort Scale
11
15/02/09 23:30 Wharf W / NW < 2 Night time Clear sky – no cloud
2
16/02/09 03:20 Wharf E / NE 2 – 3 Night time >50 %
3
16/02/09 03:50
Lookout – south-southeast of the wharf
E / NE (when apparent)
< 2 (when apparent)
Night time >50 %
1
Table 5 Example of Meteorological Data Measured at Weather Station
Date Time Wind Direction (degrees,
360 = North) Wind Speed (m/s)
15/02/2009 2300 352 15.0
15/02/2009 2315 018 10.0
15/02/2009 2330 024 10.0
15/02/2009 2345 023 9.0
16/02/2009 0000 035 6.0
16/02/2009 0015 036 3.0
16/02/2009 0030 049 8.0
16/02/2009 0045 142 4.0
16/02/2009 0100 148 5.0
16/02/2009 0115 151 6.0
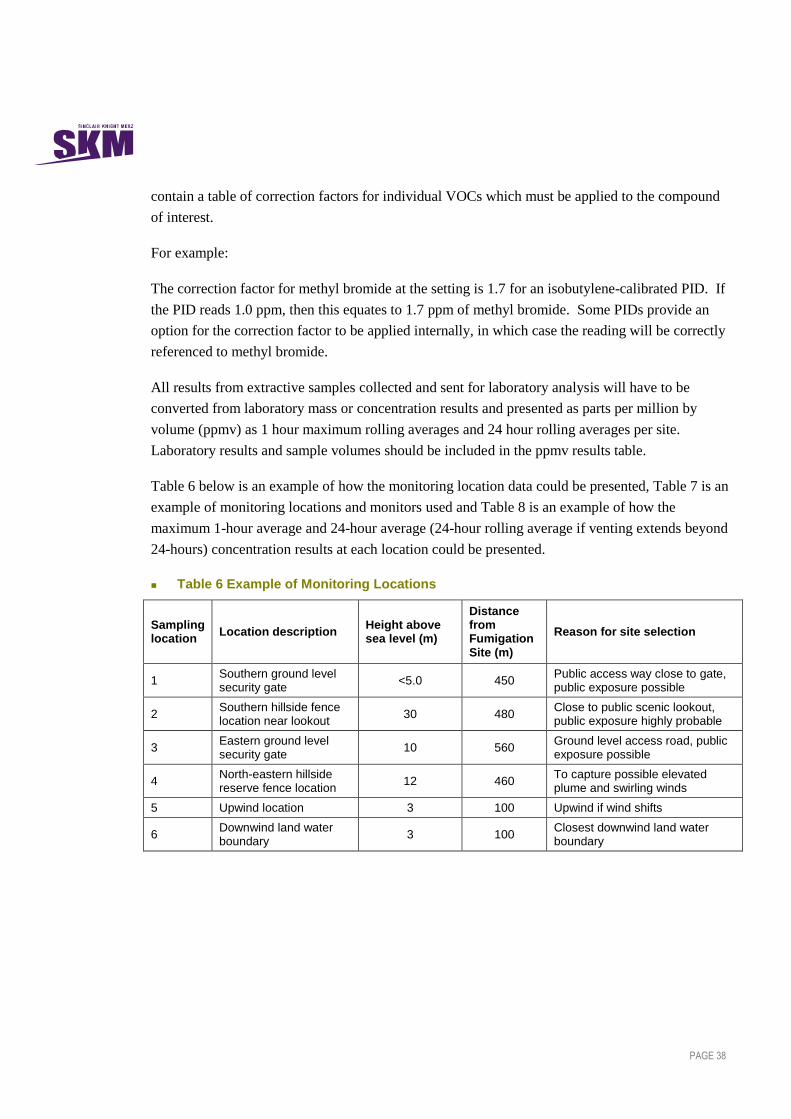
6.3. Results of Monitoring
It is important to numerically link all aspects of the sampling for ease of reference. This can be
achieved by using specific numbers for each sample location marked on the site plan (see Table 6
for sample location numbering example) right through to the results presentation. All results from
PIDs should be presented as parts per million by volume (ppmv) as a 1 hour rolling average and as
a 24 hour rolling average. In the case of PIDs the results should be corrected for the target
compound by using the experimentally determined correction factors relative to the calibration gas.
PIDs are typically calibrated with isobutylene calibration gas, and the instrument manuals will
11 http://en.wikipedia.org/wiki/Beaufort_scale
PAGE 38
contain a table of correction factors for individual VOCs which must be applied to the compound
of interest.
For example:
The correction factor for methyl bromide at the setting is 1.7 for an isobutylene-calibrated PID. If
the PID reads 1.0 ppm, then this equates to 1.7 ppm of methyl bromide. Some PIDs provide an
option for the correction factor to be applied internally, in which case the reading will be correctly
referenced to methyl bromide.
All results from extractive samples collected and sent for laboratory analysis will have to be
converted from laboratory mass or concentration results and presented as parts per million by
volume (ppmv) as 1 hour maximum rolling averages and 24 hour rolling averages per site.
Laboratory results and sample volumes should be included in the ppmv results table.
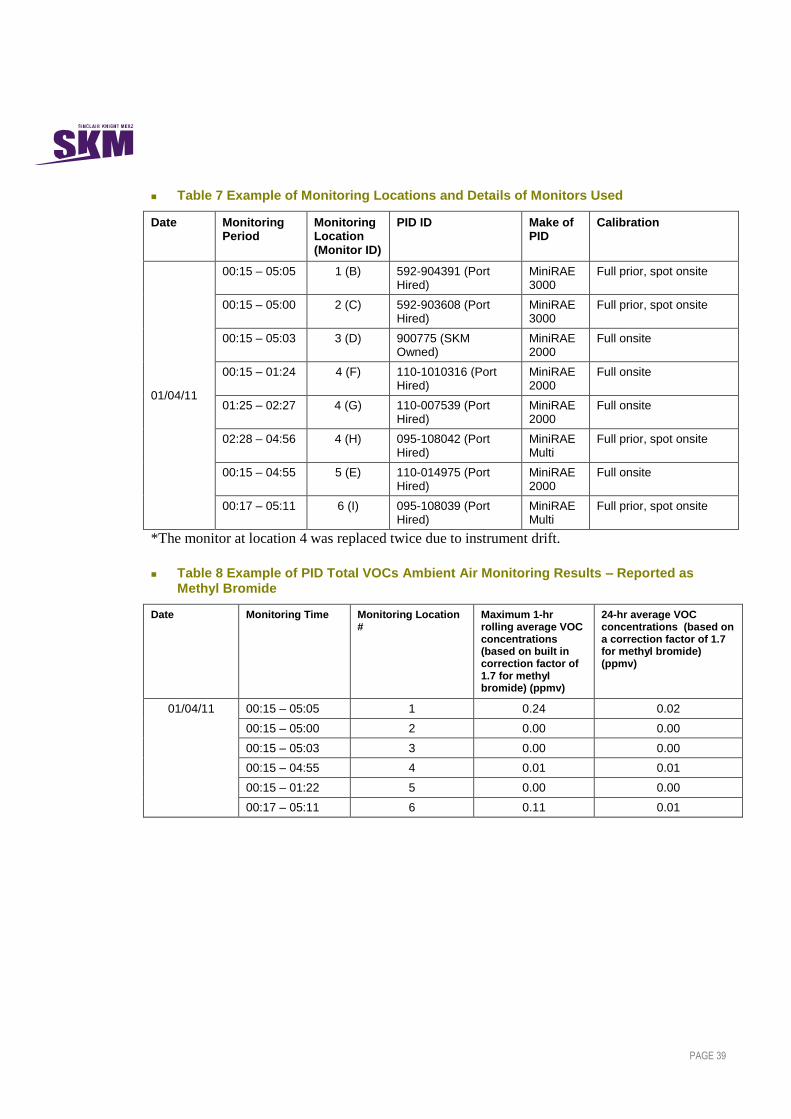
Table 6 below is an example of how the monitoring location data could be presented, Table 7 is an
example of monitoring locations and monitors used and Table 8 is an example of how the
maximum 1-hour average and 24-hour average (24-hour rolling average if venting extends beyond
24-hours) concentration results at each location could be presented.
Table 6 Example of Monitoring Locations
Sampling location
Location description Height above sea level (m)
Distance from Fumigation Site (m)
Reason for site selection
1 Southern ground level security gate
<5.0 450 Public access way close to gate, public exposure possible
2 Southern hillside fence location near lookout
30 480 Close to public scenic lookout, public exposure highly probable
3 Eastern ground level security gate
10 560 Ground level access road, public exposure possible
4 North-eastern hillside reserve fence location
12 460 To capture possible elevated plume and swirling winds
5 Upwind location 3 100 Upwind if wind shifts
6 Downwind land water boundary
3 100 Closest downwind land water boundary
PAGE 39
Table 7 Example of Monitoring Locations and Details of Monitors Used
Date Monitoring Period
Monitoring Location (Monitor ID)
PID ID Make of PID
Calibration
01/04/11
00:15 – 05:05 1 (B) 592-904391 (Port Hired)
MiniRAE 3000
Full prior, spot onsite
00:15 – 05:00 2 (C) 592-903608 (Port Hired)
MiniRAE 3000
Full prior, spot onsite
00:15 – 05:03 3 (D) 900775 (SKM Owned)
MiniRAE 2000
Full onsite
00:15 – 01:24 4 (F) 110-1010316 (Port Hired)
MiniRAE 2000
Full onsite
01:25 – 02:27 4 (G) 110-007539 (Port Hired)
MiniRAE 2000
Full onsite
02:28 – 04:56 4 (H) 095-108042 (Port Hired)
MiniRAE Multi
Full prior, spot onsite
00:15 – 04:55 5 (E) 110-014975 (Port Hired)
MiniRAE 2000
Full onsite
00:17 – 05:11 6 (I) 095-108039 (Port Hired)
MiniRAE Multi
Full prior, spot onsite
*The monitor at location 4 was replaced twice due to instrument drift.
Table 8 Example of PID Total VOCs Ambient Air Monitoring Results – Reported as Methyl Bromide
Date Monitoring Time Monitoring Location #
Maximum 1-hr rolling average VOC concentrations (based on built in correction factor of 1.7 for methyl bromide) (ppmv)
24-hr average VOC concentrations (based on a correction factor of 1.7 for methyl bromide) (ppmv)
01/04/11 00:15 – 05:05 1 0.24 0.02
00:15 – 05:00 2 0.00 0.00
00:15 – 05:03 3 0.00 0.00
00:15 – 04:55 4 0.01 0.01
00:15 – 01:22 5 0.00 0.00
00:17 – 05:11 6 0.11 0.01
PAGE 40
6.4. Calculation of Time-Averaged Methyl Bromide Concentrations
The following is updated guidance for determining time-averaged concentrations of methyl
bromide from ambient air monitoring data near methyl bromide fumigations. 1-hour, 24-hour and
annual average concentrations of methyl bromide must be determined for comparison with the
TELs and to satisfy reporting requirements of the EPA as described in the Methyl Bromide
Fumigations: Post-reassessment Guidance for Fumigators (EPA, April 2011).
These recommendations are made with the assumption that monitoring is conducted using PIDs at
the buffer zones around methyl bromide fumigations. PIDs are at present the best option available
for ambient air monitoring of methyl bromide fumigations due to their providing direct and
continuous readings and their affordability. This makes them appropriate for detecting
concentrations against the 1 hour TEL and the 24 hour TEL (1ppm and 0.333ppm respectively).
However the instruments lack the sensitivity to detect methyl bromide at concentrations relevant to
chronic exposure levels of methyl bromide when multiple daily ventilations occur on a regular
basis, i.e. the annual TEL for methyl bromide is 0.0013 ppm, while the lowest reading provided by
most PIDs is 0.1 ppm.
6.4.1. Calculating 1-hour and 24-hour Averages
1-hour and 24-hour average concentrations are calculated assuming methyl bromide concentrations
of zero during the times that monitoring did not occur. As PID readings are typically collected as
1-minute averages, a 1-hour average would be calculated by summing all PID readings during the
1-hour period of interest and dividing by 60. 24-hour averages may be calculated either by
averaging the 1-minute data or by averaging the 1-hour averages over that 24-hour period.
If the monitor reads zero during the ventilation period it is possible that methyl bromide from the
fumigation is present at levels below the instrument level of detection. If there were no measured
readings at a monitoring site on a given day, then the monitoring record should state that the 1 hour
and 24 hour averages were not calculated as there were no measured readings at that site on that
day while stating the limit of detection of the monitoring equipment (typically 0.1 ppm for PIDs).
For fumigation monitoring events in which methyl bromide is measured during the ventilation
period, it is recommended to calculate 1-hour and 24-hour averages by assuming concentrations of
one-half the level of detection for the non-detect (or zero) readings immediately before and after
the detected readings. Assuming a level of detection for PIDs of 0.1 ppm, a value of 0.05 ppm may
therefore be assumed for non-detect readings immediately before and after measured readings of
methyl bromide. An example showing the calculation of 1-hour and 24-hour average
concentrations from monitoring data collected over a 30-minute period is shown in Table 1 from a
fumigation using less than 7kg methyl bromide.
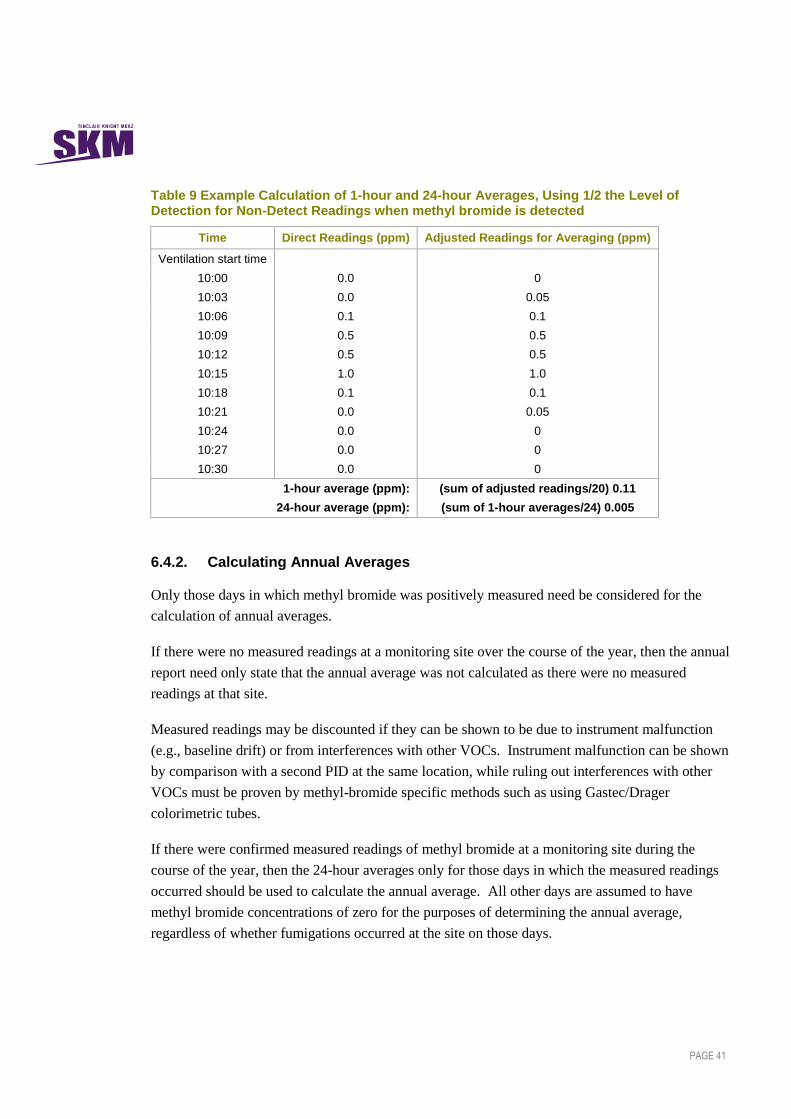
PAGE 41
Table 9 Example Calculation of 1-hour and 24-hour Averages, Using 1/2 the Level of Detection for Non-Detect Readings when methyl bromide is detected
Time Direct Readings (ppm) Adjusted Readings for Averaging (ppm)
Ventilation start time
10:00 0.0 0
10:03 0.0 0.05
10:06 0.1 0.1
10:09 0.5 0.5
10:12 0.5 0.5
10:15 1.0 1.0
10:18 0.1 0.1
10:21 0.0 0.05
10:24 0.0 0
10:27 0.0 0
10:30 0.0 0
1-hour average (ppm): (sum of adjusted readings/20) 0.11
24-hour average (ppm): (sum of 1-hour averages/24) 0.005
6.4.2. Calculating Annual Averages
Only those days in which methyl bromide was positively measured need be considered for the
calculation of annual averages.
If there were no measured readings at a monitoring site over the course of the year, then the annual
report need only state that the annual average was not calculated as there were no measured
readings at that site.
Measured readings may be discounted if they can be shown to be due to instrument malfunction
(e.g., baseline drift) or from interferences with other VOCs. Instrument malfunction can be shown
by comparison with a second PID at the same location, while ruling out interferences with other
VOCs must be proven by methyl-bromide specific methods such as using Gastec/Drager
colorimetric tubes.
If there were confirmed measured readings of methyl bromide at a monitoring site during the
course of the year, then the 24-hour averages only for those days in which the measured readings
occurred should be used to calculate the annual average. All other days are assumed to have
methyl bromide concentrations of zero for the purposes of determining the annual average,
regardless of whether fumigations occurred at the site on those days.
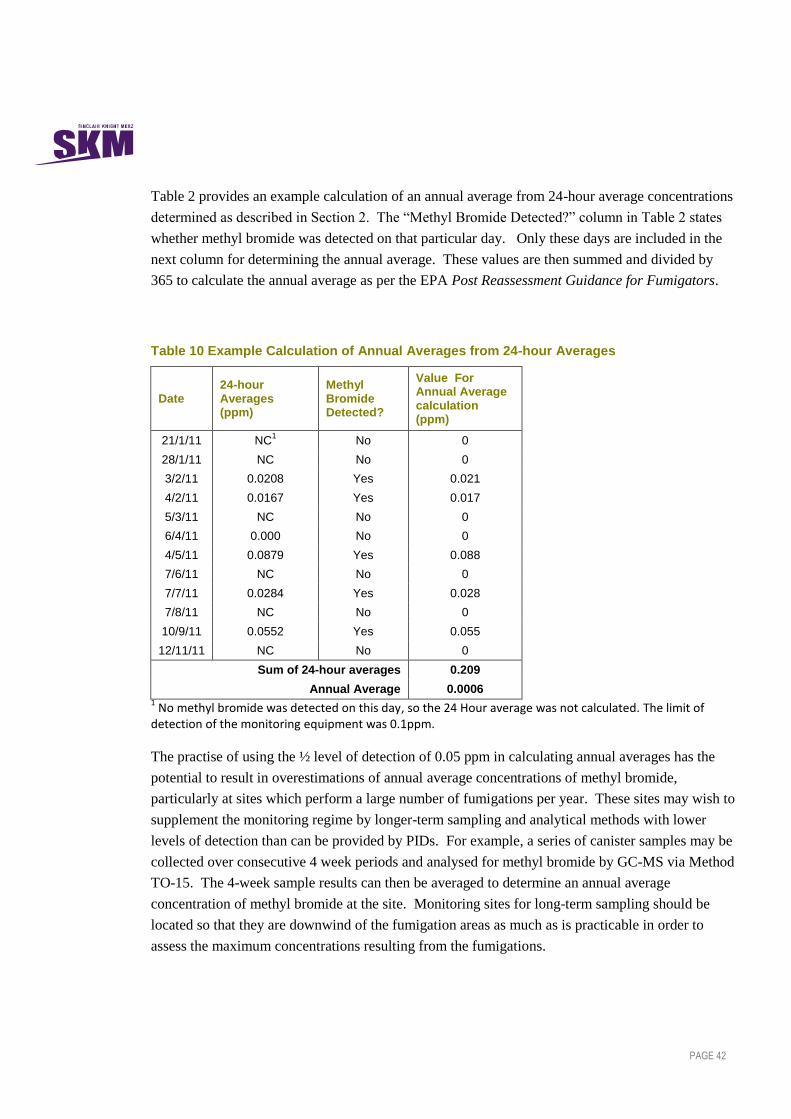
PAGE 42
Table 2 provides an example calculation of an annual average from 24-hour average concentrations
determined as described in Section 2. The “Methyl Bromide Detected?” column in Table 2 states
whether methyl bromide was detected on that particular day. Only these days are included in the
next column for determining the annual average. These values are then summed and divided by
365 to calculate the annual average as per the EPA Post Reassessment Guidance for Fumigators.
Table 10 Example Calculation of Annual Averages from 24-hour Averages
Date 24-hour Averages (ppm)
Methyl Bromide Detected?
Value For Annual Average calculation (ppm)
21/1/11 NC1 No 0
28/1/11 NC No 0
3/2/11 0.0208 Yes 0.021
4/2/11 0.0167 Yes 0.017
5/3/11 NC No 0
6/4/11 0.000 No 0
4/5/11 0.0879 Yes 0.088
7/6/11 NC No 0
7/7/11 0.0284 Yes 0.028
7/8/11 NC No 0
10/9/11 0.0552 Yes 0.055
12/11/11 NC No 0
Sum of 24-hour averages 0.209
Annual Average 0.0006 1 No methyl bromide was detected on this day, so the 24 Hour average was not calculated. The limit of
detection of the monitoring equipment was 0.1ppm.
The practise of using the ½ level of detection of 0.05 ppm in calculating annual averages has the
potential to result in overestimations of annual average concentrations of methyl bromide,
particularly at sites which perform a large number of fumigations per year. These sites may wish to
supplement the monitoring regime by longer-term sampling and analytical methods with lower
levels of detection than can be provided by PIDs. For example, a series of canister samples may be
collected over consecutive 4 week periods and analysed for methyl bromide by GC-MS via Method
TO-15. The 4-week sample results can then be averaged to determine an annual average
concentration of methyl bromide at the site. Monitoring sites for long-term sampling should be
located so that they are downwind of the fumigation areas as much as is practicable in order to
assess the maximum concentrations resulting from the fumigations.
PAGE 43
6.4.3. Reporting Averages
Averages must be reported in a format that is relevant to measured concentrations and the exposure
limits being reported against, and must include units of concentration:
The 1 hour TEL is 1ppm (3.9 mg/m3), so examples of a recorded 1 hour exposure level would
be: 0.05 ppm methyl bromide or 0.2 mg/m3 methyl bromide.
The 24 hour TEL is 0.333 ppm (1.3 mg/m3), so examples of a recorded 24 hour exposure level
would be: 0.055 ppm methyl bromide or 0.2 mg/m3 methyl bromide.
The chronic (annual average) TEL is 0.0013 ppm (0.005 mg/ m3), so examples of a recorded
24 hour exposure level would be: 0.0055 ppm methyl bromide or 0.021 mg/m3 methyl
bromide.
6.5. Conclusion of Results
After the presentation of the meteorological data and contaminant concentration results, a
conclusion shall be reached relating to the relevant ambient air standards. Any measurements
showing significant concentrations of MeBr or other VOCs should be related to the timing of the
ventilation and wind direction if it is possible they were caused by the fumigation. Any non-zero
readings due to instrument drift or by interfering VOCs should also be described.
A report outlining the methodology and results of the ambient air monitoring containing all
relevant data as required by the ERMA Decision shall be created for monitoring of a fumigation
venting event.
Locations using more than 500 kg/year of methyl bromide per calendar year without re-capture
technology must also prepare an annual report outlining their air quality monitoring programme
including all required information as set out in Section 16.8.4 of the ERMA Decision. This report
must be provided to the EPA, the Department of Labour and the local Medical Officer of Health by
the 30th of June the following year and should be made available to the public upon request.
Any breaches of the 1-hour or 24-hour TELs outlined in Section 2.2 of this GPG must be reported
to the Department of Labour and relevant Medical Officer of Health as soon as practicable but
within 5 working days. An example of a notification sheet can be found at Appendix 2 of the
following document:
http://www.epa.govt.nz/Publications/Methyl%20bromide%20guidance%2018.04.pdf
All monitoring data must be kept for a period of seven years after the fumigation and must be made
available to any enforcement agency upon request.
PAGE 44
7. References
1. Decision on Application for the Reassessment of a Hazardous Substance under Section 63 of the Hazardous Substance and New Organisms ACT 1996 Name of substances: Methyl Bromide and formulated substances containing methyl bromide. Application Number: HRC08002, Environmental Risk Management Authority, New Zealand. 28 October 2010. (http://archive.ermanz.govt.nz/resources/publications/pdfs/Methyl%20Bromide%20Reassessment
%20Application.pdf) 2. Methyl Bromide Fumigations Post-Reassessment Guide for Fumigators, EPA, April 2011. 3. MiniRAE 2000 Portable VOC Monitor PGM-7600, Operation and Maintenance Manual.
RAE Systems 2005. 4. Good practice guide for air quality monitoring and data management, Ministry for the
Environment, New Zealand, April 2009. 5. Methyl Bromide, NIOSH 25020 Issue 2, 1996. 6. http://www.wunderground .com/US/FL/Boca_Raton.html 7. Methyl bromide fumigations, Post-reassessment guidance for fumigators. Environmental
Protection Authority, New Zealand, April 2011. 8. http://en.wikipedia.org/wiki/Beaufort_scale 9. Australian/New Zealand Standard 3580.1.1:2007 Method for sampling and analysis of
ambient air, Part 1.1: Guide to siting air monitoring equipment. 10. Compendium of Methods for the Determination of Toxic Organic Compounds in Ambient
Air, Second Edition, Compendium Method TO-17, Determination of Volatile Organic Compounds in Ambient Air Using Active Sampling Onto Sorbent Tubes. USEPA, January 1999.
11. Compendium of Methods for the Determination of Toxic Organic Compounds in Ambient Air, Second Edition, Compendium Method TO-15, Determination of Volatile Organic Compounds (VOCs) in Air Collected In Specially-Prepared Canisters And Analyzed By Gas Chromatography/Mass Spectrometry (GC/MS). USEPA, January 1999.

PAGE 45
Appendix A Ambient Monitoring Field Data Sheets
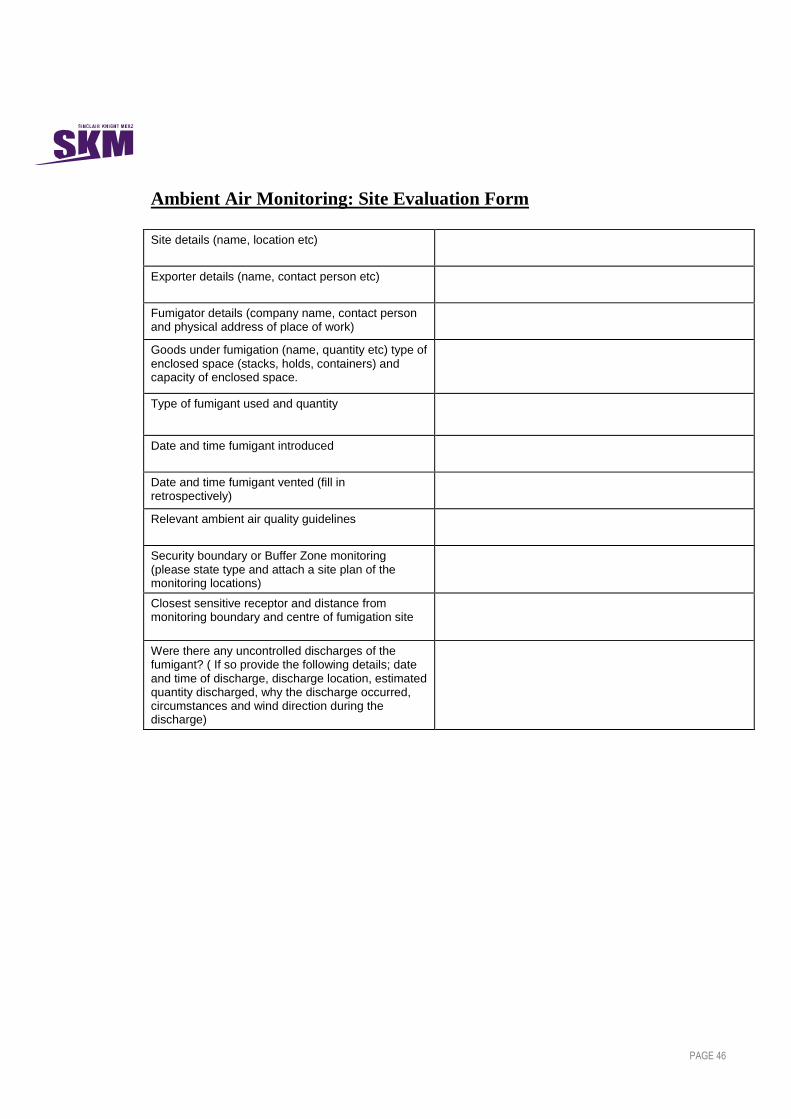
PAGE 46
Ambient Air Monitoring: Site Evaluation Form
Site details (name, location etc)
Exporter details (name, contact person etc)
Fumigator details (company name, contact person and physical address of place of work)
Goods under fumigation (name, quantity etc) type of enclosed space (stacks, holds, containers) and capacity of enclosed space.
Type of fumigant used and quantity
Date and time fumigant introduced
Date and time fumigant vented (fill in retrospectively)
Relevant ambient air quality guidelines
Security boundary or Buffer Zone monitoring (please state type and attach a site plan of the monitoring locations)
Closest sensitive receptor and distance from monitoring boundary and centre of fumigation site
Were there any uncontrolled discharges of the fumigant? ( If so provide the following details; date and time of discharge, discharge location, estimated quantity discharged, why the discharge occurred, circumstances and wind direction during the discharge)

PAGE 47
Plan sketch/photograph/diagram of site including buffer zone boundary
Relief sketch/photograph/diagram of site
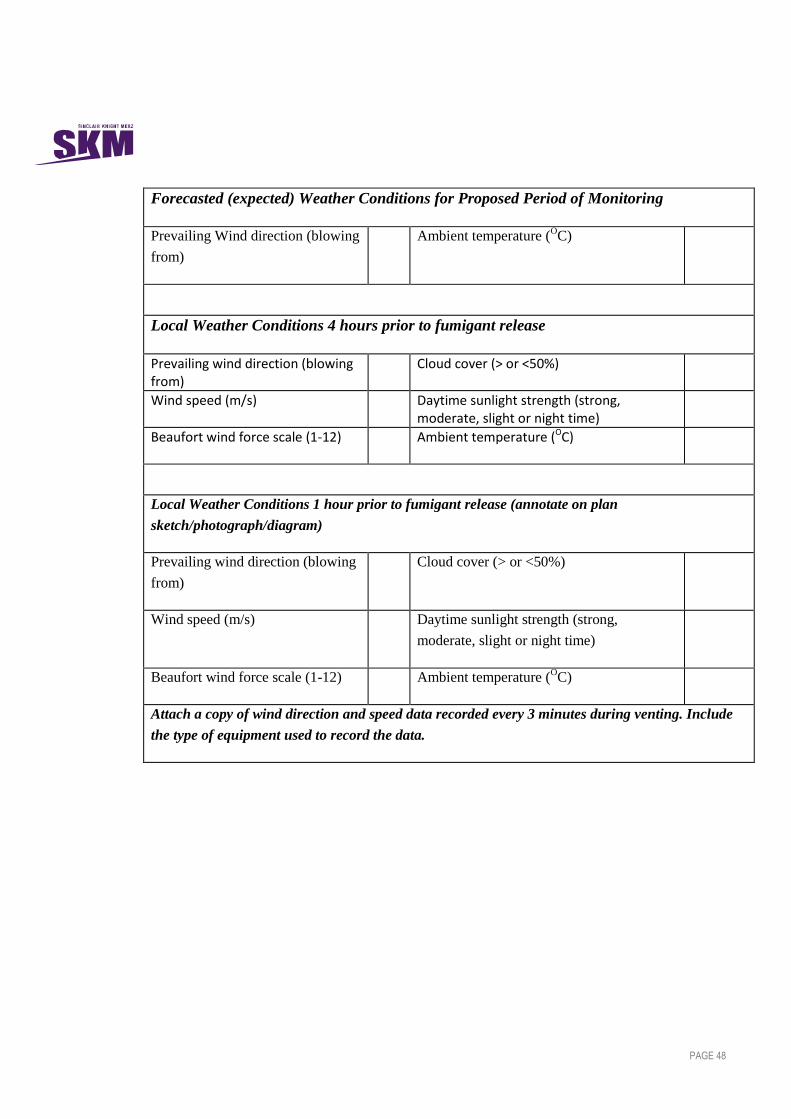
PAGE 48
Forecasted (expected) Weather Conditions for Proposed Period of Monitoring
Prevailing Wind direction (blowing
from)
Ambient temperature (OC)
Local Weather Conditions 4 hours prior to fumigant release
Prevailing wind direction (blowing from)
Cloud cover (> or <50%)
Wind speed (m/s) Daytime sunlight strength (strong, moderate, slight or night time)
Beaufort wind force scale (1-12) Ambient temperature (OC)
Local Weather Conditions 1 hour prior to fumigant release (annotate on plan
sketch/photograph/diagram)
Prevailing wind direction (blowing
from)
Cloud cover (> or <50%)
Wind speed (m/s) Daytime sunlight strength (strong,
moderate, slight or night time)
Beaufort wind force scale (1-12) Ambient temperature (OC)
Attach a copy of wind direction and speed data recorded every 3 minutes during venting. Include
the type of equipment used to record the data.

PAGE 49
Ambient Air Monitoring: Sampling Methodology and Location
Ambient air monitoring equipment used and
technique (e.g. PID, gas detection tube,
canister sample)
Applicable method or standard of sampling
Method of laboratory analysis (if applicable,
e.g. TO-15)
Estimated duration of sampling
Number of sample locations
Analyser section
Analyser Information (For Real Time Sampling Only)
Make Model Equipment
type
Equipment
ID
Mode Gas
Selection
Correction
Factor
Logging
Interval
Notes:

PAGE 50
Notes:
Real Time Sampling
Pre-sampling calibration
Equipment
type
Equipment ID Span gas type
and
concentration
(ppm)
Pre-cal
reading
Zero
reading
Span
reading
Zero
reading
Post-cal
reading
Sample location information – mark each sample location on plan sketch with and
associated sample number
Sample
Location
Number
Location/Name Equipment
type and ID
Wind speed
and direction
at sample
installation
Distance
from
fumigated
goods
Start
date
and
time
End date
and time
Total
sample
time
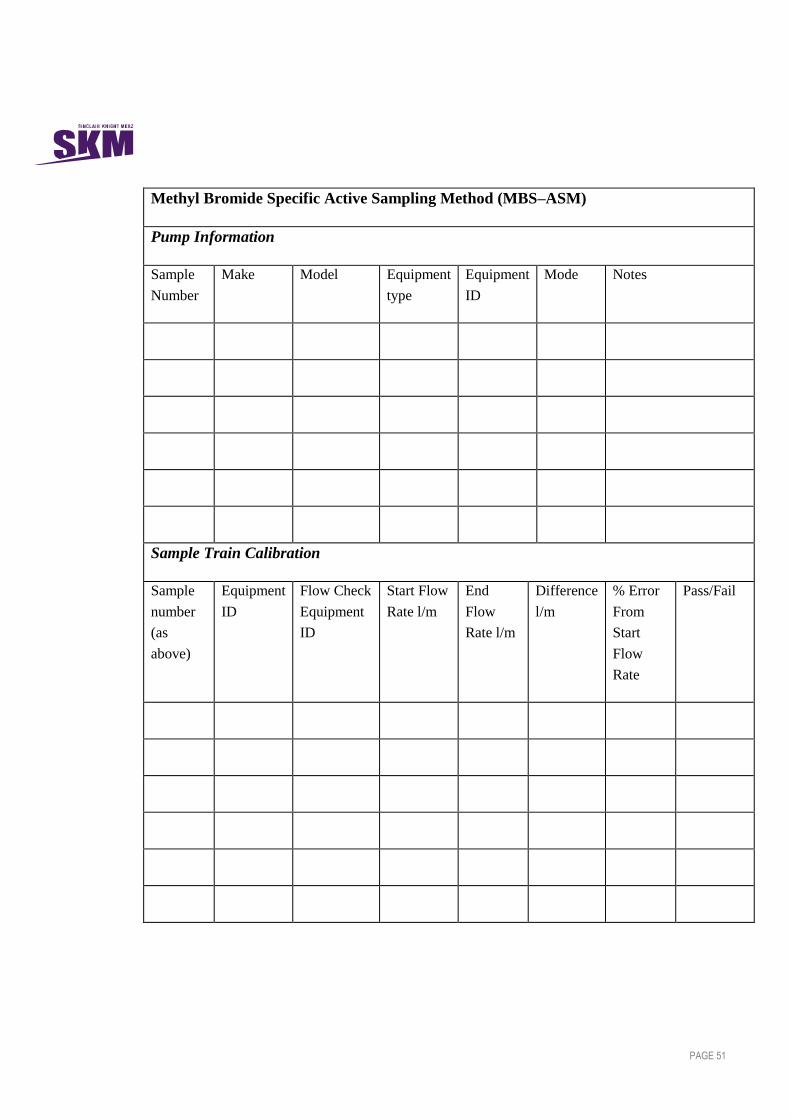
PAGE 51
Methyl Bromide Specific Active Sampling Method (MBS–ASM)
Pump Information
Sample
Number
Make Model Equipment
type
Equipment
ID
Mode Notes
Sample Train Calibration
Sample
number
(as
above)
Equipment
ID
Flow Check
Equipment
ID
Start Flow
Rate l/m
End
Flow
Rate l/m
Difference
l/m
% Error
From
Start
Flow
Rate
Pass/Fail
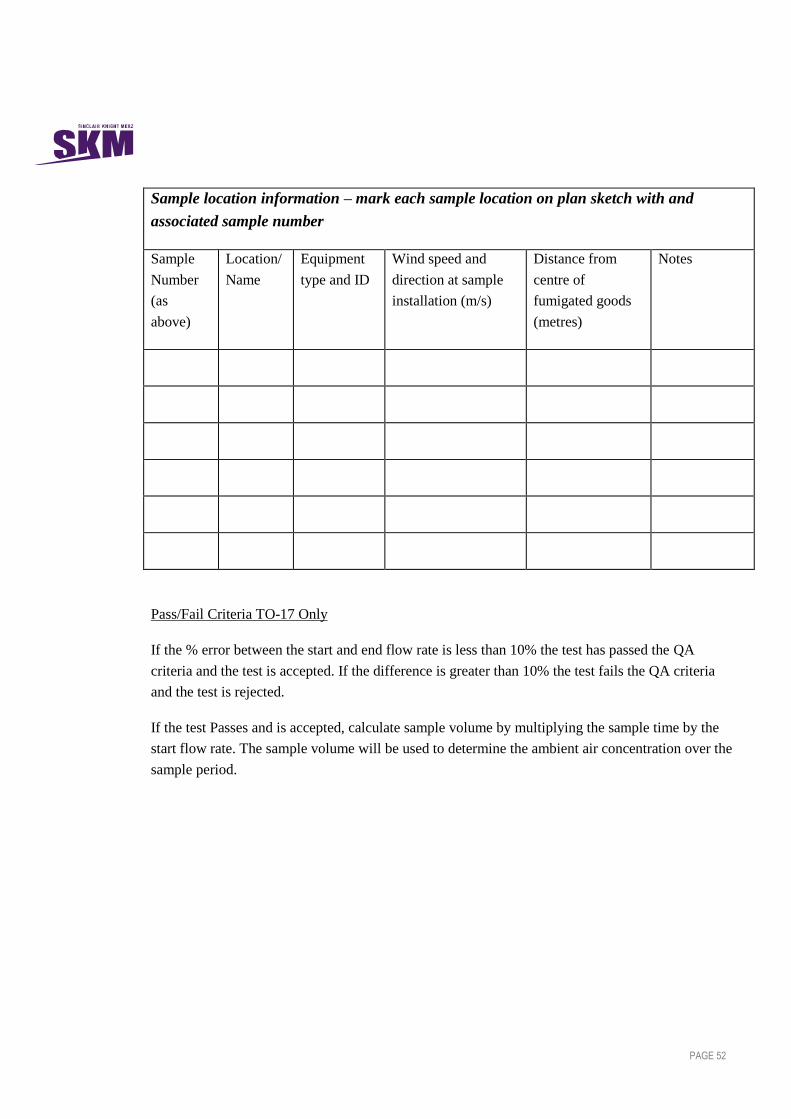
PAGE 52
Sample location information – mark each sample location on plan sketch with and
associated sample number
Sample
Number
(as
above)
Location/
Name
Equipment
type and ID
Wind speed and
direction at sample
installation (m/s)
Distance from
centre of
fumigated goods
(metres)
Notes
Pass/Fail Criteria TO-17 Only
If the % error between the start and end flow rate is less than 10% the test has passed the QA
criteria and the test is accepted. If the difference is greater than 10% the test fails the QA criteria
and the test is rejected.
If the test Passes and is accepted, calculate sample volume by multiplying the sample time by the
start flow rate. The sample volume will be used to determine the ambient air concentration over the
sample period.
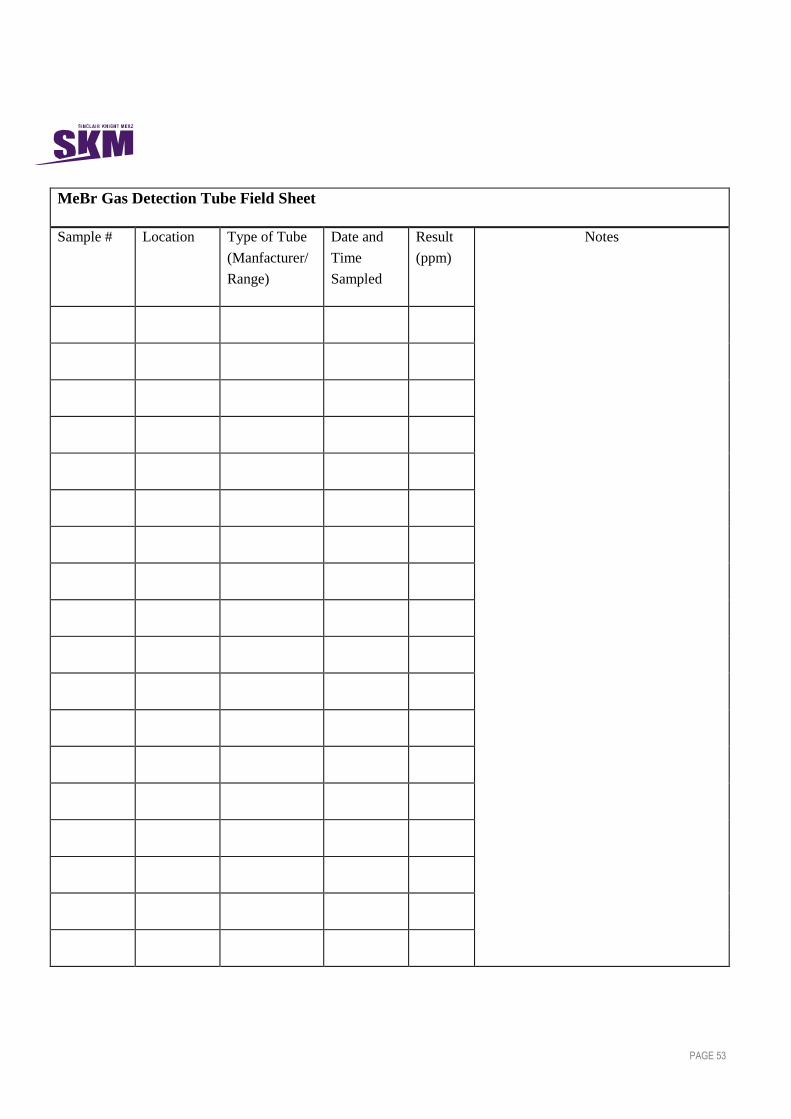
PAGE 53
MeBr Gas Detection Tube Field Sheet
Sample # Location Type of Tube
(Manfacturer/
Range)
Date and
Time
Sampled
Result
(ppm)
Notes
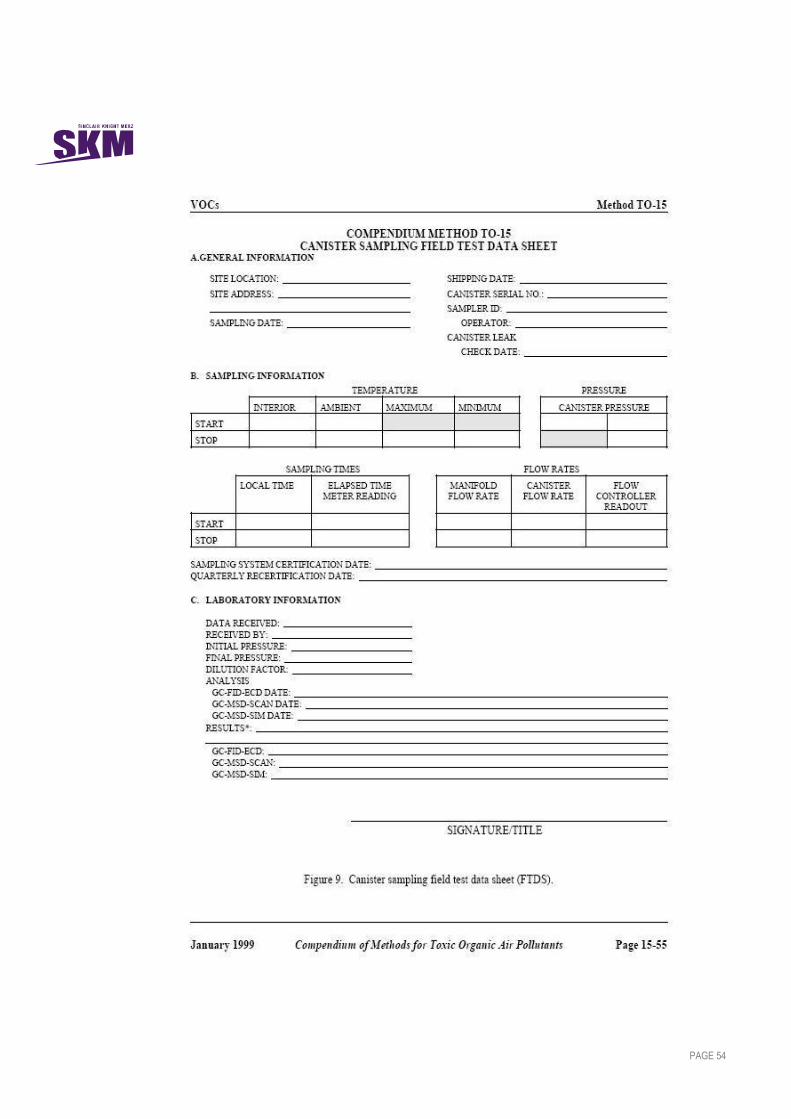
PAGE 54

PAGE 55
Appendix B Case Study: Monitoring Method
PAGE 56
The following appendix sets out a step by step example of a complex ambient air monitoring event
of a methyl bromide fumigation venting carried out in New Zealand.
Background
The scale of the fumigation included fumigation release from ship holds and from log stacks
located in a secured port with surrounding complex terrain. The total amount of methyl bromide
used for the fumigation included 2502 kg within 5 ship holds and 377 kg within four log stacks
fumigated under covers.
Step 1 Site Assessment
The topography of the fumigation sites were assessed by aerial photography, topographical maps,
site photos and from a site walk around. The walk around also accessed the surrounding activities,
buildings and vegetation. The proposed location for the fumigation release was discussed with the
port operator. Local wind patterns were discussed with the port, historic metrological data was
interrogated and weather forecasts were reviewed and recorded on the monitoring filed sheets. The
weather forecast indicated that meteorological conditions would not result in poor dispersion
conditions although light winds would result in less than ideal dispersion conditions. If conditions
were likely to indicate very poor dispersion conditions the fumigation venting would be slowed and
may need to occur over two nights.
Step 2 Monitoring Location Selection
The selection of monitoring locations was based on the planned size and location of the fumigation
and on the site assessment discussed above. Because the planned fumigation was large, the local
topography made wind directions unpredictable and the forecasts winds were light and variable.
Six locations were selected for monitoring. The locations included three boundary points (outside
of the buffer zone) with public access (sensitive locations) that would be potentially downwind,
one location on the nearest downwind land sea boundary (within the 100 metre buffer zone), one
location upwind in the event the wind direction changed, and one location at the boundary location
crosswind. The site had a secure boundary much larger than the minimum 100 metre buffer zone
and the port authority established and monitored an exclusion zone over the water near the vessel
under fumigation. All sampling locations met the requirements set out in the GPG.
Step 3 Equipment Selection
PIDs were selected as the monitoring equipment based on the number of monitoring locations and
the need to provide fumigation venting control if required. While there was a small potential for
some VOC contamination from a local boat building facility the forecast winds did not indicate it
would become an upwind source. A total of nine PIDs were hired from multiple equipment
PAGE 57
suppliers for delivery two days prior to the fumigation release. A new charcoal filter, 15 GASTEC
methyl bromide detector tubes and a cylinder containing 100 ppm Isobutylene calibration gas were
purchased for the event. On receipt the samplers were removed from their cases and checked to
ensure they were operational.
Step 4 Monitoring Preparation
a) All monitors were powered up one day prior to the fumigation and the battery levels were
checked. Extra batteries were included with the units and could be needed based on the size
of the fumigation and expected slow venting required. The PIDs were also checked to
make sure that multiple moisture/dust filters were included.
b) The clocks of all the PIDs were synchronised and the instruments were set to log
automatically, historic data was cleared and the settings were changed to account for the
methyl bromide correction factor.
c) The calibration documents were collected and stored.
Step 5 Monitor Pre-monitoring Calibrations
A clean preparation area was established at the fumigation location. A full calibration for each
instrument was not carried out as the suppliers performed calibrations prior to dispatch. Zero and
span calibration checks were performed on all PIDs to ensure the calibration was still valid. Zero
calibrations were performed with charcoal filter at the PID inlets, and span calibrations were
performed using 100 ppm isobutylene gas. Full calibrations were performed on those monitors that
were not within +/-10% of the span and zero checks (span check readings within 10% of 170 ppm
were accepted to account for the methyl bromide calibration factor of 1.7). Calibrations were
carried out with PID pre-filters in line.
Step 6 Setup
a) Four hours prior to the fumigation venting the local weather conditions were recorded and
the selected monitoring locations were re-assessed. The weather conditions were similar to
the forecasted conditions used in the initial location selection so no changes were made to
the monitoring locations.
b) A meeting with the fumigators confirmed the schedule for the fumigation and to discuss
the monitoring schedule. The amount of methyl bromide used, amount of product or area
being fumigated was collected for the fumigation and recorded.
c) The Port was asked to confirm that the meteorological station was operating normally.
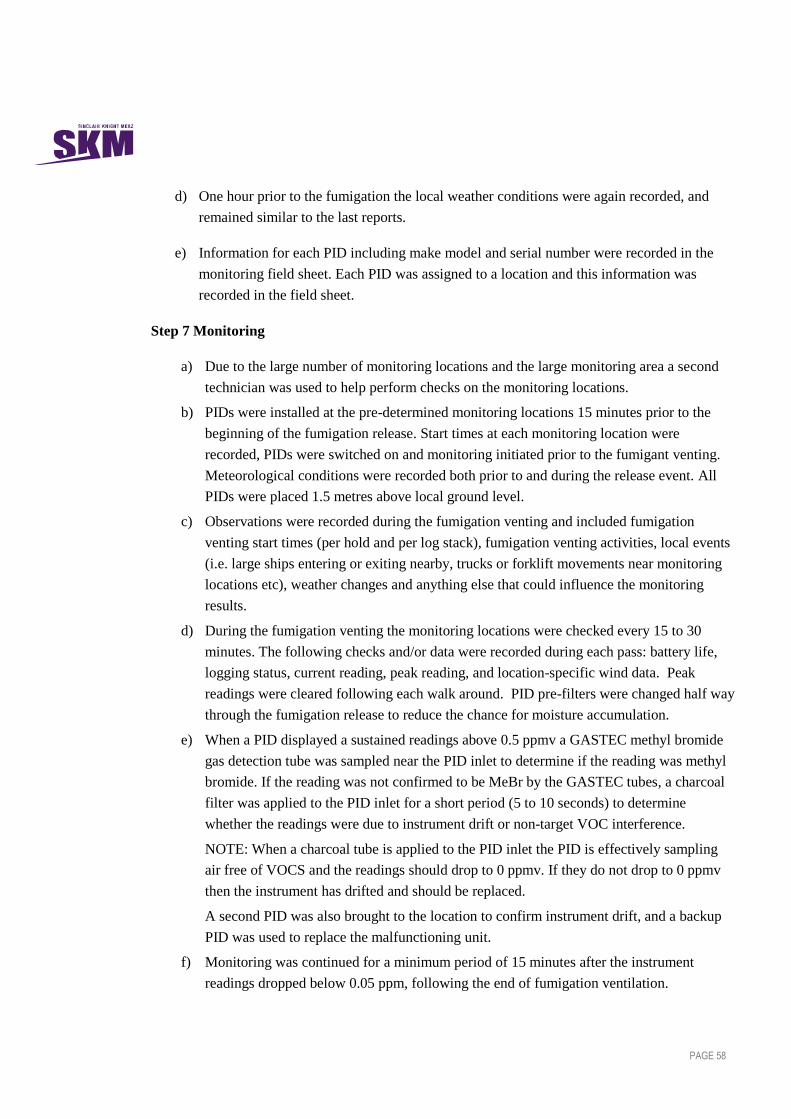
PAGE 58
d) One hour prior to the fumigation the local weather conditions were again recorded, and
remained similar to the last reports.
e) Information for each PID including make model and serial number were recorded in the
monitoring field sheet. Each PID was assigned to a location and this information was
recorded in the field sheet.
Step 7 Monitoring
a) Due to the large number of monitoring locations and the large monitoring area a second
technician was used to help perform checks on the monitoring locations.
b) PIDs were installed at the pre-determined monitoring locations 15 minutes prior to the
beginning of the fumigation release. Start times at each monitoring location were
recorded, PIDs were switched on and monitoring initiated prior to the fumigant venting.
Meteorological conditions were recorded both prior to and during the release event. All
PIDs were placed 1.5 metres above local ground level.
c) Observations were recorded during the fumigation venting and included fumigation
venting start times (per hold and per log stack), fumigation venting activities, local events
(i.e. large ships entering or exiting nearby, trucks or forklift movements near monitoring
locations etc), weather changes and anything else that could influence the monitoring
results.
d) During the fumigation venting the monitoring locations were checked every 15 to 30
minutes. The following checks and/or data were recorded during each pass: battery life,
logging status, current reading, peak reading, and location-specific wind data. Peak
readings were cleared following each walk around. PID pre-filters were changed half way
through the fumigation release to reduce the chance for moisture accumulation.
e) When a PID displayed a sustained readings above 0.5 ppmv a GASTEC methyl bromide
gas detection tube was sampled near the PID inlet to determine if the reading was methyl
bromide. If the reading was not confirmed to be MeBr by the GASTEC tubes, a charcoal
filter was applied to the PID inlet for a short period (5 to 10 seconds) to determine
whether the readings were due to instrument drift or non-target VOC interference.
NOTE: When a charcoal tube is applied to the PID inlet the PID is effectively sampling
air free of VOCS and the readings should drop to 0 ppmv. If they do not drop to 0 ppmv
then the instrument has drifted and should be replaced.
A second PID was also brought to the location to confirm instrument drift, and a backup
PID was used to replace the malfunctioning unit.
f) Monitoring was continued for a minimum period of 15 minutes after the instrument
readings dropped below 0.05 ppm, following the end of fumigation ventilation.
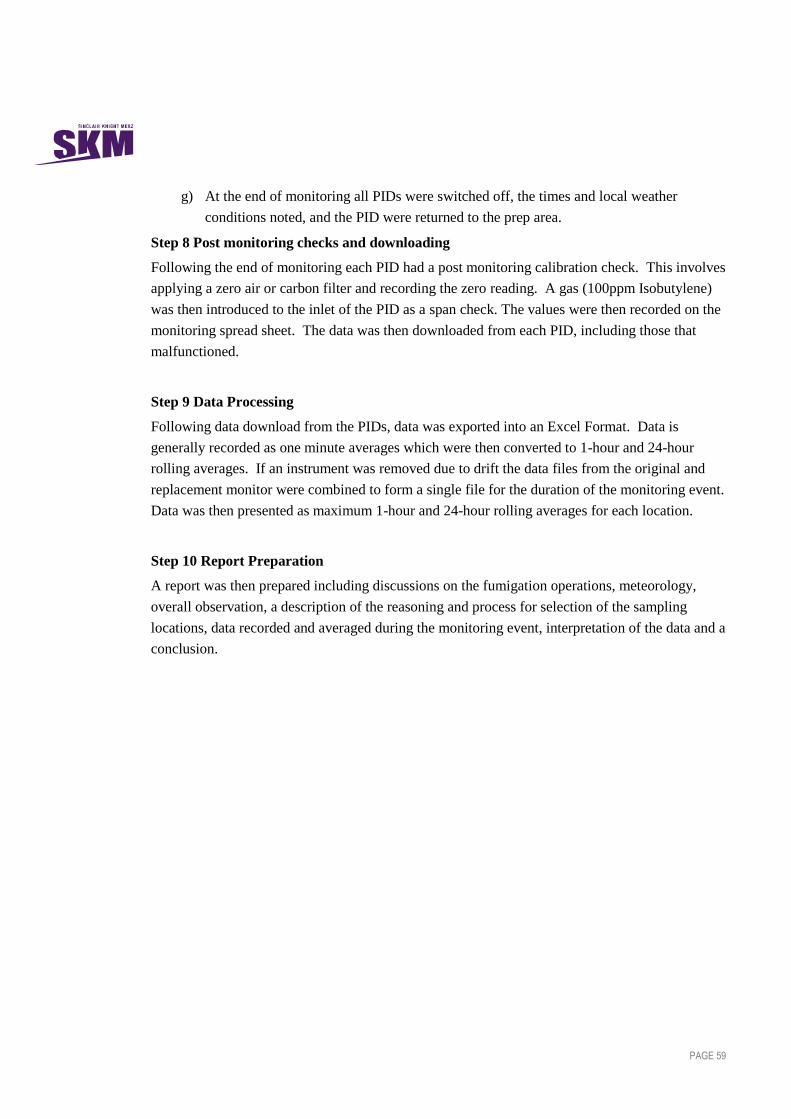
PAGE 59
g) At the end of monitoring all PIDs were switched off, the times and local weather
conditions noted, and the PID were returned to the prep area.
Step 8 Post monitoring checks and downloading
Following the end of monitoring each PID had a post monitoring calibration check. This involves
applying a zero air or carbon filter and recording the zero reading. A gas (100ppm Isobutylene)
was then introduced to the inlet of the PID as a span check. The values were then recorded on the
monitoring spread sheet. The data was then downloaded from each PID, including those that
malfunctioned.
Step 9 Data Processing
Following data download from the PIDs, data was exported into an Excel Format. Data is
generally recorded as one minute averages which were then converted to 1-hour and 24-hour
rolling averages. If an instrument was removed due to drift the data files from the original and
replacement monitor were combined to form a single file for the duration of the monitoring event.
Data was then presented as maximum 1-hour and 24-hour rolling averages for each location.
Step 10 Report Preparation
A report was then prepared including discussions on the fumigation operations, meteorology,
overall observation, a description of the reasoning and process for selection of the sampling
locations, data recorded and averaged during the monitoring event, interpretation of the data and a
conclusion.


