32
APPENDIX 3.6-A Water Consumption Technical Memorandum

APPENDIX 3.6-A
Water Consumption Technical Memorandum

1
Technical Memorandum
Date: February 20, 2012
To: Ann Koby, Bryan Porter
From: Erik Fanselau, Jeff Nelson
Subject: Water Usage Analysis for HSTMerced to Fresno Section
This Technical Memorandum (TM) presents our analysis and evaluation of anticipated wateruse requirements for both the construction and operation of the California High-Speed Train(HST) for the Merced to Fresno section. This TM also identifies current water usage at theproposed facility and track alignment locations and likely water supply sources to meet theanticipated HST water demand for this section.
Executive Summary
The Merced to Fresno section runs through Merced, Madera, and Fresno counties and will be75 to 95 miles long, depending on the alignment that is constructed. The major features thatare to be part of the Merced to Fresno Section include HST passenger stations in the cities ofMerced and Fresno, and the track alignment and associated right-of-way. One HeavyMaintenance Facility (HMF) may also be included as part of this section. PB reviewed allrelevant sections of pertinent HST reports and plans to identify all project facilities that wouldhave significant water demand requirements. Based on this review, we identified threefacilities requiring significant operational water usage, those being the two passenger stationsthat will be located in Merced and Fresno, and the one HMF that may be located in this section.
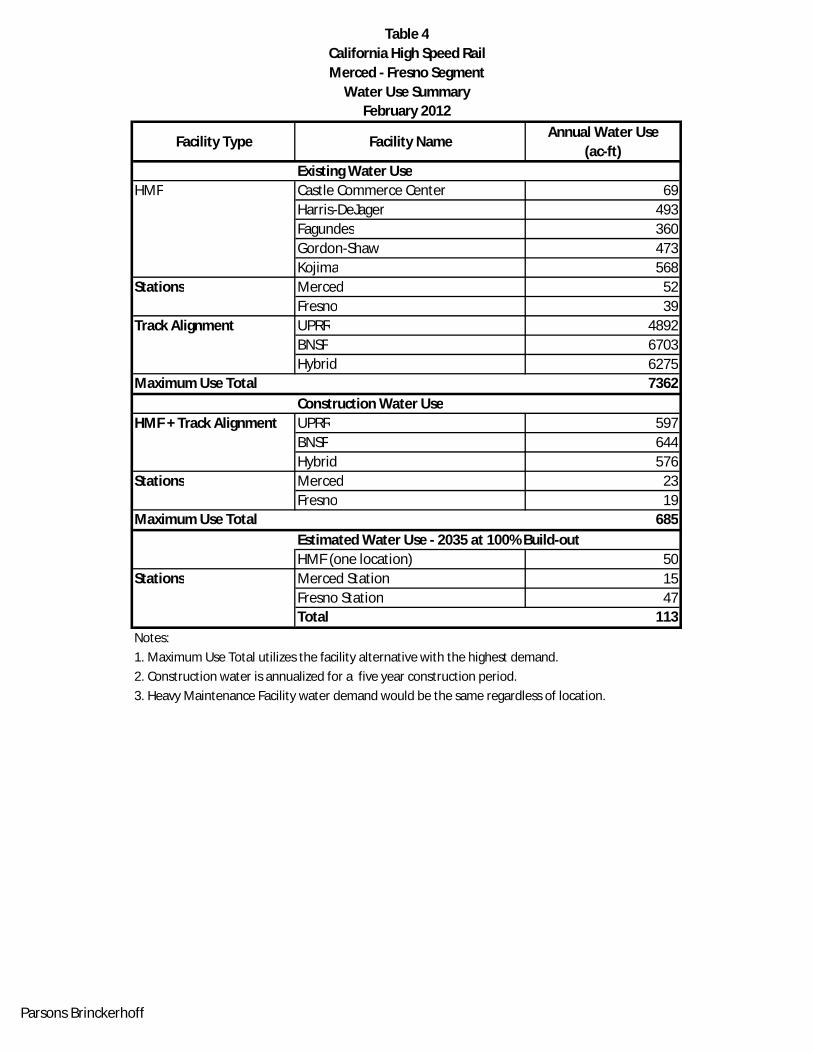
PB identified water use factors for the different facilities and estimated usage rates assummarized in Table 1. We used these factors to estimate the future water demand for eachfacility and track alignment alternatives for both construction activities and operation andmaintenance at final build-out. PB then evaluated existing water usage for all five proposedHMF locations, the three alternative track alignments, and at each station location andcompared this result with our future estimated demand. This comparison indicates that theconstruction of the Merced to Fresno section of the HST will result in a net decrease in annualwater consumption to only 9% of the existing water usage for the project footprint andoperation and maintenance of the HST at final build-out also will result in a net decrease ofwater usage over existing water usage in/at the project footprint. This information issummarized in Table 4.
Background
The California High-Speed Rail Authority (Authority), a state governing board formed in 1996,has responsibility for planning, designing, constructing, and operating the HST. Whencompleted, the HST System will provide intercity, high-speed service on more than 800 miles oftracks throughout California, connecting the major population centers of Sacramento, the SanFrancisco Bay Area, the Central Valley, Los Angeles, the Inland Empire, Orange County, and SanDiego.

2
The HST system, shown on the cover, is divided into 12 sections. The Merced to Fresno Section,shown in Figure 1 (and highlighted on the cover), will connect to the San Jose to MercedSection to the northwest via Pacheco Pass, the Merced to Sacramento Section to the north, andthe Fresno and Bakersfield section (and from there to the Southern California sections) to thesouth. The Merced to Fresno section runs through Merced, Madera, and Fresno counties andwill be 75 to 95 miles long, depending on the final alignment.
The major features that are to be part of the Merced to Fresno Section include HST passengerstations in the cities of Merced and Fresno, the track alignment and associated right-of-way,and possibly one Heavy Maintenance Facility (HMF). Other lesser facilities will include amaintenance-of-way facility, a traction power supply station (TPSS), and switching andparalleling stations.
Methodology
Our analysis consisted of the following steps.
1) We reviewed existing relevant information, reports and documents to identify projectfeatures and activities that would require significant water usage during both theconstruction and operation of this section of the HST.
2) We identified the expected land requirements for the different station and HMFlocations and track alignments as well as passenger loading estimates and staffingrequirements for operating and maintaining each feature, during both construction andoperation at full build-out operation.
3) We then developed water demand estimates for both construction and long termoperation of the planned facilities and the track alignments. Our water demandestimate for construction is based on the estimated one-time, five year constructionperiod concluding in 2020. Our annual water use estimate is based on full build-out in2035.
4) We then determined water usage of the existing uses at the sites/stations where theHSR system would be constructed and operated. To determine existing water usage weused the actual parcel land use information and applied region specific water usagerates developed from recent data. In addition, we contacted the owners of the HMFsites and asked for specific historical water usage data for each of the HMF sites.
5) Finally, we identified available existing water supply and additional water supplysources, if needed, to provide the required water to each section feature, during bothconstruction and long term operation. A more detailed description of our approach foreach step is described below.
Identification of Project Features with Significant Water Usage
PB reviewed all relevant project documents to identify all project related facilities that wouldhave significant water demand requirements. Based on this review, we identified threefacilities requiring significant operational water usage, those being the Merced and Fresnopassenger stations and the potential Heavy Maintenance Facility.

3
There are two potential locations being evaluated for the Fresno station; both locations arewithin a few blocks of each other. The station configurations and footprints will be the samefor either location. There is only one location currently being evaluated for the Merced Station.One HMF will be located either as part of the Merced to Fresno section, or as part of the Fresnoto Bakersfield section. While it is not certain if an HMF will be included as part of the Merced toFresno section, this TM includes an analysis of the water usage associated with a HMF forcompleteness. Five potential locations for the HMF have been identified along the Merced toFresno section: Castle Commerce Center, Harris-DeJager, Fagundes, Gordon-Shaw, and Kojima.
The HMF will include a heavy rail vehicle maintenance area and a layover area. The HMF willrequire approximately 154 acres to accommodate all activities associated with the train fleetassembly, disassembly and complete rehabilitation; all on-board components of the train-sets;and overnight layover accommodations and servicing facilities. The facility will also include amaintenance shop, yard operations control center building, one traction power supply station(TPSS), a train interior cleaning platform and other support facilities. The HMF footprint isexpected to cover the same area (154 acres) regardless of which of the five potential locationsis chosen. However, the total site limit area associated with the five possible sites (site limit)varies in size from 231 acres for the Fagundes site to 401 acres for the Harris-DeJager site. Ifthere is a HMF located within the Merced to Fresno section, a maintenance-of-way facility willlikely be incorporated into the HMF. If an HMF is not located within the Merced to Fresnosection, a separate maintenance-of-way facility will likely be included in this section.Maintenance-of-way facilities provide for equipment, materials, and replacement parts storageand support quarters and staging areas for HST System maintenance personnel. Themaintenance-of-way facility would be located immediately adjacent to the HST tracks andwould occupy approximately 26 acres. We do not anticipate significant water usage associatedwith the maintenance-of-way facility.
The TPSS, and switching and paralleling stations will be unmanned, remotely operated facilitieswith no dedicated water supply and as such, are not anticipated to require significant, if any,water usage. Therefore, no water usage analysis was performed for these facilities.
There are three track alignment alternatives. These alignments are referred to as the UPRR/SR99, BNSF, and the Hybrid alignment, which incorporates portions of both the UPRR/SR 99 andBNSF alignments. We performed an analysis for all three alignments.
Estimating Future Water Demand Requirements for Merced to Fresno Section
This section describes the relevant information and assumptions we used to estimate thefuture water demand for each facility and track alignment alternatives. Water demandestimates were developed for both construction activities and operation and maintenance atfinal build-out. Data tables summarizing key facility information and water demand estimatesare included at the end of this report. We reviewed the 15% design plans for both the Mercedand Fresno stations. Both stations have a similar footprint. As a result, the water demand forboth office space and landscaping would be similar with the only variable being a difference inpassenger usage.
The process we followed for estimating the water demand for the operation of each facility issummarized below.
identify facilities requiring water usage including stations, HMFs and track alignments

4
determine water use factors for each facility including:
o size/footprint of buildings and overall site areas
o passenger/employee use for each station and facility, and
o facility functions and operation/maintenance requirements
determine appropriate water use factors
apply factors and estimate total water demand
PB identified operational water use factors for the different facilities by obtaining informationfrom similar facilities such as Bay Area Rapid Transit (BART) and Los Angeles InternationalAirport, from American Water Works Association (AWWA) manuals and research papers andthe August 2008 Fresno Urban Water Management Plan (FUWMP). We then compared thedifferent water use factors and used our professional engineering judgment to select the mostappropriate annual water usage rate.
HMF - After careful consideration, PB decided to use the recent operational data from theHayward BART facility (water rate usage of 31 gallons/employee/day) as a basis fordeveloping a water use factor for the HMF facility as the facilities are similar in function(both perform heavy maintenance and cleaning for electrically powered train sets) and size,and have similar precipitation conditions. Data from the Department of Water ResourcesState Climatologist shows similar average rainfall totals for Hayward (14.9 inches, Newarkgage) and the HMF site (12.5 inches, Merced gage). PB compared the number of train setsand employees for both the BART (actual numbers) and HST (planned numbers) facilities andtook into account other climatic conditions (average temperature, humidity) andlandscaping, as well as the expected use of newer water recycling and reuse technologies atthe HMF and adjusted the water usage factor for the HMF slightly downward to 30gallons/employee/day. PB also spoke with the BART Shop Superintendent at the Haywardfacility and confirmed that the work performed there is similar to the work that would beperformed at the proposed HMF. With the ongoing improvement in water recycling andreuse technologies likely to be employed at the HMF, we feel that this water use factor maybe conservatively high, but appropriate for use in this analysis.
Passenger Stations - PB looked at several different approaches for estimating the futurewater demand for the Fresno and Merced stations including estimating water demand on aper capita basis as well as on a facility square foot basis. After comparing these methods, wechose the method that yielded the most conservative results, that being applyinggallons/capita/day use factors to the estimated number of passengers and employees ateach station. The factors we used were 30 gallons per capita per day (gpcpd) of water usefor each employee, and 5 gpcpd for passengers.
Track alignments – no water will be utilized along the track alignments during operation ofthe system.
The different water use factors and our estimated future water demand for each facility issummarized in Table 1.

5
The process we followed for estimating the water demand related to construction of eachfacility and track alignments is summarized below.
identify the construction footprint for each facility and track alignment
identify the different construction components associated with both the constructionof the facilities and the track that use water:
o manufacturing of concrete
o earthwork and soil conditioning
o dust suppression
o irrigation for reseeded areas
Based on anticipated project construction schedule and on PB’s past actual water usageexperience on other construction projects in the Central Valley with similar elements, wedeveloped water usage estimates for construction of the stations, HMF, and track. This isdiscussed in more detail below in the “Water Supply to Serve Construction” section. Our totalestimated construction water usage was annualized over a five year construction period. Thisinformation is summarized in Table 2.
Existing water use and water supply sources
We identified land areas that will be impacted by the HST for each of the three track alignmentalternatives (Figure 1), each of the five potential HMF locations (Figures 2-4), and for each ofthe station locations (Figure 5). As described earlier, the area of land acquired for the HMFsmay be greater than the 154 acres required for the HMF footprint. The Authority has nocurrent plans to change the existing land use on this additional acreage. Accordingly, thisanalysis only focused on the 154 acres that will be developed for the HMF. Four of the fivepotential HMF locations are served by untreated agricultural water and groundwater; oneproposed HMF location, the Castle Commerce Center, is supplied by treated groundwater (SeeTable 3A). As the HMF facility is expected to have the same layout and number of employeesregardless of the site selected, and as all five potential sites are near one another with similarclimatic conditions, all HMF alternatives will use the same amount of water.
Alignments
PB evaluated existing land use information for each of the three track alternatives. Thepredominant land use (60%-70%) for each of the alignments is agricultural. Other identifiedland uses include single family residential, multi-family residential, commercial, industrial, andlandscape irrigation. PB utilized the FUWMP land use factors for determining the water usagefor the land areas identified as being used for single family residential, multi-family residential,commercial, industrial, and landscape irrigation purposes.
As part of our evaluation to determine an appropriate agricultural usage factor for this section,PB reviewed two California Department of Water Resources (DWR) documents that containeddetailed water usage information for specific crops. The first document entitled “Crop WaterUse in California”, Bulletin 113-4, April 1986, contained specific water use for individual crops.This Bulletin provided County-specific data to allow us to utilize specific rates for Madera,

6
Merced, and Fresno counties. Water use varies from 1.1 ac-ft/ac/year for grain to 6.7 ac-ft/ac/year for rice. The average for all crops was 3.8 ac-ft/ac/year for Merced County, 3.6 ac-ft/ac/year for Madera County, and 3.7 ac-ft/ac/year for Fresno County.
A second document we referenced is DWR’s 2001 crop usage water rates table (included inAppendix A to this TM). This document also provides specific crop water usage rates byCounty. The data in the 2001 table shows a slight overall reduction in average water use from1986. In this 2001 table, water use varies from 1.4 ac-ft/ac/year for grain to 5.6 ac-ft/ac/yearfor rice. Average crop water usage rates by County are:
Madera County - 3.5 ac-ft/ac/year;
Merced County - 3.3 ac-ft/ac/year;
Fresno County - 3.4 ac-ft/ac/year.
As we were not able to determine the breakdown of specific crop type for each alignmentalternative, we applied the County specific average crop water usage rates from the DWR’s2001 Table information to the total agriculture land area each alignment alternative footprintwould cover in each County to calculate the water usage for the alignment footprint througheach County. Much of the farm land has gone out of production over the past several years. Toaccount for the agricultural land being taken out of service, we applied a 10% reduction factorto the total areas of agricultural land for each alignment.
HMF sites – PB attempted to obtain specific water use information from representatives foreach of the potential HMF sites. Mr. Jim Pichner with Merced County was able to providespecific water usage data for the Castle Commerce Center, which we used to estimate currentwater usage at the potential HMF site. Bobby Kahn from the Madera County EconomicDevelopment Commission (Fagundes, Kojima, and Gordon-Shaw sites), and Russell Harris, thelandowner for the Harris-DeJager site, provided information regarding the specific crops grownat each site (plus dairy usage in the case of one site), and water supply source information foreach of these sites. For these sites, we utilized DWR crop water usage data, by County,(included in the Appendix) to identify the specific agricultural water use factor for each specificcrop grown at each site. PB then applied these specific water use factors to the different HMFsite locations and generated estimated existing annual water usage for each of these sites. Theinformation for each potential HMF site is summarized below.
Fagundes - the Fagundes site is currently occupied by an active dairy operation (20%) andcorn (80%) grown for feed silage. PB estimated the water use associated with growing thecorn based on the DWR crop use data. PB estimated the water use associated with the dairyby estimating the number of cows (61 cows for 154 acres) and assuming an average waterdemand of 45 gallons/day for milking cows. The dairy operation is currently supplied by on-site groundwater wells. The corn is irrigated with water from the Chowchilla IrrigationDistrict. Based on the DWR crop water use data, the water use factor we used for growingcorn is 2.9 ac-ft/ac/yr.
Kojima - the Kojima site is currently used for almond orchards. The water supply for this siteis split equally between private groundwater wells and the Chowchilla Irrigation District.Based on the DWR data, the water usage for growing almonds is 3.7 ac-ft/ac/yr.
7
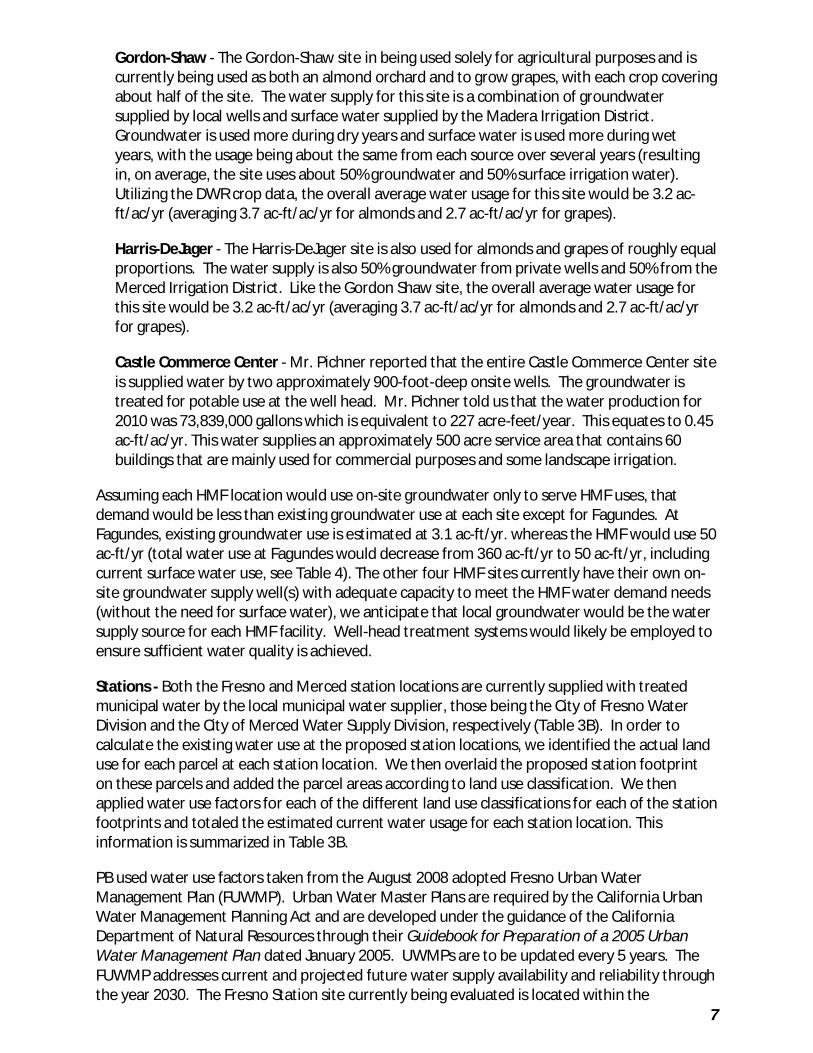
Gordon-Shaw - The Gordon-Shaw site in being used solely for agricultural purposes and iscurrently being used as both an almond orchard and to grow grapes, with each crop coveringabout half of the site. The water supply for this site is a combination of groundwatersupplied by local wells and surface water supplied by the Madera Irrigation District.Groundwater is used more during dry years and surface water is used more during wetyears, with the usage being about the same from each source over several years (resultingin, on average, the site uses about 50% groundwater and 50% surface irrigation water).Utilizing the DWR crop data, the overall average water usage for this site would be 3.2 ac-ft/ac/yr (averaging 3.7 ac-ft/ac/yr for almonds and 2.7 ac-ft/ac/yr for grapes).
Harris-DeJager - The Harris-DeJager site is also used for almonds and grapes of roughly equalproportions. The water supply is also 50% groundwater from private wells and 50% from theMerced Irrigation District. Like the Gordon Shaw site, the overall average water usage forthis site would be 3.2 ac-ft/ac/yr (averaging 3.7 ac-ft/ac/yr for almonds and 2.7 ac-ft/ac/yrfor grapes).
Castle Commerce Center - Mr. Pichner reported that the entire Castle Commerce Center siteis supplied water by two approximately 900-foot-deep onsite wells. The groundwater istreated for potable use at the well head. Mr. Pichner told us that the water production for2010 was 73,839,000 gallons which is equivalent to 227 acre-feet/year. This equates to 0.45ac-ft/ac/yr. This water supplies an approximately 500 acre service area that contains 60buildings that are mainly used for commercial purposes and some landscape irrigation.
Assuming each HMF location would use on-site groundwater only to serve HMF uses, thatdemand would be less than existing groundwater use at each site except for Fagundes. AtFagundes, existing groundwater use is estimated at 3.1 ac-ft/yr. whereas the HMF would use 50ac-ft/yr (total water use at Fagundes would decrease from 360 ac-ft/yr to 50 ac-ft/yr, includingcurrent surface water use, see Table 4). The other four HMF sites currently have their own on-site groundwater supply well(s) with adequate capacity to meet the HMF water demand needs(without the need for surface water), we anticipate that local groundwater would be the watersupply source for each HMF facility. Well-head treatment systems would likely be employed toensure sufficient water quality is achieved.
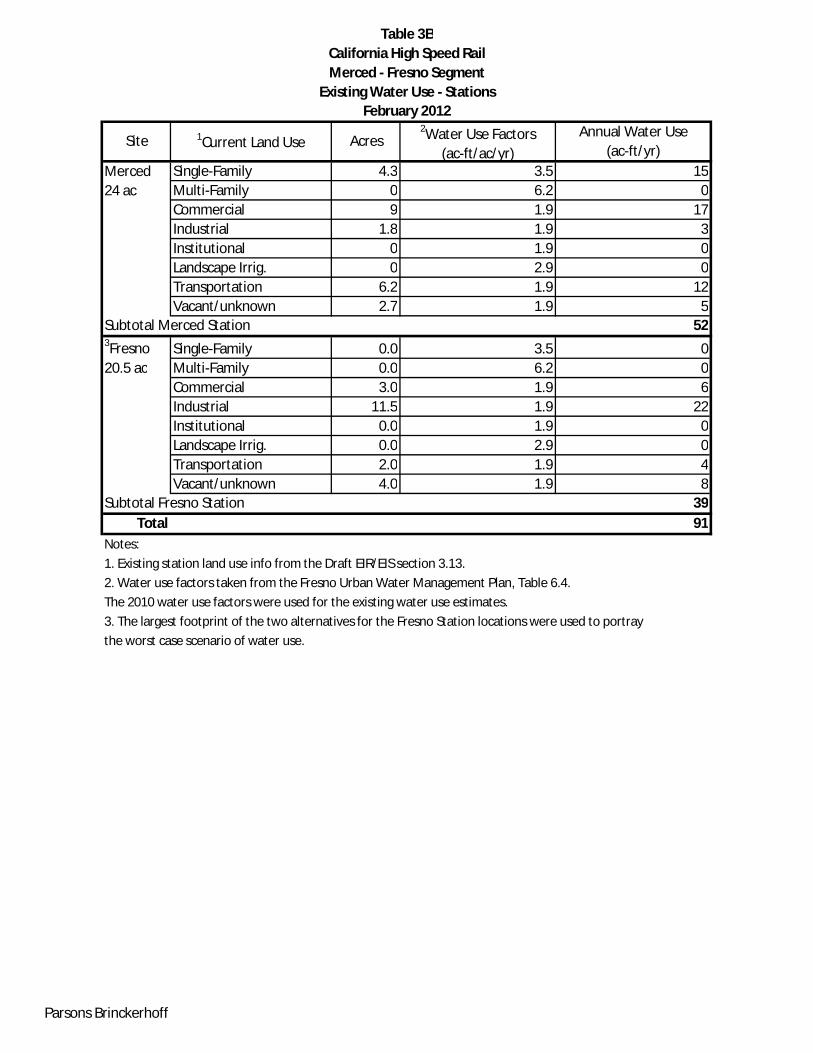
Stations - Both the Fresno and Merced station locations are currently supplied with treatedmunicipal water by the local municipal water supplier, those being the City of Fresno WaterDivision and the City of Merced Water Supply Division, respectively (Table 3B). In order tocalculate the existing water use at the proposed station locations, we identified the actual landuse for each parcel at each station location. We then overlaid the proposed station footprinton these parcels and added the parcel areas according to land use classification. We thenapplied water use factors for each of the different land use classifications for each of the stationfootprints and totaled the estimated current water usage for each station location. Thisinformation is summarized in Table 3B.
PB used water use factors taken from the August 2008 adopted Fresno Urban WaterManagement Plan (FUWMP). Urban Water Master Plans are required by the California UrbanWater Management Planning Act and are developed under the guidance of the CaliforniaDepartment of Natural Resources through their Guidebook for Preparation of a 2005 UrbanWater Management Plan dated January 2005. UWMPs are to be updated every 5 years. TheFUWMP addresses current and projected future water supply availability and reliability throughthe year 2030. The Fresno Station site currently being evaluated is located within the

8
geographical area covered by the FUWMP. The FUWMP provides land use-based waterdemand projections for single family residential, multi-family residential,commercial/institutional, industrial, landscape irrigation uses. The UWMP for Merced has notbeen updated since 2005, and does reflect new guidance developed by the DWR and the wateruse factors it reports are higher than those in the FUWMP. Therefore, we are using the waterdemand factors from the Fresno UWMP for Merced, and otherwise as appropriate, to calculateexisting water use as the Fresno numbers are more conservative and more recent. The FUWMPincludes water use rates for 2005, 2010, and 2025. PB used the 2010 water use rates toestimate current water usage. Mike Carbajal, from the City of Fresno, confirmed to PB on May3, 2011, that Fresno would supply water to the station. It will be necessary to file a formalapplication for service with the City of Fresno. Kim Nutt, from the City of Merced, confirmed toPB on April 20, 2011, that Merced would supply water to the station. As with Fresno, it will benecessary to file a formal application for service with the City of Merced.
Comparison of existing water usage to estimated future demandThis section compares the estimated existing water usage at each facility location and trackalignment to the future estimated water demand for the future facilities.
Fresno Station – current estimated water usage is 39 ac-ft/yr and estimated futuredemand is 47 ac-ft/year.
Merced Station – current estimated water usage is 52 ac-ft/yr and estimated futuredemand is 15 ac-ft/yr.
Tracks alignments – Estimated existing water usage for the uses being displaced by thealignments ranged from 4892 ac-ft/yr to 6703 ac-ft/yr. We do not anticipate any waterusage associated with any of the three alignments (the alignments will consist solely oftrack, switches and other unmanned equipment). There will be no demand for waterfor landscaping, operation, or maintenance along the track alignment.
HMFs – current estimated water usage for the five HMF locations ranges from 69 ac-ft/year (CCC) to 568 ac-ft/yr (Kojima). Estimated future water demand, regardless of theHMF location, is 50 ac-ft/yr.
Water supply to serve construction
Table 2 provides estimated construction water use for concrete work, earthwork, dust control,and irrigation for reseeded areas for the HMF and UPRR/SR99 and BNSF track alignments.CH2M Hill provided the water use for the Hybrid alignment separately and will incorporate thisinformation into future revisions of the Draft EIR/EIS.
Since this table did not include values for the Merced and Fresno stations the water use volumefor earthwork, dust control, and irrigation was estimated using the rate for the 154 acre HMFsite and scaling it down for the 24 acre Merced station and 20.5 acre Fresno station sites. Thismethodology was not used for estimating the concrete work for the stations as it is notcomparable to the percentage of concrete work on the HMF site. In order to estimate thewater used during construction for concrete work for the Merced and Fresno stations weconsulted with our Senior Structural Engineer, Ali Seyedmadani, PE, PhD. Dr. Seyedmadaniused the 15% Station Plans as a reference and estimated the water required based on hisestimation of the concrete volume from the elevation drawings and area of structure footprint.
9
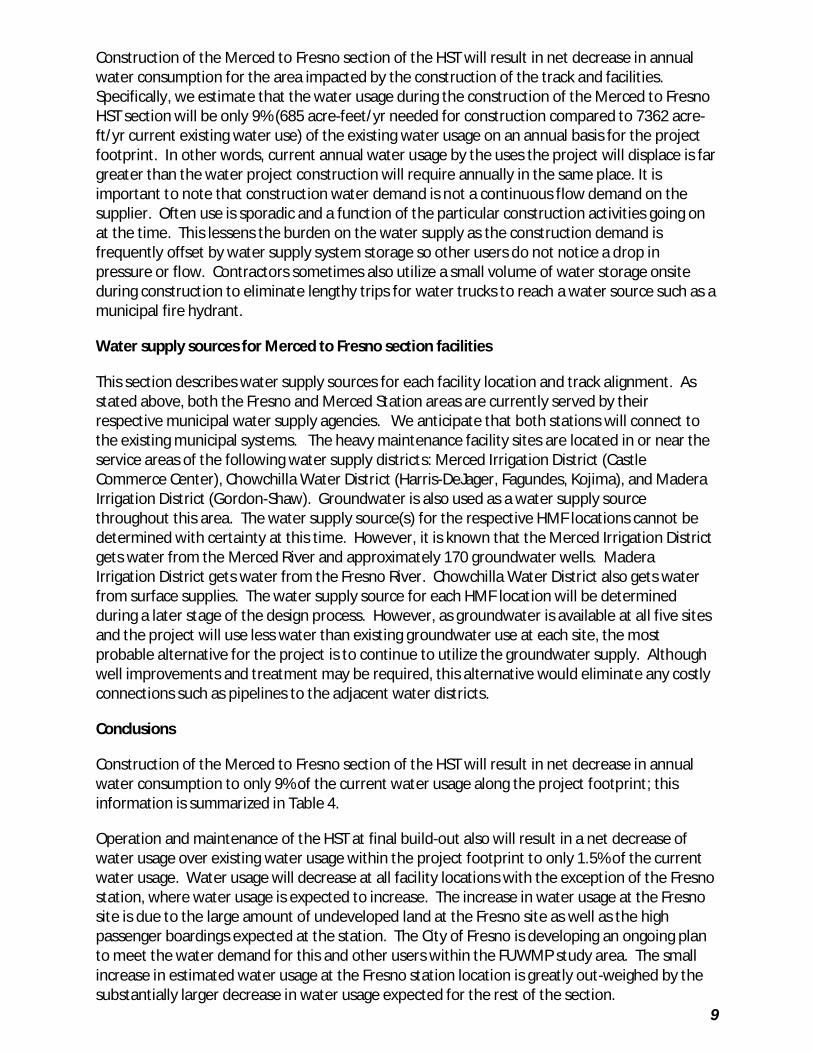
Construction of the Merced to Fresno section of the HST will result in net decrease in annualwater consumption for the area impacted by the construction of the track and facilities.Specifically, we estimate that the water usage during the construction of the Merced to FresnoHST section will be only 9% (685 acre-feet/yr needed for construction compared to 7362 acre-ft/yr current existing water use) of the existing water usage on an annual basis for the projectfootprint. In other words, current annual water usage by the uses the project will displace is fargreater than the water project construction will require annually in the same place. It isimportant to note that construction water demand is not a continuous flow demand on thesupplier. Often use is sporadic and a function of the particular construction activities going onat the time. This lessens the burden on the water supply as the construction demand isfrequently offset by water supply system storage so other users do not notice a drop inpressure or flow. Contractors sometimes also utilize a small volume of water storage onsiteduring construction to eliminate lengthy trips for water trucks to reach a water source such as amunicipal fire hydrant.
Water supply sources for Merced to Fresno section facilities
This section describes water supply sources for each facility location and track alignment. Asstated above, both the Fresno and Merced Station areas are currently served by theirrespective municipal water supply agencies. We anticipate that both stations will connect tothe existing municipal systems. The heavy maintenance facility sites are located in or near theservice areas of the following water supply districts: Merced Irrigation District (CastleCommerce Center), Chowchilla Water District (Harris-DeJager, Fagundes, Kojima), and MaderaIrrigation District (Gordon-Shaw). Groundwater is also used as a water supply sourcethroughout this area. The water supply source(s) for the respective HMF locations cannot bedetermined with certainty at this time. However, it is known that the Merced Irrigation Districtgets water from the Merced River and approximately 170 groundwater wells. MaderaIrrigation District gets water from the Fresno River. Chowchilla Water District also gets waterfrom surface supplies. The water supply source for each HMF location will be determinedduring a later stage of the design process. However, as groundwater is available at all five sitesand the project will use less water than existing groundwater use at each site, the mostprobable alternative for the project is to continue to utilize the groundwater supply. Althoughwell improvements and treatment may be required, this alternative would eliminate any costlyconnections such as pipelines to the adjacent water districts.
Conclusions
Construction of the Merced to Fresno section of the HST will result in net decrease in annualwater consumption to only 9% of the current water usage along the project footprint; thisinformation is summarized in Table 4.
Operation and maintenance of the HST at final build-out also will result in a net decrease ofwater usage over existing water usage within the project footprint to only 1.5% of the currentwater usage. Water usage will decrease at all facility locations with the exception of the Fresnostation, where water usage is expected to increase. The increase in water usage at the Fresnosite is due to the large amount of undeveloped land at the Fresno site as well as the highpassenger boardings expected at the station. The City of Fresno is developing an ongoing planto meet the water demand for this and other users within the FUWMP study area. The smallincrease in estimated water usage at the Fresno station location is greatly out-weighed by thesubstantially larger decrease in water usage expected for the rest of the section.

10
References
American Water Works Association (AWWA), Manual of Water Supply Practices M50, 2001
Bay Area Rapid Transit (BART), Hayward Maintenance Facility – Water Use Per Employee.
City of Fresno, Urban Water Management Plan, West Yost Associates, August 2008.
California Department of Water Resources (DWR), Crop Water Use in California, Bulletin 113-4,April 1986.
California Department of Water Resources (DWR), Crop Water Use (DWR website), 2001.
California High Speed Train Project - Merced to Fresno Section EIR/EIS (draft), California HighSpeed Rail Authority, 2010.
California High Speed Train Project – Station Drawings – 15% Draft – Fresno to Bakersfield,December, 2010.
California High Speed Train Project – Station Design – 15% Design In Progress Submittal –Merced to Fresno, October, 2010.
Draft Water Usage Analysis for CHST Fresno to Bakersfield Section – Technical Memorandum,URS, February 14, 2012.
Drawdown Calculations for 25 GPM Well in Chowchilla Area, Fritz Carlson – CH2M Hill,November 10, 2010.
Los Angeles World Airports - Plumbing Criteria, Syska Hennessy.
Los Angeles International Airport Terminals Water Demand Master Plan, 2005.
Merced HSR Station – Space Program, California High Speed Rail Authority, 2010.
Operations and Service Plan Summary, California High Speed Rail Authority, December 27,2010.
Power Demand, Water, and Sewage Demand for Central Valley High Speed Train Stations, KateKing – ARUP, August 6, 2010.
Water Supply and Pollution Control, 4th ed., Viessman Jr, Warren and Hammer, Mark J, 1985.
Western Farm Press, California’s Water Supply and Demand, UC Davis, February 26, 2010.

Appendix


1. EIR/EIS 0 24 35,618 402. BART data 0 30 45,000 503. AWWA 0 137 206,209 231Selected Value 45,000 501. EIR/EIS Station 3700 4 Landscaping 2300 3Total Consumption 72. Office 44,070 150 0 6611 7 Concourse 117,417 20 0 2348 3 Landscaping 0 0 2300 3Total Consumption by Area 13
5 gal/passenger 30 gal/employee
13,720 15
Selected Value 13,720 151. EIR/EIS Station 5500 6 Landscaping 2300 3Total Consumption 92. Office 44,070 150 0 6611 7 Concourse 117,417 20 0 2348 3 Landscaping 0 0 2300 3Total Consumption by Area 13
5 gal/passenger 30 gal/employee
42,240 47
Selected Value 42,240 47Total 113Notes:1. HMF water consumption would be the same regardless of which location is selected.2. HMF water consumption includes industrial, landscaping, and train washing uses.3. Selected value for HMF is based on actual data from a comparable facility.4. Selected value for stations is based on the methodology that resulted in the highest use.5. Footprint areas used in this table were taken from the "Merced HSR Station - Space Program" document. Fresno station will have similar areas.6. Maintenance of Way facility and Traction Power Supply Station were not included due to negligible water use.
7. EIR/EIS values for the Merced and Fresno Station were taken from Table 3.6-20 in the Draft EIR/EIS.
3. Common Use Factors Total Consumption by Person
3. Common Use Factors Total Consumption by Person
Heavy Maintenance Facility
Merced Station
2600 passengers 24 employees
Fresno Station 8400 passengers 8 employees
Daily Employee and Passenger Use
1500 employees
Table 1
Annual Water Use (ac-ft/yr)
Use Factor
(gal/day/1000 ft2)Estimated Daily
Volume (gal/day)Facility Area
(sf)
California High Speed RailMerced - Fresno SegmentWater Demand Summary
February 2012
Use Factor (gal/cap/day)
Facility Method
Parsons Brinckerhoff
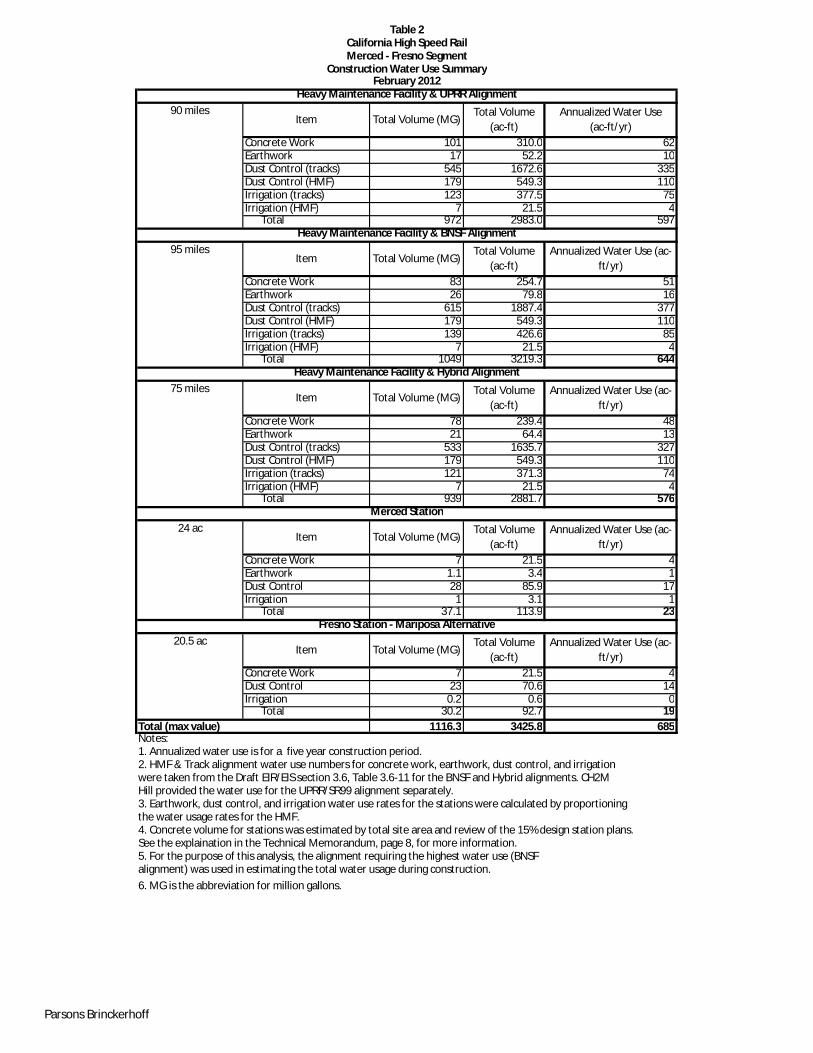
Concrete Work 101 310.0 62Earthwork 17 52.2 10Dust Control (tracks) 545 1672.6 335Dust Control (HMF) 179 549.3 110Irrigation (tracks) 123 377.5 75Irrigation (HMF) 7 21.5 4
Total 972 2983.0 597
Concrete Work 83 254.7 51Earthwork 26 79.8 16Dust Control (tracks) 615 1887.4 377Dust Control (HMF) 179 549.3 110Irrigation (tracks) 139 426.6 85Irrigation (HMF) 7 21.5 4
Total 1049 3219.3 644
Concrete Work 78 239.4 48Earthwork 21 64.4 13Dust Control (tracks) 533 1635.7 327Dust Control (HMF) 179 549.3 110Irrigation (tracks) 121 371.3 74Irrigation (HMF) 7 21.5 4
Total 939 2881.7 576
Concrete Work 7 21.5 4Earthwork 1.1 3.4 1Dust Control 28 85.9 17Irrigation 1 3.1 1
Total 37.1 113.9 23
Concrete Work 7 21.5 4Dust Control 23 70.6 14Irrigation 0.2 0.6 0
Total 30.2 92.7 19Total (max value) 1116.3 3425.8 685Notes:1. Annualized water use is for a five year construction period.2. HMF & Track alignment water use numbers for concrete work, earthwork, dust control, and irrigationwere taken from the Draft EIR/EIS section 3.6, Table 3.6-11 for the BNSF and Hybrid alignments. CH2MHill provided the water use for the UPRR/SR99 alignment separately.3. Earthwork, dust control, and irrigation water use rates for the stations were calculated by proportioningthe water usage rates for the HMF.4. Concrete volume for stations was estimated by total site area and review of the 15% design station plans.See the explaination in the Technical Memorandum, page 8, for more information.5. For the purpose of this analysis, the alignment requiring the highest water use (BNSFalignment) was used in estimating the total water usage during construction.
6. MG is the abbreviation for million gallons.
Total Volume(ac-ft)
Annualized Water Use (ac-ft/yr)
Fresno Station - Mariposa Alternative
Item Total Volume (MG)Total Volume
(ac-ft)Annualized Water Use (ac-
ft/yr)
20.5 ac
Heavy Maintenance Facility & BNSF Alignment
95 milesItem
Merced Station
Item Total Volume (MG)Total Volume
(ac-ft)Annualized Water Use (ac-
ft/yr)
24 ac
Annualized Water Use (ac-ft/yr)
Total Volume (MG)Total Volume
(ac-ft)
Heavy Maintenance Facility & Hybrid Alignment
75 milesItem Total Volume (MG)
Table 2
February 2012Construction Water Use Summary
Merced - Fresno SegmentCalifornia High Speed Rail
Total Volume (MG)Total Volume
(ac-ft)Annualized Water Use
(ac-ft/yr)
Heavy Maintenance Facility & UPRR Alignment
Item90 miles
Parsons Brinckerhoff

0
0
154 0.45 69
0
0
0Total 69
0 3.5 0
0 1.9 0
0 1.9 0
0 1.9 0
154 3.2 493
0 2.9 0Total 493
0 3.5 0
0 1.9 0
0 1.9 0
0 1.9 0
Dairy (20%) 154 See note below 3.1
123.2 2.9 357
0 2.9 0Total 360
0 3.5 0
0 1.9 0
15 1.9 29
0 1.9 0
138 3.2 442
1 2.9 3Total 473
0 3.5 0
0 1.9 0
0 1.9 0
0 1.9 0
152 3.7 562
2 2.9 6Total 568
Notes:
1. Includes agricultural land impacted by the connecting track to the Merced Station.
The 2010 water use factors were used for the existing water use estimates.
3. Agricultural water use factors for each site were weighted based on specific crop usage at each site.
4. Dairy water usage calculated by assuming 2.5 acres per cow and 45 gallons of water per day per cow.
Table 3A
Chowchilla Water District
February 2012Existing Water Use - Potential Heavy Maintenance Facilities
Merced - Fresno Segment
California High Speed Rail
Gordon-Shaw 364 acres
Fagundes 231 acres
Kojima 392 acres
Site
Castle Commerce
Center 370 acres
Current Land Use
Harris-DeJager
401 acres
Water Service Provider
Merced Irrigation District
Chowchilla Water District
Chowchilla Water District
Agricultural-Corn (80%)
Madera Irrigation District
Landscape Irrig.
Landscape Irrig.
Commercial
Industrial
Institutional
Agricultural
Single-Family
Single-Family
Commercial
Industrial
Institutional
Agricultural
Landscape Irrig.
Landscape Irrig.
Commercial
Industrial
Institutional
2. Water use factors taken from the Fresno Urban Water Management Plan, Table 6.4, DWR 2001 Crop Usage Water Rates Table, and in the case of Castle Commerce from actual groundwater well production records.
Annual Water Use (ac-ft/yr)
Single-Family
Commercial
Single-Family
Landscape Irrig.
Industrial
Institutional
Agricultural
Area Impacted by HMFWater Use Factors
(ac-ft/ac/yr)
Single-Family
Commercial
Industrial
Institutional
Agricultural
Parsons Brinckerhoff
Merced 4.3 3.5 1524 ac 0 6.2 0
9 1.9 171.8 1.9 3
0 1.9 00 2.9 0
6.2 1.9 122.7 1.9 5
Subtotal Merced Station 523Fresno 0.0 3.5 020.5 ac 0.0 6.2 0
3.0 1.9 611.5 1.9 22
0.0 1.9 00.0 2.9 02.0 1.9 44.0 1.9 8
Subtotal Fresno Station 39Total 91
Notes:
1. Existing station land use info from the Draft EIR/EIS section 3.13.
2. Water use factors taken from the Fresno Urban Water Management Plan, Table 6.4.
The 2010 water use factors were used for the existing water use estimates.
3. The largest footprint of the two alternatives for the Fresno Station locations were used to portray
the worst case scenario of water use.
Landscape Irrig.
Single-FamilyMulti-FamilyCommercialIndustrialInstitutional
TransportationVacant/unknown
TransportationVacant/unknown
Single-FamilyMulti-FamilyCommercialIndustrialInstitutionalLandscape Irrig.
Acres2Water Use Factors
(ac-ft/ac/yr)
Annual Water Use(ac-ft/yr)
Table 3BCalifornia High Speed RailMerced - Fresno Segment
Existing Water Use - StationsFebruary 2012
1Current Land UseSite
Parsons Brinckerhoff

36 3.2 11512 6.2 74
122 1.9 232247 1.9 469
59 1.9 1121079 3.5 3777
39 2.9 1134892
82 3.2 26278 6.2 48498 1.9 186
299 1.9 56863 1.9 120
1429 3.5 500228 2.9 81
670381 3.2 25975 6.2 46591 1.9 173
290 1.9 55158 1.9 110
1317 3.5 461037 2.9 107
6275Notes:
1. Includes agricultural land impacted by the connecting track to the Merced Station.
2. Only one of the three track alignment alternatives will be built.
3. Water use factors taken from the Fresno Urban Water Management Plan, Table 6.4.
The 2010 water use factors were used for the existing water use estimates.
4. Agricultural water use estimate taken from the Draft EIR/EIS section 3.6, page 3.6-38.
5. Track land use impacts averaged from values listed in the Draft EIR/EIS section 3.13, Table 3.13-1.
BNSF 95 miles
Hybrid 75 miles
InstitutionalAgriculturalLandscape Irrig.
AgriculturalInstitutional
AgriculturalLandscape Irrig.
Total
Landscape Irrig.Total
Single-FamilyMulti-FamilyCommercialIndustrial
TotalSingle-FamilyMulti-FamilyCommercialIndustrial
Single-FamilyMulti-Family
Table 3CCalifornia High Speed RailMerced - Fresno Segment
Existing Water Use - Track Alignment AlternativesFebruary 2012
AcresWater Use Factors
(ac-ft/ac/yr)Annual Water Use
(ac-ft/yr)UPRR
90 miles
Current Land UseAlt.
CommercialIndustrialInstitutional
Parsons Brinckerhoff
Facility Type Facility NameAnnual Water Use
(ac-ft)Existing Water Use
HMF Castle Commerce Center 69Harris-DeJager 493Fagundes 360Gordon-Shaw 473Kojima 568
Stations Merced 52Fresno 39
Track Alignment UPRR 4892BNSF 6703Hybrid 6275
Maximum Use Total 7362Construction Water Use
HMF + Track Alignment UPRR 597BNSF 644Hybrid 576
Stations Merced 23Fresno 19
Maximum Use Total 685Estimated Water Use - 2035 at 100% Build-outHMF (one location) 50
Stations Merced Station 15Fresno Station 47Total 113
Notes:
1. Maximum Use Total utilizes the facility alternative with the highest demand.
2. Construction water is annualized for a five year construction period.
3. Heavy Maintenance Facility water demand would be the same regardless of location.
Table 4California High Speed RailMerced - Fresno Segment
Water Use SummaryFebruary 2012
Parsons Brinckerhoff

Merced Madera FresnoGrain 1.1 1.2 1.3Rice 6.7 6.3Cotton 3.7 3.8 3.7Sugar Beets 3.7 3.7 3.8Corn 3.5 3.5 3.6Alfalfa 4.8 5.1 4.3Pasture 6.1 6.3 6.0Tomatoes 3.2 3.3 3.3Almond/Pistachio 2.6 2.8 2.7Other Deciduous 3.9 3.9 3.7Citrus/Olive 3.0 2.8 2.6Grapes 3.5 3.7 3.4Ave 3.8 3.6 3.7Note: Source of data: "Crop Water Use in California", Table 1, DWR, Bulletin 113-4, April 1986.
Merced Madera FresnoGrain 1.4 1.6 1.6Rice 5.5 5.6 5.5Cotton 3.1 3.5 3.0Sugar Beets 2.0 2.1 3.0Corn 2.6 2.9 3.0Alfalfa 5.0 4.9 4.9Pasture 4.7 4.7 4.8Tomatoes 3.1 3.2 2.5Almond/Pistachio 3.3 3.7 3.6Other Deciduous 3.6 3.8 3.9Citrus/Olive 2.9 3.1 3.0Grapes 2.2 2.7 2.5Ave 3.3 3.5 3.4Note: Source of data: DWR, 2001.
Crop Water UseMerced - Fresno SegmentCalifornia High Speed Rail
Table A1
Crop Annual Ave Unit Applied Water (ac-ft/ac/yr)
County
Crop
February 2012
CountyAnnual Ave Unit Applied Water (ac-ft/ac/yr)
Parsons Brinckerhoff
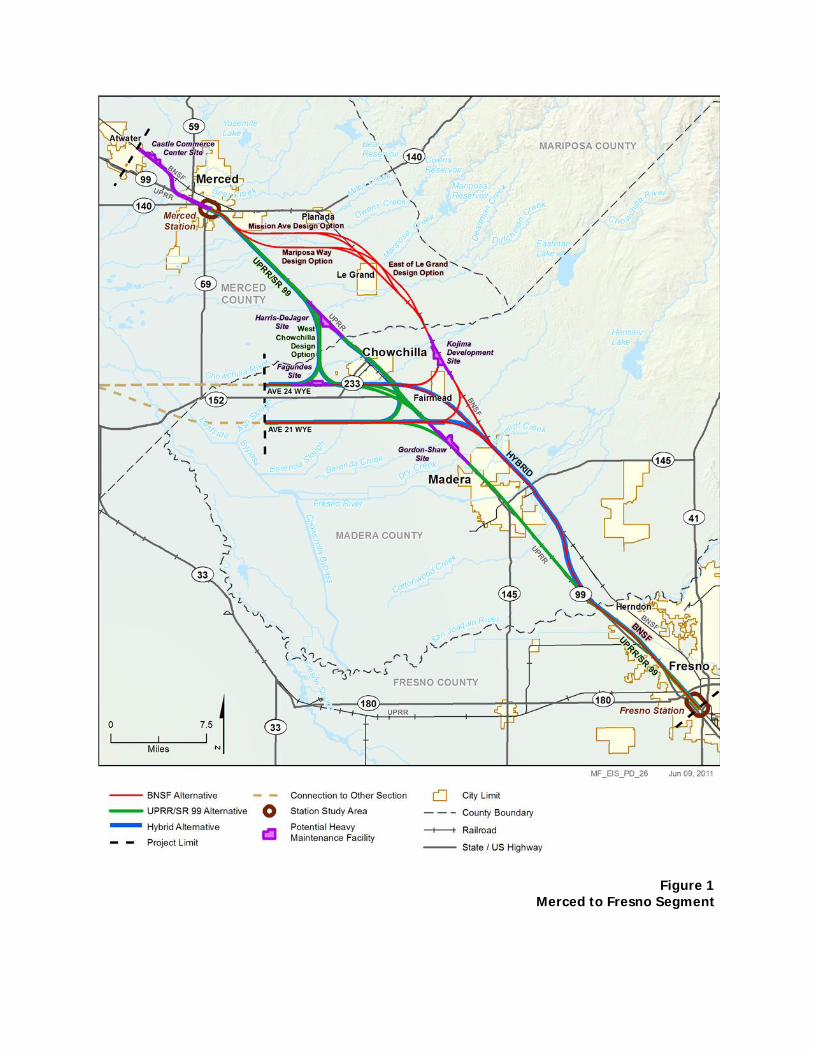
Figure 1 Merced to Fresno Segment
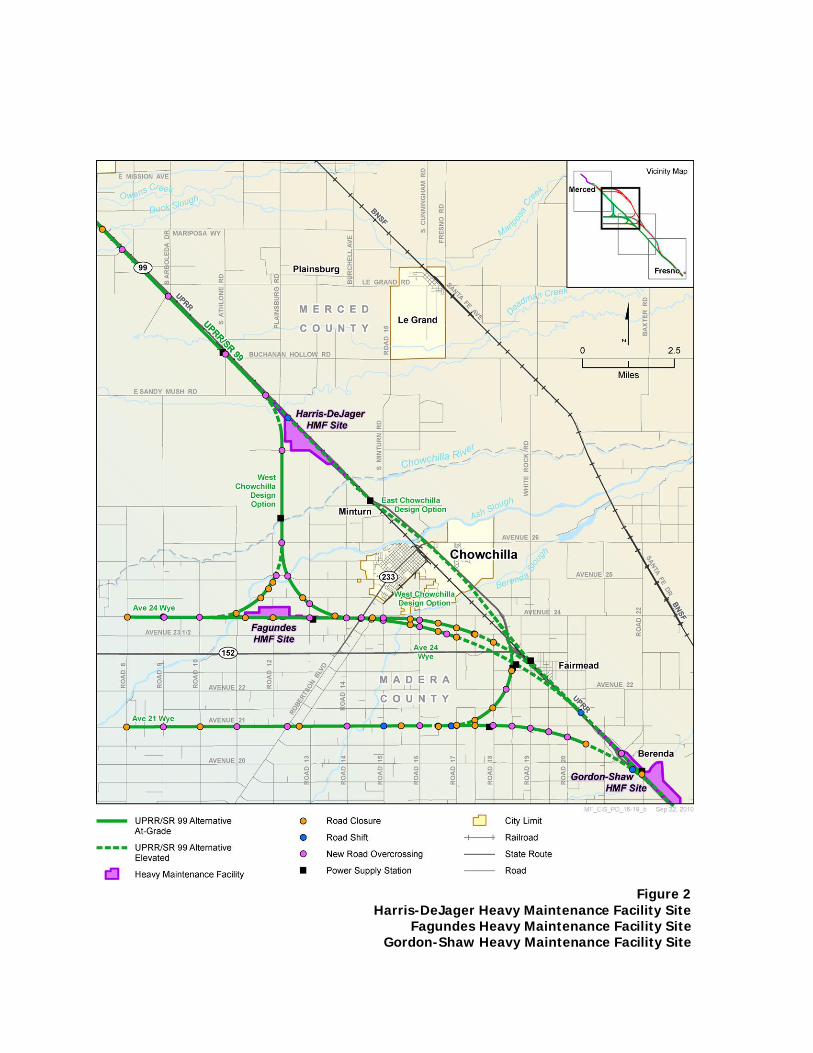
Figure 2 Harris-DeJager Heavy Maintenance Facility Site
Fagundes Heavy Maintenance Facility Site Gordon-Shaw Heavy Maintenance Facility Site
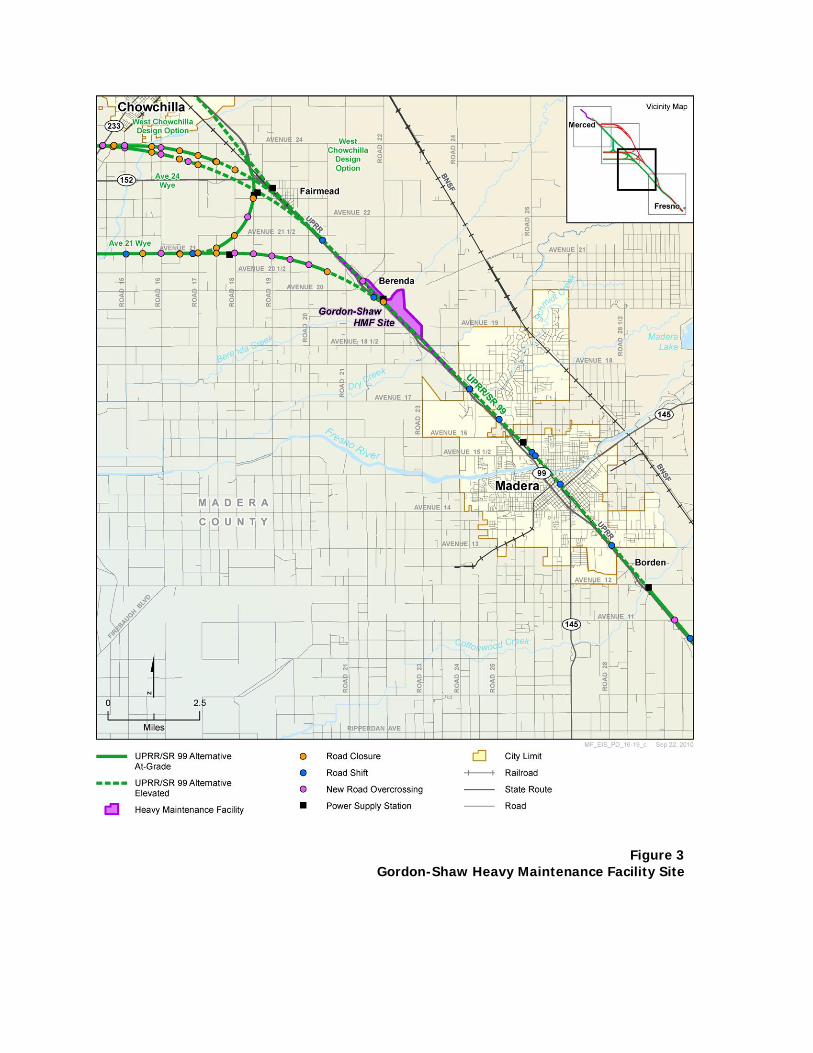
Figure 3 Gordon-Shaw Heavy Maintenance Facility Site

Figure 4 Castle Commerce Center Heavy Maintenance Facility Site

Figure 5 Proposed Harris-Dejager HMF Site Aerial View
Figure 6 Proposed Fagundes HMF Site Aerial View

Figure 7 Proposed Gordon-Shaw HMF Site Aerial View
Figure 8 Proposed Kojima Development HMF Site Aerial View

Figure 9 Proposed Castle Commerce Center HMF Site Aerial View

Figure 10 Merced Station Location

Figure 11 Existing Land Uses in the
Downtown Merced Station Area

Figure 12 Fresno Station Location

Figure 13 Existing Land Uses in the
Downtown Fresno Station Study Area


