Page 1
Page 1 of 2
Appendix 4D Half Year Report
APPENDIX 4D
RESULTS FOR ANNOUNCEMENT TO THE MARKET
Half Year Report
For the period ended 31 December 2015
Name of Entity: Shopping Centres Australasia Property Group (SCA Property Group). The SCA Property Group comprises Shopping Centres Australasia Property Group comprises Shopping Centres Australasia Property Management Trust ARSN 160 612 626 and Shopping Centres Australasia Property Retail Trust ARSN 160 612 788. The Responsible Entity of Shopping Centres Australasia Property Management Trust and Shopping Centres Australasia Property Retail Trust is Shopping Centres Australasia Property Group RE Limited (ABN 47 158 809 851; AFSL 426603).
6 months to 31 Dec 2015
6 months to 31 Dec 2014
Variance
$m $m
Revenue from ordinary activities 99.2 85.8 15.6%
Profit from ordinary activities after tax attributable to members
90.8 98.2 (7.5%)
Net profit for the period attributable to members
90.8 98.2 (7.5%)
Funds from Operations (FFO)1 48.8 37.8 29.1%
6 months to 31 Dec 2015
6 months to 31 Dec 2014
Variance
Earnings and Distribution per unit Cents per security
Cents per security
Basic earnings per security 12.5 15.1 (17.2%)
Weighted average FFO per security1 6.7 5.8 15.5%
Interim distribution (cents per security)
6.0 5.6 7.1%
Record Date for determining entitlement to distribution
31 Dec 2015 31 Dec 2014 na
Date on which distribution was paid 29 Jan 2016 30 Jan 2015 na
Amount per security of interim distribution franked (cents)
0.0 0.0 nc
Notes:
1. The Group reports net profit attributable to members in accordance with Australian Accounting
Standards (AAS). Funds from Operations (FFO) is a non-AAS measure that represents the Directors’
view of underlying earnings from ongoing operating activities for the period, being statutory net
profit/loss after tax adjusted to exclude certain items including unrealised gains and losses and non
recurring items.
For
per
sona
l use
onl
y
Page 2
Page 2 of 2
Net Tangible Assets
31 Dec 2015 31 Dec 2014 Variance $ $
Net tangible asset per security 1.85 1.73 6.9%
Details of entities over which control has been gained or lost during the period:
None.
Details of any associates and Joint Venture entities required to be disclosed:
On 1 October 2015 SCA Property Group acquired 24.4% of SCA Unlisted Retail Fund 1.
Refer note 9 of the attached Interim Financial Report for additional information.
Accounting standards used by foreign entities
International Financial Reporting Standards.
Audit
The accounts have been subject to a review with an unqualified review conclusion opinion.
Refer attached Interim Financial Report.
Distribution Reinvestment Plan (DRP)
The Group has a Distribution Reinvestment Plan (DRP) under which unitholders may elect to have all or part of their distribution entitlements satisfied by the issue of new units rather than being paid in cash. The DRP was activated for the distribution in respect of the half year ended 31 December 2015. In accordance with the DRP Rules, this issue price has been calculated as the arithmetic average of the daily volume weighted average price of all sales of Stapled Units sold through a Normal Trade recorded on ASX for the first 10 ASX Trading Days following the business day after the record date, less 1.0% (1.0% being the Board approved DRP discount for this distribution) and rounded to the nearest whole cent.
Other significant information and commentary on results
See attached ASX announcement and materials referred to below.
For all other information required by Appendix 4D, please refer to the following
attached documents:
Directors’ report
Interim Financial Report
Results presentation
Mark Lamb
Company Secretary
8 February 2016
For
per
sona
l use
onl
y
Page 3
Shopping Centres Australasia Property Group Interim Financial Report for the half year ended 31 December 2015
Shopping Centres Australasia Property Group comprises two real estate investment trusts being Shopping
Centres Australasia Property Management Trust (ARSN 160 612 626) and Shopping Centres Australasia
Property Retail Trust (ARSN 160 612 788). The Responsible Entity of Shopping Centres Australasia Property
Management Trust and Shopping Centres Australasia Property Retail Trust is Shopping Centres Australasia
Property Group RE Limited (ABN 47 158 809 851; AFSL 426603) (Responsible Entity). The Responsible Entity
is incorporated and domiciled in Australia. The registered office of the Responsible Entity is Level 5, 50 Pitt
Street, Sydney, New South Wales.
For
per
sona
l use
onl
y
Page 4
Shopping Centres Australasia Property Group Directors’ Report
For the half year ended 31 December 2015
1
Directors’ Report
Shopping Centres Australasia Property Group (SCA Property Group or the Group) was formed by the
stapling of the units in two Trusts, being Shopping Centres Australasia Property Management Trust
(Management Trust) (ARSN 160 612 626) and Shopping Centres Australasia Property Retail Trust
(Retail Trust) (ARSN 160 612 788) (collectively the Trusts) and their controlled entities.
The Responsible Entity of the Management Trust and the Retail Trust is Shopping Centres
Australasia Property Group RE Limited (ABN 47 158 809 851; AFSL 426 603) (Responsible Entity).
The Responsible Entity now presents the Interim Financial Report of the Group together with the
Interim Financial Report of the Retail Trust for the half year ended 31 December 2015.
In accordance with Accounting Standard AASB 3 Business Combinations, the arrangement discussed
above is regarded as a business combination and the Management Trust has been identified as the
Parent for preparing the Interim Financial Reports.
The Directors’ report is a combined Directors’ report that covers both the Group and the Retail Trust.
The financial information for the Group is taken from the Interim Financial Statements and notes.
1. Directors
The Directors of the Responsible Entity at any time during and up to the date of this report are:
Mr Philip Marcus Clark AM Non-Executive Director and Chairman Dr Kirstin Ferguson Non-Executive Director Mr James Hodgkinson Non-Executive Director Dr Ian Pollard Non-Executive Director Mr Philip Redmond Non-Executive Director Ms Belinda Robson Non-Executive Director Mr Anthony Mellowes Director and CEO Mr Mark Fleming Director and CFO The Company Secretary at any time during and up to the date of this report is Mark Lamb.
2. Principal activities
The principal activity of the Group during the period was investment in, and management of, shopping
centres in Australia and New Zealand.
3. Property portfolio
The investment portfolio as at 31 December 2015 consisted of 81 shopping centres in Australia and
New Zealand (30 June 2015: 82 shopping centres including 5 investment properties held for sale).
The portfolio is geographically diverse and spread across all six States in Australia and also in New
Zealand. It consists of sub-regional, neighbourhood and freestanding retail assets, with a strong
weighting toward non-discretionary retail segments.
For
per
sona
l use
onl
y
Page 5
Shopping Centres Australasia Property Group Directors’ Report
For the half year ended 31 December 2015
2
Investment properties - acquisitions
During the half year the Group completed 4 property acquisitions for $115.2m. Details of these
properties include:
Investment properties - disposals
During the period the Group established a funds management business initially comprising the
management of SCA Unlisted Fund No 1 (SURF 1). The Group identified a number of shopping
centre properties that it considers to be “non-core” because they are either freestanding stores or
have only one or two specialty stores. SURF 1 contains 5 of these non-core assets all located in New
South Wales, being Woolworths Fairfield, Woolworths Griffith North, Dan Murphy’s Burwood, Dan
Murphy’s Katoomba and Big W Inverell. The Group sold these properties to SURF 1 on 1 October
2015 for $60.9 million. These properties were classified for financial reporting purposes as held for
sale at 30 June 2015.
Revaluations
During the half year ended 31 December 2015 independent valuations were completed for 18
investment properties, including both Australian and New Zealand investment properties. In addition
all of the properties acquired (4) during the period were also independently valued. All of the
remaining investment properties were internally valued. The weighted average capitalisation rate as
at 31 December 2015 was 7.28% (30 June 2015: 7.49%).
Australian property
The total value of Australian investment properties as at 31 December 2015 was $1,840.5 million (30
June 2015: $1,687.4 million). The change in value during the half year of the Australian investment
properties was due principally to:
- The acquisition of the properties discussed above at Investment properties – acquisitions.
- Firming of the Australian portfolio average weighted capitalisation rate by 16bps to 7.32% (30
June 2015: 7.48%) which resulted in a $21.8 million favourable unrealised fair value movement
(30 June 2015: $61.7 million).
Property Type State Settlement Date Cost 1
Value at
31 December
2015
$'m $'m
Griffin Plaza Neighbourhood NSW Sep-15 23 23
Marian Town Centre Neighbourhood QLD Nov-15 32 32
Northgate Neighbourhood NSW Dec-15 14.8 14.8
Wonthaggi Neighbourhood VIC Dec-15 45.4 45.4
115.2 115.2
1. Cost excludes transactions costs of $8.5m
For
per
sona
l use
onl
y
Page 6
Shopping Centres Australasia Property Group Directors’ Report
For the half year ended 31 December 2015
3
New Zealand property
The total value of New Zealand investment properties as at 31 December 2015 was A$235.6 million
(30 June 2015: A$208.0 million). The change in value of the New Zealand investment properties was
due principally to:
- Firming of the New Zealand portfolio average weighted capitalisation rate by 64 bps to 6.92% (30
June 2015: 7.56%) which resulted in $16.2 million favourable unrealised fair value movement (30
June 2015: $6.2 million).
- Favourable unrealised exchange rate movements of $11.0 million (30 June 2015: unfavourable
$9.0 million).
Summary
1 NZD converted to AUD for 31 December 2015 at AUD 1.00 = NZD 1.065 (30 June 2015 at AUD 1.00 = NZD 1.122).
4. Operating and financial review
Operational review: The Group remains focused on:
- Specialty tenant management: this includes maximising specialty occupancy while ensuring
that the retail shopping properties secure the right tenant for the right location in order to create a
sustainable and long-term tenant mix to optimise the performance of the portfolio.
- Property management: this includes appropriate capital expenditure programs to maximise
sales turnover and occupancy.
- Portfolio management: this includes the acquisition of suitable properties that will add to the
Group’s ability to provide a solid income base to support distributions including selective
developments and refurbishments to provide an opportunity for greater growth of earnings.
- Capital management: investment returns are managed and where applicable maximised
through prudent and disciplined capital management. This includes consideration of:
o Debt management: Maintaining diversified debt maturity and sources of debt.
o Equity management: Maintaining the ability to raise equity from retail and institutional
investors.
Number $m Number $m
Investment properties
- Australia 67 1,840.5 63 1,687.4
- New Zealand1 14 235.6 14 208.0
81 2,076.1 77 1,895.4
Investment properties held for sale - - 5 60.9
Total investment property value 81 2,076.1 82 1,956.3
31 December 2015 30 June 2015
For
per
sona
l use
onl
y
Page 7
Shopping Centres Australasia Property Group Directors’ Report
For the half year ended 31 December 2015
4
Financial review: A summary of the Group and the Retail Trust’s results for the period is set out
below:
Measurement of results
The Group reports net profit after tax (statutory) attributed to unitholders in accordance with Australian
Accounting Standards (AAS). The Responsible Entity considers the non-AAS measures, Funds from
Operations and Distributable Earnings, important indicators of the underlying earnings of the Group.
Funds from Operations and Distributable Earnings are explained below.
Funds from Operations: In June 2013 the Property Council of Australia (PCA) released a White
Paper titled “Voluntary Best Practice Guidelines for Disclosing FFO and AFFO”. The White Paper set
out principles for determining Property Council Funds from Operations (FFO) and Property Council
Adjusted Funds from Operations (AFFO). From 1 July 2014 the Group has measured its non-
Australian Accounting Standard performance against both Distributable Earnings and FFO. The
Group also reports its AFFO.
Distributable Earnings: Is the basis upon which distributions are determined by the Directors having
regard to the guidance in ASIC’s RG 230 ‘Disclosing non IFRS financial information’ (RG 230). A
reconciliation between the statutory profit, Distributable Earnings and FFO is provided below.
Distributable Earnings represents the Directors’ view of underlying earnings from ongoing operating
activities for the half year, being FFO adjusted for recurring cash items that are not otherwise included
in FFO.
The table below provides a reconciliation from the net profit after tax to FFO, Distributable Earnings
and AFFO.
31 Dec 2015 31 Dec 2014 31 Dec 2015 31 Dec 2014
Net profit after tax ($m) 90.8 98.2 90.1 98.2
Distributable earnings ($m) 48.8 41.1 48.1 41.1
Distributions paid and payable to unitholders
($m)43.5 36.3 43.5 36.3
Basic earnings per unit for net profit after tax
(cents per unit)12.5 15.1 12.4 15.1
Diluted earnings per unit for net profit after tax
(cents per unit)12.5 15.1 12.4 15.1
Weighted Ave Funds from Operations (cents
per unit)6.7 5.8 6.6 5.8
Weighted Ave Distributable earnings (cents per
unit)6.7 6.3 6.7 6.3
Distributions (cents per unit) 6.0 5.6 6.0 5.6
Net tangible assets ($m) 1,341.0 1,123.9 1,333.1 1,119.2
Net tangible assets ($ per unit) 1.85 1.73 1.84 1.73
SCA Property Group Retail Trust
For
per
sona
l use
onl
y
Page 8
Shopping Centres Australasia Property Group Directors’ Report
For the half year ended 31 December 2015
5
Distributable Earnings for the half year to 31 December 2015 increased from $41.1 million (31
December 2014) to $48.8 million primarily due to additional property income from acquisitions, growth
in comparable net operating income and a lower weighted average cost of debt.
31 Dec 2015 31 Dec 2014 31 Dec 2015 31 Dec 2014
$m $m $m $m
Net profit after tax (statutory) 90.8 98.2 90.1 98.2
Adjustments for non cash items included
in statutory profit
Reverse: Straight-lining of rental income
and amortisation of incentives(1.0) (3.1) (1.0) (3.1)
Reverse: Fair value unrealised
adjustments
- Investment properties (38.0) (46.8) (38.0) (46.8)
- Derivatives (14.4) (38.3) (14.4) (38.3)
- Share of net profit from
investments accounted for using
the equity method
(0.2) - (0.2) -
- Foreign exchange losses
unrealised11.4 23.1 11.4 23.1
- Other financial assets (rent
guarantee)- 2.4 - 2.4
Other (includes transaction costs and
non cash write-off of upfront debt fees
following the debt refinancing)
- 2.3 - 2.3
Add: Distribution received / receivable
from equity accounted for investment0.2 - 0.2 -
Funds from Operations 48.8 37.8 48.1 37.8
Other adjustments
Add: Cash received / receivable from
rental guarantee- 4.5 - 4.5
Less: Structural vacancy allowance - (1.2) - (1.2)
Distributable Earnings 48.8 41.1 48.1 41.1
Less: Maintenance capital expenditure (0.9) (0.5) (0.9) (0.5)
Less: Capital leasing incentives and
leasing costs(2.1) (3.5) (2.1) (3.5)
Adjusted Funds from Operations 45.8 37.1 45.1 37.1
SCA Property Group Retail Trust
For
per
sona
l use
onl
y
Page 9
Shopping Centres Australasia Property Group Directors’ Report
For the half year ended 31 December 2015
6
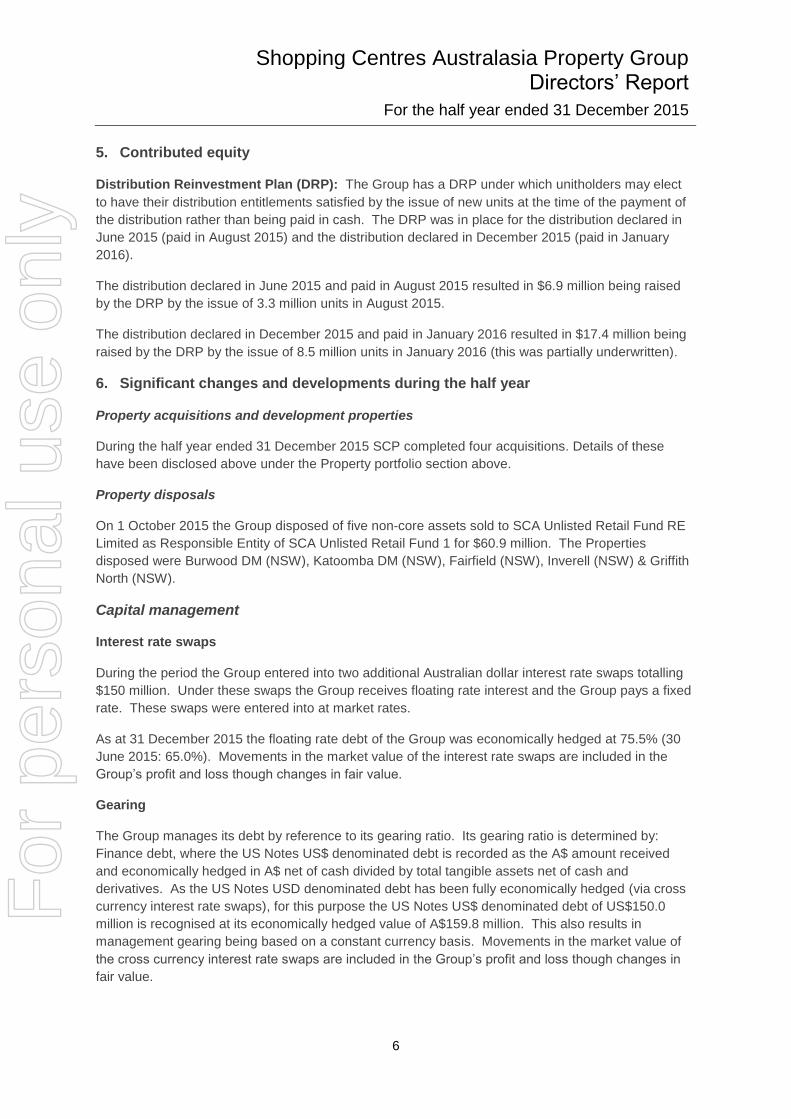
5. Contributed equity
Distribution Reinvestment Plan (DRP): The Group has a DRP under which unitholders may elect
to have their distribution entitlements satisfied by the issue of new units at the time of the payment of
the distribution rather than being paid in cash. The DRP was in place for the distribution declared in
June 2015 (paid in August 2015) and the distribution declared in December 2015 (paid in January
2016).
The distribution declared in June 2015 and paid in August 2015 resulted in $6.9 million being raised
by the DRP by the issue of 3.3 million units in August 2015.
The distribution declared in December 2015 and paid in January 2016 resulted in $17.4 million being
raised by the DRP by the issue of 8.5 million units in January 2016 (this was partially underwritten).
6. Significant changes and developments during the half year
Property acquisitions and development properties
During the half year ended 31 December 2015 SCP completed four acquisitions. Details of these
have been disclosed above under the Property portfolio section above.
Property disposals
On 1 October 2015 the Group disposed of five non-core assets sold to SCA Unlisted Retail Fund RE
Limited as Responsible Entity of SCA Unlisted Retail Fund 1 for $60.9 million. The Properties
disposed were Burwood DM (NSW), Katoomba DM (NSW), Fairfield (NSW), Inverell (NSW) & Griffith
North (NSW).
Capital management
Interest rate swaps
During the period the Group entered into two additional Australian dollar interest rate swaps totalling
$150 million. Under these swaps the Group receives floating rate interest and the Group pays a fixed
rate. These swaps were entered into at market rates.
As at 31 December 2015 the floating rate debt of the Group was economically hedged at 75.5% (30
June 2015: 65.0%). Movements in the market value of the interest rate swaps are included in the
Group’s profit and loss though changes in fair value.
Gearing
The Group manages its debt by reference to its gearing ratio. Its gearing ratio is determined by:
Finance debt, where the US Notes US$ denominated debt is recorded as the A$ amount received
and economically hedged in A$ net of cash divided by total tangible assets net of cash and
derivatives. As the US Notes USD denominated debt has been fully economically hedged (via cross
currency interest rate swaps), for this purpose the US Notes US$ denominated debt of US$150.0
million is recognised at its economically hedged value of A$159.8 million. This also results in
management gearing being based on a constant currency basis. Movements in the market value of
the cross currency interest rate swaps are included in the Group’s profit and loss though changes in
fair value.
For
per
sona
l use
onl
y
Page 10
Shopping Centres Australasia Property Group Directors’ Report
For the half year ended 31 December 2015
7
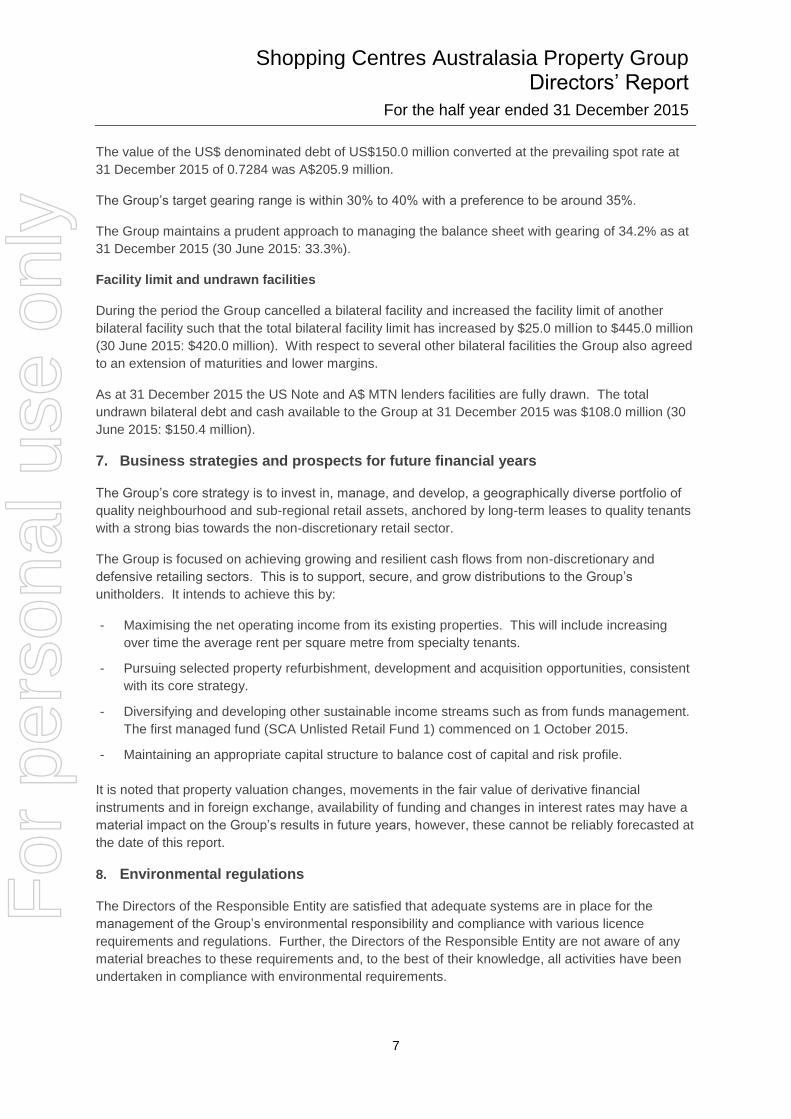
The value of the US$ denominated debt of US$150.0 million converted at the prevailing spot rate at
31 December 2015 of 0.7284 was A$205.9 million.
The Group’s target gearing range is within 30% to 40% with a preference to be around 35%.
The Group maintains a prudent approach to managing the balance sheet with gearing of 34.2% as at
31 December 2015 (30 June 2015: 33.3%).
Facility limit and undrawn facilities
During the period the Group cancelled a bilateral facility and increased the facility limit of another
bilateral facility such that the total bilateral facility limit has increased by $25.0 million to $445.0 million
(30 June 2015: $420.0 million). With respect to several other bilateral facilities the Group also agreed
to an extension of maturities and lower margins.
As at 31 December 2015 the US Note and A$ MTN lenders facilities are fully drawn. The total
undrawn bilateral debt and cash available to the Group at 31 December 2015 was $108.0 million (30
June 2015: $150.4 million).
7. Business strategies and prospects for future financial years
The Group’s core strategy is to invest in, manage, and develop, a geographically diverse portfolio of
quality neighbourhood and sub-regional retail assets, anchored by long-term leases to quality tenants
with a strong bias towards the non-discretionary retail sector.
The Group is focused on achieving growing and resilient cash flows from non-discretionary and
defensive retailing sectors. This is to support, secure, and grow distributions to the Group’s
unitholders. It intends to achieve this by:
- Maximising the net operating income from its existing properties. This will include increasing
over time the average rent per square metre from specialty tenants.
- Pursuing selected property refurbishment, development and acquisition opportunities, consistent
with its core strategy.
- Diversifying and developing other sustainable income streams such as from funds management.
The first managed fund (SCA Unlisted Retail Fund 1) commenced on 1 October 2015.
- Maintaining an appropriate capital structure to balance cost of capital and risk profile.
It is noted that property valuation changes, movements in the fair value of derivative financial
instruments and in foreign exchange, availability of funding and changes in interest rates may have a
material impact on the Group’s results in future years, however, these cannot be reliably forecasted at
the date of this report.
8. Environmental regulations
The Directors of the Responsible Entity are satisfied that adequate systems are in place for the
management of the Group’s environmental responsibility and compliance with various licence
requirements and regulations. Further, the Directors of the Responsible Entity are not aware of any
material breaches to these requirements and, to the best of their knowledge, all activities have been
undertaken in compliance with environmental requirements.
For
per
sona
l use
onl
y
Page 11
Shopping Centres Australasia Property Group Directors’ Report
For the half year ended 31 December 2015
8
9. Indemnification and Insurance of Directors, Officers and Auditor
The Trusts have paid premiums for Directors’ and Officers’ liability insurance in respect of all
directors, secretaries and officers. In accordance with usual commercial practice, the insurance
contract prohibits disclosure of details relating to the nature of the liabilities covered by the insurance,
the limit of indemnity and the amount of the premiums paid under the policy.
The Trusts’ constitutions provide that in addition to any indemnity under any law, but subject to the
Corporations Act 2001, the Responsible Entity has a right of indemnity out of the assets of the Trusts
on a full indemnity basis in respect of any liability incurred by the Responsible Entity in properly
performing any of its powers or duties in relation to the Trusts.
The auditor of the Group is not indemnified out of the assets of the Group.
10. Auditor’s Independence Declaration
A copy of the Auditor’s Independence Declaration as required under section 307C of the Corporations
Act 2001 is set out on page 10.
11. Subsequent events
During December 2015 the Group entered into a conditional agreement to acquire Greenbank
neighbourhood shopping centre (Queensland) for $23.0 million (excluding transaction costs). This
transaction settled in January 2016. This acquisition includes a call option for the Group to acquire
ten hectares of adjacent development land for $10.0 million exercisable at any time within the next 5
years (and the vendor has a put option which is exercisable in December 2020 if the call option is not
exercised by that time).
On 4 January 2016 Receivers and Managers were appointed to Dick Smith Holdings Limited (ASX:
DSH) (Dick Smith). This followed the appointment of Voluntary Administrators. The Group has four
leases with Dick Smith (three in Australia and one in New Zealand). The annual gross income from
these leases is $1.0 million. It is possible that some of these leases may continue or that part or all of
the space may be vacated and available for releasing.
On 18 January 2016 Woolworths Limited (ASX: WOW) (Woolworths) announced that it intended to
pursue an orderly prospective sale or wind-up of the business known as Masters Home Improvement
(Masters). The Group has a lease to Masters, in Mt Gambier (South Australia). Mt Gambier
comprises of a subregional centre together with a Masters. The annual gross income from Masters is
$1.7 million and the lease expires in May 2035. The site occupied by Masters in Mt Gambier was
independently and externally valued in December 2015 for $20.2 million on the basis of the existing
lease remaining in place.
The distribution declared in December 2015 and paid on 29 January 2016 resulted in $17.4 million
being raised by the Distribution Reinvestment Plan (DRP) by the issue of 8.5 million units on 29
January 2016 (this was partially underwritten).
The Directors of the Responsible Entity are not aware of any other matter since the end of the half
year that has significantly or may significantly affect the operations of the Group, the result of those
operations, or state of the Group’s affairs in future financial periods.
For
per
sona
l use
onl
y
Page 12
Shopping Centres Australasia Property Group Directors’ Report
For the half year ended 31 December 2015
9
12. Rounding of amounts
The Trusts are of a kind of entity referred to in Class Order 98/100 (as amended) issued by the
Australian Securities & Investments Commission relating to the “rounding off” of amounts in the
Directors’ report and interim financial statements. Amounts in the Directors’ report and interim
financial statements have been rounded off in accordance with that Class Order to the nearest
hundred thousand dollars.
This report is made in accordance with a resolution of the Directors.
Chairman
Sydney
8 February 2016
For
per
sona
l use
onl
y
Page 13
Liability limited by a scheme approved under Professional Standards Legislation.
Member of Deloitte Touche Tohmatsu.
10
8 February 2016
Dear Board Members
Shopping Centres Australasia Property Management Trust and Shopping Centres Australasia
Property Retail Trust
In accordance with section 307C of the Corporations Act 2001, I am pleased to provide the following
declaration of independence to the directors of Shopping Centres Australasia Property Group RE
Limited in its capacity as Responsible Entity for Shopping Centres Australasia Property Management
Trust and Shopping Centres Australasia Property Retail Trust.
As lead audit partner for the review of the interim financial report of Shopping Centres Australasia
Property Management Trust and Shopping Centres Australasia Property Retail Trust for the half year
ended 31 December 2015, I declare that to the best of my knowledge and belief, there have been no
contraventions of:
(i) the auditor independence requirements of the Corporations Act 2001 in relation to the
review; and
(ii) any applicable code of professional conduct in relation to the review.
Yours faithfully,
DELOITTE TOUCHE TOHMATSU
AG Collinson
Partner
Chartered Accountants
The Board of Directors
Shopping Centres Australasia Property Group RE Limited as Responsible Entity for
Shopping Centres Australasia Property Management Trust and
Shopping Centres Australasia Property Retail Trust
Level 5, 50 Pitt Street
Sydney NSW 2000
Deloitte Touche Tohmatsu
A.B.N. 74 490 121 060
Grosvenor Place
225 George Street
Sydney NSW 2000
PO Box N250 Grosvenor Place
Sydney NSW 1220 Australia
DX 10307SSE
Tel: +61 (0) 2 9322 7000
Fax: +61 (0) 2 9322 7001
www.deloitte.com.au
For
per
sona
l use
onl
y
Page 14
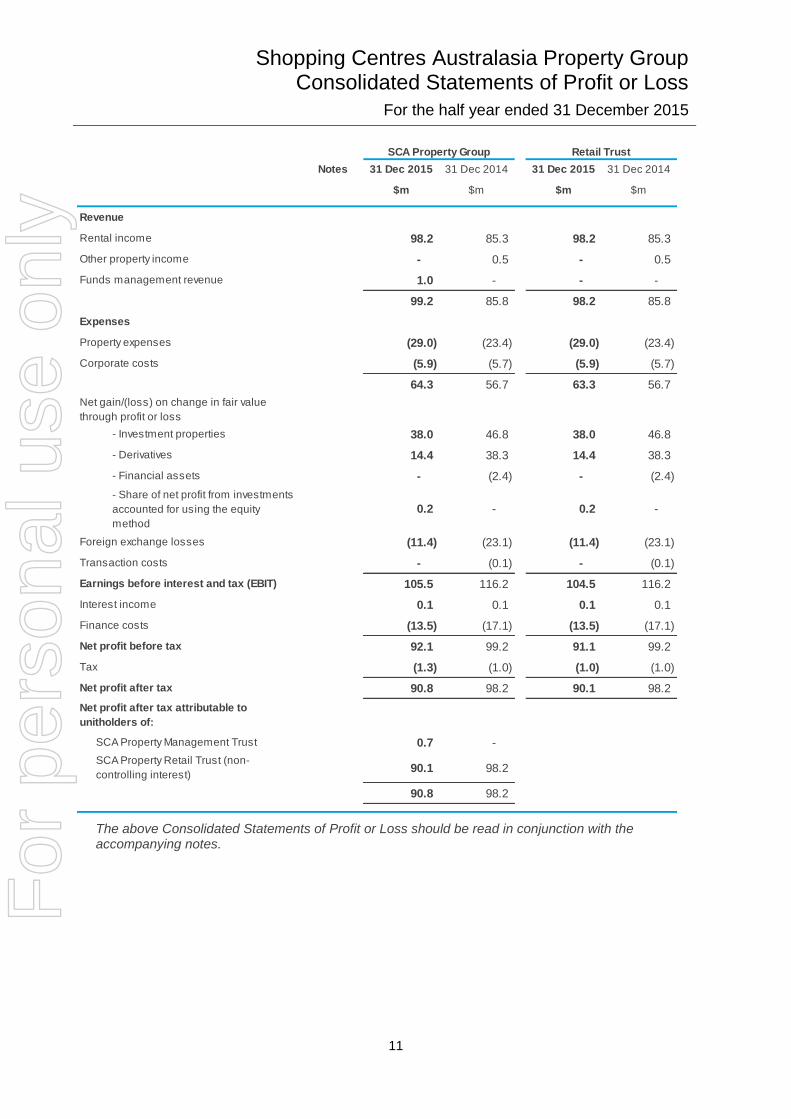
Shopping Centres Australasia Property Group Consolidated Statements of Profit or Loss
For the half year ended 31 December 2015
11
The above Consolidated Statements of Profit or Loss should be read in conjunction with the accompanying notes.
Notes 31 Dec 2015 31 Dec 2014 31 Dec 2015 31 Dec 2014
$m $m $m $m
Revenue
Rental income 98.2 85.3 98.2 85.3
Other property income - 0.5 - 0.5
Funds management revenue 1.0 - - -
99.2 85.8 98.2 85.8
Expenses
Property expenses (29.0) (23.4) (29.0) (23.4)
Corporate costs (5.9) (5.7) (5.9) (5.7)
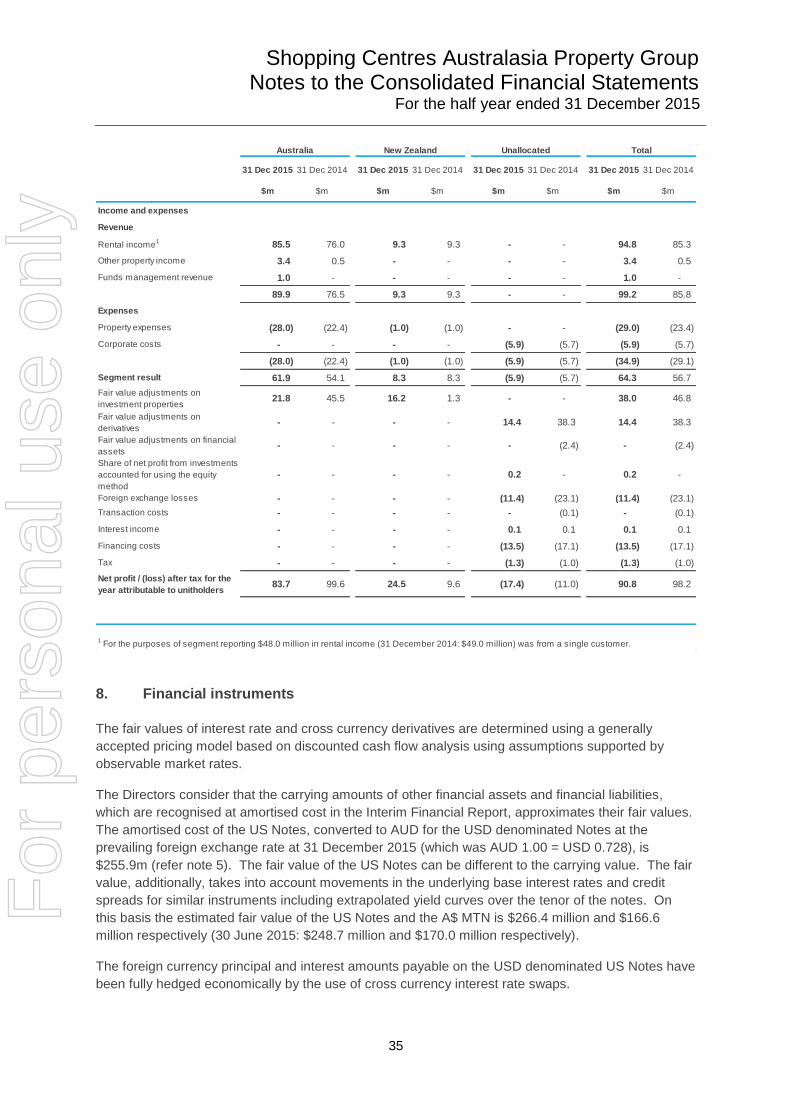
64.3 56.7 63.3 56.7
Net gain/(loss) on change in fair value
through profit or loss
- Investment properties 38.0 46.8 38.0 46.8
- Derivatives 14.4 38.3 14.4 38.3
- Financial assets - (2.4) - (2.4)
- Share of net profit from investments
accounted for using the equity
method
0.2 - 0.2 -
Foreign exchange losses (11.4) (23.1) (11.4) (23.1)
Transaction costs - (0.1) - (0.1)
Earnings before interest and tax (EBIT) 105.5 116.2 104.5 116.2
Interest income 0.1 0.1 0.1 0.1
Finance costs (13.5) (17.1) (13.5) (17.1)
Net profit before tax 92.1 99.2 91.1 99.2
Tax (1.3) (1.0) (1.0) (1.0)
Net profit after tax 90.8 98.2 90.1 98.2
Net profit after tax attributable to
unitholders of:
SCA Property Management Trust 0.7 -
SCA Property Retail Trust (non-
controlling interest)90.1 98.2
90.8 98.2
SCA Property Group Retail Trust
For
per
sona
l use
onl
y
Page 15
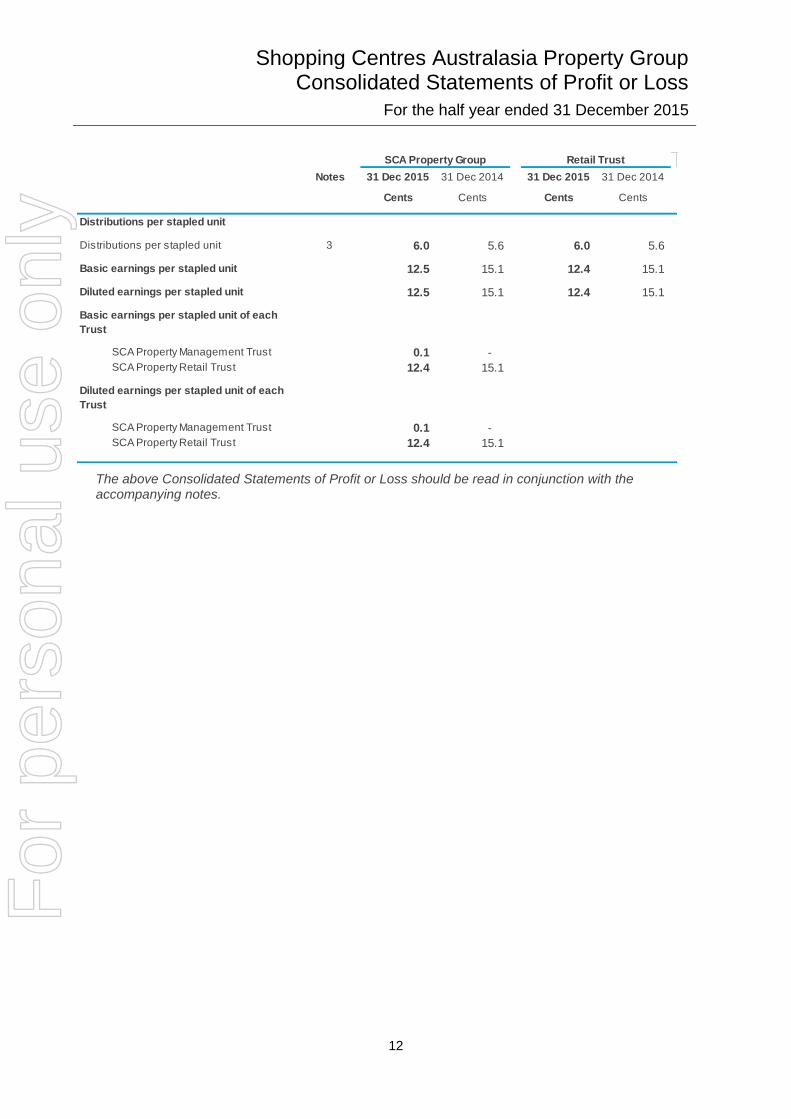
Shopping Centres Australasia Property Group Consolidated Statements of Profit or Loss
For the half year ended 31 December 2015
12
The above Consolidated Statements of Profit or Loss should be read in conjunction with the accompanying notes.
Notes 31 Dec 2015 31 Dec 2014 31 Dec 2015 31 Dec 2014
Cents Cents Cents Cents
Distributions per stapled unit
Distributions per stapled unit 3 6.0 5.6 6.0 5.6
Basic earnings per stapled unit 12.5 15.1 12.4 15.1
Diluted earnings per stapled unit 12.5 15.1 12.4 15.1
Basic earnings per stapled unit of each
Trust
SCA Property Management Trust 0.1 -
SCA Property Retail Trust 12.4 15.1
Diluted earnings per stapled unit of each
Trust
SCA Property Management Trust 0.1 -
SCA Property Retail Trust 12.4 15.1
SCA Property Group Retail Trust
For
per
sona
l use
onl
y
Page 16
Shopping Centres Australasia Property Group Consolidated Statements of Profit or Loss and
Other Comprehensive Income
For the half year ended 31 December 2015
13
The above Consolidated Statements of Profit or Loss and Other Comprehensive Income should be
read in conjunction with the accompanying notes.
Notes 31 Dec 2015 31 Dec 2014 31 Dec 2015 31 Dec 2014
$m $m $m $m
Net profit after tax for the year 90.8 98.2 90.1 98.2
Other comprehensive income
Items that may be classified
subsequently to profit or loss
Movement in foreign currency translation
reserves:
Net exchange differences on
translation of foreign operations8.0 (0.8) 8.0 (0.8)
Cash flow hedges:
Effective portion of changes in fair
value of cash flow hedges- (3.1) - (3.1)
Total comprehensive income 98.8 94.3 98.1 94.3
Total comprehensive profit for the period
attributable to unitholders of:
SCA Property Management Trust 0.7 -
SCA Property Retail Trust (non-
controlling interest)98.1 94.3
Total comprehensive income 98.8 94.3
SCA Property Group Retail Trust
For
per
sona
l use
onl
y
Page 17
Shopping Centres Australasia Property Group Consolidated Balance Sheets
As at 31 December 2015
14
The above Consolidated Balance Sheets should be read in conjunction with the accompanying notes.
Notes 31 Dec 2015 30 Jun 2015 31 Dec 2015 30 Jun 2015
$m $m $m $m
Current assets
Cash and cash equivalents 4.5 3.7 3.4 2.1
Receivables 17.7 8.0 17.6 7.9
Derivative financial instruments 8 3.4 3.2 3.4 3.2
Other assets 3.9 0.6 3.6 0.4
29.5 15.5 28.0 13.6
Assets classified as held for sale - 60.9 - 60.9
Total current assets 29.5 76.4 28.0 74.5
Non-current assets
Investment properties 4 2,076.1 1,895.4 2,076.1 1,895.4
Derivative financial instruments 8 61.4 46.7 61.4 46.7
Property, plant and equipment 0.1 0.1 - -
Investment in associate 9 8.2 - 8.2 -
Other financial assets 10 2.4 2.4 2.4 2.4
Total non-current assets 2,148.2 1,944.6 2,148.1 1,944.5
Total assets 2,177.7 2,021.0 2,176.1 2,019.0
Current liabilities
Payables 11 31.9 20.9 39.2 25.5
Distribution payable 3 43.5 41.8 43.5 41.8
Derivative financial instruments 8 0.4 0.1 0.4 0.1
Provisions 0.9 1.1 - -
Total current liabilities 76.7 63.9 83.1 67.4
Non-current liabilities
Derivative financial instruments 8 0.2 0.1 0.2 0.1
Interest bearing liabilities 5 759.7 680.1 759.7 680.1
Provisions 0.1 0.1 - -
Total non-current liabilities 760.0 680.3 759.9 680.2
Total liabilities 836.7 744.2 843.0 747.6
Net assets 1,341.0 1,276.8 1,333.1 1,271.4
SCA Property Group Retail Trust
For
per
sona
l use
onl
y
Page 18
Shopping Centres Australasia Property Group Consolidated Balance Sheets
As at 31 December 2015
15
The above Consolidated Balance Sheets should be read in conjunction with the accompanying notes.
Notes 31 Dec 2015 30 Jun 2015
$m $m
Equity
Equity Holders of Management Trust
Contributed equity 6 7.3 7.3
Accumulated profit/ (loss) 0.6 (1.7)
Parent entity interest 7.9 5.6
Equity Holders of Retail Trust
Contributed equity 6 1,199.3 1,192.4
Reserves 13.2 4.9
Accumulated profit/ (loss) 120.6 73.9
Non-controlling interest 1,333.1 1,271.2
Equity Holders of Management Trust 7.9 5.6
Equity Holders of Retail Trust 1,333.1 1,271.2
Total equity 1,341.0 1,276.8
For
per
sona
l use
onl
y
Page 19
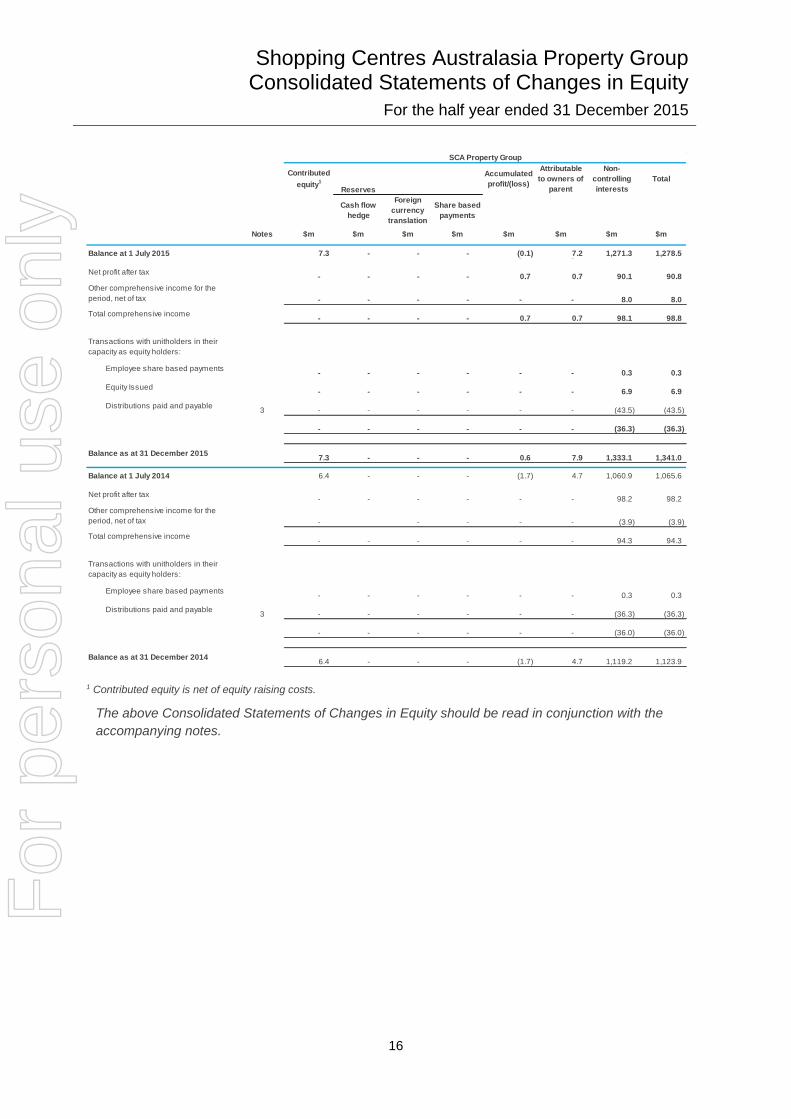
Shopping Centres Australasia Property Group Consolidated Statements of Changes in Equity
For the half year ended 31 December 2015
16
1 Contributed equity is net of equity raising costs.
The above Consolidated Statements of Changes in Equity should be read in conjunction with the
accompanying notes.
Contributed
equity1
Reserves
Accumulated
profit/(loss)
Attributable
to owners of
parent
Non-
controlling
interests
Total
Cash flow
hedge
Foreign
currency
translation
Share based
payments
Notes $m $m $m $m $m $m $m $m
Balance at 1 July 2015 7.3 - - - (0.1) 7.2 1,271.3 1,278.5 - -
Net profit after tax- - - - 0.7 0.7 90.1 90.8
Other comprehensive income for the
period, net of tax - - - - - - 8.0 8.0
Total comprehensive income- - - - 0.7 0.7 98.1 98.8
Transactions with unitholders in their
capacity as equity holders:
Employee share based payments- - - - - - 0.3 0.3
Equity Issued- - - - - - 6.9 6.9
Distributions paid and payable3 - - - - - - (43.5) (43.5)
- - - - - - (36.3) (36.3)
Balance as at 31 December 20157.3 - - - 0.6 7.9 1,333.1 1,341.0
Balance at 1 July 2014 6.4 - - - (1.7) 4.7 1,060.9 1,065.6 - -
Net profit after tax- - - - - - 98.2 98.2
Other comprehensive income for the
period, net of tax - - - - - (3.9) (3.9)
Total comprehensive income- - - - - - 94.3 94.3
Transactions with unitholders in their
capacity as equity holders:
Employee share based payments- - - - - - 0.3 0.3
Distributions paid and payable3 - - - - - - (36.3) (36.3)
- - - - - - (36.0) (36.0)
Balance as at 31 December 20146.4 - - - (1.7) 4.7 1,119.2 1,123.9
SCA Property Group
For
per
sona
l use
onl
y
Page 20
Shopping Centres Australasia Property Group Consolidated Statements of Changes in Equity
For the half year ended 31 December 2015
17
1 Contributed equity is net of equity raising costs.
The above Consolidated Statements of Changes in Equity should be read in conjunction with the
accompanying notes.
Cash flow
hedge
Foreign
currency
translation
Share based
payments
Notes $m $m $m $m $m $m
Balance at 1 July 2015 1,192.4 - 3.8 1.1 74.0 1,271.3
Net profit after tax- - - - 90.1 90.1
Other comprehensive income for the
period, net of tax - - 8.0 - - 8.0
Total comprehensive income- - 8.0 - 90.1 98.1
Transactions with unitholders in their
capacity as equity holders:
Employee share based payments- - - 0.3 - 0.3
Equity Issued6.9 - - - - 6.9
Distributions paid and payable3 - - - - (43.5) (43.5)
6.9 - - 0.3 (43.5) (36.3)
Balance as at 31 December 20151,199.3 - 11.8 1.4 120.6 1,333.1
Balance at 1 July 2014 1,049.0 (1.0) 11.0 0.3 1.6 1,060.9
Net profit after tax- - - - 98.2 98.2
Other comprehensive income for the
period, net of tax - (3.1) (0.8) - - (3.9)
Total comprehensive income- (3.1) (0.8) - 98.2 94.3
Transactions with unitholders in their
capacity as equity holders:
Employee share based payments- - - 0.3 - 0.3
Distributions paid and payable3 - - - - (36.3) (36.3)
- - - 0.3 (36.3) (36.0)
Balance as at 31 December 20141,049.0 (4.1) 10.2 0.6 63.5 1,119.2
Retail Trust
Contributed
equity1
Accumulated
profit/(loss)Total
Reserves
For
per
sona
l use
onl
y
Page 21
Shopping Centres Australasia Property Group Consolidated Statements of Cash Flows
For the half year ended 31 December 2015
18
The above Consolidated Statements of Cash Flows should be read in conjunction with the accompanying notes.
Notes 31 Dec 2015 31 Dec 2014 31 Dec 2015 31 Dec 2014
$m $m $m $m
Cash flows from operating activities
Property and other income received
(inclusive of GST)108.2 91.8 107.2 91.8
Property expenses paid (inclusive of
GST)(31.3) (26.0) (31.3) (26.0)
Corporate costs paid (inclusive of GST) (7.9) (7.3) (7.1) (7.9)
Rental guarantee income received - 8.6 - 8.6
Interest received 0.1 0.1 0.1 0.1
Finance costs paid (13.4) (15.8) (13.4) (15.8)
Transaction costs paid - (0.1) - (0.1)
Taxes paid including GST (6.5) (6.6) (5.8) (6.3)
Net cash flow from operating activities 49.2 44.7 49.7 52.3
Cash flows from investing activities
Payments for investment properties
purchased and developments(131.0) (112.5) (131.0) (112.5)
Payments for investments in SURF (8.0) - (8.0) -
Payments for other assets 9 - (2.4) - (2.4)
Net proceeds from investment
properties sold60.9 - 60.9 -
Payments for plant and equipment - (0.2) - -
Net cash flow from investing activities (78.1) (115.1) (78.1) (122.8)
Cash flow from financing activities
Proceeds from equity raising 6.9 - 6.9 -
Net proceeds from borrowings 69.6 231.3 69.6 231.3
Repayment of borrowings (5.0) (116.5) (5.0) (116.5)
Distributions paid (41.8) (36.3) (41.8) (36.3)
Net cash flow from financing activities 29.7 78.5 29.7 78.5
Net (decrease) / increase in cash and
cash equivalents held0.8 8.1 1.3 8.0
Cash and cash equivalents at the
beginning of the half year3.7 0.9 2.1 0.4
Effects of exchange rate changes on
cash and cash equivalents- - - -
Cash and cash equivalents at the end
of the half year4.5 9.0 3.4 8.4
SCA Property Group Retail Trust
For
per
sona
l use
onl
y
Page 22
Shopping Centres Australasia Property Group Notes to the Consolidated Financial Statements
For the half year ended 31 December 2015
19
1. Corporate information
Shopping Centres Australasia Property Group (the Group or SCA Property Group) represents the
stapling of the units in two Australian managed investment schemes, Shopping Centres Australasia
Property Management Trust (Management Trust) (ARSN 160 612 626) and Shopping Centres
Australasia Property Retail Trust (Retail Trust) (ARSN 160 612 788) (collectively the Trusts). The
Group’s ASX code is SCP.
The Responsible Entity of both Trusts is Shopping Centres Australasia Property Group RE Limited (ABN
47 158 809 851; AFSL 426603) (Responsible Entity).
The Interim Financial Statements of the Group comprise the consolidated Interim Financial Statements of
the Management Trust and its controlled entities including the Retail Trust and its controlled entities.
The Interim Financial Statements of the Retail Trust comprise the consolidated Interim Financial
Statements of the Retail Trust and its controlled entities.
The Directors of the Responsible Entity have authorised the Interim Financial Report for issue on 8
February 2016.
2. Significant accounting policies
(a) Statement of compliance
The Interim Financial Report has been prepared in accordance with the requirements of the Corporations
Act 2001 and AASB 134 Interim Financial Reporting. Compliance with AASB 134 ensures compliance
with International Financial Reporting Standard IAS 34 Interim Financial Reporting.
(b) Basis of preparation
This Interim Financial Report does not include all the notes of the type normally included in an annual
financial report. Accordingly, this report should be read in conjunction with the annual report for the year
ended 30 June 2015 and any public announcements made by the Group during the interim reporting
period in accordance with the continuous disclosure requirements of the Corporations Act 2001.
Basis of consolidation
Controlled Entities
The Interim Financial Report of Shopping Centres Australasia Property Group incorporates the assets
and liabilities of Shopping Centres Australasia Property Management Trust (the Parent) and all of its
subsidiaries, including Shopping Centres Australasia Property Retail Trust and its subsidiaries, as at 31
December 2015. Shopping Centres Australasia Property Management Trust has been identified as the
parent entity in relation to the stapling. The results and equity of Shopping Centres Australasia Property
Retail Trust (which is not directly owned by Shopping Centres Australasia Property Management Trust)
have been treated and disclosed as a non-controlling interest. Whilst the results and equity of the
Shopping Centres Australasia Property Retail Trust are disclosed as a non-controlling interest, the
stapled security holders of Shopping Centres Australasia Management Trust are the same as the stapled
security holders of Shopping Centres Australasia Property Retail Trust.
For
per
sona
l use
onl
y
Page 23
Shopping Centres Australasia Property Group Notes to the Consolidated Financial Statements
For the half year ended 31 December 2015
20
These Financial Statements also include a separate column representing the Financial Statements of
Shopping Centres Australasia Property Retail Trust, incorporating the assets and liabilities of Shopping
Centres Australasia Property Retail Trust and all of its subsidiaries, as at 31 December 2015.
Subsidiaries are all entities over which the Group has control. Control is defined as having rights to
variable returns from involvement in the investee and having the ability to affect those returns through its
power over the investee.
Where an entity began or ceased to be a controlled entity during the reporting periods, the results are
included only from the date control commenced or up to the date control ceased.
In preparing the Interim Financial Report, all intra-group transactions and balances, including unrealised
profits arising thereon, have been eliminated in full.
Investments in associates
Associates are entities over which the Group has significant influence but not control. Investments in
associates are accounted for in the consolidated balance sheet by using the equity method of accounting
after initially being recognised at cost. Under the equity accounted method, the Group’s share of the
associates’ post acquisition net profit after income tax expense is recognised in the consolidated
statement of comprehensive income. Distributions received or receivable from associates are recognised
in the consolidated financial report as a reduction of the carrying amount of the investment.
Historical cost convention
The Interim Financial Report has been prepared on the basis of historical cost, except for certain non-
current assets and financial instruments that are measured at fair value.
Going concern
The Interim Financial Report is prepared on the going concern basis. In preparing the Interim Financial
Report the Directors note that the Group and the Retail Trust are in a net current asset deficiency position
due to the provision for distribution and minimal cash and cash equivalents, as it is the policy of the
Group and the Retail Trust to use surplus cash to repay bilateral debt and the bilateral debt facilities are
revolving. The Group and the Retail Trust have the ability to access appropriate funds having funds
available for drawdown from the Group’s bi lateral debt facilities and cash. Additional funds are also
expected to become available from the regular collection of property income.
Rounding
In accordance with ASIC Class Order 98/100, the amounts shown in the Interim Financial Report have
been rounded to the nearest hundred thousand dollars, unless otherwise stated.
New and amended accounting standards and interpretations
The accounting policies and methods of computation adopted in the preparation of the half year Financial
Statements are consistent with those adopted and disclosed in the Group’s 2015 annual financial report
for the year ended 30 June 2015, except for the impact of the Standards and Interpretations described
below. These accounting policies are consistent with Australian Accounting Standards and with
International Financial Reporting Standards.
For
per
sona
l use
onl
y
Page 24
Shopping Centres Australasia Property Group Notes to the Consolidated Financial Statements
For the half year ended 31 December 2015
21
AASB 2015-3 ‘Amendments to Australian Accounting Standards arising from the Withdrawal of
AASB 1031 Materiality’:
Completes the withdrawal of references to AASB 1031 in all Australian Accounting Standards and
Interpretations.
The adoption of these amendments does not have any material impact on the disclosures or the amounts
recognised in the Group’s Interim Financial Report.
Application of new and revised Accounting Standards not yet effective
A number of Australian Accounting Standards and Interpretations are in issue but are not effective for the
current period. The potential impact of these other Standards and interpretations has not yet been fully
determined. The Group does not intend to adopt any of these announcements before their effective
dates. These include:
Standard/Interpretation Effective for annual reporting periods beginning on or after
Expected to be initially applied in the financial year ending
AASB 2015-1 Amendments to Australian Accounting Standards – Annual Improvements to Australian Accounting Standards 2012-2014 Cycle
1 January 2016 30 June 2017
AASB 2015-2 Amendments to Australian Accounting Standards – Disclosure Initiative: Amendments to AASB 101
1 January 2016 30 June 2017
AASB 9 Financial Instruments, and the relevant amending standards
1 January 2018 30 June 2019
AASB 2013-9 Amendments to Australian Accounting Standards –
Conceptual Framework, Materiality and Financial Instruments – Part C
1 January 2018 30 June 2019
AASB 15 Revenue 1 January 2018 30 June 2019
Additionally, at the date of authorisation of the financial statements, the following IASB Standards and
IFRIC Interpretations were also in issue but not yet effective, although Australian equivalent Standards
and Interpretations have not yet been issued.
Standard/Interpretation Effective for annual reporting periods
beginning on or after
Expected to be initially applied in the financial
year ending
IFRS 16 Leases 1 January 2019 30 June 2020
For
per
sona
l use
onl
y
Page 25
Shopping Centres Australasia Property Group Notes to the Consolidated Financial Statements
For the half year ended 31 December 2015
22
(c) Significant accounting estimates, judgements and assumptions
The preparation of interim financial reports requires management to make judgements, estimates and
assumptions that affect the application of accounting policies and the reported amount of assets,
liabilities, income and expenses. Actual results may differ from these estimates.
The estimates and underlying assumptions are reviewed on an ongoing basis. Revisions to accounting
estimates are recognised in the period in which the estimate is revised and in any future periods affected.
The significant judgements and estimates used in the preparation of these financial statements are
outlined below:
Judgement - Selection of parent entity
In determining the parent entity of the SCA Property Group, the Directors considered various factors
including asset ownership, debt obligation, management and day to day responsibilities. The Directors
concluded that management activities were more relevant in determining the parent.
Shopping Centres Australasia Property Management Trust has been determined as the parent of the
SCA Property Group.
Judgement – Investment properties
In management’s view there are two classes of investment properties: those located in Australia and
those located in New Zealand. The investment properties in Australia and New Zealand are shopping
centres, but are located in different economic environments. Additionally the New Zealand properties are
valued in New Zealand dollars.
Judgement – Classification and carrying value of investments
The SCA Property Group controls an entity when the Group is exposed to, or has rights to, variable
returns from its involvement with the entity and has the ability to affect those returns through its power
over the entity. Critical judgements are made in assessing whether an investee entity is controlled or
subject to significant influence or joint control. These judgements include an assessment of the nature,
extent and financial effects of the Group’s interest in joint arrangements and associates, including the
nature and effects of its contractual relationship with the entity or with other investors. Associates are
entities over which the Group has significant influence but not control.
Investments in associates are accounted for by using the equity method.
Management regularly reviews equity accounted investments for impairment and remeasures
investments carried at fair value through profit or loss by reference to changes in circumstances or
contractual arrangements, external independent property valuations and market conditions, using
generally accepted market practices.
For
per
sona
l use
onl
y
Page 26
Shopping Centres Australasia Property Group Notes to the Consolidated Financial Statements
For the half year ended 31 December 2015
23
Estimate - Valuation of property investments
Critical judgements are made by the Directors in respect of the fair value of investment properties
including properties under construction and those that are classified as assets held for sale. The fair
value of these investments are reviewed regularly by management with reference to independent
property valuations, recent transactions and market conditions existing at the reporting date, using
generally accepted market practices. The major critical assumptions underlying estimates of fair values
are those relating to the capitalisation rate and to a lesser extent the discount rate.
Other assumptions of lesser importance include net passing rent, gross market rent, net market rent,
average market rental growth, and terminal yield.
If there is any change in these assumptions or economic conditions, the fair value of the investment
properties may differ. See further disclosure regarding assumptions used in valuation of investment
properties in note 4.
Estimate - Valuation of financial instruments
The fair value of derivative assets and liabilities are based on assumptions of future events and involve
significant estimates. The basis of valuation for the Group’s derivatives are set out in note 8. The value
of derivatives may differ in future reporting periods due to the passing of time and / or changes in market
rates including interest rates, foreign exchange rates and market volatility.
3. Distributions paid and payable
1 The interim distribution of 6.0 cents per stapled unit was declared on 16 December 2015 and paid on 29 January
2016.
Total amount
Cents per unit $m
6 months to 31 December 2015
SCA Property Group
Interim distribution1 6.0 43.5 29 January 2016
6.0 43.5
Retail Trust
Interim distribution 6.0 43.5 29 January 2016
6.0 43.5
6 months to 31 December 2014
SCA Property Group
Interim distribution 5.6 36.3 30 January 2015
5.6 36.3
Retail Trust
Interim distribution 5.6 36.3 30 January 2015
5.6 36.3
Date of payment
For
per
sona
l use
onl
y
Page 27
Shopping Centres Australasia Property Group Notes to the Consolidated Financial Statements
For the half year ended 31 December 2015
24
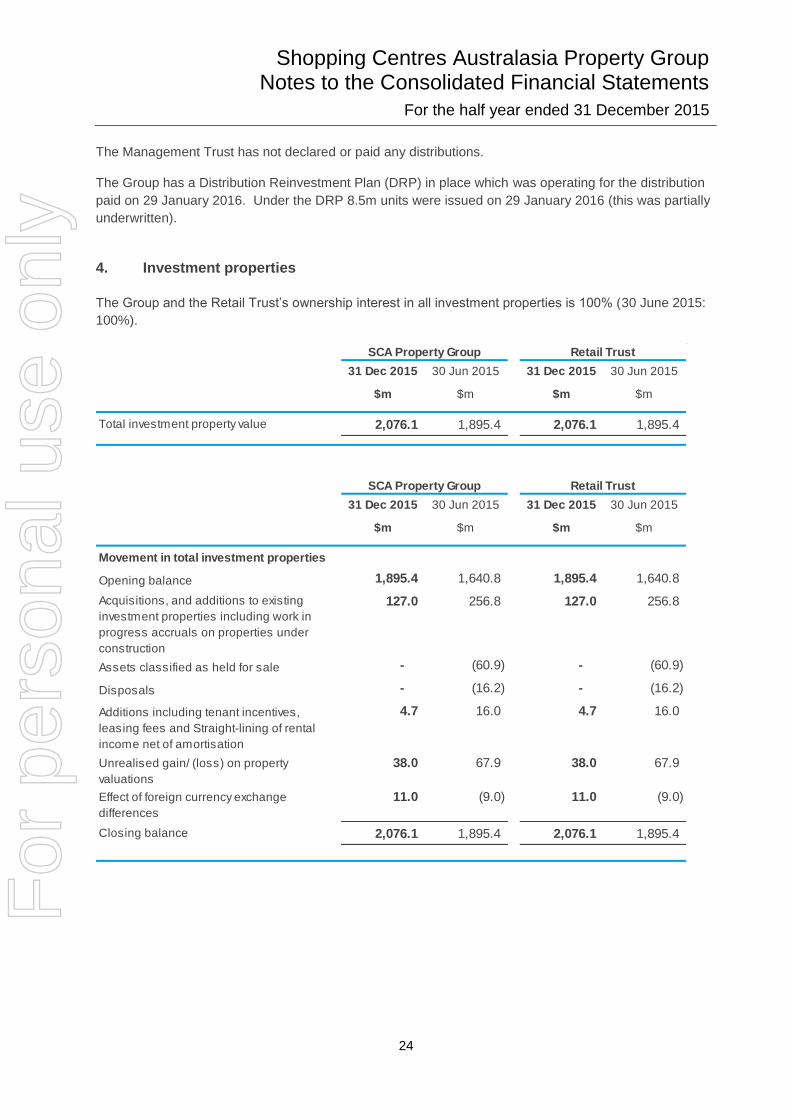
The Management Trust has not declared or paid any distributions.
The Group has a Distribution Reinvestment Plan (DRP) in place which was operating for the distribution
paid on 29 January 2016. Under the DRP 8.5m units were issued on 29 January 2016 (this was partially
underwritten).
4. Investment properties
The Group and the Retail Trust’s ownership interest in all investment properties is 100% (30 June 2015:
100%).
31 Dec 2015 30 Jun 2015 31 Dec 2015 30 Jun 2015
$m $m $m $m
Total investment property value 2,076.1 1,895.4 2,076.1 1,895.4
31 Dec 2015 30 Jun 2015 31 Dec 2015 30 Jun 2015
$m $m $m $m
Movement in total investment properties
Opening balance 1,895.4 1,640.8 1,895.4 1,640.8
Acquisitions, and additions to existing
investment properties including work in
progress accruals on properties under
construction
127.0 256.8 127.0 256.8
Assets classified as held for sale - (60.9) - (60.9)
Disposals - (16.2) - (16.2)
Additions including tenant incentives,
leasing fees and Straight-lining of rental
income net of amortisation
4.7 16.0 4.7 16.0
Unrealised gain/ (loss) on property
valuations
38.0 67.9 38.0 67.9
Effect of foreign currency exchange
differences
11.0 (9.0) 11.0 (9.0)
Closing balance 2,076.1 1,895.4 2,076.1 1,895.4
SCA Property Group Retail Trust
SCA Property Group Retail Trust
For
per
sona
l use
onl
y
Page 28
Shopping Centres Australasia Property Group Notes to the Consolidated Financial Statements
For the half year ended 31 December 2015
25
Property State Property Type Book value
cap rate1
31 Dec 2015
Book value
discount rate
31 Dec 2015
Book value 31
Dec 2015
Book value 30
June 2015
% % $m $m
Lilydale Marketplace VIC Sub-Regional 7.00 8.75 89.0 88.0
Pakenham VIC Sub-Regional 7.00 8.50 75.4 72.5
Central Highlands QLD Sub-Regional 7.50 8.75 63.0 65.0
Whitsunday QLD Sub-Regional 8.00 9.25 48.5 47.0
Mt Gambier SA Sub-Regional 7.34 8.42 63.2 66.4
Murray Bridge SA Sub-Regional 7.50 8.75 64.0 63.3
Kwinana Marketplace WA Sub-Regional 8.25 9.75 93.0 93.0
Total Sub-Regional 496.1 495.2
Neighbourhood
Berala NSW Neighbourhood 6.50 7.75 23.3 20.4
Cabarita NSW Neighbourhood 7.00 7.75 19.2 18.2
Cardiff NSW Neighbourhood 7.00 7.75 20.0 19.2
Goonellabah NSW Neighbourhood 7.50 8.25 18.0 17.8
Greystanes NSW Neighbourhood 6.75 8.25 44.6 44.3
Griffin Plaza2 NSW Neighbourhood 7.50 8.50 23.0 -
Lane Cove NSW Neighbourhood 6.50 8.25 48.5 44.9
Leura NSW Neighbourhood 7.00 7.75 14.8 13.7
Lismore NSW Neighbourhood 7.75 8.75 30.0 27.2
Macksville NSW Neighbourhood 7.50 8.50 11.1 10.9
Merimbula NSW Neighbourhood 7.75 8.25 15.0 14.7
Mittagong Village NSW Neighbourhood 7.00 8.00 9.1 7.8
Moama Marketplace NSW Neighbourhood 7.75 8.25 11.6 11.6
Morisset NSW Neighbourhood 7.50 8.25 15.9 15.7
Northgate2 NSW Neighbourhood 7.25 8.00 14.8 -
North Orange NSW Neighbourhood 7.25 8.25 26.0 26.0
Swansea NSW Neighbourhood 7.00 7.75 13.5 11.7
Ulladulla NSW Neighbourhood 7.25 8.00 18.2 17.3
West Dubbo NSW Neighbourhood 7.50 8.75 13.7 13.7
Albury VIC Neighbourhood 7.50 8.25 20.4 19.5
Ballarat VIC Neighbourhood 7.50 8.50 18.2 18.7
Cowes VIC Neighbourhood 7.50 8.50 17.5 17.5
Drouin VIC Neighbourhood 7.00 8.00 13.0 12.7
Epping North VIC Neighbourhood 6.75 8.25 25.0 23.2
Highett VIC Neighbourhood 7.00 8.00 24.0 23.6
Langwarrin VIC Neighbourhood 7.00 8.00 19.3 17.8
Ocean Grove VIC Neighbourhood 7.50 9.00 31.5 31.5
Investment propeties completed - Australia
Sub-Regional
For
per
sona
l use
onl
y
Page 29
Shopping Centres Australasia Property Group Notes to the Consolidated Financial Statements
For the half year ended 31 December 2015
26
Property State Property Type Book value
cap rate1
31 Dec 2015
Book value
discount rate
31 Dec 2015
Book value 31
Dec 2015
Book value 30
June 2015
% % $m $m
Neighbourhood
Warrnambool East VIC Neighbourhood 7.50 8.50 11.9 11.9
Warrnambool Target VIC Neighbourhood 8.00 9.00 18.8 19.6
Wonthaggi2 VIC Neighbourhood 7.00 8.25 45.4 -
Wyndham Vale VIC Neighbourhood 7.00 8.00 20.2 18.7
Ayr QLD Neighbourhood 7.50 9.00 18.0 18.9
Brookwater Village QLD Neighbourhood 6.75 8.00 32.0 31.0
Carrara QLD Neighbourhood 7.00 8.00 17.0 16.5
Chancellor Park Marketplace QLD Neighbourhood 6.75 7.75 34.0 29.0
Collingwood Park QLD Neighbourhood 8.00 8.75 10.0 10.0
Coorparoo QLD Neighbourhood 6.75 8.00 23.5 22.8
Gladstone QLD Neighbourhood 7.25 8.50 25.5 26.5
Mackay QLD Neighbourhood 7.25 8.00 22.4 21.9
Marian Town Centre2 QLD Neighbourhood 7.00 8.00 32.0 -
Mission Beach QLD Neighbourhood 7.75 8.75 10.2 10.2
Mt Warren Park QLD Neighbourhood 7.00 8.50 14.4 14.4
The Markets QLD Neighbourhood 7.00 9.00 33.2 32.3
Woodford QLD Neighbourhood 7.25 8.00 10.8 10.5
Blakes Crossing SA Neighbourhood 7.50 8.75 19.6 19.6
Walkerville SA Neighbourhood 7.00 8.00 20.5 21.5
Busselton WA Neighbourhood 6.75 8.00 22.2 21.0
Treendale WA Neighbourhood 7.00 8.25 30.5 27.5
Burnie TAS Neighbourhood 8.50 8.50 20.0 20.0
Claremont Plaza TAS Neighbourhood 7.50 8.50 30.9 30.9
Glenorchy Central TAS Neighbourhood 8.00 9.25 21.0 21.0
Greenpoint Plaza TAS Neighbourhood 8.50 9.00 13.5 13.5
Kingston Plaza TAS Neighbourhood 7.50 9.00 23.5 23.5
Meadow Mews TAS Neighbourhood 8.25 8.00 44.0 44.0
New Town Plaza TAS Neighbourhood 7.75 9.25 30.0 30.0
Prospect Vale TAS Neighbourhood 7.50 9.00 26.4 26.8
Riverside Plaza TAS Neighbourhood 8.50 9.50 7.6 7.6
Shoreline Plaza TAS Neighbourhood 7.25 8.50 30.5 29.0
Sorell TAS Neighbourhood 7.25 8.50 22.7 22.5
Total Neighbourhood 1,301.4 1,152.2
Freestanding
Katoomba Marketplace Freestanding 6.75 7.00 43.0 40.0
Total Freestanding 43.0 40.0
Total investment properties completed Australia 1,840.5 1,687.40
For
per
sona
l use
onl
y
Page 30
Shopping Centres Australasia Property Group Notes to the Consolidated Financial Statements
For the half year ended 31 December 2015
27
1 Capitalisation rate (or cap rate) is an approximation of the ratio between the net operating income produced by
an investment property and its fair value. 2 Properties acquired during the half year ended 31 December 2015.
Property Property Type Book value
cap rate1
31 Dec 2015
Book value
discount rate
31 Dec 2015
Book value 31
Dec 2015
Book value 30
June 2015
% % $m $m
Neighbourhood
Kelvin Grove Neighbourhood 7.00 8.50 11.7 10.2
Newtown Neighbourhood 6.63 7.13 21.9 18.8
Takanini Neighbourhood 7.25 9.00 32.3 30.3
Warkworth Neighbourhood 7.50 8.63 16.9 15.2
St James Neighbourhood 7.00 7.13 13.8 12.1
Total Neighbourhood 96.6 86.6
Freestanding
Bridge Street Freestanding 6.50 8.13 16.2 13.7
Dunedin South Freestanding 6.75 6.75 16.3 14.1
Hornby Freestanding 6.90 8.65 17.1 14.7
Kerikeri Freestanding 6.90 8.15 15.9 13.7
Nelson South Freestanding 6.63 6.75 10.9 9.5
Rangiori East Freestanding 7.25 9.00 13.0 11.7
Rolleston Freestanding 7.00 8.63 15.5 13.4
Stoddard Rd Freestanding 6.50 8.25 19.7 17.7
Tawa Freestanding 7.00 8.75 14.4 12.9
Total Freestanding 139.0 121.4
235.6 208.0
2,076.1 1,895.4 Total investment properties completed portfolio
Investment properties completed - New Zealand
Total investment properties completed New Zealand
For
per
sona
l use
onl
y
Page 31
Shopping Centres Australasia Property Group Notes to the Consolidated Financial Statements
For the half year ended 31 December 2015
28
5. Interest bearing liabilities
Financing facilities and financing resources
Drawn debt is carried at amortised cost.
31 Dec 2015 30 Jun 2015 31 Dec 2015 30 Jun 2015
$m $m $m $m
Unsecured Bank Bilateral Facilities
- A$ denominated 207.0 155.0 207.0 155.0
- NZ$ denominated (converted to A$) 124.5 108.3 124.5 108.3
331.5 263.3 331.5 263.3
Unsecured A$ Medium term note
- A$ denominated 175.0 175.0 175.0 175.0
Unsecured US Notes
- A$ denominated 50.0 50.0 50.0 50.0
- US$ denominated (converted to A$) 205.9 194.5 205.9 194.5
255.9 244.5 255.9 244.5
Total unsecured debt outstanding 762.4 682.8 762.4 682.8
Less: unamortised establishment fees (2.7) (2.7) (2.7) (2.7)
759.7 680.1 759.7 680.1
SCA Property Group Retail Trust
31 Dec 2015 30 Jun 2015 31 Dec 2015 30 Jun 2015
$m $m $m $m
Financing facilities and financing
resources
Committed financing facilities available 875.9 839.5 875.9 839.5
Less: amounts drawn down (762.4) (682.8) (762.4) (682.8)
Less: amounts utilised for bank guarantee (10.0) (10.0) (10.0) (10.0)
Net Bilateral facilities available 103.5 146.7 103.5 146.7
Add: Cash and cash equivalents 4.5 3.7 3.4 2.1
Financing resources available 108.0 150.4 106.9 148.8
SCA Property Group Retail Trust
For
per
sona
l use
onl
y
Page 32
Shopping Centres Australasia Property Group Notes to the Consolidated Financial Statements
For the half year ended 31 December 2015
29
The debt facilities are made up of Bilateral Bank Facilities, A$ medium term notes and US Notes.
Details of these debt facilities are below.
Bank bilateral facilities
To reduce liquidity risk, the unsecured bilateral facilities are with four banks and are made up of seven
debt facilities. The bilateral terms have been negotiated to achieve a balance between capital
availability and the cost of debt including unused debt. The facilities are unsecured, revolving, multi-
use, and can be used interchangeably.
During the period the Group cancelled a bilateral facility and increased the facility limit of another
bilateral facility such that the total bilateral facility limit has increased by $25.0 million to $445.0 million
(30 June 2015: $420.0 million). With respect to several other bilateral facilities the Group also agreed
to an extension of maturities and lower margins.
One of the bilateral facilities can also be used for bank guarantees. As at 31 December 2015, in
addition to the bilateral debt facilities drawn above, $10.0 million of the bilateral debt facilities
available was used to support a $10.0 million bank guarantee (30 June 2015: $10.0 million for bank
guarantee).
The bank guarantee assists with the Responsible Entity’s compliance with its Australian Financial
Services Licence.
A$ medium term notes (A$ MTN)
In April 2015 the Group issued AUD denominated unsecured medium term notes with aggregate face
value of $175.0 million (A$ MTN). These notes are fixed rate notes with a coupon of 3.75% and
expire in April 2021.
US Notes
In August 2014 the Group issued unsecured notes with aggregate face value of US$150.0 million and
A$50.0 million (equivalent at the date of issue in total to A$209.8 million) to US private investors (US
Notes). These US Notes are rated Baa1 by Moody’s Investor Services (Moody’s).
The maturity profile of the notes is US$100.0 million expiring August 2027, and US$50.0 million and
A$50.0 million expiring August 2029. The principal and coupon obligations have been fully
economically swapped back to Australian dollars (floating interest rates) through cross currency
interest rate swaps. Movements in the market value of the cross currency interest rate swaps are
included in the Group’s profit and loss though changes in fair value.
The value of the US$150.0 million notes are translated at the prevailing foreign exchange rate. At 31
December 2015 this was AUD 1.00 = USD 0.7284 which resulted in a translated value of the
US$150.0 million notes of A$205.9 million. The Group however has economically hedged its
exposure to the foreign exchange risk inherent in the carrying value of its US dollar borrowings by
using cross currency interest rate swap contracts. Under the cross currency interest rate swap
contracts, the Group has agreed to exchange specified principal and interest foreign currency
amounts at agreed future dates at a specified exchange rate. Such contracts have enabled the
Group to mitigate the risk of adverse movements in foreign exchange rates in relation to principal and
interest payments arising under the US dollar note issue. Under these swaps the Group has and will
receive fixed amounts in US dollars and pay variable interest rates (in A$ based on Australian
BBSW).
For
per
sona
l use
onl
y
Page 33
Shopping Centres Australasia Property Group Notes to the Consolidated Financial Statements
For the half year ended 31 December 2015
30
The cross currency interest rate swaps also include an exchange of principal pursuant to which the
US$150.0 million received in August 2014 has been swapped to A$159.8 million using an exchange
rate of AUD 1.00 = USD 0.9387. On maturity the A$159.8 million will be swapped back to US$150.0
million.
Therefore the foreign currency principal and interest amounts payable on the USD denominated US
Notes have been fully economically hedged by the use of cross currency interest rate swaps.
The difference in the value of the USD notes translated at the prevailing exchange rate of AUD 1.00 =
USD 0.7284 or A$205.9 million and the amount received of A$159.8 million (being A$46.1 million) is
the cumulative unrealised foreign exchange loss.
The cross currency interest rate swaps are valued for financial reporting purposes separately from the
US Notes. Refer note 8.
Unsecured Debt Usage and Maturity
The debt maturity profile in respect of interest bearing liabilities is set out below.
1 Drawn includes $10.0 million allocation of facility limit used for a $10.0 million bank guarantee (30 June 2015:
$10.0 million respectively).
31 December 2015
Unsecured Debt Facilities Facility Limit Drawn
$m $m
Bank Bilateral Facilities
Bank bilateral 25.0 -
Bank bilateral 25.0 25.0
Bank bilateral 140.0 124.5
Bank bilateral 25.0 20.0
Bank bilateral1 75.0 67.0
Bank bilateral 80.0 30.0
Bank bilateral 75.0 75.0
445.0 341.5
A$ Medium term note
A$ denominated 175.0 175.0 -
US Notes
US$ denominated (converted to A$) 137.3 137.3 -
US$ denominated (converted to A$) 68.6 68.6 -
A$ denominated 50.0 50.0 -
255.9 255.9 -
Total unsecured financing facilities 875.9 772.4 103.5
Undrawn
$m
8.0
-
5.0
25.0
50.0
15.5
-
Facility Maturity
Date
Dec-19
Dec-18
103.5
Dec-19
Aug-29
Aug-29
Aug-27
Apr-21
Feb-19
Nov-18
Dec-19
Dec-18
For
per
sona
l use
onl
y
Page 34
Shopping Centres Australasia Property Group Notes to the Consolidated Financial Statements
For the half year ended 31 December 2015
31
1 Drawn includes $10.0 million allocation of facility limit used for a $10.0 million bank guarantee.
As at 31 December 2015 the total debt facilities available were $875.9 million (30 June 2015: $839.5
million).
Debt covenants
The Group is required to comply with certain financial covenants or obligations in respect of the
interest bearing liabilities. The major financial covenants or obligations which are common across all
types of interest bearing liabilities are summarised as follows:
(a) Interest cover ratio (EBITDA to net interest expense) is more than 2.00 times;
(b) Gearing ratio (finance debt net of cash and cross currency swaps divided by total tangible
assets net of cash and derivatives) does not exceed 50%;
(c) Priority indebtedness ratio (priority debt to total tangible assets) does not exceed 10%; and
(d) Aggregate of the total tangible assets held by the Obligors represents not less than 90% of
the total tangible assets of the Group.
The Group was in compliance with all of the financial covenants and obligations for the period ended
and as at 31 December 2015.
30 June 2015
Unsecured Bank Bilateral Facilities Facility Limit Drawn
$m $m
Bank Facilities
Bank bilateral 25.0 - Nov-17
Bank bilateral1 75.0 75.0 Dec-17
Bank bilateral 75.0 10.0 Dec-17
Bank bilateral 25.0 - Nov-18
Bank bilateral 140.0 108.3 Dec-18
Bank bilateral 25.0 25.0 Dec-18
Bank bilateral 25.0 25.0 Dec-18
Bank bilateral 30.0 30.0 Dec-19
420.0 273.3
A$ Medium term note
A$ denominated 175.0 175.0 Apr-21
US Notes
US$ denominated (converted to A$) 129.7 129.7 - Aug-27
US$ denominated (converted to A$) 64.8 64.8 - Aug-29
A$ denominated 50.0 50.0 - Aug-29
244.5 244.5 -
Total unsecured financing facilities 839.5 692.8 146.7
-
-
25.0
-
65.0
25.0
31.7
Date
Facility Maturity
-
-
146.7
$m
Undrawn
For
per
sona
l use
onl
y
Page 35
Shopping Centres Australasia Property Group Notes to the Consolidated Financial Statements
For the half year ended 31 December 2015
32
Capital management – management gearing
The Group manages its debt by reference to its gearing ratio. Its gearing ratio is determined by:
Finance debt, where the US Notes US$ denominated debt is recorded as the A$ amount received
and economically hedged in A$, net of cash divided by total tangible assets net of cash and
derivatives. As the US Notes USD denominated debt has been fully economically hedged, for this
purpose the US Notes US$ denominated debt of US$150.0 million is recorded at its economically
hedged value of A$159.8 million. This also results in management gearing being based on a constant
currency basis.
The value of the US$ denominated debt of US$150.0 million converted at the prevailing spot rate at
31 December 2015 of 0.7284 was A$205.9 million. The difference of $46.1 million (being the
difference between the economically hedged value of $159.8 million and the prevailing spot value of
A$205.9 million) has been treated as an unrealised foreign exchange loss.
The Group’s gearing was 34.2% as at 31 December 2015 (30 June 2015: 33.3%).
The Group’s target gearing range is within 30% to 40% with a preference to be around 35%. The
Group’s gearing calculation is below.
Gearing (management) 31 Dec 2015 30 Jun 2015
$m $m
Bilateral and A$ notes
Unsecured bilateral facilities drawn 331.5 263.3
Unsecured bilateral facilities used for bank
guarantee10.0 10.0
Unsecured A$ medium term notes 175.0 175.0
516.5 448.3
US Notes
US$ denominated notes - USD face value 150.0 150.0
Economically hedged exchange rate 0.9387 0.9387
US$ denominated notes - AUD equivalent 159.8 159.8
A$ denominated notes 50.0 50.0
Total US Notes 209.8 209.8
Total debt used and drawn AU$ equivalent 726.3 658.1
Less: cash and cash equivalents (4.5) (3.7)
Net debt for gearing 721.8 654.4
Total Assets 2,177.7 2,021.0
Less: cash and cash equivalents (4.5) (3.7)
Less: derivative value included in total assets (64.8) (49.9)
Net total assets for gearing 2,108.4 1,967.4
Gearing (management) 34.2% 33.3%
For
per
sona
l use
onl
y
Page 36
Shopping Centres Australasia Property Group Notes to the Consolidated Financial Statements
For the half year ended 31 December 2015
33
6. Contributed equity
31 Dec 2015 30 Jun 2015 31 Dec 2015 30 Jun 2015
$m $m $m $m
Equity 1,235.0 1,228.1 1,227.6 1,220.7
Issue Costs (28.4) (28.4) (28.3) (28.3)
1,206.6 1,199.7 1,199.3 1,192.4
Equity of Management Trust
Opening balance 7.3 6.4
Equity raised through unitholder purchase
plan in April 2015- 0.4
Equity raised through institutional
placement in June 2015- 0.5
Closing balance 7.3 7.3
Equity of Retail Trust
Opening balance 1,192.4 1,049.0 1,192.4 1,049.0
Equity issued through distribution
reinvestment plan August 20156.9 - 6.9 -
Equity issued through distribution
reinvestment plan January 2015- 4.1 - 4.1
Equity raised through unitholder purchase
plan in April 2015- 61.7 - 61.7
Equity raised through institutional
placement in June 2015- 79.5 - 79.5
Issue Costs - (1.9) - (1.9)
Closing balance 1,199.3 1,192.4 1,199.3 1,192.4
Balance at the end of the period is
attributable to unit holders of:
Shopping Centres Australasia Property
Management Trust7.3 7.3 - -
Shopping Centres Australasia Property
Retail Trust1,199.3 1,192.4 1,199.3 1,192.4
1,206.6 1,199.7 1,199.3 1,192.4
SCA Property Group Retail Trust
For
per
sona
l use
onl
y
Page 37
Shopping Centres Australasia Property Group Notes to the Consolidated Financial Statements
For the half year ended 31 December 2015
34
As long as Shopping Centres Australasia Property Group remains jointly quoted, the number of units
in each of the Trusts shall be equal and the unitholders identical.
7. Segment reporting table
The Group and the Retail Trust invest in shopping centres located in Australia and New Zealand and
the chief decision makers of the Group base their decisions on these segments.
The Management Trust operates within one segment, Australia.
No segmental reporting is shown for Shopping Centres Australasia Property Retail Trust as this is not
required under AASB 8.
31 Dec 2015 30 Jun 2015 31 Dec 2015 30 Jun 2015
No. of units No. of units No. of units No. of units
Opening balance 721,488,543 648,628,320 721,488,543 648,628,320
Equity issued for executive security based
compensation arrangements - 3 July 2015100,000 - 100,000 -
Equity raised through Distribution
Reinvestment Plan - 28 August 20153,278,549 - 3,278,549 -
Equity raised through Distribution
Reinvestment Plan - 30 January 2015- 2,211,262 - 2,211,262
Equity raised through Unitholder Purchase
Plan - 9 April 2015- 31,045,000 - 31,045,000
Equity raised through institutional
placement - 18 June 2015- 39,603,961 - 39,603,961
Closing balance 724,867,092 721,488,543 724,867,092 721,488,543
SCA Property Group Retail Trust
For
per
sona
l use
onl
y
Page 38
Shopping Centres Australasia Property Group Notes to the Consolidated Financial Statements
For the half year ended 31 December 2015
35
8. Financial instruments
The fair values of interest rate and cross currency derivatives are determined using a generally
accepted pricing model based on discounted cash flow analysis using assumptions supported by
observable market rates.
The Directors consider that the carrying amounts of other financial assets and financial liabilities,
which are recognised at amortised cost in the Interim Financial Report, approximates their fair values.
The amortised cost of the US Notes, converted to AUD for the USD denominated Notes at the
prevailing foreign exchange rate at 31 December 2015 (which was AUD 1.00 = USD 0.728), is
$255.9m (refer note 5). The fair value of the US Notes can be different to the carrying value. The fair
value, additionally, takes into account movements in the underlying base interest rates and credit
spreads for similar instruments including extrapolated yield curves over the tenor of the notes. On
this basis the estimated fair value of the US Notes and the A$ MTN is $266.4 million and $166.6
million respectively (30 June 2015: $248.7 million and $170.0 million respectively).
The foreign currency principal and interest amounts payable on the USD denominated US Notes have
been fully hedged economically by the use of cross currency interest rate swaps.
31 Dec 2015 31 Dec 2014 31 Dec 2015 31 Dec 2014 31 Dec 2015 31 Dec 2014 31 Dec 2015 31 Dec 2014
$m $m $m $m $m $m $m $m
Income and expenses
Revenue
Rental income1 85.5 76.0 9.3 9.3 - - 94.8 85.3
Other property income 3.4 0.5 - - - - 3.4 0.5
Funds management revenue 1.0 - - - - - 1.0 -
89.9 76.5 9.3 9.3 - - 99.2 85.8
Expenses
Property expenses (28.0) (22.4) (1.0) (1.0) - - (29.0) (23.4)
Corporate costs - - - - (5.9) (5.7) (5.9) (5.7)
(28.0) (22.4) (1.0) (1.0) (5.9) (5.7) (34.9) (29.1)
Segment result 61.9 54.1 8.3 8.3 (5.9) (5.7) 64.3 56.7
Fair value adjustments on
investment properties21.8 45.5 16.2 1.3 - - 38.0 46.8
Fair value adjustments on
derivatives- - - - 14.4 38.3 14.4 38.3
Fair value adjustments on financial
assets- - - - - (2.4) - (2.4)
Share of net profit from investments
accounted for using the equity
method
- - - - 0.2 - 0.2 -
Foreign exchange losses - - - - (11.4) (23.1) (11.4) (23.1)
Transaction costs - - - - - (0.1) - (0.1)
Interest income - - - - 0.1 0.1 0.1 0.1
Financing costs - - - - (13.5) (17.1) (13.5) (17.1)
Tax - - - - (1.3) (1.0) (1.3) (1.0)
Net profit / (loss) after tax for the
year attributable to unitholders83.7 99.6 24.5 9.6 (17.4) (11.0) 90.8 98.2
1 For the purposes of segment reporting $48.0 million in rental income (31 December 2014: $49.0 million) was from a single customer.
Australia New Zealand Unallocated Total
For
per
sona
l use
onl
y
Page 39
Shopping Centres Australasia Property Group Notes to the Consolidated Financial Statements
For the half year ended 31 December 2015
36
The following table represents financial assets and liabilities that were measured and recognised at
fair value:
Interest Rate Swaps and Cross Currency Interest Rate Swaps
The value of the cross currency interest rate swaps relates to cross currency interest rate swaps
taken out to economically hedge the foreign currency exposure US Notes issued by the Group. The
cross currency interest rate swaps are fair valued separately to the US Notes. The value of the cross
currency interest rate swaps at 31 December 2015 was $57.2 million (30 June 2015: $43.3 million).
Movements in the market value of the interest rate and cross currency interest rate swaps are
included in the Group’s profit and loss though changes in fair value.
Fair value hierarchy
The table below analyses the cross currency interest rate and interest rate swaps carried at fair value
by valuation method. The different levels have been defined as follows:
Level 1: quoted prices (unadjusted) in active markets for identical assets or liabilities;
Level 2: inputs other than quoted prices included within Level 1 that are observable for the
asset or liability, either directly (i.e. as prices) or indirectly (i.e. derived from prices); and
Level 3: inputs from the asset or liability that are not based on observable market data
(unobservable inputs).
31 Dec 2015 30 Jun 2015 31 Dec 2015 30 Jun 2015
$m $m $m $m
Current assets
Interest rate swap contracts 1.1 1.2 1.1 1.2
Cross currency interest rate swap contracts 2.3 2.0 2.3 2.0
3.4 3.2 3.4 3.2
Non-current assets
Interest rate swap contracts 6.5 5.4 6.5 5.4
Cross currency interest rate swap contracts 54.9 41.3 54.9 41.3
61.4 46.7 61.4 46.7
Current liabilities
Interest rate swap contracts 0.4 0.1 0.4 0.1
0.4 0.1 0.4 0.1
Non-current liabilities
Interest rate swap contracts 0.2 0.1 0.2 0.1
0.2 0.1 0.2 0.1
SCA Property Group Retail Trust
For
per
sona
l use
onl
y
Page 40
Shopping Centres Australasia Property Group Notes to the Consolidated Financial Statements
For the half year ended 31 December 2015
37
Level 1 Level 2 Level 3 Total
$m $m $m $m
31 December 2015
SCA Property Group
Financial assets carried at fair value
Interest rate swap contracts - 7.6 - 7.6
Cross currency interest rate swap contracts - 57.2 - 57.2
- 64.8 - 64.8
Financial liabilities carried at fair value
Interest rate swap contracts - 0.6 - 0.6
Retail Trust
Financial assets carried at fair value
Interest rate swap contracts - 7.6 - 7.6
Cross currency interest rate swap contracts - 57.2 - 57.2
- 64.8 - 64.8
Financial liabilities carried at fair value
Interest rate swap contracts - 0.6 - 0.6
30 June 2015
SCA Property Group
Financial assets carried at fair value
Interest rate swaps - 6.6 - 6.6
Cross currency swaps - 43.3 - 43.3
- 49.9 - 49.9
Financial liabilities carried at fair value
Interest rate swaps - 0.2 - 0.2
Retail Trust
Financial assets carried at fair value
Interest rate swaps - 6.6 - 6.6
Cross currency swaps - 43.3 - 43.3
- 49.9 - 49.9
Financial liabilities carried at fair value
Interest rate swaps - 0.2 - 0.2
For
per
sona
l use
onl
y
Page 41
Shopping Centres Australasia Property Group Notes to the Consolidated Financial Statements
For the half year ended 31 December 2015
38
For financial instruments not quoted in active markets, the Group uses valuation techniques such as
present value, comparison to similar instruments for which market observable prices exist and other
relevant models used by market participants. These valuation techniques use both observable and
unobservable market inputs.
Interest rate derivatives are financial instruments that use valuation techniques with only observable
market inputs and are included in Level 2 above.
The Group does not have any Level 3 financial instruments other than as noted in note 10 below.
There were no transfers between levels during the half year.
9. Investment in associate
On 1 October 2016 the Retail Trust acquired 7,959,000 units in the SCA Unlisted Retail Fund 1
(SURF 1) at $1.00 each. SURF 1 is an unlisted closed end property fund investing in five retail
properties purchased from the Group on 1 October 2015. The Groups interest in SURF 1 is 24.4%.
Associates are entities over which the Group has significant influence but not control. The Group has
considered its interest in SURF 1 and its ability to control SURF 1 or have significant influence. The
Group does not regard its interest as sufficient for control but does regard its interest as sufficient for
significant influence. This interest is accounted for using the equity method of accounting after being
initially recognised at cost.
The Group has no exposure to contingent liabilities in relation to its investment in associate.
31 Dec 2015 30 Jun 2015 31 Dec 2015 30 Jun 2015
$m $m $m $m
Total investment in associate 8.2 - 8.2 -
31 Dec 2015 30 Jun 2015 31 Dec 2015 30 Jun 2015
$m $m $m $m
Movement in investment in associate
Opening balance - - - -
Acquisitions to equity accounted
investment
8.0 - 8.0 -
Share of profits after income tax 0.4 - 0.4 -
Distributions received or receivable (0.2) - (0.2) -
Closing balance 8.2 - 8.2 -
SCA Property Group Retail Trust
SCA Property Group Retail Trust
For
per
sona
l use
onl
y
Page 42
Shopping Centres Australasia Property Group Notes to the Consolidated Financial Statements
For the half year ended 31 December 2015
39
10. Other financial assets
Other financial assets of $2.4 million is the amount paid for the call option paid in December 2014
when the Group agreed to purchase Clemton Park (NSW) on completion of the development via a put
and call option arrangement. Under this arrangement in December 2014 SCP paid $2.4 million for
the option. On completion of the development of the property the amount of $2.4 million forms part of
the purchase price paid for the property and SCP will acquire the property for $48.0 million less the
amount already paid. The completion of the development is expected to be in the calendar year
2017.
The option is classified as a Level 3 derivative valued at fair value through profit or loss. At 31
December 2015 it has been measured at fair value based on unobservable inputs similar to those
used in valuing the Group’s investment. It is also noted that the valuation of the completed
development will also be dependent on the estimated completion date (which is expected to be in
calendar year 2017) and the estimated rents at that time.
11. Payables
31 Dec 2015 30 Jun 2015 31 Dec 2015 30 Jun 2015
$m $m $m $m
Payables
Rent received in advance 9.1 1.8 9.1 1.8
Other payables 22.8 19.1 30.1 23.7
31.9 20.9 39.2 25.5
SCA Property Group Retail Trust
For
per
sona
l use
onl
y
Page 43
Shopping Centres Australasia Property Group Notes to the Consolidated Financial Statements
For the half year ended 31 December 2015
40
12. Subsequent events
During December 2015 the Group entered into a conditional agreement to acquire Greenbank
neighbourhood shopping centre (Queensland) for $23.0 million (excluding transaction costs). This
transaction settled in January 2016. This acquisition includes a call option for the Group to acquire
ten hectares of adjacent development land for $10.0 million exercisable at any time within the next 5
years (and the vendor has a put option which is exercisable in December 2020 if the call option is not
exercised by that time).
On 4 January 2016 Receivers and Managers were appointed to Dick Smith Holdings Limited (ASX:
DSH) (Dick Smith). This followed the appointment of Voluntary Administrators. The Group has four
leases with Dick Smith (three in Australia and one in New Zealand). The annual gross income from
these leases is $1.0 million. It is possible that some of these leases may continue or that part or all of
the space may be vacated and available for releasing.
On 18 January 2016 Woolworths Limited (ASX: WOW) (Woolworths) announced that it intended to
pursue an orderly prospective sale or wind-up of the business known as Masters Home Improvement
(Masters). The Group has a lease to Masters, in Mt Gambier (South Australia). Mt Gambier
comprises of a subregional centre together with a Masters. The annual gross income from Masters is
$1.7 million and the lease expires in May 2035. The site occupied by Masters in Mt Gambier was
independently and externally valued in December 2015 for $20.2 million on the basis of the existing
lease remaining in place.
The distribution declared in December 2015 and paid on 29 January 2016 resulted in $17.4 million
being raised by the Distribution Reinvestment Plan (DRP) by the issue of 8.5 million units on 29
January 2016 (this was partially underwritten).
The Directors of the Responsible Entity are not aware of any other matter since the end of the half
year that has significantly or may significantly affect the operations of the Group, the result of those
operations, or state of the Group’s affairs in future financial periods.
For
per
sona
l use
onl
y
Page 44
Shopping Centres Australasia Property Group Directors’ Declaration
For the half year ended 31 December 2015
41
In the opinion of the Directors of Shopping Centres Australasia Property Group RE Limited, the
Responsible Entity of Shopping Centres Australasia Property Management Trust and Shopping
Centres Australasia Property Retail Trust (the “Retail Trust”):
(a) The Financial Statements and Notes, of Shopping Centres Australasia Property Management
Trust and its controlled entities, including Shopping Centres Australasia Property Retail Trust
and its controlled entities, (the “Group”), set out on pages 11 to 40 are in accordance with the
Corporations Act 2001, including:
(i) giving a true and fair view of the Group’s and the Retail Trust’s financial position as at
31 December 2015 and of their performance, for the half year ended 31 December
2015; and
(ii) complying with Australian Accounting Standards (including Australian Accounting
Interpretations) and the Corporations Regulations 2001;
(b) there are reasonable grounds to believe that both the Group and the Retail Trust will be able to
pay their debts as and when they become due and payable.
The Directors have been given the declaration in a form similar to that required by Section 295A of
the Corporations Act 2001 from the Chief Executive Officer and Chief Financial Officer for the half
year ended 31 December 2015.
Signed in accordance with a resolution of the Directors:
Chairman
Sydney
8 February 2016
For
per
sona
l use
onl
y
Page 45
Liability limited by a scheme approved under Professional Standards Legislation.
Member of Deloitte Touche Tohmatsu.
42
Independent Auditor’s Review Report
to the Stapled Security Holders of Shopping Centres
Australasia Property Management Trust and
Shopping Centres Australasia Property Retail Trust
We have reviewed the accompanying interim financial report of Shopping Centres Australasia
Property Management Trust (“SCA Property Management Trust”), and the accompanying interim
financial report of Shopping Centres Australasia Property Retail Trust (“SCA Property Retail Trust”)
which comprise the consolidated statements of financial position as at 31 December 2015, the
consolidated statements of profit or loss, the consolidated statements of profit or loss and other
comprehensive income, the consolidated statements of cash flows and the consolidated statements of
changes in equity for the half year ended on that date, notes comprising a summary of significant
accounting policies and other explanatory information, and the directors’ declaration of the
consolidated entities Shopping Centres Australasia Property Group (“the consolidated stapled entity”)
and SCA Property Retail Trust as set out on pages 11 to 41. The consolidated stapled entity, as
described in Note 1 to the financial report, comprises SCA Property Management Trust and the
entities it controlled at the end of the half year or from time to time during the half year, including
SCA Property Retail Trust and its controlled entities. SCA Property Retail Trust, as described in Note
1 to the financial report, comprises SCA Property Retail Trust and the entities it controlled at the end
of the half year or from time to time during the half year.
Directors’ Responsibility for the Financial Report
The directors of the Responsible Entity of SCA Property Management Trust and SCA Property Retail Trust (“the directors”) are responsible for the preparation of the interim financial report that gives a
true and fair view in accordance with Australian Accounting Standards and the Corporations Act 2001
and for such internal control as the directors determine is necessary to enable the preparation of the interim financial report that gives a true and fair view and is free from material misstatement, whether
due to fraud or error.
Auditor’s Responsibility
Our responsibility is to express a conclusion on the interim financial report based on our review. We
conducted our review in accordance with Australian Auditing Standards on Review Engagements ASRE 2410 Review of a Financial Report Performed by the Independent Auditor of the Entity, in
order to state whether, on the basis of the procedures described, we have become aware of any matter
Deloitte Touche Tohmatsu
A.B.N. 74 490 121 060
Grosvenor Place
225 George Street
Sydney NSW 2000
PO Box N250 Grosvenor Place
Sydney NSW 1220 Australia
DX 10307SSE
Tel: +61 (0) 2 9322 7000
Fax: +61 (0) 2 9322 7001
www.deloitte.com.au
For
per
sona
l use
onl
y
Page 46
43
that makes us believe that the interim financial report is not in accordance with the Corporations Act
2001 including: giving a true and fair view of SCA Property Management Trust and SCA Property
Retail Trust’s financial positions as at 31 December 2015 and their performance for the half year ended on that date; and complying with Accounting Standard AASB 134 Interim Financial Reporting
and the Corporations Regulations 2001. As the auditor of SCA Property Management Trust and SCA
Property Retail Trust, ASRE 2410 requires that we comply with the ethical requirements relevant to
the audit of the annual financial reports.
A review of an interim financial report consists of making enquiries, primarily of persons responsible
for financial and accounting matters, and applying analytical and other review procedures. A review is substantially less in scope than an audit conducted in accordance with Australian Auditing
Standards and consequently does not enable us to obtain assurance that we would become aware of all
significant matters that might be identified in an audit. Accordingly, we do not express an audit
opinion.
Auditor’s Independence Declaration
In conducting our review, we have complied with the independence requirements of the Corporations
Act 2001. We confirm that the independence declaration required by the Corporations Act 2001,
which has been given to the directors of the Responsible Entity of SCA Property Management Trust and SCA Property Retail Trust, would be in the same terms if given to the directors as at the time of
this auditor’s review report.
Conclusion
Based on our review, which is not an audit, we have not become aware of any matter that makes us
believe that the interim financial reports of SCA Property Management Trust and SCA Property Retail Trust are not in accordance with the Corporations Act 2001, including:
(a) giving a true and fair view of the consolidated entities’ financial positions as at 31 December 2015 and of their performance for the half year ended on that date; and
(b) complying with Accounting Standard AASB 134 Interim Financial Reporting and the
Corporations Regulations 2001.
DELOITTE TOUCHE TOHMATSU
AG Collinson Partner
Chartered Accountants
Sydney, 8 February 2016 For
per
sona
l use
onl
y