76
Appendix B HCS 2010 ANALYTICAL REPORTS - SIGNALIZED AND NON-SIGNALIZED INTERSECTIONS (AM PEAK HOUR)
| Date post: | 12-Apr-2018 |
| Category: |
Documents |
| Upload: | truonghanh |
| View: | 215 times |
| Download: | 1 times |

Appendix B
HCS 2010 ANALYTICAL REPORTS - SIGNALIZED AND NON-SIGNALIZED INTERSECTIONS
(AM PEAK HOUR)

HCS+: Unsignalized Intersections Release 5.6 Phone: Fax: E-Mail: ___________________ALL-WAY STOP CONTROL(AWSC) ANALYSIS________________________ Analyst: Mark Hays Agency/Co.: TCAG Date Performed: 5/4/2017 Analysis Time Period: AM Peak Intersection: Kern @ J St Jurisdiction: Dinuba Units: U. S. Customary Analysis Year: 2017 Project ID: 2017 Intersection Monitoring East/West Street: J Street North/South Street: Kern Ave _________Worksheet 2 - Volume Adjustments and Site Characteristics____________ | Eastbound | Westbound | Northbound | Southbound | | L T R | L T R | L T R | L T R | |_______________|_______________|_______________|_______________| Volume |29 79 12 |18 46 59 |8 61 21 |33 40 24 | % Thrus Left Lane Eastbound Westbound Northbound Southbound L1 L2 L1 L2 L1 L2 L1 L2 Configuration LTR LTR LTR LTR PHF 0.44 0.59 0.50 0.50 Flow Rate 271 207 180 194 % Heavy Veh 3 3 3 3 No. Lanes 1 1 1 1 Opposing-Lanes 1 1 1 1 Conflicting-lanes 1 1 1 1 Geometry group 1 1 1 1 Duration, T 0.25 hrs. ___________Worksheet 3 - Saturation Headway Adjustment Worksheet______________ Eastbound Westbound Northbound Southbound L1 L2 L1 L2 L1 L2 L1 L2 Flow Rates: Total in Lane 271 207 180 194 Left-Turn 65 30 16 66 Right-Turn 27 100 42 48 Prop. Left-Turns 0.2 0.1 0.1 0.3 Prop. Right-Turns 0.1 0.5 0.2 0.2 Prop. Heavy Vehicle0.0 0.0 0.0 0.0 Geometry Group 1 1 1 1 Adjustments Exhibit 17-33: hLT-adj 0.2 0.2 0.2 0.2
2017 Intersection Monitoring Report Tulare County Association of Governments
Page 1 September 2017

hRT-adj -0.6 -0.6 -0.6 -0.6 hHV-adj 1.7 1.7 1.7 1.7 hadj, computed 0.0 -0.2 -0.1 -0.0 _______________Worksheet 4 - Departure Headway and Service Time_______________ Eastbound Westbound Northbound Southbound L1 L2 L1 L2 L1 L2 L1 L2 Flow rate 271 207 180 194 hd, initial value 3.20 3.20 3.20 3.20 3.20 3.20 3.20 3.20 x, initial 0.24 0.18 0.16 0.17 hd, final value 5.34 5.20 5.48 5.49 x, final value 0.402 0.299 0.274 0.296 Move-up time, m 2.0 2.0 2.0 2.0 Service Time 3.3 3.2 3.5 3.5 _______________Worksheet 5 - Capacity and Level of Service____________________ Eastbound Westbound Northbound Southbound L1 L2 L1 L2 L1 L2 L1 L2 Flow Rate 271 207 180 194 Service Time 3.3 3.2 3.5 3.5 Utilization, x 0.402 0.299 0.274 0.296 Dep. headway, hd 5.34 5.20 5.48 5.49 Capacity 678 690 667 647 95% Queue Length 1.9 1.3 1.1 1.2 Delay 11.9 10.4 10.5 10.8 LOS B B B B Approach: Delay 11.9 10.4 10.5 10.8 LOS B B B B Intersection Delay 11.0 Intersection LOS B ______________________________________________________________________________
2017 Intersection Monitoring Report Tulare County Association of Governments
Page 2 September 2017

HCS7 Two-Way Stop-Control Report
General Information Site InformationAnalyst Mark Hays Intersection Ventura @ J St
Agency/Co. TCAG Jurisdiction Dinuba
Date Performed 5/4/2017 East/West Street Ventura Ave
Analysis Year 2017 North/South Street J St
Time Analyzed AM Peak Peak Hour Factor 0.56
Intersection Orientation North-South Analysis Time Period (hrs) 0.25
Project Description 2017 Intersection Monitoring
Lanes
Major Street: North-South
Vehicle Volumes and AdjustmentsApproach Eastbound Westbound Northbound Southbound
Movement U L T R U L T R U L T R U L T R
Priority 10 11 12 7 8 9 1U 1 2 3 4U 4 5 6
Number of Lanes 0 1 0 0 1 0 0 0 1 0 0 0 1 0
Configuration LTR LTR LTR LTR
Volume, V (veh/h) 26 2 15 0 0 0 19 103 7 11 80 43
Percent Heavy Vehicles (%) 4 4 4 4 4 4 4 4
Proportion Time Blocked
Percent Grade (%) 0 0
Right Turn Channelized No No No No
Median Type/Storage Undivided
Critical and Follow-up HeadwaysBase Critical Headway (sec)
Critical Headway (sec)
Base Follow-Up Headway (sec)
Follow-Up Headway (sec)
Delay, Queue Length, and Level of ServiceFlow Rate, v (veh/h) 77 0 34 20
Capacity, c (veh/h) 57 0 688 1041
v/c Ratio 1.35 0.05 0.02
95% Queue Length, Q₉₅ (veh) 6.8 0.2 0.1
Control Delay (s/veh) 359.0 5.0 10.5 8.5
Level of Service, LOS F A B A
Approach Delay (s/veh) 359.0 5.0 2.1 0.9
Approach LOS F A
Copyright © 2017 University of Florida. All Rights Reserved. HCS7™ TWSC Version 7.2.1 Generated: 8/7/2017 7:25:05 AMVentura @ J St.xtw
2017 Intersection Monitoring Report Tulare County Association of Governments
Page 3 September 2017

HCS7 Two-Way Stop-Control Report
General Information Site InformationAnalyst Mark Hays Intersection Crawford @ Saginaw
Agency/Co. TCAG Jurisdiction Dinuba
Date Performed 5/4/2017 East/West Street E Saginaw
Analysis Year 2017 North/South Street Crawford
Time Analyzed AM Peak Peak Hour Factor 0.71
Intersection Orientation North-South Analysis Time Period (hrs) 0.25
Project Description 2017 Intersection Monitoring
Lanes
Major Street: North-South
Vehicle Volumes and AdjustmentsApproach Eastbound Westbound Northbound Southbound
Movement U L T R U L T R U L T R U L T R
Priority 10 11 12 7 8 9 1U 1 2 3 4U 4 5 6
Number of Lanes 0 1 0 0 1 0 0 1 1 0 0 0 1 0
Configuration LTR LTR L TR LTR
Volume, V (veh/h) 9 0 87 3 0 4 140 332 3 1 399 42
Percent Heavy Vehicles (%) 2 2 2 2 2 2 2 2
Proportion Time Blocked
Percent Grade (%) 0 0
Right Turn Channelized No No No No
Median Type/Storage Undivided
Critical and Follow-up HeadwaysBase Critical Headway (sec) 7.1 6.5 6.2 7.1 6.5 6.2 4.1 4.1
Critical Headway (sec) 7.12 6.52 6.22 7.12 6.52 6.22 4.12 4.12
Base Follow-Up Headway (sec) 3.5 4.0 3.3 3.5 4.0 3.3 2.2 2.2
Follow-Up Headway (sec) 3.52 4.02 3.32 3.52 4.02 3.32 2.22 2.22
Delay, Queue Length, and Level of ServiceFlow Rate, v (veh/h) 136 10 197 1
Capacity, c (veh/h) 327 131 913 1089
v/c Ratio 0.42 0.08 0.22 0.00
95% Queue Length, Q₉₅ (veh) 2.0 0.2 0.8 0.0
Control Delay (s/veh) 23.7 34.8 10.0 8.3
Level of Service, LOS C D B A
Approach Delay (s/veh) 23.7 34.8 3.0 0.0
Approach LOS C D
Copyright © 2017 University of Florida. All Rights Reserved. HCS7™ TWSC Version 7.2.1 Generated: 8/7/2017 7:22:46 AMCrawford @ Saginaw.xtw
2017 Intersection Monitoring Report Tulare County Association of Governments
Page 4 September 2017

HCS7 Signalized Intersection Results Summary
General Information Intersection Information
Agency Duration, h 0.25
Analyst Analysis Date 5/18/2017 Area Type Other
Jurisdiction Time Period PHF 0.69
Urban Street Dinuba Analysis Year 2017 Analysis Period 1> 7:00
Intersection El Monte @ Perry File Name El Monte @ Perry.xus
Project Description 2017 Intersection Monitoring
Demand Information EB WB NB SB
Approach Movement L T R L T R L T R L T R
Demand ( v ), veh/h 13 268 9 123 392 5 13 87 204 14 115 31
Signal Information
GreenYellowRed
20.0 35.0 20.0 0.0 0.0 0.03.6 4.0 3.6 0.0 0.0 0.01.0 1.0 1.0 0.0 0.0 0.0
1 2 3 4
5 6 7
Cycle, s 89.2 Reference Phase 2
Offset, s 0 Reference Point End
Uncoordinated Yes Simult. Gap E/W On
Force Mode Fixed Simult. Gap N/S On
Timer Results EBL EBT WBL WBT NBL NBT SBL SBT
Assigned Phase 5 2 1 6 8 4
Case Number 2.0 4.0 2.0 4.0 8.0 7.0
Phase Duration, s 24.6 40.0 24.6 40.0 24.6 24.6
Change Period, ( Y+R c ), s 4.6 5.0 4.6 5.0 4.6 4.6
Max Allow Headway ( MAH ), s 3.1 3.0 3.1 3.0 3.3 3.3
Queue Clearance Time ( g s ), s 2.8 18.7 10.4 29.3 22.0 10.4
Green Extension Time ( g e ), s 0.0 1.8 0.2 1.3 0.0 1.2
Phase Call Probability 1.00 1.00 1.00 1.00 1.00 1.00
Max Out Probability 0.00 0.01 0.00 0.39 1.00 0.06
Movement Group Results EB WB NB SB
Approach Movement L T R L T R L T R L T R
Assigned Movement 5 2 12 1 6 16 3 8 18 7 4 14
Adjusted Flow Rate ( v ), veh/h 19 401 178 575 441 187 45
Adjusted Saturation Flow Rate ( s ), veh/h/ln 1641 1707 1641 1717 1524 1580 1408
Queue Service Time ( g s ), s 0.8 16.7 8.4 27.3 10.3 0.0 2.3
Cycle Queue Clearance Time ( g c ), s 0.8 16.7 8.4 27.3 20.0 8.4 2.3
Green Ratio ( g/C ) 0.22 0.39 0.22 0.39 0.22 0.22 0.22
Capacity ( c ), veh/h 368 670 368 674 384 399 316
Volume-to-Capacity Ratio ( X ) 0.051 0.599 0.485 0.854 1.148 0.469 0.142
Back of Queue ( Q ), ft/ln ( 50 th percentile) 8.5 177.8 93.6 324.2 461.3 96.9 21.1
Back of Queue ( Q ), veh/ln ( 50 th percentile) 0.3 7.0 3.7 12.8 18.2 3.8 0.8
Queue Storage Ratio ( RQ ) ( 50 th percentile) 0.17 0.00 1.25 0.00 0.00 0.00 0.42
Uniform Delay ( d 1 ), s/veh 27.2 21.5 30.1 24.8 35.7 30.1 27.7
Incremental Delay ( d 2 ), s/veh 0.3 3.9 4.5 13.0 92.8 3.9 0.9
Initial Queue Delay ( d 3 ), s/veh 0.0 0.0 0.0 0.0 0.0 0.0 0.0
Control Delay ( d ), s/veh 27.4 25.5 34.6 37.8 128.4 34.0 28.7
Level of Service (LOS) C C C D F C C
Approach Delay, s/veh / LOS 25.6 C 37.1 D 128.4 F 33.0 C
Intersection Delay, s/veh / LOS 55.7 E
Multimodal Results EB WB NB SB
Pedestrian LOS Score / LOS 2.1 B 2.3 B 2.3 B 2.3 B
Bicycle LOS Score / LOS 1.2 A 1.7 B 1.2 A 0.9 A
Copyright © 2017 University of Florida, All Rights Reserved. HCS7™ Streets Version 7.2.1 Generated: 8/7/2017 7:28:54 AM
2017 Intersection Monitoring Report Tulare County Association of Governments
Page 5 September 2017

HCS7 Two-Way Stop-Control Report
General Information Site InformationAnalyst Mark Hays Intersection E Tulare @ H St
Agency/Co. TCAG Jurisdiction Dinuba
Date Performed 5/5/2017 East/West Street E Tulare
Analysis Year 2017 North/South Street H St
Time Analyzed AM peak Peak Hour Factor 0.52
Intersection Orientation East-West Analysis Time Period (hrs) 0.25
Project Description 2017 Intersection Monitoring
Lanes
Major Street: East-West
Vehicle Volumes and AdjustmentsApproach Eastbound Westbound Northbound Southbound
Movement U L T R U L T R U L T R U L T R
Priority 1U 1 2 3 4U 4 5 6 7 8 9 10 11 12
Number of Lanes 0 0 1 0 0 0 1 0 0 1 1 0 1 0
Configuration LTR LTR LT R LTR
Volume, V (veh/h) 5 214 10 70 182 5 15 39 95 4 37 35
Percent Heavy Vehicles (%) 2 2 2 2 2 2 2 2
Proportion Time Blocked
Percent Grade (%) 0 0
Right Turn Channelized No No Yes No
Median Type/Storage Undivided
Critical and Follow-up HeadwaysBase Critical Headway (sec)
Critical Headway (sec)
Base Follow-Up Headway (sec)
Follow-Up Headway (sec)
Delay, Queue Length, and Level of ServiceFlow Rate, v (veh/h) 10 135 104 183 146
Capacity, c (veh/h) 1179 1120 143 626 242
v/c Ratio 0.01 0.12 0.72 0.29 0.60
95% Queue Length, Q₉₅ (veh) 0.0 0.4 4.2 1.2 3.5
Control Delay (s/veh) 8.1 8.7 77.8 13.1 40.3
Level of Service, LOS A A F B E
Approach Delay (s/veh) 0.3 3.3 36.6 40.3
Approach LOS E E
Copyright © 2017 University of Florida. All Rights Reserved. HCS7™ TWSC Version 7.2.1 Generated: 8/7/2017 7:23:59 AMTulare @ H St.xtw
2017 Intersection Monitoring Report Tulare County Association of Governments
Page 6 September 2017

HCS7 Two-Way Stop-Control Report
General Information Site InformationAnalyst Mark Hays Intersection Tulare @ Uruapan
Agency/Co. TCAG Jurisdiction Dinuba
Date Performed 5/17/2017 East/West Street W Tulare St
Analysis Year 2017 North/South Street Uruapan Way
Time Analyzed AM Peak Peak Hour Factor 0.80
Intersection Orientation East-West Analysis Time Period (hrs) 0.25
Project Description 2017 Intersection Monitoring
Lanes
Major Street: East-West
Vehicle Volumes and AdjustmentsApproach Eastbound Westbound Northbound Southbound
Movement U L T R U L T R U L T R U L T R
Priority 1U 1 2 3 4U 4 5 6 7 8 9 10 11 12
Number of Lanes 0 0 1 0 0 0 1 0 0 1 0 0 1 0
Configuration LTR LTR LTR LTR
Volume, V (veh/h) 6 159 5 26 115 31 8 33 20 15 28 10
Percent Heavy Vehicles (%) 1 1 1 1 1 1 1 1
Proportion Time Blocked
Percent Grade (%) 0 0
Right Turn Channelized No No No No
Median Type/Storage Undivided
Critical and Follow-up HeadwaysBase Critical Headway (sec)
Critical Headway (sec)
Base Follow-Up Headway (sec)
Follow-Up Headway (sec)
Delay, Queue Length, and Level of ServiceFlow Rate, v (veh/h) 8 32 76 66
Capacity, c (veh/h) 1378 1360 691 502
v/c Ratio 0.01 0.02 0.11 0.13
95% Queue Length, Q₉₅ (veh) 0.0 0.1 0.4 0.5
Control Delay (s/veh) 7.6 7.7 10.9 13.2
Level of Service, LOS A A B B
Approach Delay (s/veh) 0.3 1.3 10.9 13.2
Approach LOS B B
Copyright © 2017 University of Florida. All Rights Reserved. HCS7™ TWSC Version 7.2.1 Generated: 8/7/2017 7:24:31 AMTulare @ Uruapan.xtw
2017 Intersection Monitoring Report Tulare County Association of Governments
Page 7 September 2017

HCS7 Two-Way Stop-Control Report
General Information Site InformationAnalyst Mark Hays Intersection State Rout 65 @ San Juan
Agency/Co. TCAG Jurisdiction Exeter
Date Performed 5/10/2017 East/West Street San Juan
Analysis Year 2017 North/South Street SR-65
Time Analyzed AM Peak Peak Hour Factor 0.77
Intersection Orientation North-South Analysis Time Period (hrs) 0.25
Project Description 2017 Intersection Monitoring
Lanes
Major Street: North-South
Vehicle Volumes and AdjustmentsApproach Eastbound Westbound Northbound Southbound
Movement U L T R U L T R U L T R U L T R
Priority 10 11 12 7 8 9 1U 1 2 3 4U 4 5 6
Number of Lanes 0 0 0 1 0 1 0 0 1 0 0 1 1 0
Configuration L R TR L T
Volume, V (veh/h) 6 62 392 32 161 441
Percent Heavy Vehicles (%) 8 8 8
Proportion Time Blocked
Percent Grade (%) 0
Right Turn Channelized No No No No
Median Type/Storage Undivided
Critical and Follow-up HeadwaysBase Critical Headway (sec)
Critical Headway (sec)
Base Follow-Up Headway (sec)
Follow-Up Headway (sec)
Delay, Queue Length, and Level of ServiceFlow Rate, v (veh/h) 8 81 209
Capacity, c (veh/h) 95 534 988
v/c Ratio 0.08 0.15 0.21
95% Queue Length, Q₉₅ (veh) 0.3 0.5 0.8
Control Delay (s/veh) 46.2 12.9 9.6
Level of Service, LOS E B A
Approach Delay (s/veh) 15.9 2.6
Approach LOS C
Copyright © 2017 University of Florida. All Rights Reserved. HCS7™ TWSC Version 7.2.1 Generated: 8/7/2017 9:03:07 AMSR-65 @ San Juan.xtw
2017 Intersection Monitoring Report Tulare County Association of Governments
Page 8 September 2017

HCS7 All-Way Stop Control ReportGeneral Information Site Information
Analyst Mark Hays Intersection Sequoia @ D St
Agency/Co. TCAG Jurisdiction Exeter
Date Performed 6/12/2017 East/West Street Sequoia
Analysis Year 2017 North/South Street D St
Analysis Time Period (hrs) 0.25 Peak Hour Factor 0.59
Time Analyzed AM Peak
Project Description 2017 Intersection Monitoring
Lanes
Vehicle Volume and Adjustments
Approach Eastbound Westbound Northbound Southbound
Movement L T R L T R L T R L T R
Volume 58 18 6 111 27 19
% Thrus in Shared Lane
Lane L1 L2 L3 L1 L2 L3 L1 L2 L3 L1 L2 L3
Configuration TR LT L R
Flow Rate, v (veh/h) 129 198 46 32
Percent Heavy Vehicles 3 3 3 3
Departure Headway and Service Time
Initial Departure Headway, hd (s) 3.20 3.20 3.20 3.20
Initial Degree of Utilization, x 0.115 0.176 0.041 0.029
Final Departure Headway, hd (s) 4.23 4.31 5.78 4.57
Final Degree of Utilization, x 0.151 0.237 0.073 0.041
Move-Up Time, m (s) 2.0 2.0 2.3 2.3
Service Time, ts (s) 2.23 2.31 3.48 2.27
Capacity, Delay and Level of Service
Flow Rate, v (veh/h) 129 198 46 32
Capacity 851 836 623 787
95% Queue Length, Q₉₅ (veh) 0.5 0.9 0.2 0.1
Control Delay (s/veh) 8.0 8.6 8.9 7.5
Level of Service, LOS A A A A
Approach Delay (s/veh) 8.0 8.6 8.3
Approach LOS A A A
Intersection Delay, s/veh | LOS 8.4 A
Copyright © 2017 University of Florida. All Rights Reserved. HCS7™ AWSC Version 7.2.1 Generated: 8/7/2017 9:01:14 AMSequoia @ D St.xaw
2017 Intersection Monitoring Report Tulare County Association of Governments
Page 9 September 2017

HCS+: Unsignalized Intersections Release 5.6 Phone: Fax: E-Mail: ___________________ALL-WAY STOP CONTROL(AWSC) ANALYSIS________________________ Analyst: Mark Hays Agency/Co.: TCAG Date Performed: 5/8/2017 Analysis Time Period: AM Peak Intersection: Farmersville @ Ash Jurisdiction: Farmersville Units: U. S. Customary Analysis Year: 2017 Project ID: 2017 Interesction Monitoring East/West Street: Ash St North/South Street: Farmersville Blvd _________Worksheet 2 - Volume Adjustments and Site Characteristics____________ | Eastbound | Westbound | Northbound | Southbound | | L T R | L T R | L T R | L T R | |_______________|_______________|_______________|_______________| Volume |41 51 40 |38 52 70 |23 284 32 |69 269 28 | % Thrus Left Lane 50 50 Eastbound Westbound Northbound Southbound L1 L2 L1 L2 L1 L2 L1 L2 Configuration LTR LTR LT TR LT TR PHF 0.71 0.80 0.76 0.76 0.67 0.67 Flow Rate 184 198 216 228 301 242 % Heavy Veh 2 2 2 2 2 2 No. Lanes 1 1 2 2 Opposing-Lanes 1 1 2 2 Conflicting-lanes 2 2 1 1 Geometry group 2 2 5 5 Duration, T 0.25 hrs. ___________Worksheet 3 - Saturation Headway Adjustment Worksheet______________ Eastbound Westbound Northbound Southbound L1 L2 L1 L2 L1 L2 L1 L2 Flow Rates: Total in Lane 184 198 216 228 301 242 Left-Turn 57 47 30 0 102 0 Right-Turn 56 87 0 42 0 41 Prop. Left-Turns 0.3 0.2 0.1 0.0 0.3 0.0 Prop. Right-Turns 0.3 0.4 0.0 0.2 0.0 0.2 Prop. Heavy Vehicle0.0 0.0 0.0 0.0 0.0 0.0 Geometry Group 2 2 5 5 Adjustments Exhibit 17-33: hLT-adj 0.2 0.2 0.5 0.5
2017 Intersection Monitoring Report Tulare County Association of Governments
Page 10 September 2017

hRT-adj -0.6 -0.6 -0.7 -0.7 hHV-adj 1.7 1.7 1.7 1.7 hadj, computed -0.1 -0.2 0.1 -0.1 0.2 -0.1 _______________Worksheet 4 - Departure Headway and Service Time_______________ Eastbound Westbound Northbound Southbound L1 L2 L1 L2 L1 L2 L1 L2 Flow rate 184 198 216 228 301 242 hd, initial value 3.20 3.20 3.20 3.20 3.20 3.20 3.20 3.20 x, initial 0.16 0.18 0.19 0.20 0.27 0.22 hd, final value 6.82 6.69 6.90 6.69 6.85 6.55 x, final value 0.349 0.368 0.414 0.424 0.573 0.440 Move-up time, m 2.0 2.0 2.3 2.3 Service Time 4.8 4.7 4.6 4.4 4.5 4.3 _______________Worksheet 5 - Capacity and Level of Service____________________ Eastbound Westbound Northbound Southbound L1 L2 L1 L2 L1 L2 L1 L2 Flow Rate 184 198 216 228 301 242 Service Time 4.8 4.7 4.6 4.4 4.5 4.3 Utilization, x 0.349 0.368 0.414 0.424 0.573 0.440 Dep. headway, hd 6.82 6.69 6.90 6.69 6.85 6.55 Capacity 526 535 527 543 528 550 95% Queue Length 1.6 1.7 2.0 2.1 3.6 2.2 Delay 13.4 13.5 14.4 14.2 18.3 14.3 LOS B B B B C B Approach: Delay 13.4 13.5 14.3 16.5 LOS B B B C Intersection Delay 15.0- Intersection LOS B ______________________________________________________________________________
2017 Intersection Monitoring Report Tulare County Association of Governments
Page 11 September 2017

HCS7 Two-Way Stop-Control Report
General Information Site InformationAnalyst Mark Hays Intersection Visalia Rd @ Virginia St
Agency/Co. TCAG Jurisdiction Farmersville
Date Performed 5/8/2017 East/West Street Visalia Rd
Analysis Year 2017 North/South Street Virginia St
Time Analyzed Peak Hour Factor 0.78
Intersection Orientation East-West Analysis Time Period (hrs) 0.25
Project Description 2017 Intersection Monitoring
Lanes
Major Street: East-West
Vehicle Volumes and AdjustmentsApproach Eastbound Westbound Northbound Southbound
Movement U L T R U L T R U L T R U L T R
Priority 1U 1 2 3 4U 4 5 6 7 8 9 10 11 12
Number of Lanes 0 0 1 0 0 1 1 0 0 1 0 0 0 0
Configuration TR L T LR
Volume, V (veh/h) 278 12 12 412 8 27
Percent Heavy Vehicles (%) 2 2 2
Proportion Time Blocked
Percent Grade (%) 0
Right Turn Channelized No No No No
Median Type/Storage Undivided
Critical and Follow-up HeadwaysBase Critical Headway (sec)
Critical Headway (sec)
Base Follow-Up Headway (sec)
Follow-Up Headway (sec)
Delay, Queue Length, and Level of ServiceFlow Rate, v (veh/h) 15 45
Capacity, c (veh/h) 1185 528
v/c Ratio 0.01 0.09
95% Queue Length, Q₉₅ (veh) 0.0 0.3
Control Delay (s/veh) 8.1 12.5
Level of Service, LOS A B
Approach Delay (s/veh) 0.2 12.5
Approach LOS B
Copyright © 2017 University of Florida. All Rights Reserved. HCS7™ TWSC Version 7.2.1 Generated: 8/7/2017 9:06:36 AMVisalia @ Virginia.xtw
2017 Intersection Monitoring Report Tulare County Association of Governments
Page 12 September 2017

HCS7 Two-Way Stop-Control Report
General Information Site InformationAnalyst Mark Hays Intersection Farmersville @ E Oakland
Agency/Co. TCAG Jurisdiction Farmersville
Date Performed 5/17/2017 East/West Street East Oakland St
Analysis Year 2017 North/South Street Farmersville Blvd
Time Analyzed AM Peak Peak Hour Factor 0.75
Intersection Orientation North-South Analysis Time Period (hrs) 0.25
Project Description 2017 Intersection Monitoring
Lanes
Major Street: North-South
Vehicle Volumes and AdjustmentsApproach Eastbound Westbound Northbound Southbound
Movement U L T R U L T R U L T R U L T R
Priority 10 11 12 7 8 9 1U 1 2 3 4U 4 5 6
Number of Lanes 0 0 0 0 1 0 0 0 2 0 0 0 2 0
Configuration LR T TR LT T
Volume, V (veh/h) 3 48 117 2 33 135
Percent Heavy Vehicles (%) 1 1 1
Proportion Time Blocked
Percent Grade (%) 0
Right Turn Channelized No No No No
Median Type/Storage Undivided
Critical and Follow-up HeadwaysBase Critical Headway (sec)
Critical Headway (sec)
Base Follow-Up Headway (sec)
Follow-Up Headway (sec)
Delay, Queue Length, and Level of ServiceFlow Rate, v (veh/h) 68 44
Capacity, c (veh/h) 936 1425
v/c Ratio 0.07 0.03
95% Queue Length, Q₉₅ (veh) 0.2 0.1
Control Delay (s/veh) 9.1 7.6
Level of Service, LOS A A
Approach Delay (s/veh) 9.1 1.6
Approach LOS A
Copyright © 2017 University of Florida. All Rights Reserved. HCS7™ TWSC Version 7.2.1 Generated: 8/7/2017 9:04:43 AMFarmersville @ East Oakland.xtw
2017 Intersection Monitoring Report Tulare County Association of Governments
Page 13 September 2017
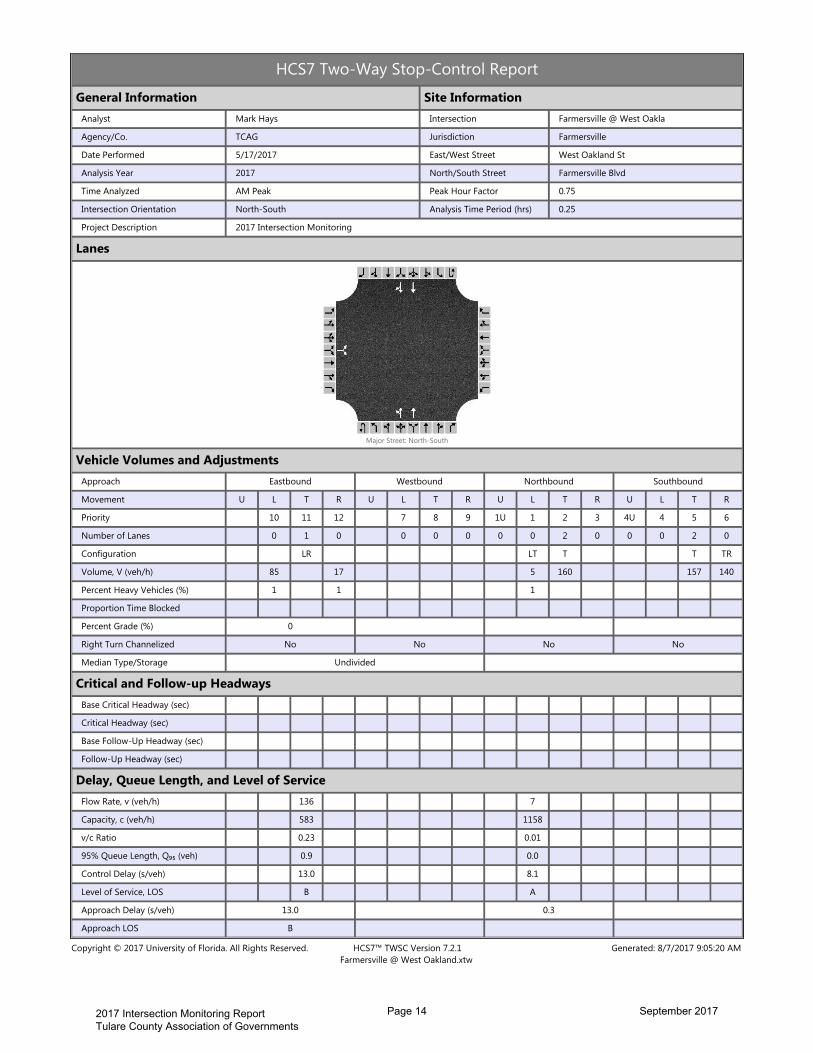
HCS7 Two-Way Stop-Control Report
General Information Site InformationAnalyst Mark Hays Intersection Farmersville @ West Oakla
Agency/Co. TCAG Jurisdiction Farmersville
Date Performed 5/17/2017 East/West Street West Oakland St
Analysis Year 2017 North/South Street Farmersville Blvd
Time Analyzed AM Peak Peak Hour Factor 0.75
Intersection Orientation North-South Analysis Time Period (hrs) 0.25
Project Description 2017 Intersection Monitoring
Lanes
Major Street: North-South
Vehicle Volumes and AdjustmentsApproach Eastbound Westbound Northbound Southbound
Movement U L T R U L T R U L T R U L T R
Priority 10 11 12 7 8 9 1U 1 2 3 4U 4 5 6
Number of Lanes 0 1 0 0 0 0 0 0 2 0 0 0 2 0
Configuration LR LT T T TR
Volume, V (veh/h) 85 17 5 160 157 140
Percent Heavy Vehicles (%) 1 1 1
Proportion Time Blocked
Percent Grade (%) 0
Right Turn Channelized No No No No
Median Type/Storage Undivided
Critical and Follow-up HeadwaysBase Critical Headway (sec)
Critical Headway (sec)
Base Follow-Up Headway (sec)
Follow-Up Headway (sec)
Delay, Queue Length, and Level of ServiceFlow Rate, v (veh/h) 136 7
Capacity, c (veh/h) 583 1158
v/c Ratio 0.23 0.01
95% Queue Length, Q₉₅ (veh) 0.9 0.0
Control Delay (s/veh) 13.0 8.1
Level of Service, LOS B A
Approach Delay (s/veh) 13.0 0.3
Approach LOS B
Copyright © 2017 University of Florida. All Rights Reserved. HCS7™ TWSC Version 7.2.1 Generated: 8/7/2017 9:05:20 AMFarmersville @ West Oakland.xtw
2017 Intersection Monitoring Report Tulare County Association of Governments
Page 14 September 2017

HCS7 Roundabouts ReportGeneral Information Site Information
Analyst Mark Hays Intersection Farmersville @ Noble
Agency or Co. TCAG E/W Street Name Noble Ave
Date Performed 5/17/2017 N/S Street Name Farmersville Blvd
Analysis Year 2017 Analysis Time Period (hrs) 0.25
Time Analyzed AM Peak Peak Hour Factor 0.87
Project Description 2017 Intersection Monitoring Jurisdiction Farmersville
Volume Adjustments and Site Characteristics
Approach EB WB NB SB
Movement U L T R U L T R U L T R U L T R
Number of Lanes (N) 0 0 1 0 0 0 0 0 0 0 1 0 0 0 1 0
Lane Assignment LR LT TR
Volume (V), veh/h 0 54 159 0 74 472 0 86 53
Percent Heavy Vehicles, % 3 3 3 3 3 3 0 3 3
Flow Rate (vPCE), pc/h 0 64 188 0 88 559 0 102 63
Right-Turn Bypass None None None None
Conflicting Lanes 1 1 1
Pedestrians Crossing, p/h 0 0 0
Critical and Follow-Up Headway Adjustment
Approach EB WB NB SB
Lane Left Right Bypass Left Right Bypass Left Right Bypass Left Right Bypass
Critical Headway (s) 4.9763 4.9763 4.9763
Follow-Up Headway (s) 2.6087 2.6087 2.6087
Flow Computations, Capacity and v/c Ratios
Approach EB WB NB SB
Lane Left Right Bypass Left Right Bypass Left Right Bypass Left Right Bypass
Entry Flow (ve), pc/h 252 647 165
Entry Volume veh/h 245 628 160
Circulating Flow (vc), pc/h 102 711 64 88
Exiting Flow (vex), pc/h 0 151 623 290
Capacity (cpce), pc/h 1244 1293 1262
Capacity (c), veh/h 1207 1255 1225
v/c Ratio (x) 0.20 0.50 0.13
Delay and Level of Service
Approach EB WB NB SB
Lane Left Right Bypass Left Right Bypass Left Right Bypass Left Right Bypass
Lane Control Delay (d), s/veh 4.8 8.2 4.0
Lane LOS A A A
95% Queue, veh 0.8 2.9 0.4
Approach Delay, s/veh 4.8 8.2 4.0
Approach LOS A A A
Intersection Delay, s/veh | LOS 6.7 A
Copyright © 2017 University of Florida. All Rights Reserved. HCS7™ Roundabouts Version 7.2.1 8/7/2017 9:08:44 AMFarmersville @ Noble.xro
2017 Intersection Monitoring Report Tulare County Association of Governments
Page 15 September 2017

HCS7 Two-Way Stop-Control Report
General Information Site InformationAnalyst Mark Hays Intersection Farmersville @ Mineral Ki
Agency/Co. TCAG Jurisdiction Farmersville
Date Performed 5/8/2017 East/West Street Mineral King Ave
Analysis Year 2017 North/South Street Farmersville Blvd
Time Analyzed AM Peak Peak Hour Factor 0.85
Intersection Orientation East-West Analysis Time Period (hrs) 0.25
Project Description 2017 Intersection Monitoring
Lanes
Major Street: East-West
Vehicle Volumes and AdjustmentsApproach Eastbound Westbound Northbound Southbound
Movement U L T R U L T R U L T R U L T R
Priority 1U 1 2 3 4U 4 5 6 7 8 9 10 11 12
Number of Lanes 0 0 1 0 0 0 1 0 0 1 0 0 0 0
Configuration TR LT LR
Volume, V (veh/h) 31 66 79 54 135 399
Percent Heavy Vehicles (%) 2 2 2
Proportion Time Blocked
Percent Grade (%) 0
Right Turn Channelized No No No No
Median Type/Storage Undivided
Critical and Follow-up HeadwaysBase Critical Headway (sec)
Critical Headway (sec)
Base Follow-Up Headway (sec)
Follow-Up Headway (sec)
Delay, Queue Length, and Level of ServiceFlow Rate, v (veh/h) 93 628
Capacity, c (veh/h) 1474 861
v/c Ratio 0.06 0.73
95% Queue Length, Q₉₅ (veh) 0.2 6.6
Control Delay (s/veh) 7.6 19.6
Level of Service, LOS A C
Approach Delay (s/veh) 4.7 19.6
Approach LOS C
Copyright © 2017 University of Florida. All Rights Reserved. HCS7™ TWSC Version 7.2.1 Generated: 8/7/2017 9:05:57 AMMineral King @ Farmersville.xtw
2017 Intersection Monitoring Report Tulare County Association of Governments
Page 16 September 2017

HCS7 Two-Way Stop-Control Report
General Information Site InformationAnalyst Mark Hays Intersection Ventura @ Citrus
Agency/Co. TCAG Jurisdiction Farmersville
Date Performed 6/7/2017 East/West Street W Citrus Dr
Analysis Year 2017 North/South Street Ventura Ave
Time Analyzed AM Peak Peak Hour Factor 0.78
Intersection Orientation North-South Analysis Time Period (hrs) 0.25
Project Description 2017 Intersection Monitoring
Lanes
Major Street: North-South
Vehicle Volumes and AdjustmentsApproach Eastbound Westbound Northbound Southbound
Movement U L T R U L T R U L T R U L T R
Priority 10 11 12 7 8 9 1U 1 2 3 4U 4 5 6
Number of Lanes 0 1 0 0 0 0 0 0 1 0 0 0 1 0
Configuration LR LT TR
Volume, V (veh/h) 46 1 1 45 47 23
Percent Heavy Vehicles (%) 1 1 1
Proportion Time Blocked
Percent Grade (%) 0
Right Turn Channelized No No No No
Median Type/Storage Undivided
Critical and Follow-up HeadwaysBase Critical Headway (sec)
Critical Headway (sec)
Base Follow-Up Headway (sec)
Follow-Up Headway (sec)
Delay, Queue Length, and Level of ServiceFlow Rate, v (veh/h) 60 1
Capacity, c (veh/h) 849 1496
v/c Ratio 0.07 0.00
95% Queue Length, Q₉₅ (veh) 0.2 0.0
Control Delay (s/veh) 9.6 7.4
Level of Service, LOS A A
Approach Delay (s/veh) 9.6 0.1
Approach LOS A
Copyright © 2017 University of Florida. All Rights Reserved. HCS7™ TWSC Version 7.2.1 Generated: 8/7/2017 9:04:02 AMCitrus @ Ventura.xtw
2017 Intersection Monitoring Report Tulare County Association of Governments
Page 17 September 2017

HCS+: Unsignalized Intersections Release 5.6 Phone: Fax: E-Mail: ___________________ALL-WAY STOP CONTROL(AWSC) ANALYSIS________________________ Analyst: Mark Hays Agency/Co.: TCAG Date Performed: 5/8/2017 Analysis Time Period: AM Peak Intersection: Parkside @ Hickory Jurisdiction: Lindsay Units: U. S. Customary Analysis Year: 2017 Project ID: 2017 Intersection Monitoring East/West Street: Hickory St North/South Street: Parkside Ave _________Worksheet 2 - Volume Adjustments and Site Characteristics____________ | Eastbound | Westbound | Northbound | Southbound | | L T R | L T R | L T R | L T R | |_______________|_______________|_______________|_______________| Volume |14 32 24 |36 70 26 |45 194 33 |17 145 25 | % Thrus Left Lane Eastbound Westbound Northbound Southbound L1 L2 L1 L2 L1 L2 L1 L2 Configuration LTR LTR LTR LTR PHF 0.70 0.85 0.80 0.73 Flow Rate 99 154 339 255 % Heavy Veh 2 2 2 2 No. Lanes 1 1 1 1 Opposing-Lanes 1 1 1 1 Conflicting-lanes 1 1 1 1 Geometry group 1 1 1 1 Duration, T 0.25 hrs. ___________Worksheet 3 - Saturation Headway Adjustment Worksheet______________ Eastbound Westbound Northbound Southbound L1 L2 L1 L2 L1 L2 L1 L2 Flow Rates: Total in Lane 99 154 339 255 Left-Turn 20 42 56 23 Right-Turn 34 30 41 34 Prop. Left-Turns 0.2 0.3 0.2 0.1 Prop. Right-Turns 0.3 0.2 0.1 0.1 Prop. Heavy Vehicle0.0 0.0 0.0 0.0 Geometry Group 1 1 1 1 Adjustments Exhibit 17-33: hLT-adj 0.2 0.2 0.2 0.2
2017 Intersection Monitoring Report Tulare County Association of Governments
Page 18 September 2017

hRT-adj -0.6 -0.6 -0.6 -0.6 hHV-adj 1.7 1.7 1.7 1.7 hadj, computed -0.1 -0.0 -0.0 -0.0 _______________Worksheet 4 - Departure Headway and Service Time_______________ Eastbound Westbound Northbound Southbound L1 L2 L1 L2 L1 L2 L1 L2 Flow rate 99 154 339 255 hd, initial value 3.20 3.20 3.20 3.20 3.20 3.20 3.20 3.20 x, initial 0.09 0.14 0.30 0.23 hd, final value 5.59 5.58 5.01 5.10 x, final value 0.154 0.239 0.471 0.361 Move-up time, m 2.0 2.0 2.0 2.0 Service Time 3.6 3.6 3.0 3.1 _______________Worksheet 5 - Capacity and Level of Service____________________ Eastbound Westbound Northbound Southbound L1 L2 L1 L2 L1 L2 L1 L2 Flow Rate 99 154 339 255 Service Time 3.6 3.6 3.0 3.1 Utilization, x 0.154 0.239 0.471 0.361 Dep. headway, hd 5.59 5.58 5.01 5.10 Capacity 660 642 721 708 95% Queue Length 0.5 0.9 2.5 1.6 Delay 9.6 10.3 12.4 10.9 LOS A B B B Approach: Delay 9.6 10.3 12.4 10.9 LOS A B B B Intersection Delay 11.3 Intersection LOS B ______________________________________________________________________________
2017 Intersection Monitoring Report Tulare County Association of Governments
Page 19 September 2017

HCS+: Unsignalized Intersections Release 5.6 Phone: Fax: E-Mail: ___________________ALL-WAY STOP CONTROL(AWSC) ANALYSIS________________________ Analyst: Mark Hays Agency/Co.: TCAG Date Performed: 5/8/2017 Analysis Time Period: AM Peak Intersection: Hermosa @ Sweetbrier Jurisdiction: Lindsay Units: U. S. Customary Analysis Year: 2017 Project ID: 2017 Intersection Monitoring East/West Street: Hermosa St North/South Street: Sweetbrier Ave _________Worksheet 2 - Volume Adjustments and Site Characteristics____________ | Eastbound | Westbound | Northbound | Southbound | | L T R | L T R | L T R | L T R | |_______________|_______________|_______________|_______________| Volume |54 252 66 |6 315 16 |37 19 1 |13 24 69 | % Thrus Left Lane 50 50 Eastbound Westbound Northbound Southbound L1 L2 L1 L2 L1 L2 L1 L2 Configuration LT TR LT TR LTR LTR PHF 0.79 0.79 0.87 0.87 0.71 0.86 Flow Rate 227 242 186 199 79 122 % Heavy Veh 2 2 2 2 2 2 No. Lanes 2 2 1 1 Opposing-Lanes 2 2 1 1 Conflicting-lanes 1 1 2 2 Geometry group 5 5 2 2 Duration, T 0.25 hrs. ___________Worksheet 3 - Saturation Headway Adjustment Worksheet______________ Eastbound Westbound Northbound Southbound L1 L2 L1 L2 L1 L2 L1 L2 Flow Rates: Total in Lane 227 242 186 199 79 122 Left-Turn 68 0 6 0 52 15 Right-Turn 0 83 0 18 1 80 Prop. Left-Turns 0.3 0.0 0.0 0.0 0.7 0.1 Prop. Right-Turns 0.0 0.3 0.0 0.1 0.0 0.7 Prop. Heavy Vehicle0.0 0.0 0.0 0.0 0.0 0.0 Geometry Group 5 5 2 2 Adjustments Exhibit 17-33: hLT-adj 0.5 0.5 0.2 0.2
2017 Intersection Monitoring Report Tulare County Association of Governments
Page 20 September 2017

hRT-adj -0.7 -0.7 -0.6 -0.6 hHV-adj 1.7 1.7 1.7 1.7 hadj, computed 0.2 -0.2 0.1 -0.0 0.2 -0.3 _______________Worksheet 4 - Departure Headway and Service Time_______________ Eastbound Westbound Northbound Southbound L1 L2 L1 L2 L1 L2 L1 L2 Flow rate 227 242 186 199 79 122 hd, initial value 3.20 3.20 3.20 3.20 3.20 3.20 3.20 3.20 x, initial 0.20 0.22 0.17 0.18 0.07 0.11 hd, final value 5.78 5.39 5.74 5.66 6.21 5.63 x, final value 0.365 0.362 0.297 0.313 0.136 0.191 Move-up time, m 2.3 2.3 2.0 2.0 Service Time 3.5 3.1 3.4 3.4 4.2 3.6 _______________Worksheet 5 - Capacity and Level of Service____________________ Eastbound Westbound Northbound Southbound L1 L2 L1 L2 L1 L2 L1 L2 Flow Rate 227 242 186 199 79 122 Service Time 3.5 3.1 3.4 3.4 4.2 3.6 Utilization, x 0.365 0.362 0.297 0.313 0.136 0.191 Dep. headway, hd 5.78 5.39 5.74 5.66 6.21 5.63 Capacity 631 672 620 642 564 642 95% Queue Length 1.7 1.7 1.2 1.3 0.5 0.7 Delay 11.8 11.1 10.8 10.9 10.2 10.0- LOS B B B B B A Approach: Delay 11.4 10.9 10.2 10.0- LOS B B B A Intersection Delay 11.0 Intersection LOS B ______________________________________________________________________________
2017 Intersection Monitoring Report Tulare County Association of Governments
Page 21 September 2017

HCS7 Two-Way Stop-Control Report
General Information Site InformationAnalyst Mark Hays Intersection Harvard @ Sierra View
Agency/Co. TCAG Jurisdiction Lindsay
Date Performed 5/11/2017 East/West Street Sierra View / Driveway
Analysis Year 2017 North/South Street Harvard
Time Analyzed AM Peak Peak Hour Factor 0.65
Intersection Orientation North-South Analysis Time Period (hrs) 0.25
Project Description 2017 Intersection Monitoring
Lanes
Major Street: North-South
Vehicle Volumes and AdjustmentsApproach Eastbound Westbound Northbound Southbound
Movement U L T R U L T R U L T R U L T R
Priority 10 11 12 7 8 9 1U 1 2 3 4U 4 5 6
Number of Lanes 0 1 0 0 1 0 0 0 1 0 0 0 1 0
Configuration LTR LTR LTR LTR
Volume, V (veh/h) 1 3 29 69 1 12 15 32 64 19 44 9
Percent Heavy Vehicles (%) 3 3 3 3 3 3 3 3
Proportion Time Blocked
Percent Grade (%) 0 0
Right Turn Channelized No No No No
Median Type/Storage Undivided
Critical and Follow-up HeadwaysBase Critical Headway (sec)
Critical Headway (sec)
Base Follow-Up Headway (sec)
Follow-Up Headway (sec)
Delay, Queue Length, and Level of ServiceFlow Rate, v (veh/h) 52 126 23 29
Capacity, c (veh/h) 898 624 1507 1424
v/c Ratio 0.06 0.20 0.02 0.02
95% Queue Length, Q₉₅ (veh) 0.2 0.7 0.0 0.1
Control Delay (s/veh) 9.3 12.2 7.4 7.6
Level of Service, LOS A B A A
Approach Delay (s/veh) 9.3 12.2 1.1 2.1
Approach LOS A B
Copyright © 2017 University of Florida. All Rights Reserved. HCS7™ TWSC Version 7.2.1 Generated: 8/8/2017 11:19:44 AMHarvard @ Sierra View AM.xtw
2017 Intersection Monitoring Report Tulare County Association of Governments
Page 22 September 2017

HCS7 Two-Way Stop-Control Report
General Information Site InformationAnalyst Mark Hays Intersection Tulare @ SR-65
Agency/Co. TCAG Jurisdiction Lindsay
Date Performed 6/21/2017 East/West Street SR-65
Analysis Year 2017 North/South Street Tulare Rd.
Time Analyzed AM peak Peak Hour Factor 0.90
Intersection Orientation East-West Analysis Time Period (hrs) 0.25
Project Description 2017 Intersection Monitoring
Lanes
Major Street: East-West
Vehicle Volumes and AdjustmentsApproach Eastbound Westbound Northbound Southbound
Movement U L T R U L T R U L T R U L T R
Priority 1U 1 2 3 4U 4 5 6 7 8 9 10 11 12
Number of Lanes 0 1 1 0 0 0 1 1 0 0 0 1 0 1
Configuration L T T R L R
Volume, V (veh/h) 102 848 911 38 13 92
Percent Heavy Vehicles (%) 5 5 5
Proportion Time Blocked
Percent Grade (%) 0
Right Turn Channelized No No No No
Median Type/Storage Undivided
Critical and Follow-up HeadwaysBase Critical Headway (sec)
Critical Headway (sec)
Base Follow-Up Headway (sec)
Follow-Up Headway (sec)
Delay, Queue Length, and Level of ServiceFlow Rate, v (veh/h) 113 14 102
Capacity, c (veh/h) 650 41 287
v/c Ratio 0.17 0.34 0.36
95% Queue Length, Q₉₅ (veh) 0.6 1.2 1.6
Control Delay (s/veh) 11.7 132.6 24.3
Level of Service, LOS B F C
Approach Delay (s/veh) 1.3 37.4
Approach LOS E
Copyright © 2017 University of Florida. All Rights Reserved. HCS7™ TWSC Version 7.2.1 Generated: 8/7/2017 10:56:09 AMSR-65 @ Tulare AM.xtw
2017 Intersection Monitoring Report Tulare County Association of Governments
Page 23 September 2017

HCS7 Two-Way Stop-Control Report
General Information Site InformationAnalyst Mark Hays Intersection Tulare @ Stanford
Agency/Co. TCAG Jurisdiction Lindsay
Date Performed 5/11/2017 East/West Street Tulare Rd
Analysis Year 2017 North/South Street Stanford Ave
Time Analyzed AM Peak Peak Hour Factor 0.72
Intersection Orientation East-West Analysis Time Period (hrs) 0.25
Project Description 2017 Intersection Monitoring
Lanes
Major Street: East-West
Vehicle Volumes and AdjustmentsApproach Eastbound Westbound Northbound Southbound
Movement U L T R U L T R U L T R U L T R
Priority 1U 1 2 3 4U 4 5 6 7 8 9 10 11 12
Number of Lanes 0 0 1 0 0 0 1 0 0 1 0 0 1 0
Configuration LTR LTR LTR LTR
Volume, V (veh/h) 98 174 3 7 242 30 4 6 5 29 6 94
Percent Heavy Vehicles (%) 2 2 2 2 2 2 2 2
Proportion Time Blocked
Percent Grade (%) 0 0
Right Turn Channelized No No No No
Median Type/Storage Undivided
Critical and Follow-up HeadwaysBase Critical Headway (sec)
Critical Headway (sec)
Base Follow-Up Headway (sec)
Follow-Up Headway (sec)
Delay, Queue Length, and Level of ServiceFlow Rate, v (veh/h) 136 10 21 179
Capacity, c (veh/h) 1140 1319 251 412
v/c Ratio 0.12 0.01 0.08 0.43
95% Queue Length, Q₉₅ (veh) 0.4 0.0 0.3 2.1
Control Delay (s/veh) 8.6 7.8 20.6 20.3
Level of Service, LOS A A C C
Approach Delay (s/veh) 3.8 0.3 20.6 20.3
Approach LOS C C
Copyright © 2017 University of Florida. All Rights Reserved. HCS7™ TWSC Version 7.2.1 Generated: 8/7/2017 10:56:56 AMTulare @ Stanford AM.xtw
2017 Intersection Monitoring Report Tulare County Association of Governments
Page 24 September 2017

HCS+: Unsignalized Intersections Release 5.6 Phone: Fax: E-Mail: ___________________ALL-WAY STOP CONTROL(AWSC) ANALYSIS________________________ Analyst: Mark Hays Agency/Co.: TCAG Date Performed: 5/11/2017 Analysis Time Period: AM Peak Intersection: Hermosa @ Homassel Jurisdiction: Lindsay Units: U. S. Customary Analysis Year: 2017 Project ID: 2017 Intersection Monitoring East/West Street: Hermosa North/South Street: Homassel _________Worksheet 2 - Volume Adjustments and Site Characteristics____________ | Eastbound | Westbound | Northbound | Southbound | | L T R | L T R | L T R | L T R | |_______________|_______________|_______________|_______________| Volume |19 75 31 |26 91 10 |39 63 32 |17 71 30 | % Thrus Left Lane Eastbound Westbound Northbound Southbound L1 L2 L1 L2 L1 L2 L1 L2 Configuration LTR LTR LTR LTR PHF 0.76 0.67 0.82 0.72 Flow Rate 163 187 162 162 % Heavy Veh 2 2 2 2 No. Lanes 1 1 1 1 Opposing-Lanes 1 1 1 1 Conflicting-lanes 1 1 1 1 Geometry group 1 1 1 1 Duration, T 0.25 hrs. ___________Worksheet 3 - Saturation Headway Adjustment Worksheet______________ Eastbound Westbound Northbound Southbound L1 L2 L1 L2 L1 L2 L1 L2 Flow Rates: Total in Lane 163 187 162 162 Left-Turn 25 38 47 23 Right-Turn 40 14 39 41 Prop. Left-Turns 0.2 0.2 0.3 0.1 Prop. Right-Turns 0.2 0.1 0.2 0.3 Prop. Heavy Vehicle0.0 0.0 0.0 0.0 Geometry Group 1 1 1 1 Adjustments Exhibit 17-33: hLT-adj 0.2 0.2 0.2 0.2
2017 Intersection Monitoring Report Tulare County Association of Governments
Page 25 September 2017

hRT-adj -0.6 -0.6 -0.6 -0.6 hHV-adj 1.7 1.7 1.7 1.7 hadj, computed -0.1 0.0 -0.1 -0.1 _______________Worksheet 4 - Departure Headway and Service Time_______________ Eastbound Westbound Northbound Southbound L1 L2 L1 L2 L1 L2 L1 L2 Flow rate 163 187 162 162 hd, initial value 3.20 3.20 3.20 3.20 3.20 3.20 3.20 3.20 x, initial 0.14 0.17 0.14 0.14 hd, final value 4.93 5.00 4.99 4.95 x, final value 0.223 0.260 0.225 0.223 Move-up time, m 2.0 2.0 2.0 2.0 Service Time 2.9 3.0 3.0 3.0 _______________Worksheet 5 - Capacity and Level of Service____________________ Eastbound Westbound Northbound Southbound L1 L2 L1 L2 L1 L2 L1 L2 Flow Rate 163 187 162 162 Service Time 2.9 3.0 3.0 3.0 Utilization, x 0.223 0.260 0.225 0.223 Dep. headway, hd 4.93 5.00 4.99 4.95 Capacity 741 719 736 736 95% Queue Length 0.9 1.0 0.9 0.9 Delay 9.3 9.8 9.4 9.4 LOS A A A A Approach: Delay 9.3 9.8 9.4 9.4 LOS A A A A Intersection Delay 9.5 Intersection LOS A ______________________________________________________________________________
2017 Intersection Monitoring Report Tulare County Association of Governments
Page 26 September 2017

HCS+: Unsignalized Intersections Release 5.6 Phone: Fax: E-Mail: ___________________ALL-WAY STOP CONTROL(AWSC) ANALYSIS________________________ Analyst: Mark Hays Agency/Co.: TCAG Date Performed: 5/11/2017 Analysis Time Period: AM Peak Intersection: Hermosa @ Harvard Jurisdiction: Lindsay Units: U. S. Customary Analysis Year: 2017 Project ID: 2017 Intersection Monitoring East/West Street: Hermosa North/South Street: Harvard _________Worksheet 2 - Volume Adjustments and Site Characteristics____________ | Eastbound | Westbound | Northbound | Southbound | | L T R | L T R | L T R | L T R | |_______________|_______________|_______________|_______________| Volume |23 102 30 |52 71 20 |21 86 32 |10 98 34 | % Thrus Left Lane Eastbound Westbound Northbound Southbound L1 L2 L1 L2 L1 L2 L1 L2 Configuration LTR LTR LTR LTR PHF 0.72 0.61 0.68 0.77 Flow Rate 213 233 203 183 % Heavy Veh 4 4 4 4 No. Lanes 1 1 1 1 Opposing-Lanes 1 1 1 1 Conflicting-lanes 1 1 1 1 Geometry group 1 1 1 1 Duration, T 0.25 hrs. ___________Worksheet 3 - Saturation Headway Adjustment Worksheet______________ Eastbound Westbound Northbound Southbound L1 L2 L1 L2 L1 L2 L1 L2 Flow Rates: Total in Lane 213 233 203 183 Left-Turn 31 85 30 12 Right-Turn 41 32 47 44 Prop. Left-Turns 0.1 0.4 0.1 0.1 Prop. Right-Turns 0.2 0.1 0.2 0.2 Prop. Heavy Vehicle0.0 0.0 0.0 0.0 Geometry Group 1 1 1 1 Adjustments Exhibit 17-33: hLT-adj 0.2 0.2 0.2 0.2
2017 Intersection Monitoring Report Tulare County Association of Governments
Page 27 September 2017

hRT-adj -0.6 -0.6 -0.6 -0.6 hHV-adj 1.7 1.7 1.7 1.7 hadj, computed -0.0 0.1 -0.0 -0.1 _______________Worksheet 4 - Departure Headway and Service Time_______________ Eastbound Westbound Northbound Southbound L1 L2 L1 L2 L1 L2 L1 L2 Flow rate 213 233 203 183 hd, initial value 3.20 3.20 3.20 3.20 3.20 3.20 3.20 3.20 x, initial 0.19 0.21 0.18 0.16 hd, final value 5.36 5.40 5.42 5.43 x, final value 0.317 0.350 0.305 0.276 Move-up time, m 2.0 2.0 2.0 2.0 Service Time 3.4 3.4 3.4 3.4 _______________Worksheet 5 - Capacity and Level of Service____________________ Eastbound Westbound Northbound Southbound L1 L2 L1 L2 L1 L2 L1 L2 Flow Rate 213 233 203 183 Service Time 3.4 3.4 3.4 3.4 Utilization, x 0.317 0.350 0.305 0.276 Dep. headway, hd 5.36 5.40 5.42 5.43 Capacity 666 666 655 654 95% Queue Length 1.4 1.6 1.3 1.1 Delay 10.8 11.3 10.8 10.5 LOS B B B B Approach: Delay 10.8 11.3 10.8 10.5 LOS B B B B Intersection Delay 10.9 Intersection LOS B ______________________________________________________________________________
2017 Intersection Monitoring Report Tulare County Association of Governments
Page 28 September 2017

HCS+: Unsignalized Intersections Release 5.6 Phone: Fax: E-Mail: ___________________ALL-WAY STOP CONTROL(AWSC) ANALYSIS________________________ Analyst: Mark Hays Agency/Co.: TCAG Date Performed: 5/11/2017 Analysis Time Period: AM Peak Intersection: Harvard @ Honolulu Jurisdiction: Lindsay Units: U. S. Customary Analysis Year: 2017 Project ID: 2017 Intersection Monitoring East/West Street: Honolulu North/South Street: Harvard _________Worksheet 2 - Volume Adjustments and Site Characteristics____________ | Eastbound | Westbound | Northbound | Southbound | | L T R | L T R | L T R | L T R | |_______________|_______________|_______________|_______________| Volume |46 47 18 |9 59 16 |27 99 6 |17 98 74 | % Thrus Left Lane Eastbound Westbound Northbound Southbound L1 L2 L1 L2 L1 L2 L1 L2 Configuration LTR LTR LTR LTR PHF 0.77 0.66 0.51 0.70 Flow Rate 143 126 257 269 % Heavy Veh 3 3 3 3 No. Lanes 1 1 1 1 Opposing-Lanes 1 1 1 1 Conflicting-lanes 1 1 1 1 Geometry group 1 1 1 1 Duration, T 0.25 hrs. ___________Worksheet 3 - Saturation Headway Adjustment Worksheet______________ Eastbound Westbound Northbound Southbound L1 L2 L1 L2 L1 L2 L1 L2 Flow Rates: Total in Lane 143 126 257 269 Left-Turn 59 13 52 24 Right-Turn 23 24 11 105 Prop. Left-Turns 0.4 0.1 0.2 0.1 Prop. Right-Turns 0.2 0.2 0.0 0.4 Prop. Heavy Vehicle0.0 0.0 0.0 0.0 Geometry Group 1 1 1 1 Adjustments Exhibit 17-33: hLT-adj 0.2 0.2 0.2 0.2
2017 Intersection Monitoring Report Tulare County Association of Governments
Page 29 September 2017

hRT-adj -0.6 -0.6 -0.6 -0.6 hHV-adj 1.7 1.7 1.7 1.7 hadj, computed 0.0 -0.0 0.1 -0.2 _______________Worksheet 4 - Departure Headway and Service Time_______________ Eastbound Westbound Northbound Southbound L1 L2 L1 L2 L1 L2 L1 L2 Flow rate 143 126 257 269 hd, initial value 3.20 3.20 3.20 3.20 3.20 3.20 3.20 3.20 x, initial 0.13 0.11 0.23 0.24 hd, final value 5.51 5.46 5.11 4.88 x, final value 0.219 0.191 0.365 0.365 Move-up time, m 2.0 2.0 2.0 2.0 Service Time 3.5 3.5 3.1 2.9 _______________Worksheet 5 - Capacity and Level of Service____________________ Eastbound Westbound Northbound Southbound L1 L2 L1 L2 L1 L2 L1 L2 Flow Rate 143 126 257 269 Service Time 3.5 3.5 3.1 2.9 Utilization, x 0.219 0.191 0.365 0.365 Dep. headway, hd 5.51 5.46 5.11 4.88 Capacity 650 663 695 747 95% Queue Length 0.8 0.7 1.7 1.7 Delay 10.0+ 9.7 11.0 10.7 LOS B A B B Approach: Delay 10.0+ 9.7 11.0 10.7 LOS B A B B Intersection Delay 10.5 Intersection LOS B ______________________________________________________________________________
2017 Intersection Monitoring Report Tulare County Association of Governments
Page 30 September 2017

HCS7 All-Way Stop Control ReportGeneral Information Site Information
Analyst Mark Hays Intersection Westfield @ Westwood
Agency/Co. Jurisdiction Porterville
Date Performed 5/8/2017 East/West Street Westfield Ave
Analysis Year 2017 North/South Street Westwood St
Analysis Time Period (hrs) 0.25 Peak Hour Factor 0.77
Time Analyzed AM Peak
Project Description
Lanes
Vehicle Volume and Adjustments
Approach Eastbound Westbound Northbound Southbound
Movement L T R L T R L T R L T R
Volume 34 125 150 79 152 71 87 140 67 85 187 60
% Thrus in Shared Lane
Lane L1 L2 L3 L1 L2 L3 L1 L2 L3 L1 L2 L3
Configuration LTR LTR L TR L TR
Flow Rate, v (veh/h) 401 392 113 269 110 321
Percent Heavy Vehicles 1 1 1 1 1 1
Departure Headway and Service Time
Initial Departure Headway, hd (s) 3.20 3.20 3.20 3.20 3.20 3.20
Initial Degree of Utilization, x 0.357 0.349 0.100 0.239 0.098 0.285
Final Departure Headway, hd (s) 8.17 8.35 9.80 9.03 9.63 8.92
Final Degree of Utilization, x 0.910 0.910 0.308 0.674 0.295 0.795
Move-Up Time, m (s) 2.0 2.0 2.3 2.3 2.3 2.3
Service Time, ts (s) 6.17 6.35 7.50 6.73 7.33 6.62
Capacity, Delay and Level of Service
Flow Rate, v (veh/h) 401 392 113 269 110 321
Capacity 441 431 367 399 374 404
95% Queue Length, Q₉₅ (veh) 10.0 9.9 1.3 4.8 1.2 7.0
Control Delay (s/veh) 52.2 53.0 16.8 28.5 16.3 38.4
Level of Service, LOS F F C D C E
Approach Delay (s/veh) 52.2 53.0 25.0 32.8
Approach LOS F F D D
Intersection Delay, s/veh | LOS 40.7 E
Copyright © 2017 University of Florida. All Rights Reserved. HCS7™ AWSC Version 7.2.1 Generated: 8/8/2017 12:08:16 PMWestfield @ Westwood.xaw
2017 Intersection Monitoring Report Tulare County Association of Governments
Page 31 September 2017

HCS7 Two-Way Stop-Control Report
General Information Site InformationAnalyst Mark Hays Intersection Mulberry @ Newcomb
Agency/Co. TCAG Jurisdiction Porterville
Date Performed 5/8/2017 East/West Street Mulberry Ave
Analysis Year 2017 North/South Street Newcomb St
Time Analyzed AM Peak Peak Hour Factor 0.77
Intersection Orientation North-South Analysis Time Period (hrs) 0.25
Project Description 2017 Intersection Monitoring
Lanes
Major Street: North-South
Vehicle Volumes and AdjustmentsApproach Eastbound Westbound Northbound Southbound
Movement U L T R U L T R U L T R U L T R
Priority 10 11 12 7 8 9 1U 1 2 3 4U 4 5 6
Number of Lanes 0 1 0 0 1 0 0 1 2 0 0 1 2 0
Configuration LTR LTR L T TR L T TR
Volume, V (veh/h) 88 140 68 87 188 60 81 150 72 30 126 162
Percent Heavy Vehicles (%) 1 1 1 1 1 1 1 1
Proportion Time Blocked
Percent Grade (%) 0 0
Right Turn Channelized No No No No
Median Type/Storage Undivided
Critical and Follow-up HeadwaysBase Critical Headway (sec)
Critical Headway (sec)
Base Follow-Up Headway (sec)
Follow-Up Headway (sec)
Delay, Queue Length, and Level of ServiceFlow Rate, v (veh/h) 384 435 105 39
Capacity, c (veh/h) 202 1150 1275
v/c Ratio 2.16 0.09 0.03
95% Queue Length, Q₉₅ (veh) 34.0 0.3 0.1
Control Delay (s/veh) 574.8 8.4 7.9
Level of Service, LOS F A A
Approach Delay (s/veh) 574.8 2.3 0.7
Approach LOS F
Copyright © 2017 University of Florida. All Rights Reserved. HCS7™ TWSC Version 7.2.1 Generated: 8/8/2017 11:57:48 AMMulberry @ Newcomb.xtw
2017 Intersection Monitoring Report Tulare County Association of Governments
Page 32 September 2017

HCS7 Signalized Intersection Results Summary
General Information Intersection Information
Agency Duration, h 0.25
Analyst Analysis Date 5/22/2017 Area Type Other
Jurisdiction Time Period PHF 0.83
Urban Street Porterville Analysis Year 2017 Analysis Period 1> 7:00
Intersection Henderson @ Newcomb … File Name Henderson @ Newcomb AM.xus
Project Description 2017 Intersection Monitoring
Demand Information EB WB NB SB
Approach Movement L T R L T R L T R L T R
Demand ( v ), veh/h 185 365 66 91 258 223 102 332 126 209 308 41
Signal Information
GreenYellowRed
4.9 1.5 13.8 5.5 2.0 12.83.0 3.0 3.5 3.0 3.0 3.50.0 0.0 0.5 0.0 0.0 0.5
1 2 4
5 6 7
Cycle, s 60.5 Reference Phase 2
Offset, s 0 Reference Point End
Uncoordinated Yes Simult. Gap E/W On
Force Mode Fixed Simult. Gap N/S On
Timer Results EBL EBT WBL WBT NBL NBT SBL SBT
Assigned Phase 5 2 1 6 3 8 7 4
Case Number 2.0 4.0 2.0 3.0 2.0 4.0 2.0 4.0
Phase Duration, s 12.4 22.3 7.9 17.8 8.5 16.8 13.5 21.7
Change Period, ( Y+R c ), s 3.0 4.0 3.0 4.0 3.0 4.0 3.0 4.0
Max Allow Headway ( MAH ), s 3.1 3.1 3.1 3.1 3.1 3.1 3.1 3.1
Queue Clearance Time ( g s ), s 9.3 9.0 5.6 11.5 6.1 10.8 10.2 7.6
Green Extension Time ( g e ), s 0.3 2.2 0.1 2.2 0.2 1.9 0.3 1.9
Phase Call Probability 0.98 1.00 0.84 1.00 0.87 1.00 0.99 1.00
Max Out Probability 0.00 0.00 0.00 0.00 0.00 0.00 0.00 0.00
Movement Group Results EB WB NB SB
Approach Movement L T R L T R L T R L T R
Assigned Movement 5 2 12 1 6 16 3 8 18 7 4 14
Adjusted Flow Rate ( v ), veh/h 223 265 254 110 311 269 123 287 265 252 213 207
Adjusted Saturation Flow Rate ( s ), veh/h/ln 1795 1885 1785 1795 1885 1598 1795 1885 1709 1795 1885 1808
Queue Service Time ( g s ), s 7.3 6.9 7.0 3.6 9.3 9.5 4.1 8.6 8.8 8.2 5.5 5.6
Cycle Queue Clearance Time ( g c ), s 7.3 6.9 7.0 3.6 9.3 9.5 4.1 8.6 8.8 8.2 5.5 5.6
Green Ratio ( g/C ) 0.16 0.30 0.30 0.08 0.23 0.23 0.09 0.21 0.21 0.17 0.29 0.29
Capacity ( c ), veh/h 281 572 541 147 431 365 164 398 361 312 554 531
Volume-to-Capacity Ratio ( X ) 0.793 0.464 0.469 0.747 0.722 0.736 0.750 0.721 0.734 0.807 0.385 0.390
Back of Queue ( Q ), ft/ln ( 50 th percentile) 75.3 68.5 65.1 39.5 95.7 83.6 43.7 90 82.9 84.3 54.2 52.4
Back of Queue ( Q ), veh/ln ( 50 th percentile) 3.0 2.7 2.6 1.6 3.8 3.3 1.7 3.6 3.3 3.3 2.2 2.1
Queue Storage Ratio ( RQ ) ( 50 th percentile) 0.30 0.00 0.00 0.13 0.00 0.28 0.29 0.00 0.00 0.42 0.00 0.00
Uniform Delay ( d 1 ), s/veh 24.7 17.2 17.2 27.3 21.7 21.8 27.0 22.3 22.4 24.2 17.1 17.2
Incremental Delay ( d 2 ), s/veh 1.9 0.2 0.2 2.8 0.9 1.1 2.6 0.9 1.1 1.9 0.2 0.2
Initial Queue Delay ( d 3 ), s/veh 0.0 0.0 0.0 0.0 0.0 0.0 0.0 0.0 0.0 0.0 0.0 0.0
Control Delay ( d ), s/veh 26.7 17.4 17.5 30.2 22.6 22.9 29.6 23.3 23.5 26.1 17.3 17.3
Level of Service (LOS) C B B C C C C C C C B B
Approach Delay, s/veh / LOS 20.2 C 23.9 C 24.5 C 20.6 C
Intersection Delay, s/veh / LOS 22.3 C
Multimodal Results EB WB NB SB
Pedestrian LOS Score / LOS 2.8 C 2.8 C 2.8 C 2.4 B
Bicycle LOS Score / LOS 1.1 A 1.6 B 1.0 A 1.0 A
Copyright © 2017 University of Florida, All Rights Reserved. HCS7™ Streets Version 7.2.1 Generated: 8/8/2017 11:37:26 AM
2017 Intersection Monitoring Report Tulare County Association of Governments
Page 33 September 2017

2017 Intersection Monitoring Report Tulare County Association of Governments
Page 34 September 2017

HCS7 Signalized Intersection Results Summary
General Information Intersection Information
Agency Duration, h 0.25
Analyst Analysis Date 5/22/2017 Area Type Other
Jurisdiction Time Period PHF 0.87
Urban Street Porterville Analysis Year 2017 Analysis Period 1> 7:00
Intersection Henderson @ Porter AM File Name Henderson @ Porter AM.xus
Project Description 2017 Intersection Monitoring
Demand Information EB WB NB SB
Approach Movement L T R L T R L T R L T R
Demand ( v ), veh/h 19 599 152 27 457 3 119 9 28 19 17 31
Signal Information
GreenYellowRed
1.1 0.4 13.0 2.8 4.5 0.03.0 0.0 4.0 3.5 4.0 0.00.5 0.0 0.5 0.5 1.0 0.0
1 2 3 4
5 6 7
Cycle, s 38.7 Reference Phase 2
Offset, s 0 Reference Point End
Uncoordinated Yes Simult. Gap E/W On
Force Mode Fixed Simult. Gap N/S On
Timer Results EBL EBT WBL WBT NBL NBT SBL SBT
Assigned Phase 5 2 1 6 8 4
Case Number 2.0 4.0 2.0 4.0 10.0 11.0
Phase Duration, s 4.6 17.5 4.9 17.9 9.5 6.8
Change Period, ( Y+R c ), s 3.5 4.5 3.5 4.5 5.0 4.0
Max Allow Headway ( MAH ), s 3.1 3.1 3.1 3.1 3.2 3.2
Queue Clearance Time ( g s ), s 2.5 10.2 2.7 6.2 4.9 2.8
Green Extension Time ( g e ), s 0.0 2.8 0.0 2.8 0.3 0.1
Phase Call Probability 0.21 1.00 0.28 1.00 0.86 0.56
Max Out Probability 0.00 0.02 0.00 0.01 0.00 0.00
Movement Group Results EB WB NB SB
Approach Movement L T R L T R L T R L T R
Assigned Movement 5 2 12 1 6 16 3 8 18 7 4 14
Adjusted Flow Rate ( v ), veh/h 22 449 414 31 265 264 137 43 41 36
Adjusted Saturation Flow Rate ( s ), veh/h/ln 1781 1870 1721 1781 1870 1866 1781 1634 1822 1574
Queue Service Time ( g s ), s 0.5 8.2 8.2 0.7 4.2 4.2 2.9 0.9 0.8 0.8
Cycle Queue Clearance Time ( g c ), s 0.5 8.2 8.2 0.7 4.2 4.2 2.9 0.9 0.8 0.8
Green Ratio ( g/C ) 0.03 0.34 0.34 0.04 0.34 0.34 0.12 0.12 0.07 0.07
Capacity ( c ), veh/h 49 628 578 66 646 645 207 189 134 116
Volume-to-Capacity Ratio ( X ) 0.446 0.716 0.716 0.469 0.410 0.410 0.662 0.224 0.309 0.308
Back of Queue ( Q ), ft/ln ( 50 th percentile) 5 63.4 57.7 6.7 31.7 31.1 26.2 7.4 7.8 6.8
Back of Queue ( Q ), veh/ln ( 50 th percentile) 0.2 2.5 2.3 0.3 1.2 1.2 1.0 0.3 0.3 0.3
Queue Storage Ratio ( RQ ) ( 50 th percentile) 0.05 0.00 0.00 0.03 0.00 0.00 0.35 0.00 0.16 0.14
Uniform Delay ( d 1 ), s/veh 18.6 11.3 11.3 18.3 9.7 9.7 16.4 15.6 17.1 17.1
Incremental Delay ( d 2 ), s/veh 2.4 0.6 0.6 1.9 0.2 0.2 1.4 0.2 0.5 0.6
Initial Queue Delay ( d 3 ), s/veh 0.0 0.0 0.0 0.0 0.0 0.0 0.0 0.0 0.0 0.0
Control Delay ( d ), s/veh 21.0 11.9 11.9 20.2 9.8 9.8 17.8 15.8 17.5 17.6
Level of Service (LOS) C B B C A A B B B B
Approach Delay, s/veh / LOS 12.1 B 10.4 B 17.3 B 17.6 B
Intersection Delay, s/veh / LOS 12.3 B
Multimodal Results EB WB NB SB
Pedestrian LOS Score / LOS 2.2 B 2.2 B 2.8 C 2.8 C
Bicycle LOS Score / LOS 1.2 A 0.9 A 0.8 A 0.6 A
Copyright © 2017 University of Florida, All Rights Reserved. HCS7™ Streets Version 7.2.1 Generated: 8/8/2017 11:40:30 AM
2017 Intersection Monitoring Report Tulare County Association of Governments
Page 35 September 2017

2017 Intersection Monitoring Report Tulare County Association of Governments
Page 36 September 2017

HCS7 Signalized Intersection Results Summary
General Information Intersection Information
Agency Duration, h 0.25
Analyst Analysis Date 5/23/2017 Area Type Other
Jurisdiction Time Period PHF 0.85
Urban Street Porterville Analysis Year 2017 Analysis Period 1> 7:00
Intersection Morton @ Newcomb AM File Name Morton @ Newcomb AM.xus
Project Description 2017 Intersection Monitoring
Demand Information EB WB NB SB
Approach Movement L T R L T R L T R L T R
Demand ( v ), veh/h 160 436 81 48 238 100 39 287 57 194 243 124
Signal Information
GreenYellowRed
2.2 1.8 9.4 1.9 3.2 12.03.0 3.0 3.6 3.0 3.0 3.60.0 0.0 0.5 0.0 0.0 0.5
1 2 4
5 6 7
Cycle, s 50.7 Reference Phase 2
Offset, s 0 Reference Point End
Uncoordinated Yes Simult. Gap E/W On
Force Mode Fixed Simult. Gap N/S On
Timer Results EBL EBT WBL WBT NBL NBT SBL SBT
Assigned Phase 5 2 1 6 3 8 7 4
Case Number 2.0 4.0 2.0 4.0 2.0 4.0 2.0 4.0
Phase Duration, s 10.0 18.2 5.2 13.5 4.9 16.1 11.1 22.3
Change Period, ( Y+R c ), s 3.0 4.1 3.0 4.1 3.0 4.1 3.0 4.1
Max Allow Headway ( MAH ), s 3.1 3.1 3.1 3.1 3.1 3.1 3.1 3.1
Queue Clearance Time ( g s ), s 7.2 9.5 3.6 7.4 3.3 7.0 8.3 6.7
Green Extension Time ( g e ), s 0.3 1.9 0.0 1.9 0.0 1.6 0.2 1.6
Phase Call Probability 0.93 1.00 0.55 1.00 0.48 1.00 0.96 1.00
Max Out Probability 0.00 0.00 0.00 0.00 0.00 0.00 0.59 0.00
Movement Group Results EB WB NB SB
Approach Movement L T R L T R L T R L T R
Assigned Movement 5 2 12 1 6 16 3 8 18 7 4 14
Adjusted Flow Rate ( v ), veh/h 188 312 296 56 206 191 46 206 198 228 225 207
Adjusted Saturation Flow Rate ( s ), veh/h/ln 1767 1856 1751 1767 1856 1656 1767 1856 1747 1767 1856 1642
Queue Service Time ( g s ), s 5.2 7.4 7.5 1.6 5.2 5.4 1.3 4.8 5.0 6.3 4.5 4.7
Cycle Queue Clearance Time ( g c ), s 5.2 7.4 7.5 1.6 5.2 5.4 1.3 4.8 5.0 6.3 4.5 4.7
Green Ratio ( g/C ) 0.14 0.28 0.28 0.04 0.18 0.18 0.04 0.24 0.24 0.16 0.36 0.36
Capacity ( c ), veh/h 243 518 489 77 343 306 67 439 413 284 668 591
Volume-to-Capacity Ratio ( X ) 0.773 0.602 0.607 0.735 0.602 0.625 0.688 0.470 0.480 0.802 0.337 0.350
Back of Queue ( Q ), ft/ln ( 50 th percentile) 52.2 69.2 64.3 18.2 51.3 47 14.8 46.4 43.7 66.6 39.3 35.4
Back of Queue ( Q ), veh/ln ( 50 th percentile) 2.0 2.7 2.6 0.7 2.0 1.9 0.6 1.8 1.7 2.6 1.5 1.4
Queue Storage Ratio ( RQ ) ( 50 th percentile) 0.52 0.00 0.00 0.07 0.00 0.00 0.10 0.00 0.00 0.33 0.00 0.00
Uniform Delay ( d 1 ), s/veh 21.1 15.8 15.9 24.0 19.0 19.1 24.1 16.6 16.7 20.5 11.8 11.9
Incremental Delay ( d 2 ), s/veh 2.0 0.4 0.5 5.0 0.6 0.8 4.6 0.3 0.3 4.0 0.1 0.1
Initial Queue Delay ( d 3 ), s/veh 0.0 0.0 0.0 0.0 0.0 0.0 0.0 0.0 0.0 0.0 0.0 0.0
Control Delay ( d ), s/veh 23.1 16.3 16.3 29.0 19.6 19.8 28.7 16.9 17.0 24.6 11.9 12.0
Level of Service (LOS) C B B C B B C B B C B B
Approach Delay, s/veh / LOS 17.9 B 20.9 C 18.2 B 16.3 B
Intersection Delay, s/veh / LOS 18.1 B
Multimodal Results EB WB NB SB
Pedestrian LOS Score / LOS 2.8 C 2.8 C 2.8 C 2.8 C
Bicycle LOS Score / LOS 1.1 A 0.9 A 0.9 A 1.0 A
Copyright © 2017 University of Florida, All Rights Reserved. HCS7™ Streets Version 7.2.1 Generated: 8/8/2017 11:45:17 AM
2017 Intersection Monitoring Report Tulare County Association of Governments
Page 37 September 2017

HCS7 Signalized Intersection Results Summary
General Information Intersection Information
Agency Duration, h 0.25
Analyst Analysis Date 5/23/2017 Area Type Other
Jurisdiction Time Period PHF 0.84
Urban Street Porterville Analysis Year 2017 Analysis Period 1> 7:00
Intersection Morton @ Prospect AM File Name Morton @ Prospect AM.xus
Project Description 2017 Intersection Monitoring
Demand Information EB WB NB SB
Approach Movement L T R L T R L T R L T R
Demand ( v ), veh/h 124 603 14 31 334 175 8 91 59 171 68 115
Signal Information
GreenYellowRed
5.9 2.3 15.5 12.0 11.6 0.03.0 3.0 3.6 3.6 3.6 0.00.0 0.0 0.5 0.5 0.5 0.0
1 2 3 4
5 6 7
Cycle, s 65.6 Reference Phase 2
Offset, s 0 Reference Point End
Uncoordinated Yes Simult. Gap E/W On
Force Mode Fixed Simult. Gap N/S On
Timer Results EBL EBT WBL WBT NBL NBT SBL SBT
Assigned Phase 5 2 1 6 8 4
Case Number 2.0 4.0 2.0 4.0 12.0 9.0
Phase Duration, s 14.2 24.9 8.9 19.6 15.7 16.1
Change Period, ( Y+R c ), s 3.0 4.1 3.0 4.1 4.1 4.1
Max Allow Headway ( MAH ), s 3.1 3.1 3.1 3.1 3.2 3.2
Queue Clearance Time ( g s ), s 6.9 13.0 3.3 12.8 8.5 8.9
Green Extension Time ( g e ), s 0.1 2.6 0.0 2.7 0.2 0.6
Phase Call Probability 0.93 1.00 0.49 1.00 0.97 1.00
Max Out Probability 0.11 0.03 0.00 0.00 0.00 0.01
Movement Group Results EB WB NB SB
Approach Movement L T R L T R L T R L T R
Assigned Movement 5 2 12 1 6 16 3 8 18 7 4 14
Adjusted Flow Rate ( v ), veh/h 148 369 366 37 324 282 188 204 81 137
Adjusted Saturation Flow Rate ( s ), veh/h/ln 1781 1870 1852 1781 1870 1597 1742 1781 1870 1585
Queue Service Time ( g s ), s 4.9 11.0 11.0 1.3 10.5 10.8 6.5 6.9 2.4 5.1
Cycle Queue Clearance Time ( g c ), s 4.9 11.0 11.0 1.3 10.5 10.8 6.5 6.9 2.4 5.1
Green Ratio ( g/C ) 0.17 0.32 0.32 0.09 0.24 0.24 0.18 0.18 0.18 0.18
Capacity ( c ), veh/h 304 593 587 160 442 377 309 326 342 290
Volume-to-Capacity Ratio ( X ) 0.486 0.622 0.623 0.231 0.733 0.749 0.610 0.625 0.237 0.472
Back of Queue ( Q ), ft/ln ( 50 th percentile) 50 110.5 107.8 13.2 110.1 95.5 65.2 70.3 25.6 45.7
Back of Queue ( Q ), veh/ln ( 50 th percentile) 2.0 4.4 4.3 0.5 4.3 3.8 2.6 2.8 1.0 1.8
Queue Storage Ratio ( RQ ) ( 50 th percentile) 0.25 0.00 0.00 0.07 0.00 0.00 0.00 0.14 0.00 0.23
Uniform Delay ( d 1 ), s/veh 24.6 19.1 19.1 27.8 23.1 23.2 24.9 24.7 22.9 24.0
Incremental Delay ( d 2 ), s/veh 0.4 0.4 0.4 0.3 0.9 1.1 0.7 0.7 0.1 0.4
Initial Queue Delay ( d 3 ), s/veh 0.0 0.0 0.0 0.0 0.0 0.0 0.0 0.0 0.0 0.0
Control Delay ( d ), s/veh 25.0 19.5 19.5 28.0 24.0 24.4 25.6 25.5 23.0 24.4
Level of Service (LOS) C B B C C C C C C C
Approach Delay, s/veh / LOS 20.4 C 24.4 C 25.6 C 24.6 C
Intersection Delay, s/veh / LOS 22.9 C
Multimodal Results EB WB NB SB
Pedestrian LOS Score / LOS 2.1 B 2.4 B 2.9 C 2.8 C
Bicycle LOS Score / LOS 1.2 A 1.0 A 0.8 A 1.2 A
Copyright © 2017 University of Florida, All Rights Reserved. HCS7™ Streets Version 7.2.1 Generated: 8/8/2017 11:46:47 AM
2017 Intersection Monitoring Report Tulare County Association of Governments
Page 38 September 2017
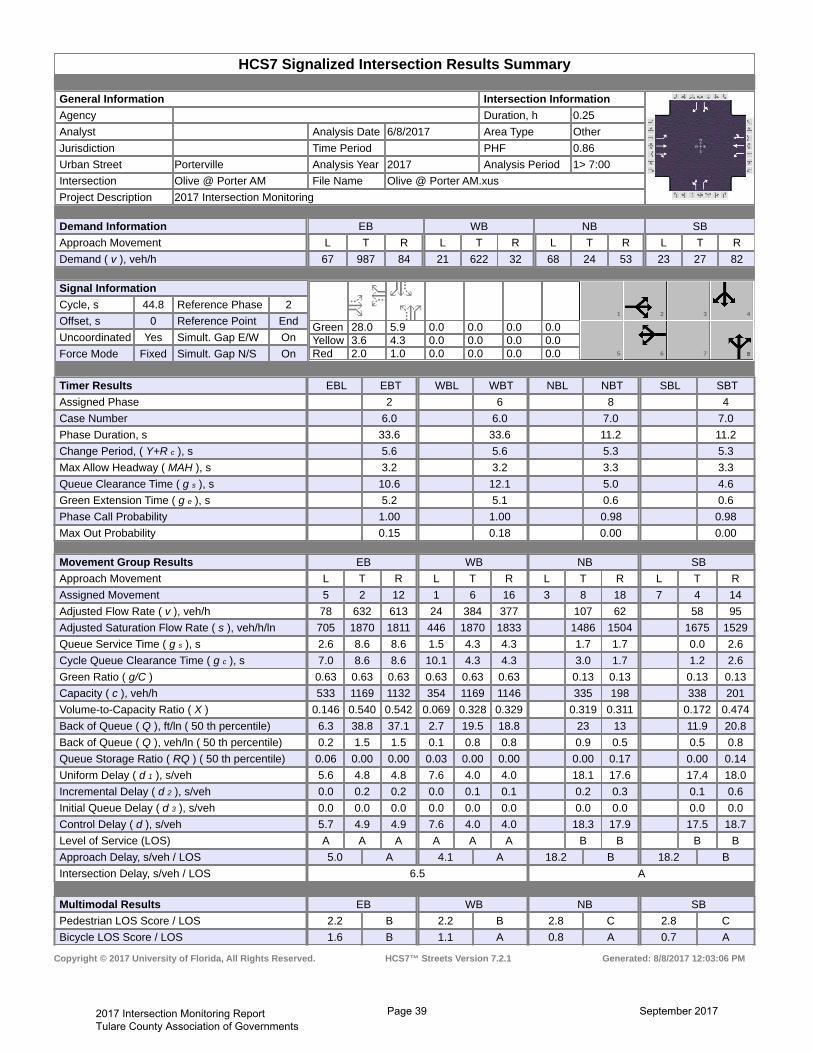
HCS7 Signalized Intersection Results Summary
General Information Intersection Information
Agency Duration, h 0.25
Analyst Analysis Date 6/8/2017 Area Type Other
Jurisdiction Time Period PHF 0.86
Urban Street Porterville Analysis Year 2017 Analysis Period 1> 7:00
Intersection Olive @ Porter AM File Name Olive @ Porter AM.xus
Project Description 2017 Intersection Monitoring
Demand Information EB WB NB SB
Approach Movement L T R L T R L T R L T R
Demand ( v ), veh/h 67 987 84 21 622 32 68 24 53 23 27 82
Signal Information
GreenYellowRed
28.0 5.9 0.0 0.0 0.0 0.03.6 4.3 0.0 0.0 0.0 0.02.0 1.0 0.0 0.0 0.0 0.0
1 2 3 4
5 6 7
Cycle, s 44.8 Reference Phase 2
Offset, s 0 Reference Point End
Uncoordinated Yes Simult. Gap E/W On
Force Mode Fixed Simult. Gap N/S On
Timer Results EBL EBT WBL WBT NBL NBT SBL SBT
Assigned Phase 2 6 8 4
Case Number 6.0 6.0 7.0 7.0
Phase Duration, s 33.6 33.6 11.2 11.2
Change Period, ( Y+R c ), s 5.6 5.6 5.3 5.3
Max Allow Headway ( MAH ), s 3.2 3.2 3.3 3.3
Queue Clearance Time ( g s ), s 10.6 12.1 5.0 4.6
Green Extension Time ( g e ), s 5.2 5.1 0.6 0.6
Phase Call Probability 1.00 1.00 0.98 0.98
Max Out Probability 0.15 0.18 0.00 0.00
Movement Group Results EB WB NB SB
Approach Movement L T R L T R L T R L T R
Assigned Movement 5 2 12 1 6 16 3 8 18 7 4 14
Adjusted Flow Rate ( v ), veh/h 78 632 613 24 384 377 107 62 58 95
Adjusted Saturation Flow Rate ( s ), veh/h/ln 705 1870 1811 446 1870 1833 1486 1504 1675 1529
Queue Service Time ( g s ), s 2.6 8.6 8.6 1.5 4.3 4.3 1.7 1.7 0.0 2.6
Cycle Queue Clearance Time ( g c ), s 7.0 8.6 8.6 10.1 4.3 4.3 3.0 1.7 1.2 2.6
Green Ratio ( g/C ) 0.63 0.63 0.63 0.63 0.63 0.63 0.13 0.13 0.13 0.13
Capacity ( c ), veh/h 533 1169 1132 354 1169 1146 335 198 338 201
Volume-to-Capacity Ratio ( X ) 0.146 0.540 0.542 0.069 0.328 0.329 0.319 0.311 0.172 0.474
Back of Queue ( Q ), ft/ln ( 50 th percentile) 6.3 38.8 37.1 2.7 19.5 18.8 23 13 11.9 20.8
Back of Queue ( Q ), veh/ln ( 50 th percentile) 0.2 1.5 1.5 0.1 0.8 0.8 0.9 0.5 0.5 0.8
Queue Storage Ratio ( RQ ) ( 50 th percentile) 0.06 0.00 0.00 0.03 0.00 0.00 0.00 0.17 0.00 0.14
Uniform Delay ( d 1 ), s/veh 5.6 4.8 4.8 7.6 4.0 4.0 18.1 17.6 17.4 18.0
Incremental Delay ( d 2 ), s/veh 0.0 0.2 0.2 0.0 0.1 0.1 0.2 0.3 0.1 0.6
Initial Queue Delay ( d 3 ), s/veh 0.0 0.0 0.0 0.0 0.0 0.0 0.0 0.0 0.0 0.0
Control Delay ( d ), s/veh 5.7 4.9 4.9 7.6 4.0 4.0 18.3 17.9 17.5 18.7
Level of Service (LOS) A A A A A A B B B B
Approach Delay, s/veh / LOS 5.0 A 4.1 A 18.2 B 18.2 B
Intersection Delay, s/veh / LOS 6.5 A
Multimodal Results EB WB NB SB
Pedestrian LOS Score / LOS 2.2 B 2.2 B 2.8 C 2.8 C
Bicycle LOS Score / LOS 1.6 B 1.1 A 0.8 A 0.7 A
Copyright © 2017 University of Florida, All Rights Reserved. HCS7™ Streets Version 7.2.1 Generated: 8/8/2017 12:03:06 PM
2017 Intersection Monitoring Report Tulare County Association of Governments
Page 39 September 2017

HCS7 Signalized Intersection Results Summary
General Information Intersection Information
Agency Duration, h 0.25
Analyst Analysis Date 5/24/2017 Area Type Other
Jurisdiction Time Period PHF 0.81
Urban Street Porterville Analysis Year 2017 Analysis Period 1> 7:00
Intersection Olive @ Indiana AM File Name Olive @ Indiana AM.xus
Project Description 2017 Intersection Monitoring
Demand Information EB WB NB SB
Approach Movement L T R L T R L T R L T R
Demand ( v ), veh/h 90 818 110 10 501 59 96 35 13 98 66 66
Signal Information
GreenYellowRed
0.4 3.4 15.5 4.2 5.0 0.03.2 0.0 3.9 3.2 3.6 0.01.0 0.0 1.0 1.0 1.0 0.0
1 2 4
5 6 7
Cycle, s 46.5 Reference Phase 2
Offset, s 0 Reference Point End
Uncoordinated Yes Simult. Gap E/W On
Force Mode Fixed Simult. Gap N/S On
Timer Results EBL EBT WBL WBT NBL NBT SBL SBT
Assigned Phase 5 2 1 6 3 8 7 4
Case Number 2.0 4.0 2.0 4.0 2.0 4.0 2.0 3.0
Phase Duration, s 8.1 23.9 4.6 20.4 8.4 9.5 8.4 9.6
Change Period, ( Y+R c ), s 4.2 4.9 4.2 4.9 4.2 4.6 4.2 4.6
Max Allow Headway ( MAH ), s 3.1 3.1 3.1 3.1 3.1 3.2 3.1 3.2
Queue Clearance Time ( g s ), s 4.9 14.7 2.3 9.3 5.1 2.8 5.1 4.3
Green Extension Time ( g e ), s 0.2 4.1 0.0 4.0 0.2 0.4 0.2 0.4
Phase Call Probability 0.76 1.00 0.15 1.00 0.79 0.99 0.79 0.99
Max Out Probability 0.00 0.00 0.00 0.06 0.00 0.00 0.00 0.00
Movement Group Results EB WB NB SB
Approach Movement L T R L T R L T R L T R
Assigned Movement 5 2 12 1 6 16 3 8 18 7 4 14
Adjusted Flow Rate ( v ), veh/h 111 585 561 12 352 339 119 30 29 121 81 81
Adjusted Saturation Flow Rate ( s ), veh/h/ln 1767 1856 1775 1767 1856 1781 1767 1856 1603 1767 1856 1542
Queue Service Time ( g s ), s 2.9 12.7 12.7 0.3 7.3 7.3 3.1 0.7 0.8 3.1 1.9 2.3
Cycle Queue Clearance Time ( g c ), s 2.9 12.7 12.7 0.3 7.3 7.3 3.1 0.7 0.8 3.1 1.9 2.3
Green Ratio ( g/C ) 0.08 0.41 0.41 0.01 0.33 0.33 0.09 0.11 0.11 0.09 0.11 0.11
Capacity ( c ), veh/h 149 759 726 17 620 595 159 197 170 162 200 167
Volume-to-Capacity Ratio ( X ) 0.746 0.771 0.772 0.716 0.568 0.570 0.745 0.152 0.173 0.745 0.406 0.489
Back of Queue ( Q ), ft/ln ( 50 th percentile) 29.6 103.7 97.2 5.4 62.7 59 31.2 6.8 6.5 31.8 19.2 19.5
Back of Queue ( Q ), veh/ln ( 50 th percentile) 1.2 4.1 3.9 0.2 2.4 2.4 1.2 0.3 0.3 1.2 0.7 0.8
Queue Storage Ratio ( RQ ) ( 50 th percentile) 0.15 0.00 0.00 0.03 0.00 0.00 0.21 0.00 0.00 0.21 0.00 0.13
Uniform Delay ( d 1 ), s/veh 20.9 11.9 11.9 23.1 12.8 12.8 20.7 19.0 19.0 20.7 19.4 19.6
Incremental Delay ( d 2 ), s/veh 2.8 0.6 0.7 18.5 0.3 0.3 2.6 0.1 0.2 2.5 0.5 0.8
Initial Queue Delay ( d 3 ), s/veh 0.0 0.0 0.0 0.0 0.0 0.0 0.0 0.0 0.0 0.0 0.0 0.0
Control Delay ( d ), s/veh 23.7 12.6 12.6 41.6 13.1 13.1 23.3 19.1 19.2 23.2 19.9 20.4
Level of Service (LOS) C B B D B B C B B C B C
Approach Delay, s/veh / LOS 13.6 B 13.6 B 21.9 C 21.5 C
Intersection Delay, s/veh / LOS 15.1 B
Multimodal Results EB WB NB SB
Pedestrian LOS Score / LOS 2.4 B 2.8 C 2.8 C 2.8 C
Bicycle LOS Score / LOS 1.5 B 1.1 A 0.6 A 1.0 A
Copyright © 2017 University of Florida, All Rights Reserved. HCS7™ Streets Version 7.2.1 Generated: 8/8/2017 11:59:05 AM
2017 Intersection Monitoring Report Tulare County Association of Governments
Page 40 September 2017
2017 Intersection Monitoring Report Tulare County Association of Governments
Page 41 September 2017

HCS7 Two-Way Stop-Control Report
General Information Site InformationAnalyst Mark Hays Intersection Bardsley @ Oakmore
Agency/Co. TCAG Jurisdiction Tulare
Date Performed 5/15/2017 East/West Street Bardsley Ave
Analysis Year 2017 North/South Street Oakmore St
Time Analyzed AM peak Peak Hour Factor 0.64
Intersection Orientation East-West Analysis Time Period (hrs) 0.25
Project Description 2017 Intersection Monitoring
Lanes
Major Street: East-West
Vehicle Volumes and AdjustmentsApproach Eastbound Westbound Northbound Southbound
Movement U L T R U L T R U L T R U L T R
Priority 1U 1 2 3 4U 4 5 6 7 8 9 10 11 12
Number of Lanes 0 1 1 0 0 0 1 0 0 0 0 1 0 1
Configuration L T TR L R
Volume, V (veh/h) 133 262 141 27 25 159
Percent Heavy Vehicles (%) 8 8 8
Proportion Time Blocked
Percent Grade (%) 0
Right Turn Channelized No No No No
Median Type/Storage Undivided
Critical and Follow-up HeadwaysBase Critical Headway (sec)
Critical Headway (sec)
Base Follow-Up Headway (sec)
Follow-Up Headway (sec)
Delay, Queue Length, and Level of ServiceFlow Rate, v (veh/h) 208 39 248
Capacity, c (veh/h) 1265 199 780
v/c Ratio 0.16 0.20 0.32
95% Queue Length, Q₉₅ (veh) 0.6 0.7 1.4
Control Delay (s/veh) 8.4 27.4 11.7
Level of Service, LOS A D B
Approach Delay (s/veh) 2.8 13.9
Approach LOS B
Copyright © 2017 University of Florida. All Rights Reserved. HCS7™ TWSC Version 7.2.1 Generated: 8/8/2017 1:59:35 PMBardsley @ Oakmore AM.xtw
2017 Intersection Monitoring Report Tulare County Association of Governments
Page 42 September 2017

HCS7 Two-Way Stop-Control Report
General Information Site InformationAnalyst Mark Hays Intersection Tulare @ Oakmore
Agency/Co. TCAG Jurisdiction Tulare
Date Performed 5/17/2017 East/West Street Tulare Ave
Analysis Year 2017 North/South Street Oakmore St
Time Analyzed AM Peak Peak Hour Factor 0.77
Intersection Orientation East-West Analysis Time Period (hrs) 0.25
Project Description 2017 Intersection Monitoring
Lanes
Major Street: East-West
Vehicle Volumes and AdjustmentsApproach Eastbound Westbound Northbound Southbound
Movement U L T R U L T R U L T R U L T R
Priority 1U 1 2 3 4U 4 5 6 7 8 9 10 11 12
Number of Lanes 0 0 1 0 0 0 1 0 0 1 0 0 1 0
Configuration LTR LTR LTR LTR
Volume, V (veh/h) 5 428 224 34 458 0 62 0 17 0 0 12
Percent Heavy Vehicles (%) 6 6 6 6 6 6 6 6
Proportion Time Blocked
Percent Grade (%) 0 0
Right Turn Channelized No No No No
Median Type/Storage Undivided
Critical and Follow-up HeadwaysBase Critical Headway (sec)
Critical Headway (sec)
Base Follow-Up Headway (sec)
Follow-Up Headway (sec)
Delay, Queue Length, and Level of ServiceFlow Rate, v (veh/h) 6 44 103 16
Capacity, c (veh/h) 963 775 123 497
v/c Ratio 0.01 0.06 0.84 0.03
95% Queue Length, Q₉₅ (veh) 0.0 0.2 5.1 0.1
Control Delay (s/veh) 8.8 9.9 109.6 12.5
Level of Service, LOS A A F B
Approach Delay (s/veh) 0.2 1.5 109.6 12.5
Approach LOS F B
Copyright © 2017 University of Florida. All Rights Reserved. HCS7™ TWSC Version 7.2.1 Generated: 8/8/2017 2:12:26 PMTulare @ Oakmore AM.xtw
2017 Intersection Monitoring Report Tulare County Association of Governments
Page 43 September 2017

HCS+: Unsignalized Intersections Release 5.6 Phone: Fax: E-Mail: ___________________ALL-WAY STOP CONTROL(AWSC) ANALYSIS________________________ Analyst: Mark Hays Agency/Co.: TCAG Date Performed: 5/17/2017 Analysis Time Period: AM Peak Intersection: Tulare @ E St Jurisdiction: Tulare Units: U. S. Customary Analysis Year: 2017 Project ID: 2017 Intersection Monitoring East/West Street: Tulare Ave North/South Street: E St _________Worksheet 2 - Volume Adjustments and Site Characteristics____________ | Eastbound | Westbound | Northbound | Southbound | | L T R | L T R | L T R | L T R | |_______________|_______________|_______________|_______________| Volume |18 86 44 |7 20 8 |26 208 17 |15 178 19 | % Thrus Left Lane Eastbound Westbound Northbound Southbound L1 L2 L1 L2 L1 L2 L1 L2 Configuration LT R LT R LT R LT R PHF 0.95 0.95 0.67 0.67 0.72 0.72 0.70 0.70 Flow Rate 108 46 39 11 324 23 275 27 % Heavy Veh 5 5 5 5 5 5 5 5 No. Lanes 2 2 2 2 Opposing-Lanes 2 2 2 2 Conflicting-lanes 2 2 2 2 Geometry group 5 5 5 5 Duration, T 0.25 hrs. ___________Worksheet 3 - Saturation Headway Adjustment Worksheet______________ Eastbound Westbound Northbound Southbound L1 L2 L1 L2 L1 L2 L1 L2 Flow Rates: Total in Lane 108 46 39 11 324 23 275 27 Left-Turn 18 0 10 0 36 0 21 0 Right-Turn 0 46 0 11 0 23 0 27 Prop. Left-Turns 0.2 0.0 0.3 0.0 0.1 0.0 0.1 0.0 Prop. Right-Turns 0.0 1.0 0.0 1.0 0.0 1.0 0.0 1.0 Prop. Heavy Vehicle0.0 0.0 0.0 0.0 0.0 0.0 0.0 0.0 Geometry Group 5 5 5 5 Adjustments Exhibit 17-33: hLT-adj 0.5 0.5 0.5 0.5
2017 Intersection Monitoring Report Tulare County Association of Governments
Page 44 September 2017

hRT-adj -0.7 -0.7 -0.7 -0.7 hHV-adj 1.7 1.7 1.7 1.7 hadj, computed 0.2 -0.6 0.2 -0.6 0.1 -0.6 0.1 -0.6 _______________Worksheet 4 - Departure Headway and Service Time_______________ Eastbound Westbound Northbound Southbound L1 L2 L1 L2 L1 L2 L1 L2 Flow rate 108 46 39 11 324 23 275 27 hd, initial value 3.20 3.20 3.20 3.20 3.20 3.20 3.20 3.20 x, initial 0.10 0.04 0.03 0.01 0.29 0.02 0.24 0.02 hd, final value 6.39 5.61 6.62 5.79 5.58 4.83 5.61 4.87 x, final value 0.192 0.072 0.072 0.018 0.502 0.031 0.429 0.037 Move-up time, m 2.3 2.3 2.3 2.3 Service Time 4.1 3.3 4.3 3.5 3.3 2.5 3.3 2.6 _______________Worksheet 5 - Capacity and Level of Service____________________ Eastbound Westbound Northbound Southbound L1 L2 L1 L2 L1 L2 L1 L2 Flow Rate 108 46 39 11 324 23 275 27 Service Time 4.1 3.3 4.3 3.5 3.3 2.5 3.3 2.6 Utilization, x 0.192 0.072 0.072 0.018 0.502 0.031 0.429 0.037 Dep. headway, hd 6.39 5.61 6.62 5.79 5.58 4.83 5.61 4.87 Capacity 568 657 557 550 648 767 640 675 95% Queue Length 0.7 0.2 0.2 0.1 2.8 0.1 2.1 0.1 Delay 10.6 8.7 9.8 8.6 13.8 7.7 12.5 7.8 LOS B A A A B A B A Approach: Delay 10.0+ 9.6 13.4 12.0 LOS B A B B Intersection Delay 12.1 Intersection LOS B ______________________________________________________________________________
2017 Intersection Monitoring Report Tulare County Association of Governments
Page 45 September 2017
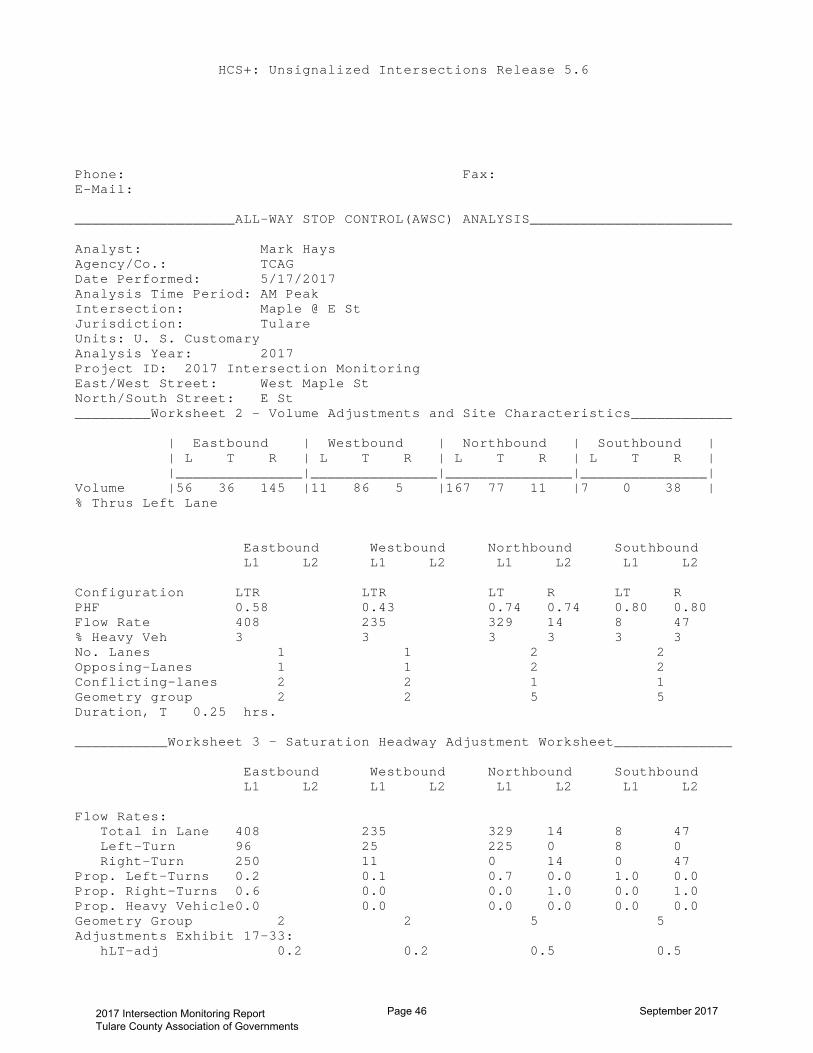
HCS+: Unsignalized Intersections Release 5.6 Phone: Fax: E-Mail: ___________________ALL-WAY STOP CONTROL(AWSC) ANALYSIS________________________ Analyst: Mark Hays Agency/Co.: TCAG Date Performed: 5/17/2017 Analysis Time Period: AM Peak Intersection: Maple @ E St Jurisdiction: Tulare Units: U. S. Customary Analysis Year: 2017 Project ID: 2017 Intersection Monitoring East/West Street: West Maple St North/South Street: E St _________Worksheet 2 - Volume Adjustments and Site Characteristics____________ | Eastbound | Westbound | Northbound | Southbound | | L T R | L T R | L T R | L T R | |_______________|_______________|_______________|_______________| Volume |56 36 145 |11 86 5 |167 77 11 |7 0 38 | % Thrus Left Lane Eastbound Westbound Northbound Southbound L1 L2 L1 L2 L1 L2 L1 L2 Configuration LTR LTR LT R LT R PHF 0.58 0.43 0.74 0.74 0.80 0.80 Flow Rate 408 235 329 14 8 47 % Heavy Veh 3 3 3 3 3 3 No. Lanes 1 1 2 2 Opposing-Lanes 1 1 2 2 Conflicting-lanes 2 2 1 1 Geometry group 2 2 5 5 Duration, T 0.25 hrs. ___________Worksheet 3 - Saturation Headway Adjustment Worksheet______________ Eastbound Westbound Northbound Southbound L1 L2 L1 L2 L1 L2 L1 L2 Flow Rates: Total in Lane 408 235 329 14 8 47 Left-Turn 96 25 225 0 8 0 Right-Turn 250 11 0 14 0 47 Prop. Left-Turns 0.2 0.1 0.7 0.0 1.0 0.0 Prop. Right-Turns 0.6 0.0 0.0 1.0 0.0 1.0 Prop. Heavy Vehicle0.0 0.0 0.0 0.0 0.0 0.0 Geometry Group 2 2 5 5 Adjustments Exhibit 17-33: hLT-adj 0.2 0.2 0.5 0.5
2017 Intersection Monitoring Report Tulare County Association of Governments
Page 46 September 2017

hRT-adj -0.6 -0.6 -0.7 -0.7 hHV-adj 1.7 1.7 1.7 1.7 hadj, computed -0.3 0.0 0.4 -0.6 0.6 -0.6 _______________Worksheet 4 - Departure Headway and Service Time_______________ Eastbound Westbound Northbound Southbound L1 L2 L1 L2 L1 L2 L1 L2 Flow rate 408 235 329 14 8 47 hd, initial value 3.20 3.20 3.20 3.20 3.20 3.20 3.20 3.20 x, initial 0.36 0.21 0.29 0.01 0.01 0.04 hd, final value 5.40 5.98 6.85 5.78 7.72 6.48 x, final value 0.612 0.390 0.626 0.022 0.017 0.085 Move-up time, m 2.0 2.0 2.3 2.3 Service Time 3.4 4.0 4.5 3.5 5.4 4.2 _______________Worksheet 5 - Capacity and Level of Service____________________ Eastbound Westbound Northbound Southbound L1 L2 L1 L2 L1 L2 L1 L2 Flow Rate 408 235 329 14 8 47 Service Time 3.4 4.0 4.5 3.5 5.4 4.2 Utilization, x 0.612 0.390 0.626 0.022 0.017 0.085 Dep. headway, hd 5.40 5.98 6.85 5.78 7.72 6.48 Capacity 669 603 522 700 400 588 95% Queue Length 4.2 1.8 4.3 0.1 0.1 0.3 Delay 16.5 12.8 20.3 8.6 10.6 9.8 LOS C B C A B A Approach: Delay 16.5 12.8 19.8 9.9 LOS C B C A Intersection Delay 16.4 Intersection LOS C ______________________________________________________________________________
2017 Intersection Monitoring Report Tulare County Association of Governments
Page 47 September 2017
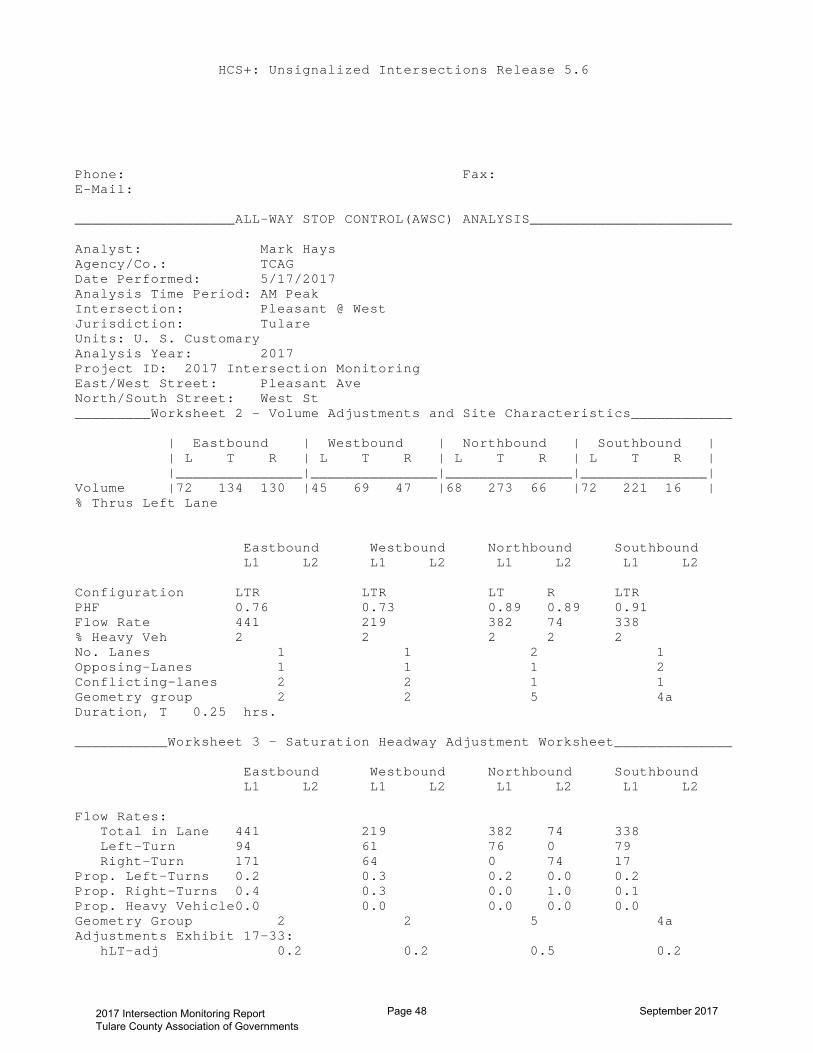
HCS+: Unsignalized Intersections Release 5.6 Phone: Fax: E-Mail: ___________________ALL-WAY STOP CONTROL(AWSC) ANALYSIS________________________ Analyst: Mark Hays Agency/Co.: TCAG Date Performed: 5/17/2017 Analysis Time Period: AM Peak Intersection: Pleasant @ West Jurisdiction: Tulare Units: U. S. Customary Analysis Year: 2017 Project ID: 2017 Intersection Monitoring East/West Street: Pleasant Ave North/South Street: West St _________Worksheet 2 - Volume Adjustments and Site Characteristics____________ | Eastbound | Westbound | Northbound | Southbound | | L T R | L T R | L T R | L T R | |_______________|_______________|_______________|_______________| Volume |72 134 130 |45 69 47 |68 273 66 |72 221 16 | % Thrus Left Lane Eastbound Westbound Northbound Southbound L1 L2 L1 L2 L1 L2 L1 L2 Configuration LTR LTR LT R LTR PHF 0.76 0.73 0.89 0.89 0.91 Flow Rate 441 219 382 74 338 % Heavy Veh 2 2 2 2 2 No. Lanes 1 1 2 1 Opposing-Lanes 1 1 1 2 Conflicting-lanes 2 2 1 1 Geometry group 2 2 5 4a Duration, T 0.25 hrs. ___________Worksheet 3 - Saturation Headway Adjustment Worksheet______________ Eastbound Westbound Northbound Southbound L1 L2 L1 L2 L1 L2 L1 L2 Flow Rates: Total in Lane 441 219 382 74 338 Left-Turn 94 61 76 0 79 Right-Turn 171 64 0 74 17 Prop. Left-Turns 0.2 0.3 0.2 0.0 0.2 Prop. Right-Turns 0.4 0.3 0.0 1.0 0.1 Prop. Heavy Vehicle0.0 0.0 0.0 0.0 0.0 Geometry Group 2 2 5 4a Adjustments Exhibit 17-33: hLT-adj 0.2 0.2 0.5 0.2
2017 Intersection Monitoring Report Tulare County Association of Governments
Page 48 September 2017
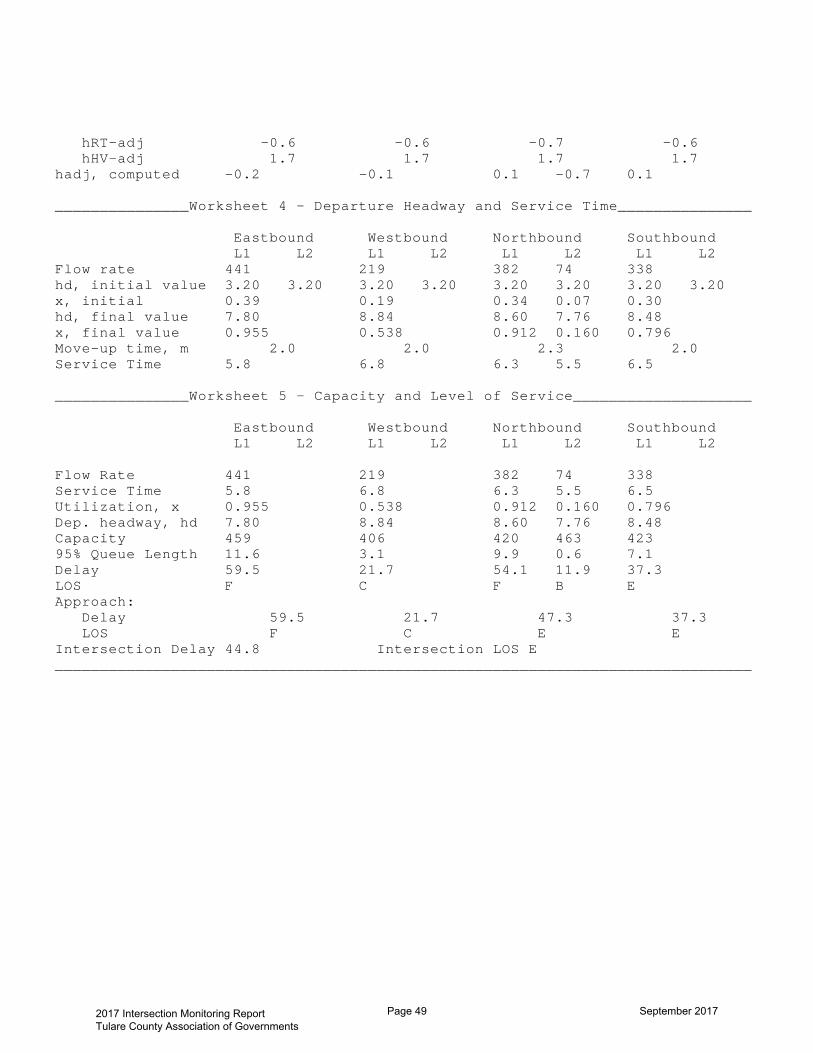
hRT-adj -0.6 -0.6 -0.7 -0.6 hHV-adj 1.7 1.7 1.7 1.7 hadj, computed -0.2 -0.1 0.1 -0.7 0.1 _______________Worksheet 4 - Departure Headway and Service Time_______________ Eastbound Westbound Northbound Southbound L1 L2 L1 L2 L1 L2 L1 L2 Flow rate 441 219 382 74 338 hd, initial value 3.20 3.20 3.20 3.20 3.20 3.20 3.20 3.20 x, initial 0.39 0.19 0.34 0.07 0.30 hd, final value 7.80 8.84 8.60 7.76 8.48 x, final value 0.955 0.538 0.912 0.160 0.796 Move-up time, m 2.0 2.0 2.3 2.0 Service Time 5.8 6.8 6.3 5.5 6.5 _______________Worksheet 5 - Capacity and Level of Service____________________ Eastbound Westbound Northbound Southbound L1 L2 L1 L2 L1 L2 L1 L2 Flow Rate 441 219 382 74 338 Service Time 5.8 6.8 6.3 5.5 6.5 Utilization, x 0.955 0.538 0.912 0.160 0.796 Dep. headway, hd 7.80 8.84 8.60 7.76 8.48 Capacity 459 406 420 463 423 95% Queue Length 11.6 3.1 9.9 0.6 7.1 Delay 59.5 21.7 54.1 11.9 37.3 LOS F C F B E Approach: Delay 59.5 21.7 47.3 37.3 LOS F C E E Intersection Delay 44.8 Intersection LOS E ______________________________________________________________________________
2017 Intersection Monitoring Report Tulare County Association of Governments
Page 49 September 2017

HCS7 Signalized Intersection Results Summary
General Information Intersection Information
Agency Duration, h 0.25
Analyst Analysis Date 5/24/2017 Area Type Other
Jurisdiction Time Period PHF 0.74
Urban Street City of Tulare Analysis Year 2017 Analysis Period 1> 7:00
Intersection Cross @ B St AM File Name Cross @ B St AM.xus
Project Description 2017 Intersection Monitoring
Demand Information EB WB NB SB
Approach Movement L T R L T R L T R L T R
Demand ( v ), veh/h 58 241 13 66 194 73 10 85 64 85 72 61
Signal Information
GreenYellowRed
10.3 7.6 0.0 0.0 0.0 0.04.0 4.0 0.0 0.0 0.0 0.00.5 1.0 0.0 0.0 0.0 0.0
1 2 3 4
5 6 7
Cycle, s 27.4 Reference Phase 2
Offset, s 0 Reference Point End
Uncoordinated Yes Simult. Gap E/W On
Force Mode Fixed Simult. Gap N/S On
Timer Results EBL EBT WBL WBT NBL NBT SBL SBT
Assigned Phase 2 6 8 4
Case Number 6.0 6.0 8.0 8.0
Phase Duration, s 14.8 14.8 12.6 12.6
Change Period, ( Y+R c ), s 4.5 4.5 5.0 5.0
Max Allow Headway ( MAH ), s 3.3 3.3 3.3 3.3
Queue Clearance Time ( g s ), s 8.3 8.0 4.8 6.7
Green Extension Time ( g e ), s 2.0 2.0 1.1 1.1
Phase Call Probability 1.00 1.00 0.98 0.98
Max Out Probability 0.00 0.00 0.00 0.00
Movement Group Results EB WB NB SB
Approach Movement L T R L T R L T R L T R
Assigned Movement 5 2 12 1 6 16 3 8 18 7 4 14
Adjusted Flow Rate ( v ), veh/h 78 343 89 361 215 295
Adjusted Saturation Flow Rate ( s ), veh/h/ln 1003 1858 1013 1753 1721 1502
Queue Service Time ( g s ), s 1.8 3.9 2.0 4.4 0.0 1.9
Cycle Queue Clearance Time ( g c ), s 6.3 3.9 6.0 4.4 2.8 4.7
Green Ratio ( g/C ) 0.38 0.38 0.38 0.38 0.28 0.28
Capacity ( c ), veh/h 475 699 498 659 617 600
Volume-to-Capacity Ratio ( X ) 0.165 0.491 0.179 0.547 0.348 0.491
Back of Queue ( Q ), ft/ln ( 50 th percentile) 6.4 18.5 7 20.2 15.4 22.6
Back of Queue ( Q ), veh/ln ( 50 th percentile) 0.3 0.7 0.3 0.8 0.6 0.9
Queue Storage Ratio ( RQ ) ( 50 th percentile) 0.06 0.00 0.03 0.00 0.00 0.00
Uniform Delay ( d 1 ), s/veh 9.2 6.5 8.9 6.7 8.2 8.7
Incremental Delay ( d 2 ), s/veh 0.1 0.2 0.1 0.3 0.1 0.2
Initial Queue Delay ( d 3 ), s/veh 0.0 0.0 0.0 0.0 0.0 0.0
Control Delay ( d ), s/veh 9.3 6.7 8.9 7.0 8.3 9.0
Level of Service (LOS) A A A A A A
Approach Delay, s/veh / LOS 7.2 A 7.4 A 8.3 A 9.0 A
Intersection Delay, s/veh / LOS 7.8 A
Multimodal Results EB WB NB SB
Pedestrian LOS Score / LOS 2.1 B 2.1 B 2.2 B 2.2 B
Bicycle LOS Score / LOS 1.2 A 1.2 A 0.8 A 1.0 A
Copyright © 2017 University of Florida, All Rights Reserved. HCS7™ Streets Version 7.2.1 Generated: 8/8/2017 1:30:57 PM
2017 Intersection Monitoring Report Tulare County Association of Governments
Page 50 September 2017
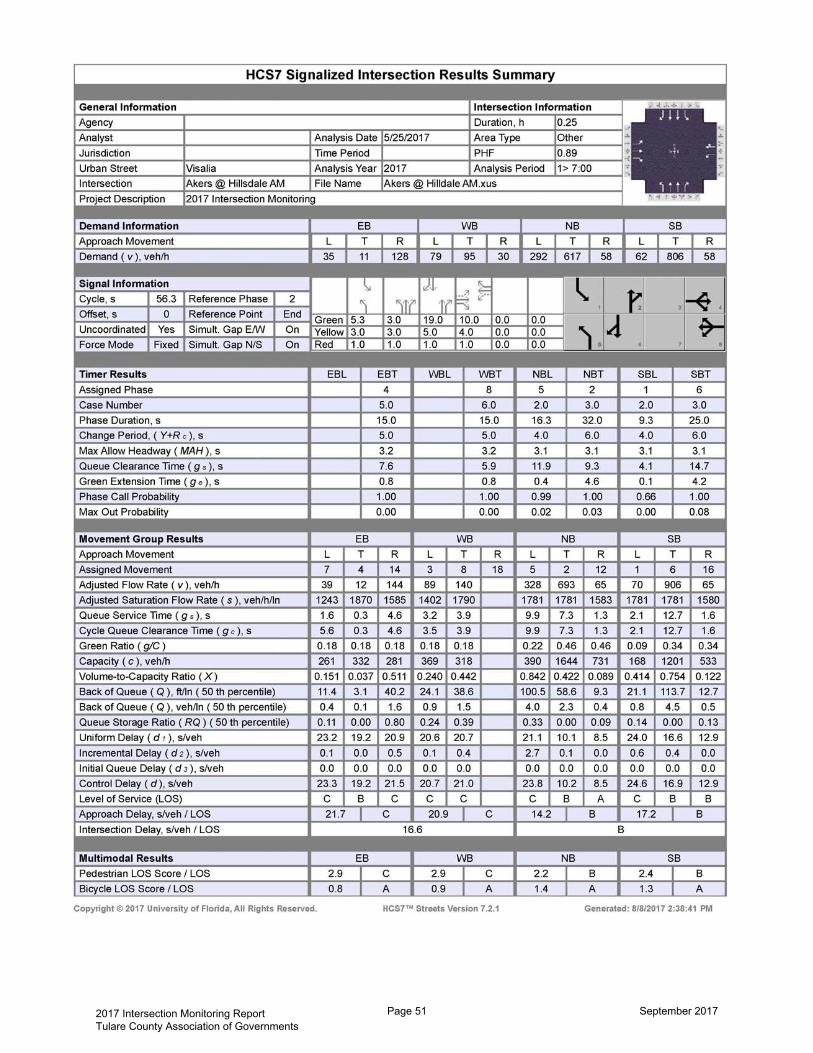
2017 Intersection Monitoring Report Tulare County Association of Governments
Page 51 September 2017

2017 Intersection Monitoring Report Tulare County Association of Governments
Page 52 September 2017
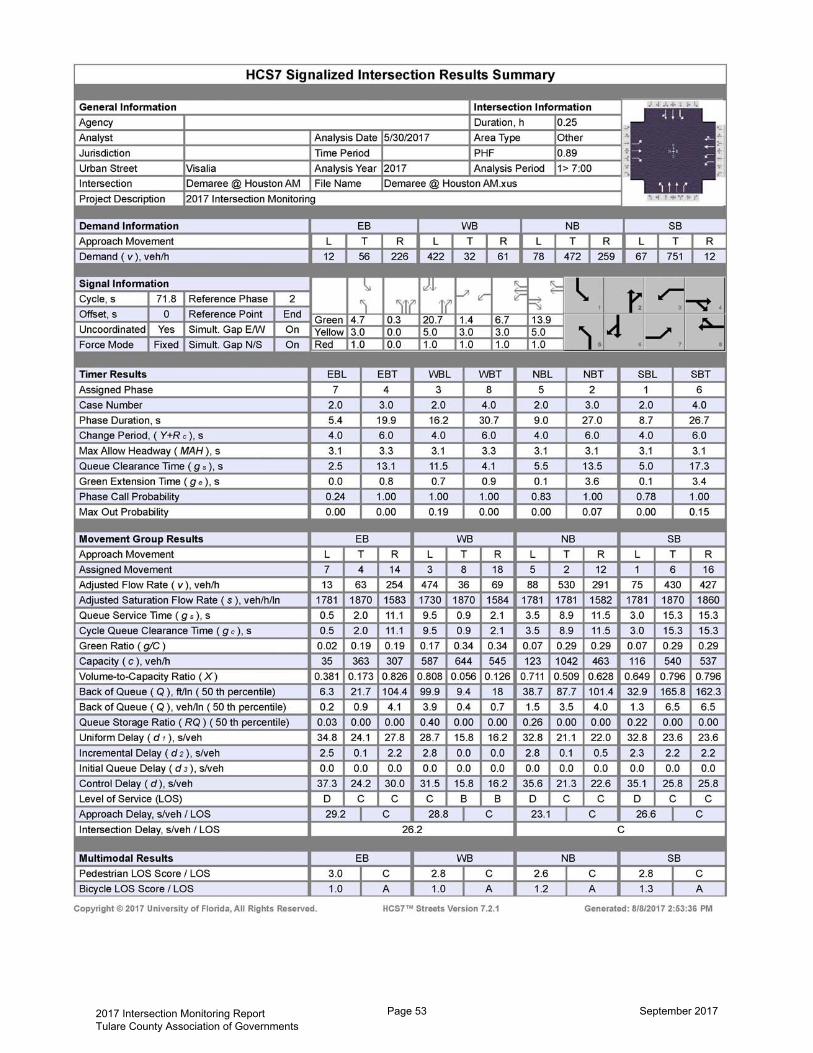
2017 Intersection Monitoring Report Tulare County Association of Governments
Page 53 September 2017

2017 Intersection Monitoring Report Tulare County Association of Governments
Page 54 September 2017

2017 Intersection Monitoring Report Tulare County Association of Governments
Page 55 September 2017

2017 Intersection Monitoring Report Tulare County Association of Governments
Page 56 September 2017

HCS7 Signalized Intersection Results Summary
General Information Intersection Information
Agency Duration, h 0.25
Analyst Analysis Date 5/25/2017 Area Type Other
Jurisdiction Time Period PHF 0.87
Urban Street Visalia Analysis Year 2017 Analysis Period 1> 7:00
Intersection Caldwell @ County Cent… File Name Caldwell @ County Center AM.xus
Project Description 2017 Intersection Monitoring
Demand Information EB WB NB SB
Approach Movement L T R L T R L T R L T R
Demand ( v ), veh/h 90 457 98 17 419 53 96 114 19 58 140 85
Signal Information
GreenYellowRed
1.3 3.1 10.5 3.4 1.1 8.03.0 0.0 4.5 3.0 0.0 4.01.0 0.0 1.0 1.0 0.0 1.0
1 2 4
5 6 7
Cycle, s 45.9 Reference Phase 2
Offset, s 0 Reference Point End
Uncoordinated Yes Simult. Gap E/W On
Force Mode Fixed Simult. Gap N/S On
Timer Results EBL EBT WBL WBT NBL NBT SBL SBT
Assigned Phase 5 2 1 6 3 8 7 4
Case Number 2.0 4.0 2.0 4.0 2.0 3.0 2.0 3.0
Phase Duration, s 8.4 19.1 5.3 16.0 8.5 14.1 7.4 13.0
Change Period, ( Y+R c ), s 4.0 5.5 4.0 5.5 4.0 5.0 4.0 5.0
Max Allow Headway ( MAH ), s 3.1 3.1 3.1 3.1 3.1 3.1 3.1 3.1
Queue Clearance Time ( g s ), s 4.6 8.9 2.5 8.2 4.7 4.8 3.7 5.6
Green Extension Time ( g e ), s 0.1 2.3 0.0 2.3 0.1 0.7 0.1 0.7
Phase Call Probability 0.73 1.00 0.22 1.00 0.76 1.00 0.57 1.00
Max Out Probability 0.00 0.00 0.00 0.00 0.00 0.00 0.00 0.00
Movement Group Results EB WB NB SB
Approach Movement L T R L T R L T R L T R
Assigned Movement 5 2 12 1 6 16 3 8 18 7 4 14
Adjusted Flow Rate ( v ), veh/h 103 328 310 20 276 267 110 131 22 67 161 98
Adjusted Saturation Flow Rate ( s ), veh/h/ln 1781 1870 1756 1781 1870 1793 1781 1870 1585 1781 1870 1556
Queue Service Time ( g s ), s 2.6 6.9 6.9 0.5 6.1 6.2 2.7 2.8 0.5 1.7 3.6 2.5
Cycle Queue Clearance Time ( g c ), s 2.6 6.9 6.9 0.5 6.1 6.2 2.7 2.8 0.5 1.7 3.6 2.5
Green Ratio ( g/C ) 0.10 0.30 0.30 0.03 0.23 0.23 0.10 0.20 0.20 0.07 0.17 0.17
Capacity ( c ), veh/h 171 553 519 52 427 410 176 370 313 134 325 271
Volume-to-Capacity Ratio ( X ) 0.605 0.593 0.598 0.379 0.646 0.651 0.627 0.354 0.070 0.499 0.495 0.361
Back of Queue ( Q ), ft/ln ( 50 th percentile) 25.1 60.9 56.8 5.3 57.3 54.6 26.7 26.1 4.1 16.3 34.3 20.2
Back of Queue ( Q ), veh/ln ( 50 th percentile) 1.0 2.4 2.3 0.2 2.3 2.2 1.1 1.0 0.2 0.6 1.3 0.8
Queue Storage Ratio ( RQ ) ( 50 th percentile) 0.19 0.00 0.00 0.04 0.00 0.00 0.21 0.00 0.08 0.13 0.00 0.40
Uniform Delay ( d 1 ), s/veh 19.9 13.8 13.8 21.9 16.0 16.1 19.9 15.9 15.0 20.4 17.1 16.7
Incremental Delay ( d 2 ), s/veh 1.3 0.4 0.4 1.7 0.6 0.7 1.4 0.2 0.0 1.1 0.4 0.3
Initial Queue Delay ( d 3 ), s/veh 0.0 0.0 0.0 0.0 0.0 0.0 0.0 0.0 0.0 0.0 0.0 0.0
Control Delay ( d ), s/veh 21.2 14.2 14.3 23.6 16.6 16.7 21.2 16.1 15.0 21.5 17.6 17.0
Level of Service (LOS) C B B C B B C B B C B B
Approach Delay, s/veh / LOS 15.2 B 16.9 B 18.2 B 18.2 B
Intersection Delay, s/veh / LOS 16.6 B
Multimodal Results EB WB NB SB
Pedestrian LOS Score / LOS 2.4 B 2.4 B 2.8 C 2.8 C
Bicycle LOS Score / LOS 1.1 A 1.0 A 0.9 A 1.0 A
Copyright © 2017 University of Florida, All Rights Reserved. HCS7™ Streets Version 7.2.1 Generated: 8/8/2017 2:43:31 PM
2017 Intersection Monitoring Report Tulare County Association of Governments
Page 57 September 2017

2017 Intersection Monitoring Report Tulare County Association of Governments
Page 58 September 2017

HCS7 Roundabouts ReportGeneral Information Site Information
Analyst Mark Hays Intersection Valencia @ Naranjo
Agency or Co. TCAG E/W Street Name Naranjo
Date Performed 5/9/2017 N/S Street Name Valencia
Analysis Year 2017 Analysis Time Period (hrs) 0.25
Time Analyzed AM Peak Peak Hour Factor 0.73
Project Description 2017 Intersection Monitoring Jurisdiction Woodlake
Volume Adjustments and Site Characteristics
Approach EB WB NB SB
Movement U L T R U L T R U L T R U L T R
Number of Lanes (N) 0 0 1 0 0 0 1 0 0 0 1 0 0 0 1 0
Lane Assignment LTR LTR LTR LTR
Volume (V), veh/h 0 39 83 49 0 87 165 63 0 43 151 84 0 43 92 53
Percent Heavy Vehicles, % 4 4 4 4 4 4 4 4 4 4 4 4 4 4 4 4
Flow Rate (vPCE), pc/h 0 56 118 70 0 124 235 90 0 61 215 120 0 61 131 76
Right-Turn Bypass None None None None
Conflicting Lanes 1 1 1 1
Pedestrians Crossing, p/h 3 4 2 0
Critical and Follow-Up Headway Adjustment
Approach EB WB NB SB
Lane Left Right Bypass Left Right Bypass Left Right Bypass Left Right Bypass
Critical Headway (s) 4.9763 4.9763 4.9763 4.9763
Follow-Up Headway (s) 2.6087 2.6087 2.6087 2.6087
Flow Computations, Capacity and v/c Ratios
Approach EB WB NB SB
Lane Left Right Bypass Left Right Bypass Left Right Bypass Left Right Bypass
Entry Flow (ve), pc/h 244 449 396 268
Entry Volume veh/h 235 432 381 258
Circulating Flow (vc), pc/h 316 332 235 420
Exiting Flow (vex), pc/h 299 372 361 325
Capacity (cpce), pc/h 1000 984 1086 899
Capacity (c), veh/h 961 945 1044 865
v/c Ratio (x) 0.24 0.46 0.36 0.30
Delay and Level of Service
Approach EB WB NB SB
Lane Left Right Bypass Left Right Bypass Left Right Bypass Left Right Bypass
Lane Control Delay (d), s/veh 6.2 9.3 7.2 7.4
Lane LOS A A A A
95% Queue, veh 1.0 2.4 1.7 1.3
Approach Delay, s/veh 6.2 9.3 7.2 7.4
Approach LOS A A A A
Intersection Delay, s/veh | LOS 7.7 A
Copyright © 2017 University of Florida. All Rights Reserved. HCS7™ Roundabouts Version 7.2.1 8/8/2017 2:58:17 PMValencia @ Naranjo.xro
2017 Intersection Monitoring Report Tulare County Association of Governments
Page 59 September 2017

HCS7 Two-Way Stop-Control Report
General Information Site InformationAnalyst Mark Hays Intersection Wutchumna @ Valencia
Agency/Co. TCAG Jurisdiction Woodlake
Date Performed 5/9/2017 East/West Street Wutchumna
Analysis Year 2017 North/South Street Valencia
Time Analyzed AM Peak Peak Hour Factor 0.68
Intersection Orientation North-South Analysis Time Period (hrs) 0.25
Project Description 2017 Intersection Monitoring
Lanes
Major Street: North-South
Vehicle Volumes and AdjustmentsApproach Eastbound Westbound Northbound Southbound
Movement U L T R U L T R U L T R U L T R
Priority 10 11 12 7 8 9 1U 1 2 3 4U 4 5 6
Number of Lanes 0 1 0 0 1 0 0 0 1 0 0 0 1 0
Configuration LTR LTR LTR LTR
Volume, V (veh/h) 3 3 17 24 8 38 8 134 15 25 194 1
Percent Heavy Vehicles (%) 4 4 4 4 4 4 4 4
Proportion Time Blocked
Percent Grade (%) 0 0
Right Turn Channelized No No No No
Median Type/Storage Undivided
Critical and Follow-up HeadwaysBase Critical Headway (sec)
Critical Headway (sec)
Base Follow-Up Headway (sec)
Follow-Up Headway (sec)
Delay, Queue Length, and Level of ServiceFlow Rate, v (veh/h) 33 103 12 37
Capacity, c (veh/h) 576 524 1263 1337
v/c Ratio 0.06 0.20 0.01 0.03
95% Queue Length, Q₉₅ (veh) 0.2 0.7 0.0 0.1
Control Delay (s/veh) 11.6 13.5 7.9 7.8
Level of Service, LOS B B A A
Approach Delay (s/veh) 11.6 13.5 0.5 1.1
Approach LOS B B
Copyright © 2017 University of Florida. All Rights Reserved. HCS7™ TWSC Version 7.2.1 Generated: 8/8/2017 2:57:13 PMWutchumna @ Valencia.xtw
2017 Intersection Monitoring Report Tulare County Association of Governments
Page 60 September 2017

HCS7 Two-Way Stop-Control Report
General Information Site InformationAnalyst Mark Hays Intersection Castlerock @ Naranjo
Agency/Co. TCAG Jurisdiction Woodlake
Date Performed 5/9/2017 East/West Street Naranjo
Analysis Year 2017 North/South Street Castlerock
Time Analyzed AM Peak Peak Hour Factor 0.64
Intersection Orientation East-West Analysis Time Period (hrs) 0.25
Project Description 2017 Intersection Monitoring
Lanes
Major Street: East-West
Vehicle Volumes and AdjustmentsApproach Eastbound Westbound Northbound Southbound
Movement U L T R U L T R U L T R U L T R
Priority 1U 1 2 3 4U 4 5 6 7 8 9 10 11 12
Number of Lanes 0 0 1 0 0 0 1 0 0 0 0 0 1 0
Configuration LT TR LR
Volume, V (veh/h) 71 79 104 16 8 72
Percent Heavy Vehicles (%) 7 7 7
Proportion Time Blocked
Percent Grade (%) 0
Right Turn Channelized No No No No
Median Type/Storage Undivided
Critical and Follow-up HeadwaysBase Critical Headway (sec)
Critical Headway (sec)
Base Follow-Up Headway (sec)
Follow-Up Headway (sec)
Delay, Queue Length, and Level of ServiceFlow Rate, v (veh/h) 111 124
Capacity, c (veh/h) 1360 793
v/c Ratio 0.08 0.16
95% Queue Length, Q₉₅ (veh) 0.3 0.6
Control Delay (s/veh) 7.9 10.4
Level of Service, LOS A B
Approach Delay (s/veh) 4.1 10.4
Approach LOS B
Copyright © 2017 University of Florida. All Rights Reserved. HCS7™ TWSC Version 7.2.1 Generated: 8/8/2017 2:56:18 PMCastlerock @ Naranjo.xtw
2017 Intersection Monitoring Report Tulare County Association of Governments
Page 61 September 2017

HCS+: Unsignalized Intersections Release 5.6 Phone: Fax: E-Mail: ___________________ALL-WAY STOP CONTROL(AWSC) ANALYSIS________________________ Analyst: Mark Hays Agency/Co.: TCAG Date Performed: 5/9/2017 Analysis Time Period: AM Peak Intersection: Ave 256 @ Rd 204 Jurisdiction: Tulare County Units: U. S. Customary Analysis Year: 2017 Project ID: 2017 Intersection Monitoring East/West Street: Ave 256 North/South Street: Rd 204 _________Worksheet 2 - Volume Adjustments and Site Characteristics____________ | Eastbound | Westbound | Northbound | Southbound | | L T R | L T R | L T R | L T R | |_______________|_______________|_______________|_______________| Volume |22 427 10 |30 500 9 |17 70 40 |5 68 53 | % Thrus Left Lane Eastbound Westbound Northbound Southbound L1 L2 L1 L2 L1 L2 L1 L2 Configuration LTR LTR LTR LTR PHF 0.94 0.96 0.79 0.88 Flow Rate 487 560 159 142 % Heavy Veh 5 5 5 5 No. Lanes 1 1 1 1 Opposing-Lanes 1 1 1 1 Conflicting-lanes 1 1 1 1 Geometry group 1 1 1 1 Duration, T 0.25 hrs. ___________Worksheet 3 - Saturation Headway Adjustment Worksheet______________ Eastbound Westbound Northbound Southbound L1 L2 L1 L2 L1 L2 L1 L2 Flow Rates: Total in Lane 487 560 159 142 Left-Turn 23 31 21 5 Right-Turn 10 9 50 60 Prop. Left-Turns 0.0 0.1 0.1 0.0 Prop. Right-Turns 0.0 0.0 0.3 0.4 Prop. Heavy Vehicle0.0 0.0 0.0 0.0 Geometry Group 1 1 1 1 Adjustments Exhibit 17-33: hLT-adj 0.2 0.2 0.2 0.2
2017 Intersection Monitoring Report Tulare County Association of Governments
Page 62 September 2017

hRT-adj -0.6 -0.6 -0.6 -0.6 hHV-adj 1.7 1.7 1.7 1.7 hadj, computed 0.1 0.1 -0.1 -0.2 _______________Worksheet 4 - Departure Headway and Service Time_______________ Eastbound Westbound Northbound Southbound L1 L2 L1 L2 L1 L2 L1 L2 Flow rate 487 560 159 142 hd, initial value 3.20 3.20 3.20 3.20 3.20 3.20 3.20 3.20 x, initial 0.43 0.50 0.14 0.13 hd, final value 6.29 6.16 7.51 7.51 x, final value 0.851 0.959 0.332 0.296 Move-up time, m 2.0 2.0 2.0 2.0 Service Time 4.3 4.2 5.5 5.5 _______________Worksheet 5 - Capacity and Level of Service____________________ Eastbound Westbound Northbound Southbound L1 L2 L1 L2 L1 L2 L1 L2 Flow Rate 487 560 159 142 Service Time 4.3 4.2 5.5 5.5 Utilization, x 0.851 0.959 0.332 0.296 Dep. headway, hd 6.29 6.16 7.51 7.51 Capacity 573 583 482 473 95% Queue Length 9.2 13.1 1.4 1.2 Delay 35.2 52.2 14.2 13.6 LOS E F B B Approach: Delay 35.2 52.2 14.2 13.6 LOS E F B B Intersection Delay 37.5 Intersection LOS E ______________________________________________________________________________
2017 Intersection Monitoring Report Tulare County Association of Governments
Page 63 September 2017
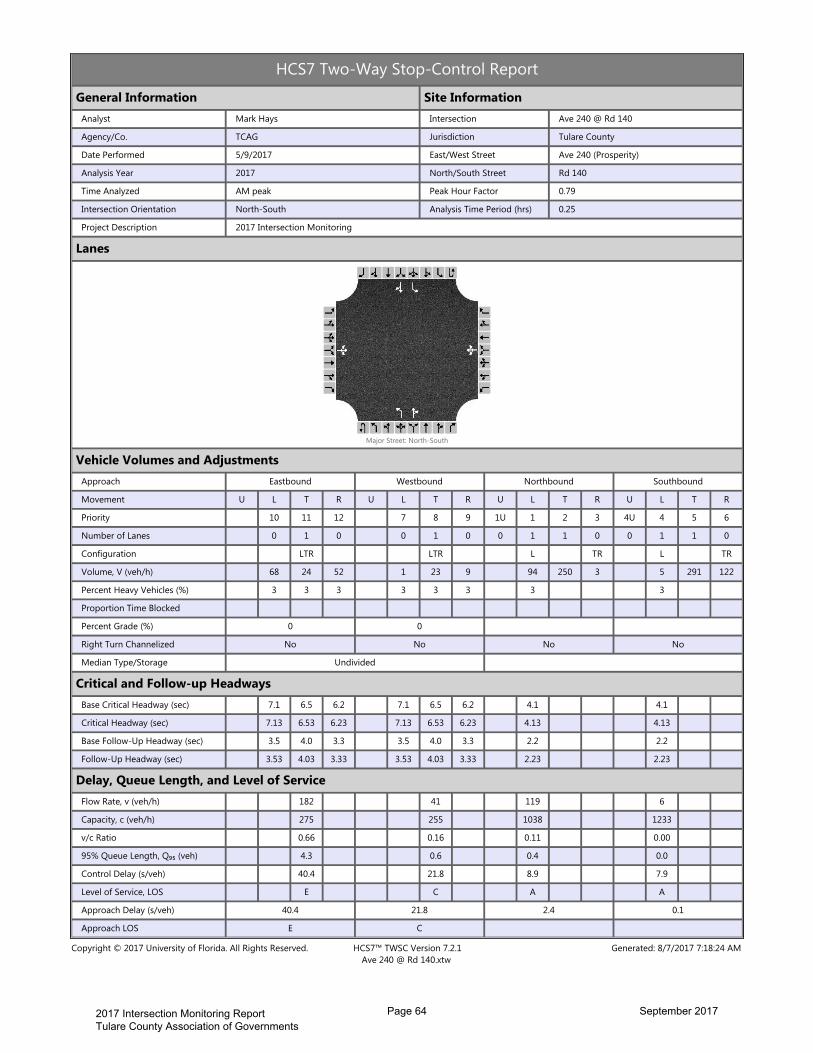
HCS7 Two-Way Stop-Control Report
General Information Site InformationAnalyst Mark Hays Intersection Ave 240 @ Rd 140
Agency/Co. TCAG Jurisdiction Tulare County
Date Performed 5/9/2017 East/West Street Ave 240 (Prosperity)
Analysis Year 2017 North/South Street Rd 140
Time Analyzed AM peak Peak Hour Factor 0.79
Intersection Orientation North-South Analysis Time Period (hrs) 0.25
Project Description 2017 Intersection Monitoring
Lanes
Major Street: North-South
Vehicle Volumes and AdjustmentsApproach Eastbound Westbound Northbound Southbound
Movement U L T R U L T R U L T R U L T R
Priority 10 11 12 7 8 9 1U 1 2 3 4U 4 5 6
Number of Lanes 0 1 0 0 1 0 0 1 1 0 0 1 1 0
Configuration LTR LTR L TR L TR
Volume, V (veh/h) 68 24 52 1 23 9 94 250 3 5 291 122
Percent Heavy Vehicles (%) 3 3 3 3 3 3 3 3
Proportion Time Blocked
Percent Grade (%) 0 0
Right Turn Channelized No No No No
Median Type/Storage Undivided
Critical and Follow-up HeadwaysBase Critical Headway (sec) 7.1 6.5 6.2 7.1 6.5 6.2 4.1 4.1
Critical Headway (sec) 7.13 6.53 6.23 7.13 6.53 6.23 4.13 4.13
Base Follow-Up Headway (sec) 3.5 4.0 3.3 3.5 4.0 3.3 2.2 2.2
Follow-Up Headway (sec) 3.53 4.03 3.33 3.53 4.03 3.33 2.23 2.23
Delay, Queue Length, and Level of ServiceFlow Rate, v (veh/h) 182 41 119 6
Capacity, c (veh/h) 275 255 1038 1233
v/c Ratio 0.66 0.16 0.11 0.00
95% Queue Length, Q₉₅ (veh) 4.3 0.6 0.4 0.0
Control Delay (s/veh) 40.4 21.8 8.9 7.9
Level of Service, LOS E C A A
Approach Delay (s/veh) 40.4 21.8 2.4 0.1
Approach LOS E C
Copyright © 2017 University of Florida. All Rights Reserved. HCS7™ TWSC Version 7.2.1 Generated: 8/7/2017 7:18:24 AMAve 240 @ Rd 140.xtw
2017 Intersection Monitoring Report Tulare County Association of Governments
Page 64 September 2017

HCS+: Unsignalized Intersections Release 5.6 Phone: Fax: E-Mail: ___________________ALL-WAY STOP CONTROL(AWSC) ANALYSIS________________________ Analyst: Mark Hays Agency/Co.: TCAG Date Performed: 5/9/2017 Analysis Time Period: AM Peak Intersection: Ave 288 @ Rd 156 Jurisdiction: Tulare County Units: U. S. Customary Analysis Year: 2017 Project ID: 2017 Intersection Monitoring East/West Street: Ave 288 North/South Street: Rd 156 _________Worksheet 2 - Volume Adjustments and Site Characteristics____________ | Eastbound | Westbound | Northbound | Southbound | | L T R | L T R | L T R | L T R | |_______________|_______________|_______________|_______________| Volume |37 97 50 |38 157 117 |47 202 17 |54 155 19 | % Thrus Left Lane Eastbound Westbound Northbound Southbound L1 L2 L1 L2 L1 L2 L1 L2 Configuration LTR LTR LTR LTR PHF 0.92 0.84 0.81 0.76 Flow Rate 199 370 327 299 % Heavy Veh 3 3 3 3 No. Lanes 1 1 1 1 Opposing-Lanes 1 1 1 1 Conflicting-lanes 1 1 1 1 Geometry group 1 1 1 1 Duration, T 0.25 hrs. ___________Worksheet 3 - Saturation Headway Adjustment Worksheet______________ Eastbound Westbound Northbound Southbound L1 L2 L1 L2 L1 L2 L1 L2 Flow Rates: Total in Lane 199 370 327 299 Left-Turn 40 45 58 71 Right-Turn 54 139 20 25 Prop. Left-Turns 0.2 0.1 0.2 0.2 Prop. Right-Turns 0.3 0.4 0.1 0.1 Prop. Heavy Vehicle0.0 0.0 0.0 0.0 Geometry Group 1 1 1 1 Adjustments Exhibit 17-33: hLT-adj 0.2 0.2 0.2 0.2
2017 Intersection Monitoring Report Tulare County Association of Governments
Page 65 September 2017
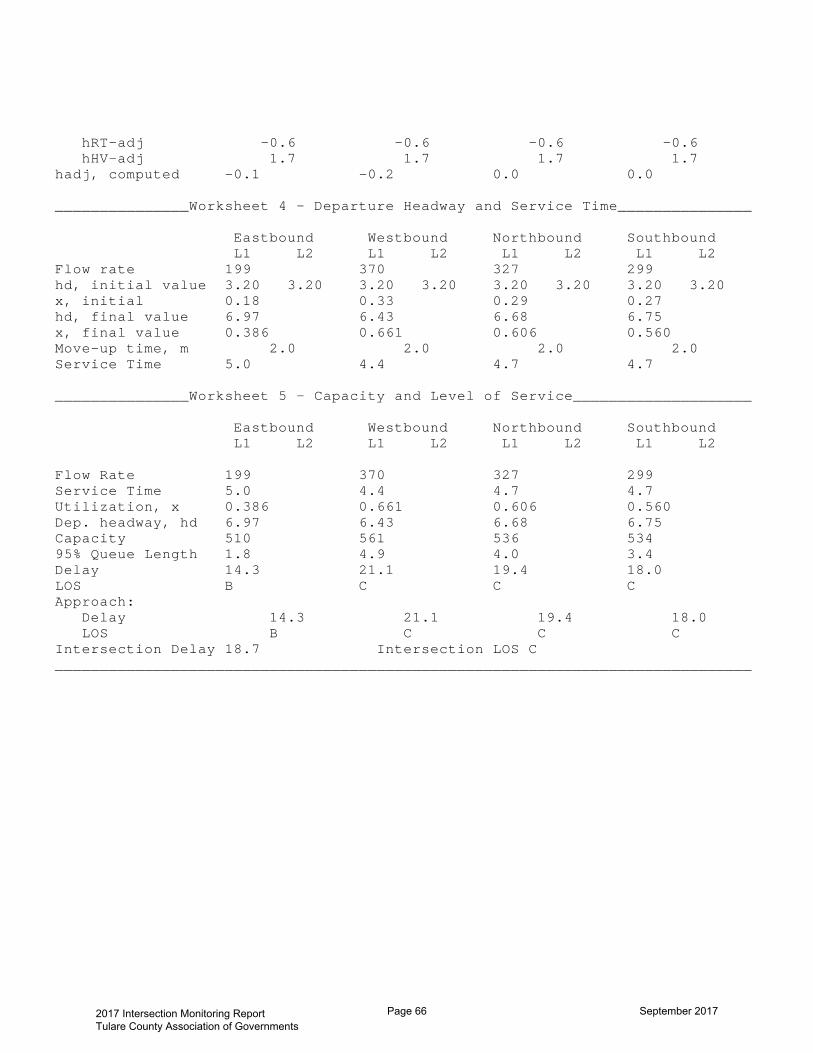
hRT-adj -0.6 -0.6 -0.6 -0.6 hHV-adj 1.7 1.7 1.7 1.7 hadj, computed -0.1 -0.2 0.0 0.0 _______________Worksheet 4 - Departure Headway and Service Time_______________ Eastbound Westbound Northbound Southbound L1 L2 L1 L2 L1 L2 L1 L2 Flow rate 199 370 327 299 hd, initial value 3.20 3.20 3.20 3.20 3.20 3.20 3.20 3.20 x, initial 0.18 0.33 0.29 0.27 hd, final value 6.97 6.43 6.68 6.75 x, final value 0.386 0.661 0.606 0.560 Move-up time, m 2.0 2.0 2.0 2.0 Service Time 5.0 4.4 4.7 4.7 _______________Worksheet 5 - Capacity and Level of Service____________________ Eastbound Westbound Northbound Southbound L1 L2 L1 L2 L1 L2 L1 L2 Flow Rate 199 370 327 299 Service Time 5.0 4.4 4.7 4.7 Utilization, x 0.386 0.661 0.606 0.560 Dep. headway, hd 6.97 6.43 6.68 6.75 Capacity 510 561 536 534 95% Queue Length 1.8 4.9 4.0 3.4 Delay 14.3 21.1 19.4 18.0 LOS B C C C Approach: Delay 14.3 21.1 19.4 18.0 LOS B C C C Intersection Delay 18.7 Intersection LOS C ______________________________________________________________________________
2017 Intersection Monitoring Report Tulare County Association of Governments
Page 66 September 2017
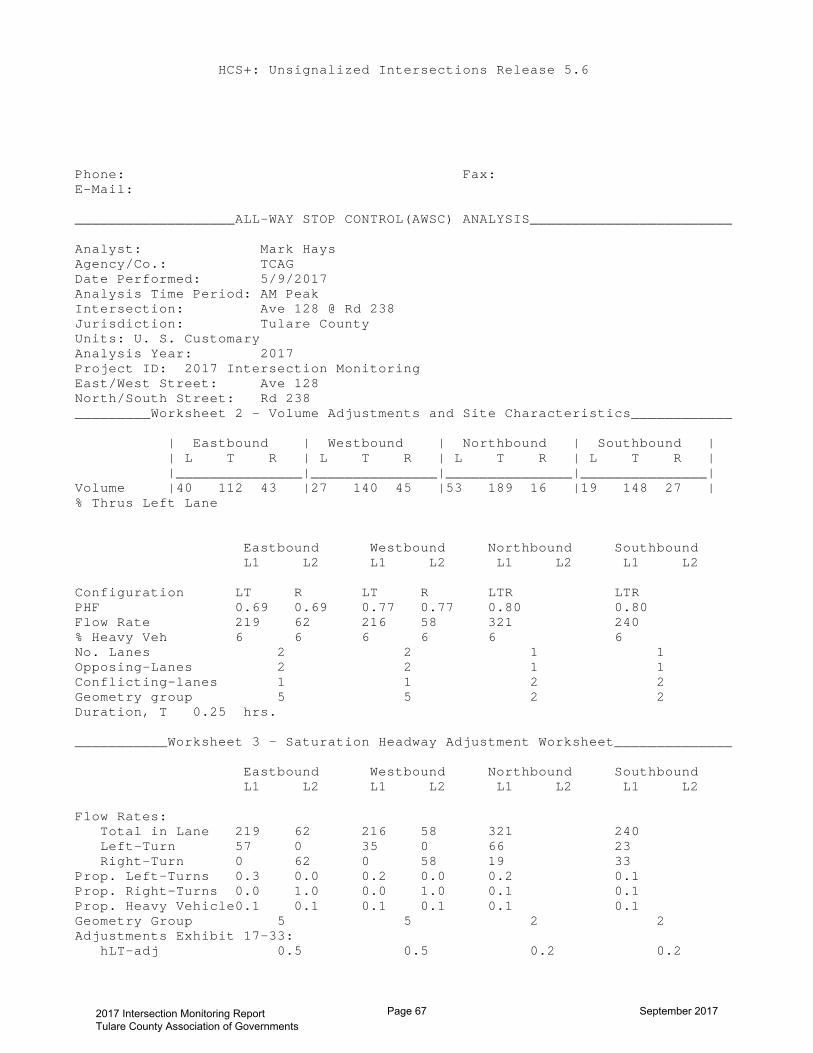
HCS+: Unsignalized Intersections Release 5.6 Phone: Fax: E-Mail: ___________________ALL-WAY STOP CONTROL(AWSC) ANALYSIS________________________ Analyst: Mark Hays Agency/Co.: TCAG Date Performed: 5/9/2017 Analysis Time Period: AM Peak Intersection: Ave 128 @ Rd 238 Jurisdiction: Tulare County Units: U. S. Customary Analysis Year: 2017 Project ID: 2017 Intersection Monitoring East/West Street: Ave 128 North/South Street: Rd 238 _________Worksheet 2 - Volume Adjustments and Site Characteristics____________ | Eastbound | Westbound | Northbound | Southbound | | L T R | L T R | L T R | L T R | |_______________|_______________|_______________|_______________| Volume |40 112 43 |27 140 45 |53 189 16 |19 148 27 | % Thrus Left Lane Eastbound Westbound Northbound Southbound L1 L2 L1 L2 L1 L2 L1 L2 Configuration LT R LT R LTR LTR PHF 0.69 0.69 0.77 0.77 0.80 0.80 Flow Rate 219 62 216 58 321 240 % Heavy Veh 6 6 6 6 6 6 No. Lanes 2 2 1 1 Opposing-Lanes 2 2 1 1 Conflicting-lanes 1 1 2 2 Geometry group 5 5 2 2 Duration, T 0.25 hrs. ___________Worksheet 3 - Saturation Headway Adjustment Worksheet______________ Eastbound Westbound Northbound Southbound L1 L2 L1 L2 L1 L2 L1 L2 Flow Rates: Total in Lane 219 62 216 58 321 240 Left-Turn 57 0 35 0 66 23 Right-Turn 0 62 0 58 19 33 Prop. Left-Turns 0.3 0.0 0.2 0.0 0.2 0.1 Prop. Right-Turns 0.0 1.0 0.0 1.0 0.1 0.1 Prop. Heavy Vehicle0.1 0.1 0.1 0.1 0.1 0.1 Geometry Group 5 5 2 2 Adjustments Exhibit 17-33: hLT-adj 0.5 0.5 0.2 0.2
2017 Intersection Monitoring Report Tulare County Association of Governments
Page 67 September 2017

hRT-adj -0.7 -0.7 -0.6 -0.6 hHV-adj 1.7 1.7 1.7 1.7 hadj, computed 0.2 -0.6 0.2 -0.6 0.1 0.0 _______________Worksheet 4 - Departure Headway and Service Time_______________ Eastbound Westbound Northbound Southbound L1 L2 L1 L2 L1 L2 L1 L2 Flow rate 219 62 216 58 321 240 hd, initial value 3.20 3.20 3.20 3.20 3.20 3.20 3.20 3.20 x, initial 0.19 0.06 0.19 0.05 0.29 0.21 hd, final value 7.18 6.33 7.14 6.34 6.30 6.43 x, final value 0.437 0.109 0.429 0.102 0.562 0.428 Move-up time, m 2.3 2.3 2.0 2.0 Service Time 4.9 4.0 4.8 4.0 4.3 4.4 _______________Worksheet 5 - Capacity and Level of Service____________________ Eastbound Westbound Northbound Southbound L1 L2 L1 L2 L1 L2 L1 L2 Flow Rate 219 62 216 58 321 240 Service Time 4.9 4.0 4.8 4.0 4.3 4.4 Utilization, x 0.437 0.109 0.429 0.102 0.562 0.428 Dep. headway, hd 7.18 6.33 7.14 6.34 6.30 6.43 Capacity 498 564 502 580 573 558 95% Queue Length 2.2 0.4 2.1 0.3 3.5 2.1 Delay 15.3 9.8 15.1 9.8 17.1 14.2 LOS C A C A C B Approach: Delay 14.1 14.0 17.1 14.2 LOS B B C B Intersection Delay 14.9 Intersection LOS B ______________________________________________________________________________
2017 Intersection Monitoring Report Tulare County Association of Governments
Page 68 September 2017

HCS7 Two-Way Stop-Control Report
General Information Site InformationAnalyst Mark Hays Intersection Ave 144 @ Rd 96
Agency/Co. TCAG Jurisdiction Tulare County
Date Performed 5/9/2017 East/West Street Ave 144
Analysis Year 2017 North/South Street Rd 96
Time Analyzed AM Peak Peak Hour Factor 0.80
Intersection Orientation East-West Analysis Time Period (hrs) 0.25
Project Description 2017 Intersection Monitoring
Lanes
Major Street: East-West
Vehicle Volumes and AdjustmentsApproach Eastbound Westbound Northbound Southbound
Movement U L T R U L T R U L T R U L T R
Priority 1U 1 2 3 4U 4 5 6 7 8 9 10 11 12
Number of Lanes 0 0 1 0 0 0 1 0 0 1 0 0 1 0
Configuration LTR LTR LTR LTR
Volume, V (veh/h) 13 55 3 7 146 8 3 16 3 10 21 29
Percent Heavy Vehicles (%) 18 18 18 18 18 18 18 18
Proportion Time Blocked
Percent Grade (%) 0 0
Right Turn Channelized No No No No
Median Type/Storage Undivided
Critical and Follow-up HeadwaysBase Critical Headway (sec) 4.1 4.1 7.1 6.5 6.2 7.1 6.5 6.2
Critical Headway (sec) 4.28 4.28 7.28 6.68 6.38 7.28 6.68 6.38
Base Follow-Up Headway (sec) 2.2 2.2 3.5 4.0 3.3 3.5 4.0 3.3
Follow-Up Headway (sec) 2.36 2.36 3.66 4.16 3.46 3.66 4.16 3.46
Delay, Queue Length, and Level of ServiceFlow Rate, v (veh/h) 16 9 28 74
Capacity, c (veh/h) 1292 1433 595 668
v/c Ratio 0.01 0.01 0.05 0.11
95% Queue Length, Q₉₅ (veh) 0.0 0.0 0.1 0.4
Control Delay (s/veh) 7.8 7.5 11.4 11.1
Level of Service, LOS A A B B
Approach Delay (s/veh) 1.5 0.4 11.4 11.1
Approach LOS B B
Copyright © 2017 University of Florida. All Rights Reserved. HCS7™ TWSC Version 7.2.1 Generated: 8/7/2017 7:14:58 AMAve 144 @ Rd 96.xtw
2017 Intersection Monitoring Report Tulare County Association of Governments
Page 69 September 2017

HCS+: Unsignalized Intersections Release 5.6 Phone: Fax: E-Mail: ___________________ALL-WAY STOP CONTROL(AWSC) ANALYSIS________________________ Analyst: Mark Hays Agency/Co.: TCAG Date Performed: 5/9/2017 Analysis Time Period: AM Peak Intersection: Ave 328 @ Rd 132 Jurisdiction: Tulare County Units: U. S. Customary Analysis Year: 2017 Project ID: 2017 Intersection Monitoring East/West Street: Ave 328 North/South Street: Rd 132 _________Worksheet 2 - Volume Adjustments and Site Characteristics____________ | Eastbound | Westbound | Northbound | Southbound | | L T R | L T R | L T R | L T R | |_______________|_______________|_______________|_______________| Volume |18 208 35 |61 201 39 |37 119 47 |48 123 25 | % Thrus Left Lane Eastbound Westbound Northbound Southbound L1 L2 L1 L2 L1 L2 L1 L2 Configuration LTR LTR LTR LTR PHF 0.70 0.78 0.88 0.83 Flow Rate 372 385 230 235 % Heavy Veh 4 4 4 4 No. Lanes 1 1 1 1 Opposing-Lanes 1 1 1 1 Conflicting-lanes 1 1 1 1 Geometry group 1 1 1 1 Duration, T 0.25 hrs. ___________Worksheet 3 - Saturation Headway Adjustment Worksheet______________ Eastbound Westbound Northbound Southbound L1 L2 L1 L2 L1 L2 L1 L2 Flow Rates: Total in Lane 372 385 230 235 Left-Turn 25 78 42 57 Right-Turn 50 50 53 30 Prop. Left-Turns 0.1 0.2 0.2 0.2 Prop. Right-Turns 0.1 0.1 0.2 0.1 Prop. Heavy Vehicle0.0 0.0 0.0 0.0 Geometry Group 1 1 1 1 Adjustments Exhibit 17-33: hLT-adj 0.2 0.2 0.2 0.2
2017 Intersection Monitoring Report Tulare County Association of Governments
Page 70 September 2017

hRT-adj -0.6 -0.6 -0.6 -0.6 hHV-adj 1.7 1.7 1.7 1.7 hadj, computed 0.0 0.0 -0.0 0.0 _______________Worksheet 4 - Departure Headway and Service Time_______________ Eastbound Westbound Northbound Southbound L1 L2 L1 L2 L1 L2 L1 L2 Flow rate 372 385 230 235 hd, initial value 3.20 3.20 3.20 3.20 3.20 3.20 3.20 3.20 x, initial 0.33 0.34 0.20 0.21 hd, final value 6.56 6.56 7.12 7.17 x, final value 0.678 0.702 0.455 0.468 Move-up time, m 2.0 2.0 2.0 2.0 Service Time 4.6 4.6 5.1 5.2 _______________Worksheet 5 - Capacity and Level of Service____________________ Eastbound Westbound Northbound Southbound L1 L2 L1 L2 L1 L2 L1 L2 Flow Rate 372 385 230 235 Service Time 4.6 4.6 5.1 5.2 Utilization, x 0.678 0.702 0.455 0.468 Dep. headway, hd 6.56 6.56 7.12 7.17 Capacity 547 550 511 500 95% Queue Length 5.1 5.6 2.3 2.5 Delay 22.3 23.5 15.9 16.3 LOS C C C C Approach: Delay 22.3 23.5 15.9 16.3 LOS C C C C Intersection Delay 20.3 Intersection LOS C ______________________________________________________________________________
2017 Intersection Monitoring Report Tulare County Association of Governments
Page 71 September 2017
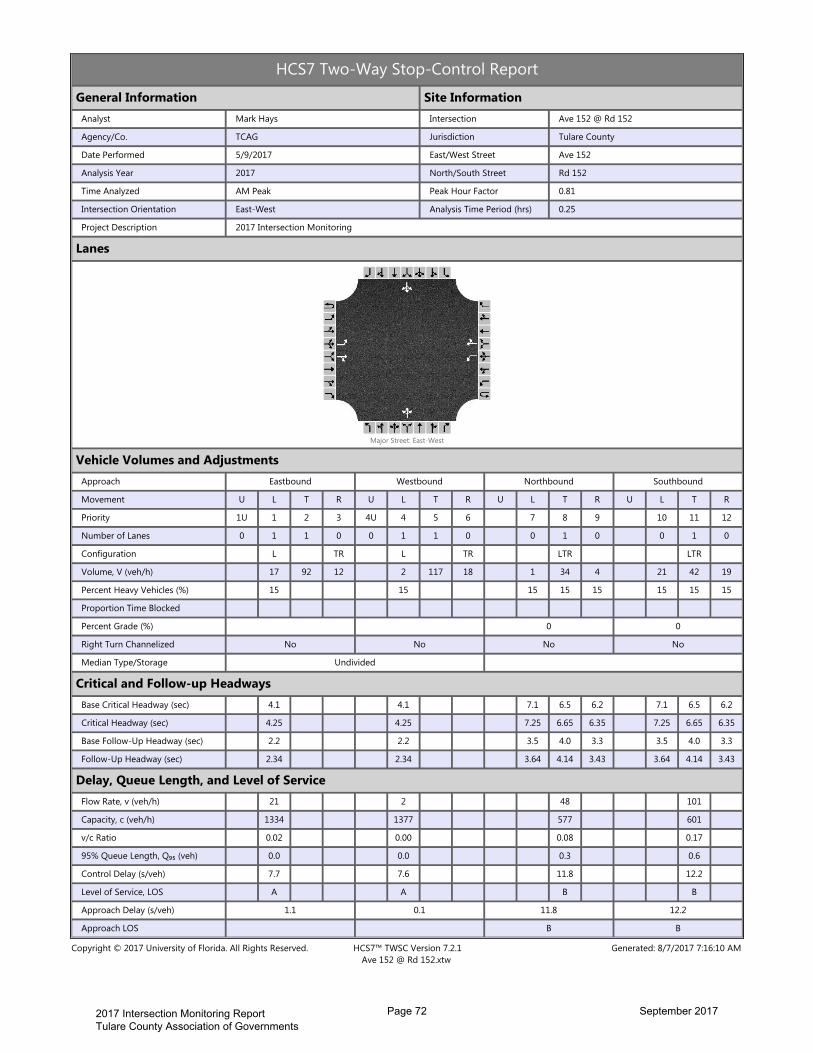
HCS7 Two-Way Stop-Control Report
General Information Site InformationAnalyst Mark Hays Intersection Ave 152 @ Rd 152
Agency/Co. TCAG Jurisdiction Tulare County
Date Performed 5/9/2017 East/West Street Ave 152
Analysis Year 2017 North/South Street Rd 152
Time Analyzed AM Peak Peak Hour Factor 0.81
Intersection Orientation East-West Analysis Time Period (hrs) 0.25
Project Description 2017 Intersection Monitoring
Lanes
Major Street: East-West
Vehicle Volumes and AdjustmentsApproach Eastbound Westbound Northbound Southbound
Movement U L T R U L T R U L T R U L T R
Priority 1U 1 2 3 4U 4 5 6 7 8 9 10 11 12
Number of Lanes 0 1 1 0 0 1 1 0 0 1 0 0 1 0
Configuration L TR L TR LTR LTR
Volume, V (veh/h) 17 92 12 2 117 18 1 34 4 21 42 19
Percent Heavy Vehicles (%) 15 15 15 15 15 15 15 15
Proportion Time Blocked
Percent Grade (%) 0 0
Right Turn Channelized No No No No
Median Type/Storage Undivided
Critical and Follow-up HeadwaysBase Critical Headway (sec) 4.1 4.1 7.1 6.5 6.2 7.1 6.5 6.2
Critical Headway (sec) 4.25 4.25 7.25 6.65 6.35 7.25 6.65 6.35
Base Follow-Up Headway (sec) 2.2 2.2 3.5 4.0 3.3 3.5 4.0 3.3
Follow-Up Headway (sec) 2.34 2.34 3.64 4.14 3.43 3.64 4.14 3.43
Delay, Queue Length, and Level of ServiceFlow Rate, v (veh/h) 21 2 48 101
Capacity, c (veh/h) 1334 1377 577 601
v/c Ratio 0.02 0.00 0.08 0.17
95% Queue Length, Q₉₅ (veh) 0.0 0.0 0.3 0.6
Control Delay (s/veh) 7.7 7.6 11.8 12.2
Level of Service, LOS A A B B
Approach Delay (s/veh) 1.1 0.1 11.8 12.2
Approach LOS B B
Copyright © 2017 University of Florida. All Rights Reserved. HCS7™ TWSC Version 7.2.1 Generated: 8/7/2017 7:16:10 AMAve 152 @ Rd 152.xtw
2017 Intersection Monitoring Report Tulare County Association of Governments
Page 72 September 2017

HCS7 Two-Way Stop-Control Report
General Information Site InformationAnalyst Mark Hays Intersection Ave 272 @ Rd 100
Agency/Co. TCAG Jurisdiction Tulare County
Date Performed 5/9/2017 East/West Street Ave 272
Analysis Year 2017 North/South Street Rd 100
Time Analyzed AM Peak Peak Hour Factor 0.81
Intersection Orientation North-South Analysis Time Period (hrs) 0.25
Project Description 2017 Intersection Monitoring
Lanes
Major Street: North-South
Vehicle Volumes and AdjustmentsApproach Eastbound Westbound Northbound Southbound
Movement U L T R U L T R U L T R U L T R
Priority 10 11 12 7 8 9 1U 1 2 3 4U 4 5 6
Number of Lanes 0 1 0 0 1 0 0 0 1 0 0 0 1 0
Configuration LTR LTR LTR LTR
Volume, V (veh/h) 0 67 15 5 24 18 9 280 7 25 242 0
Percent Heavy Vehicles (%) 2 2 2 2 2 2 2 2
Proportion Time Blocked
Percent Grade (%) 0 0
Right Turn Channelized No No No No
Median Type/Storage Undivided
Critical and Follow-up HeadwaysBase Critical Headway (sec) 7.1 6.5 6.2 7.1 6.5 6.2 4.1 4.1
Critical Headway (sec) 7.12 6.52 6.22 7.12 6.52 6.22 4.12 4.12
Base Follow-Up Headway (sec) 3.5 4.0 3.3 3.5 4.0 3.3 2.2 2.2
Follow-Up Headway (sec) 3.52 4.02 3.32 3.52 4.02 3.32 2.22 2.22
Delay, Queue Length, and Level of ServiceFlow Rate, v (veh/h) 102 58 11 31
Capacity, c (veh/h) 369 394 1261 1203
v/c Ratio 0.28 0.15 0.01 0.03
95% Queue Length, Q₉₅ (veh) 1.1 0.5 0.0 0.1
Control Delay (s/veh) 18.4 15.7 7.9 8.1
Level of Service, LOS C C A A
Approach Delay (s/veh) 18.4 15.7 0.3 1.0
Approach LOS C C
Copyright © 2017 University of Florida. All Rights Reserved. HCS7™ TWSC Version 7.2.1 Generated: 8/7/2017 7:19:09 AMAve 272 @ Rd 100.xtw
2017 Intersection Monitoring Report Tulare County Association of Governments
Page 73 September 2017
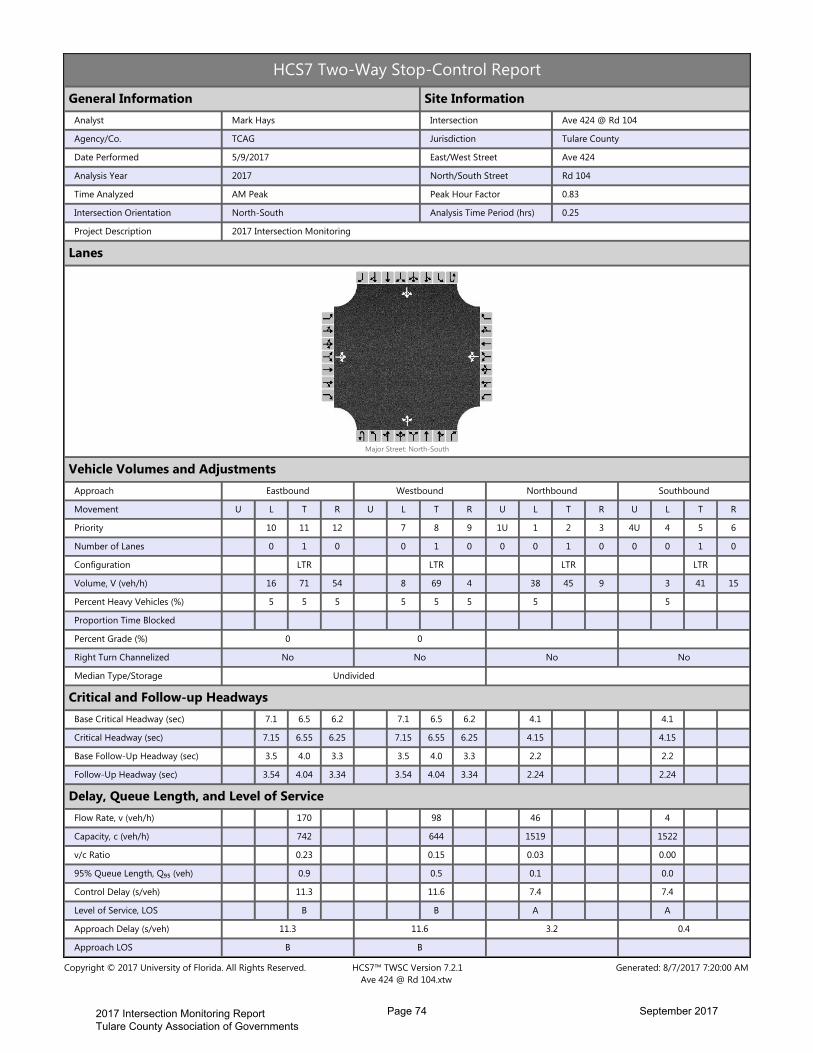
HCS7 Two-Way Stop-Control Report
General Information Site InformationAnalyst Mark Hays Intersection Ave 424 @ Rd 104
Agency/Co. TCAG Jurisdiction Tulare County
Date Performed 5/9/2017 East/West Street Ave 424
Analysis Year 2017 North/South Street Rd 104
Time Analyzed AM Peak Peak Hour Factor 0.83
Intersection Orientation North-South Analysis Time Period (hrs) 0.25
Project Description 2017 Intersection Monitoring
Lanes
Major Street: North-South
Vehicle Volumes and AdjustmentsApproach Eastbound Westbound Northbound Southbound
Movement U L T R U L T R U L T R U L T R
Priority 10 11 12 7 8 9 1U 1 2 3 4U 4 5 6
Number of Lanes 0 1 0 0 1 0 0 0 1 0 0 0 1 0
Configuration LTR LTR LTR LTR
Volume, V (veh/h) 16 71 54 8 69 4 38 45 9 3 41 15
Percent Heavy Vehicles (%) 5 5 5 5 5 5 5 5
Proportion Time Blocked
Percent Grade (%) 0 0
Right Turn Channelized No No No No
Median Type/Storage Undivided
Critical and Follow-up HeadwaysBase Critical Headway (sec) 7.1 6.5 6.2 7.1 6.5 6.2 4.1 4.1
Critical Headway (sec) 7.15 6.55 6.25 7.15 6.55 6.25 4.15 4.15
Base Follow-Up Headway (sec) 3.5 4.0 3.3 3.5 4.0 3.3 2.2 2.2
Follow-Up Headway (sec) 3.54 4.04 3.34 3.54 4.04 3.34 2.24 2.24
Delay, Queue Length, and Level of ServiceFlow Rate, v (veh/h) 170 98 46 4
Capacity, c (veh/h) 742 644 1519 1522
v/c Ratio 0.23 0.15 0.03 0.00
95% Queue Length, Q₉₅ (veh) 0.9 0.5 0.1 0.0
Control Delay (s/veh) 11.3 11.6 7.4 7.4
Level of Service, LOS B B A A
Approach Delay (s/veh) 11.3 11.6 3.2 0.4
Approach LOS B B
Copyright © 2017 University of Florida. All Rights Reserved. HCS7™ TWSC Version 7.2.1 Generated: 8/7/2017 7:20:00 AMAve 424 @ Rd 104.xtw
2017 Intersection Monitoring Report Tulare County Association of Governments
Page 74 September 2017

HCS7 Two-Way Stop-Control Report
General Information Site InformationAnalyst Mark Hays Intersection Ave 200 @ Spacer
Agency/Co. TCAG Jurisdiction Tulare County
Date Performed 5/9/2017 East/West Street Ave 200
Analysis Year 2017 North/South Street Spacer
Time Analyzed AM Peak Peak Hour Factor 0.89
Intersection Orientation North-South Analysis Time Period (hrs) 0.25
Project Description 2017 Intersection Monitoring
Lanes
Major Street: North-South
Vehicle Volumes and AdjustmentsApproach Eastbound Westbound Northbound Southbound
Movement U L T R U L T R U L T R U L T R
Priority 10 11 12 7 8 9 1U 1 2 3 4U 4 5 6
Number of Lanes 0 1 0 0 1 0 0 0 1 0 0 0 1 0
Configuration LTR LTR LTR LTR
Volume, V (veh/h) 1 25 12 2 19 6 23 129 2 7 93 0
Percent Heavy Vehicles (%) 8 8 8 8 8 8 8 8
Proportion Time Blocked
Percent Grade (%) 0 0
Right Turn Channelized No No No No
Median Type/Storage Undivided
Critical and Follow-up HeadwaysBase Critical Headway (sec) 7.1 6.5 6.2 7.1 6.5 6.2 4.1 4.1
Critical Headway (sec) 7.18 6.58 6.28 7.18 6.58 6.28 4.18 4.18
Base Follow-Up Headway (sec) 3.5 4.0 3.3 3.5 4.0 3.3 2.2 2.2
Follow-Up Headway (sec) 3.57 4.07 3.37 3.57 4.07 3.37 2.27 2.27
Delay, Queue Length, and Level of ServiceFlow Rate, v (veh/h) 42 30 26 8
Capacity, c (veh/h) 651 624 1452 1400
v/c Ratio 0.06 0.05 0.02 0.01
95% Queue Length, Q₉₅ (veh) 0.2 0.2 0.1 0.0
Control Delay (s/veh) 10.9 11.1 7.5 7.6
Level of Service, LOS B B A A
Approach Delay (s/veh) 10.9 11.1 1.3 0.6
Approach LOS B B
Copyright © 2017 University of Florida. All Rights Reserved. HCS7™ TWSC Version 7.2.1 Generated: 8/7/2017 7:17:16 AMAve 200 @ Spacer.xtw
2017 Intersection Monitoring Report Tulare County Association of Governments
Page 75 September 2017


