98
Appendix C Hydraulic Assessment Report
Appendix C
Hydraulic Assessment Report

Peka Peka to Otaki Expressway
Scheme Assessment Report
Design Flood Levels for Waterway Crossings

NZ Transport AgencyPeka Peka to Otaki Expressway
Scheme Assessment ReportDesign Flood Levels for Waterway Crossings
Status Issue 1 August 2011Project Number 440PN, 5-C1814.00 20110919 PP2O Technical Report Design Flood Levels_v3_final draft
This report has been prepared for the benefit of the NZ Transport Agency (NZTA). No liability is accepted by
this company or any employee or sub-consultant of this company with respect to its use by any other person.
This disclaimer shall apply notwithstanding that the report may be made available to other persons for an
application for permission or approval or to fulfil a legal requirement.
Quality Assurance Statement
Project Manager: Andrew Quinn (NZTA)
Prepared by: M G Webby, H W Smith and J A McConchie
Reviewed by: G McKay ………………………………
Approved for issue by: G McKay ………………………………
Revision Schedule
Rev. No
Date Description Prepared by Reviewed by Approved by

NZ Transport AgencyPeka Peka to Otaki Expressway
Scheme Assessment ReportDesign Flood Levels for Waterway Crossings
Status Issue 1 Page 1 June 2011Project Number 440PN, 5-C1814.00 20110919 PP2O Technical Report Design Flood
Levels_v3_final draft
NZ Transport Agency Contents
1. Introduction .............................................................................................................................. 1
1.1 Context ......................................................................................................................... 1
1.2 Scope of Report ......................................................................................................... 1
1.3 Level Datums .............................................................................................................. 2
2. Design Philosophy for Setting Level of Service for Expressway ............................... 3
2.1 Introduction ................................................................................................................ 3
2.2 Literature Review of Relevant Literature ............................................................ 3 2.2.1 NZTA Bridge Manual .................................................................................. 3 2.2.2 Roads of National Significance (RoNS) Design Standard ................ 3 2.2.3 Principal’s Requirements for Christchurch Southern Motorway
Design / Build Project ................................................................................ 3 2.2.4 AUSTROADS Waterway Design Manual ............................................... 3 2.2.5 Guide to Bridge Hydraulics ...................................................................... 4 2.2.6 O’Rourke (2007) .......................................................................................... 4 2.2.7 Opus PIN Inquiry ......................................................................................... 5
2.3 Synthesis of Key Ideas from Literature Review and PIN Inquiry Feedback5
2.4 Treatment Philosophy for Individual Floodplain Crossings along Route 6 2.4.1 General ........................................................................................................... 6 2.4.2 Waitohu Stream ........................................................................................... 6 2.4.3 Mangapouri Stream .................................................................................... 6 2.4.4 Otaki River ..................................................................................................... 7 2.4.5 Otaki River Floodplain ............................................................................... 7 2.4.6 Mangaone Stream ....................................................................................... 8
3. Flood Hydrology ...................................................................................................................... 9
3.1 Introduction ................................................................................................................ 9
3.2 Otaki River ................................................................................................................... 9

NZ Transport AgencyPeka Peka to Otaki Expressway
Scheme Assessment ReportDesign Flood Levels for Waterway Crossings
Status Issue 1 Page 2 June 2011Project Number 440PN, 5-C1814.00 20110919 PP2O Technical Report Design Flood
Levels_v3_final draft
3.3 Waitohu Stream ....................................................................................................... 10
3.4 Mangaone Stream ................................................................................................... 13 3.4.1 Introduction ................................................................................................ 13 3.4.2 Previous Flood Frequency Estimates for Mangaone Stream at
Existing State Highway 1 Crossing ...................................................... 14 3.4.3 Flood Frequency Estimates for Mangaone Stream at Ratanui
Gauging Station ......................................................................................... 16 3.4.4 Flood Frequency Estimates for Mangaone Stream at State
Highway 1 Culvert .................................................................................... 17
3.5 Mangapouri Stream ................................................................................................ 19
4. Waitohu Stream Design Flood Levels .............................................................................. 21
4.1 Introduction .............................................................................................................. 21
4.2 Design Flood Magnitude ....................................................................................... 21
4.3 Outline of Existing Situation ................................................................................ 21
4.4 Outline of Proposed Situation ............................................................................. 22
4.5 Predicted Flood Levels for Existing and Proposed Situations ................... 25
4.6 Effects of Proposed Expressway on Adjacent Properties ........................... 28
4.7 Sensitivity of Flood Levels at Expressway Crossing to Flood Magnitude28
4.8 Effects of Bridge Piers on Flood Levels in Waitohu Stream ........................ 30
4.9 Recommended Design Levels ............................................................................. 31
5. Mangapouri Stream Design Flood Levels ...................................................................... 33
5.1 Introduction .............................................................................................................. 33
5.2 Outline of Existing Situation ................................................................................ 33
5.3 Predicted Flood Levels for Existing Situation ................................................. 33
5.4 Basis of Design for Proposed Expressway Embankment ............................ 36
5.5 Outline of Proposed Situation with Expressway ............................................ 36
5.6 Expressway and Railway Line Culvert Dimensions ....................................... 37
5.7 Predicted Flood Levels for Proposed Situation .............................................. 38
5.8 Storm Runoff Diversions from Neighbouring Catchments ........................ 40
5.9 Recommended Design Flood Levels ................................................................. 41
6. Otaki River and Floodplain Design Flood Levels ......................................................... 42
6.1 Introduction .............................................................................................................. 42
6.2 Outline of Existing Situation ................................................................................ 42
6.3 Design Flood Considerations .............................................................................. 42

NZ Transport AgencyPeka Peka to Otaki Expressway
Scheme Assessment ReportDesign Flood Levels for Waterway Crossings
Status Issue 1 Page 3 June 2011Project Number 440PN, 5-C1814.00 20110919 PP2O Technical Report Design Flood
Levels_v3_final draft
6.4 Outline of Proposed Situation ............................................................................. 45
6.5 MIKE11 / MIKE21 Model of Otaki River and Floodplain .............................. 46
6.6 Predicted Flood Levels for Existing and Proposed Situations ................... 47
6.7 Commentary on Extent of Floodplain Inundation for 0.2% AEP Flood ... 56
6.8 Effects of Bridge Piers on Flood Levels in Main River .................................. 61
6.9 Mitigation Measures for Super-Design Flood Occurrence .......................... 56
6.10 Recommended Design Levels ............................................................................. 61
7. Mangaone Stream Design Flood Levels .......................................................................... 64
7.1 Introduction .............................................................................................................. 64
7.2 Outline of Existing Situation ................................................................................ 64
7.3 Design Flood Considerations .............................................................................. 67
7.4 Outline of Proposed Situation ............................................................................. 68
7.5 Flood Level Estimation Approach ....................................................................... 70
7.6 Predicted Flood Levels for Existing Situation ................................................. 70
7.7 Existing and Proposed Culvert Dimensions .................................................... 72
7.8 Predicted Flood Levels for Proposed Situation .............................................. 73
7.9 School Road Drain and Flood Containment Bund ......................................... 77
7.10 Sensitivity of Flood Levels at Expressway Crossing to Flood Magnitude78
7.11 Recommended Design Flood Levels ................................................................. 80
8. Conclusions ............................................................................................................................. 82
9. References ............................................................................................................................... 85
ANNEX A ............................................................................................................................................ 86

NZ Transport AgencyPeka Peka to Otaki Expressway
Scheme Assessment ReportDesign Flood Levels for Waterway Crossings
Status Issue 1 Page 1 June 2011Project Number 440PN, 5-C1814.00 20110919 PP2O Technical Report Design Flood
Levels_v3_final draft
1. Introduction
1.1 Context
The NZ Transport Agency (NZTA) proposed four-lane expressway between Peka Peka and North Otaki forms
part of the Wellington Northern Corridor Roads of National Significance (RoNS) Project. The expressway route
essentially runs parallel to the existing State Highway 1 along a narrow coastal plain. This coastal plain is
made up of a series of floodplains for one major river (the Otaki River), one medium sized river (the Waitohu
Stream), and several smaller streams (including the Mangaone Stream at Te Horo and the Mangapouri Stream
through Otaki Township).
The existing State Highway 1 has a history of being inundated by floodwaters every few years at a number of
locations including the bridge over the Waitohu Stream immediately to the north of Otaki Township and the
culvert system crossing the Mangaone Stream at Te Horo. The natural overflow path for the Otaki River, if a
super-design flood was to overtop the current Chrystall’s Bend stopbank providing protection to Otaki
Township, would be directly across the route of the proposed expressway. The present combination of the
North Island Main Trunk Railway (NIMT) culvert and the County Road culvert on the Mangapouri Stream
upstream of the SH1 crossing (along the northern edge of the Otaki River floodplain) is designed to throttle
flood flows for events in excess of a 5% AEP flood in order to protect downstream properties through Otaki
Township.
It is proposed to construct the expressway as a raised embankment across these floodplain areas and elevate it
sufficiently so that it can act as a lifeline and to remain open in extreme flood conditions. However the
concept of a "lifeline" formed by a raised embankment which cuts across and blocks a natural floodplain runs
completely counter to the philosophy of allowing a super-design flood to break out of its primary watercourse
and follow a natural overflow path to the sea. Blockage of the floodplain in such an event could also
exacerbate the flood risk to properties lying upstream and outside any natural overflow path.
The critical storm events for the smaller and medium sized streams in this context are likely to be
thunderstorm-type rainfall events rather than the larger frontal weather systems impacting the much larger
catchment of the Otaki River. However the raised expressway embankment will still block the floodplains of
these streams during floods induced by such events.
1.2 Scope of Report
This report describes the investigations undertaken to establish design flood levels for each of the waterway
and floodplain crossings considered. The fundamental principle underlying these investigations has been,
where possible, to achieve hydraulic neutrality with the proposed expressway development (i.e. ensure peak
flood levels for the same flood event are no worse than in the existing situation). In most cases, this has
required the incorporation of suitable measures to mitigate the effects of floodplain blockage from a raised
road embankment. Where an opportunity exists to enhance the existing level of flood protection to existing
residential properties by means of the expressway development, this has been identified.
NZ Transport AgencyPeka Peka to Otaki Expressway
Scheme Assessment ReportDesign Flood Levels for Waterway Crossings
Status Issue 1 Page 2 June 2011Project Number 440PN, 5-C1814.00 20110919 PP2O Technical Report Design Flood
Levels_v3_final draft
Initially the design philosophy for setting the level of service for each of the waterway and floodplain crossings
is outlined (this philosophy differs for each crossing because of individual characteristics). Then the derivation
of flood estimates for each of the waterways concerned is described. Finally the hydraulic behaviour of floods
at each waterway crossing is interpreted for both the existing and proposed expressway situations. This leads
to the definition of any required flood mitigation measures (e.g. dry culverts for overland flows) and design
flood levels for each crossing.
1.3 Level Datums
Since flood levels in a river or stream near the outlet to the sea are affected by sea levels, Greater Wellington
Regional Council (GWRC) consistently use the Mean Sea Level Wellington (1953) level datum for their flood
hazard investigations and flood protection works design. The investigations described in this report have
made use of a number of design tools developed by or for GWRC and other information which utilise this mean
sea level datum (i.e. computational hydraulic models of these rivers and streams and river cross-section data).
To ensure consistency with GWRC publications and information then, these investigations have used the same
level datum to establish design flood levels for the proposed expressway.
Existing ground levels from LiDAR data and construction levels for the proposed expressway on the other hand
are expressed in terms of the NZ Vertical Datum (2009). It has therefore been necessary to translate between
the two level data when specifying design flood levels and road design levels at key stream / river crossing
locations.
Throughout this report then, flood levels are generally expressed in terms of Mean Sea Level (MSL) Wellington
(1953) datum. To adjust these levels to be in terms of NZ Vertical Datum (2009), 0.44m needs to be
subtracted. Conversely to adjust levels in NZ Vertical Datum (2009) to be in terms of MSL Wellington Datum,
0.44m needs to be added.

NZ Transport AgencyPeka Peka to Otaki Expressway
Scheme Assessment ReportDesign Flood Levels for Waterway Crossings
Status Issue 1 Page 3 June 2011Project Number 440PN, 5-C1814.00 20110919 PP2O Technical Report Design Flood
Levels_v3_final draft
2. Design Philosophy for Setting Level of Service for Expressway
2.1 Introduction
This section discusses the design philosophy for setting the level of service for flood hazards for the proposed
expressway. In developing this philosophy we have carried out a limited literature review and also sent out a
Practice Interest Network (PIN) inquiry seeking feedback from others within Opus.
2.2 Literature Review of Relevant Literature
2.2.1 NZTA Bridge Manual
For the Serviceability Limit State Flood the current NZTA Bridge Manual (Transit NZ, 2003) requires either
600mm or 1200mm freeboard to the underside of a bridge structure depending on the potential for woody
debris raft formation on the piers. For the same flood condition, the Bridge Manual allows surcharging of
culverts but requires 500mm freeboard to the road surface (although where on the road surface – the
centreline or the edge of the pavement- is not specified).
However the Bridge Manual is silent on specifying any design flood standard for approach embankments.
2.2.2 Roads of National Significance (RoNS) Design Standard
Similarly the Roads of National Significance (RONS) design standard is silent on the level of service required for
RoNS projects which cross significant floodplain areas.
2.2.3 Principal’s Requirements for Christchurch Southern Motorway Design / Build Project
The Principal’s Requirements for the Christchurch Southern Motorway Design / Build Project (which crosses
significant areas of low-lying flood-prone land) specify achievement standards along the following lines:
No flow on traffic lanes in a 5% AEP / 10 minute duration storm event with a maximum shoulder depth
of 100mm and flow velocity of 2m/s
At least a 2m wide strip of a two-lane road and at least two lanes of a four-lane road to be clear of
flooding in a 1% AEP / 10 minute duration storm with no more than 100m flow depth and 2m/s flow
velocity in flooded lanes.
While these design requirements may not be appropriate in every circumstance, they do provide some guiding
principles on the serviceability of roads under extreme flood conditions.
2.2.4 AUSTROADS Waterway Design Manual
The AUSTROADS Waterway Design Manual (AUSTROADS, 1994) provides useful design principles and guidance
for floodways. A floodway is defined to be a “low level section of road, specially constructed to allow the
passage of floodwaters across it without damage”. This reflects the Australian experience where they have a

NZ Transport AgencyPeka Peka to Otaki Expressway
Scheme Assessment ReportDesign Flood Levels for Waterway Crossings
Status Issue 1 Page 4 June 2011Project Number 440PN, 5-C1814.00 20110919 PP2O Technical Report Design Flood
Levels_v3_final draft
large number of rural roads across very flat country with low traffic volumes for which it is totally impractical
to achieve a road with a flood-free status.
The Waterway Design Manual indicates that floodways in Australia are generally provided where traffic
volumes are low and in the following circumstances:
where flow across the road will be infrequent or of short duration
in conjunction with a bridge or culvert which is designed to pass a lesser flood than the total waterway
design flood
where it is impractical or uneconomic to construct a bridge or culvert.
The context of the proposed Peka Peka to North Otaki Expressway is completely different. Nevertheless the
Waterway Design Manual provides some useful design principles for floodways that will be relevant if parts of
the expressway embankment are designed to allow overtopping by shallow depths of water in a very extreme
flood event. These include:
giving careful consideration to the hydraulic design of the embankment to ensure that it will pass the
required overflow
careful detailing of the overtopping sections of the embankment to ensure their stability and resistance
to erosion by overtopping flows
design of the pavement to accommodate the potential for overtopping by flood flows
2.2.5 Guide to Bridge Hydraulics
The Transportation Association of Canada Guide to Bridge Hydraulics (TAC, 2004) provides limited guidance
on flow relief for bridges where bridge crossing are “occasionally designed so that a portion of the crossing
design flood can pass over a lower section of roadway at a safe distance from the bridge”. This guidance is
offered in respect of low traffic volume roads, where the flood risk to road users is low and alternative flood-
free routes are available. This mirrors the advice in AUSTROADS (1994) for floodways.
As an alternative to a lowered section of roadway, the Guide to Bridge Hydraulics also suggests relief flow can
be achieved by means of separate bridge and culvert openings through the road embankment across the
floodplain.
2.2.6 O’Rourke (2007)
O’Rourke (2007) discusses the concept of critical infrastructure including “lifeline systems”, the
interdependency of such systems and how they can be made more resilient to recovery after physical stress
from natural and other disasters. He describes a conceptual framework of qualities developed by a group of
engineers and social scientists for defining the resilience of physical and social systems:
robustness – the inherent strength or resistance in a system to withstand external demands without
degradation or loss of function
redundancy – system properties that allow for alternate options, choices and substitutions under stress
resourcefulness – the capacity to mobilise needed resources and services in emergencies
rapidity – the speed with which disruption can be overcome and safety, services, and financial stability
restored
In the context of the proposed Peka Peka to Otaki Expressway, these particular qualities relate to:
the physical strength of the expressway construction and its capacity to resist erosion by overtopping
flows
NZ Transport AgencyPeka Peka to Otaki Expressway
Scheme Assessment ReportDesign Flood Levels for Waterway Crossings
Status Issue 1 Page 5 June 2011Project Number 440PN, 5-C1814.00 20110919 PP2O Technical Report Design Flood
Levels_v3_final draft
the availability or otherwise of alternative routes in the event of inundation by an extreme flood event
the availability of materials and equipment for repair in the event of the occurrence of flood
overtopping induced damage
the rapidity with which the lifeline system can be restored to full service after a closure or partial
closure of the expressway by flood induced overtopping
2.2.7 Opus PIN Inquiry
Following a brief outline of the flood hazard issues affecting the Peka Peka to North Otaki RoNS Project,
responses were sought from within Opus via the Road Asset Development (RAD), Road Asset Management
(RAM) and Water Resources PINs on the following matters:
what is a suitable philosophy for determining the level of service for this category of road
development?
what is an acceptable level of service for major roads crossing a floodplain?
what is an acceptable freeboard value for major roads crossing a floodplain?
would a zero freeboard value for a 0.5% AEP or 0.2% AEP design flood be acceptable?
can closure due to flood inundation of one lane of a two lane expressway (in each direction) be
tolerated?
Feedback was received from a wide range of company staff both within New Zealand and internationally. The
feedback responses are given in full in Annex A. The following section provides a synthesis of key ideas
included in this feedback.
2.3 Synthesis of Key Ideas from Literature Review and PIN Inquiry Feedback
A number of key principles and themes emerge from the literature review and the feedback from the PIN
inquiry. These are summarised below:
the criticality of the Peka Peka to North Otaki route and its strategic importance as part of the primary
road link to the capital city
the lack of redundancy in the route with no alternative serviceable route along this part of the Kapiti
Coast and the high likelihood of simultaneous flooding along the Coast
allowing for some overtopping of the expressway in an extreme flood event but with the depth of
overtopping insufficient to prevent access by emergency services
ensuring a robust design to prevent erosion damage by overtopping flows
the retention of some level of service immediately post-flood
simplicity of design to facilitate repair in the event of damage occurrence caused by overtopping flows
the provision of floodplain waterways through an embankment to complement main bridge crossings
of watercourses
the precedent example of overflow sections on the existing state highway network including the
Rangiriri Spillway on State Highway 1 between Auckland and Hamilton and the Ngaruroro River
overflow path on the Napier / Hastings Expressway
minimising the upstream and downstream head difference across a raised embankment to minimise
the risk of erosion damage by overtopping flows
incorporating dedicated overflow paths across a floodplain within a road design
possibly designing the lateral profile along an overflow section of road with the crown on the upstream
side rather than at the road centreline

NZ Transport AgencyPeka Peka to Otaki Expressway
Scheme Assessment ReportDesign Flood Levels for Waterway Crossings
Status Issue 1 Page 6 June 2011Project Number 440PN, 5-C1814.00 20110919 PP2O Technical Report Design Flood
Levels_v3_final draft
2.4 Treatment Philosophy for Individual Floodplain Crossings along Route
2.4.1 General
Each of the main waterway / floodplain crossings along the route of the proposed Peka Peka to North Otaki
Expressway has unique features requiring individual treatment with respect to defining and then implementing
the desired level of service.
2.4.2 Waitohu Stream
Flood hazard mapping of the current situation (refer Figure 4.1) indicates an extensive area of flood inundation
exists to the north of the proposed Waitohu Stream crossing. Our preliminary investigations have established
two contributing sources for this inundation:
the inadequate capacity of the existing State Highway 1 bridge crossing the Waitohu Stream which
causes flood breakout along the right (north) bank upstream of the bridge (the natural slope of the
floodplain forces breakout flows to head in a north-westerly direction)
the overland flow contribution of a sub-catchment area north of and parallel to the Waitohu Stream
The volume of overland flow generated by these two sources is quite significant. In the present situation it
would overtop State Highway 1 and force the closure of the road. The proposed expressway will therefore
need to be elevated on an embankment with passage for the overland flows through the embankment provided
for by a dry culvert.
The NZTA Bridge Manual requires a minimum freeboard value of 500mm for culverts. However any ponded
floodwaters upstream of the culvert at this location would be relatively calm and it may be possible to tolerate
a reduced freeboard value. Structural considerations may require a minimum depth of fill over any culvert.
One very helpful way of setting a minimum freeboard value would be to evaluate the incremental rise in flood
level for floods of different magnitude (e.g. the 1 and 0.5% AEP floods).
The previously recommended minimum freeboard value of 600mm to the underside of the proposed new
Waitohu Stream Bridge remains appropriate as a minimum freeboard standard. It is also considered
appropriate to assume the 1% AEP flood adjusted for the effects of possible future climate change to 2090 as
the Serviceability Limit State Flood for the bridge.
2.4.3 Mangapouri Stream
During the course of the investigations, Greater Wellington Regional Council (GWRC) advised that the existing
North Island Main Trunk Railway culvert on the Mangapouri Stream has been intentionally restricted in size in
order to act as a throttle for flood flows under severe flood conditions and thereby prevent downstream flood
inundation through Otaki Township The culvert has been specifically sized to limit downstream flood flows to
the level of the 5% AEP flood at the existing State Highway 1 culvert (WRC, 1998).
As the proposed expressway route requires the railway line to be relocated westwards (on the downstream
side) of the expressway, the culvert through the expressway embankment will be required to take over the
throttling function for large flood flows of the existing railway line culvert. The expressway embankment will
also be required to function as a flood detention barrier in the same way that the railway embankment does at
present except that it will be more impermeable than the ballast forming the latter structure.

NZ Transport AgencyPeka Peka to Otaki Expressway
Scheme Assessment ReportDesign Flood Levels for Waterway Crossings
Status Issue 1 Page 7 June 2011Project Number 440PN, 5-C1814.00 20110919 PP2O Technical Report Design Flood
Levels_v3_final draft
The catchment upstream of the proposed expressway crossing of the stream is relatively small so that flood
magnitudes are likely to be fairly low. As the area upstream of the stream crossing is quite flat, the extent of
upstream ponding when the expressway embankment functions as a flood detention barrier is likely to be
quite extensive. Consequently increases in flood ponding level due to increments in peak flood discharge will
likely be very small.
It would be appropriate in this context to evaluate the incremental rise in flood level for floods of different
magnitudes (e.g. 1, 0.5 and 0.2% AEP floods) and set the freeboard value for the minimum embankment crest
level based on the results of these calculations. It is also considered appropriate to assume the 1% AEP flood
adjusted for the effects of possible future climate change to 2090 as the Serviceability Limit State Flood for the
culvert and expressway embankment.
2.4.4 Otaki River
The Otaki River drains a relatively large catchment which extends back to the main east / west divide of the
Tararua Range. The catchment includes extensive forest cover so that there is very high likelihood of large
volumes of woody debris being flushed out of the catchment under extreme flood conditions and snagging on
the piers of the proposed expressway bridge, thereby inducing the formation of debris raft and causing
increased head losses past the bridge. For this reason it is appropriate to adopt a design freeboard value for
the bridge of 1.2m.
In view of the longevity of the projected design life for the proposed expressway bridge and the importance of
the structure, it is appropriate for the Serviceability Limit State Flood to have a relatively low frequency value of
at least 0.2% AEP based on current climate conditions.
2.4.5 Otaki River Floodplain
Otaki Township is sited on the floodplain of the Otaki River but is protected by a stopbank along the north
bank of the river (this is referred to as the Chrystall’s Bend extended stopbank). The design standard for the
stopbank is the 1% AEP flood with freeboard based on current climate conditions. The stopbank would
therefore be overtopped by any super-design flood with an exceedance probability of less than 1%. Any
floodwaters which overtopped the stopbank would flow as overland flow across the floodplain with at least
part of this flow inundating the township. Overtopping floodwaters could also induce a breach in the
stopbank.
Construction of the proposed expressway represents an opportunity to improve the level of flood security to
Otaki Township. By constructing the expressway on a raised embankment, the embankment would act as a
flood detention barrier forcing any stopbank overflow to pond upstream of it until the ponded floodwaters in
turn overtopped the road embankment. The effect of this would be to cause slightly more inundation of the
floodplain upstream of the expressway embankment than would occur upstream of the existing North Island
Main Trunk railway embankment in the present situation.
Without first actually carrying out some computational hydraulic model simulations to gauge the effects of
stopbank overtopping by a super-design flood, it is difficult to specify design flood and design freeboard
standards for the expressway embankment. It is considered appropriate therefore to undertake as a series of
model simulations for the 1% and 0.2% AEP floods based on current climate conditions and also adjusted for
the effects of possible future climate change to 2090.
NZ Transport AgencyPeka Peka to Otaki Expressway
Scheme Assessment ReportDesign Flood Levels for Waterway Crossings
Status Issue 1 Page 8 June 2011Project Number 440PN, 5-C1814.00 20110919 PP2O Technical Report Design Flood
Levels_v3_final draft
2.4.6 Mangaone Stream
As noted in Section 1.1, the existing State Highway 1 has a history of being overtopped by floodwaters every
few years in the immediate vicinity of the culvert system for the Mangaone Stream at Te Horo. The stream
downstream of the existing culvert has limited channel capacity which results in extensive overland flow and
floodplain inundation.
Construction of the proposed expressway past this location again represents an opportunity to improve the
level of flood security to downstream properties. As with the expressway crossing of the Otaki River
floodplain, if the expressway crossing of the Mangaone Stream floodplain was to be constructed as an elevated
embankment, the embankment would function as a flood detention barrier. Under severe flood conditions
then, floodwaters would pond upstream of the expressway embankment as they currently do to a limited
extent upstream of the North Island Main Trunk Railway Embankment.
As this stream and floodplain crossing is a less significant structure than the proposed bridge over the Otaki
River, it would be appropriate to adopt a lower Serviceability Limit State Flood design standard than for the
bridge. The 1% AEP flood adjusted for the effects of possible future climate change to 2090 is considered a
suitable design standard. Rather than specifying a design freeboard standard for the embankment and culvert
system, it would be appropriate to evaluate the incremental rise in flood level for floods of different
magnitudes (e.g. 1, 0.5 and 0.2% AEP floods) and set the freeboard value for the minimum embankment crest
level based on the results of these calculations.
NZ Transport AgencyPeka Peka to Otaki Expressway
Scheme Assessment ReportDesign Flood Levels for Waterway Crossings
Status Issue 1 Page 9 June 2011Project Number 440PN, 5-C1814.00 20110919 PP2O Technical Report Design Flood
Levels_v3_final draft
3. Flood Hydrology
3.1 Introduction
In order to assess flood levels at each of the river or stream crossings, it was first necessary to quantify the
frequency and magnitude of flood flows for those watercourses at the road crossing points. This is normally
done using gauged flow records However not all catchments are gauged so that transposition of flood
frequency estimates from other nearby and hydrologically similar gauged catchments must be carried out to
obtain these estimates (i.e. a regional flood frequency method must be adopted). Also the catchment area at a
river or stream crossing point may be different from the contributing catchment area for a stream gauging
station so that gauging station flood frequency estimates must be adjusted to account for such differences to
obtain the crossing point flood frequency estimates. Sometimes, where a gauging station flow record is
available, the record is too short to produce reliable flood frequency estimates. In these latter cases, longer
term rainfall records can be used in conjunction with a calibrated rainfall / runoff model to estimate flood
frequency magnitudes.
In this section, the estimation of flood frequency magnitudes is described for each of the Otaki River, Waitohu
Stream, Mangaone Stream and Mangapouri Stream crossings and then the estimated flood frequency
magnitudes are summarised. Cognisance has been taken of flood frequency estimates obtained by GWRC as
part of recent flood hazard assessments for each of these watercourses. This is to ensure that the flood
frequency estimates used to determine design flood levels at each of the stream crossing points for the PP2O
Project are reasonably consistent with the previous estimates obtained by GWRC in their investigations of
existing flood hazards.
3.2 Otaki River
There is a gauging station on the Otaki River a few kilometres upstream of the existing State Highway 1 and
North Island Main Trunk Railway bridges at Pukehinau. Because of the large size of the contributing catchment
area to the river at the flow gauging station (306km2), the flow record from this station will provide a fairly
accurate record of the flow at the existing road and railway crossing points. The flow record for the gauging
station is a very long one (1958 – present) so that flood frequency estimates determined from the annual flood
maxima series for the station are likely to be fairly reliable.
Recent investigations on behalf of GWRC (GWRC, 2007) give estimates of the 1% and 0.2% annual exceedance
probability (AEP) floods based on current climate conditions. These estimates are shown in Table 3.1 below.

NZ Transport AgencyPeka Peka to Otaki Expressway
Scheme Assessment ReportDesign Flood Levels for Waterway Crossings
Status Issue 1 Page 10 June 2011Project Number 440PN, 5-C1814.00 20110919 PP2O Technical Report Design Flood
Levels_v3_final draft
Table 3.1 Flood estimates for Otaki River
Annual Exceedance
Probability (%)
Flood Estimate (m3/s) Current climate conditions
as assumed by GWRC (2007) Adjusted for effects of possible future
climate change to 2090 1 1,810 2,120
0.2 2,130 2,490
The design requirements for the PP2O Project include the need to make appropriate allowance for the effects
of possible future climate change. The latest Ministry for the Environment Guidelines (MfE, 2010) provide
guidance on how to allow for such changes. This guidance is in the form of mid range, upper range and lower
range estimates of rainfall increases to 20040 and 2090. In the absence of a predictive rainfall/ runoff model
to translate catchment rainfall into runoff estimates, it is commonly assumed that the estimated increases in
rainfall due to climate change effects correspond directly to increases in flood flow.
In the case of the Wellington and Manawatu regions, the MfE (2010) Guidelines suggest a mid range estimate
for increased average rainfall (and hence flood flow) of +17% to 2090. Estimated values of the 1% and 0.2%
AEP floods adjusted for the effects of possible future climate change based on this increase are given in the
right hand column of Table 3.1 above. It is worth noting that the 1% AEP flood estimate for future climate
change effects to 2090 corresponds closely to the 0.2% AEP flood estimate for current climate conditions.
3.3 Waitohu Stream
The Waitohu Stream is gauged at the water supply intake about 4km upstream of the existing State Highway 1
bridge. The gauging station has been open since 1994 so that a 17 year long flow record is available for
carrying out a flood frequency analysis.
Figure 3.1 shows the results of a flood frequency analysis of this 17 year record. The three frequency
distributions fitted to the annual flood maxima series (Gumbel, GEV and Log Pearson 3) all show reasonably
good agreement with only a relatively small variation between them when extrapolated to obtain estimates of
low frequency floods.
Table 3.2 summarises the flood frequency estimates at the gauging station site for annual exceedance
probabilities (AEP) in the range of 43% (mean annual flood) to 0.1%. These flood frequency estimates have
also been scaled using the catchment scaling approach of McKerchar and Pearson (1989) to obtain
corresponding estimates at the site of the existing State Highway 1 bridge. The 1% AEP flood is estimated to
have a magnitude in the range 139-146m3/s at the bridge for current climate conditions. Based on the most
recent MfE (2010) Guidelines, this estimated range for the 1% AEP flood would increase to 163-171m3/s to
allow for the effects of possible future climate change to 2090 (based on a mid range increase in average
temperature and hence rainfall).
NZ Transport AgencyPeka Peka to Otaki Expressway
Scheme Assessment ReportDesign Flood Levels for Waterway Crossings
Status Issue 1 Page 11 June 2011Project Number 440PN, 5-C1814.00 20110919 PP2O Technical Report Design Flood
Levels_v3_final draft
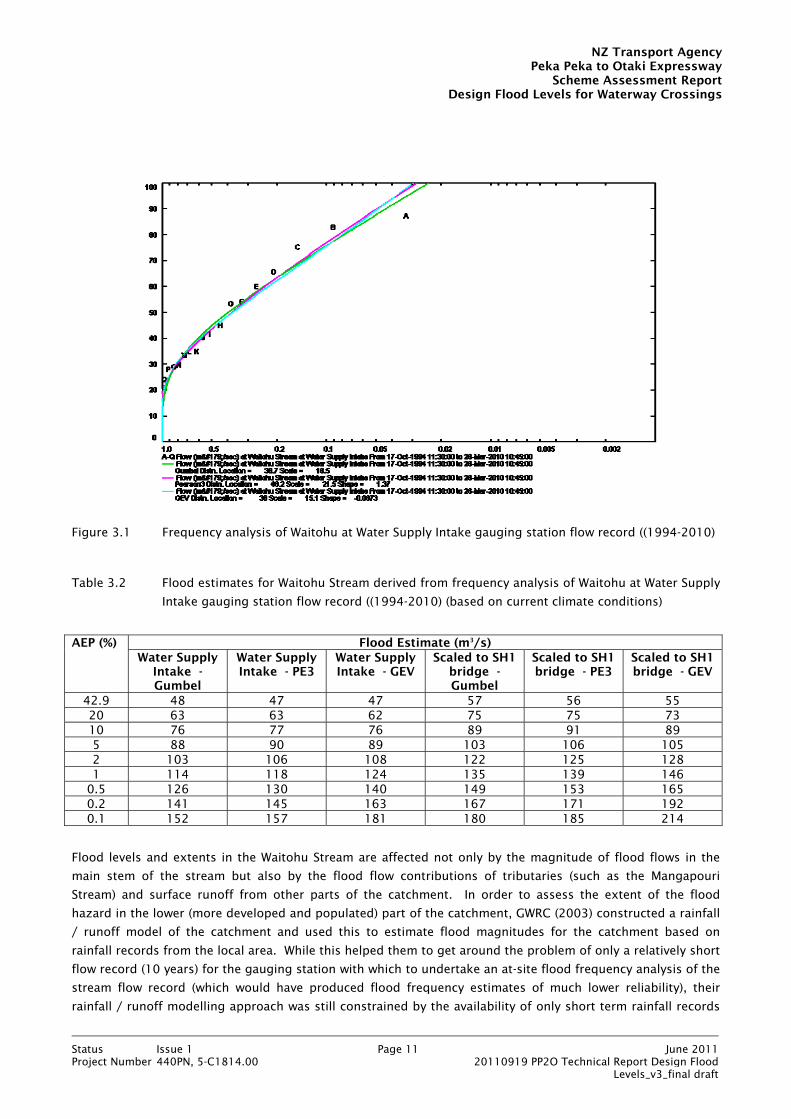
Figure 3.1 Frequency analysis of Waitohu at Water Supply Intake gauging station flow record ((1994-2010)
Table 3.2 Flood estimates for Waitohu Stream derived from frequency analysis of Waitohu at Water Supply
Intake gauging station flow record ((1994-2010) (based on current climate conditions)
AEP (%) Flood Estimate (m3/s)
Water Supply Intake - Gumbel
Water Supply Intake - PE3
Water Supply Intake - GEV
Scaled to SH1 bridge - Gumbel
Scaled to SH1 bridge - PE3
Scaled to SH1 bridge - GEV
42.9 48 47 47 57 56 55 20 63 63 62 75 75 73 10 76 77 76 89 91 89 5 88 90 89 103 106 105 2 103 106 108 122 125 128 1 114 118 124 135 139 146
0.5 126 130 140 149 153 165 0.2 141 145 163 167 171 192 0.1 152 157 181 180 185 214
Flood levels and extents in the Waitohu Stream are affected not only by the magnitude of flood flows in the
main stem of the stream but also by the flood flow contributions of tributaries (such as the Mangapouri
Stream) and surface runoff from other parts of the catchment. In order to assess the extent of the flood
hazard in the lower (more developed and populated) part of the catchment, GWRC (2003) constructed a rainfall
/ runoff model of the catchment and used this to estimate flood magnitudes for the catchment based on
rainfall records from the local area. While this helped them to get around the problem of only a relatively short
flow record (10 years) for the gauging station with which to undertake an at-site flood frequency analysis of the
stream flow record (which would have produced flood frequency estimates of much lower reliability), their
rainfall / runoff modelling approach was still constrained by the availability of only short term rainfall records
NZ Transport AgencyPeka Peka to Otaki Expressway
Scheme Assessment ReportDesign Flood Levels for Waterway Crossings
Status Issue 1 Page 12 June 2011Project Number 440PN, 5-C1814.00 20110919 PP2O Technical Report Design Flood
Levels_v3_final draft
with which to estimate the model inputs. However the rainfall runoff modelling approach did enable them to
consider storms of varying durations from 1 hour to 24 hours, something the flood frequency analysis of a
gauged stream flow record does not allow.
At the lower end of the catchment, there are large areas of low-lying land behind the coastal sand dune barrier
which provide flood storage for floodwaters in a significant flood before they exit through the gap in the dune
barrier cut by the stream. For these flood storage areas the key parameter influencing peak flood levels is the
flood volume rather than the peak discharge. For such areas, GWRC’s (2003) analysis found the critical storm
duration to generally be 6 hours for most floods. In contrast the key parameter influencing peak flood levels
at the sites of the existing State Highway 1 and proposed expressway bridges is the peak flood discharge. For
these locations, the critical storm duration is 2 hours for most floods.
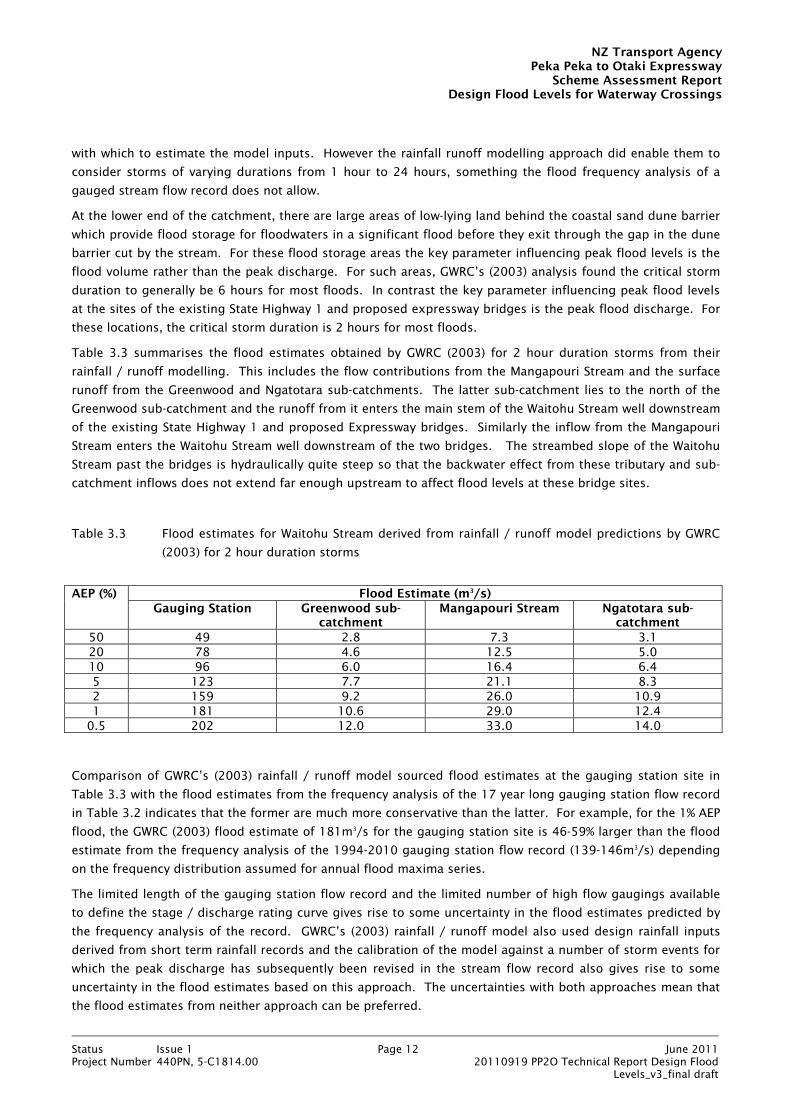
Table 3.3 summarises the flood estimates obtained by GWRC (2003) for 2 hour duration storms from their
rainfall / runoff modelling. This includes the flow contributions from the Mangapouri Stream and the surface
runoff from the Greenwood and Ngatotara sub-catchments. The latter sub-catchment lies to the north of the
Greenwood sub-catchment and the runoff from it enters the main stem of the Waitohu Stream well downstream
of the existing State Highway 1 and proposed Expressway bridges. Similarly the inflow from the Mangapouri
Stream enters the Waitohu Stream well downstream of the two bridges. The streambed slope of the Waitohu
Stream past the bridges is hydraulically quite steep so that the backwater effect from these tributary and sub-
catchment inflows does not extend far enough upstream to affect flood levels at these bridge sites.
Table 3.3 Flood estimates for Waitohu Stream derived from rainfall / runoff model predictions by GWRC
(2003) for 2 hour duration storms
AEP (%) Flood Estimate (m3/s)
Gauging Station Greenwood sub-catchment
Mangapouri Stream Ngatotara sub-catchment
50 49 2.8 7.3 3.1 20 78 4.6 12.5 5.0 10 96 6.0 16.4 6.4 5 123 7.7 21.1 8.3 2 159 9.2 26.0 10.9 1 181 10.6 29.0 12.4
0.5 202 12.0 33.0 14.0
Comparison of GWRC’s (2003) rainfall / runoff model sourced flood estimates at the gauging station site in
Table 3.3 with the flood estimates from the frequency analysis of the 17 year long gauging station flow record
in Table 3.2 indicates that the former are much more conservative than the latter. For example, for the 1% AEP
flood, the GWRC (2003) flood estimate of 181m3/s for the gauging station site is 46-59% larger than the flood
estimate from the frequency analysis of the 1994-2010 gauging station flow record (139-146m3/s) depending
on the frequency distribution assumed for annual flood maxima series.
The limited length of the gauging station flow record and the limited number of high flow gaugings available
to define the stage / discharge rating curve gives rise to some uncertainty in the flood estimates predicted by
the frequency analysis of the record. GWRC’s (2003) rainfall / runoff model also used design rainfall inputs
derived from short term rainfall records and the calibration of the model against a number of storm events for
which the peak discharge has subsequently been revised in the stream flow record also gives rise to some
uncertainty in the flood estimates based on this approach. The uncertainties with both approaches mean that
the flood estimates from neither approach can be preferred.
NZ Transport AgencyPeka Peka to Otaki Expressway
Scheme Assessment ReportDesign Flood Levels for Waterway Crossings
Status Issue 1 Page 13 June 2011Project Number 440PN, 5-C1814.00 20110919 PP2O Technical Report Design Flood
Levels_v3_final draft
GWRC (2004b) used the flood discharge predictions of their rainfall / runoff model (GWRC, 2003) as an input
to a one-dimensional computational hydraulic model of the stream and floodplain system in order to assess
the flood hazard throughout the lower part of the Waitohu Catchment (i.e. along the coastal plain between the
foothills and the sea). To reflect the likely rainfall gradient across the whole catchment due to orographic
effects, GWRC assumed for the 1% and 0.5% AEP 2 hour duration rainstorm events adjusted for climate change
effects that the runoff from these storms in the upper foothills part of the catchment would coincide with the
runoff from a 5% AEP rainstorm of the same duration over the lower coastal plain part of the catchment.
In order to assess the effect of the proposed Expressway on the existing flood hazard and to derive design
flood levels for the Expressway crossing of the Waitohu Stream and floodplain, the same one-dimensional
computational hydraulic model of the stream and floodplain system developed by GWRC was utilised. For
reasons of consistency then, the flood estimates obtained from the rainfall / runoff model approach by GWRC
(2003) were adopted for the investigations of the effect of the proposed Expressway crossing of the Waitohu
Stream and floodplain in this report. However it is noted that these flood estimates are likely to be very
conservative.
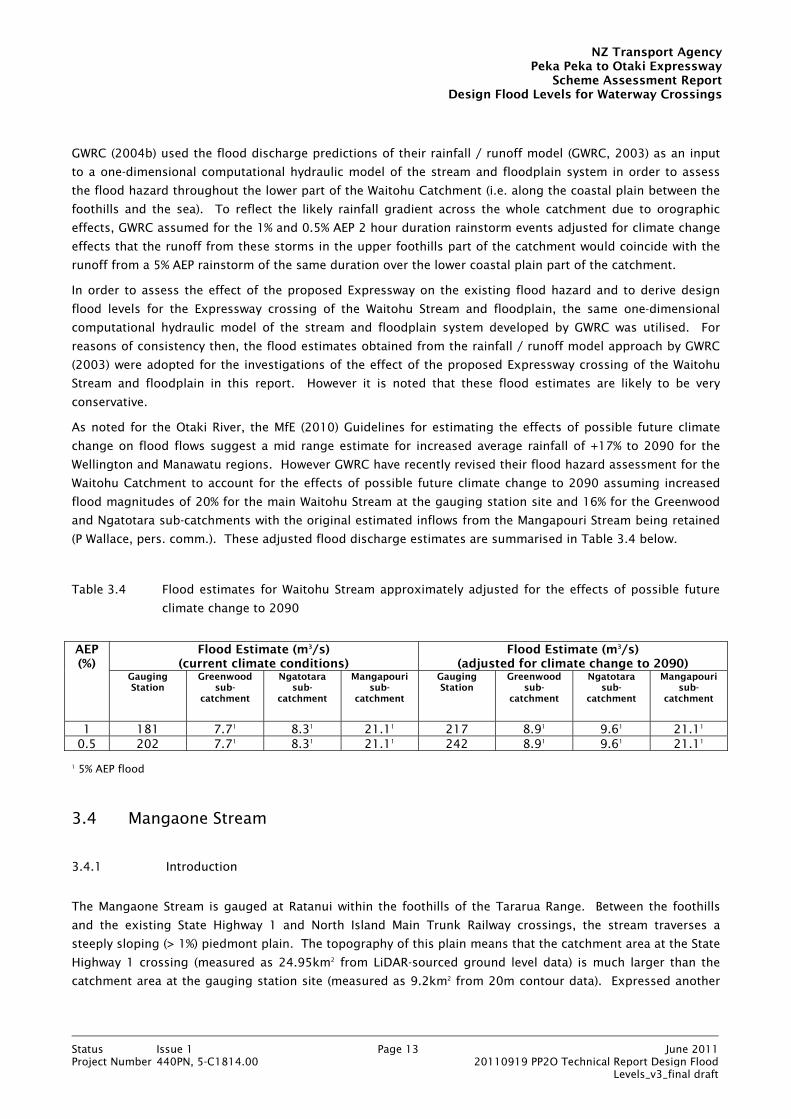
As noted for the Otaki River, the MfE (2010) Guidelines for estimating the effects of possible future climate
change on flood flows suggest a mid range estimate for increased average rainfall of +17% to 2090 for the
Wellington and Manawatu regions. However GWRC have recently revised their flood hazard assessment for the
Waitohu Catchment to account for the effects of possible future climate change to 2090 assuming increased
flood magnitudes of 20% for the main Waitohu Stream at the gauging station site and 16% for the Greenwood
and Ngatotara sub-catchments with the original estimated inflows from the Mangapouri Stream being retained
(P Wallace, pers. comm.). These adjusted flood discharge estimates are summarised in Table 3.4 below.
Table 3.4 Flood estimates for Waitohu Stream approximately adjusted for the effects of possible future
climate change to 2090
AEP (%)
Flood Estimate (m3/s) (current climate conditions)
Flood Estimate (m3/s) (adjusted for climate change to 2090)
Gauging Station
Greenwood sub-
catchment
Ngatotara sub-
catchment
Mangapouri sub-
catchment
Gauging Station
Greenwood sub-
catchment
Ngatotara sub-
catchment
Mangapouri sub-
catchment
1 181 7.71 8.31 21.11 217 8.91 9.61 21.11 0.5 202 7.71 8.31 21.11 242 8.91 9.61 21.11
1 5% AEP flood
3.4 Mangaone Stream
3.4.1 Introduction
The Mangaone Stream is gauged at Ratanui within the foothills of the Tararua Range. Between the foothills
and the existing State Highway 1 and North Island Main Trunk Railway crossings, the stream traverses a
steeply sloping (> 1%) piedmont plain. The topography of this plain means that the catchment area at the State
Highway 1 crossing (measured as 24.95km2 from LiDAR-sourced ground level data) is much larger than the
catchment area at the gauging station site (measured as 9.2km2 from 20m contour data). Expressed another

NZ Transport AgencyPeka Peka to Otaki Expressway
Scheme Assessment ReportDesign Flood Levels for Waterway Crossings
Status Issue 1 Page 14 June 2011Project Number 440PN, 5-C1814.00 20110919 PP2O Technical Report Design Flood
Levels_v3_final draft
way, the gauging station catchment area is only 37% of the catchment area at the State Highway 1 stream
crossing.
This is problematical for the estimation of flood frequencies and magnitudes at the State Highway 1 stream
crossing and hence the proposed Expressway crossing. The rainfall / runoff relationship of the catchment at
the Ratanui gauging station site is distinctly different to that of the lower part of the catchment across the
piedmont plain to the coast. The lower part of the catchment across the plain is likely to receive less rainfall
because of less orographic enhancement. The flatter ground slopes on the alluvial gravels of the plain also
mean that there is likely to be significantly less runoff from this part of the catchment. It is a common
occurrence with the Mangaone Stream that significant floods break out of the main channel near the head of
the plain and flow overland via several paths before being intercepted by the railway line embankment and
then channelled through a culvert system to the seaward side of State Highway 1. The alluvial gravel deposits
making up the piedmont plain form an unconfined groundwater aquifer which has the potential to receive
water from stream flow, overland flow and floodplain detention storage infiltrating through these deposits.
The process of overland flow across the plain gives rise to attenuation of the peak flood discharge due to the
effects of surface (bed) friction.
This means that flood frequency estimates obtained from a frequency analysis of the annual flood maxima
series for the Ratanui gauging station site cannot simply be extrapolated to determine flood estimates for the
existing State Highway 1 stream crossing using the catchment area scaling approach of McKerchar and
Pearson’s (1989) regional flood frequency method.
3.4.2 Previous Flood Frequency Estimates for Mangaone Stream at Existing State Highway 1 Crossing
There have been several previous flood estimates for the Mangaone Stream at the existing State Highway 1
crossing.
McKerchar (1991) utilised the regional flood frequency method of McKerchar and Pearson’s (1989) to establish
flood frequencies and magnitudes at the existing State Highway 1 crossing from other nearby gauging station
flow records. These flood estimates are summarised in Table 3.5. In addition to the problems hinted at
before, there are two other problems with this approach. Firstly, the catchment area of 16.6km2 is significantly
underestimated as the catchment boundaries would have been determined from 20m topographic contour
data which is ill-defined across the plain area. Secondly, the flood estimates are likely to be biased by the
different rainfall / runoff characteristics and hence higher flow regime of the Otaki River Catchment used in
McKerchar and Pearson’s (1989) regional flood frequency method.
Table 3.5 Comparison of flood frequency estimates for Mangaone Stream at State Highway 1 Culverts
AEP (%) Flood Estimate (m3/s)
McKerchar (1991) MWH (2002b) REC Current Study – GEV Area (km2)
16.6 ~ 27 19.01 (24.95) 24.95
42.9 25 19.7 26.8 (33.3) 33.7 20 35 25.4 45.5 10 42 29.7 55.3 5 48 33.8 64.4 2 56 38.8 76.6 1 63 43.6 57.3 (71.2) 85.7
0.5 68 47.5 94.8 0.2 - - 106.8

NZ Transport AgencyPeka Peka to Otaki Expressway
Scheme Assessment ReportDesign Flood Levels for Waterway Crossings
Status Issue 1 Page 15 June 2011Project Number 440PN, 5-C1814.00 20110919 PP2O Technical Report Design Flood
Levels_v3_final draft
MWH (2002a, 2002b) used a hybrid approach to obtain flood estimates at the existing State Highway 1 stream
crossing. They first carried out a frequency analysis on the 1993-2000 annual flood maxima series for the
Mangaone Stream at Ratanui gauging station flow record. Flood hydrographs scaled to fit these estimated
flood discharge peaks were then used as an upstream boundary condition for a one-dimensional MIKE11
computational hydraulic model of the stream channel and overland flow path system across the coastal plain
to the sea. The runoff contribution from the lower coastal plain part of the catchment was estimated with a
rainfall / runoff model using rainfall data as an input and the predicted runoff hydrographs were applied as an
internal boundary condition to the hydraulic model of the stream channel and overland flow path system. The
flood estimates obtained by MWH (2002b) are also summarised in Table 3.6.
There are a number of problems with the MWH (2002b) flood estimates. Firstly, the hybrid approach mixing
flood hydrographs scaled from gauged stream flow records for one part of the catchment and rainfall / runoff
model predictions for another part of the catchment is unusual. Secondly, the catchment area at the State
Highway 1 stream crossing assumed by MWH to be ~ 27km2 (this excludes those sub-catchment areas to the
south of the stream crossing from which surface runoff flows directly across the road) is slightly overestimated
compared to the catchment area of 24.95km2 estimated from the LiDAR-sourced topographic data in these
investigations. Thirdly, the rainfall data used as the primary input to the rainfall / runoff model over the lower
coastal plain part of the catchment was sourced from HIRDS (a tool produced by NIWA that can estimate
rainfall frequency at any point in the country) but the predictive accuracy of actual rainfall over the coastal
plain by this tool is unknown. Fourthly and most importantly, the annual flood maxima series used by MWH to
obtain the flood frequency estimates for the Ratanui gauging station site was only 8 years long (1993-2000).
Consequently the frequency distributions fitted to the data have an extremely poor fit (as seen in Figure 3.2
below) which makes the flood frequency estimates obtained for the gauging station site unreliable. It is
appropriate therefore to conclude that the flood estimates obtained by MWH (2002b) for the State Highway 1
crossing of the Mangaone Stream contain a high level of uncertainty.
1.0 0.5 0.2 0.1 0.05 0.02 0.01 0.005 0.002
10
12
14
16
18
20
22
24
26
28
30
32
34
36
38
40
A-H Flow (m³/sec) at Mangaone Stream at Ratanui From 13-Jan-1993 12:00:00 to 7-Dec-2000 00:00:00Flow (m³/sec) at Mangaone Stream at Ratanui From 13-Jan-1993 12:00:00 to 7-Dec-2000 00:00:00
Gumbel Distn. Location = 14.8 Scale = 4.94Flow (m³/sec) at Mangaone Stream at Ratanui From 13-Jan-1993 12:00:00 to 7-Dec-2000 00:00:00
Pearson3 Distn. Location = 17.6 Scale = 9.67 Shape = 4.53Flow (m³/sec) at Mangaone Stream at Ratanui From 13-Jan-1993 12:00:00 to 7-Dec-2000 00:00:00
GEV Distn. Location = 14 Scale = 1.52 Shape = -0.654
H G F ED
CB
A
Figure 3.2 Flood frequency distributions for Mangaone Stream at Ratanui (1993-2000)
NZ Transport AgencyPeka Peka to Otaki Expressway
Scheme Assessment ReportDesign Flood Levels for Waterway Crossings
Status Issue 1 Page 16 June 2011Project Number 440PN, 5-C1814.00 20110919 PP2O Technical Report Design Flood
Levels_v3_final draft
The latest iteration of McKerchar and Pearson’s (1989) regional flood frequency method incorporated in NIWA’s
GIS-based River Environment Classification (REC) System predicts a mean annual (42.9% AEP) flood estimate of
26.8m3/s and a 1% AEP flood estimate of 57.3m3/s based on a catchment area of 19.01km2. As noted before
this is a significant underestimate of the actual catchment area which is probably based on 20m topographic
contour data. If the flood estimates are corrected for the 24.95km2 catchment area measured from LiDAR-
sourced topographic data in these investigations, the corrected mean annual and 1% AEP flood values are 33.3
and 71.2m3/s respectively. The original and corrected REC flood estimates are summarised in Table 3.5 above.
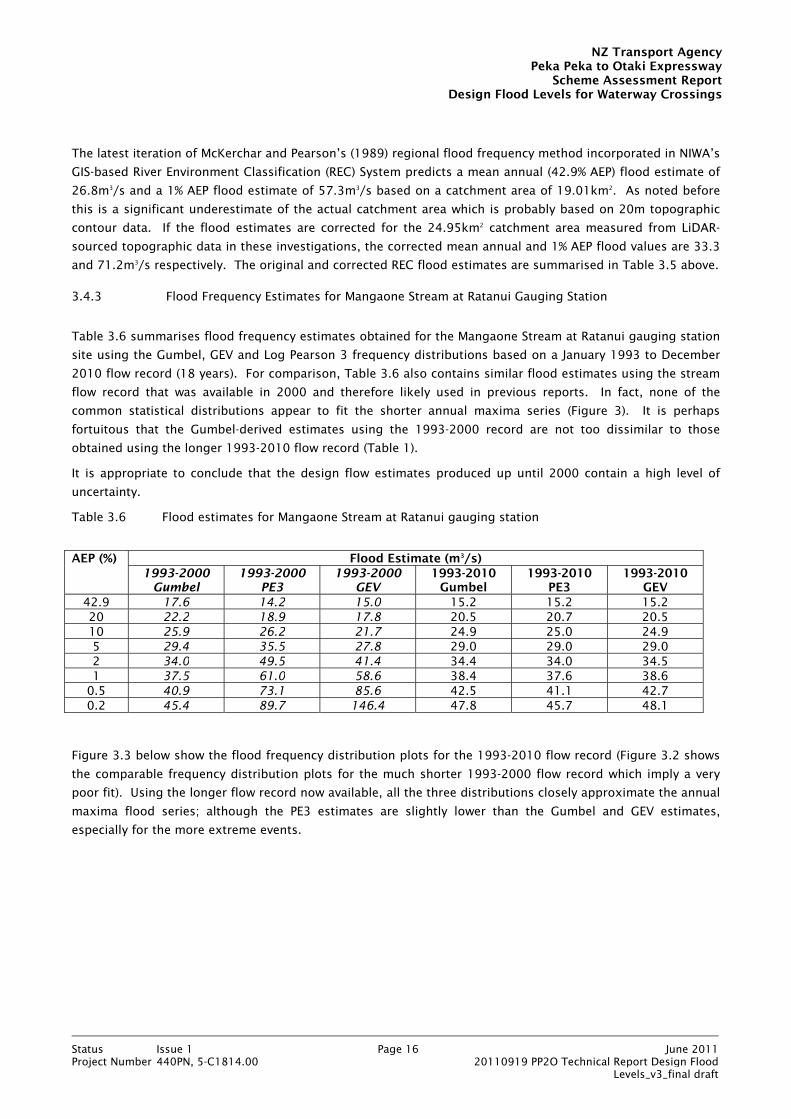
3.4.3 Flood Frequency Estimates for Mangaone Stream at Ratanui Gauging Station
Table 3.6 summarises flood frequency estimates obtained for the Mangaone Stream at Ratanui gauging station
site using the Gumbel, GEV and Log Pearson 3 frequency distributions based on a January 1993 to December
2010 flow record (18 years). For comparison, Table 3.6 also contains similar flood estimates using the stream
flow record that was available in 2000 and therefore likely used in previous reports. In fact, none of the
common statistical distributions appear to fit the shorter annual maxima series (Figure 3). It is perhaps
fortuitous that the Gumbel-derived estimates using the 1993-2000 record are not too dissimilar to those
obtained using the longer 1993-2010 flow record (Table 1).
It is appropriate to conclude that the design flow estimates produced up until 2000 contain a high level of
uncertainty.
Table 3.6 Flood estimates for Mangaone Stream at Ratanui gauging station
AEP (%) Flood Estimate (m3/s)
1993-2000 Gumbel
1993-2000 PE3
1993-2000 GEV
1993-2010 Gumbel
1993-2010 PE3
1993-2010 GEV
42.9 17.6 14.2 15.0 15.2 15.2 15.2 20 22.2 18.9 17.8 20.5 20.7 20.5 10 25.9 26.2 21.7 24.9 25.0 24.9 5 29.4 35.5 27.8 29.0 29.0 29.0 2 34.0 49.5 41.4 34.4 34.0 34.5 1 37.5 61.0 58.6 38.4 37.6 38.6
0.5 40.9 73.1 85.6 42.5 41.1 42.7 0.2 45.4 89.7 146.4 47.8 45.7 48.1
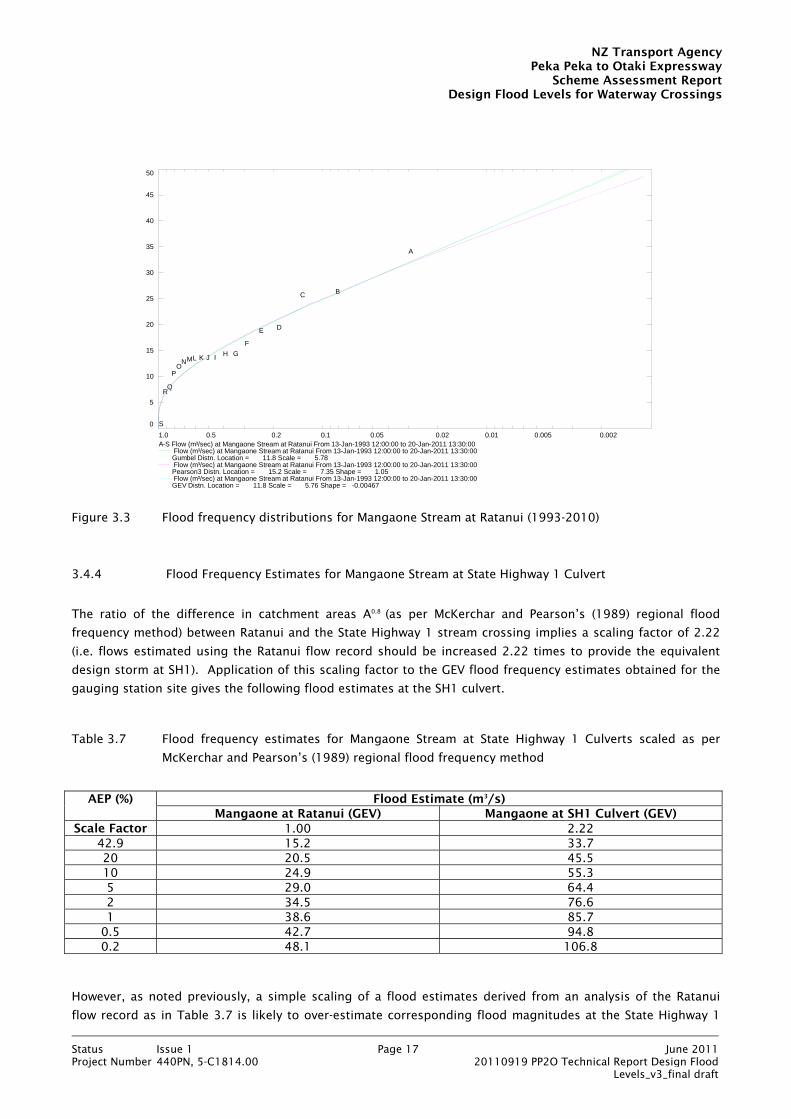
Figure 3.3 below show the flood frequency distribution plots for the 1993-2010 flow record (Figure 3.2 shows
the comparable frequency distribution plots for the much shorter 1993-2000 flow record which imply a very
poor fit). Using the longer flow record now available, all the three distributions closely approximate the annual
maxima flood series; although the PE3 estimates are slightly lower than the Gumbel and GEV estimates,
especially for the more extreme events.
NZ Transport AgencyPeka Peka to Otaki Expressway
Scheme Assessment ReportDesign Flood Levels for Waterway Crossings
Status Issue 1 Page 17 June 2011Project Number 440PN, 5-C1814.00 20110919 PP2O Technical Report Design Flood
Levels_v3_final draft
1.0 0.5 0.2 0.1 0.05 0.02 0.01 0.005 0.002
0
5
10
15
20
25
30
35
40
45
50
A-S Flow (m³/sec) at Mangaone Stream at Ratanui From 13-Jan-1993 12:00:00 to 20-Jan-2011 13:30:00Flow (m³/sec) at Mangaone Stream at Ratanui From 13-Jan-1993 12:00:00 to 20-Jan-2011 13:30:00
Gumbel Distn. Location = 11.8 Scale = 5.78Flow (m³/sec) at Mangaone Stream at Ratanui From 13-Jan-1993 12:00:00 to 20-Jan-2011 13:30:00
Pearson3 Distn. Location = 15.2 Scale = 7.35 Shape = 1.05Flow (m³/sec) at Mangaone Stream at Ratanui From 13-Jan-1993 12:00:00 to 20-Jan-2011 13:30:00
GEV Distn. Location = 11.8 Scale = 5.76 Shape = -0.00467
S
RQ
PO
NML K J I H G
F
E D
C B
A
Figure 3.3 Flood frequency distributions for Mangaone Stream at Ratanui (1993-2010)
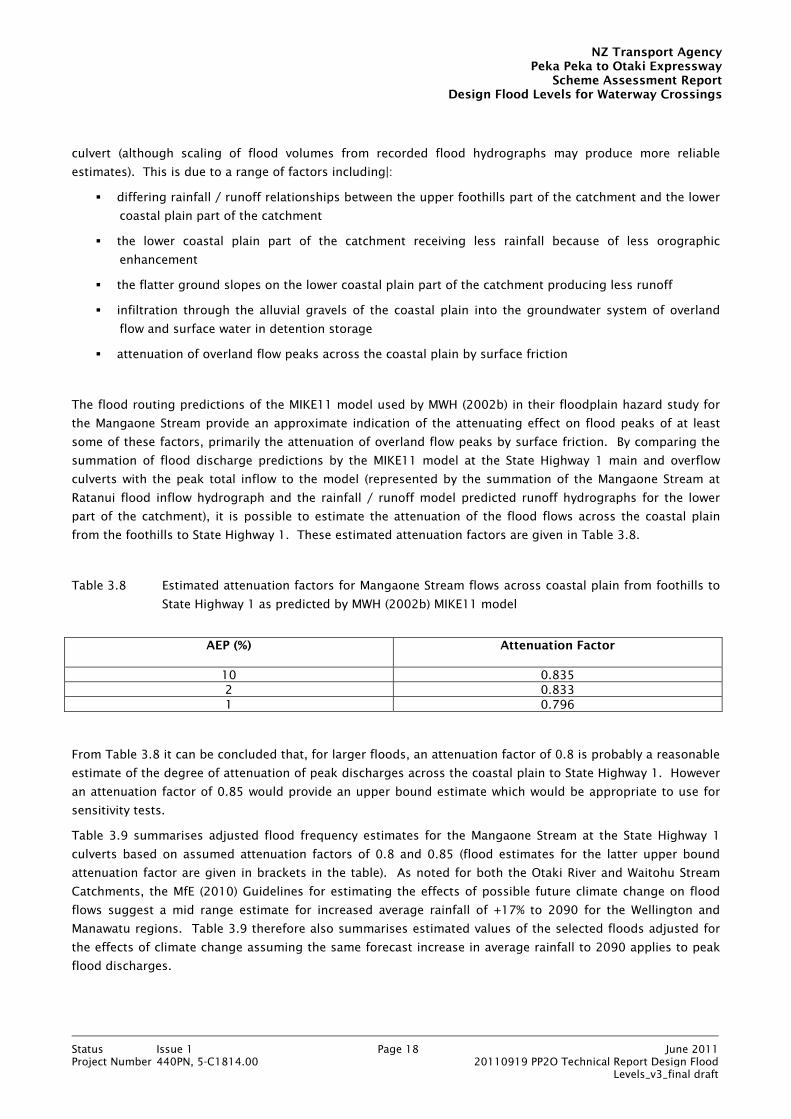
3.4.4 Flood Frequency Estimates for Mangaone Stream at State Highway 1 Culvert
The ratio of the difference in catchment areas A0.8 (as per McKerchar and Pearson’s (1989) regional flood
frequency method) between Ratanui and the State Highway 1 stream crossing implies a scaling factor of 2.22
(i.e. flows estimated using the Ratanui flow record should be increased 2.22 times to provide the equivalent
design storm at SH1). Application of this scaling factor to the GEV flood frequency estimates obtained for the
gauging station site gives the following flood estimates at the SH1 culvert.
Table 3.7 Flood frequency estimates for Mangaone Stream at State Highway 1 Culverts scaled as per
McKerchar and Pearson’s (1989) regional flood frequency method
AEP (%) Flood Estimate (m3/s)
Mangaone at Ratanui (GEV) Mangaone at SH1 Culvert (GEV) Scale Factor 1.00 2.22
42.9 15.2 33.7 20 20.5 45.5 10 24.9 55.3 5 29.0 64.4 2 34.5 76.6 1 38.6 85.7
0.5 42.7 94.8 0.2 48.1 106.8
However, as noted previously, a simple scaling of a flood estimates derived from an analysis of the Ratanui
flow record as in Table 3.7 is likely to over-estimate corresponding flood magnitudes at the State Highway 1
NZ Transport AgencyPeka Peka to Otaki Expressway
Scheme Assessment ReportDesign Flood Levels for Waterway Crossings
Status Issue 1 Page 18 June 2011Project Number 440PN, 5-C1814.00 20110919 PP2O Technical Report Design Flood
Levels_v3_final draft
culvert (although scaling of flood volumes from recorded flood hydrographs may produce more reliable
estimates). This is due to a range of factors including|:
differing rainfall / runoff relationships between the upper foothills part of the catchment and the lower
coastal plain part of the catchment
the lower coastal plain part of the catchment receiving less rainfall because of less orographic
enhancement
the flatter ground slopes on the lower coastal plain part of the catchment producing less runoff
infiltration through the alluvial gravels of the coastal plain into the groundwater system of overland
flow and surface water in detention storage
attenuation of overland flow peaks across the coastal plain by surface friction
The flood routing predictions of the MIKE11 model used by MWH (2002b) in their floodplain hazard study for
the Mangaone Stream provide an approximate indication of the attenuating effect on flood peaks of at least
some of these factors, primarily the attenuation of overland flow peaks by surface friction. By comparing the
summation of flood discharge predictions by the MIKE11 model at the State Highway 1 main and overflow
culverts with the peak total inflow to the model (represented by the summation of the Mangaone Stream at
Ratanui flood inflow hydrograph and the rainfall / runoff model predicted runoff hydrographs for the lower
part of the catchment), it is possible to estimate the attenuation of the flood flows across the coastal plain
from the foothills to State Highway 1. These estimated attenuation factors are given in Table 3.8.
Table 3.8 Estimated attenuation factors for Mangaone Stream flows across coastal plain from foothills to
State Highway 1 as predicted by MWH (2002b) MIKE11 model
AEP (%) Attenuation Factor
10 0.835 2 0.833 1 0.796
From Table 3.8 it can be concluded that, for larger floods, an attenuation factor of 0.8 is probably a reasonable
estimate of the degree of attenuation of peak discharges across the coastal plain to State Highway 1. However
an attenuation factor of 0.85 would provide an upper bound estimate which would be appropriate to use for
sensitivity tests.
Table 3.9 summarises adjusted flood frequency estimates for the Mangaone Stream at the State Highway 1
culverts based on assumed attenuation factors of 0.8 and 0.85 (flood estimates for the latter upper bound
attenuation factor are given in brackets in the table). As noted for both the Otaki River and Waitohu Stream
Catchments, the MfE (2010) Guidelines for estimating the effects of possible future climate change on flood
flows suggest a mid range estimate for increased average rainfall of +17% to 2090 for the Wellington and
Manawatu regions. Table 3.9 therefore also summarises estimated values of the selected floods adjusted for
the effects of climate change assuming the same forecast increase in average rainfall to 2090 applies to peak
flood discharges.

NZ Transport AgencyPeka Peka to Otaki Expressway
Scheme Assessment ReportDesign Flood Levels for Waterway Crossings
Status Issue 1 Page 19 June 2011Project Number 440PN, 5-C1814.00 20110919 PP2O Technical Report Design Flood
Levels_v3_final draft
Table 3.9 Adjusted flood frequency estimates for Mangaone Stream at State Highway 1 Culverts
AEP (%) Flood Estimate (m3/s)
Scaled from Ratanui flood estimate
Adjusted for Attenuation Effects
Adjusted for Climate Change Effects to 2090
Scaling Factor
1.00 0.80 ( 0.85) 1.17
5 64.4 (54.7) (64.1) 2 76.6 (65.1) (76.2) 1 85.7 68.6 (72.9) 80.2 (85.2)
0.5 94.8 75.8 (80.6) 88.7 (94.3)
3.5 Mangapouri Stream
The Mangapouri Stream has a much smaller catchment area than either the Waitohu or Mangaone Streams
(2.02km2 at the site of the existing North Island Main Trunk Railway culvert compared to 19.2km2 for the
Waitohu Stream at the water supply intake gauging station and 9.2km2 for the Mangaone Stream at the Ratanui
gauging station). The stream is ungauged so that flood estimates must be obtained using an alternative
approach that does not rely on the availability of a long term stream flow record. A range of methods exist to
estimate peak flows in a catchment in the absence of such a record. These include the rational method, the
regional flood estimation method of McKerchar and Pearson (1989) and its latest variant (incorporated in
NIWA’s GIS-based River Environment Classification (REC) System), and the translation of the flow record from
an adjacent site with a similar rainfall / runoff relationship.
The nearest available stream flow records are from the Waitohu and Mangaone Catchments. While the Waitohu
Catchment is closer, the rainfall / runoff response of this catchment is likely to be different to that of the
Mangapouri Catchment because of its size and location relative to the Tararua Range. This is reflected in the
median yield being 23l/s/km2 as opposed to 21l/s/km2 for the Mangaone Catchment. The Mangaone
Catchment, although still significantly larger than the Mangapouri Catchment, is likely to be affected by similar
rainfall patterns and have similar runoff characteristics. It is considered that scaling the flood estimates
derived for the Mangaone Stream at the Ratanui gauging station (Table 3.7) is likely to provide more reliable
estimates of the peak discharges expected in the Mangapouri Stream than other methods.
Assuming that the flow record for the Mangaone Catchment reflects that of the much smaller Mangapouri
Catchment, flood frequency estimates for the Mangapouri Stream at the site of the North Island Main Trunk
Railway culvert scaled as a function of catchment area A0.8 are presented in Table 3.10. The scale factor used
to translate the gauged Mangaone Stream flow record to the Mangapouri Stream is 0.2973.
NZ Transport AgencyPeka Peka to Otaki Expressway
Scheme Assessment ReportDesign Flood Levels for Waterway Crossings
Status Issue 1 Page 20 June 2011Project Number 440PN, 5-C1814.00 20110919 PP2O Technical Report Design Flood
Levels_v3_final draft
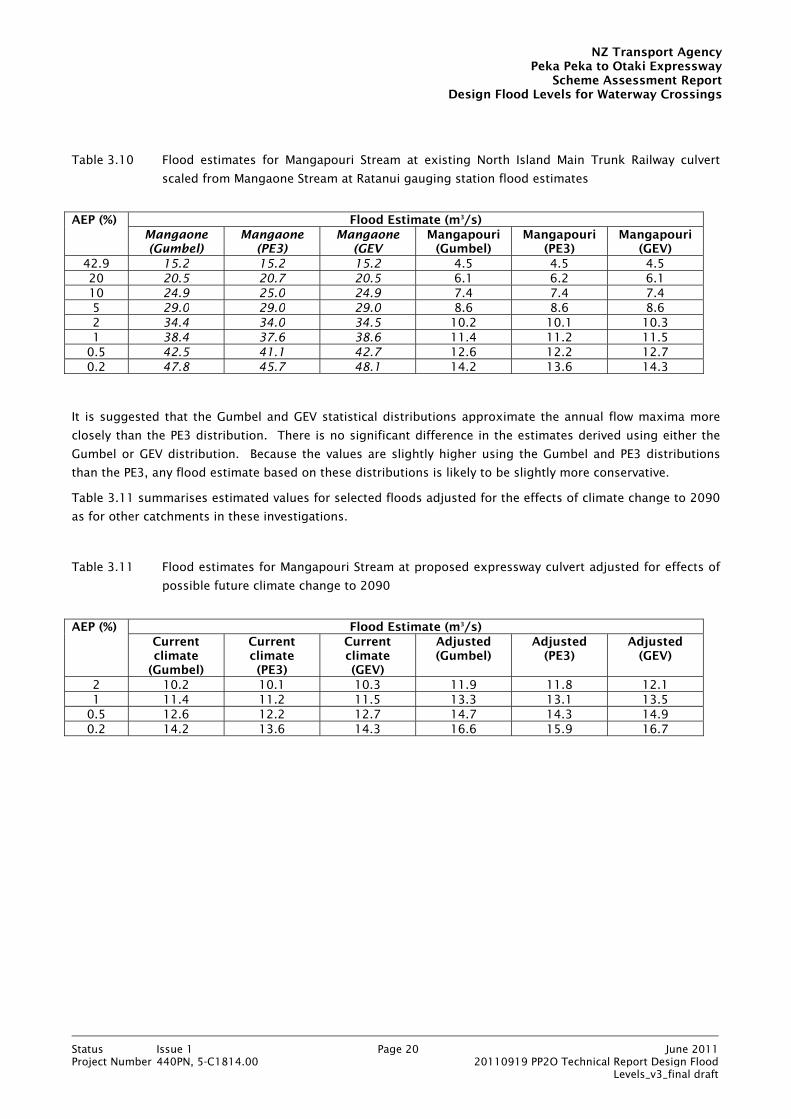
Table 3.10 Flood estimates for Mangapouri Stream at existing North Island Main Trunk Railway culvert
scaled from Mangaone Stream at Ratanui gauging station flood estimates
AEP (%) Flood Estimate (m3/s)
Mangaone (Gumbel)
Mangaone (PE3)
Mangaone (GEV
Mangapouri (Gumbel)
Mangapouri (PE3)
Mangapouri (GEV)
42.9 15.2 15.2 15.2 4.5 4.5 4.5 20 20.5 20.7 20.5 6.1 6.2 6.1 10 24.9 25.0 24.9 7.4 7.4 7.4 5 29.0 29.0 29.0 8.6 8.6 8.6 2 34.4 34.0 34.5 10.2 10.1 10.3 1 38.4 37.6 38.6 11.4 11.2 11.5
0.5 42.5 41.1 42.7 12.6 12.2 12.7 0.2 47.8 45.7 48.1 14.2 13.6 14.3
It is suggested that the Gumbel and GEV statistical distributions approximate the annual flow maxima more
closely than the PE3 distribution. There is no significant difference in the estimates derived using either the
Gumbel or GEV distribution. Because the values are slightly higher using the Gumbel and PE3 distributions
than the PE3, any flood estimate based on these distributions is likely to be slightly more conservative.
Table 3.11 summarises estimated values for selected floods adjusted for the effects of climate change to 2090
as for other catchments in these investigations.
Table 3.11 Flood estimates for Mangapouri Stream at proposed expressway culvert adjusted for effects of
possible future climate change to 2090
AEP (%) Flood Estimate (m3/s)
Current climate
(Gumbel)
Current climate (PE3)
Current climate (GEV)
Adjusted (Gumbel)
Adjusted (PE3)
Adjusted (GEV)
2 10.2 10.1 10.3 11.9 11.8 12.1 1 11.4 11.2 11.5 13.3 13.1 13.5
0.5 12.6 12.2 12.7 14.7 14.3 14.9 0.2 14.2 13.6 14.3 16.6 15.9 16.7

NZ Transport AgencyPeka Peka to Otaki Expressway
Scheme Assessment ReportDesign Flood Levels for Waterway Crossings
Status Issue 1 Page 21 June 2011Project Number 440PN, 5-C1814.00 20110919 PP2O Technical Report Design Flood
Levels_v3_final draft
4. Waitohu Stream Design Flood Levels
4.1 Introduction
The section sets out the recommendations for design flood levels for the PP20 Expressway over the Waitohu
Stream.
4.2 Design Flood Magnitude
The design flood for this stream crossing was selected as the flood resulting from the 2 hour duration 1%
annual exceedance probability (AEP) rainfall (adjusted for the effects of possible future climate change) on the
Waitohu Catchment. This is based on recent floodplain management investigations work undertaken by GWRC
(2003, 2004b).
In these investigations, GWRC considered rainfall durations varying between 1 and 6 hours as well as 12 and
24 hours. They found the critical storm duration for the extent of flood inundation in the lower parts of the
catchment to be 6 hours as the resulting flood, although having lower peak discharges, had a greater overall
flood volume. For both the existing State Highway 1 (SH1) and proposed Expressway bridges located in the
middle part of the catchment, the critical storm parameter will be the peak flood discharge as this produces
the highest flood levels at these locations. From our inspection of GWRC’s (2003) hydrological and hydraulic
modelling calculations, we found that a 2 hour duration rainfall produces the highest peak flood discharges in
the middle part of the catchment. A 2 hour duration will therefore be the critical storm duration in this
particular context.
The Waitohu Stream has a number of tributaries (mainly in the lower part of the catchment) which were
assumed to be simultaneously contributing runoff resulting from the 2 hour duration 5% AEP rainfall (adjusted
for the effects of possible future climate change). This assumption attempts to reflect the common
characteristic of a rainfall gradient across a large catchment such as the Waitohu (partly due to the effects of
altitude on precipitation) in a significant storm event. This is particularly true in a short duration rainfall event
which is likely to be a thunderstorm type one.
Based on the results of GWRC’s floodplain management investigations, the following design peak flood
discharges were assumed for the purposes of our hydraulic analyses (Table 3.4):
Waitohu Stream 217m3/s (2 hour duration 1% AEP rainstorm)
Greenwood sub-catchment 8.9m3/s (2 hour duration 5% AEP rainstorm)
4.3 Outline of Existing Situation
We have assumed for the purposes of our analyses that a 2 hour duration 1% AEP rain-fall (adjusted for
possible climate change to 2090) over the Waitohu Catchment in conjunction with a 2 hour duration 5% AEP
rainfall (adjusted for possible climate change to 2090) over the lower and middle sub-catchments induces a 1%
AEP flood incorporating climate change effects in the Waitohu Stream.

NZ Transport AgencyPeka Peka to Otaki Expressway
Scheme Assessment ReportDesign Flood Levels for Waterway Crossings
Status Issue 1 Page 22 June 2011Project Number 440PN, 5-C1814.00 20110919 PP2O Technical Report Design Flood
Levels_v3_final draft
Figure 4.11 therefore shows the extent of flood inundation resulting from a 1% AEP flood adjusted for climate
change for the current floodplain situation in the vicinity of the existing SH1 and proposed Expressway bridge
crossings of the Waitohu Stream (but without the Expressway in place). The extent of inundation is indicated
by the shading superimposed on the background of an aerial photograph. The inundation map incorporates
directional arrows to indicate the general direction of flow paths at the flood peak (note that these arrows are
indicative only rather than being calculated by a two-dimensional computational hydraulic model).
It is immediately apparent from this flood inundation map that the existing SH1 Bridge acts as a throttle on
flood flows and causes floodwaters to break out along the right (north) bank upstream of the bridge. These
floodwaters combine with surface runoff from the Greenwood sub-catchment to the north of the Waitohu
Stream to then flow across SH1 which currently is roughly at grade on natural ground. Floodwaters also break
out on both the left and right banks immediately upstream of the existing SH1 Bridge and outflank it.
This flood inundation pattern highlights the issue that the existing SH1 Bridge acts as restriction for flood
flows. However it should be noted that it is the intention of the PP2O Project to retain this existing bridge in
its present form without modification or replacement.
4.4 Outline of Proposed Situation
The proposed expressway bridge will cross the Waitohu Stream approximately 260m downstream and to the
west of the existing SH1 bridge crossing. As noted in the Scoping Report, the proposed expressway crossing
is located within a geomorphologic zone of instability characterised by lateral channel instability and sediment
deposition (GWRC, 2004a). GWRC have defined a fairly wide design alignment for the stream downstream of
the existing SH1 Bridge to reflect this instability zone. The Scoping Report for the PP2O Expressway
recommended a minimum 75m bridge span length to accommodate this instability zone and GWRC’s design
alignment for the stream.
This Scheme Assessment has assumed that this minimum span length could be provided by a bridge with
three spans of 25m each. This would allow the two central piers to be located on either side of the existing
main flow channel of the stream. No assumptions have been made about the form of the abutments for the
bridge crossing as flood levels for the expressway situation are very unlikely to be influenced by the abutment
geometry with such a large bridge span length.
The alignment of the proposed Expressway passes directly through the extensive flood inundation area to the
north of the Waitohu Stream Crossing caused by the combination of surface runoff sourced from the
Greenwood sub-catchment and right bank breakout flows upstream of the existing SH1 Bridge. This area lies
right at the northern end of the Peka Peka to North Otaki section of proposed Wellington Levin Expressway.
As the expressway will be constructed in stages with construction of the Peka Peka to North Otaki section likely
to precede the North Otaki to Levin section, two situations with the proposed expressway were considered:
the first with the approach embankment on the northern side of the Waitohu Stream Bridge Crossing
sloping down to the grade of the natural grade across the northern floodplain (the situation prior to
completion of the North Otaki to Levin section of the Expressway); and
the second with the approach embankment on the northern side of the Waitohu Stream Bridge elevated
above natural ground level and clear of the predicted peak flood level for the design 1% AEP flood (the
situation post completion of the North Otaki to Levin section of the Expressway).
1 Note that the layout of the expressway and interchange connections to the local road network shown in this figure and subsequent figures differs from the final recommended layout.
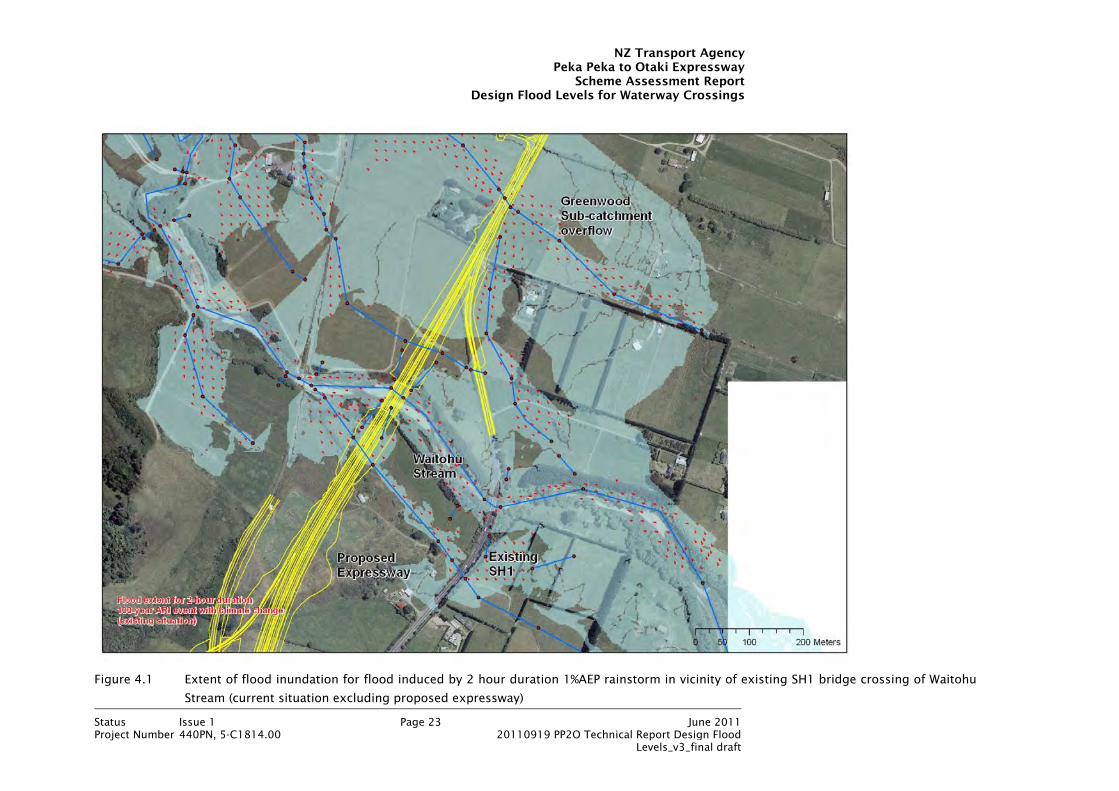
NZ Transport AgencyPeka Peka to Otaki Expressway
Scheme Assessment ReportDesign Flood Levels for Waterway Crossings
Status Issue 1 Page 23 June 2011Project Number 440PN, 5-C1814.00 20110919 PP2O Technical Report Design Flood
Levels_v3_final draft
Figure 4.1 Extent of flood inundation for flood induced by 2 hour duration 1%AEP rainstorm in vicinity of existing SH1 bridge crossing of Waitohu
Stream (current situation excluding proposed expressway)

NZ Transport AgencyPeka Peka to Otaki Expressway
Scheme Assessment ReportDesign Flood Levels for Waterway Crossings
Status Issue 1 Page 24 June 2011Project Number 440PN, 5-C1814.00 20110919 PP2O Technical Report Design Flood
Levels_v3_final draft
Figure 4.2 Topographic relief map of Waitohu Stream and Floodplain area crossed by proposed expressway with layout of MIKE11 computational
hydraulic model superimposed on it
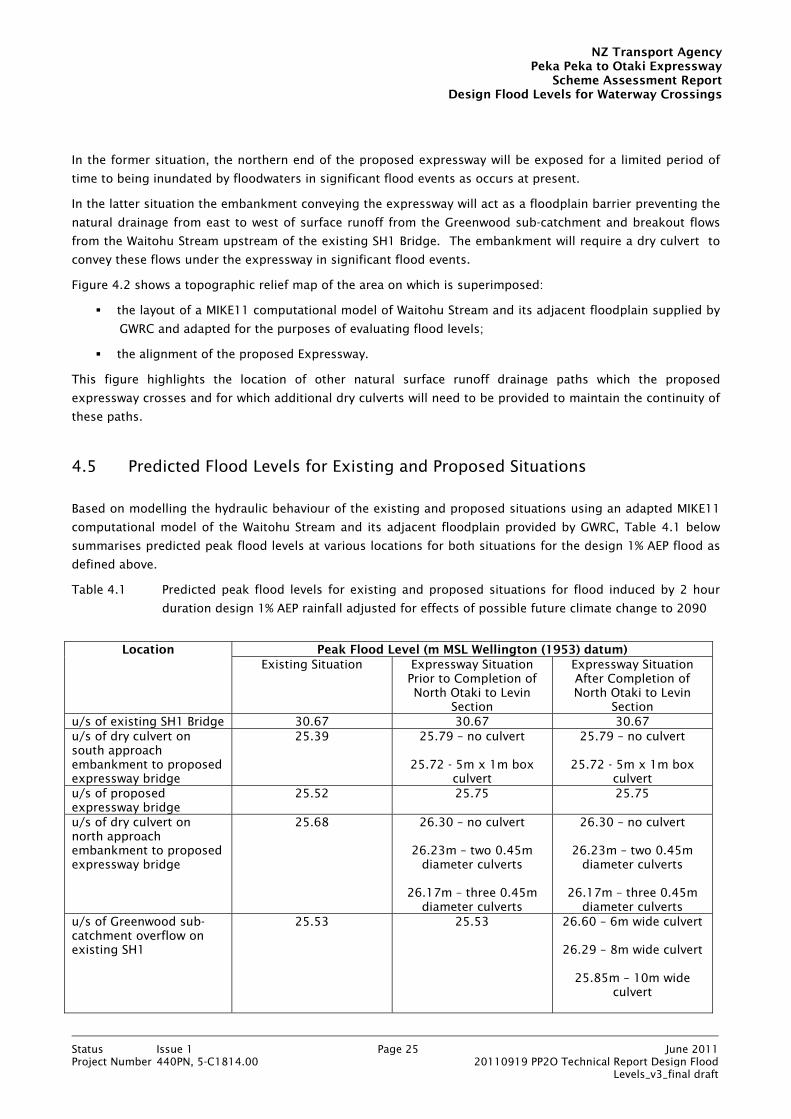
NZ Transport AgencyPeka Peka to Otaki Expressway
Scheme Assessment ReportDesign Flood Levels for Waterway Crossings
Status Issue 1 Page 25 June 2011Project Number 440PN, 5-C1814.00 20110919 PP2O Technical Report Design Flood
Levels_v3_final draft
In the former situation, the northern end of the proposed expressway will be exposed for a limited period of
time to being inundated by floodwaters in significant flood events as occurs at present.
In the latter situation the embankment conveying the expressway will act as a floodplain barrier preventing the
natural drainage from east to west of surface runoff from the Greenwood sub-catchment and breakout flows
from the Waitohu Stream upstream of the existing SH1 Bridge. The embankment will require a dry culvert to
convey these flows under the expressway in significant flood events.
Figure 4.2 shows a topographic relief map of the area on which is superimposed:
the layout of a MIKE11 computational model of Waitohu Stream and its adjacent floodplain supplied by
GWRC and adapted for the purposes of evaluating flood levels;
the alignment of the proposed Expressway.
This figure highlights the location of other natural surface runoff drainage paths which the proposed
expressway crosses and for which additional dry culverts will need to be provided to maintain the continuity of
these paths.
4.5 Predicted Flood Levels for Existing and Proposed Situations
Based on modelling the hydraulic behaviour of the existing and proposed situations using an adapted MIKE11
computational model of the Waitohu Stream and its adjacent floodplain provided by GWRC, Table 4.1 below
summarises predicted peak flood levels at various locations for both situations for the design 1% AEP flood as
defined above.
Table 4.1 Predicted peak flood levels for existing and proposed situations for flood induced by 2 hour
duration design 1% AEP rainfall adjusted for effects of possible future climate change to 2090
Location Peak Flood Level (m MSL Wellington (1953) datum)
Existing Situation Expressway Situation Prior to Completion of North Otaki to Levin
Section
Expressway Situation After Completion of North Otaki to Levin
Section u/s of existing SH1 Bridge 30.67 30.67 30.67 u/s of dry culvert on south approach embankment to proposed expressway bridge
25.39 25.79 – no culvert
25.72 - 5m x 1m box culvert
25.79 – no culvert
25.72 - 5m x 1m box culvert
u/s of proposed expressway bridge
25.52 25.75 25.75
u/s of dry culvert on north approach embankment to proposed expressway bridge
25.68 26.30 – no culvert
26.23m – two 0.45m diameter culverts
26.17m – three 0.45m
diameter culverts
26.30 – no culvert
26.23m – two 0.45m diameter culverts
26.17m – three 0.45m
diameter culverts u/s of Greenwood sub-catchment overflow on existing SH1
25.53 25.53 26.60 – 6m wide culvert
26.29 – 8m wide culvert
25.85m – 10m wide culvert

NZ Transport AgencyPeka Peka to Otaki Expressway
Scheme Assessment ReportDesign Flood Levels for Waterway Crossings
Status Issue 1 Page 26 June 2011Project Number 440PN, 5-C1814.00 20110919 PP2O Technical Report Design Flood
Levels_v3_final draft
The flood level predictions shown in Table 4.1 indicate that blocking the floodplain with a raised embankment
has the effect of increasing flood levels upstream slightly as would be expected. Providing dry culverts to
preserve natural drainage paths through the southern and northern approach embankments helps to reduce
flood levels down towards those of the existing situation. However there is a limit to how much these can be
reduced. Further optimisation work could be carried out to refine the assumed sizes and numbers of culverts
but the above flood level predictions are sufficient to establish parameters for road design. Local ground
levels in the vicinity of the dry culvert through the northern approach embankment are relatively high and
preclude lowering of flood levels much more unless the floodplain in the vicinity of the culvert entrance is
locally reshaped to provide flood storage.
Figure 4.3 shows a map similar to Figure 4.1 which illustrates the extent of flood inundation resulting from a
1% AEP flood adjusted for climate change for the final configuration of the proposed Expressway (with the
northern Otaki to Levin section completed) in the vicinity of the Waitohu Stream Crossing. The extent of flood
inundation is very similar to that shown in Figure 4.1. This suggests that the increased flood levels for the
proposed expressway situation probably have only a fairly local effect due to the steepness of the floodplain.
It is important to recognise though that the flood inundation map shown in Figure 4.3 (and also the one shown
in Figure 4.1) has been derived from flood level predictions obtained using a one-dimensional computational
hydraulic model. This requires predicted flood levels from discrete cross-section locations along the
prescribed flow paths in the model to be extrapolated laterally away from these flow paths in order to estimate
the likely extent of flood inundation. This approach is the same as that used by GWRC’s hydraulic modelling
consultant to produce flood inundation maps for the whole of the Waitohu Stream floodplain (GWRC, 2004b).
The estimated extent of flood inundation in Figure 4.3 (and also in Figure 4.1) is possibly less accurate than if
it had been obtained with the assistance of an equivalent two-dimensional computational hydraulic model.
However the extent of inundation shown is likely to be conservative.
The one-dimensional hydraulic modelling approach used is an entirely appropriate method for establishing
design flood levels (and hence road and bridge levels) for the proposed Expressway at a preliminary design
stage.
Table 4.2 summarises the assumed dimensions and levels of the dry culverts required to maintain natural
drainage paths through the proposed Expressway.
Table 4.2 Culvert types, dimensions and levels for proposed Expressway situation
Location Type Size (m) Invert Level (m MSL
Wellington)
Length (m)
Slope (%)
Road Level (m MSL
Wellington) u/s d/s
Southern approach embankment
box 5m x 1m 24.2 24.25 40 0.125 26.22
Northern approach embankment
circular 3 x 0.45m
diameter
25.5 24.6 40 2.25 26.67
Greenwood sub-catchment drainage – post Otaki to Levin construction
box 10m x 2.5m
23.6 23.4 25 0.8 26.35

NZ Transport AgencyPeka Peka to Otaki Expressway
Scheme Assessment ReportDesign Flood Levels for Waterway Crossings
Status Issue 1 Page 27 June 2011Project Number 440PN, 5-C1814.00 20110919 PP2O Technical Report Design Flood
Levels_v3_final draft
Figure 4.3 Extent of flood inundation for flood induced by 2 hour duration 1%AEP rainstorm in vicinity of existing SH1 and proposed expressway
bridge crossing of Waitohu Stream (future situation with proposed expressway in place)

NZ Transport AgencyPeka Peka to Otaki Expressway
Scheme Assessment ReportDesign Flood Levels for Waterway Crossings
Status Issue 1 Page 28 June 2011Project Number 440PN, 5-C1814.00 20110919 PP2O Technical Report Design Flood
Levels_v3_final draft
4.6 Effects of Proposed Expressway on Adjacent Properties
Figures 4.1 and 4.3 show that there are at least a couple of residential properties within the flood inundation
area upstream of the route of the proposed expressway, one property directly along the Greenwood sub-
catchment overland flow path and another property just to the south between the same overland flow path and
the flow path for flood breakout from the main stream Figures 4.4 and 4.5 show the predicted backwater
profiles for these flow paths (Greenwood and Plunket) for the both the existing and proposed situations for the
1% AEP flood adjusted for possible future climate change effects. The location of the two properties in
question is also shown approximately on Figures 4.4 and 4.5.
Inspection of the backwater profiles shown in Figures 4.4 and 4.5 indicates that, due to the steepness of the
floodplain, these properties are located sufficiently far upstream for the change in the backwater effect
induced by the dry culvert under the expressway embankment to be negligible compared to the existing
situation with peak flood levels, at worst, only marginally increased.
4.7 Sensitivity of Flood Levels at Expressway Crossing to Flood Magnitude
Table 4.3 compares peak flood levels for the proposed expressway situation for the 1% and 0.5% AEP floods
adjusted for the effects of possible future climate change to 2090.
Table 4.3 Predicted peak flood levels for proposed expressway crossing of Waitohu Stream and floodplain
(after completion of North Otaki to Levin Section) for different flood magnitudes adjusted for
effects of possible future climate change to 2090
Location Peak Flood Level (m MSL Wellington (1953) datum)
1% AEP Flood 0.5% AEP Flood u/s of existing SH1 Bridge 30.67 30.74 u/s of dry culvert on south approach embankment to proposed expressway bridge
25.72
25.78
u/s of proposed expressway bridge
25.75 25.81
u/s of dry culvert on north approach embankment to proposed expressway bridge
26.17
26.21
u/s of Greenwood sub-catchment overflow on existing SH1
25.85
26.22
Table 4.3 indicates that increasing the total inflow past the expressway by 25m3/s (i.e. from 217m3/s to
242m3/s – Table 3.4) typically increase peak flood levels upstream of each culvert by 0.04-0.07m. At the
Greenwood sub-catchment culvert however, the increase in upstream peak flood level is somewhat larger
although the increased backwater effect rapidly diminishes with distance upstream (Figures 4.4 and 4.5).

NZ Transport AgencyPeka Peka to Otaki Expressway
Scheme Assessment ReportDesign Flood Levels for Waterway Crossings
Status Issue 1 Page 29 June 2011Project Number 440PN, 5-C1814.00 20110919 PP2O Technical Report Design Flood
Levels_v3_final draft
20
21
22
23
24
25
26
27
28
29
30
31
32
33
1000 1100 1200 1300 1400 1500 1600
Level (m)
Model Chainage (m)
Invert Level
Q100 Existing Situation
Q100 Proposed Expressway
Q200 Existing Situation
Q200 Proposed Expressway
Approx. chainage location of 82 SH1, Manakau‐Otaki
Approx. chainage location of 84 SH1, Manahau‐Otaki
Figure 4.4 Comparison of backwater profiles upstream of Greenwood overflow culvert for 1% AEP flood
adjusted for climate change effects to 2090 along Greenwood branch overland flow path
24.0
25.0
26.0
27.0
28.0
29.0
1140 1160 1180 1200 1220 1240 1260 1280 1300 1320 1340 1360 1380 1400 1420
Level (m)
Chainage
Invert Level
Q100 Existing Situation
Q100 Proposed Situation
Q200 Existing Situation
Q200 Proposed Situation
Approx. chainage location of 82 SH1, Manakau‐Otaki
Figure 4.5 Comparison of backwater profiles upstream of Greenwood overflow culvert for 1% AEP flood
adjusted for climate change effects to 2090 along Plunket branch overland flow path

NZ Transport AgencyPeka Peka to Otaki Expressway
Scheme Assessment ReportDesign Flood Levels for Waterway Crossings
Status Issue 1 Page 30 June 2011Project Number 440PN, 5-C1814.00 20110919 PP2O Technical Report Design Flood
Levels_v3_final draft
4.8 Effects of Bridge Piers on Flood Levels in Waitohu Stream
The two parallel bridges crossing the Waitohu Stream as part of the proposed expressway will have three spans
of 25m. The bridges will have spill-through type abutments while the two piers will be rectangular-shaped with
a tapered nose and tail. The piers will measure up to 3.1m long and be about 1.75m wide.
Table 4.4 summarises the estimated pier head losses for floods of varying magnitudes based on this bridge
waterway and pier geometry. The pier head losses have been estimated using two standard approaches –
Yarnell’s method and the rational method (Montes, 1998).
Table 4.4 Estimated pier head losses for proposed expressway bridge crossing of Waitohu Stream (losses
for one bridge only)
Flood Peak Discharge
at Bridge (m3/s)
Peak Flood Level
at Bridge (m)
Pier Head Loss (m)
Yarnell’s Method Rational Method
1% AEP flood adjusted for
climate change to 2090
131 25.66 0.028 0.016
0.5% AEP flood adjusted for
climate change to 2090
138 25.76 0.035 0.016
The estimated values in Table 4.4 indicate that pier head losses will be less than 0.04m for one bridge up to
the 0.5% AEP flood adjusted for possible climate change effects. The total pier head loss for two parallel
bridges is approximately the sum of the pier head losses for the two individual bridges. In this case the total
pier head loss is likely to be less than 0.08m. This assumes that the existing SH1 bridge remains unmodified2
and limits the flow past it in a significant flood (by causing flood breakout across country into the Greenwood
sub-catchment).
2 This assumption is based on the brief for the PP2O Project which excludes any remedial treatment of the existing SH1 bridge.
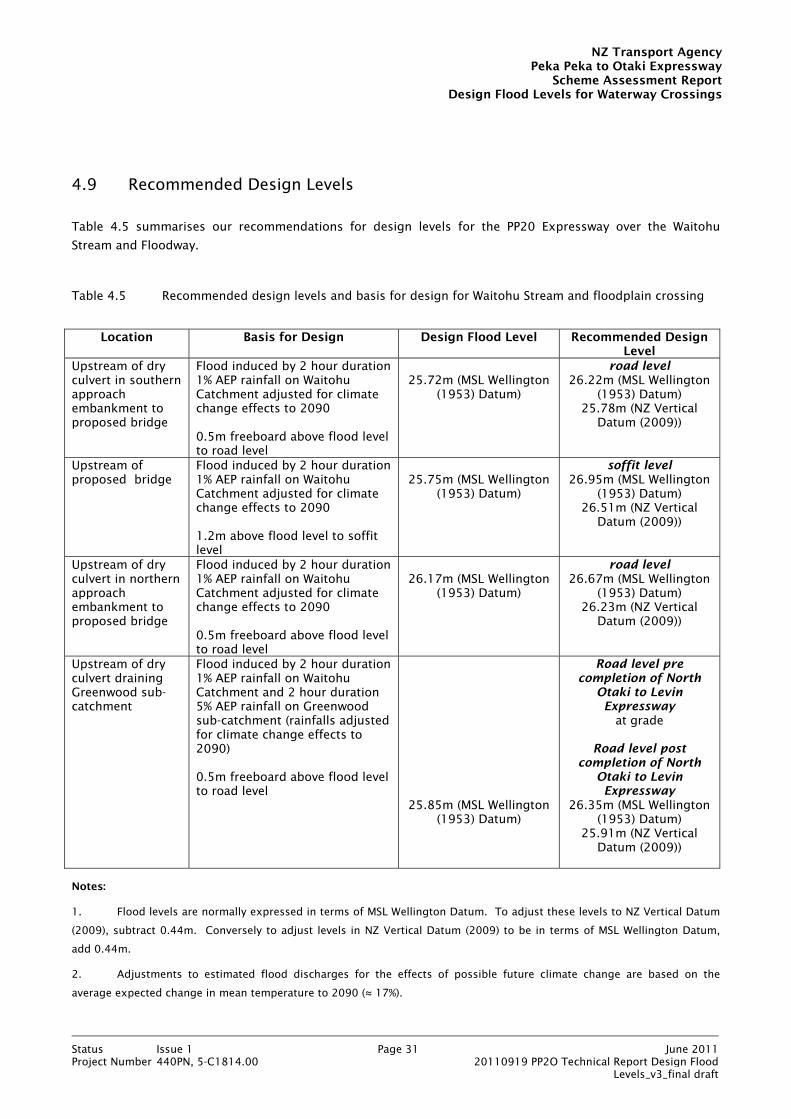
NZ Transport AgencyPeka Peka to Otaki Expressway
Scheme Assessment ReportDesign Flood Levels for Waterway Crossings
Status Issue 1 Page 31 June 2011Project Number 440PN, 5-C1814.00 20110919 PP2O Technical Report Design Flood
Levels_v3_final draft
4.9 Recommended Design Levels
Table 4.5 summarises our recommendations for design levels for the PP20 Expressway over the Waitohu
Stream and Floodway.
Table 4.5 Recommended design levels and basis for design for Waitohu Stream and floodplain crossing
Location Basis for Design Design Flood Level Recommended Design
Level Upstream of dry culvert in southern approach embankment to proposed bridge
Flood induced by 2 hour duration 1% AEP rainfall on Waitohu Catchment adjusted for climate change effects to 2090 0.5m freeboard above flood level to road level
25.72m (MSL Wellington
(1953) Datum)
road level 26.22m (MSL Wellington
(1953) Datum) 25.78m (NZ Vertical
Datum (2009))
Upstream of proposed bridge
Flood induced by 2 hour duration 1% AEP rainfall on Waitohu Catchment adjusted for climate change effects to 2090 1.2m above flood level to soffit level
25.75m (MSL Wellington
(1953) Datum)
soffit level 26.95m (MSL Wellington
(1953) Datum) 26.51m (NZ Vertical
Datum (2009))
Upstream of dry culvert in northern approach embankment to proposed bridge
Flood induced by 2 hour duration 1% AEP rainfall on Waitohu Catchment adjusted for climate change effects to 2090 0.5m freeboard above flood level to road level
26.17m (MSL Wellington
(1953) Datum)
road level 26.67m (MSL Wellington
(1953) Datum) 26.23m (NZ Vertical
Datum (2009))
Upstream of dry culvert draining Greenwood sub-catchment
Flood induced by 2 hour duration 1% AEP rainfall on Waitohu Catchment and 2 hour duration 5% AEP rainfall on Greenwood sub-catchment (rainfalls adjusted for climate change effects to 2090) 0.5m freeboard above flood level to road level
25.85m (MSL Wellington (1953) Datum)
Road level pre completion of North
Otaki to Levin Expressway
at grade
Road level post completion of North
Otaki to Levin Expressway
26.35m (MSL Wellington (1953) Datum)
25.91m (NZ Vertical Datum (2009))
Notes:
1. Flood levels are normally expressed in terms of MSL Wellington Datum. To adjust these levels to NZ Vertical Datum
(2009), subtract 0.44m. Conversely to adjust levels in NZ Vertical Datum (2009) to be in terms of MSL Wellington Datum,
add 0.44m.
2. Adjustments to estimated flood discharges for the effects of possible future climate change are based on the
average expected change in mean temperature to 2090 (≈ 17%).

NZ Transport AgencyPeka Peka to Otaki Expressway
Scheme Assessment ReportDesign Flood Levels for Waterway Crossings
Status Issue 1 Page 32 June 2011Project Number 440PN, 5-C1814.00 20110919 PP2O Technical Report Design Flood
Levels_v3_final draft
3. A minimum freeboard allowance of 1.2m is recommended to be applied to the design flood level upstream of the
bridge for the proposed Expressway to allow for the risk of possible future stream bed aggradation. This is in accordance
with the Transit New Zealand Bridge Manual (TNZ, 2003).
4. A minimum freeboard allowance of 0.5m is recommended to be applied to the design flood level upstream of each
dry culvert for the proposed Expressway. This is in accordance with the Transit New Zealand Bridge Manual (TNZ, 2003).

NZ Transport AgencyPeka Peka to Otaki Expressway
Scheme Assessment ReportDesign Flood Levels for Waterway Crossings
Status Issue 1 Page 33 June 2011Project Number 440PN, 5-C1814.00 20110919 PP2O Technical Report Design Flood
Levels_v3_final draft
5. Mangapouri Stream Design Flood Levels
5.1 Introduction
This section sets out the recommendations for design levels for the PP20 Expressway over the Mangapouri
Stream.
5.2 Outline of Existing Situation
The area upstream of the existing County Road culvert acts as a flood detention area. In a significant flood
event, water will start to pond in the area upstream before starting to spill over the road to the north of the
culvert, filling the area between the North Island Main Trunk (NIMT) railway line and County Road (Figure 5.13).
The railway embankment acts as a second and higher "dam" to pond upstream floodwaters. The County Road
culvert and the railway culvert in combination throttle flood flows to limit downstream flood inundation
through Otaki. This interpretation differs from the prevailing view of GWRC and KCDC that the existing NIMT
railway line culvert acts as the primary throttle for flood flows in the Mangapouri Stream. The area between
the railway embankment and the existing State Highway 1 (SH1) acts as a third detention pond for floodwaters
with the outflow controlled by the discharge characteristics of the SH1 culvert4 and road overflow.
In significant flood situations then, the culvert and stream system in the existing situation in the SH1 / County
Road / Rahui Road triangle behaves hydraulically as a system of three detention ponds in series.
5.3 Design Flood Magnitude
Flood estimates for the existing NIMT railway crossing of the Mangapouri Stream were drawn from Table 3.11
assuming the GEV frequency distribution is the distribution that best fits the annual flood maxima series.
The design flood for this stream crossing was selected as the 1% AEP flood adjusted for the effects of possible
future climate change to 2090. This has an estimated value of 13.5m3/s.
5.4 Predicted Flood Levels for Existing Situation
Based on modelling the hydraulic performance of the existing situation, Table 5.1 below summarises the
predicted peak flood levels and discharges for floods of varying annual exceedance probabilities.
3 Note that the layout of the expressway and interchange connections to the local road network shown in this figure and subsequent figures differs from the final recommended layout. 4 The discharge characteristics of the State Highway 1 culvert are influenced by tailwater level control from the downstream channel of the Mangapouri Stream.

NZ Transport AgencyPeka Peka to Otaki Expressway
Scheme Assessment ReportDesign Flood Levels for Waterway Crossings
Status Issue 1 Page 34 June 2011Project Number 440PN, 5-C1814.00 20110919 PP2O Technical Report Design Flood
Levels_v3_final draft
Figure 5.1 Existing culvert system along Mangapouri Stream in State Highway 1 / County Rd/ Rahui Rd triangle with footprint of proposed PP2O
expressway and relocated NIMT railway line overlaid

NZ Transport AgencyPeka Peka to Otaki Expressway
Scheme Assessment ReportDesign Flood Levels for Waterway Crossings
Status Issue 1 Page 35 June 2011Project Number 440PN, 5-C1814.00 20110919 PP2O Technical Report Design Flood
Levels_v3_final draft
Figure 5.2 Inundation map for existing situation for 1% AEP flood adjusted for possible future climate change effects to 2090

NZ Transport AgencyPeka Peka to Otaki Expressway
Scheme Assessment ReportDesign Flood Levels for Waterway Crossings
Status Issue 1 Page 36 June 2011Project Number 440PN, 5-C1814.00 20110919 PP2O Technical Report Design Flood
Levels_v3_final draft
Table 5.1 Predicted peak flood levels and discharges for existing situation in Mangpouri Stream
Case Peak Flood Level (m MSL Wellington datum) Peak Flood Discharge (m3/s)
u/s County Rd culvert
u/s railway line culvert
u/s SH1 culvert
upstream flow downstream flow
10% AEP flood for current climate
14.38 14.02 12.78 7.4 3.74
5% AEP flood for current climate
14.44 14.42 13.05 8.6 4.34
1% AEP flood for current climate
14.70 14.68 13.30 11.5 4.70
1% AEP flood for climate change to 2090
14.85 14.85 13.45 13.5 4.91
0.5% AEP flood for climate change to 2090
14.96 14.96 13.53 14.9 5.06
0.2% AEP flood for climate change to 2090
15.13 15.13 13.63 16.7 5.26
Note that the levels in Table 5.1 are expressed in terms of the Mean Sea Level Wellington (1953) datum. To
convert these levels to the NZ Vertical Datum, 0.44m needs to be subtracted from them.
Figure 5.2 shows the extent of inundation upstream of the existing NIMT railway line embankment for the 1%
AEP flood adjusted for the effects of possible future climate change to 2090.
5.5 Basis of Design for Proposed Expressway Embankment
It can be seen from Table 5.1 that flood levels upstream of the existing NIMT railway line and County Road are
not particularly sensitive to increases in flood magnitude. There are only relatively small increases in upstream
flood level for relatively large increases in peak flood flow.
On this basis, it is suggested that the proposed expressway embankment should be designed for the “1%
annual exceedance probability (AEP) flood plus climate change” case with a small freeboard allowance of about
300mm. Rahui Road to the east of the County Road intersection is relatively low in level and acts as a safety
valve for ponded floodwaters above a level of about RL 14.7m (MSL Wellington (1953)) with excess floodwater
volumes breaking out to the south into the adjacent Racecourse Catchment.
5.6 Outline of Proposed Situation with Expressway
The culvert through the proposed expressway must emulate the current throttling function of the County Road
and railway line culverts with the expressway embankment acting as a "dam" to hold the ponded floodwaters
so as to ensure that downstream flood hazard is not increased. County Road might also be able to be
modified to act as a “dam” to store floodwaters as an alternative to the Expressway embankment but the latter
is preferred as it minimises the extent of modification required to County Road.
The NIMT railway line is to be relocated parallel with and to the west of the proposed expressway and will also
require a culvert to convey the Mangapouri Stream. It is envisaged that there will be some form of drain
between the Expressway and the railway line embankments to collect storm runoff from the surfaces of both
facilities. This has been accounted for in this assessment. The existing railway embankment will remain but
the culvert will be removed and a sufficiently large gap left so that the passage of flood flows is not impeded.

NZ Transport AgencyPeka Peka to Otaki Expressway
Scheme Assessment ReportDesign Flood Levels for Waterway Crossings
Status Issue 1 Page 37 June 2011Project Number 440PN, 5-C1814.00 20110919 PP2O Technical Report Design Flood
Levels_v3_final draft
The culvert and stream system in the SH1 / County Road / Rahui Road triangle will thus be modified in the
proposed situation to behave as a series of four interconnected detention ponds under flood conditions,
similar to the current situation.
5.7 Expressway and Railway Line Culvert Dimensions
From a stream geomorphological perspective, it is appropriate to retain the existing alignment of the
Mangapouri Stream through the SH1 / County Road / Rahui Road triangle. This will mean that both the
proposed expressway and the relocated railway line will cross the stream at an oblique angle, making the
culverts slightly longer than if they crossed perpendicular to the stream. Approximate lengths of 40m and
20m are therefore required for the Expressway and railway line culverts respectively.
The culvert invert levels are stepped to reflect the existing average streambed slope in the upper reaches of
the stream. The culvert slopes are designed to be not so steep that they inhibit fish passage under normal low
flow conditions. However spoilers may still need to be fitted to the invert of the culverts to ensure flow
velocities are low enough to facilitate fish passage under such flow conditions. This will be addressed at the
detailed design stage.
The culverts have been sized so that the predicted flood levels upstream of the proposed Expressway
embankment approximate those upstream of the railway line and County Road culverts in the existing
situation given in Table 5.1 above. This indicates that a 1.35m nominal (1.372m actual) internal diameter
concrete pipe is required for both culverts. A box culvert section of 1.5m high by 1.5m wide was found to be
too large while a 1.0m by 1.0m box culvert section would have been too small.
The following table (Table 5.2) summarises culvert types, dimensions and levels for the modified culvert and
stream system in the SH1 / County Road / Rahui Road triangle.
Table 5.2 Culvert types, dimensions and levels for proposed Expressway situation in Mangapouri Stream
Location Type Diameter
(m) Invert Level (m MSL
Wellington)
Length (m)
Slope (%)
Road Level (m MSL
Wellington) u/s d/s
County Rd 1 circular 1.2 11.97 12.01 19.3 negative 14.39 2 Proposed Expressway
circular 1.372 11.25 11.20 40 0.125 to be defined
Relocated NIMT railway 3
circular 1.372 11.15 11.125 20 0.125 to be defined
Existing SH1 1 twin circular 0.9 11.06 10.96 20 0.5 11.06 1 Details for these culverts obtained from Wellington Regional Council February 1998 report “Otaki Floodplain Management Plan, Mangapouri Stream Upgrade, Hydraulic Modelling Report”, Report No. WRC/RI-T-97/48. 2 Road levels further north from this culvert along County Road are lower than this level. 3 The existing NIMT railway line culvert is a custom-built arch type one measuring approximately 0.95m by 1.2m.
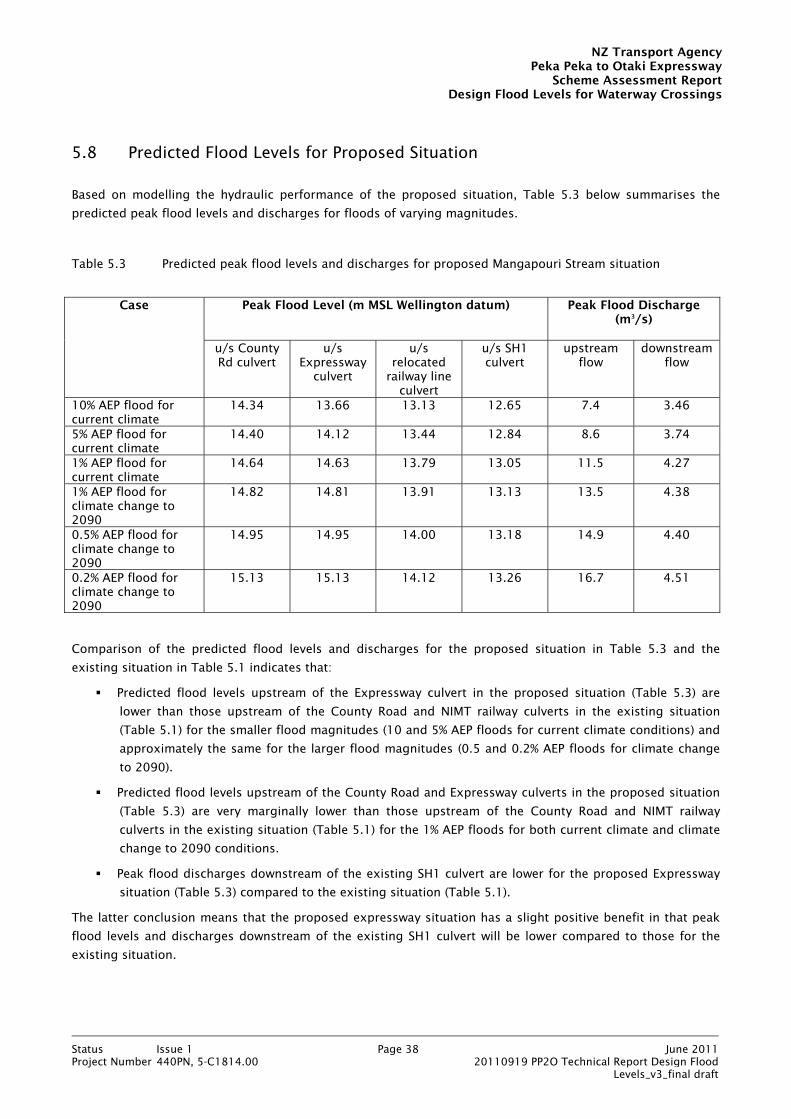
NZ Transport AgencyPeka Peka to Otaki Expressway
Scheme Assessment ReportDesign Flood Levels for Waterway Crossings
Status Issue 1 Page 38 June 2011Project Number 440PN, 5-C1814.00 20110919 PP2O Technical Report Design Flood
Levels_v3_final draft
5.8 Predicted Flood Levels for Proposed Situation
Based on modelling the hydraulic performance of the proposed situation, Table 5.3 below summarises the
predicted peak flood levels and discharges for floods of varying magnitudes.
Table 5.3 Predicted peak flood levels and discharges for proposed Mangapouri Stream situation
Case Peak Flood Level (m MSL Wellington datum)
Peak Flood Discharge
(m3/s)
u/s County Rd culvert
u/s Expressway
culvert
u/s relocated
railway line culvert
u/s SH1 culvert
upstream flow
downstream flow
10% AEP flood for current climate
14.34 13.66 13.13 12.65 7.4 3.46
5% AEP flood for current climate
14.40 14.12 13.44 12.84 8.6 3.74
1% AEP flood for current climate
14.64 14.63 13.79 13.05 11.5 4.27
1% AEP flood for climate change to 2090
14.82 14.81 13.91 13.13 13.5 4.38
0.5% AEP flood for climate change to 2090
14.95 14.95 14.00 13.18 14.9 4.40
0.2% AEP flood for climate change to 2090
15.13 15.13 14.12 13.26 16.7 4.51
Comparison of the predicted flood levels and discharges for the proposed situation in Table 5.3 and the
existing situation in Table 5.1 indicates that:
Predicted flood levels upstream of the Expressway culvert in the proposed situation (Table 5.3) are
lower than those upstream of the County Road and NIMT railway culverts in the existing situation
(Table 5.1) for the smaller flood magnitudes (10 and 5% AEP floods for current climate conditions) and
approximately the same for the larger flood magnitudes (0.5 and 0.2% AEP floods for climate change
to 2090).
Predicted flood levels upstream of the County Road and Expressway culverts in the proposed situation
(Table 5.3) are very marginally lower than those upstream of the County Road and NIMT railway
culverts in the existing situation (Table 5.1) for the 1% AEP floods for both current climate and climate
change to 2090 conditions.
Peak flood discharges downstream of the existing SH1 culvert are lower for the proposed Expressway
situation (Table 5.3) compared to the existing situation (Table 5.1).
The latter conclusion means that the proposed expressway situation has a slight positive benefit in that peak
flood levels and discharges downstream of the existing SH1 culvert will be lower compared to those for the
existing situation.

NZ Transport AgencyPeka Peka to Otaki Expressway
Scheme Assessment ReportDesign Flood Levels for Waterway Crossings
Status Issue 1 Page 39 June 2011Project Number 440PN, 5-C1814.00 20110919 PP2O Technical Report Design Flood
Levels_v3_final draft
Figure 5.3 Inundation map for proposed expressway situation for 1% AEP flood adjusted for possible future climate change effects to 2090

NZ Transport AgencyPeka Peka to Otaki Expressway
Scheme Assessment ReportDesign Flood Levels for Waterway Crossings
Status Issue 1 Page 40 June 2011Project Number 440PN, 5-C1814.00 20110919 PP2O Technical Report Design Flood
Levels_v3_final draft
With respect to the first and second conclusions, the reason for lower flood levels upstream of the Expressway
culvert in the proposed situation is due to the effect of slightly increased flood storage achieved with the
location of the Expressway road embankment and relocated railway embankment at least 50m downstream of
the existing railway embankment (the assumption has been made here that, post construction of the
expressway, a sufficiently wide hole will be formed in the existing railway embankment in the vicinity of the
existing culvert to allow the area upstream of the existing embankment and the area between the existing
embankment and the new Expressway embankment to function as a combined and interconnected flood
storage area).
Figure 5.3 shows the extent of inundation in the proposed situation for the 1% AEP flood adjusted for the
effects of possible future climate change to 2090. The extent of inundation upstream of the proposed
expressway is very similar to the extent of inundation upstream of the NIMT railway embankment in the
existing situation.
5.9 Storm Runoff Diversions from Neighbouring Catchments
The 0.37km2 Te Manuao Catchment is an urban one covering the north-east part of Otaki Township
sandwiched between the Waitohu Catchment to the north and the Mangapouri Catchment to the south. The
piped drainage system for the catchment drains to a large storage pond on the western side of SH1 which in
turn drains via infiltration into the groundwater system and an outlet pipe to the Mangapouri Stream. This
system provides very effective attenuation of storm runoff from the catchment.
The storage pond lies within the footprint of the proposed expressway so will no longer exist in the future
situation. Storm runoff from the Te Manuao Catchment will therefore have to be conveyed by pipe downhill to
the detention pond area upstream of the expressway embankment over the Mangapouri Stream.
SKM have modelled the storm runoff from the Te Manuao Catchment for KCDC and have advised the estimated
peak runoff for a 1% AEP rainstorm to be ~ 1.4m3/s (B Fountain, SKM, pers. comm.). This is based on a 24
hour nested storm rainfall / runoff modelling approach which differs from the regional flood estimation
method applied to derive flood estimates for the Mangapouri Catchment in Section 3.5 of this report. However
the peak runoff predicted by the SKM will be an indicative estimate for the 1% AEP flood for the Te Manuao
Catchment.
From the predicted flood level and discharge values in Table 5.3, the additional diversion flow from the Te
Manuao Catchment into the detention pond area upstream of the expressway embankment crossing the
Mangapouri Stream would be likely to increase the peak flood level for the 1% AEP flood by up to ~ 0.13m. The
design of the expressway crossing of the stream can safely accommodate this additional stormwater inflow
volume with modest changes in detailing.
Storm runoff from the 0.45km2 Racecourse Catchment, the 0.116km2 Te Roto Catchment and the 0.013km2
Andrews Catchment to the south of the Mangapouri Catchment appears to drain primarily by ponding and
ground infiltration with the existing outlet under SH1 for the former catchment totally blocked by vegetation (B
Fountain, SKM, pers. comm.). However, for the proposed expressway situation, a better solution may be to
direct surface runoff from these small semi-rural catchments southwards towards a proposed culvert under the
expressway embankment near the Chrystall’s Bend extended stopbank (refer to Section 6.9). This issue is
appropriate to deal with at the detailed design stage.
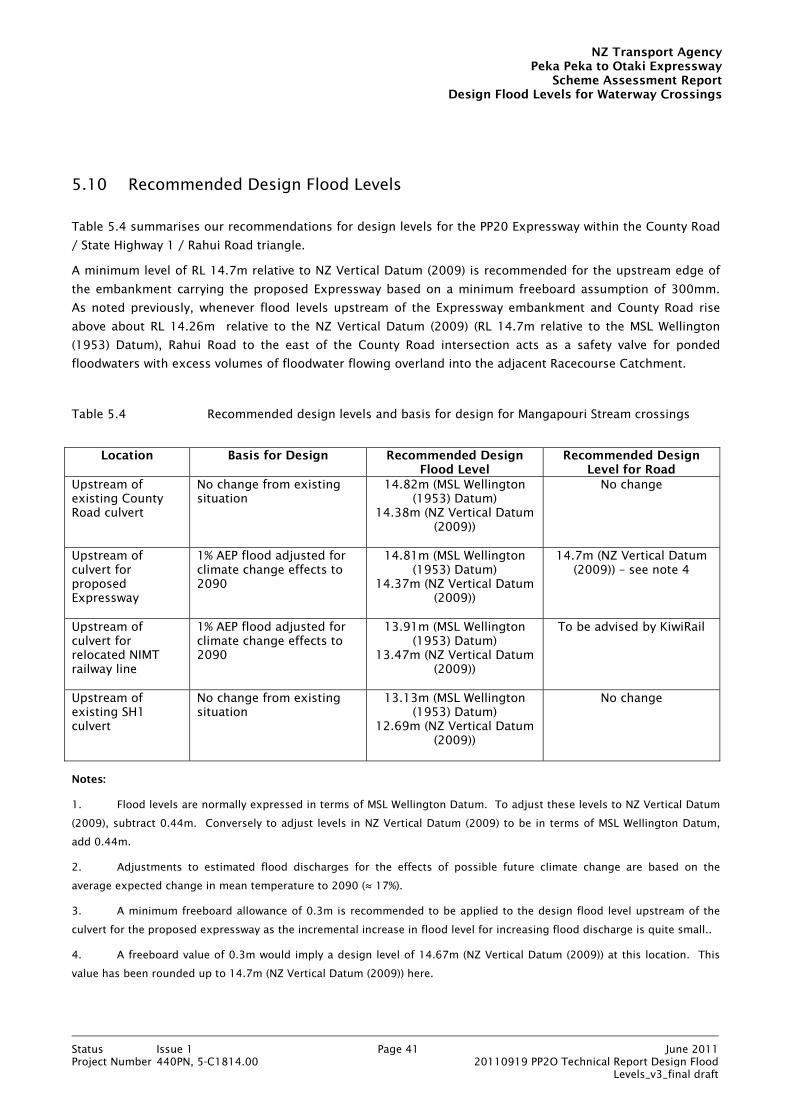
NZ Transport AgencyPeka Peka to Otaki Expressway
Scheme Assessment ReportDesign Flood Levels for Waterway Crossings
Status Issue 1 Page 41 June 2011Project Number 440PN, 5-C1814.00 20110919 PP2O Technical Report Design Flood
Levels_v3_final draft
5.10 Recommended Design Flood Levels
Table 5.4 summarises our recommendations for design levels for the PP20 Expressway within the County Road
/ State Highway 1 / Rahui Road triangle.
A minimum level of RL 14.7m relative to NZ Vertical Datum (2009) is recommended for the upstream edge of
the embankment carrying the proposed Expressway based on a minimum freeboard assumption of 300mm.
As noted previously, whenever flood levels upstream of the Expressway embankment and County Road rise
above about RL 14.26m relative to the NZ Vertical Datum (2009) (RL 14.7m relative to the MSL Wellington
(1953) Datum), Rahui Road to the east of the County Road intersection acts as a safety valve for ponded
floodwaters with excess volumes of floodwater flowing overland into the adjacent Racecourse Catchment.
Table 5.4 Recommended design levels and basis for design for Mangapouri Stream crossings
Location Basis for Design Recommended Design
Flood Level Recommended Design
Level for Road Upstream of existing County Road culvert
No change from existing situation
14.82m (MSL Wellington (1953) Datum)
14.38m (NZ Vertical Datum (2009))
No change
Upstream of culvert for proposed Expressway
1% AEP flood adjusted for climate change effects to 2090
14.81m (MSL Wellington (1953) Datum)
14.37m (NZ Vertical Datum (2009))
14.7m (NZ Vertical Datum (2009)) – see note 4
Upstream of culvert for relocated NIMT railway line
1% AEP flood adjusted for climate change effects to 2090
13.91m (MSL Wellington (1953) Datum)
13.47m (NZ Vertical Datum (2009))
To be advised by KiwiRail
Upstream of existing SH1 culvert
No change from existing situation
13.13m (MSL Wellington (1953) Datum)
12.69m (NZ Vertical Datum (2009))
No change
Notes:
1. Flood levels are normally expressed in terms of MSL Wellington Datum. To adjust these levels to NZ Vertical Datum
(2009), subtract 0.44m. Conversely to adjust levels in NZ Vertical Datum (2009) to be in terms of MSL Wellington Datum,
add 0.44m.
2. Adjustments to estimated flood discharges for the effects of possible future climate change are based on the
average expected change in mean temperature to 2090 (≈ 17%).
3. A minimum freeboard allowance of 0.3m is recommended to be applied to the design flood level upstream of the
culvert for the proposed expressway as the incremental increase in flood level for increasing flood discharge is quite small..
4. A freeboard value of 0.3m would imply a design level of 14.67m (NZ Vertical Datum (2009)) at this location. This
value has been rounded up to 14.7m (NZ Vertical Datum (2009)) here.

NZ Transport AgencyPeka Peka to Otaki Expressway
Scheme Assessment ReportDesign Flood Levels for Waterway Crossings
Status Issue 1 Page 42 June 2011Project Number 440PN, 5-C1814.00 20110919 PP2O Technical Report Design Flood
Levels_v3_final draft
6. Otaki River and Floodplain Design Flood Levels
6.1 Introduction
This section sets out the recommendations for design levels for the PP20 Expressway for the Otaki River and
Floodplain.
6.2 Outline of Existing Situation
The existing State Highway 1 (SH1) crossing of the Otaki River lies to the south of Otaki Township which is
located on the floodplain to the north of the river (Figure 6.1). The bridge crossing is located approximately
60m downstream of the NIMT railway bridge across the river.
The Otaki River incorporates a stopbank system along the true right (northern) bank which provides a 1% AEP
standard of flood protection to the township of Otaki. This stopbank (known as Chrystall’s extended
stopbank) starts from some high ground about 2.5km upstream of the existing SH1 Bridge and then ends
downstream at the NIMT railway line. It partially encloses the basin occupied by Stresscrete’s precast concrete
factory immediately upstream of the railway line so that the factory site lies between the stopbank and the
river. The railway embankment between the end of the stopbank and the river has been strengthened to form
part of the primary flood defence system for Otaki Township.
The Mangapouri Stream flows along the northern edge of the Otaki River floodplain adjacent to high ground.
6.3 Design Flood Considerations
Table 3.1 summarises flood estimates for both current climate conditions and for the effects of possible future
climate change to 2090 for the Otaki River.
In view of the very significant nature of the Otaki River, the design flood magnitude for the expressway
crossing of the river was selected as the 0.2% annual exceedance probability (AEP) flood based on current
climate conditions. This closely approximates the 1% AEP flood adjusted for possible future climate change
effects to 2090.
The 2,130m3/s magnitude of the 0.2% AEP flood is based on an estimate used in recent computational
hydraulic modelling investigations undertaken by GWRC (2007) for the design of the Chrystall’s extended
stopbank along the right (north) bank of the Otaki River. The stopbank was actually designed for the 1% AEP
flood of 1,810m3/s based on current climate conditions (the freeboard on the stopbank for this flood is about
0.5m). However GWRC (2007) also investigated the effect of residual flood breakout across the floodplain from
upstream of the extended stopbank.
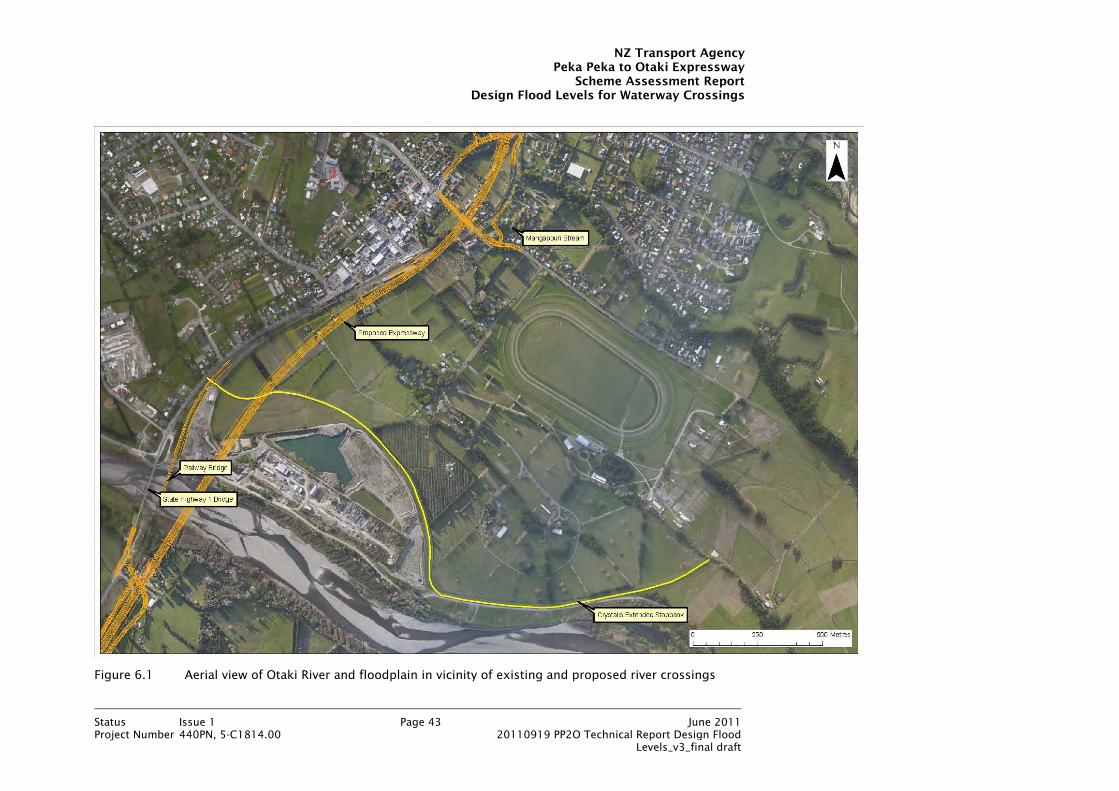
NZ Transport AgencyPeka Peka to Otaki Expressway
Scheme Assessment ReportDesign Flood Levels for Waterway Crossings
Status Issue 1 Page 43 June 2011Project Number 440PN, 5-C1814.00 20110919 PP2O Technical Report Design Flood
Levels_v3_final draft
Figure 6.1 Aerial view of Otaki River and floodplain in vicinity of existing and proposed river crossings

NZ Transport AgencyPeka Peka to Otaki Expressway
Scheme Assessment ReportDesign Flood Levels for Waterway Crossings
Status Issue 1 Page 44 June 2011Project Number 440PN, 5-C1814.00 20110919 PP2O Technical Report Design Flood
Levels_v3_final draft
Figure 6.2 Composite GWRC / KCDC flood hazard map for existing situation on Otaki River and floodplain

NZ Transport AgencyPeka Peka to Otaki Expressway
Scheme Assessment ReportDesign Flood Levels for Waterway Crossings
Status Issue 1 Page 45 June 2011Project Number 440PN, 5-C1814.00 20110919 PP2O Technical Report Design Flood
Levels_v3_final draft
While the 1% AEP flood of 1,810m3/s based on current climate conditions will not overtop the Chrystall’s
extended stopbank (the freeboard is estimated to be ≈ 0.5m), the calibrated MIKE11 / MIKE21 model
developed by GWRC indicates that a 0.2% AEP flood (equivalent to a 1% AEP flood adjusted for possible future
climate change effects to 2090) would overtop the extended stopbank by up to 0.4m. The stopbank
overtopping behaviour will be modified slightly by the northern approach embankment to the proposed
Expressway Bridge as discussed below.
Figure 6.2 shows the extent of flood inundation of the Otaki River floodplain from a combined GWRC / KCDC
flood hazard map - this is a composite hazard map covering flood hazards from all potential sources including
stopbank overflow from the river and urban stormwater overflow. The floodplain areas shaded in pink
represent residual overflow from the section of stopbank upstream of the extended Chrystall’s Bend stopbank
around the perimeter of the concrete factory yard. Ponding of stopbank-overtopping sourced floodwaters
occurs upstream of the existing NIMT railway line (shown by the dark blue and light blue areas upstream of the
railway line in Figure 6.2) before the overflow from this ponding disperses via various overland flow paths
through and around Otaki Township (shown by the pink areas downstream of SH1 and the railway line).
6.4 Outline of Proposed Situation
The proposed expressway bridge crossing the Otaki River will be located approximately 120m upstream of the
NIMT Railway Bridge (Figure 6.1). The crossing will be comprised of two parallel bridges, one for each traffic
direction. Each bridge will have a very similar overall length to the railway bridge so that it does not act as a
constriction to flood flows in the main river. However the piers will be much more widely spaced (up to 30m
apart) than the piers on the railway bridge so that pier head losses will be much lower. Each pier will be
rectangular-shaped (measuring up to 3.1m long and 1.5m wide) with a tapered nose and tail (the foundation
will consist of a footing supported by two cylindrical columns).
The northern approach embankment to the expressway bridge will bisect the basin occupied by Stresscrete’s
precast concrete factory. The embankment will be higher than the Chrystall’s extended stopbank so as not to
compromise the existing standard of flood protection provided to Otaki Township. The embankment will
therefore act as a partial dam under flood conditions for any floodwaters entering the basin enclosed by the
stopbank. This is described further below.
As noted before, the existing Chrystall’s extended stopbank has been designed for a 1% AEP flood with 0.5m
freeboard based on current climate conditions. Although GWRC have designed the stopbank to be raised in
the future to maintain the original design standard in the face of increasing flood magnitudes due to climate
change effects, there is no guarantee that such upgrading will be undertaken in the future. The effects of the
design 1% AEP flood adjusted for possible future climate change effects (approximately equivalent to a 0.2%
AEP flood based on current climate conditions) were therefore assessed based on the current stopbank
configuration. This represents a worst case scenario.
With the current stopbank configuration, the design 1% AEP flood adjusted for possible future climate change
effects would overtop the existing stopbank along much of its length and flow overland across the floodplain.
Depending on the level of stopbank overtopping, such overtopping could potentially also cause a stopbank
breach to develop. However the latter situation has not been considered in these investigations.

NZ Transport AgencyPeka Peka to Otaki Expressway
Scheme Assessment ReportDesign Flood Levels for Waterway Crossings
Status Issue 1 Page 46 June 2011Project Number 440PN, 5-C1814.00 20110919 PP2O Technical Report Design Flood
Levels_v3_final draft
6.5 MIKE11 / MIKE21 Model of Otaki River and Floodplain
The combined MIKE11 / MIKE21 model developed by GWRC and loaned to us for these investigations simulates
the Otaki River as a conventional river model with the one-dimensional computational hydraulic modelling
software package MIKE11. It also simulates the shallow basin occupied by Stresscrete’s concrete factory using
the two-dimensional hydraulic modelling software package MIKE21. Appropriate linkages are incorporated
between the two model components to represent the hydraulic exchange of flow between the main river
channel and the basin in a large flood event.
The model effectively assumes a “glass wall” along Chrystall’s extended stopbank to limit any stopbank
overtopping (note that this is a common assumption in the hydraulic modelling of flood control schemes
incorporating stopbanks in order to estimate how much stopbanks need to be raised to achieve and increased
standard of protection). However other versions of the model allowed for flood breakout across the floodplain.
As the proposed expressway crosses the floodplain to the north of Chrystall’s extended stopbank, the effect of
stopbank overtopping in a large flood exceeding the design standard for the stopbank is of very significant
interest. The calibrated MIKE11 / MIKE21 Otaki River and floodplain model provided by GWRC was therefore
adapted for these investigations by extending it to cover this floodplain area with appropriate linkages to
represent stopbank overflow from the main river onto the floodplain and from the concrete factory basin to the
floodplain (by means of weir flow in the model). The floodplain area was modelled using MIKE21 with the
topography defined using the most recent LiDAR data obtained for the PP2O Project (the topography of the
concrete factory basin area was also updated using this LiDAR data). The embankment on which the
Expressway is to be constructed was assumed to be impermeable to any floodwaters so that it effectively acts
as a dam causing floodwaters to pond upstream of it.
A number of hydraulic model simulations were carried out assuming both overtopping and no overtopping of
the Chrystall’s extended stopbank. The results of these are detailed below.
It should be noted that the MIKE11 / MIKE21 Otaki River and floodplain model was previously used as a design
tool by GWRC for determining the stopbank design crest levels for the Chrystall’s Bend extended stopbank.
The application of the model in that context reflected GWRC’s philosophy for design flood level contingency
for channel design and at bridges. This philosophy assumes that freeboard is a provision added to a model-
predicted flood level profile to take account of such factors as model uncertainty, river bed aggradation,
surface wave action under flood conditions, seasonal variations in floodplain vegetation, minor debris build-up
in the channel, bridge pier head losses and other hydraulic effects. The philosophy also assumes that debris
clearance is the required clearance to pass woody debris (logs and tree branches) under a bridge to minimise
the likelihood of such debris snagging on the bridge deck and inducing the formation of a debris raft.
For the design of the Chrystall’s Bend extended stopbank (GWRC, 2007), the MIKE11 / MIKE21 model was used
to compute the design water surface profile for the selected design flood with a set of channel resistance
(Manning’s n channel roughness) values that were higher than the calibration values (typically in the range
0.055-0.070) in order to replicate the effect of the freeboard contingency for the uncertainties in the hydraulic
effects noted above.
The same version of the MIKE11 / MIKE21 model incorporating the set of increased Manning’s n values was
utilised for these investigations determining the effect of the PP2O Expressway on floodplain flows resulting
from stopbank overtopping. The design freeboard allowance of 1.2m subsequently recommended for the
proposed Otaki River Bridges (refer to Section 6.10) to account for the high potential for debris raft formation
corresponds to GWRC’s debris clearance allowance.

NZ Transport AgencyPeka Peka to Otaki Expressway
Scheme Assessment ReportDesign Flood Levels for Waterway Crossings
Status Issue 1 Page 47 June 2011Project Number 440PN, 5-C1814.00 20110919 PP2O Technical Report Design Flood
Levels_v3_final draft
6.6 Predicted Flood Levels for Existing and Proposed Situations
All flood levels in this section are expressed in terms of the Mean Sea Level (MSL) Wellington (1953) datum.
Figure 6.3 shows a graph of peak flood levels along Chrystall’s extended stopbank within the concrete factory
basin area for the existing situation with no stopbank overtopping for the 1% and 0.2% AEP floods (i.e. with the
modelled stopbank effectively incorporating vertical “glass wall” extensions so that any overtopping is
precluded in a model sense). In contrast to the main river where the peak flood level profile exhibits a
gradient reflecting the slope of the river bed (Figure 6.4), peak flood levels in the concrete factory basin area
are approximately horizontal. This indicates the basin area acts essentially as a flood ponding area with a
limited number of flow exchange points for floodwaters between the main river channel and the basin. The
0.2% AEP flood can be seen to overtop the adjacent stopbank by up to 0.4m (assuming a “glass wall” basin
side).
Figure 6.4 shows a graph of peak flood levels in the main river channel upstream and downstream of the
sequence of three bridges spanning the Otaki River for the existing and proposed expressway situations with
no stopbank overtopping (i.e. with the modelled stopbanks again effectively incorporating vertical “glass wall”
extensions so that any overtopping is precluded in a model sense). Flood level profiles are given for the 1%
and 0.2% AEP floods for existing climate conditions and also for the 0.2% AEP flood adjusted for the effects of
possible future climate change to 2090. As would be expected, the flood level profiles gradually shift higher
and higher as the peak flood discharge (refer Table 3.1) increases.
Figure 6.5 shows a graph of peak flood levels along Chrystall’s extended stopbank within the concrete factory
basin area for both the existing and proposed Expressway situations with no stopbank overtopping for the
0.2% AEP flood i.e. with the modelled stopbanks again effectively incorporating vertical “glass wall” extensions
so that any overtopping is precluded in a model sense). The effect of the northern approach embankment to
the proposed expressway Bridge which bisects the concrete factory basin at about chainage 1150m can be
clearly seen by comparing the 0.2% AEP flood levels profiles for the existing and proposed situations. The
embankment acts as a partial dam so that flood levels in the basin are higher on the upstream side than on the
downstream side. The embankment will need to be designed from a geotechnical perspective taking this into
consideration. The 0.2% AEP flood can be seen to overtop the adjacent stopbank by up to 0.5m upstream of
the Expressway embankment and by up to 0.3m on the downstream side (between the embankment and the
railway line).
Similarly to Figure 6.4, Figure 6.6 shows a graph of peak flood levels in the main river channel upstream and
downstream of the sequence of three bridges spanning the Otaki River for the existing and proposed
expressway situations but with stopbank overtopping (i.e. with the model reconfigured to represent weir flow
over the top of the stopbanks and the resulting floodplain flow that would occur in reality under overtopping
conditions). However, for comparison, some peak flood levels are also given in Figure 6.6 for corresponding
cases without stopbank overtopping for comparison.
The flood level profiles shown in Figure 6.6 are for the 1% and 0.2% AEP floods for existing climate conditions
and also for the 0.2% AEP flood adjusted for the effects of possible future climate change to 2090. As would
be expected, when stopbank overtopping is represented in the MIKE11 / MIKE21 model, slightly lower flood
levels in the main river channel are predicted compared to when stopbank overtopping is artificially precluded
by vertical “glass wall” extensions to the modelled stopbanks.

NZ Transport AgencyPeka Peka to Otaki Expressway
Scheme Assessment ReportDesign Flood Levels for Waterway Crossings
Status Issue 1 Page 48 June 2011Project Number 440PN, 5-C1814.00 20110919 PP2O Technical Report Design Flood
Levels_v3_final draft
Figure 6.7 shows a graph of peak flood levels along Chrystall’s extended stopbank within the basin area
occupied by the concrete factory for the proposed expressway situation with stopbank overtopping for the
0.2% AEP flood (for both current climate conditions and adjusted for the effects of possible future climate
change to 2090) occurring. Note that the 0.2% AEP flood for current climate conditions only just overtops the
stopbank adjacent to the expressway embankment when stopbank overtopping is simulated. Further stopbank
overtopping is predicted to occur just upstream of the start of the concrete factory basin area.
The overtopping stopbank flow from upstream of the concrete factory basin area flows along the outside of the
stopbank and combines with the overtopping flow that occurs adjacent to the expressway embankment. The
embankment across the floodplain to the north of Chrystall’s extended stopbank prevents the stopbank
overflow from flowing towards the sea through Otaki Township and instead causes the floodwaters to pond
upstream.
Figure 6.8 illustrates the approximate extent of flood inundation upstream of the proposed expressway for the
design flood case i.e. resulting from the stopbank overflow for the 0.2% AEP flood based on current climate
conditions). The extent of flood inundation is mostly confined to a narrow strip 100-200m wide upstream of
the expressway. However it does spread northwards into the Mangapouri Stream sub-catchment and, in
particular, the detention pond area for Mangapouri Stream flood flows upstream of the section of Expressway
embankment in the SH1 . County Road / Rahui Road triangle. This in fact appears to be the only area where
residential properties are inundated by the ponding of stopbank overtopping floodwaters as the narrow
inundation strip to the east of the Expressway and south of Rahui Road appears to be devoid of any houses.
It is important to note with respect to Figure 6.8 that this inundation map does not include any local surface
runoff contributions from the Racecourse or Mangapouri Catchments. These contributions are likely to be
small reflecting the small size of these catchments and also their much shorter response times than the
response time for the much larger Otaki Catchment (i.e. the flood peak in these very small local catchments for
long duration storm events affecting the much large Otaki Catchment will occur well before the flood peak in
the Otaki River).
Figure 6.9 shows the predicted peak level profile for ponded floodwaters along the upstream face of the
embankment for the proposed expressway for the design flood case assuming no overtopping of the
expressway embankment. This peak flood level profile indicates that there is a gradual movement of these
floodwaters in a northerly direction parallel with the expressway towards the ponding area for the Mangapouri
Catchment. The profile also indicates that, if a 0.2% AEP flood-free highway design standard was adopted,
then the expressway embankment would need to be a minimum of ~1.2m above existing ground levels.
Predicted flood levels in the Mangapouri Catchment ponding area upstream of the Expressway embankment
are slightly less than for a 0.2% AEP flood induced by a short duration high intensity rainfall storm an adopted
as design standard for the Mangapouri Stream culvert system under the proposed Expressway and the
relocated NIMT railway line.
Figure 6.9 also shows the predicted peak level profile for ponded floodwaters along the upstream face of the
expressway embankment for the 0.2% AEP super-design flood adjusted for the effects of possible future
climate change to 2090 assuming no overtopping of the embankment (i.e. treating the embankment as a
“glass wall”). This was evaluated prior to the vertical alignment of the expressway being developed by the road
geometric designers using the inputs from these investigations. Subsequent to this peak flood level profile
being evaluated, the proposed vertical alignment of the expressway centreline developed by the road
geometric designers was added to Figure 6.9. This suggests that, after overtopping the Chrystall’s Bend
extended stopbank, the design 0.2% AEP flood will pond in front of the expressway embankment before
marginally overtopping it. The effects of road overtopping are examined further in Section 6.9.
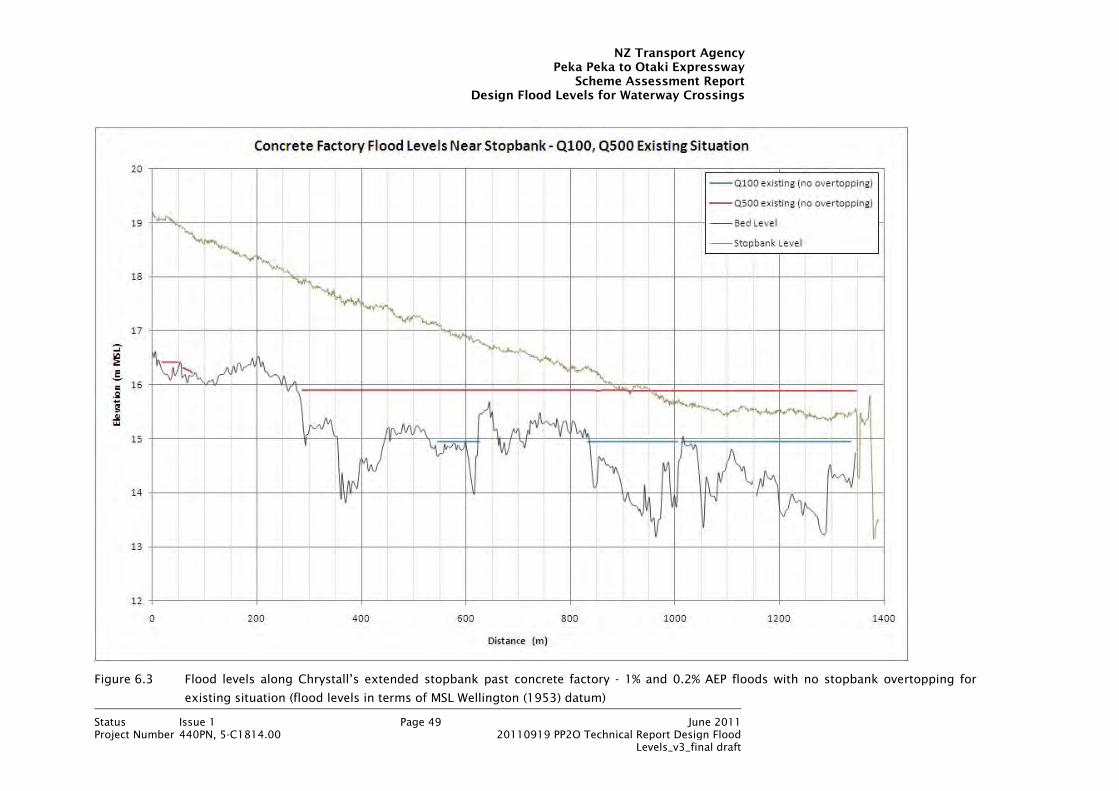
NZ Transport AgencyPeka Peka to Otaki Expressway
Scheme Assessment ReportDesign Flood Levels for Waterway Crossings
Status Issue 1 Page 49 June 2011Project Number 440PN, 5-C1814.00 20110919 PP2O Technical Report Design Flood
Levels_v3_final draft
Figure 6.3 Flood levels along Chrystall’s extended stopbank past concrete factory - 1% and 0.2% AEP floods with no stopbank overtopping for
existing situation (flood levels in terms of MSL Wellington (1953) datum)
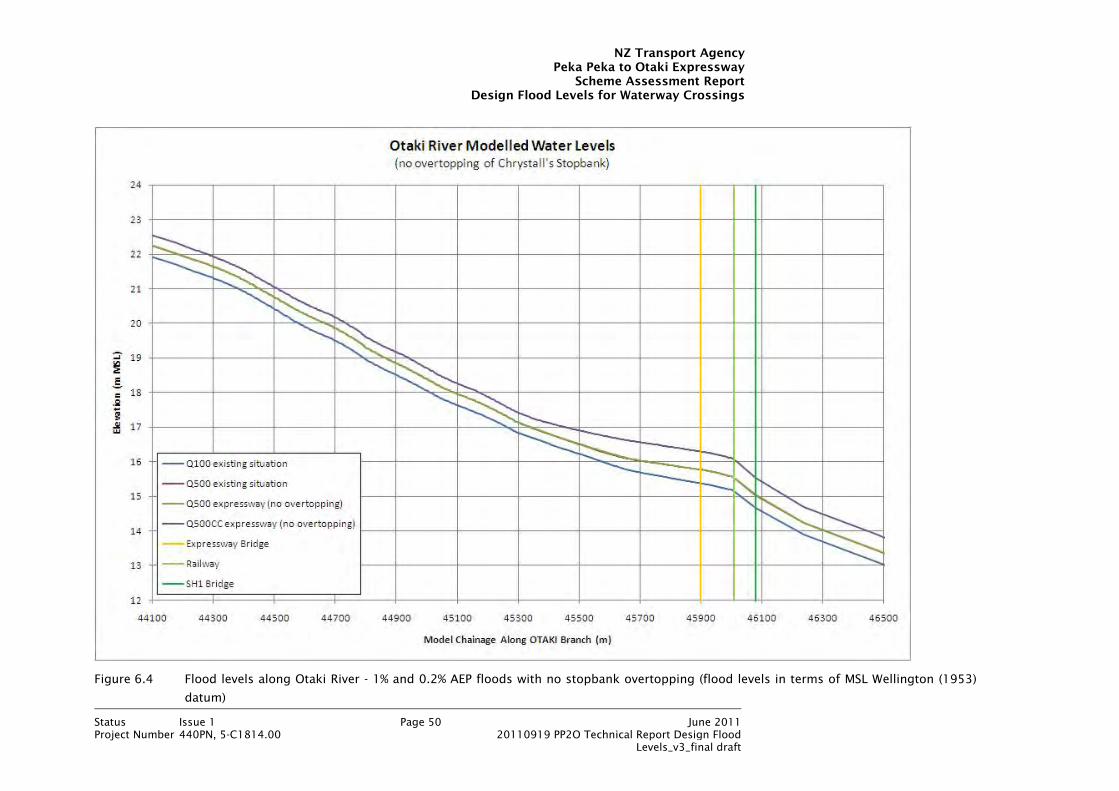
NZ Transport AgencyPeka Peka to Otaki Expressway
Scheme Assessment ReportDesign Flood Levels for Waterway Crossings
Status Issue 1 Page 50 June 2011Project Number 440PN, 5-C1814.00 20110919 PP2O Technical Report Design Flood
Levels_v3_final draft
Figure 6.4 Flood levels along Otaki River - 1% and 0.2% AEP floods with no stopbank overtopping (flood levels in terms of MSL Wellington (1953)
datum)

NZ Transport AgencyPeka Peka to Otaki Expressway
Scheme Assessment ReportDesign Flood Levels for Waterway Crossings
Status Issue 1 Page 51 June 2011Project Number 440PN, 5-C1814.00 20110919 PP2O Technical Report Design Flood
Levels_v3_final draft
Figure 6.5 Flood levels along Chrystall’s extended stopbank past concrete factory - 0.2% AEP flood with no stopbank overtopping for existing and
proposed Expressway situations (flood levels in terms of MSL Wellington (1953) datum)

NZ Transport AgencyPeka Peka to Otaki Expressway
Scheme Assessment ReportDesign Flood Levels for Waterway Crossings
Status Issue 1 Page 52 June 2011Project Number 440PN, 5-C1814.00 20110919 PP2O Technical Report Design Flood
Levels_v3_final draft
Figure 6.6 Flood levels along Otaki River - 0.2% AEP floods with stopbank overtopping (flood levels in terms of MSL Wellington (1953) datum)

NZ Transport AgencyPeka Peka to Otaki Expressway
Scheme Assessment ReportDesign Flood Levels for Waterway Crossings
Status Issue 1 Page 53 June 2011Project Number 440PN, 5-C1814.00 20110919 PP2O Technical Report Design Flood
Levels_v3_final draft
Figure 6.7 Flood levels along Chrystall’s extended stopbank past concrete factory - 0.2% AEP flood with stopbank overtopping for proposed
Expressway situation (flood levels in terms of MSL Wellington (1953) datum)

NZ Transport AgencyPeka Peka to Otaki Expressway
Scheme Assessment ReportDesign Flood Levels for Waterway Crossings
Status Issue 1 Page 54 June 2011Project Number 440PN, 5-C1814.00 20110919 PP2O Technical Report Design Flood
Levels_v3_final draft
Figure 6.8 Extent of flood inundation for proposed Expressway situation on Otaki River floodplain for 0.2%AEP flood adjusted for effects of future
climate change with stopbank overtopping

NZ Transport AgencyPeka Peka to Otaki Expressway
Scheme Assessment ReportDesign Flood Levels for Waterway Crossings
Status Issue 1 Page 55 June 2011Project Number 440PN, 5-C1814.00 20110919 PP2O Technical Report Design Flood
Levels_v3_final draft
Residual overland flow path DS of existing SH1
Residual overland flow path DS of existing SH1
10.00
11.00
12.00
13.00
14.00
15.00
16.00
17.00
18.00
19.00
20.00
0 200 400 600 800 1000 1200 1400 1600
Elevation (m M
SL)
Approx Chainage Along Alignment from TRB of Otaki River (m)
Design Expressway Level Ground Level
Q500 Water Level Q500+CC Water Level
RahuiRoad
Mangapouri
Stream
Crystalls Extended
Stopbank
Figure 6.9 Estimated flood levels immediately upstream of expressway for 0.2% AEP overtopping Chrystall’s extended stopbank (flood levels in
terms of MSL Wellington (1953) datum) – no overtopping of expressway embankment assumed

NZ Transport AgencyPeka Peka to Otaki Expressway
Scheme Assessment ReportDesign Flood Levels for Waterway Crossings
Status Issue 1 Page 56 June 2011Project Number 440PN, 5-C1814.00 20110919 PP2O Technical Report Design Flood
Levels_v3_final draft
6.7 Commentary on Extent of Floodplain Inundation for 0.2% AEP Flood
It is important to note that the extent of flood inundation shown in Figure 6.8 resulting from stopbank
overtopping in the design 0.2% AEP flood (based on current climate conditions) reflects a couple of trade-offs:
providing a greater level of flood security (0.2% AEP design standard based on current climate
conditions) to the proposed expressway as a lifeline facility compared to a lower level of flood security
and an inability to function as a lifeline facility if the Expressway was constructed at grade (1% AEP
standard based on current climate conditions); and
providing a greater level of flood security to the much larger area of Otaki Township to the west of the
expressway at the expense of slightly increased inundation in selected areas to the east of the
expressway.
The extent of upstream inundation in the Mangapouri Catchment ponding area at the top of Figure 6.8 is very
similar to what it is in Figure 5.3 for the design flood assumed for that catchment (0.2% AEP flood resulting
from a short duration high intensity storm event and adjusted for the effects of possible future climate change
to 2090). This is because the peak flood levels in this area are much the same (14.85m for the design case
here compared to 14.81m for the Mangapouri Catchment design case).
The only area that would be adversely affect by the implementation of the recommended design standard for
the Expressway embankment is a small area bounded by the proposed Expressway to the west, Rahui Road to
the north and the Otaki Racecourse to the east.
This recommended design standard is a matter of both expressway design philosophy and future floodplain
management strategy. The former aspect is the responsibility of NZTA as the developer and Opus as the
designer. GWRC has statutory responsibility for the latter aspect so that the recommended design approach
needs to be agreed with them.
The 0.2% AEP flood based on current climate conditions represents a fairly rare event so that it is reasonable to
assume a minimum freeboard value of 0.3m above design flood level to the edge of the proposed expressway
embankment. Floods larger than a 0.2% AEP flood would start to overtop the road embankment to a relatively
shallow depth because of the length of the embankment, with the overtopping flows continuing to flow
westwards through Otaki Township as shallow overland flow.
Despite the assumption of the expressway embankment acting as an impermeable barrier to stopbank
overtopping flows for floods in the 1% to 0.2% AEP range, there will still be the need for a local drainage
system through the embankment to both evacuate storm runoff from localised storm events and to evacuate
any ponded floodwaters.
6.8 Mitigation Measures for Super-Design Flood Occurrence
As noted before, the occurrence of stopbank overtopping by the design 0.2% AEP flood is a near certainty (due
to the lower design standard for the stopbank) and consequential breaching of the stopbank as a result of
being overtopped cannot be precluded. Similarly the possibility of a super-design flood (i.e. one larger than
the design one), albeit with a lower probability of occurrence, cannot be discounted and this would also result
in stopbank overtopping and possibly a stopbank breach depending on the depth of stopbank overtopping.

NZ Transport AgencyPeka Peka to Otaki Expressway
Scheme Assessment ReportDesign Flood Levels for Waterway Crossings
Status Issue 1 Page 57 June 2011Project Number 440PN, 5-C1814.00 20110919 PP2O Technical Report Design Flood
Levels_v3_final draft
In the event of the occurrence of stopbank overtopping (with or without stopbank breaching), the stopbank
overtopping (and breach) flows would pond in front of the expressway embankment as intended and then
overtop the embankment. However the vertical alignment of the embankment has been configured to
gradually slope down from the river crossing to the south to get under the Rahui Road overbridge adjacent to
the Mangapouri Stream. The vertical alignment means that, if the road embankment is overtopped by a super-
design flood, then the overflow will potentially be directed through the main part of Otaki Township.
In order to reduce the extent of flood inundation for the design flood case as seen in Figure 6.8 and for any
super-design floods, a dry culvert through the road embankment immediately to the north of the Chrystall’s
Bend extended stopbank would need to be provided. This culvert would enable outflow from the detention
pond area upstream of the expressway embankment to be directed more towards existing secondary overland
flow paths across the existing SH1 as seen in Figure 6.2. It would also provide a means of being able to
convey surface drainage from the Racecourse Catchment to the western isde of teh expressway away from
populated areas.
Figure 6.10 shows the approximate extent of flood inundation across the floodplain in the existing situation
for the super-design 0.2% AEP flood adjusted for the effects of possible future climate change to 2090 (the
inundation extent is only approximate as the effects of flow obstruction by buildings through the urban areas
is ignored). After this super-design flood overtops the Chrystall’s Bend extended stopbank (assuming no
consequential stopbank breaching), the breakout flows would flow across the floodplain, over SH1 and through
Otaki Township. There are strong similarities with the GWRC’s flood inundation pattern for residual overflow
shown in Figure 6.2 (pink and light blue shaded areas) as well as some differences.
Figure 6.11 shows a comparable picture to Figure 6.10 for the flood but for the proposed expressway
situation. The model simulation run used to generate this flood extent map incorporated a 20m wide by 1.5m
high culvert to provide a leakage path through the expressway embankment as a flood mitigation measure (the
culvert location is marked). This is by no means optimised in terms of size and location. However comparison
of Figure 6.11 with Figure 6.10 does indicate that incorporation of the culvert does provide some degree of
flood relief to the main residential part of Otaki Township with the extent of flood inundation trough the town
reduced. Optimisation of the culvert size and location would form a key part of the detailed design for the
expressway.
Figure 6.12 shows a further version of Figure 6.9 with peak flood level profiles along the upstream face of the
proposed expressway embankment for both:
the design 0.2% AEP flood based on current climate conditions (no road overtopping and with road
overtopping)
the super-design 0.2% AEP flood adjusted for possible future climate change effects to 2090 (no road
overtopping and with road overtopping)
Figure 6.12 shows that, for the design flood case, the level of the expressway embankment at and south of the
Rahui Road overbridge has been set below the required level determined from these investigations. As a
consequence a low bund along the eastern side of the expressway will need to be provided over a short
distance south of the overbridge in order to contain floodwaters and prevent flood breakout through Otaki
Township for the design flood.
For the super-design flood case, the upstream ponding levels in front of expressway embankment are
considerably reduced by allowing road embankment overtopping to occur.

NZ Transport AgencyPeka Peka to Otaki Expressway
Scheme Assessment ReportDesign Flood Levels for Waterway Crossings
Status Issue 1 Page 58 June 2011Project Number 440PN, 5-C1814.00 20110919 PP2O Technical Report Design Flood
Levels_v3_final draft
Figure 6.10 Extent of flood inundation for existing situation on Otaki River floodplain for 0.2% AEP flood adjusted for possible effects of future
climate change with stopbank overtopping

NZ Transport AgencyPeka Peka to Otaki Expressway
Scheme Assessment ReportDesign Flood Levels for Waterway Crossings
Status Issue 1 Page 59 June 2011Project Number 440PN, 5-C1814.00 20110919 PP2O Technical Report Design Flood
Levels_v3_final draft
Figure 6.11 Extent of flood inundation for proposed expressway situation on Otaki River floodplain for 0.2% AEP flood adjusted for possible effects
of future climate change with stopbank overtopping and expressway embankment overtopping

NZ Transport AgencyPeka Peka to Otaki Expressway
Scheme Assessment ReportDesign Flood Levels for Waterway Crossings
Status Issue 1 Page 60 June 2011Project Number 440PN, 5-C1814.00 20110919 PP2O Technical Report Design Flood
Levels_v3_final draft
Residual overland flow path DS of existing SH1
Residual overland flow path DS of existing SH1
10.00
11.00
12.00
13.00
14.00
15.00
16.00
17.00
18.00
19.00
20.00
0 200 400 600 800 1000 1200 1400 1600
Elevation (m M
SL)
Approx Chainage Along Alignment from TRB of Otaki River (m)
Design Expressway Level
Ground Level
Q500 Water Level (Expressway No Overtopping)
Q500 + CC Water Level (Expressway No Overtopping)
Q500 + CC Water Level (Existing Situation)
Q500 + CC Water Level (No Expressway Overtopping with 20m Flood Relief Culvert)
RahuiRoad
Mangapouri
Stream
Crystalls Extended
Stopbank
Figure 6.12 Estimated flood levels immediately upstream of expressway for design and super-design floods overtopping Chrystall’s extended
stopbank (flood levels in terms of MSL Wellington (1953) datum) – with overtopping of expressway embankment assumed
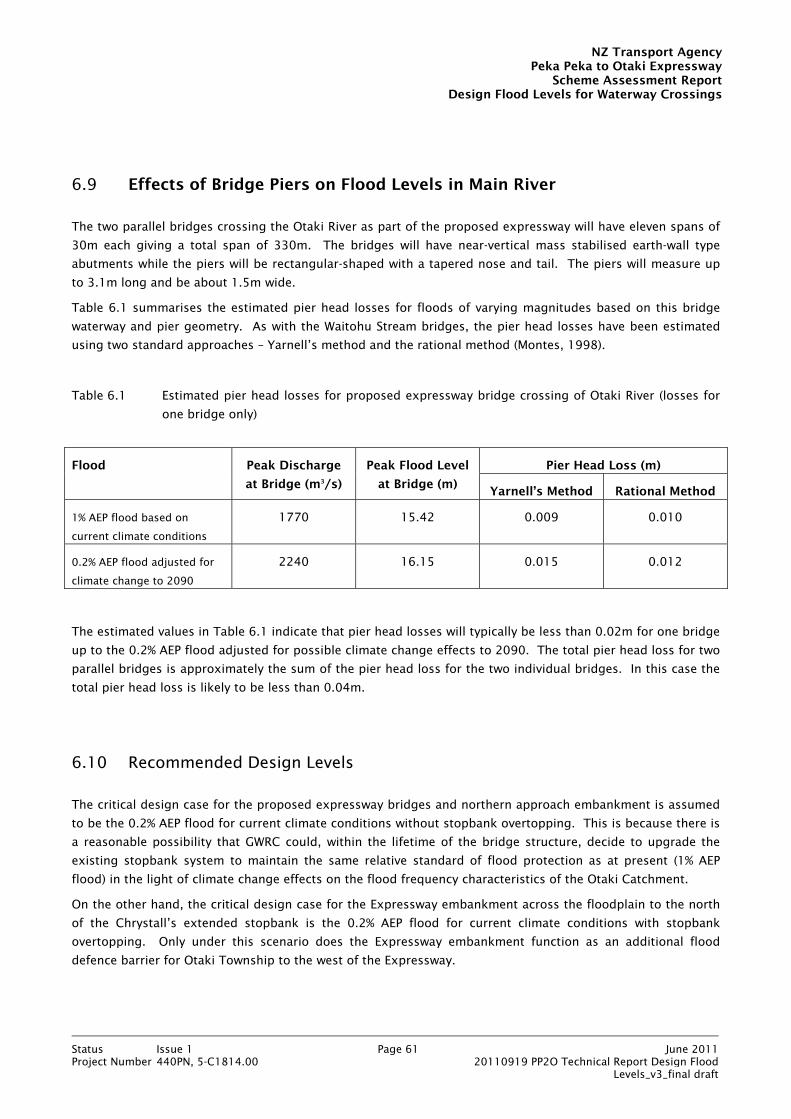
NZ Transport AgencyPeka Peka to Otaki Expressway
Scheme Assessment ReportDesign Flood Levels for Waterway Crossings
Status Issue 1 Page 61 June 2011Project Number 440PN, 5-C1814.00 20110919 PP2O Technical Report Design Flood
Levels_v3_final draft
6.9 Effects of Bridge Piers on Flood Levels in Main River
The two parallel bridges crossing the Otaki River as part of the proposed expressway will have eleven spans of
30m each giving a total span of 330m. The bridges will have near-vertical mass stabilised earth-wall type
abutments while the piers will be rectangular-shaped with a tapered nose and tail. The piers will measure up
to 3.1m long and be about 1.5m wide.
Table 6.1 summarises the estimated pier head losses for floods of varying magnitudes based on this bridge
waterway and pier geometry. As with the Waitohu Stream bridges, the pier head losses have been estimated
using two standard approaches – Yarnell’s method and the rational method (Montes, 1998).
Table 6.1 Estimated pier head losses for proposed expressway bridge crossing of Otaki River (losses for
one bridge only)
Flood Peak Discharge
at Bridge (m3/s)
Peak Flood Level
at Bridge (m)
Pier Head Loss (m)
Yarnell’s Method Rational Method
1% AEP flood based on
current climate conditions
1770 15.42 0.009 0.010
0.2% AEP flood adjusted for
climate change to 2090
2240 16.15 0.015 0.012
The estimated values in Table 6.1 indicate that pier head losses will typically be less than 0.02m for one bridge
up to the 0.2% AEP flood adjusted for possible climate change effects to 2090. The total pier head loss for two
parallel bridges is approximately the sum of the pier head loss for the two individual bridges. In this case the
total pier head loss is likely to be less than 0.04m.
6.10 Recommended Design Levels
The critical design case for the proposed expressway bridges and northern approach embankment is assumed
to be the 0.2% AEP flood for current climate conditions without stopbank overtopping. This is because there is
a reasonable possibility that GWRC could, within the lifetime of the bridge structure, decide to upgrade the
existing stopbank system to maintain the same relative standard of flood protection as at present (1% AEP
flood) in the light of climate change effects on the flood frequency characteristics of the Otaki Catchment.
On the other hand, the critical design case for the Expressway embankment across the floodplain to the north
of the Chrystall’s extended stopbank is the 0.2% AEP flood for current climate conditions with stopbank
overtopping. Only under this scenario does the Expressway embankment function as an additional flood
defence barrier for Otaki Township to the west of the Expressway.
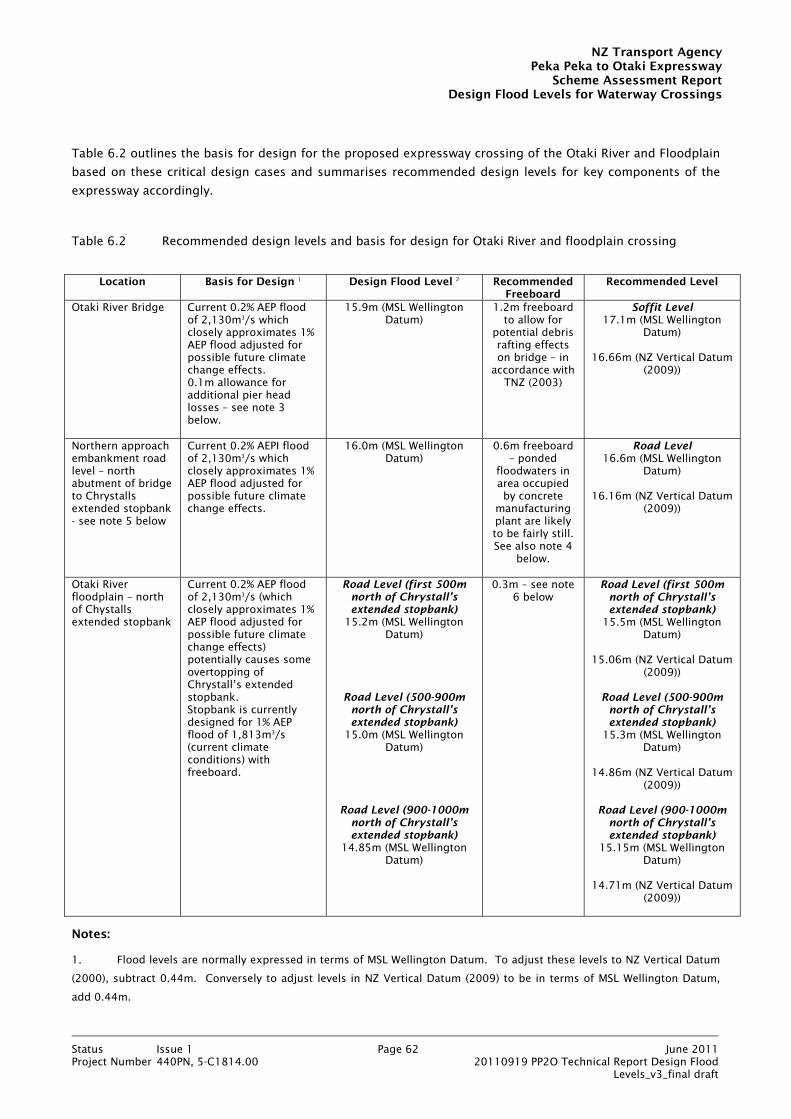
NZ Transport AgencyPeka Peka to Otaki Expressway
Scheme Assessment ReportDesign Flood Levels for Waterway Crossings
Status Issue 1 Page 62 June 2011Project Number 440PN, 5-C1814.00 20110919 PP2O Technical Report Design Flood
Levels_v3_final draft
Table 6.2 outlines the basis for design for the proposed expressway crossing of the Otaki River and Floodplain
based on these critical design cases and summarises recommended design levels for key components of the
expressway accordingly.
Table 6.2 Recommended design levels and basis for design for Otaki River and floodplain crossing
Location Basis for Design 1 Design Flood Level 2 Recommended
Freeboard Recommended Level
Otaki River Bridge Current 0.2% AEP flood of 2,130m3/s which closely approximates 1% AEP flood adjusted for possible future climate change effects. 0.1m allowance for additional pier head losses – see note 3 below.
15.9m (MSL Wellington Datum)
1.2m freeboard to allow for
potential debris rafting effects on bridge – in
accordance with TNZ (2003)
Soffit Level 17.1m (MSL Wellington
Datum)
16.66m (NZ Vertical Datum (2009))
Northern approach embankment road level – north abutment of bridge to Chrystalls extended stopbank - see note 5 below
Current 0.2% AEPI flood of 2,130m3/s which closely approximates 1% AEP flood adjusted for possible future climate change effects.
16.0m (MSL Wellington Datum)
0.6m freeboard – ponded
floodwaters in area occupied by concrete
manufacturing plant are likely to be fairly still. See also note 4
below.
Road Level 16.6m (MSL Wellington
Datum)
16.16m (NZ Vertical Datum (2009))
Otaki River floodplain – north of Chystalls extended stopbank
Current 0.2% AEP flood of 2,130m3/s (which closely approximates 1% AEP flood adjusted for possible future climate change effects) potentially causes some overtopping of Chrystall’s extended stopbank. Stopbank is currently designed for 1% AEP flood of 1,813m3/s (current climate conditions) with freeboard.
Road Level (first 500m north of Chrystall’s extended stopbank)
15.2m (MSL Wellington Datum)
Road Level (500-900m north of Chrystall’s extended stopbank)
15.0m (MSL Wellington Datum)
Road Level (900-1000m north of Chrystall’s extended stopbank)
14.85m (MSL Wellington Datum)
0.3m – see note 6 below
Road Level (first 500m north of Chrystall’s extended stopbank)
15.5m (MSL Wellington Datum)
15.06m (NZ Vertical Datum
(2009))
Road Level (500-900m north of Chrystall’s extended stopbank)
15.3m (MSL Wellington Datum)
14.86m (NZ Vertical Datum
(2009))
Road Level (900-1000m north of Chrystall’s extended stopbank)
15.15m (MSL Wellington Datum)
14.71m (NZ Vertical Datum
(2009))
Notes:
1. Flood levels are normally expressed in terms of MSL Wellington Datum. To adjust these levels to NZ Vertical Datum
(2000), subtract 0.44m. Conversely to adjust levels in NZ Vertical Datum (2009) to be in terms of MSL Wellington Datum,
add 0.44m.

NZ Transport AgencyPeka Peka to Otaki Expressway
Scheme Assessment ReportDesign Flood Levels for Waterway Crossings
Status Issue 1 Page 63 June 2011Project Number 440PN, 5-C1814.00 20110919 PP2O Technical Report Design Flood
Levels_v3_final draft
2. Adjustments to estimated flood discharges for the effects of possible future climate change are based on the
average expected change in mean temperature to 2090.
3. Bridge pier head loss to be confirmed once layout of bridge piers is confirmed by bridge designers.
4. Northern approach embankment between the Chystalls Bend stopbank and the north abutment of the bridge acts as
a partial dam for floodwaters ponded between the stopbank and the river. The effect of this is to cause a differential head of
about 0.4m between the upstream and downstream sides of the approach embankment.
5. Level of Chrystall’s extended stopbank adjacent to approach embankment for proposed bridge is about RL 15.5m
(MSL Wellington Datum (1953).
6. This is consistent with the freeboard allowance proposed for the Expressway embankment crossing the Mangapouri
Stream just to the north.
NZ Transport AgencyPeka Peka to Otaki Expressway
Scheme Assessment ReportDesign Flood Levels for Waterway Crossings
Status Issue 1 Page 64 June 2011Project Number 440PN, 5-C1814.00 20110919 PP2O Technical Report Design Flood
Levels_v3_final draft
7. Mangaone Stream Design Flood Levels
7.1 Introduction
This section sets out the recommendations for design levels for the PP20 expressway over the Mangaone
Stream incorporating the east-west local road link between Gear Road / School Road and Te Horo Beach Road.
7.2 Outline of Existing Situation
The Mangaone Stream exits from the foothills of the Tararua Ranges and flows westwards across the coastal
plain over a distance of about 7km to the sea. State Highway 1 (SH1) and the North Island Main Trunk (NIMT)
railway line, which run parallel to each other along the coastal plain, follow a roughly north-east / south-west
alignment and cross the Mangaone Stream at Te Horo, about halfway between the foothills and the sea.
Under significant flood conditions, the Mangaone Stream breaks out of its relatively low banks across the
coastal plain and follows a number of separate flow paths down to the railway line. The railway acts as a
partial barrier for these flood flows with intercepted overland flows from the coastal plain being directed back
towards the Mangaone Stream by the natural topography of the plain.
A complex culvert system has been constructed to convey these intercepted flows past the railway line and SH1
(Figure 7.1). The Mangaone Stream has railway and road culvert crossings but there are additional inter-
connected overflow culverts (that are normally dry) under both transport facilities that direct flow through a
gap between the houses and other buildings on the west side of SH1. This overflow floodway is located close
to the low point on the coastal plain and in fact conveys the bulk of the flood volume past SH1 in a significant
flood event, Road overflow (and probably also railway embankment seepage) is a known problem in significant
flood events and occurs every few years.
The School Road drain to the south of the Mangaone Stream also collects surface runoff from part of the
coastal plain upstream of the railway line and SH1. It directs runoff to the overflow culvert system from the
Gear Road / School Road intersection. It also has known flood inundation problems which are related to the
configuration and size of the drain itself rather than the railway line and SH1. Historic modification of natural
drainage paths in this area may also be factor in the School Road flooding issue.
The complexity of the drainage system is illustrated by some aerial photographs of the 28 October 1998 flood
provided by GWRC (figures 7.2-7.4). These appear to have been taken after the flood peak but they clearly
demonstrate overland flow paths across the alluvial fan and ponding areas upstream of the NIMT railway line
(Figures 7.2 and 7.3) and overland flow paths downstream of SH (Figures 7.2, 7.3 and 7.4)1. It is worth noting
that the 28 October 1998 flood occurred approximately one week after an even larger flood, both floods being
the largest recorded floods at the upstream Mangaone Stream at Ratanui gauging station.
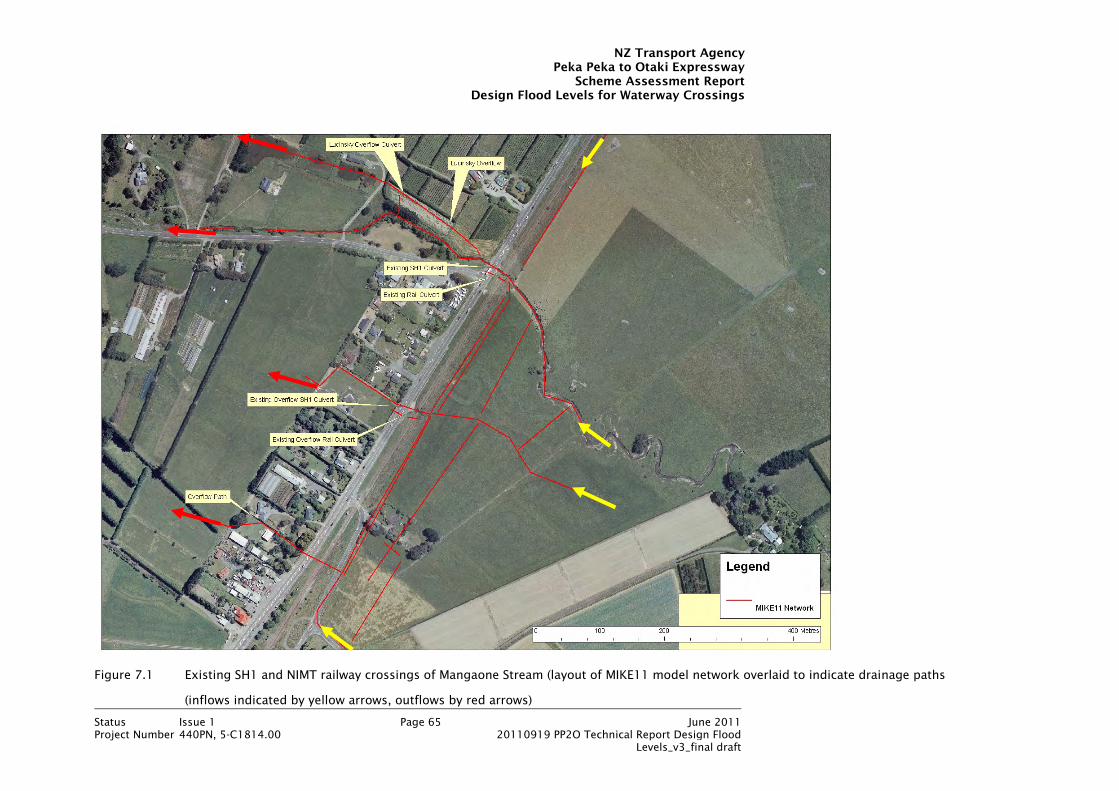
NZ Transport AgencyPeka Peka to Otaki Expressway
Scheme Assessment ReportDesign Flood Levels for Waterway Crossings
Status Issue 1 Page 65 June 2011Project Number 440PN, 5-C1814.00 20110919 PP2O Technical Report Design Flood
Levels_v3_final draft
Figure 7.1 Existing SH1 and NIMT railway crossings of Mangaone Stream (layout of MIKE11 model network overlaid to indicate drainage paths
(inflows indicated by yellow arrows, outflows by red arrows)
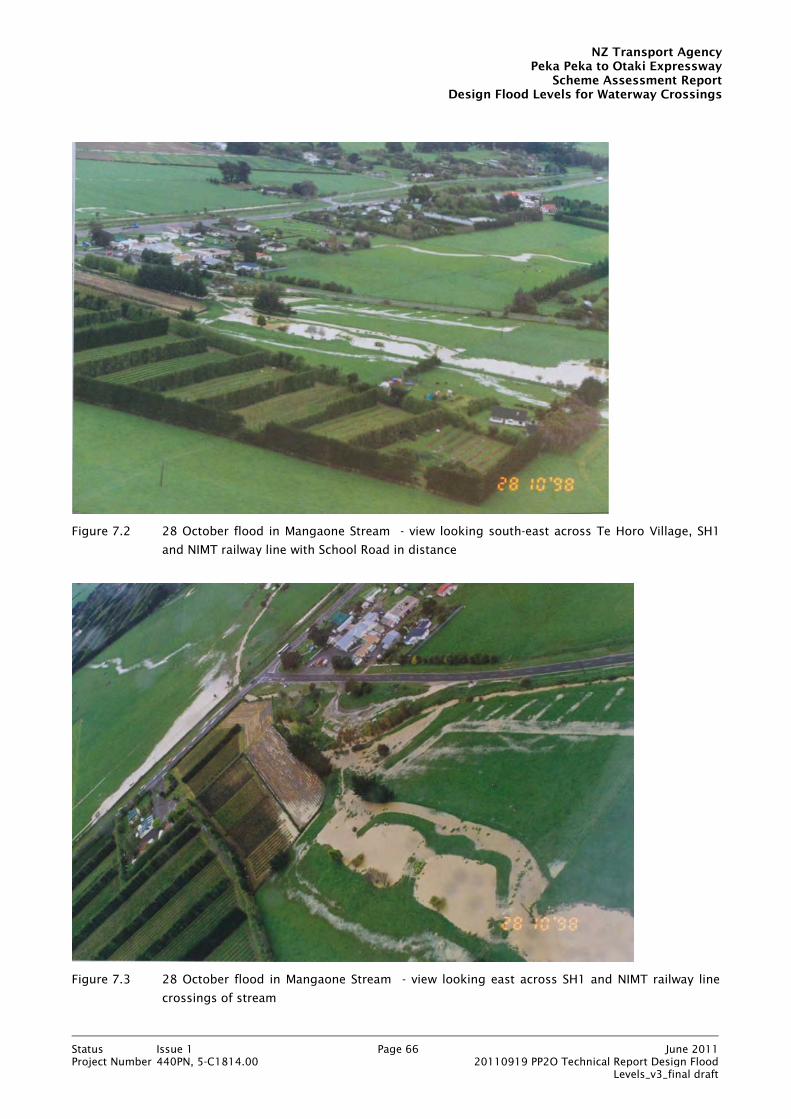
NZ Transport AgencyPeka Peka to Otaki Expressway
Scheme Assessment ReportDesign Flood Levels for Waterway Crossings
Status Issue 1 Page 66 June 2011Project Number 440PN, 5-C1814.00 20110919 PP2O Technical Report Design Flood
Levels_v3_final draft
Figure 7.2 28 October flood in Mangaone Stream - view looking south-east across Te Horo Village, SH1
and NIMT railway line with School Road in distance
Figure 7.3 28 October flood in Mangaone Stream - view looking east across SH1 and NIMT railway line
crossings of stream
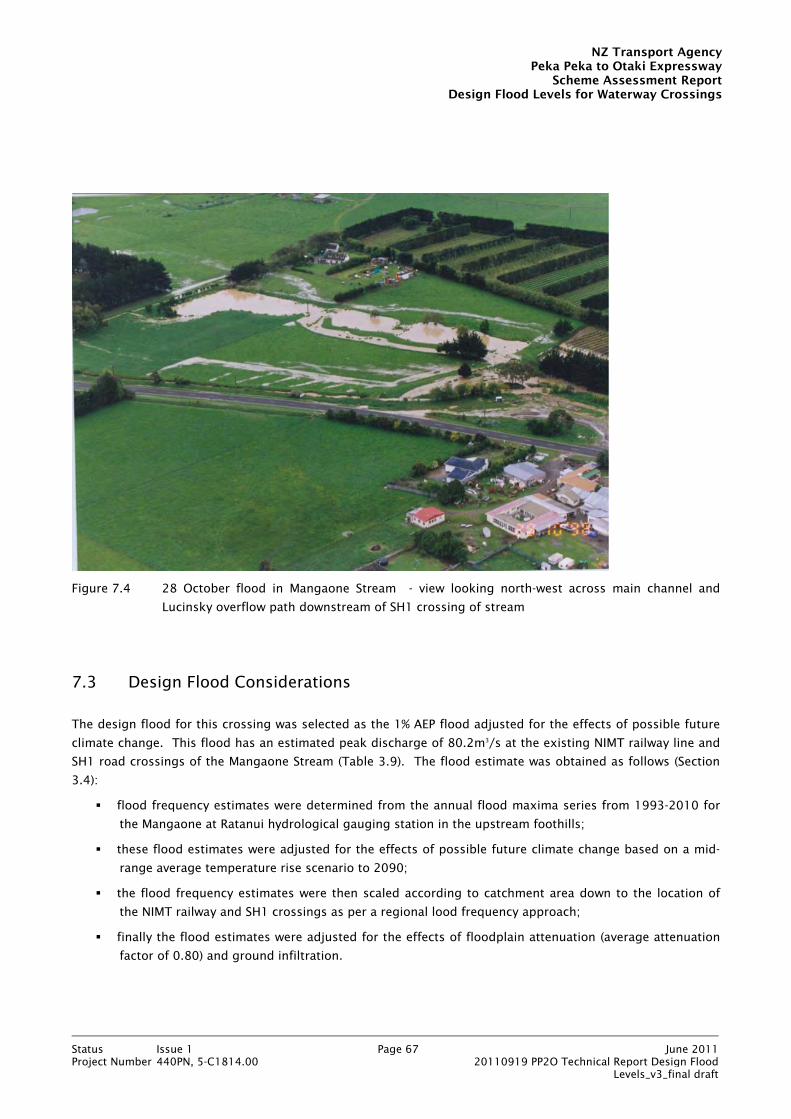
NZ Transport AgencyPeka Peka to Otaki Expressway
Scheme Assessment ReportDesign Flood Levels for Waterway Crossings
Status Issue 1 Page 67 June 2011Project Number 440PN, 5-C1814.00 20110919 PP2O Technical Report Design Flood
Levels_v3_final draft
Figure 7.4 28 October flood in Mangaone Stream - view looking north-west across main channel and
Lucinsky overflow path downstream of SH1 crossing of stream
7.3 Design Flood Considerations
The design flood for this crossing was selected as the 1% AEP flood adjusted for the effects of possible future
climate change. This flood has an estimated peak discharge of 80.2m3/s at the existing NIMT railway line and
SH1 road crossings of the Mangaone Stream (Table 3.9). The flood estimate was obtained as follows (Section
3.4):
flood frequency estimates were determined from the annual flood maxima series from 1993-2010 for
the Mangaone at Ratanui hydrological gauging station in the upstream foothills;
these flood estimates were adjusted for the effects of possible future climate change based on a mid-
range average temperature rise scenario to 2090;
the flood frequency estimates were then scaled according to catchment area down to the location of
the NIMT railway and SH1 crossings as per a regional lood frequency approach;
finally the flood estimates were adjusted for the effects of floodplain attenuation (average attenuation
factor of 0.80) and ground infiltration.
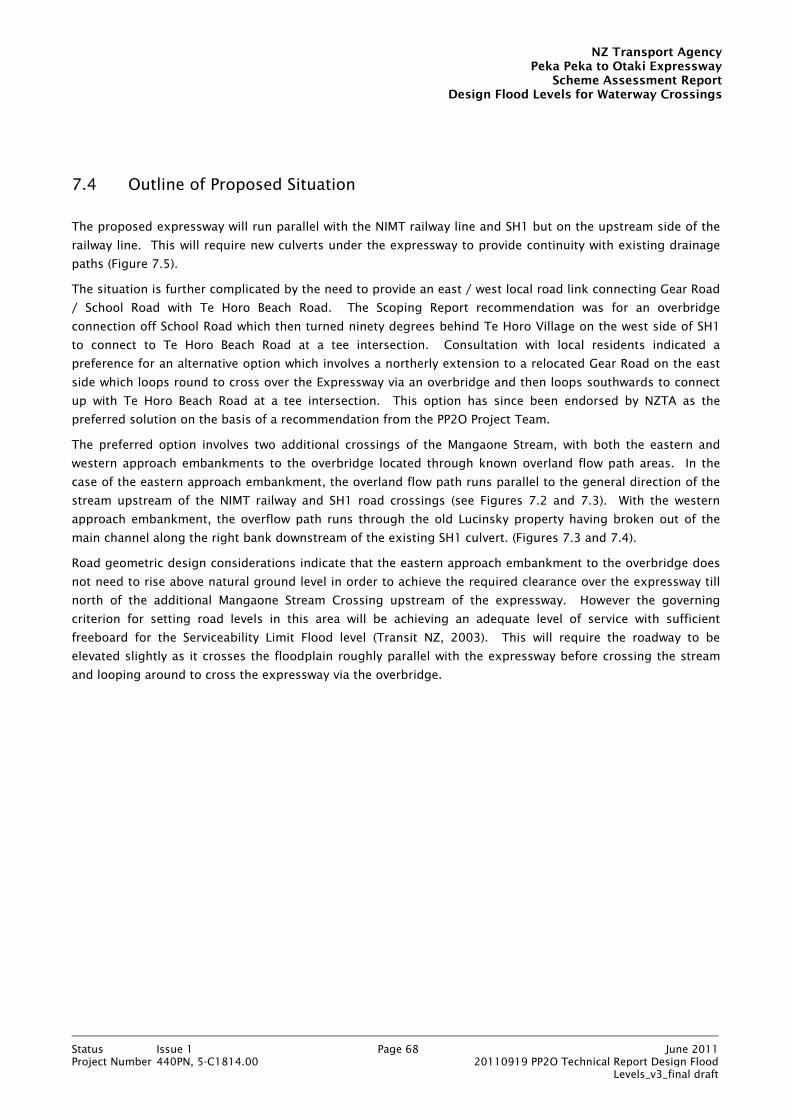
NZ Transport AgencyPeka Peka to Otaki Expressway
Scheme Assessment ReportDesign Flood Levels for Waterway Crossings
Status Issue 1 Page 68 June 2011Project Number 440PN, 5-C1814.00 20110919 PP2O Technical Report Design Flood
Levels_v3_final draft
7.4 Outline of Proposed Situation
The proposed expressway will run parallel with the NIMT railway line and SH1 but on the upstream side of the
railway line. This will require new culverts under the expressway to provide continuity with existing drainage
paths (Figure 7.5).
The situation is further complicated by the need to provide an east / west local road link connecting Gear Road
/ School Road with Te Horo Beach Road. The Scoping Report recommendation was for an overbridge
connection off School Road which then turned ninety degrees behind Te Horo Village on the west side of SH1
to connect to Te Horo Beach Road at a tee intersection. Consultation with local residents indicated a
preference for an alternative option which involves a northerly extension to a relocated Gear Road on the east
side which loops round to cross over the Expressway via an overbridge and then loops southwards to connect
up with Te Horo Beach Road at a tee intersection. This option has since been endorsed by NZTA as the
preferred solution on the basis of a recommendation from the PP2O Project Team.
The preferred option involves two additional crossings of the Mangaone Stream, with both the eastern and
western approach embankments to the overbridge located through known overland flow path areas. In the
case of the eastern approach embankment, the overland flow path runs parallel to the general direction of the
stream upstream of the NIMT railway and SH1 road crossings (see Figures 7.2 and 7.3). With the western
approach embankment, the overflow path runs through the old Lucinsky property having broken out of the
main channel along the right bank downstream of the existing SH1 culvert. (Figures 7.3 and 7.4).
Road geometric design considerations indicate that the eastern approach embankment to the overbridge does
not need to rise above natural ground level in order to achieve the required clearance over the expressway till
north of the additional Mangaone Stream Crossing upstream of the expressway. However the governing
criterion for setting road levels in this area will be achieving an adequate level of service with sufficient
freeboard for the Serviceability Limit Flood level (Transit NZ, 2003). This will require the roadway to be
elevated slightly as it crosses the floodplain roughly parallel with the expressway before crossing the stream
and looping around to cross the expressway via the overbridge.

NZ Transport AgencyPeka Peka to Otaki Expressway
Scheme Assessment ReportDesign Flood Levels for Waterway Crossings
Status Issue 1 Page 69 June 2011Project Number 440PN, 5-C1814.00 20110919 PP2O Technical Report Design Flood
Levels_v3_final draft
Figure 7.5 Proposed Expressway crossing of Mangaone Stream with local link road Proposal B (inflows
indicated by yellow arrows, outflows by red arrows)
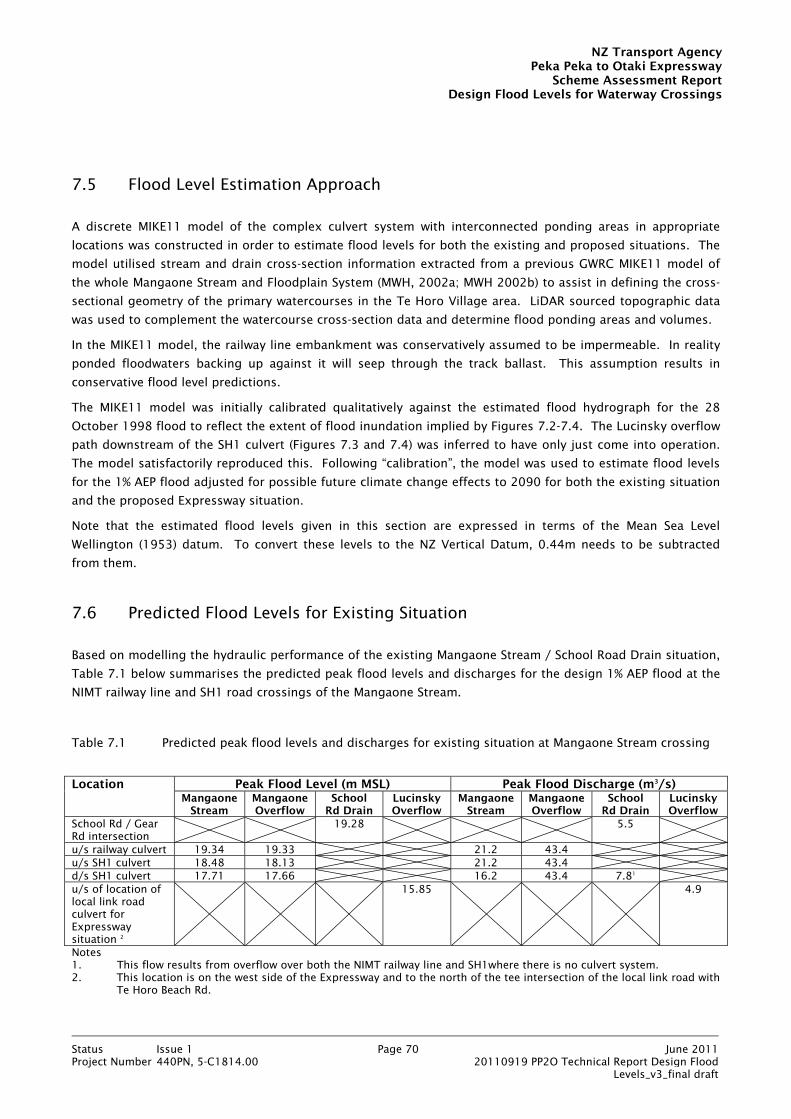
NZ Transport AgencyPeka Peka to Otaki Expressway
Scheme Assessment ReportDesign Flood Levels for Waterway Crossings
Status Issue 1 Page 70 June 2011Project Number 440PN, 5-C1814.00 20110919 PP2O Technical Report Design Flood
Levels_v3_final draft
7.5 Flood Level Estimation Approach
A discrete MIKE11 model of the complex culvert system with interconnected ponding areas in appropriate
locations was constructed in order to estimate flood levels for both the existing and proposed situations. The
model utilised stream and drain cross-section information extracted from a previous GWRC MIKE11 model of
the whole Mangaone Stream and Floodplain System (MWH, 2002a; MWH 2002b) to assist in defining the cross-
sectional geometry of the primary watercourses in the Te Horo Village area. LiDAR sourced topographic data
was used to complement the watercourse cross-section data and determine flood ponding areas and volumes.
In the MIKE11 model, the railway line embankment was conservatively assumed to be impermeable. In reality
ponded floodwaters backing up against it will seep through the track ballast. This assumption results in
conservative flood level predictions.
The MIKE11 model was initially calibrated qualitatively against the estimated flood hydrograph for the 28
October 1998 flood to reflect the extent of flood inundation implied by Figures 7.2-7.4. The Lucinsky overflow
path downstream of the SH1 culvert (Figures 7.3 and 7.4) was inferred to have only just come into operation.
The model satisfactorily reproduced this. Following “calibration”, the model was used to estimate flood levels
for the 1% AEP flood adjusted for possible future climate change effects to 2090 for both the existing situation
and the proposed Expressway situation.
Note that the estimated flood levels given in this section are expressed in terms of the Mean Sea Level
Wellington (1953) datum. To convert these levels to the NZ Vertical Datum, 0.44m needs to be subtracted
from them.
7.6 Predicted Flood Levels for Existing Situation
Based on modelling the hydraulic performance of the existing Mangaone Stream / School Road Drain situation,
Table 7.1 below summarises the predicted peak flood levels and discharges for the design 1% AEP flood at the
NIMT railway line and SH1 road crossings of the Mangaone Stream.
Table 7.1 Predicted peak flood levels and discharges for existing situation at Mangaone Stream crossing
Location Peak Flood Level (m MSL) Peak Flood Discharge (m3/s)
Mangaone Stream
Mangaone Overflow
School Rd Drain
Lucinsky Overflow
Mangaone Stream
Mangaone Overflow
School Rd Drain
Lucinsky Overflow
School Rd / Gear Rd intersection
19.28 5.5
u/s railway culvert 19.34 19.33 21.2 43.4 u/s SH1 culvert 18.48 18.13 21.2 43.4 d/s SH1 culvert 17.71 17.66 16.2 43.4 7.81 u/s of location of local link road culvert for Expressway situation 2
15.85 4.9
Notes 1. This flow results from overflow over both the NIMT railway line and SH1where there is no culvert system. 2. This location is on the west side of the Expressway and to the north of the tee intersection of the local link road with
Te Horo Beach Rd.

NZ Transport AgencyPeka Peka to Otaki Expressway
Scheme Assessment ReportDesign Flood Levels for Waterway Crossings
Status Issue 1 Page 71 June 2011Project Number 440PN, 5-C1814.00 20110919 PP2O Technical Report Design Flood
Levels_v3_final draft
Figure 7.6a Flood inundation map for existing situation for 1% AEP flood adjusted for possible climate
change effects to 2090 (inflows indicated by yellow arrows, outflows by red arrows)
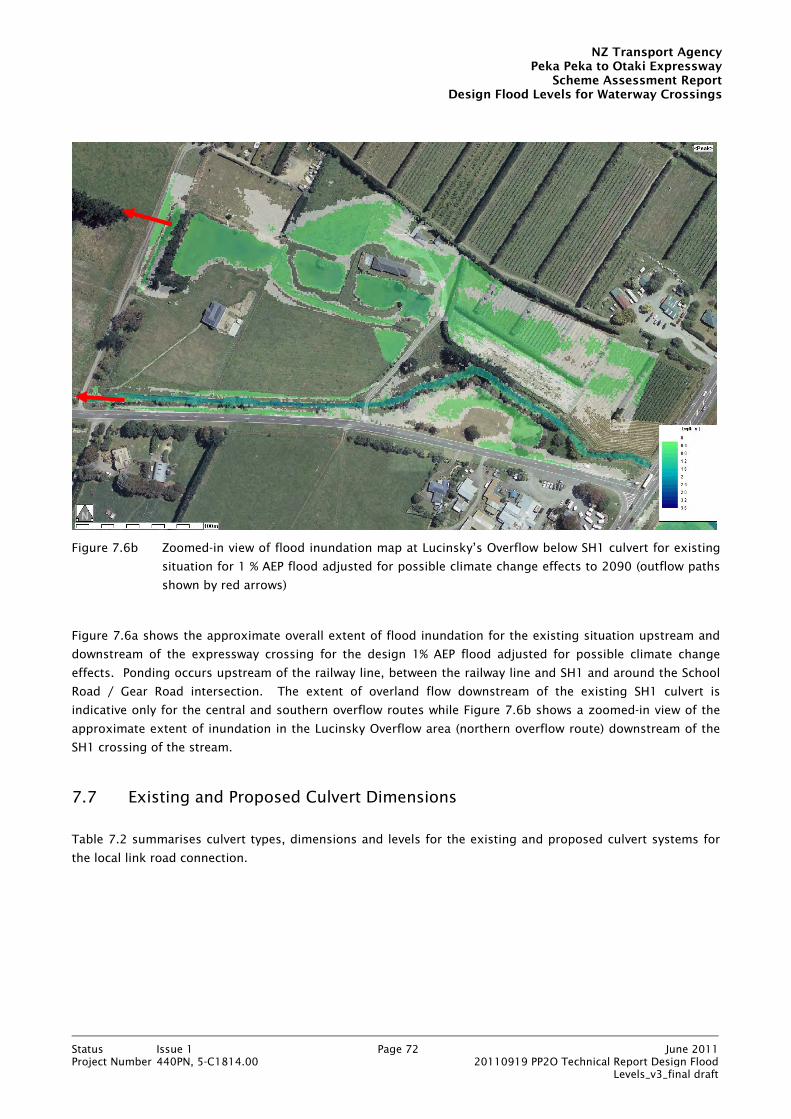
NZ Transport AgencyPeka Peka to Otaki Expressway
Scheme Assessment ReportDesign Flood Levels for Waterway Crossings
Status Issue 1 Page 72 June 2011Project Number 440PN, 5-C1814.00 20110919 PP2O Technical Report Design Flood
Levels_v3_final draft
Figure 7.6b Zoomed-in view of flood inundation map at Lucinsky’s Overflow below SH1 culvert for existing
situation for 1 % AEP flood adjusted for possible climate change effects to 2090 (outflow paths
shown by red arrows)
Figure 7.6a shows the approximate overall extent of flood inundation for the existing situation upstream and
downstream of the expressway crossing for the design 1% AEP flood adjusted for possible climate change
effects. Ponding occurs upstream of the railway line, between the railway line and SH1 and around the School
Road / Gear Road intersection. The extent of overland flow downstream of the existing SH1 culvert is
indicative only for the central and southern overflow routes while Figure 7.6b shows a zoomed-in view of the
approximate extent of inundation in the Lucinsky Overflow area (northern overflow route) downstream of the
SH1 crossing of the stream.
7.7 Existing and Proposed Culvert Dimensions
Table 7.2 summarises culvert types, dimensions and levels for the existing and proposed culvert systems for
the local link road connection.

NZ Transport AgencyPeka Peka to Otaki Expressway
Scheme Assessment ReportDesign Flood Levels for Waterway Crossings
Status Issue 1 Page 73 June 2011Project Number 440PN, 5-C1814.00 20110919 PP2O Technical Report Design Flood
Levels_v3_final draft
Table 7.2 Culvert types, dimensions and levels for proposed Expressway crossing of Mangaone Stream
(local link road Option B)
Location Type Size (m) Invert Level (m MSL
Wellington (1953))
Length (m)
Slope (%)
Road Level (m MSL
Wellington) u/s d/s
Mangaone Stream Local link road (eastern side) proposed
box 10.0 x 2.0 18.89 18.7 16 1.19 see note 2 below
Expressway – proposed box 5.0 x 2.0 17.71 16.64 50 2.14 see note 2 below
NIMT railway - existing box 3.0 x 2.8 16.5 16.45 2 2.5 19.34 SH1 - existing box 4.8 x 1.75 16.6 16.4 8 2.5 18.14 Local link road (western side)– proposed
single span bridge
see note 2 below
Mangaone Overflow Local link road – proposed
see note 1 below
to be determined
see note 2 below
Expressway - proposed box 8.0 x 1.5 18.23 17.85 50 0.76 see note 2 below
NIMT railway - existing box 6.0 x 1.5 16.44 15.94 4.5 11.1 19.24 SH1 - existing box 3.7 x 2.1 15.6 15.4 8 2.5 17.74 School Rd Drain Local link road – proposed
box 3 2.5 x 1.0 to be determined
to be determined
16 0 see note 2 below
Lucinsky Overflow Local link road (western side)– proposed
box 10.0 x 1.0 15.5 15.4 16 0.63 see note 2 below
Notes 1. Wide, low multi-cell box culvert provided for overland flow at this location to achieve a 5% AEP flood standard level of service for local link road. 2. Road level at this location to be determined as a result of the investigations summarised in this report 3. School Road Drain assumed to be diverted to run parallel with new local link road from Gear Road / School Road intersection to a low point in the ground topography opposite existing Gear Road / SH1 intersection. A box culvert under local link road provided to connect to flood storage area between local link road and proposed Expressway. In extreme flood situations, flood storage area would expand to inundate local link road north of culvert.
7.8 Predicted Flood Levels for Proposed Situation
Based on modelling the hydraulic performance of the proposed situation, Table 7.3 below summarises the
predicted peak flood levels and discharges for the design flood for the proposed Expressway situation
incorporating the Option B local link road connection. This table is in the same form as Table 7.1 for the
existing situation to facilitate easier comparison with the flood level and discharge predictions for that case.

NZ Transport AgencyPeka Peka to Otaki Expressway
Scheme Assessment ReportDesign Flood Levels for Waterway Crossings
Status Issue 1 Page 74 June 2011Project Number 440PN, 5-C1814.00 20110919 PP2O Technical Report Design Flood
Levels_v3_final draft
Table 7.3 Predicted peak flood levels and discharges for proposed expressway situation with local link
road Proposal B (1% AEP flood adjusted for possible climate change effects to 2090)
Location Peak Flood Level (m MSL) Peak Flood Discharge (m3/s)
Mangaone Stream
Mangaone Overflow
School Rd Drain
Lucinsky Overflow
Mangaone Stream
Mangaone Overflow
School Rd Drain
Lucinsky Overflow
School Rd / Gear Rd intersection
19.28 5.5
u/s of local link road culvert on east side of Expressway
20.99 52
u/s Expressway culvert
20.41 20.44 20.36 29.6 32.9
u/s railway culvert 19.25 19.24 20.1 41.4 u/s SH1 culvert 18.47 18.10 20.1 41.4 d/s SH1 culvert 17.71 17.62 15.5 41.4 u/s of local link road bridge on west side of Expressway
15.75 15.5
u/s of local link road culvert on west side of Expressway
15.99 4.7
With the proposed expressway incorporating the local link road, peak flood levels upstream of the existing
railway and SH1 road culverts remain much the same as for the existing situation and peak discharges
downstream of SH1 are also very close. This means that the extent of flood inundation downstream of Te
Horo along the Mangaone Stream will be unchanged from the present situation for a flood of the same
magnitude. However there is a significant increase in flood levels upstream of the expressway.
The expressway embankment through this area takes over the function of the railway embankment in the
existing situation as a flood detention bund. In order to make a valid comparison between the existing and
proposed situations (by excluding the effect of the sloping alluvial fan surface), it is necessary to consider the
relative maximum flood depth of the upstream pond in each case (rather than the peak flood level), even
though the railway line and the expressway embankment are spatially separated by a distance of more than
50m.
Table 7.4 below compares the relative peak flood depths for the design flood at three locations along the
length of the flood pond areas in the existing and proposed situations.

NZ Transport AgencyPeka Peka to Otaki Expressway
Scheme Assessment ReportDesign Flood Levels for Waterway Crossings
Status Issue 1 Page 75 June 2011Project Number 440PN, 5-C1814.00 20110919 PP2O Technical Report Design Flood
Levels_v3_final draft
Table 7.4 Relative peak flood depths for design 1% AEP flood adjusted for climate change effects in flood
ponding areas for existing and proposed situations
Location Existing Situation
(u/s of railway embankment) Proposed Situation
(u/s of expressway embankment) Relative Increase in Peak Depth
(m)
Ground Level (m
MSL)
Peak Flood
Level (m MSL)
Peak Depth
(m)
Ground Level (m
MSL)
Peak Flood
Level (m MSL)
Peak Depth
(m)
Mangaone Stream 18.25 19.34 1.09 18.65 20.41 1.76 0.67 Mangaone Overflow 17.85 19.33 1.48 18.45 20.44 1.99 0.51 School Rd Drain 18.85 19.28 0.43 19.45 20.36 0.91 0.48
Table 7.4 indicates that the relative increase in peak flood depths between the proposed and existing
situations at three ponding area locations is in the range of about 0.5-0.7m. The increased peak flood depths
in the proposed situation are due to a number of factors:
the prevention of road overtopping on the Expressway in the design flood event;
the elimination of leakage over the railway line and SH1 from the Gear Road / School Road intersection
which occurs in the existing situation; and
the slope (> 1%) of the alluvial fan surface that the Mangaone Stream flows across towards the sea.
The increased peak flood depths will be reflected in a slightly greater areal extent of flood ponding in the
proposed situation relative to the existing situation.
For flood levels upstream of the expressway to remain similar to those in the present situation, overtopping of
the expressway embankment would have to be allowed to occur which runs counter to the design philosophy
for the expressway as a lifeline link.
The local link road embankment and culvert across the Mangaone Stream also causes flood levels to be further
elevated. The predicted flood level in Table 7.3 is likely to be a conservative estimate as, in practice, leakage
of ponded floodwaters from the storage area upstream of the local link road to the storage areas either side of
the expressway culvert crossing of the Mangaone Stream would occur. This leakage has only been partially
allowed for in the MIKE11 model.
Table 7.3 shows that the peak flood level and discharge upstream of the local link road crossing of the
Lucinsky overflow in the design flood are generally very similar to the corresponding values for the existing
situation in Table 7.1. This means that the incorporation of a wide box culvert (10m x 1m) in the western
approach embankment to the local link road overbridge is sufficient to not impede flood breakout flows along
the Lucinsky overflow path (the flow depths along this overflow path are shallow and wide).
Although the peak flood levels upstream of the Expressway are higher, the extent of flood ponding is
constrained by the eastern approach embankment to the local link road overbridge and, more importantly, the
steep slope (> 1%) of the alluvial fan surface upstream of the Expressway. Flood inundation maps similar to
Figures 7.6a and b for the existing situation are shown in Figures 7.7a and b for the proposed situation.
Figure 7.7a shows that the extent of flood ponding upstream of the Expressway and local link road is well
short of any residential properties for the design flood. Fortunately this area is devoid of such properties that
would remain after construction of the Expressway.

NZ Transport AgencyPeka Peka to Otaki Expressway
Scheme Assessment ReportDesign Flood Levels for Waterway Crossings
Status Issue 1 Page 76 June 2011Project Number 440PN, 5-C1814.00 20110919 PP2O Technical Report Design Flood
Levels_v3_final draft
Figure 7.7a Flood inundation map for proposed situation for 1% AEP flood adjusted for possible climate
change effects to 2090 (inflow paths indicated by yellow arrows, outflow paths by red arrows)
Flood containment bund
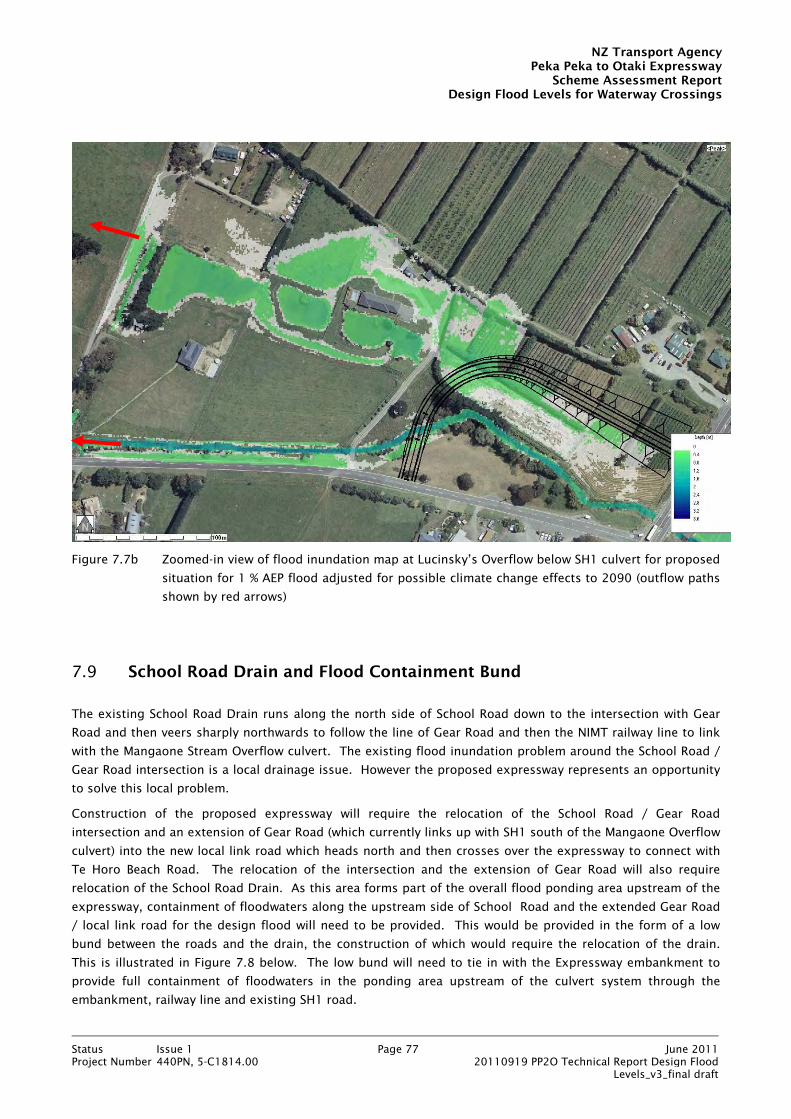
NZ Transport AgencyPeka Peka to Otaki Expressway
Scheme Assessment ReportDesign Flood Levels for Waterway Crossings
Status Issue 1 Page 77 June 2011Project Number 440PN, 5-C1814.00 20110919 PP2O Technical Report Design Flood
Levels_v3_final draft
Figure 7.7b Zoomed-in view of flood inundation map at Lucinsky’s Overflow below SH1 culvert for proposed
situation for 1 % AEP flood adjusted for possible climate change effects to 2090 (outflow paths
shown by red arrows)
7.9 School Road Drain and Flood Containment Bund
The existing School Road Drain runs along the north side of School Road down to the intersection with Gear
Road and then veers sharply northwards to follow the line of Gear Road and then the NIMT railway line to link
with the Mangaone Stream Overflow culvert. The existing flood inundation problem around the School Road /
Gear Road intersection is a local drainage issue. However the proposed expressway represents an opportunity
to solve this local problem.
Construction of the proposed expressway will require the relocation of the School Road / Gear Road
intersection and an extension of Gear Road (which currently links up with SH1 south of the Mangaone Overflow
culvert) into the new local link road which heads north and then crosses over the expressway to connect with
Te Horo Beach Road. The relocation of the intersection and the extension of Gear Road will also require
relocation of the School Road Drain. As this area forms part of the overall flood ponding area upstream of the
expressway, containment of floodwaters along the upstream side of School Road and the extended Gear Road
/ local link road for the design flood will need to be provided. This would be provided in the form of a low
bund between the roads and the drain, the construction of which would require the relocation of the drain.
This is illustrated in Figure 7.8 below. The low bund will need to tie in with the Expressway embankment to
provide full containment of floodwaters in the ponding area upstream of the culvert system through the
embankment, railway line and existing SH1 road.

NZ Transport AgencyPeka Peka to Otaki Expressway
Scheme Assessment ReportDesign Flood Levels for Waterway Crossings
Status Issue 1 Page 78 June 2011Project Number 440PN, 5-C1814.00 20110919 PP2O Technical Report Design Flood
Levels_v3_final draft
The construction of the low bund between School Road / Gear Road / the new local link road and the drain will
prevent the lateral spread of floodwaters towards those properties that are currently at risk of flood inundation
in only moderate storm events in the existing situation.
7.10 Sensitivity of Flood Levels at Expressway Crossing to Flood Magnitude
Table 7.5 compares peak flood levels for the proposed expressway crossing of the Mangaone Stream and
floodplain for the 1% and 0.5% AEP floods adjusted for the effects of possible future climate change to 2090.
Table 7.5 Predicted peak flood levels for proposed expressway crossing of the Mangaone Stream and
floodplain for different flood magnitudes adjusted for effects of possible future climate change
to 2090
Location upstream
of Expressway
1% AEP Flood 0.5% AEP Flood
Peak Flood Level
(m MSL Wellington)
Peak Outflow
(m3/s)
Peak Flood Level
(m MSL Wellington)
Peak Outflow
(m3/s)
Mangaone Stream 20.41 29.6 20.81 29.9
Mangaone Overflow 20.44 32.9 20.80 41.9
School Road Drain 20.36 n/a 20.80 n/a
The flood level data in Table 7.5 indicate that an increase in total inflow of 8.5m3/s (from 80.2m3/s to
88.7m3/s for the 1% and 0.5% AEP floods respectively adjusted for possible climate change effects – Table 3.9)
to the flood storage area upstream of the expressway embankment gives rise to a typical increase in peak
flood level at each location of ~ 0.4m.

NZ Transport AgencyPeka Peka to Otaki Expressway
Scheme Assessment ReportDesign Flood Levels for Waterway Crossings
Status Issue 1 Page 79 June 2011Project Number 440PN, 5-C1814.00 20110919 PP2O Technical Report Design Flood
Levels_v3_final draft
Figure 7.8 Proposed diversion of School Road Drain and associated flood containment bund (inflow paths
indicated by yellow arrows, outflow paths by red arrows)
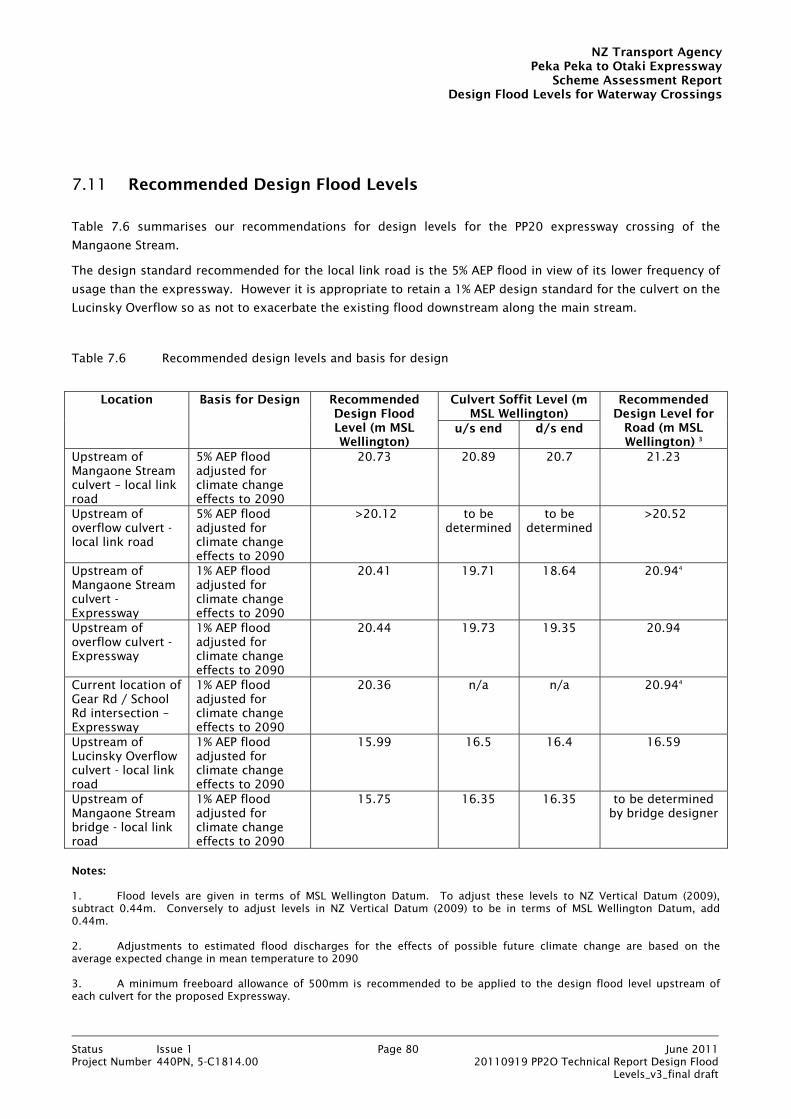
NZ Transport AgencyPeka Peka to Otaki Expressway
Scheme Assessment ReportDesign Flood Levels for Waterway Crossings
Status Issue 1 Page 80 June 2011Project Number 440PN, 5-C1814.00 20110919 PP2O Technical Report Design Flood
Levels_v3_final draft
7.11 Recommended Design Flood Levels
Table 7.6 summarises our recommendations for design levels for the PP20 expressway crossing of the
Mangaone Stream.
The design standard recommended for the local link road is the 5% AEP flood in view of its lower frequency of
usage than the expressway. However it is appropriate to retain a 1% AEP design standard for the culvert on the
Lucinsky Overflow so as not to exacerbate the existing flood downstream along the main stream.
Table 7.6 Recommended design levels and basis for design
Location Basis for Design Recommended
Design Flood Level (m MSL Wellington)
Culvert Soffit Level (m MSL Wellington)
Recommended Design Level for
Road (m MSL Wellington) 3
u/s end d/s end
Upstream of Mangaone Stream culvert – local link road
5% AEP flood adjusted for climate change effects to 2090
20.73 20.89 20.7 21.23
Upstream of overflow culvert - local link road
5% AEP flood adjusted for climate change effects to 2090
>20.12 to be determined
to be determined
>20.52
Upstream of Mangaone Stream culvert - Expressway
1% AEP flood adjusted for climate change effects to 2090
20.41 19.71 18.64 20.944
Upstream of overflow culvert - Expressway
1% AEP flood adjusted for climate change effects to 2090
20.44 19.73 19.35 20.94
Current location of Gear Rd / School Rd intersection – Expressway
1% AEP flood adjusted for climate change effects to 2090
20.36 n/a n/a 20.944
Upstream of Lucinsky Overflow culvert - local link road
1% AEP flood adjusted for climate change effects to 2090
15.99 16.5 16.4 16.59
Upstream of Mangaone Stream bridge - local link road
1% AEP flood adjusted for climate change effects to 2090
15.75 16.35 16.35 to be determined by bridge designer
Notes: 1. Flood levels are given in terms of MSL Wellington Datum. To adjust these levels to NZ Vertical Datum (2009), subtract 0.44m. Conversely to adjust levels in NZ Vertical Datum (2009) to be in terms of MSL Wellington Datum, add 0.44m. 2. Adjustments to estimated flood discharges for the effects of possible future climate change are based on the average expected change in mean temperature to 2090 3. A minimum freeboard allowance of 500mm is recommended to be applied to the design flood level upstream of each culvert for the proposed Expressway.

NZ Transport AgencyPeka Peka to Otaki Expressway
Scheme Assessment ReportDesign Flood Levels for Waterway Crossings
Status Issue 1 Page 81 June 2011Project Number 440PN, 5-C1814.00 20110919 PP2O Technical Report Design Flood
Levels_v3_final draft
4. These design levels set to be the same as at the Mangaone Overflow culvert.

NZ Transport AgencyPeka Peka to Otaki Expressway
Scheme Assessment ReportDesign Flood Levels for Waterway Crossings
Status Issue 1 Page 82 June 2011Project Number 440PN, 5-C1814.00 20110919 PP2O Technical Report Design Flood
Levels_v3_final draft
8. Conclusions
The proposed expressway route traverses a narrow coastal plain which is made up of a series of floodplains for
a number of watercourses. This report has presented the results of hydrologic and hydraulic investigations
undertaken to assess the impact of the proposed expressway and establish design flood levels for crossings of
the following major watercourses:
the Otaki River and floodplain crossing;
the Waitohu Stream and floodplain crossing;
the Mangaone Stream and floodplain crossing; and
the Mangapouri Stream crossing.
The establishment of design flood levels for these crossings has required extensive computational hydraulic
modelling, both one-dimensional and two-dimensional. The fundamental principles underlying these
investigations has been where possible, to achieve hydraulic neutrality with the proposed expressway
development (i.e. ensure peak flood levels for the same flood event are generally no worse than in the existing
situation).
The proposed Waitohu Stream crossing is located within a geomorphologic zone of instability characterised by
lateral channel instability and sediment deposition. To accommodate the instability of this zone, a minimum
75m span bridge comprised of three spans each of 25m is recommended. This span length allows the two
piers for the bridge to be located on either side of the existing active channel for the stream. Pier head losses
will be minimal under design and super-design flood conditions.
In the case of the Waitohu floodplain crossing, the expressway must be constructed as a raised embankment
across the 0.8km wide floodplain. Existing overland flow paths across this floodplain require the incorporation
of dry culverts through the expressway embankment to maintain the continuity of these flow paths. While the
construction of a flood barrier with point leakage paths though it does have the effect of elevating flood levels
immediately in front of the barrier compared to the existing situation, the backwater effect of the barrier
rapidly diminishes with distance upstream due to the steepness of the floodplain. The relative effect on two
local residential properties on the floodplain is negligible. Downstream flood discharges are no worse than in
the existing situation.
Currently the combination of the existing County Road and NIMT railway culverts on the Mangapouri Stream in
conjunction with the railway embankment acting as a flood detention barrier provides an effective throttle for
limiting downstream flows through Otaki Township. As construction of the proposed expressway will require
the railway line to be relocated westwards, the expressway embankment will take over the flood detention
barrier function of the railway embankment with the combination of the new expressway and railway culverts
acting as a throttle for flood flows. Upstream properties along County Road and the northern side of Rahui
Road already lie within the flood inundation zone induced by flood detention behind the existing railway line.
The flood levels upstream of the proposed expressway embankment for the same floods will be no worse than
for the current situation while peak discharges downstream will be lower. This means that the additional flood
storage provided by the expressway potentially offers a slight reduction in the flood hazard to downstream
properties.
NZ Transport AgencyPeka Peka to Otaki Expressway
Scheme Assessment ReportDesign Flood Levels for Waterway Crossings
Status Issue 1 Page 83 June 2011Project Number 440PN, 5-C1814.00 20110919 PP2O Technical Report Design Flood
Levels_v3_final draft
The proposed Otaki River Crossing will be comprised of two parallel bridges with a total span similar to that of
the downstream railway bridge although the pier spacing will be much larger. This geometry means that,
unlike the existing SH1 bridge, the expressway bridges will not act as a constriction to flood flows in the main
river. Pier head losses will also be minimal. A minimum design flood level of RL 15.9m (MSL Wellington
datum) based on the 0.2% AEP design flood is recommended for the bridges with a freeboard allowance of at
least 1.2m for woody debris clearance.
The expressway crossing of the Otaki River floodplain on the north bank of the river presents an opportunity
to provide greater flood security to Otaki Township than at present. Currently the township is protected by the
Chrystal’s Bend extended stopbank constructed to a 1% AEP design flood standard based on current climate
conditions. The stopbank would be overtopped by the 0.2% AEP flood (approximately equal to the 1% AEP
flood adjusted for possible climate change effects to 2090) which is recommended to be adopted as the
serviceability limit state design standard for the bridge crossing of the Otaki River.
If the expressway crossing of the Otaki River floodplain is constructed as a raised embankment, this
embankment could act as a flood detention barrier causing stopbank overflows to pond in front of it. Design
levels have been established for the raised embankment on the basis of two-dimensional computational
hydraulic modelling of flood flows across the floodplain. The recommended embankment configuration
incorporates a 20m wide by 1.5m high culvert through the embankment near the junction of the Chrystal’s
Bend extended stopbank with the expressway to provide a drainage outlet for the ponded floodwaters (this
could also function as a drainage outlet for surface runoff from the series of very small semi-urban catchments
immediately to the south of the Mangapouri Catchment). This culvert reduces the extent of flood inundation
arising from stopbank overflows through Otaki Township compared to the existing situation for the super-
design 0.2% AEP flood adjusted for possible climate change effects to 2090. Stopbank overflows from the
same flood would also affect the Mangapouri Stream flood inundation zone due to ponding upstream of the
expressway embankment whereas this area would not be affected in the present situation.
The existing SH1 crossing of the Mangaone Stream at Te Horo is a known flooding hotspot with overtopping of
the highway occuring regularly every few years. As with the expressway crossing of the Otaki River floodplain,
construction of the proposed expressway on a raised embankment provides an opportunity to improve the
flood security to the railway line, the existing SH1 and downstream residential properties. The expressway
embankment would act as a flood detention barrier impounding floodwater upstream.
The configuration of the proposed Mangaone Stream and floodplain crossing would require in addition to the
existing railway and SH1 culvert systems:
a culvert under the expressway on the main Mangaone Stream channel;
a culvert under the expressway aligned with the existing NIMT railway and SH1 overflow culverts;
a culvert under the local link road (eastern side) on the main stream channel;
a wide, low culvert system under the local link road (eastern side) aligned with the expressway, NIMT
railway and SH1 overflow culverts to convey overland flow;
a culvert under the local link road (western side) on the main stream channel;
a culvert under the local link road (western side) on the Lucinsky Overflow;
diversion of the School Road drain along the eastern side of the local link road, under the local link
road to the expressway embankment and then along the upstream side of the expressway to the
Mangaone Overflow culvert;
a low flood containment bund between School Road / local link road and the School Road drain; and

NZ Transport AgencyPeka Peka to Otaki Expressway
Scheme Assessment ReportDesign Flood Levels for Waterway Crossings
Status Issue 1 Page 84 June 2011Project Number 440PN, 5-C1814.00 20110919 PP2O Technical Report Design Flood
Levels_v3_final draft
a culvert under the local link road for the diverted School Road drain.
The effects of flood ponding upstream of the expressway embankment would not impact on any residential
properties on the floodplain. The culvert system would not make flood discharges (and hence flood levels) on
the western (downstream) side of SH1 any worse than in the existing situation. The culvert under the western
approach embankment to the east-west local link road overbridge would not impede flood flows along the
Lucinsky Overflow.

NZ Transport AgencyPeka Peka to Otaki Expressway
Scheme Assessment ReportDesign Flood Levels for Waterway Crossings
Status Issue 1 Page 85 June 2011Project Number 440PN, 5-C1814.00 20110919 PP2O Technical Report Design Flood
Levels_v3_final draft
9. References
AUSTROADS (1994). Waterway Design, A Guide to the Hydraulic Design of Bridges, Culverts and Floodways.
AUSTROADS, Sydney, 137p.
GWRC (2003). “Waitohu Stream Study: Flood Report”. Report prepared by M Harkness, Resource Investigations
Department, Greater Wellington Regional Council, July 2003.
GWRC (2004a). “Waitohu Stream Study: River Characteristics and Sedimentation”, Channel Management.
Report prepared by G & E Williams Consultants Ltd for GWRC, Greater Wellington Regional Council, April 2004.
GWRC (2004b). “Waitohu Stream Study: Hydraulic Modelling”. Report prepared by P Wallace, Flood Protection,
Greater Wellington Regional Council, July 2004.
GWRC (2007). “Hydraulic Assessment of Chrystall’s Extended Stopbank”. Report prepared by P Wallace for
Greater Wellington Regional Council, March 2007.
Montes, S (1998). Hydraulics of Open Channel Flow. ASCE Press, Reston Virginia, 697p.
McKerchar, A I and Pearson, C P (1989). Flood Frequency in New Zealand. Publication No. 20 of Hydrology
Centre, Division of Water Sciences, DSIR, Christchurch.
McKerchar, A I (1991). “Kapiti Coast Flood Plain Management; Hydrology and Climatology”. Report prepared
for Wellington Regional Council by Hydrology Centre, DSIR Marine & Freshwater, Christchurch.
MfE (2010). Tools for Estimating the Effects of Climate Change on Flood Flow: A Guidance Manual for Local
Government in New Zealand. Ministry for the Environment Publication No. ME 1013, New Zealand Government,
May 2010.
MWH (2002a). “Mangaone Stream Flood Hazard Assessment, Summary Report”. Report prepared by
Montgomery Watson Harza for Wellington Regional Council, WRC Publication No. WRC/FPSA-T-02/25, June
2002.
MWH (2002b). “Mangaone Stream Flood Hazard Assessment, Hydraulic Modelling Report”. Report prepared by
Montgomery Watson Harza for Wellington Regional Council, 2 Volumes, WRC Publication No. WRC/FPSA-T-
02/27, June 2002.
O’Rourke, T D (2007). “Critical Infrastructure, Interdependencies and Resilience”. US National Academy of
Engineering, The Bridge, Vol. 37, No. 1, Spring 2007, pp22-29.
Transit NZ (2003). Bridge Manual. Second edition, Transit New Zealand (now NZ Transport Agency), June
2003.
TAC (2004). Guide to Bridge Hydraulics. Second edition, Thomas Telford, London, by arrangement with the
Transportation Association of Canada, 181p.
WRC (1989). “Otaki Floodplain Management Plan: Mangapouri Stream Upgrade Hydraulic Modelling Report”.
Wellington Regional Council Report No. WRC/RI-T-97.48, February 1998.

NZ Transport AgencyPeka Peka to Otaki Expressway
Scheme Assessment ReportDesign Flood Levels for Waterway Crossings
Status Issue 1 Page 86 June 2011Project Number 440PN, 5-C1814.00 20110919 PP2O Technical Report Design Flood
Levels_v3_final draft
ANNEX A
Feedback Responses from Opus PIN Inquiry on Level of Service for Floodplain Crossings by Roads

NZ Transport AgencyPeka Peka to Otaki Expressway
Scheme Assessment ReportDesign Flood Levels for Waterway Crossings
Status Issue 1 Page 87 June 2011Project Number 440PN, 5-C1814.00 20110919 PP2O Technical Report Design Flood
Levels_v3_final draft
1. Roelof De Haan, Manager – Environmental Engineering, Nelson As fill material is at a premium, can the 2 seaward lanes be at a slightly lower level, and subject to allowed inundation in certain areas, whereas the landward 2 lanes are raised high enough as lifeline routes? Adequate connections between them will be necessary either side of the expected/planned inundated areas. In addition the extreme water level situations could be retained on the seaward side by a protective embankment (using less material to construct than the road profile). The upstream flood plains need then to be protected by stopbanks. 2. Russell Lane, FM / Asset Management Consultant, Christchurch How about creating a temporary river bed/flood channel to take the excess river flow - review Dutch experience below. Overview The Rhine River Delta experiences annual flooding. In 1993 and 1995, floods devastated regions surrounding the delta. In the neighbouring vicinity over 200,000 people were evacuated. Climate change is ongoing, and as the river floods each year the water distributes sediments throughout the flood plain which in turn reduces the space that was initially allowed for annual floods. In 2006 the Dutch Cabinet proposed the Spatial Planning Key Decision (SPKD). The SPKD is a design plan for more highly innovated structures and the modification of existing structures in the immediate floodplain site. Meander Consultancy and Research Partners contributed to the site analysis and interpretation. The project will be ongoing from 2006 until 2015. The Room for the River project site encompasses four rivers: the Rhine, the Meuse, the Waal, and the IJssel. The area to be addressed begins in the Netherlands, flows into Germany into a portion of France and finally reaches into Switzerland. The design presents an integrated spatial plan with the main objectives of flood protection, master landscaping and the improvement of overall environmental conditions. Completion of a basic package of forty projects is foreseen for 2015, with a budget of 2.2 billion. Measures in the plan include: placing and moving dykes, depoldering, creating and increasing the depth of flood channels, reducing the height of the groynes, removing obstacles, and the construction of a Green River which would serve as a flood bypass. This will result in lower flood levels. By 2015 the Rhine branches will safely cope with an outlet capacity of 16,000 cubic meters of water per second; the measures implemented to achieve this will also improve the quality of the environment of the river basin. [edit] Features Relocation of dykes Dykes will be relocated father from the river shore. This will create additional space within the flood plain for the river during annual floods. Lower the level of floodplain In addition to the relocation of the dykes, the floodplain bottom will be lowered in depth. Increasing the depth in the floodplain must occur due to the collection of sediments in the area after years of regular flooding. Reduce height of the groynes The groynes within the riverbed will be lowered to allow for more drainage to occur during an increase in water levels more quickly than presently positioned. Groynes will be added in specified locations in addition to the modifications occurring to the existing structures. Construction of a Green Channel A Green Channel will be constructed serving as a flood bypass around Veessen-Wapenveld. Increase the depth of the side channels Side channels will be lowered in depth to increase the barrier between the river and infrastructures and residents. It will also allow for more water to be removed from the flooded location thus reducing the breach of the dykes. Removal of obstacles Locations along the river where there are obstacles will be addressed. For example, the hydraulic bridge at Oosterbeek will be removed.

NZ Transport AgencyPeka Peka to Otaki Expressway
Scheme Assessment ReportDesign Flood Levels for Waterway Crossings
Status Issue 1 Page 88 June 2011Project Number 440PN, 5-C1814.00 20110919 PP2O Technical Report Design Flood
Levels_v3_final draft
3. Simon Bush, Structures Asset Management Team Leader, Auckland From my point of view, and others will no doubt have a different one, a lifeline does not need to be fully operational during or post event, what it does have to do is provide some semblance of service after the event. By providing the service, albeit reduced (say a single lane of operation), it allows the emergency services and the community to still function and life to rebuild. I'd therefore say the LoS has to: 1) Ensure the infrastructure is not destroyed during the event (i.e. over-topping) - adequate freeboard for the low probability event - may even be well beyond the 1:100yr event 2) Ensure that some level of service is available afterwards i.e. is the embankment robust enough - has enough flow paths for water etc 3) Is the proposed solution simple enough for local contractors to patch and repair afterwards (i.e. limited retaining walls, only simple drainage structures etc) I've found O'Rourke's Paper on critical infrastructure useful in these types of situations. The paper listed below looks at inter-dependency, and the ability to get back to some semblance of service after the event. In the paper he looks at hurricane Katrina. http://www.nae.edu/Publications/TheBridge/Archives/V-37-1EngineeringfortheTh reatofNaturalDisasters/CriticalInfrastructureInterdependenciesandResilience.aspx 4. John Crawford, Technical Principal – Wastewater, Hamilton I suggest you talk to Richard Fallas in Auckland. He has recently been grappling with this issue for the Mt Maunganui to Te Puke Expressway as part of the Opus/Fulton Hogan D&C Team (they have been awarded the contract) where he is design team leader. Have had various discussions/debates with Richard on this and I think they have settled on a Zero freeboard, very long weir concept whereby a superelevation is applied right across the carriageway, with the high edge forming the weir crest on the upstream side. Thus you get flow across the carriageway but it is essentially supercritical and very shallow depth so you can still drive (slowly) through it without closing lanes unless you have a high, tidally influenced tail water. I imagine the downstream road shoulder would need to be reasonably robust - but then, some damage may be acceptable under a 0.2 or 0.5% AEP event. By not having the high point (crown) in the middle of the road, you both avoid closing lanes 9assuming you can keep the depth down) and reduce the fill requirement even further. By now, I imagine Richard will have been able to ascertain the acceptability of the level of service provided by this solution. A potential down side was the fact that the lanes in one direction, along the weir length, will have a reverse camber. 5. Rick Jarvis, Manager – infrastructure and Asset Management, Chatswood, NSW, Australia Having recently driven this bit of SH1 recently, I am not at all surprised by your problem. LoS: Low speed but high load capacity will be required for the essential transport and civil defence needs. As it will be the only dry land for miles, It will be the refuge for stock and vehicles - so expect to need some width, not just 2 lanes. Stock don't respect fences when they are swimming. With extra width you can trade out of the need for continuous barrier fencing (-how much fill = a guardrail). Freeboard: I would not risk a minimal freeboard, you could lose the downstream side of the embankment with even small overflows scouring the face. There is going to be a lot of debris (including cars and houses) in a flood of that size, so all the embankment perforations need to be sizeable, and with plenty of afflux in the main channels. For each floodplain there is a relationship between the permeability of the embankment and the upstream top water levels, so one would hope there is an optimal area of voids in the embankment to the volume of fill required. I would first seek out a least cost permeability solution such as large Bebo arches at various centres and seek the magic spacing number.
NZ Transport AgencyPeka Peka to Otaki Expressway
Scheme Assessment ReportDesign Flood Levels for Waterway Crossings
Status Issue 1 Page 89 June 2011Project Number 440PN, 5-C1814.00 20110919 PP2O Technical Report Design Flood
Levels_v3_final draft
6. Paul Ryan, Principal Planner & Environmental Engineer, Hamilton The Lower Waikato-Waipa Flood Control Scheme provides for the Waikato River to spill over State Highway 1 in a controlled manner at Rangiriri, north of Huntly. I recall that such spillage has occurred at least a couple of times in the last 30 years. This spillage rationalises what occurred naturally before the State highway existed; excess flow in the Waikato River channel flows into Lake Waikare to the east of the State highway and relieves flood pressure on the river downstream of Rangiriri. (The discharge from Lake Waikare back into the Waikato River further downstream is controlled by a radial flood gate). I understand that during design flood conditions the flow depth and velocity over the State highway is such that vehicles can continue to use the State highway, but the traffic is reduced to one lane. Stopbanks exist on both sides of the Waikato River both upstream and downstream of Rangiriri, but the crest of the stopbanks drop down and the spillway section is designed, and has been constructed, to function as a broad-crested weir. The State highway is right alongside, but a metre or so below the spillway crest. The spillway comprises two sections with total length of about 1.4km. 7. Alex McKenzie, Regional Contracts Engineer, Hamilton Some thoughts from afar. I think the road and the location is strategically important. The prime road access to Wellington the capital of our country should be on a virtual "Never Closed" rating. As highlight by recent events in Christchurch there will always need to be guaranteed access to Wellington. I realise that this lifts it out of just consideration of closure due to flooding. So do you construct a causeway or an embankment. An embankment acts as a dam or a block to flood flows. A causeway involves suitable spaced flood ways possibly banks of large culverts, Armco arches and the like to release the super flood waters. If the embankment fill material is difficult to source or costly then consider regular bridges even without any permanent water courses. We have constructed embankments with scour proof surfacing so that the embankment acts as a large weir or a number of large weirs so that the water flows over the road. Unfortunately this usually means that the road is unusable during the period the water is flowing over the roadway and so misses the need of maintaining continuous access. Do you have an idea as to how long the super flood peaks would be in effect? Up to 12 hours and it is manageable. Up to 24 hours can be accepted but if you are looking at days then it will not be acceptable for Wellington to be cut off. In all likelihood if the you have major flooding in this area then you will have flooding over the range and possibly closure of State Highway 2 and the Hutt Valley. This increases the importance of need to have all weather all day access to the greater Wellington area. In summary you need to include passage way for a very serious flood and to then build in control weirs in the embankment to maintain the flood level so that the bridge structures are not permanent or temporarily put at risk. 8. Nigel Edger, Geotechnical Engineer, Hamilton You say the embankment blocks the floodplain - why not alleviate the blockage? Low flat wide culverts at intervals to allow flood waters thru the embankment. Obviously a bit expensive, but could enable a lower embankment with savings there.... 9. Harlan Kelly, Vice-President, Opus Dayton Knight, Vancouver, Canada Palm Springs California has highway designs that are simple weir crests for flash floods 10. Michael Haydon, Principal Civil Engineer, Auckland I can't answer the hydrological aspects of your query Grant; perhaps someone in Hamilton can as there is a major 'overflow' weir for the Waikato south of Mercer which permits the Waikato to drain into swamps on the other side of the highway in extreme flood conditions. NZTA (TNZ) must have established levels of service for this site which could be what you are looking for.
NZ Transport AgencyPeka Peka to Otaki Expressway
Scheme Assessment ReportDesign Flood Levels for Waterway Crossings
Status Issue 1 Page 90 June 2011Project Number 440PN, 5-C1814.00 20110919 PP2O Technical Report Design Flood
Levels_v3_final draft
11. Haran Arampamoorthy, Principal Researcher – Transportation Engineering, Central Laboratories, Lower Hutt Is there a chance of the existing river or stream changes it's path after the road and bridge constructed? If it is a floodplain then it is a possibility that may be investigated. In India there are places where the river trace in floodplain changed completely and the road protection work was not very successful. 12. Warren Bird, Principal Environmental Engineer, Auckland NZTA guidance on this subject is widely scattered: The Bridge Manual requires either 600 or 1200mm of freeboard to the underside of bridges, depending on debris blockage potential (i.e. no road overflow). The Bridge Manual allows heading up to occur at culverts, but requires 500mm freeboard to road surface level (i.e. no road overflow) The Roads of National Significance (RONS) standard is silent on the issue. The NZTA Stormwater Treatment Standard says quite a lot, but is mostly focussed on off-site effects, and doesn't really address on-site level-of-service issues. The NRB Highway Surface Drainage guideline requires surface water depth no greater than 4mm in a 2 yr/10minute storm. It is mainly focussed on aqua-planing risk, and recognizes that deeper water will occur in bigger storms but traffic speeds will be correspondingly slower. The best guidance probably comes from some recent design-build PRs (principal's requirements - e.g. Christchurch Southern Motorway) which typically say something like 'no flow on traffic lanes in a 20yr/10min storm, with a max shoulder depth of 100mm and velocity of 2m/s'; and 'in a 100yr/10 min storm at least 2m width of a 2-lane road, and at least 2 lanes of a 4-lane road should be clear of flooding, with flooded lanes no greater than 100mm depth and 2m/s velocity'. [Storm durations would need to be adjusted for Otaki.] My opinion is that a strategic arterial road should be passable to emergency services for the entire duration of a big storm event, and re-open to all vehicles straight after. It should remain open to all vehicles in a moderate event (although perhaps with reduced lane availability as above). Zero freeboard (i.e. spillway overflow) may be acceptable in certain circumstances. The SH1 Rangiriri spillway has a very adequate all-weather bypass available on the other side of the river. There is no such similar all-weather bypass within cooey of Otaki-PekaPeka, so I suggest any overflow that interrupts traffic is highly undesirable. The Tauranga Eastern Link spillway is going to be equipped with an automatic flood warning system - I presume the alternative route is flood-free. In short: provide ample bridge waterways, and don't rely too much on road overflow. Consider overflow channels and extra bridges if required. It will probably be cost-effective to optimise bridge waterways by modelling. On a different note, embankments in flood plains remove flood storage, and may isolate even larger areas of storage behind their cordon. If the storage lost is a big proportion of the available storage in a given area, then compensatory storage may need to be provided. 13. John Wells, Senior Design Engineer, Gisborne Warren has hit the issue for the Otaki coast right on the head in his penultimate paragraph - "Provide ample bridge waterways------Consider overflow channels and extra bridges if necessary". By the time water levels get up to the crest level/crown of a road on an embankment acting as a weir, everything upstream is drowned - On the Otaki Coast that means side-roads, vehicles, buildings, crops, animals and probably people. Release of the ponded water needs to be at a considerably lower level than that. 14. Tony Loveday, Technical Principal – Stormwater, Toowoomba, Queensland, Australia I agree with John's general approach here & we have done the same on some of the Western Downs flood plains. "Crest" on the upstream side, long (as long as possible) level floodways. Bridges can be given higher freeboard than the approach roads either side (as the consequence of damage is greater). For Australia, the published design standard for "national highways" is Q100 immunity & that is usually taken to mean no freeboard. For vast lengths of our national highways (mostly the bits away from the major cities), even that is unattainable in

NZ Transport AgencyPeka Peka to Otaki Expressway
Scheme Assessment ReportDesign Flood Levels for Waterway Crossings
Status Issue 1 Page 91 June 2011Project Number 440PN, 5-C1814.00 20110919 PP2O Technical Report Design Flood
Levels_v3_final draft
any practical sense so we often end up with "do the best you can with the available budget" as the design standard. As a very rough rule of thumb, to avoid (or minimise) damage to the downstream side in overtopping events we try & set floodway levels and lengths and underdrainage capacity so that the difference in elevation between the upstream & downstream water levels at the point of overtopping is around 300mm. 15. Peter McCarten, Principal Design Engineer (Civil), Napier Response by telephone. The design of the Napier / Hastings Expressway several years ago had very similar issues as it crossed a major overflow path of the Ngaruroro River at a distance of more than 10km from the coast where floodplain levels were of the order of only 3-4m above mean sea level. Because of the very low lying nature of the ground, the expressway could not be elevated very much as this would have created a very wide dam with a extensive ponding area upstream of it. The decision was made to elevate the expressway a maximum of 300mm above natural ground levels to minimise blockage of the natural overflow path to the sea. I have intimate knowledge of the Mangaone Stream from childhood days spent eeling in it while staying at Te Horo Beach. In my opinion the stream channel has suffered from a lack of maintenance over the years causing its flood capacity to be deficient.


