28
APPENDIX D – SEISMIC REFRACTION/REFLECTION REPORT
APPENDIX D – SEISMIC REFRACTION/REFLECTION REPORT


. TERRA PHYSICS 28841 Base Line Road Highland, CA 92346 phone/fax (909)862-0626
GEOPHYSICAL SURVEY LIMITATIONS
Geophysical exploration is not an exact science, only an additional tool used to locate subsurface material boundaries and measure their physical properties. TERRA PHYSICS is not a guarantor of the services provided, but agrees to perform services in a professional and non-negligent manner and according to information and data available to us. Users of this report should recognize the extreme difficulty in locating undocumented, subsurface material boundaries due to factors such as changing stratigraphy and hydrology and the proximity of near-surface sources of vibrational and electrical noise.
Data and results presented in this report were compiled from existing geological data and the current surveys. Geophysical interpretation of subsurface conditions from the surface measurements is not unique. These results represent reasonable descriptions of the geological conditions and are presented for information only. The results should be verified by direct investigation methods. Complex subsurface geology may prevent reliable extrapolation of these results away from their original measurement locations. TERRA PHYSICS reserves the right to review this report’s results when additional information concerning this investigation is available in the future.
i

. TERRA PHYSICS 28841 Base Line Road Highland, CA 92346 phone/fax (909)862-0626
TABLE OF CONTENTS Section Page 1.0 INTRODUCTION......................................................................................................................................1 1.1 Scope Of Work ..................................................................................................................................1 1.2 Survey Design.....................................................................................................................................1 1.3 Schedule ..............................................................................................................................................2 2.0 SUMMARY OF RESULTS .....................................................................................................................5 2.1 Site 2 – Seismic Profile 13 (Operational Area L) Results .................................................................6 2.2 Site 2 – Refraction Profile 14 (RWQC6 Disposal Area) Results ....................................................13 2.3 Wolfskill Property – Refraction Profiles 15 and 16 (Wetlands) Results ........................................16 3.0 REFERENCE............................................................................................................................................21
LIST OF FIGURES Figure 1 Beaumont Site 2/Wolfskill Property General Location Map................................................................1 2 Beaumont Site 2/Wolfskill Property Map Showing Additional Seismic Profile Locations ...............3 3a Seismic Profile 13 Vicinity Map ............................................................................................................7 3b Refraction Profile 13 Interpreted Velocity Model.................................................................................8 3c Diagram Showing Profile 13 Velocity Model Correlations With Previous Surveys ..........................9 3d Reflection Profile 13 Interpreted Cross Section..................................................................................11 3e Reflection Profile 13 – Processed Time Section .................................................................................12 4a Refraction Profile 14 Vicinity Map......................................................................................................14 4b Refraction Profile 14 Interpreted Velocity Model...............................................................................15 5a Wolfskill Property Profiles 15 And 16 Vicinity Map .........................................................................17 5b Refraction Profile 15 Interpreted Velocity Model...............................................................................18 5c Refraction Profile 16 Interpreted Velocity Model...............................................................................20
LIST OF TABLES Table 1 Beaumont Site 2 Seismic Velocity Versus Stratigraphy Correlations ...................................................2 2 Description Of Additional Seismic Profile Locations.............................................................................2 3 Correlations Of Additional Refraction Velocity Models And Generalized Stratigraphy .....................5
ii
. TERRA PHYSICS 28841 Base Line Road Highland, CA 92346 phone/fax (909)862-0626
1.0 INTRODUCTION
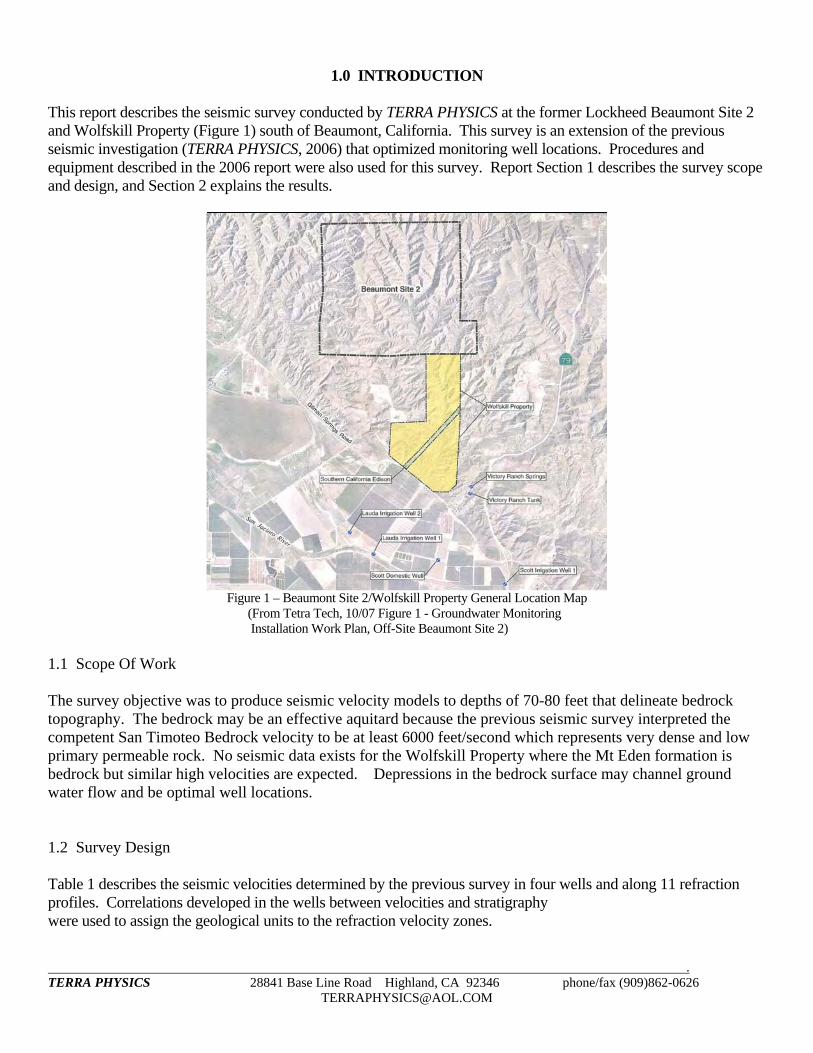
This report describes the seismic survey conducted by TERRA PHYSICS at the former Lockheed Beaumont Site 2 and Wolfskill Property (Figure 1) south of Beaumont, California. This survey is an extension of the previous seismic investigation (TERRA PHYSICS, 2006) that optimized monitoring well locations. Procedures and equipment described in the 2006 report were also used for this survey. Report Section 1 describes the survey scope and design, and Section 2 explains the results.
Figure 1 – Beaumont Site 2/Wolfskill Property General Location Map
(From Tetra Tech, 10/07 Figure 1 - Groundwater Monitoring Installation Work Plan, Off-Site Beaumont Site 2)
1.1 Scope Of Work The survey objective was to produce seismic velocity models to depths of 70-80 feet that delineate bedrock topography. The bedrock may be an effective aquitard because the previous seismic survey interpreted the competent San Timoteo Bedrock velocity to be at least 6000 feet/second which represents very dense and low primary permeable rock. No seismic data exists for the Wolfskill Property where the Mt Eden formation is bedrock but similar high velocities are expected. Depressions in the bedrock surface may channel ground water flow and be optimal well locations. 1.2 Survey Design Table 1 describes the seismic velocities determined by the previous survey in four wells and along 11 refraction profiles. Correlations developed in the wells between velocities and stratigraphy were used to assign the geological units to the refraction velocity zones.

. TERRA PHYSICS 28841 Base Line Road Highland, CA 92346 phone/fax (909)862-0626
2 TABLE 1
BEAUMONT SITE 2 SEISMIC VELOCITY VERSUS STRATIGRAPHY CORRELATIONS DOWNHOLE VELOCITY (feet/second)
REFRACTION VELOCITY (feet/second)
GENERALIZED STRATIGRAPHY
V1: 850 – 1170 1130 – 1300 Recent, Dry, Unconsolidated Silt And Sand Alluvium V2: 1480 – 3200 1510 – 2900 Dry, Slightly Consolidated Silt And Sand Alluvium V3: 4200 4050 Dry, Weathered San Timoteo Bedrock 4850 --- Saturated, Weathered San Timoteo Bedrock V4: 5500 – 6900 5950 – 7700 Competent San Timoteo Bedrock
For this additional survey, Tetra Tech, Inc. staked the four profiles described in Table 2 and Figure 2. Profile 13 (Operational Area L) was located along the west side of the northwest oriented main access road (roughly parallel with the canyon axis) and was positioned between contaminated wells to the north and ‘Clean’ wells to the south. Reflection data were simultaneously recorded along this profile to provide additional lateral and vertical resolution for delineating structural changes in the bedrock that might indicate a fault. Profile 14 (RWQC6 Discharge Area) was north oriented and located immediately east and down-gradient of the three discharge ponds. Profiles 15 and 16 (Wolfskill Property) were roughly east oriented across the canyon above and below the wetlands.
TABLE 2 DESCRIPTION OF ADDITIONAL SEISMIC PROFILE LOCATIONS
SURVEY ID
FIRST END LATITUDE LONGITUDE (degrees) (degrees)
SECOND END LATITUDE LONGITUDE (degrees) (degrees)
LENGTH
(feet)
ANGLE
(degrees)
SITE 2: Profile 13 (Operation Area L)
33.9007998 117.0283581
33.9022024 117.0278861
536
N 14-34 E
Profile 14 (RWQC6 Discharge Ponds)
33.8977825 117.0291773 33.8985719 117.0294250 253 N 17 W
WOLFSKILL PROPERTY: Profile 15 (Profile North Of Wetlands)
33.8775470 117.0211917
33.8778486 117.0195573
510
N 80 E
Profile 16 (Profile South Of Wetlands)
33.8663353 117.0226935 33.8659919 117.0217146 322 S 71 E
NOTE: Latitude/Longitude in NAD83 datum. The resultant refraction velocity models described in Section 2 show the predicted stratigraphic layers and the lowest elevation depressions (possibly historical drainages) in the competent bedrock velocity zone. These depressions are labeled with geodetic coordinates in the datum generally used by GPS instruments so they can be easily located and staked. 1.3 Schedule 08/23 Mr. Paul Michalski discussed additional seismic survey targets. 08/24 Cost proposal was submitted to Mr. Michalski. 09/11 Data collection scheduled by Mr. David Bertolacci to start on September 17. 09/17 Mr. Bertolacci conducted the Health and Safety and biological sensitivity training. Profile 13 refraction/reflection data were recorded on profile’s southern third.

. TERRA PHYSICS 28841 Base Line Road Highland, CA 92346 phone/fax (909)862-0626
3
FIGURE 2BEAUMONT SITE 2/WOLFSKILL PROPERTY MAP SHOWING ADDITIONAL SEISMIC PROFILE LOCATIONS
NEWPROFILE 16
NEWPROFILE 15
NEW PROFILE 13
NEW PROFILE 14

. TERRA PHYSICS 28841 Base Line Road Highland, CA 92346 phone/fax (909)862-0626
4
09/18 Profile 13 data collection completed. 09/21 Profiles 14, 15, and 16 refraction data were recorded. 09/25 Data processing began. 10/10 Profiles 13, 14, and 16 refraction results were emailed to Mr. Bertolacci. 10/11 Profile 15 refraction results were emailed to Mr. Bertolacci. 10/15 Profile 13 reflection results completed. 10/18 Draft report was delivered to Tetra Tech. 10/22 Final report was delivered to Tetra Tech.
. TERRA PHYSICS 28841 Base Line Road Highland, CA 92346 phone/fax (909)862-0626
5 2.0 SUMMARY OF RESULTS
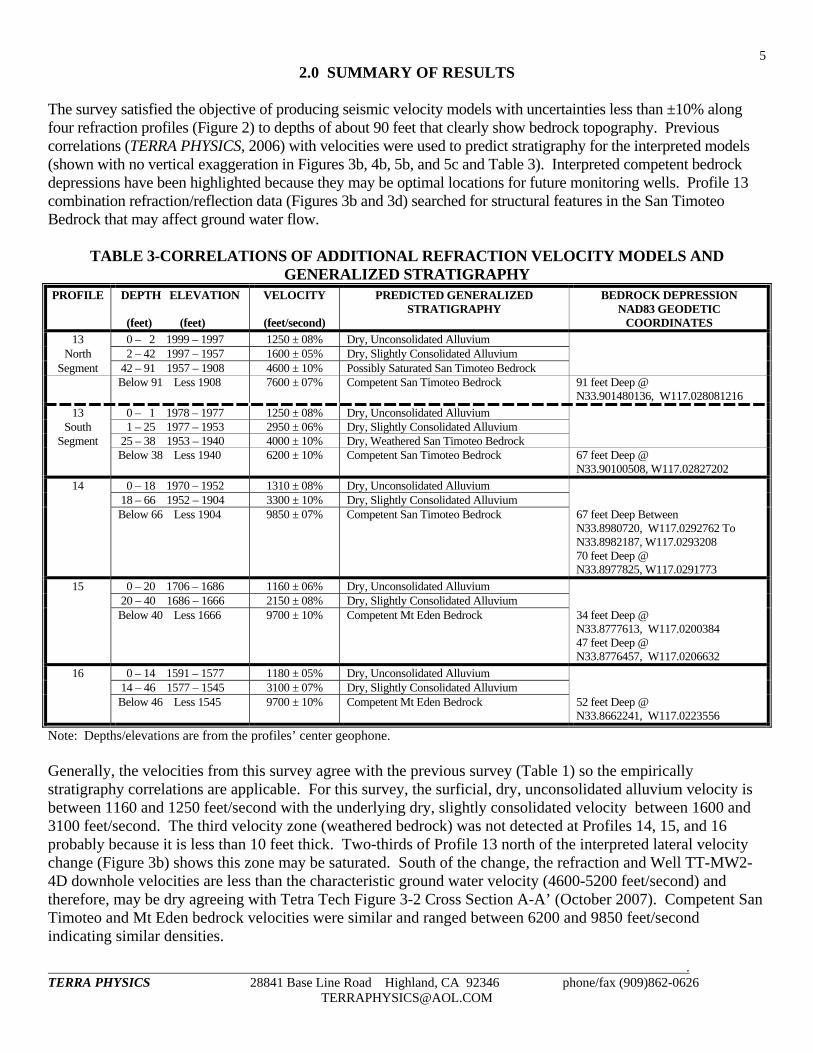
The survey satisfied the objective of producing seismic velocity models with uncertainties less than ±10% along four refraction profiles (Figure 2) to depths of about 90 feet that clearly show bedrock topography. Previous correlations (TERRA PHYSICS, 2006) with velocities were used to predict stratigraphy for the interpreted models (shown with no vertical exaggeration in Figures 3b, 4b, 5b, and 5c and Table 3). Interpreted competent bedrock depressions have been highlighted because they may be optimal locations for future monitoring wells. Profile 13 combination refraction/reflection data (Figures 3b and 3d) searched for structural features in the San Timoteo Bedrock that may affect ground water flow.
TABLE 3-CORRELATIONS OF ADDITIONAL REFRACTION VELOCITY MODELS AND GENERALIZED STRATIGRAPHY
PROFILE DEPTH ELEVATION (feet) (feet)
VELOCITY
(feet/second)
PREDICTED GENERALIZED STRATIGRAPHY
BEDROCK DEPRESSION
NAD83 GEODETIC COORDINATES
13 0 – 2 1999 – 1997 1250 ± 08% Dry, Unconsolidated Alluvium North 2 – 42 1997 – 1957 1600 ± 05% Dry, Slightly Consolidated Alluvium
Segment 42 – 91 1957 – 1908 4600 ± 10% Possibly Saturated San Timoteo Bedrock Below 91 Less 1908 7600 ± 07% Competent San Timoteo Bedrock 91 feet Deep @
N33.901480136, W117.028081216 13 0 – 1 1978 – 1977 1250 ± 08% Dry, Unconsolidated Alluvium
South 1 – 25 1977 – 1953 2950 ± 06% Dry, Slightly Consolidated Alluvium Segment 25 – 38 1953 – 1940 4000 ± 10% Dry, Weathered San Timoteo Bedrock
Below 38 Less 1940 6200 ± 10% Competent San Timoteo Bedrock 67 feet Deep @ N33.90100508, W117.02827202
14 0 – 18 1970 – 1952 1310 ± 08% Dry, Unconsolidated Alluvium 18 – 66 1952 – 1904 3300 ± 10% Dry, Slightly Consolidated Alluvium Below 66 Less 1904 9850 ± 07% Competent San Timoteo Bedrock 67 feet Deep Between
N33.8980720, W117.0292762 To N33.8982187, W117.0293208 70 feet Deep @ N33.8977825, W117.0291773
15 0 – 20 1706 – 1686 1160 ± 06% Dry, Unconsolidated Alluvium 20 – 40 1686 – 1666 2150 ± 08% Dry, Slightly Consolidated Alluvium Below 40 Less 1666 9700 ± 10% Competent Mt Eden Bedrock 34 feet Deep @
N33.8777613, W117.0200384 47 feet Deep @ N33.8776457, W117.0206632
16 0 – 14 1591 – 1577 1180 ± 05% Dry, Unconsolidated Alluvium 14 – 46 1577 – 1545 3100 ± 07% Dry, Slightly Consolidated Alluvium Below 46 Less 1545 9700 ± 10% Competent Mt Eden Bedrock 52 feet Deep @
N33.8662241, W117.0223556
Note: Depths/elevations are from the profiles’ center geophone. Generally, the velocities from this survey agree with the previous survey (Table 1) so the empirically stratigraphy correlations are applicable. For this survey, the surficial, dry, unconsolidated alluvium velocity is between 1160 and 1250 feet/second with the underlying dry, slightly consolidated velocity between 1600 and 3100 feet/second. The third velocity zone (weathered bedrock) was not detected at Profiles 14, 15, and 16 probably because it is less than 10 feet thick. Two-thirds of Profile 13 north of the interpreted lateral velocity change (Figure 3b) shows this zone may be saturated. South of the change, the refraction and Well TT-MW2-4D downhole velocities are less than the characteristic ground water velocity (4600-5200 feet/second) and therefore, may be dry agreeing with Tetra Tech Figure 3-2 Cross Section A-A’ (October 2007). Competent San Timoteo and Mt Eden bedrock velocities were similar and ranged between 6200 and 9850 feet/second indicating similar densities.
. TERRA PHYSICS 28841 Base Line Road Highland, CA 92346 phone/fax (909)862-0626
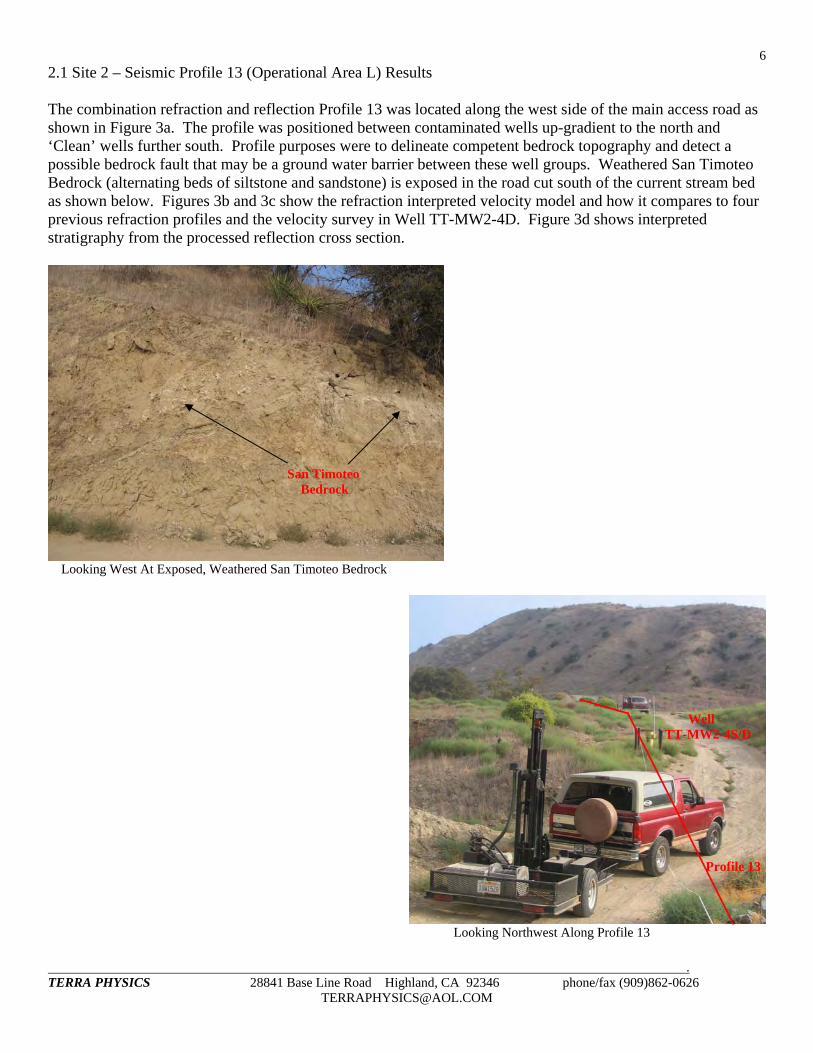
6 2.1 Site 2 – Seismic Profile 13 (Operational Area L) Results The combination refraction and reflection Profile 13 was located along the west side of the main access road as shown in Figure 3a. The profile was positioned between contaminated wells up-gradient to the north and ‘Clean’ wells further south. Profile purposes were to delineate competent bedrock topography and detect a possible bedrock fault that may be a ground water barrier between these well groups. Weathered San Timoteo Bedrock (alternating beds of siltstone and sandstone) is exposed in the road cut south of the current stream bed as shown below. Figures 3b and 3c show the refraction interpreted velocity model and how it compares to four previous refraction profiles and the velocity survey in Well TT-MW2-4D. Figure 3d shows interpreted stratigraphy from the processed reflection cross section.
Looking West At Exposed, Weathered San Timoteo Bedrock
Looking Northwest Along Profile 13
San Timoteo Bedrock
Well TT-MW2-4S/D
Profile 13

. TERRA PHYSICS 28841 Base Line Road Highland, CA 92346 phone/fax (909)862-0626
7
FIGURE 3aSEISMIC PROFILE 13 VICINITY MAP
DOWNHOLE VELOCITY SURVEY
. TERRA PHYSICS 28841 Base Line Road Highland, CA 92346 phone/fax (909)862-0626
8
-40 -20 0 20 40 60 80 100 120 140 160 180 200 220 240 260 280 300 320 340 360 380 400 420 440 460 480 500 520 540DISTANCE ALONG PROFILE (feet)
1900
1920
1940
1960
1980
2000
NA
VD
88 E
LEVA
TIO
N (f
eet)
NO VERTICAL EXAGGERATION
BEN
D IN
SE
CTI
ON
DR
AIN
PIP
E IN
STR
EAM
BED
TTM
W2-
4S2
ft E
AST
1250 +/- 08% ft/sec
2950 +/- 06% ft/sec
4000 +/-10% ft/sec
6200 +/-10% ft/sec
1250 +/-08% ft/sec
1600 +/-05% ft/sec
4600 +/-10% ft/sec
7600 +/-07% ft/sec
850 +/-08% ft/sec
3050 +/-05% ft/sec
4200 +/-10% ft/sec
5500 +/-11% ft/sec
FIGURE 3b - REFRACTION PROFILE 13 INTERPRETED VELOCITY MODEL
SURFACE
AQUITARD DEPRESSION (67 ft @ N33.90100508, W117.02827202)
AQUITARD DEPRESSION (91 ft @ N33.901480136, W117.028081216)
N33
.900
7998
W11
7.02
8358
1
N33
.902
2024
W11
7.02
7886
1
LATERAL V3/V4 CHANGE
N 33.5 EN 22.5 E
BEN
D IN
SE
CTI
ON
N 22.5 E N 14 E
PREDICTED STRATIGRAPHY
DRY, UNCONSOLIDATED ALLUVIUM
DRY, SLIGHTLY CONSOLIDATED ALLUVIUM
WEATHERED SAN TIMOTEO BEDROCK
COMPETENT SAN TIMOTEO BEDROCK POSSIBLE AQUITARD
DRY POSSIBLYSATURATED
WELL VELOCITIES
TT-M
W2-
1063
ft E
AST
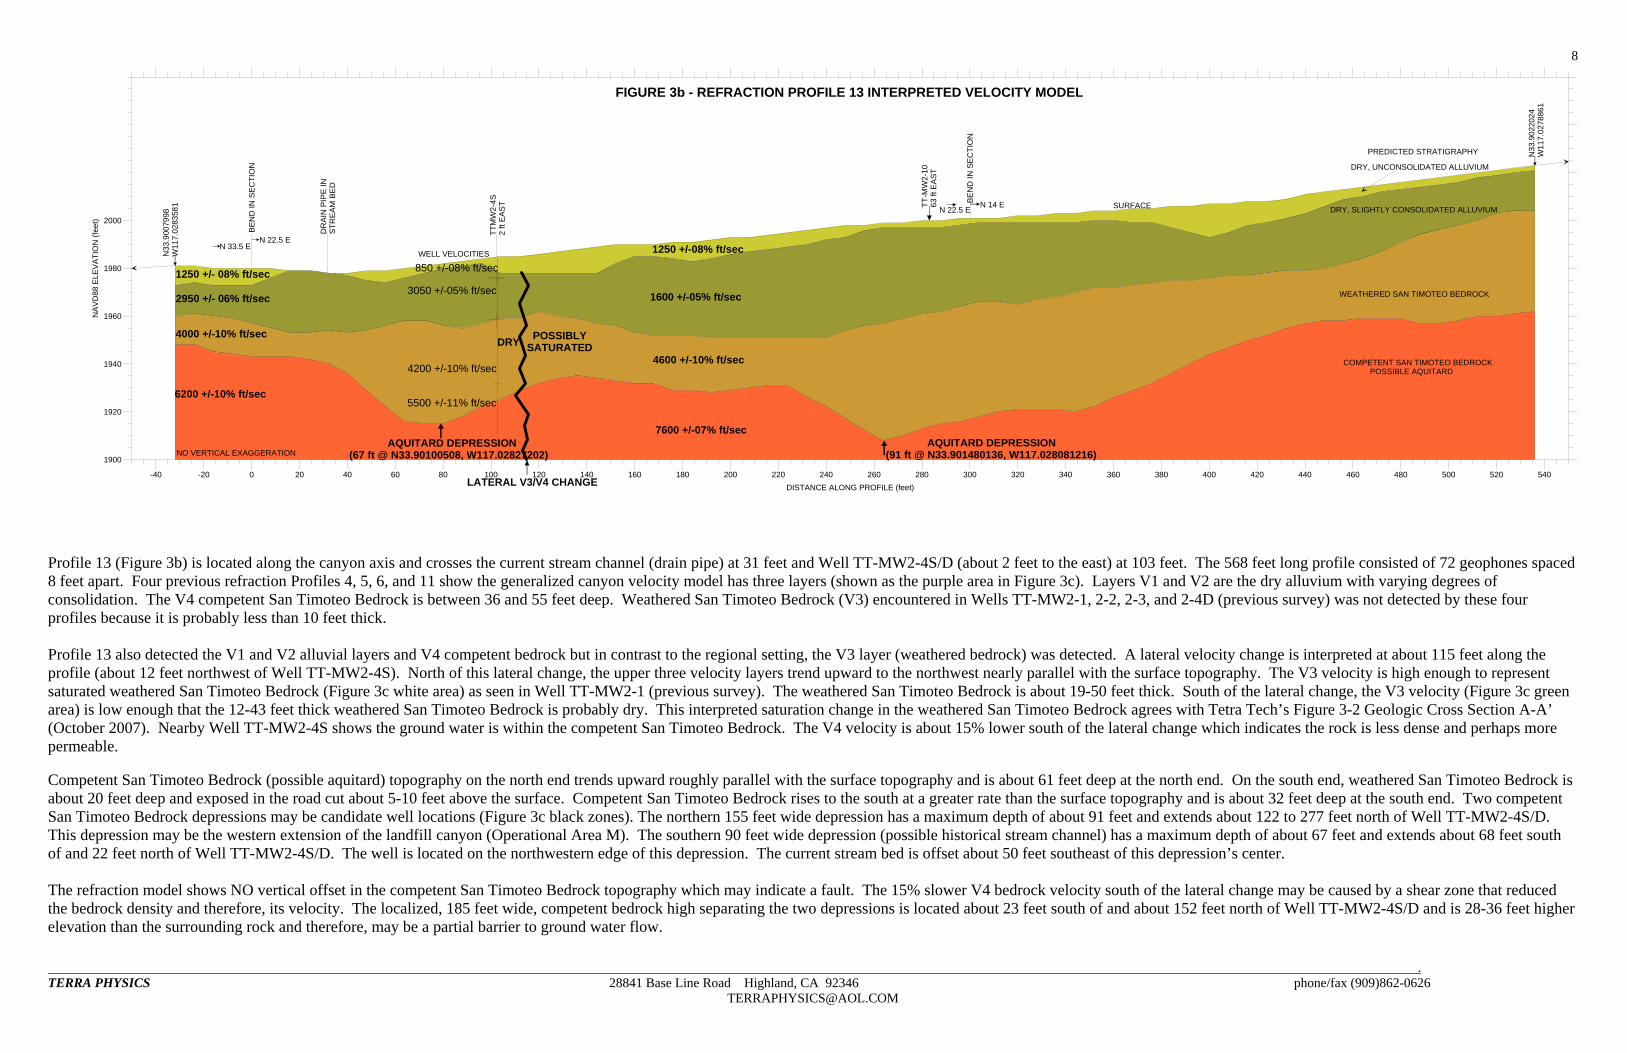
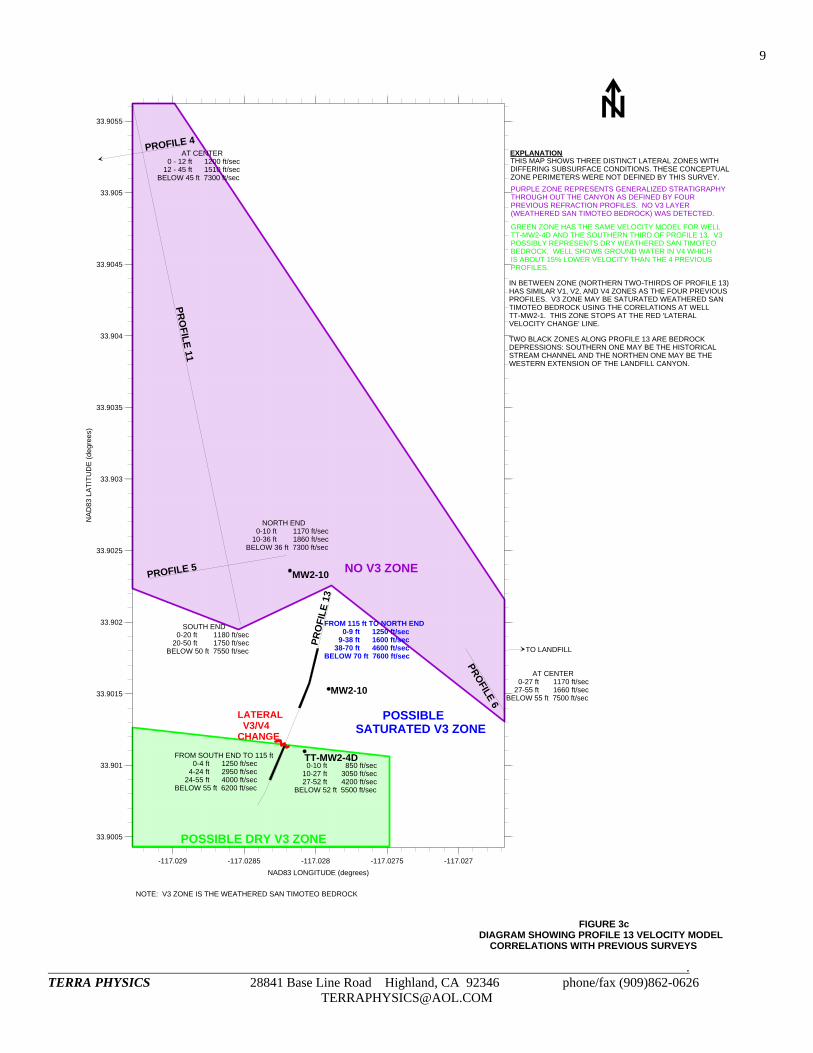
Profile 13 (Figure 3b) is located along the canyon axis and crosses the current stream channel (drain pipe) at 31 feet and Well TT-MW2-4S/D (about 2 feet to the east) at 103 feet. The 568 feet long profile consisted of 72 geophones spaced 8 feet apart. Four previous refraction Profiles 4, 5, 6, and 11 show the generalized canyon velocity model has three layers (shown as the purple area in Figure 3c). Layers V1 and V2 are the dry alluvium with varying degrees of consolidation. The V4 competent San Timoteo Bedrock is between 36 and 55 feet deep. Weathered San Timoteo Bedrock (V3) encountered in Wells TT-MW2-1, 2-2, 2-3, and 2-4D (previous survey) was not detected by these four profiles because it is probably less than 10 feet thick. Profile 13 also detected the V1 and V2 alluvial layers and V4 competent bedrock but in contrast to the regional setting, the V3 layer (weathered bedrock) was detected. A lateral velocity change is interpreted at about 115 feet along the profile (about 12 feet northwest of Well TT-MW2-4S). North of this lateral change, the upper three velocity layers trend upward to the northwest nearly parallel with the surface topography. The V3 velocity is high enough to represent saturated weathered San Timoteo Bedrock (Figure 3c white area) as seen in Well TT-MW2-1 (previous survey). The weathered San Timoteo Bedrock is about 19-50 feet thick. South of the lateral change, the V3 velocity (Figure 3c green area) is low enough that the 12-43 feet thick weathered San Timoteo Bedrock is probably dry. This interpreted saturation change in the weathered San Timoteo Bedrock agrees with Tetra Tech’s Figure 3-2 Geologic Cross Section A-A’ (October 2007). Nearby Well TT-MW2-4S shows the ground water is within the competent San Timoteo Bedrock. The V4 velocity is about 15% lower south of the lateral change which indicates the rock is less dense and perhaps more permeable.
Competent San Timoteo Bedrock (possible aquitard) topography on the north end trends upward roughly parallel with the surface topography and is about 61 feet deep at the north end. On the south end, weathered San Timoteo Bedrock is about 20 feet deep and exposed in the road cut about 5-10 feet above the surface. Competent San Timoteo Bedrock rises to the south at a greater rate than the surface topography and is about 32 feet deep at the south end. Two competent San Timoteo Bedrock depressions may be candidate well locations (Figure 3c black zones). The northern 155 feet wide depression has a maximum depth of about 91 feet and extends about 122 to 277 feet north of Well TT-MW2-4S/D. This depression may be the western extension of the landfill canyon (Operational Area M). The southern 90 feet wide depression (possible historical stream channel) has a maximum depth of about 67 feet and extends about 68 feet south of and 22 feet north of Well TT-MW2-4S/D. The well is located on the northwestern edge of this depression. The current stream bed is offset about 50 feet southeast of this depression’s center. The refraction model shows NO vertical offset in the competent San Timoteo Bedrock topography which may indicate a fault. The 15% slower V4 bedrock velocity south of the lateral change may be caused by a shear zone that reduced the bedrock density and therefore, its velocity. The localized, 185 feet wide, competent bedrock high separating the two depressions is located about 23 feet south of and about 152 feet north of Well TT-MW2-4S/D and is 28-36 feet higher elevation than the surrounding rock and therefore, may be a partial barrier to ground water flow.
. TERRA PHYSICS 28841 Base Line Road Highland, CA 92346 phone/fax (909)862-0626
9
-117.029 -117.0285 -117.028 -117.0275 -117.027NAD83 LONGITUDE (degrees)
33.9005
33.901
33.9015
33.902
33.9025
33.903
33.9035
33.904
33.9045
33.905
33.9055
NA
D83
LA
TITU
DE
(deg
rees
)
FIGURE 3cDIAGRAM SHOWING PROFILE 13 VELOCITY MODEL CORRELATIONS WITH PREVIOUS SURVEYS
PRO
FILE 11
PROFILE 5
PRO
FILE
13
PROFILE 6
TT-MW2-4D
AT CENTER 0-27 ft 1170 ft/sec 27-55 ft 1660 ft/secBELOW 55 ft 7500 ft/sec
NORTH END 0-10 ft 1170 ft/sec 10-36 ft 1860 ft/secBELOW 36 ft 7300 ft/sec
SOUTH END 0-20 ft 1180 ft/sec 20-50 ft 1750 ft/secBELOW 50 ft 7550 ft/sec
0-10 ft 850 ft/sec 10-27 ft 3050 ft/sec 27-52 ft 4200 ft/secBELOW 52 ft 5500 ft/sec
FROM SOUTH END TO 115 ft 0-4 ft 1250 ft/sec 4-24 ft 2950 ft/sec 24-55 ft 4000 ft/secBELOW 55 ft 6200 ft/sec
FROM 115 ft TO NORTH END 0-9 ft 1250 ft/sec 9-38 ft 1600 ft/sec 38-70 ft 4600 ft/secBELOW 70 ft 7600 ft/sec
MW2-10
MW2-10
LATERAL V3/V4 CHANGE
NO V3 ZONE
POSSIBLE DRY V3 ZONE
POSSIBLESATURATED V3 ZONE
PROFILE 4
NOTE: V3 ZONE IS THE WEATHERED SAN TIMOTEO BEDROCK
TO LANDFILL
EXPLANATIONTHIS MAP SHOWS THREE DISTINCT LATERAL ZONES WITH DIFFERING SUBSURFACE CONDITIONS. THESE CONCEPTUALZONE PERIMETERS WERE NOT DEFINED BY THIS SURVEY.PURPLE ZONE REPRESENTS GENERALIZED STRATIGRAPHYTHROUGH OUT THE CANYON AS DEFINED BY FOUR PREVIOUS REFRACTION PROFILES. NO V3 LAYER (WEATHERED SAN TIMOTEO BEDROCK) WAS DETECTED.
GREEN ZONE HAS THE SAME VELOCITY MODEL FOR WELLTT-MW2-4D AND THE SOUTHERN THIRD OF PROFILE 13. V3 POSSIBLY REPRESENTS DRY WEATHERED SAN TIMOTEOBEDROCK. WELL SHOWS GROUND WATER IN V4 WHICHIS ABOUT 15% LOWER VELOCITY THAN THE 4 PREVIOUSPROFILES.
IN BETWEEN ZONE (NORTHERN TWO-THIRDS OF PROFILE 13)HAS SIMILAR V1, V2, AND V4 ZONES AS THE FOUR PREVIOUSPROFILES. V3 ZONE MAY BE SATURATED WEATHERED SANTIMOTEO BEDROCK USING THE CORELATIONS AT WELLTT-MW2-1. THIS ZONE STOPS AT THE RED 'LATERALVELOCITY CHANGE' LINE.
TWO BLACK ZONES ALONG PROFILE 13 ARE BEDROCKDEPRESSIONS: SOUTHERN ONE MAY BE THE HISTORICAL STREAM CHANNEL AND THE NORTHEN ONE MAY BE THE WESTERN EXTENSION OF THE LANDFILL CANYON.
AT CENTER 0 - 12 ft 1200 ft/sec 12 - 45 ft 1510 ft/secBELOW 45 ft 7300 ft/sec

. TERRA PHYSICS 28841 Base Line Road Highland, CA 92346 phone/fax (909)862-0626
10
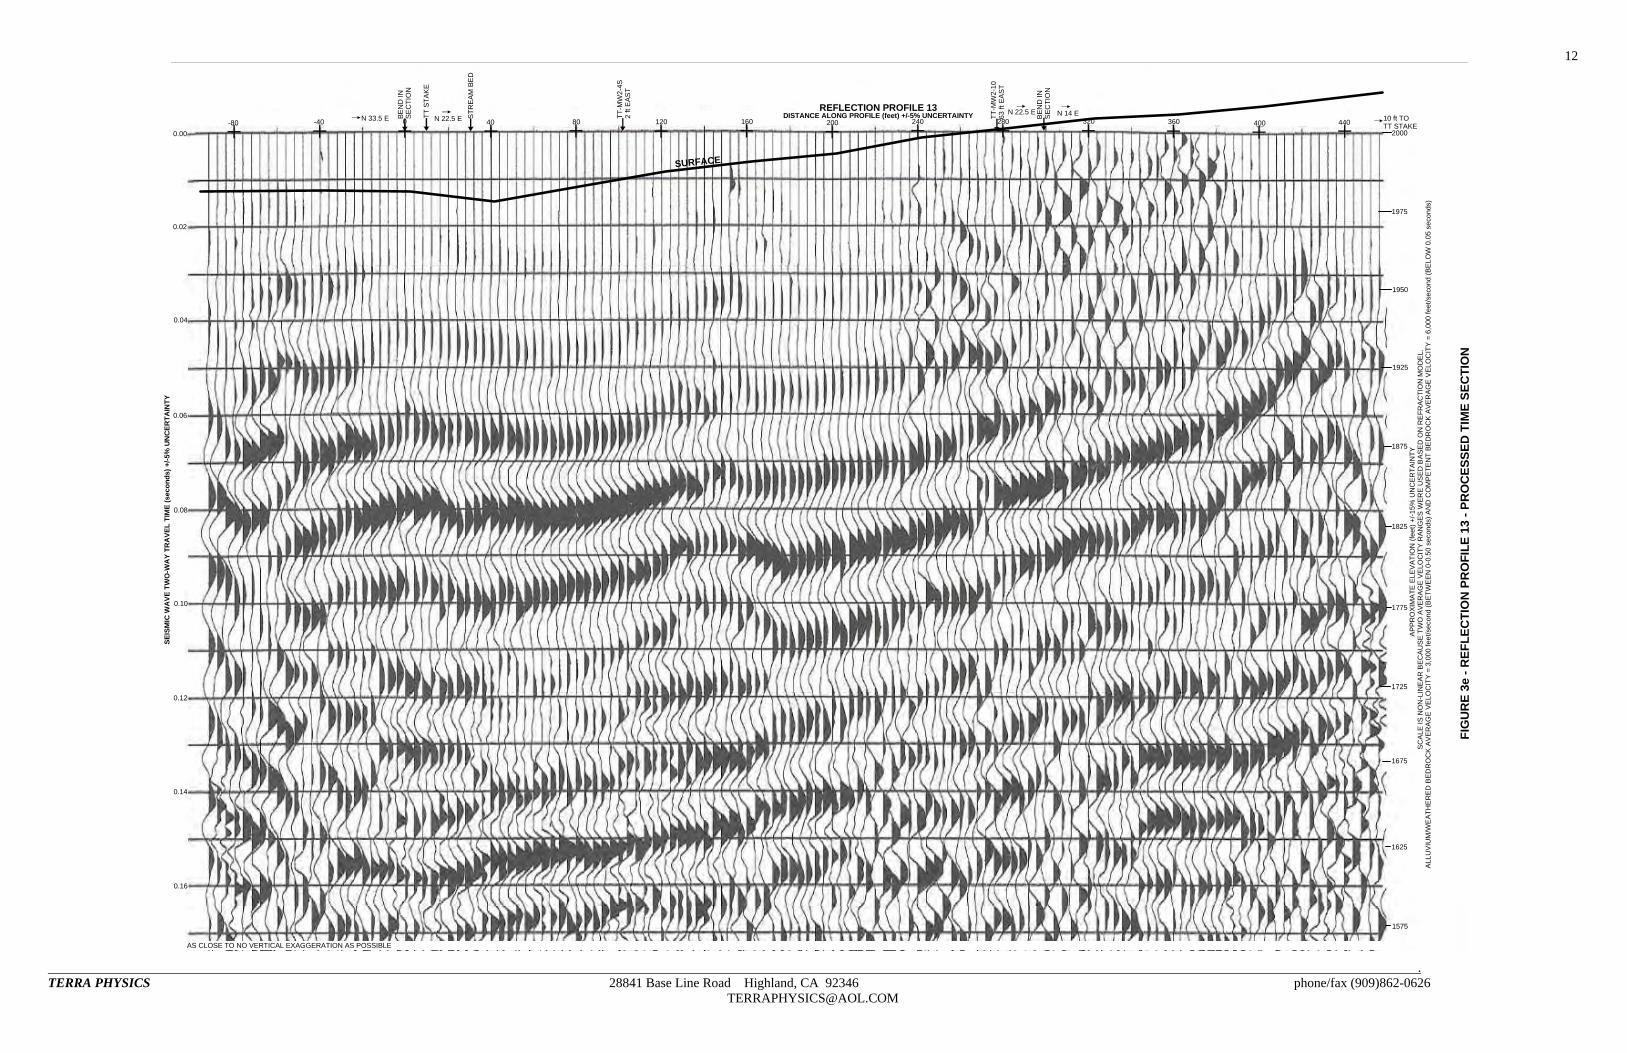
The reflection data recorded along with the refraction data on Profile13 was processed and displayed as a time section (at the refraction velocity model scale) in Figure 3e. Distances along the top axis are identical to those shown on the refraction velocity mode (Figure 3b). The reflection data is shifted about 50 feet south of the refraction model because of the source point-geophone geometry required by the reflection technique to obtain at least 300 feet penetration (details described in TERRA PHYSICS, 2006). Surficial structure locations are shown on the top axis and the ground surface is shown as a bold black line. Processed reflection data traces are displayed at 4 feeet intervals, half of the geophone spacing. Data quality (defined as fold for reflection data) is 12 through out the section except on the profile ends where it ramps down by a factor of 1 for each geophone. Therefore, features shown on the first and last 11 data traces are not as well defined as the remaining traces. The refraction data was able to resolve velocity changes to depths of about 90 feet, whereas, the reflection data clearly shows coherent reflections as deep as about 425 feet. Stratigraphic layers interpreted from the reflection data are shown with different colors in Figure 3d. Top of the weathered and competent San Timoteo Bedrock are the upper two reflections. Their topography and depths roughly agree with the refraction velocity model that shows two depressions separated by a localized bedrock high. Competent bedrock reflector also rises to the north. In addition to these reflectors, 8 semi parallel, additional ones that probably represent bedrock bedding were highlighted. All reflectors except the weathered bedrock show an abrupt vertical offset of about 5-10 feet between profile distances of 246 and 275 feet. Center of this zone is about 155 feet northwest of Well TT-MW2-4S and coincides with northern depression center in the refraction model (Figure 3b).

. TERRA PHYSICS 28841 Base Line Road Highland, CA 92346 phone/fax (909)862-0626
11
44040036032028024020016012080400-40-80DISTANCE ALONG PROFILE (feet) +/-5% UNCERTAINTY
1575
1925
2000
AP
PRO
XIM
ATE
ELE
VAT
ION
(fee
t) +/
-15%
UN
CER
TAIN
TY
S
CAL
E IS
NO
N-L
INE
AR B
ECAU
SE T
WO
AVE
RAG
E V
ELO
CIT
Y R
ANG
ES W
ERE
USE
D B
ASE
D O
N R
EFR
ACTI
ON
MO
DEL
.AL
LUV
IUM
/WEA
THE
RED
BED
RO
CK
AV
ERAG
E V
ELO
CIT
Y =
3,0
00 fe
et/s
econ
d (B
ETW
EEN
0-0
.50
seco
nds)
AN
D C
OM
PETE
NT
BED
RO
CK
AVE
RA
GE
VELO
CIT
Y =
6,0
00 fe
et/s
econ
d (B
ELO
W 0
.05
seco
nds)
AS CLOSE TO NO VERTICAL EXAGGERATION AS POSSIBLE
0.16
0.14
0.12
0.10
0.08
0.06
0.04
0.02
0.00
SEIS
MIC
WA
VE T
WO
-WA
Y TR
AVE
L TI
ME
(sec
onds
) +/-5
% U
NC
ERTA
INTY
REFLECTION PROFILE 13
1975
1950
1875
1825
1775
1725
1675
1625
FIG
UR
E 3d
- R
EFLE
CTI
ON
PR
OFI
LE 1
3 IN
TER
PRET
ED C
RO
SS S
ECTI
ON
WEATHERED BEDROCK
COMPETENT BEDROCK
BEN
D IN
SEC
TIO
N
N 33.5 E N 22.5 ETT S
TAKE
STR
EAM
BED
TT-M
W2-
4S2
ft EA
ST
TT-M
W2-
1063
ft E
AST
BEN
D IN
SEC
TIO
N
N 22.5 E N 14 E10 ft TO TT STAKE
POSSIBLE FAULT
DU
SURFACE
. TERRA PHYSICS 28841 Base Line Road Highland, CA 92346 phone/fax (909)862-0626
12
44040036032028024020016012080400-40-80DISTANCE ALONG PROFILE (feet) +/-5% UNCERTAINTY
1575
1925
2000
A
PPR
OXI
MA
TE E
LEV
ATIO
N (f
eet)
+/-1
5% U
NC
ERTA
INTY
SCA
LE IS
NO
N-L
INE
AR
BEC
AU
SE
TWO
AVE
RA
GE
VEL
OC
ITY
RAN
GES
WER
E U
SE
D B
ASE
D O
N R
EFR
AC
TIO
N M
OD
EL.
ALL
UV
IUM
/WE
ATH
ER
ED B
ED
RO
CK
AV
ERA
GE
VE
LOC
ITY
= 3
,000
feet
/sec
ond
(BET
WE
EN 0
-0.5
0 se
cond
s) A
ND
CO
MP
ETE
NT
BED
RO
CK
AVE
RA
GE
VEL
OC
ITY
= 6,
000
feet
/sec
ond
(BE
LOW
0.0
5 se
cond
s)
AS CLOSE TO NO VERTICAL EXAGGERATION AS POSSIBLE
0.16
0.14
0.12
0.10
0.08
0.06
0.04
0.02
0.00
SEIS
MIC
WA
VE T
WO
-WA
Y TR
AVE
L TI
ME
(sec
onds
) +/-5
% U
NC
ERTA
INTY
REFLECTION PROFILE 13
1975
1950
1875
1825
1775
1725
1675
1625
FIG
UR
E 3e
- R
EFLE
CTI
ON
PR
OFI
LE 1
3 - P
RO
CES
SED
TIM
E SE
CTI
ON
BEN
D IN
SEC
TIO
N
N 33.5 E N 22.5 ETT S
TAK
E
STR
EA
M B
ED
TT-M
W2-
4S2
ft E
AST
TT-M
W2-
1063
ft E
AST
BEN
D IN
SEC
TIO
N
N 22.5 E N 14 E10 ft TO TT STAKE
SURFACE

. TERRA PHYSICS 28841 Base Line Road Highland, CA 92346 phone/fax (909)862-0626
13 2.2 Site 2 – Refraction Profile 14 (RWQC6 Discharge Area) Results Profile 14 was roughly north oriented and located about 50 feet east of the series of discharge ponds (Figure 4a). The profile purpose was to detect competent San Timoteo bedrock topography down-gradient from these ponds. The refraction interpreted model is shown in Figure 4b.
Looking West Towards Ponds
Looking At Profile 14 South End
Pond Berm
Road
Profile 14
Profile 14
Road
Pond Berm
Profile 14

. TERRA PHYSICS 28841 Base Line Road Highland, CA 92346 phone/fax (909)862-0626
14
FIGURE 4aREFRACTION PROFILE 14 VICINITY MAP
PONDPOND
RWQC6 PERMITTED DISCHARGE AREA
TT MOVED STAKE

. TERRA PHYSICS 28841 Base Line Road Highland, CA 92346 phone/fax (909)862-0626
15
0 20 40 60 80 100 120 140 160 180 200 220 240 260DISTANCE ALONG PROFILE (feet)
1900
1920
1940
1960
1980
2000N
AVD
88 E
LEV
ATIO
N (f
eet)
FIGURE 4b - REFRACTION PROFILE 14 INTERPRETED VELOCITY MODEL
NO VERTICAL EXAGGERATION
1310 +/-8% ft/sec
3300 +/-10% ft/sec
9850 +/-7% ft/sec
NO V3 ZONE
N33
.897
7825
W11
7.02
9177
3
N33
.898
5719
W11
7.02
9425
0
N 17 W
PR
OFI
LEP
ER
PEN
DIC
ULA
RTO
RID
GE
PR
OFI
LEP
ERP
EN
DIC
ULA
RTO
RID
GE
AQUITARD DEPRESSION (67 ft DEEP BETWEEN N33.8980720, W117.0292762 AND N33.8982187, W117.0293208)
PONDS ABOUT 50 feet WEST
SB6
-PM
W4
(4 ft
W)
DIR
T R
OA
DC
EN
TER
PREDICTED STRATIGRAPHY
DRY, UNCONSOLIDATED ALLUVIUM
DRY, SLIGHTLY CONSOLIDATED ALLUVIUM
COMPETENT SAN TIMOTEO BEDROCK POSSIBLE AQUITARD
SURFACE
SB1
(120
ft W
EST)
RO
CK
@ 3
0 ft
SB2
(113
ft W
EST
)N
O R
OC
K IN
31
ft
SB3
(295
ft W
EST)
NO
RO
CK
IN 3
0.5
ft
SB4
(145
ft W
EST
)N
O R
OC
K IN
30
ft
SB5
(13
ft W
ES
T)N
O R
OC
K IN
33
ft)
AQ
UIT
AR
D D
EPR
ESSI
ON
(70
ft D
EEP)
The north trending Profile 14 (Figure 4b) crossed the Tetra Tech SB-6 stake at 104 feet, the road center at 149 feet, and the eastern pond berm between 171 and 270 feet. The 253 feet long profile consisted of 24 geophones spaced 11 feet apart. The profile has a three layer velocity model similar to many previous profiles but no direct comparisons can be made because there are no nearby profiles or wells. The V3 weathered San Timoteo Bedrock layer and/or a saturated layer were not detected probably because they may be less than 10 feet thick. Profile 14 was oriented roughly perpendicular to the pond canyon’s northern and southern ridges (left photo). Competent San Timoteo Bedrock was encountered at 30 feet deep in Boring SB1 on the northern ridge and not detected in the upper 30 feet in Borings SB2, SB3, SB4, and SB5 in the canyon bottom. Competent bedrock (V4) rises toward the north approximately parallel with the surface topography and is about 54 feet deep on the north end. About 50 feet east of the eastern pond (right photo), the competent San Timoteo Bedrock is 53 to 62 feet deep. From profile distances of 0 to 154 feet, competent bedrock is relatively flat between 63 to 70 feet deep and does not rise to the south because the profile was not oriented along the bedrock ridge (center photo). The lowest elevation competent San Timoteo Bedrock depression is about 44 feet wide, 67 feet deep, and located between the SB-6 stake and the dirt road. The low elevation bedrock extends to the profile south end, at least 35 feet south of the slope toe. Ground water may flow eastward towards the lowest depression AND southeastward pass the southern ridge slope toe and then eastward along the buried bedrock ridge.

. TERRA PHYSICS 28841 Base Line Road Highland, CA 92346 phone/fax (909)862-0626
16 2.3 Wolfskill Property – Refraction Profiles 15 And 16 (Wetlands) Results
Profiles 15 and 16 extended entirely across the canyon from slope toe to toe. They were east oriented, roughly perpendicular to the canyon axis. Profile 15 was north of the wetlands and Profile 16 was to the south (Figure 5a). The profiles purpose was to detect competent Mt Eden bedrock topography. The refraction interpreted models are shown in Figures 5b and 5c.
Looking At Profile 15 West End
Looking At Profile 15 East End
Profile 15
County Landfill
Road
Profile 15
Stream Bed

. TERRA PHYSICS 28841 Base Line Road Highland, CA 92346 phone/fax (909)862-0626
17
FIGURE 5aWOLFSKILL PROPERTY PROFILES 15 AND 16 VICINITY MAP

. TERRA PHYSICS 28841 Base Line Road Highland, CA 92346 phone/fax (909)862-0626
18
-20 0 20 40 60 80 100 120 140 160 180 200 220 240 260 280 300 320 340 360 380 400 420 440 460 480 500 520 540DISTANCE ALONG PROFILE (feet)
1660
1680
1700
1720
NAV
D88
ELE
VAT
ION
(fee
t)FIGURE 5b - REFRACTION PROFILE 15 INTERPRETED VELOCITY MODEL
N 80 E
SURFACE
NO V3 ZONE
STREAM BED
N33
.877
5470
W11
7.02
1191
7
N33
.877
8486
W11
7.01
9557
3
NO VERTICAL EXAGGERATION
1160 +/-6% ft/sec
2150 +/- 8% ft/sec
9700 +/- 10% ft/sec
AQUITARD DEPRESSION (34 ft DEEP @ N33.8777613, W117.0200384)
AQUITARD DEPRESSION (47 ft DEEP @ N33.8776457, W117.0206632)
DIR
T R
OA
D C
EN
TER
NO NEARBY BORINGS
PREDICTED STRATIGRAPHY
DRY, UNCONSOLIDATED ALLUVIUM
DRY, SLIGHTLY CONSOLIDATED ALLUVIUM
COMPETENT MT EDEN BEDROCK POSSIBLE AQUITARD
The east trending Profile 15 (Figure 5b) crossed the Tetra Tech stake near the center and the road center at 256 feet. The 510 feet long profile consisted of 35 geophones spaced 15 feet apart. The profile has a three layer velocity model similar to many Site 2 profiles but no direct comparisons can be made because there are no nearby profiles or wells. The V3 weathered Mt Eden Bedrock layer (suspected to be a similar velocity as the San Timoteo weathered bedrock) and/or a saturated layer were not detected because they may be less than 10 feet thick. Competent Mt Eden Bedrock (V4) surface is roughly parallel with surface topography and becomes about 27 feet deep on the west end and about 37 feet deep on the east end. The northern competent bedrock rise may separate this canyon from the one leading northeast towards the County Landfill (lower photo). The western competent Mt Eden Bedrock depression is about 98 feet wide, 47 feet deep, and located about 51 – 149 feet west of the road center. The eastern depression is about 105 feet wide, 34 feet deep, and located about 44 – 149 feet east of the road center. The current stream channel’s deepest point is offset about 43 feet west of the northern depression’s (possible historical stream channel) deepest point. The refraction model shows NO vertical offset or low velocity zone in the competent Mt Eden Bedrock which may indicate a fault that could be responsible for the spring feeding the wetlands between Profiles 15 and 16.
. TERRA PHYSICS 28841 Base Line Road Highland, CA 92346 phone/fax (909)862-0626
19
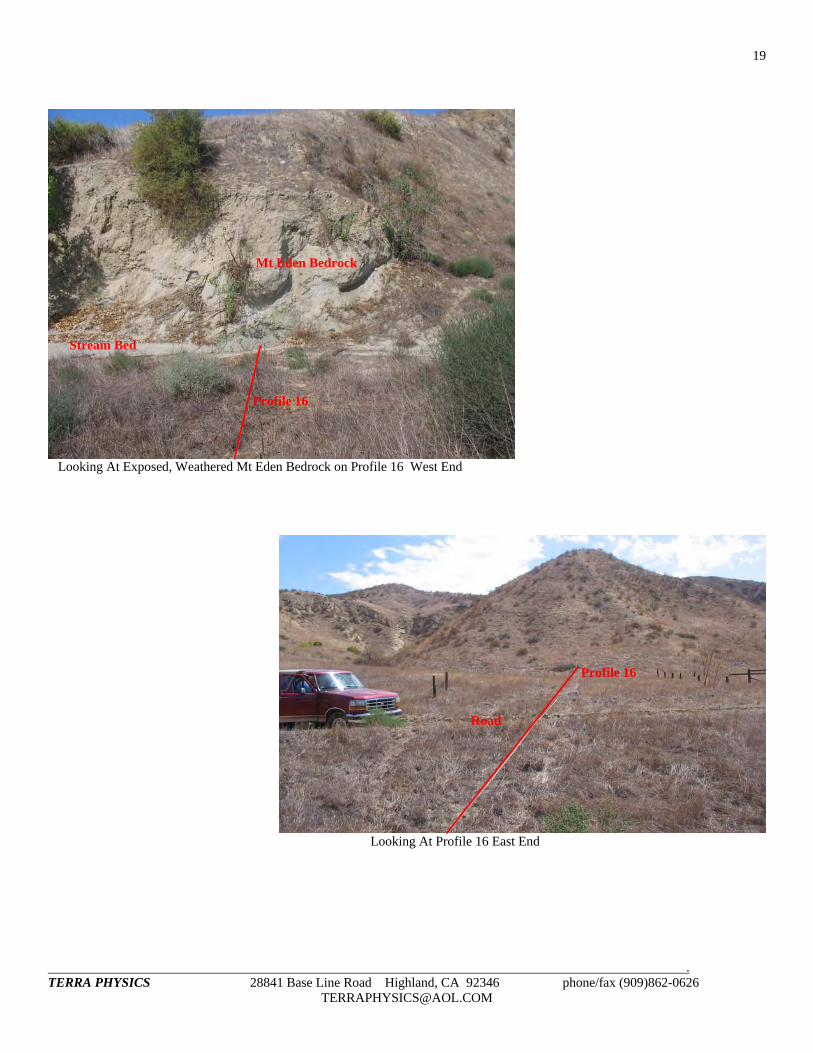
Looking At Exposed, Weathered Mt Eden Bedrock on Profile 16 West End
Looking At Profile 16 East End
Profile 16
Stream Bed
Mt Eden Bedrock
Road
Profile 16

. TERRA PHYSICS 28841 Base Line Road Highland, CA 92346 phone/fax (909)862-0626
20
0 20 40 60 80 100 120 140 160 180 200 220 240 260 280 300 320 340DISTANCE ALONG PROFILE (feet)
1500
1520
1540
1560
1580
1600
1620
NAV
D88
ELE
VA
TIO
N (f
eet)
NO VERTICAL EXAGGERATION
SURFACE
FIGURE 5c - REFRACTION PROFILE 16 INTERPRETED VELOCITY MODEL
NO V3 ZONE
1180 +/-5% ft/sec
3100 +/-7% ft/sec
9700 +/-9% ft/sec
NO NEARBY BORINGSD
IRT
RO
AD
CE
NTE
R
N33
.866
3353
W11
7.02
2693
5
S 71 E
N33
.865
9919
W11
7.02
1714
6
AQUITARD DEPRESSION (52 ft DEEP @ N33.8662241, W117.0223556)
DRY, UNCONSOLIDATED ALLUVIUM
DRY, SLIGHTLY CONSOLIDATED ALLUVIUM
COMPETENT MT EDEN BEDROCK POSSIBLE AQUITARD
PREDICTED STRATIGRAPHY
STR
EAM
B
ED
The east trending Profile 16 (Figure 5c) crossed the Tetra Tech stake near the center and the road center at 108 feet. The 322 feet long profile consisted of 24 geophones spaced 14 feet apart. The profile has a three layer velocity model similar to Profile 15 and many Site 2 profiles but no direct comparisons can be made because there are no nearby wells. The V3 weathered Mt Eden Bedrock layer (suspected to be a similar velocity as the San Timoteo weathered bedrock) and/or a saturated layer were not detected because they may be less than 10 feet thick. Competent Mt Eden Bedrock (V4) surface is roughly parallel with surface topography and is about 32 feet deep on the east end. On the west end, competent Mt Eden Bedrock is as shallow as 26 feet and exposed in the stream’s western bank (upper photo). The competent Mt Eden Bedrock depression is about 137 feet wide, 52 feet deep, and extends about 90 feet west of and 47 feet east of the road center. The current stream channel’s deepest point (profile west end) is offset about 108 feet west of the depression’s (possible historical stream channel) deepest point.

. TERRA PHYSICS 28841 Base Line Road Highland, CA 92346 phone/fax (909)862-0626
21
3.0 REFERENCE
TERRA PHYSICS, 2006. “Final Report – Seismic Refraction Survey To Detect San Timoteo Formation Bedrock – Former Lockheed Beaumont Site 2 – Laborde Canyon – South Of Beaumont, California”, prepared for Tetra Tech under Project No. 04-82b, Highland, CA.