31
APPENDIX H: AMORCO MARINE TERMINAL EMISSIONS CALCULATIONS METHODOLOGY

APPENDIX H: AMORCO MARINE TERMINAL EMISSIONS CALCULATIONS METHODOLOGY

THIS PAGE IS INTENDED TO BE LEFT BLANK

AMORCO MARINE TERMINAL EMISSIONS CALCULATIONS BACKGROUND Emissions of criteria pollutants and greenhouse gases (GHG) from ocean going vessels (OGV) were calculated in accordance with methods prescribed by the BAAQMD in Tesoro’s Title V Operating Permit (the Permit) which includes Facilities #B2758 – Golden Eagle Refinery and #B2759 - Amorco Marine Oil Terminal. These methods appear in Condition 878 and Appendix B of the operating permit which are provided as Attachment A. The methods prescribed in The Permit for calculating emissions from OGVs provide the following calculation parameters:
tanker fuel usage rates; diesel fuel used during barge unloading; tug usages; fuel combustion emission factors; and hydrocarbon emission factors from onloading of crude oil, ballast or products.
The last item in the above list is not applicable for the Amorco Terminal since no onloading occurs at this location. Data from the tanker fuel usage rate table (volume/hr) was multiplied by the time (hr) to calculate the total amount of fuel used. Activities were divided into four categories:
transit to and from the terminal maneuvering in the vicinity of the terminal hoteling; and boiler operation during unloading.
In addition, two (2) tug boats were assumed to operate in conjunction with each vessel for a total operating time of eight (8) hours per tug boat in accordance with the tug usages provided in the The Permit. Time in each activity was based on a starting point approximately 11 miles west of the Golden Gate Bridge until the vessel was at berth. A total of ten (10) hours was assumed for the roundtrip to and from the starting point west of the Golden Gate Bridge. Six (6) hours was assumed for the transit time and four (4) hours was assumed for the maneuvering time. Hoteling duration was assumed to be 20 hours. As noted above, tanker fuel use rates were provided in the The Permit. Tug fuel use rates were obtained from the “Port of Los Angeles Baseline Emission Inventory – 2001” prepared by Starcrest Consulting Group, LLC (Attachment B). The section on Page 153 of this document entitled Assist Tugboats notes “The average hourly fuel consumption for assist tugboats was 39 gallons per hour.” This is approximately equal to one (1) barrel (42 gallons) per hour. The calculations used for this analysis conservatively assumed three (3) barrels per hour to account for variance in tugboats and low load factors. Provided as Attachment C is a spreadsheet entitled, “Ships & Tugs – BAAQMD Prescribed Methodology” which contains the emission factors from The Permit data along with the hourly activity data used to calculate criteria pollutant emissions. The Permit does not specify PM2.5 emission factors, therefore factors were obtained from the May 2011 California Air Resources Board Planning and Technical Support Division document entitled “Emissions Estimation Methodology for Ocean-Going Vessels.” (The CARB Guidance - Attachment D). Tug-specific

PM2.5 emission factors are not provided in The CARB Guidance, therefore to calculate these emissions the ship transit PM2.5 emissions are scaled proportionally to the ratio of ship transit-to-tug-transit PM10 emissions. The volume of fuel consumed is multiplied by the criteria pollutant emission factors to determine overall emissions. The spreadsheet shows the results for a single ship along with the 2008 baseline and future cases. GHG emission factors are not provided in The Permit. GHG emission factors in grams pollutant per kW-hr for CO2 and CH4 were taken from Tables II-6 through II-9 from The CARB Guidance. Table II-10 in the same document provided fuel consumption rates by fuel type in grams fuel/kW-hr. The fuel consumption rates were used in combination with the emission factors to develop emission factors in terms of grams pollutant/gram fuel. This enabled the use of consistent fuel consumption data for the GHG and criteria pollutant calculations. Emission factors for N2O were taken from “The Port of Long Beach Air Emissions Inventory – 2011” (Attachment B). Tables 2.6, 2.11, and 2.15 contain the N2O emissions data for propulsion engines, auxiliary engines, and boilers, respectively, in grams/kW-hr. Table 2.17 contains a correction factor for N2O emissions when burning marine diesel oil (MDO). This factor of 0.94 was applied to the calculated emissions. The table also notes that the emissions of CO2 and CH4 have a correction factor of 1.00. Provided as Attachment E is a spreadsheet entitled, “GHG Based on Fuel from BAAQMD Method” which contains the emission factors and fuel consumption factors from The CARB Guidance along with the fuel consumed (consistent with criteria pollutant calculations). The amount of fuel consumed is multiplied by the GHG emission factors to determine overall emissions. Separate emission factors are identified for CO2, CH4, and N2O. The individual results are multiplied by the GHG potency factors to develop an overall CO2 equivalent (CO2e) value. As with criteria pollutants, the spreadsheet shows the results for a single ship along with the 2008 baseline and future cases. Criteria pollutants outside of indirect emissions from ocean going vessels will remain below the cap set in The Permit. Any actual increase in stationary source emissions would be minor and primarily result from throughput increases in the storage tanks. Other emissions sources at the Amorco Terminal such as fugitive components are included in the cap and will not increase. GHG emissions from the stationary sources were increased by scaling up the total baseline emissions proportional to the projected increases in the number of ocean going vessels. This is a conservative assumption since only tank throughput emissions would increase.

Attachment A
Title V Operating Permit Excerpts

THIS PAGE IS INTENTIONALLY LEFT BLANK.

Bay Area Air Quality Management District
939 Ellis Street San Francisco, CA 94109
(415) 771-6000
Final
MAJOR FACILITY REVIEW PERMIT
Issued To:
Tesoro Refining and Marketing Company Facility #B2758 & Facility #B2759
Facility Addresses: Facility #B2758 Facility #B2759 Golden Eagle Refinery Amorco Terminal 150 Solano Way 1750 Marina Vista Way Martinez, CA 94553 Martinez, CA 94553
Mailing Address:
Golden Eagle Refinery, 150 Solano Way Martinez, CA 94533
Responsible Official Facility Contact William Bodnar Matthew Marusich Vice President and General Manager Environmental Manager (925) 228-1220 (925) 228-1220
Type of Facility: Petroleum Refining BAAQMD Engineering Division Contact: Primary SIC: 2911 Arthur P. Valla Product: Refined Petroleum Products ISSUED BY THE BAY AREA AIR QUALITY MANAGEMENT DISTRICT Signed by Jeff McKay for Jack P. Broadbent June 28, 2011 _ Jack P. Broadbent, Executive Officer/Air Pollution Control Officer Date

THIS PAGE IS INTENTIONALLY LEFT BLANK.

Facility Name: Tesoro Refining and Marketing Company Permit for Facility #: B2758 and B2759
VI. Permit Conditions
2011 Final Renewal 412 June 28, 2011
Condition 878
S100 Avon Wharf Loading Berth No. 1
1. When calculating hydrocarbon emissions from vessel or barge loading, the
Permittee/Owner/Operator shall use the emission factors presented in condition number 5 of condition ID #878. (basis: cumulative increase)
2. Permittee/Owner/Operator shall install and maintain a Pressure
Recorder/Controller in the vapor recovery system to provide a permanent record of pressure during the loading of vessels. These records shall be maintained for a minimum of 5 years. (basis: cumulative increase)
3. Not less frequently than every six months, Permittee/Owner/Operator shall
conduct tests to assess leakage from all relief valves that vent to atmosphere in the marine vapor recovery system on a semi-annual basis. Permittee/Owner/Operator shall ensure that the testing and record keeping are done in compliance with Regulation 8, Rule 18. (basis: cumulative increase, Regulation 8-18)
4. If leakage is detected during the loading of a vessel, or if the vapor recovery
system is shutdown for any period of time during loading, or if a relief valve in the recovery system vents to atmosphere during loading, Permittee/Owner/Operator shall use the "Non-Vapor Recovery" emission factors in condition number 5 of condition ID #878 to calculate emissions from the entire loading operation. Credit for vapor recovery may be given for a portion of a vessel loading operation, provided that Permittee/Owner/Operator can provide documentation to the satisfaction of the APCO that credit is appropriate, as determined by the APCO.
(basis: cumulative increase) 5. DATA FOR DETERMINING EMISSIONS FROM MARINE ACTIVITY Described herein are the following lists of fuel usage rates and emission
factors for calculating marine activity emissions Part B-1 Tanker Fuel Usage Rates Part B-2 Diesel Fuel Used During Barge Unloading Part B-3 Tug Usages
Facility Name: Tesoro Refining and Marketing Company Permit for Facility #: B2758 and B2759
VI. Permit Conditions
2011 Final Renewal 413 June 28, 2011
Part B-4 Fuel Combustion Emission Factors Part B-5 Hydrocarbon Emissions from Onloading of Crude Oil, Ballast or
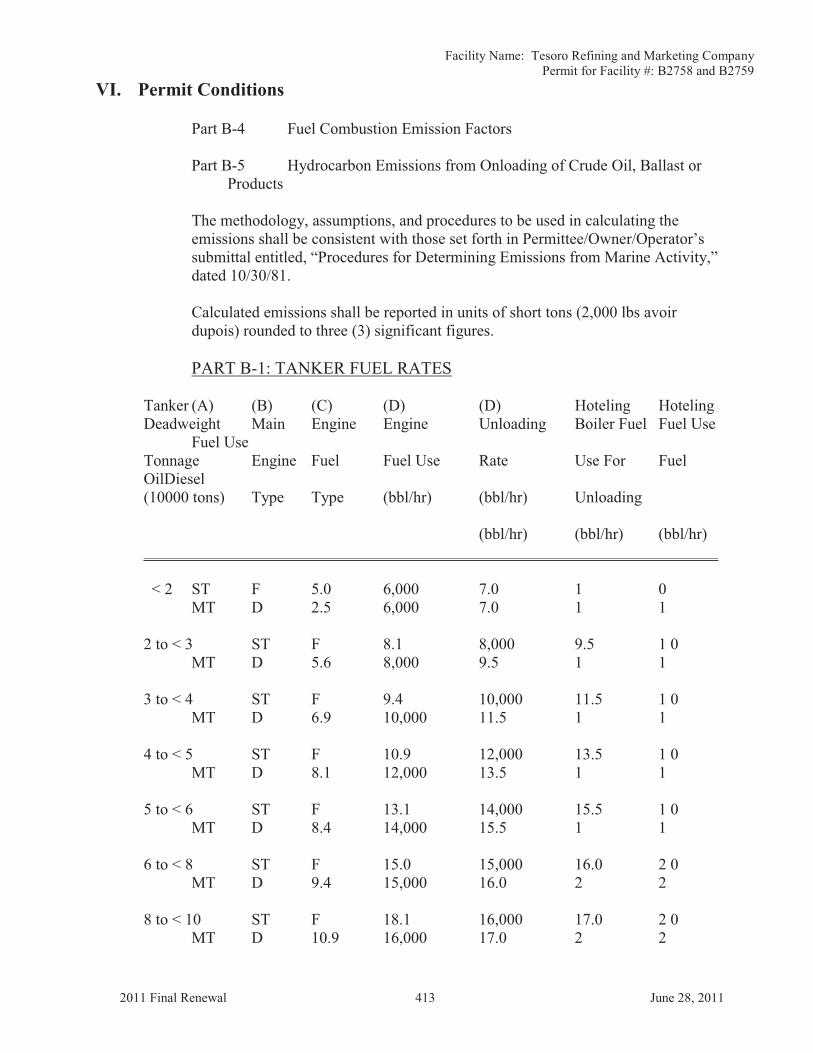
Products The methodology, assumptions, and procedures to be used in calculating the emissions shall be consistent with those set forth in Permittee/Owner/Operator’s submittal entitled, “Procedures for Determining Emissions from Marine Activity,” dated 10/30/81. Calculated emissions shall be reported in units of short tons (2,000 lbs avoir dupois) rounded to three (3) significant figures. PART B-1: TANKER FUEL RATES
Tanker (A) (B) (C) (D) (D) Hoteling Hoteling Deadweight Main Engine Engine Unloading Boiler Fuel Fuel Use Fuel Use Tonnage Engine Fuel Fuel Use Rate Use For Fuel OilDiesel (10000 tons) Type Type (bbl/hr) (bbl/hr) Unloading (bbl/hr) (bbl/hr) (bbl/hr) ________________________________________________________________________ < 2 ST F 5.0 6,000 7.0 1 0 MT D 2.5 6,000 7.0 1 1 2 to < 3 ST F 8.1 8,000 9.5 1 0 MT D 5.6 8,000 9.5 1 1 3 to < 4 ST F 9.4 10,000 11.5 1 0 MT D 6.9 10,000 11.5 1 1 4 to < 5 ST F 10.9 12,000 13.5 1 0 MT D 8.1 12,000 13.5 1 1 5 to < 6 ST F 13.1 14,000 15.5 1 0 MT D 8.4 14,000 15.5 1 1 6 to < 8 ST F 15.0 15,000 16.0 2 0 MT D 9.4 15,000 16.0 2 2 8 to < 10 ST F 18.1 16,000 17.0 2 0 MT D 10.9 16,000 17.0 2 2

Facility Name: Tesoro Refining and Marketing Company Permit for Facility #: B2758 and B2759
VI. Permit Conditions
2011 Final Renewal 414 June 28, 2011
10 to < 14 ST F 20.0 17,000 17.5 2 0 MT D 13.1 17,000 17.5 2 2 14 to < 18 ST F 21.6 18,000 18.5 2 0 MT D 15.6 18,000 18.5 2 2 > 18 ST F 22.5 19,000 19.5 3 0 MT D 19.1 19,000 19.5 3 3 Explanation of abbreviations for PART B-1: Column A ST = steamship (steam boilers and turbines) MT = motorship (internal combustion engines) Column B F = fuel oil (not diesel fuel) D = diesel oil Column C BBL/hr = barrels per hour of fuel use during transit (at 50% of full steaming) Column D During unloading of oil or ballast, steamships and motorships use fuel oil
(F) for boilers/turbines which drive the unloading pumps
PART B-2: DIESEL FUEL USED DURING BARGE UNLOADING* barge unloading rate diesel fuel usage (bbl/hr) (bbl/hr) 2,000 2.3 2,200 2.4 2,500 2.9 3,500 4.1 8,000 9.5 10,000 11.5 13,000 13.5 * Based on internal combustion engines driving the unloading pumps on the barges
using the same kind of diesel as the tugs (i.e., 0.50 wt% sulfur and API gravity of 35)
PART B-3: TUG USAGES One tug for assisting tankers of < 50,000 DWT size, for a total transit time of four
hours per tanker call at docks. Two tugs for assisting tankers of > 50,000 DWT size, for a total transit time of
four hours each tug per tanker call at docks.

Facility Name: Tesoro Refining and Marketing Company Permit for Facility #: B2758 and B2759
VI. Permit Conditions
2011 Final Renewal 415 June 28, 2011
One tug for transporting barges or lighters, for a total transit time of ten hours per
each barge/lighter call at docks. Thus, for each call below: Total tug transit hour Tanker of < 50,000 4 Tanker of > 50,000 8 Product shipment barge 10 Crude oil lighter 10
PART B-4: FUEL COMBUSTION EMISSION FACTORS (pounds / 1,000 gallons of fuel burned *)
Boiler In Steamships: Fuel Type *POC *SO2 *NOx *CO *PM10 during transit F 3.10 315.3 48.2 2.62 19.0 during hoteling F 3.10 315.3 20.9 2.62 19.0 during unloading F 3.10 315.3 48.2 2.62 19.0
Internal Combustion Engines In Motorships: Fuel Type *POC *SO2 *NOx *CO *PM10
during transit D 32.8 70.1 367.0 56.9 20.0 during hoteling D 32.8 70.1 367.0 56.9 20.0
Internal Combustion Engines in Motorships > or = 100,000 DWT: Fuel Type *POC *SO2 *NOx *CO *PM10
during transit D 32.8 210.3 367.0 56.9 20.0 during hoteling D 32.8 210.3 367.0 56.9 20.0
Boilers In Motorships: Fuel Type *POC *SO2 *NOx *CO *PM10 during transit F 3.10 315.3 20.9 2.62 19.0 during hoteling F 3.10 315.3 48.2 2.62 19.0 Internal Combustion (IC):
Engines In Tugs: Fuel Type *POC *SO2 *NOx *CO *PM10 during transit TD 13.0 70.1 571.2 56.9 25.0 IC engines driving barge unloading pumps TD 13.0 70.1 571.2 56.9 25.0
(PM-10 factor of 25 lb/1000 gallons also applies to internal combustion engines driving barge unloading pumps)
Explanation of abbreviations for PART B-4: Fuel Type F = fuel oil or residuum sulfur @ < 2.0 wt%; nitrogen @ < 0.43 wt%; API gravity 18

Facility Name: Tesoro Refining and Marketing Company Permit for Facility #: B2758 and B2759
VI. Permit Conditions
2011 Final Renewal 416 June 28, 2011
D = marine diesel sulfur @ < 0.5 wt%; nitrogen @ < 0.08 wt%; API gravity 35 TD = tug diesel sulfur @ < 0.5 wt; API gravity @ 35 PART B-5: HYDROCARBON EMISSIONS FROM ONLOADING OF
CRUDE OIL, BALLAST OR PRODUCTS COMMODITY Non-Vapor Recovery Vapor Recovery ONLOADED POC Emissions POC Emissions (lb/1,000 gallons) (lb/1,000 gallons) Crude Oil: Barges 1.7 0.034 Vessels 1.0 0.02 Ballast: (unsegregated***) Crude 0.7 0.014 Gasoline 1.6 0.032 Gasoline: Barges 4.0 0.08 Vessels 2.4 0.048 Turbine Fuel (Jet Fuel) 0.005 0.0001 Diesel Oil, Gas Oil, 0.005 0.0001 Conversion Feed, Cutter Stock, Catalytic Cracker Charge HDN Charge, Stove Oil, Solvents, Lubestocks, Middle Distillate Oil Fuel Oil, Heavy Fuel Oil, 4.0 E-05 8.0 E-07 Low Sulfur Oil, Bunkers IFO, LSFO, Residuum, Carbon Black, Purchased Cut Back Tar, Asphalt *** The volume of unsegregated ballast taken on by a ship which has
offloaded cargo is determined by the following equation: B = 7.5 x MDWT x (0.35 – B segregated/100) Explanation of abbreviations for PART B-5: B = the volume of ballast into dirty cargo tanks in Mbbl MDWT = ship tonnage in thousands of dead weight tons as indicated by Clarkson B segregated = the percent of segregated or dedicated ballast for the ship as
indicated by Clarkson or some other reliable source which is

Facility Name: Tesoro Refining and Marketing Company Permit for Facility #: B2758 and B2759
VI. Permit Conditions
2011 Final Renewal 417 June 28, 2011
known to be more current; e.g., ship’s records, where the percent is equal to or less than 35. If the percent is greater than 35 than the amount of unsegregated ballast will be zero.
Condition 1910
S1007 Hydrocracker Unit 2nd Stage S1008 Hydrocracker Unit 1st Stage PERMIT CONDITION 1910 APPLICATION #548 HYDROCRACKER EXPANSION PROJECT PERMIT CONDITIONS (S-1007) AND (S-1008) Application 15944 (May 2007): S-1007 Isocracker Unit: IIR Compressor Leak Control Measure to install a shroud/clamp to capture compressor leaks and route gases to the flare gas recovery header. Add inspection requirements for the shroud/clamp. Application 16850 (February 2008): S-1007 Isocracker Unit: HIR Compressor Leak Control Measure to install a shroud/clamp to capture compressor leaks and route gases to the flare gas recovery header. Add inspection requirements for the shroud/clamp. Administratively Changed by Application 18861 (June 2009) Removed completed parts and parts redundant with District Regulations Administratively Changed by Application 21711 (May 2010). Deleted Parts 3 and 4. Leaks permanently repaired. 1. Deleted. (No pressure relief valves associated with this project vent to
atmosphere) 2. Deleted. (Completed. All pumps and compressors have double mechanical
seals with a barrier fluid, or equivalent, and all new compressors must meet applicable New Source Performance Standards.)
3. Deleted (Completed. IIR Compressor leak permanently repaired and shroud/clamp removed during 2Q09 Hydrocracker shutdown).
4. Deleted (Completed. HIR Compressor leak permanently repaired and
shroud/clamp removed during 2Q09 Hydrocracker shutdown).

Attachment B
Port of Los Angeles Baseline Emission Inventory – 2001

THIS PAGE IS INTENTIONALLY LEFT BLANK.


Baseline Air Emissions Inventory – 2001
Port of Los Angeles July 2005
153
During the survey interviews, the proportion of time spent within three zones (the Port harbor, up to 25 miles, and from 25 to 50 miles) was discussed with the vessel operators. Based on the interviews, percentages were given for each vessel type and emissions for each of the pollutants were estimated for each zone. Table 3.3 summarizes the average percent of time spent by each category of harbor vessel in the three zones. These percentages can be used with average annual operating hours data by vessel type presented below to derive annual average hours by zone.
Table 3.3: Average Time Spent in Zone, percent
Percent Time in ZoneCategory Harbor 25 Miles 50 Miles
Assist Tug 100% 0% 0%Tugboat (Unit Tow) 81% 15% 4%Ferry 35% 51% 14%Excursion 25% 65% 9%Crew boat 52% 48% 0%Work boat 66% 34% 0%Government 74% 14% 12%Commercial Fishing 10% 50% 40%Recreational Vessel 40% 38% 22%Dredge and Dredging Support 100% 0% 0%Line Haul Towboat 60% 20% 20%
58.5% 30.5% 11.0%
Assist Tugboats As shown in Tables 3.1 and 3.2, in 2001 the three harbor assist tugboat companies operated a total of 18 diesel-powered boats. The majority of the assist tugboats had two main engines with each engine having a horsepower between 1,500 and 2,500 hp. The most common main engine model found was Caterpillar 3516B. The annual operating hours for main propulsion engines ranged from 300 to 1,900 hours, with an average of 1,043 hours. The average assist tugboat had two 110 hp auxiliary engines used to supply on-board power, navigation systems, and air conditioning/heating for the crew. The most common type of auxiliary engine among assist tugboats was the Caterpillar 3304. The auxiliary engines ranged from 67 to 180 hp. The annual hours of usage for auxiliary engines ranged from 130 to 2,900 hours, with an average of 1,200 hours. One harbor assist tugboat company started using shore power after 2001 for its tugboats while they are at the company’s docks. The average hourly fuel consumption for assist tugboats was 39 gallons per hour. Approximately 44% of the assist tugboats had Category 2 main engines.

Attachment C
Ships & Tugs – BAAQMD Prescribed Methodology

THIS PAGE IS INTENTIONALLY LEFT BLANK.

Ships & Tugs - BAAQMD Prescribed Methodology
Assumptions:Engine Mode Fuel
Fuel Use (g/kW-
hr)
PM2.5
(g/kW-hr)
PM2.5 (lbs/1000
gal)
180,000 DWT MDO 217 0.23 7.5
2 Tugs @ 8 hours each Residual 227 1.46 45.7
6 hour transit time (in/out) Boiler All Residual 305 0.78 18.2
20 hour hoteling time MDO 200 0.23 8.2
4 hour maneuvering time (in/out) Residual 204 1.46 50.8
Boiler Operational During Hoteling Time MDO 194 0.23 8.4
Residual 204 1.46 50.8
Diesel Fuel Oil POC SO2 NOx CO PM10 PM2.5
Transit to/from MOT 19.1 6 4813.2 0 157.87 1,012.22 1,766.44 273.87 96.26 39.23
Maneuvering 19.1 4 3208.8 0 105.25 674.81 1,177.63 182.58 64.18 26.16
Hoteling 3 3 20 2520 2520 90.47 1,324.51 977.51 149.99 98.28 20.54
Boiler Unloading 19.5 20 0 16380 50.78 5,164.61 789.52 42.92 311.22 133.52
Tug 1 (Tug Diesel) 3 8 1008 0 13.10 70.66 575.77 57.36 25.20 8.22
Tug 2 (Tug Diesel) 3 8 1008 0 13.10 70.66 575.77 57.36 25.20 8.22
430.58 8,317.47 5,862.64 764.07 620.34 235.89
In Tons:
Activity POC SO2 NOx CO PM10 PM2.5 0.22 4.16 2.93 0.38 0.31 0.12
Ship Transit 32.8 210.3 367 56.9 20 8.2
Ship Hoteling IC 32.8 210.3 367 56.9 20 8.2 2008 had 85 vessel calls (tons/yr)
Boiler Unloading 3.1 315.3 48.2 2.62 19 18.2 18.30 353.49 249.16 32.47 26.36 10.03
Boiler Hoteling 3.1 315.3 20.9 2.62 19 18.2
Tug Transit 13 70.1 571.2 56.9 25 10.2 2008 Avg Tons/Day
0.05 0.97 0.68 0.09 0.07 0.03
for 90 vessels:
19.38 374.29 263.82 34.38 27.92 10.61
PM2.5 Emission Factor Unit Conversion
Aux All
Main
Transit
Maneuvering
Emissions (lbs) per ship call
Criteria Pollutant Emission Factors (lbs/1000 gal)
ActivityFuel Usage (BBL/HR) Time in
Activity
Total Diesel
Used (Gal)
Total Fuel Oil
Used (Gal)

THIS PAGE IS INTENTIONALLY LEFT BLANK.

Attachment D
Emissions Estimation Methodology for Ocean-Going Vessels

THIS PAGE IS INTENTIONALLY LEFT BLANK.

Emissions Estimation Methodology for Ocean-Going Vessels
May 2011
California Air Resources BoardPlanning and Technical Support Division

D - 15
Table II-6: Main Engine Emission Factors – Transit Mode (g/kW-hr)
Table II-7 presents the emission factors for main engines during maneuvering or low load operation near ports.
Table II-7: Main Engine Emission Factors –Maneuvering (g/kW-hr)
Table II-8 presents the emission factors for auxiliary engines, including diesel-electric vessels. As shown in the table, the emission factors for auxiliary engine vary depending on the type of fuel used.
Table II-9 presents the emission factors for auxiliary boilers, which use heavy fuel oil. These emission factors were converted to grams per kilowatt hour from grams per tonne of fuel using methodology developed by Starcrest(Starcrest, 2007a).
Engine Speed Fuel CH4 CO CO2 NOx PM10 PM2.5 ROG SOx
Slow Marine Distillate (0.1% S) 0.07 1.10 588 17.0 0.25 0.23 0.78 0.36Slow Marine Distillate (0.5% S) 0.07 1.10 588 17.0 0.38 0.35 0.78 1.90Slow Heavy Fuel Oil 0.08 1.38 620 18.1 1.50 1.46 0.69 10.50Medium Marine Distillate (0.1% S) 0.08 1.10 645 13.2 0.25 0.23 0.65 0.40Medium Marine Distillate (0.5% S) 0.08 1.10 645 13.2 0.38 0.35 0.65 2.08Medium Heavy Fuel Oil 0.09 1.10 677 14.0 1.50 1.46 0.57 11.50High Marine Distillate (0.1% S) 0.08 1.10 645 12.1 0.25 0.23 0.65 0.40High Marine Distillate (0.5% S) 0.08 1.10 645 12.1 0.38 0.35 0.65 2.08High Heavy Fuel Oil 0.09 1.10 645 12.7 1.50 1.46 0.23 11.50

D - 16
Table II-8: Auxiliary Engine Emission Factors – Transit, Maneuvering, andHotelling (g/kW-hr)
Table II-9: Auxiliary Boiler Emission Factors (g/kW-hr)
The emission factors for main engines, auxiliary engines and auxiliary boilers used by ARB staff are generally consistent with the emission factors used by Starcrest in developing the 2005 Port of Los Angeles emissions inventory andthe updates done in 2007. The Starcrest emission factors were based on work done by Entec (Entec, 2002). The Entec emission factors were developed using Lloyd’s of London and IVL Swedish Environmental Institute data that related emissions to engine speed and the type of fuel used.
ARB staff developed an alternate particulate matter emission factor for engines burning heavy fuel oil based upon an extensive review of emission tests described in scientific literature. This emission factor, set at 1.5 grams/kilowatt-hour, is based upon the use of HFO fuel with 2.5% sulfur content. The basis of this emission factor is fully described in a white paper written by ARB staff in 2007, which is available on the ARB web site (CARB, 2008).
For CO emissions from the main engines during transit, staff elected to use a U.S. EPA emission factor published in the Environ report (Environ, 2007). This emission factor is consistent with the CO emission factors used by Starcrest for the Port of Los Angeles emission inventory (Starcrest, 2005).
6. Fuel ConsumptionIt was assumed that all main engines and auxiliary boilers burned heavy fuel oil. The main engine assumption was based on the 2005 ARB OGV survey; the auxiliary boiler assumption was based on communications with boiler manufacturers. For auxiliary engines, it was assumed that 92% of cruise ships burned heavy fuel oil and 8% distillate. For all other ships, it was assumed that 71% use heavy fuel oil and 29% use distillate in their auxiliary engines. These data were obtained from the 2005 ARB OGV survey.
Engine Speed Fuel CH4 CO CO2 NOx PM10 PM2.5 ROG SOx
Medium Marine Distillate (0.1% S) 0.09 1.10 690 13.9 0.25 0.23 0.52 0.40Medium Marine Distillate (0.5% S) 0.09 1.10 690 13.9 0.38 0.35 0.52 2.10Medium Heavy Fuel Oil 0.09 1.10 722 14.7 1.50 1.46 0.46 11.10
Fuel CH4 CO CO2 NOx PM10 PM2.5 ROG SOx
Heavy Fuel Oil 0.03 0.20 970 2.1 0.80 0.78 0.11 16.50

D - 17
Table II-10 Fuel Consumption Rates (g/kW-hr)Engine Engine Speed Mode Fuel Fuel Use Rate
All All Marine Distillate 217All All Residual 227
Boiler N. A. All Residual 305High Transit Residual 213
Medium Transit Marine Distillate 203Slow Transit Marine Distillate 185
Medium Transit Residual 213Slow Transit Residual 195High Maneuvering Residual 213
Medium Maneuvering Marine Distillate 203Slow Maneuvering Marine Distillate 185
Medium Maneuvering Residual 213Slow Maneuvering Residual 195
Auxiliary
Main
Fuel consumption rates were obtained from Entec (Entec, 2002) and vary by engine, engine speed, and mode of operation. Fuel use rates are expressed in the same units as emission factors; in grams per kilowatt hour. Table II-10 summarizes the fuel consumption rates used.
7. Growth rateGrowth rates were estimated by vessel type and by port. These growth rates were based upon an analysis of US Army Corps of Engineers vessel call data (USACE, 2006) between the years 1994-2005. The total net registered tonnage (NRT), a measure of the volume of cargo a ship can carry, was determined by vessel type and by port. Previous ARB OGV growth rates were based on total installed main engine power determined from vessel call data between the years 1997 and 2003. Growth in NRT is directly proportional to growth in installed power. NRT was used to estimate growth because it was not possible to determine main engine power for many of the records; in contrast, NRT data was available for almost 99% of the records analyzed. The growth rates selected are the midpoint between the best fit compounded annual growth rate in NRT between 1994 through 2005 and the best fit linear (arithmetic) growth rate in NRT for the same time period. The sum of growth of all California ports was set to equal to the statewide growth with the assumption that the ports will grow proportionally to their historical NRT growth between the years 1994-2005.
Growth rates developed using this methodology were checked and verified against other studies, including the Port of Los Angeles and Port of Long Beach emission inventory updates done in 2007 (Starcrest, 2007a and 2007b), the Port of San Diego emission inventory (Starcrest, 2007c), and the Port of Oakland emission inventory (Environ, 2007).

Attachment E
GHG Based on Fuel from BAAQMD Method

THIS PAGE IS INTENTIONALLY LEFT BLANK.

GHG Based on Fuel from BAAQMD MethodEF from CARB May 2011 Appendix D
Engine Mode FuelFuel Use (g/kW‐hr)
CH4 CO2 N2O CO2e CH4 CO2 N2O CO2e
MDO 217 0.09 690 0.029 700.9234 0.000414747 3.179723502 0.000134286 3.230061751Residual 227 0.09 722 0.031 733.5 0.000396476 3.18061674 0.000136564 3.231277533
Boiler All Residual 305 0.03 970 0.08 995.43 9.83607E‐05 3.180327869 0.000262295 3.263704918MDO 200 0.08 645 0.029 655.7134 0.000399334 3.219633943 0.000145458 3.273111814
Residual 204 0.09 677 0.031 688.5 0.000441176 3.318627451 0.000151961 3.375MDO 194 0.08 644 0.029 654.7134 0.000412371 3.319587629 0.000150206 3.37481134
Residual 204 0.09 677 0.031 688.5 0.000441176 3.318627451 0.000151961 3.375
ActivityTotal Diesel Used (Gal)
Total Fuel Oil Used (Gal)
grams fuel
One Ship 85 Calls 90 CallsTransit to/from MOT 4813.2 0 15,514,869 50.75 4,313.80 4,567.56
Maneuvering 3208.8 0 10,343,246 34.89 2,965.23 3,139.65Hoteling Diesel 2520 0 8,122,968 26.22 2,228.83 2,359.94Hotel Fuel Oil 0 2520 8,122,968 26.23 2,229.67 2,360.83
Boiler Unloading 0 16380 52,799,292 172.22 14,638.29 15,499.37Tug 1 (Tug Diesel) 1008 0 3,249,187 12.08 1,026.50 1,086.88Tug 2 (Tug Diesel) 1008 0 3,249,187 12.08 1,026.50 1,086.88
334.46 28,428.82 30,101.10
GHG CO2e Emissions (metric tons)
GHG EF g/kW‐hr GHG EF g(pollutant)/g(fuel)
Aux All
MainTransit
Maneuvering


