31
Appendix J Road Safety Audit Report
Appendix J Road Safety Audit Report

16 October 2015
US-31/M-37/Division Street,
Traverse City, MIRoad Safety Audit
FINALREPORT
PREPARED FOR:Michigan Department of Transportation

Division PEL, Traverse City
Road Safety Audit Final Report October 16, 2015
Table of Contents Introduction ..................................................................................................................................................................1
Background ......................................................................................................................................... 1
RSA Team .......................................................................................................................................... 3
Kickoff Meeting Summary ................................................................................................................ 3
General Observations ........................................................................................................................ 4
Cost Estimate ..................................................................................................................................... 5
Highway Safety Manual Analysis – Baseline .................................................................................... 5
RSA Findings and Recommendations ..................................................................................................................6
Crash Potential #1: Crosswalks .......................................................................................................... 6
Crash Potential #2: Turning Left from Four-Lane Section .............................................................. 7
Crash Potential #3: Grandview Parkway Intersection ...................................................................... 8
Crash Potential #4: Fourteenth Street Intersection ........................................................................ 10
Crash Potential #5: Eleventh Street Intersection ............................................................................ 11
Crash Potential #6: Front Street Intersection ................................................................................. 12
Crash Potential #7: Seventh/ Eighth Street Intersection ................................................................ 13
Crash Potential #8: Sight Distance at Fifth and Ninth Streets ....................................................... 14
Highway Safety Manual Analysis – Recommended Alternative ..................................................... 15
Time of Return – Ultimate Recommendation ................................................................................. 15
Conclusion .................................................................................................................................................................. 15
Appendices APPENDIX A-1: Sign-in Sheet APPENDIX A-2: Safety Issue Risk Assessment Matrix APPENDIX B: Calculations and Spreadsheets APPENDIX C: Crash Summary Report

Division PEL, Traverse City
Road Safety Audit Final Report October 16, 2015
Introduction This document represents the final report for the Road Safety Audit (RSA) completed along Division (US-31/M-37) in Traverse City, MI, on June 1-2, 2015. This RSA was completed as part of the Division Street Planning and Environment Linkages (PEL) study.
The RSA was conducted per the Federal Highway Administration (FHWA) Road Safety Audit Guidelines as adopted by the Michigan Department of Transportation (MDOT). The definition of an RSA is “to perform a formal, safety performance examination of an existing or future road or intersection by an independent, multi-disciplinary RSA team”.
The main objective was to review operations of the roadway and identify safety issues for all road users. The RSA team focused on identifying improvement recommendations and countermeasures for roadway segments demonstrating a history of or potential for a high incidence of motor vehicle crashes.
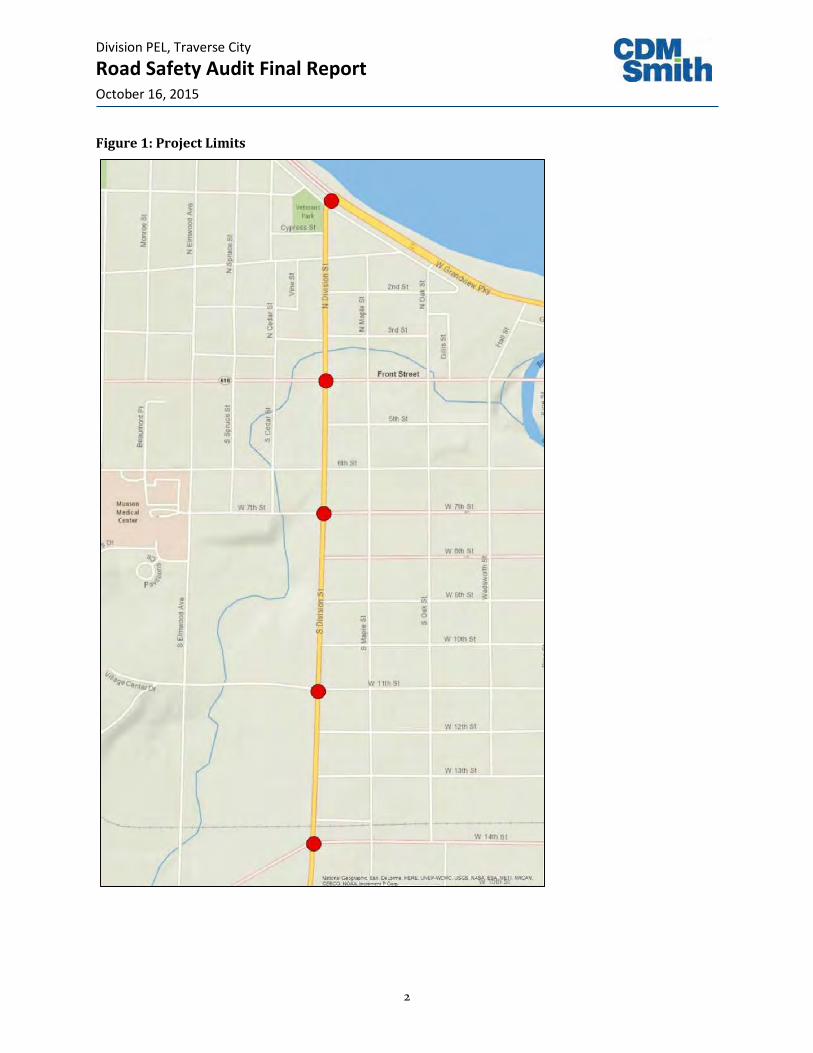
Background Division Street (US-31/M-37) is classified as “other principal arterial” and is listed on the National Highway System (NHS). The project focused on 1.2 miles of roadway from approximately 200 feet south of Fourteenth Street/Silver Lake Road (CS 28012 MP 5.590) north to Grandview Parkway (CS 28012 MP 6.910). The Project limits are shown in Figure 1. The posted speed limit is 40 mph south of Eighth Street and 30 mph north of Eighth Street, with a four-lane section. There are four signalized intersections, three of which have left turn lanes. Land use is primarily residential, and parkland south of Eighth Street, residential and retail between Eighth and Fifth Streets, then retail, professional services, restaurants and one private school north of Fifth Street to the Grandview Parkway.
1
Division PEL, Traverse City
Road Safety Audit Final Report October 16, 2015
Figure 1: Project Limits
2

Division PEL, Traverse City
Road Safety Audit Final Report October 16, 2015
RSA Team The RSA team was composed of multi-disciplinary experts from the Michigan Department of Transportation (MDOT) and CDM Smith and included:
• Wendy Ramirez, PE: Traffic and Safety • Jami Trudelle, PE: Traffic and Safety • Bill Taylor: Geometrics • Team Leaders: Matt Hunter, PE, PTOE (CDM Smith) and Brian Smith, PE (CDM Smith)
In addition, local law enforcement members joined the RSA team to provide crucial insight into project specific safety experience, including:
• Officer Chris Barsheff: Grand Traverse Sheriff Department • Officers Scott Maxon and Adam Verschaeve: Traverse City Police
The sign in sheet is located in Appendix A-1.
Kickoff Meeting Summary The RSA began with a kickoff meeting which included the RSA team, RSA Safety Manager, MDOT Project Manager, Grand Traverse Sheriff Department, and MDOT TSC staff. At the meeting, the RSA team leaders provided an overview of the RSA process and an introduction to the project area. The project team shared constraints and concerns of the RSA with the RSA team which included:
• Avoid impact to historic areas • Stay within right-of-way (ROW) where possible • Pedestrian and Bicycles • Review Eighth Street operations
o How is one way working? o How much traffic is accessing Eighth via Division?
Non-RSA team members were dismissed and the RSA team reviewed the data package materials which included:
• Traffic volumes • Crash Data (2011-2014) • Crash Analysis Tech Memo (CDMS 2014) • Crash Analysis Summary Tables • Aerial Photos/Maps • Internet (TMIS, MTCF, Google man)
The RSA team proceeded to conduct several field visits during various conditions including light and dark, non-peak and peak hour traffic, and during school finish. The team drove and walked the site, and reviewed road operations and safety from the perspective of all road users. Issues identified during the kick-off meeting were reviewed and new issues were identified. The RSA team convened at the MDOT Traverse City TSC to discuss the issues identified and develop a set of mitigation options.
3

Division PEL, Traverse City
Road Safety Audit Final Report October 16, 2015
Each safety issue was prioritized using the Safety Issue Risk Assessment matrix displayed below in Table 1, and in more detail in Appendix A-2.
Table 1: Safety Issue Risk Assessment Table
Frequency Rating Severity Rating
Low Moderate High Extreme
Frequent C D E F
Occasional B C D E
Infrequent A B C D
Rare A A B C
The project team developed mitigations to address each identified issue, with the intent to provide short-term mitigation solutions that could be implemented quickly at a low cost, and longer term improvements with a higher cost that could be incorporated into the main Division (US-31/M-37) PEL project.
A close-out presentation was prepared that incorporated the RSA team activities, findings and recommendations, which were presented to the MDOT RSA Safety Manager, MDOT Project Manager, project team and MDOT TSC staff for consideration.
The RSA team recommendations were further analyzed and included developing, preliminary geometrics, high level cost estimates, and performing safety analysis using the Highway Safety Manual (HSM). The RSA process, recommendation and assumptions are contained in this report for the MDOT Project Manager’s to responds to.
General Observations Based on the data review and field visits the RSA team noted several positive features along the Division Street study corridor including:
• Street lighting • Do not block intersection signing • Grandview Parkway, yield to pedestrian signs, and illuminated case signs • Good condition local signing • No observed speed issues during peak times • Speed warning signs • Adjacent Maple Street bicycle route
4

Division PEL, Traverse City
Road Safety Audit Final Report October 16, 2015
Cost Estimate A high level cost estimate was developed for each mitigation item based on the following method:
• Calculate baseline estimate of pavement removal and construction • Total pavement estimate used to calculate general percentage costs for miscellaneous items
(signing/pavement markings, MOT, drainage, street lighting) based on historical construction costs
• Calculate 20 percent contingency to account for unknowns • Mobilization (10 percent), utilities and ROW • Professional Engineering (16 percent), Construction Engineering (12 percent)
Highway Safety Manual Analysis – Baseline The Highway Safety Manual (HSM) methodology was used to assess the benefits of the RSA team recommendations. The base conditions were evaluated to provide an average crash frequency and crash rate to compare mitigation results against. Using the MDOT developed Worksheet 1 of the HSM, Division Street was divided into nine segments to analyze intersections and roadway sections separately as follows:
1. Fourteenth Street signalized intersection 2. Fourteenth Street to Eleventh Street segment 3. Eleventh Street two-way stop controlled intersection 4. Eleventh Street to Seventh Street segment 5. Seventh Street signalized intersection 6. Seventh Street to Front Street segment 7. Front Street signalized intersection 8. Front Street to Grandview Parkway segment 9. Grandview Parkway signalized intersection
The MDOT HSM Worksheet 1 was calibrated with 2014 locally established values. MDOT HSM Worksheet 1 was used to establish the composite baseline crash frequency and crash rate for the Division Street project conditions and limits as follows:
• Composite Average Crash Frequency (average crashes per year) = 119.75 (Combined Segment and Intersection Scores)
• Fourteenth to Grandview Parkway Average Crash Rate (crashes per 1,000,000 vehicle miles travelled) = 3.3
Nine recommendations for safety improvements throughout the Division corridor were ultimately developed as part of the field investigation during light and dark conditions. The next sections describe the features, reasons, and cost estimates for each recommendation. A crash reduction percentage is provided compared to the baseline conditions. Calculations and spreadsheets are provided in Appendix B, and the Crash Summary Report is provided in Appendix C.
5

Division PEL, Traverse City
Road Safety Audit Final Report October 16, 2015
RSA Findings and Recommendations Please note that the safety mitigations identified by the RSA team are just for the consideration and response of the MDOT Project Manager. The RSA team attempted to provide feasible and practical safety mitigations within the project limits, but acknowledge that there may be other factors not considered by the team that make the recommendation unfeasible.
The RSA team attempted to provide a short term and long term mitigation where applicable for each safety concern.
• Short Term – Lower cost and could be implemented prior to the main road project • Long Term – Higher cost and could be implemented with the main road project
The RSA team developed the following crash mitigations which are ordered by crash risk rating E to A. No level F crash risk ratings were identified.
Crash Potential #1: Crosswalks Crash Potential #1 relates to pedestrian crossings either with worn pavement markings or ramps without adequately marked crosswalks at unsignalized intersections. Officer Maxon felt that pedestrian demand to cross Division Street was present at Eleventh Street, Seventh Street, Front Street, and Grandview Parkway. In addition the RSA team noted several areas without sidewalk on the east side of Division with worn paths indicating pedestrian demand.
Four (4) pedestrian crashes occurred, with one (1) fatality at Eleventh Street where a pedestrian tried to cross congested traffic.
Crash Potential #1: Risk Rating The RSA team assigned a crash risk grade E to Crash Potential #1 based on an occasional crash frequency and extreme expected severity.
Crash Potential #1: Suggestions Based on the fatality and potential risk of severe crashes involving pedestrians the RSA team developed the following short-term and long-term suggestions:
EXPECTED FREQUENCY EXPECTED SEVERITY
RISK RATING E
Occasional Extreme High Risk Level
6
Division PEL, Traverse City
Road Safety Audit Final Report October 16, 2015
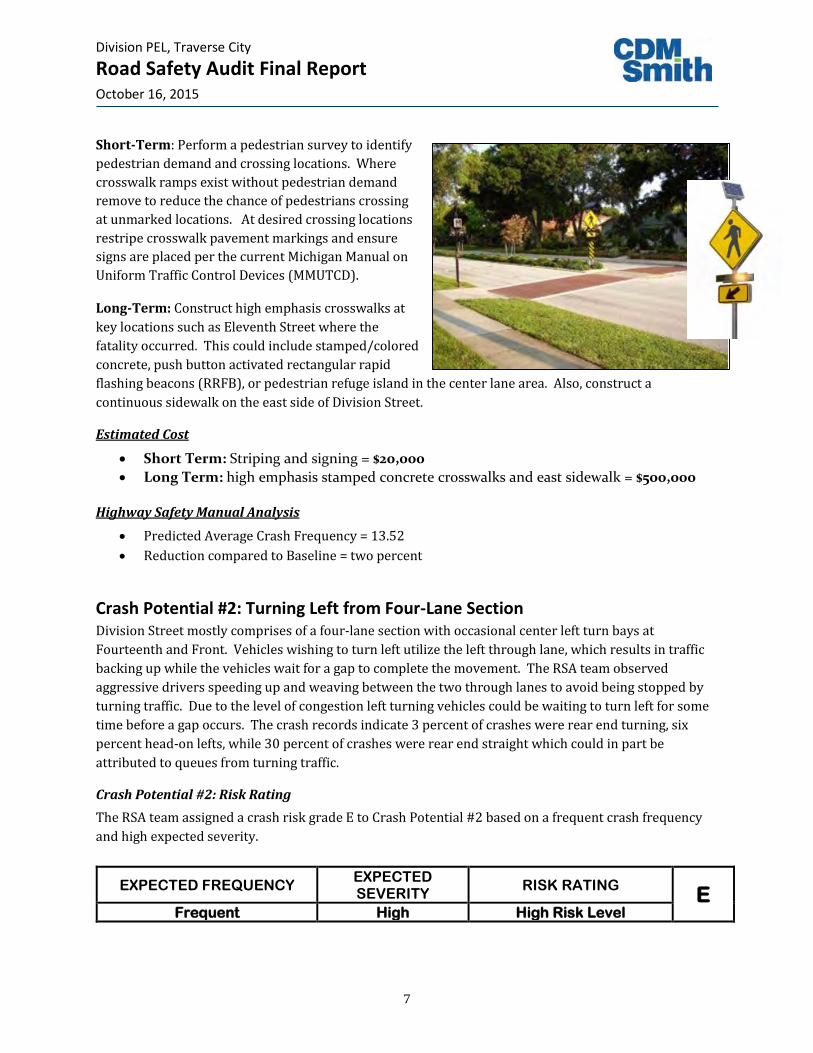
Short-Term: Perform a pedestrian survey to identify pedestrian demand and crossing locations. Where crosswalk ramps exist without pedestrian demand remove to reduce the chance of pedestrians crossing at unmarked locations. At desired crossing locations restripe crosswalk pavement markings and ensure signs are placed per the current Michigan Manual on Uniform Traffic Control Devices (MMUTCD).
Long-Term: Construct high emphasis crosswalks at key locations such as Eleventh Street where the fatality occurred. This could include stamped/colored concrete, push button activated rectangular rapid flashing beacons (RRFB), or pedestrian refuge island in the center lane area. Also, construct a continuous sidewalk on the east side of Division Street.
Estimated Cost
• Short Term: Striping and signing = $20,000 • Long Term: high emphasis stamped concrete crosswalks and east sidewalk = $500,000
Highway Safety Manual Analysis
• Predicted Average Crash Frequency = 13.52 • Reduction compared to Baseline = two percent
Crash Potential #2: Turning Left from Four-Lane Section Division Street mostly comprises of a four-lane section with occasional center left turn bays at Fourteenth and Front. Vehicles wishing to turn left utilize the left through lane, which results in traffic backing up while the vehicles wait for a gap to complete the movement. The RSA team observed aggressive drivers speeding up and weaving between the two through lanes to avoid being stopped by turning traffic. Due to the level of congestion left turning vehicles could be waiting to turn left for some time before a gap occurs. The crash records indicate 3 percent of crashes were rear end turning, six percent head-on lefts, while 30 percent of crashes were rear end straight which could in part be attributed to queues from turning traffic.
Crash Potential #2: Risk Rating The RSA team assigned a crash risk grade E to Crash Potential #2 based on a frequent crash frequency and high expected severity.
EXPECTED FREQUENCY EXPECTED SEVERITY RISK RATING E
Frequent High High Risk Level
7

Division PEL, Traverse City
Road Safety Audit Final Report October 16, 2015
Crash Potential #2: Suggestions Based on the number of crashes associated with turning left from the four-lane section the RSA team developed the following suggestions:
Short-Term: None applicable
Long-Term: Construct a center left turn lane throughout the corridor, and potentially a raised median where able and not in conflict with side streets. This will allow left turn traffic to exit the left most through lane, reducing rear end crashes. Also the turn lane should reduce head-on lefts as turning vehicles will take more time to assess appropriate gaps without the pressure of blocking the through lane.
Estimated Cost
• Short Term: Not Applicable • Long Term: Center left turn lane = $13.3 million
Highway Safety Manual Analysis
• Predicted Average Crash Frequency = 9.65 • Reduction compared to Baseline = 30 percent
Crash Potential #3: Grandview Parkway Intersection At Grandview Parkway the signalized T-intersection is in close proximity to Bay Street which is a major safety concern. Based on the RSA team’s observations there was heavy congestion for the NB lefts and WB lefts, and a lot of confusion from the driver and pedestrian perspective, due to vehicles making unexpected turns to and from Bay Street. Vehicles were observed turning in and out of West Bay Street which was especially difficult for EB left turners. While the intersection is signed “DO NOT BLOCK”, most of the time NB vehicles queued through the intersection. Crosswalks are present at the south and east legs of Grandview Parkway, and the west and east legs of Bay Street. The RSA team crossed at several locations and felt hurried due to the level of congestion. While crossing the west Bay Street leg a vehicle from WB Grandview turned quickly onto Bay Street before coming to a sudden stop. This could have resulted in a rear end crash or a pedestrian crash. Several pedestrians were observed running across the road presumably due to feeling uncomfortable. The pavement markings were worn especially for the SB movement on the south leg of Grandview. Of the 35 total crashes at Grandview 31 percent resulted in Type C (minor) injuries, which included one pedestrian crash. Forty-one percent of crashes were rear-end straight.
Crash Potential #3: Risk Rating The RSA team assigned a crash risk grade D to Crash Potential #3 based on an occasional crash frequency and a high severity outcome.
EXPECTED FREQUENCY EXPECTED SEVERITY RISK RATING D
Occasional High Significant Risk Level
8

Division PEL, Traverse City
Road Safety Audit Final Report October 16, 2015
Crash Potential #3: Suggestions Based on the heavy congestion, and general pedestrian discomfort, the RSA team developed the following suggestions:
Short Term: Restrict turning movements at Bay Street to at least right-in-right-out, and ideally on the west leg to right out only. This will eliminate many of the challenging movements and reduce the risk of crashes associated with Bay Street. Replace pavement markings and recess to improve durability. Evaluate lead pedestrian signal phasing to enhance safety by providing them with a 3 second head start across the road which increases pedestrian visibility.
Long Term: a) Add a second WB left and NB left turn lane to increase capacity, and effectively reduce congestion resulting in less aggressive driving and improved safety. Adding a NB left lane would require some ROW from the Southeast corner. b) Convert the signalized intersection to a roundabout, which would slow traffic, increase capacity, enhance pedestrian movements, and improve safety. This option would also include closing the Bay Street access to Division Street. Constructing a roundabout would require some ROW from the Southeast corner.
Estimated Cost
• Short Term: pavement marking, signal timing, and access control = $56,000 • Long Term: a) Additional lane capacity= $787,000
b) Roundabout = $2.3 million
Highway Safety Manual Analysis
• Predicted Average Crash Frequency = 2.86 • Reduction compared to Baseline = 37 percent
b) Roundabout a) Additional signal geometry
9

Division PEL, Traverse City
Road Safety Audit Final Report October 16, 2015
Crash Potential #4: Fourteenth Street Intersection At the Fourteenth Street signalized intersection the west leg is on a curve through the intersection, resulting in a large skew angle. The RSA team observed heavy congestion for the WB leg, and noted a split signal phasing with all WB movements followed by a permitted left phase. This resulted in a WB yellow trap which occurs when left turners go from a flashing yellow to a red light, while oncoming through traffic stays green. When approaching from the west the signal heads didn’t appear to be centered over the lanes. Based on the four-year crash data a total of 96 crashes were recorded, of which 21 percent resulted in type B (non-capacitating) or C (minor) injuries, with no fatalities or type A (incapacitation injury) crashes. Thirty-four percent occurred during rainy or snowy conditions. Thirty-five percent occurred within the intersection with the remainder on approaches, and 15 percent were head on-left. Only three crashes were associated with EB/WB head-on left turns. According to the City this is the least safe intersection in their roadway system.
Crash Potential #4: Risk Rating The RSA team assigned a crash risk grade C to Crash Potential #5 based on an occasional crash frequency and a moderate severity outcome.
Crash Potential #4: Suggestions Based on the skew of the intersection, non-conventional EB/WB signal timing, heavy WB congestion, and general higher number of general crashes, the RSA team developed the following suggestions:
Short-Term: Centering signal heads over lanes, and considering a conventional EB/WB signal phasing may help and should be considered.
Long-Term: Convert the signalized intersection to a roundabout, which would slow traffic, increase capacity, enhance pedestrian movements, and improve safety.
Estimated Cost
• Short Term: signal modifications = $10,000 • Long Term: roundabout= $2.6 million
Highway Safety Manual Analysis
• Predicted Average Crash Frequency = 4.66 • Reduction compared to Baseline = 48 percent
EXPECTED FREQUENCY EXPECTED SEVERITY RISK RATING C
Occasional Moderate Moderate Risk Level
10

Division PEL, Traverse City
Road Safety Audit Final Report October 16, 2015
Crash Potential #5: Eleventh Street Intersection At Eleventh Street the roadway is a four-lane, two-way stop controlled intersection. During the am peak hour there is a heavy NB left movement and during the pm peak hour there is a heavy EB left movement. The NB left traffic backs up along Division Street to the south and, according to Officer Maxon, stretches to Fourteenth Street on occasion. A total of 54 crashes occurred at Eleventh Street, with 46 percent head-on left or angle crashes, 30 percent rear end, and one (1) pedestrian fatality. The pedestrian fatality was previously discussed in Crash Potential #1. Based on the RSA teams observations 76 percent of crashes as listed above can be attributed to NB left traffic queueing in the through lane, either directly being involved in head-on or angle crashes, blocking visibility for other movements, or causing rear-ends.
Crash Potential #5: Risk Rating The RSA team assigned a crash risk grade C to Crash Potential #5 based on an occasional crash frequency and a moderate severity outcome.
Crash Potential #5: Suggestions Based on the number of crashes associate with NB left traffic the RSA team developed the following suggestions:
Short Term: None applicable
Long Term: Expand roadway to provide NB/SB center left turn lane, and signalize the intersection if warrants are met.
Estimated Cost
• Long Term: NB/SB center left turn lane and signal = $1.1 million
Highway Safety Manual Analysis
• Predicted Average Crash Frequency = 5.33 • Reduction compared to Baseline = 22 percent
EXPECTED FREQUENCY EXPECTED SEVERITY RISK RATING C
Occasional Moderate Moderate Risk Level
11

Division PEL, Traverse City
Road Safety Audit Final Report October 16, 2015
Crash Potential #6: Front Street Intersection The Front Street intersection was very congested during each RSA site visit, with SB through traffic backing up to Bay Street, turn lanes were very backed up, and frequent pedestrian movements. At all quadrants the turning radius was tight, and at the NW and SW quadrants there was evidence of truck paths across the sidewalk. The adjacent picture shows a truck trailer tracking across the crosswalk landing area in the NW quadrant. Finally, the west sidewalk north of Front Street was uneven and would be challenging for wheel chair users. A total of 54 crashes were recorded over the four-year data period, with 28 percent angle, 43 percent rear ends, and 15 percent night crashes.
Crash Potential #6: Risk Rating The RSA team assigned a crash risk grade C to Crash Potential #6 based on a rare crash frequency and an extreme severity outcome.
Crash Potential #6: Suggestions Based on the perceived crash risk associated with truck trailer paths at Front Street the RSA team developed the following suggestions:
Short Term: None applicable
Long Term: Front Street is heavily congested and fully developed on all four quadrants, with no available space for additional capacity without very high ROW costs. To alleviate some congestion on Division Street, extend center left turn lanes and optimize signal timings to enhance corridor progression. Enhance pedestrian safety by increasing the curb radius to allow for trucks to turn, and provide ADA compliant sidewalk at NW quadrant.
Estimated Cost Long Term: Center left turn lane, and pedestrian improvements = $137,000
Highway Safety Manual Analysis
• Predicted Average Crash Frequency = 7.94 • Reduction compared to Baseline = five percent
EXPECTED FREQUENCY EXPECTED SEVERITY RISK RATING C
Rare Extreme Moderate Risk Level
12

Division PEL, Traverse City
Road Safety Audit Final Report October 16, 2015
Crash Potential #7: Seventh/ Eighth Street Intersection Seventh Street has a one-way WB only east leg which two-directional for the west leg. WB traffic approaches the intersection in two-lanes with the left lane designated as through only, and the right lane as right only. The WB through lane shifts 12 ft. to the right through the intersection tying into the curbside lane. The RSA team observed several drivers using the WB right lane to go straight, and confusion for permitted EB left traffic waiting to turn left potentially in front of WB straight traffic. The SE quadrant includes an extra sidewalk ramp not tying to the crosswalk which could be confusing for blind pedestrians. Lastly, the RSA team observed a heavy weave movement from EB Seventh Street to EB Eighth Street due to the one-way configuration, which adds approximately 100 vehicles an hour to Division Street between Seventh and Eighth Street. The crash records indicate 19 crashes at Seventh Street, and 19 crashes at Eighth Street during the four-year period. At Seventh Street there were 63 percent rear ends, however not related to the perceived risk identified by the RSA team. At Eighth Street the majority of crashes were related to SB left traffic at Eighth, with either angle or rear-end crashes.
Crash Potential #7: Risk Rating The RSA team assigned a crash risk grade C to Crash Potential #7 based on an occasional crash frequency and a moderate severity outcome.
Crash Potential #7: Suggestions Based on the confusing intersection layout at Seventh Street and the weave movement to Eighth Street the RSA team developed the following suggestions:
Short-Term: Refresh pavement marking at Seventh Street and provide guide tracks to define the WB through movement. Remove additional crosswalk ramp.
EXPECTED FREQUENCY EXPECTED SEVERITY RISK RATING C
Occasional Moderate Moderate Risk Level
Short Term
13

Division PEL, Traverse City
Road Safety Audit Final Report October 16, 2015
Long-Term: Convert Seventh Street to two-directional traffic on the east leg to alleviate the high volume weave movement to Eighth Street. This will allow EB traffic to access Eighth via local streets and will allow EB bike traffic to directly access the Maple bike route. This alternative would also provide a centered left turn lane for EB/WB lefts. The image below shows the NB/SB Division center left turn lane which was previously accounted for in crash mitigation #2.
Estimated Cost
• Short Term: pavement markings = $10,000 • Long Term: convert Seventh to two-way street
$500,000
Highway Safety Manual Analysis
• Predicted Average Crash Frequency = 7.8 • Reduction compared to Baseline = six percent
Crash Potential #8: Sight Distance at Fifth and Ninth Streets The RSA team experienced difficulty turning WB left from Fifth Street due to the residential wall along the ROW line, as well as a utility pole close to the back of curb. At Ninth Street, the intersection light was partially obscured from sight when travelling in the SB direction by overhanging trees. Based on the four-year crash data, five occurred at Fifth Street, two at Ninth Street, and a total of 11 fixed object crashes throughout the corridor, and not necessarily attributed to the sight distance issues. Safety risk was slightly perceived by the RSA team but not necessarily supported by the four-year crash data.
Crash Potential #8: Risk Rating The RSA team assigned a crash risk grade B to Crash Potential #8 based on an infrequent crash frequency and a moderate severity outcome.
EXPECTED FREQUENCY EXPECTED SEVERITY RISK RATING B
Infrequent Moderate Low Risk Level
Long Term
14
Division PEL, Traverse City
Road Safety Audit Final Report October 16, 2015
Crash Potential #8: Suggestions Based on the perceived crash risk crash risk associated with sight distance at Fifth and Ninth Streets the RSA team developed the following suggestions:
Short-Term: Trim trees blocking street light visibility.
Long-Term: The RSA team originally made suggestions to relocate the wall at Fifth Street, and place utility lines underground, eliminating some fixed object hazards, however after further review of the available crash data these improvements are costly and not necessary. However, placing utilities below ground is desirable for long term safety and service reliability.
No Cost estimate or HSM analysis was completed for this alternative as they was not a crash history to support the changes. In addition, no Crash Modification Factors were available there.
Highway Safety Manual Analysis – Recommended Alternative The combined Crash Modification Factor (CMF) for the recommended alternative is 0.75.
• Composite Average Crash Frequency = 38.24 • MP 1.338 to MP 2.674 Average Crash Rate = 5.32 • Reduction compared to Baseline = 25 percent
Time of Return – Ultimate Recommendation Time of Return is a measure to evaluate the benefit of a project and how much time is needed to see a pay-off of the cost. MDOT spreadsheet titled “Non-Trunkline TOR 2015” worksheet was used for this evaluation for PR 992703 for the preferred alternative. The TOR evaluated the crashes associated with Fourteenth Street, Grandview Parkway, corridor between Fourteenth Street and Seventh Street, and pedestrian crashes. The TOR analysis resulted in a period of 24.73 years based on the most current four years of data available and a cost estimate of $15,787,000. Calculations and spreadsheets are provided in Appendix B.
Conclusion This Road Safety Audit was prepared to assist the Project Team in prioritizing and implementing safety enhancements within the Division Street corridor project limits. This RSA is based on observations made on June 1-2, 2015 and the information available to the RSA team at the time of the RSA. This report does not preclude the identification of additional safety issues by the Project Team. It is recommended that the Project Team Manager review this report, and document their responses to the issues and recommendations in a response letter.
15

Division PEL, Traverse City
Road Safety Audit Final Report October 16, 2015
APPENDIX A-1: Sign-in Sheet


Division PEL, Traverse City
Road Safety Audit Final Report October 16, 2015
APPENDIX A-2: Safety Issue Risk Assessment Matrix

Estimated Frequency Rating
Estimated Expected Crash Frequency
(per audit item)
Frequency
RatingExposure Probability
High High10 or more crashes per year Frequent
Medium High
High Medium
1 to 9 crashes per year OccasionalMedium Medium
Low High
High Low Less than 1 crash per year, but more than 1 crash
every 5 yearsInfrequent
Low Medium
Medium LowLess than 1 crash per 5 years Rare
Low Low

Estimated Severity Rating
Typical Crashes Expected
(per Audit Item)
Expected Crash
SeveritySeverity Rating
High-speed crashes, especially with pedestrians
or cyclists
Probable fatality or
incapacitating injuryExtreme
Moderate-speed crashes, especially head-on,
crossing, or off-road crashes or crashes involving
pedestrians and cyclists
Moderate to severe injury High
Crashes involving medium to low speeds; left-
turn and right-turn crashesMinor to moderate injury Moderate
Crashes involving low to medium speeds; rear-
end or sideswipe crashes
Property damage only or
minor injuryLow

Estimated Crash Risk Assessment
Frequency Rating
Severity Rating
Low Moderate High Extreme
Frequent C D E F
Occasional B C D E
Infrequent A B C D
Rare A A B C
Crash risk Ratings: A: Minimal Risk Level D: Significant Risk Level
B: Low Risk Level E: High Risk Level
C: Moderate Risk Level F: Extreme Risk Level

Division PEL, Traverse City
Road Safety Audit Final Report October 16, 2015
APPENDIX B: Calculations and Spreadsheets

Date:
Agency:
Analyst:
Description:
Npredicted (TOTAL) Npredicted (FI) Npredicted (PDO) Npredicted (ped)
Rural
2-Lane-- -- -- --
Rural
Multilane-- -- -- --
Urban/
Suburban118.579 39.002 79.576 0.635
Total 118.579 39.002 79.576 0.635
Nexpected (TOTAL) Nexpected (FI) Nexpected (PDO)
Rural
2-Lane-- -- --
Rural
Multilane-- -- --
Urban/
Suburban278.0 93.3 184.8
Total 278.0 93.3 184.8
Rank
1.
2.
3.
4.
5.
6.
7.
8.
9.
10.
Rank
1.
2.
3.
4.
5.
6.
7.
8.
9.
10.
Rank
1.
2.
3.
4.
5.
6.
7.
8.
9.
10.
Rank
1.
2.
3.
4.
5.
6.
7.
8.
9.
10.
(INT) M-37 @ 11th Traverse City Control = 4ST Major AADT: 25,200 / Minor AADT: 4,150 11.76
(INT) M-37 @ 11th Traverse City Control = 4ST Major AADT: 25,200 / Minor AADT: 4,150 10.81
(INT) M-37 @ Front Traverse City Control = 4SG Major AADT: 25,200 / Minor AADT: 12,700 12.10
(INT) M-37 @ Front Traverse City Control = 4SG Major AADT: 25,200 / Minor AADT: 12,700 11.93
(INT) M-37 @ 14th Traverse City Control = 4SG Major AADT: 25,800 / Minor AADT: 15,750 18.84
(INT) M-37 @ 14th Traverse City Control = 4SG Major AADT: 25,800 / Minor AADT: 15,750 15.94
(SEG) M-37, 14th to Grandview (Ex) Traverse City Type = 4U, Length = 1.2 mi AADT: 25,800 44.29
(INT) M-37 @ 14th Traverse City Control = 4SG Major AADT: 25,800 / Minor AADT: 15,750 19.62
Highest Expected Average Crashes Excess
(SEG) M-37, 14th to Grandview (Ex) Traverse City Type = 4U, Length = 1.2 mi AADT: 25,800 47.09
(SEG) M-37, 14th to Grandview (Ex) Traverse City Type = 4U, Length = 1.2 mi AADT: 25,800 46.95
Nexpected (bike)
--
--
0.6
Nexpected (ped)
0.6
--
--
275.3
275.3
Nexpected (vehicle)
(INT) M-37 @ Front Traverse City Control = 4SG Major AADT: 25,200 / Minor AADT: 12,700 2.96
(INT) M-37 @ 7th Traverse City Control = 4SG Major AADT: 25,200 / Minor AADT: 5,300
(SEG) M-37, 14th to Grandview (Ex) Traverse City Type = 4U, Length = 1.2 mi AADT: 25,800 4.23
(INT) M-37 @ 14th
2.92
(SEG) M-37, 14th to Grandview (Ex) Traverse City Type = 4U, Length = 1.2 mi AADT: 25,800 3.02
(INT) M-37 @ 11th Traverse City Control = 4ST Major AADT: 25,200 / Minor AADT: 4,150 2.98
(INT) M-37 @ 7th Traverse City Control = 4SG Major AADT: 25,200 / Minor AADT: 5,300 7.88
Highest Predicted Total Crashes Predicted
(INT) M-37 @ Front Traverse City Control = 4SG Major AADT: 25,200 / Minor AADT: 12,700 7.94
(INT) M-37 @ Front Traverse City Control = 4SG Major AADT: 25,200 / Minor AADT: 12,700 8.36
(INT) M-37 @ 7th Traverse City Control = 4SG Major AADT: 25,200 / Minor AADT: 5,300 8.29
(SEG) M-37, 14th to Grandview (Ex) Traverse City Type = 4U, Length = 1.2 mi AADT: 25,800 9.66
(INT) M-37 @ 11th Traverse City Control = 4ST Major AADT: 25,200 / Minor AADT: 4,150 2.24
(INT) M-37 @ Front Traverse City Control = 4SG Major AADT: 25,200 / Minor AADT: 12,700 2.82
(INT) M-37 @ 7th Traverse City Control = 4SG Major AADT: 25,200 / Minor AADT: 5,300 2.77
(INT) M-37 @ 7th Traverse City Control = 4SG Major AADT: 25,200 / Minor AADT: 5,300 2.74
Traverse City Control = 4SG Major AADT: 25,800 / Minor AADT: 15,750 3.12
Highest Predicted Fatal & Injury Crashes Predicted
(SEG) M-37, 14th to Grandview (Ex) Traverse City Type = 4U, Length = 1.2 mi AADT: 25,800 4.32
(INT) M-37 @ 7th Traverse City Control = 4SG Major AADT: 25,200 / Minor AADT: 5,300 7.80
(INT) M-37 @ 14th Traverse City Control = 4SG Major AADT: 25,800 / Minor AADT: 15,750 7.69
(INT) M-37 @ 14th Traverse City Control = 4SG Major AADT: 25,800 / Minor AADT: 15,750 8.93
(SEG) M-37, 14th to Grandview (Ex) Traverse City Type = 4U, Length = 1.2 mi AADT: 25,800 13.80
(SEG) M-37, 14th to Grandview (Ex) Traverse City Type = 4U, Length = 1.2 mi AADT: 25,800 13.52
MSH
CDM Smith
2.091
--
158
September 1, 2016 Control Section(s):
PR Number(s):
Job Number(s):
28012
992703
N/A
Empirical Bayes Analysis (Site-Specific)
Expected Crashes
(crashes/year)
322
138.6 139.4
138.6 139.4
-- --
Observed Crashes
(crashes/year)
Nobserved (intersection)Nobserved (segment)Nobserved (TOTAL)Npredicted (bike)
2.091 322 158 165
165
Nexpected (segment) Nexpected (intersection)
--
--
2.1
2.1
Traverse City
(INT) M-37 @ 14th
(INT) M-37 @ 11th
(INT) M-37 @ Grandview
(INT) M-37 @ Grandview
Highest Excess Expected Crashes
8.21
5.41
4.41
3.63
3.19
3.08
2.26
Traverse City
Traverse City
Excess
7.31
5.55
Major AADT: 21,200 / Minor AADT: 15,750
Major AADT: 21,200 / Minor AADT: 15,750
Control = 3SG
Control = 3SG
Major AADT: 25,200 / Minor AADT: 4,150Control = 4ST
(SEG) M-37, 14th to Grandview (Ex)
AADT: 25,800
Major AADT: 25,800 / Minor AADT: 15,750
Division PEL
--
M-37 Division Corridor PEL
Predicted average crash frequency
(crashes/year)
-- -- -- --
-- -- -- --
AADT: 25,800
AADT: 25,800
Major AADT: 25,800 / Minor AADT: 15,750
Major AADT: 25,800 / Minor AADT: 15,750
Type = 4U, Length = 1.2 mi
Control = 4SG
Type = 4U, Length = 1.2 mi
Type = 4U, Length = 1.2 mi
Control = 4SG
Control = 4SG
Traverse City
Traverse City
Traverse City
Traverse City
Traverse City
Traverse City
(SEG) M-37, 14th to Grandview (Ex)
(INT) M-37 @ 14th
(SEG) M-37, 14th to Grandview (Ex)
(INT) M-37 @ 14th
HSM Analysis (2005-2010).20150302_Division.xlsm - Outputs 9/6/2015 - 4:38 PM

TOR 2015 (Local Agency) Date: 6-Sep-15
Proj: M-37 Division City/Twp.: Traverse City
Prepared by: MSH County: Grand Traverse
PR Number: 992703 PR MP: 13.806 to 15.002
2012 NSC VALUES:
Death $1,410,000 =FATCOST
Disabling (A) injury: $72,700 =ACOST
B-Injury $23,400 =BCOST
PDO and/or Minor Injury Crash: $8,900 =PDOCCST
BTOTAL = ADTa/ADTbx(QxR1+(BCOSTxR2)+(PDOCCSTxR3))
WHERE:
BTOTAL= Total Benefit in Dollars Over Years Used 2493530
ADTa = Average traffic volume after the improvement 15,650.0
ADTb = Average traffic volume before the improvement 15,650.0
R1 = Reduction in fatalities and A-Injuries Combined. 5.0
R2 = Reduction in B-injury crashes: 5.0
R3 = Reduction in PDO and C-injury crashes 128.0
Q = [FATCOST+((I/F)xACOST)]/[1+(I/F)]
= [1,210,000+(6.64 x 62,500)] / [1+6.64] 247,700.0
for AREA TYPE ERR
I/F = 6.64
Q-Reference Q A-Inuries Fatalities I/F
RURAL 278900 7121 1298 5.486133
URBAN 224400 9964 1275 7.814902
BETWEEN 247700 17085 2573 6.640109
Data from Safety Programs Unit, E. Line
5-Year, Statewide, Non-Trunkline crash figures.
(From 1-1-09 through 12-31-13) used.
Time of Return (T.O.R.) is based on .... 5.0 years of data.
NOINFB =No-Inflation Annual Benefit=BTOTAL/years 498706
------
With an inflation rate of .......... 2.50%
B=Annual Benefit=Present Value (with Inflation) $638,386
C = Project Cost $15,787,000
TOR=C/B=COST/ANNUAL BENEFIT= 24.73
COMPUTED BENEFITS DERIVED THROUGH CRASH REDUCTION
The method of evaluating crash costs, used below, is given on page 67 of Roy Jorgensen's report of
Highway Safety Improvement Criteria 1966 edition. This same method is given in the Bureau of
Public Roads IM21-3-67. In 1994 we have adapted the Q formula to blend Fatalities and A-injuries
only. In the following analysis the costs provided by the National Safety Council (NSC) are:

YEAR 1 YEAR 2 YEAR 3 YEAR 4 YEAR 5
2011 2012 2013 2014 0- - - - - - -
60% %REDUCTION
33 33 33 33 0
25 25 25 25 0
1 1 1 0 0
0 0 0 0 0
- - - - - - -
80% %REDUCTION
26 26 26 26 0
21 21 21 21 0
2 2 2 0 0
1 0 1 0 0
- - - - - - -
85% %REDUCTION
1 1 1 1 0
0 0 0 0 0
0 0 0 0 0
1 1 1 1 0
- - - - - - -
0% %REDUCTION
0 0 0 0 0
0 0 0 0 0
0 0 0 0 0
0 0 0 0 0
- - - - - - -
0% %REDUCTION
0 0 0 0 0
0 0 0 0 0
0 0 0 0 0
0 0 0 0 0
- - - - - - -
1 # A-Injuries: 3 For reference only
1 # Fatalilties: 0 For reference only; "Q" accounts
2 for the risk of a fatality.
PROJECT COST ESTIMATE : $15,787,000 If unknown, enter "0" (zero).
#REF! ADTb (before-volume) 15,650.0 You may change these
ADTa (after-volume) 15,650.0 default ADT values.
NUMBER OF YEARS OF DATA: 5.00 3 to 5 years should be used.
RATE OF INFLATION: 2.50%
AREA TYPE: 3 (1 = RURAL,2 = URBAN,3 = BETWEEN)
REMARKS:
B-Injured Persons
A-Injured or Killed Persons
0
Number of Crashes
PDO+C Injury Crashes
0
Number of Crashes
PDO+C Injury Crashes
Number of Crashes
PDO+C Injury Crashes
B-Injured Persons
A-Injured or Killed Persons
B-Injured Persons
A-Injured or Killed Persons
B-Injured Persons
A-Injured or Killed Persons
Pedestrian Enahancements
Center left turn lane
Number of Crashes
PDO+C Injury Crashes
Number of Crashes
PDO+C Injury Crashes
B-Injured Persons
A-Injured or Killed Persons
NUMBER OF CRASHES OR INJURED PERSONS.
Roundabout
0 M-37 Division
Tranverse City
992703
13.806 to 15.002
Center Left-turn Lane and Roundabout

Frequency
Baseline (No build)
Seg 1 14th to Grandview 13.8
Int 1 14th 8.93
Int 2 11th 6.83
Int 3 7th 8.29
Int 4 Front 8.36
Int 5 Grandview 4.57
Subtotal 46.21
Baseline (with Recom #1)
Seg 1(mod1) 14th to Grandview 13.52
Subtotal 13.52
Reduction % 2%
Baseline (with Recom #2)
Seg 1(mod1) 14th to Grandview 9.65
Subtotal 9.65
Reduction % 30%
Baseline (with Recom #4 ST)
Int 1 (mod1) 14th 7.69
Subtotal 7.69
Reduction % 57%
Baseline (with Recom 4 LT)
Int 1 (mod2) 14th 4.66
Subtotal 4.66
Reduction % 48%
Baseline (with Recom #5)
Int 2 11th 5.33
Subtotal 5.33
Reduction % 22%
Baseline (with Recom #7)
Int 3 7th 7.8
Subtotal 7.8
Reduction % 6%
Baseline (with Recom #6)
Int 4 Front 7.94
Subtotal 7.94
Reduction % 5%
Baseline (with Recom #7)
Int 5 Grandview 3.67
Subtotal 3.67
Reduction % 20%
Baseline (with Recom #3)
Int 5 Grandview 2.86
Subtotal 2.86
Reduction % 37%
Baseline (Recommendation)
Seg 1 14th to Grandview 9.65
Int 1 14th 4.66
Int 2 11th 5.33
Int 3 7th 7.8
Int 4 Front 7.94
Int 5 Grandview 2.86
Subtotal 38.24
Reduction % 25%
Predicted Crash Frequency

Division PEL, Traverse City
Road Safety Audit Final Report October 16, 2015
APPENDIX C: Crash Summary Report
See Appendix I


