Page 1
Appendix J: VdM WiFi Network Planning J1
Appendix J: VdM WiFi Network Planning
Contents Abstract ......................................................................................................................................................... 2
1. Wireless Deployment for Smart City Video Surveillance Network ....................................................... 3
2. Simulation Organization ........................................................................................................................ 4
2.1 Scenarios ............................................................................................................................................. 4
2.2 System Parameters and Assumptions ................................................................................................ 6
3. Simulation Results and Discussion ...................................................................................................... 11
3.1 Scenario 1: High-density 802.11n-based deployment ...................................................................... 11
3.2 Scenario 2: High-density 802.11ac-based deployment .................................................................... 12
3.3 Scenario 3: Low-density 802.11ac-based deployment ..................................................................... 14
3.4 Scale-up estimation........................................................................................................................... 15
4. Concluding Remarks ............................................................................................................................ 16
References .................................................................................................................................................. 17
Page 2
Appendix J: VdM WiFi Network Planning J2
Abstract In this Appendix, we investigate the scalability of Smart City IoT infrastructure and demonstrate the issues
expected when expanding deployment to city-wide scale. Specifically, we focus on the number of cameras
and access points, and bandwidth requirements for supporting a Smart City wireless video surveillance
network using 802.11n and 802.11acbased technologies. We apply various common camera and gateway
deployment patterns to demonstrate possible variations in Smart City deployment constraints and
estimate the number of devices and resources required in 3 different scenarios. The deployments are
simulated using Atoll network planning software based on installation parameters and equipment models
obtained from our practical small-scale deployment in the MSCPS.
Page 3
Appendix J: VdM WiFi Network Planning J3
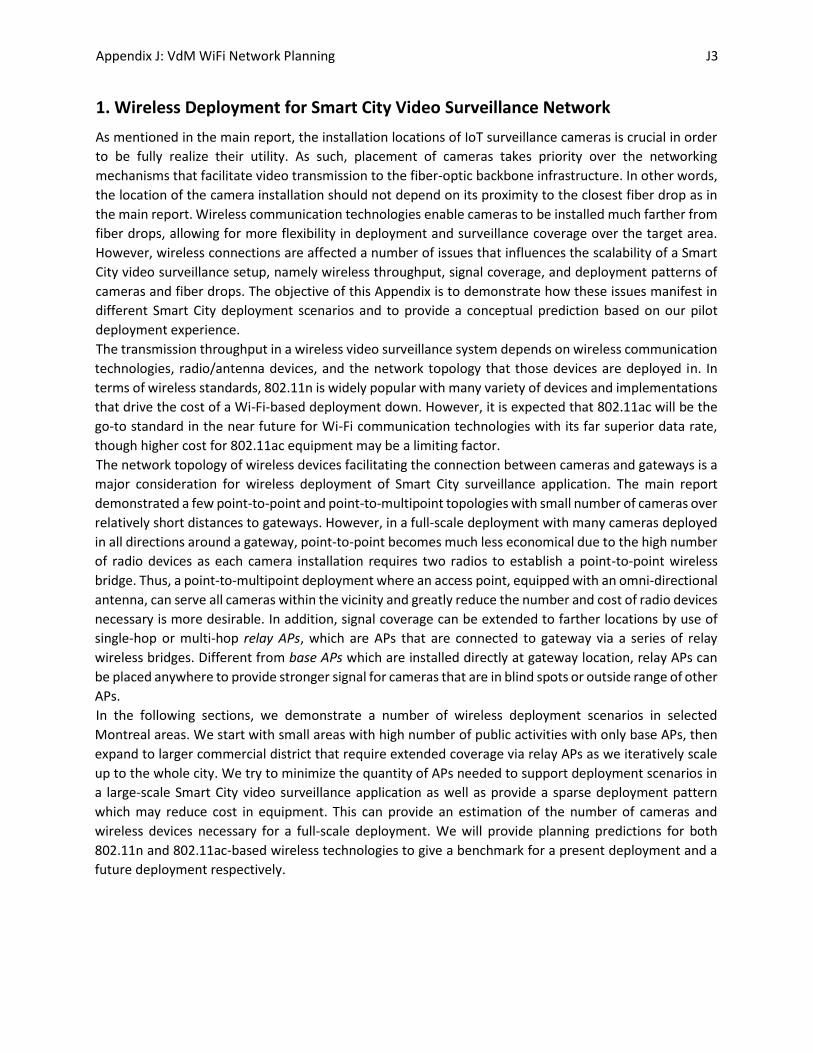
1. Wireless Deployment for Smart City Video Surveillance Network
As mentioned in the main report, the installation locations of IoT surveillance cameras is crucial in order
to be fully realize their utility. As such, placement of cameras takes priority over the networking
mechanisms that facilitate video transmission to the fiber-optic backbone infrastructure. In other words,
the location of the camera installation should not depend on its proximity to the closest fiber drop as in
the main report. Wireless communication technologies enable cameras to be installed much farther from
fiber drops, allowing for more flexibility in deployment and surveillance coverage over the target area.
However, wireless connections are affected a number of issues that influences the scalability of a Smart
City video surveillance setup, namely wireless throughput, signal coverage, and deployment patterns of
cameras and fiber drops. The objective of this Appendix is to demonstrate how these issues manifest in
different Smart City deployment scenarios and to provide a conceptual prediction based on our pilot
deployment experience.
The transmission throughput in a wireless video surveillance system depends on wireless communication
technologies, radio/antenna devices, and the network topology that those devices are deployed in. In
terms of wireless standards, 802.11n is widely popular with many variety of devices and implementations
that drive the cost of a Wi-Fi-based deployment down. However, it is expected that 802.11ac will be the
go-to standard in the near future for Wi-Fi communication technologies with its far superior data rate,
though higher cost for 802.11ac equipment may be a limiting factor.
The network topology of wireless devices facilitating the connection between cameras and gateways is a
major consideration for wireless deployment of Smart City surveillance application. The main report
demonstrated a few point-to-point and point-to-multipoint topologies with small number of cameras over
relatively short distances to gateways. However, in a full-scale deployment with many cameras deployed
in all directions around a gateway, point-to-point becomes much less economical due to the high number
of radio devices as each camera installation requires two radios to establish a point-to-point wireless
bridge. Thus, a point-to-multipoint deployment where an access point, equipped with an omni-directional
antenna, can serve all cameras within the vicinity and greatly reduce the number and cost of radio devices
necessary is more desirable. In addition, signal coverage can be extended to farther locations by use of
single-hop or multi-hop relay APs, which are APs that are connected to gateway via a series of relay
wireless bridges. Different from base APs which are installed directly at gateway location, relay APs can
be placed anywhere to provide stronger signal for cameras that are in blind spots or outside range of other
APs.
In the following sections, we demonstrate a number of wireless deployment scenarios in selected
Montreal areas. We start with small areas with high number of public activities with only base APs, then
expand to larger commercial district that require extended coverage via relay APs as we iteratively scale
up to the whole city. We try to minimize the quantity of APs needed to support deployment scenarios in
a large-scale Smart City video surveillance application as well as provide a sparse deployment pattern
which may reduce cost in equipment. This can provide an estimation of the number of cameras and
wireless devices necessary for a full-scale deployment. We will provide planning predictions for both
802.11n and 802.11ac-based wireless technologies to give a benchmark for a present deployment and a
future deployment respectively.
Page 4
Appendix J: VdM WiFi Network Planning J4
2. Simulation Organization
2.1 Scenarios There are many deployment scenarios when considering a wireless video surveillance application for a
designated area, depending on numerous factors: the type of application and data to be monitored,
camera deployment patterns, location of gateways, wireless technologies, etc. In this section, we focus
on intersection monitoring where cameras are placed at numerous intersections and junctions in a target
area to record their vehicular and pedestrian traffic activities. The two main camera deployment patterns
that we want to investigate are high-density deployment and low-density pattern. In a high-density
deployment pattern, a camera is installed at almost every intersection in the target area to provide near
complete surveillance coverage of ongoing traffic, excluding some small crossroads where traffic activities
are too infrequent to justify the cost. If two intersections are close enough to each other that one camera
can reasonably monitor both, then a second camera does not have to be installed. In a low-density
deployment pattern, only intersections with traffic light are monitored by cameras, reducing cost of
installation and maintenance while still providing surveillance at major locations in the target area.
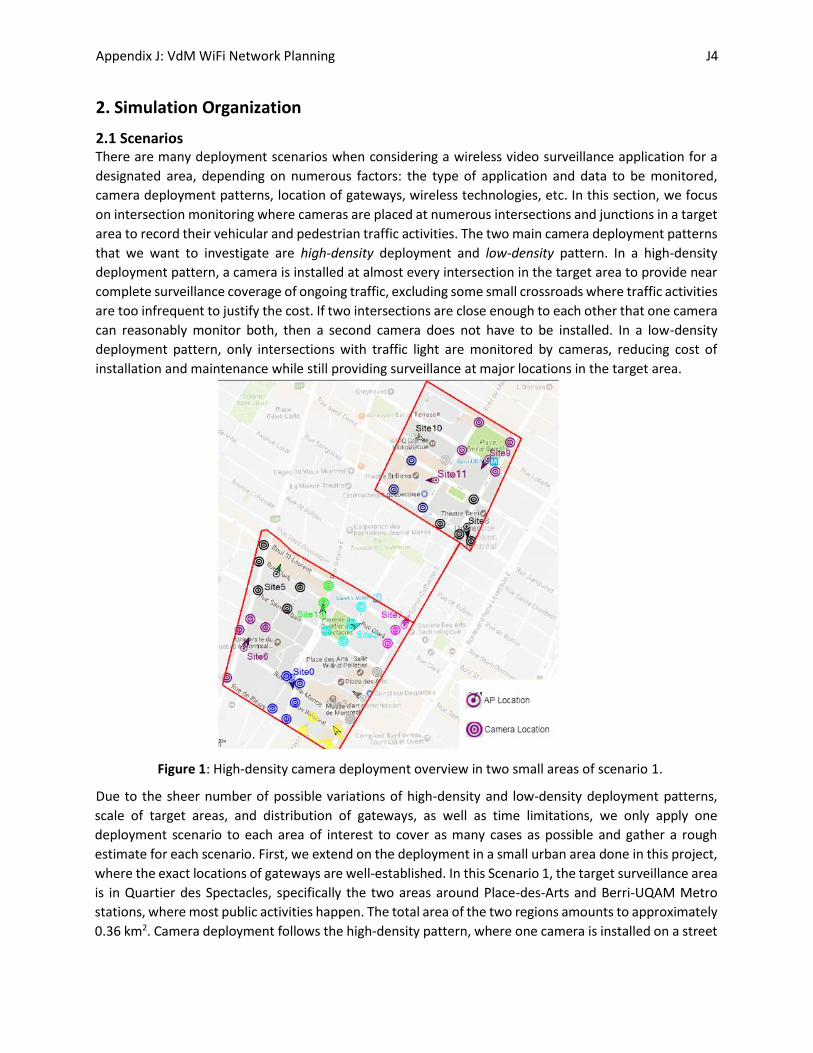
Figure 1: High-density camera deployment overview in two small areas of scenario 1.
Due to the sheer number of possible variations of high-density and low-density deployment patterns,
scale of target areas, and distribution of gateways, as well as time limitations, we only apply one
deployment scenario to each area of interest to cover as many cases as possible and gather a rough
estimate for each scenario. First, we extend on the deployment in a small urban area done in this project,
where the exact locations of gateways are well-established. In this Scenario 1, the target surveillance area
is in Quartier des Spectacles, specifically the two areas around Place-des-Arts and Berri-UQAM Metro
stations, where most public activities happen. The total area of the two regions amounts to approximately
0.36 km2. Camera deployment follows the high-density pattern, where one camera is installed on a street
Page 5
Appendix J: VdM WiFi Network Planning J5
light pole at every intersection, excluding small alleys and intersections already in field of vision of other
cameras. Figure 1 gives an overview of the target area and the expected locations of the cameras. The
wireless base APs are installed at the known gateway locations and are connected directly to the optical
fiber network. With the small target area and the low number of cameras, wireless coverage is sufficiently
provided by base APs at gateway locations that relay APs are not necessary. 802.11n-based wireless radios
and APs are used to establish wireless network coverage in this scenario.
Next, we broaden the scope to the slightly larger commercial district area surrounding Quartier des
Spectacles with a similar urban planning attributes (e.g., building types, traffic intersection density, etc.)
to maintain the correlation with the previous scenario. In fact, the target area is the two larger
surrounding regions that encompass the two areas around Place-des-Arts and Berri-UQAM Metro
stations, respectively. As the gateway locations are not known for these larger areas, we assume that fiber
drops are located along a major road through the target area. We consider two scenarios for the
distribution pattern of gateway locations: Scenario 2 in which gateways are placed along a road near the
edge of the target surveillance area, and Scenario 3 in which gateways are placed along a road going
through the center of the target surveillance area. For Scenario 2, the gateways are located on Rue
Amherst at the edge of the area, where most cameras are deployed toward one side of the road. In the
other Scenario 3, the gateways are located on Rue de Bleury, with cameras distributed more evenly on
both sides of the road. In both scenarios, while base APs are still installed directly at the gateway locations,
single-hop relay APs are also used to extend coverage range to distant cameras in order to provide
sufficient throughput. Each relay AP is connected to a gateway via a wireless bridge independent of the
wireless network provided by the base APs installed at the corresponding gateway location.
Figure 2: High-density camera deployment overview in scenario 2.
Figure 2 shows the overview of camera deployment pattern in Scenario 2 in the northeastern 1.6 km2 half
of the commercial district. Cameras are distributed following the high-density pattern, where a camera is
installed at almost every intersection. In this scenario, base APs are installed at assumed gateway locations
Page 6
Appendix J: VdM WiFi Network Planning J6
every 200 m along Rue Amherst near the northern edge of the target area. Thus, most cameras
installations are located toward south of the base APs, so relay APs have to be distributed in regions that
are out of range to provide coverage to all cameras. They are linked to base APs via point-to-point wireless
bridges in the same manner described in the main report. The wireless network is setup using 802.11ac-
based wireless radios and APs to contrast with the 802.11n deployment in scenario 1.
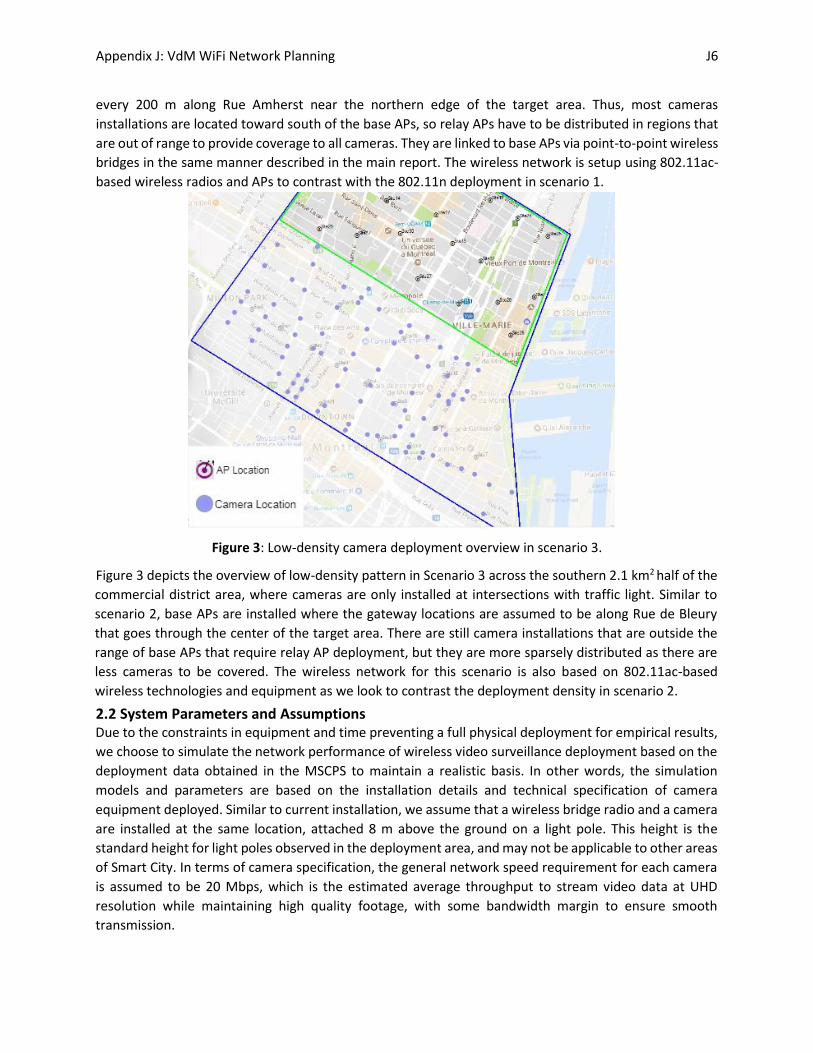
Figure 3: Low-density camera deployment overview in scenario 3.
Figure 3 depicts the overview of low-density pattern in Scenario 3 across the southern 2.1 km2 half of the
commercial district area, where cameras are only installed at intersections with traffic light. Similar to
scenario 2, base APs are installed where the gateway locations are assumed to be along Rue de Bleury
that goes through the center of the target area. There are still camera installations that are outside the
range of base APs that require relay AP deployment, but they are more sparsely distributed as there are
less cameras to be covered. The wireless network for this scenario is also based on 802.11ac-based
wireless technologies and equipment as we look to contrast the deployment density in scenario 2.
2.2 System Parameters and Assumptions Due to the constraints in equipment and time preventing a full physical deployment for empirical results,
we choose to simulate the network performance of wireless video surveillance deployment based on the
deployment data obtained in the MSCPS to maintain a realistic basis. In other words, the simulation
models and parameters are based on the installation details and technical specification of camera
equipment deployed. Similar to current installation, we assume that a wireless bridge radio and a camera
are installed at the same location, attached 8 m above the ground on a light pole. This height is the
standard height for light poles observed in the deployment area, and may not be applicable to other areas
of Smart City. In terms of camera specification, the general network speed requirement for each camera
is assumed to be 20 Mbps, which is the estimated average throughput to stream video data at UHD
resolution while maintaining high quality footage, with some bandwidth margin to ensure smooth
transmission.
Page 7
Appendix J: VdM WiFi Network Planning J7
Hardware and wireless protocol parameters
The hardware and wireless protocol parameters are based on the Ubiquiti Network’s proprietary airMAX
wireless technology and equipment, supported by device models in the directional wireless bridge radio
NanoBeam and wireless access point Rocket series. Unlike standard Wi-Fi protocol, Ubiquiti’s airMAX
TDMA-based (Time-division Multiple Access) protocol allows each active station to send and receive data
using pre-designated time slots scheduled by an intelligent associated AP, essentially eliminating the
hidden node collisions typically encountered in large-scale Wi-Fi networks [1]. The AP also keeps track of
airtime usage of each station to determine which stations are active, then reassigns available time slots
so that airtime efficiency is maximized [1]. Thus, airMAX provides significant performance improvement
in latency, throughput, and scalability in comparison to CSMA (Carrier Sense Multiple Access) protocol
employed by traditional Wi-Fi standards.
Specifically, for the 802.11n-based Scenario 1, we use the NBE-M5-16 wireless bridge radios and the
Rocket-M5 wireless access point, equipped with omni-directional antennas AMO-5G10, to represent
stations (i.e., the cameras), and AP, respectively. The specifications of the devices are shown in Figure 4
and 5. Although the supposed maximum data rate supported by the Rocket-M5 AP is 130 Mbps at index
MCS15 [2], according to 802.11n standard [3], it only has a 100 Mbps networking interface, meaning that
each AP can only serve up to 5 stations simultaneously to ensure that every camera can transmit at
maximum rate. A key consideration is that the AMO-5G10 antenna projects a narrow beam width of 12o
on the horizontal elevation plane (as shown in Figure 4) [4], which means that wireless radios and APs
have to be installed at similar height for maximum signal strength.
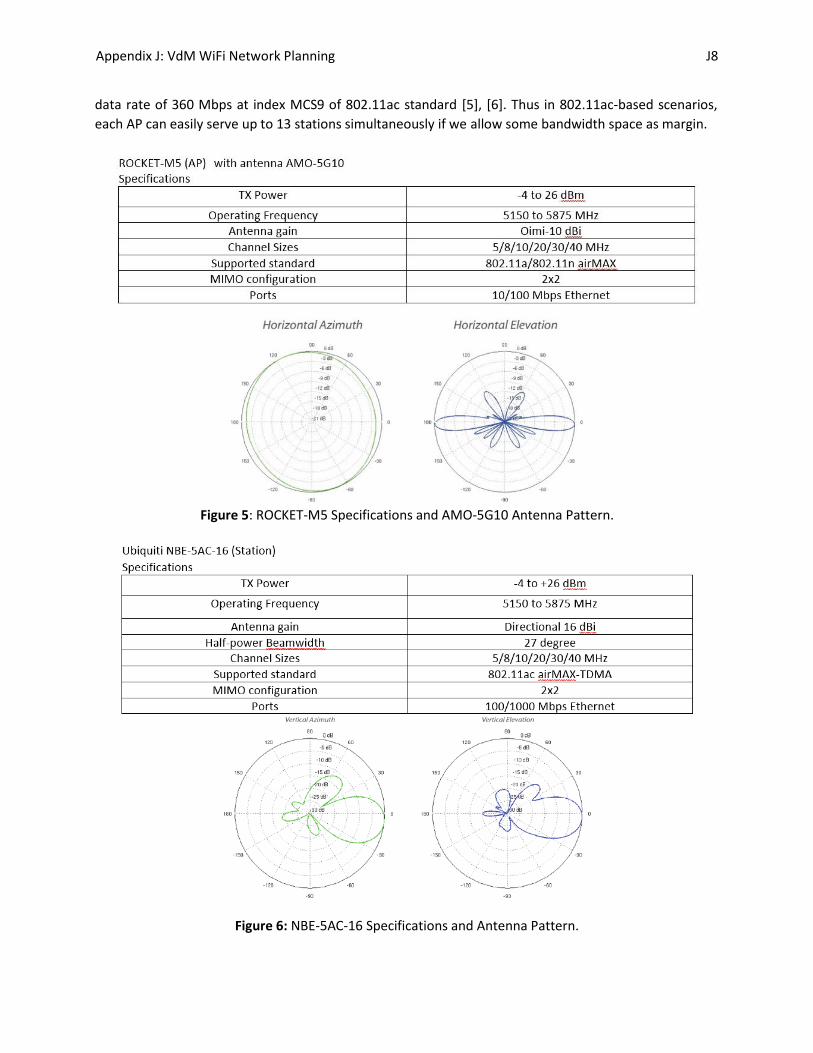
Similarly, for the 802.11ac-based Scenarios 2 and 3, we use the NBE-5AC-16 wireless bridge radios and
the R5AC-Lite wireless access point, also equipped with AMO-5G10 antennas, to represent the stations
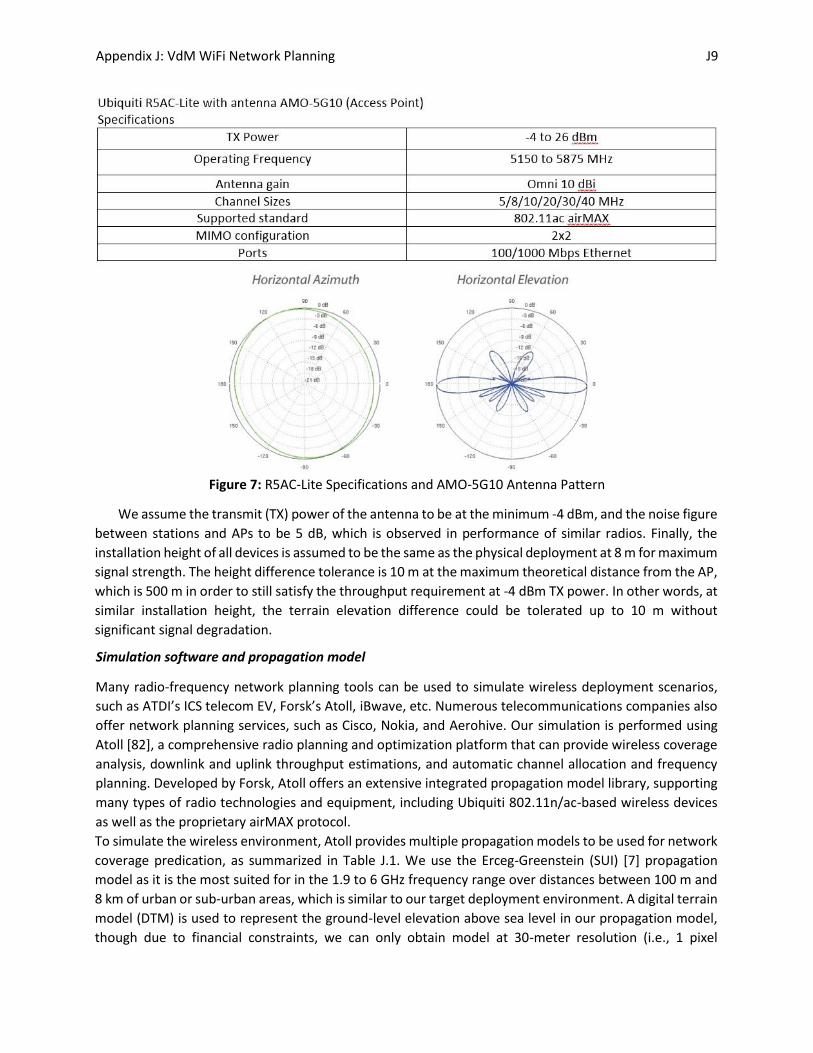
and the AP, respectively. Figure 6 and 7 shows the specifications of the station and the AP devices. The
R5AC-Lite AP includes a 1000 Mbps LAN networking interface, allowing it to support fully the maximum
Figure 4: NBE-M5-16 Specifications and Antenna Pattern
Page 8
Appendix J: VdM WiFi Network Planning J8
data rate of 360 Mbps at index MCS9 of 802.11ac standard [5], [6]. Thus in 802.11ac-based scenarios,
each AP can easily serve up to 13 stations simultaneously if we allow some bandwidth space as margin.
Figure 5: ROCKET-M5 Specifications and AMO-5G10 Antenna Pattern.
Figure 6: NBE-5AC-16 Specifications and Antenna Pattern.
Page 9
Appendix J: VdM WiFi Network Planning J9
We assume the transmit (TX) power of the antenna to be at the minimum -4 dBm, and the noise figure
between stations and APs to be 5 dB, which is observed in performance of similar radios. Finally, the
installation height of all devices is assumed to be the same as the physical deployment at 8 m for maximum
signal strength. The height difference tolerance is 10 m at the maximum theoretical distance from the AP,
which is 500 m in order to still satisfy the throughput requirement at -4 dBm TX power. In other words, at
similar installation height, the terrain elevation difference could be tolerated up to 10 m without
significant signal degradation.
Simulation software and propagation model
Many radio-frequency network planning tools can be used to simulate wireless deployment scenarios,
such as ATDI’s ICS telecom EV, Forsk’s Atoll, iBwave, etc. Numerous telecommunications companies also
offer network planning services, such as Cisco, Nokia, and Aerohive. Our simulation is performed using
Atoll [82], a comprehensive radio planning and optimization platform that can provide wireless coverage
analysis, downlink and uplink throughput estimations, and automatic channel allocation and frequency
planning. Developed by Forsk, Atoll offers an extensive integrated propagation model library, supporting
many types of radio technologies and equipment, including Ubiquiti 802.11n/ac-based wireless devices
as well as the proprietary airMAX protocol.
To simulate the wireless environment, Atoll provides multiple propagation models to be used for network
coverage predication, as summarized in Table J.1. We use the Erceg-Greenstein (SUI) [7] propagation
model as it is the most suited for in the 1.9 to 6 GHz frequency range over distances between 100 m and
8 km of urban or sub-urban areas, which is similar to our target deployment environment. A digital terrain
model (DTM) is used to represent the ground-level elevation above sea level in our propagation model,
though due to financial constraints, we can only obtain model at 30-meter resolution (i.e., 1 pixel
Figure 7: R5AC-Lite Specifications and AMO-5G10 Antenna Pattern
Page 10
Appendix J: VdM WiFi Network Planning J10
represents a 30m-by-30m area) without any clutter land-use information (e.g., buildings, vegetation) that
may impact radio wave propagation. Under such restrictions, the model does not include clutter classes,
data describing the land use on the terrain (e.g., buildings) which can impact radio propagation due to
their physical and electrical properties, and clutter heights, data representing height of buildings,
structures, and vegetation features in the area. Thus, the simulation assumes no radio interference from
buildings and other on-site devices (i.e., public or private Wi-Fi networks deployed by third party).
Table 1: Summary of Propagation Models provided by Atoll.
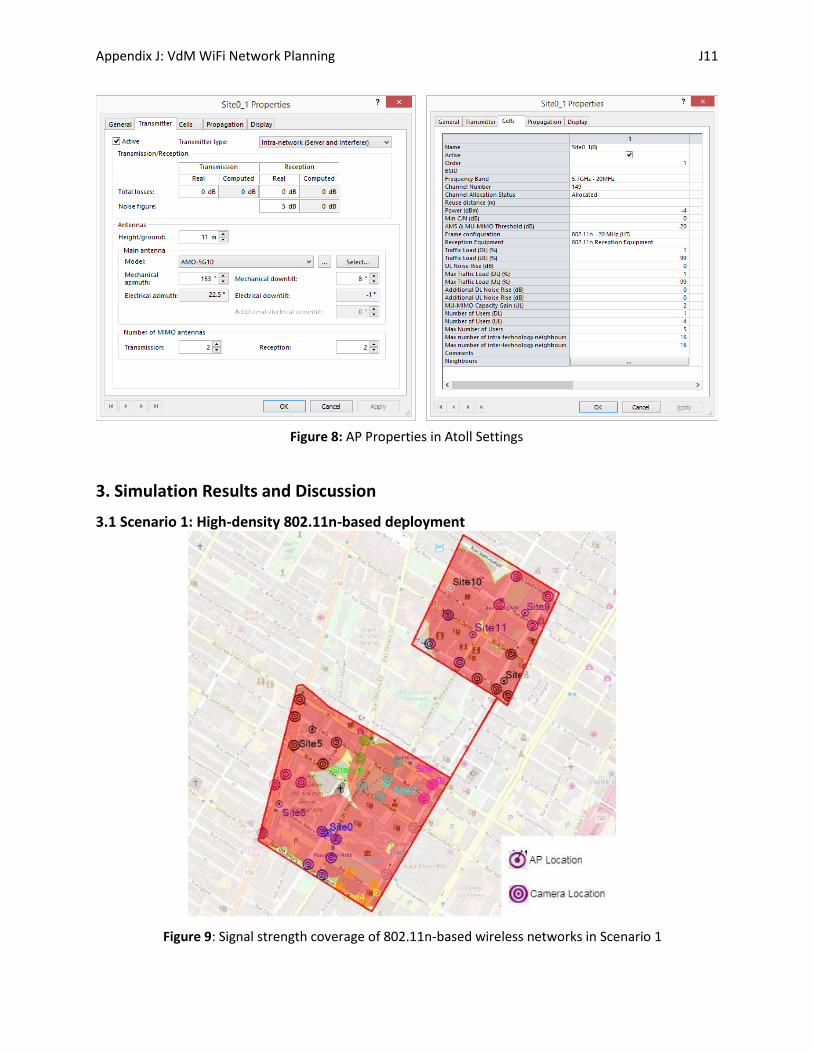
The AP configuration is modelled as transmitter in Atoll. Its properties are set as shown in Figure 8.
Page 11
Appendix J: VdM WiFi Network Planning J11
3. Simulation Results and Discussion
3.1 Scenario 1: High-density 802.11n-based deployment
Figure 9: Signal strength coverage of 802.11n-based wireless networks in Scenario 1
Figure 8: AP Properties in Atoll Settings
Page 12
Appendix J: VdM WiFi Network Planning J12
In Scenario 1, it is shown in Figure 5 that we can provide high throughput coverage to every station/camera
in the target surveillance areas given our constraints. In total, there are 12 APs covering 41 cameras across
the two areas, with every camera capable of reaching peak data rate of up to 150 Mbps. The camera and
AP densities for 802.11n based deployment in this scenario are 113 cameras/km2 and 33 APs/km2,
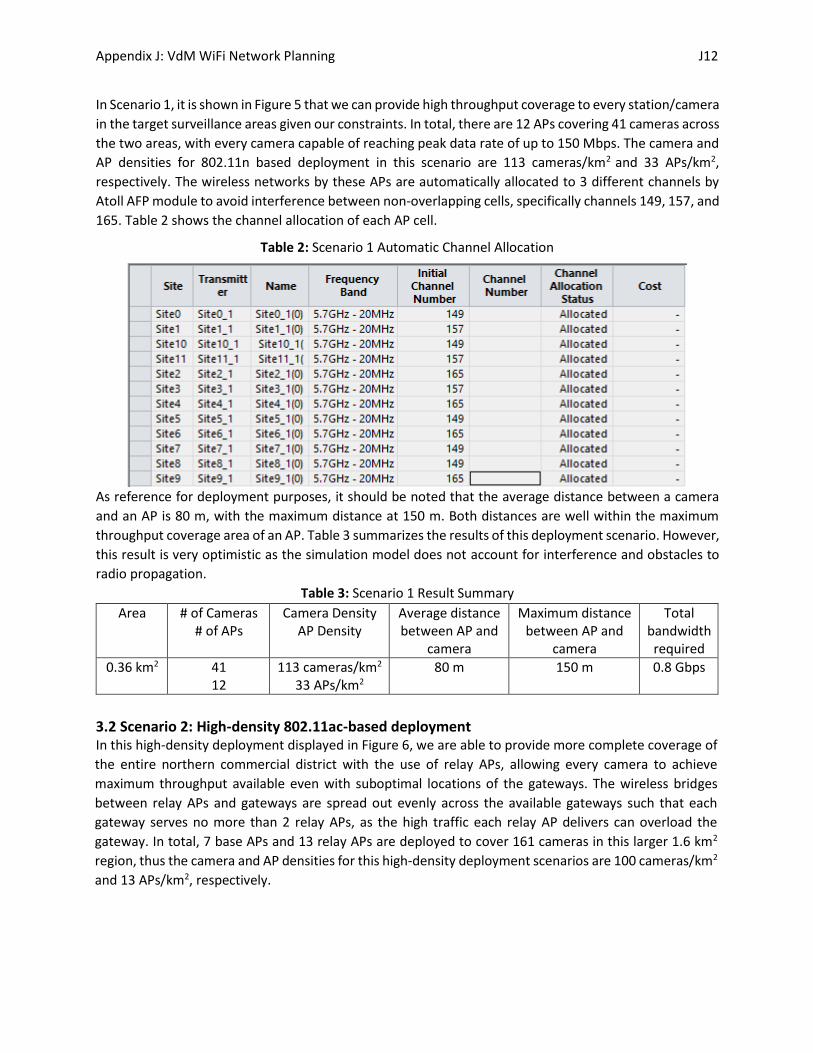
respectively. The wireless networks by these APs are automatically allocated to 3 different channels by
Atoll AFP module to avoid interference between non-overlapping cells, specifically channels 149, 157, and
165. Table 2 shows the channel allocation of each AP cell.
As reference for deployment purposes, it should be noted that the average distance between a camera
and an AP is 80 m, with the maximum distance at 150 m. Both distances are well within the maximum
throughput coverage area of an AP. Table 3 summarizes the results of this deployment scenario. However,
this result is very optimistic as the simulation model does not account for interference and obstacles to
radio propagation.
Table 3: Scenario 1 Result Summary
Area # of Cameras # of APs
Camera Density AP Density
Average distance between AP and
camera
Maximum distance between AP and
camera
Total bandwidth required
0.36 km2 41 12
113 cameras/km2 33 APs/km2
80 m 150 m 0.8 Gbps
3.2 Scenario 2: High-density 802.11ac-based deployment In this high-density deployment displayed in Figure 6, we are able to provide more complete coverage of
the entire northern commercial district with the use of relay APs, allowing every camera to achieve
maximum throughput available even with suboptimal locations of the gateways. The wireless bridges
between relay APs and gateways are spread out evenly across the available gateways such that each
gateway serves no more than 2 relay APs, as the high traffic each relay AP delivers can overload the
gateway. In total, 7 base APs and 13 relay APs are deployed to cover 161 cameras in this larger 1.6 km2
region, thus the camera and AP densities for this high-density deployment scenarios are 100 cameras/km2
and 13 APs/km2, respectively.
Table 2: Scenario 1 Automatic Channel Allocation
Page 13
Appendix J: VdM WiFi Network Planning J13
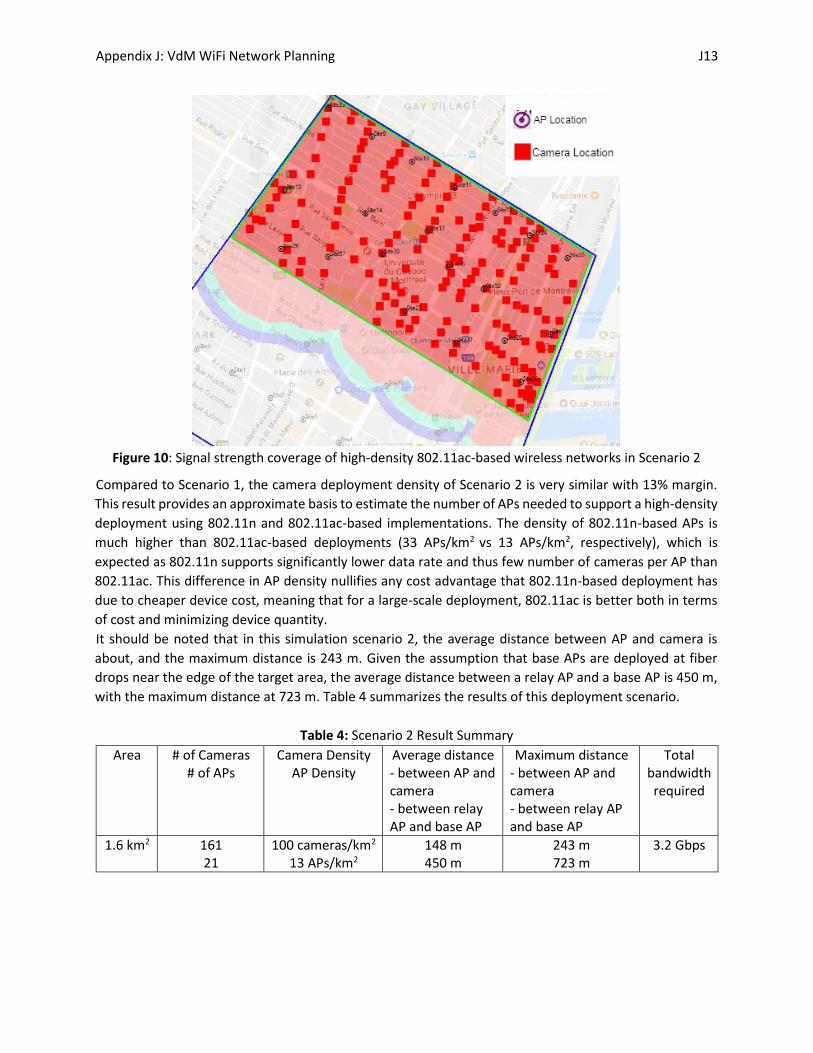
Figure 10: Signal strength coverage of high-density 802.11ac-based wireless networks in Scenario 2
Compared to Scenario 1, the camera deployment density of Scenario 2 is very similar with 13% margin.
This result provides an approximate basis to estimate the number of APs needed to support a high-density
deployment using 802.11n and 802.11ac-based implementations. The density of 802.11n-based APs is
much higher than 802.11ac-based deployments (33 APs/km2 vs 13 APs/km2, respectively), which is
expected as 802.11n supports significantly lower data rate and thus few number of cameras per AP than
802.11ac. This difference in AP density nullifies any cost advantage that 802.11n-based deployment has
due to cheaper device cost, meaning that for a large-scale deployment, 802.11ac is better both in terms
of cost and minimizing device quantity.
It should be noted that in this simulation scenario 2, the average distance between AP and camera is
about, and the maximum distance is 243 m. Given the assumption that base APs are deployed at fiber
drops near the edge of the target area, the average distance between a relay AP and a base AP is 450 m,
with the maximum distance at 723 m. Table 4 summarizes the results of this deployment scenario.
Table 4: Scenario 2 Result Summary
Area # of Cameras # of APs
Camera Density AP Density
Average distance - between AP and camera - between relay AP and base AP
Maximum distance - between AP and camera - between relay AP and base AP
Total bandwidth required
1.6 km2 161 21
100 cameras/km2 13 APs/km2
148 m 450 m
243 m 723 m
3.2 Gbps
Page 14
Appendix J: VdM WiFi Network Planning J14
3.3 Scenario 3: Low-density 802.11ac-based deployment
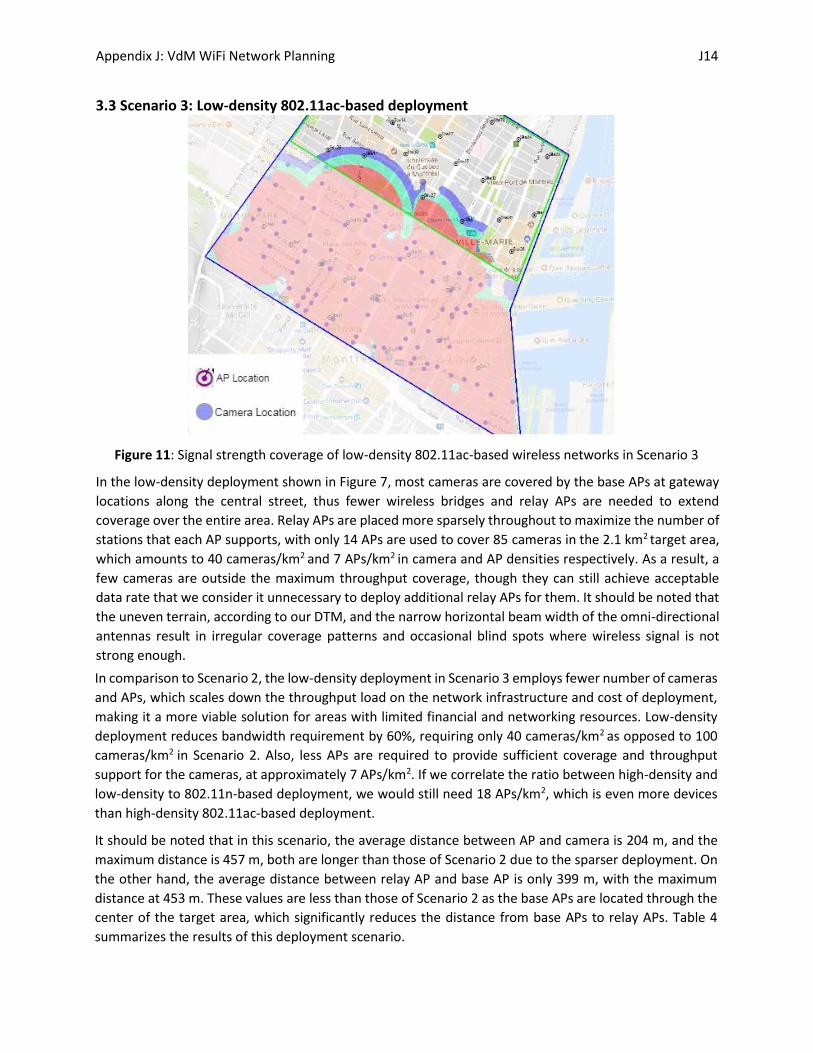
Figure 11: Signal strength coverage of low-density 802.11ac-based wireless networks in Scenario 3
In the low-density deployment shown in Figure 7, most cameras are covered by the base APs at gateway
locations along the central street, thus fewer wireless bridges and relay APs are needed to extend
coverage over the entire area. Relay APs are placed more sparsely throughout to maximize the number of
stations that each AP supports, with only 14 APs are used to cover 85 cameras in the 2.1 km2 target area,
which amounts to 40 cameras/km2 and 7 APs/km2 in camera and AP densities respectively. As a result, a
few cameras are outside the maximum throughput coverage, though they can still achieve acceptable
data rate that we consider it unnecessary to deploy additional relay APs for them. It should be noted that
the uneven terrain, according to our DTM, and the narrow horizontal beam width of the omni-directional
antennas result in irregular coverage patterns and occasional blind spots where wireless signal is not
strong enough.
In comparison to Scenario 2, the low-density deployment in Scenario 3 employs fewer number of cameras
and APs, which scales down the throughput load on the network infrastructure and cost of deployment,
making it a more viable solution for areas with limited financial and networking resources. Low-density
deployment reduces bandwidth requirement by 60%, requiring only 40 cameras/km2 as opposed to 100
cameras/km2 in Scenario 2. Also, less APs are required to provide sufficient coverage and throughput
support for the cameras, at approximately 7 APs/km2. If we correlate the ratio between high-density and
low-density to 802.11n-based deployment, we would still need 18 APs/km2, which is even more devices
than high-density 802.11ac-based deployment.
It should be noted that in this scenario, the average distance between AP and camera is 204 m, and the
maximum distance is 457 m, both are longer than those of Scenario 2 due to the sparser deployment. On
the other hand, the average distance between relay AP and base AP is only 399 m, with the maximum
distance at 453 m. These values are less than those of Scenario 2 as the base APs are located through the
center of the target area, which significantly reduces the distance from base APs to relay APs. Table 4
summarizes the results of this deployment scenario.
Page 15
Appendix J: VdM WiFi Network Planning J15
Table 4: Scenario 3 Result Summary
Area # of Cameras # of APs
Camera Density AP Density
Average distance - between AP and camera - between relay AP and base AP
Maximum distance - between AP and camera - between relay AP and base AP
Total bandwidth required
2.1 km2 85 14
40 cameras/km2 7 APs/km2
204 m 399 m
457 m 453 m
1.66 Gbps
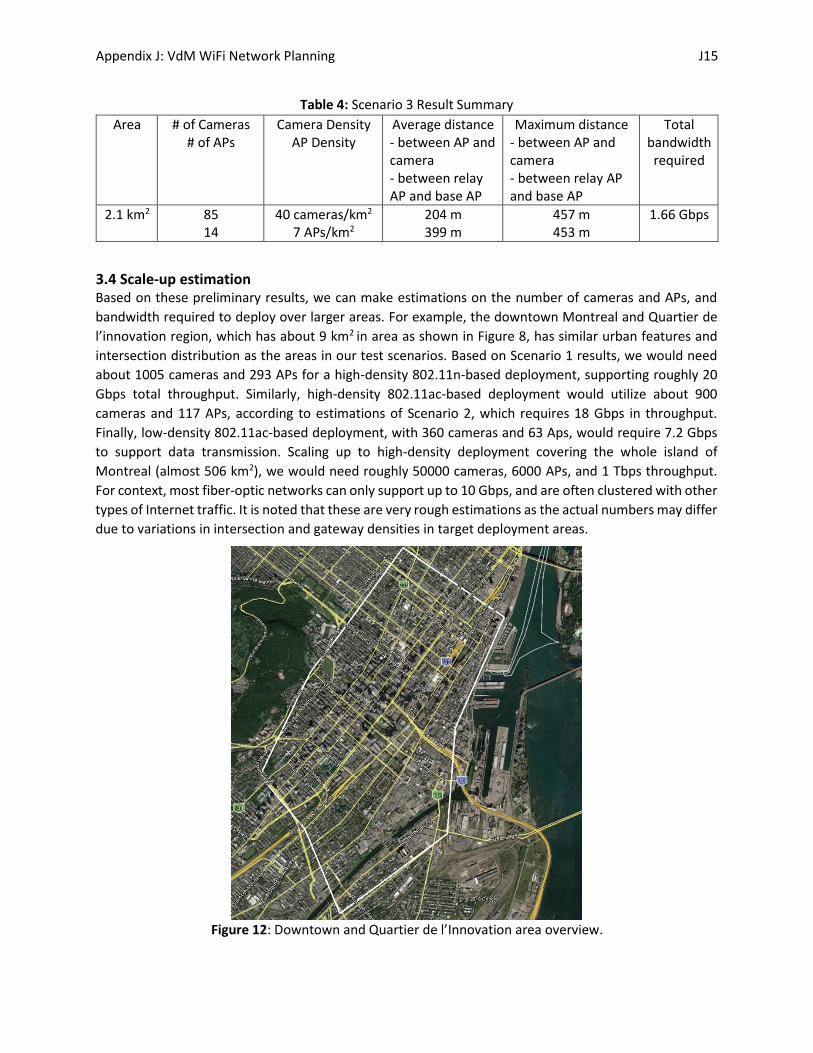
3.4 Scale-up estimation Based on these preliminary results, we can make estimations on the number of cameras and APs, and
bandwidth required to deploy over larger areas. For example, the downtown Montreal and Quartier de
l’innovation region, which has about 9 km2 in area as shown in Figure 8, has similar urban features and
intersection distribution as the areas in our test scenarios. Based on Scenario 1 results, we would need
about 1005 cameras and 293 APs for a high-density 802.11n-based deployment, supporting roughly 20
Gbps total throughput. Similarly, high-density 802.11ac-based deployment would utilize about 900
cameras and 117 APs, according to estimations of Scenario 2, which requires 18 Gbps in throughput.
Finally, low-density 802.11ac-based deployment, with 360 cameras and 63 Aps, would require 7.2 Gbps
to support data transmission. Scaling up to high-density deployment covering the whole island of
Montreal (almost 506 km2), we would need roughly 50000 cameras, 6000 APs, and 1 Tbps throughput.
For context, most fiber-optic networks can only support up to 10 Gbps, and are often clustered with other
types of Internet traffic. It is noted that these are very rough estimations as the actual numbers may differ
due to variations in intersection and gateway densities in target deployment areas.
Figure 12: Downtown and Quartier de l’Innovation area overview.
Page 16
Appendix J: VdM WiFi Network Planning J16
While these estimates are preliminary, the huge throughput requirements raise nontrivial questions
about how much resources in a given area can Smart City support and how to distribute networking
resources to numerous devices and applications. One thing is for certain: a centralized network
infrastructure and data management system will not be able to scale with the demand of Smart City. Thus,
designing a scalable distributed IoT infrastructure is crucial to enable a full-scale Smart City deployment
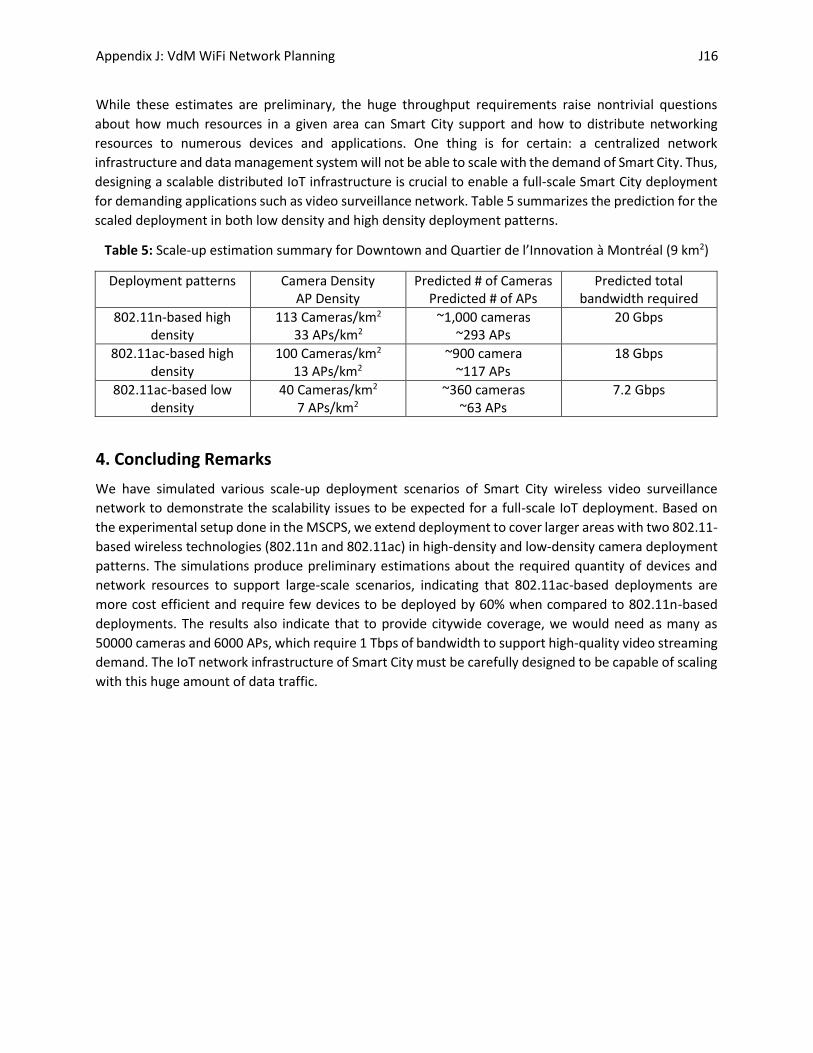
for demanding applications such as video surveillance network. Table 5 summarizes the prediction for the
scaled deployment in both low density and high density deployment patterns.
Table 5: Scale-up estimation summary for Downtown and Quartier de l’Innovation à Montréal (9 km2)
Deployment patterns Camera Density AP Density
Predicted # of Cameras Predicted # of APs
Predicted total bandwidth required
802.11n-based high density
113 Cameras/km2 33 APs/km2
~1,000 cameras ~293 APs
20 Gbps
802.11ac-based high density
100 Cameras/km2 13 APs/km2
~900 camera ~117 APs
18 Gbps
802.11ac-based low density
40 Cameras/km2 7 APs/km2
~360 cameras ~63 APs
7.2 Gbps
4. Concluding Remarks
We have simulated various scale-up deployment scenarios of Smart City wireless video surveillance
network to demonstrate the scalability issues to be expected for a full-scale IoT deployment. Based on
the experimental setup done in the MSCPS, we extend deployment to cover larger areas with two 802.11-
based wireless technologies (802.11n and 802.11ac) in high-density and low-density camera deployment
patterns. The simulations produce preliminary estimations about the required quantity of devices and
network resources to support large-scale scenarios, indicating that 802.11ac-based deployments are
more cost efficient and require few devices to be deployed by 60% when compared to 802.11n-based
deployments. The results also indicate that to provide citywide coverage, we would need as many as
50000 cameras and 6000 APs, which require 1 Tbps of bandwidth to support high-quality video streaming
demand. The IoT network infrastructure of Smart City must be carefully designed to be capable of scaling
with this huge amount of data traffic.
Page 17
Appendix J: VdM WiFi Network Planning J17
References [1] AirMAX TDMA System. Ubiquiti Networks. 2014.
[2] Rocket M: Powerful 2x2 MIMO airMAX BaseStation. Ubiquiti Networks. 2015.
[3] “IEEE Standard for Information technology– Local and metropolitan area networks– Specific
requirements– Part 11: Wireless LAN Medium Access Control (MAC)and Physical Layer (PHY)
Specifications Amendment 5: Enhancements for Higher Throughput”. In: IEEE Std 802.11n-2009
(Amendment to IEEE Std 802.11-2007 as amended by IEEE Std 802.11k-2008, IEEE Std 802.11r-2008,
IEEE Std 802.11y-2008, and IEEE Std 802.11w-2009) (2009).
[4] airMAX Omni: Next-Gen 2x2 Dual Polarity MIMO Omni Antenna. Ubiquiti Networks. 2012.
[5] “IEEE Standard for Information technology–Telecommunications and information exchange
between systemsLocal and metropolitan area networks–Specific requirements– Part 11: Wireless
LAN Medium Access Control (MAC) and Physical Layer (PHY) Specifications–Amendment 4:
Enhancements for Very High Throughput for Operation in Bands below 6 GHz”. In: IEEE Std
802.11ac-2013 (Amendment to IEEE STd 802.11-2012, as amended by IEEE Std 802.11ae-2012, IEEE
Std 802.11aa-2012, and IEEE Std 802.11ad-2012) (2013).
[6] Rocket ac: Powerful airMAX ac BaseStation. Ubiquiti Networks. 2015.
[7] V. Erceg, L. Greenstein, S. Tjandra, S. Parkoff, A. Gupta, et al. “An empirically based path loss model
for wireless channels in suburban environments”. In: IEEE Journal on Selected Areas in
Communications 17.7 (1999), pp. 1205–1211.