SUPPLEMENT TO “REVOLT ON THE NILE: ECONOMIC SHOCKS,RELIGION, AND POLITICAL POWER”
(Econometrica, Vol. 81, No. 5, September 2013, 2033–2053)
BY ERIC CHANEY
A.1. SENSITIVITY CHECKS AND ADDITIONAL RESULTS
A.1.1. Relation to Duration Models
EVEN WHEN AN UNDERLYING DURATION such as a head judge’s time in officeis continuous, measurements of such durations are often discrete. This is thecase in many economic applications and is also true for the duration of thehead judge in office. When a duration is only known to fall within a certaintime interval (such as a Nile year), the exact duration is not observed and thedata are often referred to as grouped duration data.
The analysis in the main text is closely related to the specification com-monly used in such group duration settings (see, for example, Meyer (1990),Ryu (1994), Jenkins (1995), and Sueyoshi (1995)). In the context of this paper,the relevant “grouped-data” duration model can be estimated by splitting eachhead judge duration into the Nile years in which he was in office. Then, foreach judge-year observation, the dependent variable is equal to 1 if the judgewas replaced in that year and 0 otherwise. For example, if a head judge wasreplaced in the third Nile year following his appointment, three observationswould be created. The dependent variable in the first two observations wouldbe equal to 0 and that in the third would equal 1.
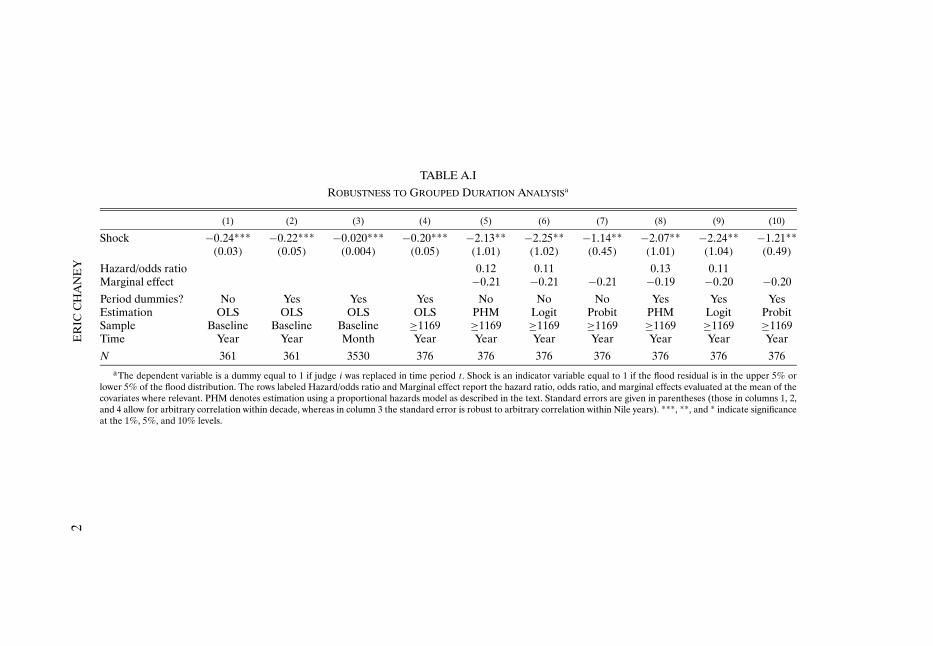
In Table A.I, I investigate the extent to which results are robust to estimationusing such grouped-data specifications. In columns 1–4 of Table A.I, I presentresults using the linear probability model. In column 1, I present results usingthe baseline sample without additional controls, whereas in column 2, I addperiod dummies. In column 3, I repeat the analysis using the judge-month asthe unit of observation (see below for a detailed description of these data). Incolumn 4, I use all observations after 1169.
In columns 5–10, I present the results derived from nonlinear models. I canonly do this in the full sample after 1169, because on the baseline sample, thereare no judge replacements in Nile shock years. In columns 5–7, I omit perioddummies and thus constrain the baseline hazard to be constant. In columns8–10, I include period dummies and thus allow the baseline hazard to vary ar-bitrarily across periods (e.g., Sueyoshi (1995)).1 In columns 5 and 8, I estimatethe effect of Nile shocks on judge replacement using the proportional hazards
1I pool the period dummies after the fourth year in these nonlinear specifications to avoiddropping observations.
Period dummies? No Yes Yes Yes No No No Yes Yes YesEstimation OLS OLS OLS OLS PHM Logit Probit PHM Logit ProbitSample Baseline Baseline Baseline ≥1169 ≥1169 ≥1169 ≥1169 ≥1169 ≥1169 ≥1169Time Year Year Month Year Year Year Year Year Year Year
N 361 361 3530 376 376 376 376 376 376 376aThe dependent variable is a dummy equal to 1 if judge i was replaced in time period t . Shock is an indicator variable equal to 1 if the flood residual is in the upper 5% or
lower 5% of the flood distribution. The rows labeled Hazard/odds ratio and Marginal effect report the hazard ratio, odds ratio, and marginal effects evaluated at the mean of thecovariates where relevant. PHM denotes estimation using a proportional hazards model as described in the text. Standard errors are given in parentheses (those in columns 1, 2,and 4 allow for arbitrary correlation within decade, whereas in column 3 the standard error is robust to arbitrary correlation within Nile years). ***, **, and * indicate significanceat the 1%, 5%, and 10% levels.
REVOLT ON THE NILE 3
model following the approach in Meyer (1990).2 In columns 6 and 9, I estimatethe effects of Nile shocks on judge replacement using a logit specification. Incolumns 7 and 10, I estimate the shock effects using a probit specification. Forthese specifications, I present marginal effects (evaluated at the mean of theperiod dummies where relevant) and the relevant hazard/odds ratio. As theseresults show, the marginal effects obtained in the nonlinear models are almostidentical to those obtained using the linear probability model.
Since the head judges in the main series are “stacked” by calendar time,the analysis in the main text is closely linked to such grouped duration speci-fications when time is measured in Nile years. The main differences are thatthe analysis in the main text omits some short-lived judges by making the Nileyear the unit of observation and estimates the replacement probability usinga linear probability model instead of a nonlinear specification. Thus, it is notsurprising that the results using grouped duration specifications are similar tothose presented in the main text.
A.1.2. Judge Changes and Flood Residuals
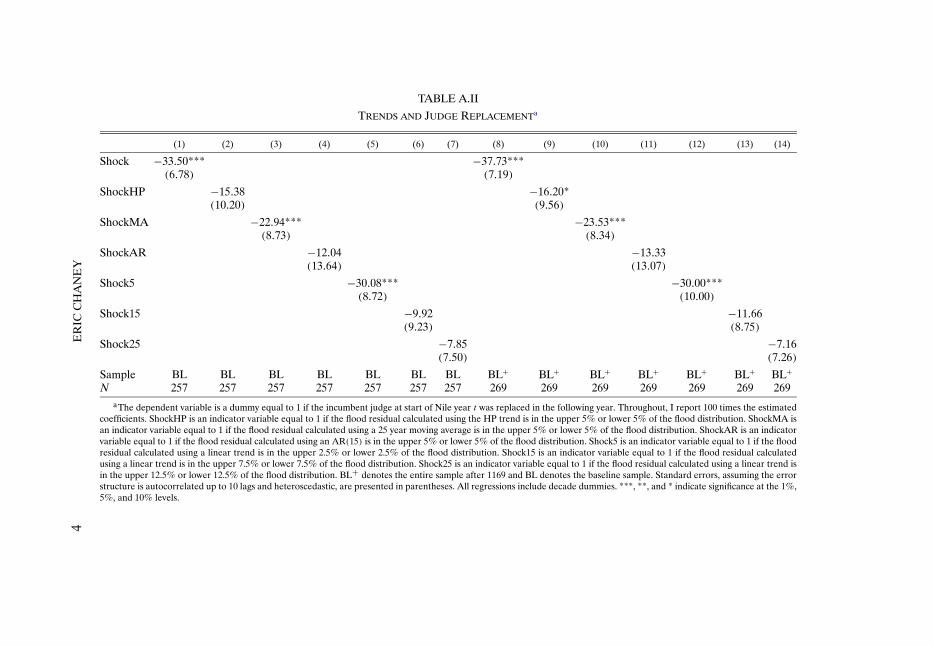
How sensitive are the results to the choice of trend and cutoffs? I investi-gate this question in Table A.II. Columns 1–7 use the baseline sample, whereasresults reported in columns 8–14 were estimated on the sample including allyears after 1169. The row labeled Shock provides the estimates of β1 fromequation (1) of the main text. The row labeled ShockHP provides the esti-mates of β1 from equation (1) when calculating the Nile shock variable usingdeviations from an HP filter with the HP parameter value set to 6.25 as sug-gested by Ravn and Uhlig (2002). The rows labeled ShockMA and ShockARperform the same exercise using deviations from a 25 year moving average andan AR(15).3 Although the point estimates decrease in absolute value whencompared to the results obtained using shockt , they remain negative.4
In the rows labeled Shock5, Shock15, and Shock25, I present results usingthe top and bottom 2.5%, 7.5%, and 12.5% of flood deviations from a lineartrend, respectively. The results show that while the point estimates are gen-erally similar to those obtained using the variable shockt when the 5% cutoffis used, the point estimates decrease sharply and lose statistical significancewhen the 15% and 25% cutoffs are used in the baseline sample. These resultsare consistent with historical evidence that only extreme shocks led to signif-icant increases in social unrest, and suggest that variables constructed using
2The results presented here abstract from unobserved heterogeneity. Results that allow forunobserved heterogeneity as in Meyer (1990) yield similar results to those presented.
3The AR lag length was chosen using the Akaike information criterion (AIC) and setting themaximum lag length equal to 30.
4Consequently, these results are consistent with the hypothesis that the use of nonlinear trendsto construct the shock variable decreases the precision with which this variable measures actualNile shocks.
N 257 257 257 257 257 257 257 269 269 269 269 269 269 269aThe dependent variable is a dummy equal to 1 if the incumbent judge at start of Nile year t was replaced in the following year. Throughout, I report 100 times the estimated
coefficients. ShockHP is an indicator variable equal to 1 if the flood residual calculated using the HP trend is in the upper 5% or lower 5% of the flood distribution. ShockMA isan indicator variable equal to 1 if the flood residual calculated using a 25 year moving average is in the upper 5% or lower 5% of the flood distribution. ShockAR is an indicatorvariable equal to 1 if the flood residual calculated using an AR(15) is in the upper 5% or lower 5% of the flood distribution. Shock5 is an indicator variable equal to 1 if the floodresidual calculated using a linear trend is in the upper 2.5% or lower 2.5% of the flood distribution. Shock15 is an indicator variable equal to 1 if the flood residual calculatedusing a linear trend is in the upper 7.5% or lower 7.5% of the flood distribution. Shock25 is an indicator variable equal to 1 if the flood residual calculated using a linear trend isin the upper 12.5% or lower 12.5% of the flood distribution. BL+ denotes the entire sample after 1169 and BL denotes the baseline sample. Standard errors, assuming the errorstructure is autocorrelated up to 10 lags and heteroscedastic, are presented in parentheses. All regressions include decade dummies. ***, **, and * indicate significance at the 1%,5%, and 10% levels.
REVOLT ON THE NILE 5
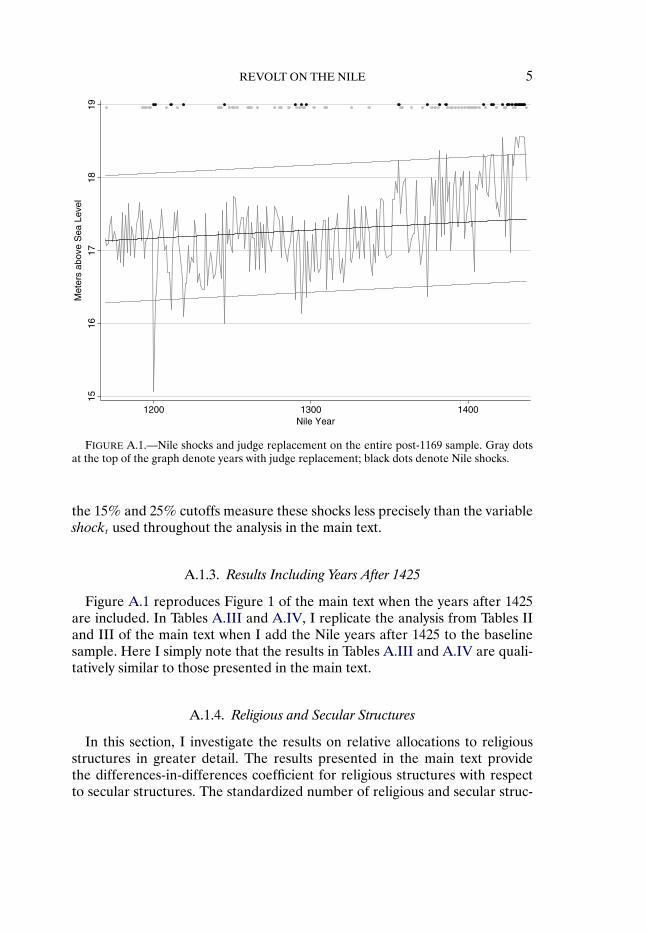
FIGURE A.1.—Nile shocks and judge replacement on the entire post-1169 sample. Gray dotsat the top of the graph denote years with judge replacement; black dots denote Nile shocks.
the 15% and 25% cutoffs measure these shocks less precisely than the variableshockt used throughout the analysis in the main text.
A.1.3. Results Including Years After 1425
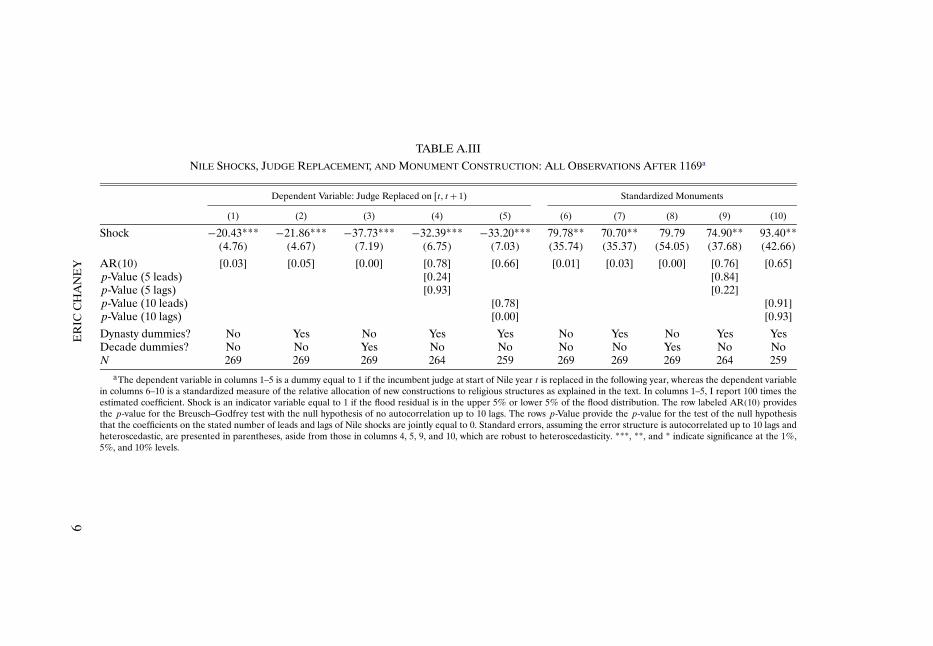
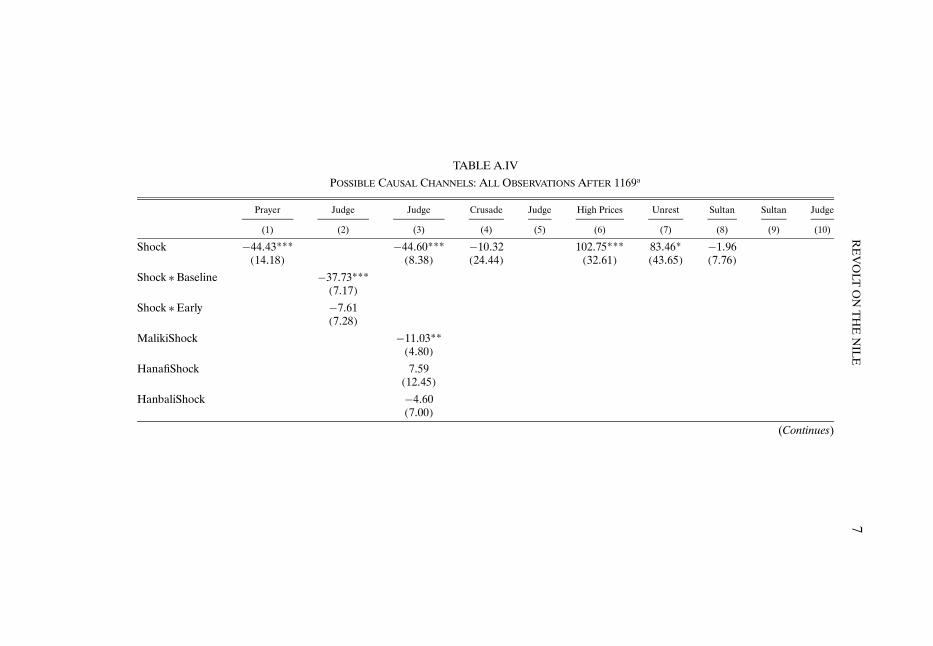
Figure A.1 reproduces Figure 1 of the main text when the years after 1425are included. In Tables A.III and A.IV, I replicate the analysis from Tables IIand III of the main text when I add the Nile years after 1425 to the baselinesample. Here I simply note that the results in Tables A.III and A.IV are quali-tatively similar to those presented in the main text.
A.1.4. Religious and Secular Structures
In this section, I investigate the results on relative allocations to religiousstructures in greater detail. The results presented in the main text providethe differences-in-differences coefficient for religious structures with respectto secular structures. The standardized number of religious and secular struc-
6E
RIC
CH
AN
EY
TABLE A.III
NILE SHOCKS, JUDGE REPLACEMENT, AND MONUMENT CONSTRUCTION: ALL OBSERVATIONS AFTER 1169a
Dependent Variable: Judge Replaced on [t� t + 1) Standardized Monuments
AR(10) [0�03] [0�05] [0�00] [0�78] [0�66] [0�01] [0�03] [0�00] [0�76] [0�65]p-Value (5 leads) [0�24] [0�84]p-Value (5 lags) [0�93] [0�22]p-Value (10 leads) [0�78] [0�91]p-Value (10 lags) [0�00] [0�93]Dynasty dummies? No Yes No Yes Yes No Yes No Yes YesDecade dummies? No No Yes No No No No Yes No NoN 269 269 269 264 259 269 269 269 264 259
aThe dependent variable in columns 1–5 is a dummy equal to 1 if the incumbent judge at start of Nile year t is replaced in the following year, whereas the dependent variablein columns 6–10 is a standardized measure of the relative allocation of new constructions to religious structures as explained in the text. In columns 1–5, I report 100 times theestimated coefficient. Shock is an indicator variable equal to 1 if the flood residual is in the upper 5% or lower 5% of the flood distribution. The row labeled AR(10) providesthe p-value for the Breusch–Godfrey test with the null hypothesis of no autocorrelation up to 10 lags. The rows p-Value provide the p-value for the test of the null hypothesisthat the coefficients on the stated number of leads and lags of Nile shocks are jointly equal to 0. Standard errors, assuming the error structure is autocorrelated up to 10 lags andheteroscedastic, are presented in parentheses, aside from those in columns 4, 5, 9, and 10, which are robust to heteroscedasticity. ***, **, and * indicate significance at the 1%,5%, and 10% levels.
RE
VO
LTO
NT
HE
NIL
E7
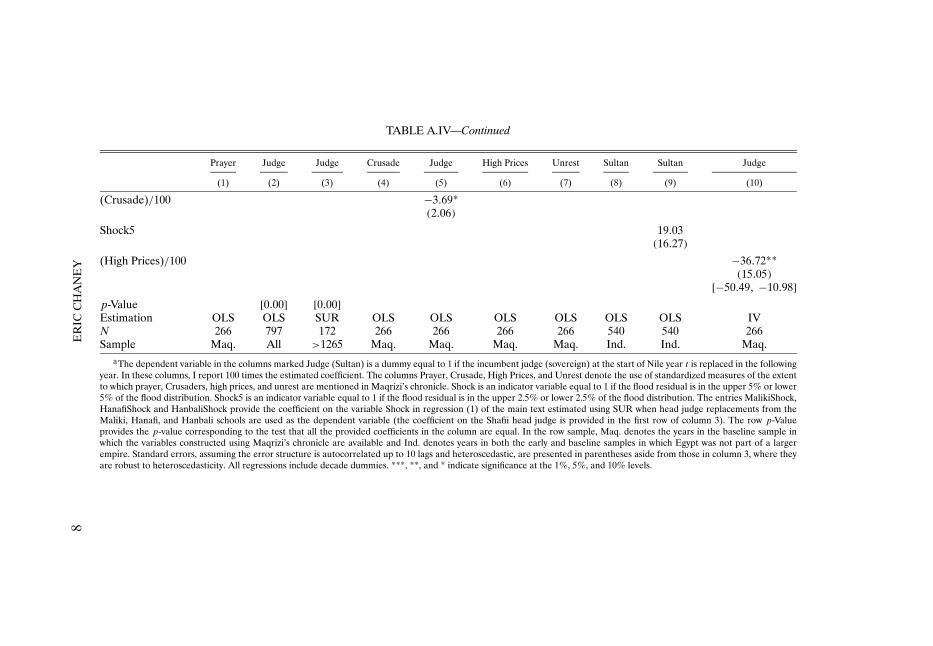
TABLE A.IV
POSSIBLE CAUSAL CHANNELS: ALL OBSERVATIONS AFTER 1169a
Prayer Judge Judge Crusade Judge High Prices Unrest Sultan Sultan Judge
aThe dependent variable in the columns marked Judge (Sultan) is a dummy equal to 1 if the incumbent judge (sovereign) at the start of Nile year t is replaced in the followingyear. In these columns, I report 100 times the estimated coefficient. The columns Prayer, Crusade, High Prices, and Unrest denote the use of standardized measures of the extentto which prayer, Crusaders, high prices, and unrest are mentioned in Maqrizi’s chronicle. Shock is an indicator variable equal to 1 if the flood residual is in the upper 5% or lower5% of the flood distribution. Shock5 is an indicator variable equal to 1 if the flood residual is in the upper 2.5% or lower 2.5% of the flood distribution. The entries MalikiShock,HanafiShock and HanbaliShock provide the coefficient on the variable Shock in regression (1) of the main text estimated using SUR when head judge replacements from theMaliki, Hanafi, and Hanbali schools are used as the dependent variable (the coefficient on the Shafii head judge is provided in the first row of column 3). The row p-Valueprovides the p-value corresponding to the test that all the provided coefficients in the column are equal. In the row sample, Maq. denotes the years in the baseline sample inwhich the variables constructed using Maqrizi’s chronicle are available and Ind. denotes years in both the early and baseline samples in which Egypt was not part of a largerempire. Standard errors, assuming the error structure is autocorrelated up to 10 lags and heteroscedastic, are presented in parentheses aside from those in column 3, where theyare robust to heteroscedasticity. All regressions include decade dummies. ***, **, and * indicate significance at the 1%, 5%, and 10% levels.
REVOLT ON THE NILE 9
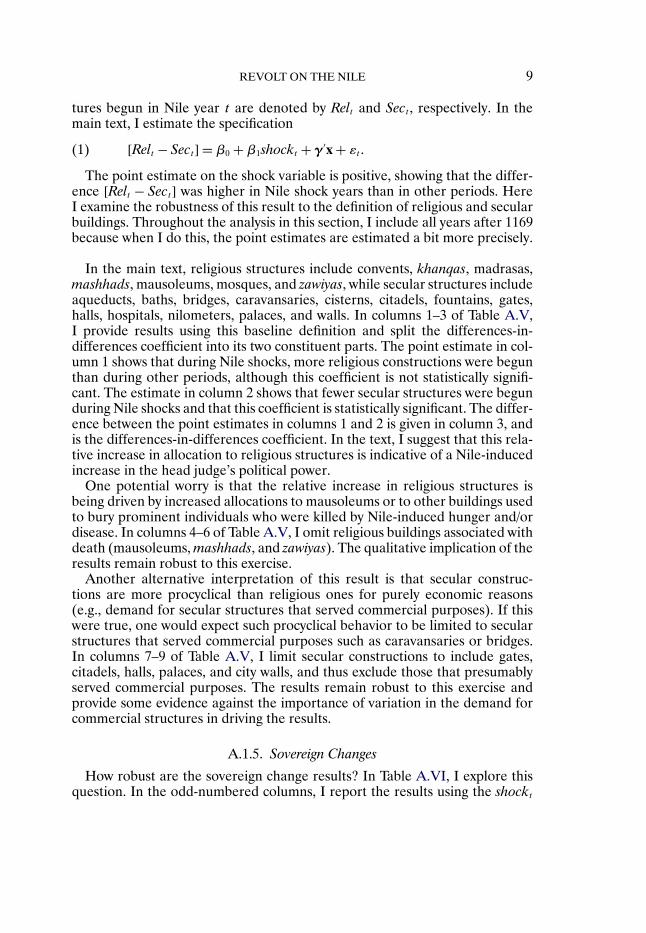
tures begun in Nile year t are denoted by Relt and Sect , respectively. In themain text, I estimate the specification
[Relt − Sect] = β0 +β1shockt + γ ′x + εt�(1)
The point estimate on the shock variable is positive, showing that the differ-ence [Relt − Sect] was higher in Nile shock years than in other periods. HereI examine the robustness of this result to the definition of religious and secularbuildings. Throughout the analysis in this section, I include all years after 1169because when I do this, the point estimates are estimated a bit more precisely.
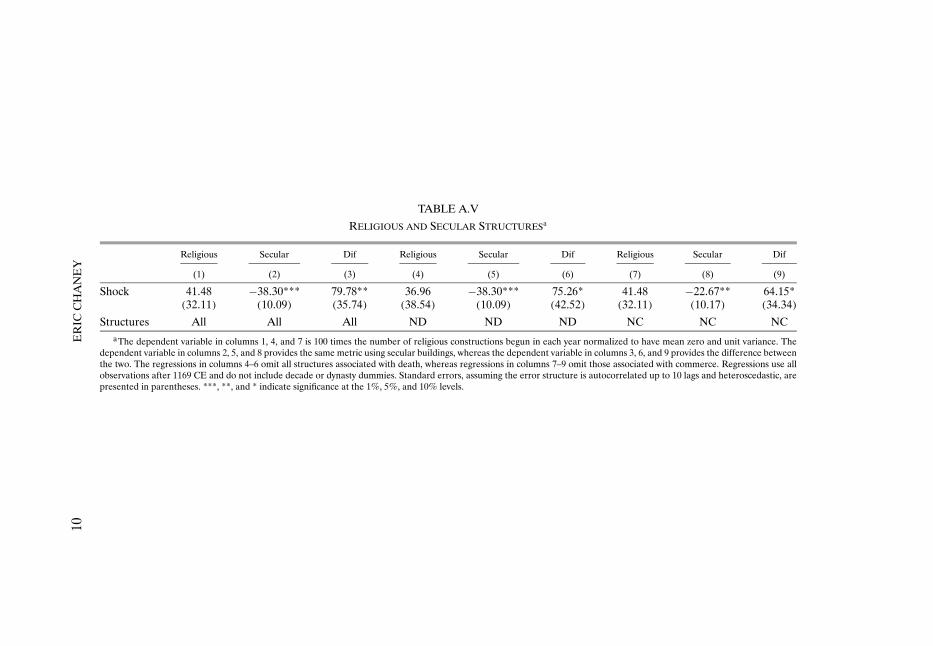
In the main text, religious structures include convents, khanqas, madrasas,mashhads, mausoleums, mosques, and zawiyas, while secular structures includeaqueducts, baths, bridges, caravansaries, cisterns, citadels, fountains, gates,halls, hospitals, nilometers, palaces, and walls. In columns 1–3 of Table A.V,I provide results using this baseline definition and split the differences-in-differences coefficient into its two constituent parts. The point estimate in col-umn 1 shows that during Nile shocks, more religious constructions were begunthan during other periods, although this coefficient is not statistically signifi-cant. The estimate in column 2 shows that fewer secular structures were begunduring Nile shocks and that this coefficient is statistically significant. The differ-ence between the point estimates in columns 1 and 2 is given in column 3, andis the differences-in-differences coefficient. In the text, I suggest that this rela-tive increase in allocation to religious structures is indicative of a Nile-inducedincrease in the head judge’s political power.
One potential worry is that the relative increase in religious structures isbeing driven by increased allocations to mausoleums or to other buildings usedto bury prominent individuals who were killed by Nile-induced hunger and/ordisease. In columns 4–6 of Table A.V, I omit religious buildings associated withdeath (mausoleums, mashhads, and zawiyas). The qualitative implication of theresults remain robust to this exercise.
Another alternative interpretation of this result is that secular construc-tions are more procyclical than religious ones for purely economic reasons(e.g., demand for secular structures that served commercial purposes). If thiswere true, one would expect such procyclical behavior to be limited to secularstructures that served commercial purposes such as caravansaries or bridges.In columns 7–9 of Table A.V, I limit secular constructions to include gates,citadels, halls, palaces, and city walls, and thus exclude those that presumablyserved commercial purposes. The results remain robust to this exercise andprovide some evidence against the importance of variation in the demand forcommercial structures in driving the results.
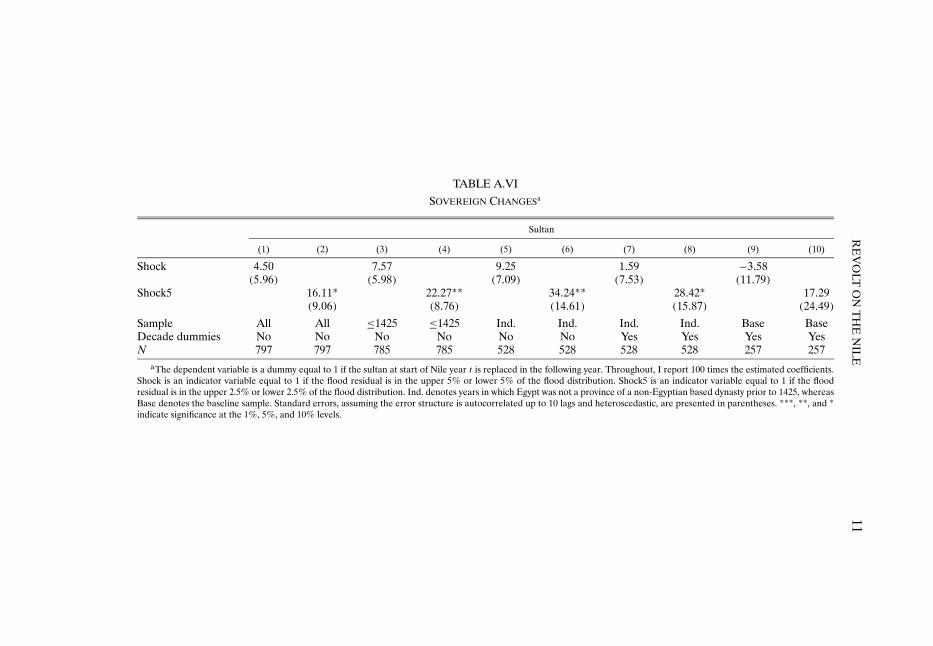
A.1.5. Sovereign Changes
How robust are the sovereign change results? In Table A.VI, I explore thisquestion. In the odd-numbered columns, I report the results using the shockt
10E
RIC
CH
AN
EY
TABLE A.V
RELIGIOUS AND SECULAR STRUCTURESa
Religious Secular Dif Religious Secular Dif Religious Secular Dif
Structures All All All ND ND ND NC NC NCaThe dependent variable in columns 1, 4, and 7 is 100 times the number of religious constructions begun in each year normalized to have mean zero and unit variance. The
dependent variable in columns 2, 5, and 8 provides the same metric using secular buildings, whereas the dependent variable in columns 3, 6, and 9 provides the difference betweenthe two. The regressions in columns 4–6 omit all structures associated with death, whereas regressions in columns 7–9 omit those associated with commerce. Regressions use allobservations after 1169 CE and do not include decade or dynasty dummies. Standard errors, assuming the error structure is autocorrelated up to 10 lags and heteroscedastic, arepresented in parentheses. ***, **, and * indicate significance at the 1%, 5%, and 10% levels.
Sample All All ≤1425 ≤1425 Ind. Ind. Ind. Ind. Base BaseDecade dummies No No No No No No Yes Yes Yes YesN 797 797 785 785 528 528 528 528 257 257
aThe dependent variable is a dummy equal to 1 if the sultan at start of Nile year t is replaced in the following year. Throughout, I report 100 times the estimated coefficients.Shock is an indicator variable equal to 1 if the flood residual is in the upper 5% or lower 5% of the flood distribution. Shock5 is an indicator variable equal to 1 if the floodresidual is in the upper 2.5% or lower 2.5% of the flood distribution. Ind. denotes years in which Egypt was not a province of a non-Egyptian based dynasty prior to 1425, whereasBase denotes the baseline sample. Standard errors, assuming the error structure is autocorrelated up to 10 lags and heteroscedastic, are presented in parentheses. ***, **, and *indicate significance at the 1%, 5%, and 10% levels.
p-Value [0�24] [0�01] [0�02] [0�02] [0�08] [0�05]Decade dummies? No Yes No Yes No YesN 266 266 266 266 266 266
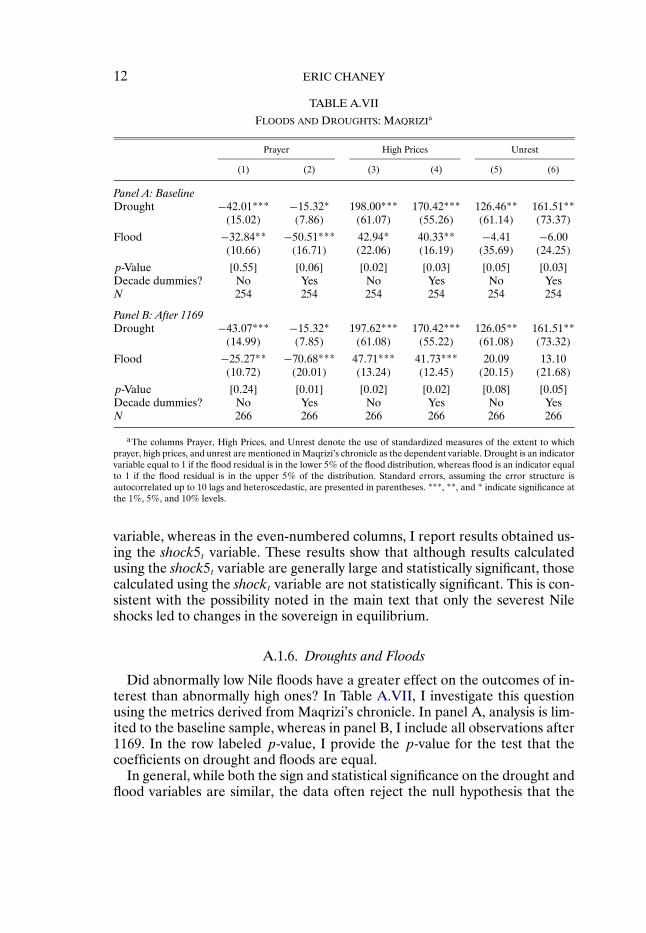
aThe columns Prayer, High Prices, and Unrest denote the use of standardized measures of the extent to whichprayer, high prices, and unrest are mentioned in Maqrizi’s chronicle as the dependent variable. Drought is an indicatorvariable equal to 1 if the flood residual is in the lower 5% of the flood distribution, whereas flood is an indicator equalto 1 if the flood residual is in the upper 5% of the distribution. Standard errors, assuming the error structure isautocorrelated up to 10 lags and heteroscedastic, are presented in parentheses. ***, **, and * indicate significance atthe 1%, 5%, and 10% levels.
variable, whereas in the even-numbered columns, I report results obtained us-ing the shock5t variable. These results show that although results calculatedusing the shock5t variable are generally large and statistically significant, thosecalculated using the shockt variable are not statistically significant. This is con-sistent with the possibility noted in the main text that only the severest Nileshocks led to changes in the sovereign in equilibrium.
A.1.6. Droughts and Floods
Did abnormally low Nile floods have a greater effect on the outcomes of in-terest than abnormally high ones? In Table A.VII, I investigate this questionusing the metrics derived from Maqrizi’s chronicle. In panel A, analysis is lim-ited to the baseline sample, whereas in panel B, I include all observations after1169. In the row labeled p-value, I provide the p-value for the test that thecoefficients on drought and floods are equal.
In general, while both the sign and statistical significance on the drought andflood variables are similar, the data often reject the null hypothesis that the
REVOLT ON THE NILE 13
coefficients on droughts and floods are equal. This suggests that Nile droughtsmay have caused more severe increases in food prices and unrest than Nilefloods. However, the data do not reject the null hypothesis that the effects ofNile floods and droughts on judge dismissal and relative allocations to religiousstructures were equal.
Do these results stand in contradiction? Not necessarily, since it is possiblethat both Nile floods and Nile droughts led the potential for unrest to increaseabove the threshold beyond which the sovereign found it optimal to increaseconcessions to the head judge to a sufficient degree that his replacement prob-ability fell. In other words, it is possible that even for medium amounts of po-tential unrest the sovereign found it optimal to meet the judge’s demands andthat further increases in unrest beyond this threshold had less of an effect onconcessions to the judge. Unfortunately, data limitations render it impossibleto investigate this or other hypotheses regarding the differential effects of Niledroughts and floods with any degree of certainty. For this reason, I have pre-ferred to stress that both Nile droughts and floods seem to have increased thepropensity for unrest and have concentrated on the pooled coefficients.
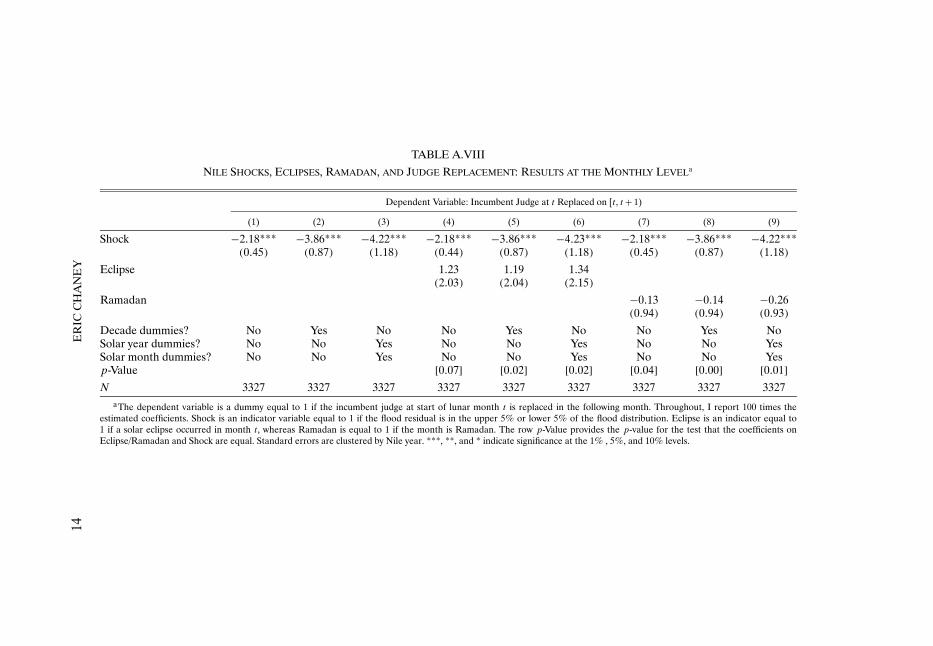
A.1.7. Results by Lunar Months, Eclipses, and Ramadan
In Table A.VIII, I investigate the effects of Nile shocks when the lunar monthis used as the unit of observation on the entire post-1169 sample. In column 1,I regress the judge replacement dummy on the shock variable. In column 2,I add decade dummies, and in column 3, I add solar year and solar monthdummies (recall that the Nile shock variable varies by Nile year). These resultsare qualitatively similar to the results obtained when the Nile year is used asthe unit of observation.
In columns 4–6, I add an indicator equal to 1 if a solar eclipse occurredin a given month.5 Eclipses are thought to have increased religiosity (Akasoy(2007, pp. 394–395)). Thus, if increases in religiosity are generating the results,I would expect to see a negative relationship between eclipses and head judgereplacement. The results, however, are not consistent with this hypothesis.
Finally, in columns 7–9, I add an indicator variable equal to 1 if the monthwas Ramadan. Recent research has found evidence of increases in religiosityduring Ramadan in modern Turkey (Akay, Karabulut, and Martinsson (2011)).Historically this also appears to have been the case. For example, prayersduring Ramadan in the medieval period were believed to be “worth scoresor even hundreds of prayers on normal occasions” (Berkey (2001, p. 47)).Consequently, if increases in religiosity or increases in the demand for reli-gious services were driving the Nile results, one would expect to see significantdecreases in the judge replacement probability during Ramadan. Results incolumns 7–9, however, show that this prediction is not borne out by the data.
5Data on solar eclipses are drawn from Espenak and Meeus (2006) and include all solareclipses (total, annular, partial, and hybrid) that could be seen from Cairo.
14E
RIC
CH
AN
EY
TABLE A.VIII
NILE SHOCKS, ECLIPSES, RAMADAN, AND JUDGE REPLACEMENT: RESULTS AT THE MONTHLY LEVELa
Dependent Variable: Incumbent Judge at t Replaced on [t� t + 1)
Decade dummies? No Yes No No Yes No No Yes NoSolar year dummies? No No Yes No No Yes No No YesSolar month dummies? No No Yes No No Yes No No Yesp-Value [0�07] [0�02] [0�02] [0�04] [0�00] [0�01]N 3327 3327 3327 3327 3327 3327 3327 3327 3327
aThe dependent variable is a dummy equal to 1 if the incumbent judge at start of lunar month t is replaced in the following month. Throughout, I report 100 times theestimated coefficients. Shock is an indicator variable equal to 1 if the flood residual is in the upper 5% or lower 5% of the flood distribution. Eclipse is an indicator equal to1 if a solar eclipse occurred in month t , whereas Ramadan is equal to 1 if the month is Ramadan. The row p-Value provides the p-value for the test that the coefficients onEclipse/Ramadan and Shock are equal. Standard errors are clustered by Nile year. ***, **, and * indicate significance at the 1% , 5%, and 10% levels.
REVOLT ON THE NILE 15
The point estimates on the Ramadan dummy are small in absolute value andnot statistically significant.
A.2. DATA
A.2.1. Lunar and Solar Years
The data sources often use the hijri calendar. Hijri years are lunar years thatconsist of 354 days (355 days in a lunar leap year) and have 12 months thatalternate between 29 and 30 days. The first day of the first hijri year corre-sponds to the solar date July 16th 622 CE (solar years and CE years are usedinterchangeably), the day the Prophet Muhammad made his Hijra or migrationfrom Mecca to Medina. Since the lunar year, hijri, or AH year is approximately11 days shorter than the solar year, the first day of the lunar year slowly “cyclesbackward” through the solar year. Thus, the lunar months have no calendarregularity. This has important implications for the correct assignment of theNile flood data as discussed below.
A.2.2. Nile Flood Data
The historians Ibn al-Hijazi and Taghri Birdi provide two separate sets ofNile flood data. Hijazi’s statistics cover the interval [1, 873] AH, whereas TaghriBirdi’s statistics span the years [20, 855] AH. Both data sets appear to be copiesof the original records kept by the guardian of the nilometer on the island ofRauda. The authors give the yearly maximum and minimum level of the Nileflood by lunar year.
Scholars agree that these data provide credible estimates of the true Nileflood levels and Hijazi’s data have been extensively used in the climatology lit-erature. The data, however, contain two sources of measurement error. First,both data sets have transcription errors. It is straightforward to show that thissource of error attenuates the coefficients of interest under plausible assump-tions. Second, both authors assigned the yearly Nile flood maxima and minimato lunar years. The assignment of the flood levels to lunar years introduces anadditional source of measurement error if left uncorrected.
To better understand this problem, consider the flood that occurred in theyear 1008 CE. Hijazi recorded this flood level as having occurred in the year398 AH, which spanned the solar interval [17 September 1007, 4 September1008]. However, information regarding the maximum Nile flood level began tobe revealed in July. Consequently, if I assigned the flood recorded by Hijaziin 398 AH to that lunar year, only the lunar dates corresponding to the solarinterval [1 July 1008, 4 September 1008] would be correctly assigned. I wouldspuriously assign to the remainder of dates in the lunar year 398 the flood thatoccurred in 1008 CE, when in reality these dates were treated by the Nile floodthat occurred in 1007 CE.
16 ERIC CHANEY
To further complicate matters, neither Hijazi nor Taghri Birdi appears tohave necessarily recorded Nile floods in the lunar year in which the maximumflood level occurred. Hijazi seems to have assigned solar year floods to lunaryears by convention. I use the Toussoun (1925) mapping to assign the floodlevels to the CE year in which they occurred.
Although there is enough information to construct such a mapping for Hi-jazi’s data, it is not possible to determine which solar year flood Taghri Birdirecorded in each lunar year.6 For this reason, I use Hijazi’s data throughoutthe paper.
A.2.3. Head Judge Data
Ibn Hajar (1449 [1998]) provided the month and year of head judge changes.Of the 245 judge changes reported by Ibn Hajar on the interval [20, 10th monthof 842] AH, the year of replacement was available (or could be imputed) for239 changes (98%), and the year and month of replacement were available for209 changes (85%).
Missing replacement dates were imputed as follows. Ibn Hajar (1449 [1998],pp. 4–21) provided a poem that lists Egypt’s judges in chronological order.7
When a judge’s replacement date was missing, I replaced this missing datewith the appointment date of the judge who chronologically followed him inthe poem. When the appointment month/year of the following judge was alsomissing, the replacement month/year was left blank. Judge changes missing themonth but containing the year of change were assigned the month 6.
When there was more than one head judge after 1265 CE, I included thedismissal date of the Shafii judge in the main series (the Shafii school was themost influential in Egypt during the Mamluk era).8 After 1265 CE, I createdthree additional series for the head judges of the three other law schools in anidentical manner to those for the Shafii school.
Since the head judge data do not completely cover the hijri year 842, I dis-card it from the sample. The data set consequently contains 239 judge replace-ments on the interval [20, 841] AH.
Although the head judge change data are given by lunar months and years,Nile floods followed the solar calendar. To correctly assign each Nile flood to
6The mapping from lunar to solar years is made possible in Hijazi’s data by the fact that hegenerally skips every 34th lunar year. Taghri Birdi’s data do not follow such a pattern, makingthe exact mapping between lunar and solar years unclear. See Popper (1951, pp. 123–149) for adetailed discussion.
7A spread sheet that documents the construction of this data set is available on request.8There was also more than one head judge briefly under the Fatimids. During the Fatimid
period, I included the Ismaili (Shia) head judge, since the head judges were generally Ismailiunder the Fatimids.
REVOLT ON THE NILE 17
the lunar months it treated, I developed a mapping from lunar months/yearsto solar months/years using the tables provided in Freeman-Grenville (1995).9
To create the mapping between lunar and solar months, I first calculatedthe percentage of each lunar month occupied by a given solar month. I thenassigned a lunar month to a solar month if the solar month occupied 50% ormore (15 days or more) of the lunar month. When the lunar month was evenlydivided between two solar months, I used the earlier of the two solar months.Sometimes two different lunar months are assigned to one solar month (thatis, one solar month occupied 50% or more of two lunar months).
Equipped with this mapping, I defined a Nile year to run from July throughJune of the solar year (since these were approximately the dates treated byeach Nile flood level). I then assigned the Nile flood from CE year t to thelunar months in the interval [July t, June t + 1].
Throughout much of the analysis I use the Nile year as the unit of obser-vation. Collapsing the monthly data down to the Nile year level was straight-forward. The merged data sets span the interval [20, 841] AH. Since the year841 AH ended on June 23, 1438 CE, the data set contains 797 Nile years [641,1437]. In other words, the data cover the interval [July 641, June 1438] CE.
If regressions are run at the lunar level, there are 9857 observations in the en-tire sample. This number can be understood as follows. If I ran the regressionsat the solar month level, I would have 797∗12 = 9564 observations. Since thereare 293 solar years containing 13 lunar months, the total number of monthlyobservations is 9564 + 293 = 9857.
A.2.4. Other Data
In this section, I explain in detail the construction of the variables that havenot yet been fully explained.
A.2.4.1. Maqrizi Chronicle Data
I used a digitized version of the historian Maqrizi’s chronicle (1364–1442CE) al-Suluk li-Ma’arifat Duwal al-Muluk (available at http://www.al-eman.com) to construct the relevant variables. In this chronicle, Maqrizi—one ofthe most trusted sources for information on Egypt in the period covered by hiswritings—provides a yearly description of events in Egypt.10
The proxy for religiosity is constructed in the spirit of Baker, Bloom, andDavis (2011). I use Microsoft Word’s search function to calculate the numberof times Maqrizi used the Arabic word for prayer (s. alah) in his description of
9I use the Julian calendar as a proxy for the solar (tropical) calendar for simplicity, whilerecognizing that this calendar slowly diverged from the solar calendar. By 1582, this calendar haddiverged from the tropical calendar by 10 days.
10The digitized version of Maqrizi’s chronicle overlaps with the baseline data set on the Nileyear interval [1172, 1437] and provides a narrative of events by lunar year.
the events of each year. I then normalize by the total number of words Maqriziused in his chronicle entry for that year and take the weighted average of thisquantity for the lunar years that overlapped with at least part of a given Nileyear (where the weights are the percentage of the Nile year occupied by therespective lunar year). I then standardize this quantity by subtracting the mean,dividing by the standard deviation, and multiplying by 100.
The proxy for high prices measures the extent to which the word ghala’ ap-pears in each year and is constructed as above. This term refers to a period ofhigh food prices or a rise in such prices (Allouche (1994, pp. 7–12)).
The proxy for unrest is the sum of the number of times Maqrizi used thewords fitna (riot, discord, dissension, or civil strife; Wehr (1980, p. 696)), qital(combat or battle; Wehr (1980, p. 743)), or the root n-h-b (to plunder, loot,or take by force; Wehr (1980, p. 1002)) interacted with an indicator equal to1 if Maqrizi mentions the term ghala’ at least once in that year.11 The firsttwo words attempt to measure unrest broadly and the last word attempts tomeasure looting by the populace (a close reading of Maqrizi’s chronicle sug-gests that his use of the root n-h-b was more likely to refer to looting by thepopulace (rather than by the military) during periods of high prices). It is im-portant to note that since Maqrizi does not use any single term to refer to suchevents, and the nouns and verbs used to denote unrest often have alternativemeanings (for example, fitna can also mean lust), this metric is likely a rougherproxy for the underlying quantities of interest than the other metrics derivedfrom Maqrizi’s chronicle.
A.2.4.2. Sovereign Changes
The months of sovereign changes are drawn from Sami (1916).
A.2.5. Summary Statistics
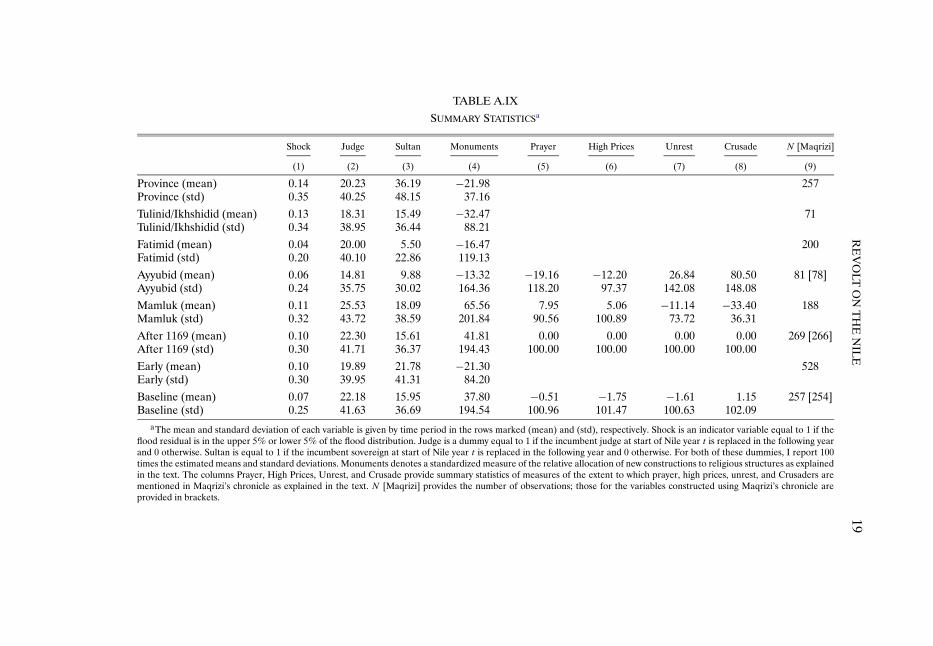
In Table A.IX, I present summary statistics by dynasty when the Nile year isused as the unit of observation. One interesting pattern that emerges from aninspection of Table A.IX is that the probability of a Nile shock was lower dur-ing the Fatimid and Ayyubid dynasties than during other periods. It is possiblethat this pattern is due to long-term variation in Ethiopian rainfall patterns.Also, although the probability of a judge replacement remained roughly con-stant over time, changes in the sovereign of Egypt were more likely duringthe “province dynasty” (when the sovereign was a governor appointed by theCaliph in Medina, Damascus, or Baghdad) and less likely during the Fatimiddynasty.
11Although Wehr (1980) is a dictionary of modern Arabic, these words had similar meaningsin the medieval period. See, for example, Lane (1893 [1984]).
RE
VO
LTO
NT
HE
NIL
E19
TABLE A.IX
SUMMARY STATISTICSa
Shock Judge Sultan Monuments Prayer High Prices Unrest Crusade N [Maqrizi]
aThe mean and standard deviation of each variable is given by time period in the rows marked (mean) and (std), respectively. Shock is an indicator variable equal to 1 if theflood residual is in the upper 5% or lower 5% of the flood distribution. Judge is a dummy equal to 1 if the incumbent judge at start of Nile year t is replaced in the following yearand 0 otherwise. Sultan is equal to 1 if the incumbent sovereign at start of Nile year t is replaced in the following year and 0 otherwise. For both of these dummies, I report 100times the estimated means and standard deviations. Monuments denotes a standardized measure of the relative allocation of new constructions to religious structures as explainedin the text. The columns Prayer, High Prices, Unrest, and Crusade provide summary statistics of measures of the extent to which prayer, high prices, unrest, and Crusaders arementioned in Maqrizi’s chronicle as explained in the text. N [Maqrizi] provides the number of observations; those for the variables constructed using Maqrizi’s chronicle areprovided in brackets.
20 ERIC CHANEY
A.3. DATA AFTER 1517: NILE SHOCKS AND REVOLTS
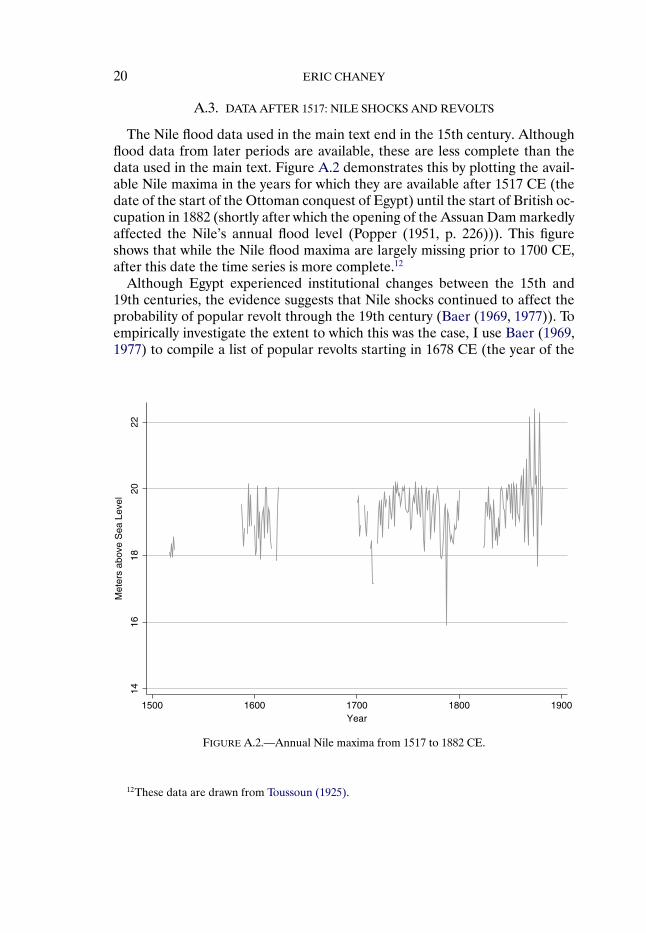
The Nile flood data used in the main text end in the 15th century. Althoughflood data from later periods are available, these are less complete than thedata used in the main text. Figure A.2 demonstrates this by plotting the avail-able Nile maxima in the years for which they are available after 1517 CE (thedate of the start of the Ottoman conquest of Egypt) until the start of British oc-cupation in 1882 (shortly after which the opening of the Assuan Dam markedlyaffected the Nile’s annual flood level (Popper (1951, p. 226))). This figureshows that while the Nile flood maxima are largely missing prior to 1700 CE,after this date the time series is more complete.12
Although Egypt experienced institutional changes between the 15th and19th centuries, the evidence suggests that Nile shocks continued to affect theprobability of popular revolt through the 19th century (Baer (1969, 1977)). Toempirically investigate the extent to which this was the case, I use Baer (1969,1977) to compile a list of popular revolts starting in 1678 CE (the year of the
FIGURE A.2.—Annual Nile maxima from 1517 to 1882 CE.
12These data are drawn from Toussoun (1925).
REVOLT ON THE NILE 21
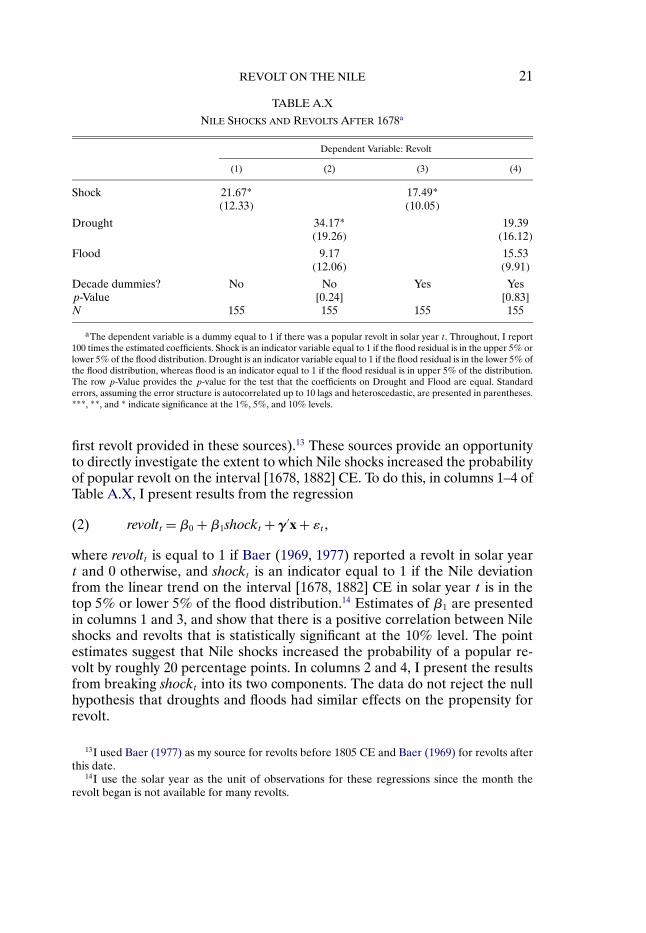
TABLE A.X
NILE SHOCKS AND REVOLTS AFTER 1678a
Dependent Variable: Revolt
(1) (2) (3) (4)
Shock 21�67* 17�49*(12�33) (10�05)
Drought 34�17* 19�39(19�26) (16�12)
Flood 9�17 15�53(12�06) (9�91)
Decade dummies? No No Yes Yesp-Value [0�24] [0�83]N 155 155 155 155
aThe dependent variable is a dummy equal to 1 if there was a popular revolt in solar year t . Throughout, I report100 times the estimated coefficients. Shock is an indicator variable equal to 1 if the flood residual is in the upper 5% orlower 5% of the flood distribution. Drought is an indicator variable equal to 1 if the flood residual is in the lower 5% ofthe flood distribution, whereas flood is an indicator equal to 1 if the flood residual is in upper 5% of the distribution.The row p-Value provides the p-value for the test that the coefficients on Drought and Flood are equal. Standarderrors, assuming the error structure is autocorrelated up to 10 lags and heteroscedastic, are presented in parentheses.***, **, and * indicate significance at the 1%, 5%, and 10% levels.
first revolt provided in these sources).13 These sources provide an opportunityto directly investigate the extent to which Nile shocks increased the probabilityof popular revolt on the interval [1678, 1882] CE. To do this, in columns 1–4 ofTable A.X, I present results from the regression
revoltt = β0 +β1shockt + γ ′x + εt�(2)
where revoltt is equal to 1 if Baer (1969, 1977) reported a revolt in solar yeart and 0 otherwise, and shockt is an indicator equal to 1 if the Nile deviationfrom the linear trend on the interval [1678, 1882] CE in solar year t is in thetop 5% or lower 5% of the flood distribution.14 Estimates of β1 are presentedin columns 1 and 3, and show that there is a positive correlation between Nileshocks and revolts that is statistically significant at the 10% level. The pointestimates suggest that Nile shocks increased the probability of a popular re-volt by roughly 20 percentage points. In columns 2 and 4, I present the resultsfrom breaking shockt into its two components. The data do not reject the nullhypothesis that droughts and floods had similar effects on the propensity forrevolt.
13I used Baer (1977) as my source for revolts before 1805 CE and Baer (1969) for revolts afterthis date.
14I use the solar year as the unit of observations for these regressions since the month therevolt began is not available for many revolts.
22 ERIC CHANEY
Unfortunately, after the Ottoman conquest of Egypt, the head judge wasTurkish, and although it is believed that members of the local religious elitescontinued to play a similar role to that played by the head judge in earlierperiods, there was no equivalent to the earlier position of head judge (Winter(1992, Chapter 4)). Consequently, it is impossible to replicate the head judgeanalysis in this later period.
ADDITIONAL REFERENCES
AKASOY, A. (2007): “Islamic Attitudes to Disasters in the Middle Ages: A Comparison of Earth-quakes and Plagues,” The Medieval History Journal, 10, 387–410. [13]
AKAY, A., G. KARABULUT, AND P. MARTINSSON (2011): “The Effect of Religiosity and ReligiousFestivals on Positional Concerns: An Experimental Investigation of Ramadan,” Report. [13]
ALLOUCHE, A. (1994): Mamluk Economics: A Study and Translation of al-Maqrizi’s Ighatha. SaltLake City: University of Utah Press. [18]
BAER, G. (1969): “Submissiveness and Revolt of the Fellah,” in Studies in the Social History ofModern Egypt. Chicago: University of Chicago Press, 93–108. [20,21]
(1977): “Popular Revolt in Ottoman Cairo,” Der Islam, 54 (2), 213–242. [20,21]BERKEY, J. (2001): Popular Preaching and Religious Authority in the Medieval Islamic Near East.
Seattle: University of Washington Press. [13]ESPENAK, F., AND J. MEEUS (2006): Five Millennium Canon of Solar Eclipses: 2000 BCE to 3000
CE. Washington, DC: National Aeronautics and Space Administration. [13]FREEMAN-GRENVILLE, G. S. P. (1995): The Islamic and Christian Calendars AD 622–2222 (AH
1–1650). Reading: Garnet Publishing. [17]JENKINS, S. (1995): “Easy Estimation Methods for Discrete-Time Duration Models,” Oxford Bul-
letin of Economics and Statistics, 57 (1), 129–138. [1]LANE, E. W. (1893 [1984]): Arabic–English Lexicon. Cambridge: Islamic Texts Society. [18]MEYER, B. (1990): “Unemployment Insurance and Unemployment Spells,” Econometrica, 58 (4),
757–782. [1,3]RAVN, M., AND H. UHLIG (2002): “On Adjusting the Hodrick–Prescott Filter for the Frequency
of Observations,” Review of Economics and Statistics, 84 (2), 371–380. [3]RYU, K. (1994): “Group Duration Analysis of the Proportional Hazard Model: Minimum Chi-
Sqaured Estimators and Specifiation Tests,” Journal of the American Statistical Association, 89(428), 1386–1397. [1]
SAMI, A. (1916): Taqwım al-Nıl. Cairo: Mat.b’a al-‘Amiriya. [18]TOUSSOUN, O. (1925): Memoire sur l’Histoire du Nil. Cairo: Institut français d’archéologie orien-
tale. [16,20]WEHR, H. (1980): A Dictionary of Modern Written Arabic. Beirut: Librairie du Liban. [18]WINTER, M. (1992): Egyptian Society Under Ottoman Rule 1517–1798. New York: Routledge. [22]
Dept. of Economics, Harvard University, Littauer Center, Cambridge, MA02138, U.S.A.; [email protected].
Manuscript received August, 2011; final revision received March, 2013.