PORTUGAL PORTUGAL 1 Application and verification of ECMWF products 2012 Instituto Português do Mar e da Atmosfera, I.P. (IPMA) 1. Summary of major highlights ECMWF products are used as the main source of data for operational medium-range weather forecasting at IPMA. In the short-range ECMWF forecasts are used along with the ones provided by the limited area models ALADIN and AROME, forced by ARPEGE initial and boundary conditions. Validation of forecasts from ECMWF against observations and comparison with ALADIN and AROME forecasts is done operationally. This report presents a sample of results obtained for the period between 2007 and 2013. In 2011/2012 the major highlights in terms of NWP were an application based on forecasts from ECMWF, ALADIN and AROME, which computes the probability of exceeding different thresholds for a selected number of variables from all models, within the same product, and the operational implementation of the ocean wave model Simulating WAves Nearshore (SWAN) for a domain adjacent to Portugal mainland. Recently, an algorithm to detect in-flight icing conditions has been developed based on ECMWF's determinist forecasts of temperature, relative humidity, vertical velocity and cloud water content for each model level below 23,000ft (Belo-Pereira, 2013). The maximum icing intensity for two different layers (1000-11,000ft and 11,000-22,000ft) are determined. The top and bottom altitude (in flight levels) of the severe icing layers are also derived. 2. Use and application of products 2.1 Post-processing of model output 2.1.1 Statistical adaptation Statistical adaptation of ECMWF's forecasts is made to improve daily minimum and maximum temperatures forecasts in selected locations up to 120 hours. This system comprises forecasts from ECMWF as well as from ALADIN and AROME models, whenever available. The application computes MOS and Kalman filter corrected temperatures for each model and the final forecast is then computed as the average of all available forecasts. 2.1.2 Physical adaptation An ALADIN LAM-EPS system is run using LBC and IC provided by all ECMWF's ensemble members. The system runs daily at the ECMWF's c1a machine and results are sent to IPMA headquarters. The forecasts have a resolution of 11 km and are run for 60 hours. A calibration of the LAM-EPS mimics the ECMWF EPS calibration, running operationally every Thursday with the last 18 years and a moving time window of 5 weeks. This allows to access the LAM- EPS climatology and to perform a bias correction of several parameters, namely the two-metre temperature and precipitation on a daily basis. The spectral density of ECMWF limited area ocean-wave model (LAM) is used as initial and boundary conditions to the SWAN model, together with ALADIN's 10 m wind. SWAN is run twice a day for a domain adjacent to Portugal mainland with 0.05º of horizontal resolution, 36 directions and 36 frequencies. Processing of its fields is done for every hour and forecasts are produced until H+72h. The tri-hourly forecasts are also available on IPMA's portal (http://www.ipma.pt/pt/maritima/cartas/).
Transcript
PORTUGAL PORTUGAL
1
Application and verification of ECMWF products 2012 Instituto Português do Mar e da Atmosfera, I.P. (IPMA)
1. Summary of major highlights
ECMWF products are used as the main source of data for operational medium-range weather forecasting at IPMA. In the short-range ECMWF forecasts are used along with the ones provided by the limited area models ALADIN and AROME, forced by ARPEGE initial and boundary conditions. Validation of forecasts from ECMWF against observations and comparison with ALADIN and AROME forecasts is done operationally. This report presents a sample of results obtained for the period between 2007 and 2013.
In 2011/2012 the major highlights in terms of NWP were an application based on forecasts from ECMWF, ALADIN and AROME, which computes the probability of exceeding different thresholds for a selected number of variables from all models, within the same product, and the operational implementation of the ocean wave model Simulating WAves Nearshore (SWAN) for a domain adjacent to Portugal mainland.
Recently, an algorithm to detect in-flight icing conditions has been developed based on ECMWF's determinist forecasts of temperature, relative humidity, vertical velocity and cloud water content for each model level below 23,000ft (Belo-Pereira, 2013). The maximum icing intensity for two different layers (1000-11,000ft and 11,000-22,000ft) are determined. The top and bottom altitude (in flight levels) of the severe icing layers are also derived. 2. Use and application of products 2.1 Post-processing of model output 2.1.1 Statistical adaptation Statistical adaptation of ECMWF's forecasts is made to improve daily minimum and maximum temperatures forecasts in selected locations up to 120 hours. This system comprises forecasts from ECMWF as well as from ALADIN and AROME models, whenever available. The application computes MOS and Kalman filter corrected temperatures for each model and the final forecast is then computed as the average of all available forecasts. 2.1.2 Physical adaptation
An ALADIN LAM-EPS system is run using LBC and IC provided by all ECMWF's ensemble members. The system runs daily at the ECMWF's c1a machine and results are sent to IPMA headquarters. The forecasts have a resolution of 11 km and are run for 60 hours.
A calibration of the LAM-EPS mimics the ECMWF EPS calibration, running operationally every Thursday with the last 18 years and a moving time window of 5 weeks. This allows to access the LAM-EPS climatology and to perform a bias correction of several parameters, namely the two-metre temperature and precipitation on a daily basis.
The spectral density of ECMWF limited area ocean-wave model (LAM) is used as initial and boundary conditions to the SWAN model, together with ALADIN's 10 m wind. SWAN is run twice a day for a domain adjacent to Portugal mainland with 0.05º of horizontal resolution, 36 directions and 36 frequencies. Processing of its fields is done for every hour and forecasts are produced until H+72h. The tri-hourly forecasts are also available on IPMA's portal (http://www.ipma.pt/pt/maritima/cartas/).
PORTUGAL PORTUGAL
2
2.1.3 Derived fields The deterministic forecast from ECMWF is used on a daily basis to produce some derived-processed fields such as the thermal frontal parameter and Q-vector convergence, temperature advection at 850 hPa, vorticity advection at 500 hPa, Total-Totals and Jefferson indices. Several other indices (e.g. Lifted Index) are computed and tephigrams are plotted for selected locations in Portugal. 2.2 Use of products 1h ECMWF forecasts are currently being plotted operationally in meteogram format for selected locations, along with the other NWP models available at IPMA.
Apart from the deterministic forecasts, in the short and medium range, many of the products derived from the ensemble forecasting are used daily and considered to be very beneficial.
The ECMWF monthly forecast is used to produce a bulletin twice a week with outlook on 2 meter air temperature and precipitation for Mainland Portugal for each of the 4 weeks. This bulletin is made available at IPMA's Web page and for external customers if requested, including civil protection authorities. Every week, a draft on the evolution of the anomaly signal of every specific week is performed internally. The SST anomaly has also recently started to be evaluated internally.
The EUROSIP seasonal forecast is used to produce a monthly bulletin with forecasts on the 2 meter air temperature and precipitation for Continental Portugal for each of the 3 quarters of the forecast. This bulletin is made available at IPMA's Web page and for external customers if requested, including civil protection authorities. The anomaly signal for the ECMWF seasonal forecast is also evaluated. Every month, a draft on the evolution of the anomaly signal of every specific quarter is performed internally. 3. Verification of products 3.1 Objective verification 3.1.1 Direct ECMWF model output (both deterministic and EPS) An example of the verification of ECMWF's deterministic forecasts is shown, in figures 1 to 4, for the period of 26 June to 19 August, which starts with the change of ECMWF cycle in 2013. RMSE computations were made for the 00UTC run using 21 main weather stations in Portugal mainland. Results are shown for the most relevant variables and for the years 2012 and 2013. This 6.5 weeks period included 2 heat waves in 2013 in the first 2.5 weeks, which was not the case in 2012, which did not have persistent warm and dry weather, but only some peaks of high temperatures. August 2012 was near normal in temperature, but rainy in the north, against a warm and dry month in 2013. In general, the whole period was less windy in 2013 than in 2012. Therefore, as the predictability of the two periods is different, one should notice that the quality of the forecast cannot be compared directly.
PORTUGAL PORTUGAL
3
Figure 1 – RMSE of MSLP for the period 26 June to 19 August, for the years 2012 (green) and 2013 (blue), for 00 UTC run.
Figure 2 – RMSE of 2 m relative humidity for the period 26 June to 19 August, for the years 2012 (green) and 2013 (blue), for
00 UTC run.
PORTUGAL PORTUGAL
4
Figure 3 – RMSE of 2 m temperature for the period 26 June to 19 August, for the years 2012 (green) and 2013
(blue), for 00 UTC run.
Figure 4 – RMSE of 10 m wind speed for the period 26 June to 19 August, for the years 2012 (green) and 2013 (blue), for 00
UTC run.
Figures 1 to 4 show that, in general, the RMSE of ECMWF's forecasts in 2013 is slightly higher than the one for 2012. This result is similar to the ones computed with ALADIN and AROME models.
The only exception is the 10 m wind speed (also in the 3 models), as the RMSE is smaller in 2013. However, one should be aware that in 2013 the average wind speed in the 21 stations was approximately 0.5 m/s lower than the average observed in 2012.
PORTUGAL PORTUGAL
5
3.1.2 ECMWF model output compared to other NWP models
ECMWF forecasts are compared with the operational limited area models ALADIN and AROME, respectively, with 9 and 2.5 km horizontal resolution.
Figure 5 and 7 show the monthly RMSE of the 2 m minimum temperature and 2 m maximum temperature at day 2, and figures 6 and 8 show the monthly RMSE of the 2 m relative humidity and the 10 m wind speed, both at step H+15. RMSE was computed with 21 weather stations in Portugal mainland, for the period October 2007 until July 2013.
Figure 5 – Monthly RMSE of the 2 m minimum temperature, at forecast day 2, for 00 UTC run.
The RMSE of ECMWF forecasts of 2 m minimum temperatures do not show any annual cycle and its range has been between 1.6ºC and 2.8ºC. In early 2012 the values of the RMSE were high when compared to the ones obtained in previous years, but in the remaining seasons the RMSE was similar or smaller. For most of the time, ECMWF forecasts are better than the limited area models; March 2013 display the lowest errors for any of the models.
Figure 6 – Monthly RMSE of the 2 m maximum temperature, at forecast day 2, for 00 UTC run.
PORTUGAL PORTUGAL
6
In the case of the 2 m maximum temperatures, the RMSE of the ECMWF forecasts is highest in summer, and higher than the other models, due to the model cold bias (not shown). In winter this is no longer an issue as the RMSE is similar to the results obtained with ALADIN and AROME.
The benefit of increased horizontal resolution is clear as the RMSE has been decreasing since 2010, mainly in summer. Finally, the increasingly higher values of RMSE in June and July 2013 can be explained by the large errors observed in a warm period during the second half of June and the whole month of July, when there was a clear warm bias.
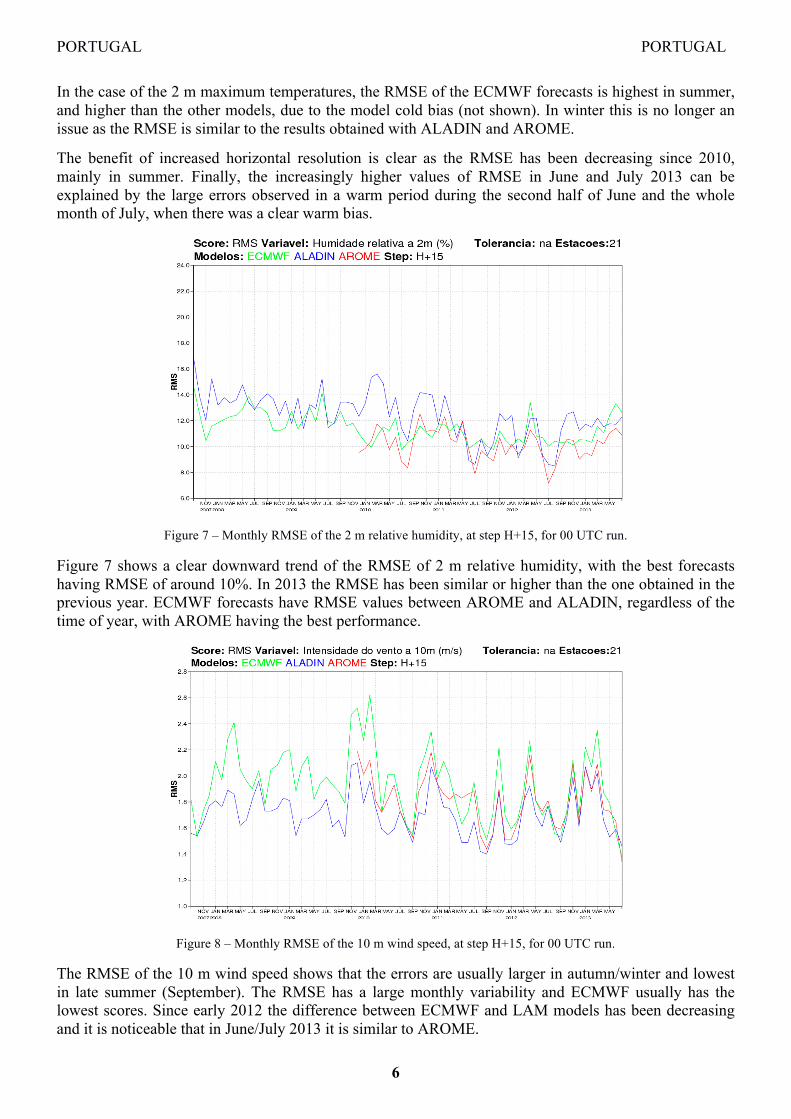
Figure 7 – Monthly RMSE of the 2 m relative humidity, at step H+15, for 00 UTC run.
Figure 7 shows a clear downward trend of the RMSE of 2 m relative humidity, with the best forecasts having RMSE of around 10%. In 2013 the RMSE has been similar or higher than the one obtained in the previous year. ECMWF forecasts have RMSE values between AROME and ALADIN, regardless of the time of year, with AROME having the best performance.
Figure 8 – Monthly RMSE of the 10 m wind speed, at step H+15, for 00 UTC run.
The RMSE of the 10 m wind speed shows that the errors are usually larger in autumn/winter and lowest in late summer (September). The RMSE has a large monthly variability and ECMWF usually has the lowest scores. Since early 2012 the difference between ECMWF and LAM models has been decreasing and it is noticeable that in June/July 2013 it is similar to AROME.
PORTUGAL PORTUGAL
7
3.1.3 Post-processed products An in-flight icing conditions product [1] has been developed based on ECMWF's forecasts and an example is shown in figure 9.
Figure 9 – Icing intensity (left panel) in the layer between 11,000-22,000ft (top) and 1000-11,000ft (bottom). Altitude (in flight levels) of the base (centre panel) and top (right panel) of the severe icing in the layer 11,000-22,000ft (top) and 1000-11,000ft
(bottom). A flight level (FL) 110 corresponds to 11,000 ft.
Figures 10 to 13 show the RMSE of the minimum and maximum temperatures, for the summer of 2012 and winter 2012/13. The scores are valid for the 00 UTC run and 21 weather stations. The plots allow the comparison of direct model output (DMO), MOS and Kalman filter forecasts for three models (ECMWF, ALADIN and AROME). The final forecast (ENS_001_ALL), is computed as the average of all the 6 available MOS and Kalman filter forecasts. Even though it is not shown, the bias of the DMO forecasts varies on a seasonal basis, with some key features common to all the models. The DMO forecasts usually underestimate the maximum temperature (bias between 0 and -1ºC) and are neutral to positive in the case of the minimum temperature (between 0 and 1ºC). The ENS forecasts are neutral, regardless of the range and variable, as the bias is usually in the range between -0.5ºC to 0.5ºC.
PORTUGAL PORTUGAL
8
Figure 10 – RMSE of the 2m minimum temperature, in the summer of 2012. Scores were computed for DMO and statistical
post-processing of ECMWF, ALADIN and AROME forecasts.
Figure 11 – RMSE of the 2m maximum temperature, in the summer of 2012. Scores were computed for DMO and statistical
post-processing of ECMWF, ALADIN and AROME forecasts.
Figure 12 – RMSE of the 2m minimum temperature, in the winter of 2012/13. Scores were computed for DMO and statistical
post-processing of ECMWF, ALADIN and AROME forecasts.
PORTUGAL PORTUGAL
9
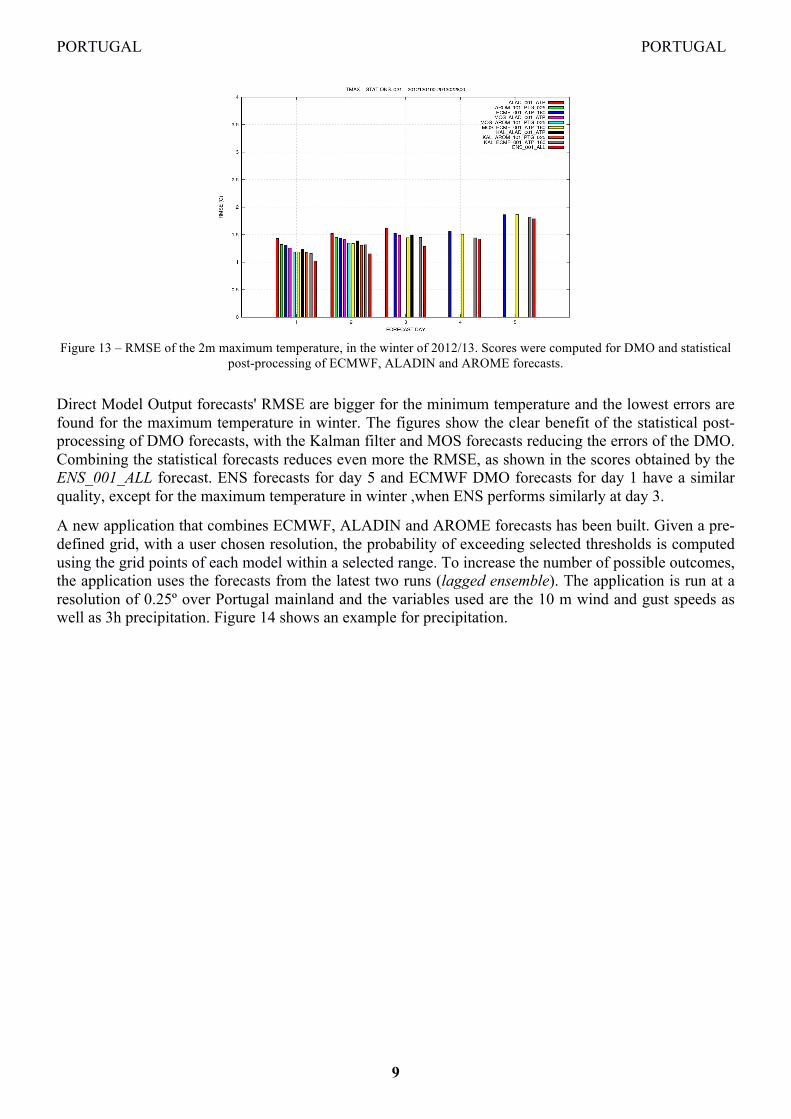
Figure 13 – RMSE of the 2m maximum temperature, in the winter of 2012/13. Scores were computed for DMO and statistical
post-processing of ECMWF, ALADIN and AROME forecasts.
Direct Model Output forecasts' RMSE are bigger for the minimum temperature and the lowest errors are found for the maximum temperature in winter. The figures show the clear benefit of the statistical post-processing of DMO forecasts, with the Kalman filter and MOS forecasts reducing the errors of the DMO. Combining the statistical forecasts reduces even more the RMSE, as shown in the scores obtained by the ENS_001_ALL forecast. ENS forecasts for day 5 and ECMWF DMO forecasts for day 1 have a similar quality, except for the maximum temperature in winter ,when ENS performs similarly at day 3.
A new application that combines ECMWF, ALADIN and AROME forecasts has been built. Given a pre-defined grid, with a user chosen resolution, the probability of exceeding selected thresholds is computed using the grid points of each model within a selected range. To increase the number of possible outcomes, the application uses the forecasts from the latest two runs (lagged ensemble). The application is run at a resolution of 0.25º over Portugal mainland and the variables used are the 10 m wind and gust speeds as well as 3h precipitation. Figure 14 shows an example for precipitation.
PORTUGAL PORTUGAL
10
Figure 14 – Probability of precipitation exceeding the 1 mm/3h, valid at 15UTC (H+39) 14th July 2013. 3.1.4 End products delivered to users 3.2 Subjective verification 3.2.1 Subjective scores (including evaluation of confidence indices when available) 3.2.2 Synoptic studies
Several events of heavy precipitation affecting Madeira Islands occurred during 2010, in January 2011 and recently in the autumn of 2012. Some of these events happened with a strong west/southwestward flow, with the advection of very warm and moist air – atmospheric rivers. ECMWF forecasts were assessed in several events and performed very well in the large scale. However, and as expected due to the coarse resolution of ECMWF, if one takes into account the area studied, even though it provided a useful insight of the intensity of the precipitation, the model clearly underestimates the amounts even at low level locations.
A rapid cyclogenesis event (16 hPa in 6 hours) in the northeast Atlantic in January 18/19th 2012 – storm Gong – caused 1 death, severe damage in mainland Portugal and extensive power failures. The lowest MSLP recorded was 968.2 hPa at 6:50 am on the 19th. The observed maximum wind gust in IPMA's observation network was 140 km/h, but there were reports (from the power utility company) of wind gusts in the 200-220 km/h range at altitudes around 300-500 m in the centre of the country. Even though these values are extreme, the most remarkable feature of this event was the persistence of strong winds (more than 50 km/h), for more than 18 hours in some locations.
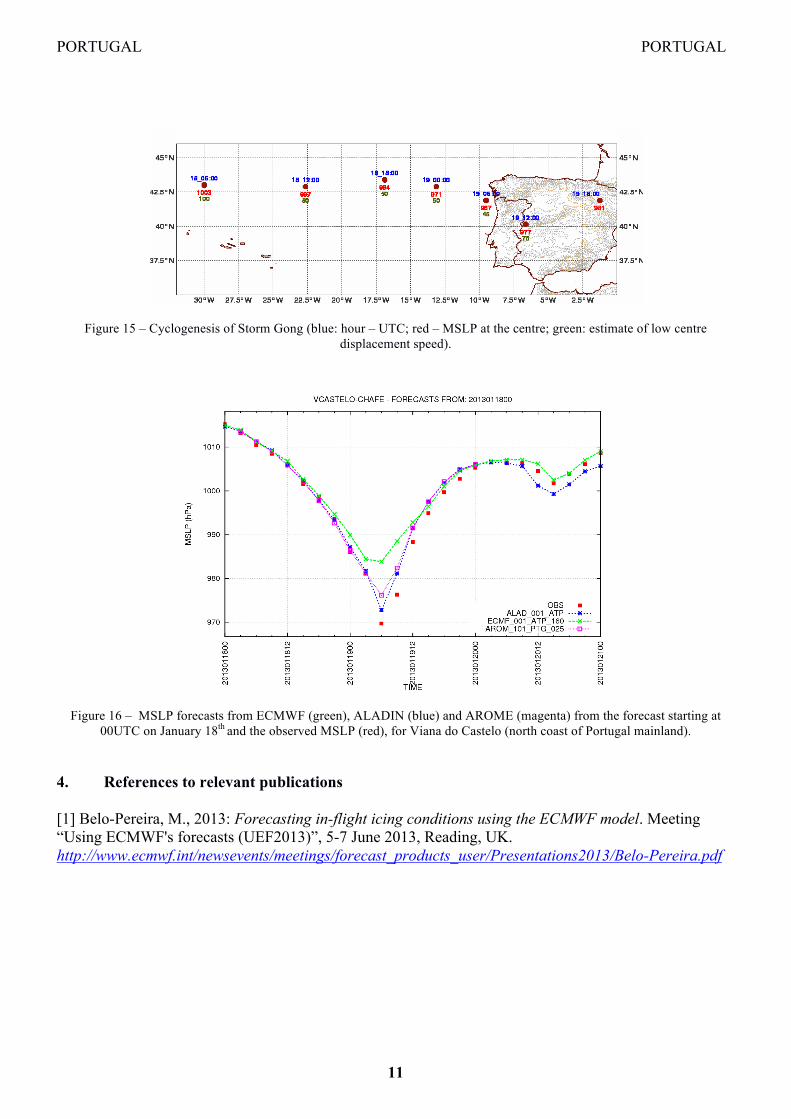
In this event several ECMWF's forecasts underestimated the deepening of the low (figures 15 and 16) and the wind speed/gusts (not shown). Figure 16 shows the MSLP forecasts from ALADIN, AROME and ECMWF from the 00 UTC forecast on January 18th and the observed MSLP, for Viana do Castelo, which is located in the coast in the north of Portugal mainland.
PORTUGAL PORTUGAL
11
Figure 15 – Cyclogenesis of Storm Gong (blue: hour – UTC; red – MSLP at the centre; green: estimate of low centre displacement speed).
Figure 16 – MSLP forecasts from ECMWF (green), ALADIN (blue) and AROME (magenta) from the forecast starting at 00UTC on January 18th and the observed MSLP (red), for Viana do Castelo (north coast of Portugal mainland).
4. References to relevant publications [1] Belo-Pereira, M., 2013: Forecasting in-flight icing conditions using the ECMWF model. Meeting “Using ECMWF's forecasts (UEF2013)”, 5-7 June 2013, Reading, UK. http://www.ecmwf.int/newsevents/meetings/forecast_products_user/Presentations2013/Belo-Pereira.pdf