Application, Network and Link Layer Measurements of Streaming Video over a Wireless Campus Network Feng Li, Jae Chung, Mingzhe Li, Huahui Wu, Mark Claypool, Robert Kinicki {lif,goos,lmz,flashine,claypool,rek}@cs.wpi.edu CS Department at Worcester Polytechnic Institute Worcester, MA, 01609, USA Abstract. The growth of wireless LANs has brought the expectation for high-bitrate streaming video to wireless PCs. However, it remains unknown how to best adapt video to wireless channel characteristics as they degrade. This paper presents results from experiments that stream commercial video over a wireless campus network and analyze perfor- mance across application, network and wireless link layers. Some of the key findings include: 1) Wireless LANs make it difficult for streaming video to gracefully degrade as network performance decreases; 2) Video streams with multiple encoding levels can more readily adapt to degraded wireless network conditions than can clips with a single encoding level; 3) Under degraded wireless network conditions, TCP streaming can provide higher video frame rates than can UDP streaming, but TCP streaming will often result in significantly longer playout durations than will UDP streaming; 4) Current techniques used by streaming media systems to determine effective capacity over wireless LAN are inadequate, resulting in streaming target bitrates significantly higher than can be effectively supported by the wireless network. 1 Introduction The combination of the decrease in price of wireless LAN access points (APs) and the increase in wireless link capacities has prompted a significant increase in the number of wireless networks in homes, corporate enterprise networks, and academic campus networks. The promise of up to 54 Mbps capacity 1 from a wireless AP means that users now expect to see applications such as streaming video that require high bitrates running seamlessly from wired media servers to wireless media clients. Although much is already known about wireless LANs and the individual components of the wireless LAN environment that make the delivery of high- demand applications over wireless a challenge, there has been little effort to integrate measures of wireless link layer performance with streaming media ap- plication layer choices. Such knowledge can facilitate the redesign of streaming 1 IEEE 802.11g
Transcript
Application, Network and Link Layer
Measurements of Streaming Video over a
Wireless Campus Network
Feng Li, Jae Chung, Mingzhe Li, Huahui Wu, Mark Claypool, Robert Kinicki{lif,goos,lmz,flashine,claypool,rek}@cs.wpi.edu
CS Department at Worcester Polytechnic InstituteWorcester, MA, 01609, USA
Abstract. The growth of wireless LANs has brought the expectationfor high-bitrate streaming video to wireless PCs. However, it remainsunknown how to best adapt video to wireless channel characteristics asthey degrade. This paper presents results from experiments that streamcommercial video over a wireless campus network and analyze perfor-mance across application, network and wireless link layers. Some of thekey findings include: 1) Wireless LANs make it difficult for streamingvideo to gracefully degrade as network performance decreases; 2) Videostreams with multiple encoding levels can more readily adapt to degradedwireless network conditions than can clips with a single encoding level; 3)Under degraded wireless network conditions, TCP streaming can providehigher video frame rates than can UDP streaming, but TCP streamingwill often result in significantly longer playout durations than will UDPstreaming; 4) Current techniques used by streaming media systems todetermine effective capacity over wireless LAN are inadequate, resultingin streaming target bitrates significantly higher than can be effectivelysupported by the wireless network.
1 Introduction
The combination of the decrease in price of wireless LAN access points (APs)and the increase in wireless link capacities has prompted a significant increasein the number of wireless networks in homes, corporate enterprise networks, andacademic campus networks. The promise of up to 54 Mbps capacity1 from awireless AP means that users now expect to see applications such as streamingvideo that require high bitrates running seamlessly from wired media servers towireless media clients.
Although much is already known about wireless LANs and the individualcomponents of the wireless LAN environment that make the delivery of high-demand applications over wireless a challenge, there has been little effort tointegrate measures of wireless link layer performance with streaming media ap-plication layer choices. Such knowledge can facilitate the redesign of streaming
1 IEEE 802.11g
2
media systems to account for the trend towards a wireless last hop to clients.Moreover, a better understanding of the impact of wireless LAN transmissioncharacteristics on streaming media is valuable to network practitioners concernedwith providing adequate wireless LAN coverage and discovering trouble spots innetwork performance.
Previous work [8] has shown that streaming products such as RealNetworksand Windows Streaming Media make important decisions concerning the char-acteristics of the video stream prior to streaming the video to a client. Thesedecisions are based on estimates of the underlying network characteristics ob-tained from network probes. However, it remains unclear which wireless channelcharacteristics, such as frame loss rate, signal strength, or link layer bitrate, arethe most useful for streaming media strategies that improve the performanceof a streaming video by adapting video transmission choices to current wirelessnetwork conditions.
A primary goal of this investigation is to correlate wireless link layer behaviorand network layer performance with streaming media application layer perfor-mance. Application layer measurement tools [6] were combined with commer-cially available network layer measurement tools and publicly available IEEE802.11 measurement tools to conduct wireless experiments and integrate themeasurement results. Seeking to characterize the impact of wireless network con-ditions on streamed video performance, this active measurement study considersfour hypothesis:
1. Wireless LANs make it difficult for streaming video to gracefully adapt when
network conditions degrade. This investigation attempts to uncover specificcharacteristics of streams to poor locations that could trigger streamingserver adjustments to improve video transmission quality. Increasing per-formance in poor locations is critical since a streaming wireless client withbad performance can negatively impact other wireless clients connected tothe same AP [1].
2. Videos encoded with multiple levels can stream better than videos encoded
with only a single level when wireless LAN conditions are poor. Commercialmedia encoders allow videos to be encoded with one or more target bitratelevels. When streaming, the server determines which encoding level to usebased on feedback from the client regarding the client end-host networkconditions. A video with multiple levels of encoding should make better useof a wireless LAN with limited capacity than a video with a single level ofencoding.
3. TCP is more effective than UDP for streaming video over wireless LANs.
Commercial media players typically let the client select the streaming trans-port protocol. UDP is often selected due to lower overhead and jitter. How-ever, recent work [4, 5, 11] suggests TCP and TCP-like protocols can be atleast as effective and potentially more effective at providing higher qualityvideo to clients under poor network conditions.
4. Current techniques used by streaming media systems to estimate available
capacity to a wireless LAN client are inadequate for providing the best video
3
performance. Some commercial media players use packet-pair techniques [10]to estimate the capacity along the flow path prior to starting the streamingof the video to the client [8]. However, packet-pair was not designed forwireless networks where changes in transmission conditions cause mid-streamwireless capacity changes. By measuring frame errors and signal strength atthe data link layer during wireless streaming experiments, changes in thewireless environment can be correlated with changes in video performance,and facilitate the development of better wireless capacity estimators.
2 Methodology
2.1 Tools
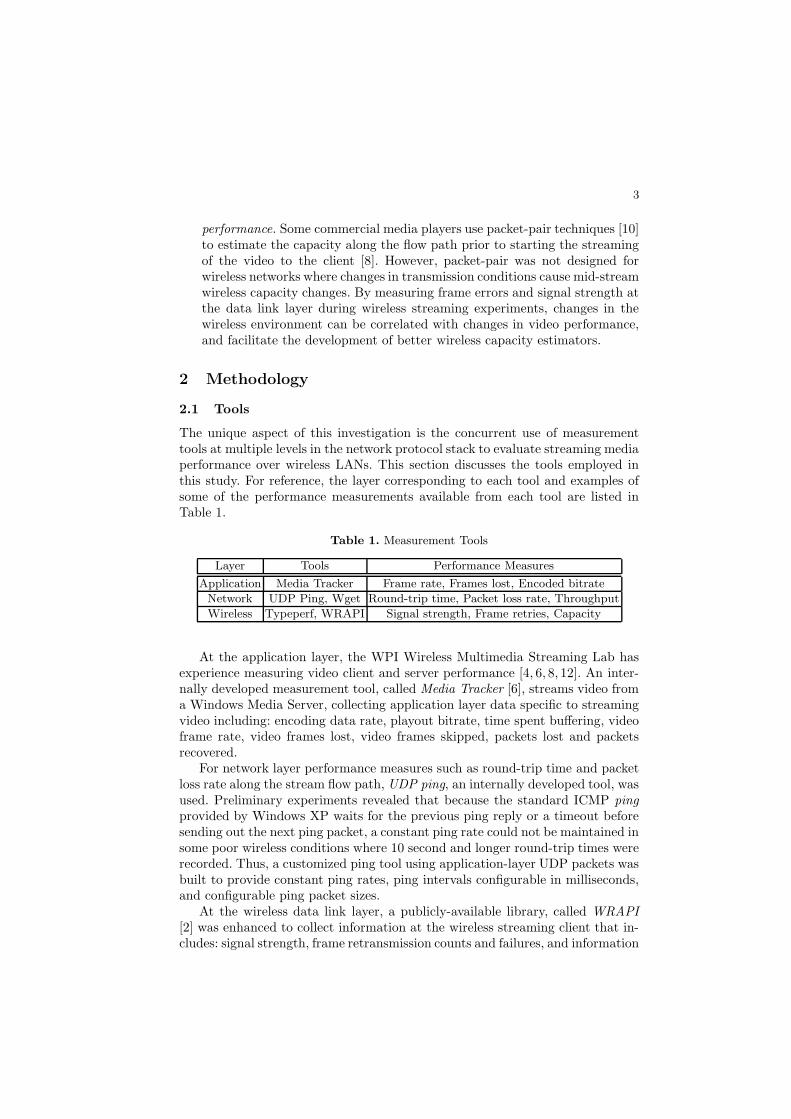
The unique aspect of this investigation is the concurrent use of measurementtools at multiple levels in the network protocol stack to evaluate streaming mediaperformance over wireless LANs. This section discusses the tools employed inthis study. For reference, the layer corresponding to each tool and examples ofsome of the performance measurements available from each tool are listed inTable 1.
Table 1. Measurement Tools
Layer Tools Performance Measures
Application Media Tracker Frame rate, Frames lost, Encoded bitrate
Network UDP Ping, Wget Round-trip time, Packet loss rate, Throughput
Wireless Typeperf, WRAPI Signal strength, Frame retries, Capacity
At the application layer, the WPI Wireless Multimedia Streaming Lab hasexperience measuring video client and server performance [4, 6, 8, 12]. An inter-nally developed measurement tool, called Media Tracker [6], streams video froma Windows Media Server, collecting application layer data specific to streamingvideo including: encoding data rate, playout bitrate, time spent buffering, videoframe rate, video frames lost, video frames skipped, packets lost and packetsrecovered.
For network layer performance measures such as round-trip time and packetloss rate along the stream flow path, UDP ping, an internally developed tool, wasused. Preliminary experiments revealed that because the standard ICMP ping
provided by Windows XP waits for the previous ping reply or a timeout beforesending out the next ping packet, a constant ping rate could not be maintained insome poor wireless conditions where 10 second and longer round-trip times wererecorded. Thus, a customized ping tool using application-layer UDP packets wasbuilt to provide constant ping rates, ping intervals configurable in milliseconds,and configurable ping packet sizes.
At the wireless data link layer, a publicly-available library, called WRAPI
[2] was enhanced to collect information at the wireless streaming client that in-cludes: signal strength, frame retransmission counts and failures, and information
4
about the specific wireless AP that handles the wireless last hop to the client.Additionally, typeperf, a performance monitoring tool built-in to Windows XP,collected processor utilization and network data including data received bitrateand the current wireless target capacity.
Although the above four tools were deployed concurrently on the wirelessstreaming client, baseline measurements indicated these tools consume onlyabout 3% of the processor time. Given that streaming downloads consumedabout 35% of processor time, the assumption is the measurement tools do notsignificantly effect the performance of the streaming downloads to the wirelessclients.
2.2 Experiment Setup
This investigation conducts a series of experiments where video clips are streamedfrom a Windows Media Server over a wired campus network to a wireless stream-ing client at pre-determined locations in the WPI Computer Science Departmentbuilding. As Figure 1 shows, the wireless portion of the WPI campus networkis partitioned from the wired infrastructure. Thus, the assumption is that allvideo streams traverse the same network path except for the last two hops froma common exit off the wired campus LAN to a wireless AP and from the APto the streaming client. The media server runs Windows Media Service v9.0 aspart of the Windows Server 2003 Standard Edition, and the wireless client re-sides on a Dell laptop with a Centrio mobile CPU running Windows XP sp1and an IEEE 802.11g wireless network adaptor based on the Broadcom2 chipset.The WPI wireless LAN uses Airespace3 APs and provides IEEE 802.11 a/b/gwireless service for all the experiments.
Two distinct video clips, known as Coast Guard and Paris, were used in thisstudy. Both clips were encoded to run at 352× 288 resolution and 30 frames persecond. Both clips run for approximately two minutes.4 Coast Guard is a high-motion video clip (5.4% skipped macro blocks) with a camera panning scene ofa moving Coast Guard cutter. Paris is a low-motion video clip (41.2% skippedmacro blocks) with two people sitting and talking with some rapid motion fromtwo small objects in the scene.
Windows Media Server selects the streaming rate based upon the encodedbitrate of the layers in the video clip and an estimate of available capacity forthe bottleneck link along the flow path. During this investigation, two distinctversions of each video were streamed to every client location: a single level versionof the video encoded at 2.5 Mbps to stress the wireless link; and a multiple levelversion that includes eleven encoding layers such that the streaming server hasthe opportunity to do media scaling to dynamically choose the encoded clipto stream based on perceived network capacity. To compare the performanceof standard streaming protocol choices, each of the four videos instances wasstreamed using TCP and repeated using UDP.
2.3 Experiment Design
At the beginning and the end of each experimental instance, the client down-loaded a large file using wget, a publicly-available HTTP/FTP download appli-cation,5 to estimate the effective throughput of a TCP bulk transfer. Thus, eachexperiment consisted of an initial bulk download, eight different video downloads(2 clips (Paris and Coast Guard) × 2 versions (Single Level and Multiple Level)× 2 transport protocols (UDP and TCP)) and a final bulk download. Whileeach video was streamed, the client initiated UDP ping requests to determineround-trip time and packet losses. The UDP ping requests were 200 millisecondsapart, with 1350-byte packets for the single level video and 978-byte packets forthe multiple level video. The choice of packet sizes came from the observationthat 90% of the packets are 1350 bytes and 978 bytes for single level and multiplelevel video, respectively. While streaming, measurement data was also collectedby WRAPI, typeperf and Media Tracker at the client side on a stationary laptop.
Clearly, wireless networking transmission performance is dependent on cur-rent network conditions. To reduce the variability in the network conditions, allthe experiments were conducted during the Winter Break (December 23-25, 2004and December 29-30, 2004) in the Computer Science Department on the WPIcampus. During these testing periods, there was only occasional network activityand virtually no other wireless users in the Computer Science department. Eachexperiment was repeated five times at three distinct locations on three differentfloors in the Computer Science department. Thus the results come from a totalof 45 experimental runs that include 360 video streams. On each floor, an APwas selected to interact with the client laptop. Then, preliminary experiments
4 The median duration of video clips stored on the Internet [7] is 2 minutes.5 http://www.gnu.org/software/wget/wget.html
6
were conducted to find three laptop reception locations for each AP, representinggood, fair, and bad reception locations. It turned out to be difficult to make aclear distinction between bad and fair locations due to high variability in thesignal strength at fair and bad locations.
3 Results
3.1 Data Collected
Ten data sets were removed from the 360 video streaming runs due to wire-less connection failures that caused abnormal streaming terminations. Thus, 350video instances (see Table 2) are included in the analysis of the results.
Table 2. Data Collected
TCP Streaming UDP Streaming Total
Multiple Level Video 86 85 171
Single Level Video 89 90 179
Subtotal 175 175 350
Comparison of the two clips, Paris and Coast Guard, with analysis similar tothe other experimental factors presented in Section 3.2-3.4, produced no statisti-cally significant differences in performance. This suggests that the differences inmotion between the low-motion Paris video and the high-motion Coast Guardvideo did not impact performance over a wireless network. Thus, all subsequentanalysis combines the data obtained for both clips for each of the categories inTable 2.
3.2 Categorization
Figure 2 depicts the throughput obtained versus signal strength for all thestreaming and bulk download instances. The streaming data and the bulk down-load data are separately fit with logarithmic functions. The root mean squarevalue of the deviation of the data from the fitted function6 are 0.49 Mbps and1.47 Mbps for streaming throughput and bulk downloading throughput, respec-tively. Note, there is a “cliff” where throughput degrades suddenly when thesignal strength is between -70 dBm and -80 dBm.
To provide a clearer picture of streaming video behavior, the experimentswere classified by the average signal strength recorded for a download from theserver to the instrumented video client. For the remainder of the analysis, theexperiments are categorized in one of three distinct regions: “Bad” locations (lessthan -75 dBm); “Edge” locations (between -75 and -70 dBm); and “Good” loca-tions (greater -70 dBm).7 This classification facilitates focusing on understanding
6 The stdfit reported from the gnuplot fit function.7 The variance in signal strength is about the same for both Good and Bad locations.
7
0
0.5
1
1.5
2
2.5
-80 -70 -60 -50 -40 -300
2
4
6
8
10
Str
eam
ing
Thr
ough
put (
Mbp
s)
Bul
kdow
nloa
d T
hrou
ghpu
t (M
bps)
Signal Strength (dBm)
StreamingBulkdownloadFit Streaming
Fit Bulkdownload
Fig. 2. Average Wireless Signal Strength versus Average Throughput
0
0.25
0.5
0.75
1
-80 -75 -70 -65 -60 -55 -50 -45 -40 -35 -30
Cum
ulat
ive
Dis
trib
utio
n
Signal Strength (dBm)
Bad
Edge
Good
Fig. 3. CDF of Wireless Signal Strengths
the performance differences between the Good and the Bad locations. Figure 3shows a cumulative distribution function (CDF) of the average signal strengthsgathered and depicts the Good, Edge and Bad regions, with approximately 1/3of the data points in each region.
3.3 Single Level Encoding versus Multi-Level Encoding
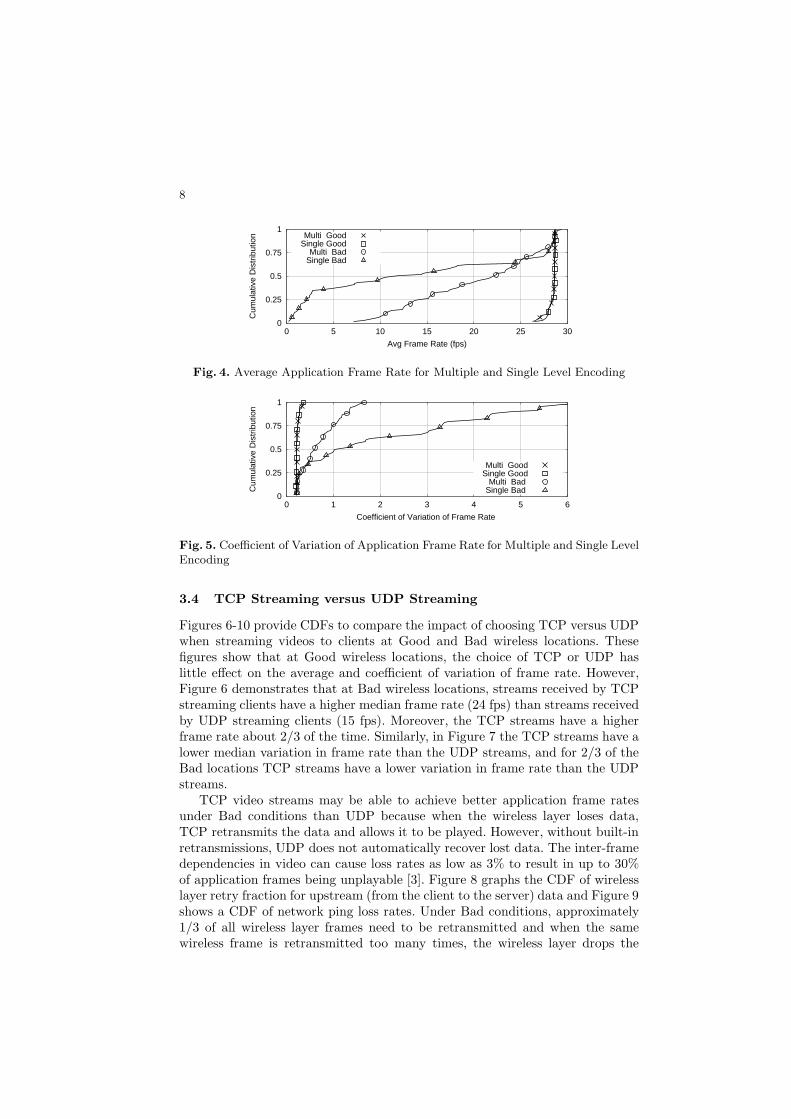
As described in Section 2.1, both video clips were encoded twice, once at a single,high-bandwidth encoded level and again with multiple encoded levels. Figure 4and Figure 5 provide CDFs to compare the impact of the server having multipleencoding levels versus only a single encoding level for wireless streaming. Thesefigures indicate that when the client is at a Good location, the number of encodedlevels has little effect on the average video frame rate and the coefficient ofvariation of the video frame rate. Since a Good wireless connection can generallysupport both the single level and the highest level in the multiple level clip, thestream does not need to be scaled to a lower bitrate.
However, at Bad locations, multiple level encoding provides better streamingperformance than single level encoding. More than 2/3 of the time, the multiplelevel clip has a higher frame rate than the single level clip, and the multiple levelclip has a median frame rate of 22 frames per second compared to a median of11 frames per second for the single level clip.
8
0
0.25
0.5
0.75
1
0 5 10 15 20 25 30
Cum
ulat
ive
Dis
trib
utio
n
Avg Frame Rate (fps)
Multi GoodSingle Good
Multi BadSingle Bad
Fig. 4. Average Application Frame Rate for Multiple and Single Level Encoding
0
0.25
0.5
0.75
1
0 1 2 3 4 5 6
Cum
ulat
ive
Dis
trib
utio
n
Coefficient of Variation of Frame Rate
Multi GoodSingle Good
Multi Bad Single Bad
Fig. 5. Coefficient of Variation of Application Frame Rate for Multiple and Single LevelEncoding
3.4 TCP Streaming versus UDP Streaming
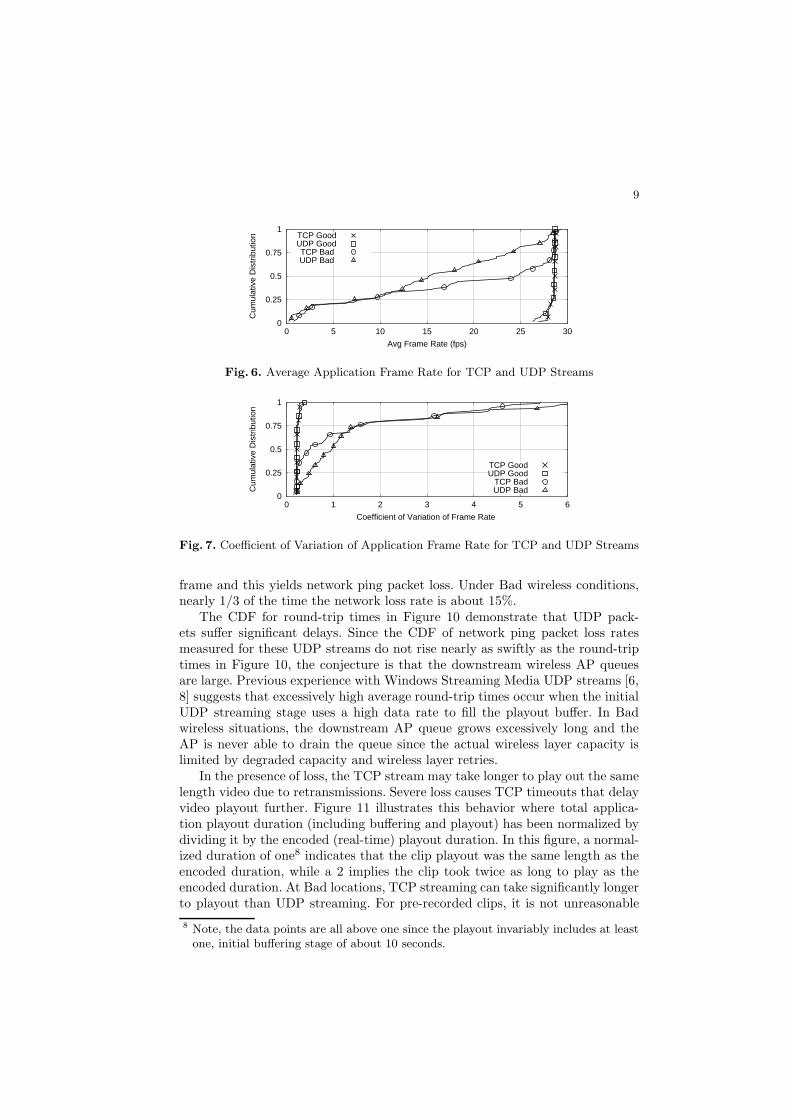
Figures 6-10 provide CDFs to compare the impact of choosing TCP versus UDPwhen streaming videos to clients at Good and Bad wireless locations. Thesefigures show that at Good wireless locations, the choice of TCP or UDP haslittle effect on the average and coefficient of variation of frame rate. However,Figure 6 demonstrates that at Bad wireless locations, streams received by TCPstreaming clients have a higher median frame rate (24 fps) than streams receivedby UDP streaming clients (15 fps). Moreover, the TCP streams have a higherframe rate about 2/3 of the time. Similarly, in Figure 7 the TCP streams have alower median variation in frame rate than the UDP streams, and for 2/3 of theBad locations TCP streams have a lower variation in frame rate than the UDPstreams.
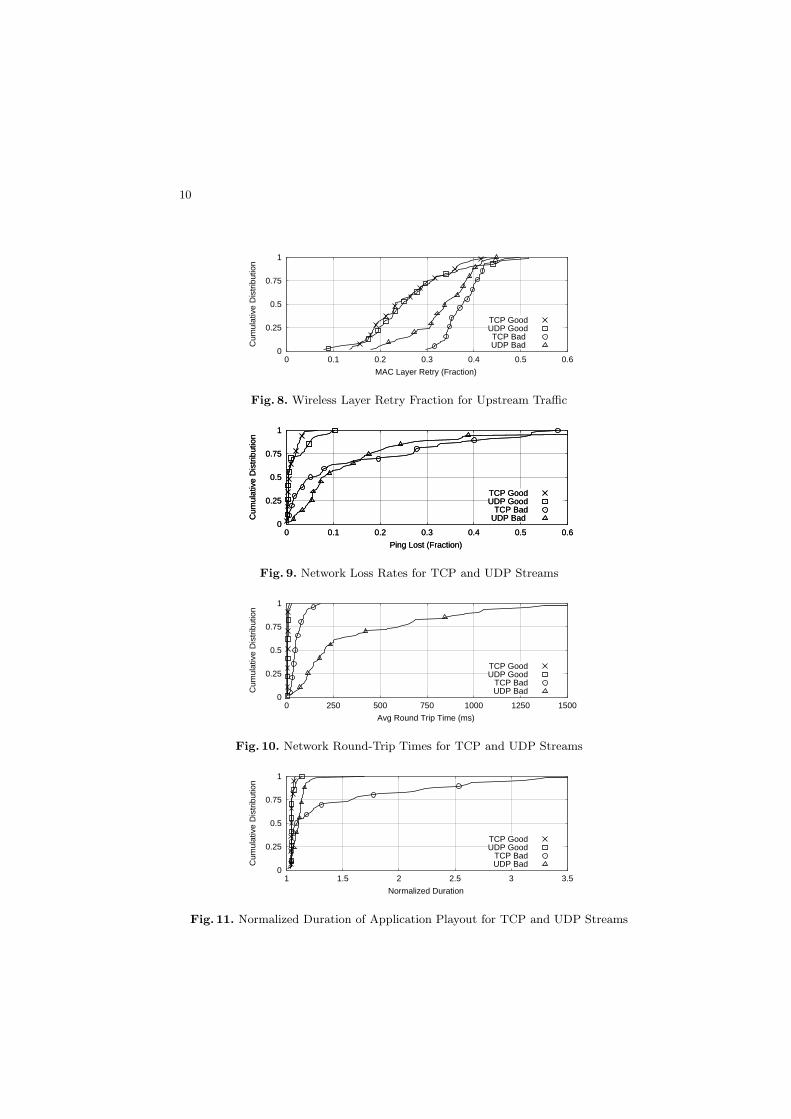
TCP video streams may be able to achieve better application frame ratesunder Bad conditions than UDP because when the wireless layer loses data,TCP retransmits the data and allows it to be played. However, without built-inretransmissions, UDP does not automatically recover lost data. The inter-framedependencies in video can cause loss rates as low as 3% to result in up to 30%of application frames being unplayable [3]. Figure 8 graphs the CDF of wirelesslayer retry fraction for upstream (from the client to the server) data and Figure 9shows a CDF of network ping loss rates. Under Bad conditions, approximately1/3 of all wireless layer frames need to be retransmitted and when the samewireless frame is retransmitted too many times, the wireless layer drops the
9
0
0.25
0.5
0.75
1
0 5 10 15 20 25 30
Cum
ulat
ive
Dis
trib
utio
n
Avg Frame Rate (fps)
TCP Good UDP Good TCP Bad UDP Bad
Fig. 6. Average Application Frame Rate for TCP and UDP Streams
0
0.25
0.5
0.75
1
0 1 2 3 4 5 6
Cum
ulat
ive
Dis
trib
utio
n
Coefficient of Variation of Frame Rate
TCP GoodUDP Good
TCP BadUDP Bad
Fig. 7. Coefficient of Variation of Application Frame Rate for TCP and UDP Streams
frame and this yields network ping packet loss. Under Bad wireless conditions,nearly 1/3 of the time the network loss rate is about 15%.
The CDF for round-trip times in Figure 10 demonstrate that UDP pack-ets suffer significant delays. Since the CDF of network ping packet loss ratesmeasured for these UDP streams do not rise nearly as swiftly as the round-triptimes in Figure 10, the conjecture is that the downstream wireless AP queuesare large. Previous experience with Windows Streaming Media UDP streams [6,8] suggests that excessively high average round-trip times occur when the initialUDP streaming stage uses a high data rate to fill the playout buffer. In Badwireless situations, the downstream AP queue grows excessively long and theAP is never able to drain the queue since the actual wireless layer capacity islimited by degraded capacity and wireless layer retries.
In the presence of loss, the TCP stream may take longer to play out the samelength video due to retransmissions. Severe loss causes TCP timeouts that delayvideo playout further. Figure 11 illustrates this behavior where total applica-tion playout duration (including buffering and playout) has been normalized bydividing it by the encoded (real-time) playout duration. In this figure, a normal-ized duration of one8 indicates that the clip playout was the same length as theencoded duration, while a 2 implies the clip took twice as long to play as theencoded duration. At Bad locations, TCP streaming can take significantly longerto playout than UDP streaming. For pre-recorded clips, it is not unreasonable
8 Note, the data points are all above one since the playout invariably includes at leastone, initial buffering stage of about 10 seconds.
10
0
0.25
0.5
0.75
1
0 0.1 0.2 0.3 0.4 0.5 0.6
Cum
ulat
ive
Dis
trib
utio
n
MAC Layer Retry (Fraction)
TCP GoodUDP GoodTCP Bad UDP Bad
Fig. 8. Wireless Layer Retry Fraction for Upstream Traffic
0
0.25
0.5
0.75
1
0 0.1 0.2 0.3 0.4 0.5 0.6
Cum
ulat
ive
Dis
trib
utio
n
Ping Lost (Fraction)
TCP GoodUDP Good
TCP BadUDP Bad
0
0.25
0.5
0.75
1
0 0.1 0.2 0.3 0.4 0.5 0.6
Cum
ulat
ive
Dis
trib
utio
n
Ping Lost (Fraction)
TCP GoodUDP Good
TCP BadUDP Bad
Fig. 9. Network Loss Rates for TCP and UDP Streams
0
0.25
0.5
0.75
1
0 250 500 750 1000 1250 1500
Cum
ulat
ive
Dis
trib
utio
n
Avg Round Trip Time (ms)
TCP GoodUDP Good
TCP BadUDP Bad
Fig. 10. Network Round-Trip Times for TCP and UDP Streams
0
0.25
0.5
0.75
1
1 1.5 2 2.5 3 3.5
Cum
ulat
ive
Dis
trib
utio
n
Normalized Duration
TCP GoodUDP Good
TCP BadUDP Bad
Fig. 11. Normalized Duration of Application Playout for TCP and UDP Streams
11
to consider a stream duration extended by more than 10% to be unacceptableto users. Using this criteria, approximately 40% of the TCP Bad streams inFigure 11 are unacceptable.
4 The Challenges of Streaming over Wireless
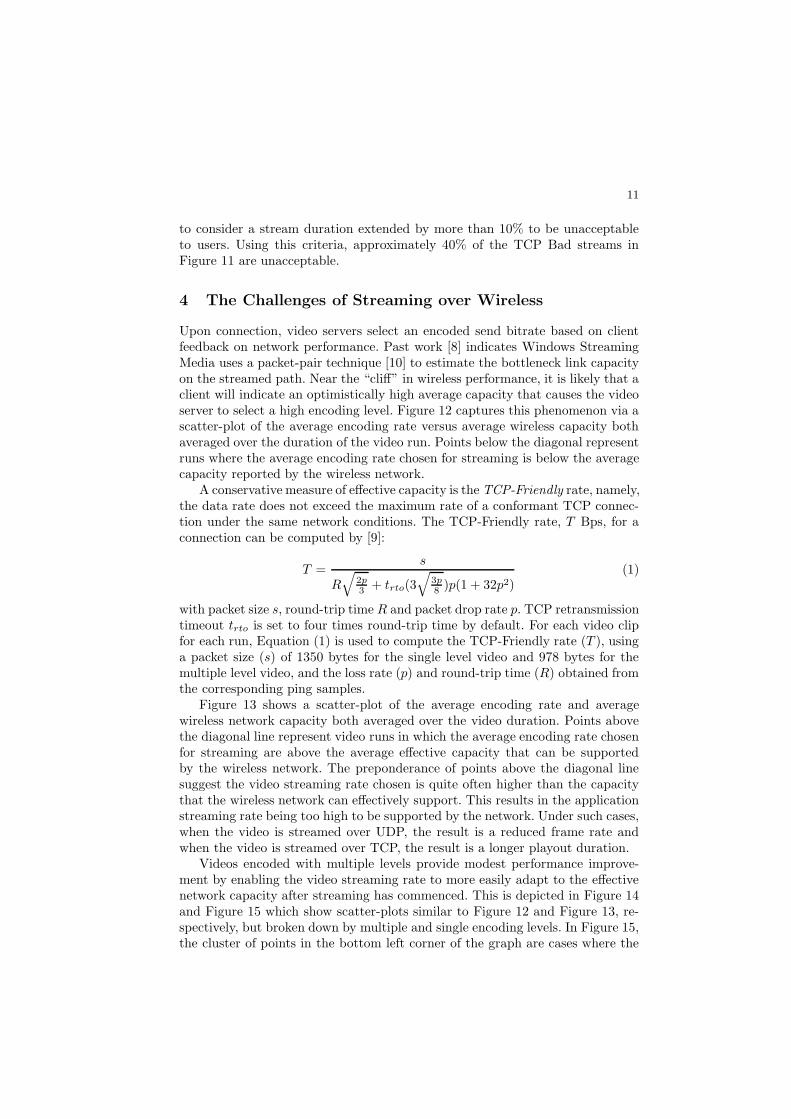
Upon connection, video servers select an encoded send bitrate based on clientfeedback on network performance. Past work [8] indicates Windows StreamingMedia uses a packet-pair technique [10] to estimate the bottleneck link capacityon the streamed path. Near the “cliff” in wireless performance, it is likely that aclient will indicate an optimistically high average capacity that causes the videoserver to select a high encoding level. Figure 12 captures this phenomenon via ascatter-plot of the average encoding rate versus average wireless capacity bothaveraged over the duration of the video run. Points below the diagonal representruns where the average encoding rate chosen for streaming is below the averagecapacity reported by the wireless network.
A conservative measure of effective capacity is the TCP-Friendly rate, namely,the data rate does not exceed the maximum rate of a conformant TCP connec-tion under the same network conditions. The TCP-Friendly rate, T Bps, for aconnection can be computed by [9]:
T =s
R
√
2p
3+ trto(3
√
3p
8)p(1 + 32p2)
(1)
with packet size s, round-trip time R and packet drop rate p. TCP retransmissiontimeout trto is set to four times round-trip time by default. For each video clipfor each run, Equation (1) is used to compute the TCP-Friendly rate (T ), usinga packet size (s) of 1350 bytes for the single level video and 978 bytes for themultiple level video, and the loss rate (p) and round-trip time (R) obtained fromthe corresponding ping samples.
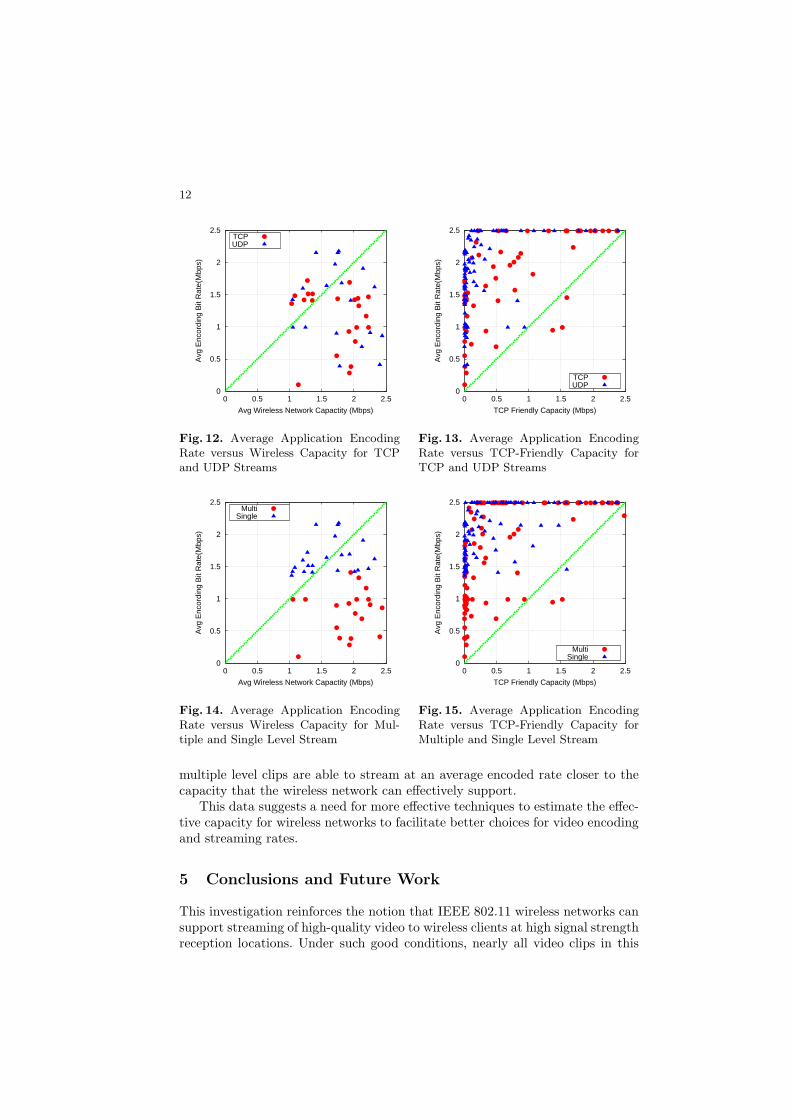
Figure 13 shows a scatter-plot of the average encoding rate and averagewireless network capacity both averaged over the video duration. Points abovethe diagonal line represent video runs in which the average encoding rate chosenfor streaming are above the average effective capacity that can be supportedby the wireless network. The preponderance of points above the diagonal linesuggest the video streaming rate chosen is quite often higher than the capacitythat the wireless network can effectively support. This results in the applicationstreaming rate being too high to be supported by the network. Under such cases,when the video is streamed over UDP, the result is a reduced frame rate andwhen the video is streamed over TCP, the result is a longer playout duration.
Videos encoded with multiple levels provide modest performance improve-ment by enabling the video streaming rate to more easily adapt to the effectivenetwork capacity after streaming has commenced. This is depicted in Figure 14and Figure 15 which show scatter-plots similar to Figure 12 and Figure 13, re-spectively, but broken down by multiple and single encoding levels. In Figure 15,the cluster of points in the bottom left corner of the graph are cases where the
12
0
0.5
1
1.5
2
2.5
0 0.5 1 1.5 2 2.5
Avg
Enc
ordi
ng B
it R
ate(
Mbp
s)
Avg Wireless Network Capactity (Mbps)
TCPUDP
Fig. 12. Average Application EncodingRate versus Wireless Capacity for TCPand UDP Streams
0
0.5
1
1.5
2
2.5
0 0.5 1 1.5 2 2.5
Avg
Enc
ordi
ng B
it R
ate(
Mbp
s)
TCP Friendly Capacity (Mbps)
TCPUDP
Fig. 13. Average Application EncodingRate versus TCP-Friendly Capacity forTCP and UDP Streams
0
0.5
1
1.5
2
2.5
0 0.5 1 1.5 2 2.5
Avg
Enc
ordi
ng B
it R
ate(
Mbp
s)
Avg Wireless Network Capactity (Mbps)
MultiSingle
Fig. 14. Average Application EncodingRate versus Wireless Capacity for Mul-tiple and Single Level Stream
0
0.5
1
1.5
2
2.5
0 0.5 1 1.5 2 2.5
Avg
Enc
ordi
ng B
it R
ate(
Mbp
s)
TCP Friendly Capacity (Mbps)
MultiSingle
Fig. 15. Average Application EncodingRate versus TCP-Friendly Capacity forMultiple and Single Level Stream
multiple level clips are able to stream at an average encoded rate closer to thecapacity that the wireless network can effectively support.
This data suggests a need for more effective techniques to estimate the effec-tive capacity for wireless networks to facilitate better choices for video encodingand streaming rates.
5 Conclusions and Future Work
This investigation reinforces the notion that IEEE 802.11 wireless networks cansupport streaming of high-quality video to wireless clients at high signal strengthreception locations. Under such good conditions, nearly all video clips in this
13
study played out at high frame rates. Moreover, server choices of multiple ver-sus single encoding levels and TCP versus UDP streaming did not significantlyimpact performance at good locations. However, these experiments produce anoticeable cliff such that throughput drops off suddenly when signal strengthdegrades below -75dBm. The bad wireless environment for those experimentsat the bottom of this cliff can be characterized by nearly 50% more retries forwireless MAC layer frames and median packet loss rates over 5%. Under suchbad wireless environments, multiple level videos adapt better to volatile wire-less conditions than videos encoded only at a single level. Under bad conditions,multi-level videos consistently had higher frame rates with a median of 24 ap-plication frame per second, approximately double the median application framerate of single level videos.
At bad client locations, TCP streamed videos usually recorded higher framerates than UDP streamed videos. For the TCP streams, the median of 24 appli-cation frames per second, was approximately 50% higher than the UDP median.The conjecture is that TCP retransmissions reduce network packet loss ratesthat yield more playable frames than UDP when wireless conditions are bad.Unfortunately, this higher TCP frame rate comes at a price, significantly longervideo playout durations. Nearly 20% of the TCP streamed videos to bad clientlocations had the two-minute video clip produce four minute playout durations.Approximately 40% of these TCP videos had playout durations considered tobe intolerable. While UDP streams also experienced extensions in playout du-rations under bad conditions, only 25% of the UDP durations were intolerableand no UDP playout reached a doubled duration in this investigation.
The effective capacities reported by the wireless MAC layer are significantlybelow the capacity the wireless MAC layer is expected to support, and themeasured encoding rate for the streaming video, while lower than the wirelesscapacity, is higher than the effective capacity. The use of multiple encoding lev-els in a video clip partially alleviates this problem, but significant improvementsto streaming performance under bad wireless conditions may require new tech-niques that identify and adapt to challenging wireless transmission situations.
Understanding packet and frame burst loss behavior is also critical to improv-ing multimedia streaming encoding mechanisms designed to protect, correct orconceal video frame errors. Unfortunately, our tool set was unable to captureerror bursts across layers. Developing measurement techniques to capture errorbursts during real streaming events remains an important item for future re-search. Another missing component to improving the strategies used by videoservers to adjust to volatile wireless network conditions is a better understandingof when and how a video server decides to do media scaling. Ongoing researchis to measure the media scaling reaction of media players to changes in wirelessnetwork conditions.
Finally, two other commercial applications, Real Media and QuickTime, arealso major contributors to streaming Internet traffic. However these servers prob-ably behave differently than Media Player and investigations with customizedmeasurement tools for these two application suites are also possible future work.
14
References
1. G. Bai and C. Williamson. The Effects of Mobility on Wireless Media StreamingPerformance. In Proceedings of Wireless Networks and Emerging Technologies(WNET), pages 596–601, July 2004.
2. A. Balachandran and G. Voelker. WRAPI – Real-time Monitoring and Control ofan 802.11 Wireless LAN. Technical report, CS at UCSD, 2004.
3. J. Boyce and R. Gaglianello. Packet Loss Effects on MPEG Video sent over thePublic Internet. In Proceedings of ACM Multimedia, pages 181–190, Bristol,U.K., Sept. 1998.
4. J. Chung, M. Claypool, and Y. Zhu. Measurement of the CongestionResponsiveness of RealPlayer Streaming Video Over UDP. In Proceedings of thePacket Video Workshop (PV), Nantes, France, Apr. 2003.
5. A. Goel, C. Krasic, K. Li, and J. Walpole. Supporting Low Latency TCP-BasedMedia Streams. In Proceedings of the Tenth International Workshop on Qualityof Service (IWQoS), May 2002.
6. M. Li, M. Claypool, and R. Kinicki. MediaPlayer versus RealPlayer – AComparison of Network Turbulence. In Proceedings of the ACM SIGCOMMInternet Measurement Workshop (IMW), pages 131 – 136, Marseille, France,Nov. 2002.
7. M. Li, M. Claypool, R. Kinicki, and J. Nichols. Characteristics of StreamingMedia Stored on the Web. ACM Transactions on Internet Technology (TOIT),2004. (Accepted for publication).
8. J. Nichols, M. Claypool, R. Kinicki, and M. Li. Measurements of the CongestionResponsiveness of Windows Streaming Media. In Proceedings of the 14th ACMInternational Workshop on Network and Operating Systems Support for DigitalAudio and Video (NOSSDAV), June 2004.
9. J. Padhye, V. Firoiu, D. Towsley, and J. Kurose. Modeling TCP Throughput: ASimple Model and Its Empirical Validation. In Proceedings of ACM SIGCOMM,Vancouver, Brisish Columbia, Candada, 1998.
10. R. Prasad, M. Murray, C. Dovrolis, and K. Claffy. Bandwidth Estimation:Metrics, Measurement Techniques, and Tools. IEEE Network,November-December 2003.
11. B. Wang, J. Kurose, P. Shenoy, and D. Towsley. Streaming via TCP: AnAnalytic Performance Study. In Proceedings of ACM Multimedia, Oct. 2004.
12. Y. Wang, M. Claypool, and Z. Zuo. An Empirical Study of RealVideoPerformance Across the Internet. In Proceedings of the ACM SIGCOMMInternet Measurement Workshop (IMW), pages 295 – 309, San Francisco,California, USA, Nov. 2001.