METEOROLOGICAL APPLICATIONS Meteorol. Appl. (2010) Published online in Wiley InterScience (www.interscience.wiley.com) DOI: 10.1002/met.176 Application of Meteosat second generation data towards improving the nowcasting of convective initiation Christopher W. Siewert, a * Marianne Koenig a and John R. Mecikalski b a EUMETSAT, Darmstadt, 64295, Germany b Atmospheric Science Department, University of Alabama in Huntsville, Huntsville, AL, USA ABSTRACT: The prediction of convective initiation (CI) from a satellite perspective provides forecasters with a constant relatively high temporal and convective scale spatial resolution tool to help protect life and property. By monitoring infrared (IR) channel brightness temperatures, their trends and multi-spectral channel differences, the prediction of CI can be accomplished on the 0–1 h timescale. These methods, currently employed on the Geostationary Operational Environmental Satellite (GOES) system, have only recently been explored on the Meteosat Second Generation (MSG) satellite system. The additional channels and derived instability indices available on the MSG satellites may provide additional information useful to the prediction of CI. In this paper a concept is developed and discussed towards the advantages and possible applications of the inclusion of MSG specific IR spectral channels and instability information through the analysis of several convective case events over Central Europe and South Africa. Copyright 2010 Royal Meteorological Society KEY WORDS satellite; nowcasting; convection Received 27 April 2009; Revised 28 October 2009; Accepted 3 November 2009 1. Introduction The use of satellites to predict convection has been ongo- ing for over 40 years (Riehl and Schleusener, 1962; Pur- dom, 1976; Adler and Fenn, 1979; Purdom, 1982; Set- vak and Doswell, 1991; Strabala et al., 1994; Roberts and Rutledge, 2003; Setvak et al., 2003; Mecikalski and Bedka, 2006; Mecikalski et al., 2008; Mackenzie et al., 2010). The use of geostationary satellite imagery, in particular in the study of convection, provides multi- ple advantages. Geostationary satellite data allows for a constant view of the same area with relatively high tem- poral and convective scale spatial resolution. Providing forecasters with satellite data to predict convective ini- tiation (CI), or the first occurrence of a 35 dBZ radar echo at ground level, has been shown to increase signif- icantly the detection CI versus the use of radar alone in National Weather Service offices throughout the United States (Roberts and Rutledge, 2003). With infrared (IR) channel spatial resolutions up to 3 km 2 at nadir and scan times from 5 to 15 min for the Meteosat Second Gen- eration (MSG) satellites (Schmetz et al., 2002), the CI process is well observed at scales from meso-γ to meso- β (2–200 km). Previous efforts have shown that the CI process can be forecast up to 1 h prior to its occurrence through the use of IR satellite data alone (Roberts and Rutledge, 2003; Mecikalski and Bedka, 2006). The framework described in Mecikalski and Bedka (2006) includes the use of eight * Correspondence to: Christopher W. Siewert, EUMETSAT, Darm- stadt, Germany. E-mail: [email protected]‘interest fields’ to forecast the occurrence of CI within the 0 – 1 h timeframe based on IR channel brightness tem- peratures, trends and multi-spectral channel differences. These interest fields were developed for use on the Geo- stationary Operational Environmental Satellite (GOES) system, particularly GOES-12, which provides coverage over the eastern half of the United States. Currently, techniques based on the Mecikalski and Bedka (2006) framework are employed by multiple agencies to detect threats to public safety and aviation in real-time situations (Mecikalski et al., 2007). Recent studies have found that the additional channels on the MSG satellites may provide additional information useful to the prediction of CI over the 0–1 h time frame (Mecikalski et al., 2010). Analyzing the benefits of increased spectral and spatial resolution and employing the techniques described in Mecikalski and Bedka (2006) on the MSG system will be useful in both increasing the ability of forecasters to predict potentially hazardous weather conditions associated with thunderstorms, as well as providing insight into the increased capabilities of the next generation of GOES satellites, whose spectral channels will be similar to those already established on the MSG satellites (Schmetz et al., 2002; Schmit et al., 2005). In this paper a concept is developed and discussed towards the advantages and possible applications of the inclusion of MSG specific interest fields and derived instability indices through the analysis of convective case events over Central Europe and South Africa. Section 2 discusses the data and methods used to analyze the Copyright 2010 Royal Meteorological Society
Transcript
METEOROLOGICAL APPLICATIONSMeteorol. Appl. (2010)Published online in Wiley InterScience(www.interscience.wiley.com) DOI: 10.1002/met.176
Application of Meteosat second generation data towardsimproving the nowcasting of convective initiation
Christopher W. Siewert,a* Marianne Koeniga and John R. Mecikalskiba EUMETSAT, Darmstadt, 64295, Germany
b Atmospheric Science Department, University of Alabama in Huntsville, Huntsville, AL, USA
ABSTRACT: The prediction of convective initiation (CI) from a satellite perspective provides forecasters with a constantrelatively high temporal and convective scale spatial resolution tool to help protect life and property. By monitoringinfrared (IR) channel brightness temperatures, their trends and multi-spectral channel differences, the prediction of CI can beaccomplished on the 0–1 h timescale. These methods, currently employed on the Geostationary Operational EnvironmentalSatellite (GOES) system, have only recently been explored on the Meteosat Second Generation (MSG) satellite system.The additional channels and derived instability indices available on the MSG satellites may provide additional informationuseful to the prediction of CI. In this paper a concept is developed and discussed towards the advantages and possibleapplications of the inclusion of MSG specific IR spectral channels and instability information through the analysis ofseveral convective case events over Central Europe and South Africa. Copyright 2010 Royal Meteorological Society
KEY WORDS satellite; nowcasting; convection
Received 27 April 2009; Revised 28 October 2009; Accepted 3 November 2009
1. Introduction
The use of satellites to predict convection has been ongo-ing for over 40 years (Riehl and Schleusener, 1962; Pur-dom, 1976; Adler and Fenn, 1979; Purdom, 1982; Set-vak and Doswell, 1991; Strabala et al., 1994; Robertsand Rutledge, 2003; Setvak et al., 2003; Mecikalski andBedka, 2006; Mecikalski et al., 2008; Mackenzie et al.,2010). The use of geostationary satellite imagery, inparticular in the study of convection, provides multi-ple advantages. Geostationary satellite data allows for aconstant view of the same area with relatively high tem-poral and convective scale spatial resolution. Providingforecasters with satellite data to predict convective ini-tiation (CI), or the first occurrence of a 35 dBZ radarecho at ground level, has been shown to increase signif-icantly the detection CI versus the use of radar alone inNational Weather Service offices throughout the UnitedStates (Roberts and Rutledge, 2003). With infrared (IR)channel spatial resolutions up to 3 km2 at nadir and scantimes from 5 to 15 min for the Meteosat Second Gen-eration (MSG) satellites (Schmetz et al., 2002), the CIprocess is well observed at scales from meso-γ to meso-β (2–200 km).
Previous efforts have shown that the CI process can beforecast up to 1 h prior to its occurrence through the useof IR satellite data alone (Roberts and Rutledge, 2003;Mecikalski and Bedka, 2006). The framework describedin Mecikalski and Bedka (2006) includes the use of eight
* Correspondence to: Christopher W. Siewert, EUMETSAT, Darm-stadt, Germany. E-mail: [email protected]
‘interest fields’ to forecast the occurrence of CI withinthe 0–1 h timeframe based on IR channel brightness tem-peratures, trends and multi-spectral channel differences.These interest fields were developed for use on the Geo-stationary Operational Environmental Satellite (GOES)system, particularly GOES-12, which provides coverageover the eastern half of the United States. Currently,techniques based on the Mecikalski and Bedka (2006)framework are employed by multiple agencies to detectthreats to public safety and aviation in real-time situations(Mecikalski et al., 2007).
Recent studies have found that the additional channelson the MSG satellites may provide additional informationuseful to the prediction of CI over the 0–1 h timeframe (Mecikalski et al., 2010). Analyzing the benefits ofincreased spectral and spatial resolution and employingthe techniques described in Mecikalski and Bedka (2006)on the MSG system will be useful in both increasingthe ability of forecasters to predict potentially hazardousweather conditions associated with thunderstorms, as wellas providing insight into the increased capabilities ofthe next generation of GOES satellites, whose spectralchannels will be similar to those already established onthe MSG satellites (Schmetz et al., 2002; Schmit et al.,2005).
In this paper a concept is developed and discussedtowards the advantages and possible applications of theinclusion of MSG specific interest fields and derivedinstability indices through the analysis of convective caseevents over Central Europe and South Africa. Section2 discusses the data and methods used to analyze the
Copyright 2010 Royal Meteorological Society
C. W. SIEWERT ET AL.
case events presented and described in detail in Section3. Section 4 presents a brief discussion of the resultsof the study and Section 5 presents the conclusionsdrawn from the results and suggests future work tofurther the understanding of the improvements of CInowcasting.
2. Data and methodology
2.1. MSG satellite
The Spinning Enhanced Visible and Infrared Imager(SEVIRI) on board the MSG-2 (Meteosat-9) satellitecontains 12 spectral channels: 3 visible, 1 near-IRand 8 IR, shown in Table I (Schmetz et al., 2002).Imagery data were provided in-house at the EUMET-SAT facilities located in Darmstadt, Germany. In com-parison, the imager on board the GOES-12 satel-lite contains only one visible and four IR channels,centred at 0.65, 3.9, 6.5, 10.7, and 13.3 µm respec-tively. The additional channels available on the MSG-2 satellite provide a wider range of spectral infor-mation including microphysical information from the1.6 µm (Setvak et al., 2003; Rosenfeld et al., 2008)and 8.7 µm channels (Strabala et al., 1994), as well aswater vapour and ozone measurements from the 7.3and 9.7 µm channels respectively. Also, the 12.0 and13.4 µm channels on SEVIRI allow for an improvedassessment of cloud depth and microphysics (Prata,1989). The recent work by Mecikalski et al. (2010)shows several new insights towards the nowcastingof CI with SEVIRI, in addition to the current infor-mation retrieved from the channels available on theGOES-12 satellite (Setvak and Doswell, 1991; Acker-man, 1996; Schmetz et al., 1997; Roberts and Rutledge,2003; Mecikalski and Bedka, 2006; Mackenzie et al.,2010).
Table I. List of channels available on SEVIRI from Schmetzet al. (2002).
The occurrence of a 35 dBZ radar echo within a growingcumulus cloud suggests a strong correlation with con-tinual development into the mature cumulus stage andprecipitation at the ground (Roberts and Rutledge, 2003).The goal of CI nowcasting is to provide insight intowhich cumulus clouds (out of the typically large popula-tion of these clouds present on a given day) will beginto precipitate with echo intensity ≥35 dBZ, and possi-bly develop in to thunderstorms in the 0–1 h timeframe.Early methods of CI nowcasting were developed using10.8 µm brightness temperature measurements and mon-itoring their 15 and 30 min trends to determine cloud-top heights and growth rates (Roberts and Rutledge,2003). Multi-spectral channel differences such as the6.5–10.8 µm (Ackerman, 1996; Schmetz et al., 1997)and 13.3–10.8 µm (Ellrod, 2004; Mecikalski and Bedka,2006) channel differences and their trends were alsofound to be useful in identifying and diagnosing cloud-top height, width and growth. In combination, Mecikalskiand Bedka (2006) developed eight CI interest fieldsfrom GOES which would be used in conjunction toidentify immature cumulus clouds that would eventuallygrow into mature precipitating cumulus clouds within the0–1 h time-frame. Mecikalski and Bedka (2006) maketheir CI ‘nowcasts’ based on a simple scoring technique,where seven of the eight interest fields must meet theirindividual threshold values for an individual pixel to belabelled a ‘threat’ for CI. These interest fields, shown inTable II, present a variety of physical processes occur-ring within the immature cumulus cloud associated withconvective growth (see Mecikalski and Bedka, 2006).Using various combinations of the interest fields haveshown that this method provides probability of detec-tion (POD) values maximizing around 99%, while falsealarm rates (FAR) minimize near 69% (Mecikalski et al.,2008). It is now recognized that one way to minimizeFARs is to either constrain the satellite estimates of CIprediction with numerical weather prediction- or satellite-based fields (e.g. convective available potential energy,convective inhibition), and/or to treat clusters of pixelsof cumulus clouds as single cumulus ‘objects’. Both ofthese ideas are subjects of ongoing research (see NOAANESDIS ATBD; Mecikalski et al., 2008).
Mecikalski et al. (2010) found that by using IR dataalone the MSG channels provide up to 67 possible CIinterest fields. Upon completion of a detailed correla-tion and principal component analyses, less than halfwere found to be unique indicators (i.e. containing non-redundant information) during the CI process as observedduring the Convective and Orographically-induced Pre-cipitation Study (COPS) field study of 2007 over south-ern Germany and northeastern France (Wulfmeyer et al.,2008; www.cops2007.de). One set of IR fields from MSGthat contain unique information, their mean values andstandard deviations, is shown in Table III. These inter-est fields have been grouped into three categories byMecikalski et al. (2010) based on their ability to describe
Copyright 2010 Royal Meteorological Society Meteorol. Appl. (2010)DOI: 10.1002/met
APPLICATIONS OF METEOSAT SECOND GENERATION DATA
Table II. List of the Mecikalski and Bedka (2006) CI indicators, their physical basis and critical threshold values.
CI interest field Purpose and resolution MB06 critical value
6.5–10.7 µm difference 4 km cloud-top height relative toupper-tropospheric WV weighting function(Schmetz et al., 1997)
−35 to −10 °C
13.3–10.7 µm difference 8 km cloud-top height assessment/updraftwidth
−25 to −5 °C
10.7 µm TB 4 km cloud-top glaciation (Roberts andRutledge, 2003)
−20 < TB < 0 °C
10.7 µm TB drop below 0 °C 4 km cloud-top glaciation (Roberts andRutledge, 2003)
Within prior 30 min
10.7 µm TB time trend (15and 30 min)
4 km cloud-top growth rate/updraft strength(Roberts and Rutledge, 2003)
<−4 °C (15 min)−1 �TB
(30 min)−1 < �TB (15 min)−1
6.5–10.7 µm time trend 4 km multispectral cloud growth >3 °C (15 min)−1
13.3–10.7 µm time trend 8 km multispectral cloud growth >3 °C (15 min)−1
the physical processes they represent as important to theCI process: cloud depth, cloud-top glaciation and updraftstrength. For this study the top 4 interest fields from‘cloud depth’ and ‘cloud-top glaciation’, and the top 5from ‘updraft strength’ were combined with the existing8 CI interest fields developed by Mecikalski and Bedka(2006). Only the top 4 or 5 were used in order to mini-mize the amount of redundancy within the interest fields’representative physical processes.
In the event where an MSG interest field was similarto that from the original Mecikalski and Bedka (2006)study, the threshold values for those interest fields wereleft at the original critical values. Confidence in doingthis was high given that the GOES channels used inthe Mecikalski and Bedka (2006) study are very similarto these MSG channels, in terms of spectral width,and central wavenumber (Schmetz et al., 2002; Schmitet al., 2005). However, in order to determine appropriatethreshold values for the new interest fields, adjustmentswere made to the mean values by adjusting the thresholdvalue up to one standard deviation away from the meanvalue such that the largest population of events wouldbe included and still remain physically explainable. Forexample, the 12.0–10.8 µm channel difference with amean value of −1.08 °C and a standard deviation of1.15 °C was adjusted to have a threshold value of 0 °C,since a positive value in this channel difference wouldretain no physical basis towards CI (Mecikalski andBedka, 2006, and references therein).
In addition to the new interest fields provided by theresults from the Mecikalski et al. (2010) study, MSG-specific operationally produced Global Instability Index(GII) Lifted Index and K-Index (see Koenig and de Con-ing, 2009) convective instability fields were used to iden-tify regions conducive to future convective developmentgiven that sufficient instability exists to support thunder-storms. With the addition of pre-convective state informa-tion, an assessment of the potential ‘strength’ of each CInowcast may be accomplished. This is a unique aspect ofthe present study compared to previous research. In total,19 CI interest fields were used here, which are presented
Table III. List of additional MSG specific interest fields, theirmean values and standard deviations from Mecikalski et al.
along with their physical representation in Table IV. Forthis study it is a requirement that 16 of the 19 interestfields must be met for an individual pixel to be labelled
Copyright 2010 Royal Meteorological Society Meteorol. Appl. (2010)DOI: 10.1002/met
C. W. SIEWERT ET AL.
Table IV. List of the 19 CI interest fields used in this study, their physical basis and critical threshold values.
Interest field Physical basis (Mecikalski et al., 2009a) Critical value
10.8 µm TB Cloud-top height/glaciation −20-0 °C10.8 µm TB drop below 0 °C Cloud-top glaciation Within prior 30 min10.8 µm 15 min trend Cloud growth rate <−4 °C10.8 µm 30 min trend Cloud growth rate <15 min trend6.2–7.3 µm difference Breaking of capping inversion/cloud depth −25-3 °C6.2–10.8 µm difference Cloud height relative to dry air aloft −35-−10 °C6.2–10.8 µm 15 min trend Cloud growth towards dry air aloft >3 °C8.7–10.8 µm difference Cloud-top glaciation −10-0 °C8.7–10.8 µm 30 min trend Cloud-top glaciation growth 0–10 °C12.0–10.8 µm difference Height relative to mid- to upper-troposphere −3-0 °C12.0–10.8 µm 15 min trend Cloud growth toward mid- to upper-troposphere >0 °C12.0–10.8 µm 30 min trend Cloud growth toward mid- to upper-troposphere >0 °C13.4–10.8 µm difference Cloud height/updraft volume −25-−5 °C13.4–10.8 µm 15 min trend Cloud height/updraft volume growth >3 °CTri-channel difference [(8.7–10.8)–(10.8–12.0)] Cloud-top glaciation −10-0 °CTri-channel 15 min trend Cloud-top glaciation growth >0 °CTri-channel 30 min trend Cloud-top glaciation growth >0 °CGII K-index Convective potential >25GII lifted index Convective potential <−2
as a threat for CI, with any pixels meeting 18 or morefields labelled as strong indicators of CI.
2.3. Cloud identification and tracking
In order to identify cloud pixels within a scene, a(convective) cloud masking technique is necessary toboth reduce processing time such that real-time CInowcasts may be made feasibly, as well as help reducefalse-alarm nowcasts. To accomplish this, a simple ‘yes orno’ cloud mask provided operationally by EUMETSAT(Lutz, 2007) was used to determine which pixels wereto be included into the CI nowcasting algorithm. Thismethod, although not as sophisticated as those based oncluster analysis techniques (Nair et al., 1998; Berendeset al., 2008), is readily available to any user of MSG dataand provided in the time periods necessary for real-timenowcasting purposes.
Once a cloud pixel is identified it must be followedthrough 15 and 30 min in which the individual brightnesstemperature and multi-spectral channel difference trendsare to be calculated. The simplest and most computation-ally inexpensive method available to accomplish this isknown as the ‘box-averaging’ method developed by theUniversity of Wisconsin’s Cooperative Institute for Mete-orological Satellite Studies (see NOAA NESDIS ATBD;Mecikalski et al., 2008). In essence, a box of cloud pix-els is expanded around a single cloudy pixel and thatpixel’s individual channel average brightness tempera-ture is based solely on the temperature of the cloudypixels around it within the box, assumed to be represen-tative of that individual cumulus cloud. In this study, a7 × 7 pixel box was used to represent the area in whicha single cloud pixel is expected to move over a 30 mintime period. At nadir this sized box represents a cloudmotion of about 42 km h−1. As the distance from nadir
increases however, the box’s representative cloud motionwill also increase. Also, in order to increase the accuracyof the box-averaging cloud tracking technique, multiple‘risk reduction’ measures are used to eliminate regionsaffected by expanding cloud edges and cirrus contamina-tion (NOAA NESDIS ATBD; Mecikalski et al., 2008).
3. Results
Two events during the year 2008 where significant CItook place will be used for discussion in this study. Thefirst, a severe weather event which included reports oftornado damage and large hail by the European SevereStorms Laboratory’s European Severe Weather Database,occurred over Eastern Germany and the Czech Republicon 31 May 2008. This event will be discussed in detailregarding the individual MSG specific interest fields andthe role they played in affecting the CI nowcasts. Theother case, representing a typical CI event over thesouthern half of Africa during the Southern Hemispheresummer, took place over the eastern half of South Africaduring the month of February 2008 and will be discussedbriefly as a comparison. Each event will be reviewedregarding the periods prior to and during CI based onthe nowcasts produced by both the Mecikalski and Bedka(2006) method and the method described above for MSG.
3.1. 31 May 2008
Beginning at about 1100 UTC on 31 May 2008, con-vection began forming in an area of strong convergenceand orographic lifting along the northern border of theCzech Republic. These convective cells would eventu-ally be linked to reports of heavy rain, large hail, funnelclouds and possible tornado damage in the Czech Repub-lic and eastern Germany in the following hours. These
Copyright 2010 Royal Meteorological Society Meteorol. Appl. (2010)DOI: 10.1002/met
APPLICATIONS OF METEOSAT SECOND GENERATION DATA
(a)
(b)
Figure 1. Images of 31 May 2008 nowcast time period 1100 UTCGlobal Instability Index (GII) derived (a) K-Index and (b) Lifted Index
values.
storms formed very rapidly due to the complex terrainand relatively high instability in the area (Figure 1(a) and(b). Figure 1(a) shows the GII derived K-Index valuesover the region for 1100 UTC. K-Index values reachingnear 35 were seen, which is fairly significant for centralEurope. Similarly, Figure 1(b) shows Lifted Index reach-ing −10° over the same area, suggesting that the potentialfor severe convection is significantly increased. Thesefields, which are available operationally to users of MSGdata, when included into the MSG CI nowcast provideduseful support for an experimental CI strength indicatorthat will be discussed further in the coming sections.
Figure 2(a) and (b) shows examples of the new MSGspecific 6.2–7.3 µm and tri-channel difference inter-est fields developed by Mecikalski et al. (2010). The6.2–7.3 µm channel difference, shown in Figure 2(a),reaches threshold values along the northern border ofthe Czech Republic at this time period. With val-ues exceeding −10 K, the 6.2–7.3 µm channel dif-ference is showing convective cloud tops near tobreaking the capping inversion and promoting furtherdevelopment (Mecikalski et al., 2010). Similarly, the
(a)
(b)
Figure 2. Images of 31 May 2008 nowcast time period 1100 UTC(a) 6.2–7.3 µm channel difference and (b) tri-channel [(8.7–10.8)–
(10.8–12.0)] µm difference.
[(8.7–10.8 µm)–(10.8–12.0 µm)] difference, shown inFigure 2(b), reaches values very near 0 K, which suggestsstrong cloud top glaciation (Mecikalski et al., 2010).
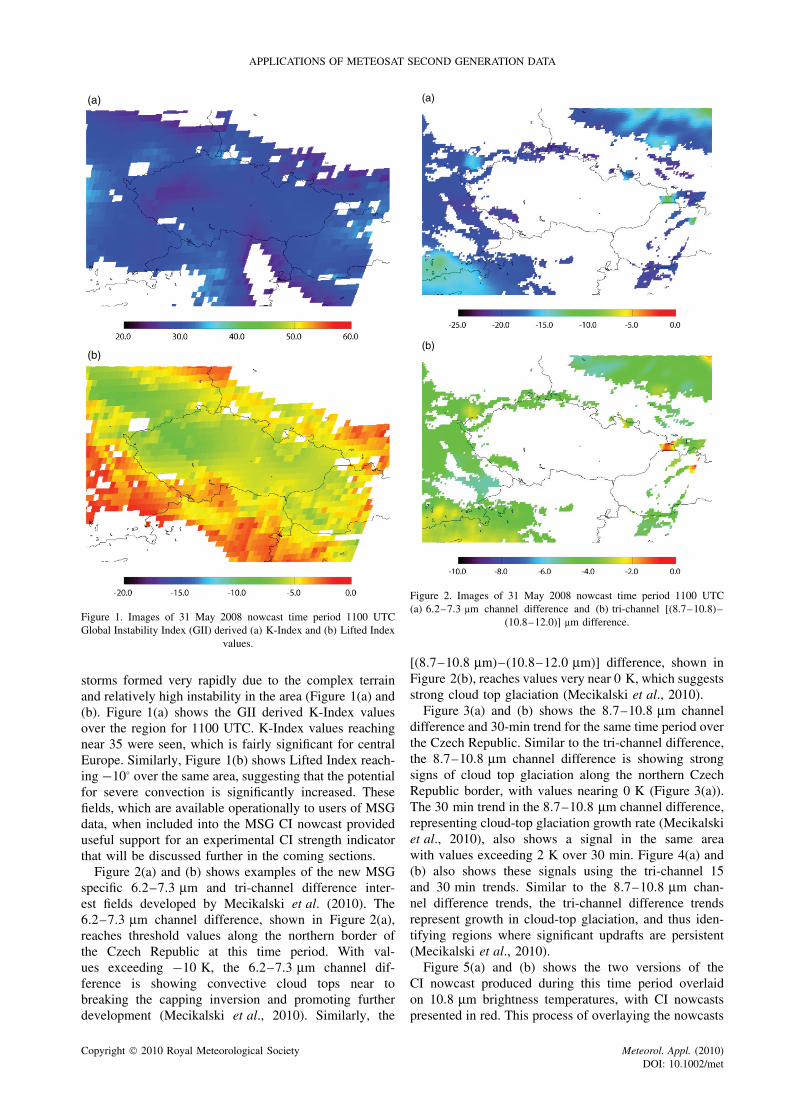
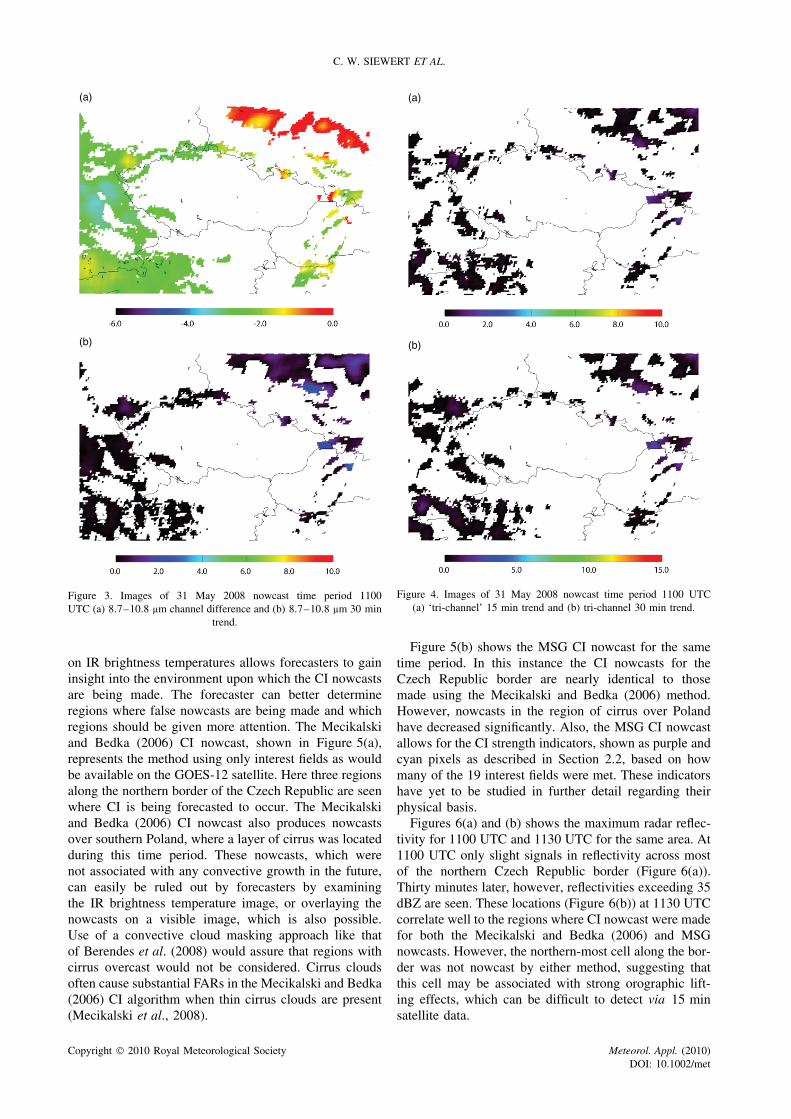
Figure 3(a) and (b) shows the 8.7–10.8 µm channeldifference and 30-min trend for the same time period overthe Czech Republic. Similar to the tri-channel difference,the 8.7–10.8 µm channel difference is showing strongsigns of cloud top glaciation along the northern CzechRepublic border, with values nearing 0 K (Figure 3(a)).The 30 min trend in the 8.7–10.8 µm channel difference,representing cloud-top glaciation growth rate (Mecikalskiet al., 2010), also shows a signal in the same areawith values exceeding 2 K over 30 min. Figure 4(a) and(b) also shows these signals using the tri-channel 15and 30 min trends. Similar to the 8.7–10.8 µm chan-nel difference trends, the tri-channel difference trendsrepresent growth in cloud-top glaciation, and thus iden-tifying regions where significant updrafts are persistent(Mecikalski et al., 2010).
Figure 5(a) and (b) shows the two versions of theCI nowcast produced during this time period overlaidon 10.8 µm brightness temperatures, with CI nowcastspresented in red. This process of overlaying the nowcasts
Copyright 2010 Royal Meteorological Society Meteorol. Appl. (2010)DOI: 10.1002/met
C. W. SIEWERT ET AL.
(a)
(b)
Figure 3. Images of 31 May 2008 nowcast time period 1100UTC (a) 8.7–10.8 µm channel difference and (b) 8.7–10.8 µm 30 min
trend.
on IR brightness temperatures allows forecasters to gaininsight into the environment upon which the CI nowcastsare being made. The forecaster can better determineregions where false nowcasts are being made and whichregions should be given more attention. The Mecikalskiand Bedka (2006) CI nowcast, shown in Figure 5(a),represents the method using only interest fields as wouldbe available on the GOES-12 satellite. Here three regionsalong the northern border of the Czech Republic are seenwhere CI is being forecasted to occur. The Mecikalskiand Bedka (2006) CI nowcast also produces nowcastsover southern Poland, where a layer of cirrus was locatedduring this time period. These nowcasts, which werenot associated with any convective growth in the future,can easily be ruled out by forecasters by examiningthe IR brightness temperature image, or overlaying thenowcasts on a visible image, which is also possible.Use of a convective cloud masking approach like thatof Berendes et al. (2008) would assure that regions withcirrus overcast would not be considered. Cirrus cloudsoften cause substantial FARs in the Mecikalski and Bedka(2006) CI algorithm when thin cirrus clouds are present(Mecikalski et al., 2008).
(a)
(b)
Figure 4. Images of 31 May 2008 nowcast time period 1100 UTC(a) ‘tri-channel’ 15 min trend and (b) tri-channel 30 min trend.
Figure 5(b) shows the MSG CI nowcast for the sametime period. In this instance the CI nowcasts for theCzech Republic border are nearly identical to thosemade using the Mecikalski and Bedka (2006) method.However, nowcasts in the region of cirrus over Polandhave decreased significantly. Also, the MSG CI nowcastallows for the CI strength indicators, shown as purple andcyan pixels as described in Section 2.2, based on howmany of the 19 interest fields were met. These indicatorshave yet to be studied in further detail regarding theirphysical basis.
Figures 6(a) and (b) shows the maximum radar reflec-tivity for 1100 UTC and 1130 UTC for the same area. At1100 UTC only slight signals in reflectivity across mostof the northern Czech Republic border (Figure 6(a)).Thirty minutes later, however, reflectivities exceeding 35dBZ are seen. These locations (Figure 6(b)) at 1130 UTCcorrelate well to the regions where CI nowcast were madefor both the Mecikalski and Bedka (2006) and MSGnowcasts. However, the northern-most cell along the bor-der was not nowcast by either method, suggesting thatthis cell may be associated with strong orographic lift-ing effects, which can be difficult to detect via 15 minsatellite data.
Copyright 2010 Royal Meteorological Society Meteorol. Appl. (2010)DOI: 10.1002/met
APPLICATIONS OF METEOSAT SECOND GENERATION DATA
(a)
(b)
Figure 5. The CI nowcast product overlaid on 10.8 µm brightnesstemperatures for 31 May 2008 at 1100 UTC over the Czech Republicfor the (a) Mecikalski and Bedka (2006) method and (b) using MSG
specific interest fields.
As noted above, the nowcasts for both the Mecikalskiand Bedka (2006) and MSG methods produced verysimilar nowcasts over the area of primary interest alongthe northern border Czech Republic. However, it wasalso noticed that the MSG CI nowcast did reduce falsenowcasts over a region of cirrus with no convectiveinterest. Upon reviewing the entire scene over centralEurope, shown in Figures 7(a) and (b), this effect canbe seen on a much larger scale. The Mecikalski andBedka (2006) method (Figure 7(a)) produces many falsenowcasts, particularly over Poland and France wherecirrus clouds are present. Including the MSG specificinterest fields, shown in Figure 7(b), significantly reducesthese nowcasts over regions where no CI would beexpected to occur during this time period.
3.2. 7 February 2008
The 7 February 2008 case study represents a typicalconvective summertime event over the southern portionsof Africa. These events, which are very common duringSouthern Hemisphere summer due to highly unstableconditions, often contribute to dangerous flooding and
(b)
(a)
Figure 6. Maximum radar reflectivity for 31 May 2008 over the CzechRepublic for (a) 1100 UTC and (b) 1130 UTC. Areas of yellow shadingrepresent maximum reflectivity exceeding 35 dBZ. (Image courtesy of
Martin Setvak).
other severe weather. The lack of radar coverage overmost of Africa makes forecasting and tracking theseevents very difficult, with validation nearly impossible.However, since the MSG satellites continuously viewthis area, a satellite tool to predict and follow convectionwould prove to be very useful. Fortunately, radar data arereadily available from the South African Weather Serviceover the majority of South Africa, which provides a goodtesting ground for satellite CI applications. Similar to thecase discussed previously, two versions of the CI nowcastwere produced and will briefly be discussed.
Figures 8 and 9 show the two CI nowcasts and theappropriate radar images respectively for the 1200 UTCCI nowcast time period. Similar to the 31 May 2008 caseboth CI nowcast methods produce similar results overareas of convective interest, with nowcasting lead timesaround 30 min. However, again it is seen that the MSG CInowcast reduces nowcasted pixels over non-convectiveenvironments where cirrus or stratus may be present,seen in the northeastern-most corners of Figure 8. Thisreduction is due to the additional IR tests applied,and, in effect, convective clouds are the only cases inwhich >12–15 CI indicators can be achieved. Also, this
Copyright 2010 Royal Meteorological Society Meteorol. Appl. (2010)DOI: 10.1002/met
C. W. SIEWERT ET AL.
(a)
(b)
Figure 7. CI nowcast overlaid on 10.8 µm brightness temperatures for31 May 2008 at 1100 UTC over central Europe from the (a) Mecikalskiand Bedka (2006) method and (b) using MSG specific interest fields.
case provides a good look at the CI strength indicatorsprovided by the addition of the GII instability fields(Figure 8(b)). Areas of ‘strong’ CI indicators, or whereall 19 of the interest field thresholds were met and shownas cyan pixels, are bounded by red pixels, where only16 of the 19 CI interest field threshold were met. Thissuggests that there may be some physical basis behindthe CI strength indicators that should be studied further.
4. Discussion
From the analysis of 10 CI case studies over South Africaand central Europe, one of each of which were presentedbriefly above, a concept for which the integration ofMSG specific interest fields into a CI nowcast has beenshown to possibly provide additional information intothe CI nowcasting process in which physical processesleading to development of convection from a satelliteperspective may be better understood. From the 31 May2008 case study example, it was shown that the newMSG specific interest fields do show skill in detectingregions of CI interest. This case study also showed that byadding these MSG specific interest fields, false CI alarms
(a)
(b)
Figure 8. The CI nowcast product overlaid on 10.8 µm brightnesstemperatures for 7 February 2008 at 1030 UTC over South Africafor the (a) Mecikalski and Bedka (2006) method and (b) using MSG
specific interest fields.
over regions where convection is not likely to occurwere significantly reduced. The specific amount of thisreduction is not known and should be quantified furtherover a much larger dataset to draw conclusions. However,visual analysis of the larger region during this and othercases used in this study suggests that it may easily bepossible to reduce overall false alarms by 5% or more.
The 7 February 2008 case study showed an exampleof how these methods may be used over the Africancontinent, where radar coverage is scarce. Again, it wasshown that including the MSG specific interest fields didslightly reduce false alarms over the area of interest.The 7 February 2008 case study also provided a goodexample of the possibilities for further understandingof the physical processes of CI from the CI strengthindicators. Techniques for implementing a CI ‘severity’nowcasts should be tested further.
5. Conclusions
The prediction of CI on the 0–1 h time frame from ageostationary satellite prospective provides a valuable
Copyright 2010 Royal Meteorological Society Meteorol. Appl. (2010)DOI: 10.1002/met
APPLICATIONS OF METEOSAT SECOND GENERATION DATA
(b)
(a)
Figure 9. Maximum radar reflectivity for 7 February 2008 over SouthAfrica for (a) 1030 UTC and (b) 1100 UTC. (Image courtesy of the
South African Weather Service).
tool for operational forecasters to help protect bothlife and property, particularly over regions where radardata are limited or not available. A scoring based CInowcasting product has been developed by Mecikalskiand Bedka (2006) for use on the GOES system and thispaper’s goal was to assess the possible improvementsthat including MSG specific interest fields developedby Mecikalski et al. (2010) may provide. Through theanalysis of 10 case studies over central Europe andSouth Africa it has been shown that by including MSGspecific interest fields provides similar CI nowcastingability to those provided by the proven Mecikalski andBedka (2006) method over regions of convective interest.The inclusion of these MSG specific interest fields alsoshowed a significant reduction in false CI alarms over theMecikalski and Bedka (2006) method where convectionwould not likely occur, however, this exact amount is
yet to be determined. The reduction in false alarms islikely caused by the fact that only convective cloudspass many tests for cloud depth, cloud-top glaciation,and updraft strength. It may also be possible to makemore physical-based CI ‘severity’ nowcasts by includingthe additional interest fields. However, the physical basisand performance of these CI severity nowcasts must bestudied in further detail.
An external study contract has been put in place tovalidate these findings over Europe using the techniquesdescribed in this paper. This follow-on study will includethe use of radar, lightning and severe storm reports fromthe European Severe Storm Laboratory to validate con-vective initiation detection and identify signals conduciveto the occurrence of severe weather and lightning. Also,it is expected that the ability to detect the onset of con-vective initiation and other weather phenomena by useof techniques based on satellite data are expected togreatly improve once the next generation of geostation-ary satellites (GOES-R and Meteosat Third Generation)is launched within the next decade.
Acknowledgements
The authors would like to thank Johannes Schmetz fromEUMETSAT for providing support for this research. Theauthors would also like to thank Kristopher Bedka fromthe University of Wisconsin’s Cooperative Institute forMeteorological Satellite Studies for providing assistancewith the CI algorithm. The authors also thank Hans-Joachim Lutz and Phillip Watts from EUMETSAT forproviding data processing for the cloud mask used in thisstudy.
References
Ackerman S. 1996. Global satellite observations of negative brightnesstemperature differences between 11 and 6.7 µm. Journal of theAtmospheric Sciences 53: 2803–2812.
Adler RF, Fenn DD. 1979. Thunderstorm intensity as determined fromsatellite data. Journal of Applied Meteorology 18: 502–517.
Berendes TA, Mecikalski JR, Mackenzie WM Jr., Bedka, KM, NairUS. 2008. Convective cloud identification and classificationin daytime satellite imagery using standard deviation limitedadaptive clustering. Journal of Geophysical Research 113: D20207,DOI:10.1029/2008JD010287.
Ellrod GP. 2004. Loss of the 12 µm “Split Window” band on GOES-M: impacts on volcanic ash detection. Journal Volcanic GeothermalResearch 135(1–2): 91–103.
Koenig M, de Coning E. 2009. The MSG global instability indicesproduct and its use as a nowcasting tool. Weather and Forecasting24: 272–285.
Lutz HJ. 2007. Cloud detection for MSG – algorithm theoreticalbasis document, EUM/MET/REP/07/0132, 26 pp. Available atwww.eumetsat.int. Accessed 2007.
Mackenzie WM Jr, Harris RT, Siewert CW, Mecikalski JR. 2010.Convective and lightning initiation estimation based on use ofthe GOES 3.9 micron channel. Journal of Geophysical Research(Submitted).
Mecikalski JR, Bedka KM. 2006. Forecasting convective initiation bymonitoring the evolution of moving cumulus in daytime GOESimagery. Monthly Weather Review 134: 49–78.
Mecikalski JR, Bedka KM, Paech SJ, Litten LA. 2008. A statisticalevaluation of GOES cloud-top properties for nowcasting convectiveinitiation. Monthly Weather Review 136: 4899–4914.
Mecikalski JR, Feltz WF, Murray JJ, Johnson DB, Bedka KM,Bedka ST, Wimmers AJ, Pavolonis M, Berendes TA, Haggerty J,
Copyright 2010 Royal Meteorological Society Meteorol. Appl. (2010)DOI: 10.1002/met
C. W. SIEWERT ET AL.
Minnis P, Bernstein B, Williams E. 2007. Aviation applications forsatellite-based observations of cloud properties, convection initiation,in-flight icing, turbulence, and volcanic ash. Bulletin of the AmericanMeteorological Society 88: 1589–1607.
Mecikalski JR, Mackenzie WM Jr, Bedka, KM. 2008. Algorithm forConvective Initiation for GOES-R. NOAA NESDIS AlgorithmTheoretical Basis Document. 30pp.
Mecikalski JR, Mackenzie WM Jr, Koenig M, Muller SA. 2010.Cloud-top properties of growing cumulus prior to convectiveinitiation as measured by Meteosat Second Generation. Part 1.Infrared fields. Journal of Applied Meteorology and Climatology (inpress).
Nair U, Weger R, Kuo K, Welch R 1998. Clustering, randomness, andregularity in cloud fields 5. The nature of regular cumulus cloudfields. Journal of Geophysical Research 103(D10): 11363–11380.
Prata AJ. 1989. Observations of volcanic ash clouds in the 10–12 µmwindow using AVHRR/2 data. International Journal of RemoteSensing 10: 751–761.
Purdom JFW. 1976. Some uses of high-resolution GOES imagery inthe mesoscale forecasting of convection and its behaviour. MonthlyWeather Review 104: 1474–1483.
Purdom JFW. 1982. Subjective interpretation of geostationary satellitedata for nowcasting. In Nowcasting, Browning KA (ed.). AcademicPress: St Louis, USA; 149–166.
Riehl H, Schleusener RA. 1962. On identification of hail bearingclouds from satellite photographs. Atmospheric Science TechnicalPaper, No. 27. Colorado State University: Fort Collins, Co; 7pp.
Roberts RD, Rutledge S. 2003. Nowcasting storm initiation and growthusing GOES-8 and WSR-88D data. Weather and Forecasting 18:562–584.
Rosenfeld D, Woodley WL, Lerner A, Kelman G, Lindsey DT.2008. Satellite detection of severe convective storms by their
retrieved vertical profiles of cloud particle effective radius andthermodynamic phase. Journal of Geophysical Research 113:D04208, DOI:10.1029/2007JD008600.
Schmetz J, Pili P, Tjemkes S, Just D, Kerkmann J, Rota S, Ratier A.2002. An introduction to Meteosat Second Generation (MSG).Bulletin of the American Meteorological Society 83: 977–992.
Schmetz J, Tjemkes SA, Gube M, van de Berg L. 1997. Monitoringdeep convection and convective overshooting with METEOSAT.Advances in Space Research 19: 433–441.
Schmit TJ, Gunshor MM, Menzel WP, Gurka JJ, Li J, Bachmeier AS.2005. Introducing the next-generation Advanced Baseline Imageron GOES-R. Bulletin of the American Meteorological Society 86:1079–1096.
Setvak M, Doswell CA III 1991. The AVHRR Channel 3 cloud topreflectivity of convective storms. Monthly Weather Review 119:841–847.
Setvak M, Rabin RM, Doswell CA III, Levizzani V. 2003. Satelliteobservations of convective storm tops in the 1.6, 3.7 and 3.9 µmspectral bands. Atmospheric Research 67–68: 607–627.
Strabala KI, Ackerman SA, Menzel WP. 1994. Cloud propertiesinferred from 8–12-µm data. Journal of Applied Meteorology 33:212–229.
Wulfmeyer V, Behrendt A, Bauer HS, Kottmeier C, Corsmeier U,Blyth A, Craig G, Schumann U, Hagen M, Crewell S, Di Giro-lamo P, Flamant C, Miller M, Montani A, Mobbs S, Richard E,Rotach WM, Arpagaus M, Russchenberg H, Schlussel P, Konig M,Gartner V, Steinacker R, Dorninger M, Turner DD, Weckwerth T,Hense A, Simmer C. 2008. RESEARCH CAMPAIGN: the convec-tive and orographically induced precipitation study. Bulletin of theAmerican Meteorological Society 89: 1477–1486.
Copyright 2010 Royal Meteorological Society Meteorol. Appl. (2010)DOI: 10.1002/met