1 S.S.D. BIO/16 - Anatomia Umana DIPARTIMENTO DI BIOMEDICINA SPERIMENTALE E NEUROSCIENZE CLINICHE Dottorato in Medicina Sperimentale e Molecolare APPLICATION OF NOVEL 3D CULTURE MODELS OF HUMAN MUCOSAE TO STUDY THE EFFECTS OF ENVIRONMENTAL FACTORS ON NON-COMMUNICABLE DISEASES CICLO XXIV TESI DI Dr. Alberto Fucarino TUTOR Chiar.mo Prof. F. Bucchieri COORDINATORE DEL DOTTORATO Chiar.mo Prof. G. Zummo
Transcript
1
S.S.D. BIO/16 - Anatomia Umana
DIPARTIMENTO DI BIOMEDICINA SPERIMENTALE E NEUROSCIENZE CLINICHE
Dottorato in Medicina Sperimentale e Molecolare
APPLICATION OF NOVEL 3D CULTURE MODELS OF HUMAN
MUCOSAE TO STUDY THE EFFECTS OF ENVIRONMENTAL
FACTORS ON NON-COMMUNICABLE DISEASES
CICLO XXIV
TESI DI
Dr. Alberto Fucarino
TUTOR
Chiar.mo Prof. F. Bucchieri
COORDINATORE DEL DOTTORATO
Chiar.mo Prof. G. Zummo
2
3
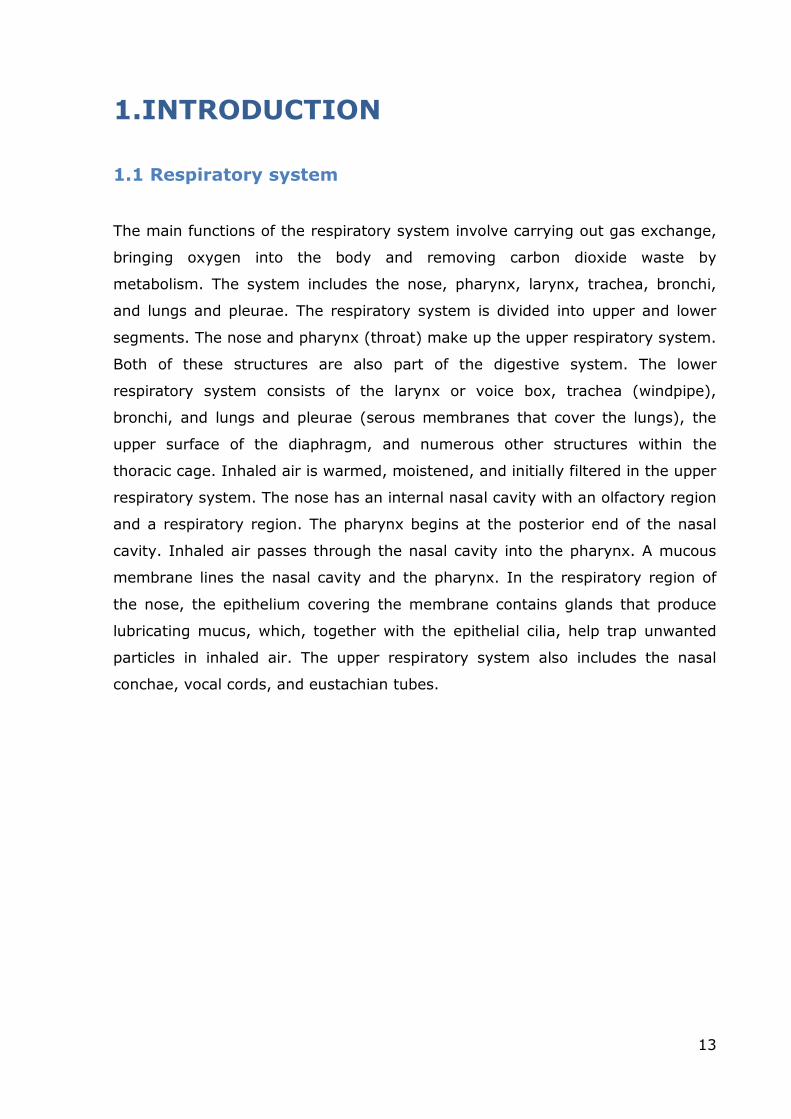
List of Contents
List of Contents ....................................................................................... 3
LIST OF FIGURES ....................................................................................... 6
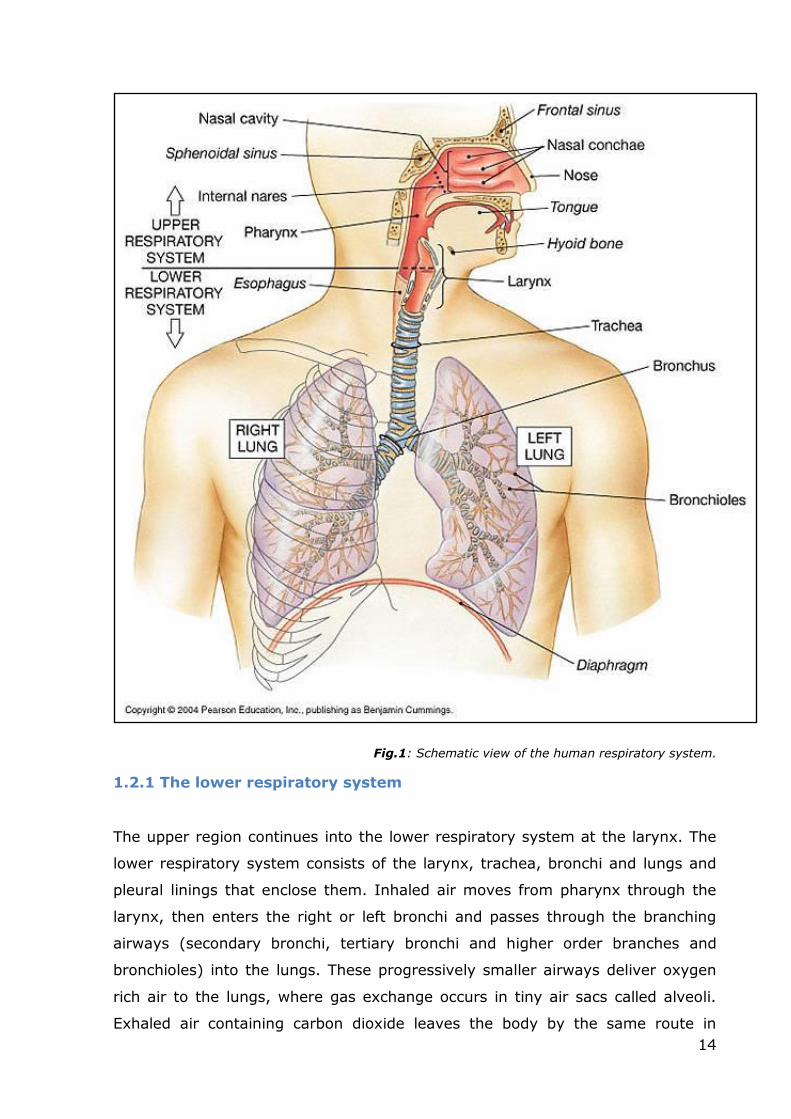
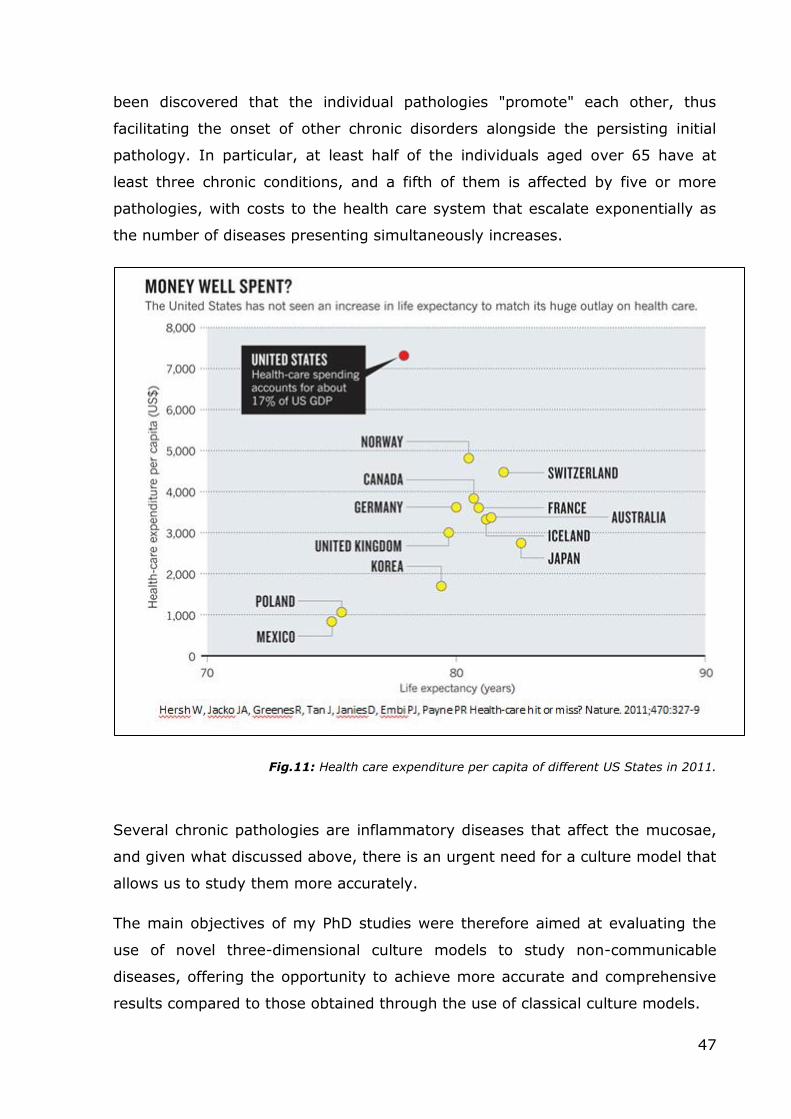
disease (COAD), and chronic obstructive respiratory disease (CORD), this disease
is caused by the simultaneous occurrence of emphysema and chronic bronchitis,
a pair of commonly co-existing diseases of the lungs, in which the airway lumen
become narrowed. The result is a limitation of the flow of air to and from the
lungs. In clinical practice, COPD is defined by its characteristically low airflow in
lung function tests. Unlike in asthma-related pathologies, this limitation is rarely
(and poorly) reversible and normally gets progressively worse over time (Lee,
2009). A broader view of the causes of health disparities between populations,
including socioeconomic status, race, ethnicity, and geography is necessary for
finding better solutions to complex population health problems such as COPD
(Rabe, 2007). The main cause of COPD development is noxious particles or gas,
25
most commonly from tobacco smoke or ambient pollution, which triggers a
massive inflammatory response in the airways and lungs. The inflammatory
response in the larger airways is known as chronic bronchitis, which is diagnosed
clinically when a patient regularly coughs up sputum. In the alveoli, the
inflammatory response causes a progressive modification of lung tissues, a
process known as emphysema (Sun, 1995). The natural progression of COPD is
characterized by occasional sudden worsening of symptoms, known as acute
exacerbation, most of which are caused by infections or air pollution (Jeffrey,
2006).
1.3.1 Asthma
Asthma is a very common inflammatory disease of the airways. It causes a
narrowing of the airways and its impact is growing across the world, by imposing
burdensome liabilities to the public health systems. Cytokines play a key role in
orchestrating the chronic inflammation and the structural changes in the
respiratory tract, and have become an important target in the development of
new therapeutic strategies against this disease. The most recent definition of
asthma from GINA (the Global Initiative for Asthma) states that “Asthma is a
chronic inflammatory disorder of the airways in which many cells and cellular
elements play a role. The chronic inflammation is associated with airway hyper-
responsiveness that leads to recurrent episodes of wheezing, breathlessness,
chest tightness, and coughing, particularly at night or in the early morning.
These episodes are usually associated with widespread, but variable, airflow
obstruction within the lung that is often reversible either spontaneously or with
treatment” (GINA report, 2008).
During an asthma attack, the lining of the bronchial tubes swell, causing the
airways to narrow, thus reducing the flow of air into and out of the lungs.
Recurrent asthma symptoms frequently cause sleeplessness, daytime fatigue,
reduced activity levels and school and work absenteeism. Luckily, asthma has a
relatively low fatality rate compared to other chronic diseases (Boushey, 1980;
Chung, 2001).
The prevalence of asthma in the developed countries is about 10% in adults, and
higher in children, while in the developing countries, the percentage is lower but
constantly growing. The World Health Organization (WHO) estimates that 300
26
million people currently suffer from asthma. It is the most common chronic
disease among children (WHO publication, 2003). Asthma often arises at a very
young age and is characterized by a remodeling of the upper airways and an
increased mucous secretion. This is the result of an inflammatory process that
occurs at the expense of the airways themselves. But asthma is not only
childhood pathology. Different studies have shown that the prevalence of asthma
in the age group of patients above 65 years old has been increasing in the recent
years. The asthma phenomenon in the elderly is much more complex than one
might expect. The oxidative stress derived from the ageing process probably
leads to immunological and inflammatory changes that have a significant impact
on the respiratory system. Asthma is also often confused with other pathologies,
in particular COPD, or chronic bronchitis or emphysema. (Pawankar, 2008).
The current guidelines for classifying asthma severity are based on two
parameters: the FEV1 and the peak expiratory flow rate. According to the clinical
classification system, asthma can be classified in terms of the frequency of
symptoms which can be intermittent, mild persistent, moderate persistent and
severe persistent. Asthma may also be classified as atopic or non-atopic,
according to the presence (atopic) or absence (non-atopic) of reaction to
allergens. Various cells play different roles in the pathogenesis of this disease,
and like an orchestra, they have a crucial role in the evolution of the disease.
The inflammatory response in asthma involves primarily the larger airways.
Bronchial biopsies obtained from asthmatic subjects show the infiltration of
eosinophils, mast cells and activated T-cells, particularly Th2 cells. There are
obvious structural changes, such as the deposition of collagen beneath the
epithelial layer and a hypertrophy of airway smooth muscle cells. There is also an
increase in angiogenic processes at the level of the hyperplastic areas.
27
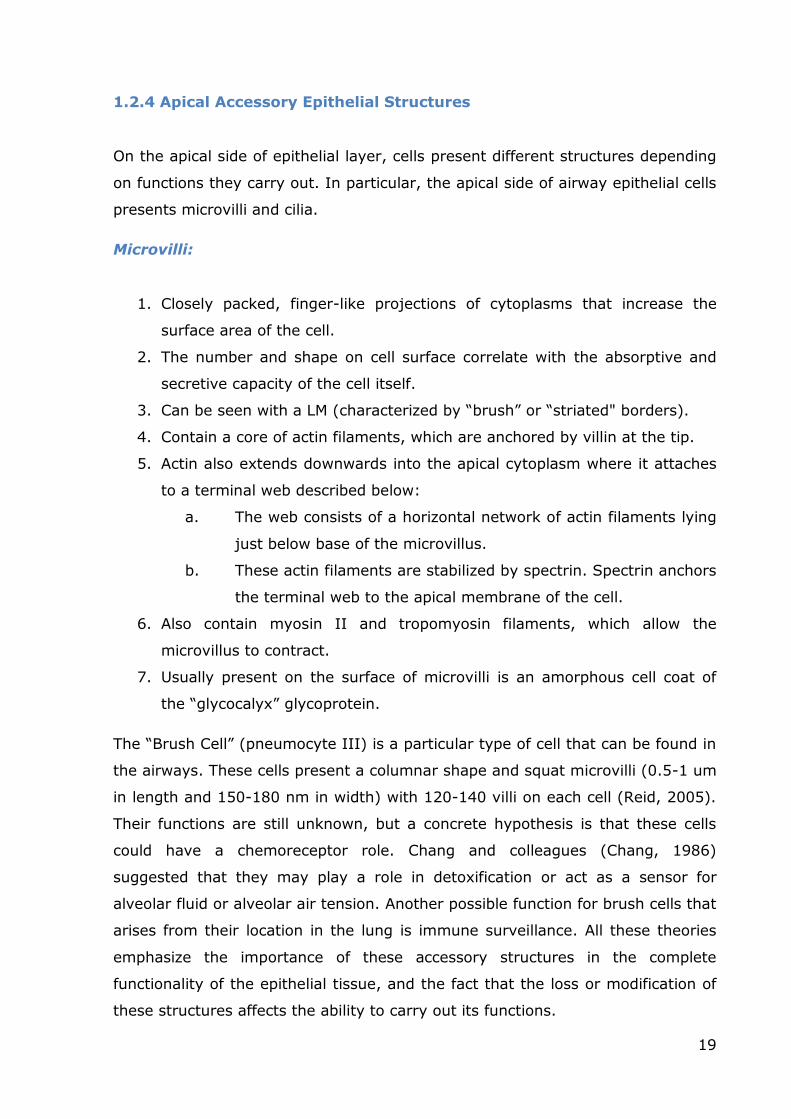
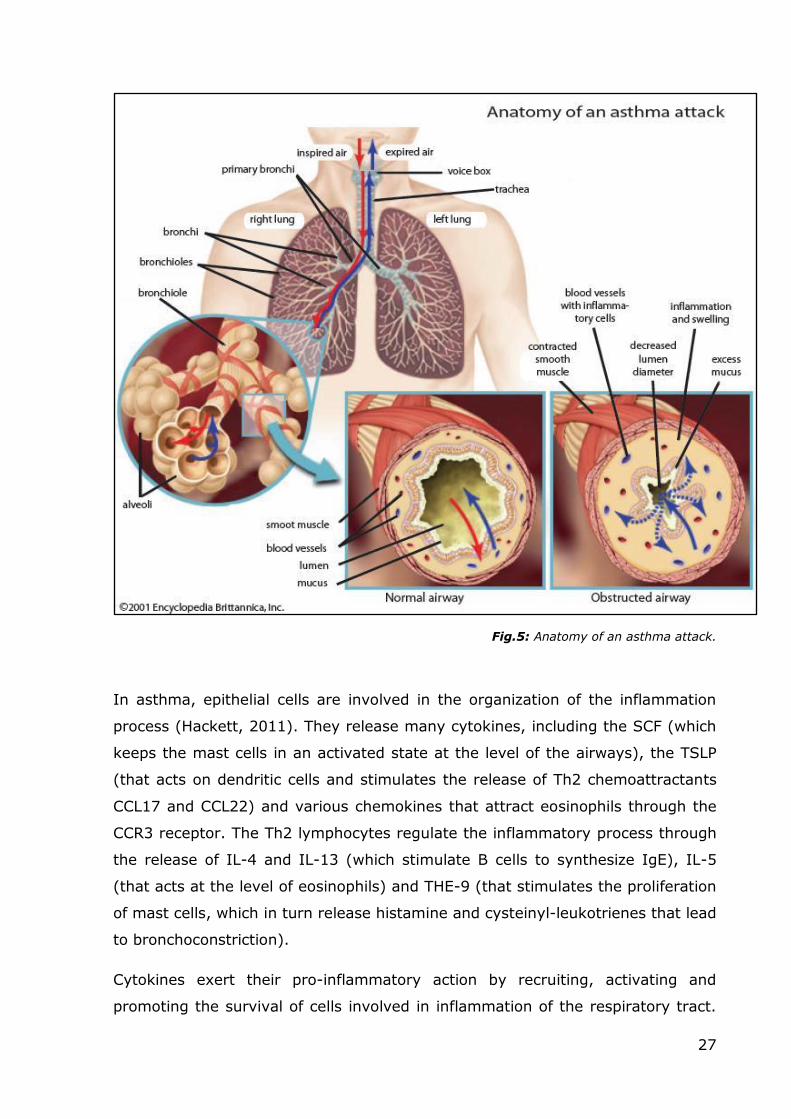
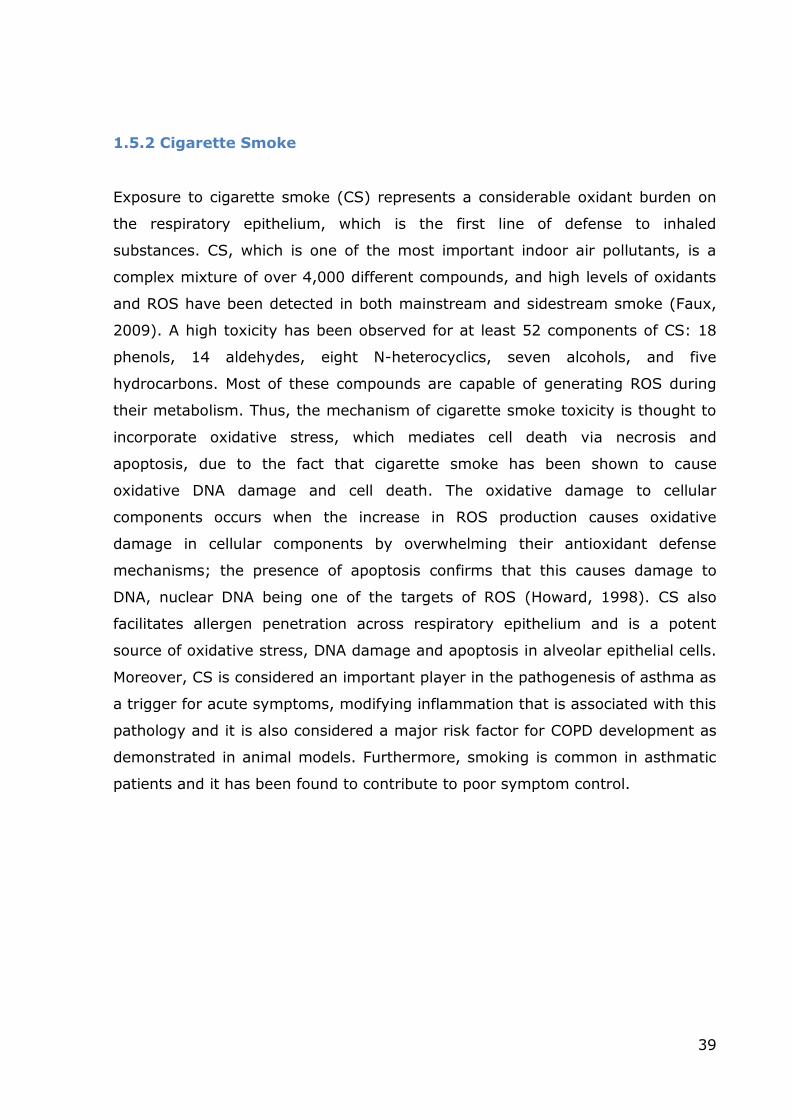
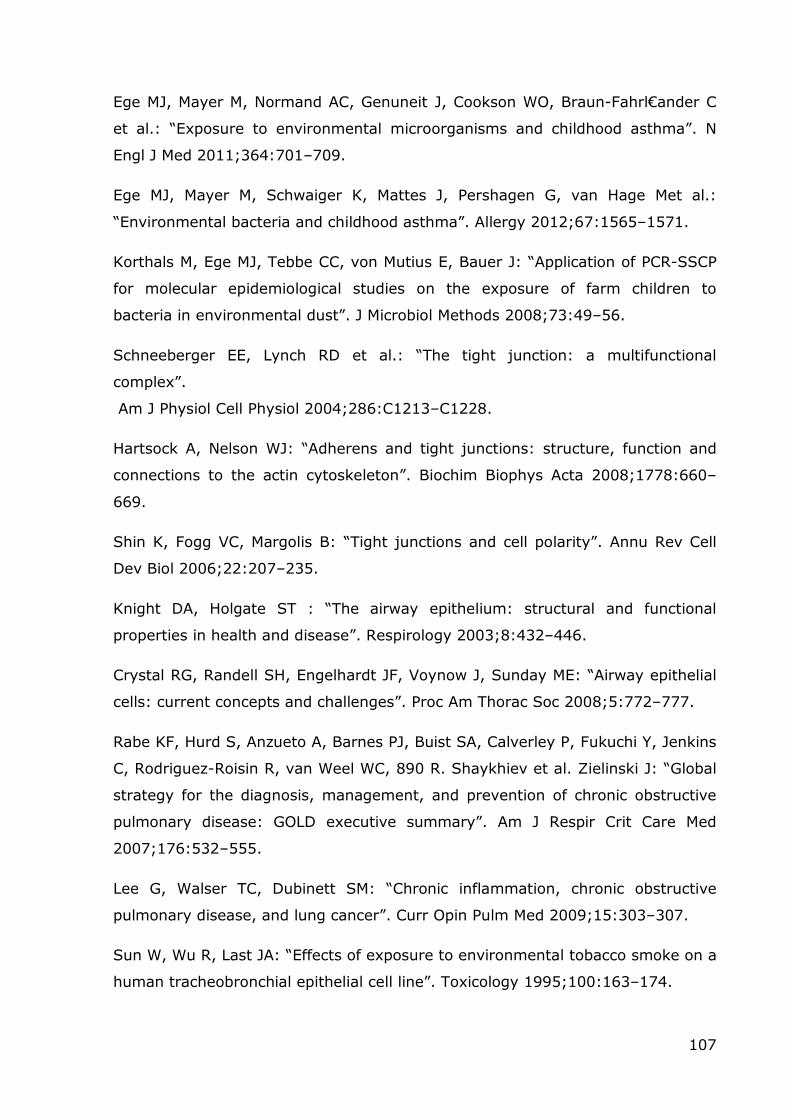
Fig.5: Anatomy of an asthma attack.
In asthma, epithelial cells are involved in the organization of the inflammation
process (Hackett, 2011). They release many cytokines, including the SCF (which
keeps the mast cells in an activated state at the level of the airways), the TSLP
(that acts on dendritic cells and stimulates the release of Th2 chemoattractants
CCL17 and CCL22) and various chemokines that attract eosinophils through the
CCR3 receptor. The Th2 lymphocytes regulate the inflammatory process through
the release of IL-4 and IL-13 (which stimulate B cells to synthesize IgE), IL-5
(that acts at the level of eosinophils) and THE-9 (that stimulates the proliferation
of mast cells, which in turn release histamine and cysteinyl-leukotrienes that lead
to bronchoconstriction).
Cytokines exert their pro-inflammatory action by recruiting, activating and
promoting the survival of cells involved in inflammation of the respiratory tract.
28
Cytokines can be divided into: lymphokines (cytokines secreted by T cells that
regulate the immune response), pro-inflammatory cytokines (that amplify and
maintain the inflammatory state), and growth factors (that promote cell survival
and lead to airway tissue remodeling), chemokines (that act as chemotactic
agents for the inflammatory cells) and anti-inflammatory cytokines (that
negatively modulate the inflammatory response).
The pro-inflammatory cytokines involved in asthma include TNF-α, IL-β 1 and IL-
6, whose levels are increased in the BAL of asthmatic subjects, and lead to an
amplification of inflammation through the activation of NF-kB. In other diseases,
such as rheumatoid arthritis or inflammatory bowel disease, blocking the action
of these cytokines has led to benefits for the patient, so it would be interesting to
determine a similar approach to airway inflammation.
Interleukin 15 is an important mediator of chronic inflammation. An association
between certain haplotypes of IL-15 and bronchial asthma has been described.
An inappropriate activation of the immune system due to aero-environmental
allergens and many other stimuli cause this disease, that is associated with a
bronchial hyperreactivity and a massive presence of eosinophils and a high level
of IgE present in the serum. The inflammatory response is initiated and
supported by various cytokines, particularly IL-4, IL-5 and IL-13 (produced by T-
helper type 2 lymphocytes). In contrast, it is likely that various mediators of the
Th1 response, which inhibit the Th2 response, are deleted by the TH2 response
itself. Such mediators include IL-2, IFN-γ and TNF-α (Barnes 2008).
IL-15 is a cytokine that mediates the Th-1 response, which in turn regulates the
activation, proliferation and cytokine release by T-, NK- and mast cells, as well
as B lymphocytes. IL-15 shares many biological functions with IL-2, but opposite
effects have also been reported. This is because IL-15 interacts with the β and γ
receptor chains of IL-2, but there is also a unique chain α for IL-15. Recently, an
association between a haplotype based on five polymorphisms of the IL-15 gene
and asthma outbreak in pediatric age has been reported (Bierbaum et al, 2006).
The genetics of asthma appear very complex. Due the complexity of asthma, it is
difficult to understand the exact effect of each single component in the disease
process, and how they contribute to the disease. Various studies have
indisputably demonstrated that asthma has an important genetic component, but
29
there is no clear pattern of inheritance with a widely variable heritability rate
between 36-79%
Multiple genome-wide linkage studies for asthma and allergy have been
performed to date, and their results have shown that many of the genes involved
in such pathologies are related to the immune system or involved in the
modulation of inflammation or in the remodeling processes. Susceptibility to
asthma can be influenced both by genes and environmental factors, which can
have an impact at different stages in life.
1.3.1.1 Atopic Asthma
Atopic asthma (also known as allergic asthma or extrinsic asthma) affects a
subpopulation of individuals that experience a worsening of symptoms upon
exposure to allergens to which they are sensitized. Upon such exposure, the
airways become constricted and inflamed, affecting breathing. The severity of
symptoms is variable. This form of asthma is more common in children than in
adults. The WHO estimates that more than 50% of patients with adult asthma
suffer from Atopic asthma. There is an inherited tendency toward the
development of extrinsic asthma. It is related to a hypersensitivity reaction of
the immune response. The subject often has a family medical history that
includes allergies of one kind or another, and a personal history of allergic
disorders. Secondary factors affecting the severity of an attack or triggering its
onset include events that produce emotional stress, environmental changes, for
example in humidity or temperature, and exposure to noxious fumes or other
airborne allergens. Common “activating” antigens include seasonal pollens (e.g.,
grass, tree and weed pollens), house dust mite, and domestic animals (e.g., cat,
dog and horse), and multiple sensitivities are usually present. Atopy and asthma
are not absolute co-morbidities; all individuals with asthma do not have allergies
and all individuals with allergies do not have asthma.
There is no definitive cure, but avoiding the allergen will prevent symptoms from
developing. A common precautionary measure is limiting outdoor activities when
the pollen concentrations in the air are high, but this obviously greatly limits
normal daily activities of the subject. It is possible to use various drugs and
alternative therapies. Bronchodilators such as epinephrine and aminophylline
may be used to enlarge the bronchioles, thus relieving respiratory distress. Other
30
drugs that thin the secretions and help in their ejection (expectorants) may also
be prescribed.
1.3.1.2 The remodeling of airways in asthma
Chronic inflammation leads to the structural changes in the airways in asthma,
collectively termed airway remodeling. These changes include changes in the
epithelium and sub-epithelial layers, the latter including matrix abnormalities and
alterations of the airway smooth muscle layer (Holgate, 2007). Asthma
exacerbations are frequently characterized by sputum production and,
furthermore, fatal asthma is commonly associated with mucus blocking the
airways. The mechanism of mucus hypersecretion is probably multifactorial, but
one consistent finding is that of goblet cell hyperplasia in the airway epithelium
of patients with asthma (Holgate, 2008). Although inflammation undoubtedly
plays a central role in asthma, it does not explain many of the characteristic
features of this chronic and recurrent disease (Cockcroft, 2006).
The relevance of airway remodeling, the other main histologic characteristic of
asthma, in the disease pathogenesis is still controversial, since traditionally
inflammation was thought to be the sole foundation of asthma, causing airway
remodeling to receive considerably less attention. Multiple studies have shown an
increase in subepithelial fibrosis in asthmatic patients (Bousquet, 2000). The
degree of subepithelial fibrosis correlates with the severity, but not with the
duration of disease. Interestingly, although one study found that treatment with
an inhaled corticosteroid (ICS) for four weeks had no effect on the thickness of
the subepithelial layer, another study, in which the treatment with ICS was
continued for 12 months, showed significant reductions in the thickness of the
subepithelial layer, suggesting that subepithelial fibrosis is a consequence of
airway inflammation (Dahl, 2006).
These alterations of the airways also provide an explanation for corticosteroid-
resistant bronchial hyperresponsiveness, and for the accelerated decline in lung
function observed in adults with asthma. The deposition of new extracellular
matrix in the lamina reticularis could prove to be another marker of chronic
epithelial damage. To explain these tissue changes and the continuous
inflammatory loop, the “Epithelial Mesenchymal Trophic Unit” (EMTU) theory was
proposed. Changes in the microenvironment that characterize the normal
31
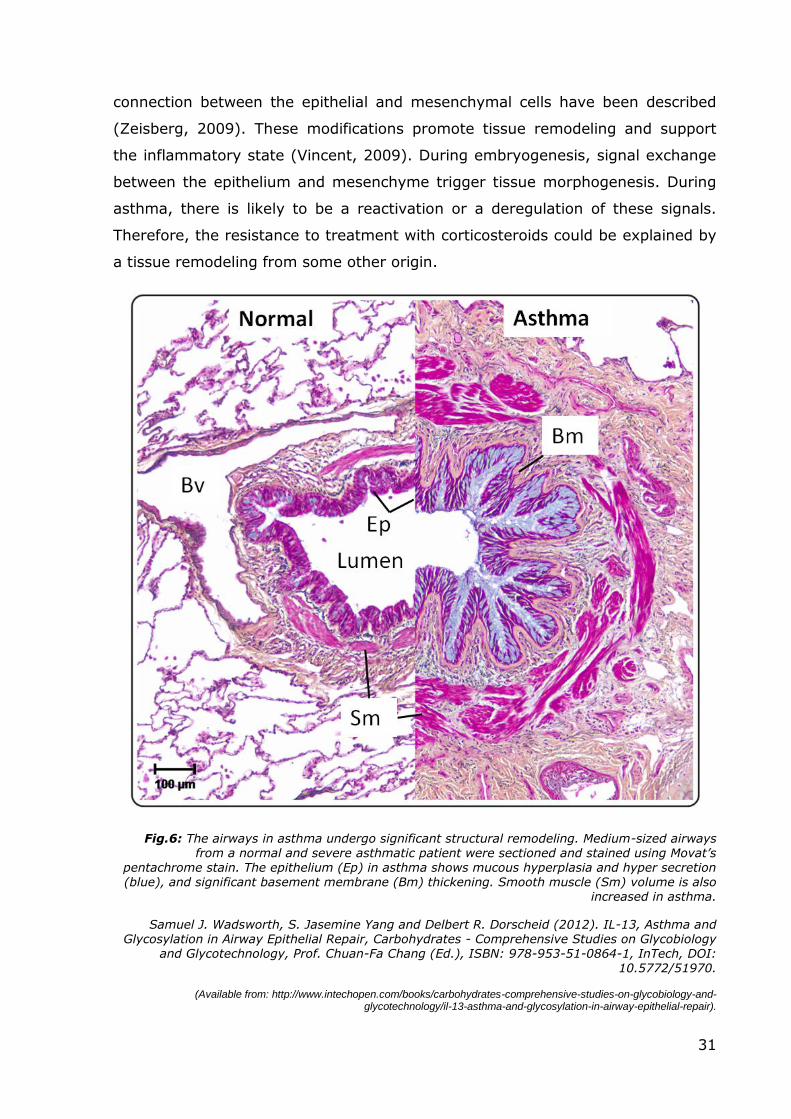
connection between the epithelial and mesenchymal cells have been described
(Zeisberg, 2009). These modifications promote tissue remodeling and support
the inflammatory state (Vincent, 2009). During embryogenesis, signal exchange
between the epithelium and mesenchyme trigger tissue morphogenesis. During
asthma, there is likely to be a reactivation or a deregulation of these signals.
Therefore, the resistance to treatment with corticosteroids could be explained by
a tissue remodeling from some other origin.
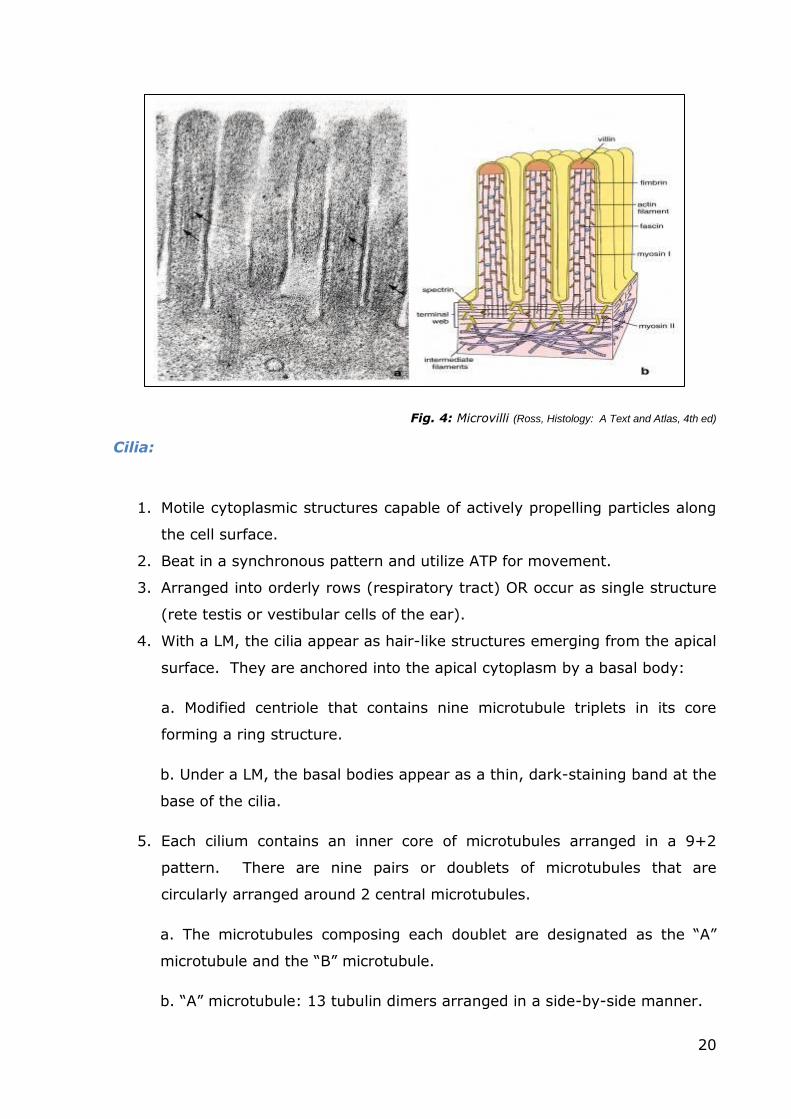
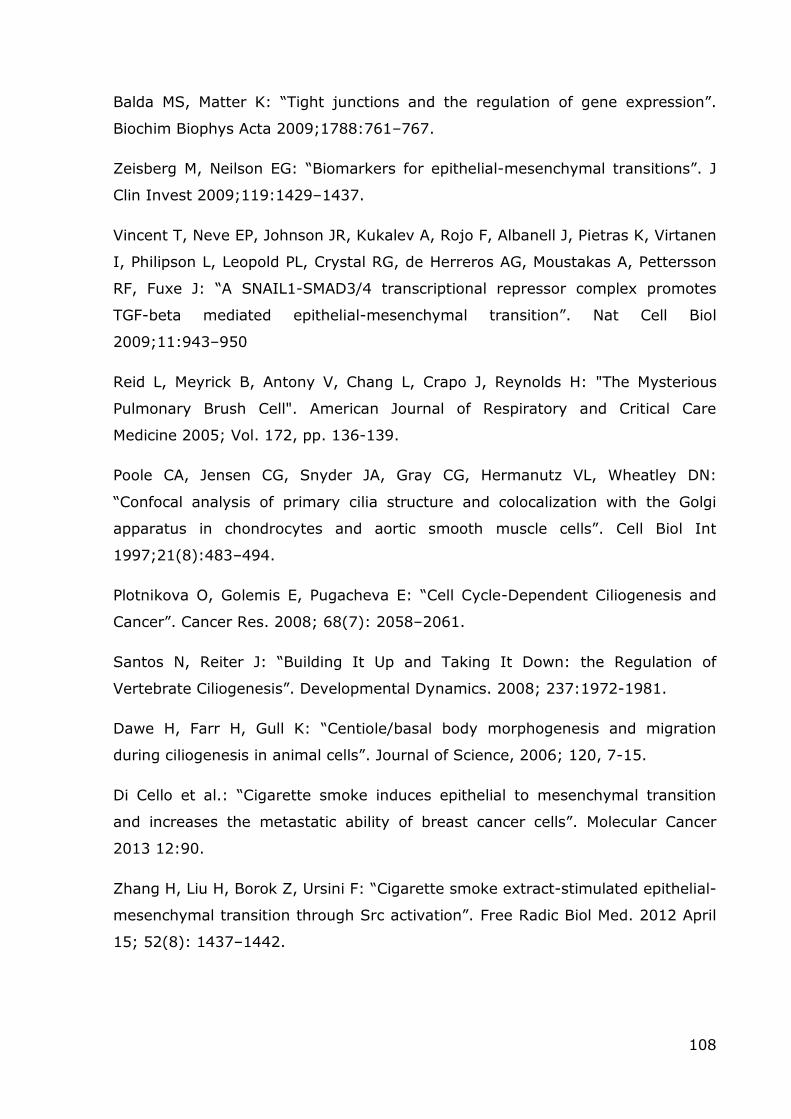
Fig.6: The airways in asthma undergo significant structural remodeling. Medium-sized airways from a normal and severe asthmatic patient were sectioned and stained using Movat’s
pentachrome stain. The epithelium (Ep) in asthma shows mucous hyperplasia and hyper secretion (blue), and significant basement membrane (Bm) thickening. Smooth muscle (Sm) volume is also
increased in asthma.
Samuel J. Wadsworth, S. Jasemine Yang and Delbert R. Dorscheid (2012). IL-13, Asthma and Glycosylation in Airway Epithelial Repair, Carbohydrates - Comprehensive Studies on Glycobiology
and Glycotechnology, Prof. Chuan-Fa Chang (Ed.), ISBN: 978-953-51-0864-1, InTech, DOI: 10.5772/51970.
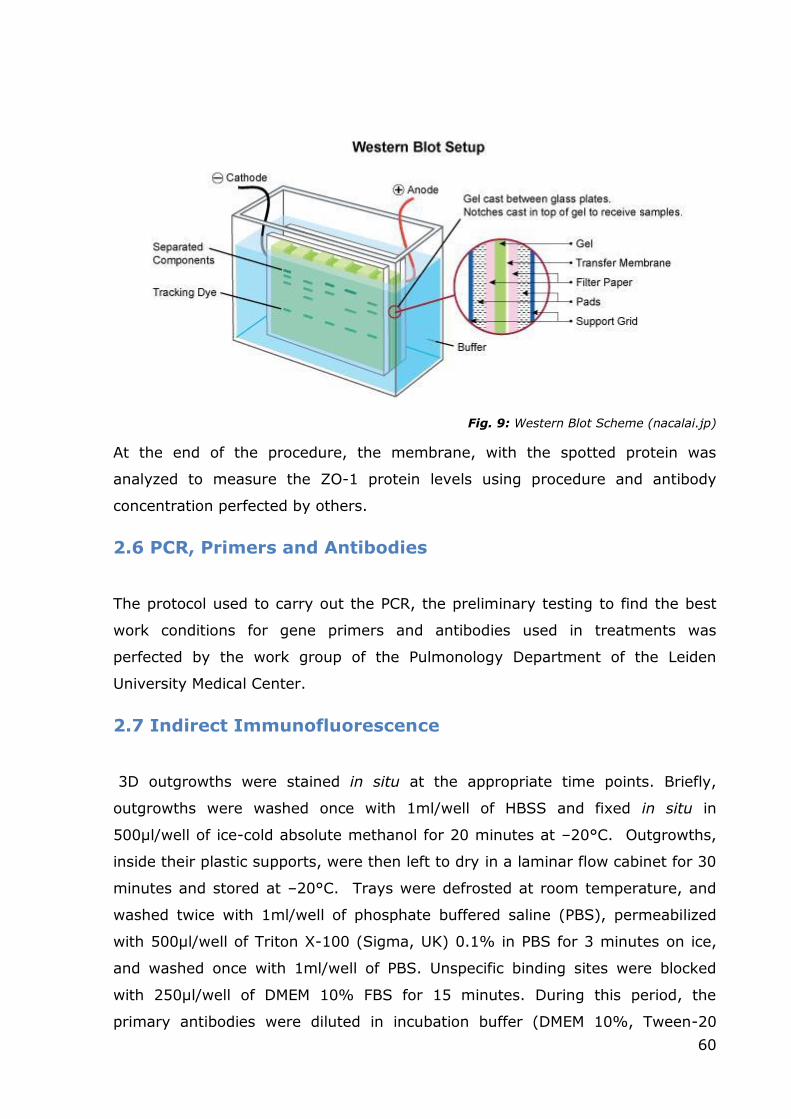
Alexa Fluor647 (excitation 633 nm, emission 640–680 nm). Each image was
averaged from 14 scans within a thickness of 5 to 7 μm.
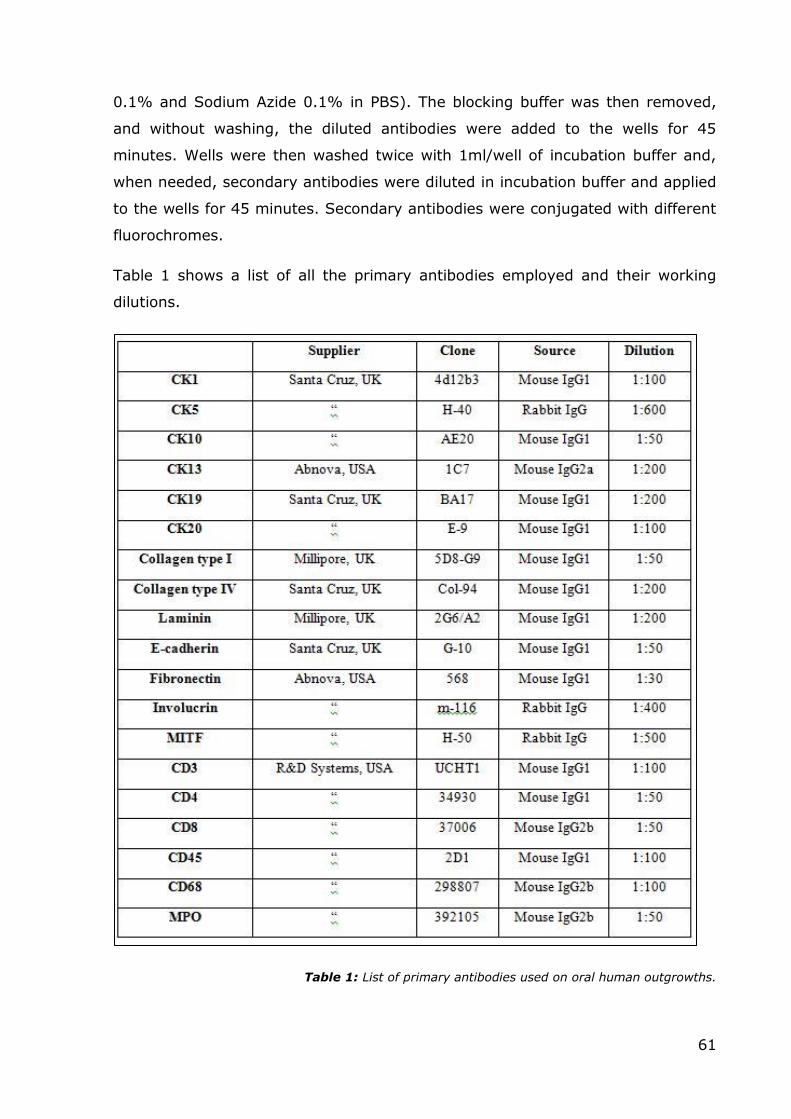
Immunofluorescent staining was semi-quantified by scoring the percentage of
positive cells or area (depending on the antigen of interest), evaluated by three
different operators (AMG, AF and AP) in five different mid-magnification (400x)
microscopic fields (score: - absence of immunostaining, -/+ less than 10% of the
total number of cells/area scored positively; + between 10% and 50% scored
positively; ++ 50-100% of the total number of cells/area were positive).
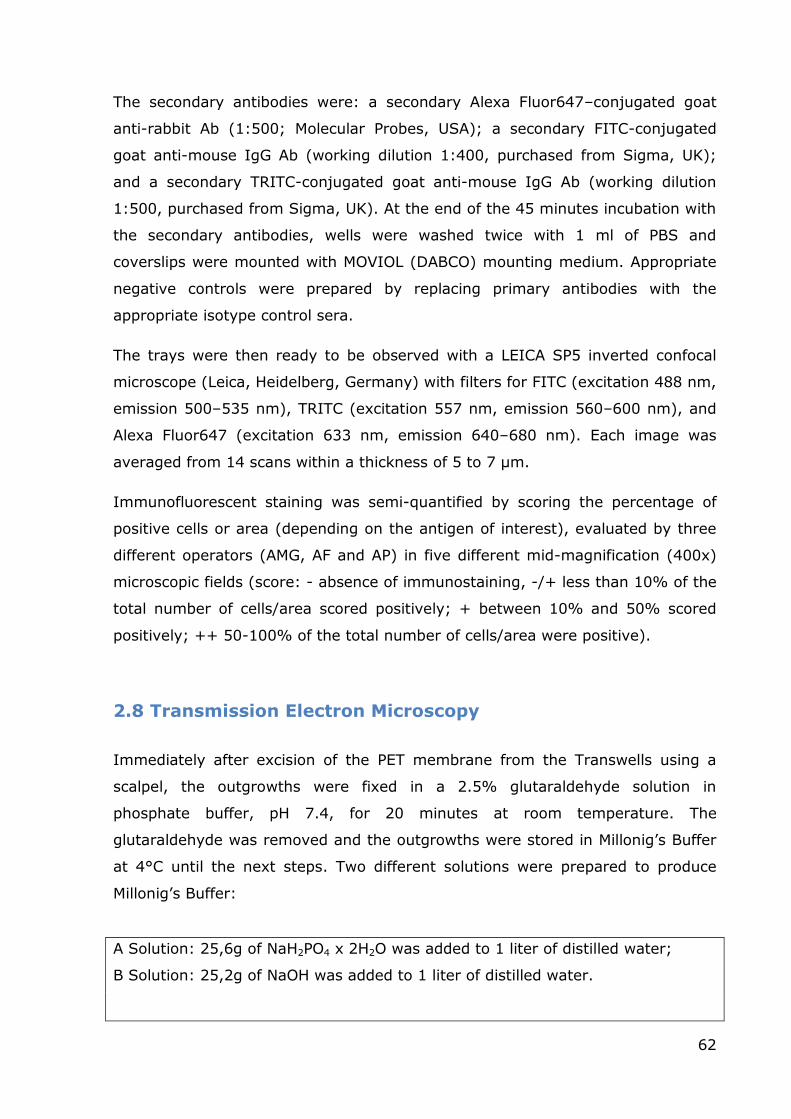
2.8 Transmission Electron Microscopy
Immediately after excision of the PET membrane from the Transwells using a
scalpel, the outgrowths were fixed in a 2.5% glutaraldehyde solution in
phosphate buffer, pH 7.4, for 20 minutes at room temperature. The
glutaraldehyde was removed and the outgrowths were stored in Millonig’s Buffer
at 4°C until the next steps. Two different solutions were prepared to produce
Millonig’s Buffer:
A Solution: 25,6g of NaH2PO4 x 2H2O was added to 1 liter of distilled water;
B Solution: 25,2g of NaOH was added to 1 liter of distilled water.
63
The final step was to mix 83 ml of the A solution with 17ml of the B solution to
make 100ml of Buffer; the pH was adjusted to 7.4.
After washes with Millonig’s Buffer, the pieces were post-fixed in 1% OsO4 for 2
h, dehydrated in an ascending ethanol series, treated with propylene oxide for
30’, infiltrated with epoxy resin (Epon812, Electron Microscopy Science, Hatfield,
PA, USA) in propylene oxide (1:3, 1:2, and 1:1 for 30 minutes at room
temperature, respectively), and finally embedded in Epon812 with DMP30. The
resin was then polymerized in an oven at 60°C for 48 hours. Ultra- and semithin
sections were cut with an ultramicrotome (Ultracut E, Reichert-Jung, Depew, NY,
USA) at different thicknesses and mounted on copper and gold grids or on glass
slides for further use. Contrast solution for the grids to be used for electron
microscopy was prepared by:
dissolving 0,7g of uranyl acetate in 10ml of methanol; Reynolds’ solution was
prepared by dissolving 1,33g of Pb(NO3)2 and 1,76g NaC6H5O7 x H2O and 8ml of
NaOH 1N in 50 ml of distilled water at pH 12.
Ultrathin (50nm) sections of the embedded samples were cut with an
ultramicrotome and placed on Cu/Rh grids. Before observation with the
transmission electron microscope (JEM-1220; JEOL, Japan) the specimens were
contrasted with uranyl-acetate 7% in methanol and Reynold’s lead citrate.
2.9 Immunogold
Ultrathin sections were mounted on gold grids to prepare them for the
immunogold assay. The outgrowths were included in epoxy resin that notoriously
covers antigenic sites, making the execution of immunological investigation
techniques considerably more difficult. A pre-treatment to unmask the sites with
sodium citrate was performed to ensure better results. Gold grids were placed in
a baker filled with a sodium citrate solution and subsequently microwaved for 4
minutes at 850W.
64
The grids were then washed twice in PBS, and subsequently incubated in a
serum blocking solution for 30 minutes and, without washing, the incubation
proceeded with primary antibodies diluted in dilution buffer for 1 hour and a half
at room temperature. Primary antibodies used were against laminin, fibronectin
and collagen type IV, and their dilutions can be found in Table 1. Grids were
rinsed five times with PBS for 3 min and incubated with the secondary antibody
conjugated with 10nm colloidal gold particles for 30 minutes at room
temperature, and washed again for five times with PBS for 3 min. Subsequently,
the grids were fixed in a 2.5% glutaraldehyde solution in PBS for 15 minutes,
and washed five times in distilled water for 3 minutes. The grids were then
prepared for contrast staining by treating them with uranyl acetate for 5
minutes, followed by eight washes with methanol for 2 minutes, treated with
Reynolds’ solution for 5 minutes and finally rinsed eight times in distilled water
for 2 minutes. After this procedure, the grids were ready for electron microscopy.
65
3.RESULTS
3.1 Use of the ALI culture model to study farm dust
properties
Aims: Firstly, it was deemed necessary to test the properties of the new
conditioned media prepared from Pseudomonas Aeruginosa extracts. The
previously used conditioned media, prepared following the old protocol, caused
stress and cell death, depending on the concentration. At the same time, it was
necessary to not only test if the “new” medium would cause the same effects
(the stock of bacteria was different) but it was also essential to ascertain which
concentration was ideal for our purpose (effects on tight junctions). From
existing literature and previous studies it was clear that dust collected from the
rooms of children living in a farm has the potential to prevent allergy and atopy
in adults. At the same time, a good number of experiments conducted on mice to
test the effects of farm dust (Hylkema, 2011; Robbe, 2012) had shown similar
results. For my PhD studies, in order to test the properties of the dust, various
samples taken from bedrooms of children living in rural environments were
mixed together to obtain a uniform “farm dust” to use for the experiments.
Initially I wanted to see if farm dust has some direct effects on tight junction
proteins. As noted before, other studies conducted on mice had shown the
protective properties of farm dust, but, at the same time, it was discovered that
the dust does not prevent the onset of an inflammatory response. In fact, in
mice, the administration of dust causes the release of IL-17, an interleukin found
in many chronic inflammation diseases. For these reasons, I wanted to see
whether the release of pro-inflammatory interleukins would take place in the ALI
culture model too, or furthermore, if the exposition to dust would prevent the
release of inflammatory cytokines from cells exposed to dust and PAOM, or both.
In order to answer these questions, I monitored the levels of IL-8. IL-8 was
chosen since it is another interleukin linked with inflammation status and
produced in vivo by airway epithelial cells and its release is a known marker in
many pathologies (such as asthma, cystic fibrosis and tumors). Finally, I tested if
farm dust can increase levels of TEER in the ALI culture model. Therefore,
Primary Epithelial Bronchial Cells were cultured at air-liquid interface to promote
66
cell differentiation and obtain a polarized epithelium with a cell composition and
organization that mimics the in vivo state. In addition to the TEER assay, I also
evaluated whether farm dust presented some regenerative properties or if a
“chronic” exposition had some specific effects.
3.1.1 Testing the disruptive effects of PAOM
Preliminary experiment on 16 HBE: To verify the potential of the new PAOM
prepared as explained in the “Methods” chapter, the best choice to reduce
inconsistencies in the results was the 16 HBE cell line. These cells are
characterized by uniform growth properties (especially in the early passages),
compared to primary cells, mainly due to the exclusion of “donor” variability.
Once the conditioned culture medium was ready, four flasks of 16 HBE were
treated with different concentrations of PAOM. The cell confluence was about 80-
90% to avoid cell detachment due to overcrowding. The three concentrations
used were 1:5, 1:10 and 1:20, with one part of PAOM for 5, 10 and 20 total
parts of media, respectively; the latter consisted of normal growth medium
(DMEM integrated with 10% FCS, for further details refer to methods). Flasks
were observed by optical microscopy at 1, 3 and 6 hours for monitoring.
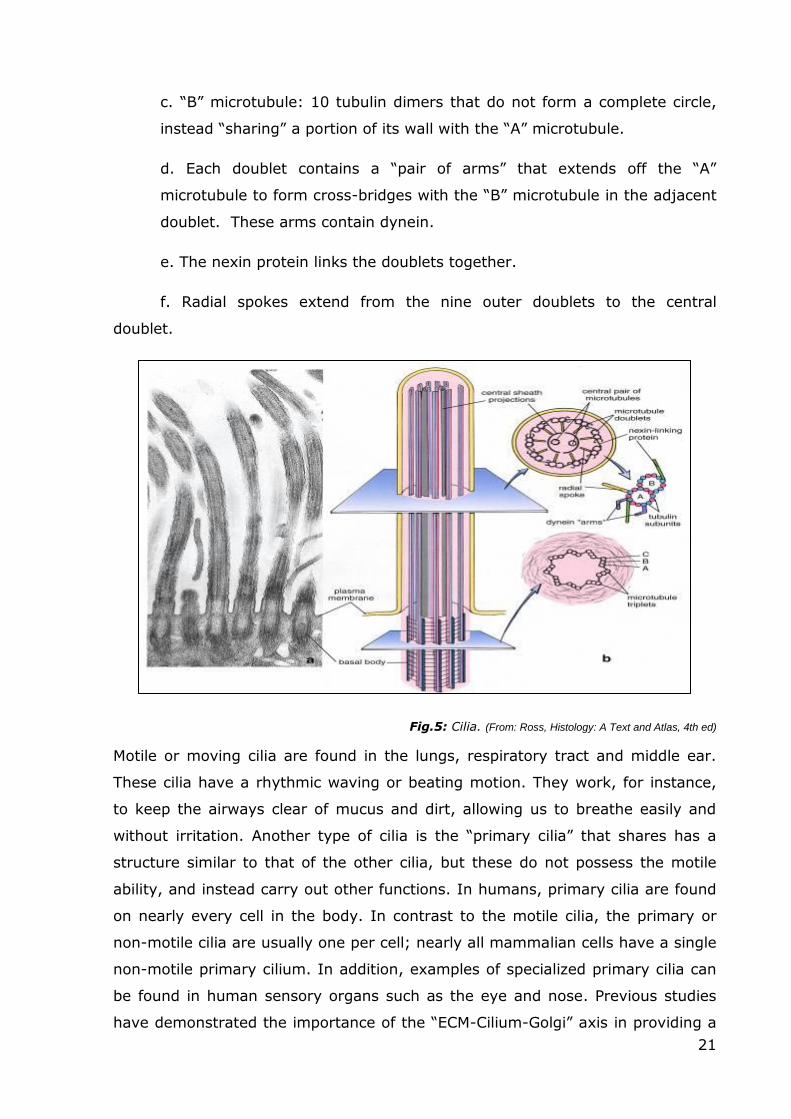
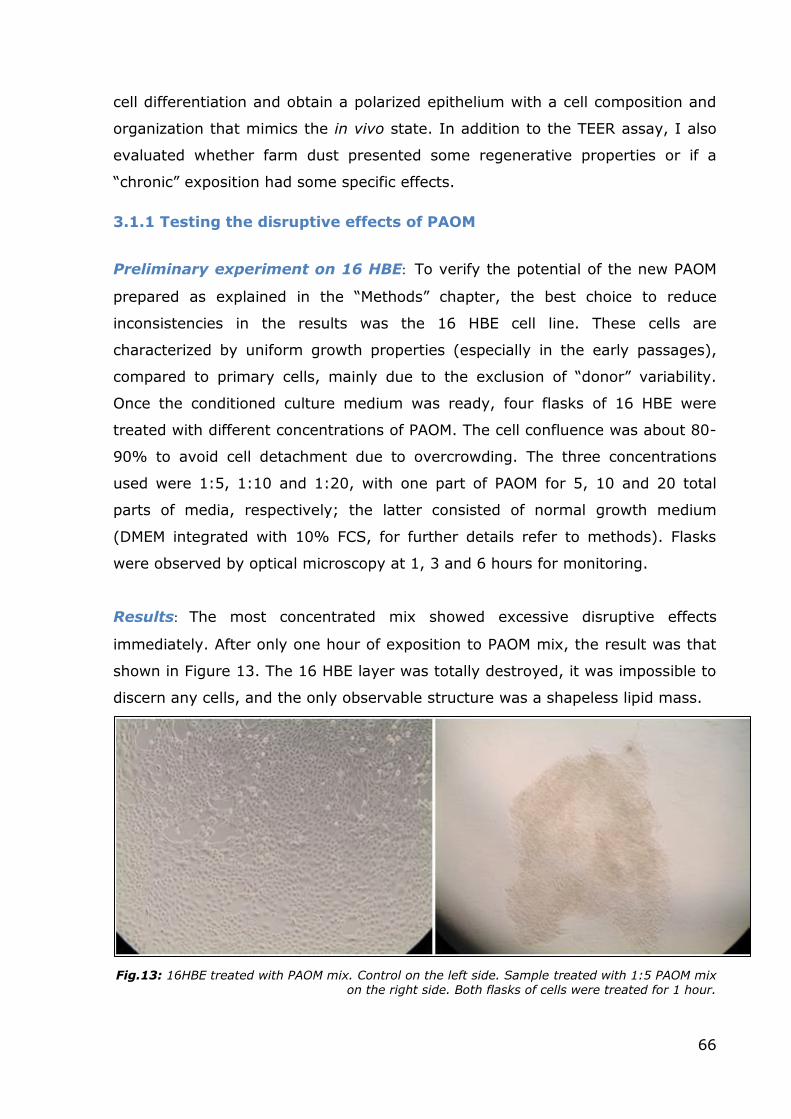
Results: The most concentrated mix showed excessive disruptive effects
immediately. After only one hour of exposition to PAOM mix, the result was that
shown in Figure 13. The 16 HBE layer was totally destroyed, it was impossible to
discern any cells, and the only observable structure was a shapeless lipid mass.
Fig.13: 16HBE treated with PAOM mix. Control on the left side. Sample treated with 1:5 PAOM mix on the right side. Both flasks of cells were treated for 1 hour.
67
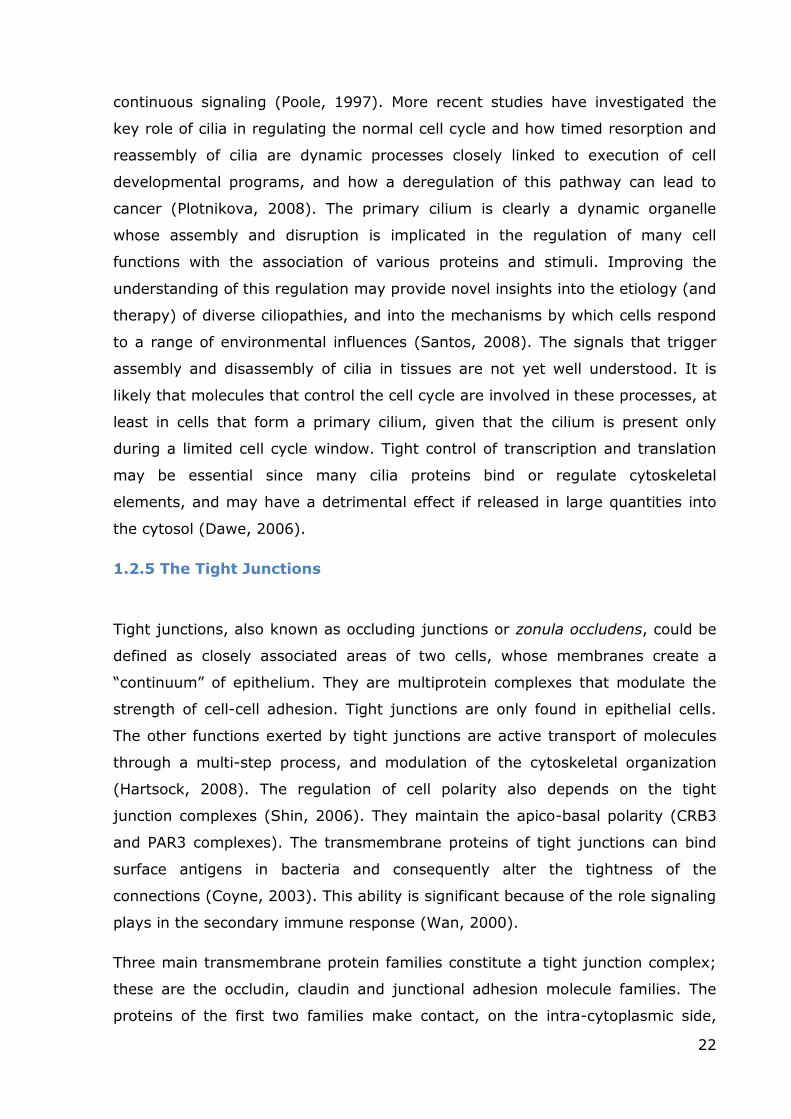
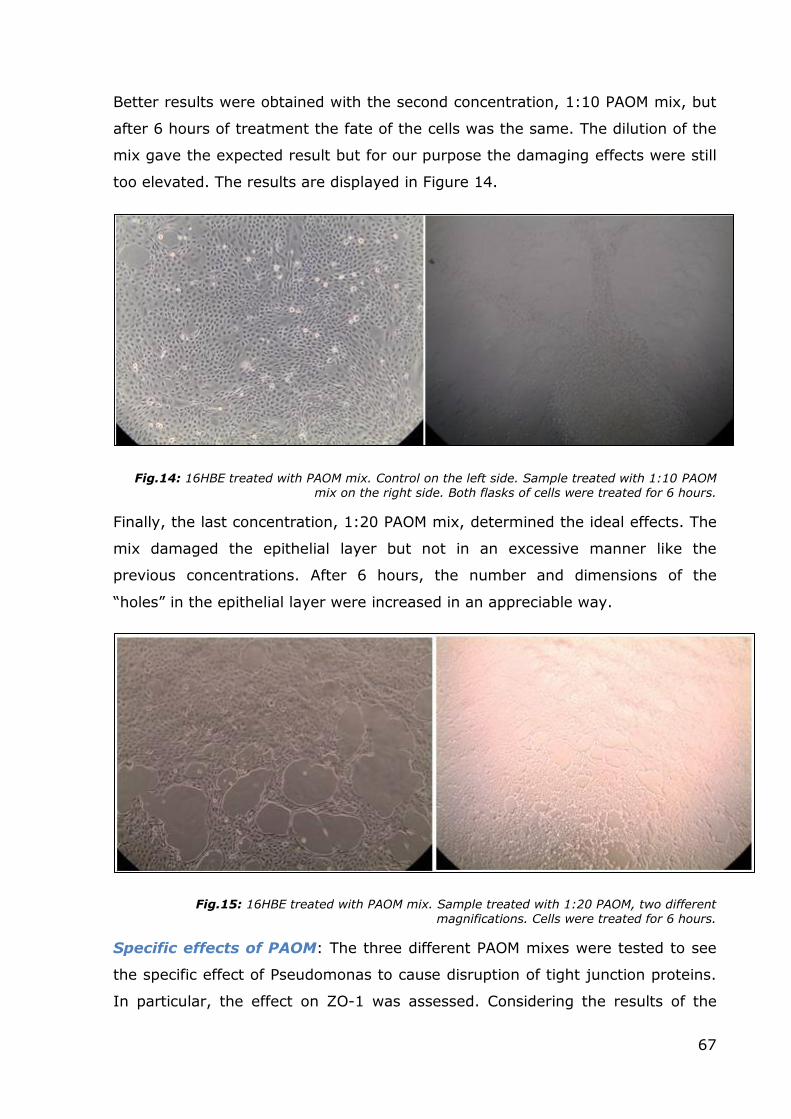
Better results were obtained with the second concentration, 1:10 PAOM mix, but
after 6 hours of treatment the fate of the cells was the same. The dilution of the
mix gave the expected result but for our purpose the damaging effects were still
too elevated. The results are displayed in Figure 14.
Fig.14: 16HBE treated with PAOM mix. Control on the left side. Sample treated with 1:10 PAOM mix on the right side. Both flasks of cells were treated for 6 hours.
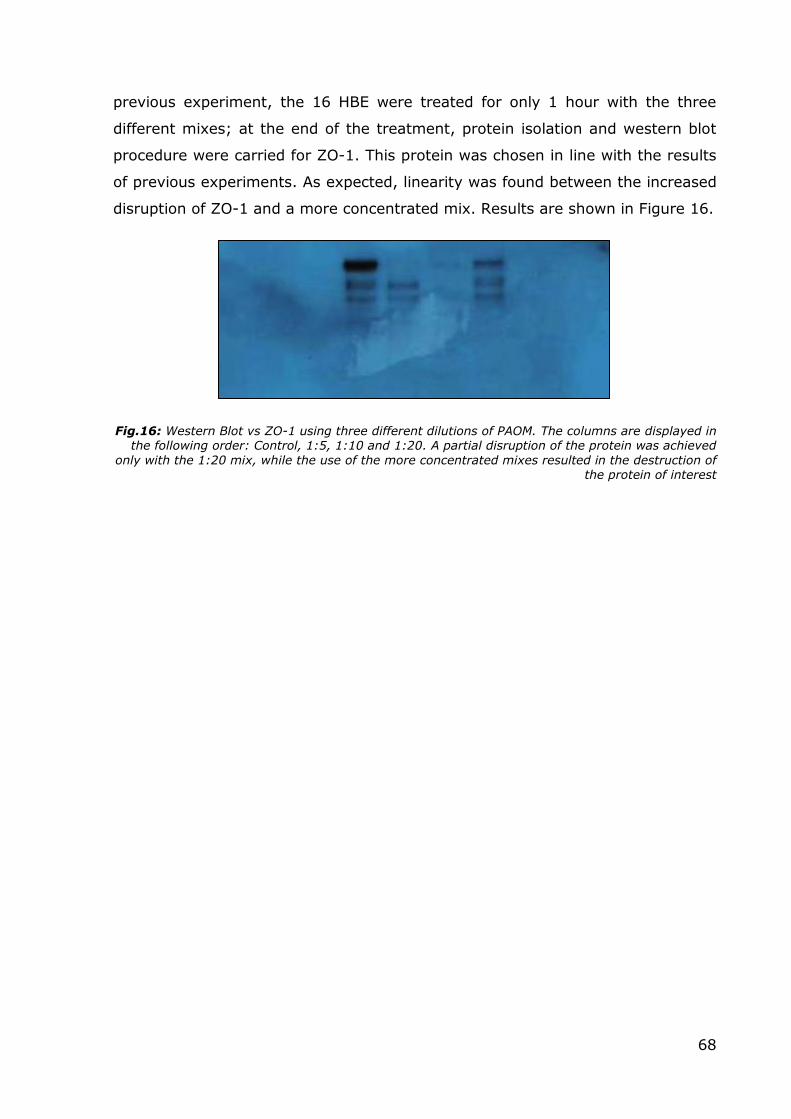
Finally, the last concentration, 1:20 PAOM mix, determined the ideal effects. The
mix damaged the epithelial layer but not in an excessive manner like the
previous concentrations. After 6 hours, the number and dimensions of the
“holes” in the epithelial layer were increased in an appreciable way.
Fig.15: 16HBE treated with PAOM mix. Sample treated with 1:20 PAOM, two different magnifications. Cells were treated for 6 hours.
Specific effects of PAOM: The three different PAOM mixes were tested to see
the specific effect of Pseudomonas to cause disruption of tight junction proteins.
In particular, the effect on ZO-1 was assessed. Considering the results of the
68
previous experiment, the 16 HBE were treated for only 1 hour with the three
different mixes; at the end of the treatment, protein isolation and western blot
procedure were carried for ZO-1. This protein was chosen in line with the results
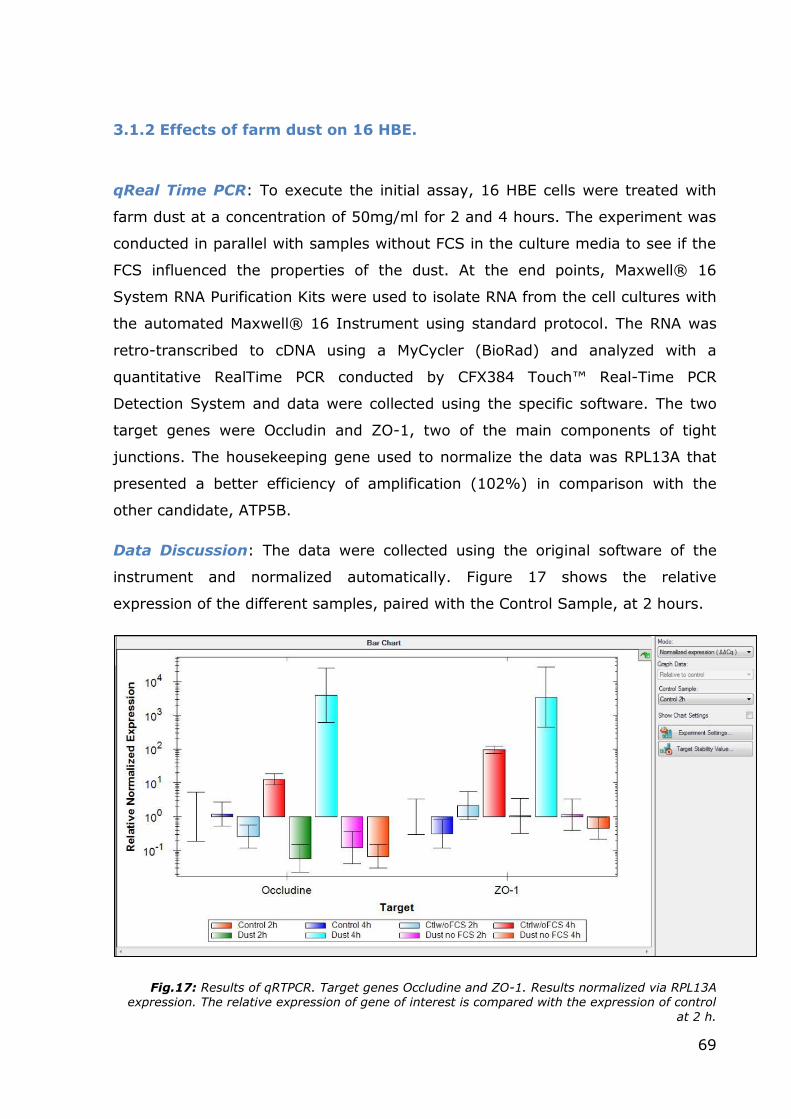
of previous experiments. As expected, linearity was found between the increased
disruption of ZO-1 and a more concentrated mix. Results are shown in Figure 16.
Fig.16: Western Blot vs ZO-1 using three different dilutions of PAOM. The columns are displayed in the following order: Control, 1:5, 1:10 and 1:20. A partial disruption of the protein was achieved
only with the 1:20 mix, while the use of the more concentrated mixes resulted in the destruction of the protein of interest
69
3.1.2 Effects of farm dust on 16 HBE.
qReal Time PCR: To execute the initial assay, 16 HBE cells were treated with
farm dust at a concentration of 50mg/ml for 2 and 4 hours. The experiment was
conducted in parallel with samples without FCS in the culture media to see if the
FCS influenced the properties of the dust. At the end points, Maxwell® 16
System RNA Purification Kits were used to isolate RNA from the cell cultures with
the automated Maxwell® 16 Instrument using standard protocol. The RNA was
retro-transcribed to cDNA using a MyCycler (BioRad) and analyzed with a
quantitative RealTime PCR conducted by CFX384 Touch™ Real-Time PCR
Detection System and data were collected using the specific software. The two
target genes were Occludin and ZO-1, two of the main components of tight
junctions. The housekeeping gene used to normalize the data was RPL13A that
presented a better efficiency of amplification (102%) in comparison with the
other candidate, ATP5B.
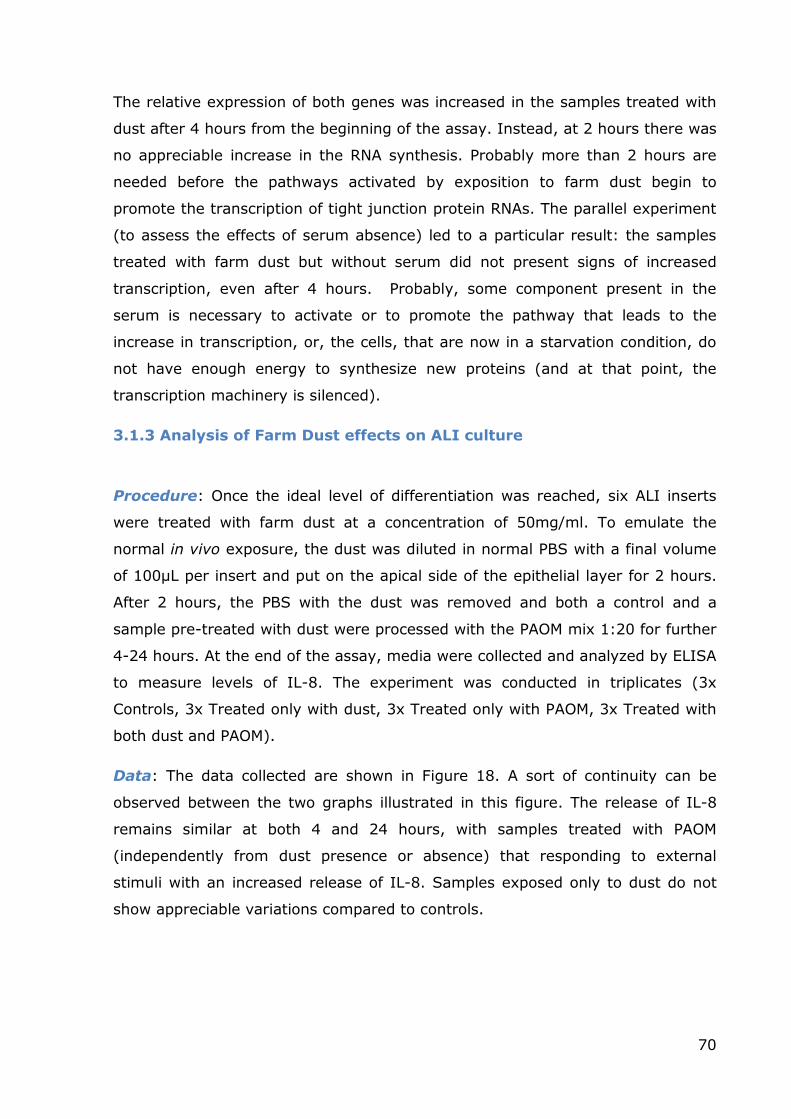
Data Discussion: The data were collected using the original software of the
instrument and normalized automatically. Figure 17 shows the relative
expression of the different samples, paired with the Control Sample, at 2 hours.
Fig.17: Results of qRTPCR. Target genes Occludine and ZO-1. Results normalized via RPL13A expression. The relative expression of gene of interest is compared with the expression of control
at 2 h.
70
The relative expression of both genes was increased in the samples treated with
dust after 4 hours from the beginning of the assay. Instead, at 2 hours there was
no appreciable increase in the RNA synthesis. Probably more than 2 hours are
needed before the pathways activated by exposition to farm dust begin to
promote the transcription of tight junction protein RNAs. The parallel experiment
(to assess the effects of serum absence) led to a particular result: the samples
treated with farm dust but without serum did not present signs of increased
transcription, even after 4 hours. Probably, some component present in the
serum is necessary to activate or to promote the pathway that leads to the
increase in transcription, or, the cells, that are now in a starvation condition, do
not have enough energy to synthesize new proteins (and at that point, the
transcription machinery is silenced).
3.1.3 Analysis of Farm Dust effects on ALI culture
Procedure: Once the ideal level of differentiation was reached, six ALI inserts
were treated with farm dust at a concentration of 50mg/ml. To emulate the
normal in vivo exposure, the dust was diluted in normal PBS with a final volume
of 100µL per insert and put on the apical side of the epithelial layer for 2 hours.
After 2 hours, the PBS with the dust was removed and both a control and a
sample pre-treated with dust were processed with the PAOM mix 1:20 for further
4-24 hours. At the end of the assay, media were collected and analyzed by ELISA
to measure levels of IL-8. The experiment was conducted in triplicates (3x
Controls, 3x Treated only with dust, 3x Treated only with PAOM, 3x Treated with
both dust and PAOM).
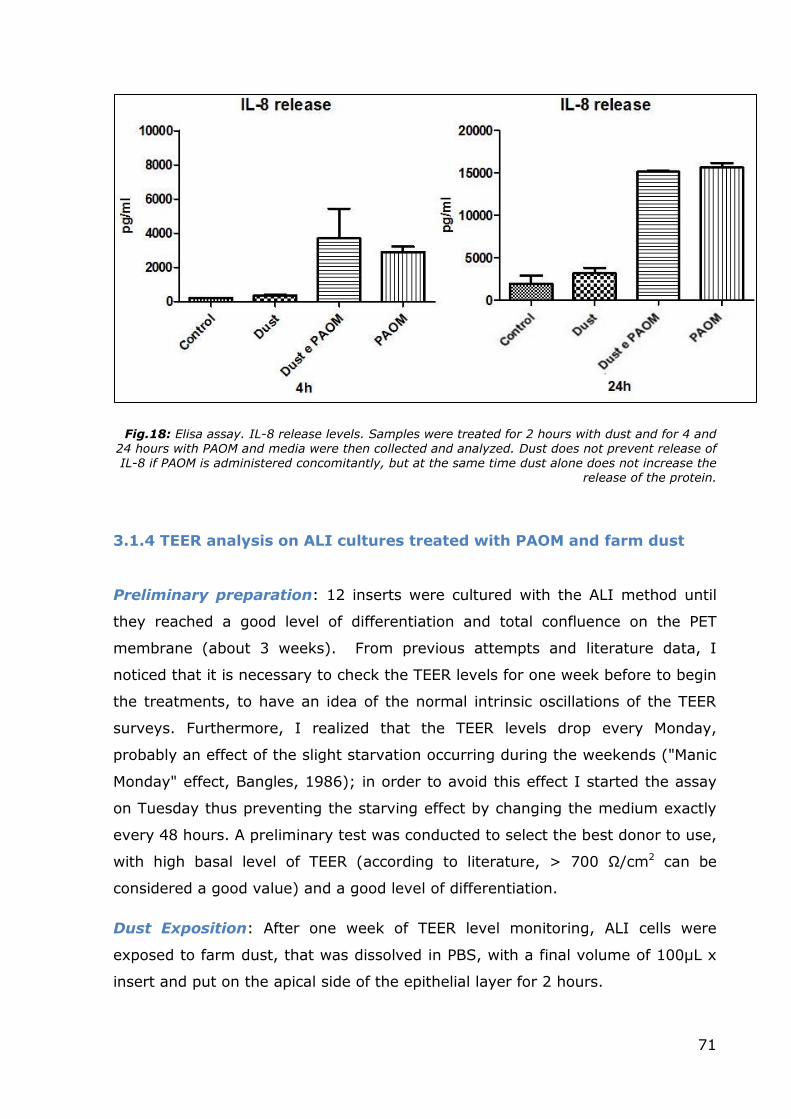
Data: The data collected are shown in Figure 18. A sort of continuity can be
observed between the two graphs illustrated in this figure. The release of IL-8
remains similar at both 4 and 24 hours, with samples treated with PAOM
(independently from dust presence or absence) that responding to external
stimuli with an increased release of IL-8. Samples exposed only to dust do not
show appreciable variations compared to controls.
71
Fig.18: Elisa assay. IL-8 release levels. Samples were treated for 2 hours with dust and for 4 and 24 hours with PAOM and media were then collected and analyzed. Dust does not prevent release of IL-8 if PAOM is administered concomitantly, but at the same time dust alone does not increase the
release of the protein.
3.1.4 TEER analysis on ALI cultures treated with PAOM and farm dust
Preliminary preparation: 12 inserts were cultured with the ALI method until
they reached a good level of differentiation and total confluence on the PET
membrane (about 3 weeks). From previous attempts and literature data, I
noticed that it is necessary to check the TEER levels for one week before to begin
the treatments, to have an idea of the normal intrinsic oscillations of the TEER
surveys. Furthermore, I realized that the TEER levels drop every Monday,
probably an effect of the slight starvation occurring during the weekends ("Manic
Monday" effect, Bangles, 1986); in order to avoid this effect I started the assay
on Tuesday thus preventing the starving effect by changing the medium exactly
every 48 hours. A preliminary test was conducted to select the best donor to use,
with high basal level of TEER (according to literature, > 700 Ω/cm2 can be
considered a good value) and a good level of differentiation.
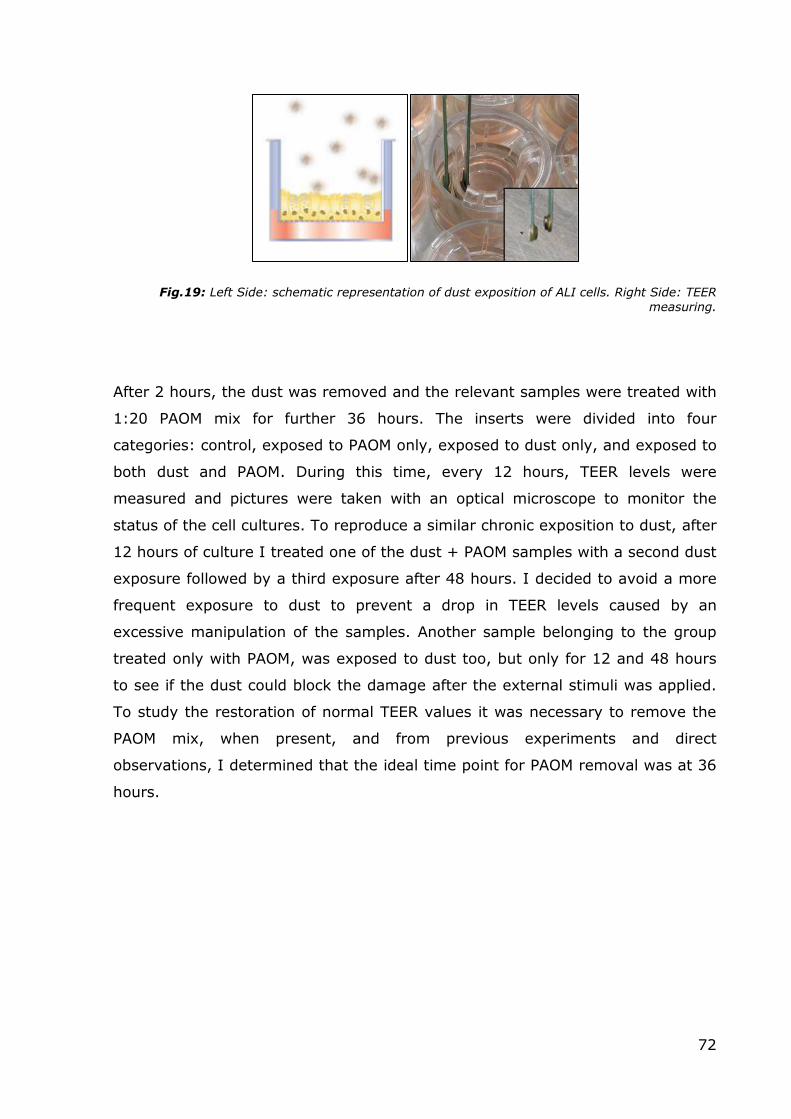
Dust Exposition: After one week of TEER level monitoring, ALI cells were
exposed to farm dust, that was dissolved in PBS, with a final volume of 100µL x
insert and put on the apical side of the epithelial layer for 2 hours.
72
Fig.19: Left Side: schematic representation of dust exposition of ALI cells. Right Side: TEER
measuring.
After 2 hours, the dust was removed and the relevant samples were treated with
1:20 PAOM mix for further 36 hours. The inserts were divided into four
categories: control, exposed to PAOM only, exposed to dust only, and exposed to
both dust and PAOM. During this time, every 12 hours, TEER levels were
measured and pictures were taken with an optical microscope to monitor the
status of the cell cultures. To reproduce a similar chronic exposition to dust, after
12 hours of culture I treated one of the dust + PAOM samples with a second dust
exposure followed by a third exposure after 48 hours. I decided to avoid a more
frequent exposure to dust to prevent a drop in TEER levels caused by an
excessive manipulation of the samples. Another sample belonging to the group
treated only with PAOM, was exposed to dust too, but only for 12 and 48 hours
to see if the dust could block the damage after the external stimuli was applied.
To study the restoration of normal TEER values it was necessary to remove the
PAOM mix, when present, and from previous experiments and direct
observations, I determined that the ideal time point for PAOM removal was at 36
hours.
73
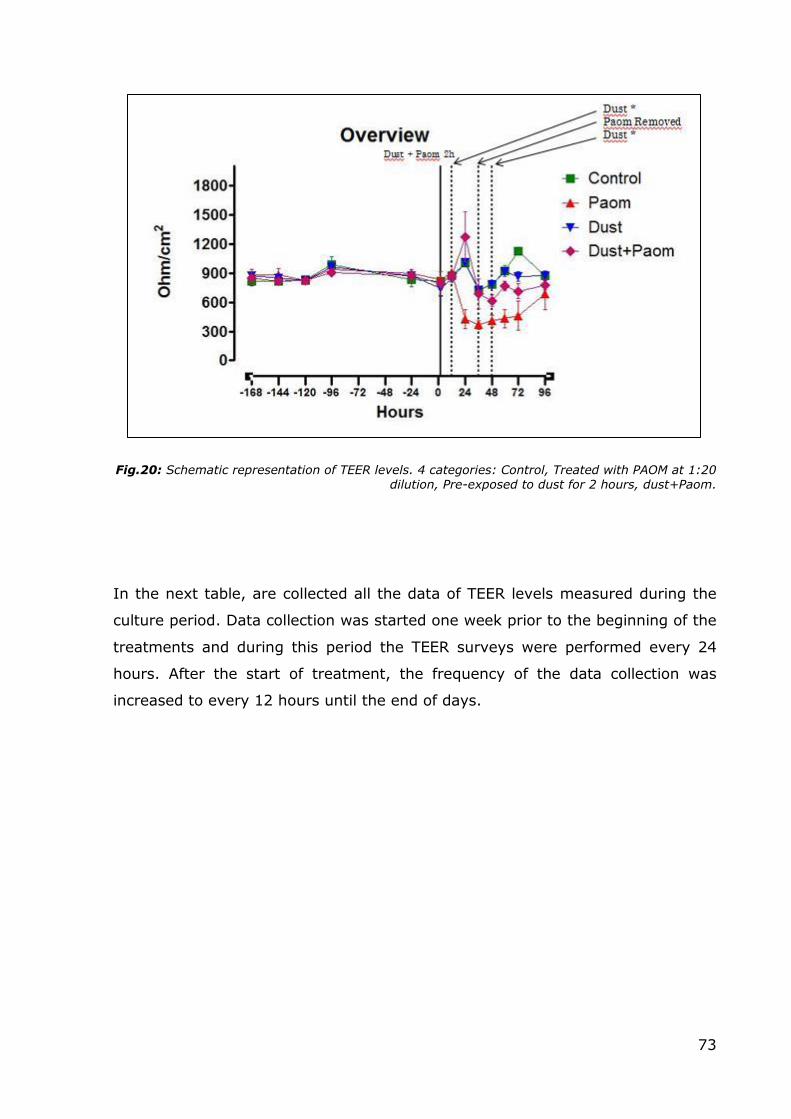
Fig.20: Schematic representation of TEER levels. 4 categories: Control, Treated with PAOM at 1:20 dilution, Pre-exposed to dust for 2 hours, dust+Paom.
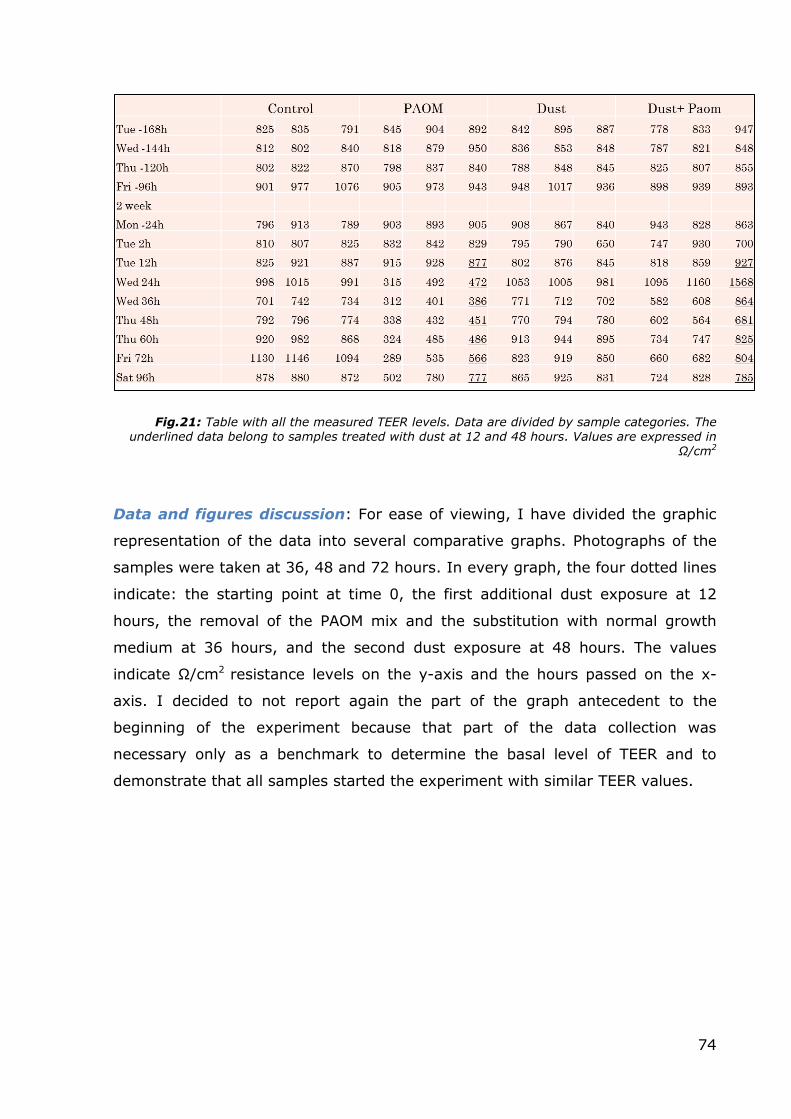
In the next table, are collected all the data of TEER levels measured during the
culture period. Data collection was started one week prior to the beginning of the
treatments and during this period the TEER surveys were performed every 24
hours. After the start of treatment, the frequency of the data collection was
increased to every 12 hours until the end of days.
74
Fig.21: Table with all the measured TEER levels. Data are divided by sample categories. The underlined data belong to samples treated with dust at 12 and 48 hours. Values are expressed in
Ω/cm2
Data and figures discussion: For ease of viewing, I have divided the graphic
representation of the data into several comparative graphs. Photographs of the
samples were taken at 36, 48 and 72 hours. In every graph, the four dotted lines
indicate: the starting point at time 0, the first additional dust exposure at 12
hours, the removal of the PAOM mix and the substitution with normal growth
medium at 36 hours, and the second dust exposure at 48 hours. The values
indicate Ω/cm2 resistance levels on the y-axis and the hours passed on the x-
axis. I decided to not report again the part of the graph antecedent to the
beginning of the experiment because that part of the data collection was
necessary only as a benchmark to determine the basal level of TEER and to
demonstrate that all samples started the experiment with similar TEER values.
75
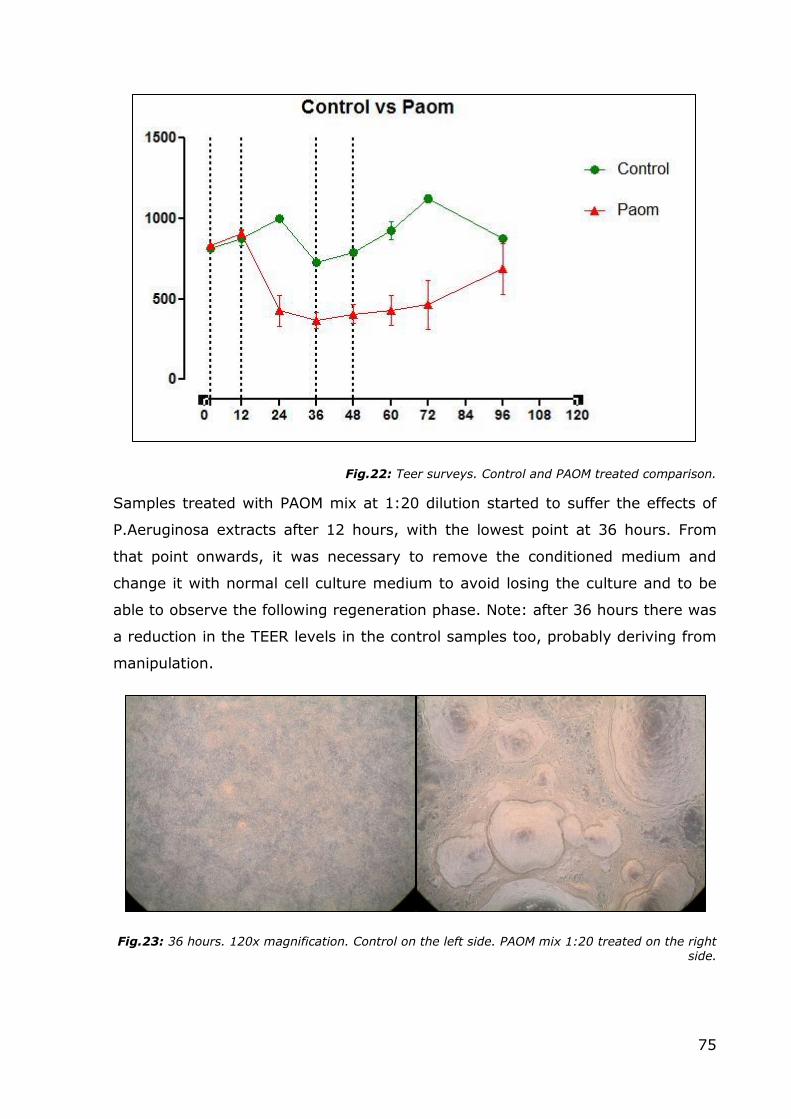
Fig.22: Teer surveys. Control and PAOM treated comparison.
Samples treated with PAOM mix at 1:20 dilution started to suffer the effects of
P.Aeruginosa extracts after 12 hours, with the lowest point at 36 hours. From
that point onwards, it was necessary to remove the conditioned medium and
change it with normal cell culture medium to avoid losing the culture and to be
able to observe the following regeneration phase. Note: after 36 hours there was
a reduction in the TEER levels in the control samples too, probably deriving from
manipulation.
Fig.23: 36 hours. 120x magnification. Control on the left side. PAOM mix 1:20 treated on the right side.
76
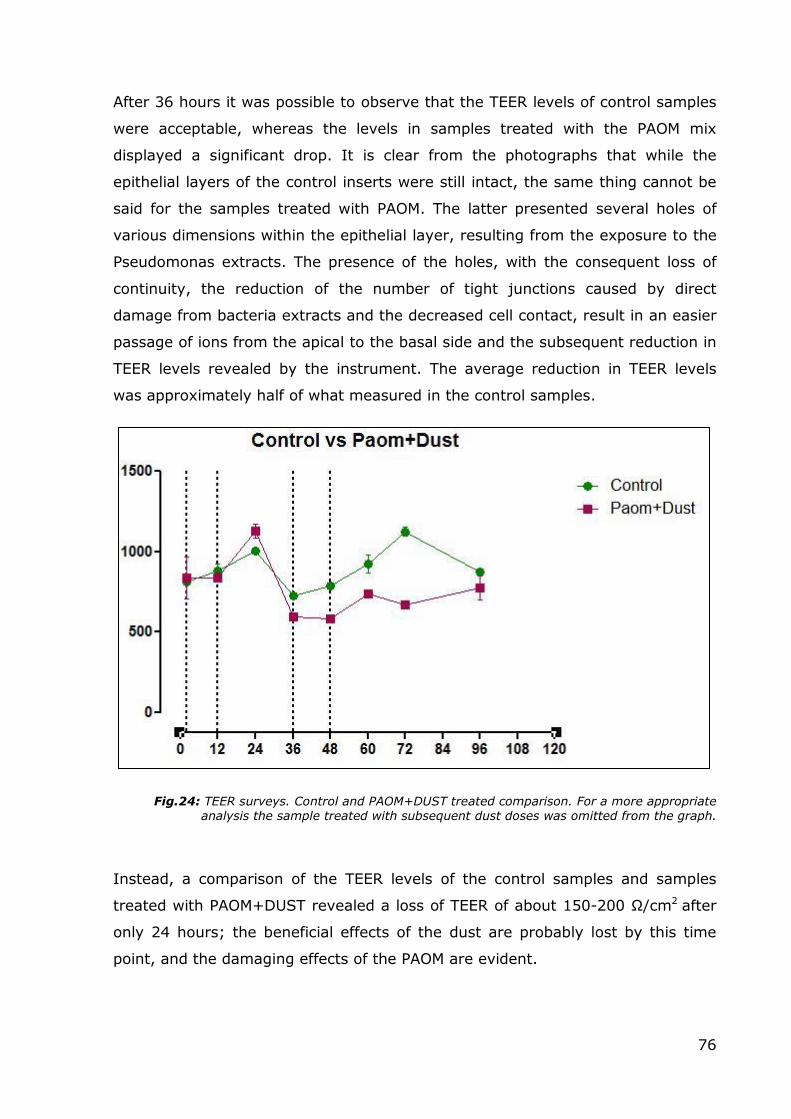
After 36 hours it was possible to observe that the TEER levels of control samples
were acceptable, whereas the levels in samples treated with the PAOM mix
displayed a significant drop. It is clear from the photographs that while the
epithelial layers of the control inserts were still intact, the same thing cannot be
said for the samples treated with PAOM. The latter presented several holes of
various dimensions within the epithelial layer, resulting from the exposure to the
Pseudomonas extracts. The presence of the holes, with the consequent loss of
continuity, the reduction of the number of tight junctions caused by direct
damage from bacteria extracts and the decreased cell contact, result in an easier
passage of ions from the apical to the basal side and the subsequent reduction in
TEER levels revealed by the instrument. The average reduction in TEER levels
was approximately half of what measured in the control samples.
Fig.24: TEER surveys. Control and PAOM+DUST treated comparison. For a more appropriate analysis the sample treated with subsequent dust doses was omitted from the graph.
Instead, a comparison of the TEER levels of the control samples and samples
treated with PAOM+DUST revealed a loss of TEER of about 150-200 Ω/cm2 after
only 24 hours; the beneficial effects of the dust are probably lost by this time
point, and the damaging effects of the PAOM are evident.
77
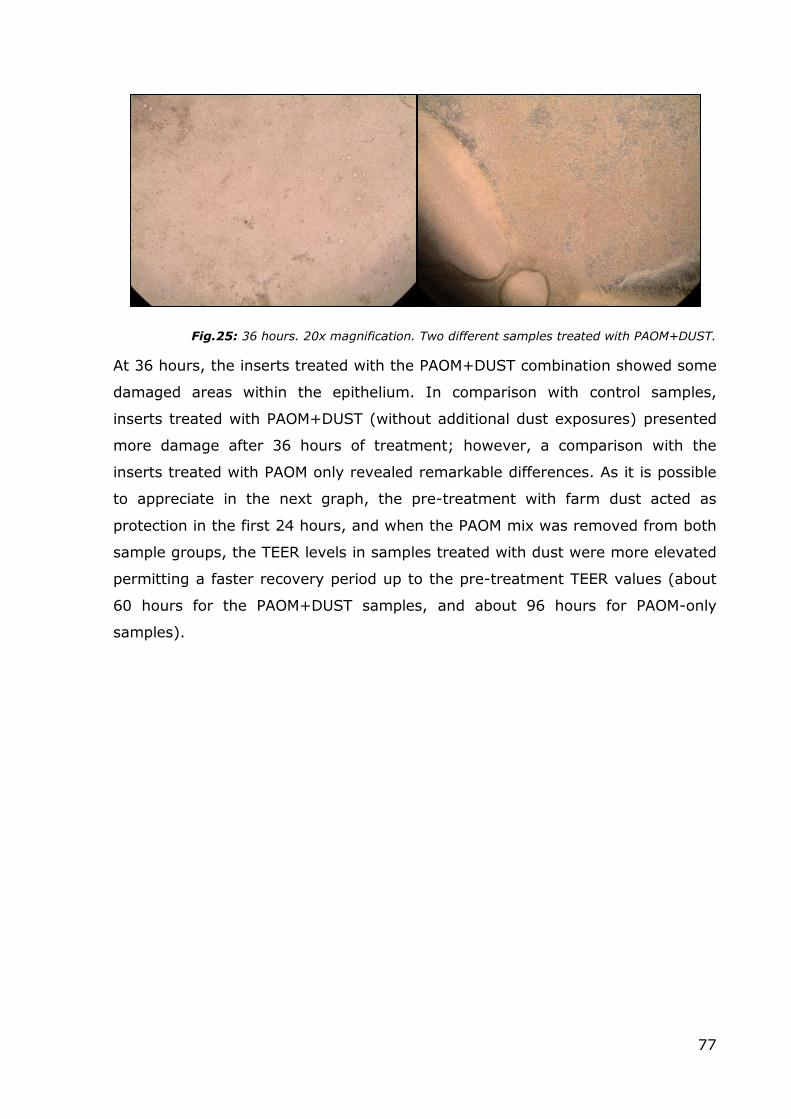
Fig.25: 36 hours. 20x magnification. Two different samples treated with PAOM+DUST.
At 36 hours, the inserts treated with the PAOM+DUST combination showed some
damaged areas within the epithelium. In comparison with control samples,
inserts treated with PAOM+DUST (without additional dust exposures) presented
more damage after 36 hours of treatment; however, a comparison with the
inserts treated with PAOM only revealed remarkable differences. As it is possible
to appreciate in the next graph, the pre-treatment with farm dust acted as
protection in the first 24 hours, and when the PAOM mix was removed from both
sample groups, the TEER levels in samples treated with dust were more elevated
permitting a faster recovery period up to the pre-treatment TEER values (about
60 hours for the PAOM+DUST samples, and about 96 hours for PAOM-only
samples).
78
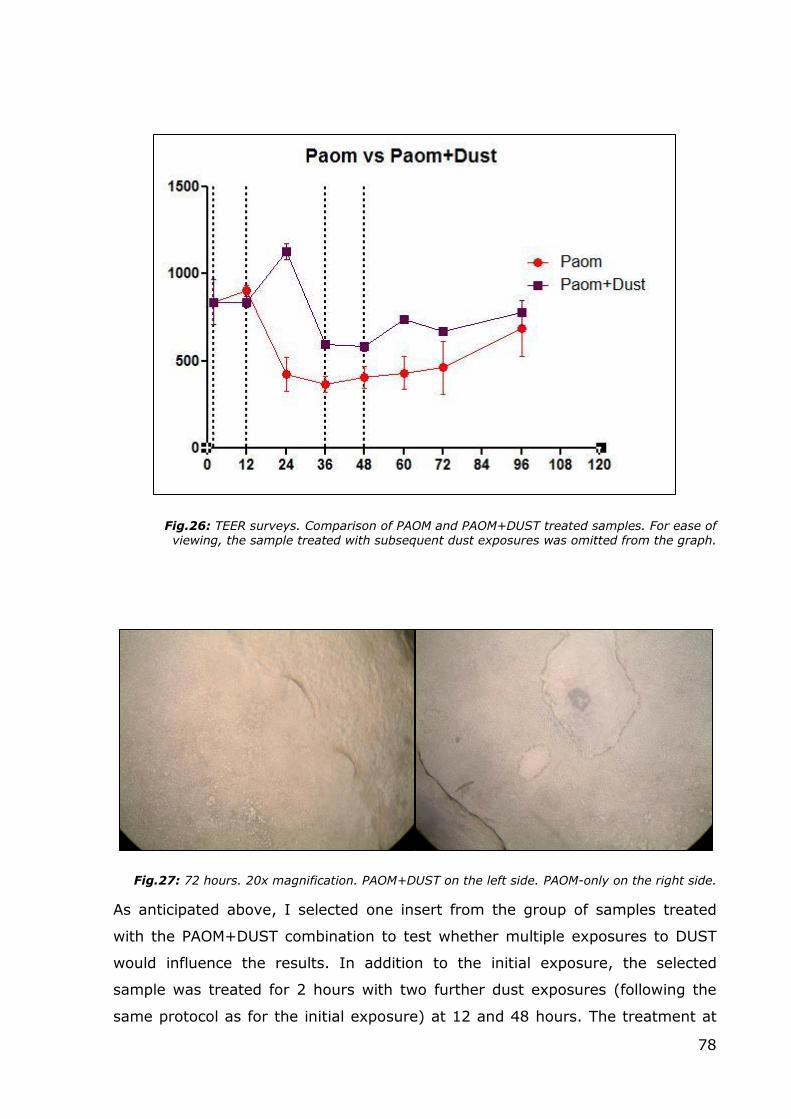
Fig.26: TEER surveys. Comparison of PAOM and PAOM+DUST treated samples. For ease of viewing, the sample treated with subsequent dust exposures was omitted from the graph.
Fig.27: 72 hours. 20x magnification. PAOM+DUST on the left side. PAOM-only on the right side.
As anticipated above, I selected one insert from the group of samples treated
with the PAOM+DUST combination to test whether multiple exposures to DUST
would influence the results. In addition to the initial exposure, the selected
sample was treated for 2 hours with two further dust exposures (following the
same protocol as for the initial exposure) at 12 and 48 hours. The treatment at
79
12 hours was intended to simulate a continuous exposure to farm dust during
the concomitant presence of an external stimulus. The second treatment at 48
hours, following the removal of the PAOM mix, was carried out to assess if the
dust would exert any regenerative effects. These additional exposures were
performed on a sample treated with the PAOM mix, but not with the initial pre-
treatment with farm dust at -2 hours, in order to evaluate whether the dust
exposure would still have protective effects after the damage caused by P.A.
extracts, and whether the hypothetical regenerative characteristics of dust are
effective on damaged tissue.
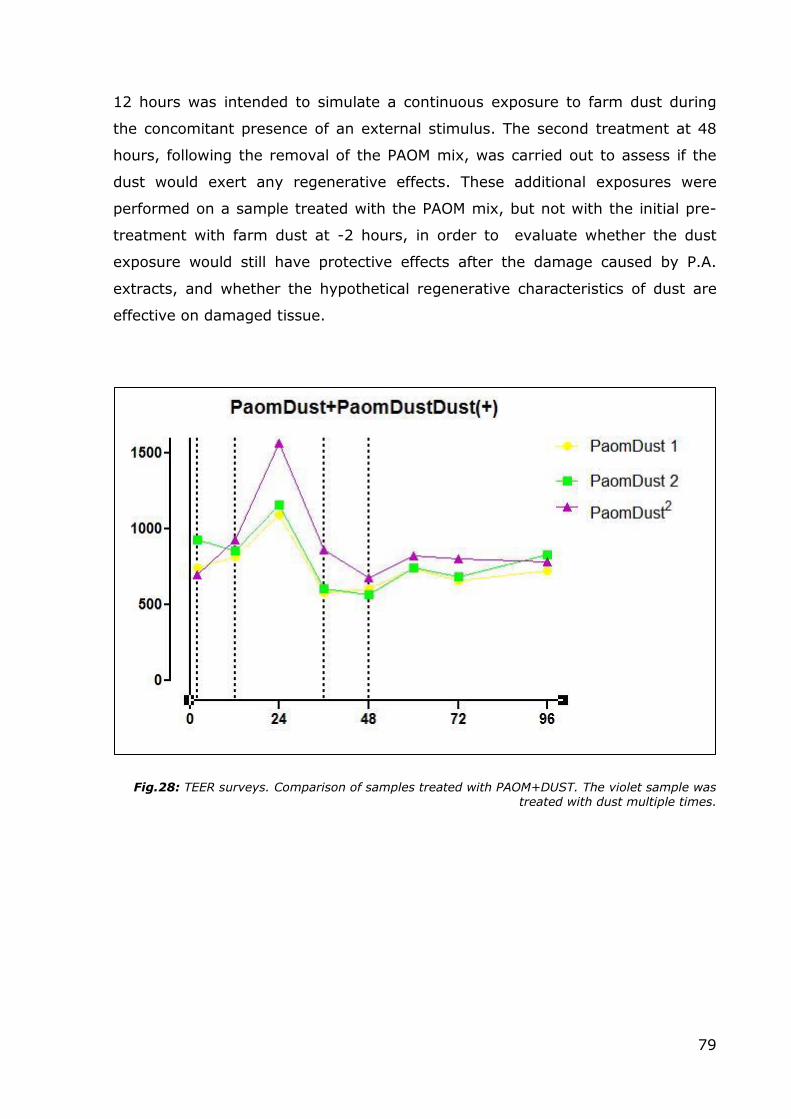
Fig.28: TEER surveys. Comparison of samples treated with PAOM+DUST. The violet sample was treated with dust multiple times.
80
.
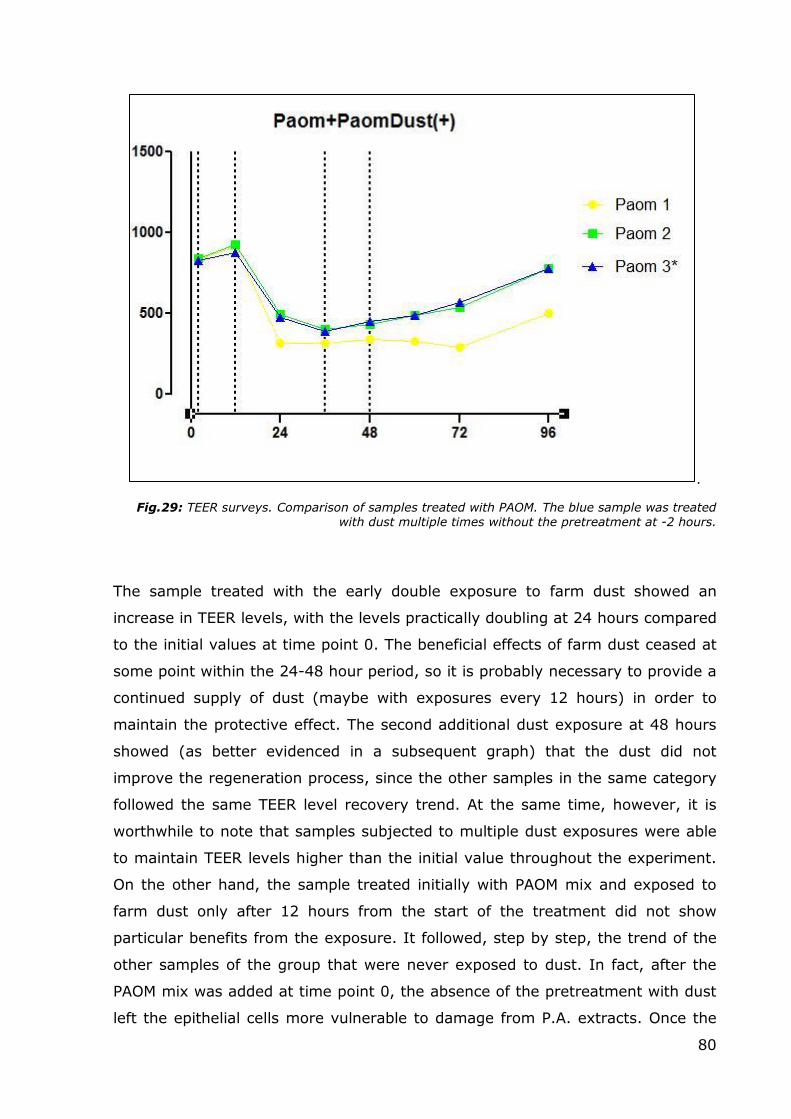
Fig.29: TEER surveys. Comparison of samples treated with PAOM. The blue sample was treated with dust multiple times without the pretreatment at -2 hours.
The sample treated with the early double exposure to farm dust showed an
increase in TEER levels, with the levels practically doubling at 24 hours compared
to the initial values at time point 0. The beneficial effects of farm dust ceased at
some point within the 24-48 hour period, so it is probably necessary to provide a
continued supply of dust (maybe with exposures every 12 hours) in order to
maintain the protective effect. The second additional dust exposure at 48 hours
showed (as better evidenced in a subsequent graph) that the dust did not
improve the regeneration process, since the other samples in the same category
followed the same TEER level recovery trend. At the same time, however, it is
worthwhile to note that samples subjected to multiple dust exposures were able
to maintain TEER levels higher than the initial value throughout the experiment.
On the other hand, the sample treated initially with PAOM mix and exposed to
farm dust only after 12 hours from the start of the treatment did not show
particular benefits from the exposure. It followed, step by step, the trend of the
other samples of the group that were never exposed to dust. In fact, after the
PAOM mix was added at time point 0, the absence of the pretreatment with dust
left the epithelial cells more vulnerable to damage from P.A. extracts. Once the
81
damage has been caused, the protective mechanism probably fails. Likewise, the
second additional exposure to dust at 48 hours to evaluate the eventual
regenerative properties gave negative results. The sample treated with dust
followed the same TEER variation trends of untreated samples, and in this
particular case, the levels were practically identical.
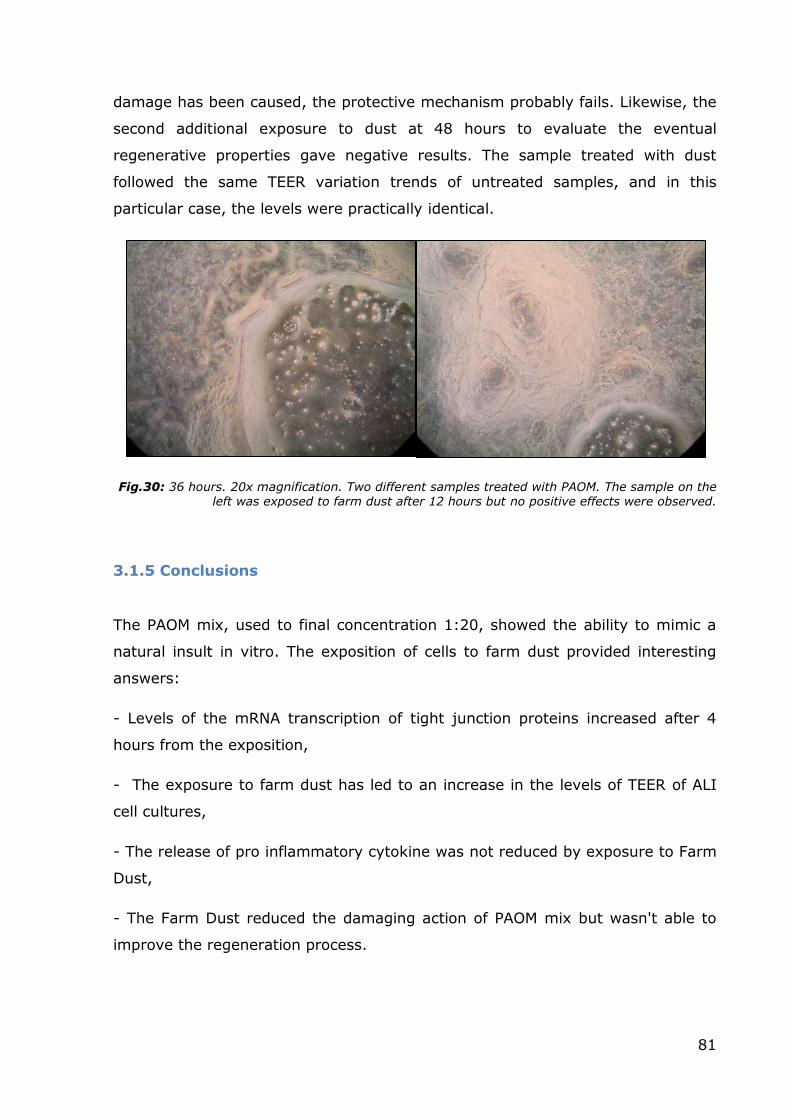
Fig.30: 36 hours. 20x magnification. Two different samples treated with PAOM. The sample on the left was exposed to farm dust after 12 hours but no positive effects were observed.
3.1.5 Conclusions
The PAOM mix, used to final concentration 1:20, showed the ability to mimic a
natural insult in vitro. The exposition of cells to farm dust provided interesting
answers:
- Levels of the mRNA transcription of tight junction proteins increased after 4
hours from the exposition,
- The exposure to farm dust has led to an increase in the levels of TEER of ALI
cell cultures,
- The release of pro inflammatory cytokine was not reduced by exposure to Farm
Dust,
- The Farm Dust reduced the damaging action of PAOM mix but wasn't able to
improve the regeneration process.
82
3.2 Application of Human Bronchial Outgrowths to study
Ciliogenesis
Aims: Ciliary shortening and dysfunction are known features of moderate to
severe asthma (Thomas, 2010) that are also strongly associated with cigarette
smoke (Lam, 2013). To date however, the lack of a proper in vitro model in
which to study these phenomena has severely impaired any real progress in our
understanding of the underlying mechanisms. My hypothesis was that the human
bronchial outgrowth model is well suited for studying ciliogenesis and testing the
effects of CSE on the regeneration of ciliated elements. The inherent features of
the model (long term culture, high resistance to damage compared to monolayer
culture models, three-dimensionality, signaling between the epithelial and
connective cell populations) offer the possibility to carry out long-term
treatments and assess responses to external stimuli. In order to carry out this
study, five non-smoking subjects with no relevant airways pathologies were
recruited, and bronchial outgrowths were prepared as explained in the Methods
chapter.
3.2.1 Phase Contrast Monitoring
After the 3D outgrowths were prepared and put in culture, they were routinely
photographed before and after treatment to record any morphological changes
occurring in the cells that constitute the mucosa reproduced in vitro. An inverted
light microscope equipped with phase contrast rings (LEICA DM-IRB) was used to
visualize changes in cell morphology, size and macroscopic modifications; these
were recorded by digital photography.
Phase contrast microscopy showed that the “outgrowth” of the cells from the
central biopsy was gradual, with the fibroblast initially forming a network of
spindly cells and epithelial cells appearing only later on the apical side of this cell
network.
83
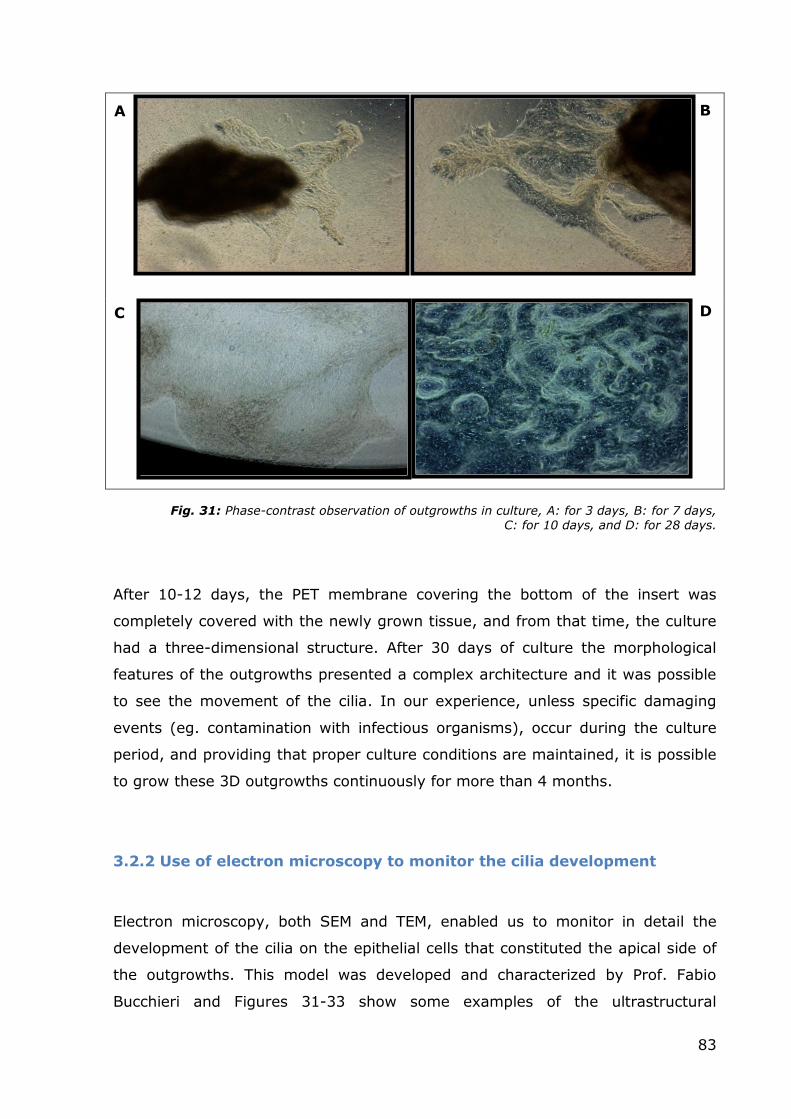
Fig. 31: Phase-contrast observation of outgrowths in culture, A: for 3 days, B: for 7 days, C: for 10 days, and D: for 28 days.
After 10-12 days, the PET membrane covering the bottom of the insert was
completely covered with the newly grown tissue, and from that time, the culture
had a three-dimensional structure. After 30 days of culture the morphological
features of the outgrowths presented a complex architecture and it was possible
to see the movement of the cilia. In our experience, unless specific damaging
events (eg. contamination with infectious organisms), occur during the culture
period, and providing that proper culture conditions are maintained, it is possible
to grow these 3D outgrowths continuously for more than 4 months.
3.2.2 Use of electron microscopy to monitor the cilia development
Electron microscopy, both SEM and TEM, enabled us to monitor in detail the
development of the cilia on the epithelial cells that constituted the apical side of
the outgrowths. This model was developed and characterized by Prof. Fabio
Bucchieri and Figures 31-33 show some examples of the ultrastructural
B A
C D
84
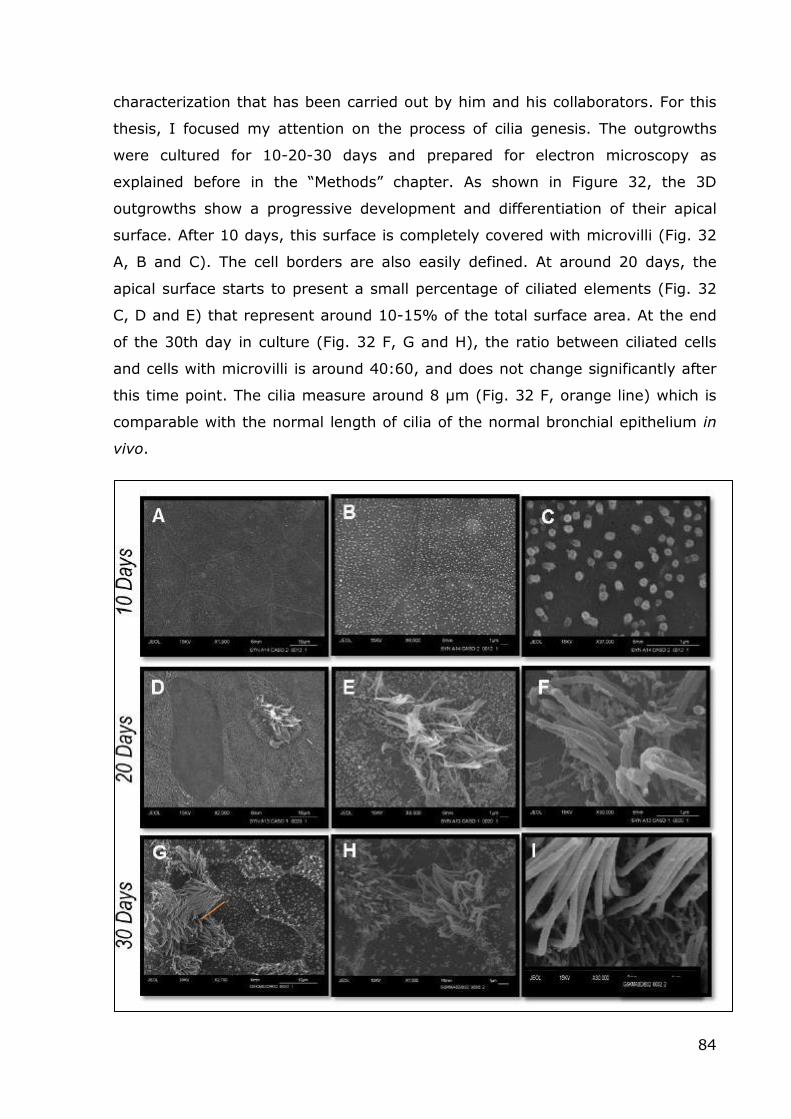
characterization that has been carried out by him and his collaborators. For this
thesis, I focused my attention on the process of cilia genesis. The outgrowths
were cultured for 10-20-30 days and prepared for electron microscopy as
explained before in the “Methods” chapter. As shown in Figure 32, the 3D
outgrowths show a progressive development and differentiation of their apical
surface. After 10 days, this surface is completely covered with microvilli (Fig. 32
A, B and C). The cell borders are also easily defined. At around 20 days, the
apical surface starts to present a small percentage of ciliated elements (Fig. 32
C, D and E) that represent around 10-15% of the total surface area. At the end
of the 30th day in culture (Fig. 32 F, G and H), the ratio between ciliated cells
and cells with microvilli is around 40:60, and does not change significantly after
this time point. The cilia measure around 8 μm (Fig. 32 F, orange line) which is
comparable with the normal length of cilia of the normal bronchial epithelium in
vivo.
85
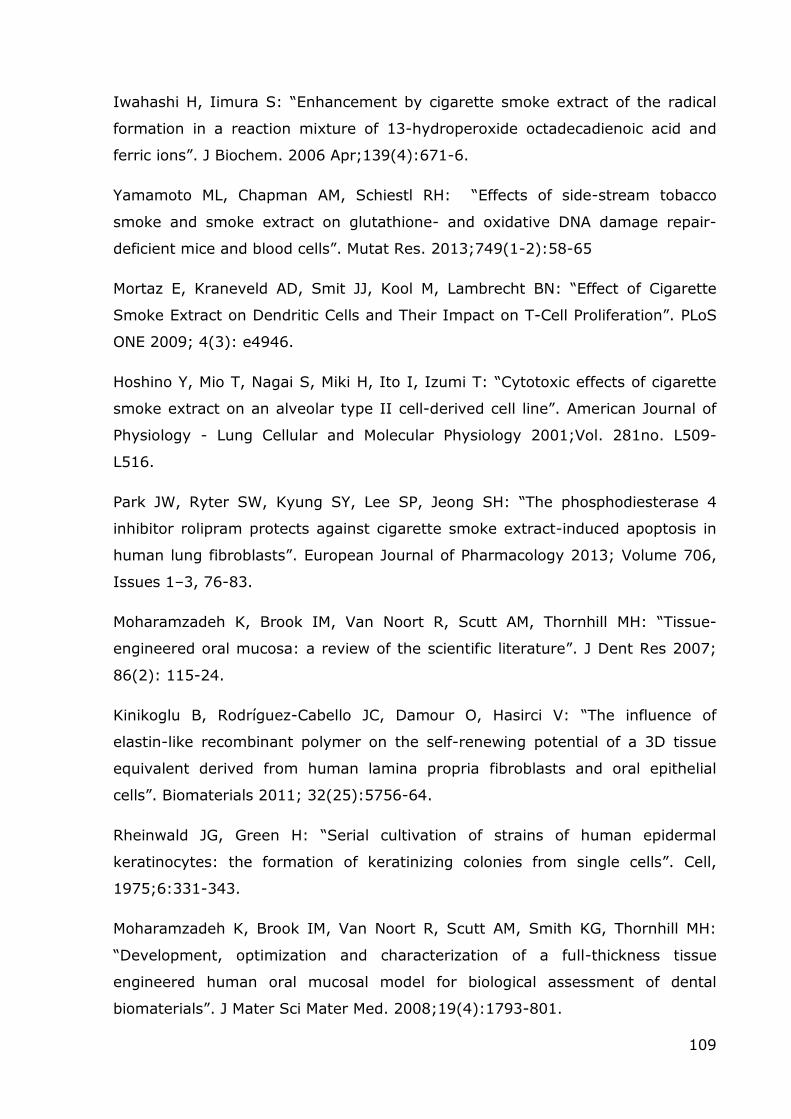
Fig.32: SEM monitoring during the first 30 days of culture. It was possible to see the new
ciliate elements starting to emerge at around 20 days in culture, and the final proportion between cells with cilia and cells with microvilli was achieved after a month in culture.
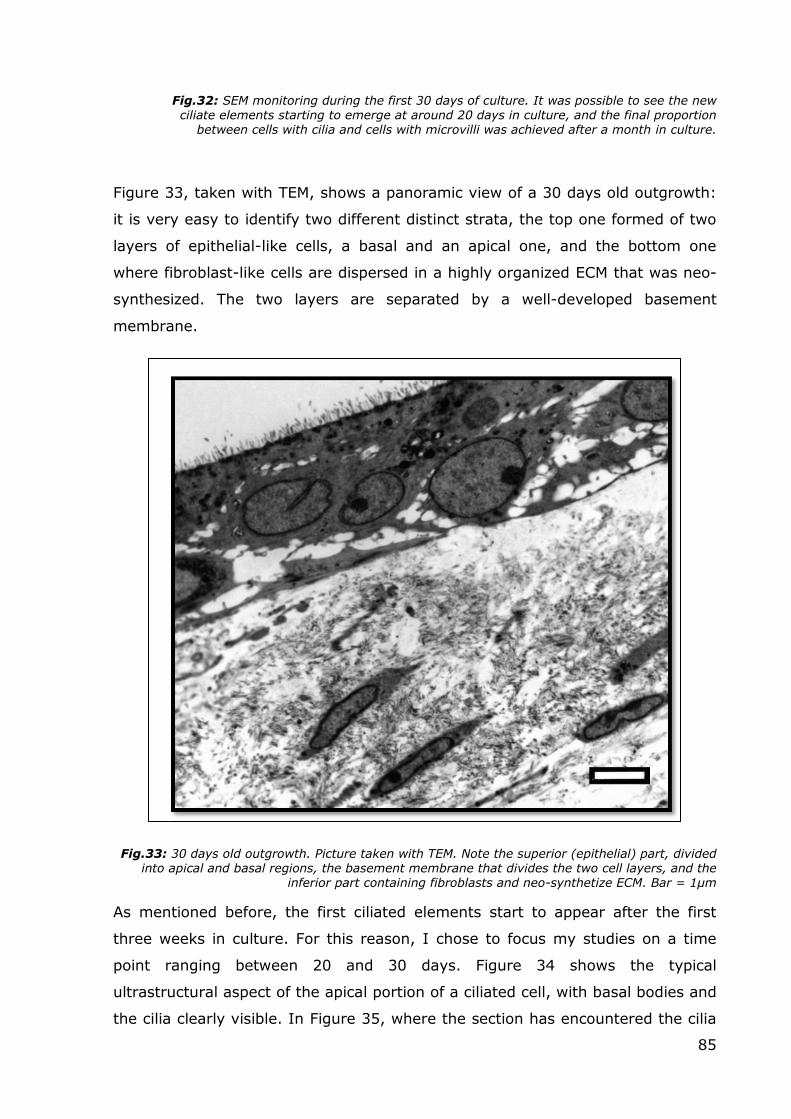
Figure 33, taken with TEM, shows a panoramic view of a 30 days old outgrowth:
it is very easy to identify two different distinct strata, the top one formed of two
layers of epithelial-like cells, a basal and an apical one, and the bottom one
where fibroblast-like cells are dispersed in a highly organized ECM that was neo-
synthesized. The two layers are separated by a well-developed basement
membrane.
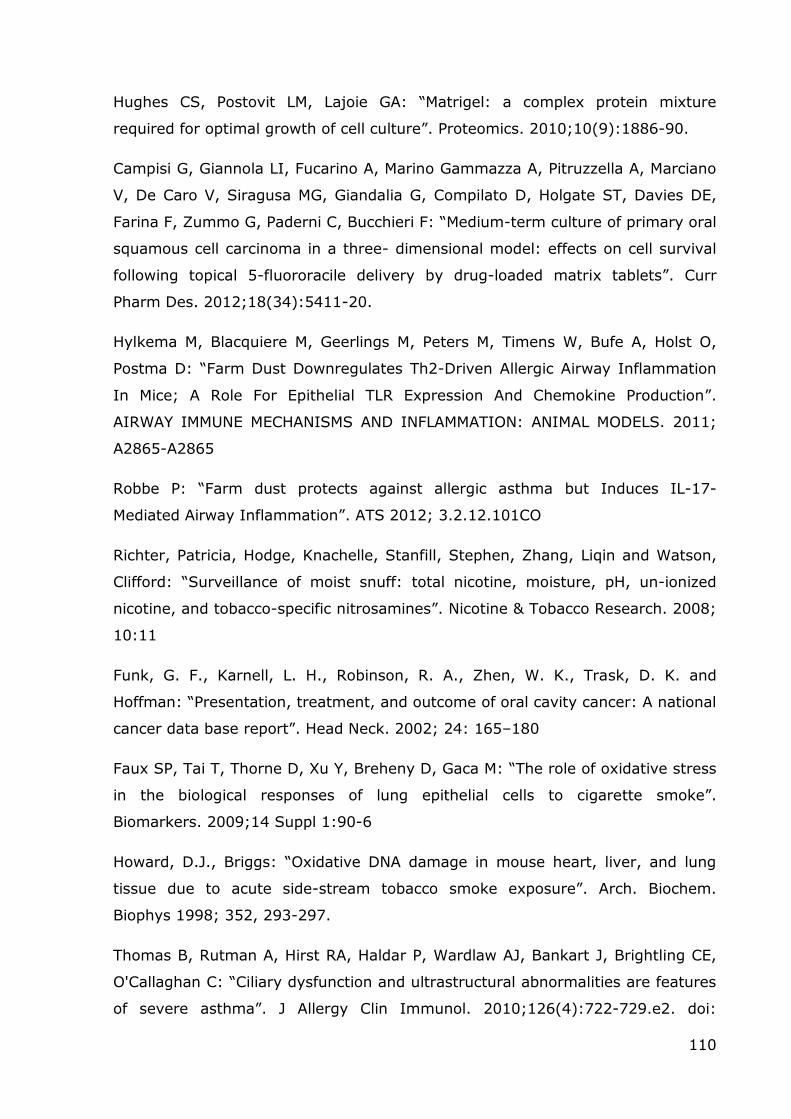
Fig.33: 30 days old outgrowth. Picture taken with TEM. Note the superior (epithelial) part, divided into apical and basal regions, the basement membrane that divides the two cell layers, and the
inferior part containing fibroblasts and neo-synthetize ECM. Bar = 1µm
As mentioned before, the first ciliated elements start to appear after the first
three weeks in culture. For this reason, I chose to focus my studies on a time
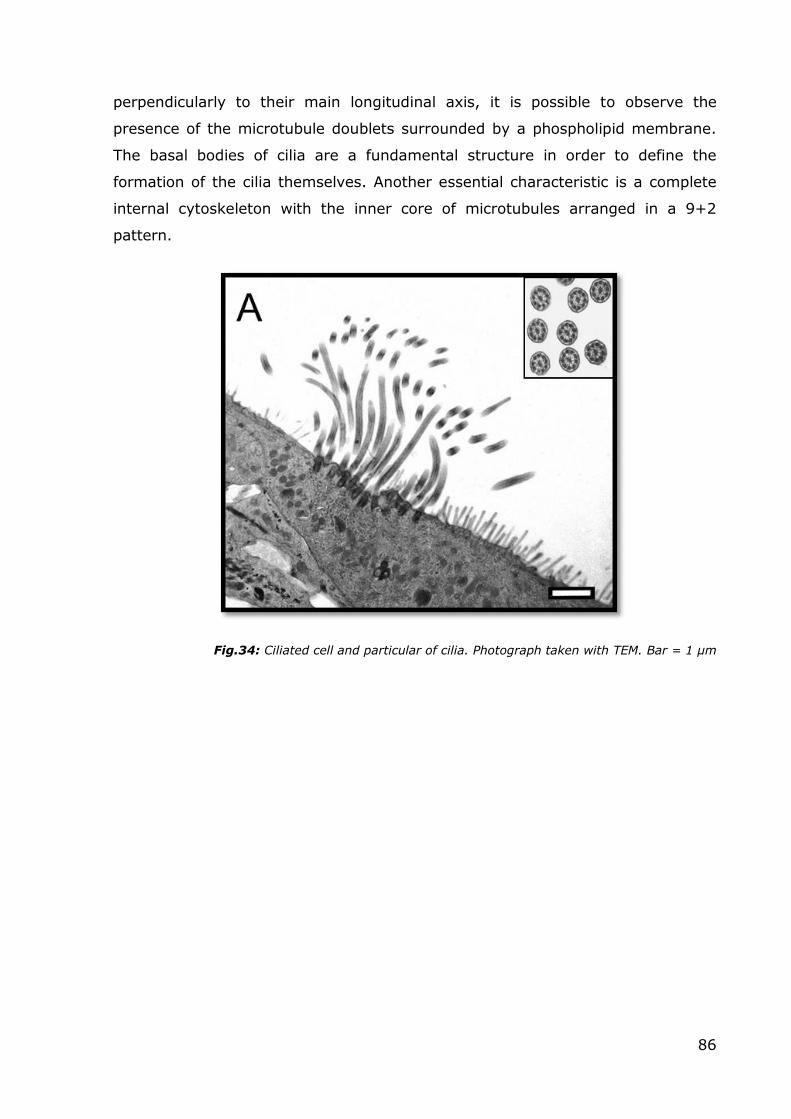
point ranging between 20 and 30 days. Figure 34 shows the typical
ultrastructural aspect of the apical portion of a ciliated cell, with basal bodies and
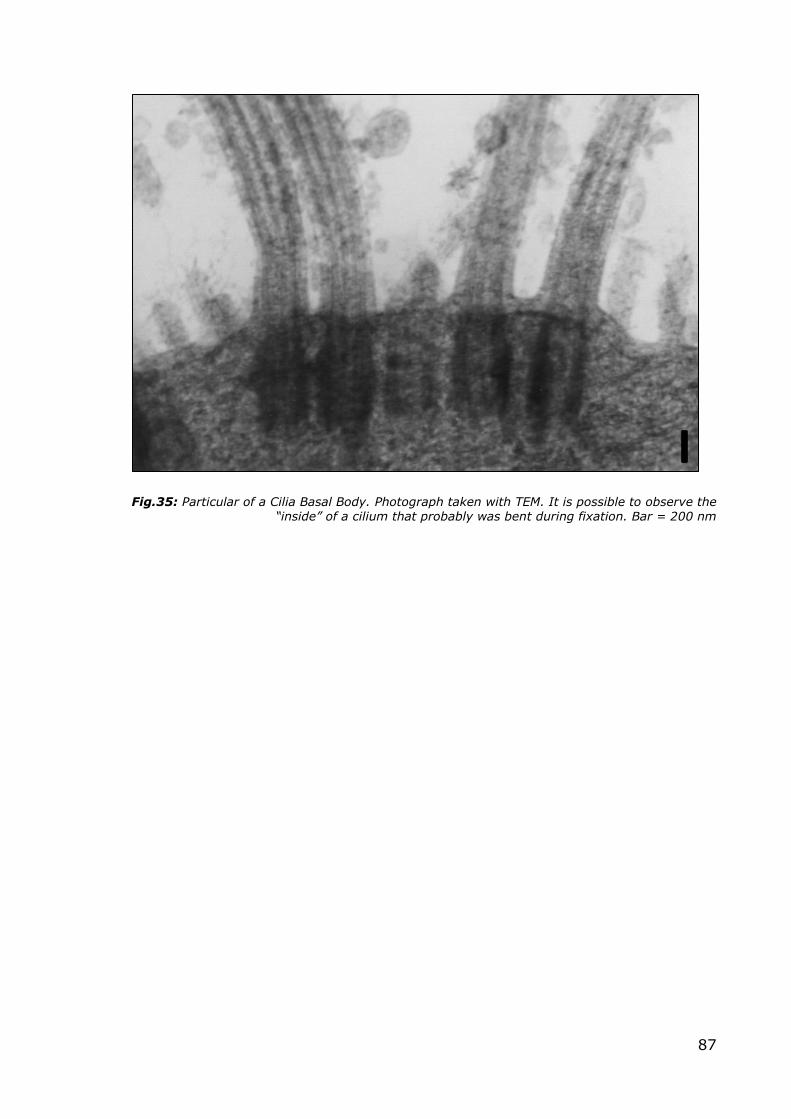
the cilia clearly visible. In Figure 35, where the section has encountered the cilia
86
perpendicularly to their main longitudinal axis, it is possible to observe the
presence of the microtubule doublets surrounded by a phospholipid membrane.
The basal bodies of cilia are a fundamental structure in order to define the
formation of the cilia themselves. Another essential characteristic is a complete
internal cytoskeleton with the inner core of microtubules arranged in a 9+2
pattern.
Fig.34: Ciliated cell and particular of cilia. Photograph taken with TEM. Bar = 1 µm
87
Fig.35: Particular of a Cilia Basal Body. Photograph taken with TEM. It is possible to observe the “inside” of a cilium that probably was bent during fixation. Bar = 200 nm
88
3.2.3 CSE treatments and cilia regeneration
In order to study the alterations that the cilia undergo following long-term CSE
exposure, bronchial outgrowths were grown until complete differentiation
(approximately 30 days) and then treated (except for the untreated control) with
a mix of normal cell culture media mix (BEGM:DMEM 1:1) and a 20% CSE
preparation as explained above, up to 21 days.
This dose was chosen because it represents a good approximation of the amount
of CSE present in the bronchial mucosa of an average smoker (a subject that
smokes 15-20 cigarettes per day).
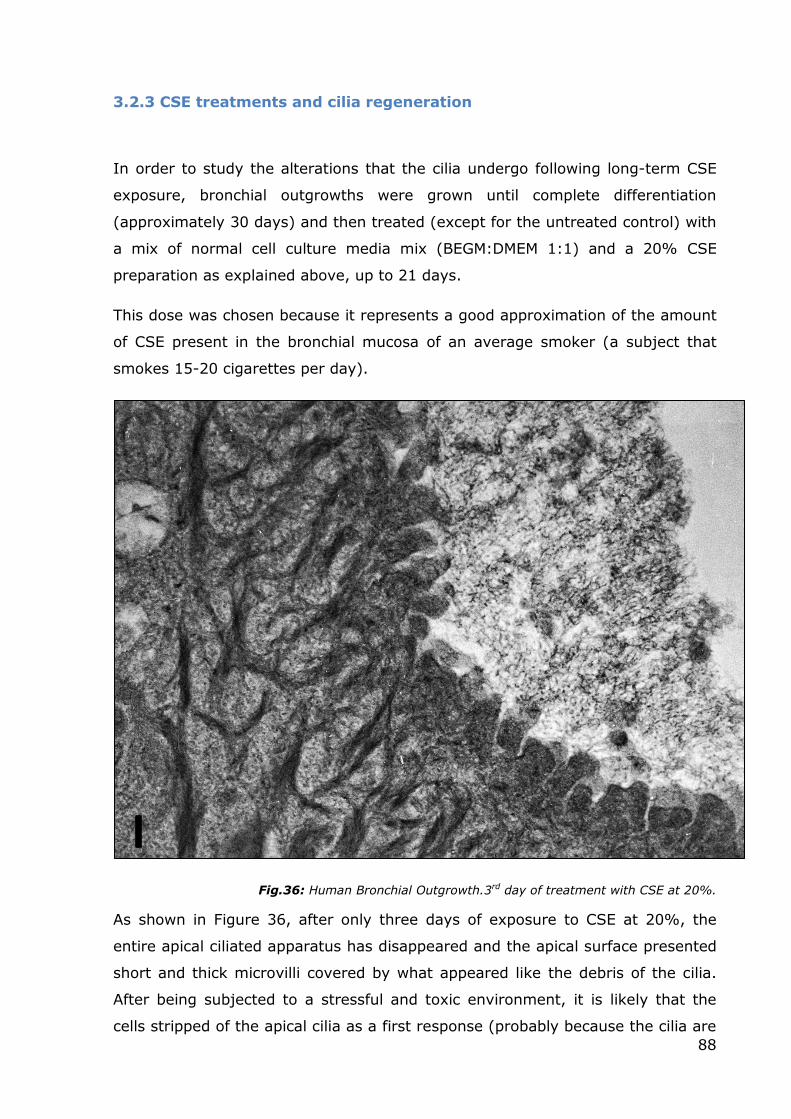
Fig.36: Human Bronchial Outgrowth.3rd day of treatment with CSE at 20%.
As shown in Figure 36, after only three days of exposure to CSE at 20%, the
entire apical ciliated apparatus has disappeared and the apical surface presented
short and thick microvilli covered by what appeared like the debris of the cilia.
After being subjected to a stressful and toxic environment, it is likely that the
cells stripped of the apical cilia as a first response (probably because the cilia are
89
a cause of energy expenditure) and immediately increased their membrane
surface with strips of microvilli to allow greater mucus secretion to defend
themselves from the external injury and to expel the toxic substances
penetrating inside.
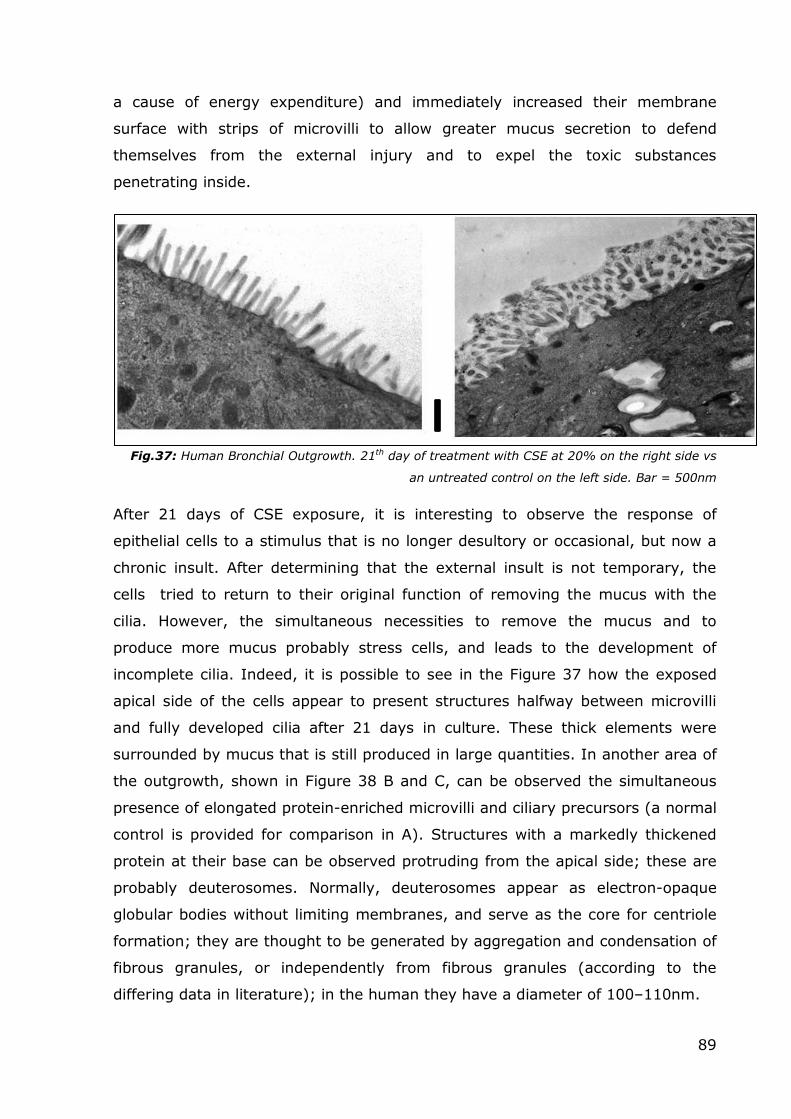
Fig.37: Human Bronchial Outgrowth. 21th day of treatment with CSE at 20% on the right side vs
an untreated control on the left side. Bar = 500nm
After 21 days of CSE exposure, it is interesting to observe the response of
epithelial cells to a stimulus that is no longer desultory or occasional, but now a
chronic insult. After determining that the external insult is not temporary, the
cells tried to return to their original function of removing the mucus with the
cilia. However, the simultaneous necessities to remove the mucus and to
produce more mucus probably stress cells, and leads to the development of
incomplete cilia. Indeed, it is possible to see in the Figure 37 how the exposed
apical side of the cells appear to present structures halfway between microvilli
and fully developed cilia after 21 days in culture. These thick elements were
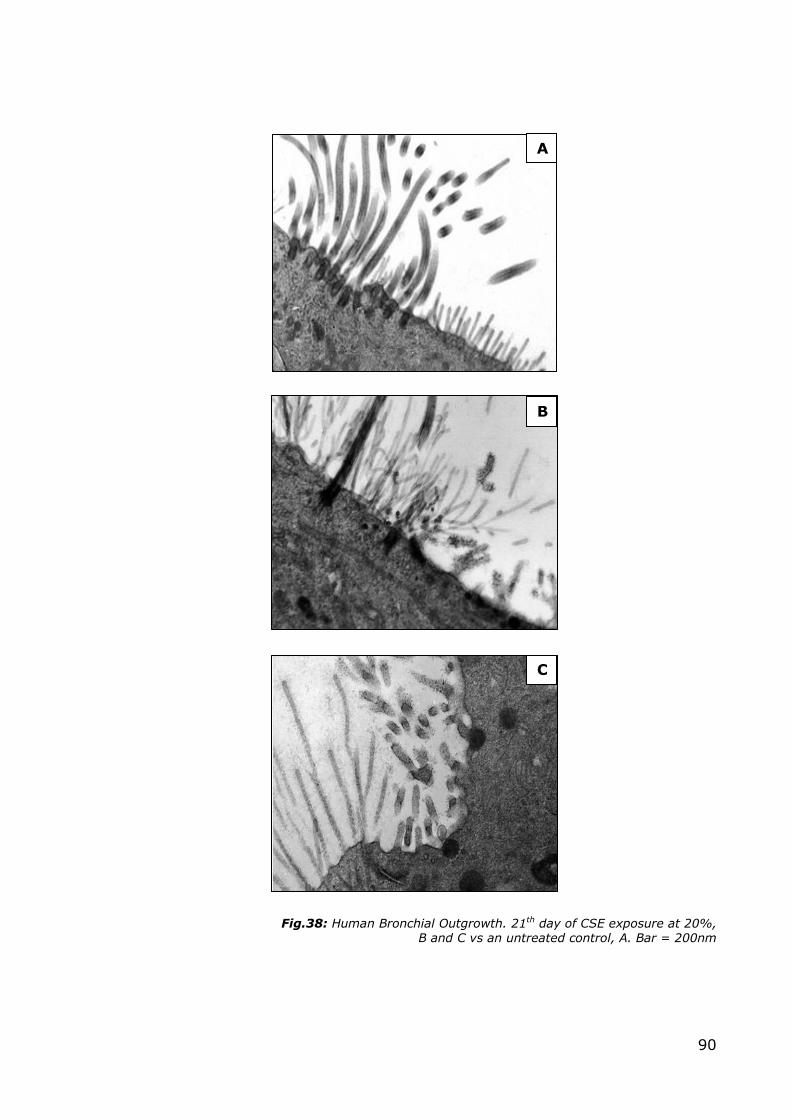
surrounded by mucus that is still produced in large quantities. In another area of
the outgrowth, shown in Figure 38 B and C, can be observed the simultaneous
presence of elongated protein-enriched microvilli and ciliary precursors (a normal
control is provided for comparison in A). Structures with a markedly thickened
protein at their base can be observed protruding from the apical side; these are
probably deuterosomes. Normally, deuterosomes appear as electron-opaque
globular bodies without limiting membranes, and serve as the core for centriole
formation; they are thought to be generated by aggregation and condensation of
fibrous granules, or independently from fibrous granules (according to the
differing data in literature); in the human they have a diameter of 100–110nm.
90
Fig.38: Human Bronchial Outgrowth. 21th day of CSE exposure at 20%, B and C vs an untreated control, A. Bar = 200nm
A
B
C
91
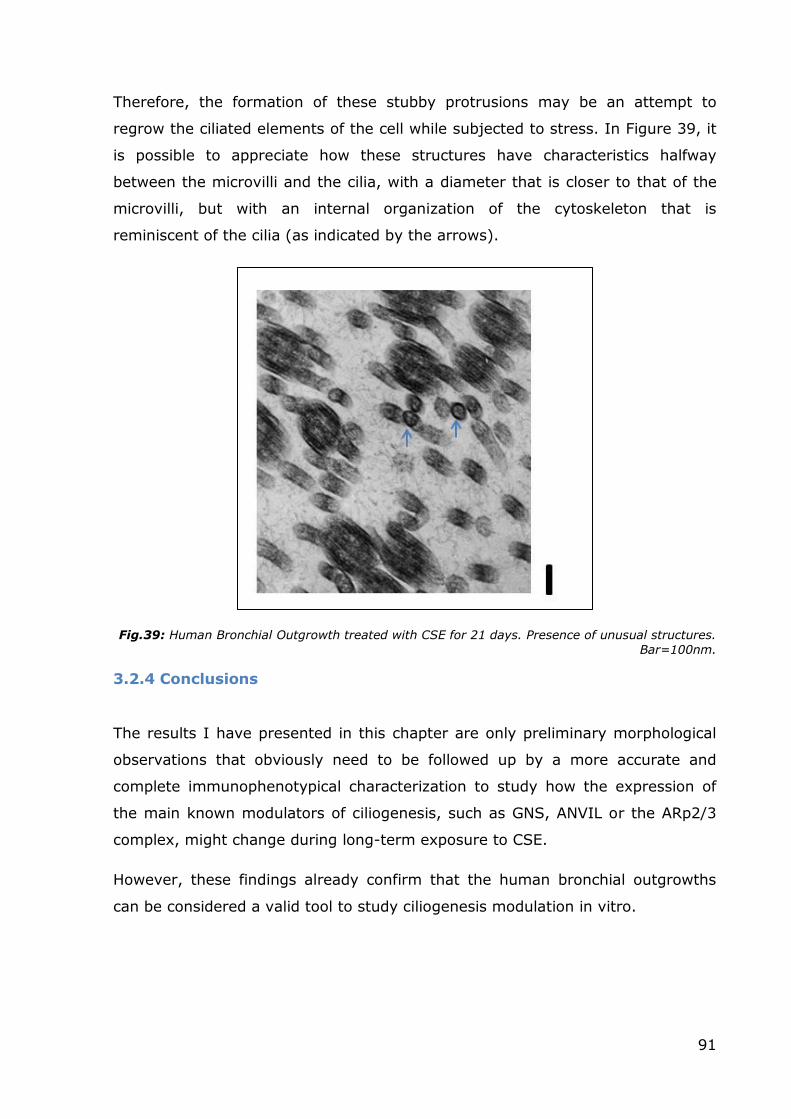
Therefore, the formation of these stubby protrusions may be an attempt to
regrow the ciliated elements of the cell while subjected to stress. In Figure 39, it
is possible to appreciate how these structures have characteristics halfway
between the microvilli and the cilia, with a diameter that is closer to that of the
microvilli, but with an internal organization of the cytoskeleton that is
reminiscent of the cilia (as indicated by the arrows).
Fig.39: Human Bronchial Outgrowth treated with CSE for 21 days. Presence of unusual structures.
Bar=100nm.
3.2.4 Conclusions
The results I have presented in this chapter are only preliminary morphological
observations that obviously need to be followed up by a more accurate and
complete immunophenotypical characterization to study how the expression of
the main known modulators of ciliogenesis, such as GNS, ANVIL or the ARp2/3
complex, might change during long-term exposure to CSE.
However, these findings already confirm that the human bronchial outgrowths
can be considered a valid tool to study ciliogenesis modulation in vitro.
92
3.3 Characterization of a novel three-dimensional model of
normal human oral mucosa
Aims: Tissue-engineered oral mucosal equivalents have been developed for in
vitro studies for a few years now. However, the usefulness of currently available
models is still limited by many factors, mainly the lack of a physiological
extracellular matrix (ECM) and the use of cell populations that do not reflect the
properly differentiated cytotypes of the mucosa of the oral cavity. For this
reason, my main aim was to tissue-engineering a novel 3D model of the normal
human oral mucosa, to overcome some of the shortcomings of the current in
vitro models. Our model includes two cell populations (keratinocytes and
fibroblasts) that outgrow from an oral biopsy fragment into a natural
extracellular 3D matrix (MatrigelTM) that initially drives the outgrowth of the
cells, and is completely replaced during the culture period by a newly deposed
matrix produced by the fibroblasts. My hypothesis was that this kind of model
could exhibit a proper histological architecture and biochemical composition (two
essential features required of an in vitro model that is to be employed to study
the responses to exogenous modifications of its microenvironment, such as those
that take place during drug administration assays). In order to achieve this goal,
I characterized the outgrowth model both at an ultra-structural and
immunophenotypic level. This model was also used for other experiments in our
laboratories (for example a drug administration assay, Campisi, 2012).
3.3.1 Morphological Analysis
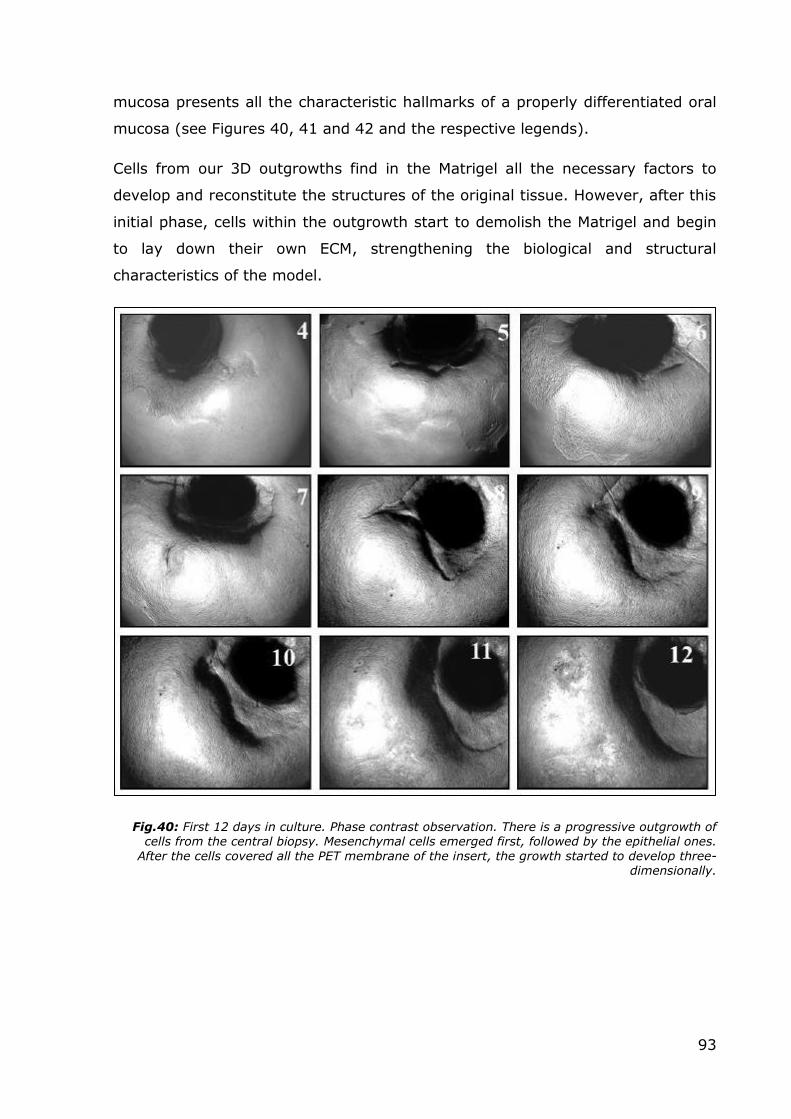
Briefly, like in the bronchial model, the oral mucosal outgrowths initially formed a
network of spindly cells (likely fibroblasts) and rounded cells (possibly epithelial
cells), growing out into the MatrigelTM from the biopsy which was originally placed
in the middle of the transwell system. After 7-8 days, the PET membrane
covering the bottom of the insert was completely covered with the newly grown
tissue that originated from a biopsy, and the new cell populations started to
spread out three-dimensionally, forming ridges and more complex 3D structures.
After 13-15 days of culture, the morphological features of the outgrowths did not
change consistently. The outgrowths were monitored by phase contrast
microscopy and analyzed by electron microscopy showing that the newly formed
93
mucosa presents all the characteristic hallmarks of a properly differentiated oral
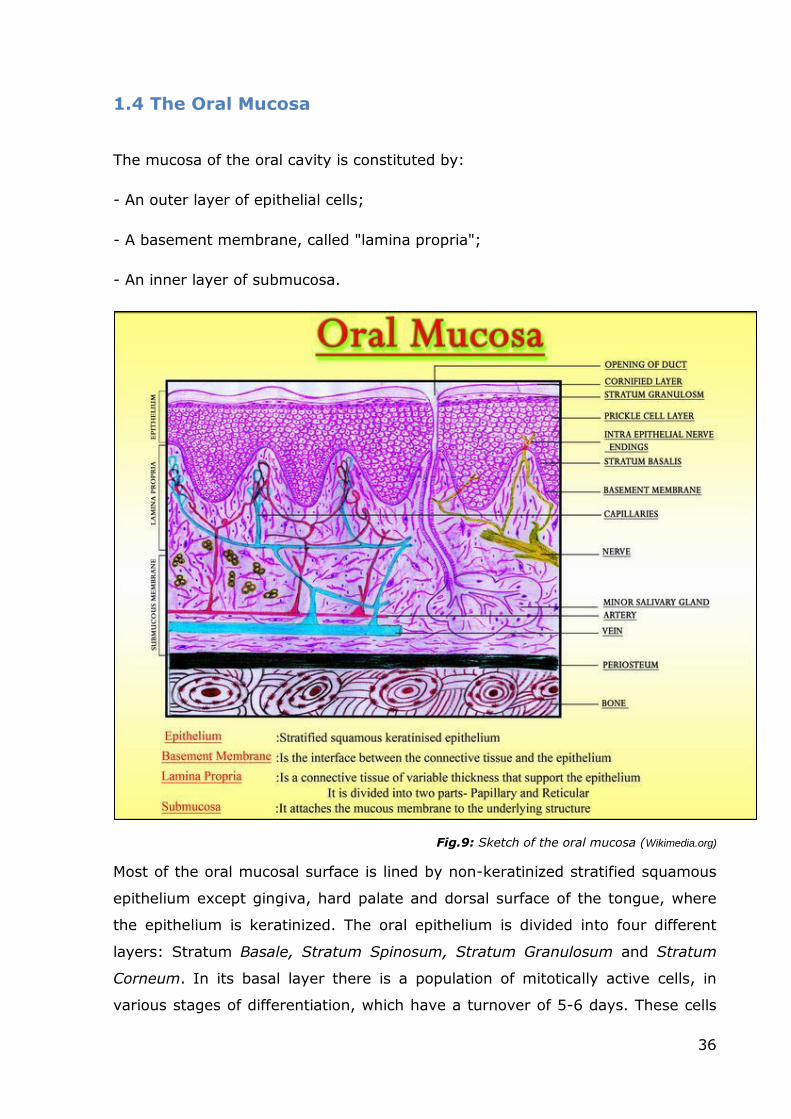
mucosa (see Figures 40, 41 and 42 and the respective legends).
Cells from our 3D outgrowths find in the Matrigel all the necessary factors to
develop and reconstitute the structures of the original tissue. However, after this
initial phase, cells within the outgrowth start to demolish the Matrigel and begin
to lay down their own ECM, strengthening the biological and structural
characteristics of the model.
Fig.40: First 12 days in culture. Phase contrast observation. There is a progressive outgrowth of cells from the central biopsy. Mesenchymal cells emerged first, followed by the epithelial ones.
After the cells covered all the PET membrane of the insert, the growth started to develop three-dimensionally.
94
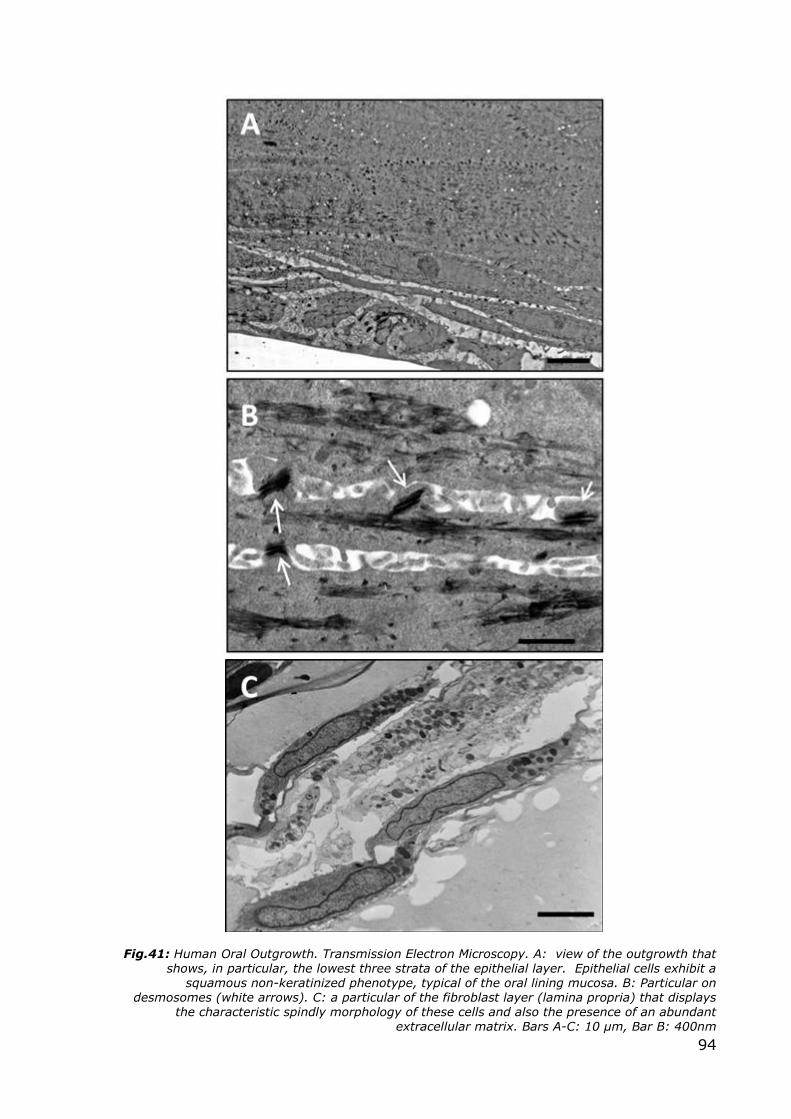
Fig.41: Human Oral Outgrowth. Transmission Electron Microscopy. A: view of the outgrowth that shows, in particular, the lowest three strata of the epithelial layer. Epithelial cells exhibit a
squamous non-keratinized phenotype, typical of the oral lining mucosa. B: Particular on desmosomes (white arrows). C: a particular of the fibroblast layer (lamina propria) that displays
the characteristic spindly morphology of these cells and also the presence of an abundant extracellular matrix. Bars A-C: 10 µm, Bar B: 400nm
95
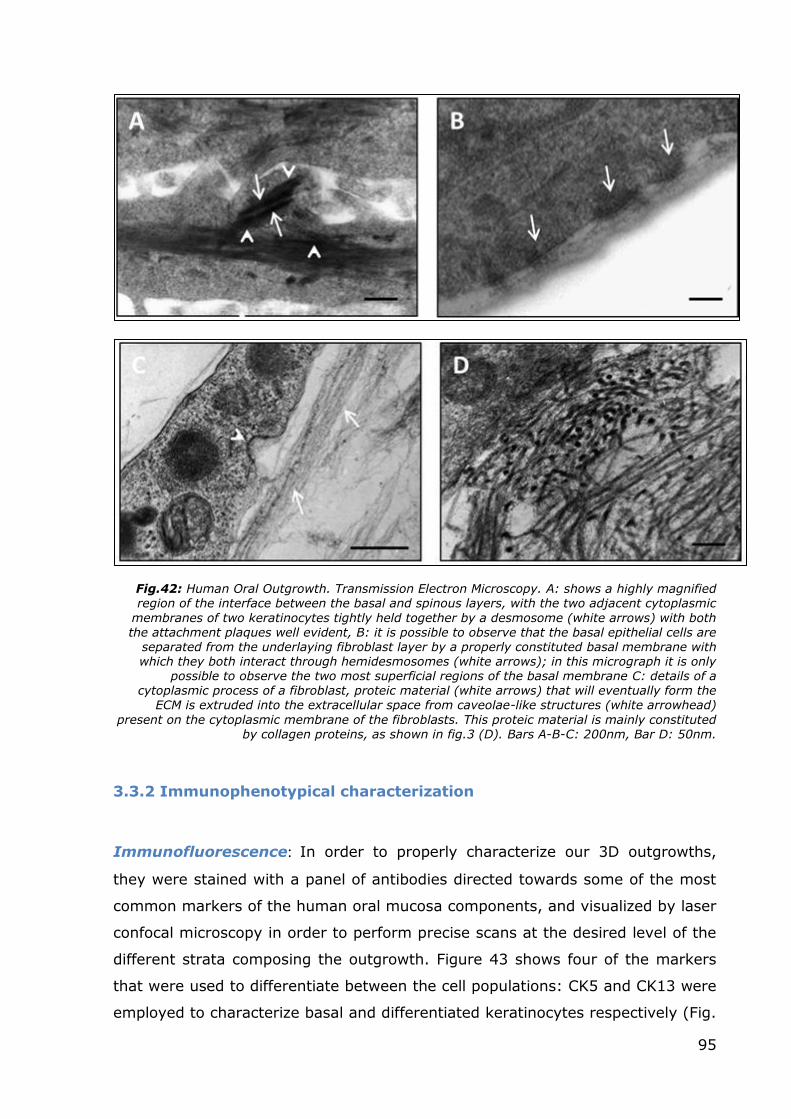
Fig.42: Human Oral Outgrowth. Transmission Electron Microscopy. A: shows a highly magnified region of the interface between the basal and spinous layers, with the two adjacent cytoplasmic
membranes of two keratinocytes tightly held together by a desmosome (white arrows) with both the attachment plaques well evident, B: it is possible to observe that the basal epithelial cells are
separated from the underlaying fibroblast layer by a properly constituted basal membrane with which they both interact through hemidesmosomes (white arrows); in this micrograph it is only
possible to observe the two most superficial regions of the basal membrane C: details of a cytoplasmic process of a fibroblast, proteic material (white arrows) that will eventually form the
ECM is extruded into the extracellular space from caveolae-like structures (white arrowhead)
present on the cytoplasmic membrane of the fibroblasts. This proteic material is mainly constituted by collagen proteins, as shown in fig.3 (D). Bars A-B-C: 200nm, Bar D: 50nm.
3.3.2 Immunophenotypical characterization
Immunofluorescence: In order to properly characterize our 3D outgrowths,
they were stained with a panel of antibodies directed towards some of the most
common markers of the human oral mucosa components, and visualized by laser
confocal microscopy in order to perform precise scans at the desired level of the
different strata composing the outgrowth. Figure 43 shows four of the markers
that were used to differentiate between the cell populations: CK5 and CK13 were
employed to characterize basal and differentiated keratinocytes respectively (Fig.
96
43 A and B), whereas laminin (Fig. 43 C) and collagen type IV (Fig. 43 D) were
used, together with fibronectin and collagen type I (not shown), to study the
ECM. CK5 staining was limited to the basal layer and the positive cells had a
distinctive rounded shape (Fig. 43 A), whereas CK13 staining, that was present
throughout the whole epithelial stratum, was much stronger in the upper layers
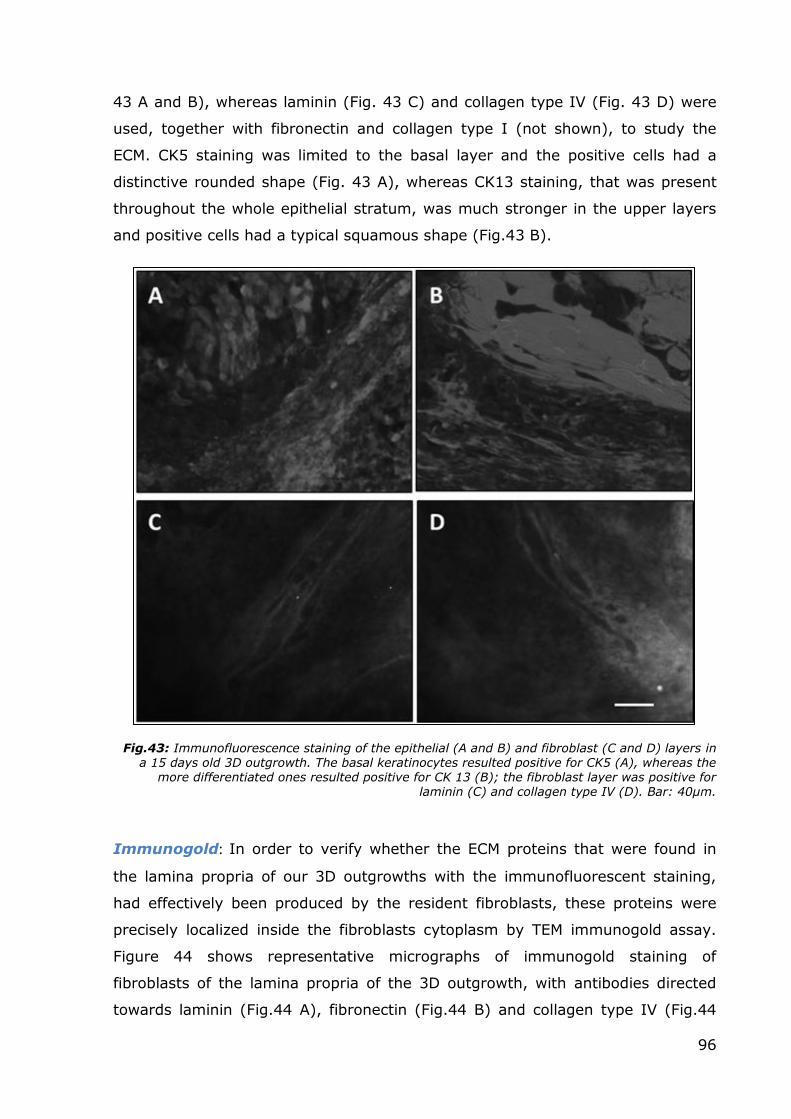
and positive cells had a typical squamous shape (Fig.43 B).
Fig.43: Immunofluorescence staining of the epithelial (A and B) and fibroblast (C and D) layers in a 15 days old 3D outgrowth. The basal keratinocytes resulted positive for CK5 (A), whereas the
more differentiated ones resulted positive for CK 13 (B); the fibroblast layer was positive for laminin (C) and collagen type IV (D). Bar: 40µm.
Immunogold: In order to verify whether the ECM proteins that were found in
the lamina propria of our 3D outgrowths with the immunofluorescent staining,
had effectively been produced by the resident fibroblasts, these proteins were
precisely localized inside the fibroblasts cytoplasm by TEM immunogold assay.
Figure 44 shows representative micrographs of immunogold staining of
fibroblasts of the lamina propria of the 3D outgrowth, with antibodies directed
towards laminin (Fig.44 A), fibronectin (Fig.44 B) and collagen type IV (Fig.44
97
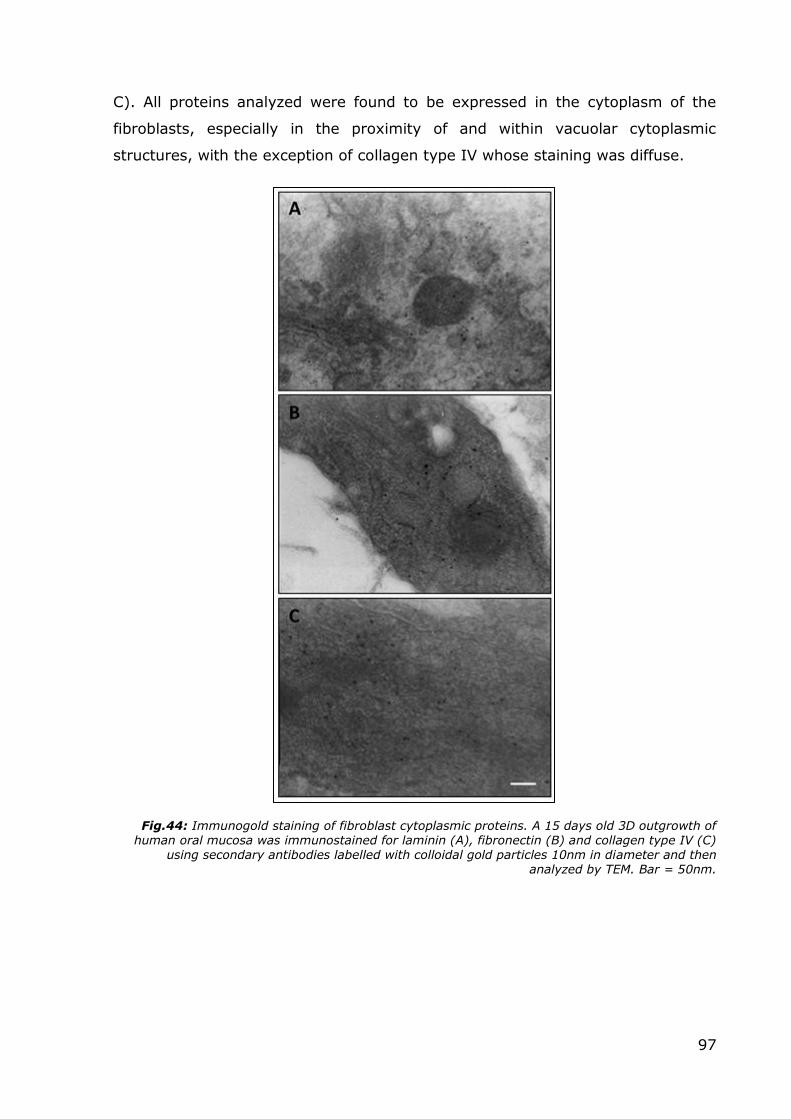
C). All proteins analyzed were found to be expressed in the cytoplasm of the
fibroblasts, especially in the proximity of and within vacuolar cytoplasmic
structures, with the exception of collagen type IV whose staining was diffuse.
Fig.44: Immunogold staining of fibroblast cytoplasmic proteins. A 15 days old 3D outgrowth of human oral mucosa was immunostained for laminin (A), fibronectin (B) and collagen type IV (C)
using secondary antibodies labelled with colloidal gold particles 10nm in diameter and then analyzed by TEM. Bar = 50nm.
98
3.3.3 Conclusions
The results that we have obtained during the development and characterization
of our 3D model of the human oral mucosa clearly show that this system is a
very good candidate for tissue-engineering the normal human oral mucosa. In
our model, oral biopsies are placed directly on Matrigel in Transwells equipped
with a PET membrane necessary to allow the passage of culture medium. Cells
from our 3D outgrowth find in the Matrigel all the factors necessary to develop
and to reconstitute the structures of the original tissue. However, after this initial
phase, cells within the outgrowth start to demolish the Matrigel and begin to lay
down their own ECM. This is a crucial moment in the development of the 3D
outgrowth, resulting in a proper differentiation of the cell components
(keratinocytes and fibroblasts) and in an in vitro reconstitution of the
physiological architecture of human oral mucosa, including a stratified non-
keratinized squamous layer composed of several layers, a proper basal
membrane and a lamina propria where fibroblasts continue to produce ECM and
biochemically signal with the layers above. Even if Matrigel is considered one of
the most effective substrates for 3D cell culture, we believe that the strength of
our outgrowth model is not so much in the culture medium used or in the matrix,
but in the common source of fibroblasts and keratinocytes. In fact, fibroblasts
and keratinocytes of our model are not separately isolated from the dermal layer
or buccal mucosa respectively, and combined again in a scaffold of different
materials, but they originate from the same biopsy. In this manner, the cultured
tissue maintains the distinct characteristics of the single original source.
99
FINAL DISCUSSION
The main aim of this thesis was to apply novel 3D cell culture models to the
study of chronic inflammatory diseases. To reach this goal, I employed a tissue-
engineered human mucosal equivalent, the 3D mucosal outgrowth, that had
been previously developed and characterised in our laboratories.
During the last few months of my PhD course, I had the possibility to spend part
of my study period in the laboratories of Pulmonology Department of Leiden
University Medical Center directed by Prof. Hiemstra, where I studied the
potential protective effects of farm dust against inflammatory states such as
those that take place in asthma and other chronic inflammatory diseases. The
cell culture model used for this part of my studies was the ALI culture.
Giving the specific characteristics and developmental stages of these two, similar
but quite distinct, cell culture models, I have preferred to present the results
obtained during the latter part of my studies in Leiden in the initial chapters of
this thesis, followed by the results of the earlier experiments using the 3D
outgrowth models carried out in Palermo.
Primary cultures or cell lines still represent the most commonly used human in
vitro culture models to study responses of cell systems to specific stimuli.
However, the main limitations of these models are the absence of extracellular
components and the loss of proper cell-cell communication that arises from the
former characteristic.
The development of a model that involves the use of a culture medium
conditioned with Pseudomonas Aeruginosa extracts permits to subject the cells to
an external insult that mimics a natural insult in vivo. Furthermore, it is possible
to modulate the dilution of the medium to support the specific requirements of
different experimental conditions. I would like to to thank Dr. E. Van’Wout and
Dr. A. Schadewijk for having perfected the method and shared and taught me
this protocol. The studies conducted with Pseudomonas extracts have confirmed
what had already been seen in previous works conducted on mice and also on
human cells: Pseudomonas extracts cause diffuse cellular damage with a specific
impact on tight junction proteins, defining them as ideal agents for use in studies
that involve these proteins as their specific target. Numerous survey studies
100
have been conducted on the beneficial effects that living in a rural environment
can have in protecting individuals from the onset of chronic inflammatory
diseases of the airways (Korsal, 2008; Ege, 2011; Fishbein, 2012). The potential
protective properties of farm dust have also been investigated in animal models
(Hagner, 2013).
The use of the ALI cell culture model allows to obtain more accurate results since
it is based on differentiated primary cells. Differentiated bronchial epithelial cells,
such as those that are used in the ALI culture model, develop a complex
polarized architecture offering the possibility to conduct TEER assessment.
The evaluation of the properties of farm dust produced interesting results: cells
exposed to farm dust responded with an increased transcription of genes that
encode for tight junction proteins. The transcription levels increased after 4
hours, that is probably the time necessary for the dust components to exert their
effects. At the same time, the dust-exposed ALI samples displayed increased
TEER levels. This is likely to be due to the fact that not only the RNA of tight
junction proteins were transcribed, but active protein synthesis took place that
determined the formation of functional tight junctions. On the other hand, the
dust did not exhibit specific regenerative or protective abilities; in fact, in the
samples exposed to dust when the damage had already taken place, we did not
observe any protective effects. Moreover, as already reported in animal studies,
the concomitant exposure to dust and an inflammatory agent did not inhibit the
inflammatory process (as measured by IL-8 release). Therefore, while many
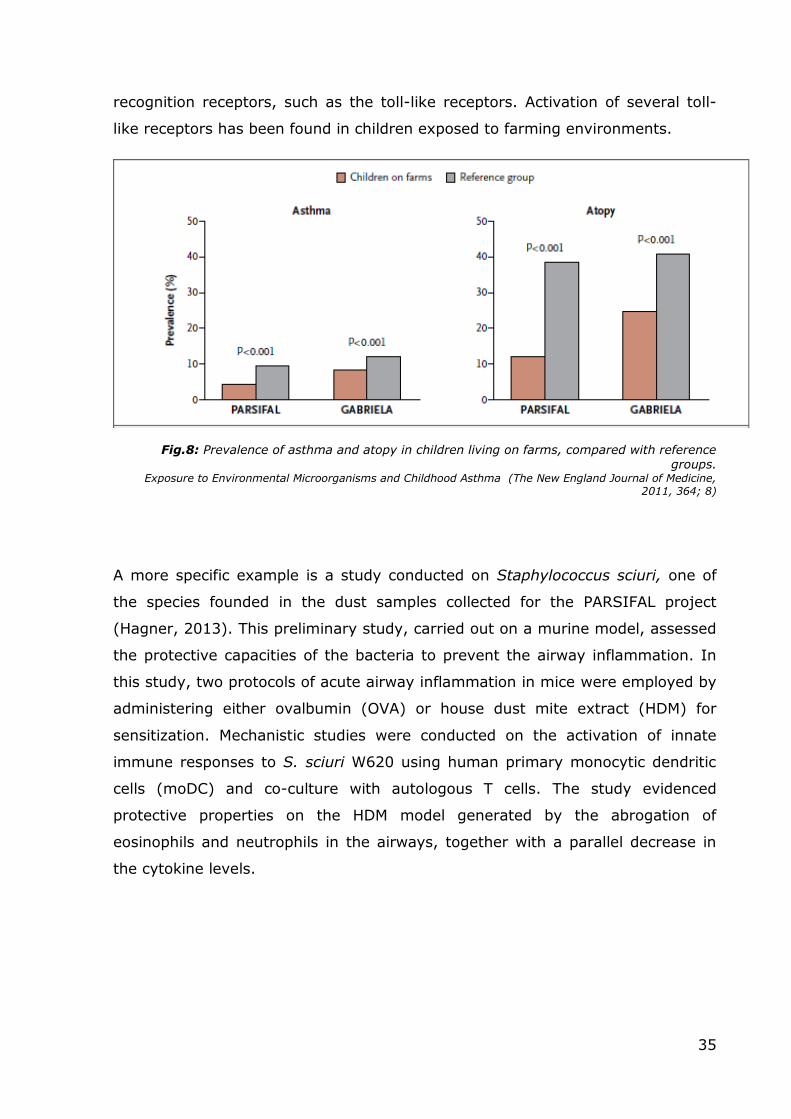
studies have not been carried out to analyze dust properties in vitro, from the
sample data of the two previous major projects (PARSIFAL and GABRIELA) and
my preliminary in vitro results it would seem that farm dust components exert a
protective effect again insults against respiratory mucosa (in both animal and
human primary cell models). Hence the need for a more extensive and thorough
analysis, especially of the single dust components to avoid eventual secondary
consequences and, more importantly, to maximize the protective effects and
their eventual therapeutic exploitation. Furthermore, the properties of farm dust
(and its components) should be studied using a wider variety of stimuli in order
to better characterize their effects.
Even though the primary cultures grown at the air-liquid interface represent an
advanced in vitro human model to study responses of cell systems to specific
101
stimuli, they lack some of the fundamental components that constitute a normal
mucosa: the ECM and connective cells.
The unavailability of suitable 3D cell culture models has inspired the researchers
in our laboratories to develop and refine, with the application of tissue
engineering techniques, an innovative three-dimensional culture model that is a
faithful in vitro reconstruction of the human bronchial mucosa. In short, the
model consists of an outgrowth of cells from a bronchial biopsy immersed in a
three-dimensional gel (Matrigel™), in turn suspended using a Transwell system
in a culture medium specific for the proliferation and differentiation of both
epithelial cells and fibroblasts at the air-liquid interface. This model has proven to
be an ideal tool to study medium- to long-term exposures to different stimuli,
such as interleukins, CSE, oxidants etc.
One of the strengths of the model is the concurrent presence of epithelial and
connective cells, that cooperate with each other by means of basement
membrane-mediated cell-cell interaction, like in the normal mucosa. Many recent
studies have focused on the interactions between the two cell populations, and
finding a way to study them in a single model in a three-dimensional
environment without the need to set up complicated co-culture systems or using
conditioned media (where the lack of cell-cell interaction is a big limitation)
definitely offers significant advantages.
Another key feature of the model is the deposition of neosynthesized ECM by the
fibroblasts. Moreover, this model offers the possibility to conduct long-term
experiments, to evaluate interactions and signaling between different cell
populations, and it is an ideal setup for conducting drug administration studies.
The complete absence of immune cells within the model is at the same time a
limitation and an advantage, offering the opportunity to selectively add, whether
in the epithelial or in the connective layer, cytokines, chemokines or any other
factor whose effects one might want to research.
Another limiting aspect of this model is the lack of circulation; this, however,
could be easily overcome by the employment of microfluidics, and in fact during
the last two months of my PhD we started working on this in collaboration with
some colleagues with a background in bioengineering.
102
One of the potential applications of this model includes the evaluation of the
development of cell structures under normal conditions and when exposed to
various stimuli. In particular, my interest was directed at the process of
ciliogenesis since these specialized epithelial structures are damaged and
dysfunctional in chronic inflammatory lung diseases and the major damaging
agent affecting the cilia is thought to be cigarette smoke (Thomas B, 2010; Lam
HC, 2013). Moreover, very little is still known about the mechanisms that are
responsible for these alterations and traditional cell culture models do not permit
the application of long-term cigarette smoke exposure. For example, primary
bronchial epithelial cells treated with relatively low concentrations (10-20%) of
CSE will usually undergo apoptosis within 48 hours. The bronchial outgrowth
model instead can be exposed to such stimuli for prolonged periods of up to
three to four weeks.
My experiments showed that when bronchial outgrowths were exposed to 20%
CSE for 21 days, the ciliated epithelial cells lost their cilia within the first three
days of exposure but remained viable until the end of the treatment period.
Following the initial stress, epithelial cells started reorganizing their apical
surface with newly developed elongated and protein-enriched microvilli and cilia-
like structures. During the entire treatment period, these modified apical
structures never regained their original architecture and function. The mucus
that was produced by the Goblet cells was in fact gathering on top of the cells
that were unable to get rid of it. This mucus layer was collected and stored for
further analyses. The microvilli appeared hyper functional, probably in an effort
to absorb the excess of mucus, while the cilia did not display the characteristic
beating motion that could be observed in untreated outgrowths.
As already mentioned, these are just preliminary observations and further
studies have already been started in order to evaluate the eventual recovery of
the apical structures when the CSE stimulus is withdrawn, and to assess the
expression of the main modulators of ciliogenesis at both RNA and protein level.
The last part of my thesis was focused on the efforts to apply this cell culture
model to another human mucosa, the oral one.
Tissue-engineered oral mucosal equivalents have been developed for in vitro
biocompatibility studies, as well as for mucosal irritation and oral disease studies
103
with the aim to better understand disease process and discover new treatments
(Moharamzadeh, 2007; Kinikoglu, 2011). In 1975, Rheinwald and Green
introduced a method to grow human keratinocytes in in vitro serial cultures,
using a feeder layer composed of irradiated mouse fibroblasts and a specific
culture medium (Rheinwald, 1975). This method is widely used for the culture of
keratinocytes and single-layer epithelial sheets, but such sheets are fragile,
difficult to handle and tend to contract (Moharamzadeh, 2007). Multilayer sheets
of cultured epithelium were obtained by culturing oral keratinocytes and
fibroblasts, crucial for the production of extracellular matrix, on permeable
ethylene terephthalate cell culture membrane (PET) at the air/liquid interface
(Moharamzadeh, 2008) or in polycarbonate cell culture inserts, developed by
SkinEthic Laboratories (Nice, France). These models have the characteristic of
being very similar to native epithelium and showing signs of differentiation, such
as different cytokeratin expression and basement membrane formation, but not
to the point of full differentiation because the cells used are derived from oral