Application of Remote Sensing for Drinking Water Security Planning Mulbagal Taluk, Kolar District. Presented by Dr. K. Ashoka Reddy Scientist , KSRSAC Karnataka State Remote Sensing Applications Centre Dept. of IT & BT, GOK Bangalore
Transcript
Application of Remote Sensing for Drinking Water Security Planning
Mulbagal Taluk, Kolar District.
Presented by
Dr. K. Ashoka Reddy
Scientist , KSRSAC
Karnataka State Remote Sensing Applications Centre
Dept. of IT & BT, GOK
Bangalore
INTRODUCTION
Mulbagal taluk is located between :
North Latitude130 011 3011 to 130 211 4511
East Longitude780151 1511 to 780 351 0011
Mulbagal Taluk at a Glance
SL No ITEM STATISTICS
1 GENERAL INFORMATION
I) Geographical Area 823 (Sq.Kms)
ii) Administrative Divisions Mulbagal
No of Panchayat/villages 30/343
iii) Population (as per 2011 census) 259008
iv) Average annual Rainfall 759mm
2
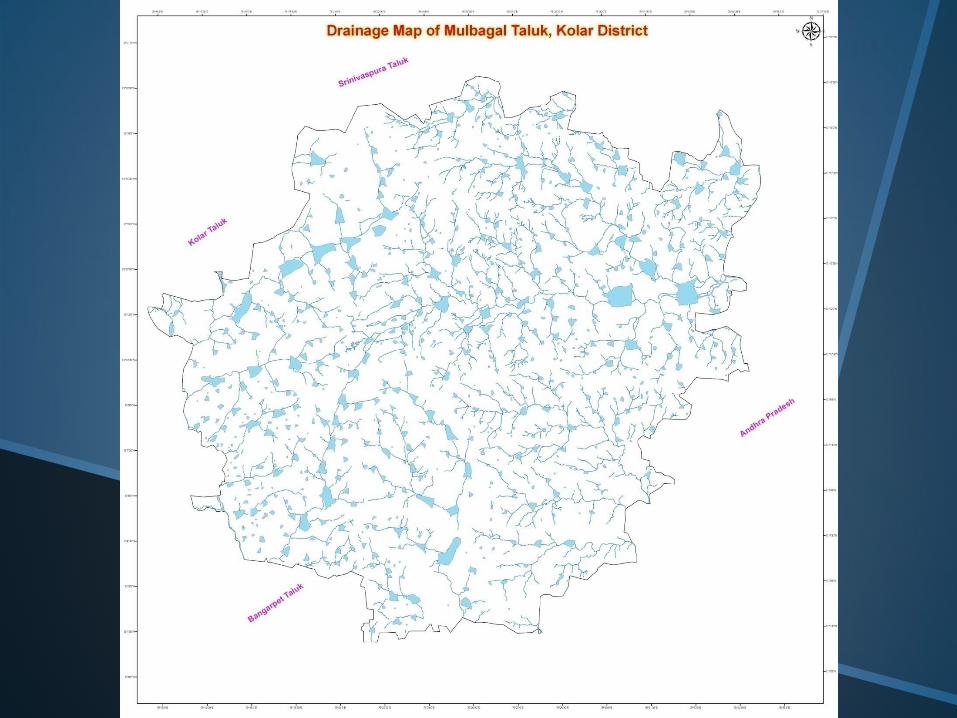
GEOMORPHOLOGY
Major physiographic units 2
Major Drainages 1
3 LAND USE
a) Forest Area 2122 (Hectares)
b) Net Area Sown 44922 (Hectares)
4 MAJOR SOIL TYPES 1.Sandy loam
2.Sandy clay loam
3.Clay
4.Rock outcrops
5 AREA UNDER PRINCIPAL CROPS (ha)
Ragi 12316
Paddy 2109
Maize 219
Oil seeds 7203
Pulses 4594
Vegetables 8894
Fruits 16298
Sericulture 2324
6 IRRIGATION BY DIFFERENT SOURCES (ha)
Dug wells -
Bore wells 6501 ha (14661 borewells)
Tanks 6713 ha (663 tanks)
Canals -
Other Sources -
Lift Irrigation -
Net Area Irrigated 13214 (29.42%)
No .of Ground Water structures
Domestic BW
Piped water supply
Mini water supply
Hand Pumps
476
148
278
50
7 NUMBER OF GROUND WATER
MONITORING WELLS OF DMG
Dug wells -
Piezometers 14
8 PREDOMINANT GEOLOGICAL
FORMATIONS
Peninsular Gneisses complex
(Granite, Gneisses and kolar
schist
9 HYDROGEOLOGY
Major water bearing formations Weathered and
fractured Granite,
Gneisses and Schist
Long term water level trend (2002-2011) in m per
year
See the Graph
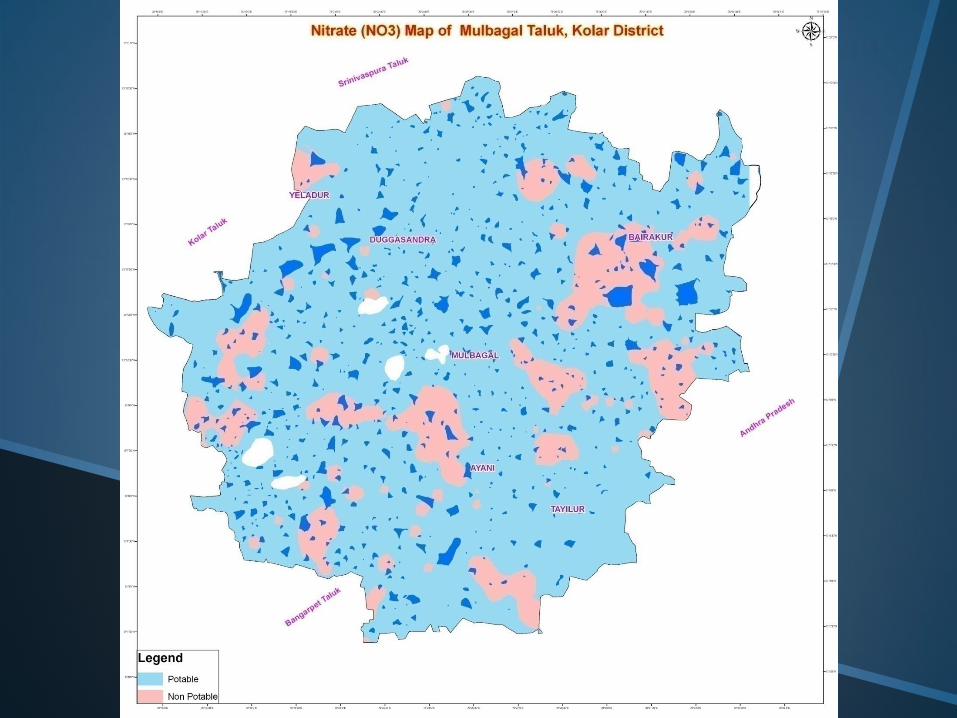
10 GROUND WATER QUALITY
Presence of chemical constituents more than
permissible limits
Fluoride, Nitrate and
Total Hardness
Type of water Potable (56.32%)
11 DYNAMIC GROUND WATER RESOURCES
(2009) IN ham
Annual replenishable ground water resource 4420 ham
Net annual ground water draft 8895 ham
Projected demand for Domestic and
Industrial use up to 2025
515 ham
Stage of ground water Development (%) 201% of resource
12 MAJOR GROUND WATER PROBLEMS AND
ISSUES
Declining Ground Water level
and failure of shallow bore
wells need for augmenting
the Ground water Resource
by artificial recharge
structures for sustainable
development.
Increase in Fluoride and
Nitrate concentrations
causing health hazards.
Watershed Map
Land use/ Land cover
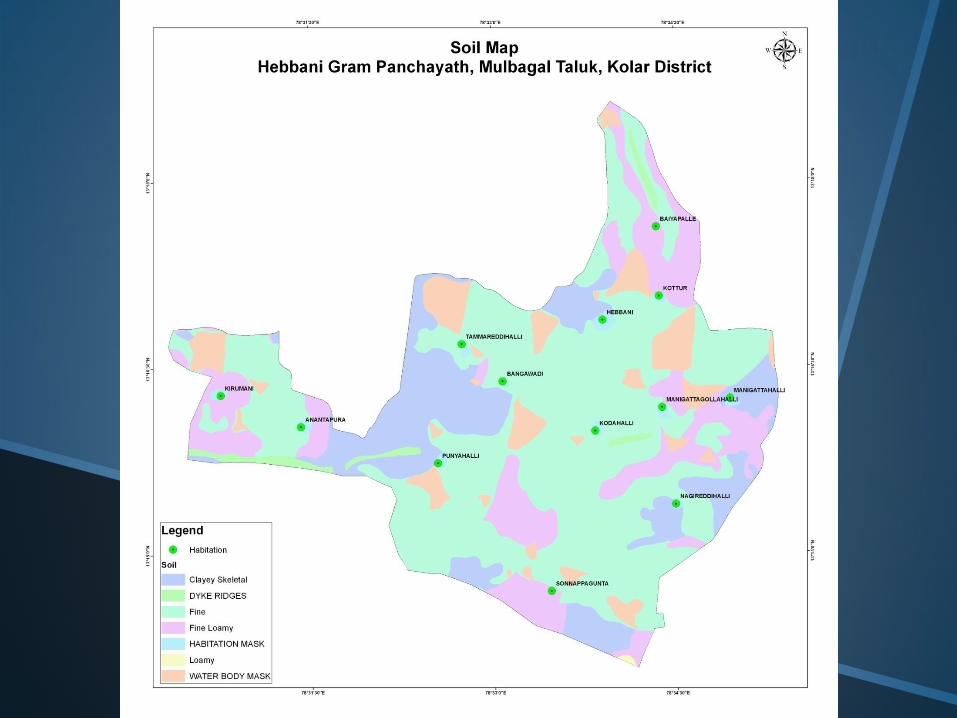
Soil
Geology
Weathered Zone
Fractured Zone
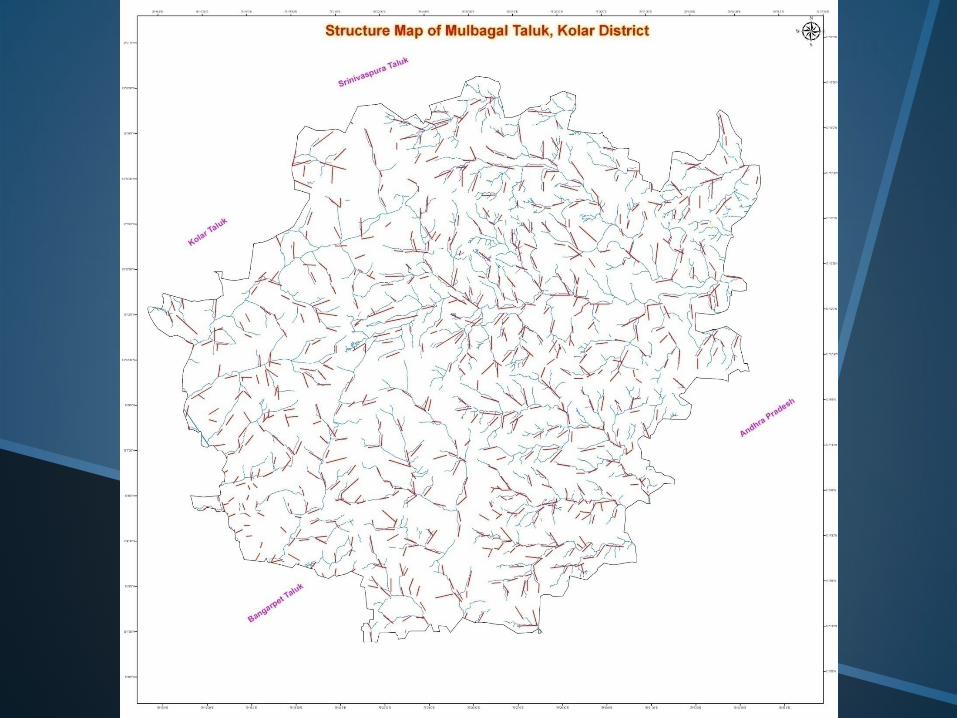
Lineaments Zone
57K/8
Rainfall Data
Season Normal Rainfall
(mm)
Pre Monsoon
(Jan to May)
146
South West Monsoon
(June to Sept)
371
North East Monsoon
(Oct to Dec)
242
Annual 759
831
1050
1302
695
605
878860
343
643
999
466
778
607
531
824836
786
439
707
619578
871
345
631
918
858
634649664
941
746
883
602
672
720
777
928
529
794820
746
512
863
1176
507
981
728
801
661
319
590
1061
574535
1017
549
676
600564
589
829
712
1087
559
842
640
464
937
676
722
821
676709
859878888
868
949
589
864
759
584
496
442
806
666
1076
521
808
1137
732
1208
624618
949
789
1172
824
910
1050
627
552
903
1453
738
807
993
766.0
821787
0
100
200
300
400
500
600
700
800
900
1000
1100
1200
1300
1400
1500
16001
90
11
90
31
90
51
90
71
90
91
91
11
91
31
91
51
91
71
91
91
92
11
92
31
92
51
92
71
92
91
93
11
93
31
93
51
93
71
93
91
94
11
94
31
94
51
94
71
94
91
95
11
95
41
95
61
95
81
96
01
96
21
96
41
96
61
96
81
97
01
97
21
97
41
97
61
97
81
98
01
98
21
98
41
98
61
98
81
99
01
99
21
99
41
99
61
99
82
00
02
00
22
00
42
00
62
00
82
01
0
Ra
infa
ll in
mm
YEARS
Annual Rainfall Pattern for Mulbagal Taluk, Kolar District
3.5 7 10.7
28.7
96
54.4
78.9
93.7
144 147.3
65.4
29.2
0
50
100
150
200
Jan
Feb
Ma
r
Ap
r
Ma
y
Ju
ne
Ju
ly
Au
gu
st
Se
pte
mb
er
Oc
tob
er
No
ve
mb
er
De
ce
mb
er
Rain
fall i
n m
m
Months
Monthly Normal Rainfall for Mulbagal Taluk
0
200
400
600
800
1000
1200
1400
1600
1 2 3 4 5 6 7 8 9 10 11
Rain
fall
(m
m)
Years from 2001 to 2011
Annual Rainfall of Mulbagal Taluk
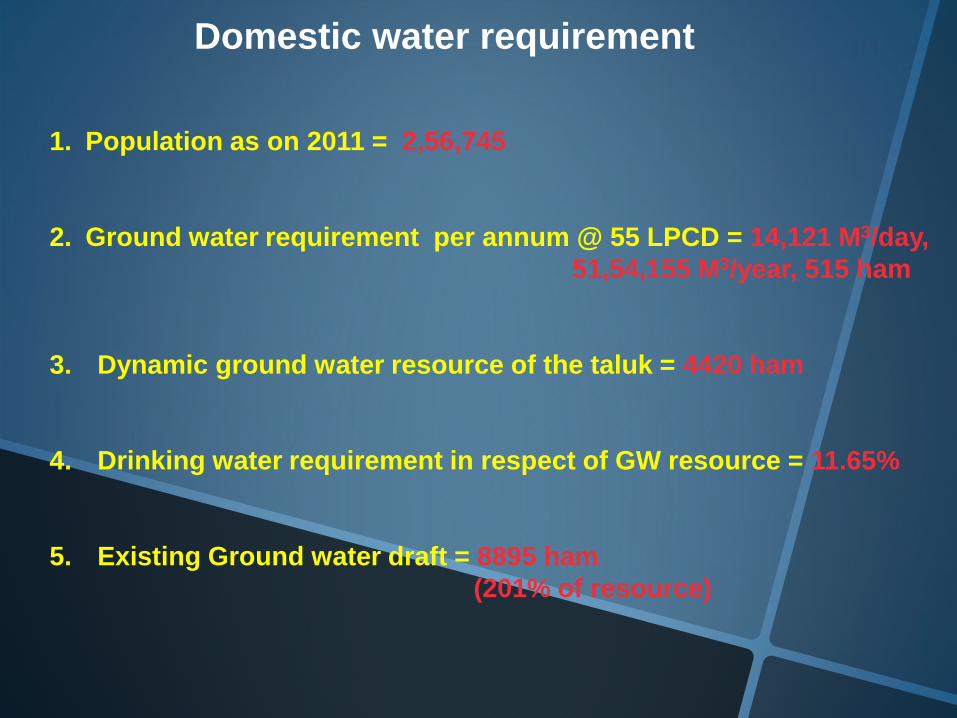
Domestic water requirement
1. Population as on 2011 = 2,56,745
2. Ground water requirement per annum @ 55 LPCD = 14,121 M3/day,
51,54,155 M3/year, 515 ham
3. Dynamic ground water resource of the taluk = 4420 ham
4. Drinking water requirement in respect of GW resource = 11.65%
5. Existing Ground water draft = 8895 ham
(201% of resource)
Use of Ground Water Prospects Maps in selection of Bore
well points
• Ground Truth
•Field Check
• Ground Geophysical survey
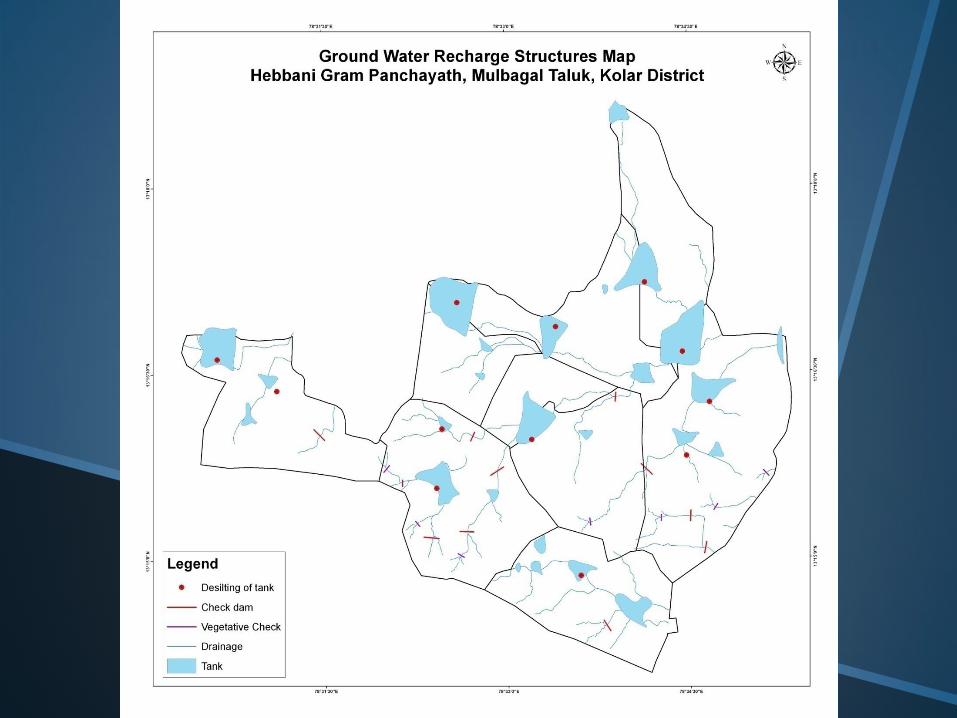
Ground water recharge structures
1. Direct Methods
• Percolation tanks
• Stream channel method (ditch & furrows)
• Check dam
• Gabion structure
2. Indirect Methods
• Recharge well
• Recharge trenches
• Individual well recharge
Probable Artificial Recharge Structures for Mulbagal Taluk
• Contour bunds
• Infiltration wells
• Check dams
• Recharge trenches
• Percolation tanks
• Desiltation of tanks
Note: These are the general classification if the area is found suitable for other
types of recharge structures, site specific structures may be identified after
studying the local hydro-geological and physiographic set up.
Ground Water Quality
Parameter No. of Habitations affected
Percentage (%) of Quality Affected Habitations
Fluoride 37 9.51 %
Iron 7 1.79 %
Total Hardness 14 3.59 %
Nitrate 112 28.79 %
Total affected
Habitations
170 43.68 %
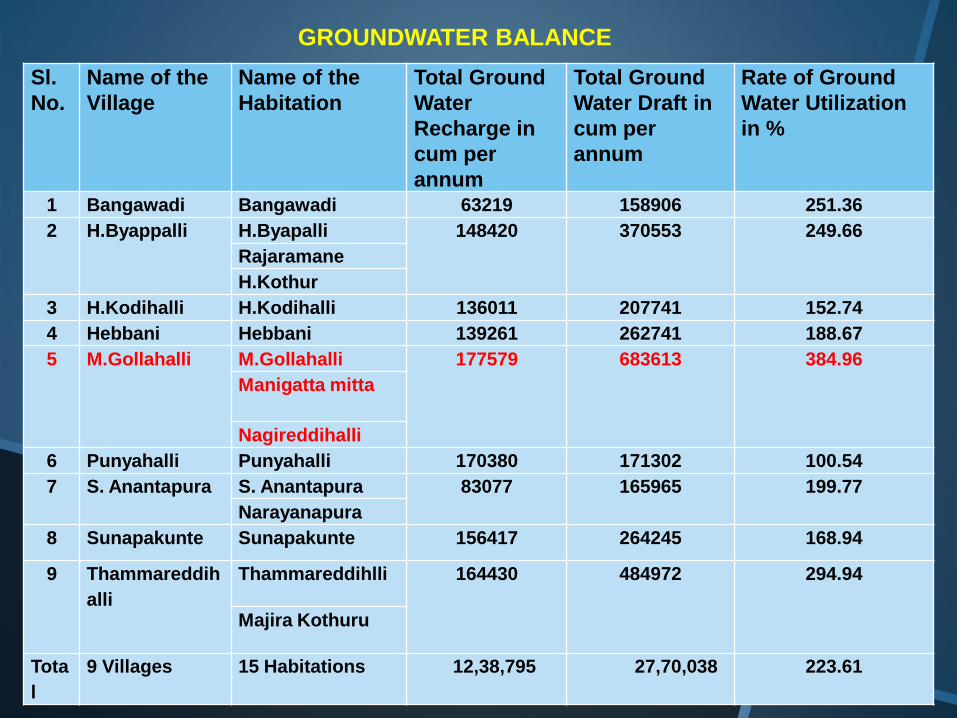
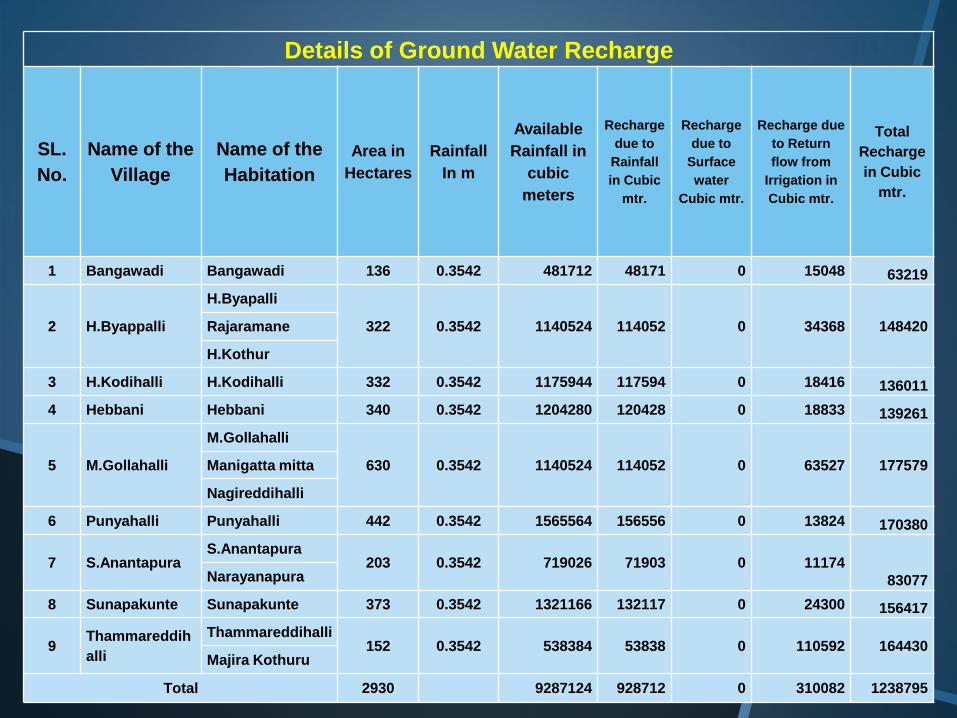
Affected Villages of Mulbagal Taluk
Hebbani Gram Panchayath
Hebbani Gram Panchayath
No. of Revenue Villages 9
No. of Habitations 15
Geographical area in ha 2903
No. of Drinking water
borewells
23
Rainfed area in ha 1072
Irrigated area in ha 450
No. of Irrigation water
borewells
598
Total no. of Irrigation
borewells
Working during 2012-13
273
No. of Revenue Villages 9
No. of Habitations 15
Geographical area in ha 2903
No. of Drinking water
borewells
23
Rainfed area in ha 1072
Irrigated area in ha 450
No. of Irrigation water
borewells
598
Total no. of Irrigation
borewells
Working during 2012-13
273
Hebbani Gram Panchayat
Agriculture
Population-total 10034
a. Area under cultivation in (ha) 1521.56
Irrigated area in Kharif 450
Irrigated area in Rabi 245.34
Irrigated area in Summer 167.61
Un Irrigated area 1071.56
b. Irrigation type (ha)
Area Irrigated under canal 0
Tanks 372.21
Bore well/ tube well 450
c. Water lifting sources
Submersible pump 598
Number of working Bore wells 273
Number of defunct Bore wells 325
Piped water supply (SVS or MVS) 23
Sl.No. Name of the Habitation Drinking water needs
Liters per day
Human Livestock Total
1 Bangavadi 18315 4770 23085
2 H.Byappanahalli
Rajaramane
H.Kothur
51755 21870 73625
3 H.Kodihalli 39820 24780 64600
4 Hebbani 172480 31400 203880
5 M.Gollahalli
Nagireddihalli
Manighattamitta
81345 51100 132445
6 Punyahalli 60390 30190 90580
7 S.Ananthapura
Narayanapura
59400 27920 87320
8 Sunnappakunte 38335 19870 58205
9 Tammareddihalli 30030 8140 38170
Total 551870 220040 771910
Drinking water profile of GP
BW
No.
Name of the Habitation Borewell Depth in m Yield in LPM


![Untitled-1 [] · 2013-04-26 · A TOUCHING EXPERIENCE! The Ah Standard at remote Govt Schools around Mulbagal were aruiously waiting to a copy of Bharadvaj English Ramada Dbtionary,](https://static.documents.pub/doc/80x56/5e8bc8d67c4a631d7849161d/untitled-1-2013-04-26-a-touching-experience-the-ah-standard-at-remote-govt.jpg)


