National Decentralized Water Resources Capacity Development Project Explanation Horizontal hydraulic conductivity < 1 1-5 5-10 30-50 70-80 100-200 ft/ day La Pine Little Deschutes River Deschutes River Sunriver Application of Simulation-Optimization Methods for Management of Nitrate Loading to Groundwater From Decentralized Wastewater Treatment Systems Near La Pine, Oregon US Geological Survey Oregon Water Science Center July 2005
Transcript
National Decentralized Water Resources Capacity Development Project
ExplanationHorizontal hydraulic conductivity
< 1
1-5
5-10
30-50
70-80
100-200 ft/ day
La Pine
Little Deschutes River
Deschutes River
Sunriver
Application of Simulation-Optimization Methods for Management of Nitrate Loading to Groundwater
From Decentralized Wastewater Treatment Systems Near La Pine, Oregon
US Geological SurveyOregon Water Science Center
July 2005
NDWRCDP, Washington University, Campus Box 1150 One Brookings Drive, Cupples 2, Rm. 11, St. Louis, MO 63130-4899
Application of Simulation-Optimization Methods for Management of Nitrate Loading to Groundwater From Decentralized Wastewater Treatment Systems Near La Pine, Oregon
Submitted by US Geological Survey Oregon Water Science Center
NDWRCDP Project Number: WU-HT-03-37
National Decentralized Water Resources Capacity Development Project (NDWRCDP) Research Project
Final Report, July 2005
DISCLAIMER
This work was supported by the National Decentralized Water Resources Capacity Development Project (NDWRCDP) with funding provided by the U.S. Environmental Protection Agency through a Cooperative Agreement (EPA No. CR827881-01-0) with Washington University in St. Louis. This report has not been reviewed by the U.S. Environmental Protection Agency. This report has been reviewed by a panel of experts selected by the NDWRCDP. The contents of this report do not necessarily reflect the views and policies of the NDWRCDP, Washington University, or the U.S. Environmental Protection Agency, nor does the mention of trade names or commercial products constitute endorsement or recommendation for use.
CITATIONS
This report was prepared by
David S. Morgan US Geological Survey Oregon Water Science Center 10615 Southeast Cherry Blossom Drive Portland, OR 97216
Roger Everett Deschutes County Community Development Department 117 Lafayette Avenue Bend, OR 97701
The final report was edited and produced by ProWrite Inc., Reynoldsburg, OH.
This report is available online at www.ndwrcdp.org. This report is also available through the
National Small Flows Clearinghouse P.O. Box 6064 Morgantown, WV 26506-6065 Tel: (800) 624-8301 WWCDMG49
This report should be cited in the following manner:
Morgan, D. S. and R. Everett. 2005. Simulation-Optimization Methods for Management of Nitrate Loading to Groundwater From Decentralized Wastewater Treatment Systems. Project No. WU-HT-03-37. Prepared for the National Decentralized Water Resources Capacity Development Project, Washington University, St. Louis, MO, by US Geological Survey, Oregon Water Science Center, Portland, OR.
Appreciation is extended to the following individuals for assistance in the preparation of this report:
Deschutes County Community Development Department Catherine Morrow Todd Cleveland Peter Gutowsky Tim Berg Dan Haldeman
Oregon Department of Environmental Quality Barbara Rich Rodney Weick
Appreciation is also expressed to the NDWRCDP for their support of this work:
Principal Investigator Jay R. Turner, D.Sc., Washington University
Project Coordinator Andrea L. Shephard, Ph.D.
NDWRCDP Project Steering Committee:
Coalition for Alternative Wastewater Treatment Valerie I. Nelson, Ph.D.
Consortium of Institutes for Decentralized Wastewater Treatment Ted L. Loudon, Ph.D., P.E.
Electric Power Research Institute Raymond A. Ehrhard, P.E. Tom E. Yeager, P.E.
National Onsite Wastewater Recycling Association Jean Caudill, R.S.
National Rural Electric Cooperative Association Scott Drake, P.E.
Water Environment Research Foundation Jeff C. Moeller, P.E.
Members-At-Large: James F. Kreissl Richard J. Otis, Ph.D., P.E. Jerry Stonebridge
v
ABSTRACT
The objective of this project was to develop and demonstrate a method to estimate the optimal loading of nitrate from decentralized wastewater treatment systems to an aquifer. The method utilizes a simulation-optimization approach in which a nitrate fate and transport simulation model is linked to an optimization model. Using this method, maximum (optimal) sustainable loading rates that meet constraints on groundwater quality and nitrate loading to streams via groundwater discharge can be determined. This method enhances the value of a simulation model as a decision-support tool in developing performance-based standards for onsite systems that will protect the quality of groundwater resources.
The method was demonstrated in conjunction with the National Onsite Demonstration Project (NODP) in the community of La Pine in southern Deschutes County, Oregon. The La Pine NODP has developed an extensive knowledge base on the hydrogeology of the shallow groundwater system, dynamics of nitrogen fate and transport, and performance of standard and new technologies for onsite wastewater treatment in this setting. One of the many products of the NODP was a nitrate fate and transport simulation model that could be used to test the optimization approach.
The La Pine nitrate loading management model (NLMM) was developed by linking the simulation model to an optimization model using the response-matrix technique. The NLMM was used to determine the minimum nitrate loading reductions that would be required in 97 management areas to meet specified water-quality constraints. Constraints can be set on groundwater nitrate concentration, discharge of nitrate to streams, and maximum or minimum loading reductions in management areas. Minimum loading reductions are determined for existing and future onsite systems. Cost factors can be applied to the optimization if the cost of reducing loading favors reductions for existing or future homes. The NLMM was used to perform trade-off analyses on the cost in terms of increased loading reductions required to meet more stringent water quality criteria. The role of the NLMM in the planning process for La Pine, Oregon, as well as considerations for application of the optimization method to other areas are described.
Background and Study Objectives..........................................................................................1-1 Purpose and Scope of the Report ..........................................................................................1-1 Previous Studies.....................................................................................................................1-2
2 NITRATE FATE AND TRANSPORT SIMULATION MODEL............................................2-1
Description of the La Pine Study Area....................................................................................2-1 Description of the Simulation Model .......................................................................................2-4 Scenario Simulations ..............................................................................................................2-6
3 NITRATE LOADING MANAGEMENT MODEL .................................................................3-1
Formulation of the Nitrate Loading Management Model.........................................................3-1 Response-Matrix Technique for Solution of the Nitrate Loading Management Model ...........3-6 Application of the Model .......................................................................................................3-11
Sensitivity of Optimal Solution to Water-Quality Constraints.............................................3-11 Sensitivity of Optimal Solution to Nitrate Loading Constraints ..........................................3-14 Sensitivity of Optimal Solution to Cost Factors..................................................................3-16 Spatial Distribution of Loading for Optimal Solution ..........................................................3-17 Comparison of Scenario Simulations and an Optimal Solution .........................................3-21
Role of the Nitrate Loading Management Model in the La Pine Planning Process ..............3-22 Considerations for Application of Simulation-Optimization Methods ....................................3-23
Need for Simulation Model ................................................................................................3-23 Adaptability to Other Areas ...............................................................................................3-23 Adaptability to Other Simulation Models............................................................................3-23
ix
Implementation in the Planning Process ...........................................................................3-24 Required Expertise............................................................................................................3-24 Cost ...................................................................................................................................3-24 Limitations .........................................................................................................................3-24
4 SUMMARY AND CONCLUSIONS.....................................................................................4-1
Figure 2-1 Location of the La Pine Study Area and Extent of the Nitrate Fate and Transport Model .................................................................................................................2-2
Figure 2-2 Block Diagram of the La Pine Nitrate Simulation Model ...........................................2-5 Figure 2-3 Historic Nitrate Loading From Distributed Wastewater Treatment Systems
and Eight Potential Future Nitrate Loading Scenarios Tested With the Simulation Model .................................................................................................................................2-8
Figure 2-5 Simulated Equilibrium Groundwater Nitrate Concentrations for 20 mg/L Distributed Wastewater Treatment Systems (Scenario 3, Table 2-2) ..............................2-11
Figure 3-1 Location of 97 Management Areas, 339 Groundwater Nitrate Concentration Constraint Points, and 14 Surface-Water Quality Constraint Reaches..............................3-2
Figure 3-2 Location of Management Areas Near Burgess Road, Direction of Groundwater Flow, and Distribution of Existing and Future Homes...................................3-8
Figure 3-3 Sensitivity of Optimal Loading Solutions to Groundwater Nitrate Concentration Constraints................................................................................................3-12
Figure 3-4 Sensitivity of Optimal Loading Solutions to Constraints on the Minimum Reduction in Groundwater Discharge Nitrate Loading to Streams...................................3-14
Figure 3-5 Sensitivity of Optimal Solution to Minimum Decentralized Wastewater Treatment Performance Standards for Future Homes Only.............................................3-15
Figure 3-6 Sensitivity of Optimal Solutions to Relative Cost Difference of Nitrate Loading Reduction for Existing and Future Homes .......................................................................3-17
Figure 3-7 Optimal Reduction in Nitrate Loading From Existing Homes..................................3-19 Figure 3-8 Optimal Reduction in Nitrate Loading From Future Homes....................................3-20 Figure 3-9 (A) Total Nitrate Loading Reduction for Each Scenario and the Optimal
Solution (B) Percent of 339 Constraint Sites Where Simulated Nitrate Concentrations Exceed 7 mg/L ........................................................................................3-21
xi
LIST OF TABLES
Table 2-1 Summary of Existing and Future Nitrate Loading From Residential Decentralized Wastewater Treatment Systems in La Pine, OR.........................................2-3
Table 2-2 Summary of Eight Potential Future Nitrate Loading Scenarios Tested With the Simulation Model................................................................................................................2-6
Table 3-1 Response Coefficients for the Shallow Nitrate Concentration Constraint Site for Loading From Existing Homes in Management Area 31 (Site 31-E-S in Figure 3-2).....................................................................................................................................3-9
xiii
1 INTRODUCTION
Background and Study Objectives
Decentralized wastewater treatment systems (DWTS) serve 25 percent of US households and 33 percent of new developments [United States Environmental Protection Agency (US EPA) 2003]. Most suburban and rural communities that utilize DWTS also rely on a decentralized drinking-water system supplied by individual, privately owned wells. Protection of the groundwater resource is a critical element of water-supply and land-use planning in these communities where alternative drinking-water sources may not exist or be economically feasible. Local streams, rivers, estuaries, and lakes also may be receiving waters for nutrient-laden groundwater discharge that can have adverse impacts on aquatic habitat.
Simulation models have been applied at the watershed scale to predict the effects of decentralized wastewater treatment on groundwater and surface-water quality. Simulation models are valuable tools for managing water resources because of their ability to simulate the complex behavior of hydrologic systems. Simulation models alone, however, cannot necessarily identify optimal solutions to water-resource management problems. Mathematical optimization techniques have been used with simulation models to identify optimal solutions to management problems, although there have been relatively few attempts to apply these techniques to groundwater quality issues associated with management of decentralized wastewater treatment systems. The simulation-optimization approach is appealing because it can account for both the complex behavior of a groundwater flow system and identify the best management strategy to achieve prescribed constraints (Wagner 1995).
The objective of this project was to demonstrate the use of optimization techniques with a simulation model to support decision making for watershed-scale management of decentralized wastewater treatment.
Purpose and Scope of the Report
This report describes the development of a method of using optimization techniques to enhance simulation models as decision-support tools. Specifically, this report addresses how these techniques apply to protection of water resources and planning for decentralized wastewater treatment in rural residential settings. The report features a case study in the community of La Pine in Deschutes County, Oregon, that demonstrates how optimization methods were linked with a simulation model to develop a nitrate loading management model (NLMM). The case study is used to illustrate the types of information that can be provided by the management model to support planning and water-quality protection issues. The key features of the nitrate
1-1
Introduction
fate and transport simulation model are described, and predictive simulations are presented for comparison with results from the nitrate loading management model. The formulation of the NLMM and the response-matrix method of solving the model are also described. The NLMM is used to evaluate the sensitivity of optimal solutions to constraints on groundwater quality and loading rates to streams. Finally, the report addresses a variety of considerations for using optimization methods with other simulation models and in other management settings.
Previous Studies
The use of simulation-optimization methods to support decisions related to groundwater management is well established, and is reviewed in articles by Gorelick (1983 and 1990), Yeh (1992), and Ahlfeld and Heidari (1994), and texts by Ahlfeld and Mulligan (2000), Gorelick et al. (1993), and Willis and Yeh (1987). Many investigators have applied the methods of simulation-optimization to the analysis of hydraulic groundwater management problems [for example, Bredehoft and Young (1970 and 1983), Maddock and Haines (1975), Heidari (1982), Willis and Liu (1984), Lekoff and Gorelick (1990a and 1990b), and Barlow et al. (1996)]. There are also many examples in which simulation-optimization methods have been used to design pump-and-treat systems for remediation of contaminated groundwater [for example, Gorelick et al. (1984), Ahlfeld et al. (1988), Haggerty and Gorelick (1994), and Liu et al. (2000)].
There are relatively few published studies in which optimization methods have been used to manage pollutant sources. Gorelick and Remson (1982) presented a linear programming-superposition method of optimally managing groundwater pollutant sources over time to maximize treatment and disposal potential while meeting groundwater quality constraints. The method was demonstrated using a simple two-dimensional sample problem. Gorelick (1982) then extended this work by using the same method with a more complex solute transport model to estimate schedules for wastewater disposal over various management horizons. Moosburner and Wood (1980) applied optimization methods to the problem of managing wastewater disposal from onsite wastewater treatment systems in the New Jersey Pine Barrens, although they used a very simple simulation model.
In this study, the optimization method was applied to a real-world planning problem using a complex three-dimensional groundwater solute-transport model. This work also shows how, using these methods, constraints on loading (groundwater discharge) of nitrate to streams, cost factors, and detailed sensitivity/trade-off analyses can be developed to support the decision-making process.
1-2
2 NITRATE FATE AND TRANSPORT SIMULATION MODEL
Description of the La Pine Study Area
The central Oregon community of La Pine is a rapidly growing rural-residential area without centralized wastewater treatment or drinking water systems (Figure 2-1). Most homes rely on individual decentralized wastewater treatment systems (DWTS) for wastewater disposal and wells for water supply. Wells are typically shallow (less than 50 feet below land surface) to tap permeable sands and gravels and to avoid more mineralized groundwater found in deeper aquifers. The water table is also shallow (less than 10 feet below land surface), and thin volcanic soils provide little opportunity for removal of nitrogen before septic effluent recharges groundwater. Centralized sewer or water systems have been determined to be economically infeasible in the area (KCM Inc. 1997) and, with a large number of lots still available for development, planners and regulators are concerned that future growth will render the groundwater resource unusable. The Deschutes and Little Deschutes Rivers have been listed as water-quality impaired under Section 303(d) of the Clean Water Act. High nitrate concentrations in shallow groundwater have been identified as potential contributors to eutrophic conditions found in some reaches (Anderson 2000 and Jones 2003).
In 1960, there were fewer than 300 homes in the La Pine area. After periods of rapid growth in the 1970s and 1990s, there were 5,400 homes and a population of 14,000 people in the area by the end of 1999 (US Bureau of the Census 2000). Centralized wastewater treatment facilities were installed in the highest density commercial/residential areas in the late 1980s, reducing the number of homes using DWTS to approximately 5,200 in Deschutes and Klamath counties (Table 2-1). In 2000, there were 5,010 developable lots remaining. Nearly 500 of these lots may ultimately be served by a centralized wastewater treatment system, leaving approximately 4,500 developable lots potentially served by DWTS. Deschutes County has projected that buildout will occur within 20 years (by 2019) if the 1990–1999 building rate of 250 homes per year continues (Everett 2003 written communication). Based on these projections, there will be more than 9,700 homes using DWTS, and the population of the area is expected to reach nearly 26,000 at buildout.
Nitrogen loading to the groundwater system has been estimated by Morgan et al. (In Press) for existing and future development (Table 2-1). All nitrogen was assumed to be converted to nitrate by the time the effluent reaches the water table. Loading was computed based on a mean of 2.55 residents per household, 170 L/d (liters per day) of effluent per person, and nitrate-N concentration at water table of 46 mg/L (milligrams per liter) (see Morgan et al., In Press, for details).
2-1
Nitrate Fate and Transport Simulation Model
2-2
Nitrate loading from 5,185 homes existing in 1999 totaled 104 kg/d. If all of the 5,010 lots remaining in 1999 were developed and used standard DWTS, there would be an additional 100 kg/d of nitrate loading at full buildout (Table 2-1). Deschutes County plans to sewer an area that includes 485 homes by 2007, which will reduce loading by nearly 10 kg/d (Catherine Morrow, Deschutes County 2004 written communication).
Figure 2-1 Location of the La Pine Study Area and Extent of the Nitrate Fate and Transport Model
Nitrate Fate and Transport Simulation Model
Table 2-1 Summary of Existing and Future Nitrate Loading From Residential Decentralized Wastewater Treatment Systems in La Pine, OR
Homes Loading1 (all values in kg/d)
County Existing (1999)
Future Future sewered
Total Existing(1999)
Future Future sewered
Total
Deschutes 4,796 4,281 (485) 8,592 96 85 (9.7) 171
Klamath 389 729 0 1,118 7.8 14.5 0 22
Total 5,185 5,010 (485) 9,710 104 100 (9.7) 194
kg/d, kilograms per day
In 1999, the La Pine area was selected to receive United States Environmental Protection Agency (US EPA) funding as part of the National Onsite Demonstration Project (NODP) (http://marx.deschutes.org/deq/LaPineIndex.htm). The work plan for the La Pine NODP stated the objective of the project as follows:
The primary objective of the La Pine National Decentralized Wastewater Treatment and Disposal project is to protect the La Pine sub basin aquifer’s water quality. The intent of this study is to accomplish the objective while allowing development to occur through a holistic approach of innovative denitrification technologies, in combination with understanding groundwater flow and nitrate fate and transport assessment, and to determine the appropriate development density through lot size optimization modeling based on the results of the denitrification systems study and assessment of the fate and transport of nitrate in the groundwater.
In order to develop the understanding of the source, fate, and transport of nitrate needed to meet this objective, the Oregon Department of Environmental Quality and Deschutes County Community Development Department requested that the US Geological Survey (USGS) complete a study of the source and fate of septic-derived nitrogen in the shallow alluvial aquifer underlying La Pine (Hinkle et al. In Press; Morgan et al. In Press). One product of that study was a numerical model that simulates the fate and transport of nitrate.
The study found that groundwater velocities are low because of low recharge rates and low to moderate hydraulic conductivity. Consequently, much of the nitrate in the aquifer is concentrated in the upper 10 to 20 feet of the system. Groundwater flows downward and toward the rivers that drain the area; however, nitrate has not moved very far either laterally or vertically since development began in the 1960s. This finding explains why, as of 1999, relatively few wells have nitrate concentrations above the drinking water standard of 10 mg/L. Simulations using the groundwater flow and nitrate transport model show, however, that even if nitrogen loading to the aquifer remained at present levels, peak nitrate concentrations in the aquifer would not occur for 30 years (Morgan et al. In Press). Doubling of nitrate loading, as is forecast to occur by 2020, will result in nitrate concentrations above the drinking water standard over large areas.
The shallow groundwater system is a heterogeneous mixture of silts, silty sands, sands, and fine gravels. Horizontal hydraulic conductivities (Kh) ranging from 5 to 80 ft/d (feet per day) were estimated from pump and slug test data and by model calibration. These deposits range in thickness from 10 to 100 feet and overlie several hundred feet of older, predominantly fine-grained sediments that act as a confining layer (Kh = 1 ft/d) to deep basalt aquifers. Other parameters for the alluvial aquifer are vertical hydraulic conductivity (Kv) 0.1 ft/d, effective porosity 0.3, and longitudinal, transverse, and vertical dispersivitities of 60, 6, and 0.06 feet, respectively. Vertical hydraulic conductivity, porosity, and dispersivitities were estimated from literature values and refined during model calibration.
Depth to the water table ranges from less than 5 feet to about 30 feet below land surface. Groundwater at the water table is generally oxic (dissolved oxygen concentration greater than 0.5 mg/L); however, at depths ranging from 0 to 50 feet below the water table groundwater becomes suboxic. This boundary is significant because nitrate is denitrified in the suboxic part of the aquifer (Hinkle et al. In Press).
Recharge from infiltration of precipitation averages about two inches per year based on studies done in support of a regional scale groundwater flow model of the upper Deschutes basin developed by the USGS (Gannett and Lite 2004). Groundwater discharges to the Deschutes and Little Deschutes Rivers, to evapotranspiration, and to wells. Withdrawals by wells are small and because much of the pumped water returns to the shallow aquifer through DWTS discharge, there is little net withdrawal from the aquifer by wells. The alluvial aquifer is bounded laterally by layered basalts, which may be hydraulically connected to groundwater in the alluvial deposits. Seasonal water-table fluctuations of up to five feet occur in response to recharge and river-stage changes. Most recharge occurs in late winter and early spring from snowmelt and precipitation. There is a minor amount of subsurface flow between the alluvial aquifer and the adjacent basalts and underlying confining beds.
Description of the Simulation Model
Transport of nitrate was simulated in the three-dimensional groundwater system with the numerical model MT3DMS (Zheng and Wang 1999). Steady-state flow was assumed for the advective component of transport and the groundwater velocity distribution was simulated using MODFLOW-96 (Harbaugh and McDonald 1996).
The alluvial aquifer was divided into a rectangular grid of 100 columns, 276 rows, and 24 layers. Cell dimensions were constant throughout the model, with the lateral dimension (∆x=∆y) equal to 500 feet and the vertical dimension (∆z) equal to 5 feet. The lateral extent of the simulation model is shown in Figure 2-1. The lateral and vertical extent of the model domain and the horizontal hydraulic conductivity distribution are illustrated in Figure 2-2. The alluvial deposits that comprise the shallow aquifer system are a heterogeneous mixture of clay, silt, sand, and gravel-size particles with horizontal hydraulic conductivities ranging from 0.1 to 80 ft/d. The hydraulic conductivity of the basalts and basaltic andesites that bound the alluvial aquifer system ranges from 50 to 200 ft/d.
2-4
Nitrate Fate and Transport Simulation Model
ExplanationHorizontal hydraulic conductivity
< 1
1-5
5-10
30-50
70-80
100-200 ft/ day
La Pine
Little Deschutes River
Deschutes River
Sunriver
Colors indicate relative magnitude of horizontal hydraulic conductivity. View is from the southeast.
Figure 2-2 Block Diagram of the La Pine Nitrate Simulation Model
The mean annual infiltration from precipitation was specified as recharge to the water table. Groundwater flows across the lateral and lower boundaries of the model were also estimated based on values from the regional-scale groundwater flow model (Gannett and Lite 2004). Groundwater discharge to evapotranspiration and the Deschutes and Little Deschutes Rivers was simulated using options available in the USGS MODFLOW model (Harbaugh and McDonald 1996).
Hinkle et al. (In Press) found that groundwater in the La Pine area evolves from oxic to increasingly reduced conditions as it flows through the shallow alluvial aquifer. Suboxic conditions are achieved within 30 years of recharge and the oxic-suboxic boundary is sharp. Well-transect studies showed that nitrate appears to be reduced to less than minimum reporting levels (0.005 milligrams nitrogen per liter) over distances too short to measure (less than 10 feet). The oxic-suboxic boundary for the model was mapped using data from 256 wells and ranges from 0 to 50 feet below the top of the water table. In the simulation model, the suboxic zone was represented as a constant concentration boundary with a nitrate concentration of zero on the basis of field data that show nitrate is denitrified rapidly after it is transported into the suboxic part of the aquifer (Hinkle et al. in press).
The steady-state flow model was calibrated using observations of head, groundwater discharge rates to rivers, and advective-transport observations from CFC-based time-of-travel data (Hinkle et al. In Press). The transport model was calibrated by simulating nitrate loading during the 40-year period 1960 to 1999 and comparing observed and simulated nitrate concentrations for the later part of the period when data are more abundant.
2-5
Nitrate Fate and Transport Simulation Model
Scenario Simulations
Simulation models often are developed with the goal of using them for predicting the future effects of management controls. The La Pine simulation model was initially used in what is referred to as a trial-and-error prediction mode. In this mode, future scenarios are designed in which the nitrate loading input to the model is varied according to a hypothetical set of management controls that could be imposed. The locations and rates of loading over time are specified as input to the simulation model and the model predicts the resulting distribution of nitrate concentrations in the aquifer and the discharge of nitrate to the streams. The results of scenarios are then compared to assess whether management controls have succeeded in meeting water-quality goals. This is referred to as a trial-and-error procedure because many simulations often must be made to find management controls that meet water quality goals. The results of the scenario simulations are presented here so that they may be compared later to the results of the simulation-optimization approach.
The calibrated simulation model was used to predict the effects of eight decentralized wastewater management scenarios on groundwater and surface-water quality. Descriptions of the scenarios and the resulting nitrate loading rates are summarized in Table 2-2.
Table 2-2 Summary of Eight Potential Future Nitrate Loading Scenarios Tested With the Simulation Model
Scenario DWTS
Performance (mg/L NO3
-)
Percent reduction from
standard system
TDC lots?1
Retro- fitting?2
Peak loading (kg/d)
Peak loading
year
Final loading(kg/d)
1 46 0 No No 182 2019 182
2 46 0 Yes No 155 2013 155
3 20 57 No Yes 116 2019 81.2
4 20 57 Yes Yes 108 2006 69.5
5 10 78 No Yes 101 2000 42.5
6 10 78 Yes Yes 101 2000 36.6
7 2 96 No Yes 101 1999 11.5
8 2 96 Yes Yes 101 1999 10.3
mg/L, milligrams per liter; kg/d, kilograms per day
1. Assumes 1,500 lots removed from pool of candidate lots. Locations were randomly selected from 2,600 possible lots.
2. Assumes all DWTS serving homes built prior to 2000 are retrofitted with denitrifying systems with performance equal to that of systems installed in new homes. Retrofits are made at rate of 94 per year until completed in 2057.
2-6
Nitrate Fate and Transport Simulation Model
The scenarios were designed by Deschutes County using two management control options in combination: 1) a transferable development credit (TDC) program and 2) a requirement for denitrifying DWTS for all existing homes and future development. The TDC program contributes to the goal of reducing groundwater contamination by minimizing the number of new septic systems. A TDC is acquired when the county pays a private property owner to record a restrictive covenant on a property. The restrictive covenant prevents the installation of a septic system. The purchased TDCs are necessary to transfer potential development to a master planned neighborhood on county owned property within the La Pine Unincorporated Community. This property is served by community sewer and water systems.
In field experiments for the La Pine NODP, denitrifying DWTS have been found to reduce nitrate concentrations in effluent recharge by up to 96 percent (Barbara Rich, Oregon Department Of Environmental Quality 2003 written communication). Morgan et al. (In Press) found that standard DWTS produce effluent recharge at the water table with a mean concentration of 46 mg/L NO3
--N (nitrate nitrogen). Four levels of DWTS performance were tested in the scenarios: 0, 57, 78, and 96 percent reduction, which correspond to nitrate effluent recharge concentrations of 46, 20, 10, and 2 mg/L NO3
--N, respectively. Four additional scenarios were defined in which the four DWTS performance levels were combined with a TDC program where development on 1,500 lots was moved to a sewered receiving area.
Additional assumptions for the scenarios included:
• Development would continue at the 1990–1999 rates of 250 homes per year until buildout (in 2019)
• All new homes would use denitrifying DWTS, and locations of new homes built each year were randomly determined
• DWTS for existing homes were randomly selected for retrofitting to denitrifying DWTS at a rate of 94 per year until all systems had been retrofitted
• For scenarios involving TDCs, 1,500 lots were randomly selected from a pool of 2,600 candidates provided by Deschutes County
Each scenario was simulated for 140 years beginning in 2000. The historical (pre-2000) nitrate loading rates and the future loading rates for each scenario are shown for the 140-year simulation period in Figure 2-3.
2-7
Nitrate Fate and Transport Simulation Model
0
20
40
60
80
100
120
140
160
180
200
1960 1980 2000 2020 2040 2060 2080 2100 2120 21
2-8
40
Nitr
ate
load
ing,
kg/
day
1 2
3 4 5 6 7 8
See Table 2-2 for descriptions of scenarios (kg/d, kilograms per day).
Figure 2-3 Historic Nitrate Loading From Distributed Wastewater Treatment Systems and Eight Potential Future Nitrate Loading Scenarios Tested With the Simulation Model
Scenario 1 (Table 2-2, Figure 2-3) is a simulation of status-quo buildout. This simulation shows the effects of making no changes to current land-use or wastewater-management regulations. Buildout was projected to occur in 2019, but simulations show that concentrations will continue to increase for many years as nitrate is added to storage in the aquifer. Concentrations will stabilize once the loading rate is balanced by the rates of denitrification and discharge of nitrate to streams. The simulation model shows that this will take more than 100 years. As the system approaches this equilibrium, concentrations will continue to increase over larger areas and many of those areas will exceed 10 mg/L nitrate within the next 20 to 50 years (Figure 2-4). Private wells are not subject to restrictions on use of water that exceeds US EPA limits; however, the known health risks of elevated nitrate would severely compromise the shallow groundwater resource as a source of drinking water.
Nitrate Fate and Transport Simulation Model
Colors indicate maximum nitrate concentration in vertical dimension.
The results of the other seven scenarios showed improved water-quality conditions for each level of increased management control. If all new homes are required to install denitrifying DWTS and all existing homes are required to replace standard DWTS with denitrifying DWTS, then simulations show that significant improvements in overall groundwater quality will be realized for all of the performance levels tested. For the 20 mg/L nitrate performance level and no TDC program (Scenario 3), however, many areas with nitrate concentrations exceeding the 10 mg/L drinking-water standard will remain (Figure 2-5). The scenarios using 10 mg/L performance level (Scenarios 5 and 6) resulted in better overall groundwater quality with fewer areas of groundwater nitrate concentration above 10 mg/L. At the 2 mg/L performance level (Scenarios 7 and 8), there were no areas where nitrate concentrations exceeded 10 mg/L. Each of these seven scenarios indicated that groundwater nitrate concentrations would peak within 20 to 50 years and then decline to equilibrium levels within 100 years. The relative effectiveness of the TDC program on reducing loading and improving water quality was diminished as the DWTS performance improved.
Results of the trial-and-error simulations showed that there is variability within the study area in the capacity to receive DWTS effluent and maintain satisfactory water-quality conditions. The capacity of an area to receive DWTS effluent appears to be related to many factors, including the density of homes, presence of upgradient development, groundwater recharge rate, groundwater flow velocity, and thickness of the oxic part of the aquifer.
Each of the scenarios tested with the simulation model was limited to management controls that were applied uniformly within the area. This is typically how simulation models must be used because as the size and complexity of the water-quality management problem increases, the ability of decision makers to design scenarios with management controls that reflect the variability in the loading capacity of sub-areas is diminished. Uniform management controls, such as requiring all existing DWTS to be retrofitted with denitrifying systems, may be more costly than variable management controls that account for the variability in the nitrate loading capacity of the groundwater system. Uniform controls that are stringent enough to protect water quality in some sub-areas may be more than is needed to protect quality in other sub-areas. The simulation model represents the hydrogeologic and chemical processes that cause this variability, and by adding optimization capability to the model, the nitrate loading capacity of the groundwater system can be determined for sub-areas.
2-10
Nitrate Fate and Transport Simulation Model
Colors indicate maximum nitrate concentration in vertical dimension (mg/L, milligrams per liter).
Figure 2-5 Simulated Equilibrium Groundwater Nitrate Concentrations for 20 mg/L Distributed Wastewater Treatment Systems (Scenario 3, Table 2-2)
2-11
3 NITRATE LOADING MANAGEMENT MODEL
The nitrate fate and transport simulation model was linked to optimization methods to produce the nitrate loading management model (NLMM). This chapter includes a description of how the management model was formulated, how it was solved, and finally, how it was applied to a complex decentralized wastewater-management and land-use planning problem near La Pine, Oregon.
Formulation of the Nitrate Loading Management Model
To solve a management problem using optimization methods, the components of the problem must be formulated using a mathematical structure. An optimization problem has three main components:
1. A set of decision variables
2. An objective function
3. A set of constraints
This formulation is a model of the decision-making process and is referred to as a “management model.”
The decision variables in the La Pine NLMM were the reduction in nitrate loading rates (relative to status-quo buildout nitrate loading rates) that would be needed to maintain or achieve desired water-quality conditions. It was not feasible to manage at the level of individual DWTS due to limits on the scale of the simulation model. To define decision variables, the study area was divided into 97 management areas. The basic unit for the management areas was a 0.25 mi2 rectangular area based on the Public Land Survey System. Up to three 0.25 mi2 (160-acre) units were combined to form management areas that contained an average of 100 lots (Figure 3-1). The model had 194 decision variables, NRi,j, because two decision variables were defined for each management area: loading reduction (kilograms per day, kg/d) for existing homes and loading reduction for future homes. Approximately 350 homes and lots were not included in the NLMM because they were in areas of very low density. These homes and lots represented only 7 kg/d of the total status-quo buildout loading of 197 kg/d.
Individual reaches are indicated by colors on the map.
Figure 3-1 Location of 97 Management Areas, 339 Groundwater Nitrate Concentration Constraint Points, and 14 Surface-Water Quality Constraint Reaches
Nitrate Loading Management Model
The objective function of the NLMM was to minimize the reduction in loading from status-quo buildout loading and is given as
minimize (Equation 3-1) ∑∑= =
NM
i
NT
jjijNRu
1 1,
where NM is the number of management areas, NT is the number of management area types, which can be either 1 for existing homes or 2 for future homes, and uj is a dimensionless unit cost factor for nitrate loading reduction from existing or future homes.
The value of the objective function was limited by a set of constraints on minimum reductions (relative to status-quo buildout) in groundwater nitrate concentrations, minimum reductions (relative to status-quo buildout) in groundwater discharge nitrate loads to streams, and minimum and maximum loading reductions to the aquifer for existing and future homes within each management area.
Minimum reduction in groundwater nitrate concentration constraints were set at 339 locations in the simulation model. The minimum reduction values were determined by simulating the status-quo buildout equilibrium concentration at each location and computing the reduction that would be necessary to meet a specified concentration value. For example, if the status-quo buildout concentration was calculated by the simulation model to be 23 mg/L and the maximum allowable concentration was 7 mg/L, then the minimum reduction constraint at that location would be 16 mg/L.
Constraint points were set at one or two locations in the simulation model for each management area. One point was selected to be sensitive to loading from existing homes and another location was selected to be sensitive to loading from future homes in the management area. The most sensitive locations for existing and future loading were determined by simulating loading from only existing or future homes in a management area and determining the location (cell) in the model where the highest simulated concentrations occurred. If the same location was most sensitive to both the existing and future loading from a management area, then only one location was set for that management area. There were 174 constraint locations in the NLMM (Figure 3-1).
The simulation model simulates three-dimensional flow and transport, and thus nitrate concentrations can vary with depth. To account for the variation in concentration with depth, both shallow and deep constraint points were set at most locations. The shallow point was set 5 to 10 feet below the water table (an average of 20 feet below land surface) and the deep point was set immediately above the suboxic boundary (an average of 50 feet below land surface). Some locations were eliminated because the oxic groundwater layer was thin and thus shallow and deep points fell within the same simulation model layer.
3-3
Nitrate Loading Management Model
Mathematically, the minimum groundwater concentration reduction constraints were specified as
CRminm,k ≤ CRm,k (Equation 3-2)
where CRm,k is the reduction in nitrate concentration (units of mg/L) at location m and depth k (which is calculated as part of the solution of the NLMM), and CRmin is the minimum concentration reduction required. The minimum concentration reduction was computed as
CRminm,k = Csqm,k – Cmaxk (Equation 3-2a)
where Csq is the simulated status-quo buildout concentration at location m and depth k, and Cmax is the maximum allowable concentration at depth k. The values used for the minimum groundwater concentration reduction constraints are described in the application of the model.
The effect of loading from the 350 homes and lots not included in the NLMM was accounted for by simulating equilibrium concentrations with only the “unmanaged” buildout loading. The resulting concentrations at each constraint site were used to adjust the CRminm,k values at each site.
Constraints on minimum reduction in groundwater discharge nitrate loads to streams were set for 14 reaches on the two streams in the study area (Figure 3-1). The minimum reduction values were determined by simulating the status-quo buildout equilibrium groundwater discharge nitrate loads to each reach and computing the reduction that would be necessary to meet a specified discharge load constraint. For example, if the status-quo buildout groundwater discharge nitrate load to a reach was predicted to be 3 kg/d and the maximum allowable discharge load was less than 1 kg/d, then the minimum reduction for that reach would be 2 kg/d. Constraints on minimum reduction in groundwater discharge nitrate loads to streams are described in the application of the model. Mathematically, the minimum reduction in groundwater discharge nitrate loads to stream constraints were specified as
DRminr ≤ DRr (Equation 3-3)
DRr is the reduction in groundwater discharge nitrate loads to stream reach r (units of kg/d) and DRmin is the minimum groundwater discharge nitrate load reduction required in reach r (units of kg/d). The minimum discharge load reduction was computed as
DRminr = Dsqr – Dmaxr (Equation 3-3a)
where Dsq is the simulated status-quo buildout discharge to reach r (units of kg/d) and Dmax is the maximum allowable discharge load to reach r (units of kg/d).
3-4
Nitrate Loading Management Model
Minimum and maximum loading reduction constraints were also set in the NLMM. Loading constraints could be specified for existing and future homes and could be used to set minimum and maximum constraints on possible loading reductions. Mathematically the constraints were expressed as
NRminj≤ NRi,j ≤ NRmaxj (Equation 3-4)
where NRminj and NRmaxj are minimum and maximum loading reduction constraints for existing and future homes (units of kg/d). The maximum and minimum reduction constraints are described in the application of the model.
In summary, the NLMM was formulated mathematically to minimize the reduction (or cost of reduction) from status-quo nitrate loading (Equation 3-1), subject to constraints on minimum reductions (relative to status-quo buildout) in groundwater nitrate concentrations (Equation 3-2), minimum reductions (relative to status-quo buildout) in groundwater discharge nitrate loads to streams (Equation 3-3), and minimum and maximum loading reductions for existing and future homes within each management area (Equation 3-4).
Finally, one of the inherent values of the optimization approach is that it requires decision makers and stakeholders to quantify planning goals and objectives as well as environmental and other constraints. The La Pine NLMM was formulated through a close collaboration with Deschutes County planners and regulators. The management objective of the NLMM, to minimize the reduction from status-quo nitrate loading from DWTS, reflects the goals of: 1) allowing as many existing lots to be developed as possible and 2) minimizing the number of existing DWTS that need to be upgraded. Considering that costs are associated with reducing loading by either not allowing lots to be developed or replacing existing DWTS, the management objective can be simply stated as “minimize the cost” of meeting water-quality goals. The water-quality goals are the constraints on the management model and have direct and quantifiable effects on the solution (or cost).
Decision makers and stakeholders must set values on the water-quality constraints that reflect regulatory requirements or economic and community values. If regulatory standards apply, the process of setting water-quality constraints is straightforward. However, if less well-defined economic or community values are to be the basis for water-quality constraints, then a trade-off analysis is a common process for finding the balance (or evaluating the relations) between costs and economic, aesthetic, health, environmental, and other benefits. The management model can be used as a decision-support tool in this process by quantifying the relation between water-quality constraints and optimal solutions.
3-5
Nitrate Loading Management Model
Response-Matrix Technique for Solution of the Nitrate Loading Management Model
The optimization method used to solve the NLMM is based on a widely applied technique for solving groundwater management problems called the response-matrix technique. The assumption that must be satisfied to use this technique is that the nitrate concentrations at each constraint site are a linear function of the loading rates in each management area. By assuming linearity, it is possible to determine the nitrate concentration or groundwater discharge loading rate to streams at any constraint location by summation of the contribution of each management area to the concentration or discharge at that location. The response-matrix technique is described in detail by Gorelick et al. (1993) and Ahlfeld and Mulligan (2000). The response-matrix approach has been used to solve groundwater waste-management problems by Moosburner and Wood (1980), Gorelick and Remson (1982), and Gorelick (1982).
The assumption that simulated nitrate concentration and discharge nitrate loading to streams were a linear function of loading to the aquifer was tested through a series of simulations. The loading rate to a single management area was varied in each simulation and the computed nitrate concentrations at several constraint locations (cells) were recorded. When loading rate was plotted against concentration for each location, the relation was shown to be linear.
One important requirement of this formulation is that the sources of nitrate loading have a known influence on the groundwater velocity field. This is necessary because the mass loading of nitrate is the product of the nitrate concentration and hydraulic loading rate of the DWTS. It is commonly assumed that for concentrated pollutant sources, the source-water flow rate has a negligible influence on the groundwater velocity field (Gorelick and Remson 1982; Gorelick 1982).
This assumption is also employed here, where recharge from DWTS to, and domestic well withdrawals from, the shallow aquifer are nearly equal, and both are small relative to natural recharge rates. Thus, the steady-state velocity field without the influence of DWTS as sources was used to simulate transport.
Use of the response-matrix technique requires that response functions for groundwater nitrate concentrations and groundwater discharge nitrate loading to streams are calculated at each of the 339 concentration constraint locations and 14 groundwater discharge nitrate loading to stream constraint reaches. The response functions were calculated by making 194 simulations, one for each decision variable. In each simulation, the status-quo buildout loading from existing or future homes in one management areas was used as input. The spatial distribution of loading within the management area was retained to the level of resolution of the simulation model finite-difference grid, which had cell dimensions of 500 feet in the x- and y-dimensions. The initial nitrate concentrations in the aquifer were set to zero, and the simulation was run until equilibrium concentrations were achieved. The status-quo loading rates (kg/d) for existing and future homes in management area i and type j were defined as Nsqi,j. The change in
3-6
Nitrate Loading Management Model
concentration (mg/L) at each concentration constraint location m and depth k, caused by status-quo loading, was defined as Csqm,k. Concentration response coefficients, rci,j,m,k, were computed as
ji
kmmkji
NsqCsqrc
,
,,,, = (Equation 3-5)
Groundwater discharge nitrate loading response coefficients, rdi,j,r, for each stream reach also were computed as
ji
rrji
NsqDsqrd
,,, = (Equation 3-6)
where Dsqr is the groundwater discharge nitrate loading to reach r caused by status-quo loading.
Concentration response coefficients have units of milligrams per liter per kilogram per day and groundwater discharge nitrate to stream response coefficients are dimensionless.
The magnitude of the response coefficient is directly proportional to the sensitivity of the nitrate concentration or discharge nitrate loading at a constraint site to loading in a management area. This relationship is illustrated for the concentration constraint site 31-E-S (Figure 3-2), which is the shallow concentration constraint site that was selected for its sensitivity to loading from existing homes in management area 31.
3-7
Nitrate Loading Management Model
Figure 3-2 Location of Management Areas Near Burgess Road, Direction of Groundwater Flow, and Distribution of Existing and Future Homes.
Management area 31 is adjacent to the west bank of the Little Deschutes River, approximately 1 to 1.5 miles north of Burgess Road (Figure 3-2). The linear response coefficients, rci,j,k,m, for several nearby management areas and types of homes (existing or future), show that the concentration at site 31-E-S is affected significantly by loading in management areas 31, 32, 50, 51, 52, and 53 (Table 3-1). Management areas 48, 49, 63, and 64 have small effects on the nitrate concentration at site 31-E-S. The values of the response coefficients (Table 3-1) show that the nitrate concentration at site 31-E-S is not a simple function of the number of homes in management area 31 or the distance from site 31-E-S to adjacent management areas. The future homes in area 31 have the largest influence on concentration at site 31-E-S, followed by existing homes in areas 50 and 31, future homes in areas 50 and 51, and existing homes in area 51. Management area 32, the closest area to site 31-E-S, has less influence on concentration than more distant areas because of the direction of groundwater flow through the area and the location of site 31-E-S in relation to homes in area 32.
3-8
Nitrate Loading Management Model
Table 3-1 Response Coefficients for the Shallow Nitrate Concentration Constraint Site for Loading From Existing Homes in Management Area 31 (Site 31-E-S in Figure 3-2)
Response coefficients have units of milligrams per liter per kilogram per day loading.
Because the system is linear, the reduction in nitrate concentration, CRm,k , at constraint location m and depth k can be calculated with the concentration response coefficients by summation of the individual concentration reductions caused by reductions in loading to existing and future homes in each management area. The summation is written as
∑∑= =
=NM
i
NT
j
jikmjim,k NRrcCR1 1
,,,, (Equation 3-7)
Similarly, the reduction in groundwater discharge nitrate loads to streams, DRr, can be calculated with the discharge load response coefficients by summation of the individual discharge load reductions caused by reductions in loading to existing and future homes in each management area. The summation is written as
∑∑= =
=NM
i
NT
jjirjir NRrdDR
1 1,,,
(Equation 3-8)
3-9
Nitrate Loading Management Model
There are 194 terms in these summations because there are 97 management areas (NM) and two loading types (NT), existing homes and future homes, in each management area. In each summation, however, many of the terms are equal to zero because the response coefficients are zero; this occurs where loading in a management area has no effect on concentration or discharge load at a constraint location.
The response matrix was prepared by running one simulation for each decision variable in which loading was applied only at the locations defined for that decision variable (for example, existing homes in management area 31). The loading rate and resulting concentrations at each of the constraint points were used to compute the response coefficient at each constraint point using equations 5 and 6. A set of utility programs and scripts were developed to run the 194 simulations, extract the simulated concentration values at constraint sites, compute the response coefficients, and format the coefficients into a matrix for input to the optimization program.
Response coefficients are the link between the simulation model and the NLMM. The response coefficients are utilized by the NLMM by replacing CRm,k (Equation 3-2) with the right-hand side of Equation 3-7 and replacing DRr (Equation 3-3) with the right hand side of Equation 3-8. The constraints for reduction in nitrate concentration and discharge load to streams are then written as
∑∑= =
≤NM
i
NT
ji,ji,j,m,km,k NRrcCR
1 1min (Equation 3-9)
and
∑∑= =
≤NM
i
NT
ji,ji,j,rr NRrdDR
1 1min (Equation 3-10)
Equations 3-9 and 3-10 replace Equations 3-2 and 3-3 in the NLMM.
The modified NLMM, defined by Equations 3-1 (objective function), 3-4 (loading constraints), 3-9 (concentration constraints), and 3-10 (discharge load constraints), comprises a linear program. This program was solved using the “What’s Best!” optimization program (LINDO Systems 2003). This set of solvers is implemented as a spreadsheet add-in and is capable of mathematically searching for the minimum nitrate loading reductions for existing and future homes in each management area that satisfy the constraints on nitrate concentrations in groundwater and groundwater discharge load of nitrate to streams. The program also identifies management problems that are not feasible. This occurs when at least one constraint cannot be met with any combination of decision variable values.
3-10
Nitrate Loading Management Model
Application of the Model
In the application of the La Pine NLMM described here, the values of constraints were varied in a sensitivity analysis to explore relations between constraint values and loading rates to the aquifer. The three constraint types used in the NLMM were individually varied and optimal solutions were computed to demonstrate how decision makers might use the NLMM to determine how constraints on groundwater concentration, groundwater discharge nitrate loading to streams, and minimum loading reduction affect the objective of minimizing nitrate loading reductions. The NLMM also was used to evaluate the influence of a cost variable that accounts for differential costs in reducing nitrate loading from existing and future homes.
Sensitivity of Optimal Solution to Water-Quality Constraints
Protection of groundwater for drinking water and surface water for recreation and habitat are important goals in the La Pine area. All residents rely on groundwater and about 60 percent of them have wells that pump from the most vulnerable upper 100 feet of the aquifer. The Deschutes and Little Deschutes Rivers that drain the La Pine area receive groundwater discharge for nearly their entire length within the study area. The simulation model shows that, at status-quo buildout, up to 20 percent of nitrate from DWTS may discharge to these streams via groundwater (Morgan et al. In Press). The effects of this discharge are not well understood, but the water quality of the streams might be adversely affected by increases in nutrient loads.
Groundwater Nitrate Concentration
Groundwater concentration constraints were set at up to two locations for each management area: one location was the most sensitive to loading from existing homes in that management area, and the other location was most sensitive to loading from future homes. In 20 management areas, the same location was most sensitive for both existing and future homes. A shallow constraint site was specified near the water table at each these 174 locations (Figure 3-1). In addition, where the oxic part of the aquifer was greater than 10 feet thick (163 of these locations), a deep constraint site was specified. As described in the discussion of the model formulation, the concentration constraint values, CRminm,k, were computed (Equation 3-2a) as the minimum reduction from status-quo buildout concentration that would be required to meet a specified concentration limit, Cmaxk.
The NLMM was solved using a range of 1 to 25 mg/L for the maximum allowable concentration values for both the shallow (Cmaxs) and deep (Cmaxd) constraint sites. This range was selected because it includes most of the range of values that would constrain, or bind, the optimal solution. Binding constraints are those that limit the amount of loading to the aquifer. Non-binding constraints are those that, because of either their value or location, do not limit the loading to the aquifer system. Different concentration constraints were set to show the relative sensitivity of the optimal loading solutions to constraints in different parts of the aquifer system.
3-11
Nitrate Loading Management Model
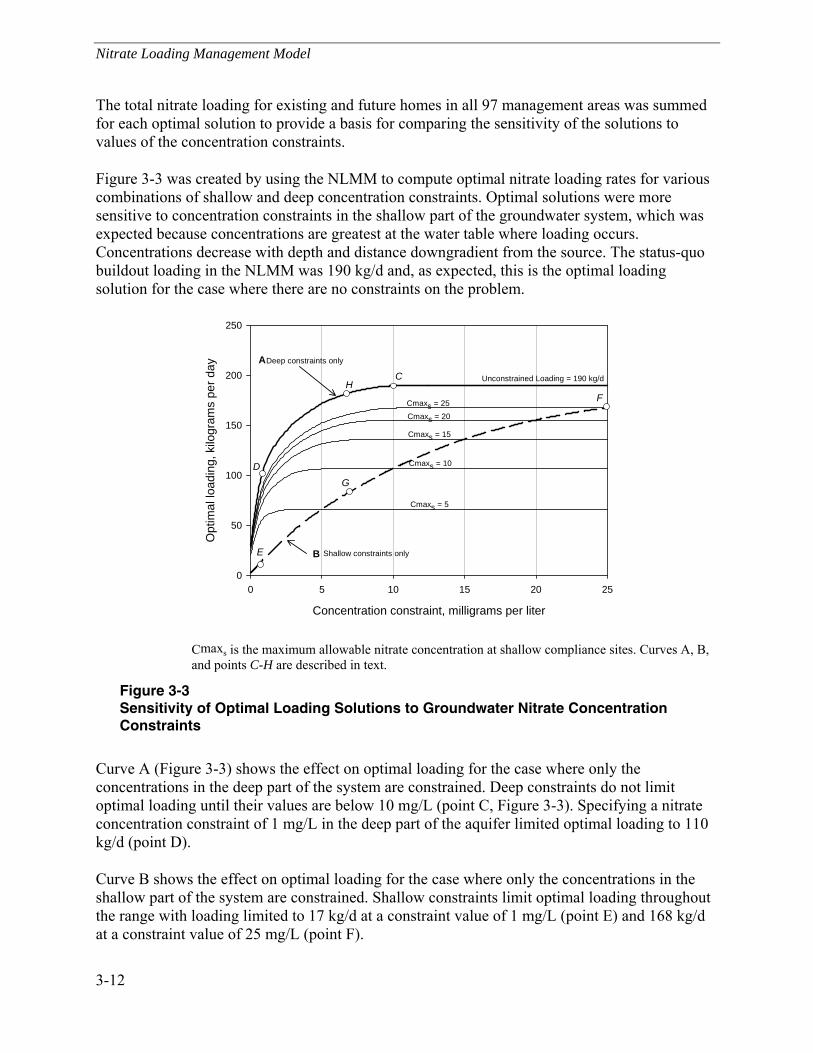
The total nitrate loading for existing and future homes in all 97 management areas was summed for each optimal solution to provide a basis for comparing the sensitivity of the solutions to values of the concentration constraints.
Figure 3-3 was created by using the NLMM to compute optimal nitrate loading rates for various combinations of shallow and deep concentration constraints. Optimal solutions were more sensitive to concentration constraints in the shallow part of the groundwater system, which was expected because concentrations are greatest at the water table where loading occurs. Concentrations decrease with depth and distance downgradient from the source. The status-quo buildout loading in the NLMM was 190 kg/d and, as expected, this is the optimal loading solution for the case where there are no constraints on the problem.
Concentration constraint, milligrams per liter
0 5 10 15 20 25
Opt
imal
load
ing,
kilo
gram
s pe
r day
0
50
100
150
200
250
Unconstrained Loading = 190 kg/d
Deep constraints only
Cmaxs = 25Cmaxs = 20
Cmaxs = 15
Cmaxs = 10
Cmaxs = 5
Shallow constraints only
A
B
C
D
E
F
G
H
Cmaxs is the maximum allowable nitrate concentration at shallow compliance sites. Curves A, B, and points C-H are described in text.
Figure 3-3 Sensitivity of Optimal Loading Solutions to Groundwater Nitrate Concentration Constraints
Curve A (Figure 3-3) shows the effect on optimal loading for the case where only the concentrations in the deep part of the system are constrained. Deep constraints do not limit optimal loading until their values are below 10 mg/L (point C, Figure 3-3). Specifying a nitrate concentration constraint of 1 mg/L in the deep part of the aquifer limited optimal loading to 110 kg/d (point D).
Curve B shows the effect on optimal loading for the case where only the concentrations in the shallow part of the system are constrained. Shallow constraints limit optimal loading throughout the range with loading limited to 17 kg/d at a constraint value of 1 mg/L (point E) and 168 kg/d at a constraint value of 25 mg/L (point F).
3-12
Nitrate Loading Management Model
If a regulatory limit, such as the Oregon Department of Environmental Quality “action level” of 7 mg/L is applied to the shallow constraint sites (and no limit is placed on the deep sites), optimal loading is reduced to 84 kg/d—a 56 percent reduction from status-quo loading (point G, Figure 3-3). For comparison, if only deep sites are constrained to 7 mg/L, optimal loading is reduced to 183 kg/d (point H). Loading curves are also shown on Figure 3-3 for shallow concentration constraint values of 5, 10, 15, 20, and 25 mg/L Figure 3-3 can be used to analyze the effects of more- or less-stringent concentration constraints on nitrate loading to the aquifer.
These results can be used to assess trade-offs in protection of water quality in the shallow and deep parts of the aquifer. Very few wells in La Pine are open to the upper 10 feet of the aquifer where the shallow constraints are located. Using these results, decision makers could evaluate the cost, in terms of reduced loading, of protecting the shallowest part of the system (within 10 feet of the water table) to the same degree as the deeper part of the system (30 to 50 feet below the water table), where most domestic wells obtain water.
Groundwater Nitrate Discharge Loading to Streams
Fourteen stream reaches were defined where constraints could be applied to groundwater nitrate discharge loading (Figure 3-1). As described in the discussion of the model formulation, the discharge loading constraint values, DRminr, were computed (Equation 3-3a) as the minimum reduction from status-quo buildout discharge loading that would be required to meet a specified limit, Dmaxr. The beginning and end of each reach were selected to coincide with confluences or road crossings. Five of the 14 reaches (numbers 1, 5, 8, 9, and 11, Figure 3-1) receive little simulated groundwater discharge nitrate loads, and were not included as constraints in the NLMM.
Discharge loading constraints were specified by setting a minimum percent reduction from status-quo buildout discharge loading. The percent reduction was varied from 0 to 99 percent, and shallow and deep concentration constraints were constant at 7 and 3 mg/L, respectively. Optimal loading to the aquifer was limited by the concentration constraints and showed little change until discharge loading constraints exceeded about 40 percent (Figure 3-4). At values above 40 percent, most of the loading reductions required to meet this constraint are in the management areas adjacent to streams where, according to the simulation model, there are shallow groundwater flow paths through the thin oxic part of the groundwater system connected to the streams. The NLMM shows that by reducing loading in the nearstream management areas, discharge of nitrate to streams could be nearly eliminated by reducing optimal loading from 84 to 40 kg/d.
3-13
Nitrate Loading Management Model
Minimum reduction in discharge loading to streams, percent
0 20 40 60 80 1000
20
40
60
80
100
Nitr
ate
load
ing,
kilo
gram
s pe
r day
0
20
40
60
80
100
Optimal loading to aquiferGround-water dischargenitrate loading
Figure 3-4 Sensitivity of Optimal Loading Solutions to Constraints on the Minimum Reduction in Groundwater Discharge Nitrate Loading to Streams
These results can be used to assess trade-offs in the protection of surface-water quality. To make decisions on the values of discharge constraints, a better understanding is needed of the processes affecting nitrate as it is transported through the nearstream and riparian environments. The simulation model uses simple assumptions regarding the fate and transport of nitrate in this part of the system and the estimates of discharge loading to streams should be considered the upper bounds of possible discharge (Morgan et al. In Press). The purpose of this analysis is to show how the NLMM can be used to conjunctively manage water quality of groundwater and surface-water resources using optimization techniques.
Sensitivity of Optimal Solution to Nitrate Loading Constraints
Minimum and maximum loading reduction constraints, NRmin and NRmax in Equation 3-4, can be set for existing or future homes in the NLMM. The constraints are computed as a percentage of the status-quo buildout loading for the existing or future homes in each management area. For example, if status-quo buildout loading for future homes in a management area is 2 kg/d, and one wishes to constrain the loading reduction to a minimum of 25 percent of status-quo buildout loading, then NRmin would be equal to 0.5 kg/d.
In this example, the loading constraints were used to test the effects of potential regulatory controls on DWTS performance in future development. As formulated, the NLMM has the flexibility to test other constraints on loading reduction. The example above demonstrates the type of analysis that would be useful if it were found that control on future development were preferable due to cost considerations or regulatory barriers to reducing loading from existing homes.
3-14
Nitrate Loading Management Model
A series of optimal solutions were computed in which the minimum reduction constraint for future homes was varied while all other constraints were held constant. Groundwater concentration constraints were set at 7 and 3 mg/L for the shallow and deep sites, respectively, and groundwater discharge nitrate loading to streams was left unconstrained. Maximum loading reduction constraints were set to 96 percent of status-quo buildout loading for both existing and future homes; this constraint reflects the assumption that the best attainable DWTS performance is 2 mg/L NO3
-. The minimum loading reduction constraint for future homes was set on the basis of assumed performance standards for DWTS that ranged from 2 to 46 mg/L NO3
- concentration in effluent that recharged the groundwater system. All existing DWTS in La Pine are assumed to discharge effluent with 46 mg/L NO3
- (Hinkle et al. In Press; Morgan et al. In Press), and this was the performance level used to compute the status-quo buildout loading of 190 kg/d. Thus, in this series of solutions, the 46 mg/L performance level was the equivalent of no reduction from status-quo loading. The other performance levels used were 2, 10, 20, and 30 mg/L, corresponding to minimum loading reductions of 96, 78, 57, and 35 percent, respectively (Figure 3-5).
Minimum reduction for loading from future homes, as percent of status quo rate
0 35 57 78 96
Opt
imal
load
ing,
kilo
gram
s pe
r day
0
20
40
60
80
100
Existing homesFuture homes
3831 24 15 3
46 46 48 51 55
Numbers are contributions to loading from existing and future homes, in kilograms per day.
Figure 3-5 Sensitivity of Optimal Solution to Minimum Decentralized Wastewater Treatment Performance Standards for Future Homes Only
Under status-quo buildout conditions, existing and future homes will contribute 104 and 86 kg/d, respectively, to the total loading of 190 kg/d. The results of this analysis show that as the minimum loading reduction constraint for future homes is increased from 0 to 96 percent, optimal loading from future homes decreases from 38 to 3 kg/d, and total loading decreases from 84 to 58 kg/d.
3-15
Nitrate Loading Management Model
The reduction in loading to the aquifer from future homes that is forced by having a minimum reduction constraint allows higher loading rates to be maintained from existing homes while still meeting concentration constraints. If no loading reduction is required for future homes, loading from existing homes will have to be reduced by 56 percent (from 104 kg/d to 46 kg/d). By requiring improved performance of DWTS in future homes, there is less need for loading reduction from existing homes to meet concentration constraints. For example, if a 96 percent reduction requirement is imposed for future homes, loading from existing homes would only have to be reduced by 47 percent. If it were less costly to reduce loading from future homes by installing denitrifying DWTS than having existing homes retrofit with denitrifying DWTS, then using this type of constraint in the NLMM would allow planners to incorporate specific DWTS performance standards for future homes into the optimal solution.
Sensitivity of Optimal Solution to Cost Factors
The simulation model accounts for the physical and geochemical complexities of the groundwater system, and this information is available to the NLMM through the response-coefficient matrix. Other variables, external to the simulation model, can also be important in determining the optimal nitrate loading solution. The cost of implementing management controls is the most common external variable that affects management decisions. In many optimization problems, the objective is to minimize the cost of satisfying the constraints on the problem.
Reducing loading from DWTS can incur significant costs whether the means is limiting housing density or installing and maintaining denitrifying DWTS. The cost factor of reducing nitrate loading, uj in Equation 3-1 of the NLMM, can be used to account for differences in cost for existing and future homes. If costs vary between decision variables in other ways, such as geographically, cost variables can be specified for individual management areas.
The sensitivity of the La Pine NLMM to differences in the cost of reducing nitrate loading from existing and future homes was evaluated by computing the optimal loading solutions for a range of unit cost ratios. Arbitrary cost factors were set that resulted in ratios of existing to future unit costs ranging from 0.11 (1:9) to 9.0 (9:1). For example, for a cost ratio of 0.11 the cost factors for existing and future loading reduction were 1 and 9, respectively. To define the end members, two additional solutions were computed in which the unit cost was set to zero first for existing, and then for future homes. The only constraints on the problem were groundwater concentration constraints of 7 and 3 mg/L for the shallow and deep sites, respectively. The loadings from existing and future homes for each cost ratio are shown in Figure 3-6.
3-16
Nitrate Loading Management Model
Loading reduction cost ratio, cost of reducing existing homes loading / cost of reducing future homes loading
Existin
g=0
0.11
0.25
0.43
0.66
1.00
1.50
2.33
4.00
9.00
Future=
0
Opt
imal
load
ing,
kilo
gram
s pe
r day
0
20
40
60
80
100Higher costs for existing homesHigher costs for future homes
Loading from future homes
Loading from existing homes
EQU
AL CO
ST
Optimal total loading
Figure 3-6 Sensitivity of Optimal Solutions to Relative Cost Difference of Nitrate Loading Reduction for Existing and Future Homes
The highest optimal total loading occurs when the cost ratio (existing:future) is 1.0. As the ratio increases or decreases to favor reductions in future or existing homes, respectively, the optimal balance in loading is affected because the objective function (to minimize cost) is most efficiently reduced by eliminating loading from homes that have the lowest cost per unit reduction. As the cost ratio increases or decreases from 1.0, the total loading that can be maintained decreases because cost variables now act as weighting factors that partially determine which management areas and types will be reduced. It is unlikely that the ratio of real costs would fall outside the range of 0.43–2.33, within which the effect on total loading is relatively small. The relative contributions to loading from existing and future homes, however, do vary significantly within this range. This suggests that wherever possible, true cost factors should be incorporated into the NLMM to account for this important external variable.
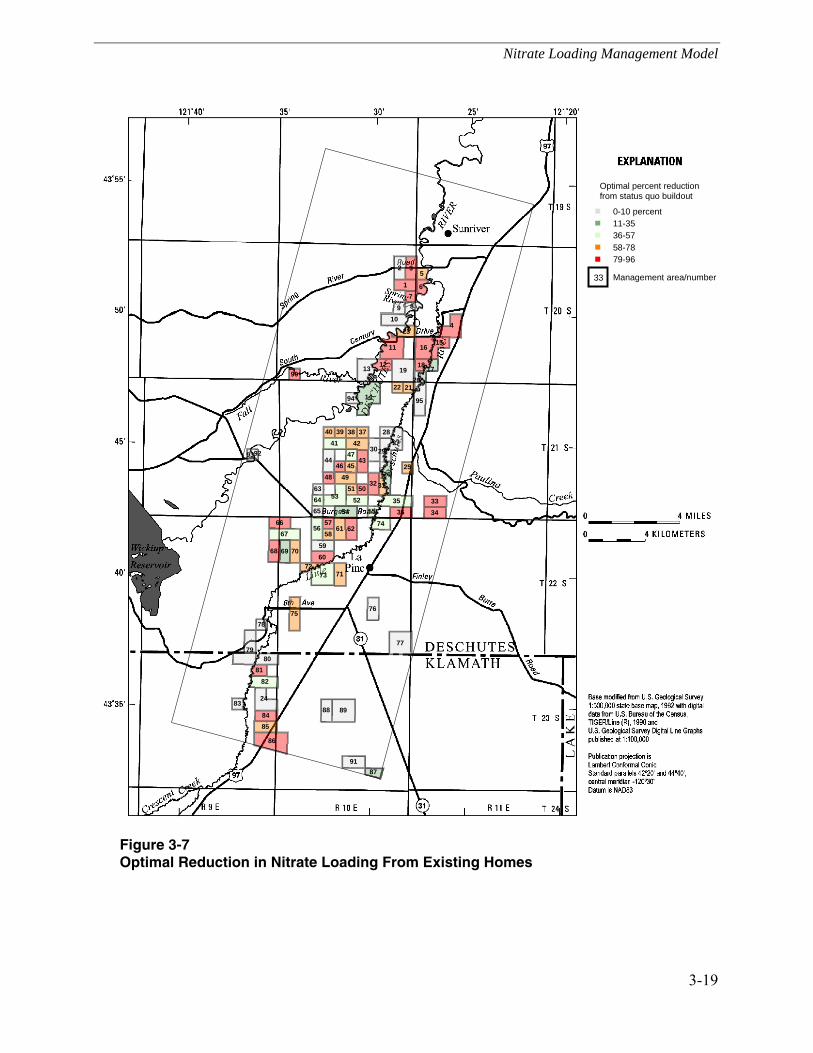
Spatial Distribution of Loading for Optimal Solution
The NLMM computes the minimum loading reduction needed from existing and future homes in each management area to achieve the water-quality goals prescribed by a constraint set. To illustrate the variation in optimal loading between management areas, optimal loading rates to each management area from both existing and future homes were mapped for a specific set of constraints. The constraints for this solution included that groundwater nitrate concentrations could not exceed 7 mg/L at shallow sites and 3 mg/L at deep sites, and the maximum loading reduction possible for either existing or future homes was 96 percent. The groundwater concentration limits were selected to reflect the goals of minimizing loading reductions and
3-17
Nitrate Loading Management Model
insuring protection of the part of the aquifer (30 to 50 feet below the water table) where most domestic wells obtain water. The 96 percent limit on loading reduction is consistent with data from the La Pine NODP, which has shown that the best sustained DWTS performance in this area is 2 mg/L NO3
- in effluent leaving the drain field. There were no constraints on discharge of nitrate to streams or minimum loading reduction and there were no differential cost factors included.
The optimal minimum reductions vary over a broad range among the 194 decision variables in 97 management areas (Figure 3-7 and Figure 3-8). The breadth of the range is a reflection of the complex relations between development location and density, hydrogeology, and geochemical processes.
For the specified constraints, the optimal reduction in total loading is 107 kg/d, or 56 percent of the 190 kg/d of loading projected for status-quo buildout. Contributions to buildout loading were reduced from 104 to 46 kg/d for existing homes and from 86 to 38 kg/d for future homes. The optimal reductions in each management area for existing and future homes are shown in Figure 3-7 and Figure 3-8, respectively.
Overall, the loading from existing homes was reduced by the same proportion, 56 percent, as the loading from future homes because there was roughly the same number of existing and future homes in the area as of 2000. Locally, within individual management areas, the reductions in loading from existing and future homes were often quite different. For example, in management area 33, where most lots had been developed by 2000, loading from existing homes and future homes would need to be reduced by 81 and 67 percent, respectively (Figure 3-7 and Figure 3-8).
The adjacent management area 34 has even fewer undeveloped lots and the entire loading reduction needed to meet concentration constraints (93 percent) would need to occur from existing homes.
To further validate the assumption that the simulated nitrate concentrations and discharge nitrate loading to streams were a linear function of nitrate loading to the aquifer, the optimal reductions in loading computed with the NLMM were applied to the loading input to the simulation model. With the optimal loading rates specified in the simulation model, the simulated nitrate concentrations and discharge loading to streams were equal to the values computed by the NLMM at all 339 concentration and 14 discharge loading constraint locations and reaches.
The detailed spatial distribution of loading reduction illustrated in this example could be used by decision makers to delineate groundwater protection zones and set special performance standards for DWTS to achieve the needed loading reductions.
3-18
Nitrate Loading Management Model
4
14
86
2 3
89
19
79
1
77
11
73
16
53
24
75
13
67
35
95
82
27
10
8
6
9
91
59
6156
33
30
68
44
7
34
43
76
85
62
49
84
71
32
54
42
15
88
36
41
60
52
66
80
69 70
5
29
26
74
1217
23
81
28
87
18
83
72
58
31
57
48
90
94
4647
78
37
45
38
25
65
22
6364
50
21
40 39
51
20
55
9392
Optimal percent reduction from status quo buildout
0-10 percent11-3536-5758-7879-96
Management area/number33
Figure 3-7 Optimal Reduction in Nitrate Loading From Existing Homes
3-19
Nitrate Loading Management Model
4
14
86
2 3
89
19
79
1
77
11
73
16
53
24
75
13
67
35
95
82
27
108
6
9
91
59
6156
33
30
68
44
7
34
43
76
85
62
49
84
71
32
54
42
15
88
36
41
60
52
66
80
69 70
5
29
26
74
12 17
23
81
28
87
18
83
72
58
31
57
48
90
94
4647
78
37
45
38
25
65
22
6364
50
21
40 39
51
20
55
9392
Optimal percent reduction from status quo buildout
Figure 3-8 Optimal Reduction in Nitrate Loading From Future Homes
3-20
Nitrate Loading Management Model
Comparison of Scenario Simulations and an Optimal Solution
Groundwater nitrate concentrations were used to compare the effectiveness of management controls imposed in the scenario simulations with the effectiveness of an optimal solution computed using the NLMM. For the comparison, concentration values were compiled at the 339 NLMM constraint sites (Figure 3-1) for four of the scenarios simulated using the simulation model in a “trial-and-error” mode. The four scenarios (1, 3, 5, and 7 in Table 2-2) specified treatment levels for DWTS of 46, 20, 10, and 2 mg/L NO3
-, respectively. For this analysis, a fifth scenario using a treatment level of 30 mg/L also was simulated. Scenario 1 was the status-quo buildout scenario where DWTS are assumed to yield 46 mg/L NO3
-. The important assumptions in the other four scenarios are that all future homes install the denitrifying DWTS, and that all existing DWTS are replaced with denitrifying DWTS. The optimal solution used in the comparison is that in which groundwater nitrate concentrations could not exceed 7 mg/L at shallow sites and 3 mg/L at deep sites, and the maximum loading reduction possible for either existing or future homes was 96 percent.
The relative effectiveness of the management controls used in each scenario was evaluated by comparing the percentage of constraint sites that had nitrate concentrations greater than 7 mg/L. The relative cost of each scenario was evaluated by comparing the total nitrate loading with the assumption that reduced loading would incur greater costs. The effectiveness and relative costs of the five scenarios are compared with the optimal solution from the NLMM in Figure 3-9. For the status-quo (46 mg/L) scenario with 190 kg/d loading, 46 percent of the sites had concentrations greater than 7 mg/L. As DWTS treatment levels decreased from 46 to 2 mg/L and loading declined from 190 to 7 kg/d, the percentage of sites with concentrations greater than 7 mg/L declined from 46 to 1 percent.
46 mg/Lsystems
Status quo(Scenario 1)
20 mg/Lsystems
(Scenario 3)
Optimalsolution
10 mg/Lsystems
(Scenario 5)
2 mg/Lsystems
(Scenario 7)
30 mg/Lsystems
Load
ing
redu
ctio
n, k
g/d
0
50
100
150
200
Per
cent
of s
ites
> 7
mg/
L
0
10
20
30
40
50
A
B
See Table 2-2 for descriptions of scenarios.
Figure 3-9 (A) Total Nitrate Loading Reduction for Each Scenario and the Optimal Solution (B) Percent of 339 Constraint Sites Where Simulated Nitrate Concentrations Exceed 7 mg/L
3-21
Nitrate Loading Management Model
The optimal solution, with concentration constraints of 7 and 3 mg/L in the shallow and deep sites, respectively, had three sites (one percent) with concentrations slightly greater than 7 mg/L because of the effect of a small amount of loading from dispersed homes not included in the NLMM. Loading in the optimal solution was 83 kg/d, which was nearly equivalent to loading in the 20 mg/L scenario (3), in which 26 percent of the sites had concentrations greater than 7 mg/L. The 10 mg/L and 2 mg/L scenarios (5 and 7, respectively) are approximately equivalent to the optimal solution in reducing nitrate concentrations in groundwater. Because they apply uniform management controls, however, loading must be reduced by 38 to 70 percent more than would be required under the optimal solution to achieve similar results.
The scenarios are based on uniform management controls (that is, all new homes have denitrifying DWTS and all existing systems are replaced), whereas the optimal solution only calls for reductions where reductions are needed to meet quality constraints. Decision makers will most likely not be able to implement the optimal solution exactly because it would be difficult to have DWTS performance requirements vary greatly over areas as small as some of the management areas defined in the NLMM. More likely, decentralized wastewater treatment will be managed over larger areas that have similar nitrate loading capacity in the NLMM solution. This will increase the real loading reduction required to meet water-quality standards, but should still be far less costly than uniform management controls.
Role of the Nitrate Loading Management Model in the La Pine Planning Process
By: Barbara Rich, Coordinator, La Pine National Demonstration Project Peter Gutowsky, Planner, Deschutes County Community Development Department
The county will be developing target loads using the NLMM. The project area will be divided into sub-areas where all discharges can be assumed to be environmentally equal for trading purposes. Target loads [similar to Total Maximum Daily Loads (TMDLs)] will be established for each trading sub-area that will meet or exceed water-quality goals. An assessment team will evaluate different methods for allocating target loads among properties within each sub-area. The county’s task will be to evaluate and distinguish each sub-area and its respective “nitrate reduction solution.” This analysis will provide staff with a framework for categorizing sub-areas based on their nitrate reduction solution, number of lots (developed versus vacant), neighborhood profile, and age of existing septic systems. Ultimately, these queries should aid staff in developing onsite water-quality mitigation approaches for retrofitting existing homes with new denitrification technology and placing higher treatment standards for new housing development. Additionally, by using the nitrate loading management model to calculate the total number of retrofitted onsite systems required to meet the maximum nitrate loading capacity of the aquifer, the county can develop onsite wastewater retrofitting incentive strategies. Potential options include pollution credit programs, using transferable development credits, and a revolving loan program.
Lastly, the NLMM model is a potent tool to use when engaging advisory committees and the general public during the policy development process because scenarios can be run as they are
3-22
Nitrate Loading Management Model
conceived and the outcomes shown graphically. The immediacy of the feedback helps build the knowledge base of the public participants to the process quickly and efficiently.
Considerations for Application of Simulation-Optimization Methods
Need for Simulation Model
Simulation models can be expensive to develop, largely because they require more data than some other techniques, such as mass balance calculations. However, where simulation models are justified due to the complexity of the groundwater system and need for predictive capability, the use of optimization has the potential to reduce the cost of using the simulation model to identify best management strategies. It should be noted that simulation models are available for many communities, and even if they were initially developed for other purposes, can often be cost-effectively adapted to address water-quality issues. The US EPA (1994) found that “In 1994, the cost of numerical modeling is generally lower than 10 years before because of the availability of personal computer versions of the code, decrease in the cost of workstations, reduction in the cost of simulations and presentation of results, and more sophisticated and experienced users.” Over the last decade, these trends have continued and numerical models are consequently being applied to more groundwater resource management issues than ever before.
Adaptability to Other Areas
The simulation-optimization method is highly adaptable and can be utilized in nearly any setting. The general approach to defining the objective function, decision variables, and constraints can be used to adapt the simulation-optimization method and develop nitrate loading management models for other areas. The primary requirement is that there be a simulation model available that will support optimization (see below). The most problem-specific part of implementing optimization is formulating the management model. The objective function, decision variables, and especially the constraints, will be unique to the specific planning needs and stakeholder goals.
Adaptability to Other Simulation Models
The La Pine NLMM was developed using the MODFLOW-MT3D simulation model. The NLMM could have been developed with any groundwater flow and transport simulation model that accurately predicted the changes in nitrate concentration and discharge loading to streams in response to changes in nitrate loading. Use of optimization is not limited to groundwater simulation modeling. Surface-water flow and transport as well as watershed process simulation models could also be enhanced as decision-support tools using optimization methods. In the La Pine example, it was found that there was a linear relation between loading and concentrations, and the simulation model was used to compute the linear response coefficient matrix used by the NLMM. Non-linear simulation models also can be used with optimization to develop management models, although they are more difficult to solve. Ahlfeld and Mulligan (2000) provide good descriptions of advanced linear and non-linear problem formulation and solution.
3-23
Nitrate Loading Management Model
Implementation in the Planning Process
Simulation-optimization methods fundamentally change the role of the simulation model in the planning process. In the traditional trial-and-error approach, the simulation model is a passive tool. Planners must use intuition to conceive management strategies and controls that will achieve land-use and water-quality goals, and then translate the strategies into scenarios. The simulation model predicts the outcomes of each scenario, and the outcomes are compared to water-quality goals. The number of possible scenarios is infinite and the likelihood of identifying the best scenario is small. Using optimization methods transforms the simulation model into a management model that is an active tool because planners and stakeholders must articulate and quantify the management goals and the water-quality constraints on those goals. The management model provides the values of the decision variables (for example, minimum loading reductions) that meet the specified constraints. Once those values are known, the planning process can focus on how to achieve the reductions, whether it be by denitrifying DWTS, cluster systems, density reduction, centralized treatment, or other means.
Required Expertise
A technical expert with skills and experience in simulation modeling and optimization techniques is needed to link the simulation model with optimization to construct the management model. The technical expert works closely with planners to formulate the management problem by defining the management objectives, decision variables, and constraints. The management model should be tested and verified by the technical expert to ensure that the solutions from the management model are consistent with results from the simulation model. Once the management model has been constructed and verified, it can be used to perform trade-off analyses by changing constraint values and observing the effects on the management objective. The management model can be used directly by planners to experiment with how constraints affect the optimal management solutions. The La Pine NLMM was implemented in a popular spreadsheet program and will be used directly by Deschutes County planners.
Cost
Adding optimization capability to the fate and transport simulation model for La Pine added approximately 10 percent to the cost of the project. The cost of developing a simulation model can range from tens to hundreds of thousands of dollars depending on the size and complexity of the problem. There is also a cost-savings derived from not having to devise, simulate, and analyze multiple scenarios.
Limitations
The results of the management model depend on the reliability of the underlying simulation model and on the formulation of the objective function and constraints.
3-24
4 SUMMARY AND CONCLUSIONS
Decentralized wastewater treatment systems (DWTS) have always been an important part of suburban and rural infrastructure. As population growth forces more development into these areas, there is an increasing need for management of the water-quality impacts associated with DWTS. Groundwater and watershed simulation models have become quite sophisticated and have assumed a prominent role in providing information to the planning process. Simulation models alone, however, cannot identify the best, or optimal, solutions to management problems. Optimization techniques have been linked with simulation models to solve a range of water-resource management problems, but there have been few applications in the area of planning for decentralized wastewater treatment. The objective of this study was to demonstrate the use of optimization techniques with a simulation model to support decision making related to watershed-scale management of decentralized wastewater treatment. This report describes the method of optimization used and includes a case study in which the method was applied to planning and water-quality protection issues in the community of La Pine in Deschutes County, Oregon.
The central Oregon community of La Pine is a rapidly growing rural-residential area without centralized wastewater treatment or drinking water systems. Most homes rely on individual DWTS for wastewater disposal and wells for water supply. Most wells tap the shallowest aquifers, which are the most vulnerable to contamination from DWTS. In 2000 there were about 5,200 residential DWTS and 4,500 lots that were expected to be developed by 2020. Centralized sewer or water systems have been determined to be economically infeasible in the area and, with a large number of lots still available for development, planners and regulators are concerned that future growth will render the groundwater resource unusable.
A United States Environmental Protection Agency (US EPA)-funded “National Onsite Demonstration Project” in the La Pine area has resulted in an extensive knowledge base on advanced DWTS performance and of the hydrogeology of the shallow aquifer system, including the fate and transport of nitrogen. One product of that study was a numerical model that simulates the movement and fate of nitrate in the groundwater system. The model has been used by Deschutes County to evaluate several possible scenarios for controlling nitrate loading to the aquifer and protecting the drinking-water supply. The La Pine simulation model was used in this project to demonstrate the application of optimization techniques for enhancing simulation models as decision-support tools.
A nitrate loading management model (NLMM) was developed by linking the MODFLOW-MT3D simulation model with optimization techniques. The NLMM was formulated by grouping more than 9,700 existing homes and lots into 97 management areas. Dividing loading from existing and future homes in each management area resulted in 194 decision variables. Constraints were set on groundwater nitrate concentration at 339 sites and on groundwater discharge nitrate loading to streams on 14 reaches. Constraints also were set on the maximum and minimum loading
4-1
Summary and Conclusions
reductions in each management area. The simulation model was found to be linear and the NLMM was solved using the response-matrix technique.
The NLMM was used to evaluate the sensitivity of optimal management solutions to water-quality constraints. When the problem is unconstrained, there are no reductions in loading and total optimal loading is 190 kg/d. Concentration constraints specified for the shallow part of the aquifer constrained the optimal solution to a greater degree than constraints specified for deep sites. When shallow concentration constraints were set to the Oregon Department of Environmental Quality (DEQ) action level of 7 mg/L and deep constraints were set to 3 mg/L, the total loading was reduced by 56 percent to 84 kg/d. Constraints on discharge loading of nitrate to streams did not affect the optimal solution until the minimum reduction was over 40 percent because concentration constraints specified for the aquifer had more influence on the solution below that level. The sensitivity of the model to constraints on nitrate loading was evaluated by setting minimum reduction constraints on future homes and observing the effect on the optimal loading reduction for existing homes. As the minimum reduction for future homes was increased, the total optimal loading decreased as the contribution from existing homes increased. The NLMM allows a cost factor to be included that accounts for differential costs for reduction of loading in existing and future homes. The optimal solutions were found to be sensitive to differential cost, and if possible, costs should be included in the management model. The optimal reductions vary over a broad range among the 194 decision variables in 97 management areas. The breadth of the range is a reflection of the complex relations between development location and density, hydrogeology, and geochemical processes.
Scenario simulations were compared with an optimal solution to evaluate the relative effectiveness and costs of each. The scenarios applied uniform management controls in which all future and existing homes would meet the same DWTS performance standard, ranging from 2 mg/L NO3
- to 46 mg/L NO3-, depending on the particular scenario. The results showed that a
performance level of 2 to 10 mg/L would have to be imposed to reach the same level of water-quality protection as the optimal solution. The reduction in total loading for the optimal solution was 107 kg/d compared to 192 and 148 kg/d for the 2 and 10 mg/L scenarios, respectively. Assuming that the cost per unit of loading reduction would be the same, the cost of implementing the 2 or 10 mg/L uniform performance standard would be 38 to 79 percent higher than the cost of implementing the optimal solution.
A variety of considerations for application of simulation-optimization methods were listed, including:
• Need for a simulation model
• Adaptability to other areas
• Adaptability to other simulation models
• Implementation in the planning process
• Required expertise, cost, and limitations
4-2
5 REFERENCES
Ahlfeld, D. P. and M. Heidari. 1994. “Application of Optimal Hydraulic Control to Groundwater Systems.” Journal of Water Resources Planning and Management 120(3): 350-365.
Ahlfeld, D. P., and A. E. Mulligan. 2000. Optimal Management of Flow in Groundwater Systems. Academic Press, San Diego, CA.
Ahlfeld, D. P., J. M. Mulvey, G. F. Pinder, and E. F.Wood. 1988. “Contaminated Groundwater Remediation Design Using Simulation, Optimization, and Sensitivity Theory 1: Model Development.” Water Resources Research 24(3): 431-441.
Ahlfeld, D. P., J. M. Mulvey, and G. F. Pinder.1988. “Contaminated Groundwater Remediation Design Using Simulation, Optimization, and Sensitivity Theory. 2: Analysis of a Field Site.” Water Resources Research 24(3): 443-452.
Anderson, C. W. 2000. Framework for Regional, Coordinated Monitoring in the Middle and Upper Deschutes River Basin, Oregon. US Geological Survey Open-File Report 00-386.
Barlow, P. M., B. J. Wagner, and K. Belitz. 1996. “Pumping Strategies for Management of a Shallow Water Table: The Value of the Simulation-Optimization Approach.” Groundwater 34(2): 305-317.
Bredehoft, J. D. and R. A. Young. 1970. “The Temporal Allocation of Groundwater: A Simulation Approach.” Water Resources Research 6(1): 3-21.
Bredehoft, J. D. and R. A. Young. 1983. “Conjunctive Use of Groundwater and Surface Water for Irrigated Agriculture: Risk Aversion.” Water Resources Research 19(5): 1111-1121.
Gannett, M. G. and K. E. Lite. 2004. Simulation of Regional Groundwater Flow in the Upper Deschutes Basin, Oregon. US Geological Survey Water Resources Investigations Report 03-4195.
Gorelick, S. M. 1982. “A Model for Managing Sources of Groundwater Pollution.” Water Resources Research 18(4): 773-781.
Gorelick, S. M. 1983. “A Review of Distributed Parameter Groundwater Management Modeling Methods.” Water Resources Research 19(2): 305-319.
5-1
References
Gorelick, S. M. 1990. “Large Scale Nonlinear Deterministic and Stochastic Optimization: Formulations Involving Simulation of Subsurface Contamination.” Mathematical Programming 48: 19-39.
Gorelick, S. M., R. A. Freeze, D. Donohue, and J. F. Keely. 1993. Groundwater Contamination: Optimal Capture and Containment. Lewis Publishers, Boca Raton, FL.
Gorelick, S. M. and I. Remson. 1982. “Optimal Management of Groundwater Pollutant Sources.” Water Resources Research 18(1): 71-76.
Gorelick, S. M., C. I. Voss, P. E. Gill, W. Murray, M. A. Saunders, and M. H. Wright. 1984. “Aquifer Reclamation Design: The Use of Contaminant Transport Simulation Combined with Nonlinear Programming.” Water Resources Research 20(4): 415-427.
Haggerty, R. and S. M. Gorelick. 1994. “Design of Multiple Contaminant Remediation: Sensitivity to Rate-Limited Mass Transfer.” Water Resources Research 30(2):435-446.
Harbaugh, A. W. and M. G. McDonald. 1996. User’s Documentation for MODFLOW-96: An Update to the US Geological Survey Modular Finite-Difference Groundwater Flow Model. US Geological Survey Open-File Report 96-485. 56p.
Heidari, M. 1982. “Application of Linear System’s Theory and Linear Programming to Groundwater Management in Kansas.” Water Resources Bulletin 18(6): 1003-1012.
Hinkle, S. R., J. K. Bohlke, J. H. Duff, D. S. Morgan, and R. J. Weick. In Press. A Redox Boundary Approach for Aquifer-Scale Nitrate Transport and Fate. US Geological Survey Scientific Investigations Report.
Jones, L. 2003. Characterization of Select Water Quality Parameters Within the Upper Deschutes and Little Deschutes Subbasins. Upper Deschutes Watershed Council, Bend, OR.
KCM, Inc. 1997. South County Regional Cost/Benefit Analysis: Regional Problem Solving Project Final Report. KCM, Inc., Portland, OR.
Lekoff, L. J. and S. M. Gorelick. 1990a. “Simulating Physical Processes and Economic Behavior in Saline, Irrigated Agriculture: Model Development.” Water Resources Research 26(7): 1359-1369.
Lekoff, L. J. and S. M. Gorelick. 1990b. “Benefits of an Irrigation Water Rental Market in a Saline Stream-Aquifer System.” Water Resources Research 27(7): 1371-1381.
Liu, W., M. A. Medina, W. Thomann, W. T. Piver, and T. L. Jacobs. 2000. “Optimization of Intermittent Pumping Schedules for Aquifer Remediation Using a Genetic Algorithm.” Journal of the American Water Resources Association 36(6): 1335-1348.
5-2
References
Maddock, T. and Y. Y. Haines. 1975. “A Tax System For Groundwater Management.” Water Resources Research 11(1): 7-14.
Moosburner, G. J. and E. F. Wood. 1980. “Management Model for Controlling Nitrate Contamination in the New Jersey Pine Barrens Aquifer.” Water Resources Bulletin 16(6): 971-978.
Morgan, D. S., S. R. Hinkle, and R. J. Weick. In Press. Simulation Analysis of Fate and Transport of Septic-Derived Nitrate in a Shallow Alluvial Aquifer near La Pine, Oregon. US Geological Survey Scientific Investigations Report.
US Bureau of the Census. 2000. Fact Sheet: La Pine CDP, Oregon. Accessed April 21, 2005, at http://www.census.gov/
United States Environmental Protection Agency (US EPA). 2003. Voluntary National Guidelines for Management of Onsite and Clustered (Decentralized) Wastewater Treatment Systems. EPA 832-B-03-001.
US EPA. 1994. Ground-Water Modeling Compendium, 2nd Ed., EPA 500-B-94-004.
Wagner, B. J. 1995. Recent Advances in Simulation-Optimization Groundwater Management Modeling. Review of Geophysics, Supplement, US National Report to IGUU 1991-1994. 1021-1028.
Willis, R. and P. Liu. 1984. “Optimization Model for Groundwater Planning.” Journal of Water Resources Planning and Management 110(3): 333-347.
Willis, R. and W. W. G. Yeh. 1987. Groundwater Systems Planning and Management. Prentice-Hall, Englewood Cliffs, NJ.
Yeh, W. W. G. 1992. “Systems Analysis in Groundwater Planning and Management.” Journal of Water Resources Planning and Management 118(3): 224-237.
Zheng, C. and P. P. Wang. 1999. MT3DMS: A Modular Three-Dimensional Multispecies Transport Model Documentation and User's Guide. Release DoD_3.50.A. Contract Report SERDp-99. US Army Corps of Engineers.
NDWRCDPWashington University, Campus Box 1150, One Brookings Drive, Cupples 2, Rm. 11, St. Louis, Missouri 63130-4899 • USA
This report is available online at www.ndwrcdp.org. This report is also available through theNational Small Flows Clearinghouse • West Virginia University/NRCCE, P.O. Box 6064, Morgantown, WV 26506-6064 • USA
Tel: (800) 624-8301 • WWCDMG49
Printed on recycled paper in the United States of America.