195


Page ii
Table of Contents Page
Section 1.0 PSD Applicability for Greenhouse Gases Summary .................................................. 1 1.1 Background .................................................................................................................................................. 1 1.2 PSD Applicability ........................................................................................................................................ 1
Section 2.0 Best Available Control Technology Analysis ............................................................. 5 2.1 Best Available Control Technology Requirements ........................................................................ 5 2.2 BACT Methodology ................................................................................................................................... 6 2.3 High Voltage Circuit Breakers Equipment Leaks BACT Analysis ............................................... 8
2.3.1 Source Emissions ........................................................................................................................ 8 2.3.2 GHG BACT Review ...................................................................................................................... 8
2.4 Cogeneration Biomass-Fired Boiler BACT Analysis ..................................................................... 15 2.4.1 Source Emissions ..................................................................................................................... 15 2.4.2 GHG BACT Review ................................................................................................................... 15
2.5 Fermentation and Distillation BACT Analysis ............................................................................... 47 2.5.1 Source Description.................................................................................................................. 47 2.5.2 GHG BACT Review ................................................................................................................... 48
2.6 Flare BACT Analysis ................................................................................................................................ 55 2.6.1 Source Emissions ..................................................................................................................... 55 2.6.2 GHG BACT Review ................................................................................................................... 55
2.7 Firewater Pump Engine ........................................................................................................................ 59 2.7.1 Source Emissions ..................................................................................................................... 59 2.7.2 GHG BACT Review ................................................................................................................... 59

Page iii
List of Tables Page
Table 1–1 Summary of GHG Emissions for Abengoa Bioenergy Biomass of Kansas, LLC (units in tons per year) ............................................................................................................................................... 3
Table 2–1 Summary of Emission Units Subject to GHG BACT and PSD-BACT Limits ............................. 6 Table 2–2 Ranked Control Options for High Voltage Circuit Breakers Equipment Leaks .................. 10 Table 2–3 GHG BACT Control Technology Technical Feasibility/Infeasibility Determination
Summary for the Biomass-Fired Boiler ............................................................................................ 19 Table 2–4 Primary Proposed Fuel Types for the Biomass-Fired Boiler and Approximate Carbon
Content ....................................................................................................................................................... 21 Table 2–5 CO2 Emission Rates for the Proposed Fuel Blends in the Biomass-Fired Boiler Compared
to Other Common Fossil Fuels Used for Electricity Generation ............................................. 22 Table 2–6 Summary of Oil and Gas Production in State of Kansas and Stevens County For 2009 33 Table 2–7 Ranked Control Options for the Biomass-Fired Boiler ............................................................... 37 Table 2–8 Detailed Comparison of the Impacts of Certain Heat Recovery Strategies on the
Cogeneration System ............................................................................................................................ 38 Table 2–9 Traditional Starch Fermentation Scrubber and Enzymatic Hydrolysis Fermentation
Scrubber Vent Stream Comparison .................................................................................................. 48 Table 2–10 GHG BACT Control Technology Technical Feasibility/Infeasibility Determination
Summary for the Fermentation Scrubber ...................................................................................... 50 Table 2–11 Ranked Control Options for the Fermentation Scrubber ......................................................... 53 List of Figures
Page
Figure 2-1 Block Flow Diagrams Illustrating Post-combustion, Pre-combustion, and Oxy-combustion Systems .................................................................................................................... 26 Figure 2-2 Generic MEA Chemical Absorption System ................................................................................... 30 Appendices
Appendix A Energy & Environmental Research Center, University of North Dakota, Regional Emissions and Capture Opportunities Assessment – Plains CO2 Reduction (PCOR) Partnership Phase II, 2010-EERC-08-15, December 2009.
References 2006 IPCC Guidelines for National Greenhouse Gas Inventories, Intergovernmental Panel on Climate Change, 2006. Advances in CO2 Capture Technology—The U.S. Department of Energy’s Carbon Sequestration Program, Jose´ D. Figueroa (National Energy Technology Laboratory, NETL), Timothy Fout (NETL), Sean Plasynski (NETL), Howard McIlvried (Science Applications International Corporation), Rameshwar D. Srivastava (Science Applications International Corporation ), September 17, 2007. An Introduction to CO2 Separation and Capture Technologies, MIT Energy Laboratory, August 1999.
Page iv
References (Continued) Annual Energy Outlook 2010 with Projections to 2035, Report No. DOE/EIA-0383, U.S. Energy Information Administration, May 11, 2010. Carbon Capture Research Website, http://www.fossil.energy.gov/programs/sequestration/capture, U.S. Department of Energy. Carbon Sequestration, CO2 Capture Website, http://www.netl.doe.gov/technologies/carbon_seq/core_rd/co2capture.html, U.S. Department of Energy, National Energy Technology Laboratory. Carbon Sequestration in Terrestrial Ecosystems: A Status Report on R&D Progress, Gary K. Jacobs, et. al., Oak Ridge National Laboratory, Oak Ridge, TN, August 2000. Compilation of Air Pollutant Emission Factors, Volume 1: Stationary Point and Area Sources (AP-42), Fifth Edition, U.S. Environmental Protection Agency. Final Environmental Impact Statement for the Proposed Abengoa Biorefinery Project near Hugoton, Stevens County, Kansas, Report No. DOE/EIS-0407, U.S. Department of Energy, August 2010. General Reporting Protocol, Version 3.1, California Climate Action Registry, January 2009. Geologic Sequestration of Carbon Dioxide in Kansas, Public Information Circular 27, Kansas Geological Survey, December 2008. Guidelines for National Greenhouse Gas Inventories, Volume 2: Energy, Chapter 5: Carbon Dioxide Transport, Injection and Geological Storage, § 5.4: CO2 Transport, Intergovernmental Panel on Climate Change, 2006. Guidance for Determining Best Available Control Technology for Reducing Carbon Dioxide Emissions from Bioenergy Production, U.S. Environmental Protection Agency Office of Air and Radiation, March 2011. Hyperion Energy Center Best Available Control Technology Analysis for Emissions of Carbon Dioxide, RPT Environmental Associates, Inc., March 2009. IEA Energy Technology Essentials, CO2 Capture and Storage, ETE01, International Energy Agency (IEA), December 2006. Instruction Manual-Type HGF 1012/1014, HG12IM, Revision 0, Part 1, Alstom USA Inc. Life-Cycle Energy and Greenhouse Gas Emission Impacts of Different Corn Ethanol Plant Types, Michael Wang, et. al., Center for Transportation Research, Argonne National Laboratory, May 22, 2007. Modeling CO2 Sequestration in a Saline Reservoir and Depleted Oil Reservoir to Evaluate the Regional CO2 Sequestration Potential of The Ozark Plateau Aquifer System, South-Central Kansas, FE0002056, U.S. Department of Energy, National Energy Technology Laboratory, May 2010.

Page v
References (Continued) New Source Review Manual, U.S. Environmental Protection Agency, Draft October 1990 NIST Technical Note 1425: Gases for Electrical Insulation and Arc Interruption: Possible Present and Future Alternatives to Pure SF6, Christophorou, L.G., J.K. Olthoff and D.S. Green, National Institute of Standards and Technology (NIST), Electricity Division (Electronics and Electrical Engineering Laboratory) and Process Measurements Division (Chemical Science and Technology Laboratory), November 1997. PSD and Title V Permitting Guidance For Greenhouse Gases, U.S. Environmental Protection Agency, November 2010. RACT/BACT/LAER Clearinghouse Website, http://cfpub.epa.gov/rblc, U.S. Environmental Protection Agency. Regional Emissions and Capture Opportunities Assessment – Plains CO2 Reduction (PCOR) Partnership Phase II, 2010-EERC-08-15, Energy & Environmental Research Center, University of North Dakota, December 2009. Russell City Energy Center PSD Permit Project Website, http://www.baaqmd.gov/Divisions/Engineering/Public-Notices-on-Permits/2009/080309-15487/Russell-City-Energy-Center.aspx, Bay Area Air Quality Management District. SF6 Emission Reduction Partnership for Electric Power Systems 2007 Annual Report, U.S. Environmental Protection Agency, December 2008. SF6 Leak Rates from High Voltage Circuit Breakers – U.S. EPA Investigates Potential Greenhouse Gas Emissions Source, J. Blackman (U.S. EPA, Program Manager, SF6 Emission Reduction Partnership for Electric Power Systems), M. Averyt (ICF Consulting), and Z. Taylor (ICF Consulting), June 2006. Siemens TechTopics No. 53, Use of SF6 Gas in Medium Voltage Switchgear, Siemens Power Transmission & Distribution, Inc., June 3, 2005 South-central Kansas CO2 Project Website , http://www.kgs.ku.edu/PRS/Ozark/index.html, Kansas Geologic Survey. State Production and Historical Information Website, http://www.kgs.ku.edu/PRS/petro/state.html), Kansas Geological Survey. Stevens County – Oil and Gas Production Website, http://www.kgs.ku.edu/PRS/County/rs/stevens.html), Kansas Geological Survey. Technology Options for the Near and Long Term, U.S. Climate Change Technology Program, August 2005. Technical Overview of Carbon Dioxide Capture Technologies for Coal-Fired Power Plants, MPR Associates, Inc., June 22, 2005.

May 2011 Page 1
Gre
enho
use
Gas
es B
est A
vaila
ble
Cont
rol T
echn
olog
y A
naly
sis
/ Abe
ngoa
Bio
ener
gy B
iom
ass
of K
ansa
s, L
LC
WLA
Pro
ject
No.
165
-009
Re
visi
on N
o. 0
Section 1.0 PSD Applicability for Greenhouse Gases Summary 1.1 Background
On June 3, 2010, the U.S. Environmental Protection Agency (EPA) issued the final
Greenhouse Gas (GHG) Tailoring Rule (75 FR 31514). This rule established the thresholds
for GHG emissions that define when permits under the PSD and Title V permit programs
are required for new and existing industrial facilities. Without the GHG Tailoring Rule, the
thresholds established in the Clean Air Act (CAA) for other pollutants would apply to
GHGs. This final rule "tailors" the requirements of these CAA permitting programs to limit
which facilities will be required to obtain PSD and Title V permits.
Starting in January 2011, only sources currently subject to the PSD permitting program
(i.e., those that are newly-constructed or modified in a way that significantly increases
emissions of a pollutant other than GHGs) would be subject to permitting requirements
for their GHG emissions under PSD. For those affected facilities, only GHG emissions
increases of 75,000 tons per year (ton/yr) or more of total GHG, on a carbon dioxide
equivalent (CO2e) basis, would need to determine the Best Available Control Technology
(BACT) for their GHG emissions.
1.2 PSD Applicability
Abengoa Bioenergy Biomass of Kansas, LLC (ABBK) intends to build and operate a
biomass-to-ethanol and biomass-to-energy production facility. This document relies upon
information presented in the 2011 updated facility design PSD air quality construction
permit application (hereinafter referred to as the "application") for the facility submitted to
Kansas Department of Health and Environment (KDHE). Therefore, the facility description
and emissions calculations presented in that application are not repeated herein.
According to K.A.R. 28-19-17, Prevention of Significant Deterioration, K.A.R. 28-19-200,
General Provisions; Definitions, and K.A.R. 28-19-300, Construction Permits and Approvals;
Applicability, the proposed facility is required to obtain a PSD air quality construction
permit due to the following:
May 2011 Page 2
Gre
enho
use
Gas
es B
est A
vaila
ble
Cont
rol T
echn
olog
y A
naly
sis
/ Abe
ngoa
Bio
ener
gy B
iom
ass
of K
ansa
s, L
LC
WLA
Pro
ject
No.
165
-009
Re
visi
on N
o. 0
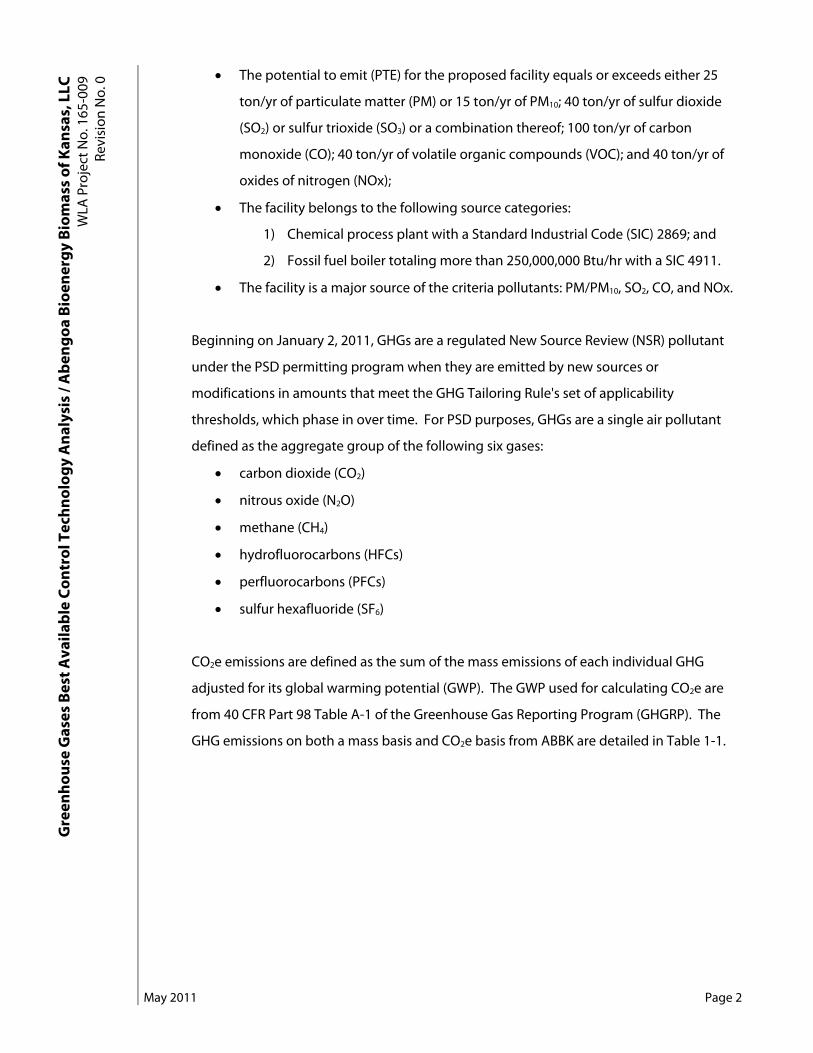
• The potential to emit (PTE) for the proposed facility equals or exceeds either 25
ton/yr of particulate matter (PM) or 15 ton/yr of PM10; 40 ton/yr of sulfur dioxide
(SO2) or sulfur trioxide (SO3) or a combination thereof; 100 ton/yr of carbon
monoxide (CO); 40 ton/yr of volatile organic compounds (VOC); and 40 ton/yr of
oxides of nitrogen (NOx);
• The facility belongs to the following source categories:
1) Chemical process plant with a Standard Industrial Code (SIC) 2869; and
2) Fossil fuel boiler totaling more than 250,000,000 Btu/hr with a SIC 4911.
• The facility is a major source of the criteria pollutants: PM/PM10, SO2, CO, and NOx.
Beginning on January 2, 2011, GHGs are a regulated New Source Review (NSR) pollutant
under the PSD permitting program when they are emitted by new sources or
modifications in amounts that meet the GHG Tailoring Rule's set of applicability
thresholds, which phase in over time. For PSD purposes, GHGs are a single air pollutant
defined as the aggregate group of the following six gases:
• carbon dioxide (CO2)
• nitrous oxide (N2O)
• methane (CH4)
• hydrofluorocarbons (HFCs)
• perfluorocarbons (PFCs)
• sulfur hexafluoride (SF6)
CO2e emissions are defined as the sum of the mass emissions of each individual GHG
adjusted for its global warming potential (GWP). The GWP used for calculating CO2e are
from 40 CFR Part 98 Table A-1 of the Greenhouse Gas Reporting Program (GHGRP). The
GHG emissions on both a mass basis and CO2e basis from ABBK are detailed in Table 1-1.
Greenhouse Gases Best Available Control Technology / Abengoa Bioenergy Biomass of Kansas, LLC WLA Project No. 165-009
Revision No. 0
May 2011
Page 3
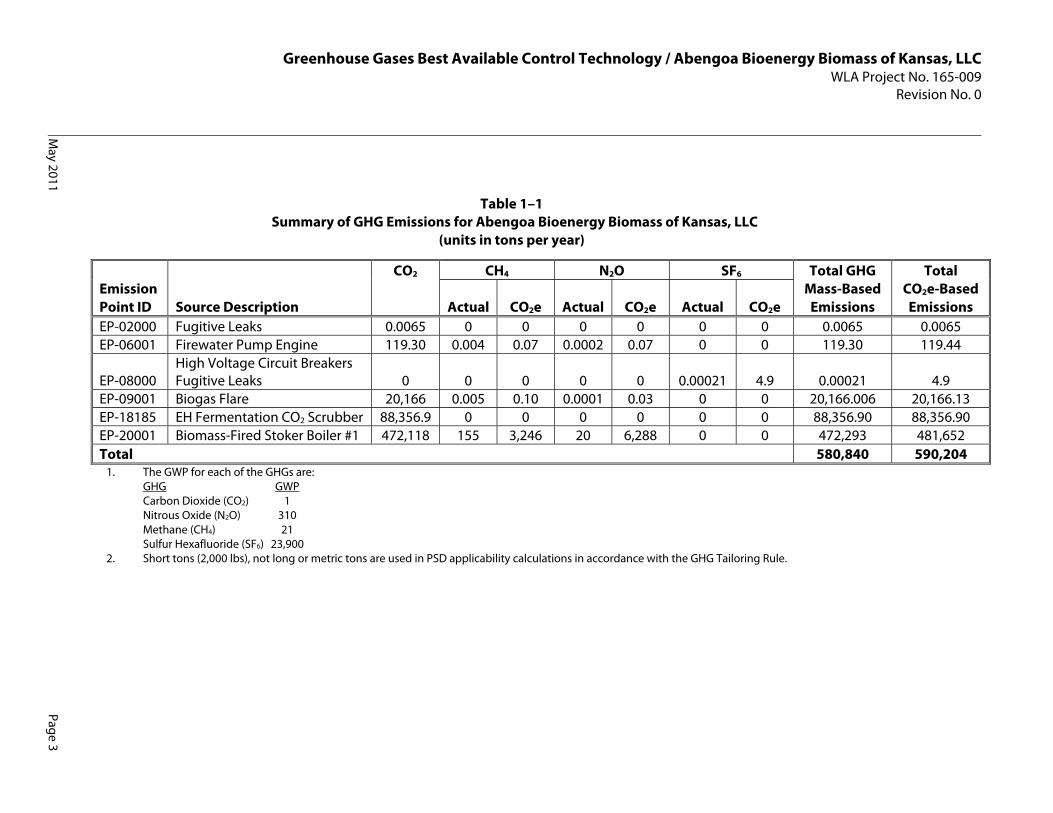
Table 1–1 Summary of GHG Emissions for Abengoa Bioenergy Biomass of Kansas, LLC
(units in tons per year)
Emission Point ID
CO2 CH4 N2O SF6 Total GHG Mass-Based
Emissions
Total CO2e-Based Emissions Source Description Actual CO2e Actual CO2e Actual CO2e
EP-02000 Fugitive Leaks 0.0065 0 0 0 0 0 0 0.0065 0.0065 EP-06001 Firewater Pump Engine 119.30 0.004 0.07 0.0002 0.07 0 0 119.30 119.44
EP-08000 High Voltage Circuit Breakers Fugitive Leaks 0 0 0 0 0 0.00021 4.9 0.00021 4.9
EP-09001 Biogas Flare 20,166 0.005 0.10 0.0001 0.03 0 0 20,166.006 20,166.13 EP-18185 EH Fermentation CO2 Scrubber 88,356.9 0 0 0 0 0 0 88,356.90 88,356.90 EP-20001 Biomass-Fired Stoker Boiler #1 472,118 155 3,246 20 6,288 0 0 472,293 481,652 Total 580,840 590,204
1. The GWP for each of the GHGs are: GHG GWP Carbon Dioxide (CO2) 1 Nitrous Oxide (N2O) 310 Methane (CH4) 21 Sulfur Hexafluoride (SF6) 23,900
2. Short tons (2,000 lbs), not long or metric tons are used in PSD applicability calculations in accordance with the GHG Tailoring Rule.

May 2011 Page 4
Gre
enho
use
Gas
es B
est A
vaila
ble
Cont
rol T
echn
olog
y / A
beng
oa B
ioen
ergy
Bio
mas
s of
Kan
sas,
LLC
W
LA P
roje
ct N
o. 1
65-0
09
Revi
sion
No.
0 PSD applies to the GHG emissions from a new source if both of the following are true:
1. Not considering its emissions of GHGs, the new source is considered a major
source under the PSD permit program and is required to obtain a PSD permit
(called an "anyway source"), and
2. The potential emissions of GHGs from the new source would be equal to or greater
than 75,000 ton/yr on a CO2e basis.
Because ABBK's proposed facility will meet both of the PSD applicability criteria for new
sources for GHGs, the facility must meet the requirements of the GHG Tailoring Rule
beginning January 2, 2011. Specifically, the PSD permit must contain emissions limitations
based on application of BACT for GHGs.

May 2011 Page 5
Gre
enho
use
Gas
es B
est A
vaila
ble
Cont
rol T
echn
olog
y / A
beng
oa B
ioen
ergy
Bio
mas
s of
Kan
sas,
LLC
W
LA P
roje
ct N
o. 1
65-0
09
Revi
sion
No.
0 Section 2.0
Best Available Control Technology Analysis 2.1 Best Available Control Technology Requirements
As described in Section 1.0, the proposed facility is subject to PSD review as a new major
source for GHGs. The CAA and corresponding implementing regulations require that a
permitting authority conduct a BACT analysis on a case-by-case basis, and the permitting
authority must evaluate the amount of emissions reductions that each available
emissions-reducing technology or technique would achieve, as well as the energy,
environmental, economic and other costs associated with each technology or technique.
Based on this assessment, the permitting authority must establish a numeric emissions
limitation that reflects the maximum degree of reduction achievable for each pollutant
subject to BACT through the application of the selected technology or technique.
However, if the permitting authority determines that technical or economic limitations on
the application of a measurement methodology would make a numerical emissions
standard infeasible for one or more pollutants, it may establish design, equipment, work
practices or operational standards to satisfy the BACT requirement.
EPA has recommended that permitting authorities continue to use the Agency's five-step
"top-down" BACT process to determine BACT for GHGs. However, EPA provided additional
guidance for GHG BACT analysis when evaluating emissions from bioenergy production.
Further, EPA proposed on March 11, 2011 to defer for a period of three years, GHG
permitting requirements for carbon dioxide (CO2) emissions from biomass-fired and other
biogenic sources. This proposed deferral will allow EPA to conduct a detailed examination
of the science associated with CO2 emissions from bioenergy and other biogenic
stationary sources. EPA expects the final action on the proposed deferral rule to take
effect in the July 2011 timeframe, and until that time, the determination of BACT is still to
be made on a case-by-case basis by the permitting authority, KDHE.
A summary of the units subject to GHG BACT and the BACT requirements for the units are
presented in Table 2-1. This section is organized by emission unit and then pollutant.
When appropriate, emission units with similar characteristics and BACT applicability are
grouped together.

May 2011 Page 6
Gre
enho
use
Gas
es B
est A
vaila
ble
Cont
rol T
echn
olog
y / A
beng
oa B
ioen
ergy
Bio
mas
s of
Kan
sas,
LLC
W
LA P
roje
ct N
o. 1
65-0
09
Revi
sion
No.
0 Table 2–1
Summary of Emission Units Subject to GHG BACT and PSD-BACT Limits
Stack ID Equipment/Process Proposed BACT Emission Limit(s)
BACT Device(s) or Operational Limitation(s)
EP-08000 HV Circuit Breakers 4.9 short tons CO2e/yr
State-of-the-art enclosed-pressure SF6 circuit breakers with leak
detection to maintain fugitive SF6 emissions below 0.5% (by weight);
implementation of an LDAR program; and density monitor
alarm set to 4 psi drop. EP-20001 Biomass-Fired Stoker Boiler #1 0.32 lb CO2e/lb
steam produced Restriction of the fuel type to
biomass that is otherwise considered to have low to no
economic value or benefit, and/or is a lower impacting crops; and lower GHG-emitting processes
and practices through an energy-efficient design, incorporating
cogeneration, process integration, combustion of co-products, heat
recovery and operational and maintenance monitoring.
EP-18185 EH Fermentation CO2
Scrubber 5.89 lb CO2e/gal etoh produced
Monitoring enzymatic hydrolysis process efficiency, incorporating
monitoring CO2 production during fermentation, energy
efficient heat integration, water recycling, and co-product
production. EP-09001 Biogas Flare 10,170 lb CO2e/hr
and 20,166 short tons
CO2e/yr
Restriction of the fuel type to primarily biogas and pipeline-grade natural gas in the pilot; implementation of an LDAR
program; and the use the most efficient flare that can perform to the specification required by the
facility's process. EP-06001 Firewater Pump Engine 480 lb CO2e/hr and
24.0 short tons CO2e/yr
(Non-Emergency Basis)
Fuel-efficient NFPA-20 certified firewater pump engine (20.3±5%
gal/hr fuel consumption limit for a 460 Hp engine with a rated speed
of 1760 rpm and an EPA Tier 3 emission rating).
2.2 BACT Methodology
BACT is an emissions limitation based on the maximum degree of reduction that is
achievable for each pollutant subject to regulation under the CAA which would be
emitted from any major emitting facility, on a case-by-case basis, taking into account
technical feasibility, energy, environmental, and economic impacts.

May 2011 Page 7
Gre
enho
use
Gas
es B
est A
vaila
ble
Cont
rol T
echn
olog
y / A
beng
oa B
ioen
ergy
Bio
mas
s of
Kan
sas,
LLC
W
LA P
roje
ct N
o. 1
65-0
09
Revi
sion
No.
0 The "top-down" BACT evaluation process requires that all technically feasible control
technologies be ranked in descending order of control efficiencies. The most effective
technology is selected as BACT unless the applicant demonstrates that energy,
environmental and/or economic impacts justify a conclusion that the most effective
technology is not "achievable". In this case, the next most effective technology is analyzed
until the top performing "achievable" technology is identified.
The BACT analyses presented in this application generally conform to the EPA guidelines.
The five steps of the "top-down" BACT evaluation procedure are as follows:
Step 1. Identify all available control options with practical potential for application
to the specific emission unit for the regulated pollutant under evaluation.
Step 2. Eliminate technically infeasible or unavailable technology options. A
demonstration of technical infeasibility should be clearly documented and
should show, based on physical, chemical, and engineering principles, that
technical difficulties would preclude the successful use of the control
option on the emissions unit under review.
Step 3. Rank remaining control technologies in order of decreasing effectiveness.
This includes:
− control effectiveness (percent pollutant removed);
− expected emission reduction (ton/yr);
− energy impacts (Btu, kW-hr);
− environmental impacts (other media and the emissions of toxic
and hazardous air emissions); and
− economic impacts (total cost effectiveness and incremental cost
effectiveness).
Step 4. Evaluate most effective controls and document results. A case-by-case
evaluation of energy, environmental, and economic impacts is performed
for each remaining control technology.
Step 5. Select the most effective control that has acceptable energy,
environmental, and economic impacts.

May 2011 Page 8
Gre
enho
use
Gas
es B
est A
vaila
ble
Cont
rol T
echn
olog
y / A
beng
oa B
ioen
ergy
Bio
mas
s of
Kan
sas,
LLC
W
LA P
roje
ct N
o. 1
65-0
09
Revi
sion
No.
0 The BACT analysis guidance provided within the EPA's PSD and Title V Permitting Guidance
for Greenhouse Gases document was followed during the preparation of this BACT analysis.
When necessary and as relevant information was available, the EPA's 1990 Draft New
Source Review Workshop Manual and EPA's RACT/BACT/LAER Clearinghouse (RBLC), as well
as GHG Control Measures White Papers published by EPA and recently published GHG
BACT analyses for similar sources were relied upon.
2.3 High Voltage Circuit Breakers Equipment Leaks BACT Analysis
2.3.1 Source Emissions
There will be one high voltage circuit breaker, rated at 125 kilovolts (kV) utilized at
the facility. The circuit breaker will use a sulfur hexafluoride (SF6) dielectric, with
the circuit breaker containing 82 pounds of SF6 in an enclosed-pressure system.1
Circuit breakers do not emit SF6 directly, but according to an EPA investigation, SF6
Leak Rates from High Voltage Circuit Breakers - U.S. EPA Investigates Potential
Greenhouse Gas Emissions Source, there is a potential for fugitive emissions (i.e.
equipment leaks).
2.3.2 GHG BACT Review
Sulfur hexafluoride, a gaseous dielectric used in the breakers, is a highly potent
greenhouse gas, with a "global warming potential" over a 100-year period that is
23,900 times greater than CO2. Leakage is expected to be minimal, and is
expected to occur only as a result of circuit interruption and at extremely low
temperatures. Further, industry standards recommend that new equipment be
built to low leakage limits (the International Electrotechnical Commission (IEC)
standard for new equipment leakage is 0.5% per year).2 Nevertheless, given SF6's
high global warming potential, even small amounts of leakage can be significant
and should be considered for purposes of a GHG BACT analysis. The following
presents the GHG BACT analysis for this source.
1 Alstom USA Inc., Instruction Manual-Type HGF 1012/1014, HG12IM, Revision 0, Part 1, Page 10, 19. 2 U.S. EPA, J. Blackman (U.S. EPA, Program Manager, SF6 Emission Reduction Partnership for Electric Power Systems), M. Averyt (ICF Consulting), and Z. Taylor (ICF Consulting), SF6 Leak Rates from High Voltage Circuit Breakers – U.S. EPA Investigates Potential Greenhouse Gas Emissions Source, June 2006, first published in Proceedings of the 2006 IEEE Power Engineering Society General Meeting, Montreal, Quebec, Canada, June 2006 (available at: www.epa.gov/electricpower-sf6/documents/leakrates_circuitbreakers.pdf).
May 2011 Page 9
Gre
enho
use
Gas
es B
est A
vaila
ble
Cont
rol T
echn
olog
y / A
beng
oa B
ioen
ergy
Bio
mas
s of
Kan
sas,
LLC
W
LA P
roje
ct N
o. 1
65-0
09
Revi
sion
No.
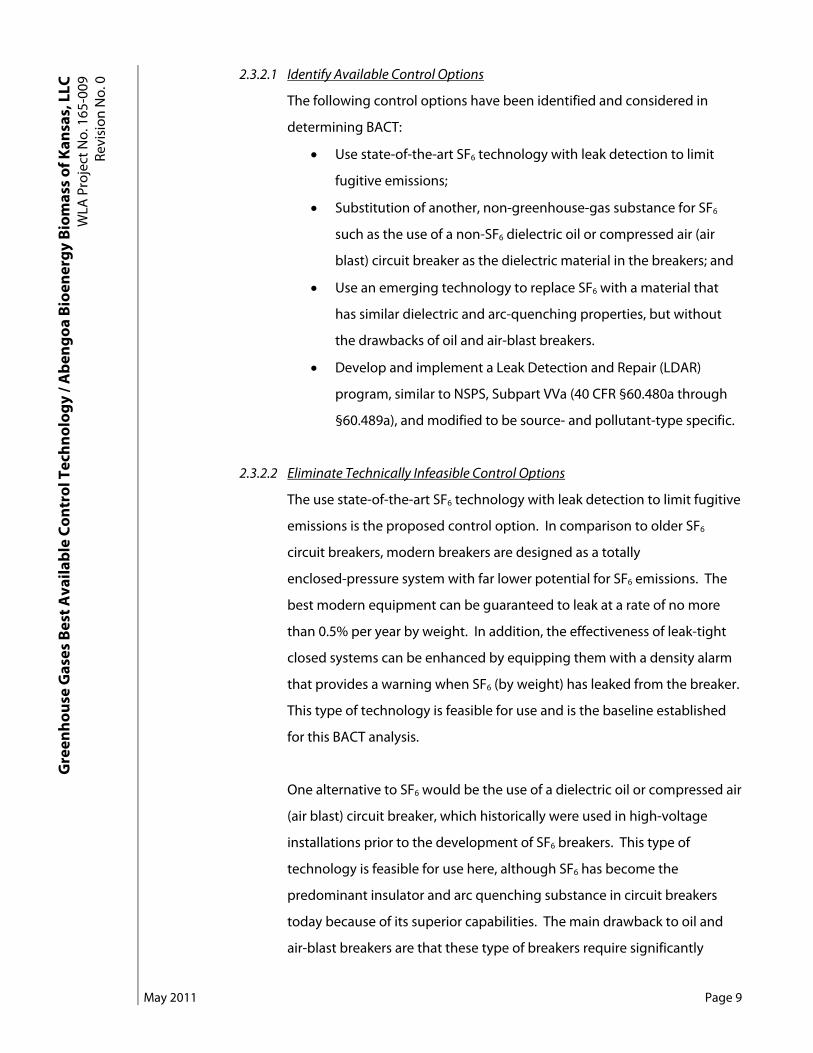
0 2.3.2.1 Identify Available Control Options
The following control options have been identified and considered in
determining BACT:
• Use state-of-the-art SF6 technology with leak detection to limit
fugitive emissions;
• Substitution of another, non-greenhouse-gas substance for SF6
such as the use of a non-SF6 dielectric oil or compressed air (air
blast) circuit breaker as the dielectric material in the breakers; and
• Use an emerging technology to replace SF6 with a material that
has similar dielectric and arc-quenching properties, but without
the drawbacks of oil and air-blast breakers.
• Develop and implement a Leak Detection and Repair (LDAR)
program, similar to NSPS, Subpart VVa (40 CFR §60.480a through
§60.489a), and modified to be source- and pollutant-type specific.
2.3.2.2 Eliminate Technically Infeasible Control Options
The use state-of-the-art SF6 technology with leak detection to limit fugitive
emissions is the proposed control option. In comparison to older SF6
circuit breakers, modern breakers are designed as a totally
enclosed-pressure system with far lower potential for SF6 emissions. The
best modern equipment can be guaranteed to leak at a rate of no more
than 0.5% per year by weight. In addition, the effectiveness of leak-tight
closed systems can be enhanced by equipping them with a density alarm
that provides a warning when SF6 (by weight) has leaked from the breaker.
This type of technology is feasible for use and is the baseline established
for this BACT analysis.
One alternative to SF6 would be the use of a dielectric oil or compressed air
(air blast) circuit breaker, which historically were used in high-voltage
installations prior to the development of SF6 breakers. This type of
technology is feasible for use here, although SF6 has become the
predominant insulator and arc quenching substance in circuit breakers
today because of its superior capabilities. The main drawback to oil and
air-blast breakers are that these type of breakers require significantly

May 2011 Page 10
Gre
enho
use
Gas
es B
est A
vaila
ble
Cont
rol T
echn
olog
y / A
beng
oa B
ioen
ergy
Bio
mas
s of
Kan
sas,
LLC
W
LA P
roje
ct N
o. 1
65-0
09
Revi
sion
No.
0 larger equipment to replicate the same insulating and arc-quenching
capabilities of the SF6 breakers.
The technical feasibility of emerging technologies alternatives to SF6 was
evaluated. According to the most recent report released by the EPA SF6
Partnership, "[n]o clear alternative exists for this gas that is used
extensively in circuit breakers, gas-insulated substations, and switch gear,
due to its inertness and dielectric properties."3 Research and development
efforts have focused on finding substitutes for SF6 that have comparable
insulating and arc quenching properties in high-voltage applications.4
While some progress has reportedly been made using mixtures of SF6 and
other inert gases (e.g., nitrogen or helium) in lower-voltage applications,
most studies have concluded, "that there is no replacement gas
immediately available to use as an SF6 substitute"5 for high-voltage
applications. Therefore, the alternative to use an emerging technology to
replace SF6 was determined to be technically infeasible.
2.3.2.3 Rank Technically Feasible Control Options
Table 2-2 presents the ranked technically feasible control options.
Table 2–2 Ranked Control Options for High Voltage Circuit Breakers Equipment Leaks
Rank Control Technology Emission Rate
(short tons CO2e/year) Emissions Reduction
(short tons CO2e/year) 1 Oil/air-blast circuit breakers 0 4.9 2 State-of-the-art enclosed-
pressure SF6 circuit breakers 4.9 N/A
3 LDAR N/A N/A Note 1: Implementation of the LDAR program will not generate emissions, nor will it control emissions beyond the
baseline. The LDAR program is used to monitor equipment leaks for repair.
3 U.S. EPA, SF6 Emission Reduction Partnership for Electric Power Systems 2007 Annual Report, December 2008, Page 1 (available at: http://www.epa.gov/electricpower-sf6/documents/sf6_2007_ann_report.pdf). 4 U.S. Climate Change Technology Program, Technology Options for the Near and Long Term, § 4.3.5, Electric Power System and Magnesium: Substitutes for SF6, November 2003, Page 185 (available at: www.climatetechnology.gov/library/2003/tech-options/tech-options-4-3-5.pdf) 5 Siemens Power Transmission & Distribution, Inc., Siemens TechTopics No. 53, Use of SF6 Gas in Medium Voltage Switchgear, June 3, 2005, Page 3 (available at: www.energy.siemens.com/cms/us/US_Products/CustomerSupport/TechTopicsApplicationNotes/Documents/TechTopics53Rev0.pdf).
May 2011 Page 11
Gre
enho
use
Gas
es B
est A
vaila
ble
Cont
rol T
echn
olog
y / A
beng
oa B
ioen
ergy
Bio
mas
s of
Kan
sas,
LLC
W
LA P
roje
ct N
o. 1
65-0
09
Revi
sion
No.
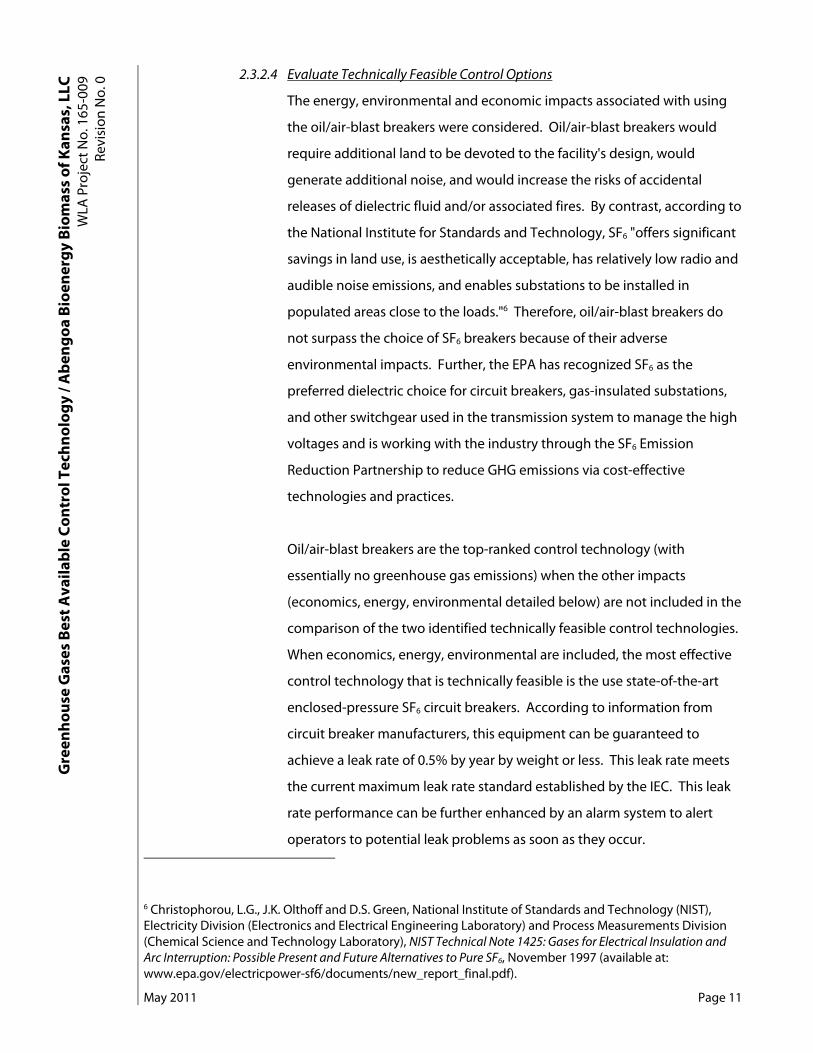
0 2.3.2.4 Evaluate Technically Feasible Control Options
The energy, environmental and economic impacts associated with using
the oil/air-blast breakers were considered. Oil/air-blast breakers would
require additional land to be devoted to the facility's design, would
generate additional noise, and would increase the risks of accidental
releases of dielectric fluid and/or associated fires. By contrast, according to
the National Institute for Standards and Technology, SF6 "offers significant
savings in land use, is aesthetically acceptable, has relatively low radio and
audible noise emissions, and enables substations to be installed in
populated areas close to the loads."6 Therefore, oil/air-blast breakers do
not surpass the choice of SF6 breakers because of their adverse
environmental impacts. Further, the EPA has recognized SF6 as the
preferred dielectric choice for circuit breakers, gas-insulated substations,
and other switchgear used in the transmission system to manage the high
voltages and is working with the industry through the SF6 Emission
Reduction Partnership to reduce GHG emissions via cost-effective
technologies and practices.
Oil/air-blast breakers are the top-ranked control technology (with
essentially no greenhouse gas emissions) when the other impacts
(economics, energy, environmental detailed below) are not included in the
comparison of the two identified technically feasible control technologies.
When economics, energy, environmental are included, the most effective
control technology that is technically feasible is the use state-of-the-art
enclosed-pressure SF6 circuit breakers. According to information from
circuit breaker manufacturers, this equipment can be guaranteed to
achieve a leak rate of 0.5% by year by weight or less. This leak rate meets
the current maximum leak rate standard established by the IEC. This leak
rate performance can be further enhanced by an alarm system to alert
operators to potential leak problems as soon as they occur. 6 Christophorou, L.G., J.K. Olthoff and D.S. Green, National Institute of Standards and Technology (NIST), Electricity Division (Electronics and Electrical Engineering Laboratory) and Process Measurements Division (Chemical Science and Technology Laboratory), NIST Technical Note 1425: Gases for Electrical Insulation and Arc Interruption: Possible Present and Future Alternatives to Pure SF6, November 1997 (available at: www.epa.gov/electricpower-sf6/documents/new_report_final.pdf).

May 2011 Page 12
Gre
enho
use
Gas
es B
est A
vaila
ble
Cont
rol T
echn
olog
y / A
beng
oa B
ioen
ergy
Bio
mas
s of
Kan
sas,
LLC
W
LA P
roje
ct N
o. 1
65-0
09
Revi
sion
No.
0 Although oil/air-blast breakers do not contain SF6, these breakers were
determined to be ranked below SF6 circuit breakers due to the preferred
modern industrial application of state-of-the-art SF6 technology with leak
detection. As stated above, SF6 has become the predominant insulator
and arc quenching substance in circuit breakers today because of its
superior capabilities. The use of oil/air-blast breakers would require
redesign of the power house at the facility as these types of breakers
require significantly larger equipment to replicate the same insulating and
arc-quenching capabilities of the SF6 breakers.
There was one PSD permit identified at the time of this BACT analysis that
had completed GHG BACT analysis for a similar type source. The Russell
City Energy Center is a proposed natural gas fired combined-cycle power
plant that would have a nominal output of 600 Megawatts of electricity
(MWe). It is proposed to be located at 3862 Depot Road, near the corner of
Depot Road and Cabot Blvd., in Hayward, California. The PSD permit for
the Russell City Energy Center was approved by the Bay Area Air Quality
Management District on February 3, 2010. The proposed BACT for this
facility is similar to the approved BACT for the Russell City Energy Center.
An LDAR program is technically feasible control option for this equipment;
therefore, no further evaluation of this control is needed.
2.3.2.5 Establish BACT
Based on this top-down analysis, ABBK proposes that GHG BACT for the
onsite circuit breakers consist of the following:
• State-of-the-art enclosed-pressure SF6 circuit breaker with a
guaranteed leak rate of 0.5% by weight or less by year;
• Density monitor alarm system; and
• Develop and implement a written LDAR program.
The ABBK facility will require one breaker using 82 lbs of SF6. At a leak rate
of 0.5%, annual SF6 emissions would be a maximum of 0.41 lbs/year, which
would equal approximately 4.9 short tons CO2e per year.

May 2011 Page 13
Gre
enho
use
Gas
es B
est A
vaila
ble
Cont
rol T
echn
olog
y / A
beng
oa B
ioen
ergy
Bio
mas
s of
Kan
sas,
LLC
W
LA P
roje
ct N
o. 1
65-0
09
Revi
sion
No.
0 2.3.2.6 BACT Compliance
Fugitive emissions are, by their nature, very difficult to monitor directly as
they are not emitted from a discrete emissions point. Fugitive SF6
emissions can be estimated very accurately, however, by measuring
"top-ups", i.e., the replacement of lost SF6 with new product.7 It is
conservatively assumed that the amount of SF6 that has leaked and
entered the atmosphere is the amount that has to be topped up to
maintain a full SF6 level. Therefore, ABBK proposes that no direct
monitoring of SF6 fugitive emissions be required. In place of direct
monitoring, ABBK proposes surrogate monitoring through measuring the
amount of SF6 lost and using a conversion factor to assess annual SF6
fugitive emissions in terms of CO2e.
In addition, the effectiveness of the leak-tight closed systems will be
enhanced by equipping them with a density alarm that provides a warning
when SF6 has leaked from the breaker. BACT was determined for the
Russell City Energy Center project to be state-of-the-art enclosed-pressure
SF6 circuit breakers with leak detection and the use of an alarm system to
alert controllers when a circuit breaker loses 10% of its SF6. As established
in various EPA publications8, an SF6 circuit breaker is classified as leaking if
it had documented "top-ups" of SF6, which occurred after a density alarm
sounded, indicating that 10% of the circuit breaker gas volume has been
emitted; however, recent industry studies9 have indicated that the leak
monitoring set point of the density alarm may be lowered with a
reasonable degree of certainty.
A density monitor is used to monitor for and determine SF6 leaks by
measuring the circuit breaker internal pressure and temperature. The
monitor then "compensates" for the difference between the measured
7 SF6 Leak Rates from High Voltage Circuit Breakers – U.S. EPA Investigates Potential Greenhouse Gas Emissions Source, supra note 2, Page 1. 8 SF6 Leak Rates from High Voltage Circuit Breakers – U.S. EPA Investigates Potential Greenhouse Gas Emissions Source, supra note 2, Page 1. 9 Thesen, Sven. Pacific Gas & Electric Co., PG&E and the New Breaker SF6 Leak Study, Page 2 (available at http://www.epa.gov/electricpower-sf6/documents/conf04_thesen_paper.pdf).

May 2011 Page 14
Gre
enho
use
Gas
es B
est A
vaila
ble
Cont
rol T
echn
olog
y / A
beng
oa B
ioen
ergy
Bio
mas
s of
Kan
sas,
LLC
W
LA P
roje
ct N
o. 1
65-0
09
Revi
sion
No.
0 temperature and the reference standard of a fully charged breaker defined
at installation and calculates the temperature compensated pressure. SF6
is a real gas, not an ideal gas. A real gas has a pressure-temperature-
density relationship described by a curved equation while an ideal gas
functions on a straight plane. Because of the pressure-temperature-
density relationship, the accuracy of the mechanical monitoring device
(density alarm) proposed is impacted by both pressure and temperature
changes. The accuracy of the most density monitors is ±2.5% (or 2 psi).10
Because of the accuracy limit of the equipment, ABBK will implement a
density alarm threshold of 5%. If the density monitor alarm set point drop
is 4 psi, this correlates to approximately a 5% decrease in SF6 mass from
the original charge at 80 psig using the known mass of SF6 at 80 psig and a
temperature of 75 oF to calculate the breaker volume. This density
monitor alarm threshold is less than the final BACT monitor alarm
threshold established for the Russell City Energy Center and is consistent
with an EPA Electric Power Systems SF6 Emission Reduction Partner's
(Pacific Gas & Electric Co.), new circuit breakers' density monitor alarm
threshold. In the event of an alarm, ABBK will investigate the event and
take any necessary corrective action to address any problems. The density
alarm threshold of 5% is an alarm threshold value only.
ABBK also proposes to develop and implement a written LDAR program
modified from the requirements of 40 CFR Part 60, Subpart VVa, Standards
of Performance for Equipment Leaks of VOC in the Synthetic Organic
Chemicals Manufacturing Industry for which Construction, Reconstruction,
or Modification Commenced After November 7, 2006, to be source- and
pollutant-type specific.
ABBK will provide construction specifications, operation and maintenance
records, and other record keeping documents to KDHE upon request to
demonstrate compliance with BACT. ABBK will also provide a copy of the
10 PG&E and the New Breaker SF6 Leak Study, Page 3

May 2011 Page 15
Gre
enho
use
Gas
es B
est A
vaila
ble
Cont
rol T
echn
olog
y / A
beng
oa B
ioen
ergy
Bio
mas
s of
Kan
sas,
LLC
W
LA P
roje
ct N
o. 1
65-0
09
Revi
sion
No.
0 LDAR program and documentation regarding observations and/or repairs
made in accordance with the LDAR program to KDHE upon request to
demonstrate compliance with BACT.
2.4 Cogeneration Biomass-Fired Boiler BACT Analysis
2.4.1 Source Emissions
The cogeneration plant will employ one water-cooled vibrating grate (stoker)
boiler. The boiler will be capable of producing 325,000 pounds per hour of
920 pound-force per square inch gauge (psig) /750 oF steam. The high pressure
steam supplies a single condensing-extraction steam turbine generator nominally
rated at 22 Megawatts of electricity (MWe). Electrical power will be supplied to the
facility. Power sales to the grid are not foreseen at this time.
Enzymatic hydrolysis process steam is extracted from the turbine at a lower
pressure from extraction ports. Boiler feedwater preheater steam and deaeration
steam is also extracted from the turbine from extraction ports. Exhaust steam is
condensed under vacuum against cooling water in the cooling water tower. The
stoker boiler's maximum design heat input is 500 million British thermal units per
hour (MMBtu/hr). The stoker boiler is capable of burning a combination of raw
biomass (consisting of corn stover, wheat straw, milo (sorghum) stubble, corn
stover, switchgrass, and other opportunity feedstocks that are available),
enzymatic hydrolysis residuals (including lignin-rich stillage cake and thin stillage
syrup), particles collected during biomass grinding, NCG vent streams, wastewater
treatment sludge and biogas. Natural gas will be used during start-up periods as
required per manufacturer recommendations. The stoker boiler will also be
capable of firing on natural gas during normal operations as needed at a limited
capacity, as well as firing on a combination of natural gas, liquid fuel (i.e. enzymatic
hydrolysis thin stillage syrup) and biogas in the event of a solid fuel failure. The
cogeneration process will utilize up to 812 dry tons/day of fuel feedstock.
2.4.2 GHG BACT Review
The biomass-fired stoker boiler is the main source of biogenic GHG emissions (CO2,
CH4, and N2O) at the facility. The Table 1-1 details the GHGs emitted from the
boiler. The total CO2-based emissions from the boiler are 481,652 short tons/yr of
May 2011 Page 16
Gre
enho
use
Gas
es B
est A
vaila
ble
Cont
rol T
echn
olog
y / A
beng
oa B
ioen
ergy
Bio
mas
s of
Kan
sas,
LLC
W
LA P
roje
ct N
o. 1
65-0
09
Revi
sion
No.
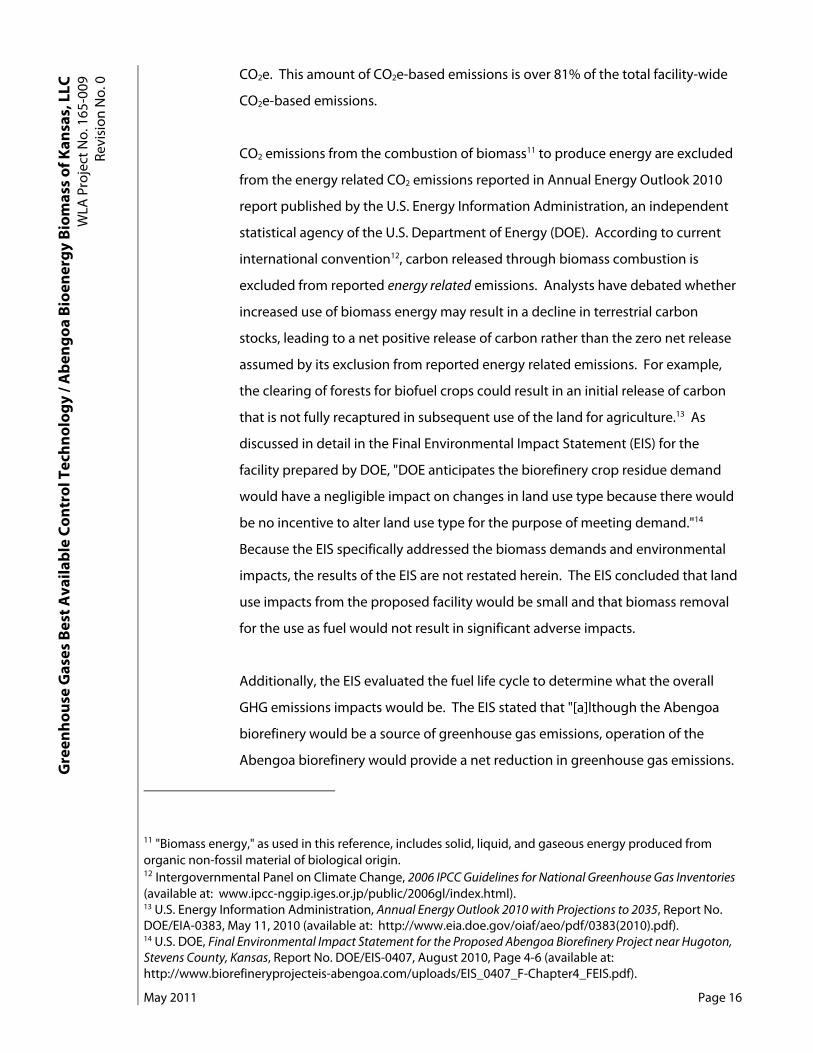
0 CO2e. This amount of CO2e-based emissions is over 81% of the total facility-wide
CO2e-based emissions.
CO2 emissions from the combustion of biomass11 to produce energy are excluded
from the energy related CO2 emissions reported in Annual Energy Outlook 2010
report published by the U.S. Energy Information Administration, an independent
statistical agency of the U.S. Department of Energy (DOE). According to current
international convention12, carbon released through biomass combustion is
excluded from reported energy related emissions. Analysts have debated whether
increased use of biomass energy may result in a decline in terrestrial carbon
stocks, leading to a net positive release of carbon rather than the zero net release
assumed by its exclusion from reported energy related emissions. For example,
the clearing of forests for biofuel crops could result in an initial release of carbon
that is not fully recaptured in subsequent use of the land for agriculture.13 As
discussed in detail in the Final Environmental Impact Statement (EIS) for the
facility prepared by DOE, "DOE anticipates the biorefinery crop residue demand
would have a negligible impact on changes in land use type because there would
be no incentive to alter land use type for the purpose of meeting demand."14
Because the EIS specifically addressed the biomass demands and environmental
impacts, the results of the EIS are not restated herein. The EIS concluded that land
use impacts from the proposed facility would be small and that biomass removal
for the use as fuel would not result in significant adverse impacts.
Additionally, the EIS evaluated the fuel life cycle to determine what the overall
GHG emissions impacts would be. The EIS stated that "[a]lthough the Abengoa
biorefinery would be a source of greenhouse gas emissions, operation of the
Abengoa biorefinery would provide a net reduction in greenhouse gas emissions.
11 "Biomass energy," as used in this reference, includes solid, liquid, and gaseous energy produced from organic non-fossil material of biological origin. 12 Intergovernmental Panel on Climate Change, 2006 IPCC Guidelines for National Greenhouse Gas Inventories (available at: www.ipcc-nggip.iges.or.jp/public/2006gl/index.html). 13 U.S. Energy Information Administration, Annual Energy Outlook 2010 with Projections to 2035, Report No. DOE/EIA-0383, May 11, 2010 (available at: http://www.eia.doe.gov/oiaf/aeo/pdf/0383(2010).pdf). 14 U.S. DOE, Final Environmental Impact Statement for the Proposed Abengoa Biorefinery Project near Hugoton, Stevens County, Kansas, Report No. DOE/EIS-0407, August 2010, Page 4-6 (available at: http://www.biorefineryprojecteis-abengoa.com/uploads/EIS_0407_F-Chapter4_FEIS.pdf).

May 2011 Page 17
Gre
enho
use
Gas
es B
est A
vaila
ble
Cont
rol T
echn
olog
y / A
beng
oa B
ioen
ergy
Bio
mas
s of
Kan
sas,
LLC
W
LA P
roje
ct N
o. 1
65-0
09
Revi
sion
No.
0 The EPA guidance, PSD and Title V Permitting Guidance for Greenhouse Gases,
published in November 2010 (hereinafter referred to as the "November 2010 EPA
GHG Guidance") does not provide any direction for GHG BACT when biomass is
used as a fuel. The Guidance for Determining Best Available Control Technology for
Reducing Carbon Dioxide Emissions from Bioenergy Production (hereinafter referred
to as the "March 2011 EPA GHG Bioenergy Guidance"), published by the EPA in
March 2011 concurrent with the proposed rule to defer application of the PSD
permitting requirements to CO2 emissions from biologically-based materials does
provide recommendations for GHG BACT analyses performed for electricity-
generating facilities that would utilize biomass fuels alone in the primary
production process. EPA Region 7 has indicated that the GHG analysis completed
for the facility in the EIS would not meet the BACT requirements for GHG PSD and
that the biomass-boiler must go through the "top-down" BACT process to
determine BACT for GHGs.15
To complete the GHG BACT analysis for the biomass-fired stoker boiler, KDHE
recommended that the March 2011 EPA GHG Bioenergy Guidance be utilized. The
following presents the GHG BACT analysis for this source.
2.4.2.1 Identify Available Control Options
Based on the March 2011 EPA GHG Bioenergy Guidance, the options listed
as Step 1 of a "top-down" BACT analysis for GHG may be limited to (1)
utilization of biomass fuel alone, (2) energy efficiency improvements, and
(3) carbon capture and sequestration.
The following control options have been identified and considered in
determining BACT:
• Use of low-carbon and carbon neutral fuels;
− Corn stover
− Wheat straw
− Milo stubble
− Wood chips/wood residues
15 KDHE, Electronic Mail from Terry Tavener, November 5, 2010.

May 2011 Page 18
Gre
enho
use
Gas
es B
est A
vaila
ble
Cont
rol T
echn
olog
y / A
beng
oa B
ioen
ergy
Bio
mas
s of
Kan
sas,
LLC
W
LA P
roje
ct N
o. 1
65-0
09
Revi
sion
No.
0 − Switchgrass
− Other opportunity agricultural residues and energy crops
− Enzymatic hydrolysis residuals
• Use of lower GHG-emitting processes and practices through an
energy-efficient design;
− Cogeneration
− Process integration and combustion of process co-
products
− Heat recovery
− Boiler operational monitoring
− Boiler maintenance
• Carbon capture and storage ("CCS", also referred to as "carbon
capture and sequestration");
• Carbon capture for beneficial uses; and
• Combination of these control options.
There are two broad strategies for reducing GHG emissions from the boiler
at the proposed facility. The first is to minimize the production of GHG
through the use of low-carbon and carbon neutral fuels and through the
use of lower GHG-emitting processes and practices. As discussed in detail
in the EIS, the proposed facility will provide a net reduction in GHG
emissions because of the fuel selected and the long-term land use
benefits. Additionally, the lower GHG-emitting processes and practices
require less fuel for process heat, which directly impacts the amount of
GHG produced. Establishing an aggressive basis for energy recovery and
process efficiency will reduce GHG production. The implementation of the
use of low-carbon and carbon neutral fuels and the use of lower GHG-
emitting processes and practices are an integral part of the facility's design
and are considered the baseline for this BACT analysis.
The second strategy for reducing GHG emissions is carbon capture and
storage ("CCS", also referred to as "carbon capture and sequestration") or
carbon capture for beneficial uses. These control options are evaluated in

May 2011 Page 19
Gre
enho
use
Gas
es B
est A
vaila
ble
Cont
rol T
echn
olog
y / A
beng
oa B
ioen
ergy
Bio
mas
s of
Kan
sas,
LLC
W
LA P
roje
ct N
o. 1
65-0
09
Revi
sion
No.
0 this BACT analysis as additional control options in addition to the baseline
control options that are already included in the facility's design.
2.4.2.2 Eliminate Technically Infeasible Control Options
There were three main options identified for control of CO2 emissions from
the boiler: 1) low-carbon and carbon neutral fuels; 2) lower GHG-emitting
processes and practices through an energy-efficient design; and 3) CCS
and/or carbon capture for beneficial uses.
Table 2-3 summarizes the technical feasibility/infeasibility determination
discussed in this section.
Table 2–3 GHG BACT Control Technology Technical Feasibility/Infeasibility Determination
Summary for the Biomass-Fired Boiler
Potentially Available Control Option Determination Result Determination ReasonFuel Type Restriction to Low-Carbon and Carbon Neutral Fuels
Technically Feasible Inherent part of the facility's design, and considered a baseline control
option. Lower GHG-Emitting Processes and Practices Through an Energy Efficient Design
Technically Feasible Inherent part of the facility's design, and considered a baseline control
option. Carbon Capture Using Pre-combustion Capture
Technically Infeasible Technology would redefine the project.
Carbon Capture Using Oxygen-fired Combustion
Technically Infeasible Technology would redefine the project.
Carbon Capture Using Post-Combustion Capture
Technically Feasible Chemical absorption has been the most widely used method of
commercial CO2 capture and is the primary CO2 capture technology
further analyzed. Carbon Transportation Technically Feasible Technical issues can be addressed
through modern pipeline construction and maintenance
practices. Carbon Storage through Geologic Sequestration
Technically Feasible In Kansas, geologic sequestration of CO2 may be possible in all five of the geologic formations: deep
saline aquifers, coal seams, oil and natural gas reservoirs, oil- and gas-
rich organic shales, and basalt Carbon Storage through Terrestrial Sequestration
Technically Feasible Inherent part of the facility's design, and considered a baseline control
option.

May 2011 Page 20
Gre
enho
use
Gas
es B
est A
vaila
ble
Cont
rol T
echn
olog
y / A
beng
oa B
ioen
ergy
Bio
mas
s of
Kan
sas,
LLC
W
LA P
roje
ct N
o. 1
65-0
09
Revi
sion
No.
0 Table 2–3
GHG BACT Control Technology Technical Feasibility/Infeasibility Determination Summary for the Biomass-Fired Boiler
Potentially Available Control Option Determination Result Determination ReasonCarbon Beneficial Uses Technically Feasible The many different technologies
being investigated for the beneficial use of CO2 vary widely in their stages of development, from those being tested at the bench-
scale, to technologies that are close to commercialization.
Combination of These Control Options Technically Feasible See reasons above.
The following discusses each of these control options.
Fuel Type Restriction (Low-Carbon and Carbon Neutral Fuels)
Numerous fuels are available for use in the boiler based on the proposed
boiler design. The primary fuel initially to be used is corn stover. Other
opportunity feedstocks that may be used if available include wheat straw,
milo stubble and waste wood chips. Mixed warm season grasses such as
switchgrass is a long-term feedstock that the facility plans to transition to
as it's primarily fuel. By the year 2018, ABBK anticipates approximately
240,000 acres (970 square kilometers) of mixed warm season grasses will
supply approximately 1,900 dry tons (1,700 metric tons) per day, which
equates to 75% of the feedstock demand.
Other process residuals and by-products that are produced at the facility
such as enzymatic hydrolysis residuals (including lignin-rich/lignin-lean
stillage cake and thin stillage syrup), particles collected during biomass
grinding, non-condensable gas (NCG) vent streams, and wastewater
treatment sludge and biogas will also be combusted in the boiler. Natural
gas will be used during start-up periods as required per manufacturer's
recommendations.
Table 2-4 presents the primary proposed fuel types and approximate
carbon content for each. Due to the facility's design, only the primary fuels
were included in Table 2-4.

May 2011 Page 21
Gre
enho
use
Gas
es B
est A
vaila
ble
Cont
rol T
echn
olog
y / A
beng
oa B
ioen
ergy
Bio
mas
s of
Kan
sas,
LLC
W
LA P
roje
ct N
o. 1
65-0
09
Revi
sion
No.
0 Table 2–4
Primary Proposed Fuel Types for the Biomass-Fired Boiler and Approximate Carbon Content
Feedstock Ultimate Analysis Carbon Content
(wt% dry basis) Corn Stover 40.7%Wheat Straw 46.6% ±2.8 Milo Stubble 46.1% ±1.8 Switchgrass 46.6%
EH Lignin-Rich Stillage 48.2%EH Thin Stillage Syrup 35.0%
Note 1: ABBK provided carbon content values for agricultural residues feedstocks. The variation in carbon content is dependent on the amount of ash in the fuel sample, which is further related to the harvesting technique. For the PTE calculations, the carbon content weight percent dry basis used is the projected overall average for the site-specific feedstock.
It should be noted that agricultural residues typically contain very similar
amounts of carbon, with wood having a slightly higher content of carbon
and enzymatic hydrolysis residuals having a slightly lower content of
carbon.
The boiler will not be able to burn the other process residuals and by-
products individually and these supplemental fuels are fed to the boiler to
either: 1) increase the overall efficiency of the facility's processes; or
2) combust by-products that would otherwise require off-site disposal.
Because the primary fuel(s) will be blended during combustion with
supplemental fuels, the nominal fuel blend and worst-case fuel blends
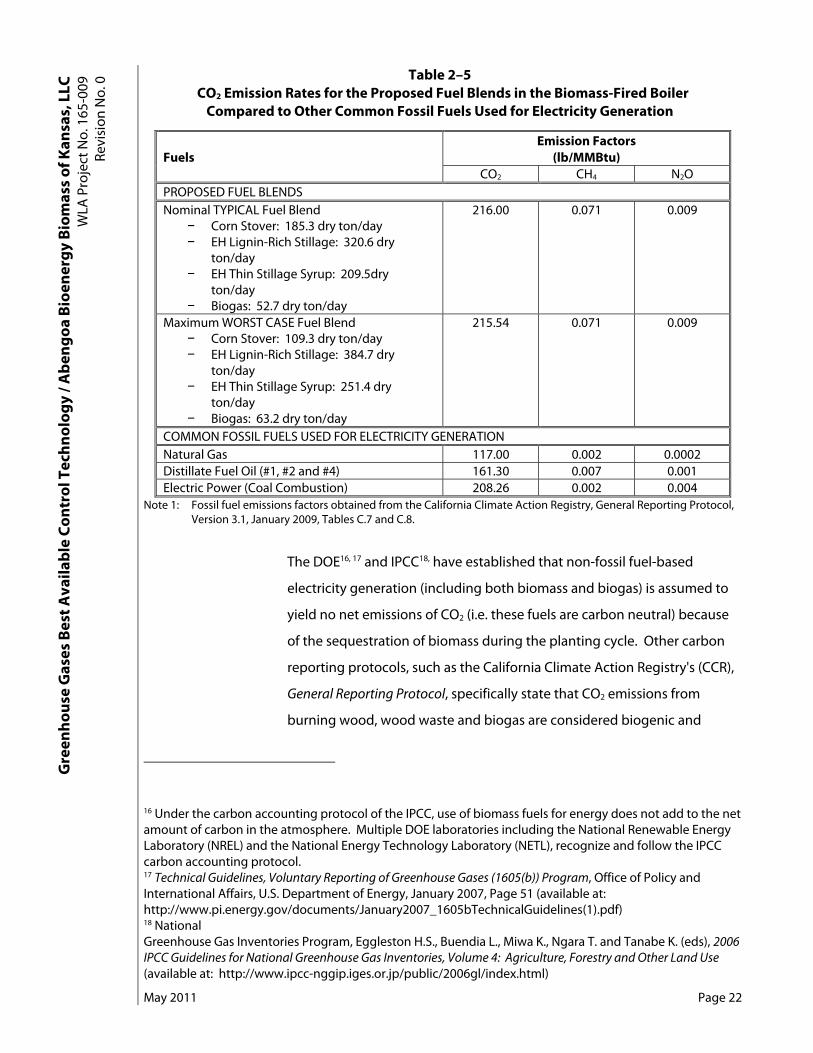
were reviewed. Table 2-5 presents the CO2 emission rates for the
proposed fuel blends compared to other common fossil fuels used for
electricity generation.
May 2011 Page 22
Gre
enho
use
Gas
es B
est A
vaila
ble
Cont
rol T
echn
olog
y / A
beng
oa B
ioen
ergy
Bio
mas
s of
Kan
sas,
LLC
W
LA P
roje
ct N
o. 1
65-0
09
Revi
sion
No.
0 Table 2–5
CO2 Emission Rates for the Proposed Fuel Blends in the Biomass-Fired Boiler Compared to Other Common Fossil Fuels Used for Electricity Generation
Fuels Emission Factors
(lb/MMBtu) CO2 CH4 N2OPROPOSED FUEL BLENDS Nominal TYPICAL Fuel Blend
− Corn Stover: 185.3 dry ton/day − EH Lignin-Rich Stillage: 320.6 dry
ton/day − EH Thin Stillage Syrup: 209.5dry
ton/day − Biogas: 52.7 dry ton/day
216.00 0.071 0.009
Maximum WORST CASE Fuel Blend− Corn Stover: 109.3 dry ton/day − EH Lignin-Rich Stillage: 384.7 dry
ton/day − EH Thin Stillage Syrup: 251.4 dry
ton/day − Biogas: 63.2 dry ton/day
215.54 0.071 0.009
COMMON FOSSIL FUELS USED FOR ELECTRICITY GENERATIONNatural Gas 117.00 0.002 0.0002Distillate Fuel Oil (#1, #2 and #4) 161.30 0.007 0.001Electric Power (Coal Combustion) 208.26 0.002 0.004
Note 1: Fossil fuel emissions factors obtained from the California Climate Action Registry, General Reporting Protocol, Version 3.1, January 2009, Tables C.7 and C.8.
The DOE16, 17 and IPCC18, have established that non-fossil fuel-based
electricity generation (including both biomass and biogas) is assumed to
yield no net emissions of CO2 (i.e. these fuels are carbon neutral) because
of the sequestration of biomass during the planting cycle. Other carbon
reporting protocols, such as the California Climate Action Registry's (CCR),
General Reporting Protocol, specifically state that CO2 emissions from
burning wood, wood waste and biogas are considered biogenic and
16 Under the carbon accounting protocol of the IPCC, use of biomass fuels for energy does not add to the net amount of carbon in the atmosphere. Multiple DOE laboratories including the National Renewable Energy Laboratory (NREL) and the National Energy Technology Laboratory (NETL), recognize and follow the IPCC carbon accounting protocol. 17 Technical Guidelines, Voluntary Reporting of Greenhouse Gases (1605(b)) Program, Office of Policy and International Affairs, U.S. Department of Energy, January 2007, Page 51 (available at: http://www.pi.energy.gov/documents/January2007_1605bTechnicalGuidelines(1).pdf) 18 National Greenhouse Gas Inventories Program, Eggleston H.S., Buendia L., Miwa K., Ngara T. and Tanabe K. (eds), 2006 IPCC Guidelines for National Greenhouse Gas Inventories, Volume 4: Agriculture, Forestry and Other Land Use (available at: http://www.ipcc-nggip.iges.or.jp/public/2006gl/index.html)
May 2011 Page 23
Gre
enho
use
Gas
es B
est A
vaila
ble
Cont
rol T
echn
olog
y / A
beng
oa B
ioen
ergy
Bio
mas
s of
Kan
sas,
LLC
W
LA P
roje
ct N
o. 1
65-0
09
Revi
sion
No.
0 should not be included as a direct stationary emissions in CO2 inventories.
Therefore, the proposed primary fuels are presented in this BACT as
carbon neutral fuels. The natural gas used for the start-up of the boiler is a
low carbon fuel as illustrated in Table 2-5.
BACT based on this control option is the use of biomass as a primary
feedstock that is otherwise considered to have low to no economic value
or benefit (i.e. crop residuals and waste wood); and/or is a lower impacting
crops (i.e. mixed warm season grasses such as switchgrass). BACT based
on this control option is also limiting the boiler to using natural gas for
start-up. This control option is technically feasible for the biomass-fired
boiler, is an inherent part of the facility's design, and is considered a
baseline control option.
Lower GHG-emitting Processes and Practices Through an Energy-Efficient
Design
There are numerous strategies for achieving a highly energy efficient
design of a new condensing-extraction steam turbine electrical power
generation facility. Energy efficiency in the overall design of the power
production process reduces the parasitic load, which in turn requires less
fuel for process heat to generate the same amount of electricity, which
directly impacts the amount of GHG emissions from the facility. All
identified strategies (i.e. control options) listed in this section are
technically feasible for application to the biomass-fired boiler, as well as
related processes, and all are an inherent part of the facility's design.
• Cogeneration as a CO2 Reduction Strategy – Cogeneration is the
simultaneous production of electric power and thermal energy
from a single fuel. The reduction in CO2 emissions from employing
cogeneration comes from the reduced fuel use at electric utility
power plants; thus, the amount of CO2 reduction is dependent
upon the type of electric utility power generation displaced. The
use of the direct-fired boiler system in which biomass feedstocks
are burned directly will produce steam. This steam drives a
turbine, which turns a generator that converts the power into
electricity. The spent steam from the onsite power plant is then

May 2011 Page 24
Gre
enho
use
Gas
es B
est A
vaila
ble
Cont
rol T
echn
olog
y / A
beng
oa B
ioen
ergy
Bio
mas
s of
Kan
sas,
LLC
W
LA P
roje
ct N
o. 1
65-0
09
Revi
sion
No.
0 used in other process areas at the facility and to heat facility
buildings, when feasible. Such combined heat and power systems
greatly increase overall energy efficiency which has a direct impact
on the amount of GHG emissions from the system.
• Process Integration and Combustion of Co-products – ABBK will
make use of the most advanced design approaches to integrate
the process units and to maximize energy efficiency. Some of the
major integration measures of the power generation system with
other facility processes include low pressure steam supplied to the
enzymatic hydrolysis process and the combustion of process co-
products such as enzymatic hydrolysis residuals (including lignin-
rich/lignin-lean stillage cake and thin stillage syrup), particles
collected during biomass grinding, NCG vent streams, and
wastewater treatment sludge and biogas. The largest co-product
(on a mass basis and energy basis) is the lignin-rich stillage cake, as
detailed in the PTE calculations. The lignin-rich stillage cake adds
approximately 210 MMBtu/hr to the total boiler system. The next
largest co-product (on a mass basis and energy basis) is the thin
stillage syrup, which adds approximately 109 MMBtu/hr.
Wastewater treatment will consist of anaerobic treatment followed
by aerobic treatment for the purpose of generating a biogas that
can be added to the boiler as fuel for an additional
42.30 MMBtu/hr of energy.
• Heat Recovery – Periodically or continuously, some water in the
boiler is removed as a means of avoiding the build-up of water
impurities in the boiler. The boiler's design includes blowdown
waste heat exchangers with raw water makeup. The low pressure
boiler feedwater will be preheated with a combination of process
waste heat and low pressure steam extraction to improve the
power cycle efficiency. Also, process steam condensate is
recovered from indirect process steam users and returned to the
boiler feedwater system. The process condensate will be cooled
with reverse osmosis water, in order to meet the temperature
requirements on the condensate polishing resin. The energy is
recovered in the reverse osmosis makeup water. Air preheat,

May 2011 Page 25
Gre
enho
use
Gas
es B
est A
vaila
ble
Cont
rol T
echn
olog
y / A
beng
oa B
ioen
ergy
Bio
mas
s of
Kan
sas,
LLC
W
LA P
roje
ct N
o. 1
65-0
09
Revi
sion
No.
0 which is a method of recovering heat from the hot exhaust gas of a
combustion process by heat exchange with the combustion air
before it enters the combustion chamber, will be included in the
boiler's design. In addition to process integration techniques to be
utilized, the boiler's design includes economizers to improve
power cycle.
• Boiler Operational Monitoring – Excessive amounts of combustion
air used in results in energy inefficient operation because more
fuel combustion is required in order to heat the excess air to
combustion temperatures. Using state-of-the-art instrumentation
for monitoring and controlling the excess air levels in the
combustion process, will reduce the heat input by minimizing the
amount of combustion air needed for safe and efficient
combustion. The boiler's design includes an online stack oxygen
analyzer. Oxygen levels will be monitored and the inlet air flow
will be adjusted for optimal thermal efficiency within the
operating limits of the boiler. Additionally, optimized air/fuel
ratios, reduce not only CO2 emissions but also NOx emissions. The
boiler will be equipped with online stack oxygen analyzers as part
of the continuous emission monitoring system (CEMS).
• Boiler Maintenance – The boiler will be maintained in accordance
with the manufacturer's recommendations. Maintenance of the
boiler is performed to increase efficiency, ensure safety and
prevent unscheduled shutdowns. Boiler outages for 10 to 14 days
each year are planned for scheduled maintenance, cleaning, and
"tune-up" to optimize performance.
Carbon Capture
Approaches to CO2 capture can be divided into three categories:
pre-combustion, oxygen-fired combustion, and post-combustion capture.
Within these categories are different technologies that can be used.

May 2011 Page 26
Gre
enho
use
Gas
es B
est A
vaila
ble
Cont
rol T
echn
olog
y / A
beng
oa B
ioen
ergy
Bio
mas
s of
Kan
sas,
LLC
W
LA P
roje
ct N
o. 1
65-0
09
Revi
sion
No.
0 Figure 2-1 presents block flow diagrams of each of the categories.19 A
description of each method and the different technologies follows.
Figure 2–1 Block Flow Diagrams Illustrating Post-combustion, Pre-combustion, and
Oxy-combustion Systems
Pre-combustion capture involves reacting a fuel with oxygen or air, and/or
steam to produce a "synthesis gas" or "fuel gas" composed mainly of CO
and H2. The CO is reacted with steam in a catalytic reactor, called a shift
converter, to give CO2 and more H2. CO2 is then separated from the gas
mixture, usually by a physical or chemical absorption process, resulting in
a hydrogen-rich fuel which can be used in many applications, such as a
combustion turbine or boiler. This approach would require a complete
redesign of the boiler so that they would burn a gaseous fuel. The
19 Jose´ D. Figueroa (National Energy Technology Laboratory, NETL), Timothy Fout (NETL), Sean Plasynski (NETL), Howard McIlvried (Science Applications International Corporation), Rameshwar D. Srivastava (Science Applications International Corporation ), International Journal of Greenhouse Gas Control 2, Advances in CO2 Capture Technology—The U.S. Department of Energy’s Carbon Sequestration Program, 2008, first published online September 17, 2007, Page 11 (available at: http://www.netl.doe.gov/technologies/carbon_seq/refshelf/CO2%20Capture%20Paper.pdf).

May 2011 Page 27
Gre
enho
use
Gas
es B
est A
vaila
ble
Cont
rol T
echn
olog
y / A
beng
oa B
ioen
ergy
Bio
mas
s of
Kan
sas,
LLC
W
LA P
roje
ct N
o. 1
65-0
09
Revi
sion
No.
0 November 2010 EPA GHG guidance states that control technologies with
inherently lower polluting processes that would fundamentally redefine
the nature of the source do not need to be evaluated.20 The DOE is
proposing to provide federal funding to ABBK to support the final design,
construction, and startup of the biomass-to-ethanol and biomass-to-
energy production facility. The DOE funding is based on the proposed
facility design. ABBK's basic or fundamental business purpose/objective
for this project is dependent on the biomass-fired boiler design as
proposed. Therefore, pre-combustion as a control technology is
technically infeasible.
In the oxygen-fired combustion (oxy-combustion) approach, the biomass
is combusted in an enriched oxygen environment resulting in a flue gas
that is mainly CO2 and H2O. This flue gas stream can be fed directly into a
CO2 compression and dehydration unit. Oxygen-fired combustion is
simpler and less chemically intensive than post-combustion CO2 capture,
but is less mature and similarly expensive. Because the boiler is designed
to use air for combustion, the use of oxygen would require substantial
redesign. As discussed previously, the November 2010 EPA GHG guidance
states that control technologies with inherently lower polluting processes
that would fundamentally redefine the nature of the source do not need
to be evaluated. Therefore, oxy-combustion as a control technology is
technically infeasible.
Post-combustion capture methods are applied to conventional
combustion processes using air and carbon-containing fuels in order to
isolate CO2 from the combustion exhaust gases. Because the air used for
combustion contains nearly 80% nitrogen, the CO2 concentration in the
exhaust gases is approximately 10% to 15% depending on the amount of
20 PSD and Title V Permitting Guidance for Greenhouse Gases, supra note13, Page 27.

May 2011 Page 28
Gre
enho
use
Gas
es B
est A
vaila
ble
Cont
rol T
echn
olog
y / A
beng
oa B
ioen
ergy
Bio
mas
s of
Kan
sas,
LLC
W
LA P
roje
ct N
o. 1
65-0
09
Revi
sion
No.
0 excess air and the carbon content of the fuel. Additionally,
post-combustion capture of CO2 is a challenging application because:21
− The low pressure and dilute concentration dictate a high actual
volume of gas to be treated;
− Trace impurities in the flue gas tend to reduce the effectiveness of
the CO2 absorbing processes; and
− Compressing captured CO2 from atmospheric pressure to pipeline
pressure (1,200 to 2,000 psi) represents a large parasitic load.
Post-combustion capture methods require separating the CO2 from other
flue gases because sequestration of combustion gases is not feasible due
in part to the cost of gas compression and storage. The most likely options
currently identifiable for CO2 separation and capture include: 22
− Absorption (chemical and physical)
− Adsorption (physical and chemical)
− Low-temperature distillation (cryogenic separation)
− Gas separation membranes
− Mineralization and biomineralization (carbon calcification)
Chemical absorption has been the most widely used method of
commercial CO2 capture for over 60 years.23 The main existing commercial
applications include enhanced oil recovery (EOR), which involves
increasing oil production rates by injecting CO2 into oil wells. Liquid
scrubbing is the most common form of chemical absorption, consisting of
two contacting towers (one for CO2 absorption and one for CO2
desorption/absorbent regeneration). Chemical absorption is a chemical
reaction that forms a loosely bonded intermediate compound. For the
CO2 capture application, a chemical solvent is exposed to the flue gas
where it reacts chemically with CO2 separating it from the other gases. The
21 NETL, Carbon Sequestration, CO2 Capture website (available at: http://www.netl.doe.gov/technologies/carbon_seq/core_rd/co2capture.html). 22 U.S. DOE, Carbon Capture Research website (available at: http://www.fossil.energy.gov/programs/sequestration/capture). 23 Herzog, H., An Introduction to CO2 Separation and Capture Technologies, MIT Energy Laboratory, August 1999 (available at: http://sequestration.mit.edu/pdf/introduction_to_capture.pdf).

May 2011 Page 29
Gre
enho
use
Gas
es B
est A
vaila
ble
Cont
rol T
echn
olog
y / A
beng
oa B
ioen
ergy
Bio
mas
s of
Kan
sas,
LLC
W
LA P
roje
ct N
o. 1
65-0
09
Revi
sion
No.
0 intermediate compound is then isolated and heated causing it to break
down into separate streams of CO2 and solvent. The solvent most often
used is monoethanolamine (MEA). The primary concerns with MEA and
other amine solvents are corrosion in the presence of O2 and other
impurities and high solvent degradation rates due to reactions with SO2
and NOx. Degradation and oxidation of the solvents over time produces
products that are corrosive and may require hazardous material handling
procedures. These difficulties can be overcome, and this capture method
is technically feasible. Figure 2-2 depicts a generic MEA chemical
absorption system (essentially a liquid scrubbing system for CO2).24 Other
chemical absorption methods are at bench and laboratory scales of
development. No CO2 absorption technology demonstrations, except for
liquid scrubbing using alkanolamines for CO2 removal, have been
successfully performed on similar type and sized sources25.
24 Energy & Environmental Research Center, University of North Dakota, Regional Emissions and Capture Opportunities Assessment – Plains CO2 Reduction (PCOR) Partnership Phase II, 2010-EERC-08-15, December 2009. 25 The PCOR December 2009 report indicated that a technology demonstration project for liquid scrubbing using ammonia as the absorbent was to be conducted at the Basin Electric Power Cooperative for the 125 MW Antelope Valley Power Station. As of December 2010, Basin Electric postponed the CO2 capture project due to technical, operational, regulatory and financial risks for installing carbon-capture technology at the conventional coal-based power plant. No technology demonstrations have been

May 2011 Page 30
Gre
enho
use
Gas
es B
est A
vaila
ble
Cont
rol T
echn
olog
y / A
beng
oa B
ioen
ergy
Bio
mas
s of
Kan
sas,
LLC
W
LA P
roje
ct N
o. 1
65-0
09
Revi
sion
No.
0 Figure 2–2
Generic MEA Chemical Absorption (Liquid Scrubbing) System
Physical absorption processes are commonly used for CO2 rejection from
natural gas and operate at high pressure and low temperature. Use of
physical absorption for CO2 capture from combustion exhaust gas would
entail a significant amount of gas compression capacity and a significant
energy penalty. This capture method is presumed for the purposes of this
analysis to be technically feasible, but because chemical absorption has
been commercially demonstrated for CO2 capture and physical absorption
does not offer any capture/control, capital or operating cost benefits, this
CO2 capture technique will not be considered further in this analysis.
Adsorption involves ducting the exhaust gas through a bed of solid
material with high surface areas, such as zeolites or activated carbon to
adsorb CO2 while allowing nitrogen and other gases to pass through.
Adsorption would require either a high degree of compression or multiple
separation steps to produce high CO2 concentration from exhaust gas.
Cryogenic separation is based on solidifying the CO2 component of the
exhaust stream by freezing it to separate it out. Gas separation
membranes (or simply membranes) capture CO2 by separating it from the
other exhaust gases using different mechanisms of separation including
solution-diffusion and molecular sieving. Mineralization offers a leak-

May 2011 Page 31
Gre
enho
use
Gas
es B
est A
vaila
ble
Cont
rol T
echn
olog
y / A
beng
oa B
ioen
ergy
Bio
mas
s of
Kan
sas,
LLC
W
LA P
roje
ct N
o. 1
65-0
09
Revi
sion
No.
0 proof, permanent solution, whereby CO2 is fixed into a solid matrix of
minerals to form thermodynamically stable carbonate minerals. The large
volumes of material involved with mineralization present significant
challenges for transportation and handling. No large-scale
demonstrations of these technologies have been performed on similar
exhaust streams. These capture methods are presumed for the purposes
of this analysis to be technically feasible, but because these methods have
not been commercially demonstrated for CO2 capture, these CO2 capture
technique will not be considered further in this analysis.
Based on identified post-combustion CO2 separation and capture
methods, the only commercially demonstrated method for similar exhaust
streams is chemical absorption (liquid scrubbing employing
alkanolamines).
Carbon Transport
Once captured, CO2 must be transported to a suitable storage site in order
to achieve any environmental benefit. CO2 pipelines are the most
prevalent means of bulk CO2 transport and are a mature market
technology in operation today.26
Pipeline transportation of CO2 is typically accomplished with CO2 that is
compressed to its supercritical state, involving pressures of 1,200 to 2,000
psi. In addition, water must be eliminated from CO2 pipeline systems, as
the presence of water results in formation of carbonic acid, which is
extremely corrosive to carbon steel pipe. In overall construction, CO2
pipelines are similar to natural gas pipelines, requiring the same attention
to design, monitoring for leaks, and protection against overpressure,
especially in populated areas. All of these technical issues can be
26 Intergovernmental Panel on Climate Change (IPCC) Guidelines for National Greenhouse Gas Inventories, Volume 2: Energy, Chapter 5: Carbon Dioxide Transport, Injection and Geological Storage, § 5.4: CO2 Transport, 2006, Page 5.8 (available at: http://www.ipcc-nggip.iges.or.jp/public/2006gl/pdf/2_Volume2/V2_5_Ch5_CCS.pdf).
May 2011 Page 32
Gre
enho
use
Gas
es B
est A
vaila
ble
Cont
rol T
echn
olog
y / A
beng
oa B
ioen
ergy
Bio
mas
s of
Kan
sas,
LLC
W
LA P
roje
ct N
o. 1
65-0
09
Revi
sion
No.
0 addressed through modern pipeline construction and maintenance
practices.
Carbon Storage
Deploying carbon storage in commercial-scale applications requires
adequate geologic formations capable of: 1) sequestering large volumes
of CO2; 2) receiving CO2 at an efficient and economic rate of injection; and
3) retaining CO2 safely over extended periods.
In south-central and southwest Kansas, potential geologic sequestration
sites within saline aquifers and depleted oil reservoirs within the Ozark
Plateau Aquifer System (OPAS) are being studied. Starting in December
2009, the University of Kansas, BEREXO Inc., Bittersweet Energy Inc., the
Kansas Geological Survey, and the Kansas State University, began to
evaluate potential CO2 sequestration sites within saline aquifer and
depleted oil reservoirs within the OPAS. The study is focusing on the
Wellington Field, with evaluation of the CO2-EOR potential of its
Mississippian Chert Reservoir and the sequestration potential in the
underlying Cambro-Ordovician Arbuckle Group Saline Reservoir. 27 The
purpose of the study is to provide a more detailed analysis of the storage
potential of a local area within OPAS (an area covering approximately
17 counties in south-central Kansas) by modeling CO2 injection within the
Arbuckle Group Saline Aquifer and Mississippian Chert Oil Reservoir at
Wellington Field (Sumner County, Kansas).
Currently, CO2 is only captured in Kansas at a few facilities that produce
high-purity CO2.28 In Kansas, geologic sequestration of CO2 may be
possible in all five of the geologic formations: deep saline aquifers, coal
seams, oil and natural gas reservoirs, oil- and gas-rich organic shales, and
27 U.S. DOE, National Energy Technology Laboratory, Modeling CO2 Sequestration in a Saline Reservoir and Depleted Oil Reservoir to Evaluate The Regional CO2 Sequestration Potential of The Ozark Plateau Aquifer System, South-Central Kansas, FE0002056, May 2010 (available at: http://www.netl.doe.gov/publications/factsheets/project/FE0002056.pdf). 28 Kansas Geological Survey, Geologic Sequestration of Carbon Dioxide in Kansas, Public Information Circular 27, December 2008 (available at: http://www.kgs.ku.edu/Publications/PIC/pic27.html).

May 2011 Page 33
Gre
enho
use
Gas
es B
est A
vaila
ble
Cont
rol T
echn
olog
y / A
beng
oa B
ioen
ergy
Bio
mas
s of
Kan
sas,
LLC
W
LA P
roje
ct N
o. 1
65-0
09
Revi
sion
No.
0 basalt (the most problematic because no one knows how much CO2 the
ancient rock--deeply buried in parts of Kansas--can hold). Altogether,
researchers estimate Kansas has at least 2.7 to 5.4 billion tons of potential
geologic sequestration space, enough to hold almost 70 years worth of
the state's stationary CO2 production.29 Stevens County, Kansas is located
in an area known for oil and gas production, as well as deep saline
formations. The proposed facility will be constructed in Section 18,
Township 33S, Range 37W. Within this area are the Hugoton Gas Area,
Panoma Gas Area and Gentzler oil and gas fields. Table 2-6 summarizes
the oil and gas production for the state and county in 2009.30, 31
Table 2–6 Summary of Oil and Gas Production in State of Kansas and Stevens County For 2009
Oil Production Production (bbls) No. of Wells Cumulative (bbls) State-Wide 39,465,916 45,609 6,313,426,149 Stevens County 954,680 153 26,277,308 County Percentage 2.42% 0.34% 0.42% Gas Production Production (mcf) No. of Wells Cumulative (mcf) State-Wide 359,713,536 25,836 38,724,276,993 Stevens County 53,957,264 2,196 8,698,699,483 County Percentage 15.00% 8.50% 22.46%
Note 1: Units are barrels (bbls) and million cubic feet (mcf).
In Kansas, concerns have been raised about regulating CO2-EOR and other
geologic sequestration activities and whether the CO2 would be trapped in
these reservoirs or move back to the surface over time. Because Kansas
has long been drilled for oil and gas and some areas have been very
densely drilled, concerns also exist that CO2 could move back to the
surface through poorly plugged or long-forgotten wells.
According to the Kansas Geological Survey, sequestration in Kansas needs
to be studied in more detail to determine if oil and natural gas reservoirs
29 Geologic Sequestration of Carbon Dioxide in Kansas, supra note 27. 30 Kansas Geological Survey, State Production and Historical Information website (available at: http://www.kgs.ku.edu/PRS/petro/state.html). 31 Kansas Geological Survey, Stevens County – Oil and Gas Production website (available at: http://www.kgs.ku.edu/PRS/County/rs/stevens.html).
May 2011 Page 34
Gre
enho
use
Gas
es B
est A
vaila
ble
Cont
rol T
echn
olog
y / A
beng
oa B
ioen
ergy
Bio
mas
s of
Kan
sas,
LLC
W
LA P
roje
ct N
o. 1
65-0
09
Revi
sion
No.
0 and coal beds have the capacity to take and hold CO2. In addition, a
variety of legal issues, such as ownership of the underground pore space
used for sequestration, would need to be resolved, and a workforce would
have to be developed. Ultimately, regulatory decisions, economics, and a
well-defined environment for GHG management will highly influence any
decisions concerning the feasibility of geologic sequestration.32
In addition to the CO2 storage options already discussed, the other primary
storage option available includes using terrestrial applications. Terrestrial
sequestration is the enhancement of CO2 uptake by plants that grow on
land and in freshwater and, importantly, the enhancement of carbon
storage in soils where it may remain more permanently stored.
In general, croplands store less carbon than grasslands which store less
carbon than forests. Grasslands are particularly good at storing carbon in
soils because they often have extensive and deep roots. DOE determined
in the EIS that "warm season grass production would likely occur on
marginal and non-harvested cropland, pasture, and former CRP lands.
Bioenergy crops have the potential to reduce atmospheric carbon by
building up soil carbon levels, especially when planted on lands where soil
carbon levels have been reduced by intensive tillage, such as marginal
cropland. In instances where pasture or former CRP lands would be
converted to warm season grass production, exchanging one system of
perennial vegetation for another would be expected to involve minimal
environmental changes, including greenhouse gas emissions. A 2007
study on the Life-Cycle Energy and Greenhouse Gas Emission Impacts of
Different Corn Ethanol Plant Types33 concluded that cellulosic ethanol
produced from switchgrass [switchgrass is a type of warm season grass]
clearly offers the greatest energy and [greenhouse gas] benefits (by far)."34
32 Geologic Sequestration of Carbon Dioxide in Kansas, supra note 27. 33 Michael Wang, et. al., Center for Transportation Research, Argonne National Laboratory Life-Cycle Energy and Greenhouse Gas Emission Impacts of Different Corn Ethanol Plant Types, first published May 22, 2007 (available at: http://iopscience.iop.org/1748-9326/2/2/024001/pdf/1748-9326_2_2_024001.pdf). 34 Final Environmental Impact Statement for the Proposed Abengoa Biorefinery Project near Hugoton, Stevens County, Kansas, supra note 11, Page 4-30.
May 2011 Page 35
Gre
enho
use
Gas
es B
est A
vaila
ble
Cont
rol T
echn
olog
y / A
beng
oa B
ioen
ergy
Bio
mas
s of
Kan
sas,
LLC
W
LA P
roje
ct N
o. 1
65-0
09
Revi
sion
No.
0 Based on these considerations, DOE concluded that in the event warm
season grasses were to replace corn stover as the dominant feedstock, the
net result to greenhouse emissions would be beneficial. By the year 2018,
ABBK anticipates approximately 240,000 acres (970 square kilometers) of
mixed warm season grasses will supply approximately 1,900 dry tons
(1,700 metric tons) per day, which equates to 75% of the feedstock
demand. The change from corn stover to grasses is dependent first on the
construction of the facility to generate the crop demand, and second on
the negotiation of contracts with local farmers to change their farming
practices from corn to grasses. ABBK's long-term operational plan for this
facility is based on the feedstock change to mixed warm season grasses.
Terrestrial sequestration provides an opportunity for low-cost CO2
emissions offsets. Storing carbon in terrestrial ecosystems can be achieved
through maintenance of standing aboveground biomass, utilization of
aboveground biomass in long-lived products, or protection of carbon
(organic and inorganic) compounds present in soils.35 Because the
proposed source consists of a biomass-fired boiler, this type of CO2 storage
is essentially being implemented as part of the facility's design; therefore,
terrestrial sequestration is considered a baseline control option.
Carbon Beneficial Uses
In addition to using CO2 for enhanced oil recovery (EOR), there are many
other possible beneficial and revenue-generating uses for captured CO2 in
various stages of development. Technologies are being developed today
that synthesize solid materials such as plastics, or carbonates that can be
used in cement or glass, from a CO2 feedstock. There are other
technologies under development that do not provide long-term storage
of CO2, but which still could reduce overall GHG emissions by either
1) using CO2 in a way that displaces the emission of other GHGs, or
2) converting CO2 into a chemical that can in turn displace the emission of
35 Gary K. Jacobs, et. al., Oak Ridge National Laboratory, Oak Ridge, TN, Carbon Sequestration in Terrestrial Ecosystems: A Status Report on R&D Progress, August 2000 (available at: http://www.netl.doe.gov/publications/proceedings/01/carbon_seq/3C1.pdf).

May 2011 Page 36
Gre
enho
use
Gas
es B
est A
vaila
ble
Cont
rol T
echn
olog
y / A
beng
oa B
ioen
ergy
Bio
mas
s of
Kan
sas,
LLC
W
LA P
roje
ct N
o. 1
65-0
09
Revi
sion
No.
0 other GHGs. An example of the former is using CO2 as a refrigerant that
substitutes for chemicals currently used in refrigeration that are far more
potent greenhouse gases than CO2, such as hydrofluorocarbons (HFCs).
An example of the latter is the wide array of "CO2-to-fuel" technologies
being researched with the goal of producing liquid fuels ranging from
methanol or ethanol to gasoline or diesel out of CO2 and water, along with
an energy input (preferably from a CO2-free source such as solar or wind).
Fuels produced from waste CO2 could displace the use of petroleum-
derived fuels, which would result in reduced net GHG emissions.
Some of the better-known types of CO2-to-fuel technologies are
biologically based and use algae and other photosynthetic
microorganisms in the conversion of CO2, water, and sunlight into liquid
fuel. A number of different companies are trying to commercialize
technologies that use photosynthetic microbes to convert CO2 to fuel.
Some other uses of CO2 that are being researched do not clearly reduce
GHG emissions directly or indirectly, but still provide some other public
benefit such as displacing the use of the toxic chemicals or saving water.
Examples include using CO2 as a solvent in place of perchlorethylene for
dry cleaning, or using CO2 as a non-toxic grain silo fumigant.
The many different technologies being investigated for the beneficial use
of CO2 vary widely in their stages of development, from those being tested
at the bench-scale, to technologies that are close to commercialization.
They also vary widely in their potential to impact overall GHG emissions.
There is a need to better understand the viability of the various
technological options for CO2 use and their potential to incentivize
industrial carbon capture and provide substantive GHG emissions
reductions.
The majority of CO2 in the merchant market36 is used for EOR
(approximately 70% to 80%),37 along with a significant portion used in the
36 Market in which CO2 is bought and sold competitively by multiple market participants.
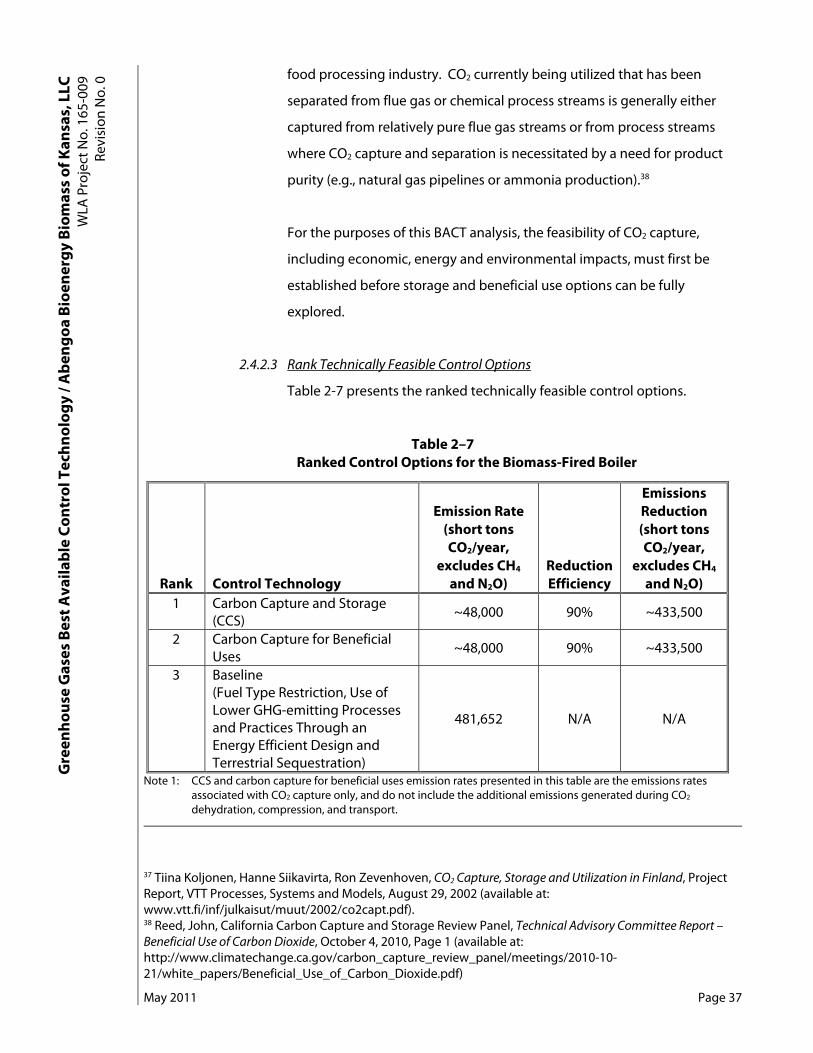
May 2011 Page 37
Gre
enho
use
Gas
es B
est A
vaila
ble
Cont
rol T
echn
olog
y / A
beng
oa B
ioen
ergy
Bio
mas
s of
Kan
sas,
LLC
W
LA P
roje
ct N
o. 1
65-0
09
Revi
sion
No.
0 food processing industry. CO2 currently being utilized that has been
separated from flue gas or chemical process streams is generally either
captured from relatively pure flue gas streams or from process streams
where CO2 capture and separation is necessitated by a need for product
purity (e.g., natural gas pipelines or ammonia production).38
For the purposes of this BACT analysis, the feasibility of CO2 capture,
including economic, energy and environmental impacts, must first be
established before storage and beneficial use options can be fully
explored.
2.4.2.3 Rank Technically Feasible Control Options
Table 2-7 presents the ranked technically feasible control options.
Table 2–7 Ranked Control Options for the Biomass-Fired Boiler
Rank Control Technology
Emission Rate (short tons CO2/year,
excludes CH4 and N2O)
Reduction Efficiency
Emissions Reduction (short tons CO2/year,
excludes CH4 and N2O)
1 Carbon Capture and Storage (CCS)
~48,000 90% ~433,500
2 Carbon Capture for Beneficial Uses
~48,000 90% ~433,500
3 Baseline (Fuel Type Restriction, Use of Lower GHG-emitting Processes and Practices Through an Energy Efficient Design and Terrestrial Sequestration)
481,652 N/A N/A
Note 1: CCS and carbon capture for beneficial uses emission rates presented in this table are the emissions rates associated with CO2 capture only, and do not include the additional emissions generated during CO2 dehydration, compression, and transport.
37 Tiina Koljonen, Hanne Siikavirta, Ron Zevenhoven, CO2 Capture, Storage and Utilization in Finland, Project Report, VTT Processes, Systems and Models, August 29, 2002 (available at: www.vtt.fi/inf/julkaisut/muut/2002/co2capt.pdf). 38 Reed, John, California Carbon Capture and Storage Review Panel, Technical Advisory Committee Report – Beneficial Use of Carbon Dioxide, October 4, 2010, Page 1 (available at: http://www.climatechange.ca.gov/carbon_capture_review_panel/meetings/2010-10-21/white_papers/Beneficial_Use_of_Carbon_Dioxide.pdf)

May 2011 Page 38
Gre
enho
use
Gas
es B
est A
vaila
ble
Cont
rol T
echn
olog
y / A
beng
oa B
ioen
ergy
Bio
mas
s of
Kan
sas,
LLC
W
LA P
roje
ct N
o. 1
65-0
09
Revi
sion
No.
0 The use of low-carbon and carbon neutral fuels, use of aggressive lower
GHG-emitting processes and practices through an energy-efficient design
to reduce CO2 emissions, and terrestrial sequestration control options are
an inherent part of the facility's design and considered baseline control
options. No emissions reduction credit is taken for the implementation of
the baseline control options. The baseline presented above represents the
design with the highest efficiency improvements limited to the maximum
worst-case fuel blend discussed in Section 2.4.2.2. A detailed comparison
of the impacts of certain heat recovery strategies on the cogeneration
system is presented in Table 2.8. In Table 2.8, the "Base Case" is intended
to represent the fully scoped cogeneration system with all heat integration
and power cycle heat recovery strategies employed. Case 1 presents the
system when the process waste heat integration is not employed, Case 2
presents the system when the boiler feedwater preheaters are not
employed, and Case 3 presents the system when the biomass boiler air
preheater and economizer are not employed.
Table 2–8 Detailed Comparison of the Impacts of Certain Heat Recovery Strategies on the
Cogeneration System
Summary Comparison (Implemented Yes/No)
Base Case (Proposed
System)
Case 1 Case 2 Case 3
Biomass Boiler (Fuel Type Restriction) Yes Yes Yes YesAir Preheat Yes Yes Yes NoEconomizer Yes Yes Yes NoHigh Pressure Boiler Feedwater Preheater Yes Yes No NoLow Pressure Boiler Feedwater Preheaters Yes Yes No NoProcess Waste Heat Integration Yes No No NoGross Power Production, MWe 21.8 19.3 20.8 20.8Estimated Net Power to Grid, MWe 2.8 0.3 1.8 1.8Heat Rate, Btu/kW-hr 21,431.2 24,207.3 23,802.9 27,543.3Cycle Efficiency, % 15.92% 14.10% 14.33% 12.39%Overall Efficiency, % 183.6 183.6 183.6 183.6Boiler Steam Production, lb steam/hr 325,000 325,000 325,000 325,000CO2e Production (Maximum WORST CASE Fuel Blend), lb CO2e/hr 109,966 109,966 116,645 135,165
CO2e/Steam Ratio (Maximum WORST CASE Fuel Blend), lb CO2e/lb steam produced 0.34 0.34 0.36 0.42
The technically feasible control options for further controlling CO2
emissions or reducing overall CO2 impacts from the biomass-fired stoker
May 2011 Page 39
Gre
enho
use
Gas
es B
est A
vaila
ble
Cont
rol T
echn
olog
y / A
beng
oa B
ioen
ergy
Bio
mas
s of
Kan
sas,
LLC
W
LA P
roje
ct N
o. 1
65-0
09
Revi
sion
No.
0 boiler is carbon capture with either long term storage through geologic
sequestration or EOR, beneficial use of the CO2 as a consumer product. For
the purposes of this BACT analysis, chemical absorption is assumed to
represent the best post-combustion CO2 capture option that has been
commercially demonstrated. The evaluation of the control options in this
BACT analysis focuses first on the effectiveness of CO2 capture, including
economic, energy and environmental impacts; and then if CO2 capture is
determined to be cost-effective, storage and beneficial use options will be
evaluated.
2.4.2.4 Evaluate Technically Feasible Control Options
CCS in biomass-fired power plants may result in net CO2 removal from the
atmosphere. However, biomass plants are typically small (25 to 50 MWe
verses 500 to1000 MWe coal power plants). Thus the CCS cost per kW is
roughly twice as high as the cost in coal plants.39 For the purposes of this
BACT analysis, the feasibility of CO2 capture, including economic, energy
and environmental impacts will be evaluated first. If CO2 capture is
determined to be cost-effective, storage and beneficial use options will be
evaluated. As established above, the only commercially demonstrated
post-combustion CO2 separation and capture method for similar exhaust
streams is chemical absorption. The general method involves exposing a
gas stream to an aqueous amine solution which reacts with the CO2 in the
gas by an acid-base neutralization reaction to form a soluble carbonate
salt.
This reaction is reversible, allowing the CO2 gas to be liberated by heating
in a separate stripping column. Therefore, the major advantage to this
technique is that, in the ideal situation, the amine is not consumed and
may be continuously recycled through the process. The amine used in this
process is most commonly one of several alkanolamines including MEA.
The technology was originally developed not for the purpose of carbon
sequestration, but in order to "sweeten" natural gas streams by removing
39 International Energy Agency (IEA), IEA Energy Technology Essentials, CO2 Capture and Storage, ETE01, December 2006, Page 3 (available at: http://www.iea.org/techno/essentials1.pdf).

May 2011 Page 40
Gre
enho
use
Gas
es B
est A
vaila
ble
Cont
rol T
echn
olog
y / A
beng
oa B
ioen
ergy
Bio
mas
s of
Kan
sas,
LLC
W
LA P
roje
ct N
o. 1
65-0
09
Revi
sion
No.
0 CO2. More recently, it was successfully adapted for recovery of CO2 from
flue gas of coal-fired electric power generating plants. Currently, there are
three electric power generating stations in the U.S. that capture CO2 from
flue gas and six other major flue gas CO2 capture facilities worldwide. All
nine use MEA as the chemical sorbent.40
The disadvantage of the chemical absorption process is that it would
consume a significant amount of the energy produced. A typical "energy
penalty", which is defined as the percentage of the net power output
consumed for the chemical absorption process installed on a conventional
coal-fired power plant is between 25% to 37%.41 This does not include
transportation and injection costs, which would increase the economic
burden even further. It is expected that the energy penalty for the
biomass-fired boiler would be equivalent to that of a coal-fired power
plant due to the similar CO2 concentration in the flue gases.
Certain factors affect the chemical absorption process implementation
costs. These factors include the following:
• The primary concerns with MEA and other amine solvents are
corrosion in the presence of O2 and other impurities and high
solvent degradation rates due to reactions with SO2 and NOx.
Post-combustion control of SO2 and NOx before the chemical
absorption system can reduce the effects of these pollutants.
• The flue gas should be cooled to around 40 ºC for the CO2
absorption to take place. This requires additional cooling water.
• Steam heat is required to heat the solvent to release the CO2
during regeneration.
• Parasitic power is required for pumping the fluids through the
chemical absorption system.
40 National Energy Technology Laboratory, Degradation of Monoethanolamine Used in Carbon Dioxide Capture from Flue Gas of a Coal-fired Electric Power Generating Station (available at: http://www.netl.doe.gov/publications/proceedings/01/carbon_seq/4b3.pdf) 41 Technical Overview of Carbon Dioxide Capture Technologies for Coal-Fired Power Plants, supra note 18, Page 5.
May 2011 Page 41
Gre
enho
use
Gas
es B
est A
vaila
ble
Cont
rol T
echn
olog
y / A
beng
oa B
ioen
ergy
Bio
mas
s of
Kan
sas,
LLC
W
LA P
roje
ct N
o. 1
65-0
09
Revi
sion
No.
0 • Heat exchangers, scrubber towers, absorption towers, and heaters
are required for the process.
• Replacement cost of the chemical solvent is high because
regeneration is only for a few cycles.
• Degradation and oxidation of the solvents over time produces
products that are corrosive and may require hazardous material
handling procedures.
• Work to date has used chemical absorption on a small scale or
limited applications. Issues involved with scaling up and
expanding the existing technology will need to be addressed.
• Reliable operation of packed towers used in chemical absorption
systems will need to be demonstrated.
Another shortcoming of the chemical absorption process is that it has a
relatively high capital cost. The large size of the major components
significantly influences the capital cost. The footprint of the biomass-fired
stoker boiler's footprint is expected to increase approximately 60% with
the addition of chemical absorption-based CO2 capture.
Because post-combustion CO2 capture has not been commercially
demonstrated on biomass-fired electricity generating systems, there are
no specific reference documents or demonstration projects that can be
relied upon. Site-specific cost estimates for the purpose of constructing a
commercial scale CO2 capture system would require significant time and
engineering investment, as well as an initial bench-scale/pilot test prior to
full scale application. Therefore, for the purposes of this BACT analysis, the
Plains CO2 Reduction (PCOR) Partnership report, Regional Emissions and
Capture Opportunities Assessment – Plains CO2 Reduction (PCOR) Partnership
(Phase II) was relied upon for comparison purposes of the estimates CO2
capture costs presented herein. A copy of the PCOR report has been
included in Appendix A.
Although the state of Kansas is not specifically included in the PCOR
report, ABBK is a member of the PCOR Partnership and the cost analyses

May 2011 Page 42
Gre
enho
use
Gas
es B
est A
vaila
ble
Cont
rol T
echn
olog
y / A
beng
oa B
ioen
ergy
Bio
mas
s of
Kan
sas,
LLC
W
LA P
roje
ct N
o. 1
65-0
09
Revi
sion
No.
0 presented in the report were assumed comparable as the PCOR report
included the neighboring states: Missouri and Nebraska. Capture and
compression costs and power requirements for ethanol plants, gas-
processing plants, and electricity-generating facilities were estimated in
the PCOR report using the Integrated Environmental Control Model
(IECM), Version 5.22 (released January 28, 2008) (IECM, 2008). The IECM is a
desktop computer model that was developed at Carnegie Mellon
University with funding from NETL, which is designed to support a variety
of technology assessment and strategic planning activities for the specific
fossil fuel-fired power plant types: pulverized coal, natural gas combined-
cycle (NGCC), coal-based integrated gasification combined-cycle (IGCC),
and oxyfuel combustion.
The results from the IECM simulations conducted for the PCOR report
show a significant cost and energy penalty for capturing 90% of the CO2
emitted from electricity-generating facilities. The PCOR report used a
minimum 100 MW limit primarily because the economics and power
requirements of capturing CO2 at units smaller than 100 MW would make
electric generation at these units no longer feasible. In addition, the IECM
has a lower estimation boundary level of 100 MW, meaning that values
calculated using the IECM for units smaller than 100 MW may not depict
the true costs and power requirements.
For the purposes of the GHG BACT analysis, the data contained in the
PCOR report was relied upon to fully demonstrate to KDHE that the cost of
add-on CO2 control at the proposed biomass-to-energy system is not
economically feasible. The PCOR report estimated the costs associated
with capture, drying and compression separately from the cost of CO2
transportation by pipeline for sequestration or EOR. Injection costs for
sequestration or any monetary value assigned to the CO2 for EOR have not
been included in the cost or energy estimates.42 Including the cost of
42 Regional Emissions and Capture Opportunities Assessment – Plains CO2 Reduction (PCOR) Partnership Phase II, supra note 26, Pages vi through viii.

May 2011 Page 43
Gre
enho
use
Gas
es B
est A
vaila
ble
Cont
rol T
echn
olog
y / A
beng
oa B
ioen
ergy
Bio
mas
s of
Kan
sas,
LLC
W
LA P
roje
ct N
o. 1
65-0
09
Revi
sion
No.
0 replacement power, the per-ton cost associated with CO2 capture, drying
and compression of 90% of the CO2 produced at the PCOR region's power
plants would be $71 per short ton CO2 avoided.43 The increase in the cost
of producing electricity caused by the capture, compression, and transport
of the CO2 was estimated in the PCOR report to be 159% to 189% with CO2
capture, drying and compression of 90% of the CO2 produced.44
The nearest commercial CO2 pipeline terminus is at Guymon, Oklahoma,
approximately 40 miles south of the proposed facility at the Mobil
Exploration and Producing U.S. Postle Field Unit. ABBK estimated that the
capital investment to install a CO2 pipeline to connect to the Mobil
Exploration and Producing U.S. Postle Field Unit would be $35 per linear
foot, or $7,392,000, excluding right-of-way acquisitions, surge storage
tanks, booster pumps, and operation and maintenance. The preparation
of the CO2 for transport via pipeline will result in additional energy
penalties, as well as additional emissions (including CO2). Because
evaluations of the OPAS are ongoing,45 it has not been fully demonstrated
that geologic sequestration in Kansas is technically feasible, therefore,
transportation via pipeline for EOR is currently the only commercially
demonstrated control option available.
The CO2 value of $45 per metric ton ($41 per short ton) delivered at
pressure to the field is presented as the base case in the NETL report,
Storing CO2 with Enhanced Oil Recovery.46 Other estimates indicate that the
CO2 costs with EOR as low as $10 per short ton. Based on the costs
presented in the PCOR report, the per-ton cost associated with CO2
capture, drying and compression of 90% of the CO2 produced would be
$71 per short ton CO2 avoided. It is assumed that because the proposed
43 Regional Emissions and Capture Opportunities Assessment – Plains CO2 Reduction (PCOR) Partnership Phase II, supra note 26, Table 12. 44 Regional Emissions and Capture Opportunities Assessment – Plains CO2 Reduction (PCOR) Partnership Phase II, supra note 26, Table 13. 45 Kansas Geologic Survey, South-central Kansas CO2 Project website (available at: http://www.kgs.ku.edu/PRS/Ozark/index.html). 46 NETL, Storing CO2 with Enhanced Oil Recovery, DOE/NETL-402/1312/02-07-08, February 7, 2008 (available at: http://www.netl.doe.gov/energy-analyses/pubs/Storing%20CO2%20w%20EOR_FINAL.pdf)

May 2011 Page 44
Gre
enho
use
Gas
es B
est A
vaila
ble
Cont
rol T
echn
olog
y / A
beng
oa B
ioen
ergy
Bio
mas
s of
Kan
sas,
LLC
W
LA P
roje
ct N
o. 1
65-0
09
Revi
sion
No.
0 biomass-to-energy system will be nominally rated at 22 MW and because
the flue gases from biomass combustion will be similar to coal combustion
(similar CO2 concentration, pollutants and control technologies), the PCOR
costs are expected to be very conservative costs for CO2 capture, drying
and compression at the proposed facility.
Comparing the CO2 value of $41 per short ton for EOR to the CO2 capture
cost of $71 per short ton, the implementation of CO2 capture at the ABBK
facility is not cost effective. Further, CO2 capture would result in significant
and adverse energy and environmental impacts due to the following:
• Parasitic consumption of steam and electricity;
• Additional emissions generated during CO2 dehydration,
compression, and transport; and
• Raw material usage for CO2 capture and processing equipment
and construction of a pipeline.
2.4.2.5 Favorable Environmental Impacts Considerations
The November 2010 EPA GHG Guidance, states that, "EPA believes that it is
appropriate for permitting authorities to account for both existing federal
and state policies and their underlying objectives in evaluating the
environmental, energy and economic benefits of biomass fuel. Based on
these considerations, permitting authorities might determine that, with
respect to the biomass component of a facility's fuel stream, certain types
of biomass by themselves are BACT for GHGs."47
Under the Energy Policy Act of 2005 (EPAct 2005), Congress directed the
DOE to carry out a program to demonstrate the commercial application of
integrated biorefineries for the production of biofuels, in particular
ethanol, from lignocellulosic feedstocks. Accordingly, in February 2006,
DOE issued a funding opportunity announcement for the design and
construction of commercial-scale integrated biorefineries intended to
demonstrate the use of a wide variety of lignocellulosic feedstocks to
47 PSD and Title V Permitting Guidance for Greenhouse Gases, supra note13, Page 9.
May 2011 Page 45
Gre
enho
use
Gas
es B
est A
vaila
ble
Cont
rol T
echn
olog
y / A
beng
oa B
ioen
ergy
Bio
mas
s of
Kan
sas,
LLC
W
LA P
roje
ct N
o. 1
65-0
09
Revi
sion
No.
0 produce combinations of liquid transportation fuels (biofuels), bio-based
chemicals, substitutes for petroleum-based feedstocks and products, and
energy in the form of electricity or useful heat (biopower). In that
announcement, DOE also encouraged the use of a wide variety of
lignocellulosic feedstocks, but not those biomass components specifically
grown for food, and encouraged the use of various technologies to collect
and treat the wide variety of biomass feedstocks.
On February 28, 2007, DOE announced the selection of six biorefinery
projects for negotiation of financial assistance awards, one of which was
the ABBK biomass-to-ethanol and biomass-to-energy production facility.
ABBK proposed an innovative approach to biorefinery operations that
would involve production of a biofuel and energy that can be used to
meet energy needs and displace fossil fuels, such as coal and natural gas.
ABBK proposed to locate the facility in Kansas to qualify for state tax
credits for the construction of cellulosic ethanol facilities (Kansas Energy
Development Act of 2006; Kansas Senate Bill 303), which would make the
biorefinery a more viable commercial operation.
2.4.2.6 Establish BACT
ABBK proposes that GHG BACT for the biomass-fired stoker boiler consist
of the following:
• Restriction of the fuel type to biomass that is otherwise considered
to have low to no economic value or benefit (i.e. crop residuals and
waste wood); and/or is a lower impacting crops (i.e. mixed warm
season grasses such as switchgrass); and
• Use of lower GHG-emitting processes and practices through an
energy-efficient design, incorporating cogeneration, process
integration, combustion of co-products, heat recovery and
operational and maintenance monitoring.
These control options are technically feasible for the biomass-fired stoker
boiler and are an inherent part of the facility's design. ABBK proposes that
the BACT limit for the biomass-fired stoker boiler be 0.32 lb CO2e /lb of
steam produced.

May 2011 Page 46
Gre
enho
use
Gas
es B
est A
vaila
ble
Cont
rol T
echn
olog
y / A
beng
oa B
ioen
ergy
Bio
mas
s of
Kan
sas,
LLC
W
LA P
roje
ct N
o. 1
65-0
09
Revi
sion
No.
0 The proposed BACT limit for the biomass-fired stoker boiler is based on the
following:
Steam production rate = 325,000 lb of steam/hr
CO2e emission rate based on the fuel specifications = 109,965 lb CO2e/hr
hr/steamoflb325,000hr/eCOlb109,965
LimitBACTeCO 22 =
producedsteamlb/eCOlb0.34LimitBACTeCO 22 =
2.4.2.7 BACT Compliance
ABBK will record the fuel type and quantity combusted in the boiler.
Feedstock properties, unburned carbon in ash and sorbent reactivity will
be tested weekly. Fuel blends will be reviewed for compliance with the
established emission limits prior to combustion and the gas parameters:
percent oxygen, flow rate, temperature, and pressure, will be monitored.
The boiler will be equipped with a temperature and pressure
compensated steam production flow meter. The flow meter is a
requirement of the biomass-fired boiler's performance specification. The
cogeneration system (biomass-fired boiler and steam turbine generator)
will be subject to a performance test in accordance with ASME PTC-46.
The boiler steam flow will be transmitted to the facility distribution control
system (DCS) and historized. The boiler's CO2 emission (lb CO2/lb steam)
will be calculated in the DCS and available for the operator. The boiler
steam flow can be verified by measuring the boiler feedwater makeup
flow and steam drum blowdown. Both of these streams will be
continuously measured and historized.
The BACT limit proposed is based on a "lb CO2e/lb steam produced" limit
instead of the engineering estimate which used "lb CO2e/MMBtu" because
the steam pressure produced will continuously monitored. ABBK
proposes that that simplest compliance method be based on steam
produced, not the boiler heat input rate. Therefore, all fuel combinations
will be reviewed for compliance with the BACT limit prior to combustion

May 2011 Page 47
Gre
enho
use
Gas
es B
est A
vaila
ble
Cont
rol T
echn
olog
y / A
beng
oa B
ioen
ergy
Bio
mas
s of
Kan
sas,
LLC
W
LA P
roje
ct N
o. 1
65-0
09
Revi
sion
No.
0 using the fuel specifications (as completed in the potential to emit
calculations for the current fuel combinations) and the calculation detailed
above. CO2e-based emissions were determined based on the projected
feedstock consumption using emission factors presented in the
application. The emission limit is based on a maximum potential to emit,
expressed in pounds of CO2e per pound of steam produced, averaged over
30-day rolling periods.
ABBK will also implement a written preventive maintenance program.
ABBK will provide construction specifications, operation and maintenance
records, feedstock records, and other record keeping documents to KDHE
upon request to demonstrate compliance with BACT.
2.5 Fermentation and Distillation BACT Analysis
2.5.1 Source Description
The CO2 generated from the biomass co-fermentation process (Area 16000) will be
routed through the enzymatic hydrolysis fermentation CO2 scrubber (S-18185).
The rated control efficiency will be equal to or greater than 99 percent. The CO2
generated from the biomass ethanol recovery process (Area 18000) will be routed
through the enzymatic hydrolysis distillation vent scrubber (S-18180). The
distillation vent scrubber vent feeds into the enzymatic hydrolysis fermentation
CO2 scrubber (S-18185) for further control efficiency.
The vent streams routed to the scrubber are expected to be saturated with water
since the process tanks contain primarily CO2, other gases (O2/N2) and water.
These vent streams also are expected to contain trace amounts of contaminants
such as ethyl alcohol (ethanol), fuel oils, H2S, NOx, etc. Table 2-9 presents a
comparison of the enzymatic hydrolysis CO2 scrubber (S-18185) vent stream to a
traditional starch fermentation scrubber vent stream.

May 2011 Page 48
Gre
enho
use
Gas
es B
est A
vaila
ble
Cont
rol T
echn
olog
y / A
beng
oa B
ioen
ergy
Bio
mas
s of
Kan
sas,
LLC
W
LA P
roje
ct N
o. 1
65-0
09
Revi
sion
No.
0 Table 2–9
Traditional Starch Fermentation Scrubber and Enzymatic Hydrolysis Fermentation Scrubber Vent Stream Comparison
Typical Starch Fermentation Scrubber
(VB 84 MMGPY) ABBK Scrubber (S-18185)
(30 MMGPY) (lb/hr) (wt.%) (lb/hr) (wt.%) Total 49,199 100.0% 23,424.48 100% Water 747 1.5% 255.48 1.1% Alcohol 2 0.004% 1.28 0.005% By Products 5 0.01% 0.65 0.003% CO2 46,993 95.5% 20,387 ~88% Air 1,453 3.0% 2,548 ~11%
The enzymatic hydrolysis CO2 scrubber (S-18185) CO2 concentration is lower than
a typical starch plant, due to the addition of air during fermentation and the
unique differences of enzymatic hydrolysis fermentation verses traditional starch
fermentation. Additional air is needed for the particular organism used in the
enzymatic hydrolysis fermentation process. The typical starch fermentation
scrubber information was obtained from the facility's scrubber vendor,
Vogelbusch. Vogelbusch engineering data indicates that a typical starch
fermentation scrubber will have a CO2 concentration of 95.5% by weight.
Abengoa Bioenergy of Nebraska, LLC has documented it's starch fermentation
scrubber's typical CO2 concentration is greater than 98% by weight.
The scrubber will be packed-tower wet scrubber, which allow for ethanol vapors
to be collected in order to produce a higher product yield, and consequently the
units control emissions of VOCs, HAPs, organic acids, furfural and higher alcohols.
The scrubber systems will recover more than 99% of the ethanol from the vapor
stream and return the ethanol to the process downstream. The water from the
wet scrubber is pumped back into the process for recycling. The distillation vent
scrubber vent feeds into the enzymatic hydrolysis fermentation CO2 scrubber (S-
18185) for further control efficiency.
2.5.2 GHG BACT Review
The total CO2e-based emissions from the enzymatic hydrolysis production is
approximately 88,400 short ton/yr CO2e. This amount of CO2e-based emissions is

May 2011 Page 49
Gre
enho
use
Gas
es B
est A
vaila
ble
Cont
rol T
echn
olog
y / A
beng
oa B
ioen
ergy
Bio
mas
s of
Kan
sas,
LLC
W
LA P
roje
ct N
o. 1
65-0
09
Revi
sion
No.
0 just over 15% of the total facility-wide CO2e-based emissions. The following
presents the GHG BACT analysis for these sources.
2.5.2.1 Identify Available Control Options
The following control options have been identified and considered in
determining BACT:
• Monitoring enzymatic hydrolysis process efficiency;
• Carbon capture and storage ("CCS", also referred to as "carbon
capture and sequestration")
• Carbon capture for beneficial uses;
• Develop and implement an LDAR program, in accordance with
NSPS, Subpart VVa (40 CFR §60.480a through §60.489a), as
proposed for the other fugitive HAR pollutants: VOC and HAP; and
• Combination of these control options.
There are two broad strategies for reducing GHG emissions from the
scrubber at the proposed facility. The first is to minimize the production of
GHG through monitoring enzymatic hydrolysis process efficiency. The
enzymatic hydrolysis process efficiency is an integral part of the facility's
design and is considered the baseline for this BACT analysis.
The second strategy for reducing GHG emissions is carbon capture and
storage ("CCS", also referred to as "carbon capture and sequestration") or
carbon capture for beneficial uses. Because of the lower CO2
concentration in the scrubber vent stream (approximately 88%), the CCS
and carbon capture for beneficial uses discussion presented in Section 2.4
is applicable. Although the CO2 concentration is 88%, this stream is still
not considered a "high purity CO2 Stream" like other traditional starch
plant fermentation vent streams, where the CO2 concentration is greater
than 95% and usually 98% to 99% before CO2 capture is performed for
commercial applications.
Implementation of an LDAR program is not intended to control emissions
beyond the baseline. The LDAR program is used to monitor equipment

May 2011 Page 50
Gre
enho
use
Gas
es B
est A
vaila
ble
Cont
rol T
echn
olog
y / A
beng
oa B
ioen
ergy
Bio
mas
s of
Kan
sas,
LLC
W
LA P
roje
ct N
o. 1
65-0
09
Revi
sion
No.
0 leaks for repair. For the fermentation and distillation operations, CO2
emissions from equipment leaks were estimated to be less than 1 lb/hr.
2.5.2.2 Eliminate Technically Infeasible Control Options
There were two main options identified for control of CO2 emissions from
the scrubber: 1) monitoring enzymatic hydrolysis process efficiency; and
2) CCS and/or carbon capture for beneficial uses.
Table 2-10 summarizes the technical feasibility/infeasibility determination
discussed in this section.
Table 2–10 GHG BACT Control Technology Technical Feasibility/Infeasibility Determination
Summary for the Fermentation Scrubber
Potentially Available Control Option Determination Result Determination ReasonMonitoring Enzymatic Hydrolysis Process Efficiency
Technically Feasible Inherent part of the facility's design, and considered a baseline control
option. Carbon Capture Using Post-Equipment Capture
Technically Feasible Chemical absorption has been the most widely used method of
commercial CO2 capture and is the primary CO2 capture technology
further analyzed. Carbon Transportation Technically Feasible Technical issues can be addressed
through modern pipeline construction and maintenance
practices. Carbon Storage through Geologic Sequestration
Technically Feasible In Kansas, geologic sequestration of CO2 may be possible in all five of the geologic formations: deep
saline aquifers, coal seams, oil and natural gas reservoirs, oil- and gas-
rich organic shales, and basalt Carbon Storage through Terrestrial Sequestration
Technically Feasible Inherent part of the facility's design, and considered a baseline control
option. Carbon Beneficial Uses Technically Feasible The many different technologies
being investigated for the beneficial use of CO2 vary widely in their stages of development, from those being tested at the bench-
scale, to technologies that are close to commercialization.
Combination of These Control Options Technically Feasible See reasons above.
May 2011 Page 51
Gre
enho
use
Gas
es B
est A
vaila
ble
Cont
rol T
echn
olog
y / A
beng
oa B
ioen
ergy
Bio
mas
s of
Kan
sas,
LLC
W
LA P
roje
ct N
o. 1
65-0
09
Revi
sion
No.
0 The following discusses each of these control options.
Monitoring Enzymatic Hydrolysis Process Efficiency
There are numerous strategies for achieving a highly efficient enzymatic
hydrolysis process. All identified strategies (i.e. control options) listed in
this section are technically feasible for application to the scrubber, and all
are an inherent part of the facility's design.
• CO2 Production Monitoring During Fermentation – This strategy is
the primary GHG BACT control technology option. CO2 production
in fermentation is a function of the yeast and selected micro-
organism. A healthy and optimized organism will produce more
ethanol and less CO2.
• Energy Efficient Heat Integration – The enzymatic hydrolysis
process is integrated with the cogeneration facility to maximize
energy efficiency. This integration is discussed in Section 2.4.
Energy efficient heat integration is more important to the boiler
GHG than the fermentation scrubber.
• Water Recycling – Process-related water will be recycled whenever
possible to reduce the facility's consumption.
• Co-product Production – Valuable co-products will be generated
during the enzymatic hydrolysis process. The valuable
co-products include products such as enzymatic hydrolysis
residuals (including lignin-rich/lignin-lean stillage cake and thin
stillage syrup) and wastewater treatment biogas. These products
can either be sold as a consumable product or combusted as a
supplemental fuel in the biomass-fired boiler.
Carbon Capture
Section 2.4.2.2 details the carbon capture control option technical
feasibility determination. The information presented in Section 2.4.2.2 is
not repeated herein. For the scrubber, the pre-combustion and oxy-
combustion approaches are not applicable. Carbon capture using post-
equipment capture is equivalent to post-combustion capture. The only

May 2011 Page 52
Gre
enho
use
Gas
es B
est A
vaila
ble
Cont
rol T
echn
olog
y / A
beng
oa B
ioen
ergy
Bio
mas
s of
Kan
sas,
LLC
W
LA P
roje
ct N
o. 1
65-0
09
Revi
sion
No.
0 commercially demonstrated method for similar exhaust streams (i.e. vent
streams with low CO2 concentrations) is chemical absorption.
Carbon Transport and Storage
Section 2.4.2.2 details the carbon transport and storage technical
feasibility determination. The information presented in Section 2.4.2.2 is
not repeated herein.
Terrestrial sequestration applies to the scrubber because the emissions
associated with this scrubber are biogenic CO2 emissions. Because the
proposed source will utilize biomass in the production of ethanol, this type
of CO2 storage is essentially being implemented as part of the facility's
design; therefore, terrestrial sequestration is considered a baseline control
option.
Carbon Beneficial Uses
Section 2.4.2.2 details the carbon beneficial uses control option technical
feasibility determination. The information presented in Section 2.4.2.2 is
not repeated herein.
2.5.2.3 Rank Technically Feasible Control Options
Table 2-11 presents the ranked technically feasible control options.
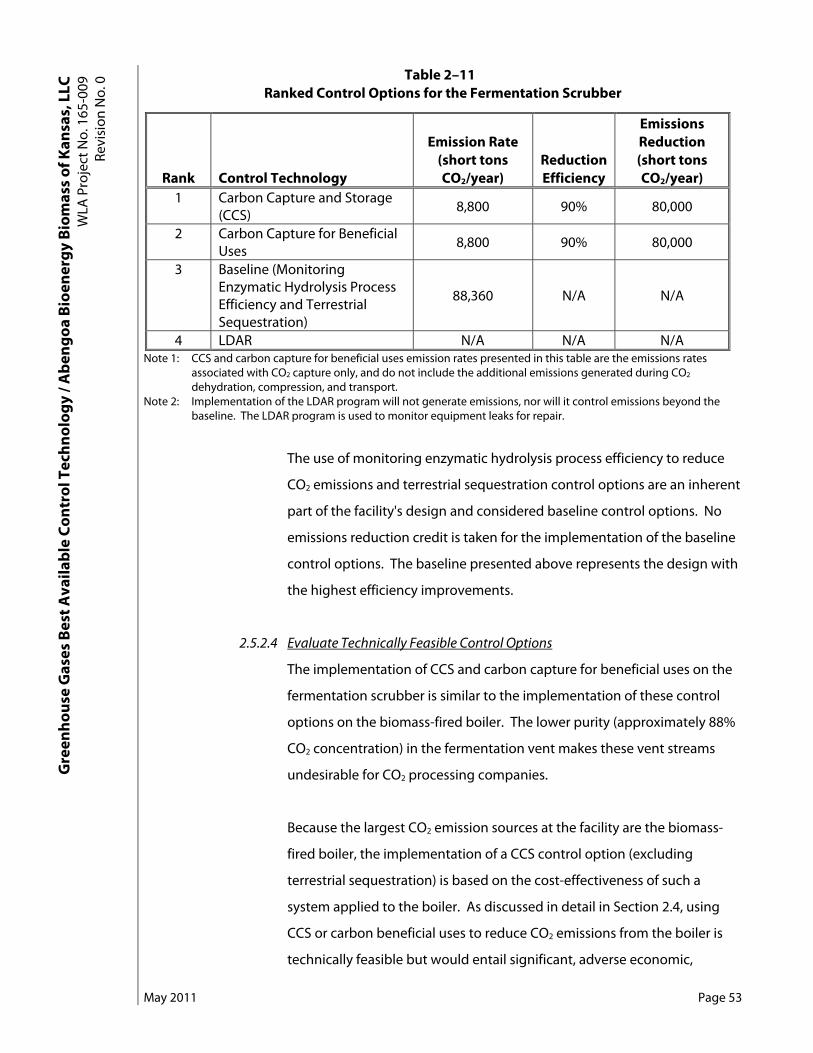
May 2011 Page 53
Gre
enho
use
Gas
es B
est A
vaila
ble
Cont
rol T
echn
olog
y / A
beng
oa B
ioen
ergy
Bio
mas
s of
Kan
sas,
LLC
W
LA P
roje
ct N
o. 1
65-0
09
Revi
sion
No.
0 Table 2–11
Ranked Control Options for the Fermentation Scrubber
Rank Control Technology
Emission Rate (short tons CO2/year)
Reduction Efficiency
Emissions Reduction (short tons CO2/year)
1 Carbon Capture and Storage (CCS)
8,800 90% 80,000
2 Carbon Capture for Beneficial Uses
8,800 90% 80,000
3 Baseline (Monitoring Enzymatic Hydrolysis Process Efficiency and Terrestrial Sequestration)
88,360 N/A N/A
4 LDAR N/A N/A N/A Note 1: CCS and carbon capture for beneficial uses emission rates presented in this table are the emissions rates
associated with CO2 capture only, and do not include the additional emissions generated during CO2 dehydration, compression, and transport.
Note 2: Implementation of the LDAR program will not generate emissions, nor will it control emissions beyond the baseline. The LDAR program is used to monitor equipment leaks for repair.
The use of monitoring enzymatic hydrolysis process efficiency to reduce
CO2 emissions and terrestrial sequestration control options are an inherent
part of the facility's design and considered baseline control options. No
emissions reduction credit is taken for the implementation of the baseline
control options. The baseline presented above represents the design with
the highest efficiency improvements.
2.5.2.4 Evaluate Technically Feasible Control Options
The implementation of CCS and carbon capture for beneficial uses on the
fermentation scrubber is similar to the implementation of these control
options on the biomass-fired boiler. The lower purity (approximately 88%
CO2 concentration) in the fermentation vent makes these vent streams
undesirable for CO2 processing companies.
Because the largest CO2 emission sources at the facility are the biomass-
fired boiler, the implementation of a CCS control option (excluding
terrestrial sequestration) is based on the cost-effectiveness of such a
system applied to the boiler. As discussed in detail in Section 2.4, using
CCS or carbon beneficial uses to reduce CO2 emissions from the boiler is
technically feasible but would entail significant, adverse economic,

May 2011 Page 54
Gre
enho
use
Gas
es B
est A
vaila
ble
Cont
rol T
echn
olog
y / A
beng
oa B
ioen
ergy
Bio
mas
s of
Kan
sas,
LLC
W
LA P
roje
ct N
o. 1
65-0
09
Revi
sion
No.
0 environmental and energy impacts due to increased fuel usage in order to
meet the steam and electric load requirements of the CCS systems.
Therefore, the use of CCS and carbon beneficial uses technologies were
determined not to be cost effective for control of CO2 from the boiler and
subsequently, are not cost effective for the fermentation CO2 emissions,
which are less than 88,360 short ton/yr CO2e.
An LDAR program is technically feasible control option for this equipment;
therefore, no further evaluation of this control is needed.
2.5.2.5 Establish BACT
ABBK proposes that GHG BACT for the fermentation scrubber vent stream
consist of the following:
• Monitoring enzymatic hydrolysis process efficiency, incorporating
the CO2 production monitoring during fermentation, energy
efficient heat integration, water recycling, and co-product
production that make the overall process efficient and economical.
• Develop and implement a written LDAR program.
These control options are technically feasible for the enzymatic hydrolysis
process and are an inherent part of the facility's design. ABBK proposes
that the BACT limit be 5.89 lb CO2e/gal anhydrous ethanol produced for
the enzymatic hydrolysis fermentation CO2 scrubber stack (EP-18185),
averaged over a 30-day rolling period. These proposed emission limit is
based on the average continuous flow CO2 concentrations.
2.5.2.6 BACT Compliance
The enzymatic hydrolysis final design has not been established; however,
as part of the BACT compliance demonstration, ABBK proposes to
complete a Value Engineering Report that will document the enzymatic
hydrolysis design parameters and efficiency variables. CO2e emissions will
be determined based on the required stack testing to be completed upon
startup. Continuous stack monitoring equipment will be installed to
monitor operational indicators and CO2. Emissions will be averaged over a
30-day rolling period for compliance.
May 2011 Page 55
Gre
enho
use
Gas
es B
est A
vaila
ble
Cont
rol T
echn
olog
y / A
beng
oa B
ioen
ergy
Bio
mas
s of
Kan
sas,
LLC
W
LA P
roje
ct N
o. 1
65-0
09
Revi
sion
No.
0 ABBK also proposes to develop and implement a written LDAR program
modified from the requirements of 40 CFR Part 60, Subpart VVa, Standards
of Performance for Equipment Leaks of VOC in the Synthetic Organic
Chemicals Manufacturing Industry for which Construction, Reconstruction,
or Modification Commenced After November 7, 2006, to be source- and
pollutant-type specific.
ABBK will provide construction specifications, value engineer calculations
and analyses, and operation and maintenance records to KDHE upon
request to demonstrate compliance with BACT. ABBK will also provide a
copy of the LDAR program and documentation regarding observations
and/or repairs made in accordance with the LDAR program to KDHE upon
request to demonstrate compliance with BACT.
2.6 Flare BACT Analysis
2.6.1 Source Emissions
The facility design will incorporate a flare (EP-09001) for control of process vents
flow, biogas and product loadout vapors. The vent streams will normally be
vented to the biomass-fired boiler for combustion; however these streams may be
vented to the flare as needed for up to 3,960 hours per year.
2.6.2 GHG BACT Review
The flare will have the potential to emit biogenic and anthropogenic GHG
emissions (CO2, CH4, and N2O) because it is used to combust process vent streams,
biogas, and product loadout vapors. Combustion of the process vent streams,
biogas, ethanol, natural gas and gasoline in the flare results in the emissions of
NOx, SO2, CO, VOC, PM/PM10/PM2.5 and biogenic and anthropogenic GHG
emissions (CO2, CH4, and N2O). Flaring destroys 2,119 lb/hr CH4 (44,503 lb/hr CO2e),
and generates 10,170 lb/hr CO2, for a total net reduction of CO2e equal to 34,333
lb/hr. Total CO2e emissions from this source (including emissions from natural gas
combustion in the flare's pilot) are 10,185 lb/hr. The following presents the GHG
BACT analysis for this source.

May 2011 Page 56
Gre
enho
use
Gas
es B
est A
vaila
ble
Cont
rol T
echn
olog
y / A
beng
oa B
ioen
ergy
Bio
mas
s of
Kan
sas,
LLC
W
LA P
roje
ct N
o. 1
65-0
09
Revi
sion
No.
0 2.6.2.1 Identify Available Control Options
The flare is incorporated in the process design as a type of control
technology. Because the combustion of biogas in a flare was selected as
BACT for all other NSR pollutants, there was no consideration of other
combustion controls performed in this analysis. The following control
options have been identified and considered in determining BACT:
• Flare; and
• Develop and implementation of an LDAR program, similar to NSPS,
Subpart VVa (40 CFR §60.480a through §60.489a), and modified to
be source- and pollutant-type specific.
There are no effective combustion controls to reduce the GHG emissions
from flares, and there are currently no available post-combustion controls.
The only achievable technological approach to reducing GHG emissions
from the flare is to use the most efficient flare that meets the final design
requirements.
2.6.2.2 Eliminate Technically Infeasible Control Options
There were two options identified for control of CO2 emissions from the
flare: 1) low-carbon fuel; and 2) energy efficient design. The baseline is
fuel type restriction and incorporation of energy efficient construction and
operation principles into the flare's design. The baseline is the top
performing control options identified. The following discusses each of
these control options.
Fuel Type Restriction (Low-Carbon Fuel)
The flare will combust biogas as the primary fuel and natural gas in the
pilot. Biogas has the lowest direct GHG emissions of all common fuels.48
Natural gas has the lowest direct GHG emissions of all common fuels,
excluding biogas, as discussed in Section 2.5.2.2. Carbon dioxide is a
common impurity in natural gas which must be removed to improve the
heating value of the gas or to meet pipeline specifications. Pipeline grade
48 General Reporting Protocol, Version 3.1, supra note 39.

May 2011 Page 57
Gre
enho
use
Gas
es B
est A
vaila
ble
Cont
rol T
echn
olog
y / A
beng
oa B
ioen
ergy
Bio
mas
s of
Kan
sas,
LLC
W
LA P
roje
ct N
o. 1
65-0
09
Revi
sion
No.
0 natural gas is "sweetened" by the manufacturer and no additional onsite
treatment of pipeline grade natural gas will further reduce CO2.
Energy Efficient Design
There are numerous strategies for achieving a highly energy efficient
design of a new flare. Design of the flare is dependent on the final process
design of the facility. Specifically, the flare will be equipped with an
electric igniter and will be a smoke-less design.
2.6.2.3 Rank Technically Feasible Control Options
The only achievable technological approach to reducing GHG emissions
from the flare is to use the most efficient flare that can perform to the
specification required by the facility's process. There are no effective
combustion or post-combustion controls to reduce the GHG emissions
from the 51.10 MMBtu/hr flare.
2.6.2.4 Evaluate Technically Feasible Control Options
As there are no other control technologies to choose from, no additional
steps in the top-down BACT analysis are required for the selection of these
control technologies as BACT. Also, an LDAR program is technically
feasible control option for this equipment; therefore, no further evaluation
of this control is needed.
2.6.2.5 Establish BACT
ABBK proposes that GHG BACT for the flare consist of the following:
• Use of lower GHG-emitting processes and practices through an
energy-efficient design design, incorporating a fuel efficient flare
pilot; and
• Develop and implement a written LDAR program.
ABBK proposes that the process vents flow, biogas flow and product
loadout vapors will be inferred based on flow measurements upstream of
the flare diverting valve and diverting valve position. ABBK further
proposes that the pilot natural gas usage records be based on the vendor

May 2011 Page 58
Gre
enho
use
Gas
es B
est A
vaila
ble
Cont
rol T
echn
olog
y / A
beng
oa B
ioen
ergy
Bio
mas
s of
Kan
sas,
LLC
W
LA P
roje
ct N
o. 1
65-0
09
Revi
sion
No.
0 engineering calculations for the pilot's natural gas demand. No additional
natural gas monitoring at the flare is proposed.
These control options are technically feasible for the flare and are an
inherent part of the facility's design.
2.6.2.6 BACT Compliance
ABBK proposes the use of the top performing control technology to
control GHG emissions from the flare. The facility will demonstrate
compliance with the BACT limit by recording natural gas fuel usage and
using the emissions factors presented in the application to determine
resulting CO2e emissions. Because the natural gas fuel usage can be
accurately measured, and the amount of GHG equivalents can be
calculated precisely based on well-established emissions factors, no other
direct monitoring of GHG emissions is proposed. The emission factors
presented in the application will be relied upon to demonstrate
compliance with the proposed BACT limit.
ABBK also proposes to develop and implement a written LDAR program
modified from the requirements of 40 CFR Part 60, Subpart VVa, Standards
of Performance for Equipment Leaks of VOC in the Synthetic Organic
Chemicals Manufacturing Industry for which Construction, Reconstruction,
or Modification Commenced After November 7, 2006, to be source- and
pollutant-type specific.
ABBK will provide construction specifications, operation and maintenance
records, and fuel usage records to KDHE upon request to demonstrate
compliance with BACT. ABBK will also provide a copy of the LDAR
program and documentation regarding observations and/or repairs made
in accordance with the LDAR program to KDHE upon request to
demonstrate compliance with BACT.
May 2011 Page 59
Gre
enho
use
Gas
es B
est A
vaila
ble
Cont
rol T
echn
olog
y / A
beng
oa B
ioen
ergy
Bio
mas
s of
Kan
sas,
LLC
W
LA P
roje
ct N
o. 1
65-0
09
Revi
sion
No.
0 2.7 Firewater Pump Engine
2.7.1 Source Emissions
One 460 horsepower (Hp) (343 kilowatt (kW)) firewater pump engine will be
installed at the facility to protect personnel and equipment in the event of a fire.
The firewater pump engine will combust diesel fuel and meet the New Source
Performance Standard (NSPS) regulation, 40 CFR Part 60, Subpart IIII, Standards of
Performance for Stationary Compression Ignition (CI) Internal Combustion Engines
(ICEs). The emergency engine is assumed to operate less than 100 hours per year
for maintenance checks and readiness testing to qualify as emergency engines
under NSPS Subpart IIII (40 CFR §60.4211(e)).
2.7.2 GHG BACT Review
The emergency diesel firewater pump engine will have the potential to emit
anthropogenic GHG emissions (CO2, CH4, and N2O) because it combusts a
hydrocarbon fuel (diesel). The following presents the GHG BACT analysis for this
source.
2.7.2.1 Identify Available Control Options
There are no effective combustion controls to reduce the GHG emissions
from internal combustion engines, and there are currently no available
post-combustion controls. The only achievable technological approach to
reducing GHG emissions from the firewater pump engine is to use the
most efficient engine that meets the stringent National Fire Protection
Association (NFPA) standards for reserve horsepower capacity, engine
cranking systems, engine cooling systems, fuel type's instrumentation and
control and exhaust systems.
2.7.2.2 Eliminate, Rank and Evaluate Technically Feasible Control Options
The only achievable technological approach to reduce GHG emissions
from the firewater pump engine is to select the most fuel-efficient
NFPA-20 certified firewater pump engine available.
As there is only one control technology to choose from, no additional
steps in the top-down BACT analysis are required for the selection of that

May 2011 Page 60
Gre
enho
use
Gas
es B
est A
vaila
ble
Cont
rol T
echn
olog
y / A
beng
oa B
ioen
ergy
Bio
mas
s of
Kan
sas,
LLC
W
LA P
roje
ct N
o. 1
65-0
09
Revi
sion
No.
0 control technology.
2.7.2.3 Establish BACT
The firewater pump engine to be selected for use at the facility will be the
most fuel-efficient NFPA-20 certified firewater pump engine available. The
specific make and model has not been established; however, a review of
similar sized engines has indicated that a fuel consumption rate of no
more than 20.3±5% gallons per hour is the most efficient rating available
for a 460 Hp engine with a rated speed of 1760 rpm and an EPA Tier 3
emission rating.
The firewater pump engine may be used for up to 100 hours per year for
reliability testing and maintenance purposes. Use of the engine at
20.3±5% gallons of diesel fuel per hour for up to 100 hours per year would
result in total GHG emissions from the firewater pump engine of 119.4
short ton/yr CO2e. ABBK requests that the fuel consumption GHG BACT
limit include a 5% variability to allow for selection of the engine with
lowest overall EPA Tier 3 emissions at the time of purchase.
2.7.2.4 BACT Compliance
The facility will demonstrate compliance with the BACT limit by recording
fuel usage and using the emissions factors presented in the application to
determine resulting CO2e emissions. Because fuel usage can be accurately
measured, and the amount of GHG equivalents can be calculated precisely
based on well-established emissions factors, no other direct monitoring of
GHG emissions is proposed. The emission factors presented in the
application will be relied upon to demonstrate compliance with the
proposed BACT limit. ABBK will provide a copy of the manufacturer's fuel
efficiency rating to KDHE upon request to also demonstrate compliance
with BACT.
Appendix A
Energy & Environmental Research Center, University of North Dakota, Regional Emissions and Capture Opportunities Assessment – Plains CO2 Reduction (PCOR) Partnership Phase II, 2010-EERC-08-15, December 2009.

REGIONAL EMISSIONS AND CAPTURE OPPORTUNITIES ASSESSMENT – PLAINS CO2 REDUCTION (PCOR) PARTNERSHIP (PHASE II) Value-Added Report Prepared for: Andrea T. McNemar U.S. Department of Energy National Energy Technology Laboratory 3610 Collins Ferry Road PO Box 880 Morgantown, WV 26507-0880 Cooperative Agreement No. DE-FC26-05NT42592
Prepared by:
Melanie D. Jensen Brandon M. Pavlish
Peng Pei Kerryanne M.B. Leroux
Edward N. Steadman John A. Harju
Energy & Environmental Research Center
University of North Dakota 15 North 23rd Street, Stop 9018
Grand Forks, ND 58202-9018
2010-EERC-08-15 December 2009 Approved
This report replaces Deliverable D44 entitled “Plains CO2 Reduction (PCOR) Partnership (Phase II) Task 9 Deliverable D44 – Best Practice Manual: Regional Sequestration Opportunities,” which was submitted to DOE on July 31, 2008.

DISCLAIMER This report was prepared as an account of work sponsored by an agency of the United States Government. Neither the United States Government, nor any agency thereof, nor any of their employees makes any warranty, express or implied, or assumes any legal liability or responsibility for the accuracy, completeness, or usefulness of any information, apparatus, product, or process disclosed or represents that its use would not infringe privately owned rights. Reference herein to any specific commercial product, process, or service by trade name, trademark, manufacturer, or otherwise does not necessarily constitute or imply its endorsement, recommendation, or favoring by the United States Government or any agency thereof. The views and opinions of authors expressed herein do not necessarily state or reflect those of the United States Government or any agency thereof. This report is available to the public from the National Technical Information Service, U.S. Department of Commerce, 5285 Port Royal Road, Springfield, VA 22161; phone orders accepted at (703) 487-4650. EERC DISCLAIMER LEGAL NOTICE This research report was prepared by the Energy & Environmental Research Center (EERC), an agency of the University of North Dakota, as an account of work sponsored by the U.S. Department of Energy. Because of the research nature of the work performed, neither the EERC nor any of its employees makes any warranty, express or implied, or assumes any legal liability or responsibility for the accuracy, completeness, or usefulness of any information, apparatus, product, or process disclosed or represents that its use would not infringe privately owned rights. Reference herein to any specific commercial product, process, or service by trade name, trademark, manufacturer, or otherwise does not necessarily constitute or imply its endorsement or recommendation by the EERC.

i
TABLE OF CONTENTS LIST OF FIGURES ....................................................................................................................... iii LIST OF TABLES .......................................................................................................................... v EXECUTIVE SUMMARY ........................................................................................................... vi INTRODUCTION .......................................................................................................................... 1 REGIONAL SOURCE TYPES ...................................................................................................... 2 COST OF CAPTURING CO2 IN THE PCOR PARTNERSHIP REGION ................................... 5
Overview of Capture Technologies ....................................................................................... 5 Absorption Processes ............................................................................................................ 6 Application of Chemical Absorption Technology to PCOR Partnership Point Sources ...... 9
THE COST OF CO2 CAPTURE .................................................................................................. 10
Ethanol Plants ...................................................................................................................... 11 CO2 Emission Reduction Potential ............................................................................ 12 Energy Consumption During Capture of CO2 from the PCOR Partnership Region’s Ethanol Plants ......................................................................... 12 Extent and Cost of CO2 Capture at Ethanol Plants in the PCOR Partnership Region ..................................................................................................... 13
Gas-Processing Facilities .................................................................................................... 15 CO2 Emission Reduction Potential ............................................................................ 15
Electric Utilities ................................................................................................................... 17 CO2 Emission Reduction Potential ............................................................................ 17 Regional Summary of CO2 Emission Reduction Potential ........................................ 17 Energy Consumption During CO2 Capture ............................................................... 21 Extent and Cost of CO2 Capture at Electric Utilities Within the PCOR Partnership Region ..................................................................................................... 25
THE COST OF TRANSPORTING CO2 TO A GEOLOGIC SEQUESTRATION SITE ........... 30 TOTAL COST OF WIDE-SCALE CCS DEPLOYMENT IN THE PCOR PARTNERSHIP REGION ............................................................................................................ 34 SUMMARY AND CONCLUSIONS ........................................................................................... 36 REFERENCES ............................................................................................................................. 38 MODEL SIMULATIONS OF THE CAPTURE OF CO2 FROM ELECTRICITY- GENERATING STATIONS FOR EACH STATE OR PROVINCE WITHIN THE PCOR PARTNERSHIP REGION ........................................................................ Appendix A
Continued . . .
ii
TABLE OF CONTENTS (continued) PROCEDURES USED TO ESTIMATE CAPTURE, DRYING, AND COMPRESSION COSTS AT ETHANOL PLANTS AND ELECTRICITY- GENERATING FACILITIES ....................................................................................... Appendix B COMPARISON OF COSTS AND ADDITIONAL ELECTRICAL REQUIREMENTS FOR CO2 CAPTURE FROM ETHANOL PLANTS .................... Appendix C DATA USED TO GENERATE CHARTS SUMMARIZING CO2 CAPTURE AT ELECTRICITY-GENERATING FACILITIES ...................................................... Appendix D SUMMARY OF CO2 PIPELINE ROUTES FOR THE PCOR PARTNERSHIP STATES AND PROVINCES ........................................................................................ Appendix E

iii
LIST OF FIGURES 1 Location and relative output for the PCOR Partnership region’s major
stationary CO2 sources .......................................................................................................... 3 2 Number of CO2 sources for each state or province, broken down by major
source category ...................................................................................................................... 4 3 CO2 emissions for each state or province, broken down by major source category ............. 5 4 CO2 capture technology options ............................................................................................ 6 5 Generic liquid scrubbing system for CO2 capture ................................................................. 7 6 Percentage of CO2 emissions from ethanol plants contributed by each state/province
with at least one ethanol plant that produces >15,000 tons/yr ............................................ 15 7 Summary of the total amount of MW considered for CO2 capture in each
state or province .................................................................................................................. 18 8 Total amount of CO2 produced (in MMtons/yr) by electricity-generating stations
considered for CO2 capture on a state/province basis ......................................................... 19 9 Map showing the location and range of CO2 emissions of the electricity-
generating stations larger than 100 MW in the PCOR Partnership region ......................... 20 10 Graphical summary of the costs and energy penalty associated with implementation
of CO2 capture at electricity-generating stations larger than 100 MW in the PCOR Partnership region ................................................................................................................ 23
11 Total CO2 captured from all electric generation stations larger than 100 MW
in the PCOR Partnership region .......................................................................................... 23 12 Replacement power capital cost as a function of CO2 capture rate for two
power generation methods and their average ...................................................................... 24 13 Comparison of CO2 capture cost for all of the states/provinces in the
PCOR Partnership region on a dollars-per-ton-CO2-captured basis for various capture rates ......................................................................................................................... 26
14 Comparison of total annual CO2 capture cost for all of the states/provinces
in the PCOR Partnership region for various capture rates .................................................. 26 15 A comparison of the energy required for CO2 capture in each state/province
in the PCOR Partnership region for various capture rates .................................................. 27
Continued…

iv
LIST OF FIGURES (continued)
16 A comparison of the energy penalties incurred during CO2 capture for each state/province in the PCOR Partnership region for various capture rates ................... 28
17 Comparison of the total amount of CO2 that could be captured for each
state/province in the PCOR Partnership region for various capture rates ........................... 28 18 Comparison of the percentage of CO2 reduced from all electricity-generating
stations in each state/province in the PCOR Partnership region when CO2 capture is implemented at the large (100 MW+) electricity-generating stations ............................. 29
19 Comparison of the percentage of CO2 reduced from all sources by implementing
CO2 capture at the large (100 MW+) electric generating stations for each state/province within the PCOR Partnership region ............................................................ 30
20 The illustrative PCOR Partnership pipeline network routes ............................................... 33

v
LIST OF TABLES 1 Common Applications for CO2 Capture Technologies ......................................................... 6 2 Various PCOR Partnership Industries and Their Capture Technology Matches ................ 10 3 Energy Required to Capture CO2 from Ethanol Plants ....................................................... 13 4 Ranges of Costs to Capture, Dry, and Compress CO2 Produced at the
PCOR Partnership Region’s Ethanol Plants ........................................................................ 14 5 Total Annual Cost to Capture CO2 at the PCOR Partnership’s Ethanol Plants .................. 14 6 CO2 Produced During Gas-Processing Activities in the PCOR Partnership Region .......... 16 7 Energy Required and Cost Associated with Drying and Compression
of the CO2 Produced During Natural Gas-Processing Activities ........................................ 17 8 Summary of Results for Implementing CO2 Capture on Electricity-
Generating Stations Larger than 100 MW .......................................................................... 22 9 EIA Assumed Capital Costs of New Electricity-Generating Stations ................................ 25 10 Geologic Sinks in Closest Proximity to PCOR Partnership CO2 Point Sources ................. 31 11 Regional Pipeline Network Summary ................................................................................. 32 12 Annualized Cost of Various CCS Scenarios in the PCOR Partnership Region .................. 35 13 Estimated Increases in COE Due to Capture of CO2 .......................................................... 36

vi
REGIONAL EMISSIONS AND CAPTURE OPPORTUNITIES ASSESSMENT – PLAINS CO2 REDUCTION (PCOR) PARTNERSHIP (PHASE II)
Melanie D. Jensen, Energy & Environmental Research Center
Brandon M. Pavlish, Energy & Environmental Research Center Peng Pei, Energy & Environmental Research Center
Kerryanne M.B. Leroux, Energy & Environmental Research Center Edward N. Steadman, Energy & Environmental Research Center
John A. Harju, Energy & Environmental Research Center
December 2009 EXECUTIVE SUMMARY The PCOR Partnership region is expansive, covering the states of Iowa, Minnesota, Missouri, Nebraska, North Dakota, South Dakota, Wisconsin, the Powder River Basin portion of the states of Montana and Wyoming, and the Canadian provinces of Alberta, Saskatchewan, Manitoba, and the northeastern corner of British Columbia. The geographic and socioeconomic diversity of the region is reflected in the variable nature of the carbon dioxide (CO2) sources found there. Over 925 point sources emitting at least 15,000 short tons/yr have been identified for the PCOR Partnership region. The CO2 is emitted during electricity generation; energy exploration and production activities; agriculture; fuel, chemical, and ethanol production; and various manufacturing and industrial activities. The majority of the region’s emissions come from just a few source types. While the CO2 emissions from the individual PCOR Partnership point sources are similar to those from sources located around the United States, the wide range of source types within the PCOR Partnership region offers the opportunity to evaluate the capture, separation, and transportation of CO2 in many different scenarios. The earliest deployment is likely to feature the capture, dehydration, compression, and pipeline transportation of CO2 from the “easiest” sources: primarily gas-processing plants and the fermentation step of ethanol plants. This will likely be followed by capture, dehydration, compression, and pipeline transportation of the CO2 produced during coal combustion at the region’s electricity generation facilities, as these are the largest sources of CO2 in the region. Several processes have been or are being developed to separate and remove CO2 from flue gas streams, with selection of a particular technology based primarily upon the pressure and concentration of CO2 in the gas stream. The technology that is most likely to be employed for capture at the electrical power-generating stations and other industrial applications is chemical absorption. Amine scrubbing will probably be used as it is a commercial (and, therefore, better-defined) technology, although some facilities may choose to apply an ammonia scrubbing system
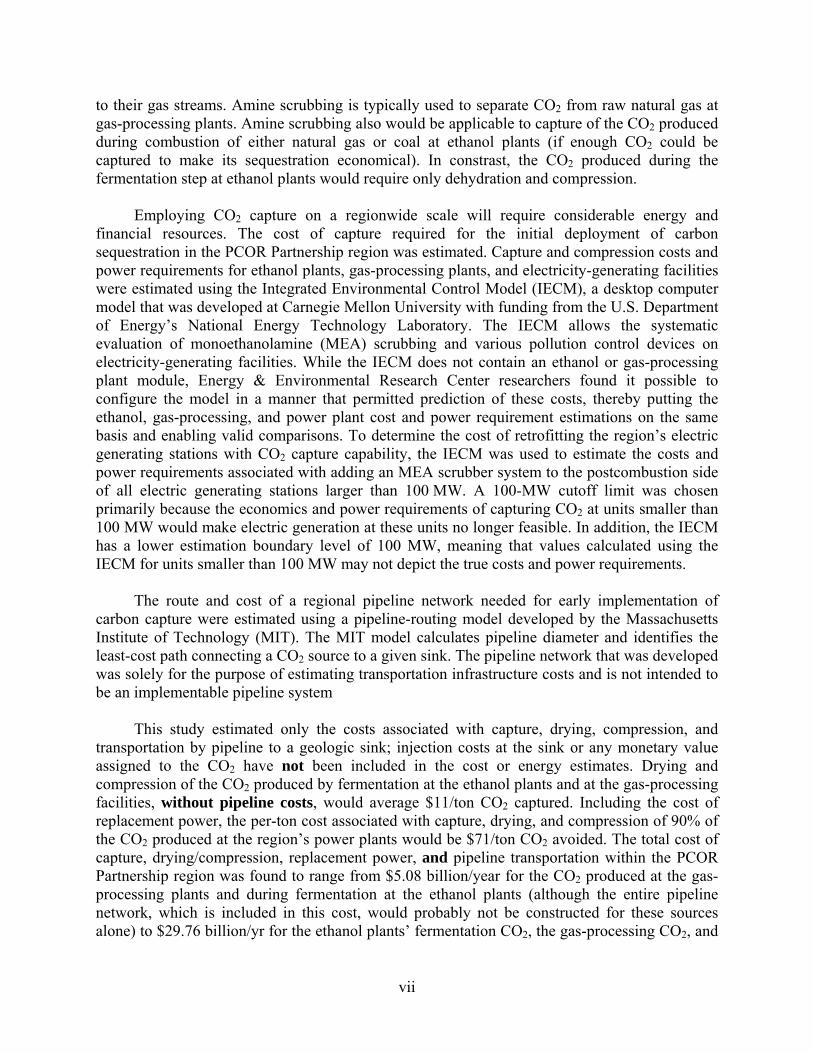
vii
to their gas streams. Amine scrubbing is typically used to separate CO2 from raw natural gas at gas-processing plants. Amine scrubbing also would be applicable to capture of the CO2 produced during combustion of either natural gas or coal at ethanol plants (if enough CO2 could be captured to make its sequestration economical). In constrast, the CO2 produced during the fermentation step at ethanol plants would require only dehydration and compression. Employing CO2 capture on a regionwide scale will require considerable energy and financial resources. The cost of capture required for the initial deployment of carbon sequestration in the PCOR Partnership region was estimated. Capture and compression costs and power requirements for ethanol plants, gas-processing plants, and electricity-generating facilities were estimated using the Integrated Environmental Control Model (IECM), a desktop computer model that was developed at Carnegie Mellon University with funding from the U.S. Department of Energy’s National Energy Technology Laboratory. The IECM allows the systematic evaluation of monoethanolamine (MEA) scrubbing and various pollution control devices on electricity-generating facilities. While the IECM does not contain an ethanol or gas-processing plant module, Energy & Environmental Research Center researchers found it possible to configure the model in a manner that permitted prediction of these costs, thereby putting the ethanol, gas-processing, and power plant cost and power requirement estimations on the same basis and enabling valid comparisons. To determine the cost of retrofitting the region’s electric generating stations with CO2 capture capability, the IECM was used to estimate the costs and power requirements associated with adding an MEA scrubber system to the postcombustion side of all electric generating stations larger than 100 MW. A 100-MW cutoff limit was chosen primarily because the economics and power requirements of capturing CO2 at units smaller than 100 MW would make electric generation at these units no longer feasible. In addition, the IECM has a lower estimation boundary level of 100 MW, meaning that values calculated using the IECM for units smaller than 100 MW may not depict the true costs and power requirements. The route and cost of a regional pipeline network needed for early implementation of carbon capture were estimated using a pipeline-routing model developed by the Massachusetts Institute of Technology (MIT). The MIT model calculates pipeline diameter and identifies the least-cost path connecting a CO2 source to a given sink. The pipeline network that was developed was solely for the purpose of estimating transportation infrastructure costs and is not intended to be an implementable pipeline system This study estimated only the costs associated with capture, drying, compression, and transportation by pipeline to a geologic sink; injection costs at the sink or any monetary value assigned to the CO2 have not been included in the cost or energy estimates. Drying and compression of the CO2 produced by fermentation at the ethanol plants and at the gas-processing facilities, without pipeline costs, would average $11/ton CO2 captured. Including the cost of replacement power, the per-ton cost associated with capture, drying, and compression of 90% of the CO2 produced at the region’s power plants would be $71/ton CO2 avoided. The total cost of capture, drying/compression, replacement power, and pipeline transportation within the PCOR Partnership region was found to range from $5.08 billion/year for the CO2 produced at the gas-processing plants and during fermentation at the ethanol plants (although the entire pipeline network, which is included in this cost, would probably not be constructed for these sources alone) to $29.76 billion/yr for the ethanol plants’ fermentation CO2, the gas-processing CO2, and

viii
90% of the CO2 produced by the electricity-generating stations of the region that are larger than 100 MW. On a per-ton basis, the second scenario would cost $71/ton. These two scenarios would reduce the region’s point-source CO2 emissions by 7% and 61%, respectively. The increase in the cost of producing electricity caused by the capture, compression, and transport of the CO2 is estimated to be 34% to 189%. (The cost of producing electricity is only a portion of the retail cost of electricity paid by consumers.) Maximizing the value-added benefits associated with enhanced oil recovery as a means of CO2 sequestration will help to offset these costs. Gaining experience through large-scale demonstrations and the earliest applications of CCS is likely to reduce the costs, as will improvements in existing capture technologies and development of new capture, compression, and pipeline concepts. The estimated high cost of the capture, compression, and pipeline network required for effective implementation of CCS as a means to reduce CO2 emissions illustrates that additional research for cost-effective capture and compression technologies and judicious siting of pipeline networks is necessary, if the approach is to be implemented with minimal financial hardship on the region’s utilities, industries, and consumers.

1
REGIONAL EMISSIONS AND CAPTURE OPPORTUNITIES ASSESSMENT – PLAINS CO2 REDUCTION (PCOR) PARTNERSHIP (PHASE II)
Melanie D. Jensen, Energy & Environmental Research Center
Brandon M. Pavlish, Energy & Environmental Research Center Peng Pei, Energy & Environmental Research Center
Kerryanne M.B. Leroux, Energy & Environmental Research Center Edward N. Steadman, Energy & Environmental Research Center
John A. Harju, Energy & Environmental Research Center
December 2009 INTRODUCTION This report presents a preliminary economic assessment of the most likely early wide-scale deployment of carbon sequestration in the PCOR Partnership region as a greenhouse gas management strategy. Included in the assessment are costs associated with capture, compression, and pipeline transport of the CO2. The costs of injection at geologic sinks are not included nor is any monetary value that might be associated with the sale of the carbon dioxide (CO2) for enhanced oil recovery (EOR) purposes. The PCOR Partnership region is expansive, covering the states of Iowa, Minnesota, Missouri, Nebraska, North Dakota, South Dakota, Wisconsin, the Powder River Basin portion of the states of Montana and Wyoming, and the Canadian provinces of Alberta, Saskatchewan, Manitoba, and the northeastern corner of British Columbia. The upper Mississippi River Valley and the western shores of the Great Lakes are home to large coal-fired electrical generators that power the manufacturing plants and breweries of St. Louis, Minneapolis–St. Paul, and Milwaukee. Coal-fired power plants, natural gas-processing plants, ethanol plants, and refineries located in the prairies and badlands of the north-central United States and central Canada further fuel the industrial and domestic needs of cities throughout North America. The PCOR Partnership region is also home to much of the world’s most fertile agricultural lands. The geographic and socioeconomic diversity of the region is reflected in the variable nature of the CO2 sources found there. Over 925 point sources emitting at least 15,000 short tons/yr have been identified for the PCOR Partnership region using various U.S. Environmental Protection Agency and Environment Canada databases. The CO2 is emitted during the following:
• Electricity generation • Energy exploration and production activities • Agriculture
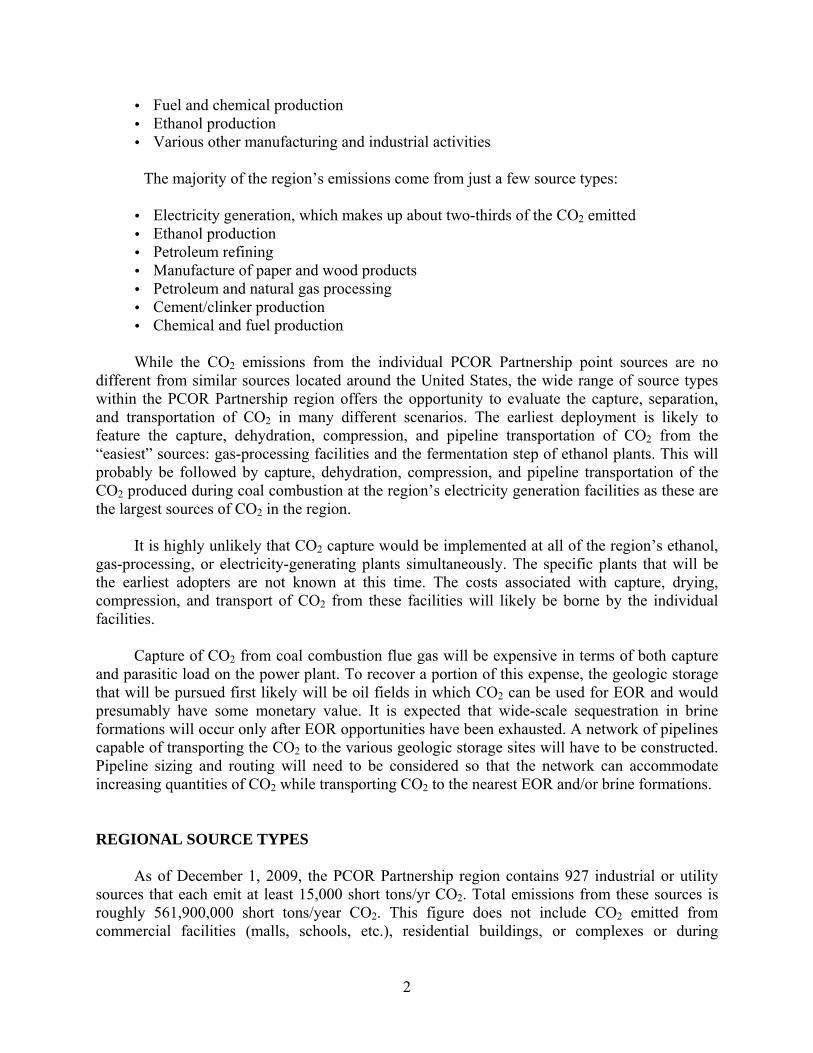
2
• Fuel and chemical production • Ethanol production • Various other manufacturing and industrial activities
The majority of the region’s emissions come from just a few source types:
• Electricity generation, which makes up about two-thirds of the CO2 emitted • Ethanol production • Petroleum refining • Manufacture of paper and wood products • Petroleum and natural gas processing • Cement/clinker production • Chemical and fuel production
While the CO2 emissions from the individual PCOR Partnership point sources are no different from similar sources located around the United States, the wide range of source types within the PCOR Partnership region offers the opportunity to evaluate the capture, separation, and transportation of CO2 in many different scenarios. The earliest deployment is likely to feature the capture, dehydration, compression, and pipeline transportation of CO2 from the “easiest” sources: gas-processing facilities and the fermentation step of ethanol plants. This will probably be followed by capture, dehydration, compression, and pipeline transportation of the CO2 produced during coal combustion at the region’s electricity generation facilities as these are the largest sources of CO2 in the region. It is highly unlikely that CO2 capture would be implemented at all of the region’s ethanol, gas-processing, or electricity-generating plants simultaneously. The specific plants that will be the earliest adopters are not known at this time. The costs associated with capture, drying, compression, and transport of CO2 from these facilities will likely be borne by the individual facilities. Capture of CO2 from coal combustion flue gas will be expensive in terms of both capture and parasitic load on the power plant. To recover a portion of this expense, the geologic storage that will be pursued first likely will be oil fields in which CO2 can be used for EOR and would presumably have some monetary value. It is expected that wide-scale sequestration in brine formations will occur only after EOR opportunities have been exhausted. A network of pipelines capable of transporting the CO2 to the various geologic storage sites will have to be constructed. Pipeline sizing and routing will need to be considered so that the network can accommodate increasing quantities of CO2 while transporting CO2 to the nearest EOR and/or brine formations. REGIONAL SOURCE TYPES As of December 1, 2009, the PCOR Partnership region contains 927 industrial or utility sources that each emit at least 15,000 short tons/yr CO2. Total emissions from these sources is roughly 561,900,000 short tons/year CO2. This figure does not include CO2 emitted from commercial facilities (malls, schools, etc.), residential buildings, or complexes or during

3
transportation of people or goods. Relatively speaking, the PCOR Partnership region emits more CO2 from electric utilities and less from industries than the rest of the United States, probably because the region is made up largely of agricultural and energy-producing areas and the majority of industrial activity is located primarily in the eastern reaches of the region. There are many smaller sources in the east and larger, more widely distributed sources in the west. This distribution of sources can be seen in Figure 1.
Figure 1. Location and relative output for the PCOR Partnership region’s major stationary CO2
sources.

4
A breakdown by state or province of the number of sources and amount of CO2 emitted from each major source category is presented in Figures 2 and 3, respectively. The broad categories contain CO2 emission sources from several areas. The agriculture-related category includes agricultural and animal processing as well as fertilizer and sugar production. The electricity generation category includes electricity generation and cogeneration. The ethanol/fuels production category includes ethanol production and the production of other fuels such as syngas and chemicals such as ammonia and asphalt. The petroleum- and natural gas-related category includes natural gas processing, natural gas storage facilities, natural gas transmission, combined petroleum and natural gas processing, petroleum processing, petroleum refining, and petroleum transmission. Other manufacturing/industrial activities include cement/clinker and lime production; paper and wood products manufacture; foundries; mining, ore, minerals, and metals processing; institutional and industrial heat and power production; and other manufacturing activities.
Figure 2. Number of CO2 sources for each state or province, broken down by major source category (it should be noted that the values for British Columbia, Montana, and Wyoming are only for the portion of the state/province that lies within the PCOR Partnership region and are
not necessarily representative of the total for those states/that province).

5
Figure 3. CO2 emissions for each state or province, broken down by major source category (it should be noted that the values for British Columbia, Montana, and Wyoming are only for the
portion of the state/province that lies within the PCOR Partnership region and are not necessarily representative of the total for those states/that province).
COST OF CAPTURING CO2 IN THE PCOR PARTNERSHIP REGION
Overview of Capture Technologies Several processes have been or are being developed to separate and remove CO2 from flue gas streams, and these technology options are summarized in Figure 4. Selection of a particular technology is based primarily upon the pressure and concentration of CO2 in the gas stream, as summarized in Table 1. Absorption is commercially available for high-volume, mixed-gas streams. Physical sorbents are ideal for gasification flue gas streams, whereas chemical sorbents are used to remove CO2 from fossil fuel combustion systems. Adsorption can also be implemented for mixed-gas streams; however, no commercial systems are yet available. Membrane and cryogenic systems are ideal for smaller flow rates. Membranes may be applied to gasification or reforming flue gas streams, and cryogenic conditions benefit carbon capture from high CO2 concentration streams. A complete description of all of the various capture technologies that are either commercially available or under development is beyond the scope of this report. The PCOR Partnership produced a comprehensive overview in 2005 (Jensen et al., 2005); an updated

6
Figure 4. CO2 capture technology options (PSA = pressure swing adsorption, TSA = temperature swing adsorption).
Table 1. Common Applications for CO2 Capture Technologies Technology Application Absorption Commercial plants, mixed-gas streams
Chemical – fossil fuel-fired systems, e.g., boilers, gas turbines Physical – gasification systems
Adsorption Mixed-gas streams Membranes Gasification and reforming, flue gas Cryogenics High-concentration, mixed-gas streams
version of the document will be available in early 2010. However, background information regarding the technologies that are the most likely to be employed during early carbon capture and sequestration (CCS) activities within the PCOR Partnership region is provided in the following paragraphs.
Absorption Processes Absorption processes are commonly used in commercial plants to remove CO2 from mixed-gas streams over a wide range of pressures and CO2 concentrations. Two types of solvents are typically used for CO2 removal: physical solvents and chemically reactive solvents. Physical solvents dissolve CO2 following Henry’s law but do not react with it. Chemically reactive solvents first dissolve CO2 and then react with it. Physical solvents are better suited to mixed-gas streams that are under high pressure, such as gasification systems. The elevated pressure increases CO2 solubility which, in turn, reduces the solvent circulation rate. The physical solvent can be recovered by flashing off CO2 at a lower pressure. Pressure does not affect the
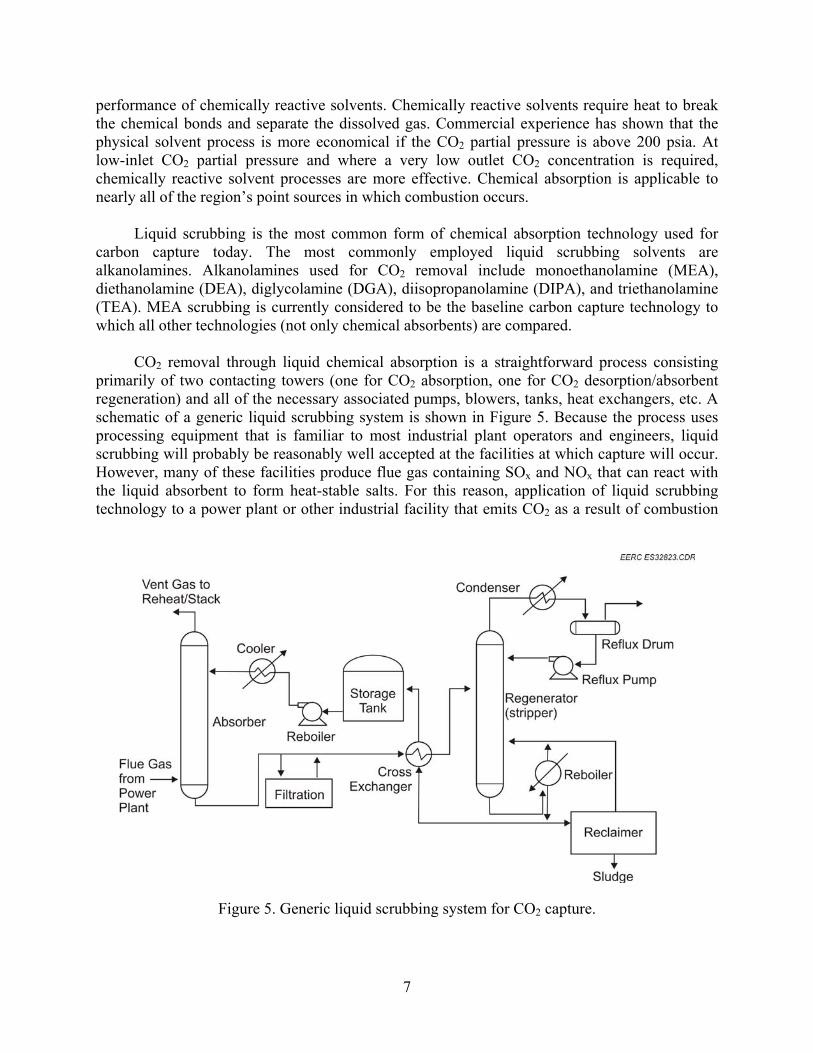
7
performance of chemically reactive solvents. Chemically reactive solvents require heat to break the chemical bonds and separate the dissolved gas. Commercial experience has shown that the physical solvent process is more economical if the CO2 partial pressure is above 200 psia. At low-inlet CO2 partial pressure and where a very low outlet CO2 concentration is required, chemically reactive solvent processes are more effective. Chemical absorption is applicable to nearly all of the region’s point sources in which combustion occurs. Liquid scrubbing is the most common form of chemical absorption technology used for carbon capture today. The most commonly employed liquid scrubbing solvents are alkanolamines. Alkanolamines used for CO2 removal include monoethanolamine (MEA), diethanolamine (DEA), diglycolamine (DGA), diisopropanolamine (DIPA), and triethanolamine (TEA). MEA scrubbing is currently considered to be the baseline carbon capture technology to which all other technologies (not only chemical absorbents) are compared. CO2 removal through liquid chemical absorption is a straightforward process consisting primarily of two contacting towers (one for CO2 absorption, one for CO2 desorption/absorbent regeneration) and all of the necessary associated pumps, blowers, tanks, heat exchangers, etc. A schematic of a generic liquid scrubbing system is shown in Figure 5. Because the process uses processing equipment that is familiar to most industrial plant operators and engineers, liquid scrubbing will probably be reasonably well accepted at the facilities at which capture will occur. However, many of these facilities produce flue gas containing SOx and NOx that can react with the liquid absorbent to form heat-stable salts. For this reason, application of liquid scrubbing technology to a power plant or other industrial facility that emits CO2 as a result of combustion
Figure 5. Generic liquid scrubbing system for CO2 capture.

8
may require the installation of additional pollution control equipment to reduce the concentrations of these contaminants prior to CO2 capture. Some amine scrubbing technology developers have focused on MEA. Commercial providers of MEA technology include ABB Lummus Global and Fluor Daniel Econamine FGSM. ABB Lummus uses a 15%–20% MEA in water solution for its commercial facilities (Imai, 2003). Fluor Daniel uses a 30% MEA solution and incorporates an inhibitor to protect against corrosion (Imai, 2003; Reddy et al., 2003). Together, there are more than 20 commercial MEA scrubbing plants in operation that range in size up to 385 tons CO2/day (International Energy Agency [IEA] Greenhouse Gas R&D Programme, 2008; Reddy, S., 2008). For comparison, a 500-MW coal-fired power plant typically produces up to 8200 tons CO2/day (New York Academy of Sciences, 2008). Mitsubishi Heavy Industries’ hindered amines (designated KS-1 and KS-2) are said to reduce steam consumption for regeneration by about 20% when compared with MEA requirements (Iijima, 2002). A commercial CO2 separation process using KS-1 has been operating at a fertilizer plant in Malaysia since October 1999. Other developers are featuring specially tailored “designer” amines or combinations of amines. Cansolv specially tailors its amine-based absorbents for fast kinetics (similar to primary amines), very low degradation (similar to tertiary amines), high resistance to oxidation and free radical attack, and the lowest possible regeneration energy (Cansolv, 2008). The Cansolv carbon capture system can be used in concert with the Cansolv SO2 scrubbing system or the Cansolv multipollutant control system, which are used to control SOx levels prior to CO2 capture. A commercial test of this carbon capture technology is being conducted at NSC in Japan. In addition to the alkanolamines, liquid scrubbing processes are now being developed using ammonia as the absorbent. Powerspan’s ECO2™
technology, which began as a research effort with the U.S. Department of Energy National Energy Technology Laboratory (NETL), is one such process (Powerspan, 2008). Ammonia permits a higher CO2 loading than does MEA, requires less energy for regeneration and release of CO2, and exhibits minimal sorbent degradation by other flue gas constituents. The heat-stable salts that are formed by the reaction of ammonia with SOx and NOx can be used as a fertilizer, providing possible value-added benefit for the first 1000- to 1500-MW facilities on which it is installed. Estimates indicate that between 25% and 30% of the U.S. fertilizer market could be met by the quantity that would be produced by the process if it were installed on a 500-MW plant. The ECO2 process is integrated after the Powerspan ECO® process, which provides NOx, SOx, and particulate control. Bench-scale testing has shown a 90% CO2 removal rate with ammonium carbonate solutions. Parametric testing will define absorption rates, ammonia vapor management, and absorptive capacity. Pilot-scale testing of the ECO2 process began in December 2008 at FirstEnergy’s R.E. Burger Plant in Shadyside, Ohio, on a 1-MW slipstream (20 tons/day). The testing was scheduled to continue through 2009. Within the PCOR Partnership region, the ECO2™ technology was selected in March 2008 by Basin Electric Power Cooperative for a 125-MW technology demonstration at the Antelope Valley Power Station.

9
Another ammonia-based technology, ALSTOM’s chilled ammonia process, is designed to operate with slurry (Power, 2008). Cooled flue gas flows upward countercurrent to the slurry, which contains a mix of dissolved and suspended ammonium carbonate and ammonium bicarbonate and captures more than 90% of the CO2. The process has the potential to be applied to capture CO2 from flue gases exhausted from coal-fired boilers and natural gas combined-cycle (NGCC) system as well as a wide variety of industrial applications. ALSTOM is installing the technology in the Pleasant Prairie Power Plant in Wisconsin, which is owned and operated by We Energies. ALSTOM has also signed a joint development contract with Statoil for the design and construction of a 40-MW test and product validation facility at Statoil’s Mongstad refinery in Norway. This facility will be designed to capture at least 80,000 tons of CO2/year from flue gases from either the refinery’s cracker unit or a new combined heat and power plant being built by Statoil and scheduled to be in operation by 2010. ALSTOM plans to offer a commercial product for selected market segments before the end of 2011. Processes using hot potassium carbonate have been commercialized as the Catacarb® and Benfield processes (Catacarb, 2008; UOP LLC, 2008). Typically, the Catacarb® and Benfield processes are used for either bulk or trace acid gas removal when removing CO2 from synthesis gas in ammonia plants or direct iron ore reduction plants, treating natural gas to achieve either liquefied natural gas or pipeline specifications, or to purify recycle gas in an ethylene oxide facility. They can be corrosive and require larger-scale equipment, an issue when retrofitting space-constrained sites for carbon capture. Other chemical absorption methods are at bench and laboratory scales of development. A process that uses a potassium carbonate/piperazine complex is being researched by the University of Texas at Austin (Cullinane and Rochelle, 2004). Researchers at the University of Regina, Saskatchewan, are studying PSR solvents, which are proprietary designer solvents formulated for optimized separation of CO2 from any gas stream (Veawab et al., 2001). NETL scientists are focusing efforts on amine-enriched sorbents (Gray et al., 2003), and amino acid salt solutions are also being developed (van Holst et al., 2006). It is unlikely that any of these technologies would be ready for deployment during the first CCS activities in the PCOR Partnership region.
Application of Chemical Absorption Technology to PCOR Partnership Point Sources It is most likely that the PCOR Partnership region’s earliest application of carbon capture would be at the ethanol, gas-processing and electricity-generating facilities. The CO2 produced at gas-processing plants and during the fermentation step at ethanol plants would require minimal processing to prepare it for pipeline transportation, making these attractive first targets for CO2 capture. Because the region’s coal-fired power plants emit roughly two-thirds of the CO2 produced by industrial stationary sources, capture of their CO2 could significantly reduce the overall regional point-source emission of CO2, making them likely targets for capture. Chemical and physical absorption systems are the only commercial capture technologies that apply to high-volume, mixed-gas streams. Although they have not been demonstrated on each of the source types, amine systems are theoretically applicable to the CO2 emission from virtually all of the PCOR Partnership sources that produce CO2 during combustion of coal or

10
natural gas. The primary exception would be the fermentation step of ethanol processing because it requires only dehydration. Cement/clinker production might also be excluded since a changing variety of fuels is often employed at those facilities, making application of absorption difficult. During ethanol manufacture, the CO2 vented from the fermenters and beerwell is scrubbed with freshwater and sodium sulfite, which removes alcohol, acetaldehydes, and other volatile organic compounds (VOCs). The water used in the CO2-scrubbing process is reclaimed into the process via the cook water tank and is considered to be a step within the ethanol production process rather than a separate CO2 capture process (Hawkeye Energy, 2008). Typically, the CO2 is marketed to the food-processing industry for use in carbonated beverages and flash-freezing applications. The cement/clinker industry does not typically capture CO2, although considerable efforts are being made to implement oxycombustion (Worrell et al., 2001). In this scenario, oxygen would be fed to the burner in the kiln instead of air, producing a highly concentrated CO2 stream. This technology is currently not cost-effective, and further research is needed to assess its technical and commercial applicability. Amine scrubbing is commonly used throughout the petroleum- and natural gas-processing industry for CO2 capture because of the technology’s high capture efficiencies and ability to provide the purity needed for EOR efforts. Therefore, amines are recommended for carbon capture in other industries where a majority of emissions are from gas combustion, including agricultural processing, paper and wood products, and petroleum refining. Amine scrubbing can also be used for other fossil fuel combustion, suggesting that this approach may be utilized for coal combustion in the electricity-generating industry. Table 2 summarizes the match of carbon capture technologies to the largest source of CO2 emissions for each industry.
Table 2. Various PCOR Partnership Industries and Their Capture Technology Matches Industry Largest CO2 Emitter Capture Technology Agricultural Processing Gas combustion Amine scrubbing Cement/Clinker1 Clinker production Oxycombustion Electric Generation Coal combustion Amine scrubbing Ethanol Manufacture2 Fermentation step Water scrubbing Paper and Wood Products Gas combustion Amine scrubbing Petroleum and Natural Gas Processing Gas combustion Amine scrubbing Petroleum Refining Gas combustion Amine scrubbing 1 Hawkeye Energy, 2008. 2 Worrell et al., 2001.
THE COST OF CO2 CAPTURE Employing CO2 capture on a regionwide scale will require considerable energy and financial resources. The cost of capture required for the wide-scale deployment of carbon

11
sequestration in the PCOR Partnership region was estimated. It is assumed that initial CO2 capture will occur at ethanol plants and gas-processing facilities. This is because a stream of almost pure CO2 is created during the fermentation step at ethanol plants and from the gas-sweetening activities at natural gas-processing plants and would, therefore, be the easiest to purify. Electricity-generating stations would likely be the next capture target industry simply because so much of the region’s CO2 is produced when coal is combusted to produce electricity. A cost assessment was performed by determining the cost and power requirements of various levels of capture at ethanol plants, gas-processing plants, and electricity-generating facilities. For the power plants, replacement power requirements were also calculated. The results of these calculations are summarized in the following sections. The reader should note that any values given for British Columbia, Montana, and Wyoming do not reflect the entire state/province. Details of the capture from power plants on a state-by-state or province-by-province basis are provided in Appendix A. Capture and compression costs and power requirements for ethanol plants, gas-processing plants, and electricity-generating facilities were estimated using the Integrated Environmental Control Model (IECM), Version 5.22 (released January 28, 2008) (IECM, 2008). The IECM is a desktop computer model that was developed at Carnegie Mellon University with funding from NETL. The IECM is available as freeware at www.iecm-online.com. The IECM allows different technology options to be evaluated systematically at the level of an individual plant or facility and takes into account not only avoided carbon emissions, but the impacts on multipollutant emissions as well; plant-level resource requirements; capital, operating, and maintenance costs; and net plant efficiency. Uncertainties and technological risks also can be defined. The modeling framework is designed to support a variety of technology assessment and strategic planning activities. Four types of fossil fuel power plants are currently included in the model: a pulverized coal plant, a natural gas combined-cycle (NGCC) plant, a coal-based integrated gasification combined-cycle (IGCC) plant, and an oxyfuel combustion plant. Each plant can be modeled with or without CO2 capture and storage. While the IECM does not contain ethanol or gas-processing plant modules, Energy & Environmental Research Center (EERC) researchers found it possible to configure the model in a manner permitting prediction of these costs, thereby putting both the ethanol and power plant cost and power requirement estimations on the same basis and enabling valid comparisons to be made.
Ethanol Plants For this study, the IECM was run multiple times to determine the costs and power requirements for various levels of CO2 capture at the PCOR Partnership region’s ethanol plants. To model the fermentation step, the IECM was configured as a natural gas-fired combustion turbine with amine scrubbing. Changing various turbine operating characteristics and the flue gas bypass option allowed the model-produced virtual plant to produce the same quantity and quality of CO2 as the particular ethanol plant being modeled. The model outputs for the virtual ethanol plant were manipulated to separate the costs associated with drying and compression of the appropriately sized gas stream from the rest of the capture costs. Capture of the CO2 from the combustion portion of an ethanol plant was performed similarly, except that the costs associated with the amine scrubbing and regeneration steps were included in the results. Specific procedures used to apply the IECM to ethanol plant calculations are presented in detail in Appendix B.

12
CO2 Emission Reduction Potential The PCOR Partnership region contains 92 ethanol plants, 90 of which use natural gas as fuel. The remaining two plants are fueled by coal. Collectively, these ethanol plants emit roughly 26.5 million short tons of CO2 each year. Almost 59% of the CO2 is emitted during the fermentation (noncombustion) process, while slightly more than 41% is emitted during combustion. Ethanol plants emit 4.7% of the CO2 produced by the PCOR Partnership region’s large point sources. Capture of all of the noncombustion CO2 would reduce the region’s CO2 output by nearly 3%. An additional 2% of the region’s point-source emissions could be avoided if 90% of the CO2 produced during fuel combustion at ethanol plants was captured. It is generally assumed the practical maximum capture of CO2 produced during combustion is 90%. Processing the CO2 emitted from the noncombustion ethanol production activities requires only drying and compression. However, ethanol plants also produce CO2 during combustion of fuel, and this CO2 would require capture, assumed in this case to be accomplished by an amine system. Following capture, the CO2 stream would then be dried and compressed. It is assumed that virtually all of the noncombustion CO2 would be captured. Amine scrubbing can reliably remove 90% to 95% of the CO2 from a flue gas, although cost constraints may not permit removal of even 90% of the combustion CO2. Therefore, cost and power requirements were calculated for capture of various levels of CO2, including 10%, 25%, 50%, 75%, and 90%.
Energy Consumption During Capture of CO2 from the PCOR Partnership Region’s Ethanol Plants
Table 3 shows the results of energy consumption calculations performed using the IECM. These calculations indicate that drying and compression to 2500 psig of noncombustion CO2 produced during the fermentation step requires an average of 0.112 MWh of electricity for each ton of fermentation CO2 produced at ethanol plants. A compression target of 2500 psig was chosen because the Great Plains Synfuels Plant CO2 stream arrives at its target geologic formation at 2500 psig. Although some targets may require less pressure, 2500 psig was deemed a prudent value as it would not be likely to underestimate compression costs. For the entire PCOR Partnership region, this power requirement totals 300 MW each year. Because ethanol plants do not produce their own electricity, this additional energy would need to be obtained from the region’s power grid. If it could not be provided by the existing power plants, additional capacity would have to be added, either by expanding some of the existing facilities or in the form of an additional plant producing 300 MW after capturing its own CO2. Capture, drying, and compression of the CO2 produced during combustion of fuel at an ethanol plant increases the average electricity requirement to 0.498 MWh on average for each ton of CO2 captured each year. Depending upon the level of CO2 capture, the regional power requirements could be as much as an additional 855 MW, for a total of 1155 MW.

13
Table 3. Energy Required to Capture CO2 from Ethanol Plants
Capture Efficiency, %
Amount of CO2
Captured, millions of
short tons/yr
Regional Power Requirement,
MW
Energy Consumption,1 MWh/ton CO2
Percentage of CO2
Emissions from PCOR Partnership
Ethanol Plants
Percentage of PCOR
Partnership Regional
Point-Source Emissions
Noncombustion Emissions 100 15.6 284 0.115 58.9 2.7 Combustion Emissions 10 1.1 83 0.711 4.1 0.2 25 2.7 209 0.711 10.3 0.5 50 5.4 417 0.711 20.7 1.0 75 8.2 626 0.711 31.0 1.5 90 9.8 751 0.711 37.2 1.8 1 Assuming 6575 hr/yr of plant operation.
Extent and Cost of CO2 Capture at Ethanol Plants in the PCOR Partnership Region
The IECM-estimated cost to process a ton of CO2 ranges from about $6.80 to $22.00 for noncombustion CO2 (which only requires drying and compression) to as much as $103 to $852 for capture, drying, and compression of 10% of the CO2 produced during fuel combustion. Typical estimates for drying and compression range from $5.40 to $10.90/ton CO2 ($6 to $12/tonne) (Dooley et al., 2006). Table 4 shows the range of costs required to capture, dry, and compress CO2 at the PCOR Partnership region’s ethanol plants. The higher costs per ton are usually found at the smaller facilities that cannot spread the capital and operating and maintenance (O&M) costs over a large CO2 product stream, thereby missing out on the economic benefit typically afforded large-scale operations. Capture from the combustion stream of facilities producing less than 15,000 tons/yr was deemed to be so uneconomical that they were not considered in the calculations. Similarly, the per-ton cost of capture, drying, and compression decreases as the capture percentage increases because the capital and O&M costs are spread over a larger quantity of CO2. Even at higher capture rates at the largest of the ethanol plants, the high costs associated with capture of CO2 from the combustion activities may deter plant ownership from pursuing this option, concentrating instead on the noncombustion CO2. If only the noncombustion CO2 were dried and compressed, the total regional cost would equal $165 million/year. This does not include costs that would be associated with any required expansion of the region’s electrical output. Sequestration of this quantity of CO2 would reduce the regional emissions by 3.1%. The levelized annual cost required for capture of various percentages of the CO2 produced during combustion activities is shown in Table 5. As shown in Table 5, these levelized annual costs range from $281 million/year to $1.09 billion/year for CO2 capture percentages of 10% and 90%, respectively.

14
Table 4. Range of Costs to Capture, Dry, and Compress CO2 Produced at the PCOR Partnership Region’s Ethanol Plants Amount of CO2 Captured, % Lowest Cost, $/ton CO2 Highest Cost, $/ton CO2 Noncombustion Emissions 100 6.77 21.69 Combustion Emissions 10 102.70 852.04 25 75.90 483.83 50 63.14 331.56 75 57.71 271.08 90 55.65 248.72
Table 5. Total Annual Cost to Capture CO2 at the PCOR Partnership’s Ethanol Plants
Amount of CO2 Captured, % Levelized Annual Cost,1 $millions/yr
Reduction in PCOR Partnership CO2 Emission, %
Noncombustion Emissions 100 148 2.7 Combustion Emissions 10 281 0.2 25 466 0.5 50 728 1.0 75 960 1.5 90 1093 1.8 1 Includes capital and O&M costs. Figure 6 shows the percentage of CO2 emissions produced from ethanol plants in the states/provinces with plants that emit at least 15,000 tons of CO2 annually. Charts comparing the energy consumption and cost of capture from ethanol plants among the states and provinces are included in Appendix C.
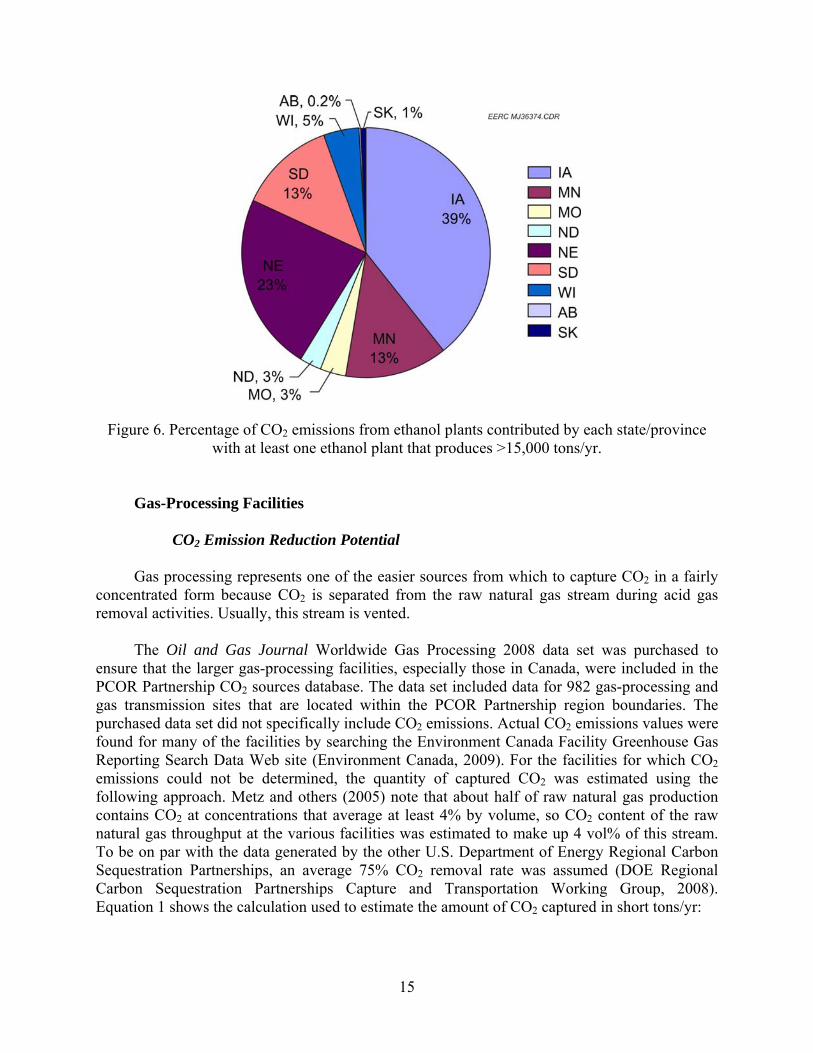
15
Figure 6. Percentage of CO2 emissions from ethanol plants contributed by each state/province with at least one ethanol plant that produces >15,000 tons/yr.
Gas-Processing Facilities
CO2 Emission Reduction Potential Gas processing represents one of the easier sources from which to capture CO2 in a fairly concentrated form because CO2 is separated from the raw natural gas stream during acid gas removal activities. Usually, this stream is vented. The Oil and Gas Journal Worldwide Gas Processing 2008 data set was purchased to ensure that the larger gas-processing facilities, especially those in Canada, were included in the PCOR Partnership CO2 sources database. The data set included data for 982 gas-processing and gas transmission sites that are located within the PCOR Partnership region boundaries. The purchased data set did not specifically include CO2 emissions. Actual CO2 emissions values were found for many of the facilities by searching the Environment Canada Facility Greenhouse Gas Reporting Search Data Web site (Environment Canada, 2009). For the facilities for which CO2 emissions could not be determined, the quantity of captured CO2 was estimated using the following approach. Metz and others (2005) note that about half of raw natural gas production contains CO2 at concentrations that average at least 4% by volume, so CO2 content of the raw natural gas throughput at the various facilities was estimated to make up 4 vol% of this stream. To be on par with the data generated by the other U.S. Department of Energy Regional Carbon Sequestration Partnerships, an average 75% CO2 removal rate was assumed (DOE Regional Carbon Sequestration Partnerships Capture and Transportation Working Group, 2008). Equation 1 shows the calculation used to estimate the amount of CO2 captured in short tons/yr:

16
CO2 Out = 75.0lb2000
ton1
lbmol
lb44
ft379
lbmol
yr
d365
d
MMftd
ft10
04.0g33
36
[Eq. 1]
In this equation, g is the natural gas throughput in MMft3/d, and the gas stream is assumed to be at oil and gas industry standard conditions of 60°F and 1 atm. It should be noted that this methodology does not imply a quality of processed natural gas. It is merely a tool used to estimate CO2 capture and subsequent emission for an “average” gas-processing facility when actual emission data are not available. Each of the natural gas-processing facility locations was verified by visual confirmation using the Google Earth satellite imagery. If the emission from a site was small and the facility did not appear on the satellite photographs to be a processing facility, the site was considered to be a natural gas transmission site rather than a gas-processing site. In keeping with the rest of the PCOR Partnership CO2 point sources, gas-processing plants emitting less than 15,000 short tons/yr were eliminated prior to their incorporation into the existing CO2 emissions data set. The PCOR Partnership CO2 emissions data set also includes data for petroleum- and natural gas-processing plants. Some of the CO2 emissions in the database are related to combustion of fuels, but some information is available regarding the CO2 produced during the noncombustion activities, i.e., gas sweetening. Where available data permitted, the CO2 that was captured at these facilities during gas sweetening was catalogued and added to the CO2 produced at the gas-processing plants. The resulting 99 plants producing a fairly pure, 21.1-million tons/yr CO2 stream during natural gas or petroleum processing are summarized in Table 6. The energy requirement and cost associated with drying and compressing the CO2 from these plants are summarized by state/province in Table 7 (not all states/provinces contain gas-processing plants). Table 6. CO2 Produced During Gas-Processing Activities in the PCOR Partnership Region State/Province Number of Facilities Short tons CO2/yr1 Alberta 82 16,460,000 British Columbia2 12 4,470,000 North Dakota 3 120,000 Saskatchewan 1 30,000 Wyoming2 1 30,000 Total 99 21,110,000 1 Rounded to the nearest 10,000 short tons/yr. 2 Only includes the portion of the state/province contained in the PCOR Partnership region.

17
Table 7. Energy Required and Cost Associated with Drying and Compression of the CO2 Produced During Natural Gas-Processing Activities State/Province Energy Required, MW Annual Cost1, $ million Alberta 289.7 200.9 British Columbia2 81.3 46.2 North Dakota 3.8 5.6 Saskatchewan 0.6 0.9 Wyoming2 0.6 0.9 Total 376.0 254.5 1 Levelized annual cost including both capital and O&M costs. 2 Only includes the portion of the state/province contained in the PCOR Partnership region.
Electric Utilities
CO2 Emission Reduction Potential An estimated 372,720,000 tons of CO2 a year is emitted by all of the region’s electric generating stations, which equates to 66% of all PCOR Partnership CO2 emissions from stationary sources. Several options for capture of CO2 from coal-fired power plants are being developed and were discussed earlier in this document. Of these options, the most commercially viable for power plants is absorption using an amine scrubber with MEA. MEA scrubbing is considered to be the baseline capture technology against which others are measured in terms of cost, efficiency, and parasitic load. To determine the cost of retrofitting the region’s electric generating stations with CO2 capture capability, the IECM was used to estimate the costs and power requirements associated with adding an MEA scrubber system to the postcombustion side of all electric generating stations larger than 100 MW. A 100-MW cutoff limit was chosen for two reasons:
The economics and power requirements of capturing CO2 at units smaller than 100 MW would make electric generation at these units no longer feasible.
The IECM has a lower estimation boundary level of 100 MW, meaning that values
calculated using the IECM for units smaller than 100 MW may not depict the true costs and power requirements. Appendix B outlines the procedures followed when using the IECM to estimate the cost and power requirements for capturing, drying, and compressing CO2 produced from electricity-generating stations.
The results of capturing, drying, and compressing CO2 produced from 100-MW and larger electric generating stations in the PCOR Partnership region are discussed on a state and province level in Appendix A and on an overall regional basis in the remainder of this section.
Regional Summary of CO2 Emission Reduction Potential The 100-MW cutoff limit excluded several electricity-generating stations from the study. A total of 74 generating stations were determined to have units larger than 100 MW. Out of these 74 generating stations, a total of 132 individual generating units were larger than 100 MW. Each

18
of these units was characterized by coal type, boiler type, unit size, and existing pollution control equipment. This specific information is summarized in Appendix A. The 132 units have an overall generating capacity of 45,096 MW. Figure 7 breaks down the power production considered for CO2 capture implementation in each of the states or provinces. As seen in Figure 7, Missouri generates the most power in these units. Figure 8 shows the amount of CO2 produced from the 132 electricity generating units considered eligible for CO2 capture on a state/province basis. They produce approximately 350 million tons/year, which is 95% of all the CO2 produced from electric generating stations in the PCOR Partnership region. A map showing the location of all the stations considered to be eligible for CO2 capture implementation under this study is shown in Figure 9.
Figure 7. Summary of the total amount of MW considered for CO2 capture in each state or province. Only the portions of each state/province that lie within the PCOR Partnership region
were included.

19
Figure 8. Total amount of CO2 produced (in MMtons/yr) by electricity-generating stations considered for CO2 capture on a state/province basis. Only the portions of each state/province
that lie within the PCOR Partnership region were included.

20
Figure 9. Map showing the location and range of CO2 emissions of the electricity-generating stations larger than 100 MW in the PCOR Partnership region.

21
Energy Consumption During CO2 Capture The IECM was used to determine the cost and energy penalty (i.e., the amount of electricity generated by the plant that cannot be put on the grid because it is used for the capture process) associated with implementing CO2 capture on the existing electricity-generating units in the PCOR Partnership region. The results are detailed in Appendix A. The primary parameters of concern were parasitic load of the amine scrubber; additional parasitic load from adding a wet flue gas desulfurization (WFGD) unit, if needed; total CO2 produced; total CO2 captured; cost of adding a WFGD, if needed; and total levelized cost of retrofitting the amine scrubbing system, including drying and compression. The total cost of capturing CO2 is displayed in $/ton of CO2 captured and includes both the levelized annual cost of the amine scrubbing system and the additional cost accrued from retrofitting WFGD in the cases where it was needed. A WFGD was added to the cost of CO2 capture in instances where SOx control was not previously installed at the plant. This was done because the cost penalty for not removing the SOx upstream of the amine scrubbing system is greater than if a WFGD system were added. The SOx concentration entering the amine scrubber system is an important parameter when determining the O&M cost because of the solvent degradation that occurs in the presence of SO2 and SO3. If the SOx concentration is greater than about 10 ppm, the solvent degradation can become a significant cost component when CO2 is captured in an amine system. While amine can be reclaimed from the heat-stable salts formed when amines react with SOx and NOx, the process often produces a hazardous waste with associated expensive disposal costs. Therefore, the preferred choice is to avoid the formation of heat-stable salts. The IECM was run for every unit in each of the portions of the states or provinces in the PCOR Partnership region at five different CO2 capture rates (10%, 25%, 50%, 75%, and 90%). The results are summarized in Table 8. The cost to capture a ton of CO2 is essentially unchanged for CO2 capture rates of 50% to 90% because of the statistical accuracy of the economic evaluation. The cost for this range of capture was $46 to $49/ton of CO2 captured for the capture rates of 90% to 50%, respectively. Although the cost per ton was relatively stable, the total cost and power requirement increased linearly as the capture percentage increased. The lowest total cost of $2.9 billion annually would be required to capture 10% of the CO2. As much as $14.4 billion annually would be needed to capture 90% of the CO2. The power requirement ranged from 1797 to 16,036 MW for 10% to 90% CO2 capture, respectively. These results are shown graphically in Figure 10. The results from the model simulations show a significant cost and energy penalty for capturing 90% of the CO2 emitted from these units. The energy that would be consumed by capturing CO2 at this high rate is 16,036 MW or 35.6% of the current gross output of all of the electricity-generating stations that were considered in this study. At the highest rate of capture (i.e., 90%), an estimated 315,000,000 tons of CO2 would be captured, or roughly 85% of all the CO2 produced by all of the electricity-generating stations in the PCOR Partnership region. The total CO2 produced by point sources in the PCOR Partnership region is about 562 million tons a year. If 90% CO2 capture could be achieved from the electricity-generating stations considered for capture in the PCOR Partnership region, an overall reduction of 56% would be realized from all CO2 emitted by point sources in the region. Figure 11 shows the amount of CO2 captured a year for different CO2 capture rates. Also shown in Figure 11 is the percentage of
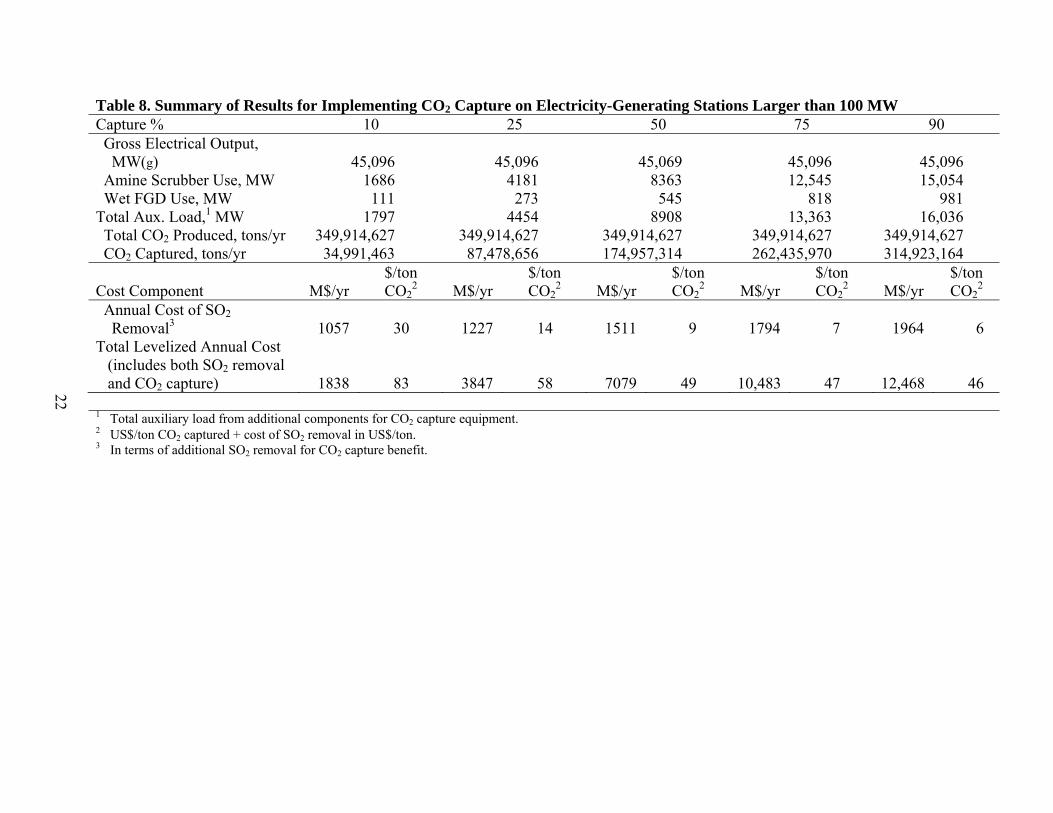
22
Table 8. Summary of Results for Implementing CO2 Capture on Electricity-Generating Stations Larger than 100 MW Capture % 10 25 50 75 90 Gross Electrical Output, MW(g) Amine Scrubber Use, MW Wet FGD Use, MW
45,096
1686 111
45,096
4181 273
45,069
8363 545
45,096 12,545
818
45,096 15,054
981 Total Aux. Load,1 MW 1797 4454 8908 13,363 16,036 Total CO2 Produced, tons/yr CO2 Captured, tons/yr
349,914,627 34,991,463
349,914,627 87,478,656
349,914,627 174,957,314
349,914,627 262,435,970
349,914,627 314,923,164
Cost Component M$/yr $/ton CO2
2 M$/yr $/ton CO2
2 M$/yr $/ton CO2
2 M$/yr $/ton CO2
2 M$/yr $/ton CO2
2 Annual Cost of SO2 Removal3 1057 30 1227 14 1511 9 1794 7 1964 6 Total Levelized Annual Cost
(includes both SO2 removal and CO2 capture)
1838
83
3847
58
7079
49
10,483
47
12,468
46
1 Total auxiliary load from additional components for CO2 capture equipment. 2 US$/ton CO2 captured + cost of SO2 removal in US$/ton. 3 In terms of additional SO2 removal for CO2 capture benefit.

23
Figure 10. Graphical summary of the costs and energy penalty associated with implementation of CO2 capture at electricity-generating stations larger than 100 MW in the PCOR Partnership
region.
Figure 11. Total CO2 captured from all electric generation stations larger than 100 MW in the PCOR Partnership region.
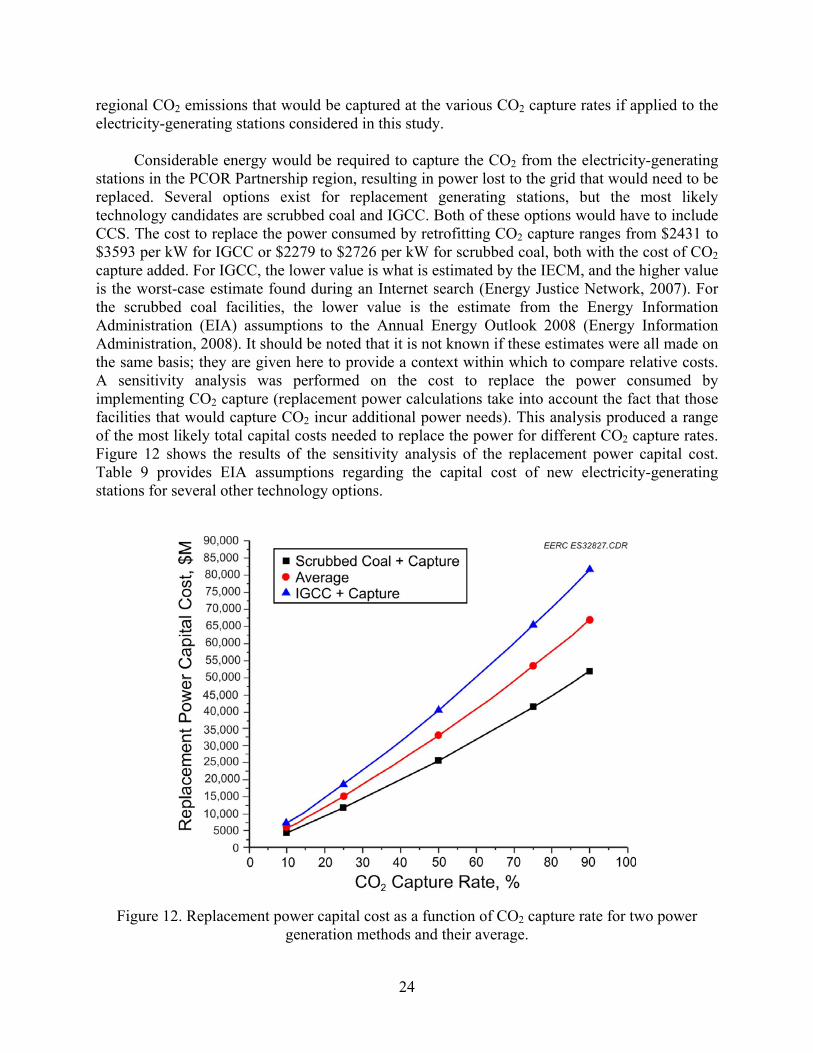
24
regional CO2 emissions that would be captured at the various CO2 capture rates if applied to the electricity-generating stations considered in this study. Considerable energy would be required to capture the CO2 from the electricity-generating stations in the PCOR Partnership region, resulting in power lost to the grid that would need to be replaced. Several options exist for replacement generating stations, but the most likely technology candidates are scrubbed coal and IGCC. Both of these options would have to include CCS. The cost to replace the power consumed by retrofitting CO2 capture ranges from $2431 to $3593 per kW for IGCC or $2279 to $2726 per kW for scrubbed coal, both with the cost of CO2 capture added. For IGCC, the lower value is what is estimated by the IECM, and the higher value is the worst-case estimate found during an Internet search (Energy Justice Network, 2007). For the scrubbed coal facilities, the lower value is the estimate from the Energy Information Administration (EIA) assumptions to the Annual Energy Outlook 2008 (Energy Information Administration, 2008). It should be noted that it is not known if these estimates were all made on the same basis; they are given here to provide a context within which to compare relative costs. A sensitivity analysis was performed on the cost to replace the power consumed by implementing CO2 capture (replacement power calculations take into account the fact that those facilities that would capture CO2 incur additional power needs). This analysis produced a range of the most likely total capital costs needed to replace the power for different CO2 capture rates. Figure 12 shows the results of the sensitivity analysis of the replacement power capital cost. Table 9 provides EIA assumptions regarding the capital cost of new electricity-generating stations for several other technology options.
Figure 12. Replacement power capital cost as a function of CO2 capture rate for two power generation methods and their average.
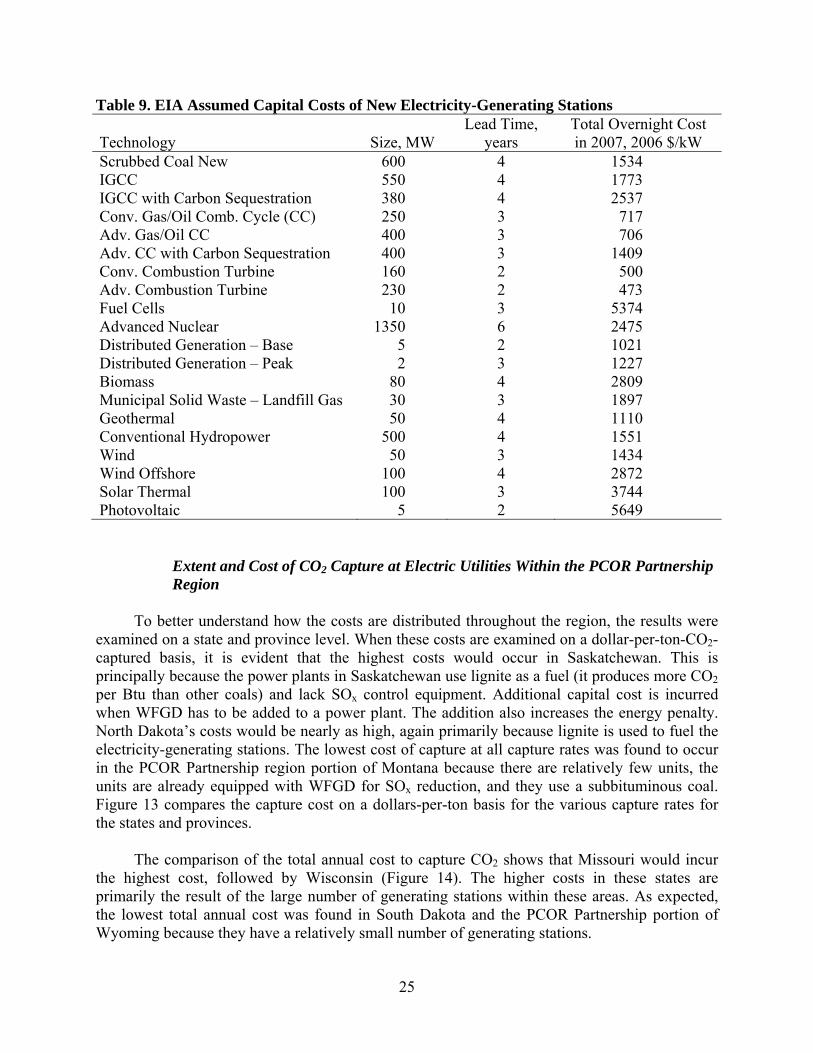
25
Table 9. EIA Assumed Capital Costs of New Electricity-Generating Stations
Technology Size, MW Lead Time,
years Total Overnight Cost in 2007, 2006 $/kW
Scrubbed Coal New 600 4 1534 IGCC 550 4 1773 IGCC with Carbon Sequestration 380 4 2537 Conv. Gas/Oil Comb. Cycle (CC) 250 3 717 Adv. Gas/Oil CC 400 3 706 Adv. CC with Carbon Sequestration 400 3 1409 Conv. Combustion Turbine 160 2 500 Adv. Combustion Turbine 230 2 473 Fuel Cells 10 3 5374 Advanced Nuclear 1350 6 2475 Distributed Generation – Base 5 2 1021 Distributed Generation – Peak 2 3 1227 Biomass 80 4 2809 Municipal Solid Waste – Landfill Gas 30 3 1897 Geothermal 50 4 1110 Conventional Hydropower 500 4 1551 Wind 50 3 1434 Wind Offshore 100 4 2872 Solar Thermal 100 3 3744 Photovoltaic 5 2 5649
Extent and Cost of CO2 Capture at Electric Utilities Within the PCOR Partnership Region
To better understand how the costs are distributed throughout the region, the results were examined on a state and province level. When these costs are examined on a dollar-per-ton-CO2-captured basis, it is evident that the highest costs would occur in Saskatchewan. This is principally because the power plants in Saskatchewan use lignite as a fuel (it produces more CO2 per Btu than other coals) and lack SOx control equipment. Additional capital cost is incurred when WFGD has to be added to a power plant. The addition also increases the energy penalty. North Dakota’s costs would be nearly as high, again primarily because lignite is used to fuel the electricity-generating stations. The lowest cost of capture at all capture rates was found to occur in the PCOR Partnership region portion of Montana because there are relatively few units, the units are already equipped with WFGD for SOx reduction, and they use a subbituminous coal. Figure 13 compares the capture cost on a dollars-per-ton basis for the various capture rates for the states and provinces. The comparison of the total annual cost to capture CO2 shows that Missouri would incur the highest cost, followed by Wisconsin (Figure 14). The higher costs in these states are primarily the result of the large number of generating stations within these areas. As expected, the lowest total annual cost was found in South Dakota and the PCOR Partnership portion of Wyoming because they have a relatively small number of generating stations.
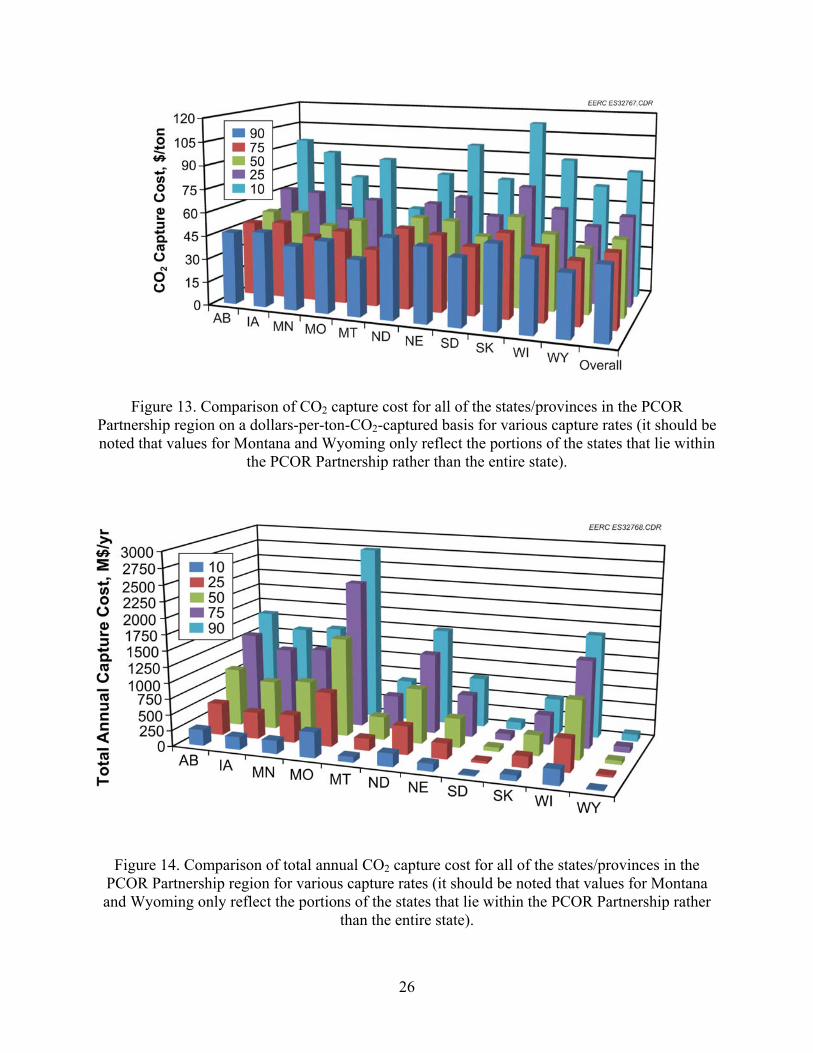
26
Figure 13. Comparison of CO2 capture cost for all of the states/provinces in the PCOR Partnership region on a dollars-per-ton-CO2-captured basis for various capture rates (it should be noted that values for Montana and Wyoming only reflect the portions of the states that lie within
the PCOR Partnership rather than the entire state).
Figure 14. Comparison of total annual CO2 capture cost for all of the states/provinces in the PCOR Partnership region for various capture rates (it should be noted that values for Montana and Wyoming only reflect the portions of the states that lie within the PCOR Partnership rather
than the entire state).

27
The comparison of the total energy required for CO2 capture at the facilities that are larger than 100 MW in each state revealed similar results, with Missouri requiring the most energy because the existing power output is high relative to the rest of the region. This comparison is shown in Figure 15. Alberta and Wisconsin are the next highest, also because the power output of the electricity-generating stations there is high. Because of the relatively few electricity-generating stations, South Dakota and Wyoming would have the lowest power replacement requirements. In terms of an energy penalty or the percentage of energy consumed by capture activities from the base load, North Dakota has the highest energy penalty associated with CO2 capture. This can be seen in Figure 16. This is most likely caused by the unit types and the use of lignite fuel throughout the state. The energy penalties that would be incurred in Wyoming are similar to North Dakota’s. The remaining states/provinces in the PCOR Partnership region are very similar in terms of the energy penalties associated with implementing CO2 capture. Reduction of CO2 emission can be viewed in several ways. The total mass of CO2 that could be captured in each state is compared in Figure 17. The figure shows that Missouri could capture the most CO2, approximately 70 million tons/yr at a rate of 90% capture. Looking at the data from the perspective of reducing the CO2 emissions from the state/province’s power plants, Figure 18 shows that the largest percentage of CO2 emission reduction from all power plants
Figure 15. A comparison of the energy required for CO2 capture in each state/province in the PCOR Partnership region for various capture rates (it should be noted that values for Montana and Wyoming only reflect the portions of the states that lie within the PCOR Partnership rather
than the entire state).
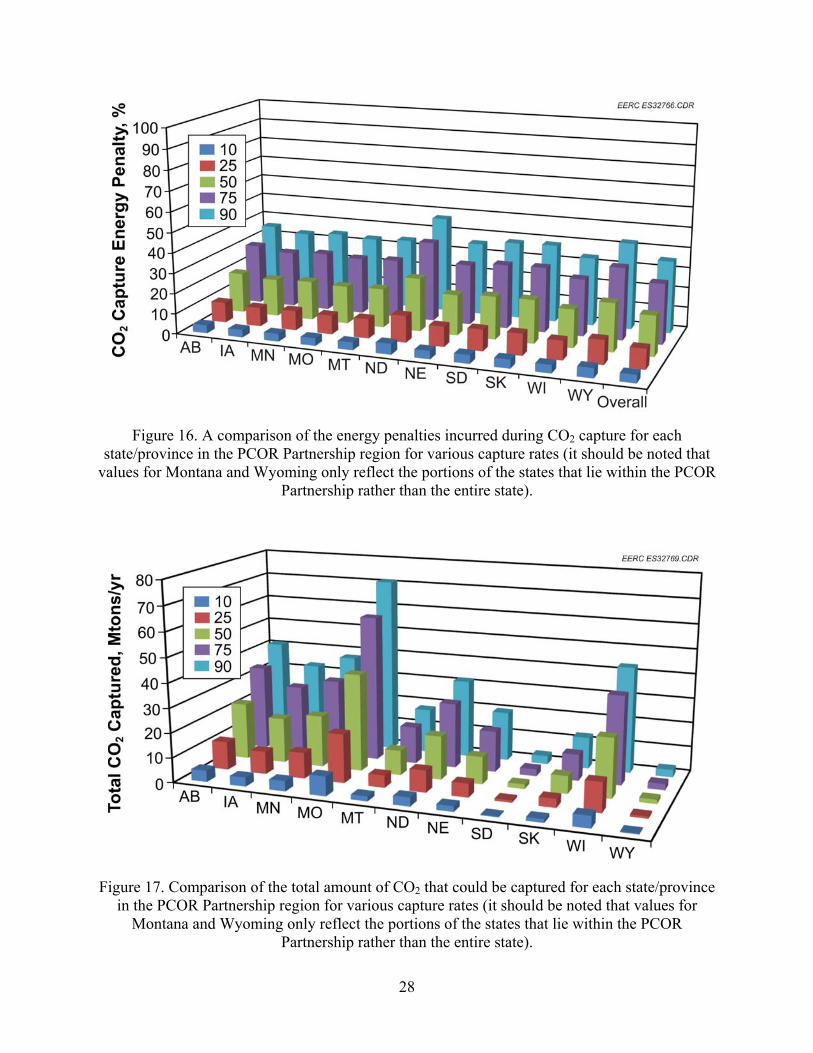
28
Figure 16. A comparison of the energy penalties incurred during CO2 capture for each
state/province in the PCOR Partnership region for various capture rates (it should be noted that values for Montana and Wyoming only reflect the portions of the states that lie within the PCOR
Partnership rather than the entire state).
Figure 17. Comparison of the total amount of CO2 that could be captured for each state/province in the PCOR Partnership region for various capture rates (it should be noted that values for
Montana and Wyoming only reflect the portions of the states that lie within the PCOR Partnership rather than the entire state).

29
Figure 18. Comparison of the percentage of CO2 reduced from all electricity-generating stations in each state/province in the PCOR Partnership region when CO2 capture is implemented at the large (100 MW+) electricity-generating stations (it should be noted that values for Montana and Wyoming only reflect the portions of the states that lie within the PCOR Partnership rather than
the entire state).
(including those smaller than 100 MW) could be made in North Dakota. This is because a large percentage of their electricity-generating stations are larger and capture could be implemented there. The smallest opportunity to reduce CO2 emissions is offered by Wyoming and Minnesota. Finally, on an overall (i.e., from all stationary sources) CO2 reduction basis (shown in Figure 19), Montana could reduce its CO2 emission by about 75% through capture of 90% of the CO2 from its power plants. This is possible because of the small number of point sources in the state and the fact that, while there are not many electricity-generating stations in Montana, they are large. Missouri and North Dakota could potentially capture approximately 70% to 75% of the CO2 produced by implementing 90% CO2 capture from their large generating stations. The data used to develop the figures discussed in this section (i.e., Figures 13–19) are included in Appendix D.
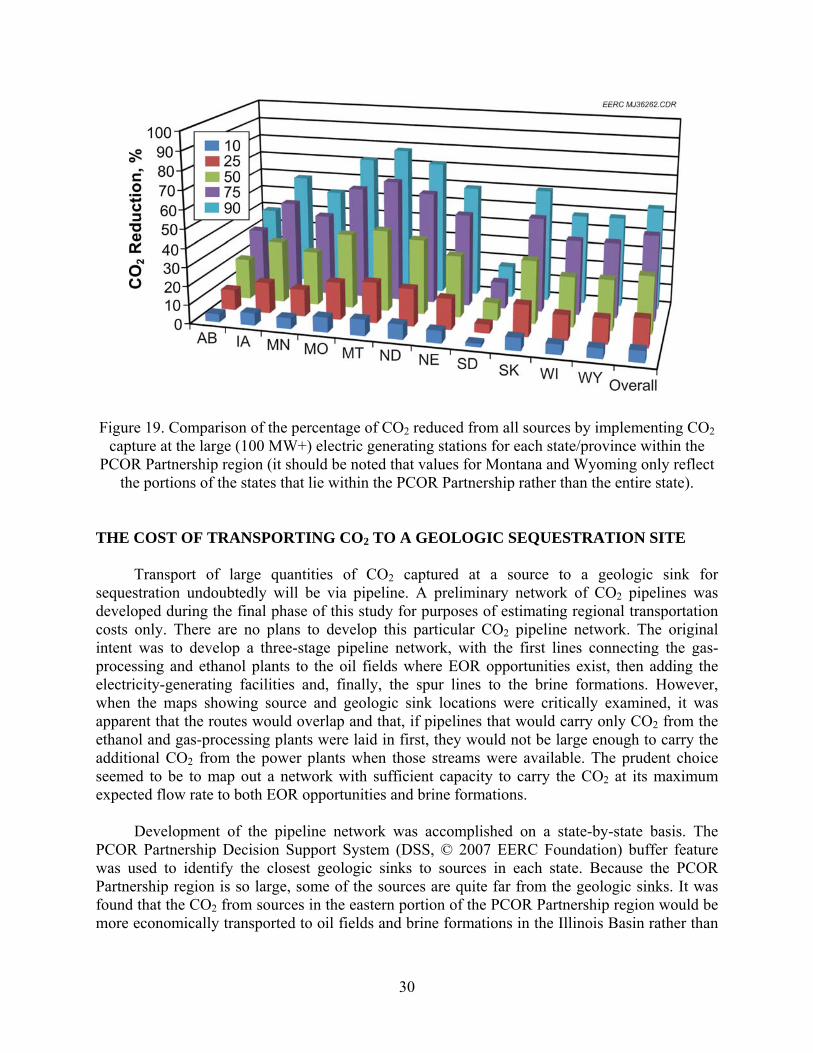
30
Figure 19. Comparison of the percentage of CO2 reduced from all sources by implementing CO2 capture at the large (100 MW+) electric generating stations for each state/province within the
PCOR Partnership region (it should be noted that values for Montana and Wyoming only reflect the portions of the states that lie within the PCOR Partnership rather than the entire state).
THE COST OF TRANSPORTING CO2 TO A GEOLOGIC SEQUESTRATION SITE Transport of large quantities of CO2 captured at a source to a geologic sink for sequestration undoubtedly will be via pipeline. A preliminary network of CO2 pipelines was developed during the final phase of this study for purposes of estimating regional transportation costs only. There are no plans to develop this particular CO2 pipeline network. The original intent was to develop a three-stage pipeline network, with the first lines connecting the gas-processing and ethanol plants to the oil fields where EOR opportunities exist, then adding the electricity-generating facilities and, finally, the spur lines to the brine formations. However, when the maps showing source and geologic sink locations were critically examined, it was apparent that the routes would overlap and that, if pipelines that would carry only CO2 from the ethanol and gas-processing plants were laid in first, they would not be large enough to carry the additional CO2 from the power plants when those streams were available. The prudent choice seemed to be to map out a network with sufficient capacity to carry the CO2 at its maximum expected flow rate to both EOR opportunities and brine formations. Development of the pipeline network was accomplished on a state-by-state basis. The PCOR Partnership Decision Support System (DSS, © 2007 EERC Foundation) buffer feature was used to identify the closest geologic sinks to sources in each state. Because the PCOR Partnership region is so large, some of the sources are quite far from the geologic sinks. It was found that the CO2 from sources in the eastern portion of the PCOR Partnership region would be more economically transported to oil fields and brine formations in the Illinois Basin rather than

31
Table 10. Geologic Sinks in Closest Proximity to PCOR Partnership CO2 Point Sources State/Province Geologic Sink Alberta EOR in Alberta British Columbia1 EOR in Alberta or brine formations in British Columbia Iowa EOR or brine formations in Illinois Basin Manitoba EOR in western Manitoba or southern Saskatchewan Minnesota EOR or brine formations in North Dakota Missouri EOR or brine formations in Illinois Basin Montana1 EOR in Montana or North Dakota; brine formations in Montana Nebraska EOR or brine formations in western Nebraska North Dakota EOR or brine formations in North Dakota Saskatchewan EOR in Alberta or southern Saskatchewan South Dakota EOR in western North Dakota or brine formation in South Dakota Wisconsin EOR or brine formations in Illinois Basin Wyoming1 EOR in Wyoming or brine formation in Montana 1 The only point sources considered in these states/provinces were those in the PCOR Partnership portion of the
state or province. to PCOR Partnership regional sinks. Table 10 summarizes the nearest sink areas for the sources in each of the states/provinces. For each state, a map showing all of the ethanol facilities, gas-processing plants, and power plants larger than 100 MW was generated using the DSS geographic information system (GIS)-mapping capabilities. The relationships between the sources and the nearest geologic sink(s) were noted and potential routes identified. Specific main trunk pipeline routes were determined using a GIS-based model for CO2 pipeline transport that was developed at the Massachusetts Institute of Technology (MIT) (Herzog, 2006; Massachusetts Institute of Technology, 2007). The MIT model calculates pipeline diameter and identifies the least cost path connecting a CO2 source to a given sink. The model implements 1 × 1-km obstacle grid layers in which local terrain, crossings, protected areas, and populated places are assigned relative cost factors that are used to determine the least cost route between a single CO2 source and a geologic sink. The cost of any booster stations was not included in the pipeline cost. To use the model, source and sink locations were selected, and both the mass flow rate of the CO2 stream and a cost of $70,000/in./mi were input (this cost was chosen because it was a “rule-of-thumb” pipeline cost estimate at the time this report was prepared). The mass flow rates that were used were the total CO2 stream produced by a source or group of sources that lay on the trunk route. This was done to ensure that the resulting pipeline network would have additional room for future capture at other industrial sources as it is unlikely that an entire pipeline network would be constructed more than once. The resulting output showed the least cost route and provided metrics for the route that included distance, pipeline diameter, construction cost, and O&M cost. These outputs are summarized on a state-by-state (or province-by-province) basis in Appendix E. While quite useful, the MIT pipeline-routing model has a few limitations. Pipeline-routing capabilities are limited to the United States; pipeline routes for the Canadian provinces had to be

32
estimated manually. The MIT model will not generate routes for distances less than about 25 mi. Although it takes obstacles into account when determining the least cost route, it does not include the additional costs to cross waterways or run through federal or tribal lands in its cost estimations. Rather, the model uses its default value of $50,000/in./mi for all distances. In an effort to make up for some of the underestimated obstacle crossings and to account for the rapid increase in the costs of steel and labor that will likely continue for the foreseeable future, the pipeline calculations were performed using a cost of $70,000 per in. diameter per mi. O&M costs were calculated to be $5000 per mile, irrespective of pipeline diameter. Pipelines were not considered if the only CO2 sources feeding the line were a few small ethanol plants as it would not be cost-effective to transport that relatively small quantity of CO2 by pipeline. This occurred in northeastern North Dakota, where two small ethanol plants are located as well as in Alberta where some sources were far from the trunk routes. Table 11 summarizes the PCOR Partnership regional pipeline network in terms of length, construction, and O&M costs, while Figure 20 shows a map of the preliminary pipeline network. The known routes of existing and planned CO2 pipelines (i.e., the Dakota Gasification Company’s pipeline from the Great Plains Synfuels Plant to the Weyburn oil field and the Enhance Energy CO2 pipeline planned for Alberta) were taken into account during the routing exercise. Based on proximity to the various geologic sinks, it would be less costly for the CO2 captured in Wisconsin, Iowa, and Missouri to be transported to coal beds, oil fields, and brine formations in the Illinois Basin. CO2 captured from plants in Nebraska likely would be sequestered in the geologic sinks located southwestern Nebraska. The CO2 captured from plants in the PCOR Partnership portion of Montana, Minnesota, South Dakota, and North Dakota would be transported to western North Dakota for EOR or to the vast brine formations of North and South Dakota. The CO2 captured at the Wyodak electricity-generating campus probably Table 11. Regional Pipeline Network Summary1 State/Province Length, miles Construction Cost, $M O&M Cost, $M/yr British Columbia2 269 143.7 1.34 Alberta 1293 1383.3 6.46 Saskatchewan 110 128.8 0.55 Manitoba –3 – – Montana2 367 532.5 1.84 Wyoming2 77 46.4 0.39 North Dakota 958 1712.0 4.79 South Dakota 915 884.0 4.58 Nebraska 1325 1639.0 6.61 Minnesota 1363 1370.5 7.02 Iowa 1312 1299.5 6.60 Missouri 986 1498.6 4.90 Wisconsin 871 1166.4 4.36 Regional Total 9846 11,547.1 49.44 1 This summary includes all pipelines of various diameters. Appendix E shows the various pipeline diameters and
lengths for each of the states/provinces. 2 Only includes the pipelines in the PCOR Partnership portion of the state/province. 3 Not applicable as there are no ethanol plants or electric generating facilities larger than 100 MW.

33
Figure 20. The illustrative PCOR Partnership pipeline network routes. Yellow gold routes show the pipeline network routes calculated during this study. Black lines are existing or planned CO2
pipelines.
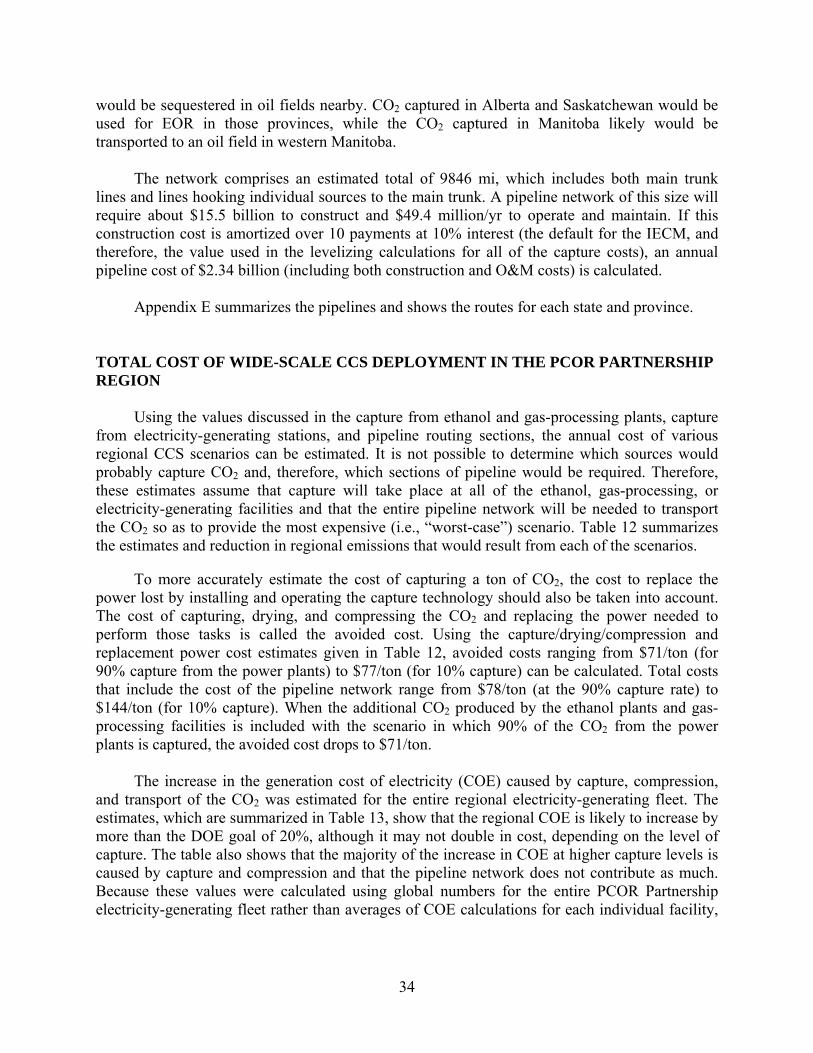
34
would be sequestered in oil fields nearby. CO2 captured in Alberta and Saskatchewan would be used for EOR in those provinces, while the CO2 captured in Manitoba likely would be transported to an oil field in western Manitoba. The network comprises an estimated total of 9846 mi, which includes both main trunk lines and lines hooking individual sources to the main trunk. A pipeline network of this size will require about $15.5 billion to construct and $49.4 million/yr to operate and maintain. If this construction cost is amortized over 10 payments at 10% interest (the default for the IECM, and therefore, the value used in the levelizing calculations for all of the capture costs), an annual pipeline cost of $2.34 billion (including both construction and O&M costs) is calculated. Appendix E summarizes the pipelines and shows the routes for each state and province. TOTAL COST OF WIDE-SCALE CCS DEPLOYMENT IN THE PCOR PARTNERSHIP REGION Using the values discussed in the capture from ethanol and gas-processing plants, capture from electricity-generating stations, and pipeline routing sections, the annual cost of various regional CCS scenarios can be estimated. It is not possible to determine which sources would probably capture CO2 and, therefore, which sections of pipeline would be required. Therefore, these estimates assume that capture will take place at all of the ethanol, gas-processing, or electricity-generating facilities and that the entire pipeline network will be needed to transport the CO2 so as to provide the most expensive (i.e., “worst-case”) scenario. Table 12 summarizes the estimates and reduction in regional emissions that would result from each of the scenarios. To more accurately estimate the cost of capturing a ton of CO2, the cost to replace the power lost by installing and operating the capture technology should also be taken into account. The cost of capturing, drying, and compressing the CO2 and replacing the power needed to perform those tasks is called the avoided cost. Using the capture/drying/compression and replacement power cost estimates given in Table 12, avoided costs ranging from $71/ton (for 90% capture from the power plants) to $77/ton (for 10% capture) can be calculated. Total costs that include the cost of the pipeline network range from $78/ton (at the 90% capture rate) to $144/ton (for 10% capture). When the additional CO2 produced by the ethanol plants and gas-processing facilities is included with the scenario in which 90% of the CO2 from the power plants is captured, the avoided cost drops to $71/ton. The increase in the generation cost of electricity (COE) caused by capture, compression, and transport of the CO2 was estimated for the entire regional electricity-generating fleet. The estimates, which are summarized in Table 13, show that the regional COE is likely to increase by more than the DOE goal of 20%, although it may not double in cost, depending on the level of capture. The table also shows that the majority of the increase in COE at higher capture levels is caused by capture and compression and that the pipeline network does not contribute as much. Because these values were calculated using global numbers for the entire PCOR Partnership electricity-generating fleet rather than averages of COE calculations for each individual facility,

35
Table 12. Annualized Cost of Various CCS Scenarios in the PCOR Partnership Region
Emissions, million tons
Annualized Cost,1 $ billions Total Annual
Cost, $ billions
Total Cost/ton,
$/ton
% Reduction in Regional CO2
Emissions3 Source Capture/Drying/
Compression Pipeline Replacement
Power2 Ethanol Plants, noncombustion
15.6
0.15 2.344 NA5 2.494 10/1606 3
Gas-Processing Plants
21.1 0.25 2.344 NA5 2.594 12/1236 4
Power Plants,7 10%
35.00 1.84 2.34 0.86 5.04 144 6
Power Plants,7 25%
87.48 3.85 2.34 2.24 8.43 96 15
Power Plants,7 50%
174.96 7.08 2.34 4.87 14.29 82 30
Power Plants,7 75%
262.44 10.48 2.34 7.88 20.70 79 45
Power Plants,7 90%
314.92 12.47 2.34 9.87 24.68 78 54
1 Calculated for pipelines and replacement power using Excel PMT function with interest = 10%, ten periods, payment at the beginning of the period. This approach produced the same annualized values as the IECM when comparison calculations were performed. The IECM was used to calculate annualized costs for capture, drying, and compression.
2 Cost of replacement power was the average of pc and IGCC plants; values taken from Figure 12 and amortized according to footnote “a” of this table.3 Total regional emission from industrial point sources is roughly 561,900,000 tons/yr. 4 It is unlikely that the entire pipeline network would be built out for only the ethanol and gas-processing plants. 5 Not applicable. 6 First cost listed is for capture/drying/compression only; second cost includes the cost of the entire pipeline network (not likely for only the ethanol and/or gas- processing plants). 7 Includes only the power plants >100 MW in size.
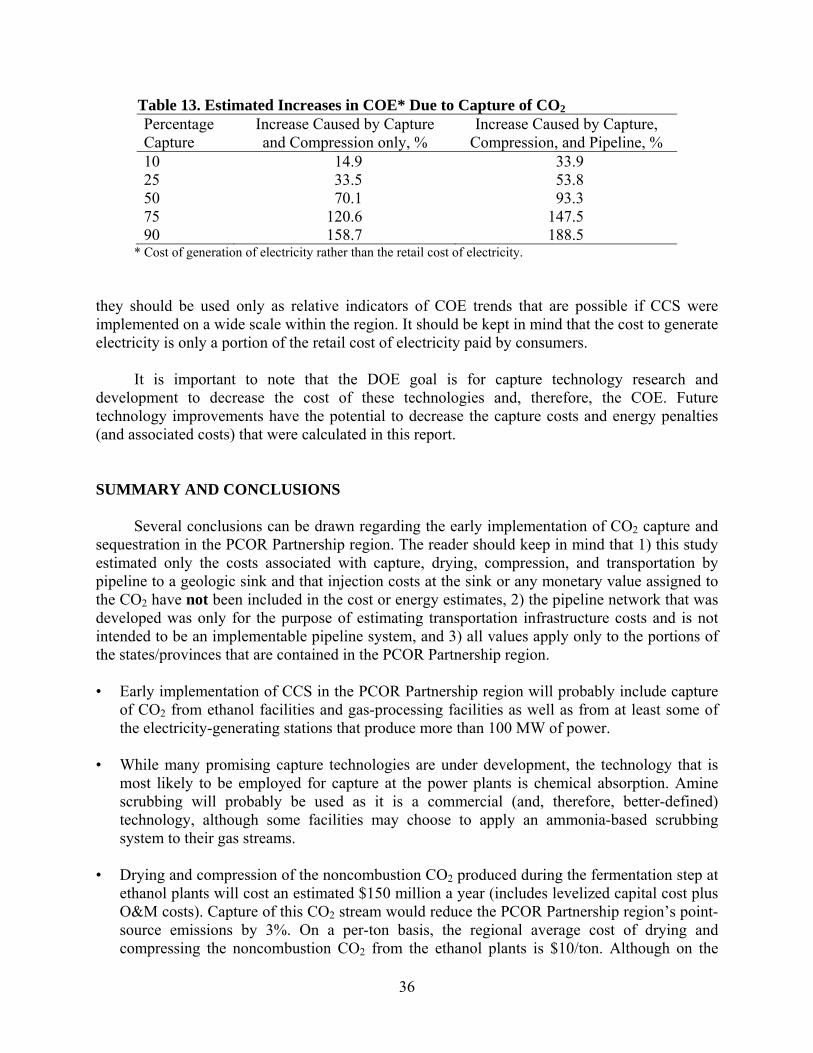
36
Table 13. Estimated Increases in COE* Due to Capture of CO2 Percentage Capture
Increase Caused by Capture and Compression only, %
Increase Caused by Capture, Compression, and Pipeline, %
10 14.9 33.9 25 33.5 53.8 50 70.1 93.3 75 120.6 147.5 90 158.7 188.5
* Cost of generation of electricity rather than the retail cost of electricity. they should be used only as relative indicators of COE trends that are possible if CCS were implemented on a wide scale within the region. It should be kept in mind that the cost to generate electricity is only a portion of the retail cost of electricity paid by consumers. It is important to note that the DOE goal is for capture technology research and development to decrease the cost of these technologies and, therefore, the COE. Future technology improvements have the potential to decrease the capture costs and energy penalties (and associated costs) that were calculated in this report. SUMMARY AND CONCLUSIONS Several conclusions can be drawn regarding the early implementation of CO2 capture and sequestration in the PCOR Partnership region. The reader should keep in mind that 1) this study estimated only the costs associated with capture, drying, compression, and transportation by pipeline to a geologic sink and that injection costs at the sink or any monetary value assigned to the CO2 have not been included in the cost or energy estimates, 2) the pipeline network that was developed was only for the purpose of estimating transportation infrastructure costs and is not intended to be an implementable pipeline system, and 3) all values apply only to the portions of the states/provinces that are contained in the PCOR Partnership region. • Early implementation of CCS in the PCOR Partnership region will probably include capture
of CO2 from ethanol facilities and gas-processing facilities as well as from at least some of the electricity-generating stations that produce more than 100 MW of power.
• While many promising capture technologies are under development, the technology that is
most likely to be employed for capture at the power plants is chemical absorption. Amine scrubbing will probably be used as it is a commercial (and, therefore, better-defined) technology, although some facilities may choose to apply an ammonia-based scrubbing system to their gas streams.
• Drying and compression of the noncombustion CO2 produced during the fermentation step at
ethanol plants will cost an estimated $150 million a year (includes levelized capital cost plus O&M costs). Capture of this CO2 stream would reduce the PCOR Partnership region’s point-source emissions by 3%. On a per-ton basis, the regional average cost of drying and compressing the noncombustion CO2 from the ethanol plants is $10/ton. Although on the

37
high end of the range, this cost is similar to compression costs found in the literature that range from $5.44 to $10.88/ton CO2. The higher cost is because the streams are often relatively small and unable to take advantage of the economy of large-scale processing.
• As shown in Table 5, capture, drying, and compression of the CO2 produced during
combustion at ethanol plants could reduce the PCOR Partnership region’s point-source CO2 emissions by 0.2% to 1.8% for capture of 10% to 90%, respectively. The levelized annual cost to capture, dry, and compress this stream would range from $281 million (for capture of 10% of the CO2) to $1.1 billion (for capture of 90% of the CO2). On a per-ton basis, costs to capture this CO2 range from $94/ton for 90% capture at one of the larger ethanol facilities to $1400/ton for 10% capture at one of the smaller facilities. It is unlikely that this combustion-produced CO2 would be captured at the ethanol facilities because of the cost.
• Drying and compression of the CO2 stream from the PCOR Partnership region’s gas-
processing facilities will require an expenditure of $255 million to capture the 21 million tons of CO2 produced each year, or $12/ton CO2. This accounts for roughly 4% of the region’s CO2 emission.
• The minimum cost of using MEA to scrub CO2 from the flue gas produced at a coal-fired
power plant, dry it, and compress it is estimated to be $46/ton to $49/ton of CO2 for 90% CO2 capture and 50% capture, respectively. Roughly $2.7 billion would be required annually to capture 10% of the CO2 from the region’s electricity-generating facilities. As much as $22.3 billion annually would be needed to capture 90% of the CO2.
• The replacement power requirement ranged from 1980 to 22,719 MW for 10% to 90% CO2
capture from the power plants, respectively. The replacement power is what would be needed to operate the CO2 capture plants at the electricity-generating stations as well as to capture the CO2 produced by generating the replacement power. The cost of replacement power is estimated to be $5.8 billion to $66.7 billion for these same levels of CO2 capture. Amortizing these values results in an annual cost of replacing the power used during capture and compression at power plants of $860 million to $9.87 billion.
• CO2 captured from facilities in Wisconsin, Iowa, and Missouri will probably be sequestered
in the Illinois Basin as those geologic sinks are located more proximally to the three states. CO2 captured from plants in Nebraska likely would be sequestered in the geologic sinks located in southwestern Nebraska. The CO2 captured from plants in the PCOR Partnership portion of Montana, Minnesota, South Dakota, and North Dakota would be transported to western North Dakota for EOR or to the vast brine formations of North and South Dakota. The CO2 captured at the Wyodak electricity-generating campus probably would be sequestered in oil fields nearby. CO2 captured in British Columbia and Alberta would be used for EOR in Alberta, while the CO2 captured in Saskatchewan likely would be transported to oil fields in that province.
• Pipeline transport of CO2 from the ethanol plants, gas-processing facilities, and electricity-
generating facilities larger than 100 MW to the geologic sinks will add $15.5 billion to the cost of CCS infrastructure in the region, or $2.34 billion per year.

38
The total cost of capture, drying/compression, and pipeline transportation within the PCOR Partnership region ranges from $5.08 billion/year for the CO2 produced at the gas-processing plants and during fermentation at the ethanol plants (i.e., the sources most likely to be among the first to apply CCS in the PCOR Partnership region) to $29.76 billion/yr for capture from all of the sources discussed in this report that are considered to make reasonable economic sense (the ethanol plants’ fermentation CO2, the gas-processing CO2, and 90% of the CO2 produced by the electricity-generating stations of the region that are larger than 100 MW). These two scenarios would reduce the region’s point-source CO2 emissions by 7% and 61%, respectively. On a per-ton basis, the scenario in which the ethanol plants’ fermentation CO2, the CO2 from the gas-processing plants, and 90% of the CO2 produced by the power plants is captured, dried and compressed, and transported by a pipeline network is $71/ton avoided. The increase in the cost of electricity caused by the capture, compression, and transport of the CO2 is estimated to be 34% to 189%. Maximizing the value-added benefits associated with EOR as a means of CO2 sequestration will help to offset these costs. Gaining experience through large-scale demonstrations and the earliest applications of CCS is likely to reduce the costs, as will improvements in existing capture technologies and development of new capture concepts. The estimated high cost of the capture, compression, and pipeline network required for effective wide-scale implementation of CCS as a means to reduce CO2 emission illustrates that additional research for cost-effective capture and compression technologies and judicious siting of pipeline networks are needed so that this approach can be implemented with minimal financial hardship on the region’s utilities, industries, and consumers. REFERENCES Cansolv, 2008, Process description: www.cansolv.com/en/co2capturedescription.ch2 (accessed
July 2008). Catacarb, 2008, Catacarb—the catalytic process for acid gas removal: www.catacarb.com
(accessed July 2008). Cullinane, J.T., and Rochelle, G.T., 2004, Carbon dioxide absorption with aqueous potassium
carbonate promoted by piperazine: Chemical Engineering Science, v. 59, no. 17, p. 3619–3630.
Dooley, J.J., Dahowski, R.T., Davidson, C.L., Wise, M.A., Gupta, N., Kim, S.H., and Malone,
E.L., 2006, Carbon dioxide capture and storage—a core element of a global energy technology strategy to address climate change: technology report prepared by the Battelle, Joint Global Change Research Institute, College Park, Maryland.
Energy Information Administration, 2008, Annual energy outlook 2008 with projections to 2030.
EIA report number DOE/EIA–0383(2008), www.eia.doe.gov/oiaf/aeo/ (accessed July 2008).

39
Energy Justice Network, 2007, Fact sheet—“clean coal” power plants (IGCC): www.energyjustice.net/coal/igcc/factsheet_long.pdf (accessed June 2008).
Environment Canada Facility GHG Reporting Search Data Web site,
www.ec.gc.ca/pdb/ghg/onlineData/dataSearch_e.cfm (accessed August 2009). Gray, M.L., Champagne, K.J., Soong, Y., Baltrus, J., Pennline, H., Stevens, R.W. Jr., Khatri, R.,
Chang, S.S.C., and Khan S., 2003, New solid amine sorbents, in Annual Conference on carbon sequestration, 2nd, May 5–8, 2003, Alexandria, Virginia, Proceedings.
Hawkeye Energy, 2008, Production process. www.hawkeye-energy.com/aspx/ production_process.aspx (accessed July 2008).
Herzog, H.A., 2006, GIS-based model for CO2 pipeline transport and source–sink matching
optimization: Presented at the WESTCARB Annual Business Meeting, Phoenix, Arizona, www.westcarb.org/Phoenix_pdfs/finalpdfs-11-08-06/17-Herzog_GIS.pdf (accessed May 2007).
Iijima, M., 2002, CO2 capture from gas power plants: Presented at the IEA advisory group on oil
and gas technology, Stavanger, Norway, November 15, 2002. Imai, N., 2003, Advanced solvent to capture CO2 from flue gas: Presented at the 2nd
International Forum on Geologic Sequestration of CO2 in Deep, Unminable Coal Seams “coal-seq,” Washington, D.C., March 7, 2003.
Integrated Environmental Control Model, 2008, www.iecm-online.com (accessed July 2008). International Energy Agency Greenhouse Gas R&D Programme, 2008, CO2 capture and storage
RD&D projects database: www.co2captureandstorage.info/search.php (accessed July 2008). Jensen, M.D., Musich, M.A., Ruby, J.D., Steadman, E.N., and Harju, J.A., 2005, Carbon
separation and capture: Grand Forks, North Dakota, Energy & Environmental Research Center, 27 p.
Massachusetts Institute of Technology, 2007, CO2 pipeline transport and cost model
(Version 2), software user’s guide: http://e40-hjh-server1.mit.edu/energylab/wikka.php? wakka=MIT (accessed June 2008).
Metz, B., Davidson, O., de Coninck, H., Loos, M., and Meyer, L., eds., 2005, IPCC special
report on carbon dioxide capture and storage: New York, Cambridge University Press, 431 p.
New York Academy of Sciences, 2008, Coal without guilt? Technologies for zero emission
power systems: Meeting report at http://64.233.167.104/search?q=cache:POXW x_mVaHMJ:www.nyas.org/ebrief/miniEB.asp%3FebriefID%3D720+CO2+produced+by+a+500-MW+coal-fired+power+plant&hl=en&ct=clnk&cd=3&gl=us (accessed July 2008).
40
Power, 2008, Carbon capture—inside Alstom’s chilled ammonia CO2 capture system. www.powermag.com/SideBar.asp?y=2008&m=february&a=38-F_CC-Box1 (accessed July 2008).
Powerspan, 2008, ECO2™ technology overview: www.powerspan.com/technology/eco2_
overview.shtml (accessed July 2008). Reddy, S., 2008, Econamine FG plusSM technology for postcombustion CO2 capture: Presented at
the 11th Meeting of the International Postcombustion CO2 Capture Network, Vienna, Austria, May 20–21, 2008.
Reddy, S., Scherffius, J., Freguia, S., and Roberts, C., 2003, Fluor’s Econamine FG plusSM
technology―an enhanced amine-based CO2 capture process: Presented at the 2nd National Conference on Carbon Sequestration, Alexandria, Virginia, May 5–8, 2003.
UOP LLC, 2008, UPO Benfield process. www.uop.com/objects/Benfield_process.pdf (accessed
July 2008). U.S. Department of Energy Regional Carbon Sequestration Partnerships Capture and
Transportation Working Group, 2008, CO2 point source emission estimation methodologies summary: U.S. Department of Energy National Energy Technology Laboratory, 35 p.
Van Holst, J., Politiek, P.P., Niederer, J.P.M., and Versteeg, G.F., 2006, CO2 capture from flue
gas using amino acid salts: Presented at the 8th International Conference on Greenhouse Gas Control Technologies; Trondheim, Norway, June 19–22, 2006.
Veawab, A., Aroonwilas, A., Chakma, A., and Tontiwachwuthikul, P., 2001, Solvent
formulation for CO2 separation from flue gas streams, in National Conference on Carbon Sequestration, 1st, May 14–17, 2001, Washington, D.C., Proceedings.
Worrell, E., Price, L., Martin, N., Hendriks, C., and Meida, L.O., 2001, Carbon dioxide
emissions from the global cement industry: Annual Review of Energy and Environment, v. 26, p. 303–329.

APPENDIX A
MODEL SIMULATIONS OF THE CAPTURE OF CO2 FROM ELECTRICITY-GENERATING
STATIONS FOR EACH STATE OR PROVINCE WITHIN THE PCOR PARTNERSHIP REGION

A-1
MODEL SIMULATIONS OF THE CAPTURE OF CO2 FROM ELECTRICITY-GENERATING STATIONS FOR EACH STATE OR PROVINCE WITHIN THE PCOR
PARTNERSHIP REGION
This appendix presents the results of model simulations that were conducted for each state or province to examine the capture of CO2 from its electricity-generating stations. The technical approach used is presented, followed by the model simulation results for each state or province. TECHNICAL APPROACH The electricity-generating stations were identified in each of the states and provinces of the Plains CO2 Reduction (PCOR) Partnership. Only those stations larger than 100 MW were targeted for CO2 capture. For each of these stations, the CO2 emissions were estimated (tons per year) and the characteristics of the individual generating units were summarized, including information such as the type and size of each boiler, the type of fuel used, and the existence and type of particulate and SO2 control, if any. The costs associated with CO2 capture include several discrete cost elements. First, the cost of CO2 capture was estimated using a monoethanolamine (MEA) scrubbing system. Costs associated with removal efficiencies of 10%, 25%, 50%, 75%, and 90% were estimated. Second, if a generating unit did not have sulfur control, the cost of incorporating a wet flue gas desulfurization (WFGD) unit was added to the cost of CO2 capture because it was determined that it was more cost-effective to remove the SO2 prior to CO2 capture than to pay the increase in operating costs associated with processing of the SO2-laden gas in the MEA system. This cost penalty is associated with the increase in solvent degradation that occurs in the MEA scrubbing system as a result of the presence of SO2. Lastly, in addition to these operating costs, the costs associated with replacing the power that was consumed as part of the CO2 recovery operations, i.e., replacement power, was also estimated and included in the cost analysis. This cost estimate was based on the use of either scrubbed coal in the existing generation unit or the addition of an integrated gasification combined cycle (IGCC) to generate the replacement power. In both cases, it was assumed that the capture of the additional CO2 that was generated during this additional power production would take place at the capture levels cited above. The Integrated Environmental Control Model (IECM) was used to estimate the capital and operating costs of the MEA scrubbing system as well as the cost of the WFGD unit. The cost for the replacement of the power that is consumed by CO2 capture was estimated using a combination of sources. For IGCC, the cost range was estimated to be $2431 to $3593 per kW. The low end of this range was generated using the IECM while the upper end of the range came from the Excelsior Energy Mesaba Project. The generation of replacement power using scrubbed coal was estimated as $2279 to $2726 per kW. The low end of this range came from Energy Information Administration (EIA) assumptions to the Annual Energy Outlook 2008; the upper range was estimated using the IECM.

A-2
PRESENTATION OF MODEL SIMULATION RESULTS For each state/province, the characteristics of the generating units greater than 100 MW are summarized, and their locations are provided on a map of the state/province. The CO2 emissions from these units are provided, expressed as annual emission rates (i.e., tons per year). The annual quantities of CO2 (tons per year) that are captured are also presented for a range of capture percentages, i.e., 10%, 25%, 50%, 75%, and 90%, and these reductions are also expressed as the percentage of the total CO2 emissions from all of the generating stations (<100 MW as well as >100 MW) and of the total CO2 emissions from all CO2 sources (electricity generation plus all others) within the state/province of interest. The energy penalty associated with the capture of CO2 (MEA scrubber and WFGD unit) is also presented for each level of removal. The penalty is expressed as the percentage of gross output of the generating units. However, the capital cost for providing replacement power is only presented for the 90% removal scenario, without consideration of the additional operating and maintenance costs. Because of the uncertainty associated with this cost element of CO2 capture, the cost of providing this replacement power is assumed to be the average cost of the minimum and maximum replacement costs estimated based on the use of scrubbed coal in the existing generating units or the addition of an IGCC system. Finally, costs for the capture of the CO2 are also provided in terms of $ per ton of CO2 removed as well as the annual levelized cost. These cost estimates include estimates of both capital as well as operating and maintenance costs. Alberta Alberta has 19 electricity-generating stations that emit more than 54,300,000 tons of CO2 annually. Of these stations, eight are larger than 100 MW. These eight generating stations consist of 19 separate generating units, the characteristics of which are summarized in Table A-1 along with a map showing their locations within the province. The units are very similar in that they each burn subbituminous coal in a tangentially fired (T-fired) boiler and have a cold-side electrostatic precipitator (ESP) for particulate matter (PM) control. It was found that most of the units are not equipped with any SOx control. Therefore, the cost of incorporating a WFGD unit was added to the cost of capturing CO2 for the appropriate amount of flue gas treated to obtain the different CO2 capture rates. The units vary in size from 100 MW (McKay River Power Plant) to the Genesee 3 Station, which has a capacity of 450 MW. The total generation capacity of the units considered for CO2 capture in the Alberta region was 6159 MW. The CO2 generated annually from these 19 units is approximately 45,700,000 tons, which is about 84% of the CO2 generated from all 19 generating stations in Alberta. The results from the model simulations (Table A-2) show a significant cost and energy penalty for capturing 90% of the CO2 emitted from these units. The energy that would be consumed at this level of capture is 2189 MW, which is 35.5% of the current gross output of these units, as compared to an energy consumption of 243 MW (about 4% of the gross output) at the 10% capture level. At the average projected cost of power replacement, $2936/kW (i.e., the average of the minimum cost projection using scrubbed coal, $2431/kW, and the maximum of using IGCC, $3593/kW), the total cost for power replacement at the 90% capture level is estimated to be about $6.4 billion. Figure A-1 shows the predicted power requirement (expressed as MW) as a function of the percentage of the CO2 that is captured. The figure also shows the

A-3
total cost of CO2 capture ($ per ton of CO2), again as a function of the percentage of CO2 that is captured. From this graphic, it can be seen that the cost of CO2 capture ($/ton) is relatively high ($94/ton) at low capture rates, i.e., 10%, but drops quickly as the percentage of CO2 captured is increased, leveling off at $51 to $46/ton for 50% to 90% CO2 capture, respectively. This downward trend is observed because of the ability to spread the high capital investment over larger quantities of carbon dioxide increases as the amount of carbon dioxide capture increases. In terms of levelized annual costs, Figure A-1 shows that it increases from $250 M per year (10% CO2 capture) to $1587 M per year (90% CO2 capture). At the highest rate of capture (90%), there would be an estimated 41,105,000 tons of CO2 captured, or roughly 87% of all the CO2 produced by the 15 electricity-generating stations in Alberta. Given that the total CO2 produced in Alberta is roughly 115,600,000 tons per year, a 90% CO2 capture achieved from the >100 MW electricity-generating stations yields an overall CO2 reduction of 35.5% for the province. As noted above, the total CO2 capture cost required to achieve this reduction would be $1.6 billion annually plus the additional cost of replacing the lost generation capacity.

A-4
Table A-1. Location and Summary of Characteristics of Electricity-Generating Units (>100 MW) in Alberta
Unit ID
CO2 Emissions, tons/year1
Unit Size, MW Fuel Type2
Boiler Type3
SO2 Control
PM Control
Sundance Gen Unit 1 16,343,514
300 Subbitum. T-fired None C-ESP4 Sundance Gen Unit 2 300 Subbitum. T-fired None C-ESP Sundance Gen Unit 3 375 Subbitum. T-fired None C-ESP Sundance Gen Unit 4 375 Subbitum. T-fired None C-ESP Sundance Gen Unit 5 375 Subbitum. T-fired None C-ESP Sundance Gen Unit 6 387 Subbitum. T-fired None C-ESP Genesee Station 1 6,733,497 410 Subbitum. T-fired None ESP Genesee Station 2 410 Subbitum. T-fired None ESP Genesee Station 3 450 Subbitum. T-fired DFGD5 FF6 Sheerness Gen Station No. 1 6,600,745 380 Subbitum. T-fired None C-ESP Sheerness Gen Station No. 1 380 Subbitum. T-fired None C-ESP Keephills Gen Plant 1 5,989,611 403 Subbitum. T-fired None C-ESP Keephills Gen Plant 2 403 Subbitum. T-fired None C-ESP Battle River Gen Station 1 5,155,346 148 Subbitum. T-fired None C-ESP Battle River Gen Station 2 148 Subbitum. T-fired None C-ESP Battle River Gen Station 3 370 Subbitum. T-fired None C-ESP Wabamun Gen Plant 3,165,672 300 Subbitum. T-fired None NA7 H. R. Milner Gen Station 959,369 145 Subbitum. W-fired None FF McKay River Power Plant 775,015 100 Subbitum. NA None NA 1 As shown in the PCOR Partnership Decision Support System (DSS, © 2007 EERC Foundation) from estimations and actual reporting data.
2 Subbituminous coal. 3 W-fired: wall-fired. 4 Cold-side ESP. 5 Dry flue gas desulfurization. 6 Fabric filter. 7 Not applicable.

A-5
Figure A-1. Results from implementing CO2 capture on electricity-generating units larger than 100 MW in Alberta.

A-6
Table A-2. Summary of CO2 Capture Costs for >100 MW Electricity-Generating Stations in Alberta Carbon Capture, % 10 25 50 75 90
45,672,247 tons CO2 emissions per year for units of >100 MW CO2 Captured
tons per year 4,567,225 11,418,062 22,836,124 31,254,186 41,105,023 Energy Assessment
Gross Electrical Output, MW
6159 6159 6159 6159 6159
Auxiliary Load, MW Amine Scrubber, MW
225 562 1125 1687 2025
WFGD Use, MW 18 46 91 137 164 Total Aux Load, MW
243 608 1216 1824 2189
% of Gross Output 3.9 9.9 19.7 29.6 35.5
Cost of Capture $M/yr $/ton CO2 $M/yr
$/ton CO2 $M/yr
$/ton CO2 $M/yr $/ton CO2 $M/yr
$/ton CO2
Annual Cost SO2 Removal
178 39 206 18 251 11 297 9 325 8
Total Levelized Annual Costa
250 94 501 62 903 51 1338 48 1587 46
a Includes the costs associated with both SO2 and CO2 removal.

A-7
Iowa Iowa has 23 electricity-generating stations that emit more than 39,078,000 tons of CO2 annually. Of these 23 stations, 11 are larger than 100 MW. The 11 generating stations consist of 13 separate generating units, the characteristics of which are summarized in Table A-3 along with a map showing their locations within the state. The units are very similar: the primary fuel is subbituminous coal and the boiler is tangentially fired, with a C-ESP for PM control. Most of the units are not equipped with any sort of SOx control. Therefore, the cost of incorporating a WFGD unit was added to the cost of capturing CO2 for the appropriate amount of flue gas treated to obtain the different CO2 capture rates. The units varied in size from 148 MW (George Neal North 1) to 740 MW (Louisa Station). The total generation capacity of the units considered for CO2 capture is 5165 MW. The CO2 generated from these 13 units totals approximately 36,500,000 tons of CO2 per year, or roughly 93% of the CO2 generated from all 23 generating stations in Iowa (39,078,000 tons per year). The results from the model simulations (Table A-4) show an energy penalty of as much as 33% for capturing 90% of the CO2 emitted from these electricity-generating units. The cost associated with this energy requirement of 1712 MW (Table A-4) is estimated at about $5.2 billion (capital costs only), based on the average power cost of $2936 per kW. The observed trends in the power penalty and cost data, shown in Figure A-2, are similar to what was observed in Alberta, with the highest cost for CO2 capture at the capture level of 10% (i.e., $86 per ton) followed by a leveling of the costs at $51 and $48 per ton for capture rates of 50% and 90%, respectively, and the levelized costs ranging from $199 million per year (for 10% CO2 capture) to $1357 million per year (90% capture). At the highest rate of capture, there would be an estimated 32,867,000 tons of CO2 captured, which is 84% of all the CO2 produced by the 23 electricity-generating stations in Iowa. Given that the total CO2 produced in Iowa is estimated at about 54,600,000 tons per year, a 90% CO2 capture achieved from the >100 MW electricity-generating stations yields an overall CO2 reduction of 60% for the state. The total CO2 capture cost required to achieve this reduction would be about $1.4 billion annually plus the additional cost of replacing the lost generation capacity.

A-8
Table A-3. Location and Summary of Characteristics of Electricity-Generating Units (>100 MW) in Iowa
Unit ID
CO2 Emissions, tons/year1
Unit Size, MW Fuel Type
Boiler Type
SO2 Control
PM Control
George Neal North 1 7,043,476 148 Subbitum. Cyclone None H-ESP2 George Neal North 2 350 Subbitum. W-fired None C-ESP George Neal North 3 550 Subbitum. W-fired None C-ESP Council Bluffs 3 5,786,096 725 Subbitum. W-fired None C-ESP Louisa 4,846,897 740 Subbitum. W-fired None H-ESP Ottumwa 1 4,714,088 726 Subbitum. T-fired None C-ESP George Neal South 4,673,886 650 Subbitum. W-fired None C-ESP Muscatine 2,006,515 180 Subbitum. T-fired WFGD3 C-ESP Lansing 4 1,658,922 263 Subbitum. W-fired None ESP Burlington 1,466,982 212 Subbitum. T-fired None NA Sutherland 1,394,454 157 Subbitum. NA None NA Prairie Creek 1,197,431 245 Subbitum. NA None NA Milton L Kapp 2 1,188,717 219 Subbitum. T-fired None ESP 1 As shown in the PCOR Partnership Decision Support System (DSS, © 2007 EERC Foundation) from estimations and actual reporting data.
2 Hot-side ESP. 3 Wet flue gas desulfurization.

A-9
Table A-4. Summary of CO2 Capture Costs for >100 MW Electricity-Generating Stations in Iowa Carbon Capture, % 10 25 50 75 90
36,519,363 tons of carbon dioxide emissions per year for units of >100 MW CO2 Captured
tons per year 3, 651,936 9,129,840 18,259,680 27,389,520 32,867,420 Energy Assessment
Gross Electrical Output, MW
5165 5165 5165 5165 5165
Auxiliary Load, MW Amine Scrubber, MW
176 441 882 1323 1588
WFGD Use, MW 14 35 69 104 124 Total Aux. Load, MW
190 476 951 1427 1712
% of Gross Output 3.7 9.2 18.4 27.6 33.1
Cost of Capture $M/yr $/ton CO2 $M/yr
$/ton CO2 $M/yr
$/ton CO2 $M/yr
$/ton CO2 $M/yr
$/ton CO2
Annual Cost SO2 Removal
115 31 136 15 170 9 205 7 225 7
Total Levelized Annual Costa
199 86 418 61 759 51 1143 49 1357 48
a Includes the costs associated with both SO2 and CO2 removal.
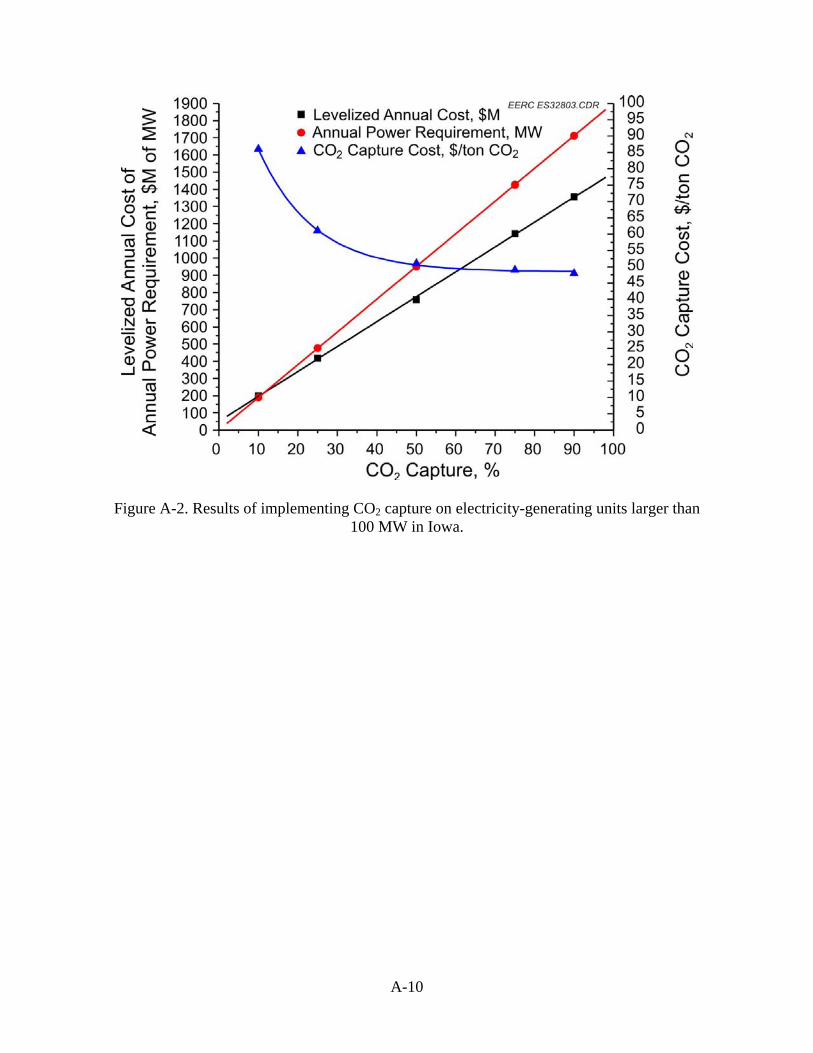
A-10
Figure A-2. Results of implementing CO2 capture on electricity-generating units larger than 100 MW in Iowa.

A-11
Minnesota Minnesota has 28 electricity-generating stations that emit more than 40,400,000 tons of CO2 annually. Of these 28 stations, eight are larger than 100 MW. The eight generating stations consist of 15 separate generating units, the characteristics of which are summarized in Table A-5 along with a map showing their locations within the state. The units vary in terms of boiler type, size, and existing pollution control equipment. The units all fire a subbituminous coal as the primary fuel and a significant number of the units are equipped with SOx control. In those instances where there is no SOx control, a WFGD unit was added to reduce the overall cost of CO2 capture. The generating units vary in size from 100 MW (High Bridge 5) to 900 MW (Sherco 3). The total generation capacity of the units considered for CO2 capture is 5241 MW. The CO2 generated from these 15 units totals approximately 40,200,000 tons of CO2 per year, roughly 99% of the CO2 generated from all 28 generating stations in Minnesota. The results from the model simulations (Table A-6) show an energy penalty of 34.5% for capturing 90% of the CO2 emitted from these electricity-generating units. The cost associated with this energy requirement of 1808 MW is estimated at roughly $5.3 billion (capital costs only), based on the average power cost of $2936 per kW. The predicted trends in the power penalty and cost data (shown in Figure A-3) are similar to what was previously observed for other states/provinces, with the highest cost for CO2 capture at the capture level of 10% (i.e., $69 per ton) followed by a leveling of the costs at $44 and $41 per ton for capture rates of 50% and 90%, respectively, and the levelized costs ranging from $207 million per year (for 10% CO2 capture) to $1414 million per year (for 90% capture). At the highest rate of capture, there would be an estimated 37,660,000 tons of CO2 captured, which is 93% of all the CO2 produced by the 28 electricity-generating stations in Minnesota. Given that the total CO2 produced in Minnesota is estimated at nearly 59,100,000 tons per year, a 90% CO2 capture achieved from the >100 MW electricity-generating stations yields an overall CO2 reduction of nearly 64% for the state. The total CO2 capture cost required to achieve this reduction would be $1.4 billion annually plus the additional cost of replacing the lost generation capacity.

A-12
Table A-5. Location and Summary of Characteristics of Electricity-Generating Units (>100 MW) in Minnesota
Unit ID
CO2 Emissions, tons/year1
Unit Size, MW Fuel Type
Boiler Type
SO2 Control
PM Control
Sherburne County No. 1 18,003,648 750 Subbitum. T-fired WFGD C-ESP Sherburne County No. 2 750 Subbitum. T-fired WFGD C-ESP Sherburne County No. 3 900 Subbitum. W-fired Dry lime FF Boswell Energy Center No. 1 8,107,209 364 Subbitum. T-fired WFGD C-ESP Boswell Energy Center No. 2 558 Subbitum. T-fired FGD C-ESP Allen S. King No. 1 3,450,149 542 Subbitum. Cyclone None C-ESP Allen S. King No. 2 1,856,715 230 Subbitum. NA None NA Black Dog No. 2 2,125,518 140 Subbitum. FBC2 None C-ESP Black Dog No. 3 110 Subbitum. W-fired None C-ESP Black Dog No. 4 185 Subbitum. W-fired None C-ESP High Bridge No. 5 1,788,938 100 Subbitum. W-fired None C-ESP High Bridge No. 6 156 Subbitum. W-fired None C-ESP Riverside 2,257,109 216 Subbitum. Cyclone None C-ESP Taconite Harbor Energy 1,723,608 130 Subbitum. NA None NA Syl Laskin 958,729 110 Subbitum. T-fired FGD NA 1 As shown in the PCOR Partnership Decision Support System (DSS, © 2007 EERC Foundation) from estimations
and actual reporting data. 2 FBC: fluidized-bed combustor.

A-13
Table A-6. Summary of CO2 Capture Costs for >100 MW Electricity-Generating Stations in Minnesota Carbon Capture, % 10 25 50 75 90
40,272,000 tons of carbon dioxide emissions per year for units of >100 MW CO2 Captured
tons per year 4,027,200 10,068,000 20,136,000 30,204,000 36,244,800 Energy Assessment
Gross Electrical Output, MW
5241 5241 5241 5241 5241
Auxiliary Load, MW Amine Scrubber, MW
195 488 977 1465 1758
WFGD Use, MW 6 14 28 41 50 Total Aux Load, MW
201 502 1004 1507 1808
% of Gross Output 3.8 9.6 19.2 28.8 34.5
Cost of Capture $M/yr $/ton CO2 $M/yr
$/ton CO2 $M/yr
$/ton CO2 $M/yr $/ton CO2 $M/yr $/ton CO2
Annual Cost SO2 Removal
82 20 91 9 106 5 121 4 130 3
Total Levelized Annual Costa
207 69 435 50 811 44 1191 42 1414 41
a Includes the costs associated with both SO2 and CO2 removal.

A-14
Figure A-3. Results from implementing CO2 capture on electricity-generating units larger than 100 MW in Minnesota.

A-15
Missouri Missouri has 36 electricity-generating stations that emit more than 83,200,000 tons of CO2 annually. Of these 36 stations, 14 are larger than 100 MW. These 14 generating stations consist of 27 separate generating units, the characteristics of which are summarized in Table A-7 along with a map showing their locations within the state. The units vary in terms of boiler type and size and existing pollution control equipment. The units primarily fire a subbituminous coal as the primary fuel, with three stations burning a bituminous–subbituminous coal blend and one station burning pure bituminous coal. It was found that almost none of the units is equipped with any SOx control systems. In cases where there is no SOx control, a WFGD unit was added to reduce the overall cost of CO2 capture. The units vary in size from 105 MW (James River 5) to 670 MW (Latan 1 and Thomas Hill 3). The total generation capacity of the units considered for CO2 capture is 10,836 MW. The CO2 generated from these 27 units totals approximately 79,030,000 tons of CO2 per year, roughly 95% of the CO2 generated from all 36 generating stations in the state (83,200,000 tons per year). The results from the model simulations are summarized in Table A-8. These results show an energy penalty of 33.5% for capturing 90% of the CO2 emitted from these units. The cost associated with this energy penalty of 3629 MW is estimated to be $10.6 billion (capital costs, only), based on an average power cost of $2936 per kW. The predicted trends in the power penalty and cost of CO2 capture as a function of the capture percentage of CO2 are presented in Figure A-4. The power penalty increases linearly with the percentage of carbon capture, increasing from 403 MW (3.7% of the total output of the units that are >100 MW) to 3629 MW (33.5% of the total output of the units that are >100 MW). This is shown in Figure A-4. The figure also shows that, at the same time, the cost of CO2 capture decreases from $83/ton of CO2 captured (10% CO2 capture rate) to between $49 and $46 per ton of CO2 captured for capture rates of 50% and 90%, respectively, while the levelized annual cost, not including the cost of replacement power, increases from $403 million to $2.75 billion. At the highest rate of capture, there would be approximately 71,124,000 tons of CO2 captured, which is roughly 85% of all the CO2 produced by the 36 electricity-generating stations in Missouri. Given that the total CO2 produced in the state from all sources is 97,600,000 tons per year, a 90% CO2 capture rate for electricity-generating stations >100 MW yields an overall CO2 reduction of 73% for the entire state. As noted above, the cost of achieving this CO2 capture is estimated to be approximately $2.8 billion annually plus the additional cost of replacing the lost generation capacity.

A-16
Table A-7. Location and Summary of Characteristics of Electricity-Generating Units (>100 MW) in Missouri
Unit ID
CO2 Emissions, tons/year1
Unit Size, MW Fuel Type
Boiler Type
SO2 Control
PM Control
Labadie No. 1 17,458,154 574 Subbitum. T-fired None C-ESP Labadie No. 2 574 Subbitum. T-fired None C-ESP Labadie No. 3 621 Subbitum. T-fired None C-ESP Labadie No. 4 621 Subbitum. T-fired None C-ESP Thomas Hill No. 1 8,692,178 180 Subbitum. Cyclone None C-ESP Thomas Hill No. 2 285 Subbitum. Cyclone None C-ESP Thomas Hill No. 3 670 Subbitum. W-fired None C-ESP Rush Island No. 1 8,646,702 620 Subbitum. T-fired None C-ESP Rush Island No. 2 620 Subbitum. T-fired None C-ESP New Madrid No. 1 7,757,564 600 Subbitum. Cyclone None C-ESP New Madrid No. 2 600 Subbitum. Cyclone None C-ESP Meramec No. 1 6,628,037 138 Bitum.–Sub. T-fired None C-ESP Meramec No. 2 138 Bitum.–Sub. T-fired None C-ESP Meramec No. 3 289 Bitum.–Sub. F-fired3 None C-ESP Meramec No. 4 360 Bitum.–Sub. F-fired None C-ESP Sioux No. 1 6,273,478
550 Bitum.–Sub. Cyclone None C-ESP
Sioux No. 2 550 Bitum.–Sub. Cyclone None C-ESP Latan No. 1 5,397,589 670 Subbitum. W-fired None C-ESP Hawthorn No. 5 4,532,076 476 Subbitum. T-fired None C-ESP Montrose No. 1 3,803,834 170 Subbitum. T-fired None C-ESP Montrose No. 2 164 Subbitum. T-fired None C-ESP Montrose No. 3 176 Subbitum. T-fired None C-ESP Sibley No. 3 3,167,591 411 Subbitum. Cyclone None C-ESP Sikeston No. 1 2,246,389 261 Subbitum. W-fired None C-ESP James River No. 5 1,647,963 105 Bitum.4 W-fired None C-ESP Asbury No. 1 1,604,015 213 Bitum.–Sub. Cyclone None C-ESP Southwest-Springfield 1,433,865 200 Subbitum. W-fired FGD C-ESP 1 As shown in the PCOR Partnership Decision Support System (DSS, © 2007 EERC Foundation) from estimations and actual reporting data.
2 Bitum.–Sub.: mix of bituminous and subbituminous coals.3 F-fired: front-fired.4 Bitum.: bituminous coal.
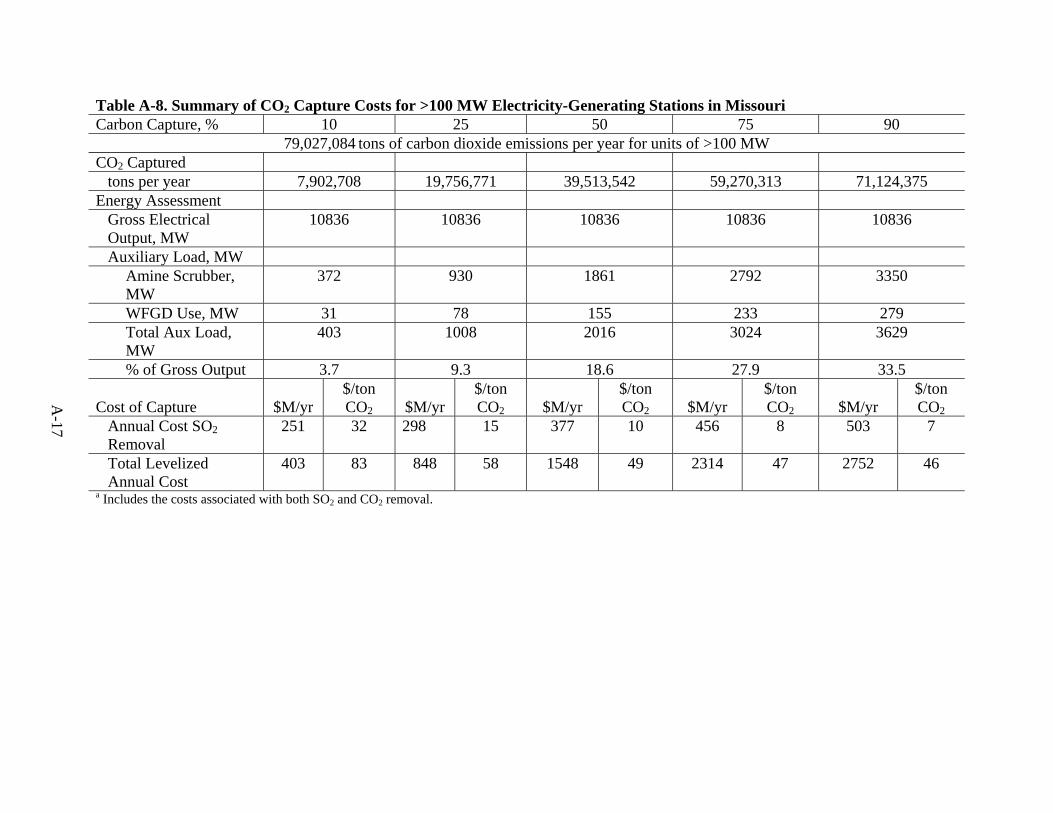
A-17
Table A-8. Summary of CO2 Capture Costs for >100 MW Electricity-Generating Stations in Missouri Carbon Capture, % 10 25 50 75 90
79,027,084 tons of carbon dioxide emissions per year for units of >100 MW CO2 Captured
tons per year 7,902,708 19,756,771 39,513,542 59,270,313 71,124,375 Energy Assessment
Gross Electrical Output, MW
10836 10836 10836 10836 10836
Auxiliary Load, MW Amine Scrubber, MW
372 930 1861 2792 3350
WFGD Use, MW 31 78 155 233 279 Total Aux Load, MW
403 1008 2016 3024 3629
% of Gross Output 3.7 9.3 18.6 27.9 33.5
Cost of Capture $M/yr $/ton CO2 $M/yr
$/ton CO2 $M/yr
$/ton CO2 $M/yr
$/ton CO2 $M/yr
$/ton CO2
Annual Cost SO2 Removal
251 32 298 15 377 10 456 8 503 7
Total Levelized Annual Cost
403 83 848 58 1548 49 2314 47 2752 46
a Includes the costs associated with both SO2 and CO2 removal.

A-18
Figure A-4. Results from implementing CO2 capture on electricity-generating units larger than 100 MW in Missouri.

A-19
Montana Only the eastern half of Montana is contained in the PCOR Partnership region. In that area, Montana has six electricity-generating stations that emit more than 20,970,000 tons of CO2 annually. Of these six stations, two are larger than 100 MW: Colstrip and J.E. Corette. The two generating stations consist of five separate generating units, the characteristics of which are summarized in Table A-9 along with a map showing their locations within the state. The units are the same in terms of boiler design and fuel type. All of the units, except the unit at the J.E. Corette Station, are equipped with SOx control equipment. As such, a WFGD unit was added to this unit to reduce the overall cost of capturing CO2. The units vary in size from 191 MW (J.E. Corette) to 778 MW (Colstrip 3 and 4). The total generation capacity of the units considered for CO2 capture is 2467 MW. The CO2 generated from these five units is approximately 19,152,000 tons of CO2 per year (20,105,280 tons per year), roughly 91% of the CO2 generated from all six generating stations in Montana. The results from the model simulations are summarized in Table A-10. These results indicate that there is an energy penalty of 34.4% associated with capturing 90% of the CO2 emitted from these units. The cost penalty associated with this energy requirement of 849 MW is estimated at $2.5 billion (capital costs, only), based on an average power cost of $2936/kW. The predicted trends in the power penalty and cost of CO2 capture as a function of the capture percentage of carbon dioxide are presented in Figure A-5. The power penalty increases linearly with the percentage of carbon capture, increasing from 95 MW (3.9% of the total output of the units that are >100 MW) to 849 MW (34.4% of the total output of the units that are >100 MW).
At the same time, the cost of CO2 capture decreases from $49/ton of CO2 captured (10% CO2 capture rate) to between $37 and $36 per ton of CO2 captured for capture rates of 50% and 90%, respectively, while the levelized annual cost, not including the cost of replacement power, increases from $89 to $635 million. It should be noted that the cost of CO2 capture of $36 to $49 per ton of CO2 captured is smaller than in the other states/provinces of the region. This is primarily due to the presence of SO2 control equipment on four of the five units targeted for CO2 capture, which represents about 92% of the total MW output of these five units. At the highest rate of capture, there would be approximately 18,094,752 tons of CO2 captured, which is roughly 86% of all the CO2 produced by the six electricity-generating stations in Montana. Given that the total CO2 produced in the state from all sources is about 23,700,000 tons per year, a 90% CO2 capture rate for electricity-generating stations >100 MW yields an overall CO2 reduction of 76% for the entire state. As noted above, the cost of achieving this CO2 capture is estimated to be approximately $635 million annually plus the additional cost of replacing the lost generation capacity.
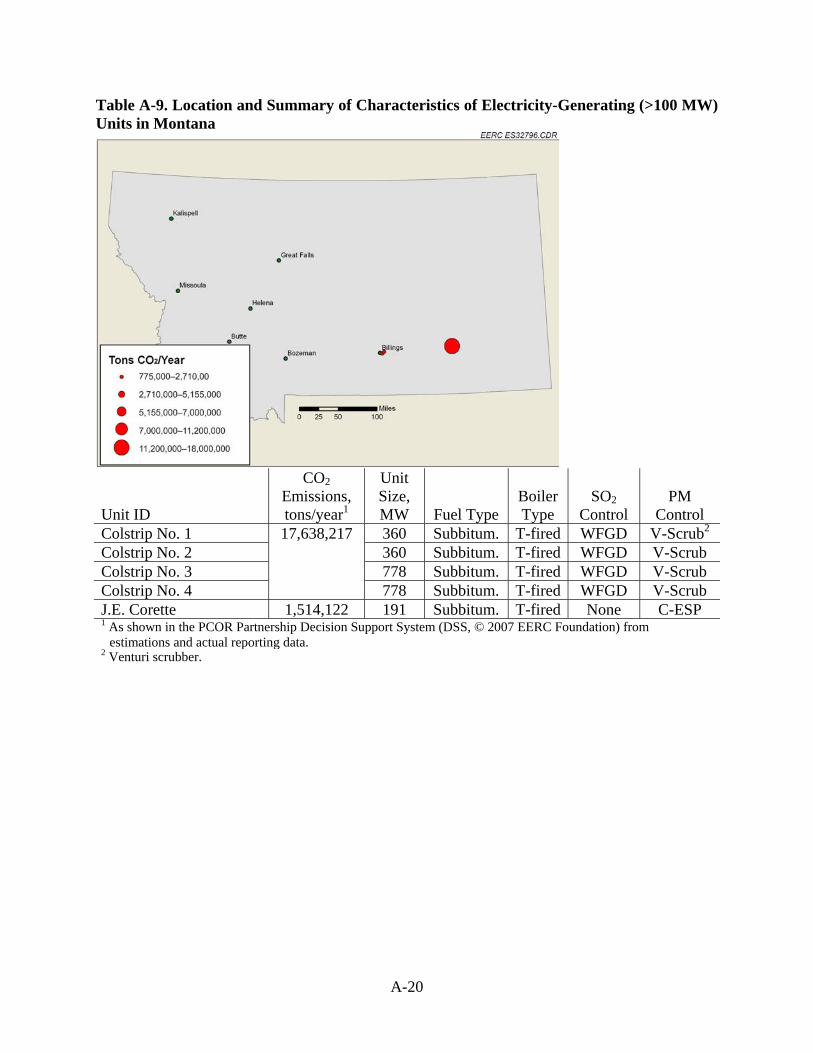
A-20
Table A-9. Location and Summary of Characteristics of Electricity-Generating (>100 MW) Units in Montana
Unit ID
CO2 Emissions, tons/year1
Unit Size, MW Fuel Type
Boiler Type
SO2 Control
PM Control
Colstrip No. 1 17,638,217 360 Subbitum. T-fired WFGD V-Scrub2 Colstrip No. 2 360 Subbitum. T-fired WFGD V-Scrub Colstrip No. 3 778 Subbitum. T-fired WFGD V-Scrub Colstrip No. 4 778 Subbitum. T-fired WFGD V-Scrub J.E. Corette 1,514,122 191 Subbitum. T-fired None C-ESP 1 As shown in the PCOR Partnership Decision Support System (DSS, © 2007 EERC Foundation) from
estimations and actual reporting data. 2 Venturi scrubber.

A-21
Table A-10. Summary of CO2 Capture Costs for >100 MW Electricity-Generating Stations in Montana Carbon Capture, % 10 25 50 75 90
20,979,036 tons of carbon dioxide emissions per year for units of >100 MW CO2 Captured
tons per year 2,097,903 5,244,759 10,489,518 15,734,277 18,881,132 Energy Assessment
Gross Electrical Output, MW
2467 2467 2467 2467 2467
Auxiliary Load, MW Amine Scrubber, MW
94 234 469 703 843
WFGD Use, MW 1 2 3 5 6 Total Aux Load, MW
95 236 472 708 849
% of Gross Output 3.9 9.6 19.1 28.7 34.4
Cost of Capture $M/yr $/ton CO2 $M/yr
$/ton CO2 $M/yr
$/ton CO2 $M/yr
$/ton CO2 $M/yr $/ton CO2
Annual Cost SO2 Removal
9 4 10 2 12 1 13 1 14 1
Total Levelized Annual Cost
89 49 190 40 362 37 536 36 635 36
a Includes the costs associated with both SO2 and CO2 removal.

A-22
Figure A-5. Results from implementing CO2 capture on electricity-generating units larger than 100 MW in Montana.

A-23
Nebraska Nebraska has 12 electricity-generating stations that emit approximately 23,300,000 tons of CO2 annually. Of these 12 stations, five are larger than 100 MW. The five generating stations consist of ten separate generating units, the characteristics of which are summarized in Table A-11 along with a map showing their locations within the state. None of the units is equipped with SOx control equipment, requiring the addition of WFGD to each of the units to reduce the overall cost of CO2 capture. The units in Nebraska vary in size from 100 MW (North Omaha 2 and 3) to 711 MW (Gerald Gentleman Station 1). The total power generation capacity of the units considered for CO2 capture in the state of Nebraska was 2819 MW. The CO2 generated from these ten units totals approximately 22,753,000 original tons of CO2 per year, or roughly 86% of the CO2 generated from all 12 generating stations in the state. The results from the model simulations are summarized in Table A-12. These results indicate that there is an energy penalty of 35.9% associated with capturing 90% of the CO2 emitted from these units. The cost associated with this energy penalty of 1012 MW is estimated to be approximately $3.0 billion (capital costs only), based on an average power cost of $2936/kW. The predicted trends in the power penalty and cost of CO2 capture as a function of the capture percentage of CO2 are presented in Figure A-6. The power penalty increases linearly with the percentage of carbon capture, increasing from 113 MW (4.0% of the total output of the units that are >100 MW) to 1012 MW (35.9% of the total output of the units that are >100 MW). At the same time, the cost of CO2 capture decreases from $96/ton of CO2 captured (10% CO2 capture rate) to between $49 and $48 per ton of CO2 captured for capture rates of 75% and 90%, respectively, while the levelized annual cost, not including the cost of replacement power, increases from $119 (10% capture) to $784 million (90% capture). At the highest rate of capture, there would be approximately 19,990,000 tons of CO2 captured, which is roughly 85% of all the CO2 produced by the 12 electricity-generating stations in Nebraska. Given that the total CO2 produced in the state from all sources is 30,990,000 tons per year, a 90% CO2 capture rate for electricity-generating stations >100 MW yields an overall CO2 reduction of 64.5% for the entire state. As noted above, the cost of achieving this CO2 capture is estimated to be approximately $784 million annually plus the additional cost of replacing the lost generation capacity.

A-24
Table A-11. Location and Summary of Characteristics of Electricity-Generating (>100 MW) Units in Nebraska
Unit ID
CO2 Emissions, tons/year1
Unit Size, MW Fuel Type
Boiler Type
SO2 Control
PM Control
Gerald Gentleman Station No. 1
11,192,809 711 Subbitum. Dry bottom
None H-ESP
Gerald Gentleman Station No. 2
654 Subbitum. Dry bottom
None NA
Nebraska City No. 1 4,703,184 565 Subbitum. W-fired None C-ESP North Omaha No. 2 100 Subbitum. T-fired None C-ESP North Omaha No. 3 100 Subbitum. T-fired None C-ESP North Omaha No. 4 125 Subbitum. T-fired None C-ESP North Omaha No. 5 200 Subbitum. W-fired None C-ESP Sheldon No. 1 1,895,755 119 Subbitum. Cyclone None H-ESP Sheldon No. 2 136 Subbitum. Cyclone None H-ESP Platte No. 1 895,952 109 Subbitum. T-fired None H-ESP 1 As shown in the PCOR Partnership Decision Support System (DSS, © 2007 EERC Foundation) from estimations and actual reporting data.

A-25
Table A-12. Summary of CO2 Capture Costs for >100 MW Electricity-Generating Stations in Nebraska Carbon Capture, % 10 25 50 75 90
22,211,654 tons of carbon dioxide emissions per year for units of >100 MW CO2 Captured
tons per year 2,221,165 5,552,914 11,105,827 16,658,741 19,990,481 Energy Assessment
Gross Electrical Output, MW
2819 2819 2819 2819 2819
Auxiliary Load, MW Amine Scrubber, MW
104 259 518 776 932
WFGD Use, MW 9 22 44 67 80 Total Aux Load, MW
113 281 562 843 1012
% of Gross Output 4.0 10.0 19.9 29.9 35.9
Cost of Capture $M/yr $/ton CO2 $M/yr
$/ton CO2 $M/yr
$/ton CO2 $M/yr
$/ton CO2 $M/yr
$/ton CO2
Annual Cost SO2 Removal
93 42 107 19 130 12 153 9 167 8
Total Levelized Annual Costa
119 96 247 64 458 53 664 49 784 48
a Includes the costs associated with both SO2 and CO2 removal.
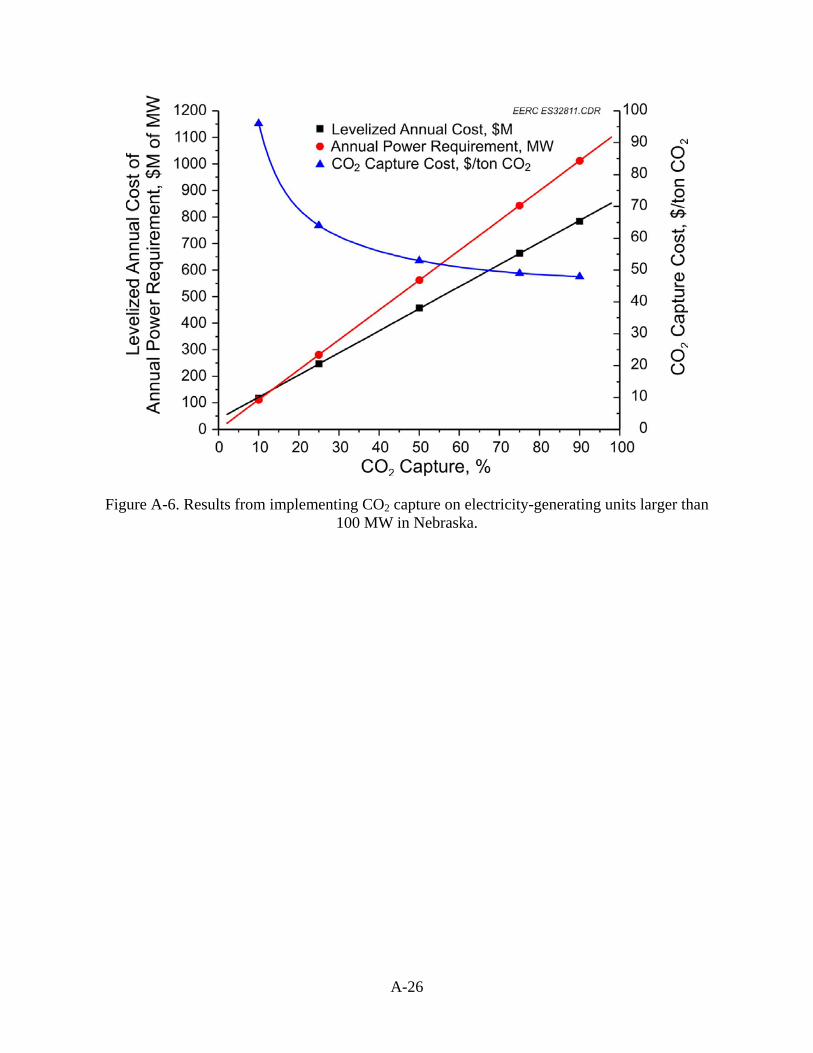
A-26
Figure A-6. Results from implementing CO2 capture on electricity-generating units larger than 100 MW in Nebraska.

A-27
North Dakota North Dakota has seven electricity-generating stations that emit approximately 35,950,000 tons of CO2 annually. Of these seven stations, six are larger than 100 MW. The six generating stations consist of ten separate generating units, the characteristics of which are summarized in Table A-13 along with a map showing their locations within the state. In those instances where a generating unit has no SOx control, a WFGD unit was added to reduce the overall cost of CO2 capture. Compared to the other states and provinces in the PCOR partnership region, the electricity-generating units in North Dakota are different in that they burn lignite rather than subbituminous or bituminous coal. The units in North Dakota vary in size from 140 MW (Stanton 1) to 547 MW (Coal Creek Unit 2). The total generation capacity of the units considered for CO2 capture in the state of North Dakota was 3843 MW. The CO2 generated from these ten units is approximately 35,274,145 tons of CO2 per year, roughly 98% of the CO2 generated from all seven generating stations in North Dakota. The results from the model simulations are summarized in Table A-14. These results indicate that there is an energy penalty of 47.2% associated with capturing 90% of the CO2 emitted from these units. This is one of the highest energy penalties of all of the states and provinces and is due largely to the fuel that is burned in these units. Lignite produces more CO2 per Btu of coal, contains more moisture, and generates a larger volume of flue gas. These factors, combined with the unit configurations, result in a high energy penalty for the MEA CO2 absorption system. The cost penalty associated with this energy requirement of 1815 MW is estimated at approximately $5.3 billion (capital costs only), based on an average power cost of $2936/kW. The predicted trends in the power penalty and cost of CO2 capture as a function of the capture percentage of CO2 is presented in Figure A-7. The power penalty increases linearly with the percentage of carbon capture, increasing from 202 MW (5.3% of the total output of the units that are >100 MW) to 1815 MW (47.2% of the total output of the units that are >100 MW). At the same time, the cost of CO2 capture decreases from $74/ton of CO2 captured (10% CO2 capture rate) to between $52 and $51 per ton of CO2 captured for capture rates of 75% and 90%, respectively while the levelized annual cost, not including the cost of replacement power, increases from $206 million (10% capture) to $1.52 billion (90% capture). At the highest rate of capture, there would be approximately 31,700,000 tons of CO2 captured, which is roughly 88% of all the CO2 produced by the seven electricity-generating stations in North Dakota. Given that the total CO2 produced in the state from all sources is about 41,800,000 tons per year, a 90% CO2 capture rate for electricity-generating stations >100 MW yields an overall CO2 reduction of 76% for the entire state. As noted above, the cost of achieving this CO2 capture is estimated to be approximately $1.52 billion annually, plus the additional cost of replacing the lost generation capacity.
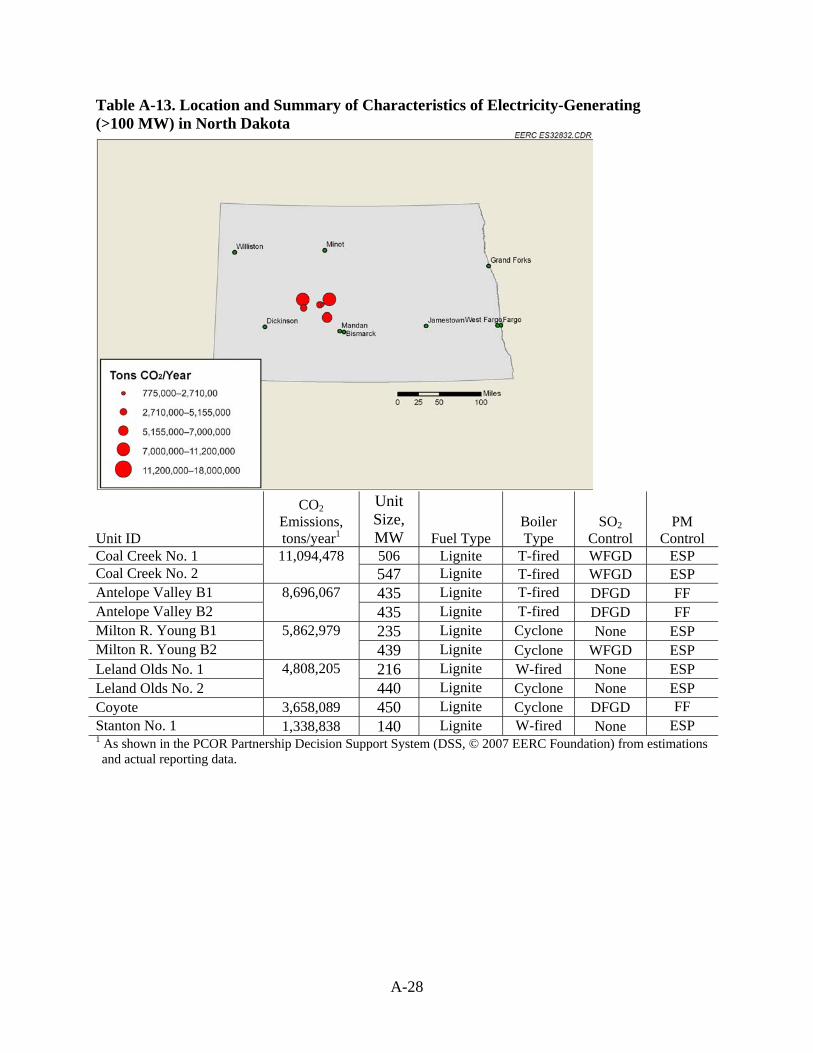
A-28
Table A-13. Location and Summary of Characteristics of Electricity-Generating (>100 MW) in North Dakota
Unit ID
CO2 Emissions, tons/year1
Unit Size, MW Fuel Type
Boiler Type
SO2 Control
PM Control
Coal Creek No. 1 11,094,478 506 Lignite T-fired WFGD ESP Coal Creek No. 2 547 Lignite T-fired WFGD ESP Antelope Valley B1 8,696,067 435 Lignite T-fired DFGD FF Antelope Valley B2 435 Lignite T-fired DFGD FF Milton R. Young B1 5,862,979 235 Lignite Cyclone None ESP Milton R. Young B2 439 Lignite Cyclone WFGD ESP Leland Olds No. 1 4,808,205 216 Lignite W-fired None ESP Leland Olds No. 2 440 Lignite Cyclone None ESP Coyote 3,658,089 450 Lignite Cyclone DFGD FF Stanton No. 1 1,338,838 140 Lignite W-fired None ESP 1 As shown in the PCOR Partnership Decision Support System (DSS, © 2007 EERC Foundation) from estimations and actual reporting data.
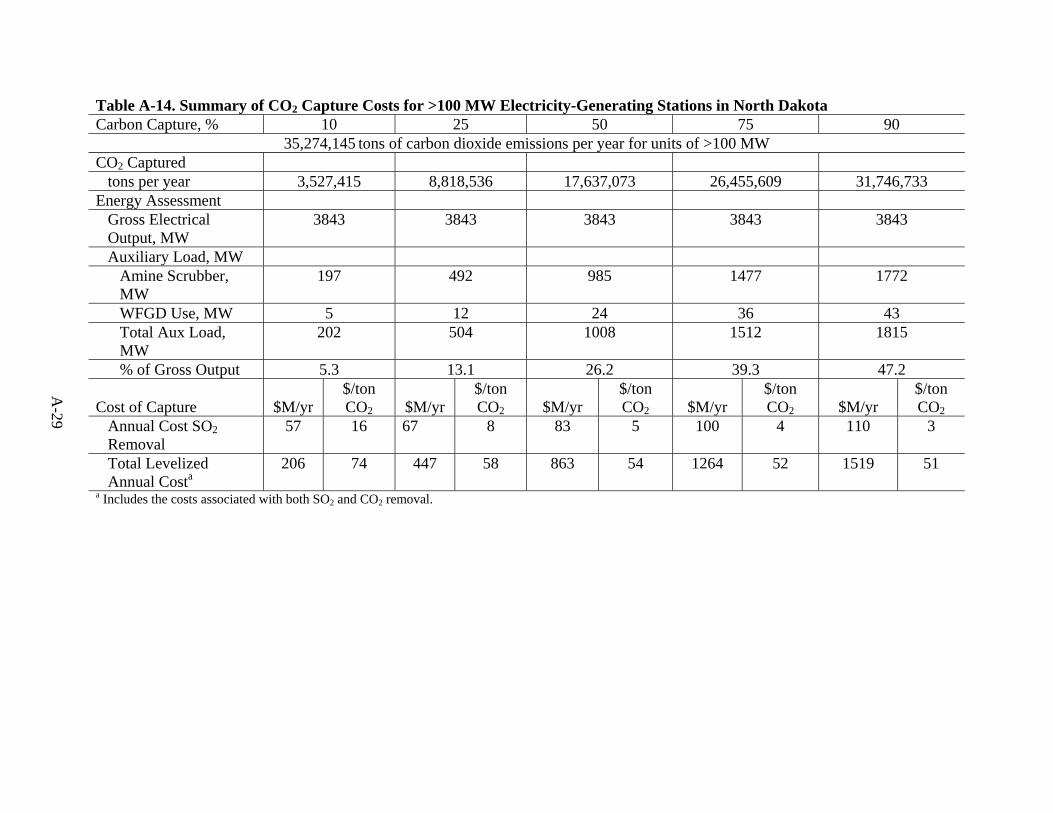
A-29
Table A-14. Summary of CO2 Capture Costs for >100 MW Electricity-Generating Stations in North Dakota Carbon Capture, % 10 25 50 75 90
35,274,145 tons of carbon dioxide emissions per year for units of >100 MW CO2 Captured
tons per year 3,527,415 8,818,536 17,637,073 26,455,609 31,746,733 Energy Assessment
Gross Electrical Output, MW
3843 3843 3843 3843 3843
Auxiliary Load, MW Amine Scrubber, MW
197 492 985 1477 1772
WFGD Use, MW 5 12 24 36 43 Total Aux Load, MW
202 504 1008 1512 1815
% of Gross Output 5.3 13.1 26.2 39.3 47.2
Cost of Capture $M/yr $/ton CO2 $M/yr
$/ton CO2 $M/yr
$/ton CO2 $M/yr
$/ton CO2 $M/yr
$/ton CO2
Annual Cost SO2 Removal
57 16 67 8 83 5 100 4 110 3
Total Levelized Annual Costa
206 74 447 58 863 54 1264 52 1519 51
a Includes the costs associated with both SO2 and CO2 removal.

A-30
Figure A-7. Results from implementing CO2 capture on electricity-generating units larger than 100 MW in North Dakota.

A-31
Saskatchewan Saskatchewan contains six electricity-generating stations that emit approximately 15,100,000 tons of CO2 annually. Of these six stations, four are larger than 100 MW and consist of eight separate generating units, the characteristics of which are summarized in Table A-15 along with a map showing their locations within the province. In cases where there is no SOx control, WFGD was added to reduce the overall cost of CO2 capture. Electricity-generating stations in Saskatchewan, similar to those in North Dakota, burn lignite rather than subbituminous and bituminous coal. The units in Saskatchewan vary in size from 100 MW (Meridian) to 293 MW (Boundary Dam Station 6). The total generation capacity of the units considered for CO2 capture in the province of Saskatchewan is 1684 MW. The CO2 generated from these eight generating units is approximately 14,200,000 tons of CO2 per year, roughly 94% of the CO2 generated from all six generating stations in the province. The results from the model simulations are summarized in Table A-16. These results indicate that there is an energy penalty of 38.5% associated with capturing 90% of the CO2 emitted from these units. This energy penalty is similar to that predicted for North Dakota, reflecting the unique characteristics of lignite coal as it relates to carbon dioxide generation and capture. The cost associated with this energy requirement of 648 MW is estimated at approximately $1.9 billion (capital costs only), based on an average power cost of $2936/kW. The predicted trends in the power penalty and cost of CO2 capture as a function of the capture percentage of carbon dioxide is presented in Figure A-8. The power penalty increases linearly with the percentage of carbon capture, increasing from 72 MW (4.3% of the total output of the units that are >100 MW) to 648 MW (38.5% of the total output of the units that are >100 MW). At the same time, the cost of CO2 capture decreases from $112/ton of CO2 captured (10% CO2 capture rate) to between $59 and $53 per ton of CO2 captured for capture rates of 50% and 90%, respectively, while the levelized annual cost, not including the cost of replacement power, increases from $87 million (10% capture) to $558 million (90% capture). At the highest rate of capture, there would be approximately 12,800,000 tons of CO2 captured, which is roughly 88.2% of all the CO2 produced by the six electricity-generating stations in Saskatchewan. Given that the total CO2 produced in the province from all sources is 22,400,000 tons per year, a 90% CO2 capture rate for electricity-generating stations >100 MW yields an overall CO2 reduction of 57% for the entire province. As noted above, the cost of achieving this CO2 capture is estimated to be approximately $558 million annually, plus the additional cost of replacing the lost generation capacity.
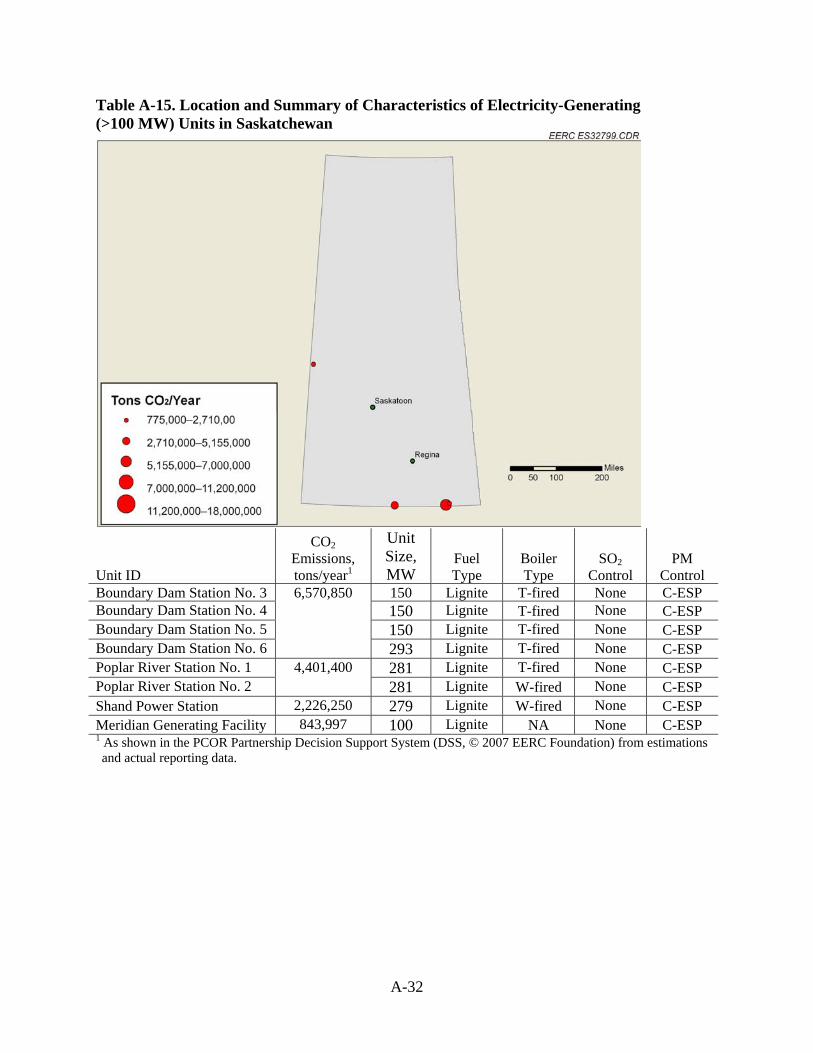
A-32
Table A-15. Location and Summary of Characteristics of Electricity-Generating (>100 MW) Units in Saskatchewan
Unit ID
CO2 Emissions, tons/year1
Unit Size, MW
Fuel Type
Boiler Type
SO2 Control
PM Control
Boundary Dam Station No. 3 6,570,850 150 Lignite T-fired None C-ESP Boundary Dam Station No. 4 150 Lignite T-fired None C-ESP Boundary Dam Station No. 5 150 Lignite T-fired None C-ESP Boundary Dam Station No. 6 293 Lignite T-fired None C-ESP Poplar River Station No. 1 4,401,400 281 Lignite T-fired None C-ESP Poplar River Station No. 2 281 Lignite W-fired None C-ESP Shand Power Station 2,226,250 279 Lignite W-fired None C-ESP Meridian Generating Facility 843,997 100 Lignite NA None C-ESP 1 As shown in the PCOR Partnership Decision Support System (DSS, © 2007 EERC Foundation) from estimations and actual reporting data.

A-33
Table A-16. Summary of CO2 Capture Costs for >100 MW Electricity-Generating Stations in Saskatchewan Carbon Capture, % 10 25 50 75 90
14,230,697 tons of carbon dioxide emissions per year for units of >100 MW CO2 Captured
tons per year 1,423,070 3,557,674 7,115,349 10,673,023 12,807,627 Energy Assessment
Gross Electrical Output, MW
1684 1684 1684 1684 1684
Auxiliary Load, MW Amine Scrubber, MW
66 166 332 497 597
WFGD Use, MW 6 14 28 43 51 Total Aux Load, MW
72 180 360 540 648
% of Gross Output 4.3 10.7 21.4 32.1 38.5
Cost of Capture $M/yr $/ton CO2 $M/yr
$/ton CO2 $M/yr
$/ton CO2 $M/yr
$/ton CO2 $M/yr
$/ton CO2
Annual Cost SO2 Removal
73 51 82 23 96 13 110 10 119 9
Total Levelized Annual Costa
87 112 179 73 321 59 463 54 558 53
a Includes the costs associated with both SO2 and CO2 removal.

A-34
Figure A-8. Results from implementing CO2 capture on electricity-generating units larger than 100 MW in Saskatchewan.
A-35
South Dakota South Dakota contains three electricity-generating stations that emit approximately 4,160,000 tons of CO2 annually. Of these three stations, one is larger than 100 MW. This generating station is known as the Big Stone Station and is located on the border of South Dakota and Minnesota. The unit has a 450-MW capacity and is equipped with a cyclone boiler with a C-ESP for PM control. The unit is not equipped with SOx control, and therefore, WFGD was added to reduce the overall cost of CO2 capture. The characteristics of this unit are presented in Table A-17 along with a map showing its location within the state. The CO2 generated from the Big Stone Station is approximately 3,780,000 tons per year, roughly 91% of the CO2 generated from all three generating stations in the state. The results from the model simulation are summarized in Table A-18. These results indicate that there is an energy penalty of 38% associated with capturing 90% of the CO2 emitted from this unit. The cost penalty associated with this energy requirement of 171 MW is estimated at approximately $502 million (capital costs only), based on an average power cost of $2936/kW. The predicted trends in the power penalty and cost of CO2 capture as a function of the capture percentage of CO2 are presented in Figure A-9. The power penalty increases linearly with the percentage of carbon capture, increasing from 19 MW (4.2% of the total output of the station) to 171 MW (38% of the total output of the station). At the same time, the cost of CO2 capture decreases from $73/ton of CO2 captured (10% CO2 capture rate) to between $45 and $43 per ton of CO2 captured for capture rates of 50% and 90%, respectively, while the levelized annual cost, not including the cost of replacement power, increases from $17 million (10% capture) to $122 million (90% capture). At the highest rate of capture, there would be approximately 3,375,000 tons of CO2 captured, which is roughly 81% of all the CO2 produced by the three electricity-generating stations in South Dakota. Given that the total CO2 produced in the state from all sources is about 17,200,000 tons per year, capturing 90% of the Big Stone Station’s CO2 would yield an overall CO2 reduction of nearly 20% for the entire state. As noted above, the cost of achieving this CO2 capture is estimated to be approximately $122 million annually, plus the additional cost of replacing the lost generation capacity.

A-36
Table A-17. Location and Summary of Characteristics of Electricity-Generating (>100 MW) Units in South Dakota
Unit ID
CO2 Emissions, tons/year
Unit Size, MW Fuel Type
Boiler Type
SO2 Control
PM Control
Big Stone 3,784,492 450 Subbitum. Cyclone None C-ESP 1 As shown in the PCOR Partnership Decision Support System (DSS, © 2007 EERC Foundation) from estimations and actual reporting data.

A-37
Table A-18. Summary of CO2 Capture Costs for >100 MW Electricity-Generating Stations in South Dakota Carbon Capture, % 10 25 50 75 90
35,274,145 tons of carbon dioxide emissions per year for units of >100 MW CO2 Captured
tons per year 3,527,415 8,818,536 17,637,073 26,455,609 31,746,733 Energy Assessment
Gross Electrical Output, MW
3843 3843 3843 3843 3843
Auxiliary Load, MW Amine Scrubber, MW
197 492 985 1477 1772
WFGD Use, MW 5 12 24 36 43 Total Aux Load, MW
202 504 1008 1512 1815
% of Gross Output 5.3 13.1 26.2 39.3 47.2
Cost of Capture $M/yr $/ton CO2 $M/yr
$/ton CO2 $M/yr
$/ton CO2 $M/yr
$/ton CO2 $M/yr
$/ton CO2
Annual Cost SO2 Removal
57 16 67 8 83 5 100 4 110 3
Total Levelized Annual Costa
206 74 447 58 863 54 1264 52 1519 51
a Includes the costs associated with both SO2 and CO2 removal.

A-38
Figure A-9. Results from implementing CO2 capture on electricity-generating units larger than 100 MW in South Dakota.
A-39
Wisconsin Wisconsin has 35 electricity-generating stations that emit approximately 49,200,000 tons of CO2 nnually. Of these 35 stations, 12 are larger than 100 MW. These 12 generating stations consist of 20 separate generating units, the characteristics of which are summarized in Table A-19 along with a map showing their location within the state. In cases where there is no SOx control, WFGD was added to reduce the overall cost of CO2 capture. The electricity-generating stations in Wisconsin use either subbituminous or bituminous coals or blends of these coals. These units vary in size from 100 MW (Alma) to 1234 MW (Pleasant Prairie Station Units 1 and 2). The total generation capacity of the units considered for CO2 capture is 6070 MW. The CO2 generated from these 20 units totals approximately 47,900,000 tons of CO2 per year, roughly 97% of the CO2 generated from all 35 generating stations in Wisconsin. The results from the model simulations are summarized in Table A-20. These results indicate that there is an energy penalty of 33.7% associated with capturing 90% of the CO2 emitted from these units. The cost penalty associated with this energy requirement of 2048 MW is estimated to be approximately $6.0 billion (capital costs only), based on an average power cost of $2936/kW. The predicted trends in the power penalty and cost of CO2 capture as a function of the capture percentage of CO2 are presented in Figure A-10. The power penalty increases linearly with the percentage of carbon capture, increasing from 243 MW (4.0% of the total output of the units that are >100 MW) to 2048 MW (33.7% of the total output of the units that are >100 MW). At the same time, the cost of CO2 capture decreases from $88/ton of CO2 captured (10% CO2 capture rate) to between $49 and $45 per ton of CO2 captured for capture rates of 50% and 90%, respectively, while the levelized annual cost, not including the cost of replacement power, increases from $245 million (10% capture) to $1.6 billion (90% capture). At the highest rate of capture, there would be approximately 43,100,000 tons of CO2 captured, which is roughly 88% of all the CO2 produced by the 35 electricity-generating stations in Wisconsin. Given that the total CO2 produced in the state from all sources is 85,100,000 tons per year, a 90% CO2 capture rate for electricity-generating stations >100 MW yields an overall CO2 reduction of 51% for the entire state. As noted above, the cost of achieving this CO2 capture is estimated to be approximately $1.6 billion annually, plus the additional cost of replacing the lost generation capacity.
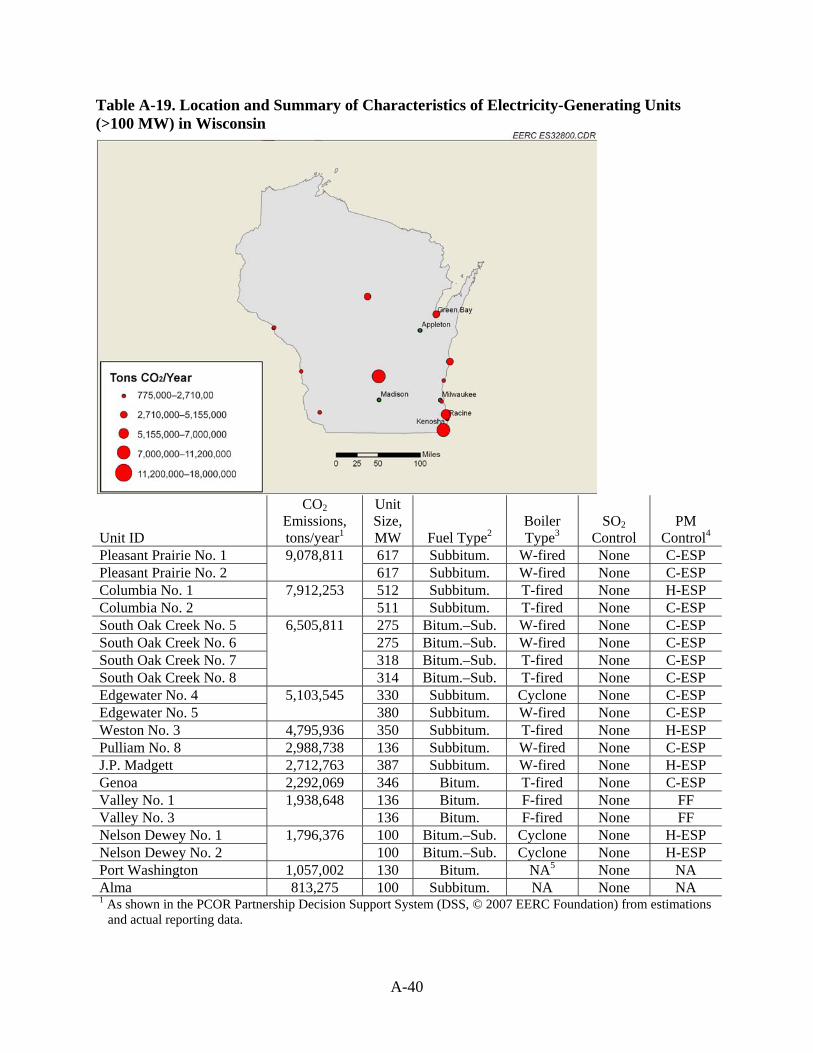
A-40
Table A-19. Location and Summary of Characteristics of Electricity-Generating Units (>100 MW) in Wisconsin
Unit ID
CO2 Emissions, tons/year1
Unit Size, MW Fuel Type2
Boiler Type3
SO2 Control
PM Control4
Pleasant Prairie No. 1 9,078,811 617 Subbitum. W-fired None C-ESP Pleasant Prairie No. 2 617 Subbitum. W-fired None C-ESP Columbia No. 1 7,912,253 512 Subbitum. T-fired None H-ESP Columbia No. 2 511 Subbitum. T-fired None C-ESP South Oak Creek No. 5 6,505,811 275 Bitum.–Sub. W-fired None C-ESP South Oak Creek No. 6 275 Bitum.–Sub. W-fired None C-ESP South Oak Creek No. 7 318 Bitum.–Sub. T-fired None C-ESP South Oak Creek No. 8 314 Bitum.–Sub. T-fired None C-ESP Edgewater No. 4 5,103,545 330 Subbitum. Cyclone None C-ESP Edgewater No. 5 380 Subbitum. W-fired None C-ESP Weston No. 3 4,795,936 350 Subbitum. T-fired None H-ESP Pulliam No. 8 2,988,738 136 Subbitum. W-fired None C-ESP J.P. Madgett 2,712,763 387 Subbitum. W-fired None H-ESP Genoa 2,292,069 346 Bitum. T-fired None C-ESP Valley No. 1 1,938,648 136 Bitum. F-fired None FF Valley No. 3 136 Bitum. F-fired None FF Nelson Dewey No. 1 1,796,376 100 Bitum.–Sub. Cyclone None H-ESP Nelson Dewey No. 2 100 Bitum.–Sub. Cyclone None H-ESP Port Washington 1,057,002 130 Bitum. NA5 None NA Alma 813,275 100 Subbitum. NA None NA 1 As shown in the PCOR Partnership Decision Support System (DSS, © 2007 EERC Foundation) from estimations
and actual reporting data.
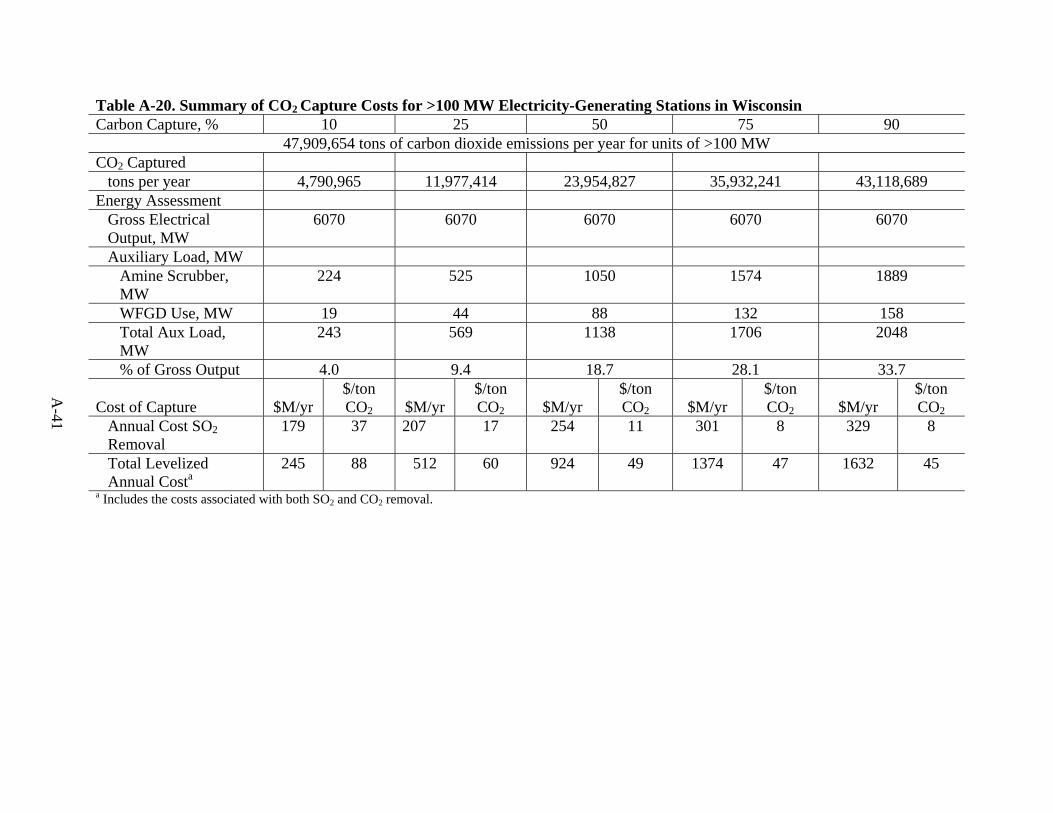
A-41
Table A-20. Summary of CO2 Capture Costs for >100 MW Electricity-Generating Stations in Wisconsin Carbon Capture, % 10 25 50 75 90
47,909,654 tons of carbon dioxide emissions per year for units of >100 MW CO2 Captured
tons per year 4,790,965 11,977,414 23,954,827 35,932,241 43,118,689 Energy Assessment
Gross Electrical Output, MW
6070 6070 6070 6070 6070
Auxiliary Load, MW Amine Scrubber, MW
224 525 1050 1574 1889
WFGD Use, MW 19 44 88 132 158 Total Aux Load, MW
243 569 1138 1706 2048
% of Gross Output 4.0 9.4 18.7 28.1 33.7
Cost of Capture $M/yr $/ton CO2 $M/yr
$/ton CO2 $M/yr
$/ton CO2 $M/yr
$/ton CO2 $M/yr
$/ton CO2
Annual Cost SO2 Removal
179 37 207 17 254 11 301 8 329 8
Total Levelized Annual Costa
245 88 512 60 924 49 1374 47 1632 45
a Includes the costs associated with both SO2 and CO2 removal.

A-42
Figure A-10. Results from implementing CO2 capture on electricity-generating units larger than 100 MW in Wisconsin.
A-43
Wyoming The PCOR Partnership region contains only a small portion of Wyoming. This portion of the state has six electricity-generating stations that emit approximately 5,900,000 tons of CO2 annually. Of these six stations, only one is larger than 100 MW. This generating station is known as the Wyodak Station and is located just east of Gillette, Wyoming. The 362-MW unit has a wall-fired boiler that is equipped with a C-ESP for PM control and a dry scrubber for SOx. The characteristics of the Wyodak Station are summarized in Table A-21 along with a map showing its location within the state. The CO2 generated from the Wyodak Station is approximately 3,371,000 tons per year, approximately 57% of the CO2 generated from all six generating stations in the part of Wyoming that is in the PCOR Partnership region. The results from the model simulations are summarized in Table A-22. These results indicate that there is an energy penalty of 42.8% associated with capturing 90% of the CO2 emitted from this unit. The cost penalty associated with this energy requirement of 155 MW is estimated to be approximately $455 million (capital costs only), based on an average power cost of $2936/kW. The predicted trends in the power penalty and cost of CO2 capture as a function of the capture percentage of carbon dioxide are presented in Figure A-11. The power penalty increases linearly with the percentage of carbon capture, increasing from 17 MW (4.7% of the total output of the units that are >100 MW) to 155 MW (42.8% of the total output of the unit). At the same time, the cost of CO2 capture decreases from $72/ton of CO2 captured (10% CO2 capture rate) to between $42 and $39 per ton of CO2 captured for capture rates of 50% and 90%, respectively, while the levelized annual cost, not including the cost of replacement power, increases from $16 million (10% capture) to $110 million (90% capture). At the highest rate of capture, there would be approximately 3,030,000 tons of CO2 captured, which is roughly 51% of all the CO2 produced by the six electricity-generating stations in the PCOR Partnership region of Wyoming. Given that the total CO2 produced in the PCOR Partnership region of the state from all sources is 6,260,000 tons per year, a 90% CO2 capture rate for electricity-generating stations >100 MW yields an overall CO2 reduction of 48% for the entire state. As noted above, the cost of achieving this CO2 capture is estimated to be approximately $110 million annually, plus the additional cost of replacing the lost generation capacity.
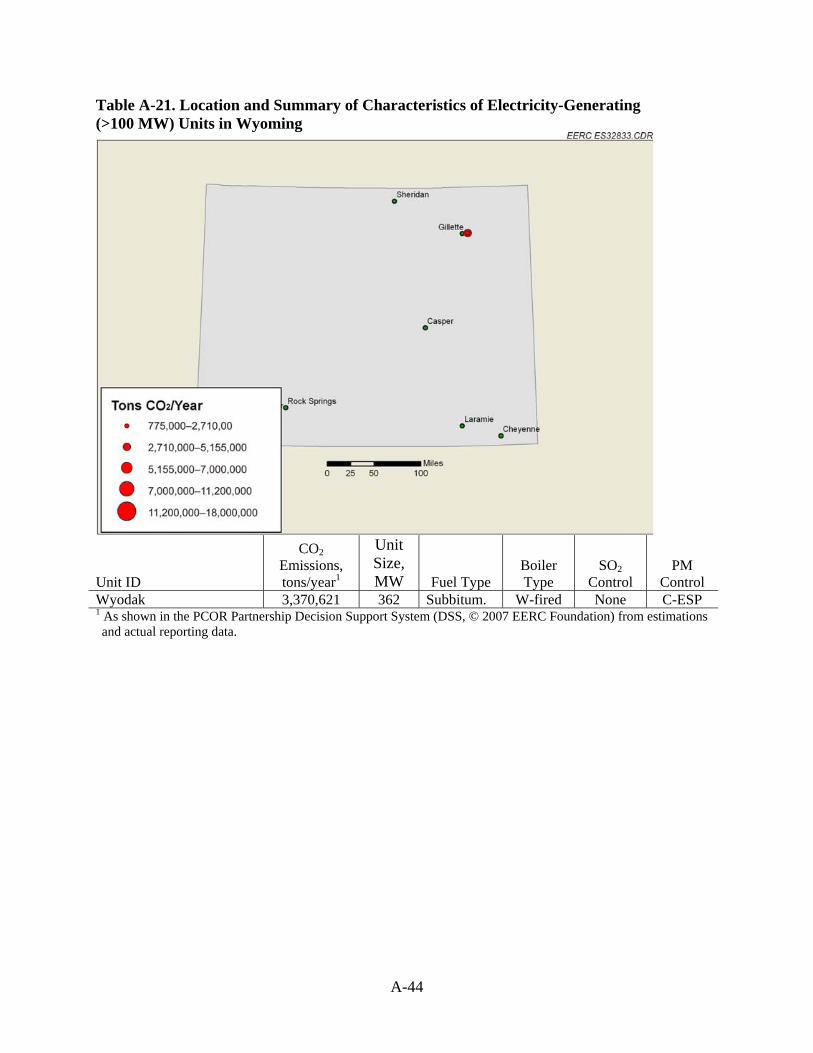
A-44
Table A-21. Location and Summary of Characteristics of Electricity-Generating (>100 MW) Units in Wyoming
Unit ID
CO2 Emissions, tons/year1
Unit Size, MW Fuel Type
Boiler Type
SO2 Control
PM Control
Wyodak 3,370,621 362 Subbitum. W-fired None C-ESP 1 As shown in the PCOR Partnership Decision Support System (DSS, © 2007 EERC Foundation) from estimations and actual reporting data.

A-45
Table A-22. Summary of CO2 Capture Costs for >100 MW Electricity-Generating Stations in Wyoming Carbon Capture, % 10 25 50 75 90
3,371,000 tons of carbon dioxide emissions per year for units of >100 MW CO2 Captured
tons per year 337,100 842,750 1,685,500 2,528,250 3,033,900 Energy Assessment
Gross Electrical Output, MW
362 362 362 362 362
Auxiliary Load, MW Amine Scrubber, MW
16 40 79 119 143
WFGD Use, MW 1 3 7 10 12 Total Aux Load, MW
17 43 86 129 155
% of Gross Output 4.7 11.9 23.8 35.6 42.8
Cost of Capture $M/yr $/ton CO2 $M/yr
$/ton CO2 $M/yr
$/ton CO2 $M/yr
$/ton CO2 $M/yr
$/ton CO2
Annual Cost SO2 Removal
10 29 12 14 15 9 19 7 21 7
Total Levelized Annual Costa
16 72 34 50 61 42 93 40 110 39
a Includes the costs associated with both SO2 and CO2 removal.
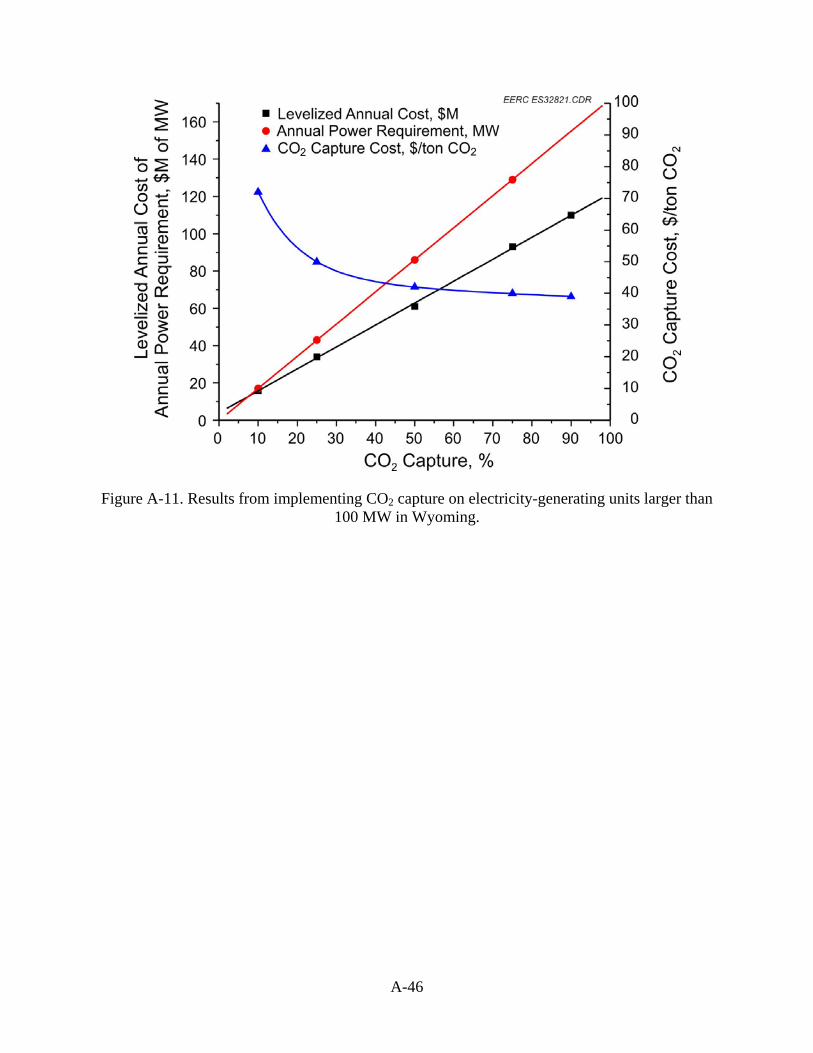
A-46
Figure A-11. Results from implementing CO2 capture on electricity-generating units larger than 100 MW in Wyoming.
APPENDIX B
PROCEDURES USED TO ESTIMATE CAPTURE, DRYING, AND COMPRESSION COSTS AT ETHANOL PLANTS AND ELECTRICITY-
GENERATING FACILITIES

B-1
PROCEDURES USED TO ESTIMATE CAPTURE, DRYING, AND COMPRESSION COSTS AT ETHANOL PLANTS AND ELECTRICITY-GENERATING FACILITIES
PROCEDURE USED TO ESTIMATE THE COST AND POWER REQUIREMENTS FOR CAPTURING, DRYING, AND COMPRESSING CO2 PRODUCED DURING NATURAL GAS COMBUSTION 1. The annual combustion carbon dioxide (CO2) emissions for the desired plant were obtained
from the Plains CO2 Reduction (PCOR) Partnership master source spreadsheet. 2. The Integrated Environmental Control Model (IECM) was configured.
• The IECM session was begun by configuring the plant to be a combustion turbine producing the amount of CO2 obtained in Step 1. To determine the CO2 production estimated by the IECM, the “Get Results–Power Block–Flue Gas” tab was checked, and the quantity of CO2 in the flue gas was noted. The “Get Results–Overall Plant–Plant Performance” tab provided the number of operating hours per year. Multiplying of the CO2 quantity in the flue gas by the operating hours per year produced an annual CO2 production rate.
• If the IECM-estimated CO2 quantity was too large, the number of turbines was changed
in the “Set Parameters–Power Block–Gas Turbine” tab to one turbine. On the same tab, the turbine inlet temperature was adjusted until it produced the correct amount of CO2 (or got as close as possible to the desired value).
• Once the plant was set up without capture, capture capability was added to it on the
“Configure Plant” tab. None of the other settings were changed.
• The product pressure was set to 2500 psig on the “Set Parameters–CO2 Capture–Amine System–Storage” tab. On the “Set Parameters–CO2 Capture–CO2 Transport–Config” sheet, the minimum possible total pipeline length of 0.6214 mi was entered.
3. The costs associated with CO2 transport and storage were subtracted from the total variable
costs on the “Get Results–CO2 Capture–O&M (operation and maintenance) Cost” tab. This resulted in a calculation of the total variable cost for the capture plant only. Dividing this number by the total variable cost for everything determined the percentage associated with the capture plant. The fixed costs were multiplied by this percentage to get the total fixed costs for the capture plant. Adding the total variable cost for the capture plant to the total fixed costs for the capture plant produced the total annual O&M costs associated with capturing, drying, and compressing the CO2 (but not for transporting or storing it).
4. The annual O&M cost on the “Get Results–CO2 Capture–Amine System–Total Cost” tab was
replaced with the one calculated in Step 3. This value was added to the annual capital cost to arrive at the total annual costs. Dividing this value by the number of tons of CO2/yr that were
B-2
removed (which was found on the Amine System Cost Factors tab) resulted in a dollars-per-ton CO2 value.
5. To calculate the energy used by the capture plant, all of the energy values from the “Get
Results–CO2 Capture–Cost Factors” tab were summed. The sum was divided by the tons of CO2 removed/yr and then multiplied by the number of hours per year that the plant operated (found above the emission rate on the tab). This calculation resulted in a value for the energy required to capture, dry, and compress a ton of CO2 per year.
6. Changing the amount of capture at the plant (i.e., 10%, 35%, 50%, etc.) was accomplished by
changing the flue gas bypass control on the “Set Parameters–CO2 Capture–Amine System–Config” tab to “Bypass.” The box next to “Overall CO2 Removal Efficiency” was unchecked, and the percentage of the desired capture rate was entered. The default IECM value is 90% capture of the CO2.
PROCEDURE USED TO ESTIMATE THE COST AND POWER REQUIREMENTS FOR CAPTURING, DRYING, AND COMPRESSING CO2 PRODUCED DURING COAL COMBUSTION 1. The annual combustion CO2 emissions for the desired plant, as well as the fuel type, were
obtained from the PCOR Partnership master source spreadsheet. Absent specific information regarding coal type, it was assumed that subbituminous coal from the Wyoming Powder River Basin was used.
2. The IECM was configured.
• The IECM session was begun by configuring the plant to be a combustion boiler. The NOx, SOx, and mercury control buttons were set to “none,” and particulate control was set to cold-side electrostatic precipitator (C-ESP). Before configuring the plant to enable CO2 capture, the plant was set up to produce the amount of CO2 obtained in Step 1.
• In the “Set Parameters–Fuel–Properties” menu, the fuel was set to the correct one and the
“Use This Fuel” button was clicked. A review of the “Get Results–Stack–Flue Gas” tab showed the quantity of CO2 the IECM predicted that the plant would produce per hour. Multiplying this value by the number of hours per year that the plant operated (found in the “Get Results–Overall Plant–Plant Performance” tab) gave a yearly CO2 emission rate.
• The box next to the gross electrical output on the “Set Parameters–Base Plant–
Performance” tab was unchecked and changed to match the plant output. In the case of a coal-fired ethanol plant, the value was changed to the minimum possible so as to produce as small a stream as possible.
• Amine capture capabilities were added on the “Configure Plant” tab.

B-3
• On the “Set Parameters–CO2 Capture–Amine System–Config” tab, the flue gas bypass control was changed to “Bypass.” The box next to “Overall CO2 Removal Efficiency” was unchecked. The bypass was set to a percentage that produced the correct amount of CO2 for a given source.
• The product pressure was set to 2500 psig on the “Set Parameters–CO2 Capture–Amine
System–Storage” tab. On the “Set Parameters–CO2 Capture–CO2 Transport–Config” sheet, the minimum total pipeline length of 0.6214 mi was entered.
3. The costs associated with CO2 transport and storage were subtracted from the total variable
costs on the “Get Results–CO2 Capture–O&M Cost” tab. This resulted in a calculation of the total variable cost for the capture plant only. Dividing this number by the total variable cost for everything determined the percentage associated with the capture plant only. Fixed costs were multiplied by this percentage to get the total fixed costs for the capture plant. Adding the total variable cost for the capture plant to the total fixed costs for the capture plant produced the total annual O&M costs associated with capturing, drying, and compressing the CO2 (but not transporting or storing it).
4. On the “Get Results–CO2 Capture–Amine System–Total Cost” tab, the annual O&M cost
was replaced with the one calculated in Step 5. This value was added to the annual capital cost to determine the total annual cost. The total annual cost was divided by the number of tons of CO2/yr that were removed (this is on the Amine System Cost Factors tab) to get a dollars-per-ton CO2 value.
5. The energy used by the capture plant was calculated by summing all of the energy values on
the “Get Results–CO2 Capture–Amine System–Misc” tab. The sum was divided by the quantity (in tons) of CO2 removed/yr and multiplied by the number of hours per year that the plant operated. This produced the energy required to capture, dry, and compress a ton of CO2 per year.
6. Changing the amount of capture at the plant (i.e., to 10%, 35%, 50%, etc.) was accomplished
by changing the flue gas bypass control on the “Set Parameters–CO2 Capture–Amine System–Config” tab to “Bypass.” The box next to “Overall CO2 Removal Efficiency” was unchecked, and the percentage of the desired capture rate was entered. The default IECM value is 90% capture of the CO2.
In the case of combustion at an ethanol plant, a particular emission rate is desired and the specific required bypass rate must be determined through a ratio of the desired emission rate to the total rate shown by the IECM, as follows:
xQuantityDesired
0.9QuantityPredictedIECM
=
and solving for x.

B-4
PROCEDURE USED TO ESTIMATE THE COST AND POWER REQUIREMENTS FOR DRYING AND COMPRESSION OF THE CO2 PRODUCED DURING GAS PROCESSING OR THE ETHANOL FERMENTATION PROCESS 1. The annual noncombustion (i.e., fermentation) CO2 emissions for the desired ethanol plant
were obtained from the PCOR Partnership master source spreadsheet. 2. The IECM was configured.
• The IECM session was begun by configuring the plant to be a combustion turbine with an amine system.
• The product pressure was set at 2500 psig on the “Set Parameters–CO2 Capture–Amine
System–Storage” tab. • The “Get Results–CO2 Capture–Amine System–Cost Factors” sheet was viewed to see
how much CO2 the IECM predicted was being captured. The IECM default bypass shows 90% capture of the plant’s emissions. A ratio was used to determine the amount of bypass needed to obtain the correct size CO2 stream. The following equation was solved for x, the overall plant capture rate:
xQuantityDesired
0.9Quantity Predicted IECM
=
• On the “Set Parameters–CO2 Capture–Amine System–Config” tab, the flue gas bypass
control was changed to “Bypass.” The box next to “Overall CO2 Removal Efficiency” was unchecked, and the overall plant capture rate that was calculated was input as a percentage.
3. The drying and compression unit cost on the “Get Results–CO2 Capture–Amine System–
Capital Cost” tab was divided by the total process facilities capital cost to determine the percentage of capital cost that was associated with drying and compression.
4. All of the energy used at the plant (shown on the “Get Results–CO2 Capture–Amine System–
Cost Factors” tab) was summed. The percentage that was associated with the CO2 compression was determined by dividing the “CO2 Compression Energy” value by the total.
5. The “Electricity” cost from the “Get Results–CO2 Capture–Amine System–O&M Cost” tab
was multiplied by the percentage from Step 4 to get a cost for electricity required to run the CO2 drying and compression unit. The CO2 drying and compression cost was divided by the total variable cost to get a percentage, which was multiplied by the total fixed costs to calculate the fixed costs associated with running the CO2 drying and compression unit. The drying and compression electricity cost was added to the drying and compression fixed costs to arrive at the total annual drying and compression O&M costs.

B-5
6. The total levelized annual cost on the “Get Results–CO2 Capture–Amine System–Total Cost” tab was multiplied by the percentage from Step 3 to give the annual capital costs associated with drying and compression of the CO2 stream. This value was added to the annual O&M costs calculated in Step 5 to get the total annual costs, which was divided by the number of tons CO2/yr to get a dollar-per-ton CO2 value.
7. The unit compression energy was calculated by the IECM and was found on the “Set
Parameters–CO2 Capture–Amine System–Storage” tab.
APPENDIX C
COMPARISON OF COSTS AND ADDITIONAL ELECTRICAL REQUIREMENTS FOR CO2
CAPTURE FROM ETHANOL PLANTS
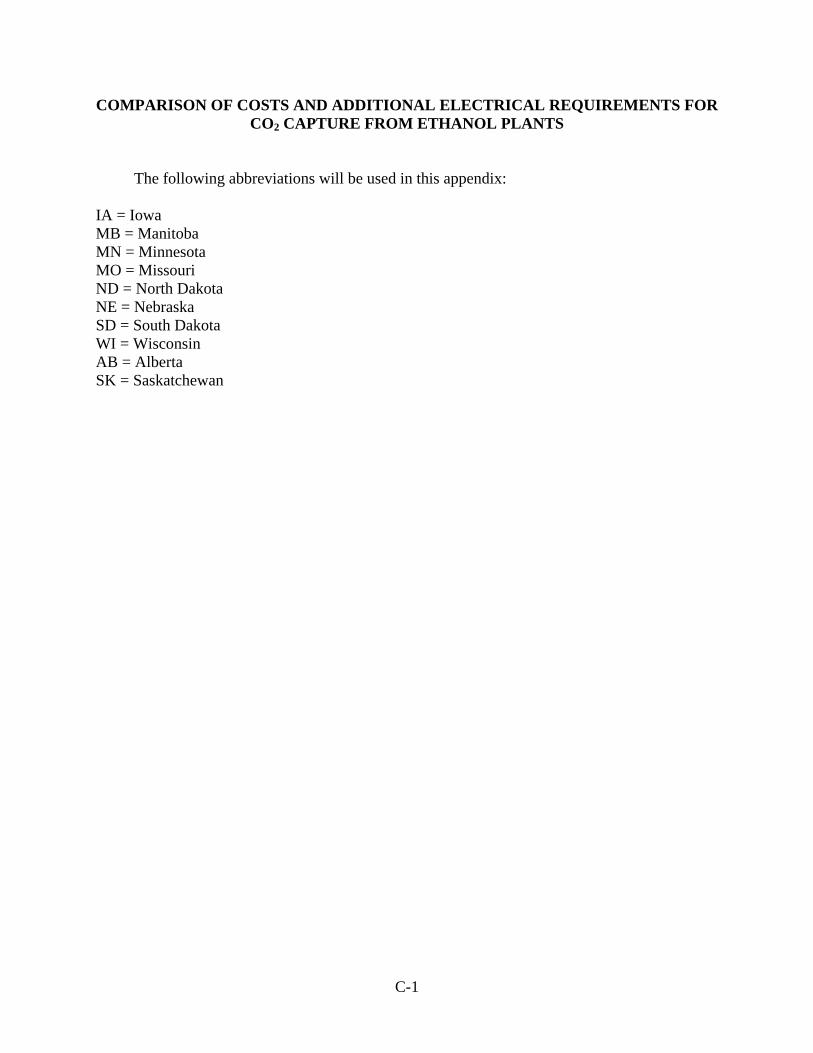
C-1
COMPARISON OF COSTS AND ADDITIONAL ELECTRICAL REQUIREMENTS FOR CO2 CAPTURE FROM ETHANOL PLANTS
The following abbreviations will be used in this appendix: IA = Iowa MB = Manitoba MN = Minnesota MO = Missouri ND = North Dakota NE = Nebraska SD = South Dakota WI = Wisconsin AB = Alberta SK = Saskatchewan
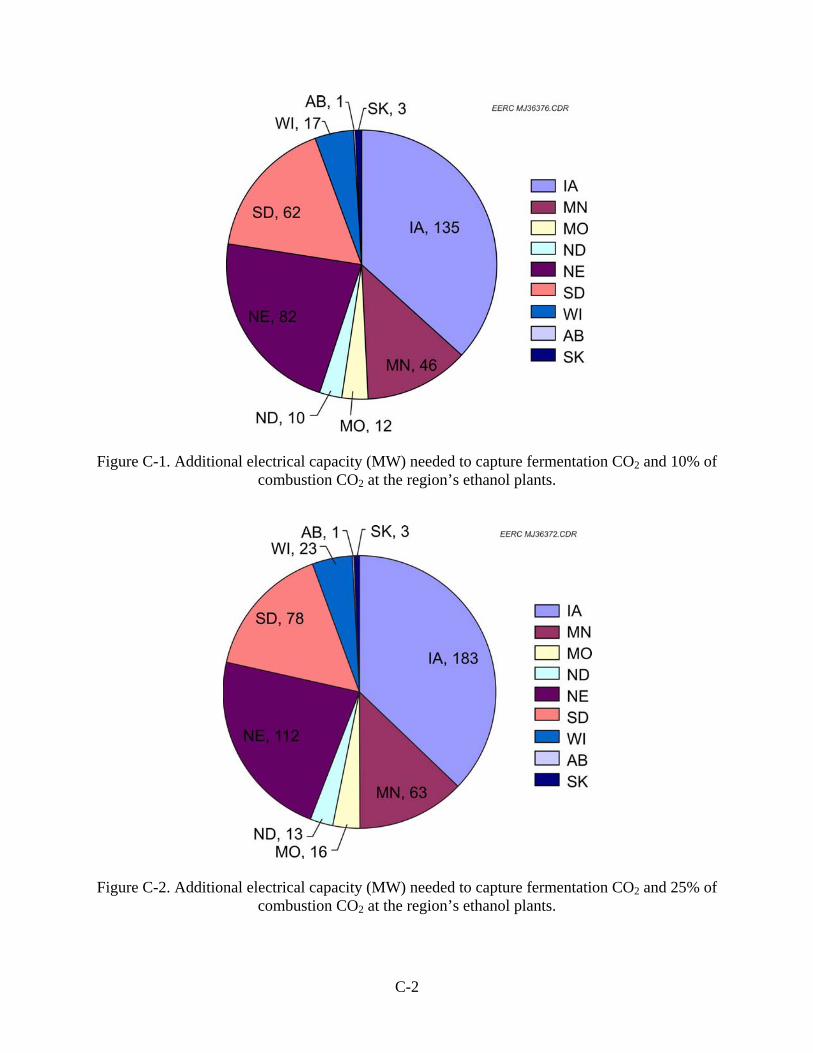
C-2
Figure C-1. Additional electrical capacity (MW) needed to capture fermentation CO2 and 10% of
combustion CO2 at the region’s ethanol plants.
Figure C-2. Additional electrical capacity (MW) needed to capture fermentation CO2 and 25% of
combustion CO2 at the region’s ethanol plants.

C-3
Figure C-3. Additional electrical capacity (MW) needed to capture fermentation CO2 and 50% of
combustion CO2 at the region’s ethanol plants.
Figure C-4. Additional electrical capacity (MW) needed to capture fermentation CO2 and 75% of
combustion CO2 at the region’s ethanol plants.

C-4
Figure C-5. Additional electrical capacity (MW) needed to capture fermentation CO2 and 90% of
combustion CO2 at the region’s ethanol plants.
Figure C-6. The cost of capture of fermentation CO2 and 10% of combustion CO2 produced at the PCOR Partnership region’s ethanol plants. The regional total annual cost of
$477.5 million/yr is not shown because its magnitude would compress the chart, making it difficult to see differences between the states and provinces.
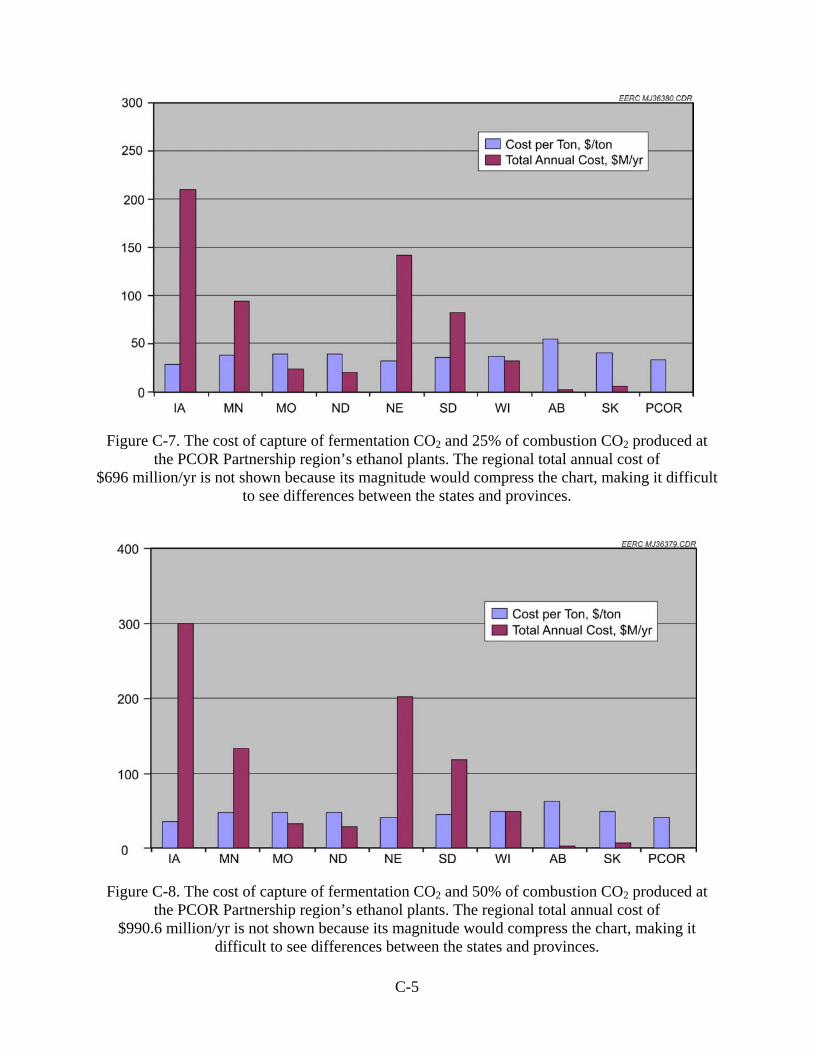
C-5
Figure C-7. The cost of capture of fermentation CO2 and 25% of combustion CO2 produced at the PCOR Partnership region’s ethanol plants. The regional total annual cost of
$696 million/yr is not shown because its magnitude would compress the chart, making it difficult to see differences between the states and provinces.
Figure C-8. The cost of capture of fermentation CO2 and 50% of combustion CO2 produced at the PCOR Partnership region’s ethanol plants. The regional total annual cost of
$990.6 million/yr is not shown because its magnitude would compress the chart, making it difficult to see differences between the states and provinces.
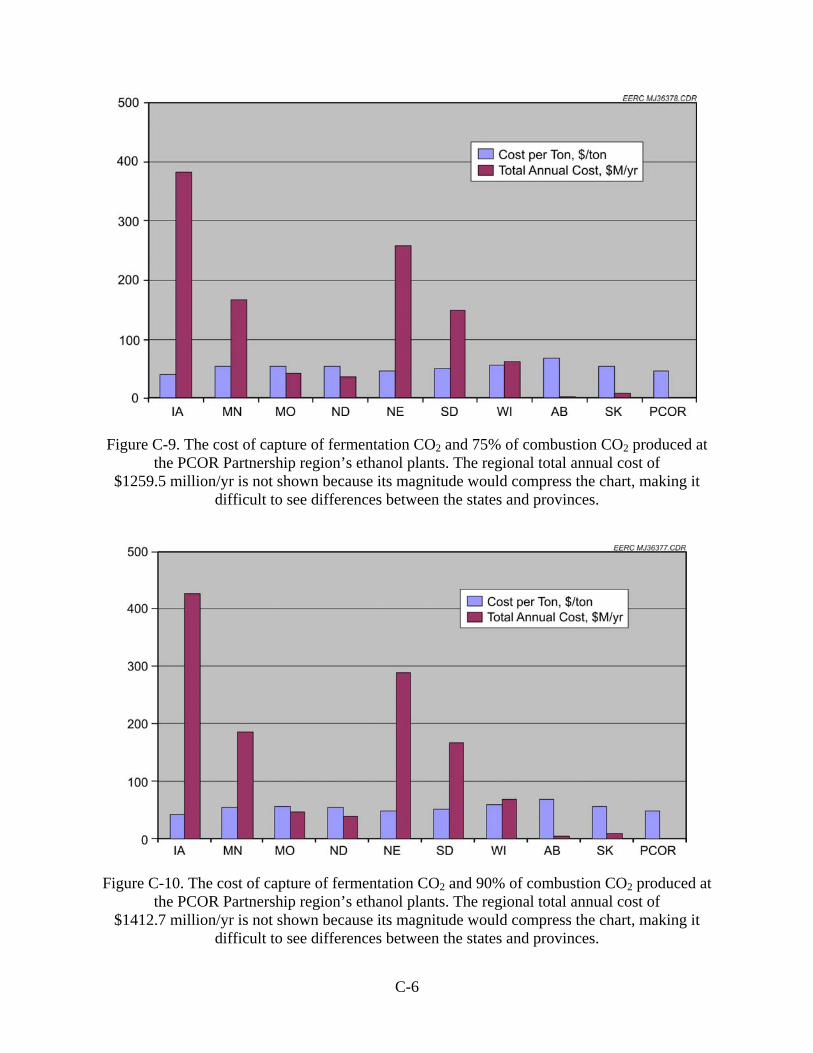
C-6
Figure C-9. The cost of capture of fermentation CO2 and 75% of combustion CO2 produced at the PCOR Partnership region’s ethanol plants. The regional total annual cost of
$1259.5 million/yr is not shown because its magnitude would compress the chart, making it difficult to see differences between the states and provinces.
Figure C-10. The cost of capture of fermentation CO2 and 90% of combustion CO2 produced at
the PCOR Partnership region’s ethanol plants. The regional total annual cost of $1412.7 million/yr is not shown because its magnitude would compress the chart, making it
difficult to see differences between the states and provinces.
APPENDIX D
DATA USED TO GENERATE CHARTS SUMMARIZING CO2 CAPTURE AT
ELECTRICITY-GENERATING FACILITIES
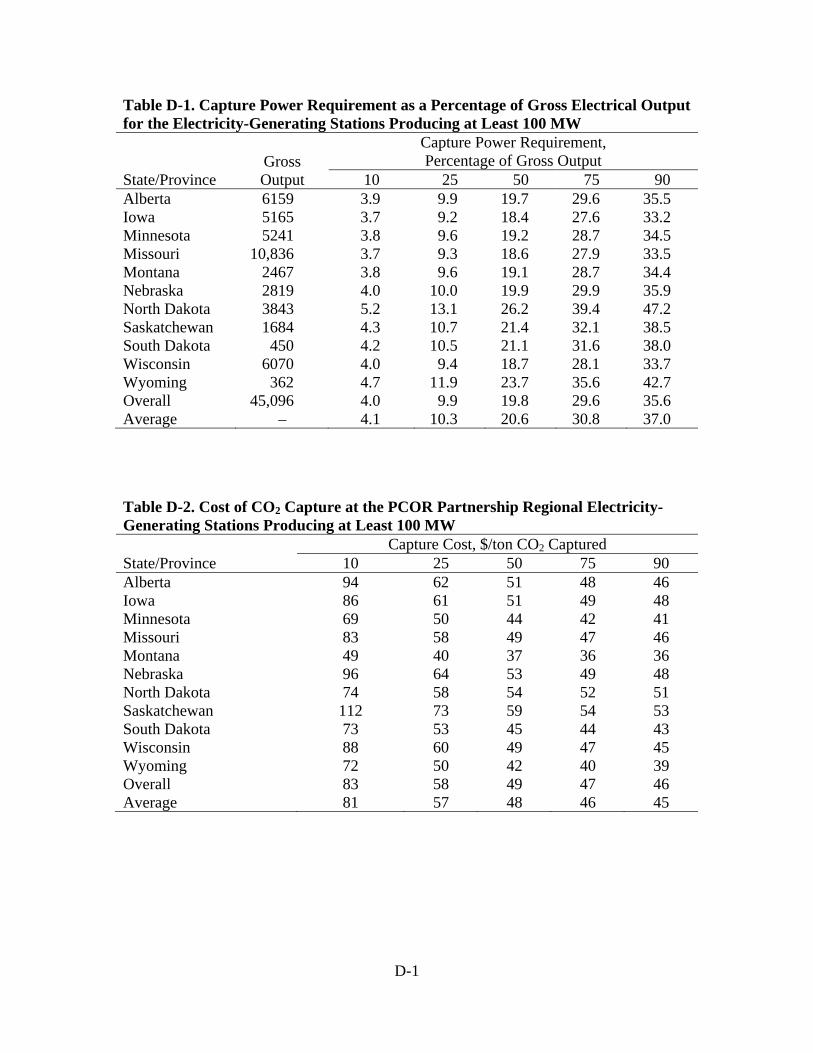
D-1
Table D-1. Capture Power Requirement as a Percentage of Gross Electrical Output for the Electricity-Generating Stations Producing at Least 100 MW
State/Province Gross Output
Capture Power Requirement, Percentage of Gross Output
10 25 50 75 90 Alberta 6159 3.9 9.9 19.7 29.6 35.5 Iowa 5165 3.7 9.2 18.4 27.6 33.2 Minnesota 5241 3.8 9.6 19.2 28.7 34.5 Missouri 10,836 3.7 9.3 18.6 27.9 33.5 Montana 2467 3.8 9.6 19.1 28.7 34.4 Nebraska 2819 4.0 10.0 19.9 29.9 35.9 North Dakota 3843 5.2 13.1 26.2 39.4 47.2 Saskatchewan 1684 4.3 10.7 21.4 32.1 38.5 South Dakota 450 4.2 10.5 21.1 31.6 38.0 Wisconsin 6070 4.0 9.4 18.7 28.1 33.7 Wyoming 362 4.7 11.9 23.7 35.6 42.7 Overall 45,096 4.0 9.9 19.8 29.6 35.6 Average – 4.1 10.3 20.6 30.8 37.0
Table D-2. Cost of CO2 Capture at the PCOR Partnership Regional Electricity-Generating Stations Producing at Least 100 MW
State/Province Capture Cost, $/ton CO2 Captured
10 25 50 75 90 Alberta 94 62 51 48 46 Iowa 86 61 51 49 48 Minnesota 69 50 44 42 41 Missouri 83 58 49 47 46 Montana 49 40 37 36 36 Nebraska 96 64 53 49 48 North Dakota 74 58 54 52 51 Saskatchewan 112 73 59 54 53 South Dakota 73 53 45 44 43 Wisconsin 88 60 49 47 45 Wyoming 72 50 42 40 39 Overall 83 58 49 47 46 Average 81 57 48 46 45

D-2
Table D-3. Levelized Annual Capture Cost for PCOR Partnership Regional Electricity-Generating Stations Producing at Least 100 MW
State/Province Levelized Annual Capture Cost, $M/yr
10 25 50 75 90 Alberta 250 501 903 1338 1587 Iowa 199 418 759 1143 1357 Minnesota 207 435 811 1191 1414 Missouri 403 848 1548 2314 2752 Montana 89 190 362 536 635 Nebraska 119 247 458 664 784 North Dakota 206 447 863 1264 1519 Saskatchewan 87 179 321 463 558 South Dakota 17 37 68 103 122 Wisconsin 245 512 924 1374 1632 Wyoming 16 34 61 93 110 Overall 1838 3847 7079 10,483 12,468
Table D-4. Quantity of CO2 Captured at the PCOR Partnership Region’s Electricity-Generating Stations Producing at Least 100 MW
State/Province
Total CO2 Production, Mtons/yr
CO2 Production from All Electric Stations, Mtons/yr
Total CO2 Captured, Mtons/yr 10 25 50 75 90
Alberta 105 47.4 4.57 11.42 22.84 34.25 41.11 Iowa 55.5 39.2 3.65 9.13 18.26 27.39 32.87 Minnesota 72.3 53.3 4.18 10.46 20.92 31.38 37.66 Missouri 99.0 83.3 7.90 19.76 39.51 59.27 71.12 Montana 23.2 21.0 2.01 5.03 10.05 15.08 18.09 Nebraska 33.7 25.8 2.22 5.55 11.11 16.66 19.99 North Dakota 44.3 36.0 3.55 8.82 17.64 26.46 31.75 Saskatchewan 21.2 14.5 1.42 3.56 7.12 10.67 12.81 South Dakota 19.9 4.19 0.38 0.94 1.88 2.81 3.38 Wisconsin 90.0 50.6 4.79 11.98 23.95 35.93 43.12 Wyoming 6.29 5.91 0.34 0.84 1.69 2.53 3.03 Overall 576 382 35.01 87.48 174.96 262.44 314.92

D-3
Table D-5. Percentage of Reduction in CO2 Emissions from Electricity-Generating Stations in the PCOR Partnership Region Afforded by CO2 Capture
State/Province
CO2 Production from All Electric
Stations, Mtons/yr
CO2 Reductions from All Electric Stations, % 10 25 50 75 90
Alberta 47.4 9.64 24.1 48.2 72.3 86.7 Iowa 39.2 9.33 23.3 46.6 70.0 83.9 Minnesota 53.3 7.86 19.6 39.3 58.9 70.7 Missouri 83.3 9.49 23.7 47.4 71.1 85.4 Montana 21.0 9.58 24.0 47.9 71.9 86.2 Nebraska 25.8 8.61 21.5 43.1 64.6 77.5 North Dakota 36.0 9.86 24.5 49.0 73.5 88.2 Saskatchewan 14.5 9.80 24.5 49.0 73.5 88.2 South Dakota 4.19 8.95 22.4 44.8 67.2 80.6 Wisconsin 50.6 9.46 23.7 47.3 71.0 85.2 Wyoming 5.91 5.70 14.2 28.5 42.7 51.3 Overall 382 9.17 22.9 45.8 68.8 82.5
Table D-6. Percentage of Reduction in CO2 Emissions from All Industrial Point Sources in the PCOR Partnership Region Afforded by CO2 Capture
State/Province
Total CO2 Production, Mtons/yr
CO2 Reductions from All Sources, %
10 25 50 75 90 Alberta 105 4.35 10.9 21.7 32.6 39.1 Iowa 55.5 6.58 16.5 32.9 49.4 59.2 Minnesota 72.3 5.79 14.5 29.0 43.4 52.1 Missouri 99.0 7.98 20.0 39.9 59.9 71.8 Montana 23.2 8.67 21.7 43.4 65.0 78.0 Nebraska 33.7 6.59 16.5 33.0 49.4 59.3 North Dakota 44.3 8.01 19.9 39.8 59.7 71.6 Saskatchewan 21.2 6.71 16.8 33.6 50.3 60.4 South Dakota 19.9 1.89 4.7 9.4 14.1 17.0 Wisconsin 90.0 5.32 13.3 26.6 39.9 47.9 Wyoming 6.29 5.35 13.4 26.8 40.2 48.2 Overall 576 6.08 15.2 30.4 45.6 54.7
APPENDIX E
SUMMARY OF CO2 PIPELINE ROUTES FOR THE PCOR PARTNERSHIP STATES AND PROVINCES
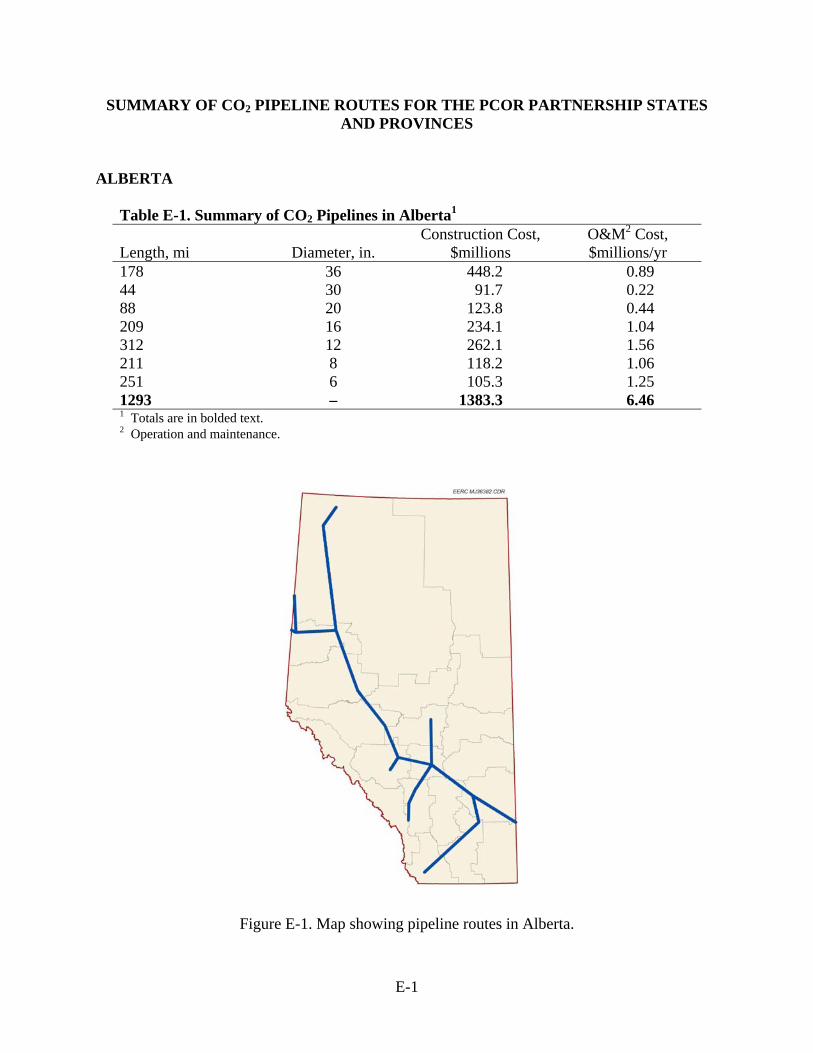
E-1
SUMMARY OF CO2 PIPELINE ROUTES FOR THE PCOR PARTNERSHIP STATES AND PROVINCES
ALBERTA
Table E-1. Summary of CO2 Pipelines in Alberta1
Length, mi Diameter, in. Construction Cost,
$millions O&M2 Cost, $millions/yr
178 36 448.2 0.89 44 30 91.7 0.22 88 20 123.8 0.44 209 16 234.1 1.04 312 12 262.1 1.56 211 8 118.2 1.06 251 6 105.3 1.25 1293 – 1383.3 6.46 1 Totals are in bolded text. 2 Operation and maintenance.
Figure E-1. Map showing pipeline routes in Alberta.

E-2
BRITISH COLUMBIA Table E-2. Summary of CO2 Pipelines in British Columbia1
Length, mi Diameter, in. Construction Cost,
$millions O&M Cost, $millions/yr 50 12 42.0 0.25 70 8 39.2 0.35 149 6 62.5 0.74 269 – 143.7 1.34 1 Totals are in bolded text.
Figure E-2. Map showing pipeline routes in British Columbia.

E-3
IOWA Table E-2. Summary of CO2 Pipelines in Iowa1
Length, mi Diameter, in. Construction Cost,
$millions O&M Cost, $millions/yr
220 24 369.6 1.1 291 20 406.7 1.5 201 16 225.1 1.0 191 12 160.4 1.0 53 8 29.7 0.3 59 6 24.8 0.3 297 4 83.2 1.5 1312 – 1299.5 6.6 1 Totals are in bolded text.
Figure E-3. Map showing pipeline routes in Iowa.

E-4
MANITOBA
There are no ethanol plants, gas-processing plants, or electricity-generating stations at least 100 MW in size in Manitoba.

E-5
MINNESOTA Table E-4. Summary of CO2 Pipelines in Minnesota1
Length, mi Diameter, in. Construction Cost,
$millions O&M Cost, $millions/yr
299 30 530.2 1.49 107 24 179.4 0.53 155 20 217.5 0.78 17 16 19.0 0.09 233 12 195.7 1.17 161 8 90.1 0.81 208 6 87.4 1.04 183 4 51.2 0.92 1363 – 1370.5 7.02 1 Totals are in bolded text.
Figure E-4. Map showing pipeline routes in Minnesota.

E-6
MISSOURI Table E-5. Summary of CO2 Pipelines in Missouri1
Length, mi Diameter, in. Construction Cost,
$millions O&M Cost, $millions/yr
374 30 785.4 1.87 204 24 342.7 1.02 76 20 106.4 0.38 111 16 124.3 0.56 139 12 116.8 0.70 82 4 23.0 0.40 986 – 1498.6 4.93 1 Totals are in bolded text.
Figure E-5. Map showing pipeline routes in Missouri.
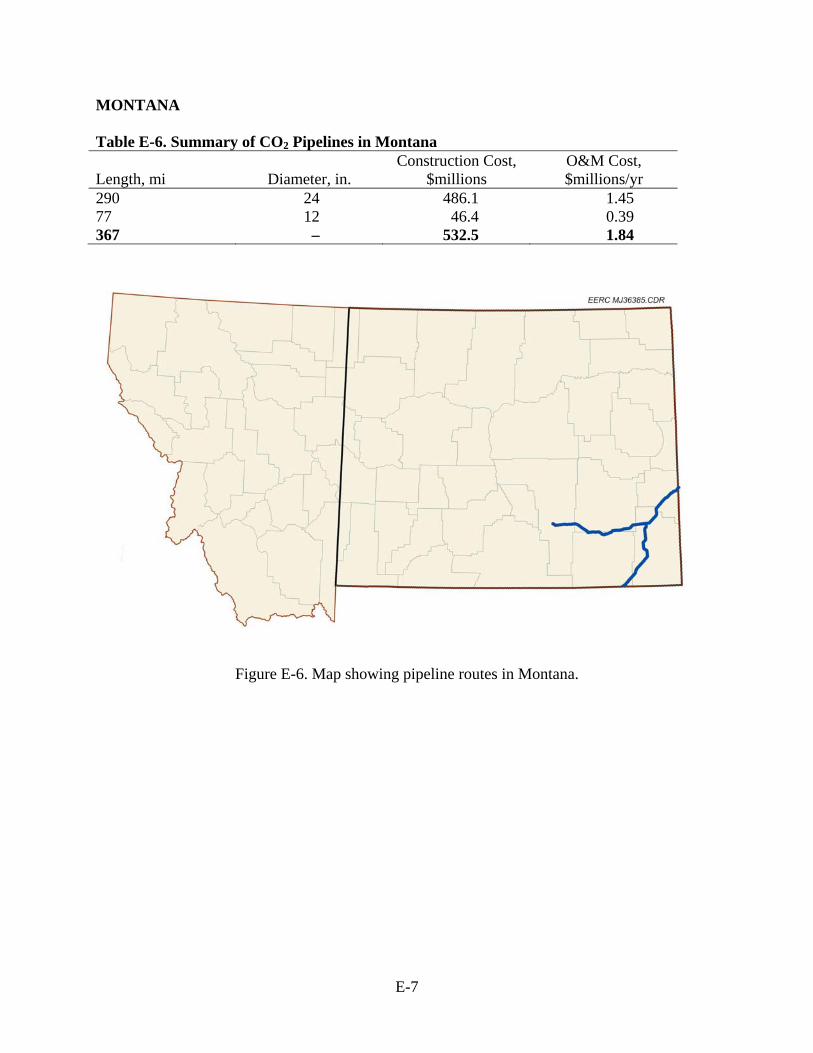
E-7
MONTANA Table E-6. Summary of CO2 Pipelines in Montana
Length, mi Diameter, in. Construction Cost,
$millions O&M Cost, $millions/yr
290 24 486.1 1.45 77 12 46.4 0.39 367 – 532.5 1.84
Figure E-6. Map showing pipeline routes in Montana.
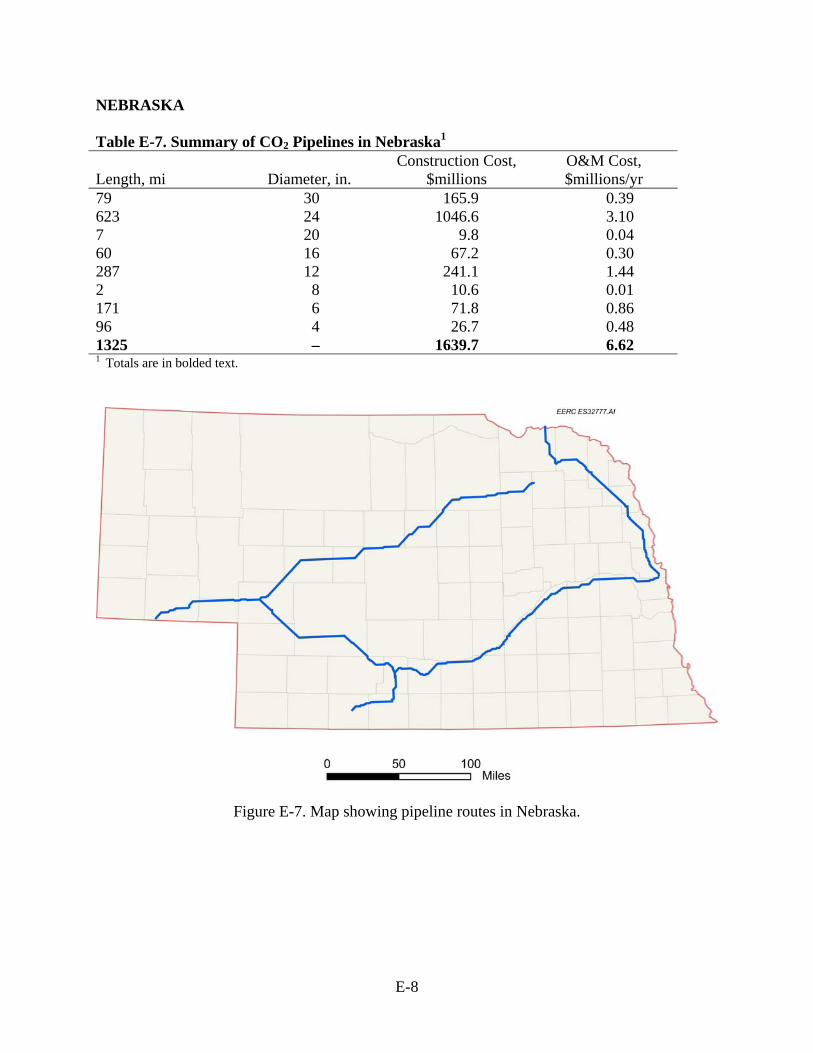
E-8
NEBRASKA Table E-7. Summary of CO2 Pipelines in Nebraska1
Length, mi Diameter, in. Construction Cost,
$millions O&M Cost, $millions/yr
79 30 165.9 0.39 623 24 1046.6 3.10 7 20 9.8 0.04 60 16 67.2 0.30 287 12 241.1 1.44 2 8 10.6 0.01 171 6 71.8 0.86 96 4 26.7 0.48 1325 – 1639.7 6.62 1 Totals are in bolded text.
Figure E-7. Map showing pipeline routes in Nebraska.

E-9
NORTH DAKOTA Table E-8. Summary of CO2 Pipelines in North Dakota1
Length, mi Diameter, in. Construction Cost,
$millions O&M Cost, $millions/yr
604 30 1266 3.02 289 20 404.8 1.45 10 16 11.2 0.05 15 12 12.6 0.08 40 6 16.8 0.20 958 – 1711.4 4.79 1 Totals are in bolded text.
Figure E-8. Map showing pipeline routes in North Dakota.

E-10
SASKATCHEWAN Table E-9. Summary of CO2 Pipelines in Saskatchewan1
Length, mi Diameter, in. Construction Cost,
$millions O&M Cost, $millions/yr
20 20 28.0 0.10 90 16 100.8 0.45 110 – 128.8 0.55 1 Totals are in bolded text.
Figure E-9. Map showing pipeline routes in Saskatchewan.

E-11
SOUTH DAKOTA Table E-10. Summary of CO2 Pipelines in South Dakota1
Length, mi Diameter, in. Construction Cost,
$millions O&M Cost, $millions/yr
362 20 506.8 1.81 202 16 225.8 1.01 21 12 17.6 0.11 297 6 124.6 1.48 33 4 9.2 0.17 915 – 884.0 4.58 1 Totals are in bolded text.
Figure E-10. Map showing pipeline routes in South Dakota.
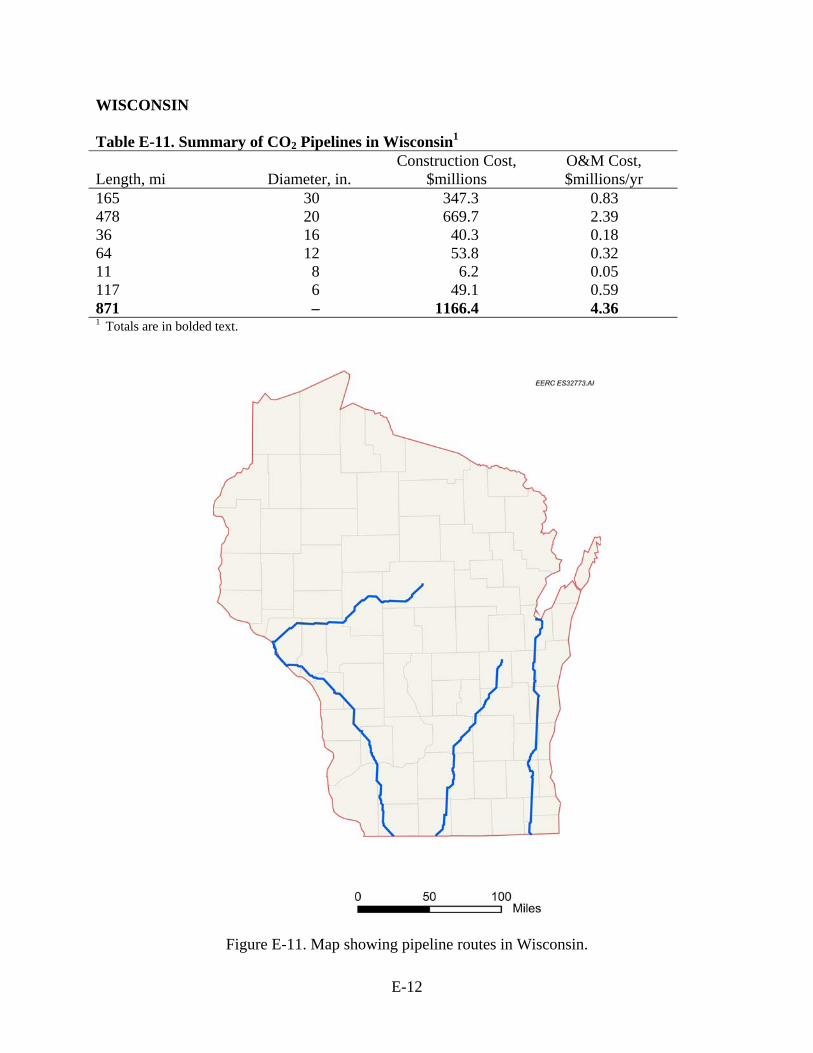
E-12
WISCONSIN Table E-11. Summary of CO2 Pipelines in Wisconsin1
Length, mi Diameter, in. Construction Cost,
$millions O&M Cost, $millions/yr
165 30 347.3 0.83 478 20 669.7 2.39 36 16 40.3 0.18 64 12 53.8 0.32 11 8 6.2 0.05 117 6 49.1 0.59 871 – 1166.4 4.36 1 Totals are in bolded text.
Figure E-11. Map showing pipeline routes in Wisconsin.

E-13
WYOMING Table E-12. Summary of CO2 Pipelines in Wyoming
Length, mi Diameter, in. Construction Cost,
$millions O&M Cost, $millions/yr
77 12 46.4 0.385
Figure E-12. Map showing pipeline routes in Wyoming.


