TRANSPORTATION RESEARCH RECORD 1233 117 Applications of Barrier VII in Design of Flexible Barriers ROGER p. BLIGH AND DEAN L. SICKING Evaluation of the performance of roadside safety appurtenances has always been limited by the high costs associated with full-scale crash testing. Computer simulation programs have provided a relatively inexpensive alternative for analyzing vehicle/barrier interactions. Barrier VII is one such program that has been used successfully as a design tool in the development of numerous bar- rier systems. This paper summarizes the Barrier VII simulation model, discusses input requirements, and describes the appropri- ate applications and limitations of the program for analyzing lon- gitudinal barrier impacts. The applications discussed include determination of design loads, evaluation of barrier performance limits, prediction of vehicle snagging, and determination of the critical impact location for a barrier system. Examples of these applications are given to emphasize these capabilities and limita- tions and to aid the user in the design of flexible barrier systems. Analysis of vehicular impacts with roadside barriers is a com- plex task. Complicating factors, such as material and geo- metric nonlinearities, virtually eliminate any hope of fully analyzing vehicular impact problems through hand calculation procedures. In fact, in view of the complexity of this dynamic interaction, the only practical and reliable approaches for evaluating the impact performance of longitudinal barriers are full-scale crash testing and computer simulation. Full-scale crash testing is the most accurate method for evaluating lon- gitudinal barrier impact performance. However, such tests are extremely expensive and cannot be used as a routine design tool. As a result, full-scale crash tests have been reserved for compliance testing of completed designs. Computer simulation programs are sophisticated analytical models for analyzing dynamic vehicle/barrier interactions and provide a relatively inexpensive alternative to full-scale crash testing. As the cost of full-scale crash testing has risen, sim- ulation programs have played an increasingly important role in the development of highway safety hardware. Longitudinal barrier design and evaluation are major areas where simu- lation programs have been used. Specific applications of vehi- cle/barrier simulation programs include determination of bar- rier component design loadings, critical impact locations, limits of barrier performance, and the severity of barrier impact. The basic goal of any computer simulation program is to provide accurate and economical solutions to complex prob- lems. Most available vehicle/barrier simulation programs have continued to evolve over the years, steadily growing more sophisticated. Although this increased sophistication has gen- erally improved accuracy, the required level of operator train- ing and experience has also increased significantly. Further, for most vehicle/barrier programs developed to date, increased Texas Transportation Institute, The Texas A&M University System, College Station, Tex. 77843. program complexity has raised input data requirements and program running time, thereby leading to additional operating costs. Thus, as a simulation program's accuracy increases through increased complexity, its usefulness is sometimes restricted due to increases in the required level of operator expertise and run time costs. Barrier VII is a simulation program that has not changed significantly during the past 15 years (1). Although pre- and post-processors have been developed for the program (2, 3), no significant program improvements have been incorporated since its original publication. Therefore, Barrier VII's code has remained essentially constant, and all validation efforts conducted to date are directly applicable to the current pro- gram. As a result, the need for continuing revalidation and user retraining arising from program modifications has been eliminated. Furthermore, the high level of sophistication incorporated into the original program has provided a rea- sonably high level of accuracy. As a result of the program's accuracy and stability, Barrier VII has been used more widely than any of its more sophisticated counterparts. This paper describes the appropriate applications and limitations of the Barrier VII program for analyzing longitudinal barrier impacts. DESCRIPTION Barrier VII is a two-dimensional vehicle/barrier simulation program with a highly sophisticated barrier model and a some- what simplified vehicle model. This combination of a complex barrier system and a simplified vehicle model has been proven to provide adequate solutions to all but the most difficult barrier-impact analysis problems. Details of the individual components of the Barrier VII program are presented below. Barrier Model The Barrier VII program employs a sophisticated barrier model that is idealized as an assemblage of discrete structural mem- bers possessing geometric and material nonlinearities. The sophistication of this model makes Barrier VII ideally suited for the prediction of maximum design loads and stresses. Available structural members include beams, cables, posts, columns, springs, links, and damping devices. Composite members can be constructed by placing two or more members in parallel to provide more complex properties than those of the basic members. Simulated guardrail beam elements are assumed to be of uniform cross section and to have bilinear elastic/perfectly-plastic properties both flexurally and exten-
Transcript
TRANSPORTATION RESEARCH RECORD 1233 117
Applications of Barrier VII in Design of Flexible Barriers
ROGER p. BLIGH AND DEAN L. SICKING
Evaluation of the performance of roadside safety appurtenances has always been limited by the high costs associated with full-scale crash testing. Computer simulation programs have provided a relatively inexpensive alternative for analyzing vehicle/barrier interactions. Barrier VII is one such program that has been used successfully as a design tool in the development of numerous barrier systems. This paper summarizes the Barrier VII simulation model, discusses input requirements, and describes the appropriate applications and limitations of the program for analyzing longitudinal barrier impacts. The applications discussed include determination of design loads, evaluation of barrier performance limits, prediction of vehicle snagging, and determination of the critical impact location for a barrier system. Examples of these applications are given to emphasize these capabilities and limitations and to aid the user in the design of flexible barrier systems.
Analysis of vehicular impacts with roadside barriers is a complex task. Complicating factors, such as material and geometric nonlinearities, virtually eliminate any hope of fully analyzing vehicular impact problems through hand calculation procedures. In fact, in view of the complexity of this dynamic interaction, the only practical and reliable approaches for evaluating the impact performance of longitudinal barriers are full-scale crash testing and computer simulation. Full-scale crash testing is the most accurate method for evaluating longitudinal barrier impact performance. However, such tests are extremely expensive and cannot be used as a routine design tool. As a result, full-scale crash tests have been reserved for compliance testing of completed designs.
Computer simulation programs are sophisticated analytical models for analyzing dynamic vehicle/barrier interactions and provide a relatively inexpensive alternative to full-scale crash testing. As the cost of full-scale crash testing has risen, simulation programs have played an increasingly important role in the development of highway safety hardware. Longitudinal barrier design and evaluation are major areas where simulation programs have been used. Specific applications of vehicle/barrier simulation programs include determination of barrier component design loadings, critical impact locations, limits of barrier performance, and the severity of barrier impact.
The basic goal of any computer simulation program is to provide accurate and economical solutions to complex problems. Most available vehicle/barrier simulation programs have continued to evolve over the years, steadily growing more sophisticated. Although this increased sophistication has generally improved accuracy, the required level of operator training and experience has also increased significantly. Further, for most vehicle/barrier programs developed to date, increased
Texas Transportation Institute, The Texas A&M University System, College Station, Tex. 77843.
program complexity has raised input data requirements and program running time, thereby leading to additional operating costs. Thus, as a simulation program's accuracy increases through increased complexity, its usefulness is sometimes restricted due to increases in the required level of operator expertise and run time costs.
Barrier VII is a simulation program that has not changed significantly during the past 15 years (1). Although pre- and post-processors have been developed for the program (2, 3), no significant program improvements have been incorporated since its original publication. Therefore, Barrier VII's code has remained essentially constant, and all validation efforts conducted to date are directly applicable to the current program. As a result, the need for continuing revalidation and user retraining arising from program modifications has been eliminated. Furthermore, the high level of sophistication incorporated into the original program has provided a reasonably high level of accuracy. As a result of the program's accuracy and stability, Barrier VII has been used more widely than any of its more sophisticated counterparts. This paper describes the appropriate applications and limitations of the Barrier VII program for analyzing longitudinal barrier impacts.
DESCRIPTION
Barrier VII is a two-dimensional vehicle/barrier simulation program with a highly sophisticated barrier model and a somewhat simplified vehicle model. This combination of a complex barrier system and a simplified vehicle model has been proven to provide adequate solutions to all but the most difficult barrier-impact analysis problems. Details of the individual components of the Barrier VII program are presented below.
Barrier Model
The Barrier VII program employs a sophisticated barrier model that is idealized as an assemblage of discrete structural members possessing geometric and material nonlinearities. The sophistication of this model makes Barrier VII ideally suited for the prediction of maximum design loads and stresses. Available structural members include beams, cables, posts, columns, springs, links, and damping devices. Composite members can be constructed by placing two or more members in parallel to provide more complex properties than those of the basic members. Simulated guardrail beam elements are assumed to be of uniform cross section and to have bilinear elastic/perfectly-plastic properties both flexurally and exten-
118
sionally. Extensionally, the member is assumed to yield over its full length when the axial force exceeds the yield force; flexurally, the member yields by forming localized plastic hinges at the ends of the member. The strength, stiffness, and damping properties, as appropriate, are assigned by the user for each barrier element.
Post members are used to represent all attachments of a barrier to the ground or to a rigid object. A post is assumed to yield at constant load by forming a plastic hinge at its base. Connection to a rigid object is simulated by making the post very stiff and strong. Stiffness for elastic horizontal displacements and base yield moments are assigned to the post for both longitudinal and lateral directions. Failure of the post may occur in one of two ways. A deflection failure can be used to represent separation of the rail from the post or withdrawal of the post from the ground. A shear failure can be specified to represent fracture of a weakened post or separation of the post from a breakaway base. For example, a shear failure mode could be used to simulate the weak timber posts sometimes used with Gl cable guardrail systems. Another application would be the simulation of the timber terminal posts in a breakaway cable terminal. These end posts are typically set in concrete footings and would therefore fail by fracturing rather than by excessive deflection.
Post parameters described above are difficult to define by analytical means. Wide variations in material properties and behavior of both the wood posts and surrounding soil are further complicated by the dynamic impact loading and its effects on soil/post interaction. Because of these complexities, guardrail posts are typically characterized through experimental data obtained from pendulum and dynamic load tests. Data from such tests are available for various-sized wood and steel posts embedded in various types of soil. Table 1 shows simulated post properties obtained ( 4-6).
Steel beam properties, such as section modulus and yield moment, can easily be determined through normal analytical techniques. However, dynamic deflection characteristics are significantly different from the static properties obtained in this manner. In an effort to account for these strain rate effects, simulated dynamic beam properties are estimated to be approximately 1.5 times calculated static values.
Vehicle Model
Barrier VII incorporates a planar vehicle model described by a number of discrete omnidirectional inelastic springs. These springs define possible contact points at which the automobile may interact with the barrier. Thus, the vehicle structure can be defined at several different heights for interaction with rail elements at different elevations. The spring stiffnesses assigned to each contact point act over a specified tributary width and are user defined.
Vehicle stiffnesses have been calibrated by simulating the impact of a vehicle into a rigid wall (7). Use of the rigid wall tests eliminated beam and post parameters as variables in the solution scheme and provided for a direct analysis of vehicle deformation versus stiffness. Vehicle spring stiffnesses were adjusted to obtain good correlation between measured and predicted vehicle deformations. As shown in Figure 1, calibrated vehicle stiffnesses were found to give very good predictions of vehicle crush. Other values, such as exit speed and
TRANSPORTATION RESEARCH RECORD 1233
angle, time for the vehicle to become parallel, and maximum 50 ms average accelerations, also showed good correlation. This further indicated that vehicle stiffness parameters, and thus the forces imparted to the barrier, were appropriate. The contact points and associated unit stiffnesses for the calibrated vehicle model are shown in Figure 2.
TABLE 1 POST PARAMETERS FOR BARRIER VII INPUT
Material
Wood Wood Steel 6 in. x 8 in. (5) 7-in. Diam. (6) W6 x 8.5 (5)
NOTE: A = longitudinal or major axis; B = transverse or minor axis; k = stiffness of post for elastic horizontal deflections; M = base moment at which post yields; F = shear force causing failure of post; and Ii deflection causing failure of post. Effective rail height = 21 in.
Before Bottoming 0.04 After Bottoming 0.25 Unloading 7.50
12
13
FIGURE 2 Calibrated vehicle model for Barrier VII input.
Validation
Before any simulation program can be useful as a reliable design tool, it must first be validated against the results of full-scale crash tests. Barrier VII has been more extensively validated than any other flexible barrier simulation. During the course of its application, simulation results have been compared with a wide range of test data, including numerous guardrail, bridge rail, and transition systems. One of the most comprehensive validation efforts was performed by Calcote ( 4) . In this study, the results of Barrier VII correlation runs were compared with 20 full-scale crash tests. Barrier systems investigated included standard Gl, G2, G3, G4, and G9 guardrail systems, as well as other guardrail systems. Additional validation efforts have been conducted for other types of longitudinal barriers, including strong-post W-beam guardfence, guardrail-to-bridge rail transitions, and short-radius guardrail installations (5, 7, 8). In most cases , the program has accurately predicted overall vehicle trajectories and barrier deflections. These two parameters are the primary indicators of barrier performance.
The ultimate measure of the value of a simulation program is to examine the test record of the safety features developed with its use. As mentioned previously, the Barrier VII pro-
119
gram has been used quite successfully as a design tool in the development and analysis of new longitudinal barrier systems. Systems that have .been tested successfully include various guardrails (8-10), bridge rails (11, 12), and guardrail-to-bridge rail transitions (5, 7, 13).
LIMIT A TIO NS
The Barrier VII simulation has been shown to be a useful design tool in the development of longitudinal barriers. However, as with any other simulation program, it has limitations. The two-dimensional vehicle model incorporated into the Barrier VII program is restrictive for analysis of barrier impacts where rollover or vaulting behavior may be a problem. Further, the two-dimensional model prevents direct prediction of vehicle underride and sheet metal snagging on barrier components. However, even though it cannot be simulated, indirect measures can be used to predict such behavior. For example, the potential for sheet metal snagging can be estimated by observing predicted vehicle and barrier deflection shapes.
Although these limitations can often be circumvented, the value of user experience and expertise in the application of the Barrier VII program should not be overlooked. User experience is helpful in differentiating difficult impact scenarios from straightforward cases. Examples of situations where user experience is especially important include impacts involving large barrier deflections or relatively shallow post embedment (14). Large barrier deflections allow automobile tires to impact guardrail posts, thereby exerting upward forces on the impacting vehicle and downward forces on the posts. These forces can lead to vehicle vaulting or rupture of the beam elements if the posts are still attached to the rail. Shallow post embedment can lead to complete post pullout, which can cause vaulting as an impacting vehicle rides over guardrail posts strewn in its path. Although Barrier VII cannot directly predict such behavior, simulation results can be used to identify when these phenomena are likely to occur. In summary, as with most computer programs, Barrier VII can be helpful in the design and analysis of longitudinal barriers when simulation results are tempered with sound engineering judgment.
CAPABILITIES AND APPLICATIONS
There are many considerations that must be addressed in the design of a safe and cost-effective barrier system. Major design parameters, such as guardrail beam strength, post spacing, and post size, are often dictated by considerations such as cost, type of barrier application, and anticipated service level. For instance, cost considerations may prescribe the types of materials to be used; the type of barrier (i .e., guardrail, bridge rail, or transition) will dictate the maximum allowable dynamic deflection; and the anticipated service level (i.e., passenger cars, trucks, or buses) will define the required barrier strength.
However, to develop an optimized system within a given set of limitations, numerous configurations must be evaluated. Using Barrier VII simulation, parametric studies can be conducted to evaluate the advantages and disadvantages of each candidate design. Evaluation criteria include indicators of performance such as redirective capabilities, maximum barrier
120
deflection, and predicted degree of snagging. Additional simulations can be made to determine necessary connection design loads. A brief overview of each of these evaluation criteria, how they relate to Barrier VII, and their relevance to longitudinal barrier design follows.
Design Loads
The most important factor from which a successful barrier design evolves is probably the determination of design loads. The old adage holds true: a barrier is only as strong as its weakest link. Barrier VII is commonly used to determine maximum expected loading on barrier components such as rails, posts, splice bolts, and end anchors, thereby reducing the likelihood of failure of these components during crash testing.
Required beam strength or rail tensile capacity, or both, can be selected on the basis of the largest bending moment and tensile force predicted in the rail. Maximum bending moments can be estimated by using upper-bound values on rail bending strength properties in Barrier VII simulations. In this way, the program will predict the maximum bending moments that the rail can transfer to splice and anchor connections. Similarly, maximum tensile forces in a rail element can be estimated by simulating a barrier with lower-bound rail bending characteristics. Such a simulation will predict the maximum barrier deflection that can be expected as well as upper bounds on splice and anchor connection tensile forces. Finally, maximum connection shear forces can be determined by incorporating high post and beam yield moments . These procedures have been shown to predict conservative design loads, since terminal or splice connections designed using these procedures have consistently performed well with little or no signs of distress during full-scale crash testing.
A specific example is illustrated by Bligh et al. (7). In this study, a tubular W-beam rail was transitioned to a rigid bridge rail. Because the strong beam was capable of transferring more shear and moment to the bridge rail end than a standard flexible W-beam, it was necessary to design a connection with adequate strength to carry these increased impact forces. Design loading conditions obtained from Barrier VII for the connection between the tubular W-beam and the concrete barrier end included a 140-kip tensile force. a 60-kip shear force. and a 280-kip-in bending moment. The transition installation was successfully tested three times without connection failure.
Barrier VII's ability to determine maximum loading conditions was used in a slightly different manner in the design of an innovative energy-absorbing bridge rail (12) . The program was used to determine the post spacing at which the shear and moment t1ansferred to the base of a post did not exceed the strength of the bridge deck. Barrier VII simulation results were also used to size rubber energy-absorbing elements that were used as blockouts.
Performance Limits
Maximum barrier deflection is often used as a surrogate measure of barrier performance. The maximum allowable deflection is generally dictated by the type of barrier under developtuent. For instance, the dynamic deflection of a bridge rai!
TRANSPORTATION RESEARCH RECORD 1233
must be limited to safely contain an impacting vehicle and prevent its wheels from falling between the railing and the edge of the bridge deck. Special emphasis must also be placed on the avoidance of excessive deflection in a transition zone. In this case. too much deflection can result in pocketing or snagging of the vehicle on the stiffer system. leading to excessive deceleration or other undesirable consequences. Although guardrail installations can typically accommodate larger deflections, it is often necessary to strictly limit vehicle travel at constricted sites where a barrier is constructed immediately in front of a severe hazard . Further. large barrier deflections can lead to undesirable tire/post contact. causing snagging or barrier override . Thus, limits of performance of most barriers can be determined from predictions of maximum barrier deflections.
The Barrier VII simulation program . with its sophisticated barrier model, has been shown to be capable of accurately predicting barrier deflections for even the most severe impact conditions. As part of the Barrier VII output. deflected barrier shapes can be determined at each time step during the simulation. In this manner. the maximum expected barrier deflection can be found, and deflected barrier and vehicle shapes can be tracked throughout the simulated impact.
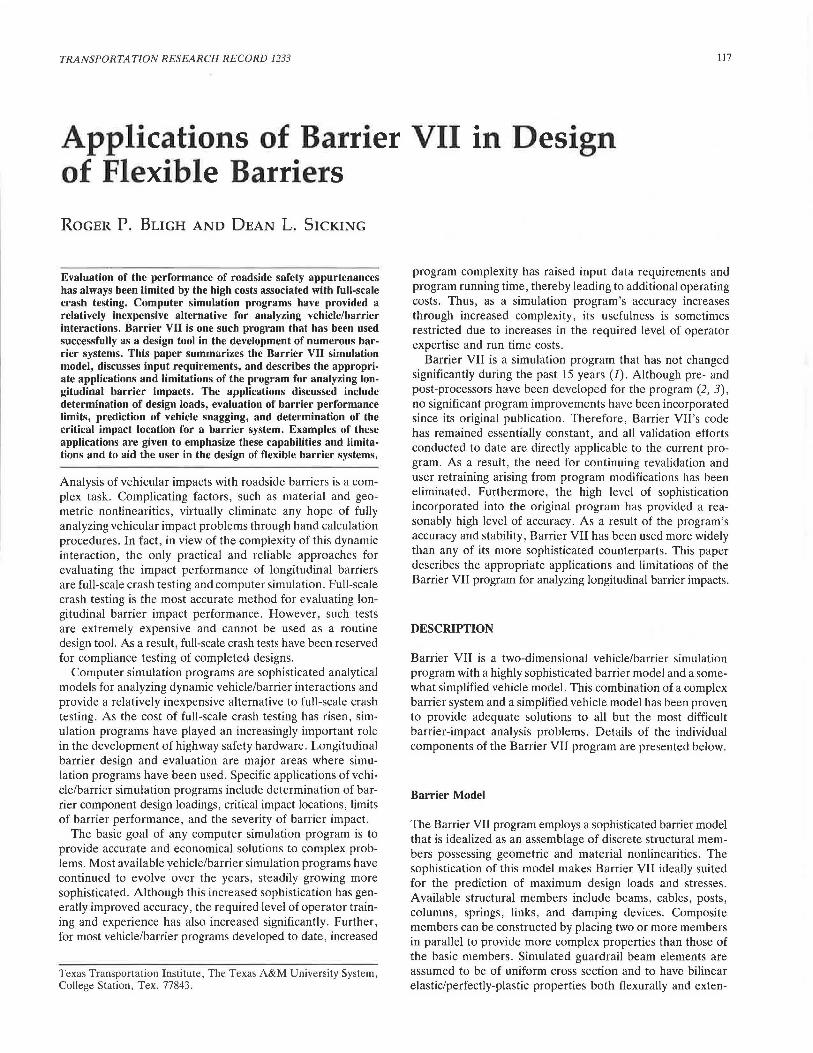
The strength of a barrier is determined by its beam strength. post spacing, and post size. Barrier VII can be used to conduct parametric studies of these variables and their effects on barrier deflection . These results can then be used to select a candidate design based on some maximum permissible deflection. Figure 3 shows the results of a parametric study developed with Barrier VII for the design of transitions to rigid barriers (7). The basic transition design was modeled as a standard strong post W-beam approach rail with modified post spacing and beam strength over the last 25 ft before the bridge rail. This figure was used to determine the barrier deflection that could be expected for a wide range of configurations and thus aided in the selection of a final design.
As mentioned above. the barrier deflection output can also be used to plot lateral barrier deflection for critical time steps during an impact. This can be useful in identifying potential performance problems such as vehicle snagging or pocketing.
Prediction of Snagging
The problem of vehicle snagging is an important consideration in the design of any barrier system. Snagging on guardrail posts and other stiff barrier components can lead to excessive vehicle decelerations or unacceptable occupant impact velocities. or both. The analysis of such vehicle/barrier or wheel/ post interactions is complex. In fact. regardless of how sophisticated the tire/suspension model of some programs might be, none of the simulation programs currently available can accurately simulate this behavior. Although wheel snagging cannot be simulated, its occurrence can be predicted. Barrier Vil. along with other simulation programs. can indirectly predict snagging by tracking wheel trajectory past guardrail posts or other potential snag points . One of the most effective means of tracking wheel position is making the wheel a vehicle tracking point. Direct coordinates for the wheel can then be determined for a particular time step or distance traveled.
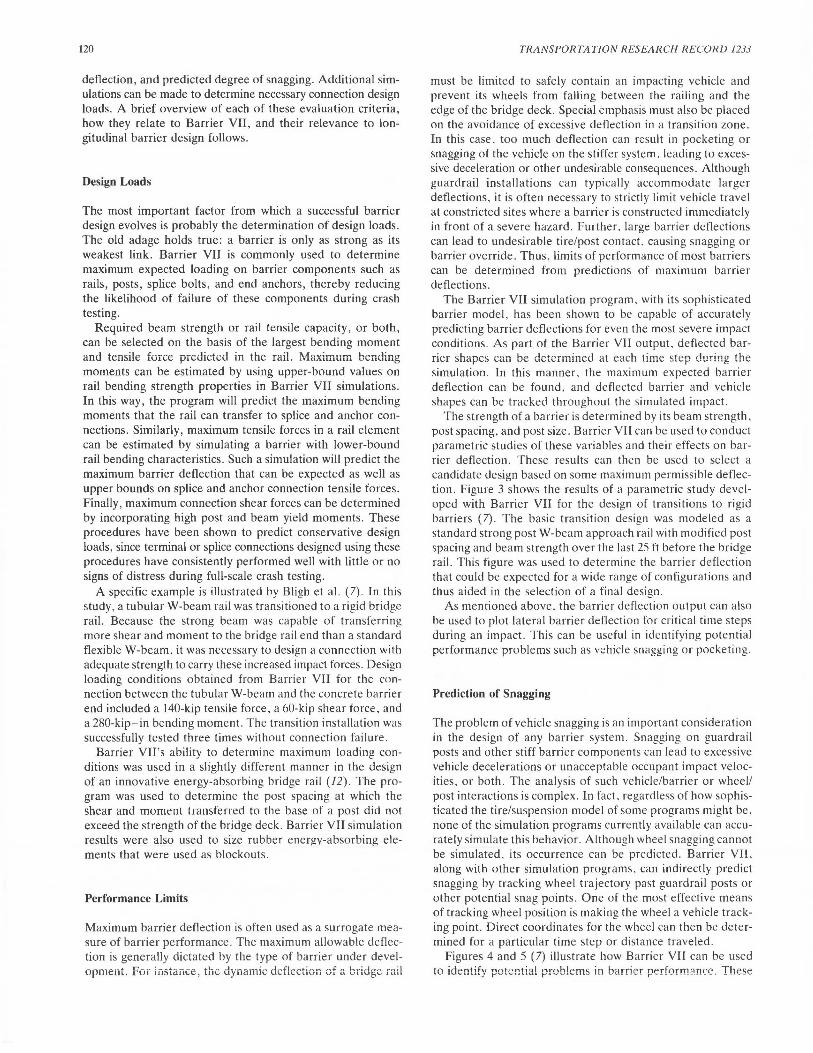
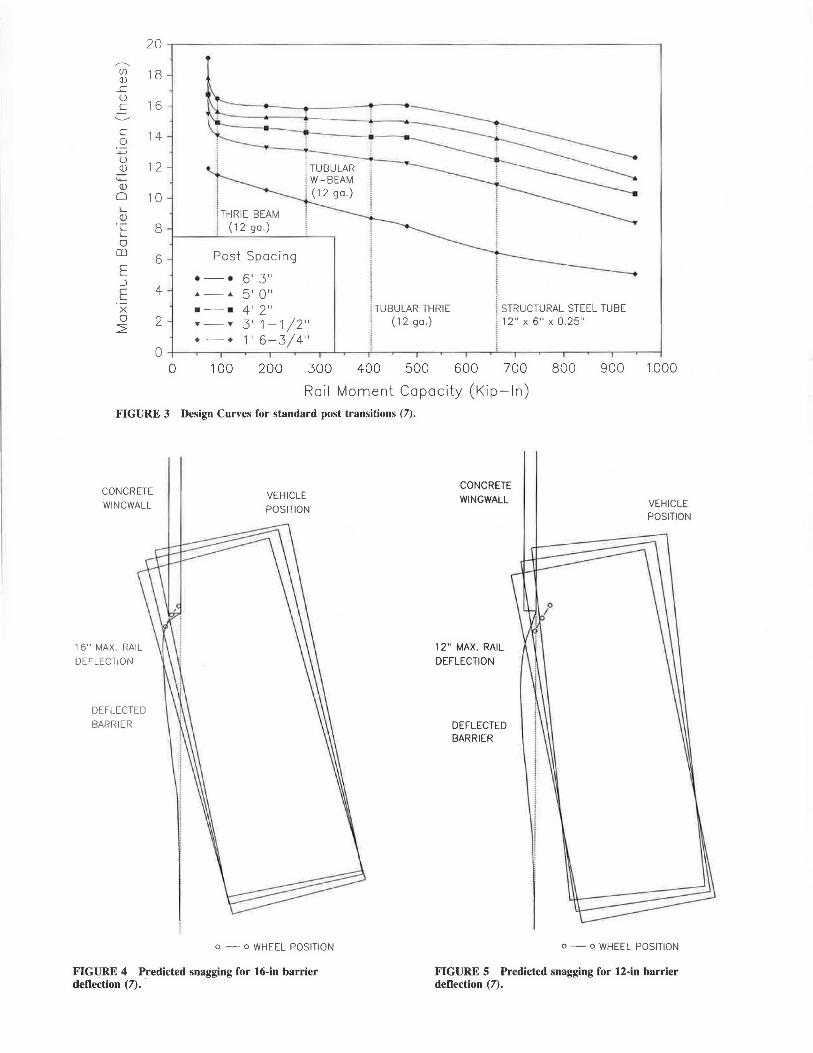
Figures 4 and 5 (7) illustrate how Barrier VII can be used to identify potential problems in barrier performil.nce, These
FIGURE 3 Design Curves for standard post transitions (7).
CONCRETE WINGWALL
1 6" MAX_ RAIL DEFLECTION
DEFLECTED BARRIER
VEHICLE POSITION
o - o WHEEL POSITION
FIGURE 4 Predicted snagging for 16-in barrier deflection ( 7).
CONCRETE WINGWALL
12" MAX. RAIL DEFLECTION
DEFLECTED BARRIER
VEHICLE POSITION
o - o WHEEL POSITION
FIGURE 5 Predicted snagging for 12-in barrier deflection (7).
122
figures were used to help determine an acceptable deflection limit when transitioning a flexible barrier into a rigid bridge rail. As shown in Figure 4. when the deflections were too large, the wheel followed a trajectory through the end of the concrete barrier. This behavior is indicative of severe vehicle snagging and poor safety performance. However. when the strength of the transition was sufficiently increased, the dynamic deflections were limited to an acceptable value and the wheel followed a path safely outside the bridge rail end. as shown in Figure 5.
The degree of wheel snagging on guardrail posts is another measure of the severity of an impact. Although Barrier VII cannot simulate this behavior. it can easily predict the amount of tire overlap on the guardrail post by using the rotation point of the post. post deflection. and tire position at time of contact with the post. Barrier VII output can be used to determine the time at which the tire reaches the guardrail post and the post deflection and lateral tire position corresponding to this time step. The results of such an analysis are shown in Figure 6. Results such as these can then be used in the design process to determine the depth of blackout required to reduce the severity of the wheel snagging or eliminate it altogether .
Impact Location
The impact location for vehicular impacts can be a critical factor in the evaluation of longitudinal barriers. All longitudinal barriers with beam-and-post construction have incremental snag points created by posts and other stiff barrier components. The distance of the impact point upstream from a snag point affects the degree of wheel. bumper. or hood
1800 lb/60 mph/15 deg Impact
6'-3" Post Spacing without Blackouts
Deflected Post
Extent of Snagging
FIGURE 6 Prediction of wheel snagging on guardrail post.
TRANSPORTATION RESEARCH RECORD 1233
snagging that occurs and thus affects the impact performance of the system. The critical impact location is the point at which the potential for snagging is maximized. An example of this variation in performance can be seen in the crash test results of a concrete beam and post bridge rail (15). When impacted near a post, the vehicle was smoothly redirected and the bridge rail successfully passed NCHRP Report 230 evaluation criteria (16). However, when a similar system was impacted further upstream from a post , the potential for snagging was maximized, and severe wheel and hood snagging was observed (17).
This same phenomenon holds true for flexible barrier systems as well. Impacting too close to a snag point. such as on a guardrail post, allows a vehicle to clear the snag point before guardrail deflections and vehicle penetration become large enough to allow snagging or pocketing. On the other hand, impacting too far upstream from a snag point may allow sufficient vehicle redirection before the snag point is reached. It should be noted that the critical impact point changes with the stiffness of the barrier. Stiff barriers redirect impacting vehicles more quickly and. therefore. have a critical impact location nearer to the snag point than more flexible barriers.
The Barrier VII simulation program has been used to determine critical impact locations for various barrier systems (5, 7, 8). The two primary indicators used to evaluate where the critical impact point occurs are barrier deflection and wheel snagging. Determination of both of these variables was discussed previously in this paper. The critical impact location is determined by simulating impacts into the barrier at various intervals before a post or other snag point. The critical impact condition is the one that creates the worst case combination of maximum barrier deflection and maximum wheel snagging at the snag point under investigation .
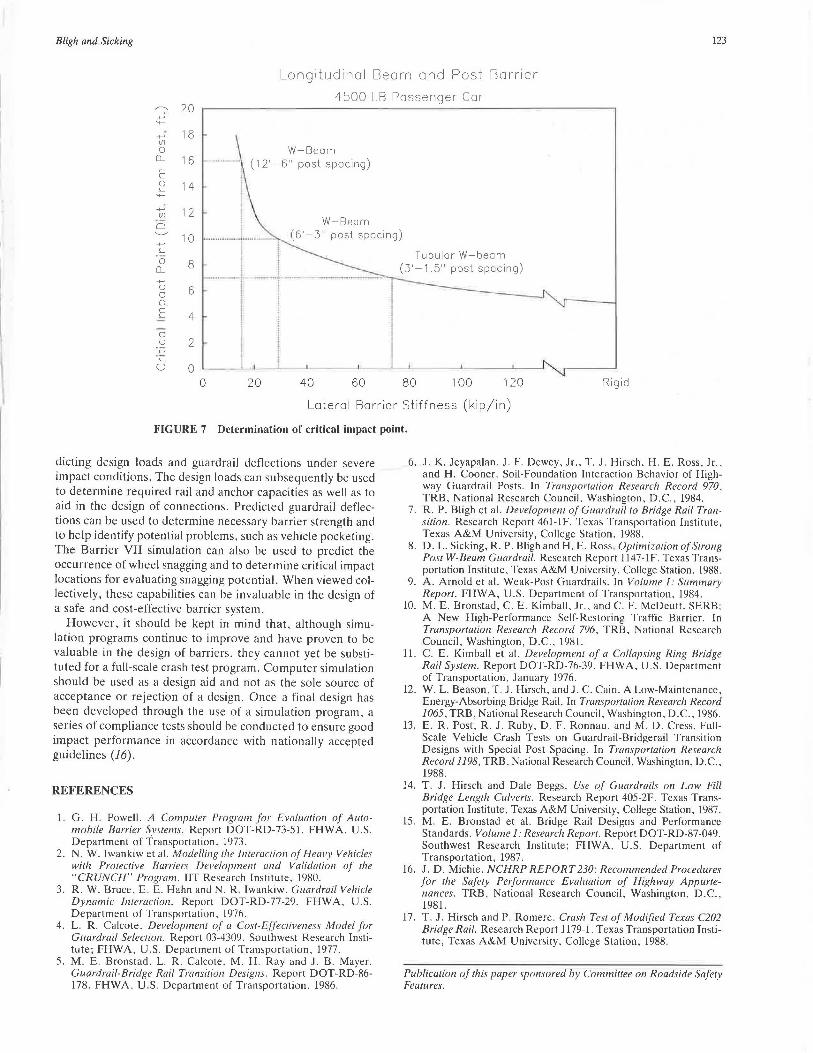
Barrier VII can also be used to determine the relationship between critical impact location and lateral barrier stiffness . As shown in Figure 7. such a relationship has been developed for a full-size passenger car. This figure can be used to determine the critical impact location for various beam-and-post barrier configurations based on an equivalent lateral barrier stiffness. An equivalent lateral stiffness was based on beam strength and weighted post stiffness over a 50-ft section of rail. A more comprehensive analysis would involve analyzing a large number of post spacings. beam strengths. and embedment depths for various vehicle sizes to develop a family of curves. These curves would determine critical impact locations for various barrier systems as a function of beam strength and equivalent post strength .
SUMMARY
Barrier VII is a two-dimensional simulation program that models vehicular impacts with deformable barriers. Due to the recent emergence of more sophisticated models. Barrier VII's usefulness in the design of longitudinal barriers is often overlooked. It is a relatively sophisticated program that has been more extensively validated than any other flexible barrier simulation model. In addition. Barrier VII is easier to use and less costly to run than some of the more sophisticated programs.
The Barrier VII program has numerous applications in the design of flexible barriers. It is capable of accurately pre-
Bligh and Sicking 123
Longitudinal Beam and Post Barrier
4500 LB Passenger Car ,---.._ 20
_,___, (f)
0 Q_
E 0 L
'+--
18
16
14
12
W-Beam .... (12'-6" past spacing)
_,___, (f)
0 10 ........ , .. , ......... ! ..... ..
W-Beam (6'-3" post spacing)
_,___,
c ·0 Q_ _,___,
u 0 o__
E
0 u
u
8
6
4
2
0 0
I i ... I _ .. l_ ... _
i I I I
I 20 40 60
Tubular W-beam (3'-1.5" post spacing)
80 100 120 Rigid
Lateral Barrier Stiffness (kip/in)
FIGURE 7 Determination of critical impact point.
dieting design loads and guardrail deflections under severe impact conditions. The design loads can subsequently be used to determine required rail and anchor capacities as well as to aid in the design of connections. Predicted guardrail deflections can be used to determine necessary barrier strength and to help identify potential problems. such as vehicle pocketing. The Barrier VII simulation can also be used to predict the occurrence of wheel snagging and to determine critical impact locations for evaluating snagging potential. When viewed collectively, these capabilities can be invaluable in the design of a safe and cost-effective barrier system.
However, it should be kept in mind that. although simulation programs continue to improve and have proven to be valuable in the design of barriers. they cannot yet be substituted for a full-scale crash test program. Computer simulation should be used as a design aid and not as the sole source of acceptance or rejection of a design. Once a final design has been developed through the use of a simulation program, a series of compliance tests should be conducted to ensure good impact performance in accordance with nationally accepted guidelines (16).
REFERENCES
1. G. H. Powell. A CompUler Program for Evaluation of Automobile Barrier Systems. Report DOT-RD-73-51. FHWA. U.S. Department of Transportation. 1973.
2. N. W. Iwankiw et al. Modelling the Interaction of Heavy Vehicles with Protective Barriers Development and Validation of the "CRUNCH" Program. IIT Research Institute. 1980.
3. R. W. Bruce. E. E. Hahn and N. R . Iwankiw. Guardrail Vehicle Dynamic Interaction. Report DOT-RD-77-29. FHWA. U.S. Department of Transportation. 1976.
4. L. R. Calcote. Development of a Cost-Effectiveness Model for Guardrail Selection. Report 03-4309. Southwest Research Institute; FHWA. U.S. Department of Transportation. 1977.
5. M. E. Bronstad. L. R. Calcote. M. H. Ray and J. B. Mayer. Guardrail-Bridge Rail Transition Designs. Report DOT-RD-86-178. FHWA. U .S. Department of Transportation. 1986.
6. J. K. Jeyapalan. J. F. Dewey. Jr .. T. J. Hirsch. H. E. Ross, Jr., and H. Cooner. Soil-Foundation Interaction Behavior of Highway Guardrail Posts. In Transportation Research Record 970, TRB, National Research Council. Washington, D.C., 1984.
7. R. P. Bligh et al. Development of Guardrail to Bridge Rail Transition. Research Report 461-IF. Texas Transportation Institute, Texas A&M University, College Station. 1988.
8. D. L. Sicking, R. P. Bligh and H. E. Ross . Optimization of Strong Post W-Beam Guardrail. Research Report 1147-IF. Texas Transportation Institute. Texas A&M University, College Station, 1988.
9. A. Arnold et al. Weak-Post Guardrails. In Volume 1: Summarv Report. FHWA, U.S. Department of Transportation, 1984. ·
10. M. E. Bronstad, C. E. Kimball. Jr .. and C. F. McDeutt. SERB: A New High-Performance Self-Restoring Traffic Barrier. In Transportation Research Record 796. TRB. National Research Council, Washington, D.C., 1981.
11. C. E. Kimball et al. Development of a Collapsing Ring Bridge Rail System. Report DOT-RD-76-39. FHWA, U.S. Department of Transportation, January 1976.
12. W. L. Beason, T. J. Hirsch, and J.C. Cain. A Low-Maintenance, Energy-Absorbing Bridge Rail. In Transportation Research Record 1065, TRB, National Research Council, Washington, D.C .. 1986.
13. E. R. Post, R. J. Ruby, D. F. Ronnau. and M. D. Cress. FullScale Vehicle Crash Tests on Guardrail-Bridgerail Transition Designs with Special Post Spacing. In Transportation Research Record 1198, TRB. National Research Council. Washington, D.C., 1988.
14. T. 1. Hirsch and Dale Beggs. Use of Guardrails on Low Fill Bridge Length Culverts. Research Report 405-2F. Texas Transportation Institute, Texas A&M University. College Station, 1987.
15. M. E. Bronstad et al. Bridge Rail Designs and Performance Standards. Volume 1: Research Report. Report DOT-RD-87-049. Southwest Research Institute; FHWA. U.S. Department of Transportation, 1987.
16. 1. D. Michie. NCHRP REPORT 230: Recommended Procedures for the Safety Performance Evaluation of Highway Appurtenances. TRB. National Research Council. Washington, D.C., 1981.
17. T. 1. Hirsch and P. Romere. Crash Test of Modified Texas C202 Bridge Rail. Research Report 1179-1. Texas Transportation Institute, Texas A&M University. College Station. 1988.
Publication of this paper sponsored by Committee on Roadside Safety Features.