182
GET Applying Technical Analysis T-1 Applying Technical Analysis Updated Feb 99
GET Applying Technical Analysis
T-1
Applying TechnicalAnalysis
Updated Feb 99
GET Applying Technical Analysis
T-2
The information presented in this manual is con-fidential and proprietary to Tom Joseph and Trad-ing Techniques, Inc.. This information cannotbe used, disclosed, or duplicated, without theprior written consent of Tom Joseph or TradingTechniques, Inc.. This work is protected by theFederal Copyright laws and no unauthorizedcopying, adaptation or distribution is permitted.
The material represented in the GET computersoftware, the GET User's Guide, Technical Sec-tion and any additions, revisions, or addenda,are believed to be accurately presented. How-ever, it is not guaranteed as to accuracy or com-pleteness, and is subject to change without no-tice, at any time. There is no guarantee that thesystems, trading techniques, trading methods, in-dicators, and/or other information presented inthis manual will result in profits, or that theywill not result in losses. It should not be as-sumed, or is any representation made, that themethods presented in the GET Software or User'sGuide, any additions, revisions, and addenda, canguarantee profits in the Futures or Stock Mar-ket or any other financial market instruments, orthat future performance will equal that of thepast.
Past performance is not a guarantee of future re-sults. Only risk capital should be invested in theFutures or Stock Market or any other financial in-strument. Neither Trading Techniques, Inc., nor TomJoseph, nor anyone else representing Trading Tech-niques, Inc., or Tom Joseph, take or assume anyresponsibility or make any guarantees or make anyspecific trading recommendations in any of the abovementioned products, any of their additions, revisions,and addenda. All investments and trades carry risk,and all trading decisions of an individual remain theresponsibility of that individual.
The client acknowledges and agrees that neither TomJoseph nor Trading Techniques, Inc., (or their re-spective heirs or successors) makes any representa-tion or guarantee regarding the information and tech-niques described in the above mentioned productsmarketed by Tom Joseph or Trading Techniques,Inc., or regarding how it may perform in the future;regarding client's ability to utilize the informationand techniques described in the above mentionedproducts; or regarding client's likelihood of successin attempting to utilize same. In the event that anyliability is alleged or awarded in any forum notwith-standing the above, such liability shall be limited tothe price paid by the client for the aggregate of allproducts purchased by client from Trading Tech-niques, Inc., or Tom Joseph.
The hypothetical computer simulated performance results provided are believed to be accurately presented.However, it is not guaranteed as to accuracy or completeness and is subject to change without any notice.Hypothetical or simulated performance results have certain inherent limitations. Unlike an actual performancerecord, simulated results do not represent actual trading. Since, also, the trades have not actually been executed,the results may have been under or over compensated for the impact, if any, of certain market factors such asliquidity. Simulated trading programs in general are also subject to the fact that they are designed with the benefitof hindsight. No representation is being made that any account will, or is likely to achieve profits or losses similarto those shown. All investments and trades carry risks.
TRADING TECHNIQUES, INC.
DISCLOSURE AND DISCLAIMER
The Expert Trend Locator (XTL) is NOT a mechanical Trading System. The XTL isone of the many Studies (methods) available in Advanced GET.

GET Applying Technical Analysis
T-3
Technical Table Of Contents
Elliott Wave Technique ................................................................................................ T-5Impulse Patterns ....................................................................................................................... T-6
Indicator To Provide Elliott Wave Counts ............................................................................. T-9
Elliott Oscillator: Step-By-Step Illustration ....................................................... T-11Minimum Pull Back Required............................................................................................... T-15Maximum Oscillator Pull Back ............................................................................................. T-16Using The Elliott Oscillator in Wave Three ......................................................................... T-17Using The Elliott Oscillator in Wave Four ........................................................................... T-18Using The Elliott Oscillator in Wave Five ............................................................................ T-19
Oscillator Breakout Bands..................................................................................................... T-20
Adding PTI (Profit Taking Index).........................................................................T-21Adding Wave Four Channels ............................................................................... T-23Profit Taking Index & Wave 4 Channels............................................................. T-24Adding Displaced Moving Average (DMA) ........................................................ T-25Elliott Wave Rules & Guidelines .......................................................................... T-26
Elliott Wave Corrections ....................................................................................... T-27
Alternation Rule ..................................................................................................................... T-31
Wave Measurements & Ratios ............................................................................. T-32Ratios For Wave Three ..........................................................................................................T-34Ratios For Wave Four ............................................................................................................ T-34Ratios For Wave Five ............................................................................................................. T-35Elliott Channels For Top Of A Wave Five............................................................................ T-36Statistical Analysis of Wave Two Ratios ............................................................................... T-37Statistical Analysis of Wave Three Ratios ............................................................................ T-38Statistical Analysis of Wave Four Ratios.............................................................................. T-40Elliott / Fibonacci Ratios ........................................................................................................ T-42
Elliott / Fibonacci Ratios For Wave 5 ................................................................................... T-43
Rules: Type 1 Trade .................................................................................................... T-44Rules: Type 2 Trade .................................................................................................... T-45
Examples Of Type One & Type two Trades ......................................................................... T-46Type One Buy Setup ............................................................................................................... T-47Type Two Buy .......................................................................................................................... T-48Type Two Sell Setup................................................................................................................ T-49Forecasting A Double Top...................................................................................................... T-50Fifth Wave Failure Setup .......................................................................................................T-51
Power of 60 Minute Charts ........................................................................................ T-65Cross-Referencing to Weekly Data ........................................................................... T-80
GET Applying Technical Analysis
T-4
Alternatives In Elliott Wave Analysis ....................................................................... T-84Locallized Elliott Wave Counts: ............................................................................................ T-84Alternate Counts ..................................................................................................................... T-84Alternate 3 (Long Term) .......................................................................................................T-85Alternate 2 (Short Term)....................................................................................................... T-86Alternate 1 (Aggressive) ........................................................................................................ T-87
Gann Techniques ........................................................................................................ T-90Gann Angles And Lines ......................................................................................................... T-91Using Gann Angles With Elliott Waves ................................................................................ T-95Optimized Gann Angles ......................................................................................................... T-97
Gann Box Analysis ................................................................................................................. T-98
Regression Trend Channels .................................................................................... T-105T.J.’s Web Levels ...................................................................................................... T-107Fibonacci Time Clusters........................................................................................... T-112
Fibonacci Extension Price Clusters .................................................................................... T-115
Fibonacci Retracement Price Clusters .............................................................................. T-117
Andrews Median Lines............................................................................................. T-120Extended Parallel Lines ....................................................................................................... T-123Extended Parallel Lines ....................................................................................................... T-124
Combining Median Lines With Wave 3 ............................................................................. T-127
Automatic Regression Trend Channels .................................................................. T-129
Expert Trend Locator - XTL ................................................................................... T-132Designated Use For XTL............................................................................................................ T-135Settings For XTL: ...................................................................................................................... T-135Taking Profits: ............................................................................................................................ T-139Trade Continuation: ................................................................................................................... T-140Guidelines for Trade Continuation ........................................................................................... T-141
Using Different Settings for XTL .............................................................................................. T-142
MOB (Make or Break) ............................................................................................. T-147
Bias Reversal ............................................................................................................. T-156Elliott Wave Trigger ................................................................................................. T-158T.J’s Ellipse................................................................................................................ T-160
Ellipse Projection (Shadow): ............................................................................................... T-163The Joseph Trend Iindex (JTI) ................................................................................ T-167
How Can JTI Be Used .......................................................................................................... T-172Cycles .........................................................................................................................T-173Trade Pofile .............................................................................................................. T-176
Applying Technical Analysis Index ...........................................................................T179
GET Applying Technical Analysis
T-5
Elliott Wave Technique
The Practical Approach— In Conjunction With GET
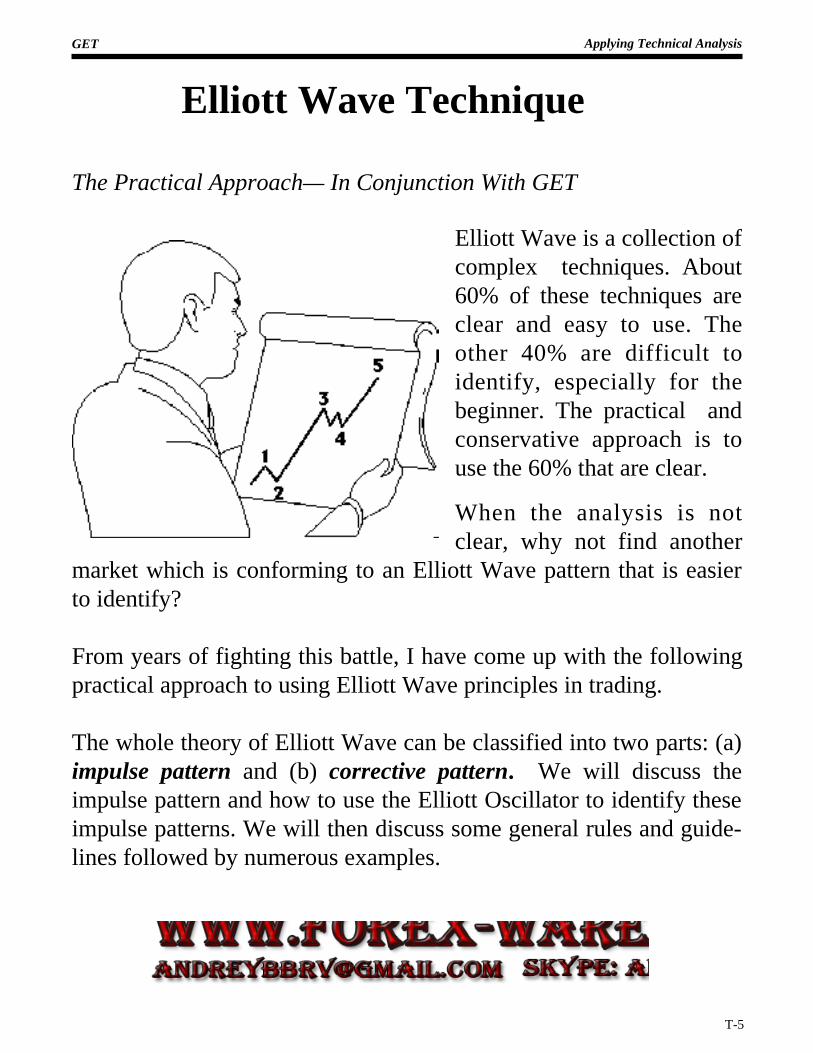
Elliott Wave is a collection ofcomplex techniques. About60% of these techniques areclear and easy to use. Theother 40% are difficult toidentify, especially for thebeginner. The practical andconservative approach is touse the 60% that are clear.
When the analysis is notclear, why not find another
market which is conforming to an Elliott Wave pattern that is easierto identify?
From years of fighting this battle, I have come up with the followingpractical approach to using Elliott Wave principles in trading.
The whole theory of Elliott Wave can be classified into two parts: (a)impulse pattern and (b) corrective pattern. We will discuss theimpulse pattern and how to use the Elliott Oscillator to identify theseimpulse patterns. We will then discuss some general rules and guide-lines followed by numerous examples.
GET Applying Technical Analysis
T-6
Impulse Patterns
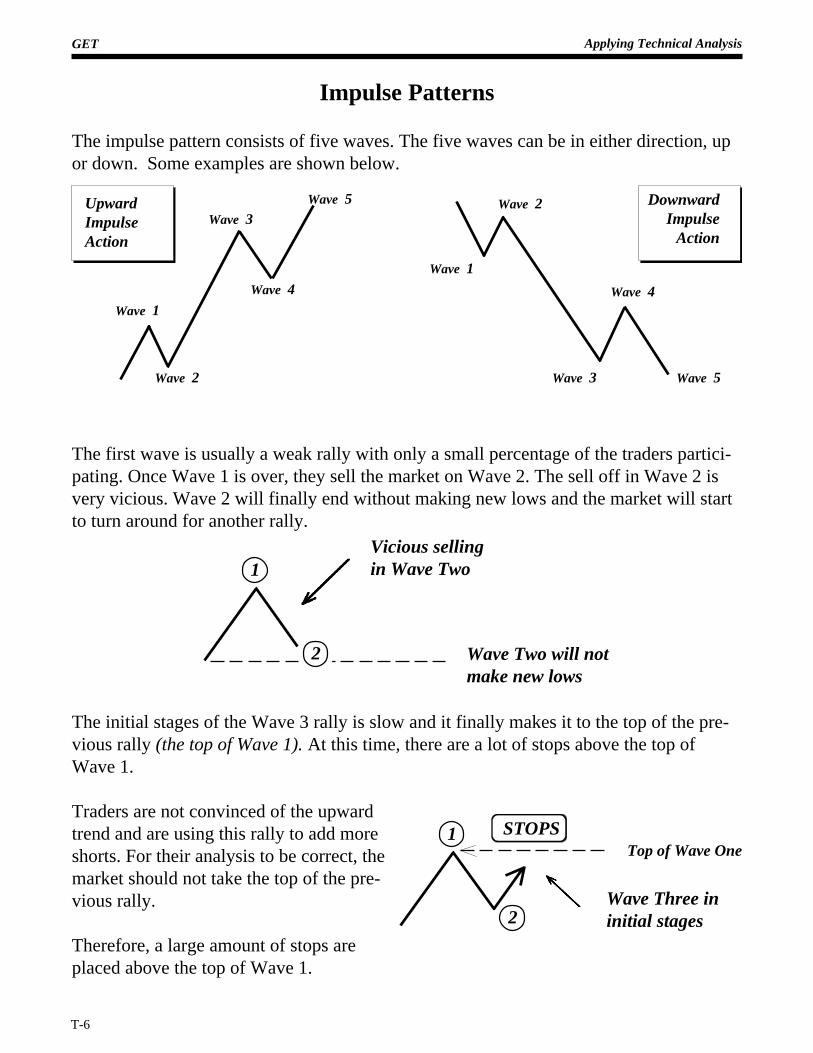
The impulse pattern consists of five waves. The five waves can be in either direction, upor down. Some examples are shown below.
The first wave is usually a weak rally with only a small percentage of the traders partici-pating. Once Wave 1 is over, they sell the market on Wave 2. The sell off in Wave 2 isvery vicious. Wave 2 will finally end without making new lows and the market will startto turn around for another rally.
The initial stages of the Wave 3 rally is slow and it finally makes it to the top of the pre-vious rally (the top of Wave 1). At this time, there are a lot of stops above the top ofWave 1.
Traders are not convinced of the upwardtrend and are using this rally to add moreshorts. For their analysis to be correct, themarket should not take the top of the pre-vious rally.
Therefore, a large amount of stops areplaced above the top of Wave 1.
Wave 1
Wave 2
Wave 3
Wave 4
Wave 5
Wave 1
Wave 3
Wave 4
Wave 5
1
2 Wave Two will notmake new lows
1
2
STOPSTop of Wave One
Wave Three ininitial stages
Vicious sellingin Wave Two
UpwardImpulseAction
DownwardImpulse
Action
Wave 2
GET Applying Technical Analysis
T-7
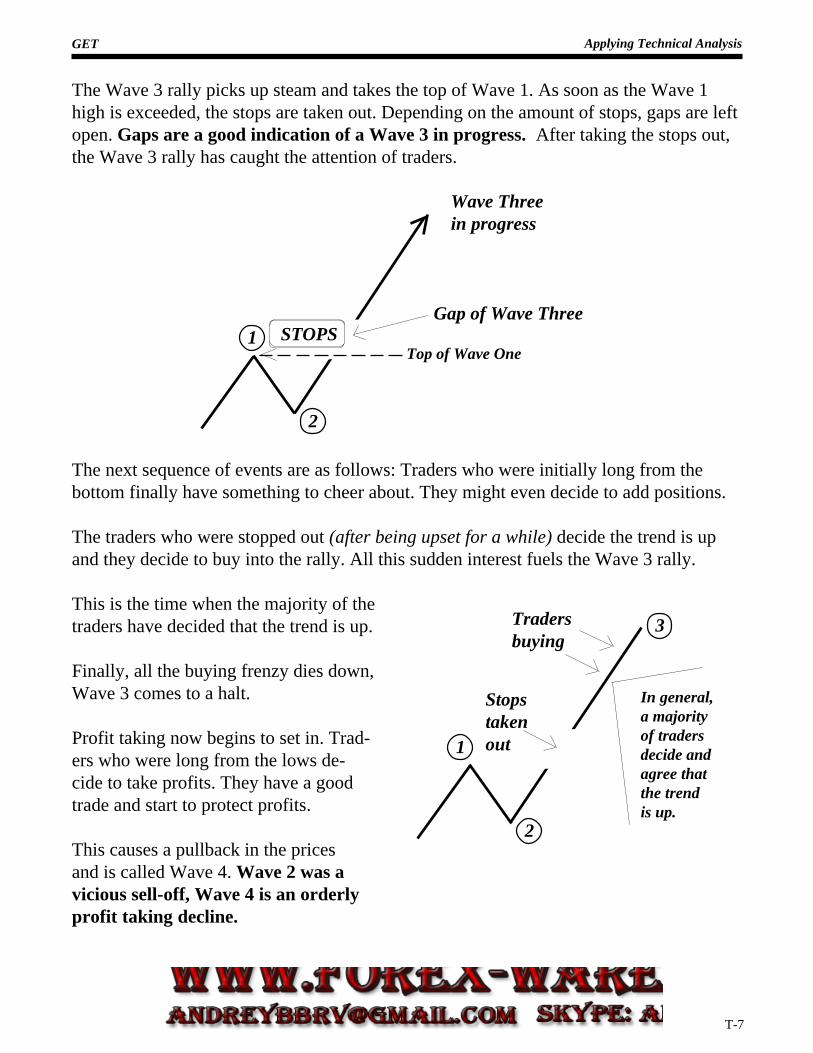
The Wave 3 rally picks up steam and takes the top of Wave 1. As soon as the Wave 1high is exceeded, the stops are taken out. Depending on the amount of stops, gaps are leftopen. Gaps are a good indication of a Wave 3 in progress. After taking the stops out,the Wave 3 rally has caught the attention of traders.
The next sequence of events are as follows: Traders who were initially long from thebottom finally have something to cheer about. They might even decide to add positions.
The traders who were stopped out (after being upset for a while) decide the trend is upand they decide to buy into the rally. All this sudden interest fuels the Wave 3 rally.
This is the time when the majority of thetraders have decided that the trend is up.
Finally, all the buying frenzy dies down,Wave 3 comes to a halt.
Profit taking now begins to set in. Trad-ers who were long from the lows de-cide to take profits. They have a goodtrade and start to protect profits.
This causes a pullback in the pricesand is called Wave 4. Wave 2 was avicious sell-off, Wave 4 is an orderlyprofit taking decline.
1
2
Top of Wave One
Gap of Wave Three
Wave Threein progress
STOPS
2
In general,a majorityof tradersdecide andagree thatthe trendis up.
1
Stopstakenout
3Tradersbuying
GET Applying Technical Analysis
T-8
2
1
3
4
5
Price makesnew highs.However,strength inrally is weakerin comparisonto the thirdwave rally.
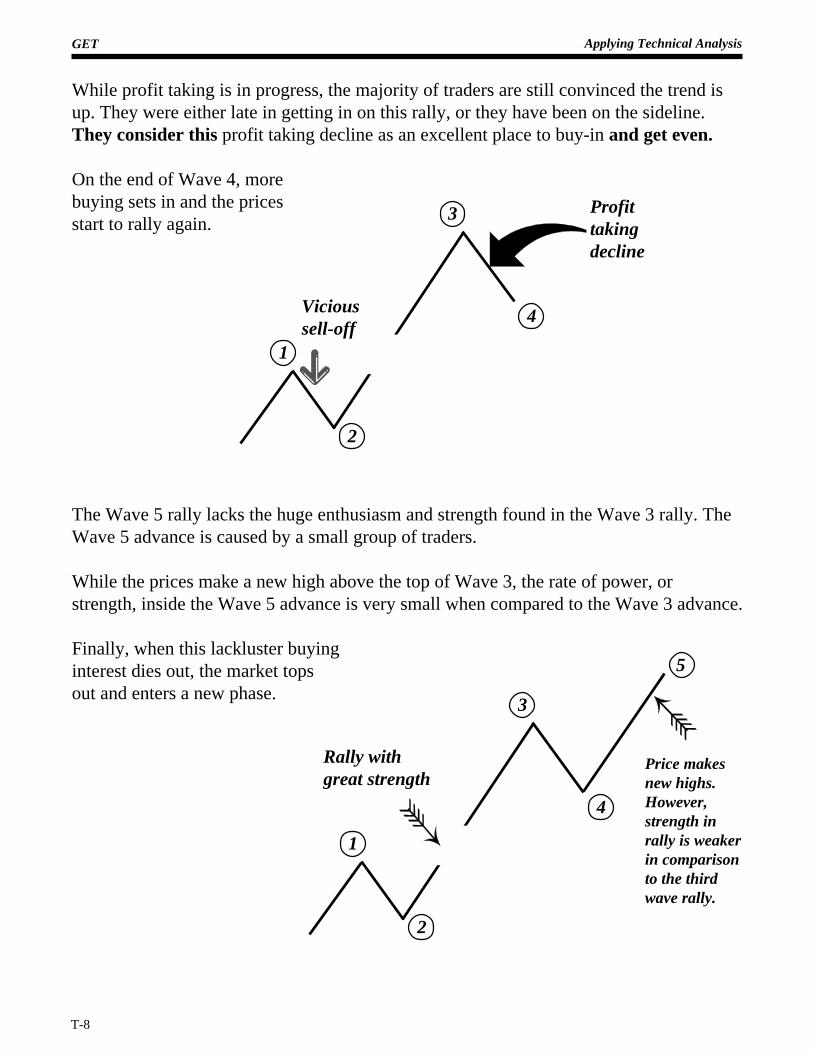
While profit taking is in progress, the majority of traders are still convinced the trend isup. They were either late in getting in on this rally, or they have been on the sideline.They consider this profit taking decline as an excellent place to buy-in and get even.
On the end of Wave 4, morebuying sets in and the pricesstart to rally again.
The Wave 5 rally lacks the huge enthusiasm and strength found in the Wave 3 rally. TheWave 5 advance is caused by a small group of traders.
While the prices make a new high above the top of Wave 3, the rate of power, orstrength, inside the Wave 5 advance is very small when compared to the Wave 3 advance.
Finally, when this lackluster buyinginterest dies out, the market topsout and enters a new phase.
2
1
Vicioussell-off
4
3 Profittakingdecline
Rally withgreat strength
GET Applying Technical Analysis
T-9
Indicator To Provide Elliott Wave Counts
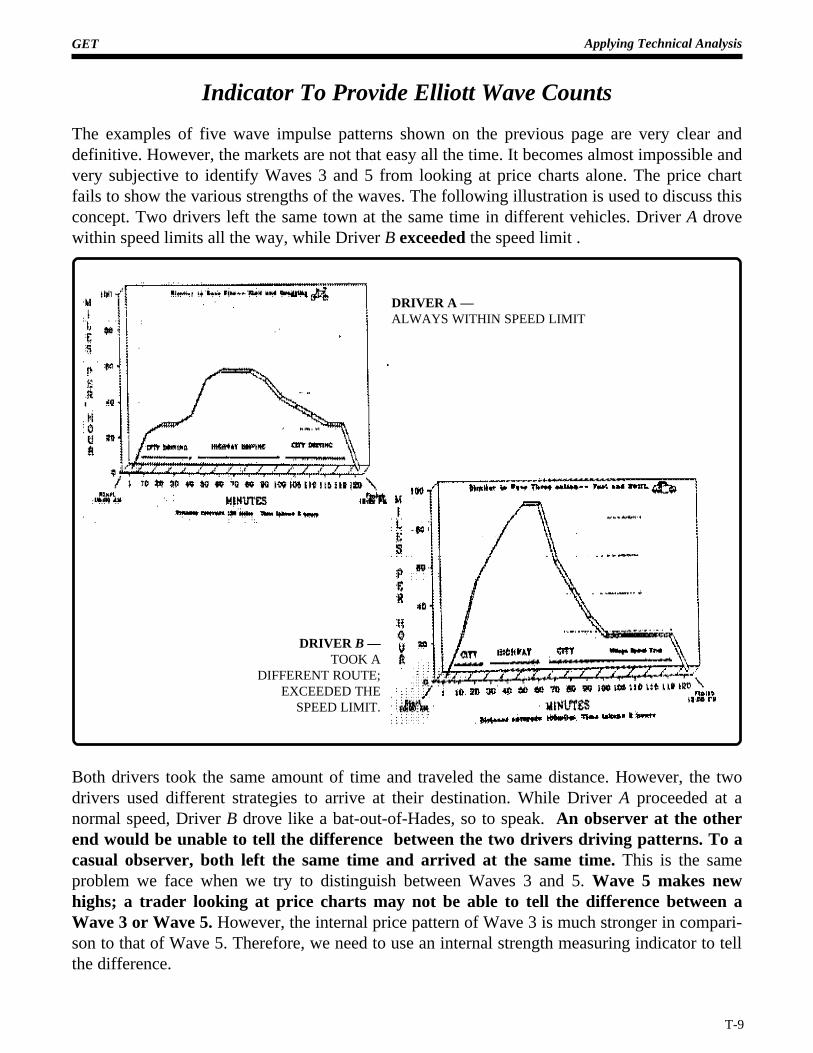
The examples of five wave impulse patterns shown on the previous page are very clear anddefinitive. However, the markets are not that easy all the time. It becomes almost impossible andvery subjective to identify Waves 3 and 5 from looking at price charts alone. The price chartfails to show the various strengths of the waves. The following illustration is used to discuss thisconcept. Two drivers left the same town at the same time in different vehicles. Driver A drovewithin speed limits all the way, while Driver B exceeded the speed limit .
Both drivers took the same amount of time and traveled the same distance. However, the twodrivers used different strategies to arrive at their destination. While Driver A proceeded at anormal speed, Driver B drove like a bat-out-of-Hades, so to speak. An observer at the otherend would be unable to tell the difference between the two drivers driving patterns. To acasual observer, both left the same time and arrived at the same time. This is the sameproblem we face when we try to distinguish between Waves 3 and 5. Wave 5 makes newhighs; a trader looking at price charts may not be able to tell the difference between aWave 3 or Wave 5. However, the internal price pattern of Wave 3 is much stronger in compari-son to that of Wave 5. Therefore, we need to use an internal strength measuring indicator to tellthe difference.
DRIVER A —ALWAYS WITHIN SPEED LIMIT
DRIVER B —TOOK A
DIFFERENT ROUTE;EXCEEDED THE
SPEED LIMIT.
GET Applying Technical Analysis
T-10
Indicator To Provide Elliott Wave Counts
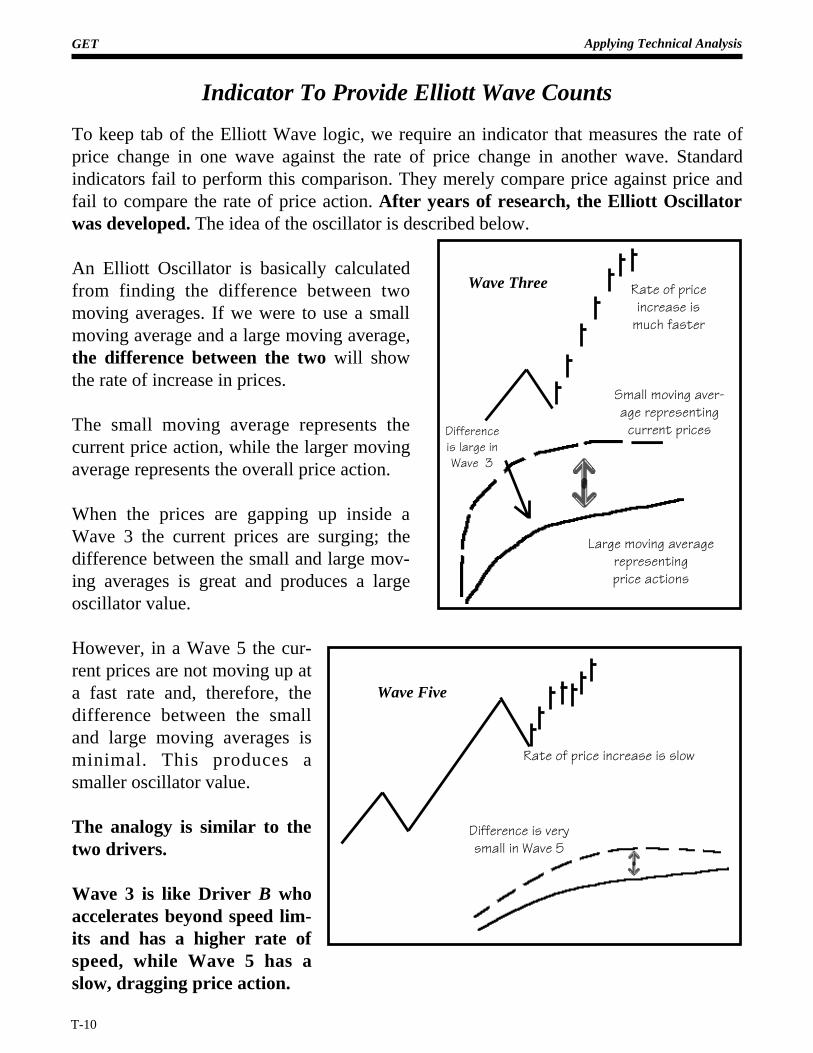
To keep tab of the Elliott Wave logic, we require an indicator that measures the rate ofprice change in one wave against the rate of price change in another wave. Standardindicators fail to perform this comparison. They merely compare price against price andfail to compare the rate of price action. After years of research, the Elliott Oscillatorwas developed. The idea of the oscillator is described below.
An Elliott Oscillator is basically calculatedfrom finding the difference between twomoving averages. If we were to use a smallmoving average and a large moving average,the difference between the two will showthe rate of increase in prices.
The small moving average represents thecurrent price action, while the larger movingaverage represents the overall price action.
When the prices are gapping up inside aWave 3 the current prices are surging; thedifference between the small and large mov-ing averages is great and produces a largeoscillator value.
However, in a Wave 5 the cur-rent prices are not moving up ata fast rate and, therefore, thedifference between the smalland large moving averages isminimal. This produces asmaller oscillator value.
The analogy is similar to thetwo drivers.
Wave 3 is like Driver B whoaccelerates beyond speed lim-its and has a higher rate ofspeed, while Wave 5 has aslow, dragging price action.
Large moving averagerepresentingprice actions
Wave Three
Wave Five
Differenceis large inWave 3
Rate of priceincrease is
much faster
Small moving aver-age representing
current prices
Difference is verysmall in Wave 5
Rate of price increase is slow
GET Applying Technical Analysis
T-11
Current pricesmoving with slowerrate shows wavefive
Larger MA represents overall price
Current prices moving up rapidlyshows wave three
Small MArepresentscurrentprice
Small and Large Moving Average
1
2
3
4
5
Prices makingnew highs, butno lasting strength
Sample Price Bar Chart
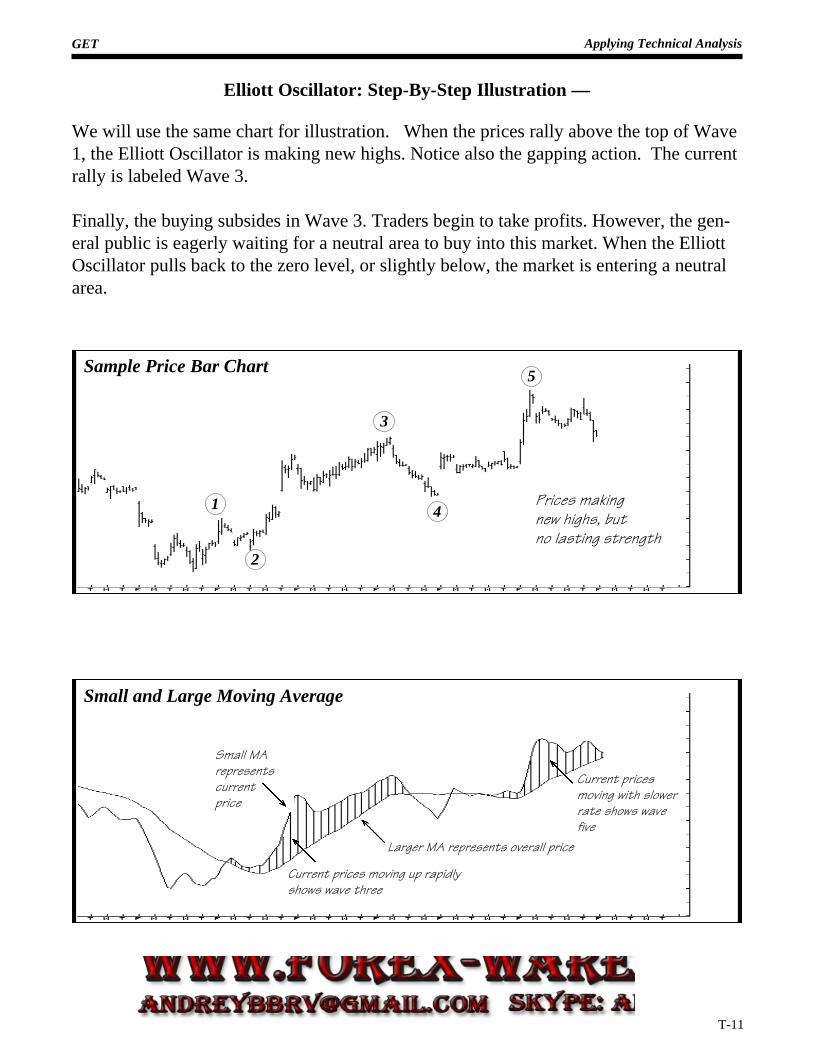
Elliott Oscillator: Step-By-Step Illustration —
We will use the same chart for illustration. When the prices rally above the top of Wave1, the Elliott Oscillator is making new highs. Notice also the gapping action. The currentrally is labeled Wave 3.
Finally, the buying subsides in Wave 3. Traders begin to take profits. However, the gen-eral public is eagerly waiting for a neutral area to buy into this market. When the ElliottOscillator pulls back to the zero level, or slightly below, the market is entering a neutralarea.
GET Applying Technical Analysis
T-12
Small MArepresentscurrentprice
Prices making newhighs without strength
Current pricesmoving with slowerrate shows WaveFive
Larger MA represents overall price
Current prices moving up rapidlyshows Wave Three
1
2
3
4
5
Prices makingnew highs, butno lasting strength
Sample Price Bar Chart
Small and Large Moving Average
The Elliott Wave Oscillator
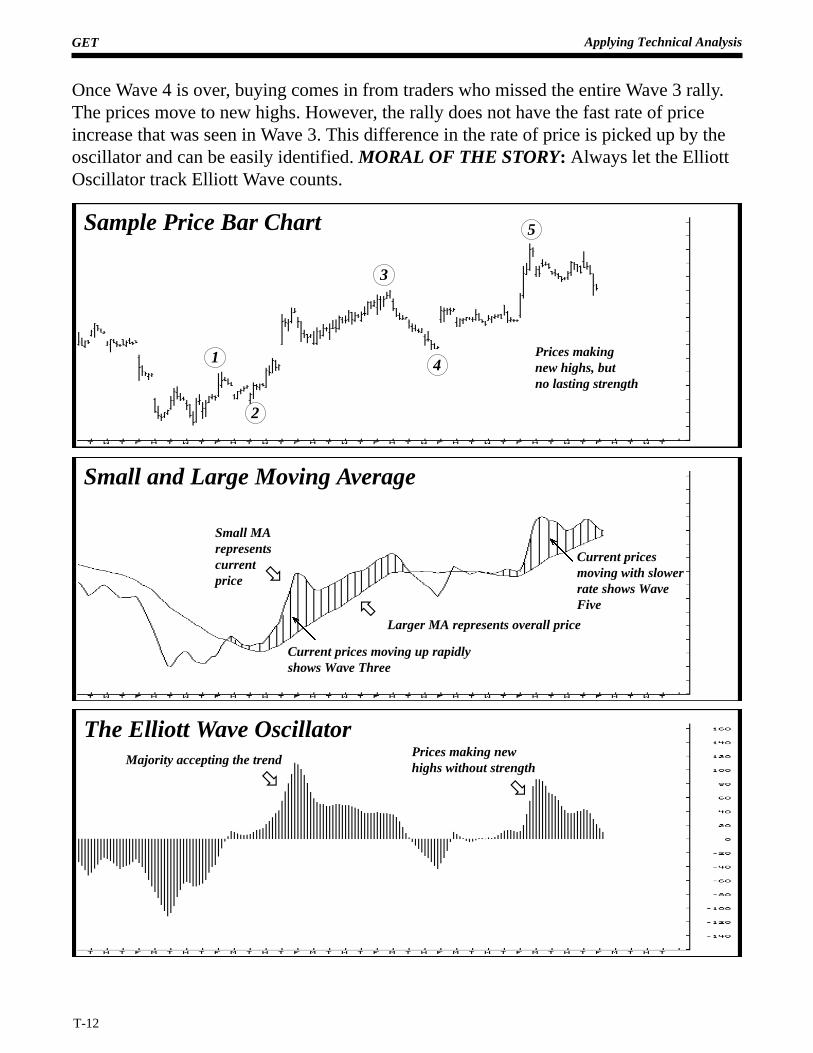
Once Wave 4 is over, buying comes in from traders who missed the entire Wave 3 rally.The prices move to new highs. However, the rally does not have the fast rate of priceincrease that was seen in Wave 3. This difference in the rate of price is picked up by theoscillator and can be easily identified. MORAL OF THE STORY: Always let the ElliottOscillator track Elliott Wave counts.
øMajority accepting the trend
ø
ø
õ
GET Applying Technical Analysis
T-13
Rallywith strength
labeledas WaveThree
4
NewPhase
2
3
1
5
3
5
Newhighswithless
strength
Strengthin rally
Five Wave Impulse(UP)
Identifying a five wave impulse(up) using the Elliott Oscillator,which is part of the software.
Divergence
õ
õLabeled asWave Four
becauseoscillator
pulled backto zero
õ
÷
ElliottOscillatorpulls back
to zero
ö
GET Applying Technical Analysis
T-14
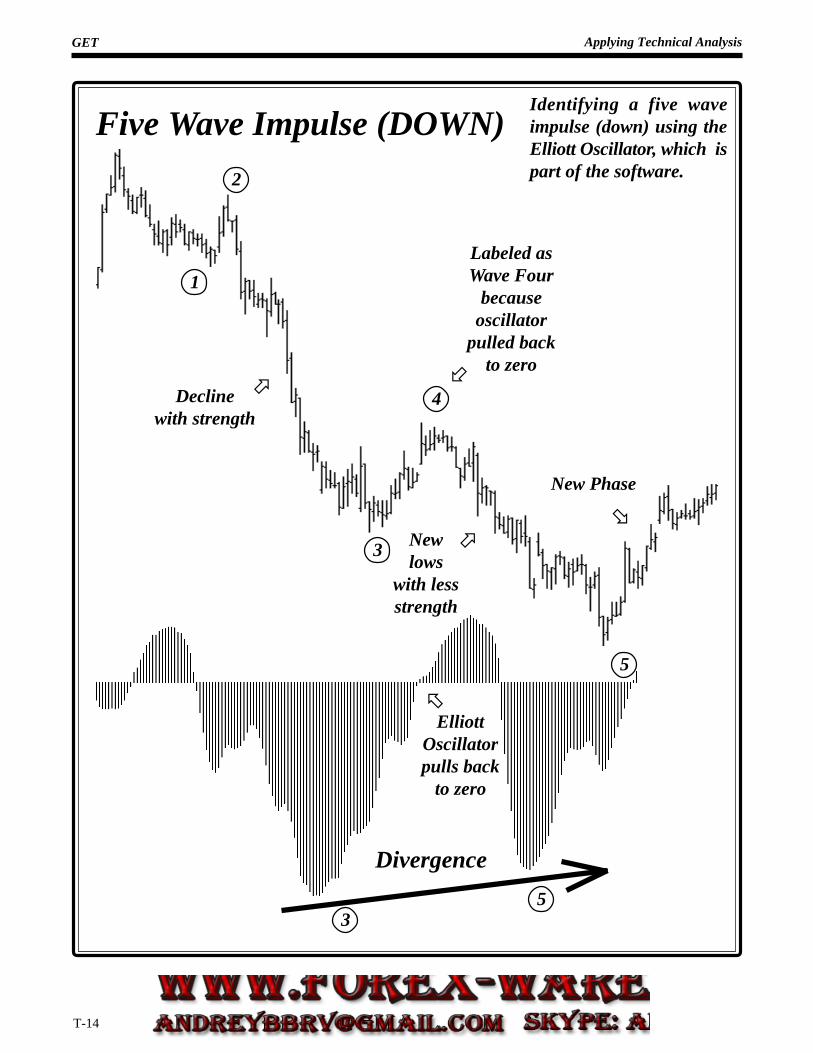
Newlows
with lessstrength
New Phase
4
3
Divergence
53
5
Declinewith strength
Five Wave Impulse (DOWN)
2
1
Identifying a five waveimpulse (down) using theElliott Oscillator, which ispart of the software.
ö
ö
õElliott
Oscillatorpulls back
to zero
ø
÷
Labeled asWave Four
becauseoscillator
pulled backto zero
GET Applying Technical Analysis
T-15
Minimum90% Pullback
Required
0
3
4
5
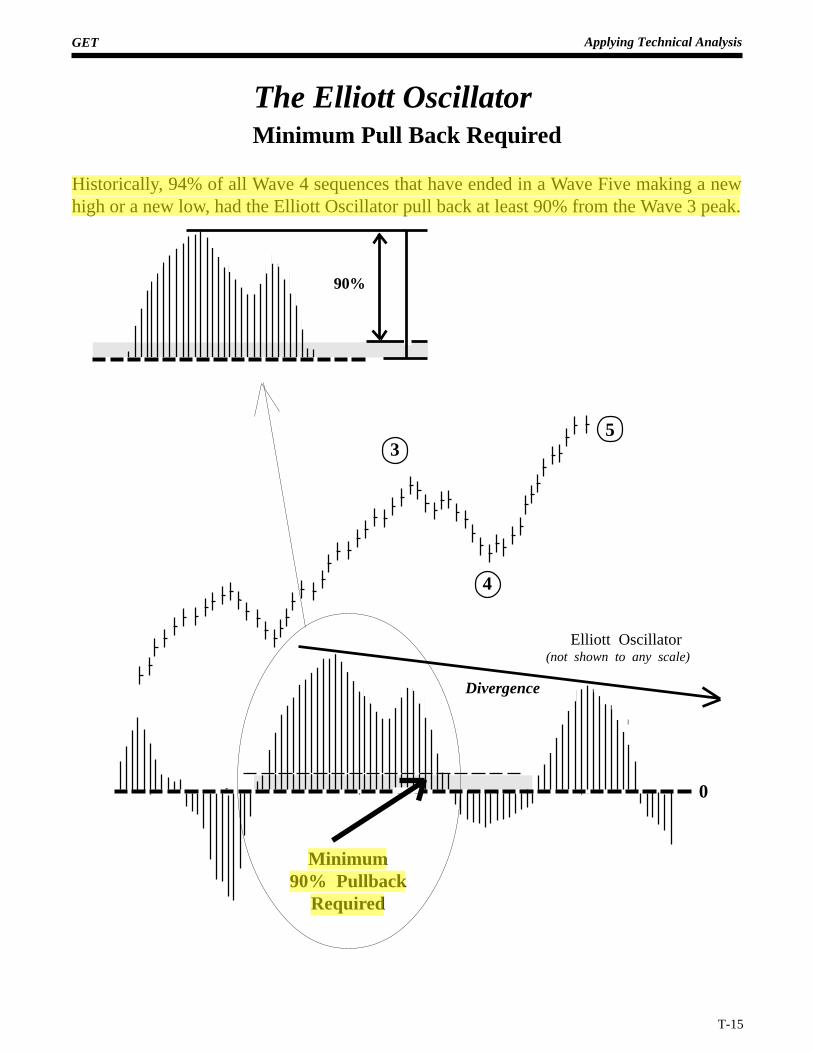
Elliott Oscillator(not shown to any scale)
90%
Divergence
Minimum Pull Back Required
Historically, 94% of all Wave 4 sequences that have ended in a Wave Five making a newhigh or a new low, had the Elliott Oscillator pull back at least 90% from the Wave 3 peak.
The Elliott Oscillator
GET Applying Technical Analysis
T-16
0
3
4
5
Elliott Oscillator(not shown to any scale)
90%
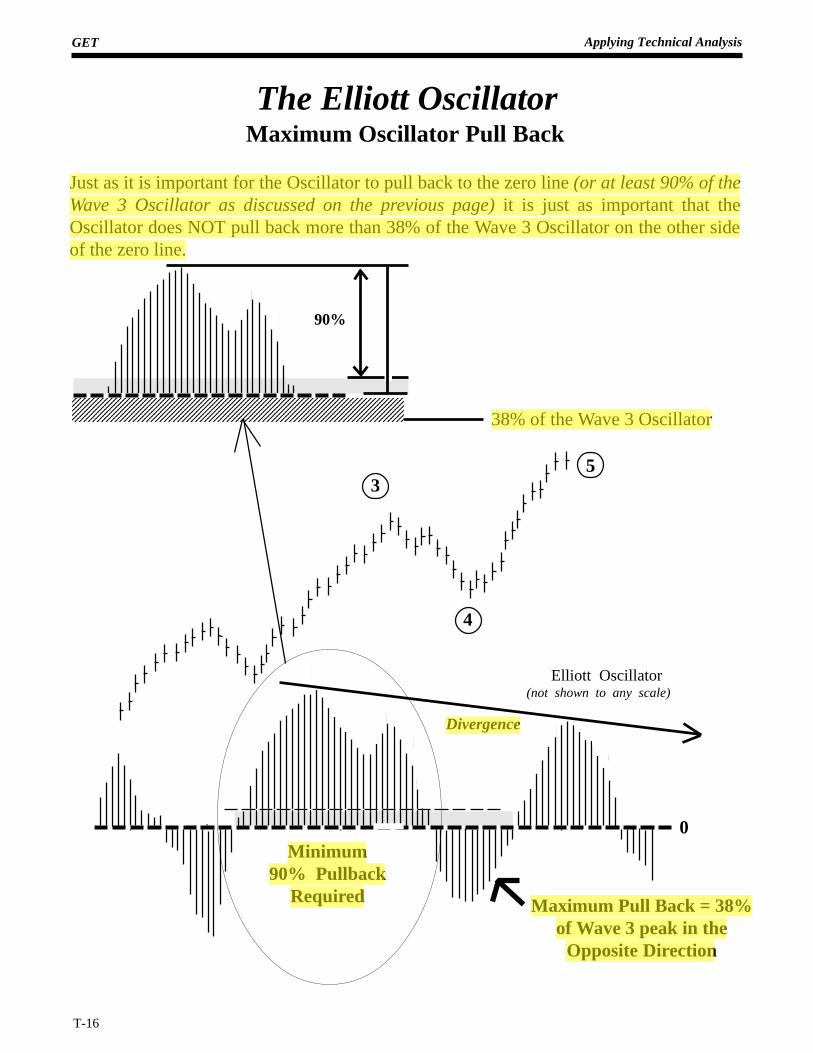
Divergence
Minimum90% Pullback
Required Maximum Pull Back = 38%of Wave 3 peak in the
Opposite Direction
The Elliott OscillatorMaximum Oscillator Pull Back
Just as it is important for the Oscillator to pull back to the zero line (or at least 90% of theWave 3 Oscillator as discussed on the previous page) it is just as important that theOscillator does NOT pull back more than 38% of the Wave 3 Oscillator on the other sideof the zero line.
38% of the Wave 3 Oscillator
123456789012345678901234567890121234567890123456789012345678901212345678901123456789012345678901234567890121234567890123456789012345678901212345678901123456789012345678901234567890121234567890123456789012345678901212345678901123456789012345678901234567890121234567890123456789012345678901212345678901123456789012345678901234567890121234567890123456789012345678901212345678901123456789012345678901234567890121234567890123456789012345678901212345678901
GET Applying Technical Analysis
T-17
Using The Elliott Oscillator in Wave Three
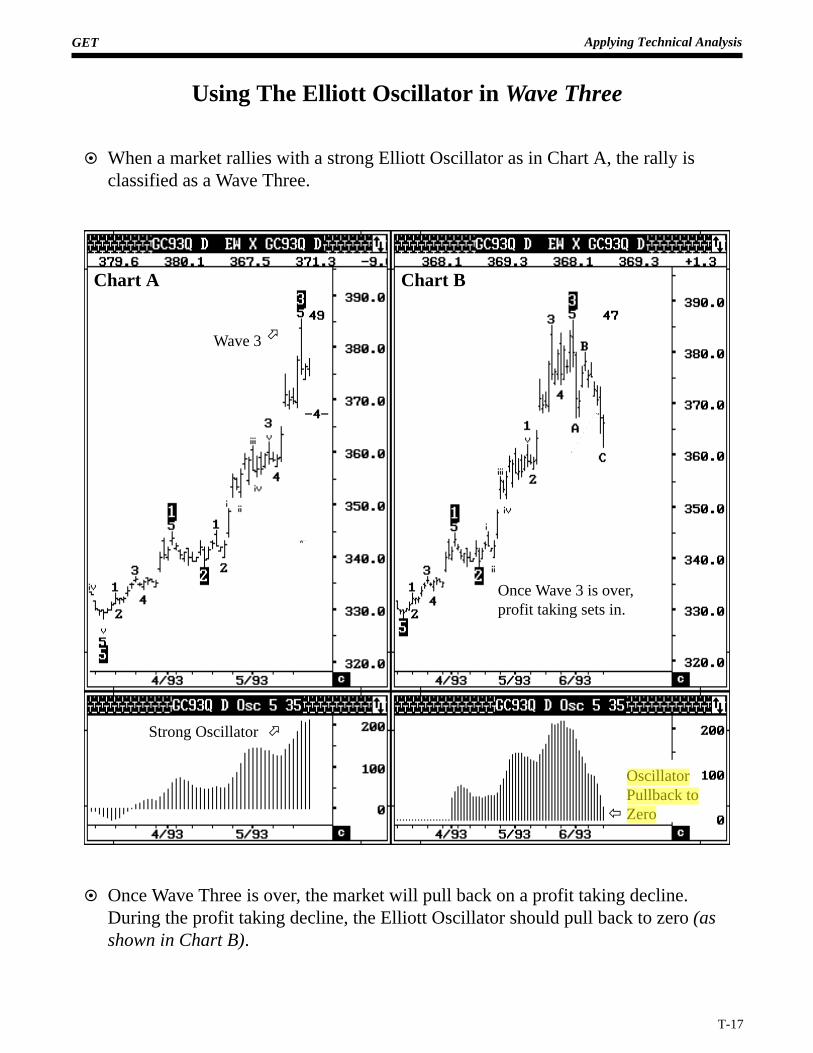
¤ When a market rallies with a strong Elliott Oscillator as in Chart A, the rally isclassified as a Wave Three.
¤ Once Wave Three is over, the market will pull back on a profit taking decline.During the profit taking decline, the Elliott Oscillator should pull back to zero (asshown in Chart B).
Chart A Chart B
OscillatorPullback toZeroï
öStrong Oscillator
öWave 3
Once Wave 3 is over,profit taking sets in.
GET Applying Technical Analysis
T-18
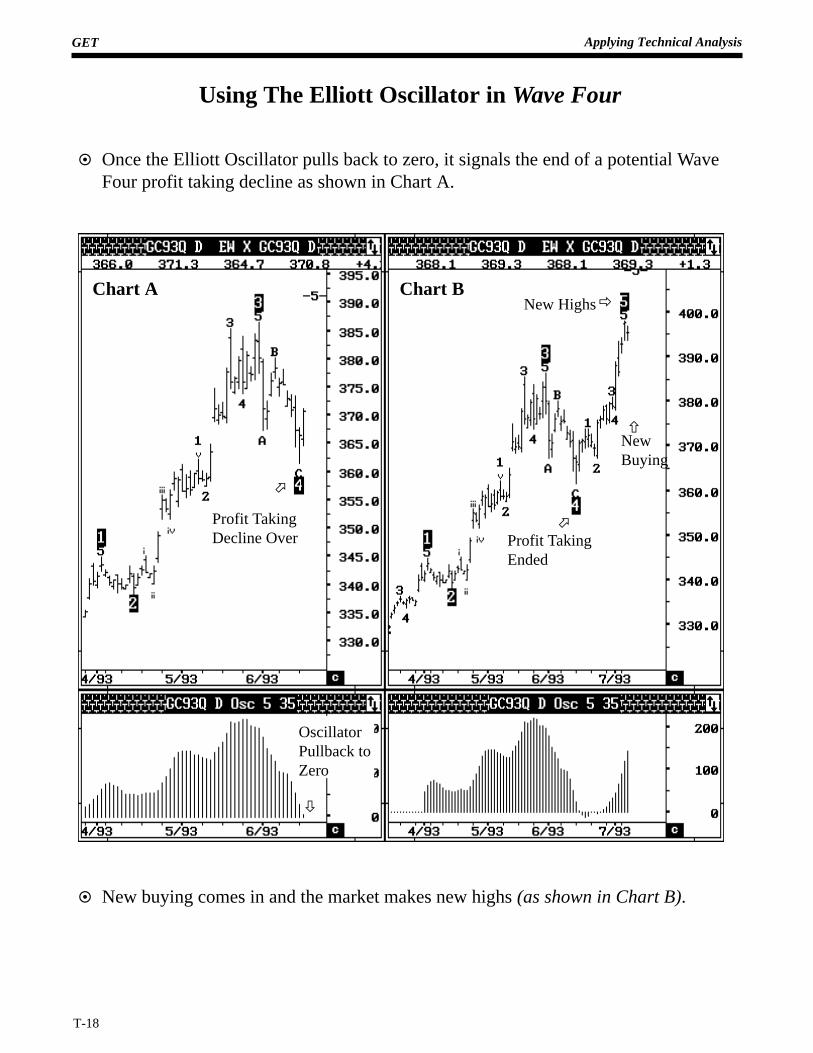
Using The Elliott Oscillator in Wave Four
¤ Once the Elliott Oscillator pulls back to zero, it signals the end of a potential WaveFour profit taking decline as shown in Chart A.
¤ New buying comes in and the market makes new highs (as shown in Chart B).
OscillatorPullback toZero
ò
Chart A Chart B
Profit TakingDecline Over
ö
New Highsð
ñNewBuying
öProfit TakingEnded
GET Applying Technical Analysis
T-19
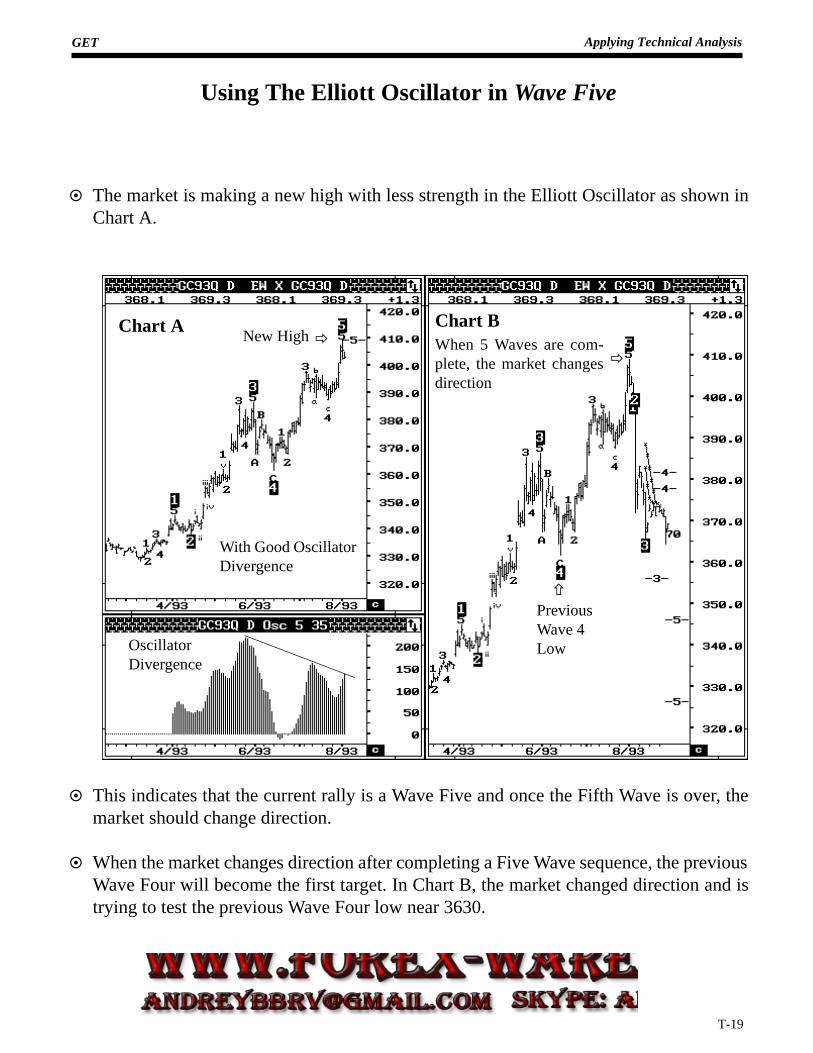
Using The Elliott Oscillator in Wave Five
¤ The market is making a new high with less strength in the Elliott Oscillator as shown inChart A.
¤ This indicates that the current rally is a Wave Five and once the Fifth Wave is over, themarket should change direction.
¤ When the market changes direction after completing a Five Wave sequence, the previousWave Four will become the first target. In Chart B, the market changed direction and istrying to test the previous Wave Four low near 3630.
Chart A Chart BðNew High
PreviousWave 4Low
ñ
With Good OscillatorDivergence
OscillatorDivergence
ðWhen 5 Waves are com-plete, the market changesdirection
GET Applying Technical Analysis
T-20
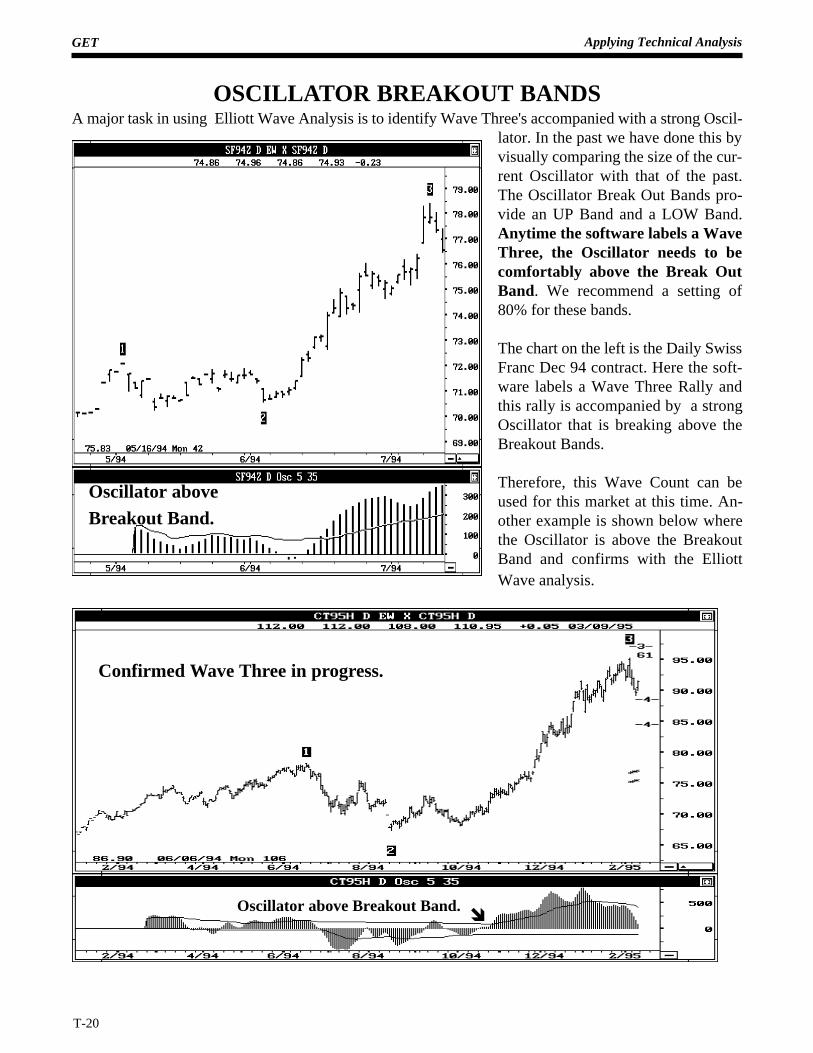
Oscillator aboveBreakout Band.
îOscillator above Breakout Band.
Confirmed Wave Three in progress.
OSCILLATOR BREAKOUT BANDSA major task in using Elliott Wave Analysis is to identify Wave Three's accompanied with a strong Oscil-
lator. In the past we have done this byvisually comparing the size of the cur-rent Oscillator with that of the past.The Oscillator Break Out Bands pro-vide an UP Band and a LOW Band.Anytime the software labels a WaveThree, the Oscillator needs to becomfortably above the Break OutBand. We recommend a setting of80% for these bands.
The chart on the left is the Daily SwissFranc Dec 94 contract. Here the soft-ware labels a Wave Three Rally andthis rally is accompanied by a strongOscillator that is breaking above theBreakout Bands.
Therefore, this Wave Count can beused for this market at this time. An-other example is shown below wherethe Oscillator is above the BreakoutBand and confirms with the ElliottWave analysis.
GET Applying Technical Analysis
T-21
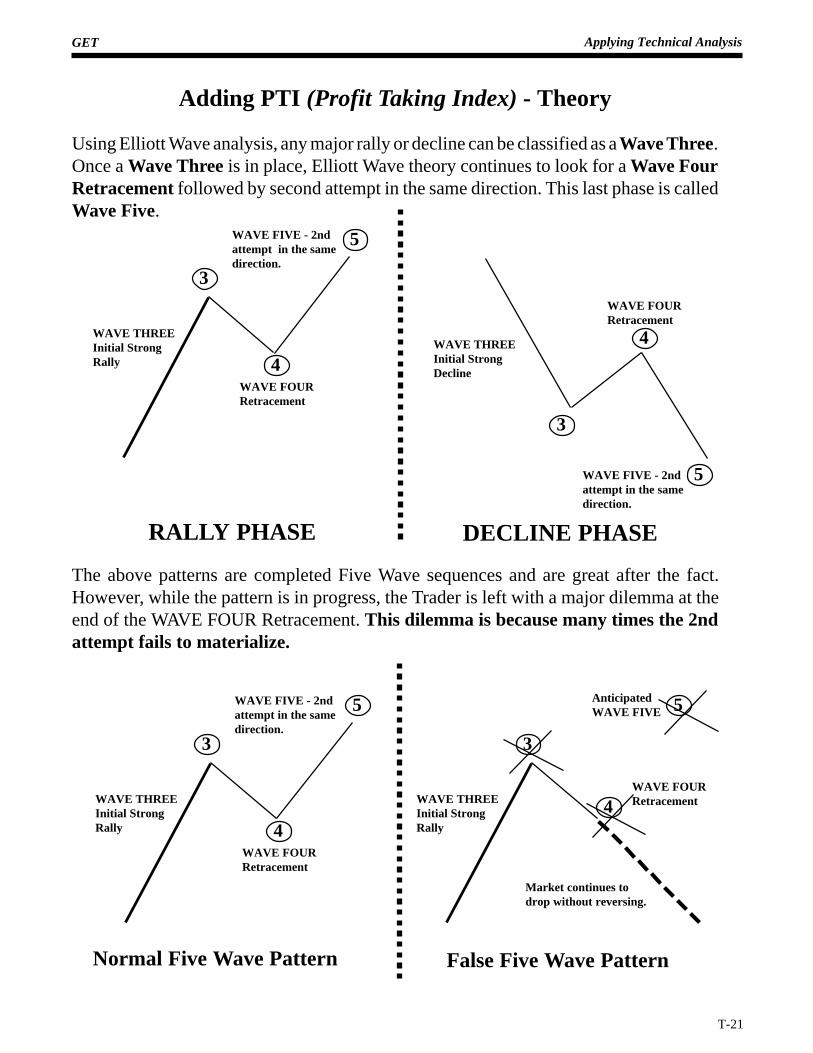
Adding PTI (Profit Taking Index) - Theory
Using Elliott Wave analysis, any major rally or decline can be classified as a Wave Three.Once a Wave Three is in place, Elliott Wave theory continues to look for a Wave FourRetracement followed by second attempt in the same direction. This last phase is calledWave Five.
WAVE THREEInitial StrongDecline4
5
3
4
5
WAVE FIVE - 2ndattempt in the samedirection.
WAVE FOURRetracement
WAVE THREEInitial StrongRally
3
WAVE FOURRetracement
WAVE FIVE - 2ndattempt in the samedirection.
DECLINE PHASERALLY PHASE
The above patterns are completed Five Wave sequences and are great after the fact.However, while the pattern is in progress, the Trader is left with a major dilemma at theend of the WAVE FOUR Retracement. This dilemma is because many times the 2ndattempt fails to materialize.
4
5
3
WAVE FIVE - 2ndattempt in the samedirection.
WAVE FOURRetracement
WAVE THREEInitial StrongRally
5
3
WAVE THREEInitial StrongRally
4WAVE FOURRetracement
Market continues todrop without reversing.
Normal Five Wave Pattern False Five Wave Pattern
AnticipatedWAVE FIVE
GET Applying Technical Analysis
T-22
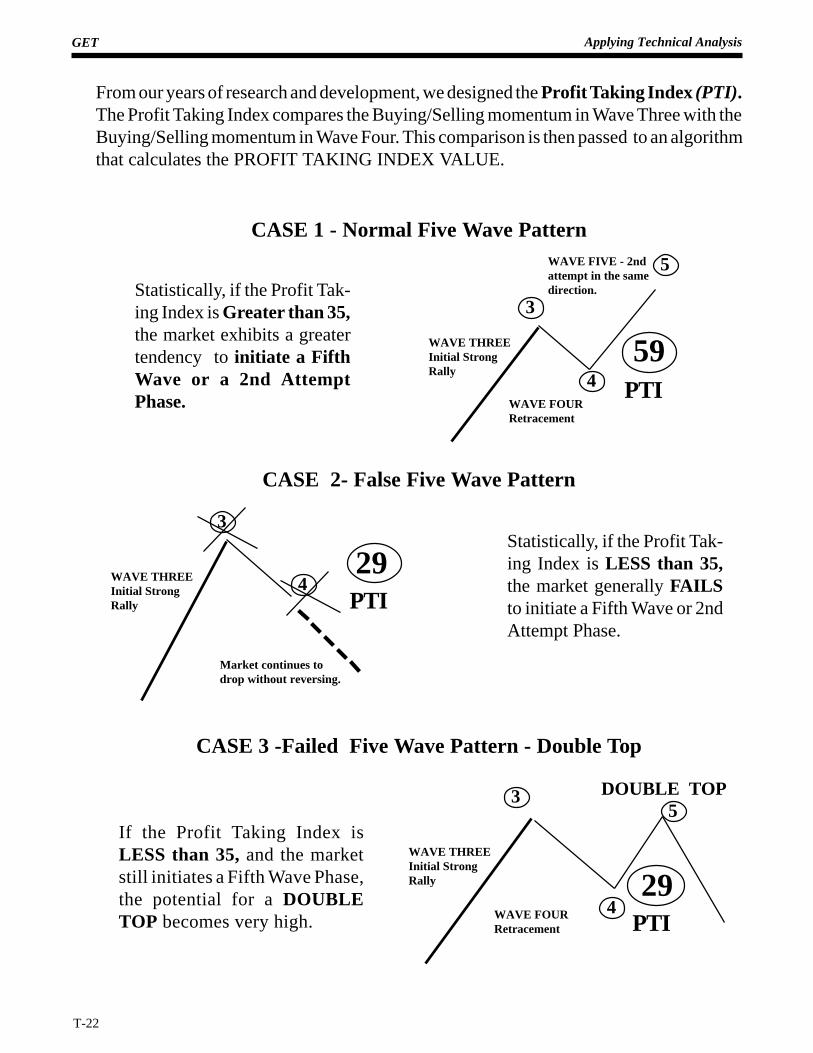
From our years of research and development, we designed the Profit Taking Index (PTI).The Profit Taking Index compares the Buying/Selling momentum in Wave Three with theBuying/Selling momentum in Wave Four. This comparison is then passed to an algorithmthat calculates the PROFIT TAKING INDEX VALUE.
WAVE FOURRetracement
If the Profit Taking Index isLESS than 35, and the marketstill initiates a Fifth Wave Phase,the potential for a DOUBLETOP becomes very high.
WAVE THREEInitial StrongRally
3
PTI
294
5DOUBLE TOP
Statistically, if the Profit Tak-ing Index is LESS than 35,the market generally FAILSto initiate a Fifth Wave or 2ndAttempt Phase.
3
WAVE THREEInitial StrongRally
4
Market continues todrop without reversing.
PTI
29
5WAVE FIVE - 2ndattempt in the samedirection.
4
WAVE THREEInitial StrongRally
3
59
WAVE FOURRetracement
PTI
Statistically, if the Profit Tak-ing Index is Greater than 35,the market exhibits a greatertendency to initiate a FifthWave or a 2nd AttemptPhase.
CASE 1 - Normal Five Wave Pattern
CASE 2- False Five Wave Pattern
CASE 3 -Failed Five Wave Pattern - Double Top
GET Applying Technical Analysis
T-23
3
59PTI
WAVE FIVE - 2ndattempt in the samedirection.
5
WAVE THREEInitial StrongRally
4ch 1
ch 2ch 3
WAVE FOURChannels WAVE FOUR
Retracement holding aboveWave Four Channels
PTI Greaterthan 35
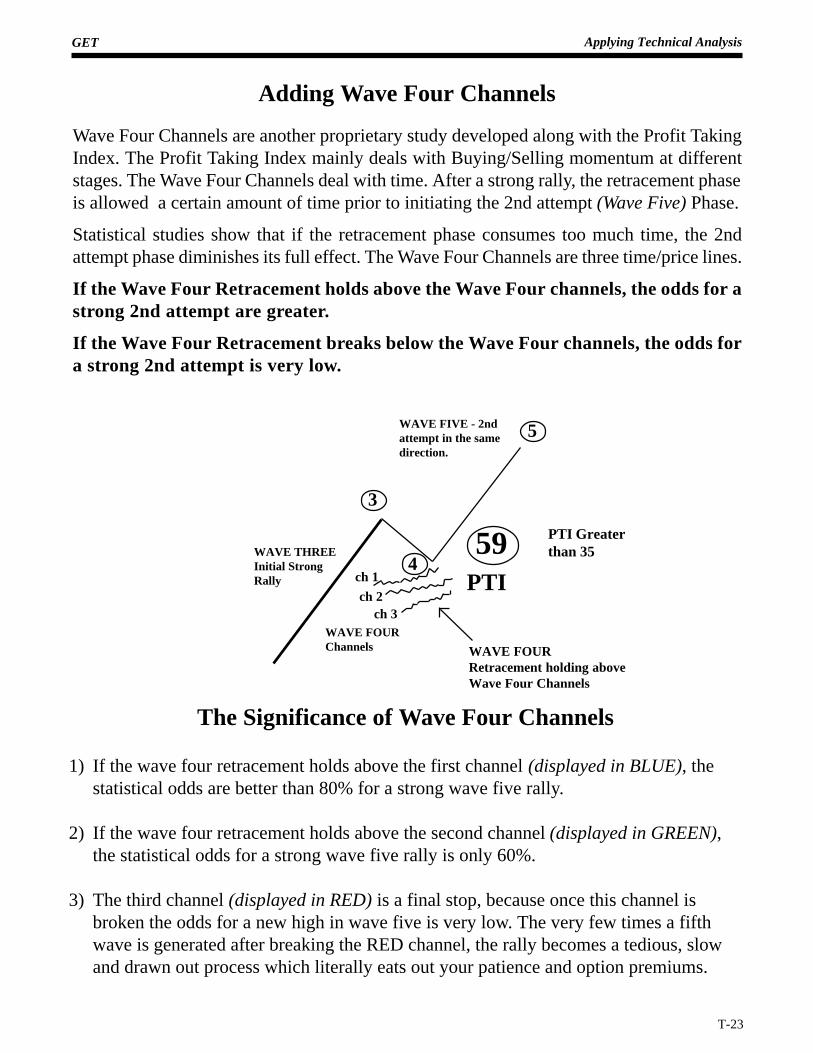
The Significance of Wave Four Channels
1) If the wave four retracement holds above the first channel (displayed in BLUE), thestatistical odds are better than 80% for a strong wave five rally.
2) If the wave four retracement holds above the second channel (displayed in GREEN),the statistical odds for a strong wave five rally is only 60%.
3) The third channel (displayed in RED) is a final stop, because once this channel isbroken the odds for a new high in wave five is very low. The very few times a fifthwave is generated after breaking the RED channel, the rally becomes a tedious, slowand drawn out process which literally eats out your patience and option premiums.
Adding Wave Four Channels
Wave Four Channels are another proprietary study developed along with the Profit TakingIndex. The Profit Taking Index mainly deals with Buying/Selling momentum at differentstages. The Wave Four Channels deal with time. After a strong rally, the retracement phaseis allowed a certain amount of time prior to initiating the 2nd attempt (Wave Five) Phase.
Statistical studies show that if the retracement phase consumes too much time, the 2ndattempt phase diminishes its full effect. The Wave Four Channels are three time/price lines.
If the Wave Four Retracement holds above the Wave Four channels, the odds for astrong 2nd attempt are greater.
If the Wave Four Retracement breaks below the Wave Four channels, the odds fora strong 2nd attempt is very low.
GET Applying Technical Analysis
T-24
Profit Taking Index & Wave 4 Channels
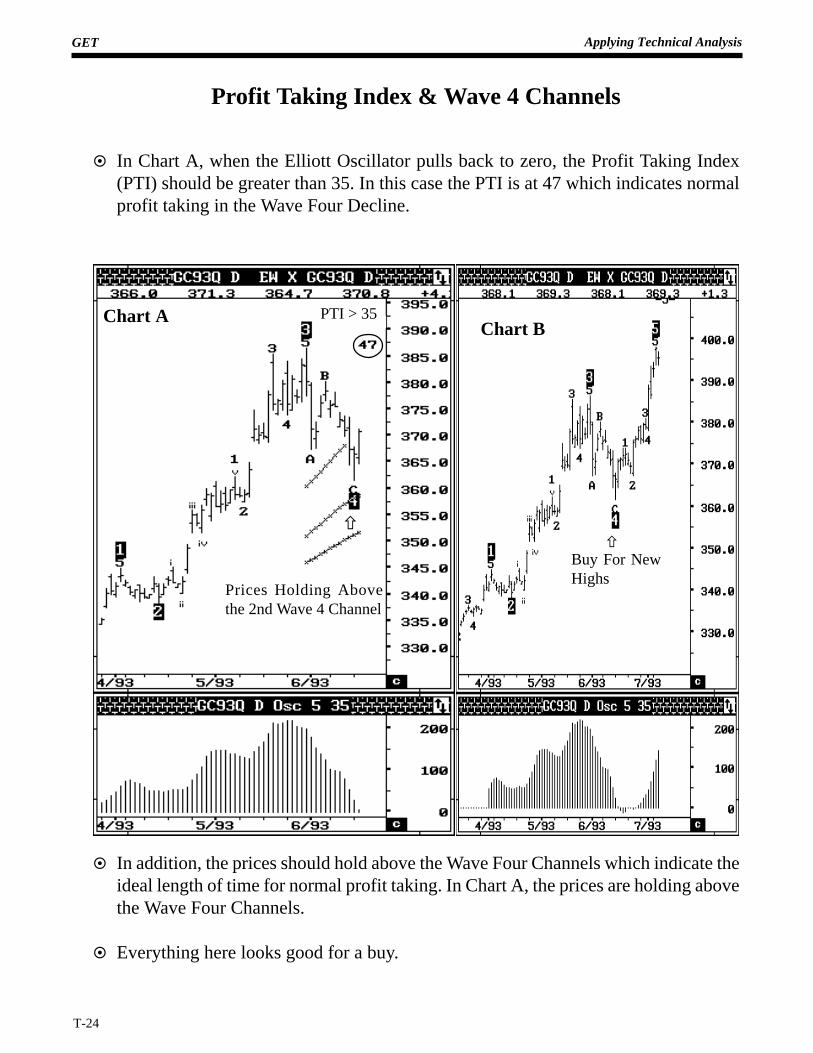
¤ In Chart A, when the Elliott Oscillator pulls back to zero, the Profit Taking Index(PTI) should be greater than 35. In this case the PTI is at 47 which indicates normalprofit taking in the Wave Four Decline.
¤ In addition, the prices should hold above the Wave Four Channels which indicate theideal length of time for normal profit taking. In Chart A, the prices are holding abovethe Wave Four Channels.
¤ Everything here looks good for a buy.
Chart BChart A
ñBuy For NewHighs
PTI > 35
Prices Holding Abovethe 2nd Wave 4 Channel
ñ
GET Applying Technical Analysis
T-25
Adding Displaced Moving Average (DMA)
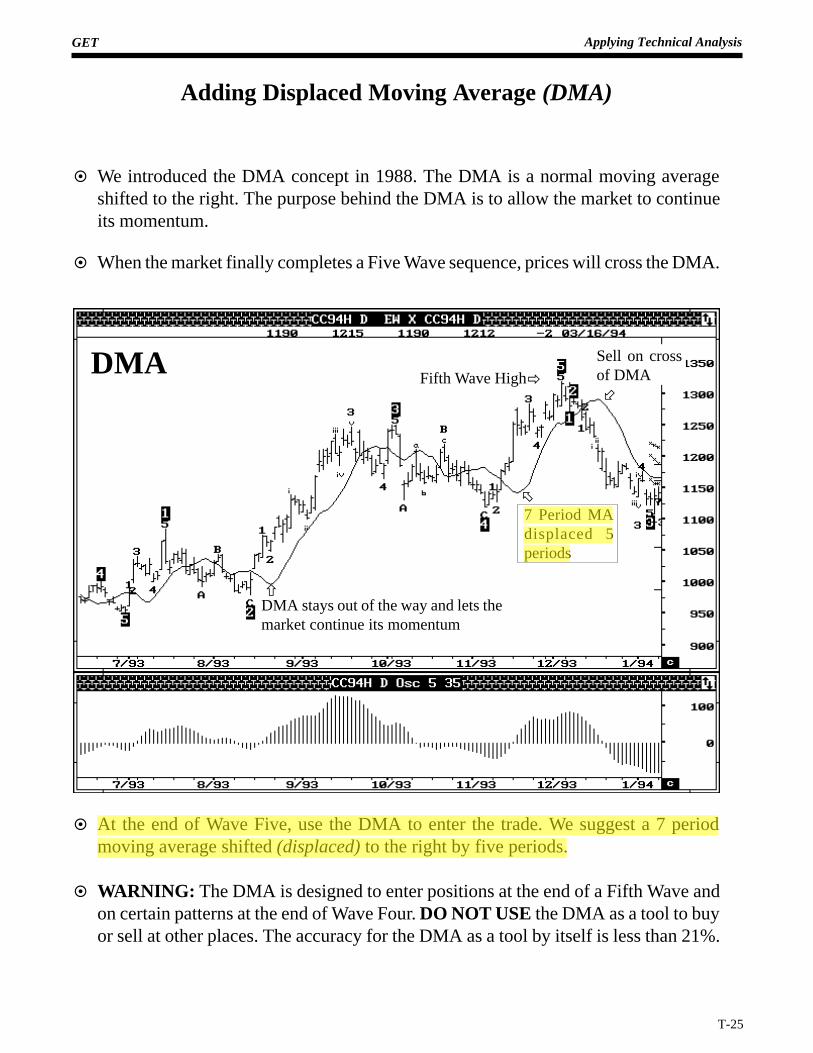
¤ We introduced the DMA concept in 1988. The DMA is a normal moving averageshifted to the right. The purpose behind the DMA is to allow the market to continueits momentum.
¤ When the market finally completes a Five Wave sequence, prices will cross the DMA.
¤ At the end of Wave Five, use the DMA to enter the trade. We suggest a 7 periodmoving average shifted (displaced) to the right by five periods.
¤ WARNING: The DMA is designed to enter positions at the end of a Fifth Wave andon certain patterns at the end of Wave Four. DO NOT USE the DMA as a tool to buyor sell at other places. The accuracy for the DMA as a tool by itself is less than 21%.
DMAðFifth Wave High
õ7 Period MAdisplaced 5periods
DMA stays out of the way and lets themarket continue its momentum
ñ
Sell on crossof DMA÷
GET Applying Technical Analysis
T-26
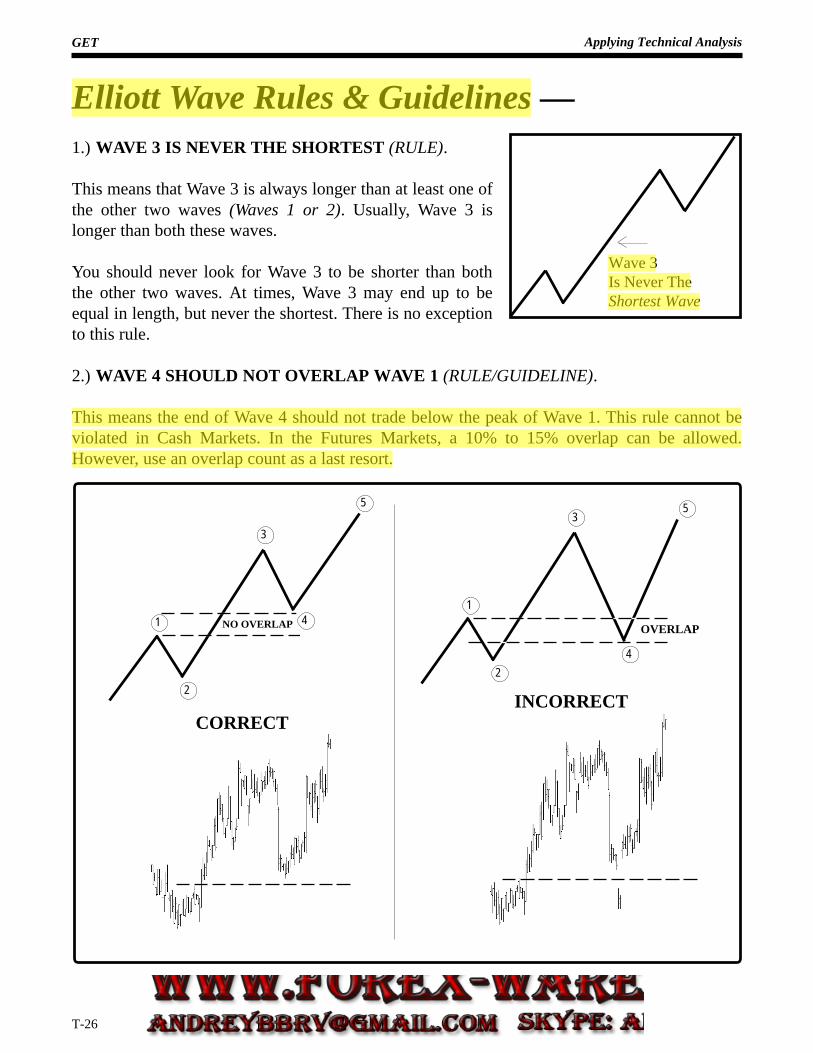
Elliott Wave Rules & Guidelines —1.) WAVE 3 IS NEVER THE SHORTEST (RULE).
This means that Wave 3 is always longer than at least one ofthe other two waves (Waves 1 or 2). Usually, Wave 3 islonger than both these waves.
You should never look for Wave 3 to be shorter than boththe other two waves. At times, Wave 3 may end up to beequal in length, but never the shortest. There is no exceptionto this rule.
2.) WAVE 4 SHOULD NOT OVERLAP WAVE 1 (RULE/GUIDELINE).
This means the end of Wave 4 should not trade below the peak of Wave 1. This rule cannot beviolated in Cash Markets. In the Futures Markets, a 10% to 15% overlap can be allowed.However, use an overlap count as a last resort.
Wave 3Is Never TheShortest Wave
5
2
3
1 4
2
3
1
4
5
OVERLAP
INCORRECTCORRECT
NO OVERLAP
GET Applying Technical Analysis
T-27
1
2
4
3
5
A
B
C
A
B
Cnot to scale
Be alert for angle divergence
Simple(Zig Zag)
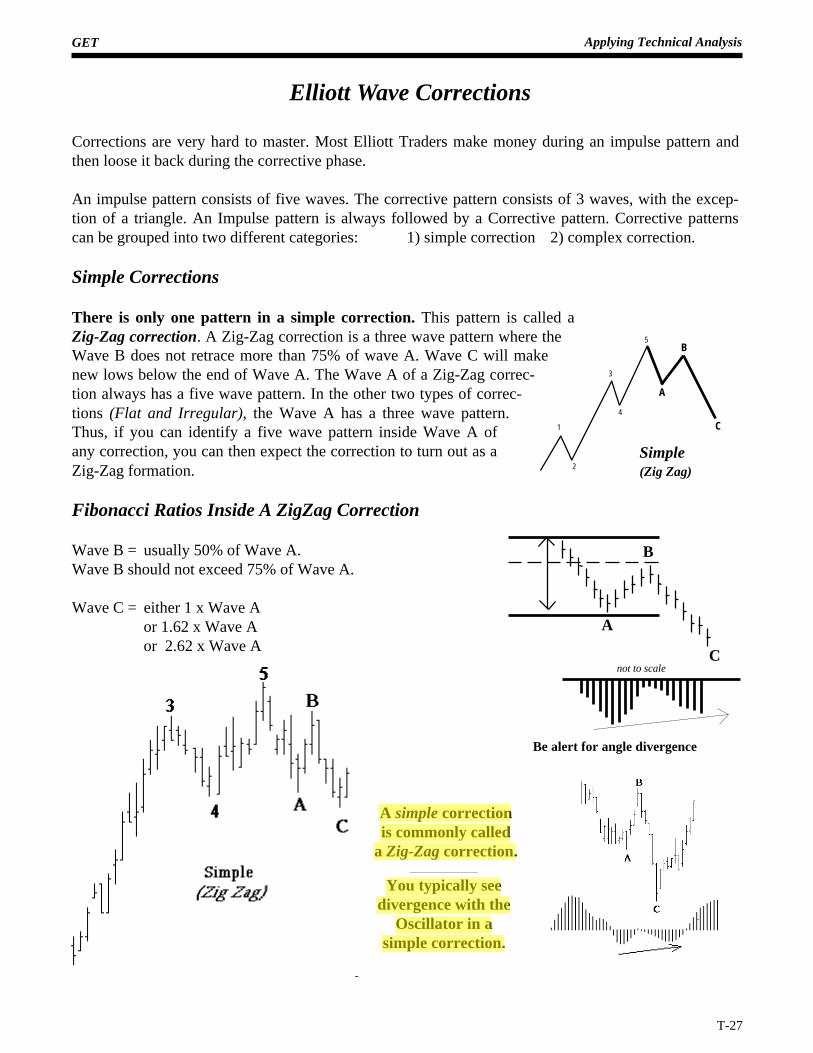
A simple correctionis commonly called
a Zig-Zag correction.
Elliott Wave Corrections
You typically seedivergence with the
Oscillator in asimple correction.
Corrections are very hard to master. Most Elliott Traders make money during an impulse pattern andthen loose it back during the corrective phase.
An impulse pattern consists of five waves. The corrective pattern consists of 3 waves, with the excep-tion of a triangle. An Impulse pattern is always followed by a Corrective pattern. Corrective patternscan be grouped into two different categories: 1) simple correction 2) complex correction.
Simple Corrections
There is only one pattern in a simple correction. This pattern is called aZig-Zag correction. A Zig-Zag correction is a three wave pattern where theWave B does not retrace more than 75% of wave A. Wave C will makenew lows below the end of Wave A. The Wave A of a Zig-Zag correc-tion always has a five wave pattern. In the other two types of correc-tions (Flat and Irregular), the Wave A has a three wave pattern.Thus, if you can identify a five wave pattern inside Wave A ofany correction, you can then expect the correction to turn out as aZig-Zag formation.
Fibonacci Ratios Inside A ZigZag Correction
Wave B = usually 50% of Wave A.Wave B should not exceed 75% of Wave A.
Wave C = either 1 x Wave Aor 1.62 x Wave Aor 2.62 x Wave A
GET Applying Technical Analysis
T-28
a c
bFLAT
A
B 5
4
3
1
2
C
1
2
4
3
5
A
B
C
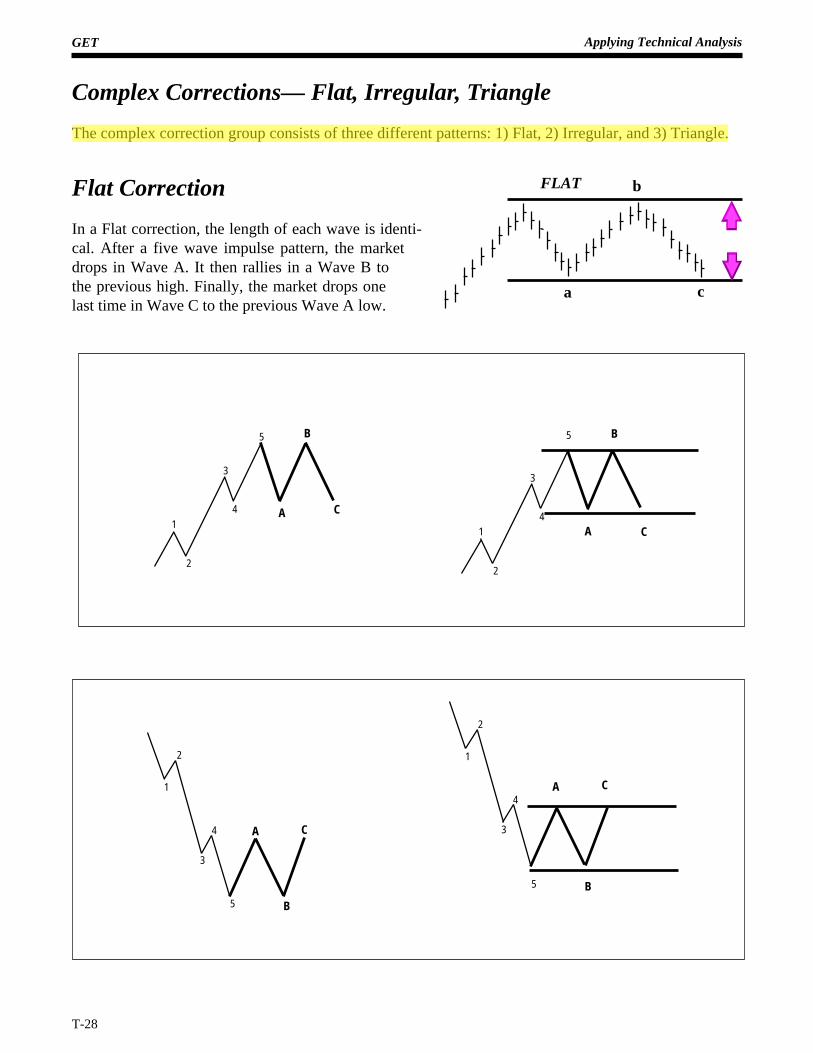
Complex Corrections— Flat, Irregular, Triangle
The complex correction group consists of three different patterns: 1) Flat, 2) Irregular, and 3) Triangle.
Flat Correction
In a Flat correction, the length of each wave is identi-cal. After a five wave impulse pattern, the marketdrops in Wave A. It then rallies in a Wave B tothe previous high. Finally, the market drops onelast time in Wave C to the previous Wave A low.
1
2
4
3
5
A
B
C
A
B 5
4
3
1
2
C
GET Applying Technical Analysis
T-29
AC
IRREGULAR 5
AC
C
OR
3
5
4
3
2
1 1
2
4
BB
DOWNWARDIRREGULAR
CORRECTION
5
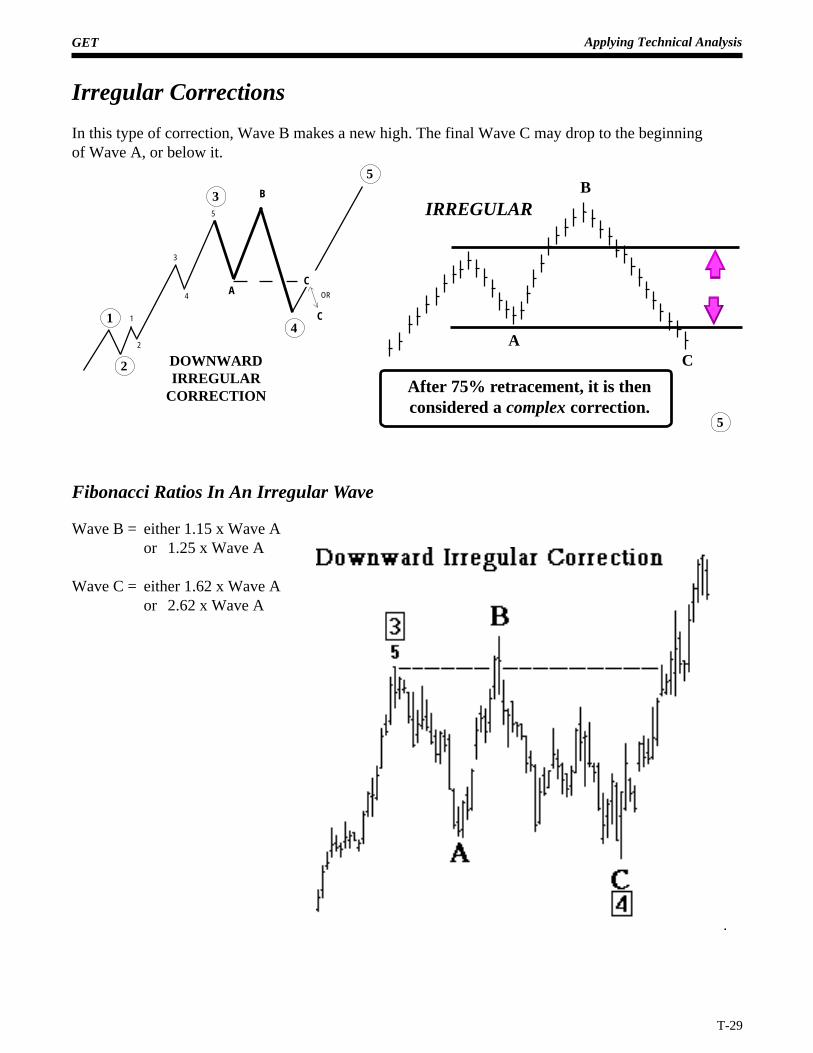
After 75% retracement, it is thenconsidered a complex correction.
Irregular Corrections
In this type of correction, Wave B makes a new high. The final Wave C may drop to the beginningof Wave A, or below it.
Fibonacci Ratios In An Irregular Wave
Wave B = either 1.15 x Wave Aor 1.25 x Wave A
Wave C = either 1.62 x Wave Aor 2.62 x Wave A
GET Applying Technical Analysis
T-30
Triangle Corrections
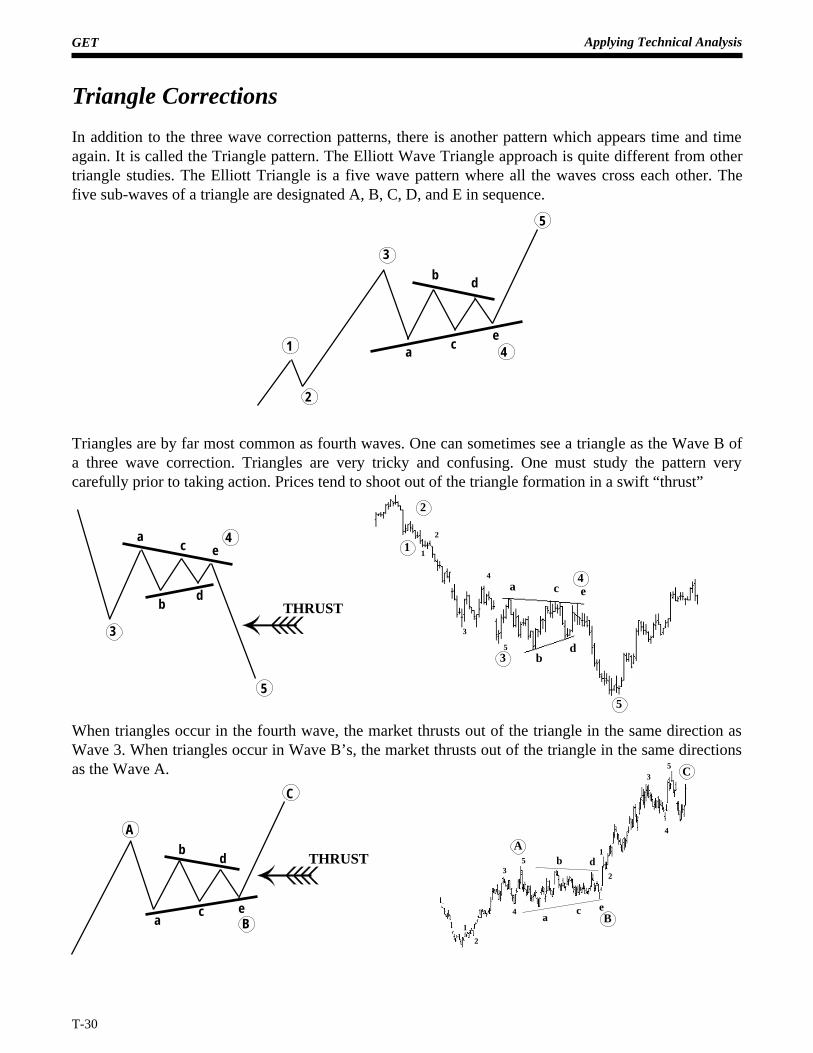
In addition to the three wave correction patterns, there is another pattern which appears time and timeagain. It is called the Triangle pattern. The Elliott Wave Triangle approach is quite different from othertriangle studies. The Elliott Triangle is a five wave pattern where all the waves cross each other. Thefive sub-waves of a triangle are designated A, B, C, D, and E in sequence.
Triangles are by far most common as fourth waves. One can sometimes see a triangle as the Wave B ofa three wave correction. Triangles are very tricky and confusing. One must study the pattern verycarefully prior to taking action. Prices tend to shoot out of the triangle formation in a swift “thrust”.
When triangles occur in the fourth wave, the market thrusts out of the triangle in the same direction asWave 3. When triangles occur in Wave B’s, the market thrusts out of the triangle in the same directionsas the Wave A.
a
b
c
d
e
A
B
THRUST
5
a
b
c
d
e4
3
THRUST
a
b
c
d
e
5
4
3
1
2
1
3
4
5
2
5
3
1
2
4ac
e
bd
B
15
A
2
4
35
eca
b d
4
3
1
2
C
C
GET Applying Technical Analysis
T-31
Alternation Rule
� If Wave Two Is A Simple
Correction, Expect
Wave Four To Be
A Complex Correction.
� If Wave Two Is A
Complex Correction,
Expect Wave Four To
Be A Simple Correction.
T -32
GET Applying Technical Analysis
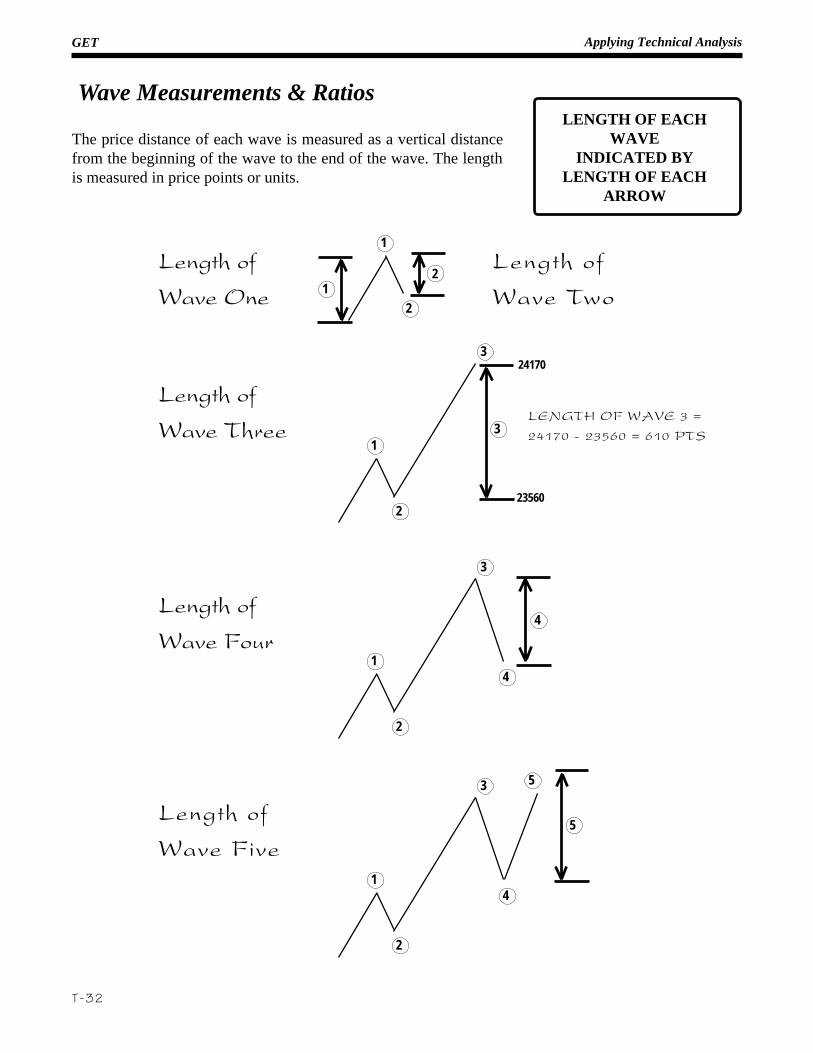
The price distance of each wave is measured as a vertical distancefrom the beginning of the wave to the end of the wave. The lengthis measured in price points or units.
Wave Measurements & Ratios
5
2
1
3
4
5
2
1
3
4
4
2
1
3
3
24170
23560
LENGTH OF WAVE 3 =
24170 - 23560 = 610 PTS
2
1
12
Length of
Wave Three
Length of
Wave Four
Length of
Wave Five
Length of
Wave One
Length of
Wave Two
LENGTH OF EACHWAVE
INDICATED BYLENGTH OF EACH
ARROW
T -33
GET Applying Technical Analysis
Fibonacci Ratios Of Waves
The first wave in an Elliott sequence is Wave 1. The measurement of Wave 1 is used to find ratios ofother waves. These ratios are not rules, but guidelines in estimating the lengths of different waves. Priorto wave ratios, we need to discuss Fibonacci.
Fibonacci Ratio Background
Fibonacci ratios are mathematical ratios derived from the Fibonacci sequence. The Fibonacci sequenceis the work of Leonardo Fibonacci around 1180ACE. The Fibonacci sequence is used in many applica-tions including engineering, space studies, stock market actions, and many other fields. This is all theinformation one needs as to the origin of the Fibonacci ratios, at least for trading purposes.
The most common Fibonacci ratios used in the stock markets are:1 - 1.618 - 2.618 - 4.23 - 6.85 (multiples)0.14 - 0.25 - 0.38 - 0.5 & 0.618 (ratios)
The ratios used in this manual slightly deviate from the standard Fibonacci ratios listed below. Thesedeviated ratios best fit the short-term wave pattern.
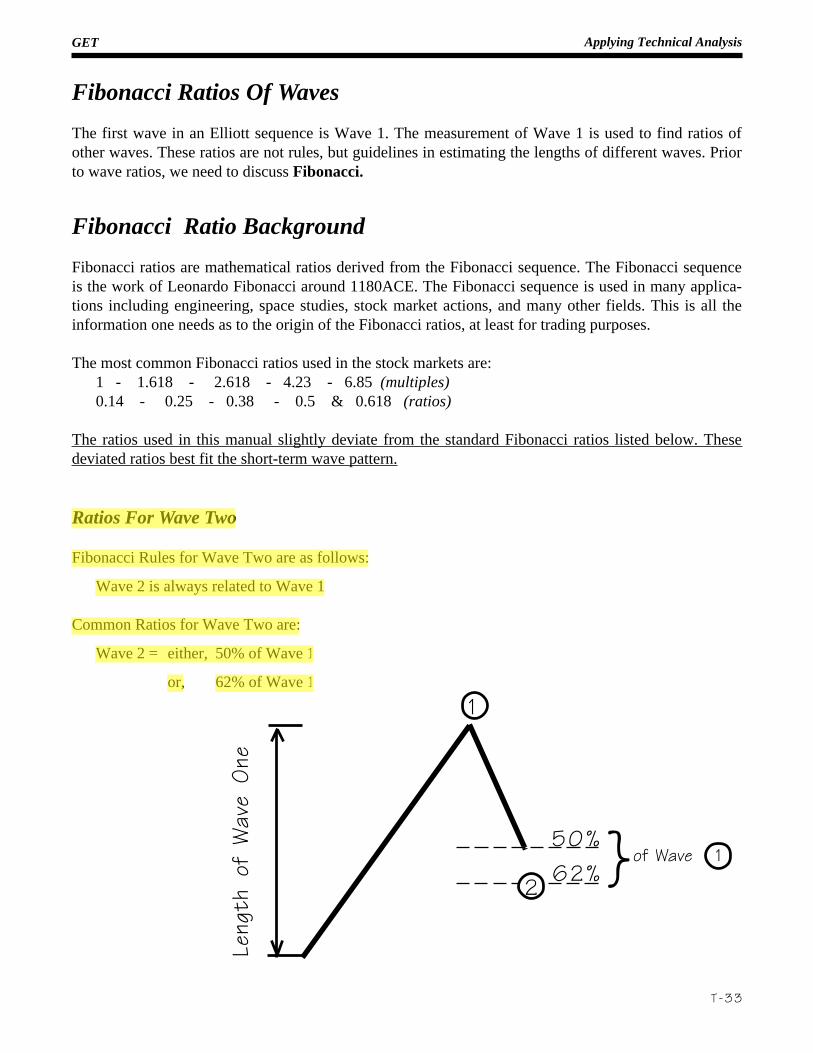
Ratios For Wave Two
Fibonacci Rules for Wave Two are as follows:
Wave 2 is always related to Wave 1
Common Ratios for Wave Two are:
Wave 2 = either, 50% of Wave 1
or, 62% of Wave 1
1
50% }2 62%
of Wave 1
Leng
th o
f W
ave
One
T -34
GET Applying Technical Analysis
X (times)lengthof Wave 3
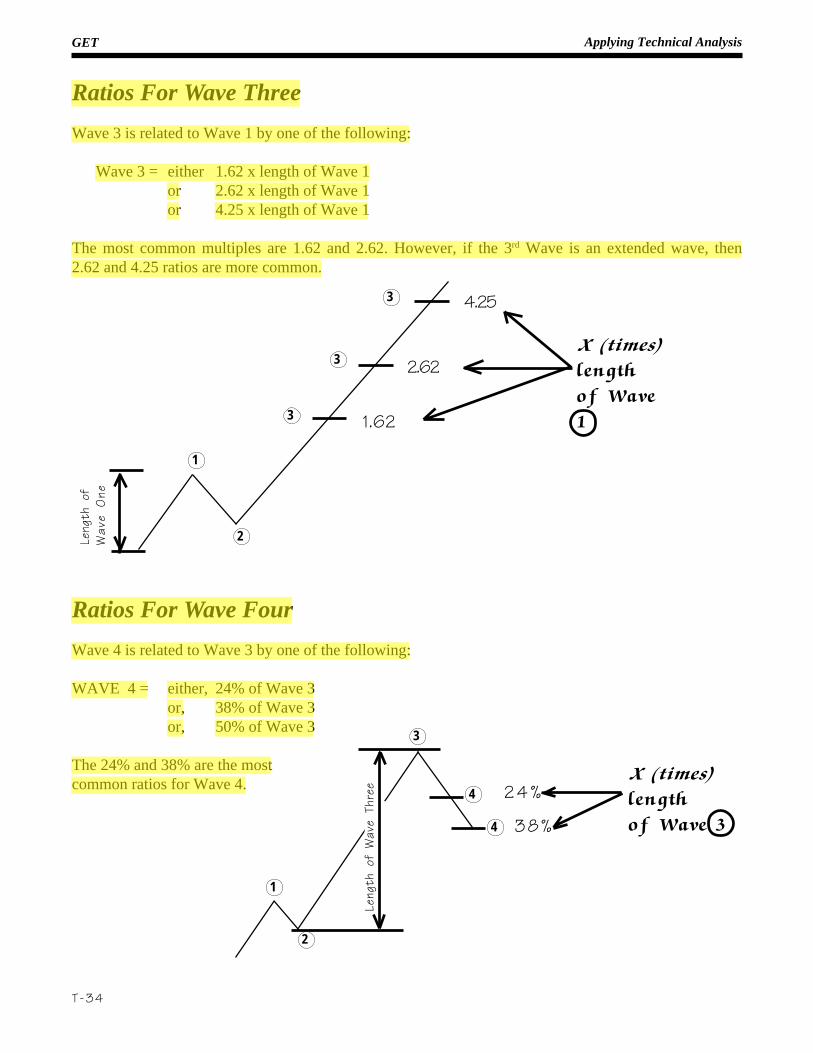
Ratios For Wave Three
Wave 3 is related to Wave 1 by one of the following:
Wave 3 = either 1.62 x length of Wave 1or 2.62 x length of Wave 1or 4.25 x length of Wave 1
The most common multiples are 1.62 and 2.62. However, if the 3rd Wave is an extended wave, then2.62 and 4.25 ratios are more common.
Ratios For Wave Four
Wave 4 is related to Wave 3 by one of the following:
WAVE 4 = either, 24% of Wave 3or, 38% of Wave 3or, 50% of Wave 3
The 24% and 38% are the mostcommon ratios for Wave 4.
1
2
3
3
4.25
2.62
3 1.62
X (times)lengthof Wave1
Leng
th o
fW
ave
One
2
1
3
Leng
th o
f W
ave
Thre
e
4
4
2 4 %
38%
T -35
GET Applying Technical Analysis
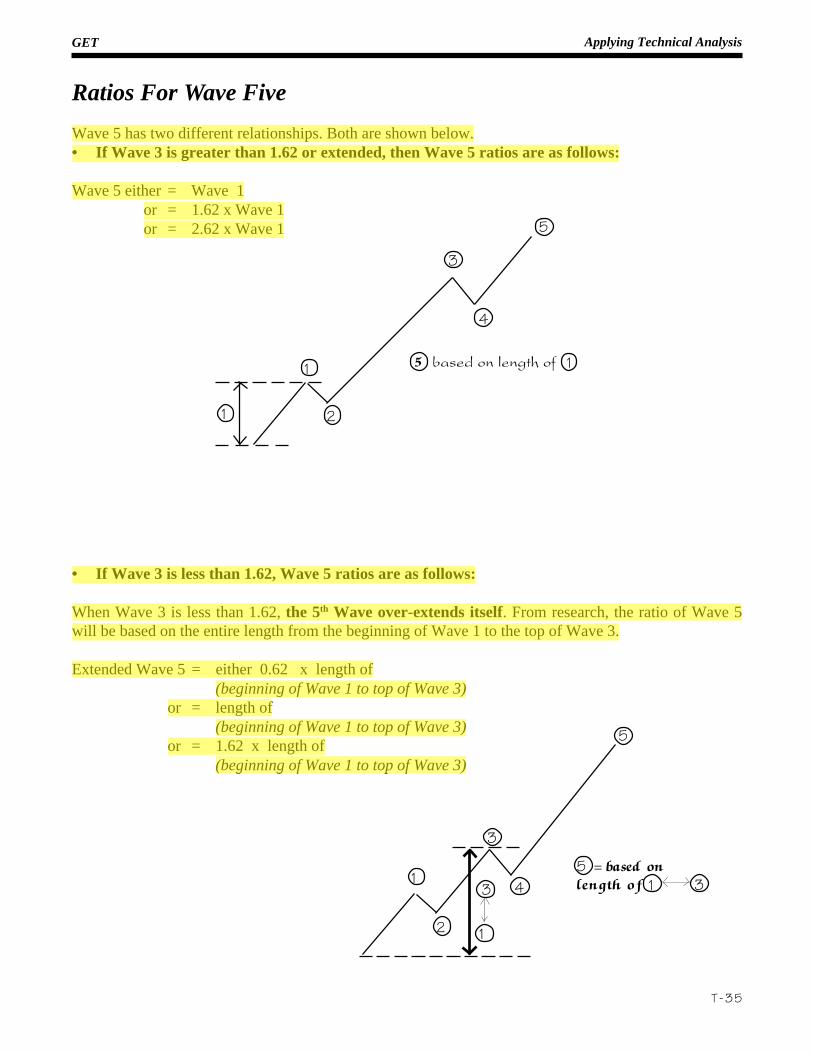
Ratios For Wave Five
Wave 5 has two different relationships. Both are shown below.• If Wave 3 is greater than 1.62 or extended, then Wave 5 ratios are as follows:
Wave 5 either = Wave 1or = 1.62 x Wave 1or = 2.62 x Wave 1
• If Wave 3 is less than 1.62, Wave 5 ratios are as follows:
When Wave 3 is less than 1.62, the 5th Wave over-extends itself. From research, the ratio of Wave 5will be based on the entire length from the beginning of Wave 1 to the top of Wave 3.
Extended Wave 5 = either 0.62 x length of(beginning of Wave 1 to top of Wave 3)
or = length of(beginning of Wave 1 to top of Wave 3)
or = 1.62 x length of(beginning of Wave 1 to top of Wave 3)
1
2
3
4
5
5 = based onlength of
1
3 31
3
4
5
1 2
1 15 based on length of
T-36
GET Applying Technical Analysis
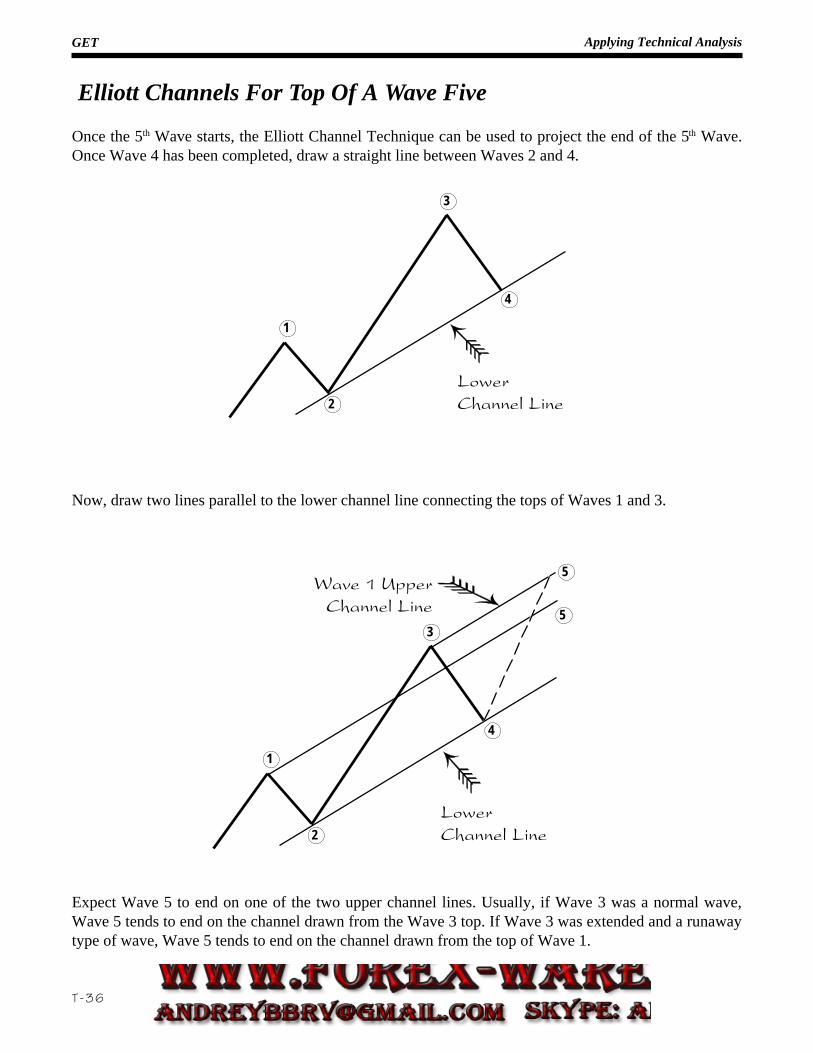
Elliott Channels For Top Of A Wave Five
Once the 5th Wave starts, the Elliott Channel Technique can be used to project the end of the 5th Wave.Once Wave 4 has been completed, draw a straight line between Waves 2 and 4.
Now, draw two lines parallel to the lower channel line connecting the tops of Waves 1 and 3.
Expect Wave 5 to end on one of the two upper channel lines. Usually, if Wave 3 was a normal wave,Wave 5 tends to end on the channel drawn from the Wave 3 top. If Wave 3 was extended and a runawaytype of wave, Wave 5 tends to end on the channel drawn from the top of Wave 1.
1
2
3
4
LowerChannel Line
1
2
3
4
LowerChannel Line
5
5
Wave 1 Upper Channel Line
GET Applying Technical Analysis
T-37
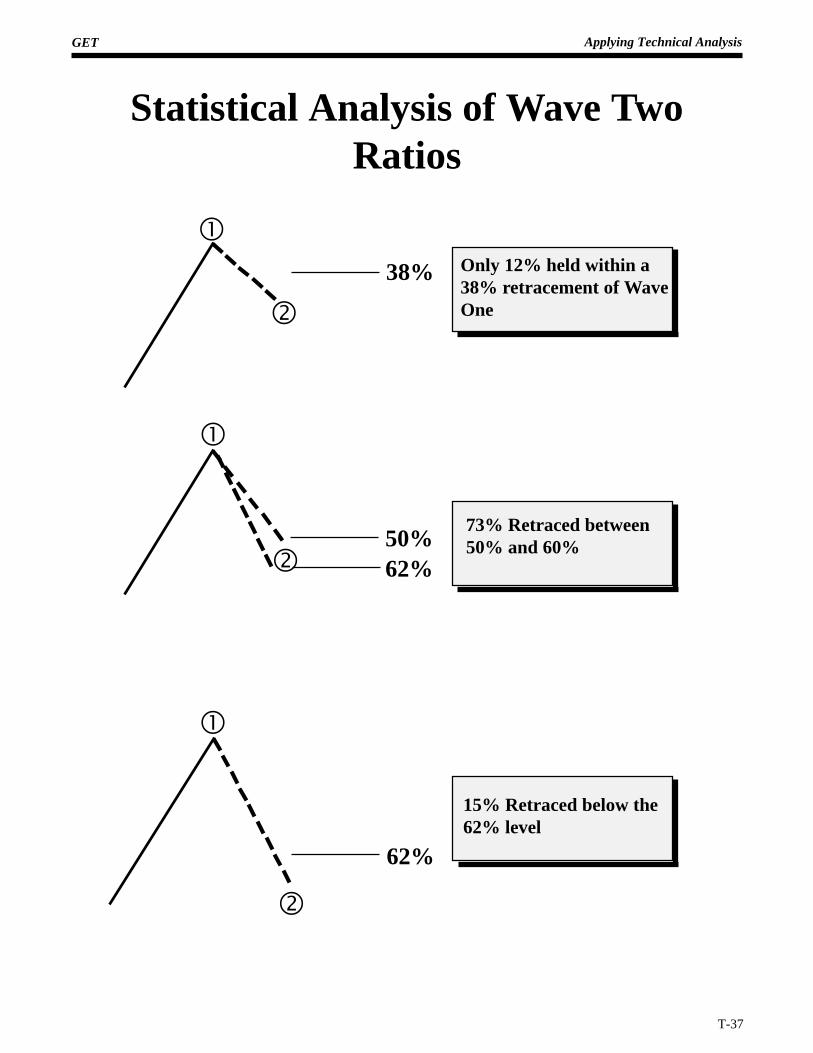
Statistical Analysis of Wave TwoRatios
Only 12% held within a38% retracement of WaveOne
15% Retraced below the62% level
73% Retraced between50% and 60%
38%
50%62%
62%
�
�
�
�
�
�
GET Applying Technical Analysis
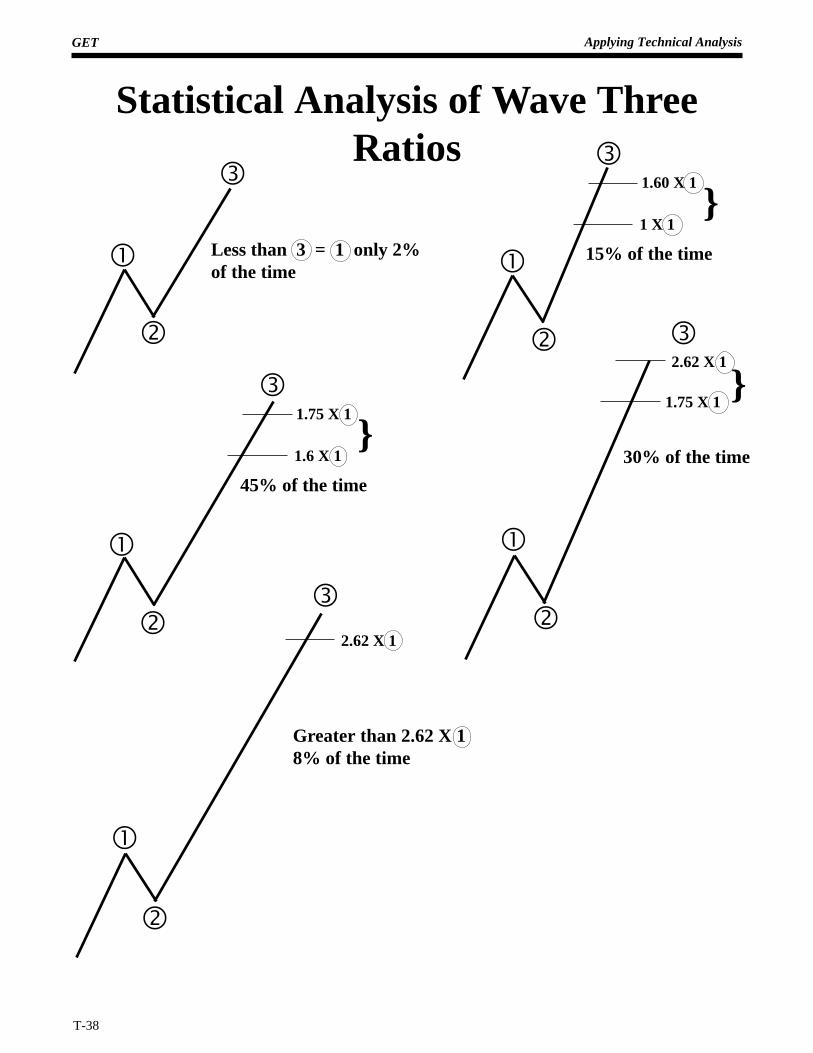
T-38
Less than 3 = 1 only 2%of the time
Statistical Analysis of Wave ThreeRatios
�
�
�
��
�
�
�
�
�
��
�
�
1.60 X 1
1 X 1
15% of the time
}
30% of the time
2.62 X 1
1.75 X 1}
1.75 X 1
1.6 X 1
45% of the time
}
�
Greater than 2.62 X 18% of the time
2.62 X 1
GET Applying Technical Analysis
T-39
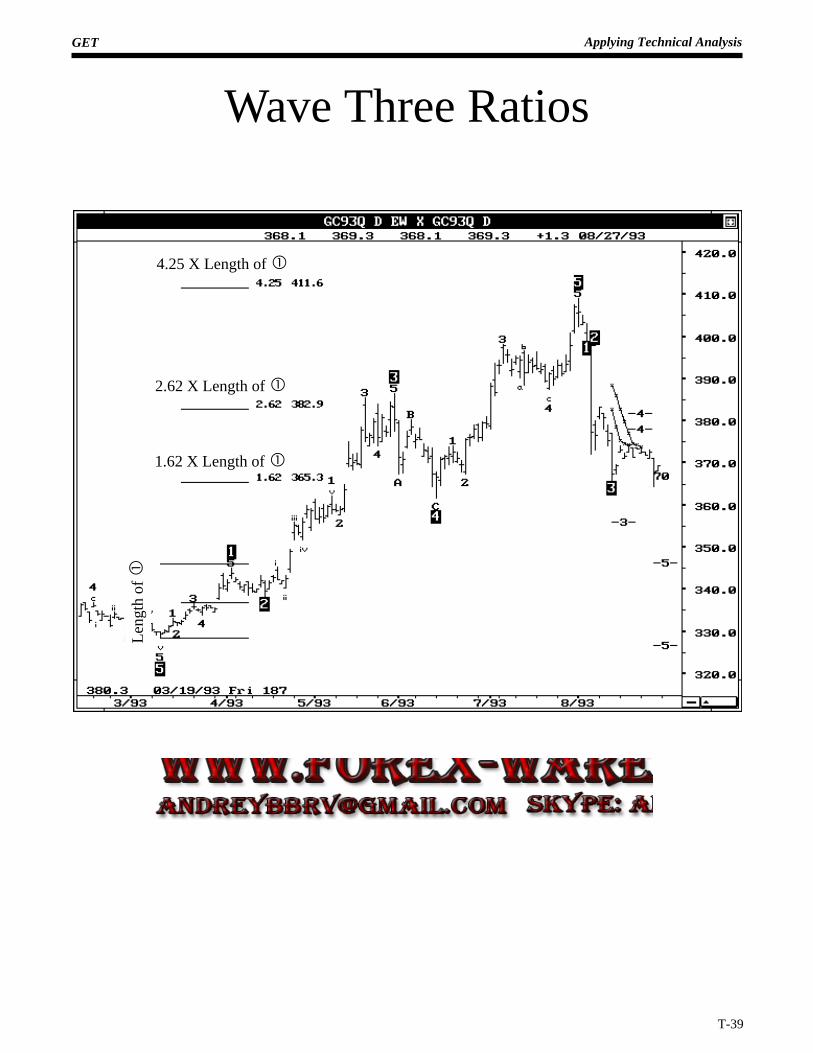
Wave Three Ratios
2.62 X Length of �
4.25 X Length of �
1.62 X Length of �
Leng
th o
f �
GET Applying Technical Analysis
T-40
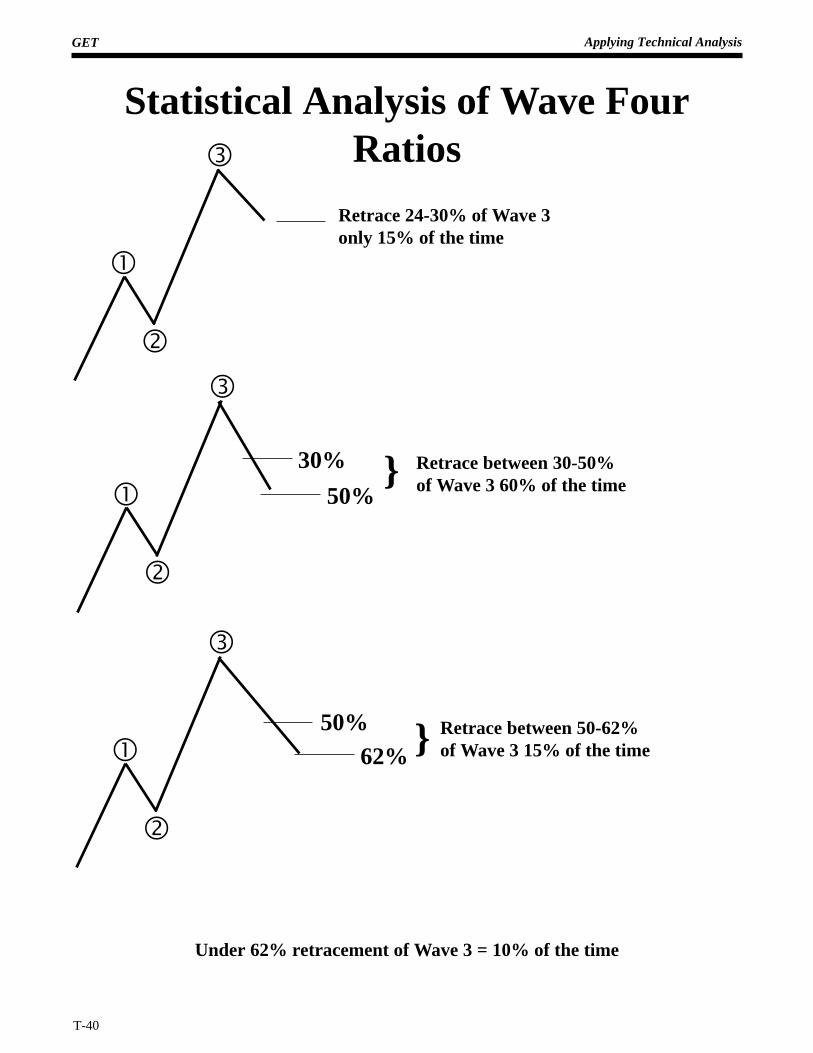
Statistical Analysis of Wave FourRatios
�
�
�
Retrace 24-30% of Wave 3only 15% of the time
Under 62% retracement of Wave 3 = 10% of the time
�
�
�
50%
30% } Retrace between 30-50%of Wave 3 60% of the time
�
�
�
50%62% } Retrace between 50-62%
of Wave 3 15% of the time
GET Applying Technical Analysis
T-41
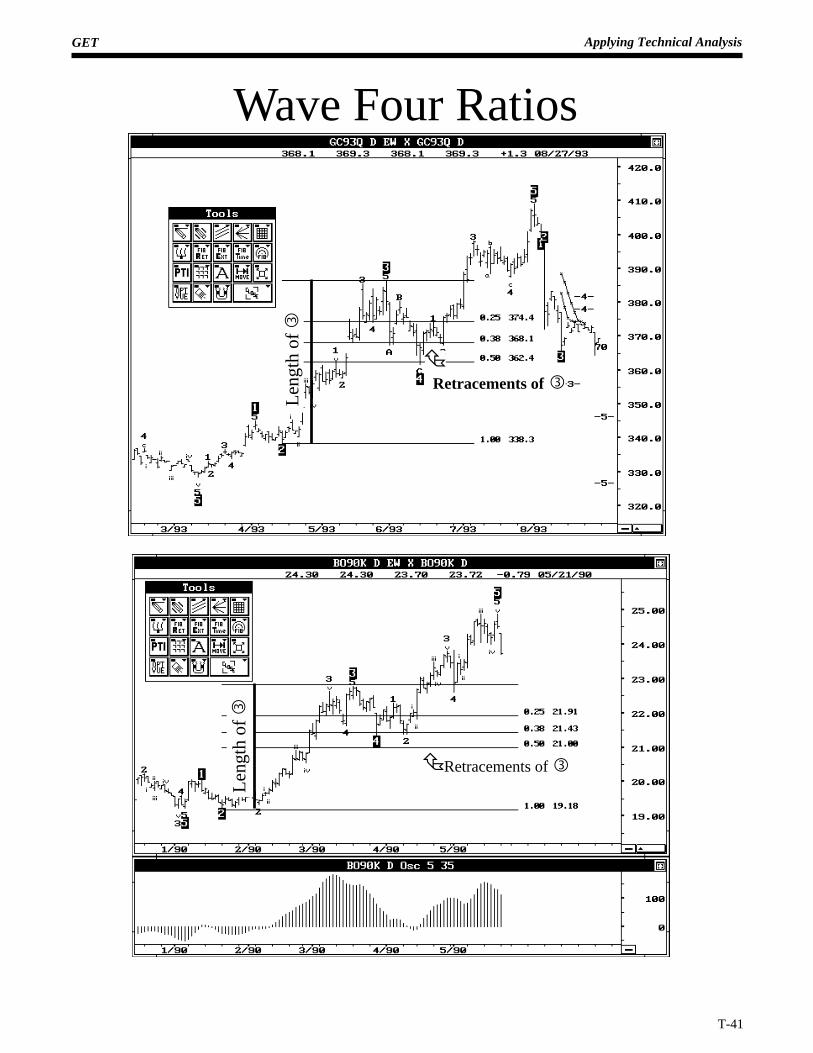
Wave Four Ratios
Leng
th o
f �
Leng
th o
f �
Retracements of �Ç
ÇRetracements of �
GET Applying Technical Analysis
T-42
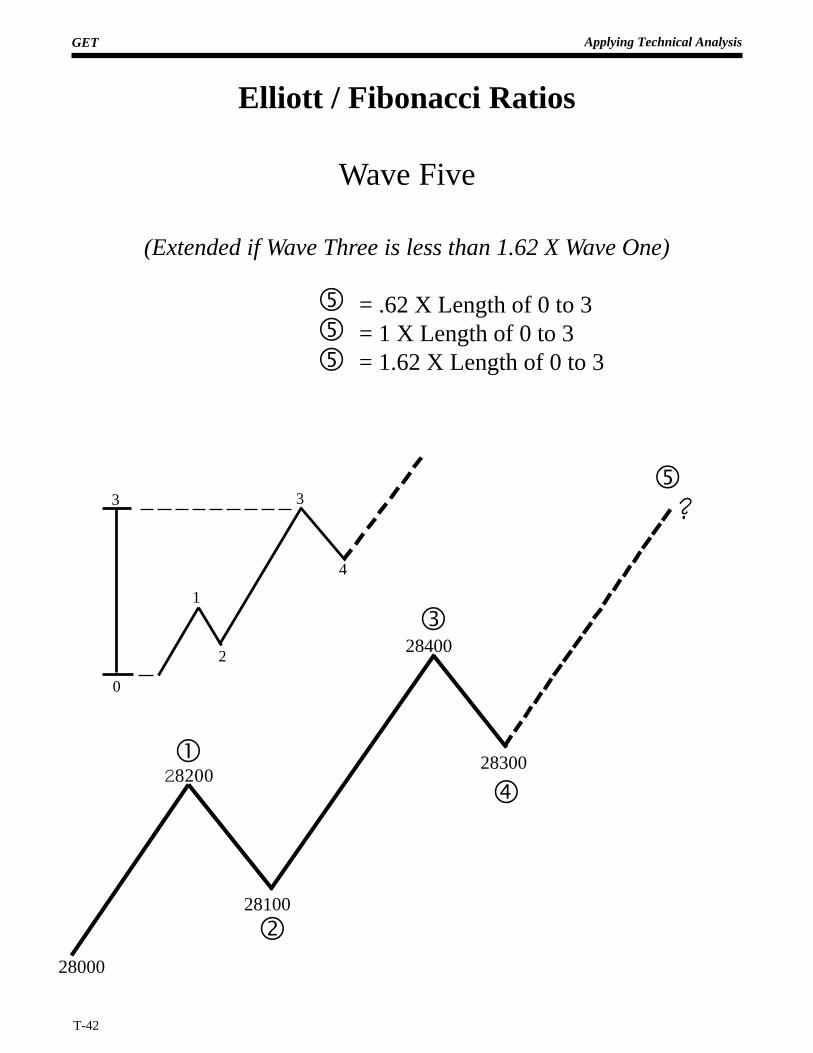
Elliott / Fibonacci Ratios
Wave Five
(Extended if Wave Three is less than 1.62 X Wave One)
= .62 X Length of 0 to 3= 1 X Length of 0 to 3= 1.62 X Length of 0 to 3�
��
3
0
1
2
3
4
�
28000
28200�
28100
�
�28400
�28300
?
GET Applying Technical Analysis
T-43
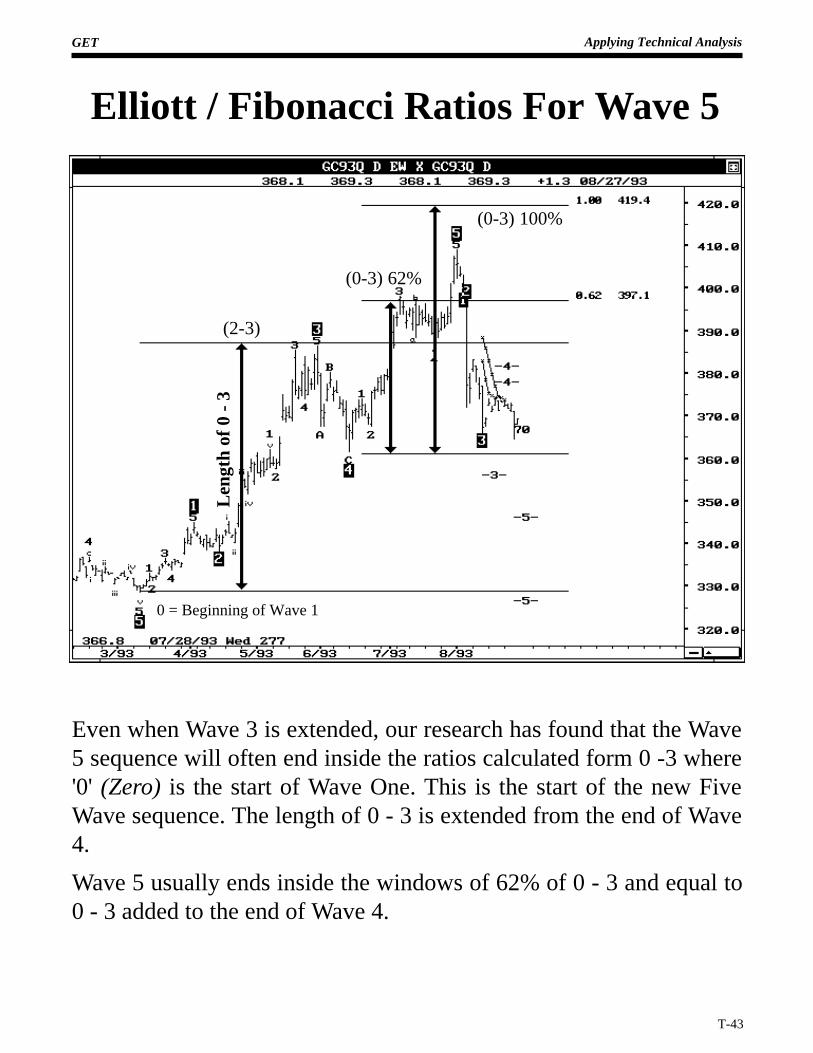
Elliott / Fibonacci Ratios For Wave 5
(0-3) 100%
(0-3) 62%
(2-3)
Leng
th o
f 0 -
3
0 = Beginning of Wave 1
Even when Wave 3 is extended, our research has found that the Wave5 sequence will often end inside the ratios calculated form 0 -3 where'0' (Zero) is the start of Wave One. This is the start of the new FiveWave sequence. The length of 0 - 3 is extended from the end of Wave4.
Wave 5 usually ends inside the windows of 62% of 0 - 3 and equal to0 - 3 added to the end of Wave 4.
GET Applying Technical Analysis
T-44
Rules: Type 1 Trade
○ ○ ○ ○
○○
○○
○○
○○
○○○○
Wave FourChannels
○ ○ ○ ○
○○
○
○
○
3
4○○○○
—5—
38%
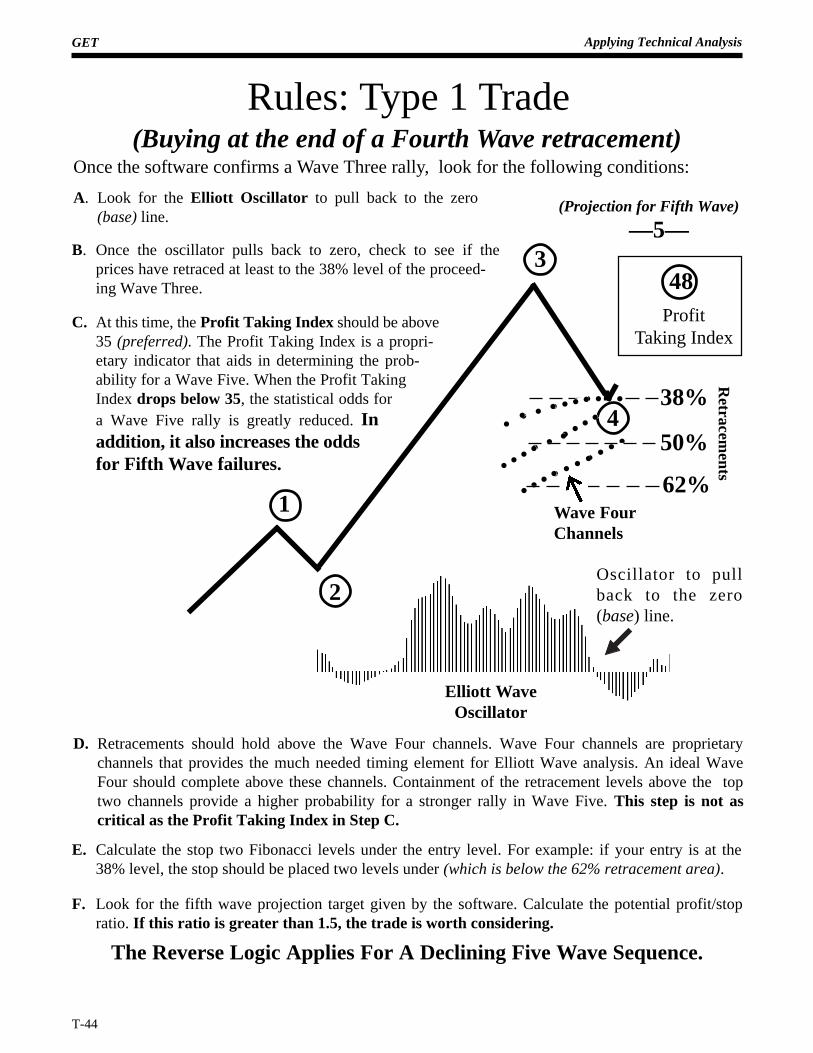
Once the software confirms a Wave Three rally, look for the following conditions:
A. Look for the Elliott Oscillator to pull back to the zero(base) line.
1
D. Retracements should hold above the Wave Four channels. Wave Four channels are proprietarychannels that provides the much needed timing element for Elliott Wave analysis. An ideal WaveFour should complete above these channels. Containment of the retracement levels above the toptwo channels provide a higher probability for a stronger rally in Wave Five. This step is not ascritical as the Profit Taking Index in Step C.
○○
○
○○○○
62%
50%
Retracem
ents
The Reverse Logic Applies For A Declining Five Wave Sequence.
E. Calculate the stop two Fibonacci levels under the entry level. For example: if your entry is at the38% level, the stop should be placed two levels under (which is below the 62% retracement area).
F. Look for the fifth wave projection target given by the software. Calculate the potential profit/stopratio. If this ratio is greater than 1.5, the trade is worth considering.
Elliott WaveOscillator
2
B. Once the oscillator pulls back to zero, check to see if theprices have retraced at least to the 38% level of the proceed-ing Wave Three.
C. At this time, the Profit Taking Index should be above35 (preferred). The Profit Taking Index is a propri-etary indicator that aids in determining the prob-ability for a Wave Five. When the Profit TakingIndex drops below 35, the statistical odds fora Wave Five rally is greatly reduced. Inaddition, it also increases the oddsfor Fifth Wave failures.
Oscillator to pullback to the zero(base) line.
(Projection for Fifth Wave)
48Profit
Taking Index
(Buying at the end of a Fourth Wave retracement)
GET Applying Technical Analysis
T-45
Rules: Type 2 Trade
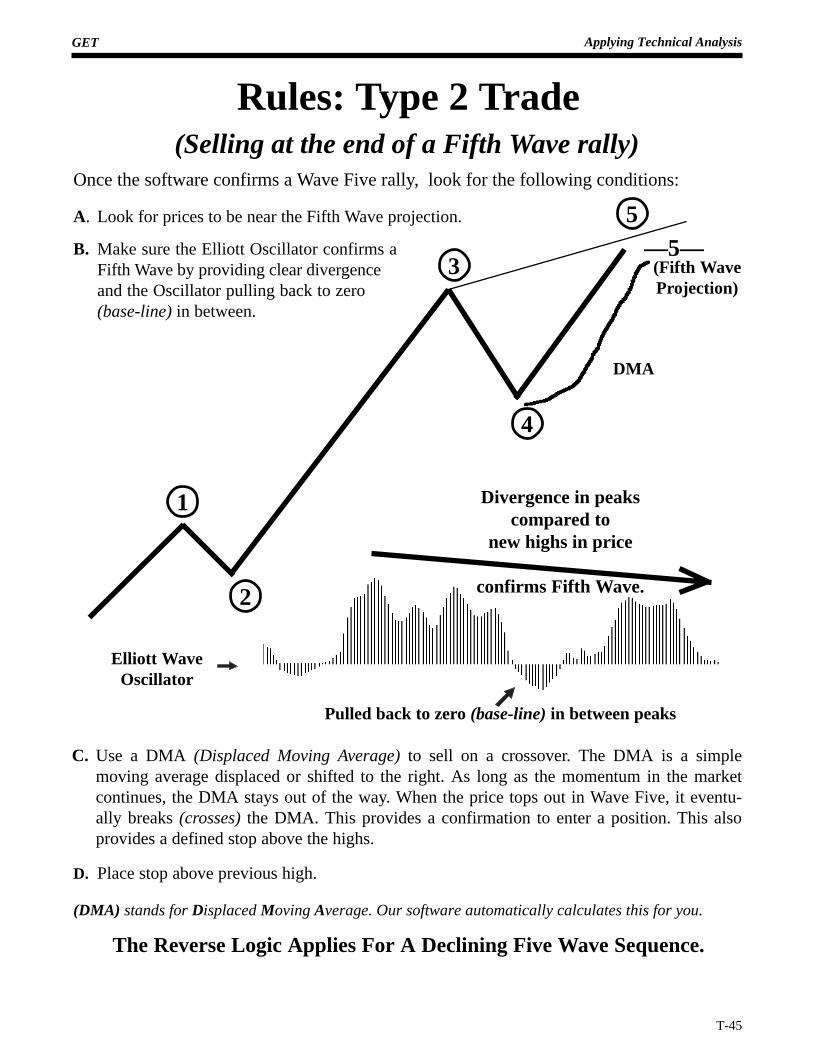
The Reverse Logic Applies For A Declining Five Wave Sequence.
(DMA) stands for Displaced Moving Average. Our software automatically calculates this for you.
1
2
3
4
5
DMA
Elliott WaveOscillator
B. Make sure the Elliott Oscillator confirms aFifth Wave by providing clear divergenceand the Oscillator pulling back to zero(base-line) in between.
Once the software confirms a Wave Five rally, look for the following conditions:
A. Look for prices to be near the Fifth Wave projection.
D. Place stop above previous high.
—5—(Fifth WaveProjection)
Divergence in peakscompared to
new highs in price
confirms Fifth Wave.
C. Use a DMA (Displaced Moving Average) to sell on a crossover. The DMA is a simplemoving average displaced or shifted to the right. As long as the momentum in the marketcontinues, the DMA stays out of the way. When the price tops out in Wave Five, it eventu-ally breaks (crosses) the DMA. This provides a confirmation to enter a position. This alsoprovides a defined stop above the highs.
(Selling at the end of a Fifth Wave rally)
Pulled back to zero (base-line) in between peaks
GET Applying Technical Analysis
T-46
The hypothetical computer simulated performance results provided are believed to be accurately presented.However, it is not guaranteed as to accuracy or completeness and is subject to change without any notice.Hypothetical or simulated performance results have certain inherent limitations. Unlike an actual performancerecord, simulated results do not represent actual trading. Since, also, the trades have not actually been executed,the results may have been under or over compensated for the impact, if any, of certain market factors such asliquidity. Simulated trading programs in general are also subject to the fact that they are designed with the benefitof hindsight. No representation is being made that any account will, or is likely to achieve profits or losses similarto those shown. All investments and trades carry risks.
© Trading Techniques, Inc.677 W. Turkeyfoot Lake Road
Akron, Ohio 44319 U.S.ATelephone # (330) 645 - 0077
All Rights Reserved. Printed in the U.S.A.
EXAMPLES OF
TYPE ONEAND
TYPE TWO
TRADES
GET Applying Technical Analysis
T-47
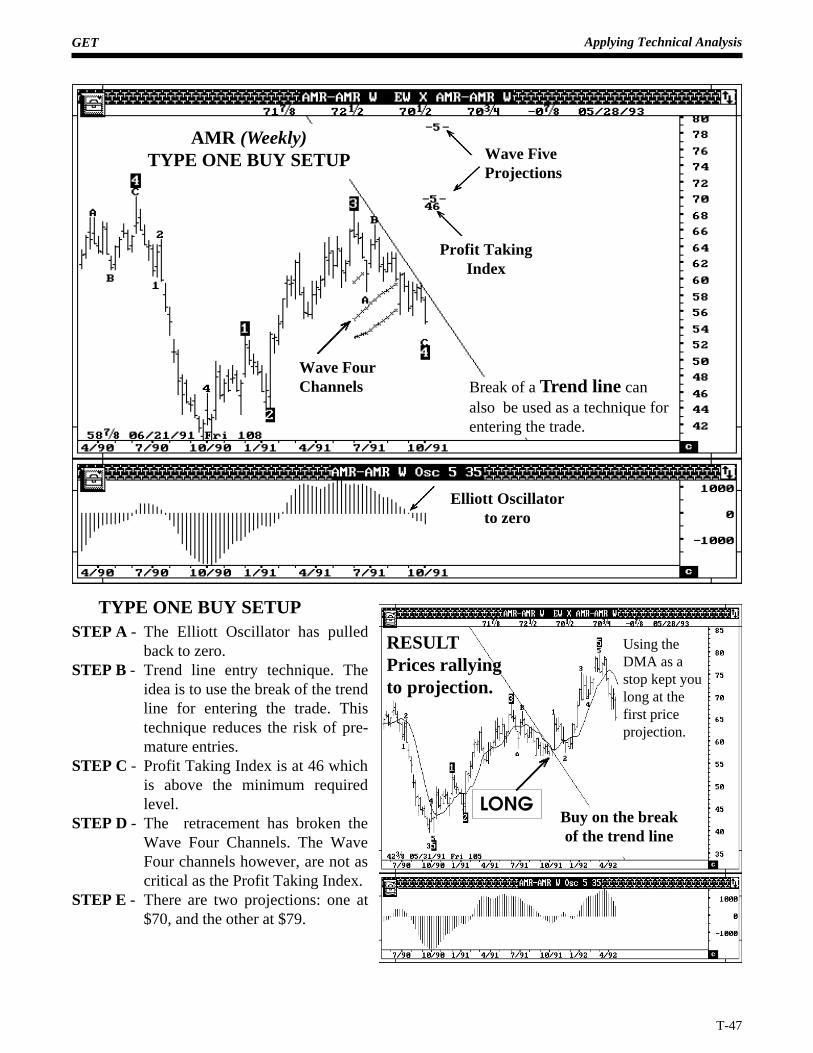
TYPE ONE BUY SETUPSTEP A - The Elliott Oscillator has pulled
back to zero.STEP B - Trend line entry technique. The
idea is to use the break of the trendline for entering the trade. Thistechnique reduces the risk of pre-mature entries.
STEP C - Profit Taking Index is at 46 whichis above the minimum requiredlevel.
STEP D - The retracement has broken theWave Four Channels. The WaveFour channels however, are not ascritical as the Profit Taking Index.
STEP E - There are two projections: one at$70, and the other at $79.
RESULTPrices rallyingto projection.
AMR (Weekly)TYPE ONE BUY SETUP
Break of a Trend line canalso be used as a technique forentering the trade.
Wave FourChannels
Profit TakingIndex
Wave FiveProjections
Elliott Oscillatorto zero
LONGBuy on the breakof the trend line
Using theDMA as astop kept youlong at thefirst priceprojection.
GET Applying Technical Analysis
T-48
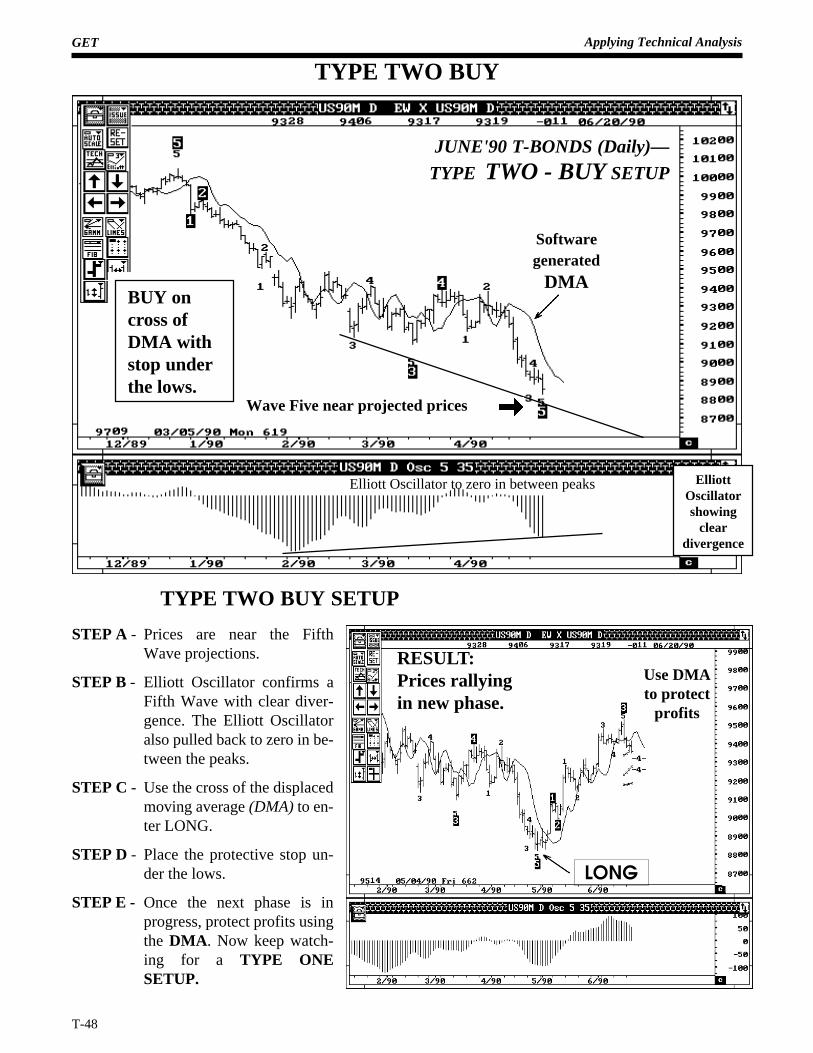
TYPE TWO BUY
BUY oncross ofDMA withstop underthe lows.
JUNE'90 T-BONDS (Daily)—
TYPE TWO - BUY SETUP
STEP A - Prices are near the FifthWave projections.
STEP B - Elliott Oscillator confirms aFifth Wave with clear diver-gence. The Elliott Oscillatoralso pulled back to zero in be-tween the peaks.
STEP C - Use the cross of the displacedmoving average (DMA) to en-ter LONG.
STEP D - Place the protective stop un-der the lows.
STEP E - Once the next phase is inprogress, protect profits usingthe DMA . Now keep watch-ing for a TYPE ONESETUP.
ElliottOscillatorshowing
cleardivergence
TYPE TWO BUY SETUP
Elliott Oscillator to zero in between peaks
Wave Five near projected prices
Softwaregenerated
DMA
LONG
Use DMAto protect
profits
RESULT:Prices rallyingin new phase.
GET Applying Technical Analysis
T-49
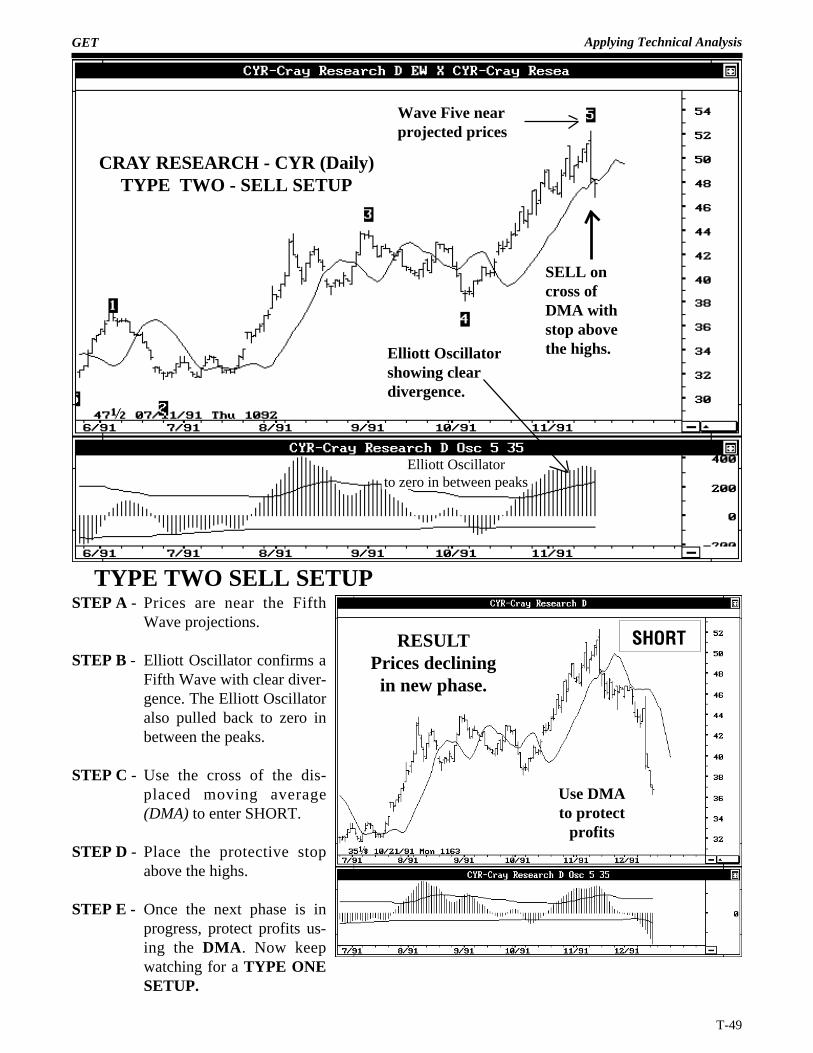
CRAY RESEARCH - CYR (Daily)TYPE TWO - SELL SETUP
Wave Five nearprojected prices
SELL oncross ofDMA withstop abovethe highs.
TYPE TWO SELL SETUPSTEP A - Prices are near the Fifth
Wave projections.
STEP B - Elliott Oscillator confirms aFifth Wave with clear diver-gence. The Elliott Oscillatoralso pulled back to zero inbetween the peaks.
STEP C - Use the cross of the dis-placed moving average(DMA) to enter SHORT.
STEP D - Place the protective stopabove the highs.
STEP E - Once the next phase is inprogress, protect profits us-ing the DMA . Now keepwatching for a TYPE ONESETUP.
RESULTPrices decliningin new phase.
Elliott Oscillatorshowing cleardivergence.
Use DMAto protect
profits
SHORT
Elliott Oscillatorto zero in between peaks
GET Applying Technical Analysis
T-50
Wave FourChannels
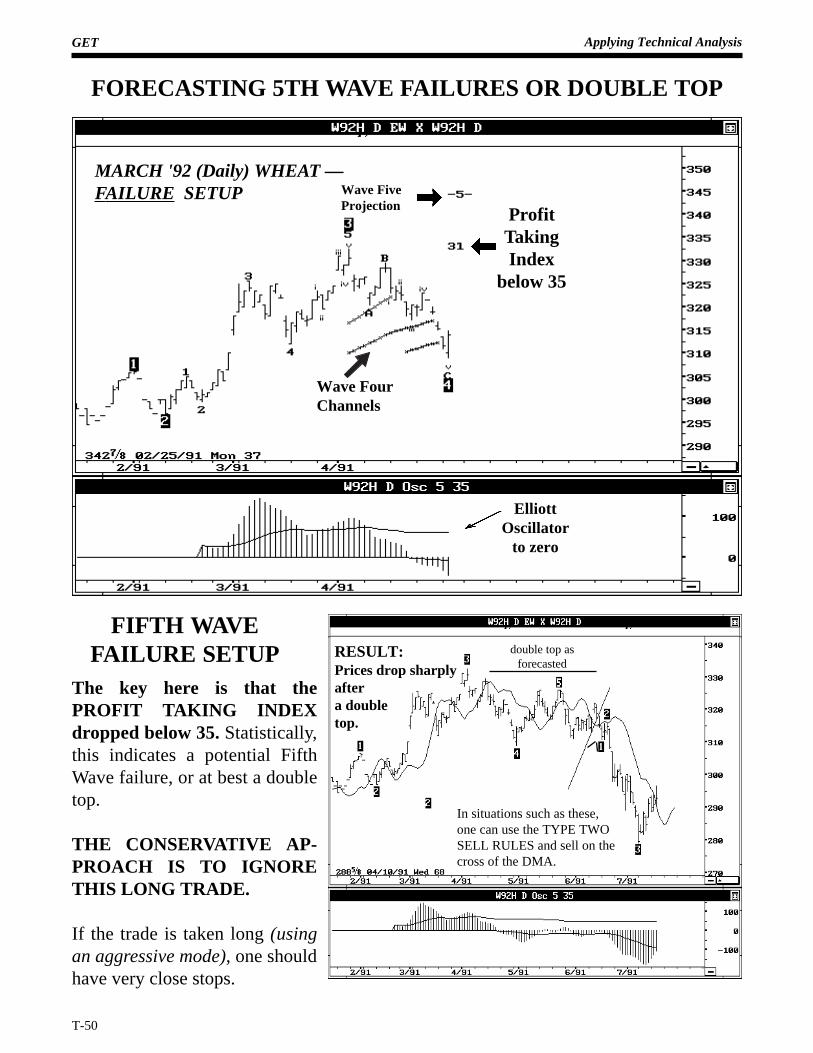
MARCH '92 (Daily) WHEAT —FAILURE SETUP Wave Five
Projection ProfitTakingIndex
below 35
ElliottOscillator
to zero
In situations such as these,one can use the TYPE TWOSELL RULES and sell on thecross of the DMA.
FIFTH WAVEFAILURE SETUP RESULT:
Prices drop sharplyaftera doubletop.
double top asforecasted
The key here is that thePROFIT TAKING INDEXdropped below 35. Statistically,this indicates a potential FifthWave failure, or at best a doubletop.
THE CONSERVATIVE AP-PROACH IS TO IGNORETHIS LONG TRADE.
If the trade is taken long (usingan aggressive mode), one shouldhave very close stops.
FORECASTING 5TH WAVE FAILURES OR DOUBLE TOP
GET Applying Technical Analysis
T-51
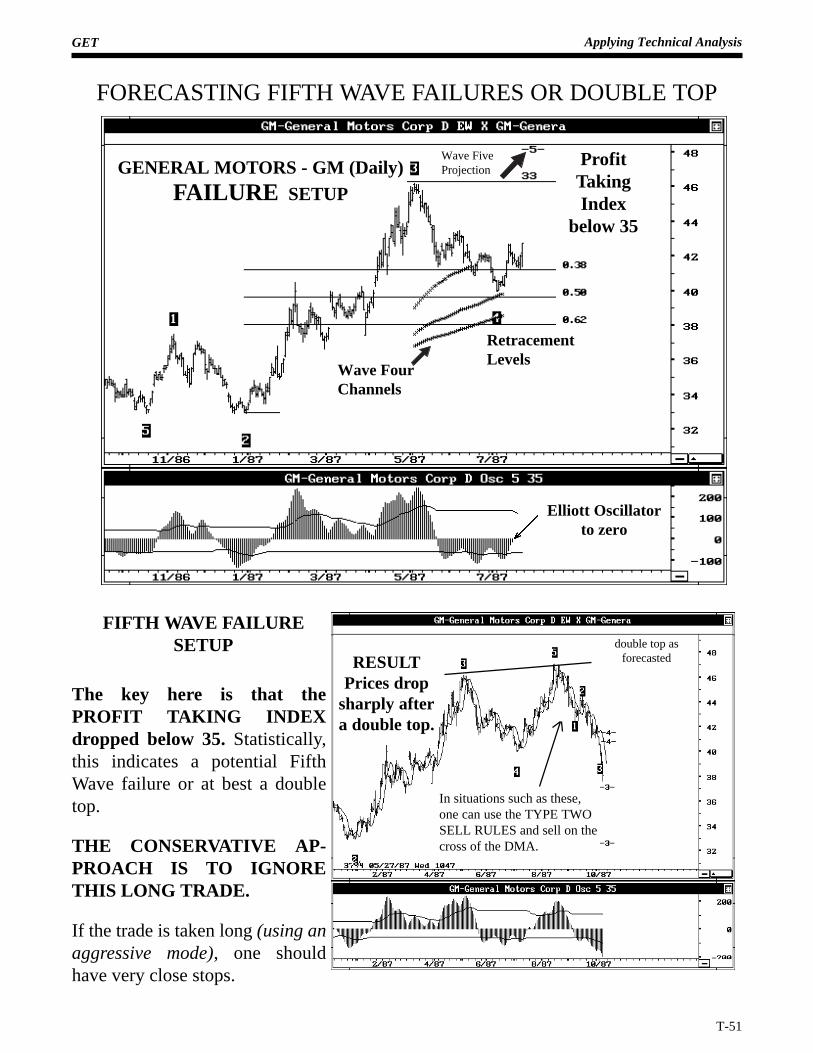
FORECASTING FIFTH WAVE FAILURES OR DOUBLE TOP
The key here is that thePROFIT TAKING INDEXdropped below 35. Statistically,this indicates a potential FifthWave failure or at best a doubletop.
THE CONSERVATIVE AP-PROACH IS TO IGNORETHIS LONG TRADE.
If the trade is taken long (using anaggressive mode), one shouldhave very close stops.
FIFTH WAVE FAILURESETUP
RetracementLevels
Wave FourChannels
Elliott Oscillatorto zero
RESULTPrices drop
sharply aftera double top.
double top asforecasted
In situations such as these,one can use the TYPE TWOSELL RULES and sell on thecross of the DMA.
Wave FiveProjection
ProfitTakingIndex
below 35
GENERAL MOTORS - GM (Daily)FAILURE SETUP
GET Applying Technical Analysis
T-52
FORECASTING FIFTH WAVE FAILURES OR DOUBLE TOP
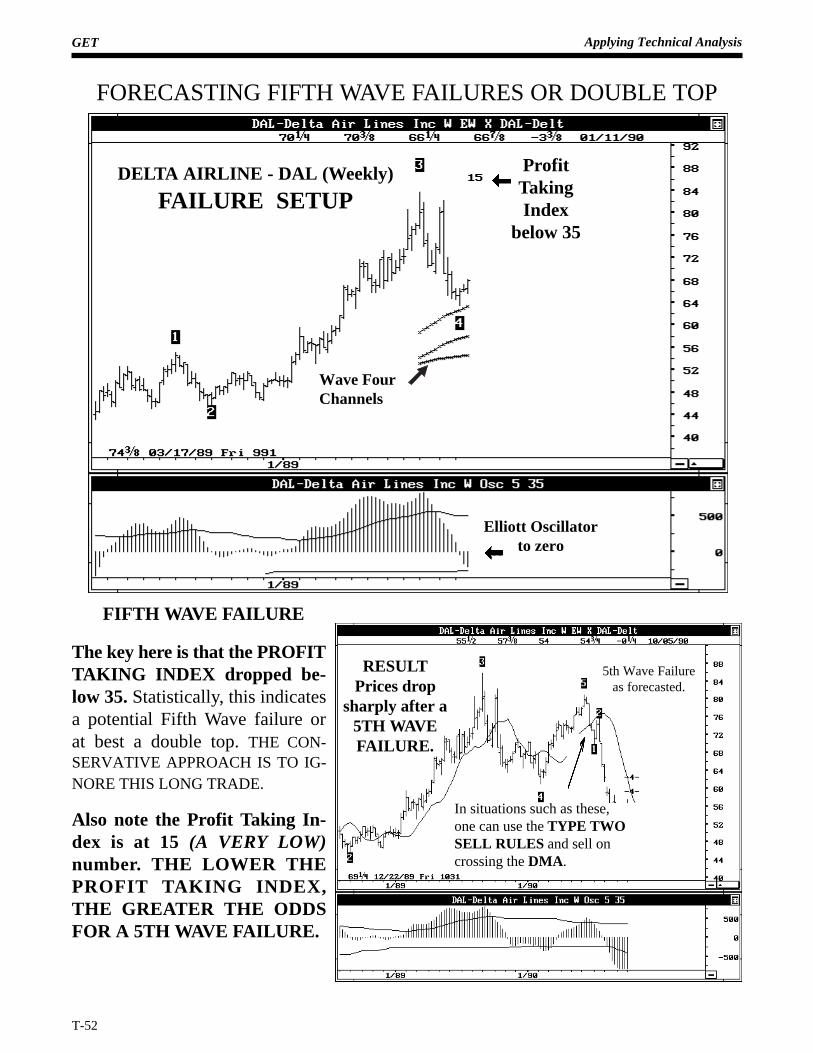
DELTA AIRLINE - DAL (Weekly)
FAILURE SETUP
ProfitTakingIndex
below 35
Wave FourChannels
Elliott Oscillatorto zero
FIFTH WAVE FAILURE
RESULTPrices drop
sharply after a5TH WAVEFAILURE.
5th Wave Failureas forecasted.
In situations such as these,one can use the TYPE TWOSELL RULES and sell oncrossing the DMA .
The key here is that the PROFITTAKING INDEX dropped be-low 35. Statistically, this indicatesa potential Fifth Wave failure orat best a double top. THE CON-SERVATIVE APPROACH IS TO IG-NORE THIS LONG TRADE.
Also note the Profit Taking In-dex is at 15 (A VERY LOW)number. THE LOWER THEPROFIT TAKING INDEX,THE GREATER THE ODDSFOR A 5TH WAVE FAILURE.
GET Applying Technical Analysis
T-53
Identify Failed Fifth Waves (Double Top)
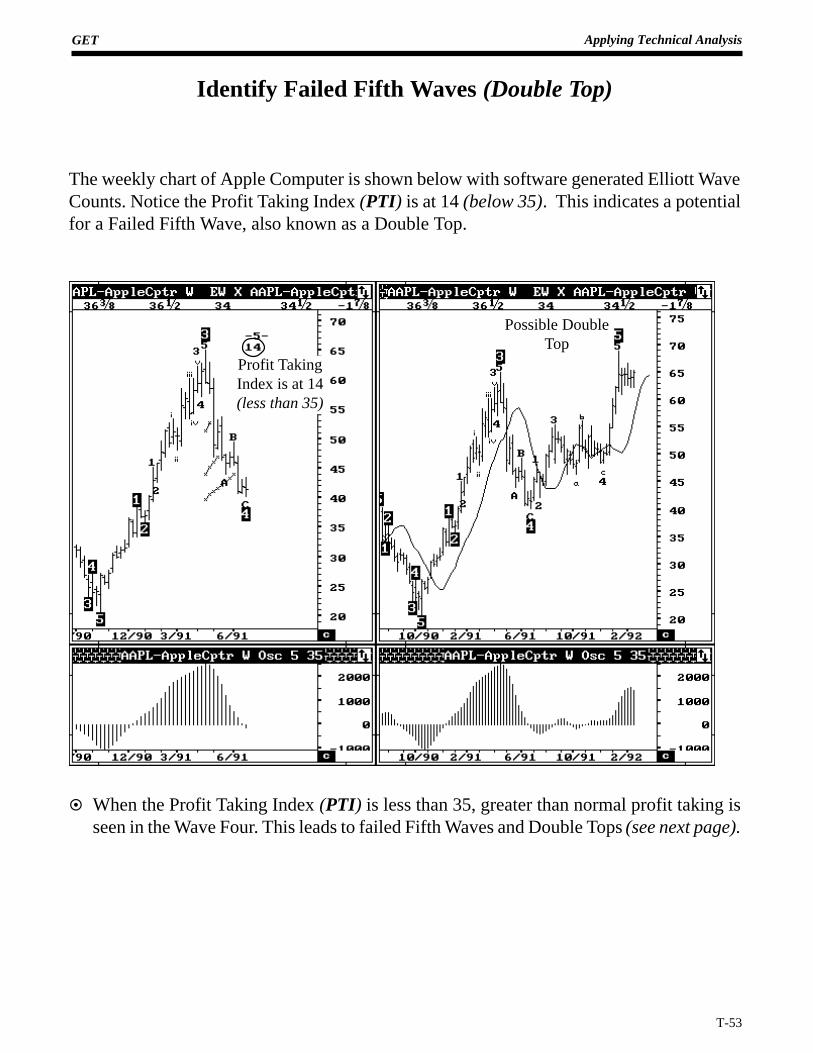
The weekly chart of Apple Computer is shown below with software generated Elliott WaveCounts. Notice the Profit Taking Index (PTI) is at 14 (below 35). This indicates a potentialfor a Failed Fifth Wave, also known as a Double Top.
¤ When the Profit Taking Index (PTI) is less than 35, greater than normal profit taking isseen in the Wave Four. This leads to failed Fifth Waves and Double Tops (see next page).
Profit TakingIndex is at 14(less than 35)
Possible DoubleTop
GET Applying Technical Analysis
T-54
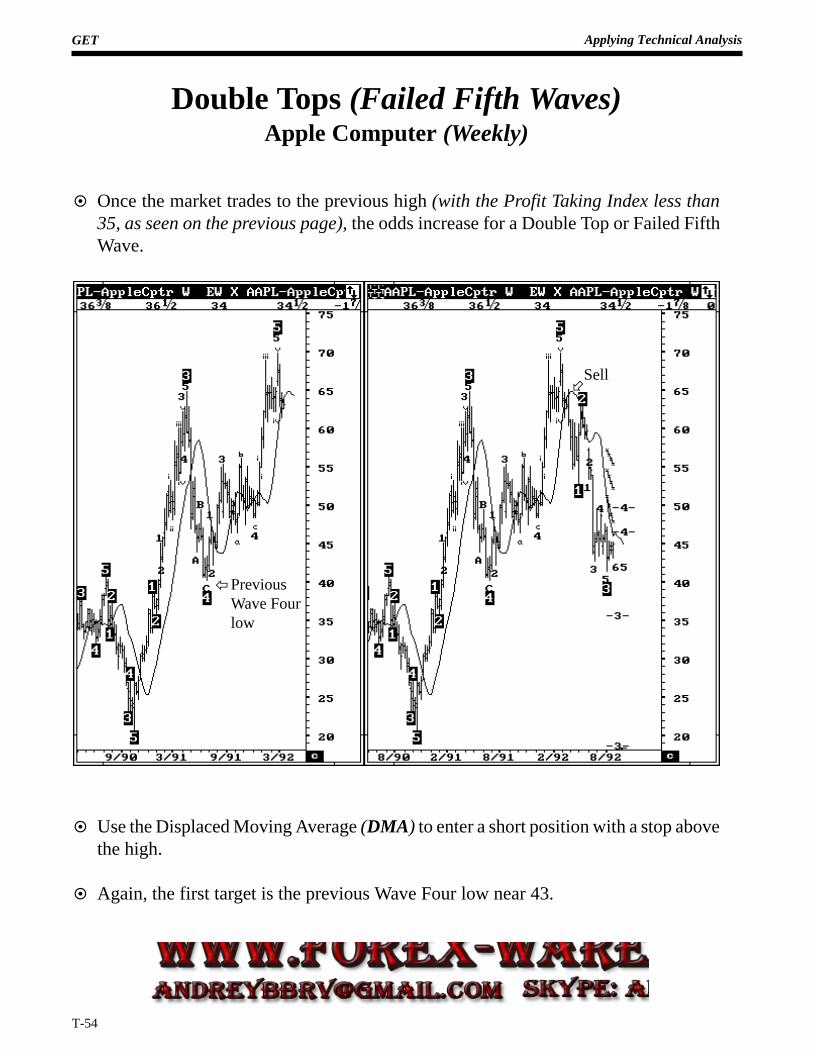
Double Tops (Failed Fifth Waves)Apple Computer (Weekly)
¤ Once the market trades to the previous high (with the Profit Taking Index less than35, as seen on the previous page), the odds increase for a Double Top or Failed FifthWave.
¤ Use the Displaced Moving Average (DMA) to enter a short position with a stop abovethe high.
¤ Again, the first target is the previous Wave Four low near 43.
÷Sell
ïPreviousWave Fourlow
GET Applying Technical Analysis
T-55
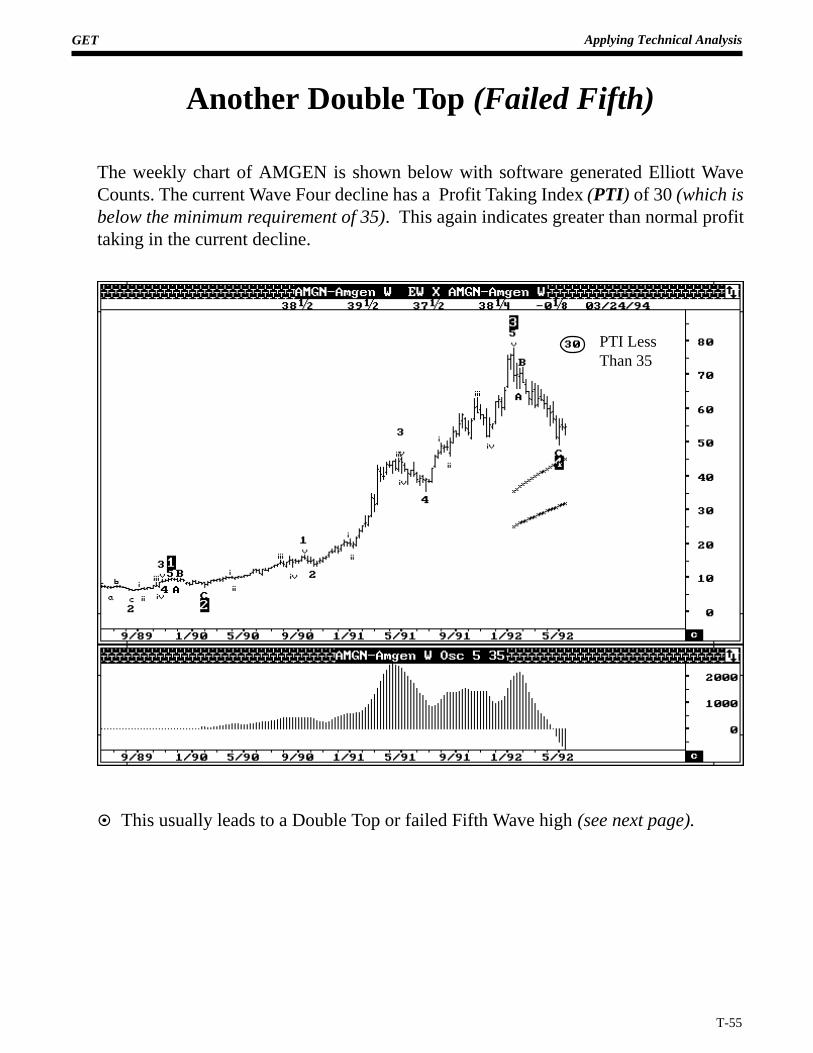
Another Double Top (Failed Fifth)
The weekly chart of AMGEN is shown below with software generated Elliott WaveCounts. The current Wave Four decline has a Profit Taking Index (PTI) of 30 (which isbelow the minimum requirement of 35). This again indicates greater than normal profittaking in the current decline.
¤ This usually leads to a Double Top or failed Fifth Wave high (see next page).
PTI LessThan 35
GET Applying Technical Analysis
T-56
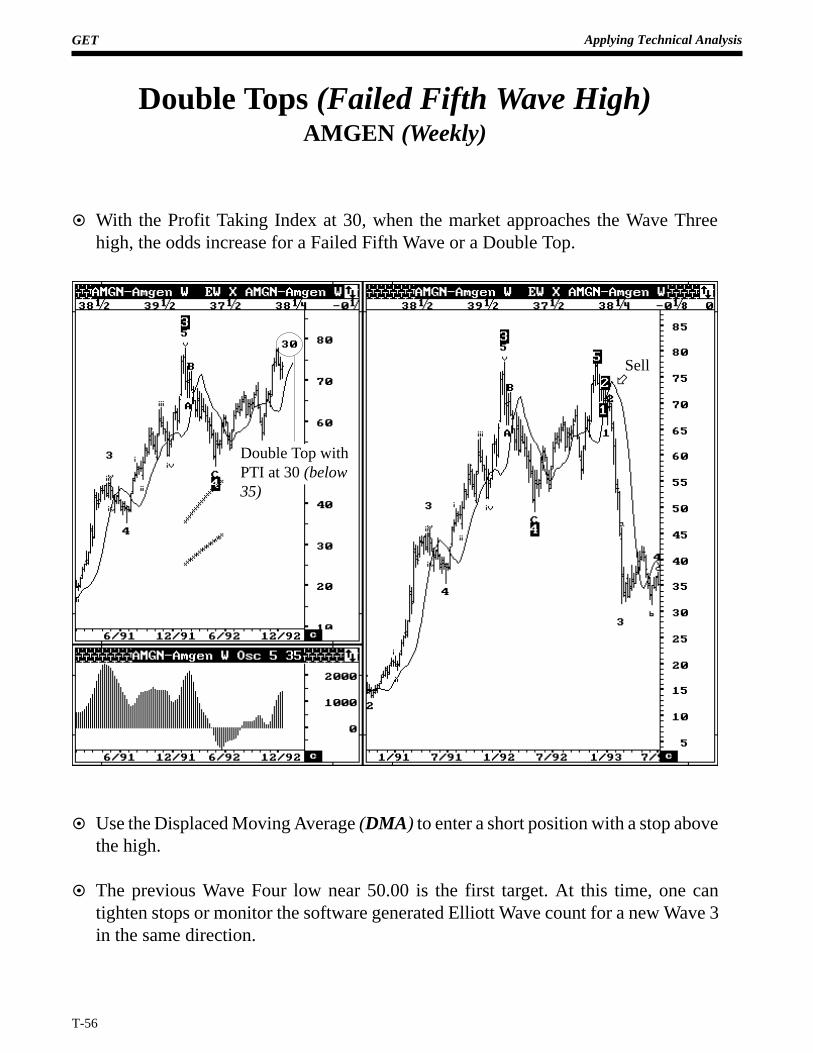
Double Tops (Failed Fifth Wave High)AMGEN (Weekly)
¤ With the Profit Taking Index at 30, when the market approaches the Wave Threehigh, the odds increase for a Failed Fifth Wave or a Double Top.
¤ Use the Displaced Moving Average (DMA) to enter a short position with a stop abovethe high.
¤ The previous Wave Four low near 50.00 is the first target. At this time, one cantighten stops or monitor the software generated Elliott Wave count for a new Wave 3in the same direction.
÷Sell
Double Top withPTI at 30 (below35)
GET Applying Technical Analysis
T-57
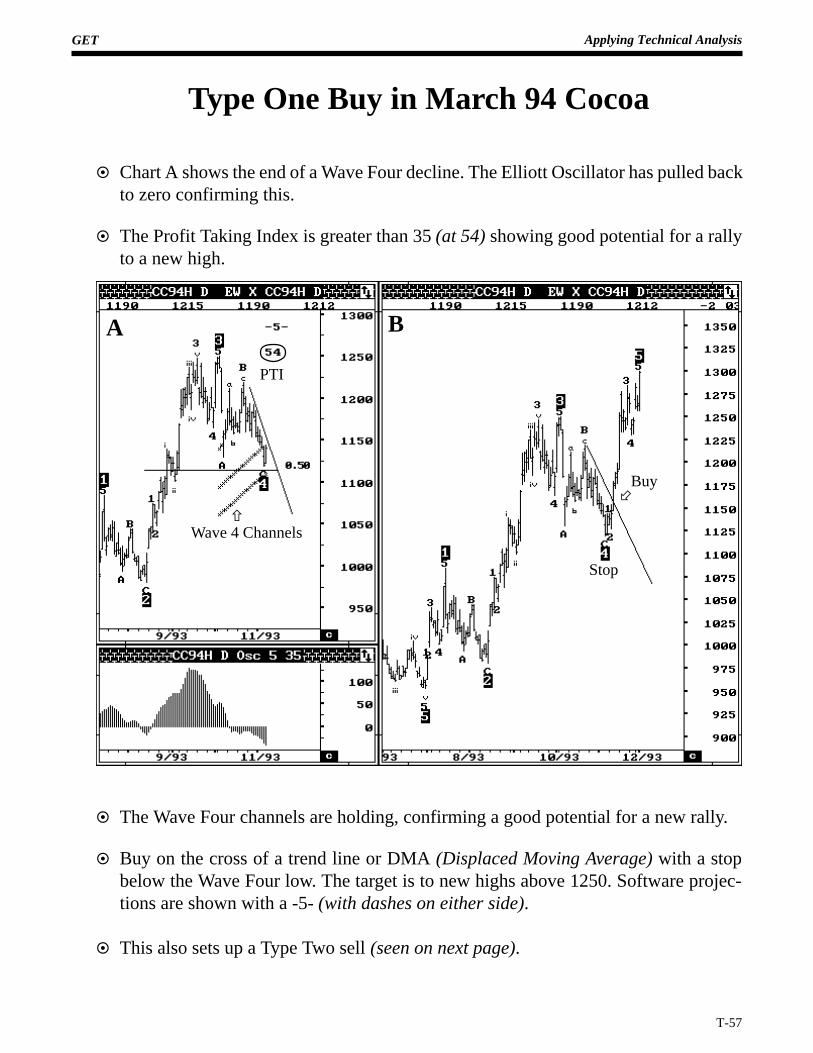
Type One Buy in March 94 Cocoa
¤ Chart A shows the end of a Wave Four decline. The Elliott Oscillator has pulled backto zero confirming this.
¤ The Profit Taking Index is greater than 35 (at 54) showing good potential for a rallyto a new high.
¤ The Wave Four channels are holding, confirming a good potential for a new rally.
¤ Buy on the cross of a trend line or DMA (Displaced Moving Average) with a stopbelow the Wave Four low. The target is to new highs above 1250. Software projec-tions are shown with a -5- (with dashes on either side).
¤ This also sets up a Type Two sell (seen on next page).
A B
÷Buy
ñWave 4 Channels
PTI
Stop
GET Applying Technical Analysis
T-58
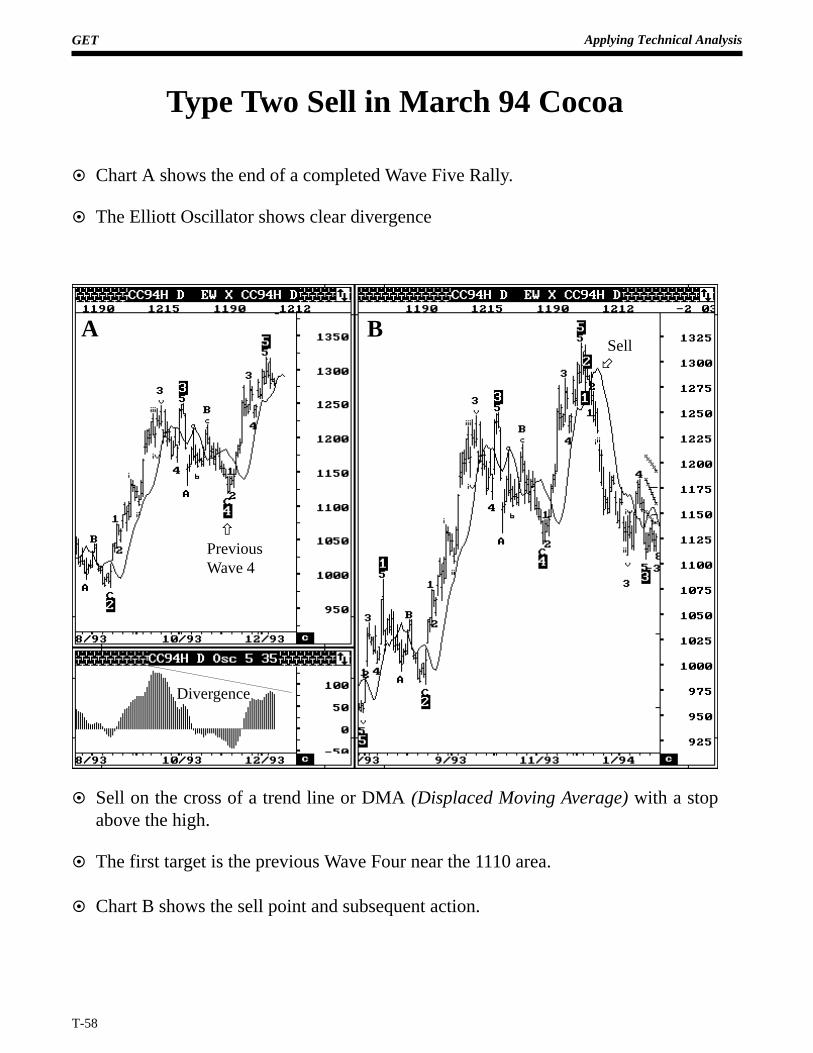
Type Two Sell in March 94 Cocoa
¤ Chart A shows the end of a completed Wave Five Rally.
¤ The Elliott Oscillator shows clear divergence
¤ Sell on the cross of a trend line or DMA (Displaced Moving Average) with a stopabove the high.
¤ The first target is the previous Wave Four near the 1110 area.
¤ Chart B shows the sell point and subsequent action.
÷Sell
A B
PreviousWave 4
ñ
Divergence
GET Applying Technical Analysis
T-59
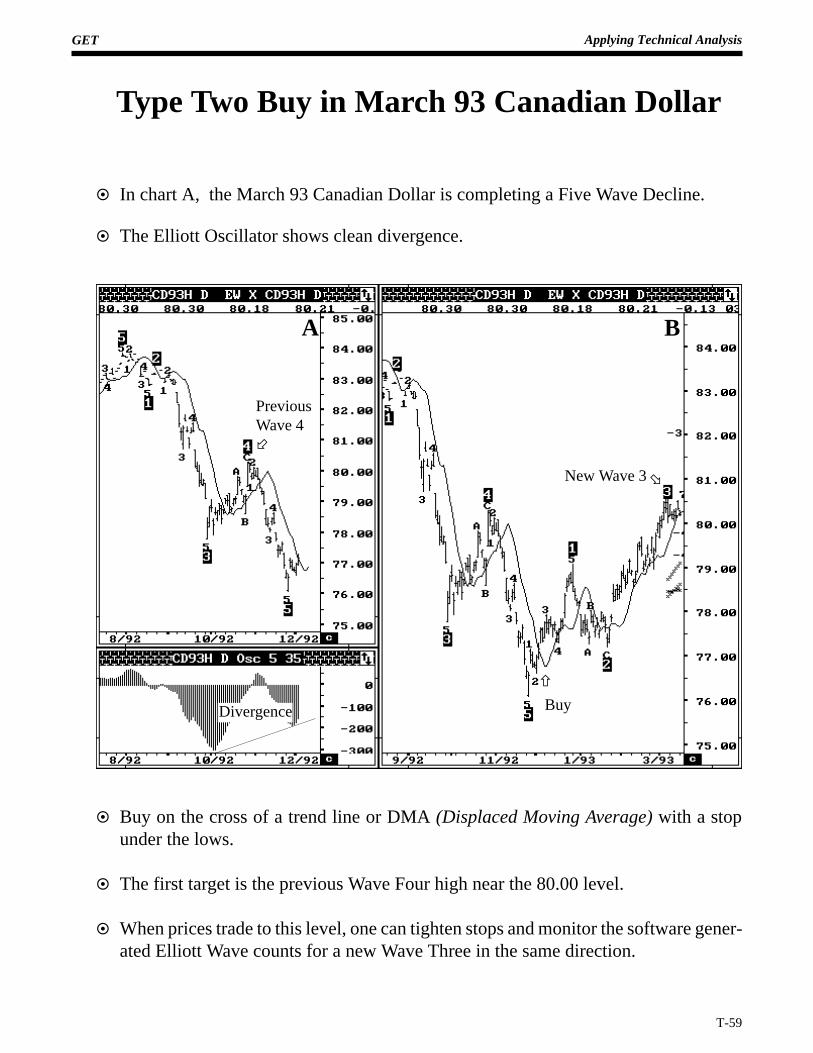
Type Two Buy in March 93 Canadian Dollar
¤ In chart A, the March 93 Canadian Dollar is completing a Five Wave Decline.
¤ The Elliott Oscillator shows clean divergence.
¤ Buy on the cross of a trend line or DMA (Displaced Moving Average) with a stopunder the lows.
¤ The first target is the previous Wave Four high near the 80.00 level.
¤ When prices trade to this level, one can tighten stops and monitor the software gener-ated Elliott Wave counts for a new Wave Three in the same direction.
A B
÷
PreviousWave 4
Buy
ñ
Divergence
øNew Wave 3
GET Applying Technical Analysis
T-60
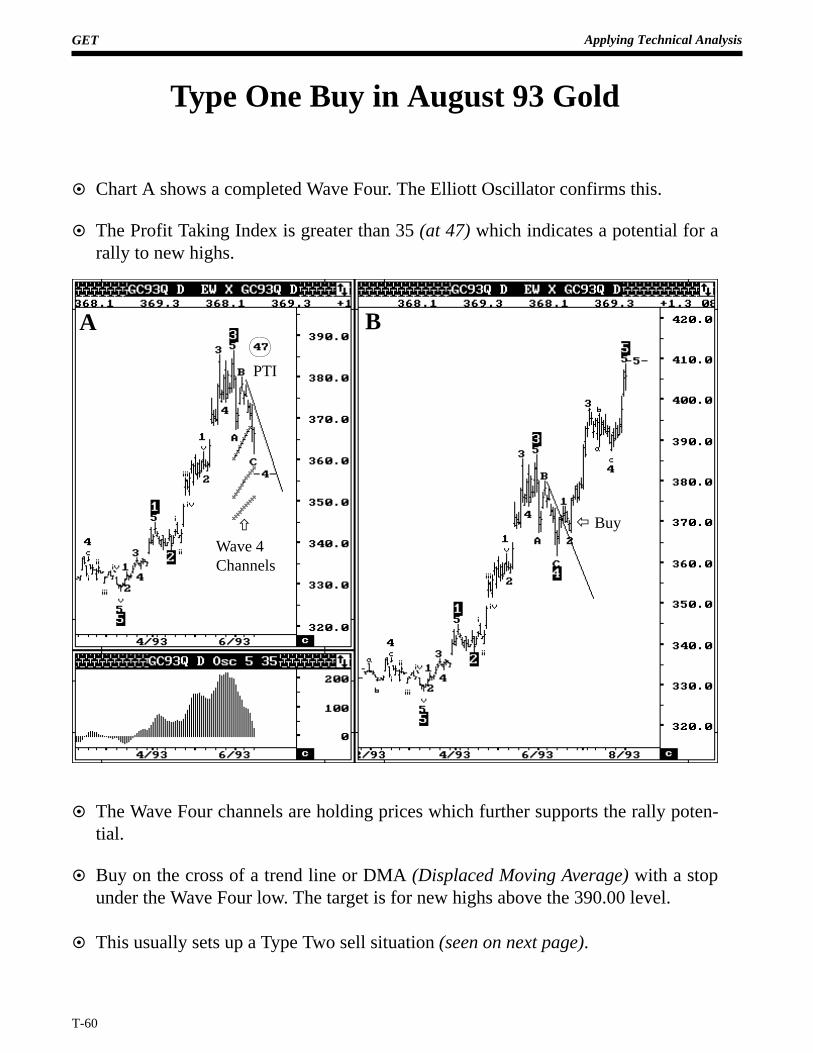
Type One Buy in August 93 Gold
¤ Chart A shows a completed Wave Four. The Elliott Oscillator confirms this.
¤ The Profit Taking Index is greater than 35 (at 47) which indicates a potential for arally to new highs.
¤ The Wave Four channels are holding prices which further supports the rally poten-tial.
¤ Buy on the cross of a trend line or DMA (Displaced Moving Average) with a stopunder the Wave Four low. The target is for new highs above the 390.00 level.
¤ This usually sets up a Type Two sell situation (seen on next page).
A B
Wave 4Channels
ñ
PTI
ï Buy
GET Applying Technical Analysis
T-61
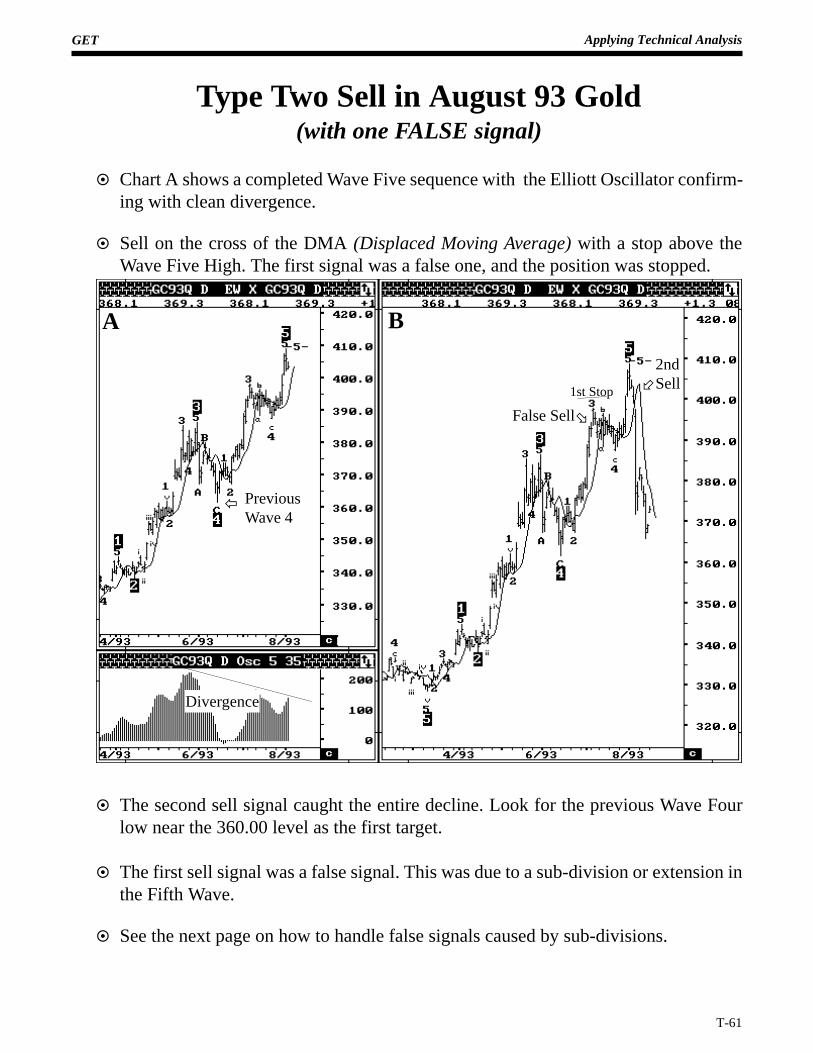
Type Two Sell in August 93 Gold(with one FALSE signal)
¤ Chart A shows a completed Wave Five sequence with the Elliott Oscillator confirm-ing with clean divergence.
¤ Sell on the cross of the DMA (Displaced Moving Average) with a stop above theWave Five High. The first signal was a false one, and the position was stopped.
¤ The second sell signal caught the entire decline. Look for the previous Wave Fourlow near the 360.00 level as the first target.
¤ The first sell signal was a false signal. This was due to a sub-division or extension inthe Fifth Wave.
¤ See the next page on how to handle false signals caused by sub-divisions.
A B
÷2ndSell
ï PreviousWave 4
øFalse Sell
1st Stop
Divergence
GET Applying Technical Analysis
T-62
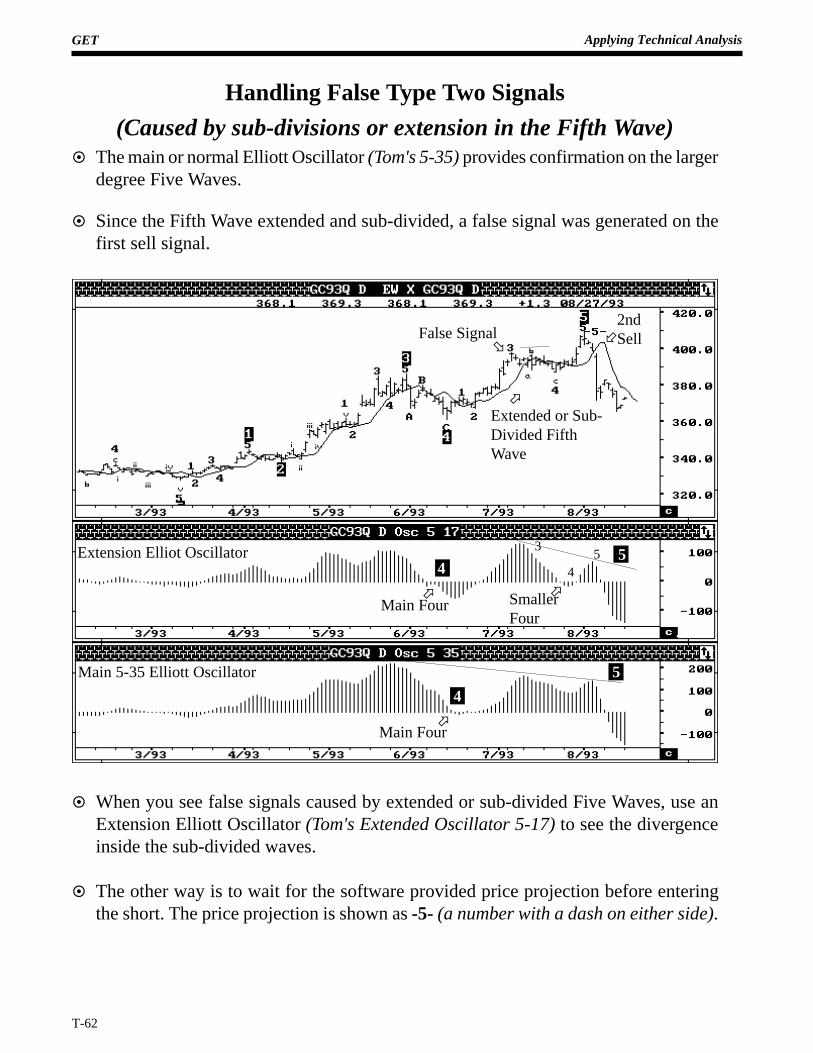
Handling False Type Two Signals
(Caused by sub-divisions or extension in the Fifth Wave)¤ The main or normal Elliott Oscillator (Tom's 5-35) provides confirmation on the larger
degree Five Waves.
¤ Since the Fifth Wave extended and sub-divided, a false signal was generated on thefirst sell signal.
¤ When you see false signals caused by extended or sub-divided Five Waves, use anExtension Elliott Oscillator (Tom's Extended Oscillator 5-17) to see the divergenceinside the sub-divided waves.
¤ The other way is to wait for the software provided price projection before enteringthe short. The price projection is shown as -5- (a number with a dash on either side).
Main 5-35 Elliott Oscillator
Extension Elliot Oscillator
Main Four
Main Four
SmallerFour
45
3
False Signal2ndSell÷
ø
öExtended or Sub-Divided FifthWave
ö
ö ö
4
4
5
5
GET Applying Technical Analysis
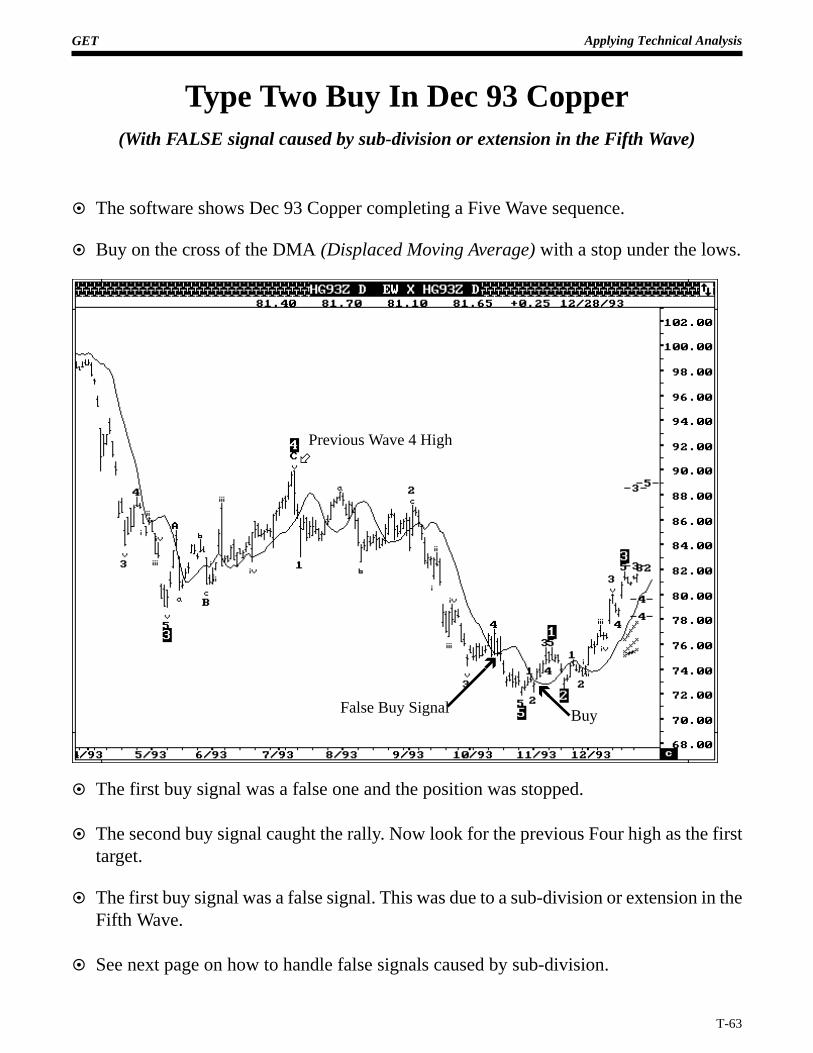
T-63
Type Two Buy In Dec 93 Copper(With FALSE signal caused by sub-division or extension in the Fifth Wave)
¤ The software shows Dec 93 Copper completing a Five Wave sequence.
¤ Buy on the cross of the DMA (Displaced Moving Average) with a stop under the lows.
¤ The first buy signal was a false one and the position was stopped.
¤ The second buy signal caught the rally. Now look for the previous Four high as the firsttarget.
¤ The first buy signal was a false signal. This was due to a sub-division or extension in theFifth Wave.
¤ See next page on how to handle false signals caused by sub-division.
Previous Wave 4 High÷
ì
ëFalse Buy Signal Buy
GET Applying Technical Analysis
T-64
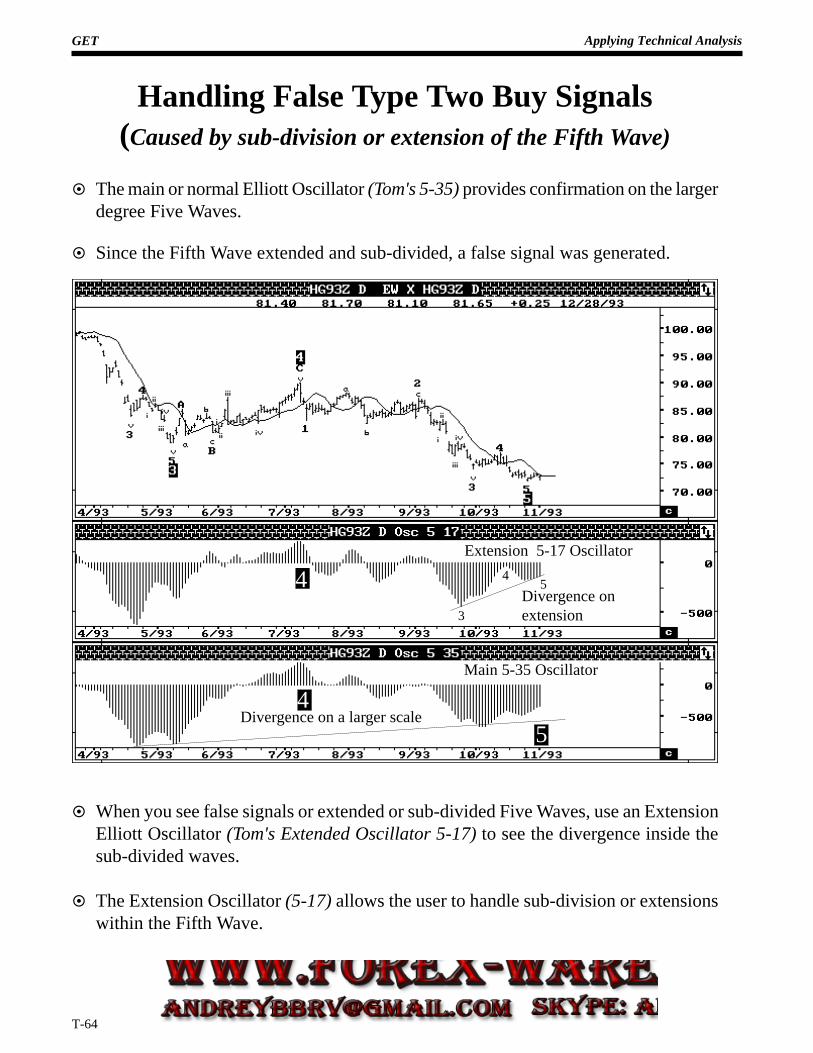
Divergence on a larger scale
Main 5-35 Oscillator
Extension 5-17 Oscillator
Divergence onextension
5
Handling False Type Two Buy Signals(Caused by sub-division or extension of the Fifth Wave)
¤ The main or normal Elliott Oscillator (Tom's 5-35) provides confirmation on the largerdegree Five Waves.
¤ Since the Fifth Wave extended and sub-divided, a false signal was generated.
¤ When you see false signals or extended or sub-divided Five Waves, use an ExtensionElliott Oscillator (Tom's Extended Oscillator 5-17) to see the divergence inside thesub-divided waves.
¤ The Extension Oscillator (5-17) allows the user to handle sub-division or extensionswithin the Fifth Wave.
4
4
3
45
GET Applying Technical Analysis
T-65
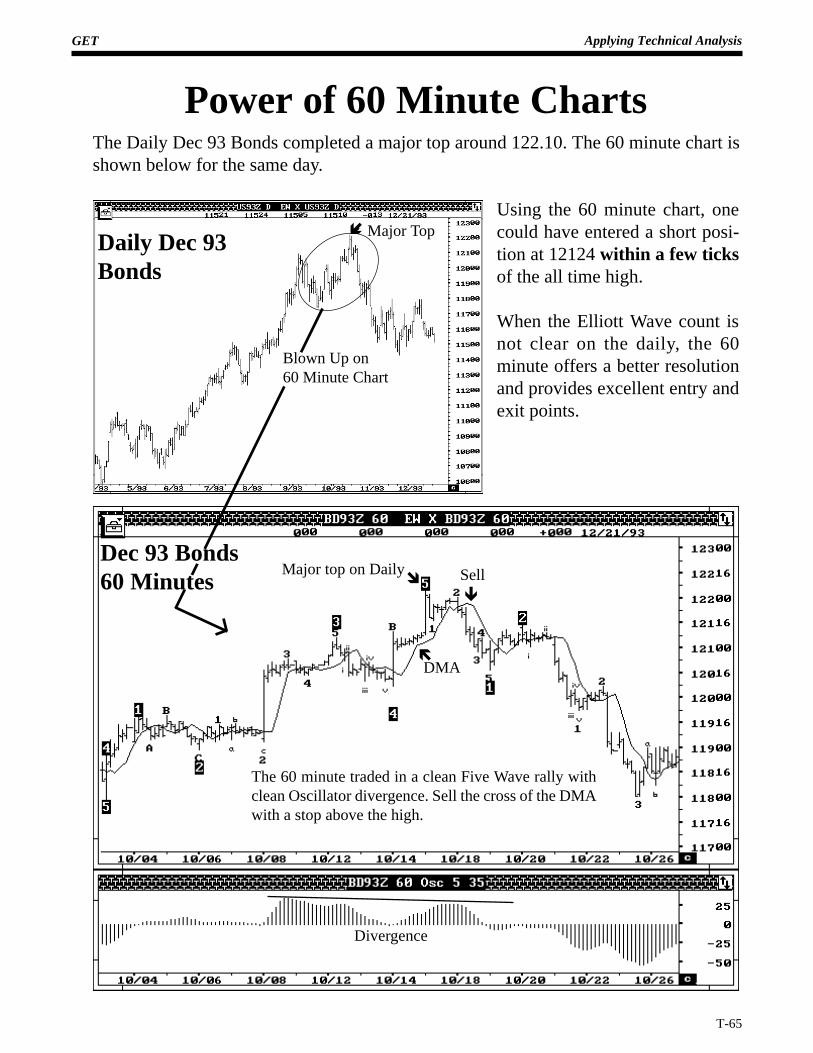
Power of 60 Minute Charts
í Major TopDaily Dec 93Bonds
îMajor top on Daily
êSell
DMAë
The 60 minute traded in a clean Five Wave rally withclean Oscillator divergence. Sell the cross of the DMAwith a stop above the high.
Divergence
Dec 93 Bonds60 Minutes
Blown Up on60 Minute Chart
The Daily Dec 93 Bonds completed a major top around 122.10. The 60 minute chart isshown below for the same day.
Using the 60 minute chart, onecould have entered a short posi-tion at 12124 within a few ticksof the all time high.
When the Elliott Wave count isnot clear on the daily, the 60minute offers a better resolutionand provides excellent entry andexit points.
GET Applying Technical Analysis
T-66
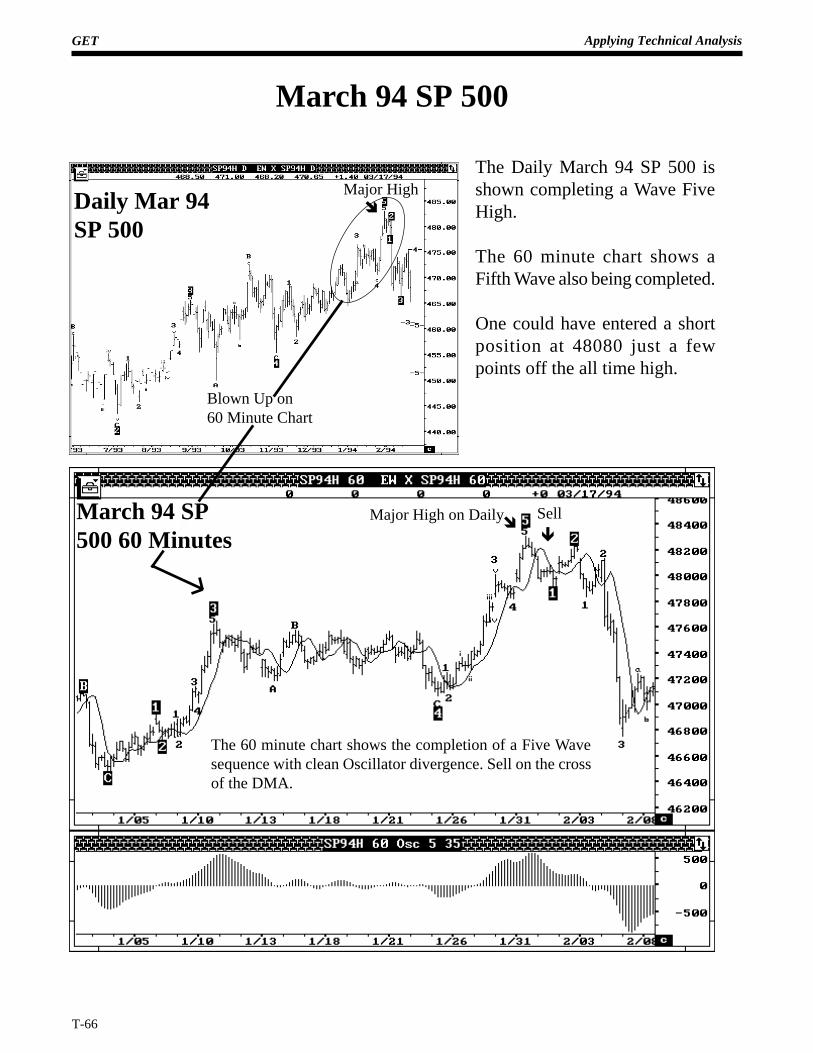
March 94 SP 500
The Daily March 94 SP 500 isshown completing a Wave FiveHigh.
The 60 minute chart shows aFifth Wave also being completed.
One could have entered a shortposition at 48080 just a fewpoints off the all time high.
Major HighDaily Mar 94SP 500
ê
SellîMajor High on Daily
î
Blown Up on60 Minute Chart
The 60 minute chart shows the completion of a Five Wavesequence with clean Oscillator divergence. Sell on the crossof the DMA.
March 94 SP500 60 Minutes
GET Applying Technical Analysis
T-67
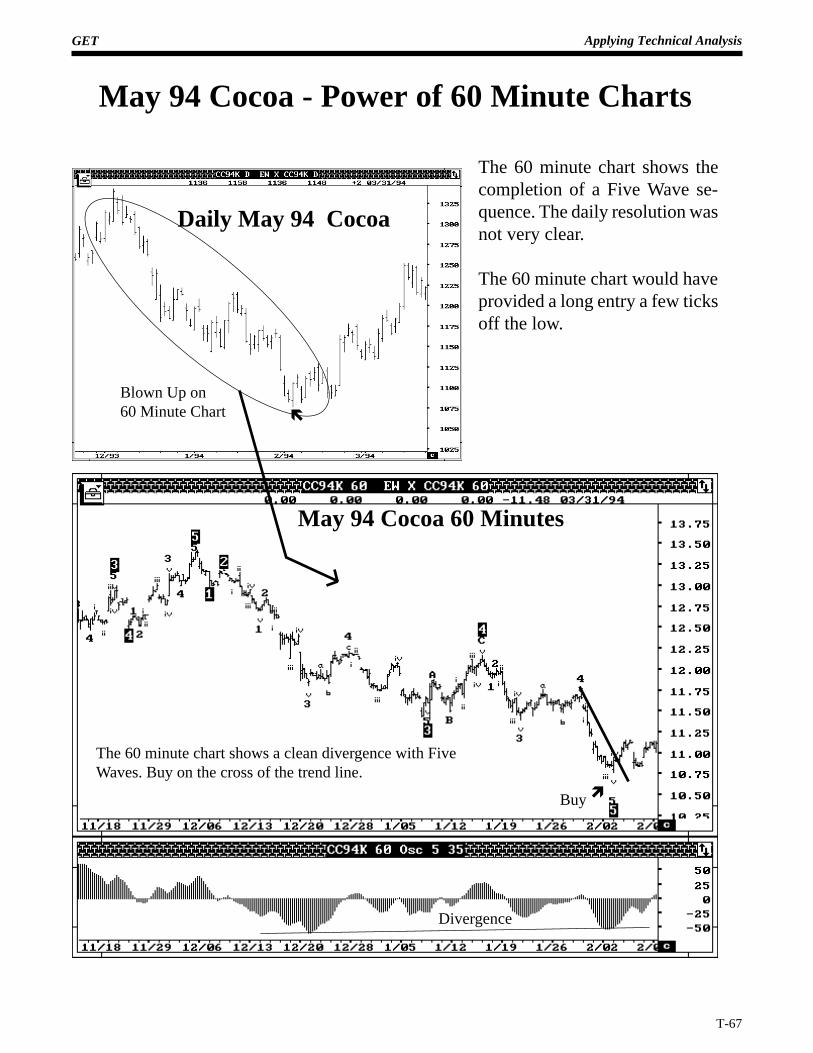
May 94 Cocoa - Power of 60 Minute Charts
The 60 minute chart shows thecompletion of a Five Wave se-quence. The daily resolution wasnot very clear.
The 60 minute chart would haveprovided a long entry a few ticksoff the low.
Daily May 94 Cocoa
ìBuy
May 94 Cocoa 60 Minutes
Blown Up on60 Minute Chart
The 60 minute chart shows a clean divergence with FiveWaves. Buy on the cross of the trend line.
ë
Divergence
GET Applying Technical Analysis
T-68
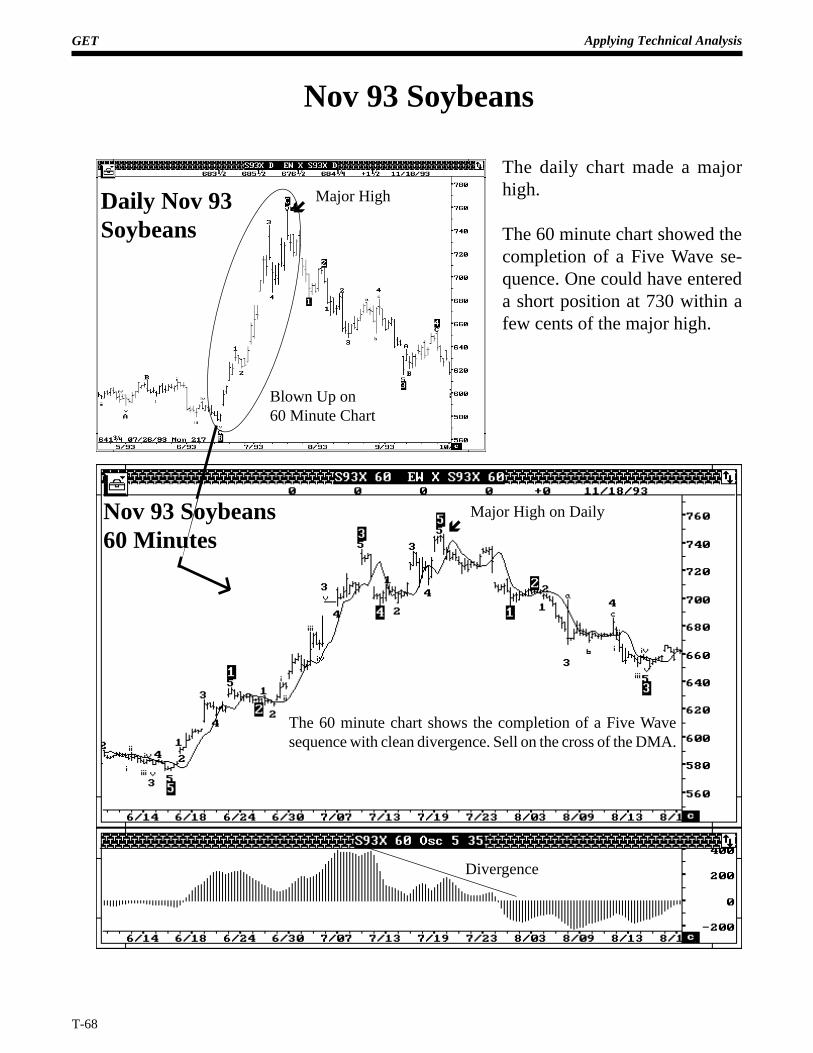
Nov 93 Soybeans
The daily chart made a majorhigh.
The 60 minute chart showed thecompletion of a Five Wave se-quence. One could have entereda short position at 730 within afew cents of the major high.
Daily Nov 93Soybeans
Major Highí
Blown Up on60 Minute Chart
Nov 93 Soybeans60 Minutes
Major High on Dailyí
The 60 minute chart shows the completion of a Five Wavesequence with clean divergence. Sell on the cross of the DMA.
Divergence
GET Applying Technical Analysis
T-69
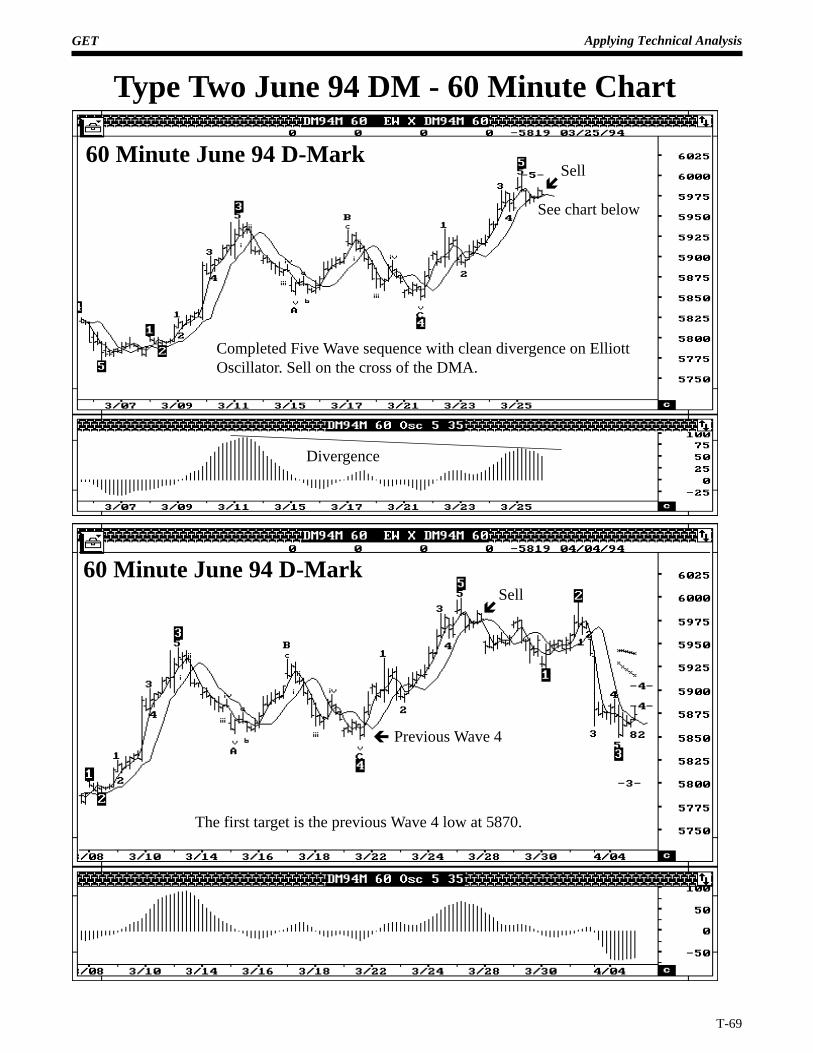
Type Two June 94 DM - 60 Minute Chart
Completed Five Wave sequence with clean divergence on ElliottOscillator. Sell on the cross of the DMA.
Divergence
íSell
60 Minute June 94 D-Mark
60 Minute June 94 D-Mark
ç Previous Wave 4
The first target is the previous Wave 4 low at 5870.
See chart below
íSell
GET Applying Technical Analysis
T-70
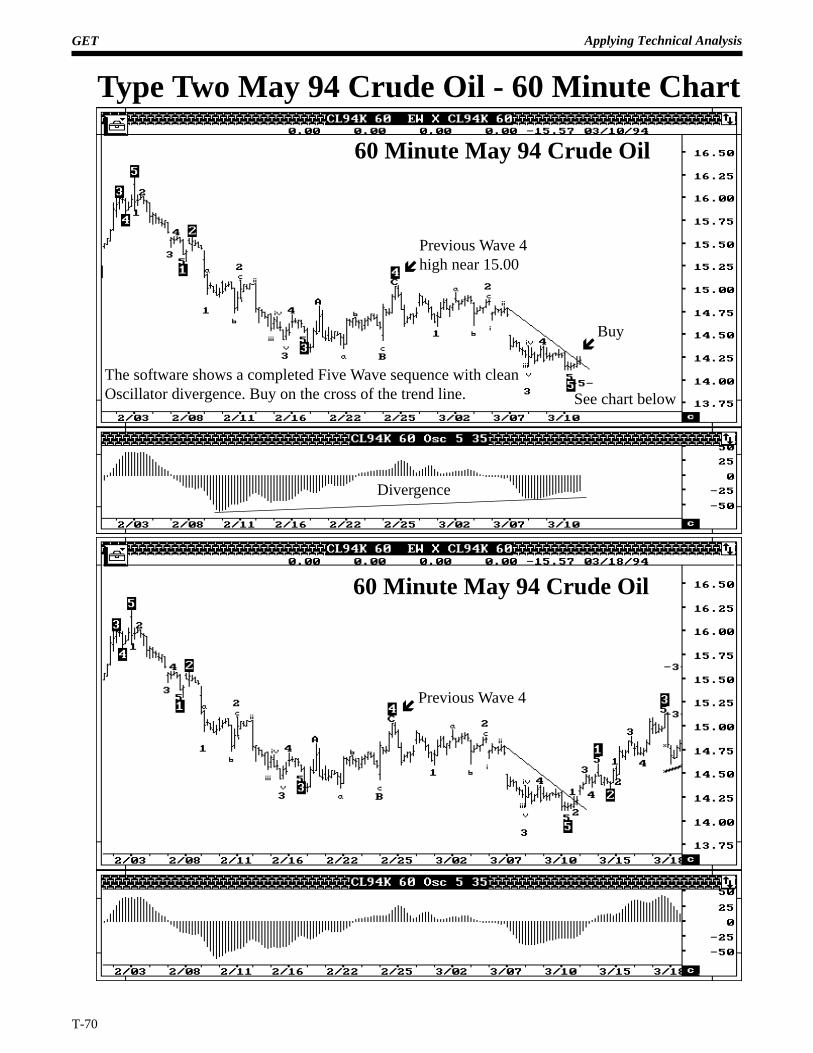
Type Two May 94 Crude Oil - 60 Minute Chart
60 Minute May 94 Crude Oil
60 Minute May 94 Crude Oil
Divergence
The software shows a completed Five Wave sequence with cleanOscillator divergence. Buy on the cross of the trend line.
íBuy
íPrevious Wave 4high near 15.00
íPrevious Wave 4
See chart below
GET Applying Technical Analysis
T-71
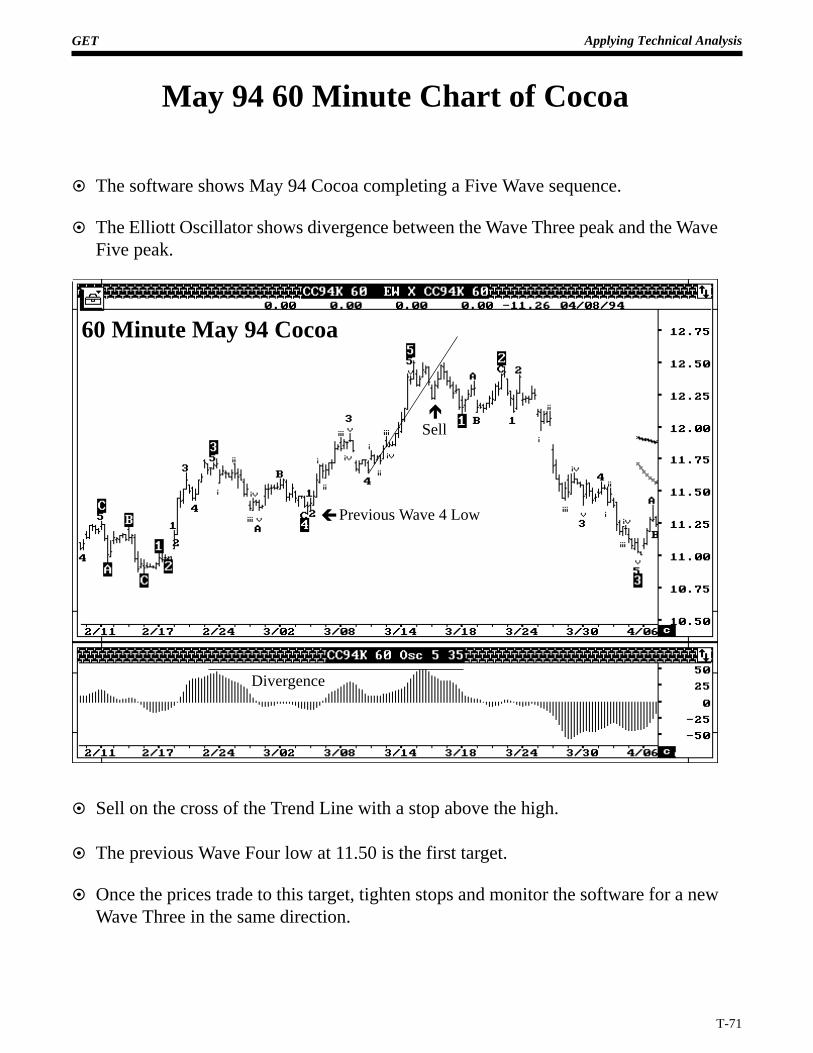
May 94 60 Minute Chart of Cocoa
¤ The software shows May 94 Cocoa completing a Five Wave sequence.
¤ The Elliott Oscillator shows divergence between the Wave Three peak and the WaveFive peak.
¤ Sell on the cross of the Trend Line with a stop above the high.
¤ The previous Wave Four low at 11.50 is the first target.
¤ Once the prices trade to this target, tighten stops and monitor the software for a newWave Three in the same direction.
60 Minute May 94 Cocoa
çPrevious Wave 4 Low
Divergence
éSell
GET Applying Technical Analysis
T-72
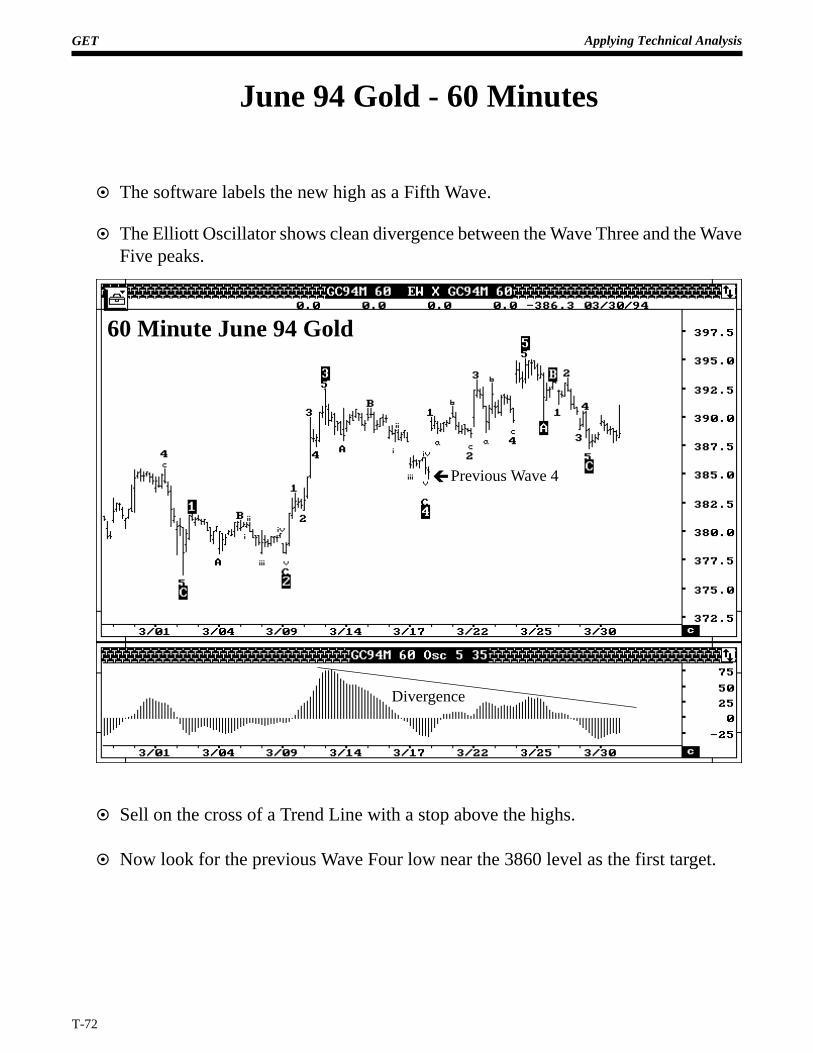
June 94 Gold - 60 Minutes
¤ The software labels the new high as a Fifth Wave.
¤ The Elliott Oscillator shows clean divergence between the Wave Three and the WaveFive peaks.
¤ Sell on the cross of a Trend Line with a stop above the highs.
¤ Now look for the previous Wave Four low near the 3860 level as the first target.
Divergence
çPrevious Wave 4
60 Minute June 94 Gold
GET Applying Technical Analysis
T-73
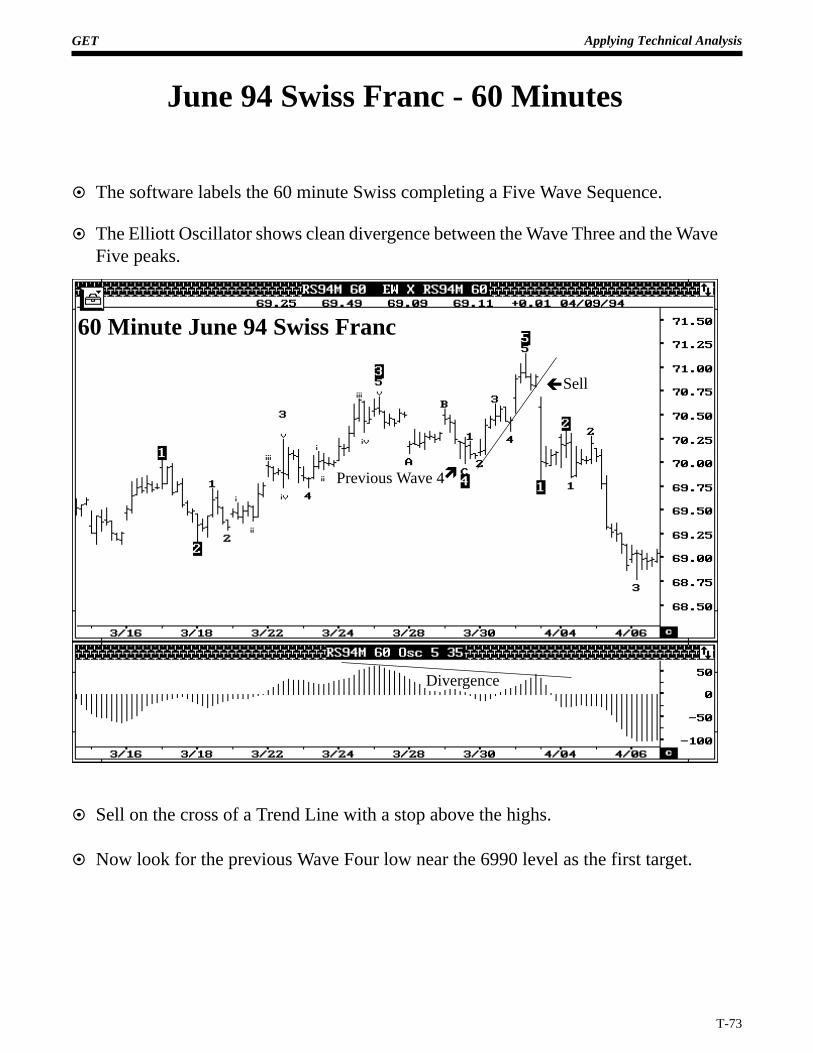
June 94 Swiss Franc - 60 Minutes
¤ The software labels the 60 minute Swiss completing a Five Wave Sequence.
¤ The Elliott Oscillator shows clean divergence between the Wave Three and the WaveFive peaks.
¤ Sell on the cross of a Trend Line with a stop above the highs.
¤ Now look for the previous Wave Four low near the 6990 level as the first target.
60 Minute June 94 Swiss Franc
ì
çSell
Previous Wave 4
Divergence
GET Applying Technical Analysis
T-74
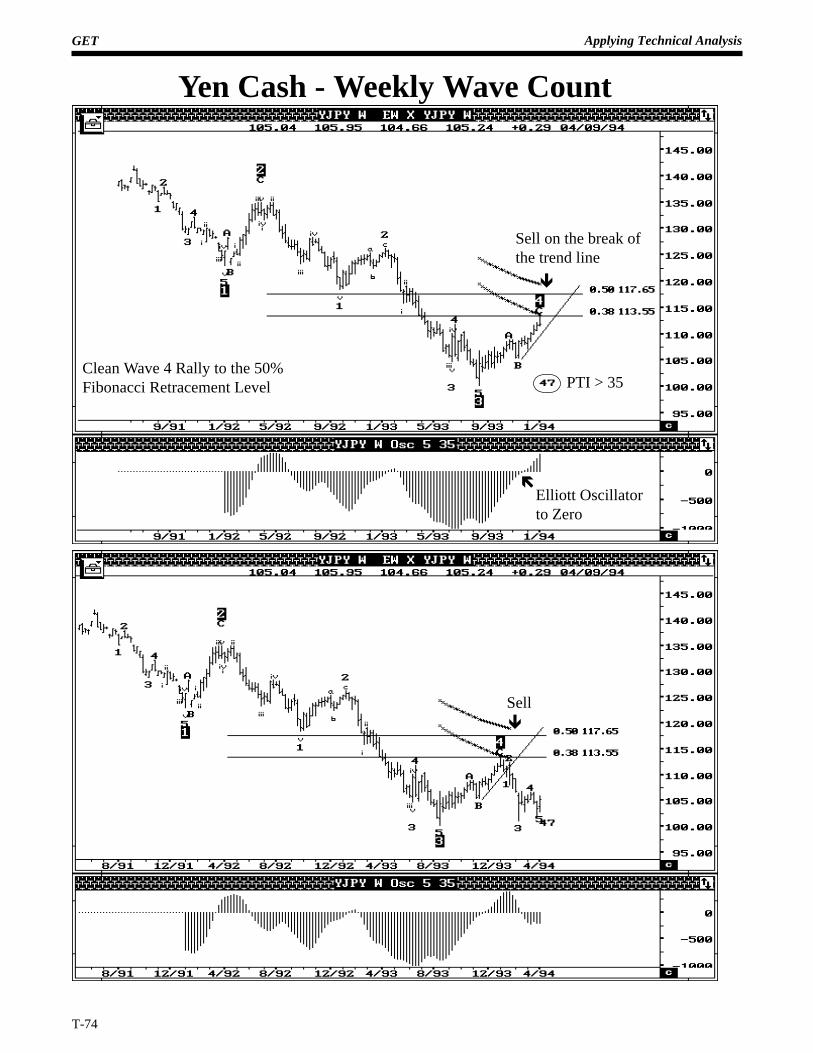
Yen Cash - Weekly Wave Count
Clean Wave 4 Rally to the 50%Fibonacci Retracement Level
ê
Sell on the break ofthe trend line
PTI > 35
ëElliott Oscillatorto Zero
êSell
GET Applying Technical Analysis
T-75
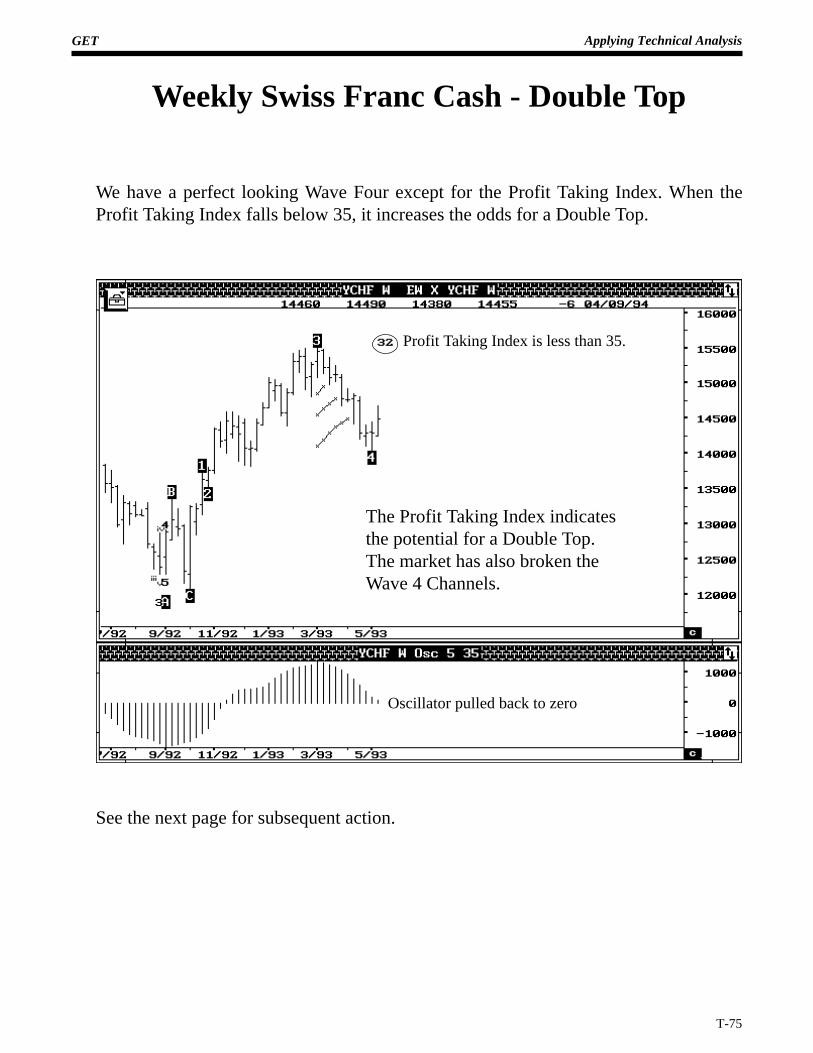
Weekly Swiss Franc Cash - Double Top
We have a perfect looking Wave Four except for the Profit Taking Index. When theProfit Taking Index falls below 35, it increases the odds for a Double Top.
See the next page for subsequent action.
Profit Taking Index is less than 35.
The Profit Taking Index indicatesthe potential for a Double Top.The market has also broken theWave 4 Channels.
Oscillator pulled back to zero
GET Applying Technical Analysis
T-76
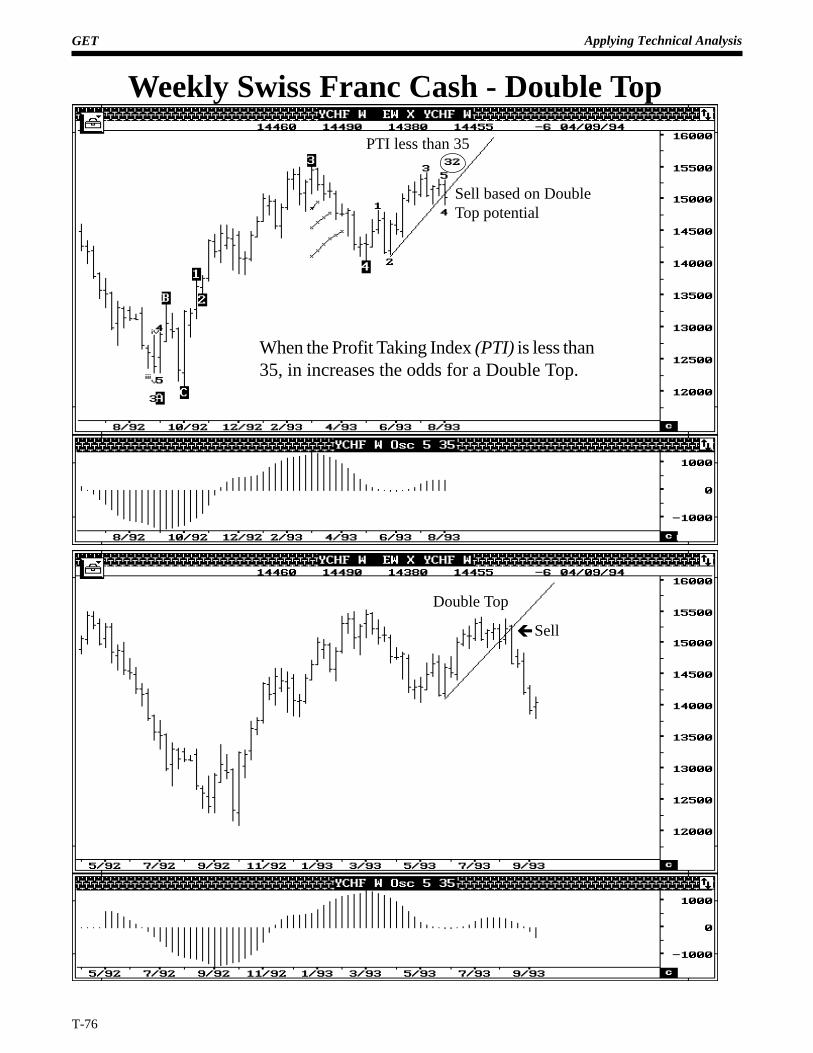
Weekly Swiss Franc Cash - Double Top
PTI less than 35
Sell based on DoubleTop potential
Double Top
çSell
When the Profit Taking Index (PTI) is less than35, in increases the odds for a Double Top.
GET Applying Technical Analysis
T-77
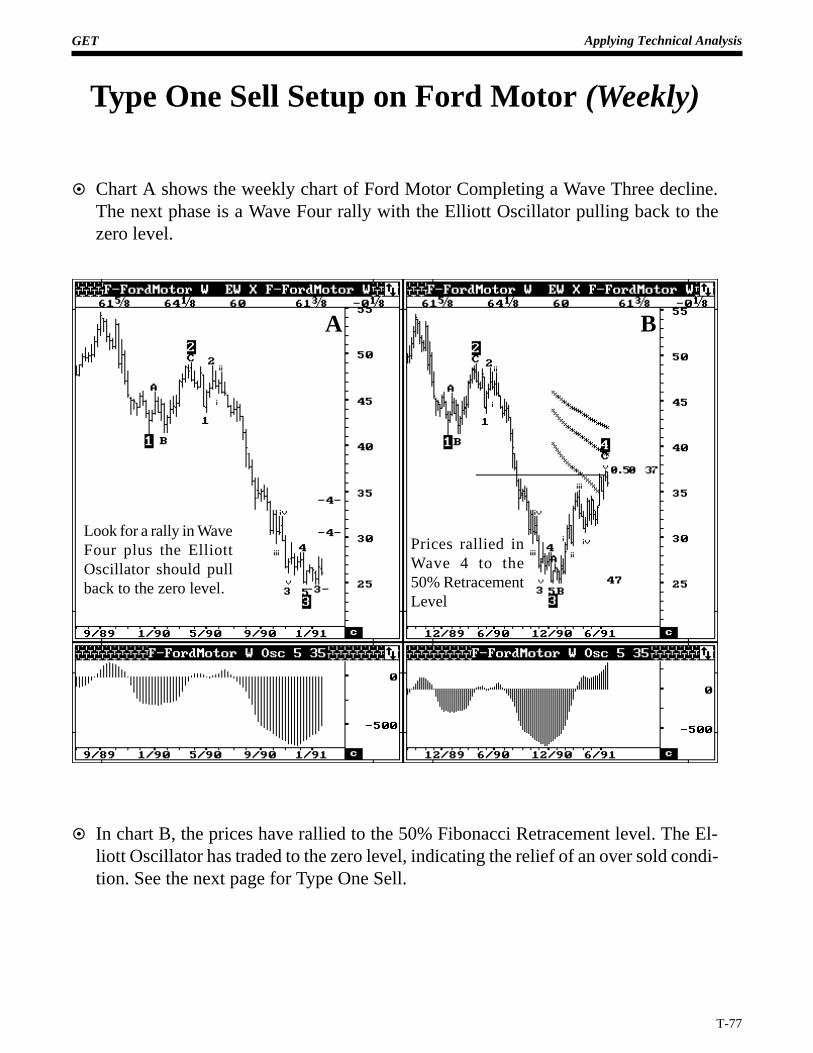
Type One Sell Setup on Ford Motor (Weekly)
¤ Chart A shows the weekly chart of Ford Motor Completing a Wave Three decline.The next phase is a Wave Four rally with the Elliott Oscillator pulling back to thezero level.
¤ In chart B, the prices have rallied to the 50% Fibonacci Retracement level. The El-liott Oscillator has traded to the zero level, indicating the relief of an over sold condi-tion. See the next page for Type One Sell.
Look for a rally in WaveFour plus the ElliottOscillator should pullback to the zero level.
BA
Prices rallied inWave 4 to the50% RetracementLevel
GET Applying Technical Analysis
T-78
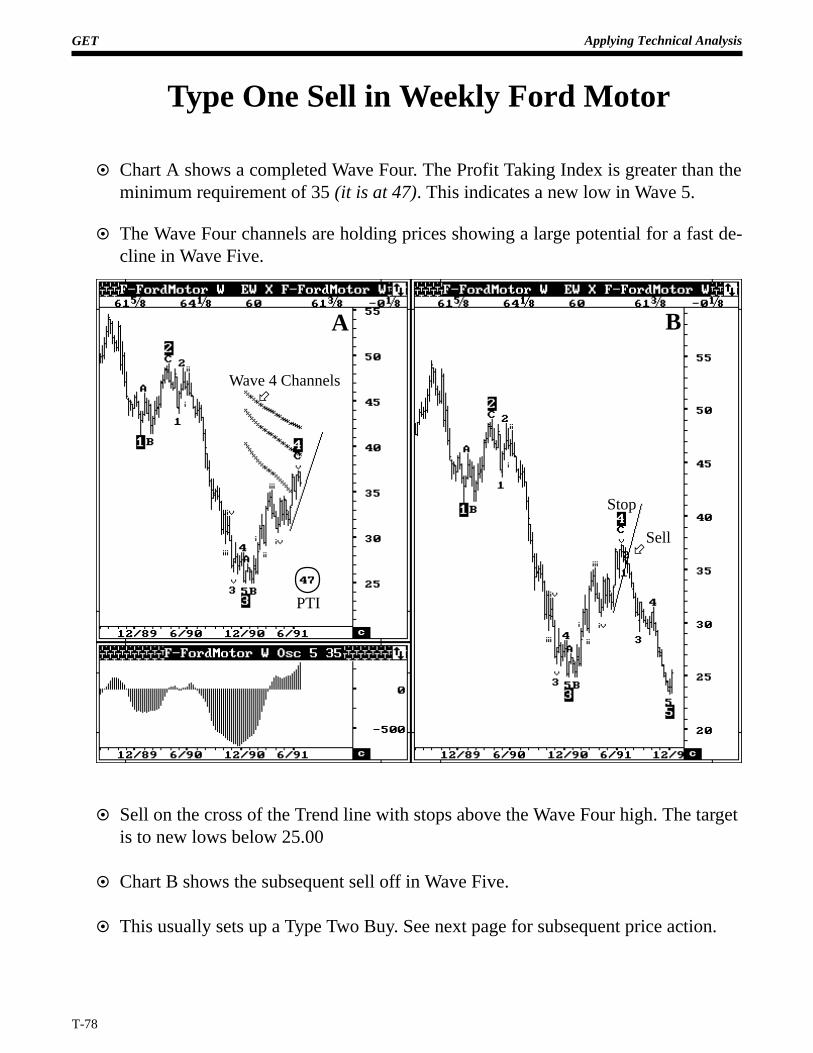
Type One Sell in Weekly Ford Motor
¤ Chart A shows a completed Wave Four. The Profit Taking Index is greater than theminimum requirement of 35 (it is at 47). This indicates a new low in Wave 5.
¤ The Wave Four channels are holding prices showing a large potential for a fast de-cline in Wave Five.
¤ Sell on the cross of the Trend line with stops above the Wave Four high. The targetis to new lows below 25.00
¤ Chart B shows the subsequent sell off in Wave Five.
¤ This usually sets up a Type Two Buy. See next page for subsequent price action.
A B
÷Sell
÷Wave 4 Channels
PTI
Stop
GET Applying Technical Analysis
T-79
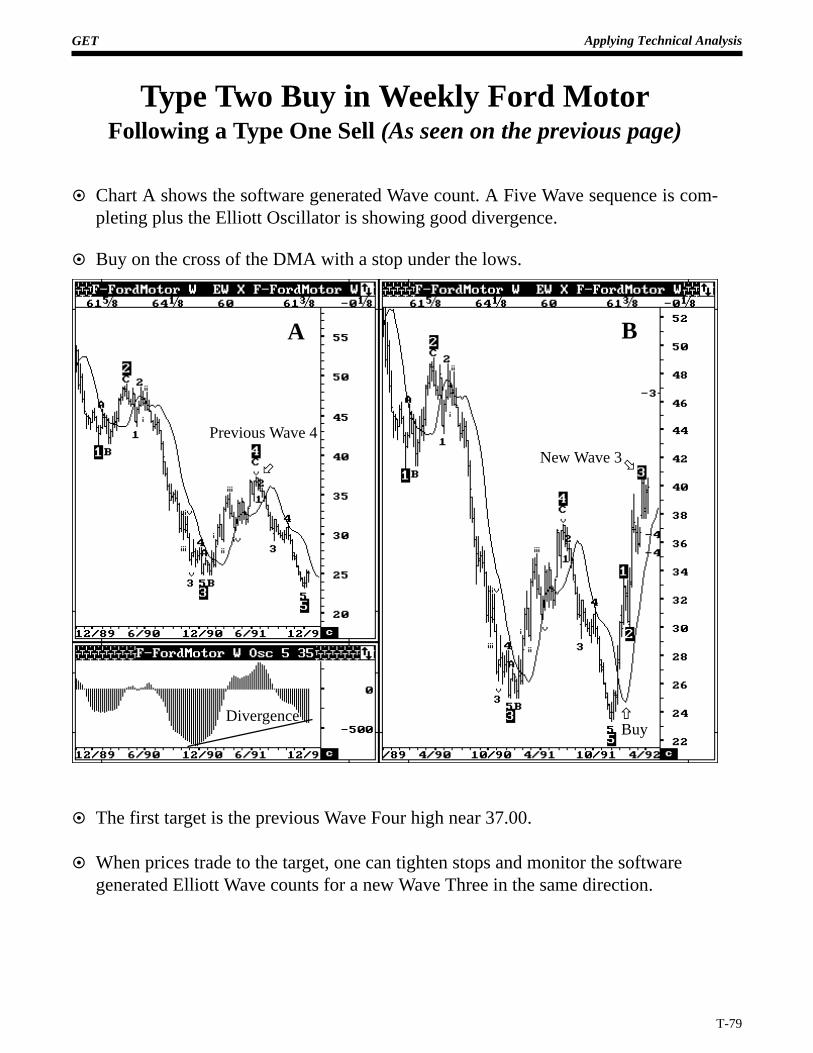
Type Two Buy in Weekly Ford MotorFollowing a Type One Sell (As seen on the previous page)
¤ Chart A shows the software generated Wave count. A Five Wave sequence is com-pleting plus the Elliott Oscillator is showing good divergence.
¤ Buy on the cross of the DMA with a stop under the lows.
¤ The first target is the previous Wave Four high near 37.00.
¤ When prices trade to the target, one can tighten stops and monitor the softwaregenerated Elliott Wave counts for a new Wave Three in the same direction.
A B
÷
Previous Wave 4
BuyñDivergence
øNew Wave 3
GET Applying Technical Analysis
T-80
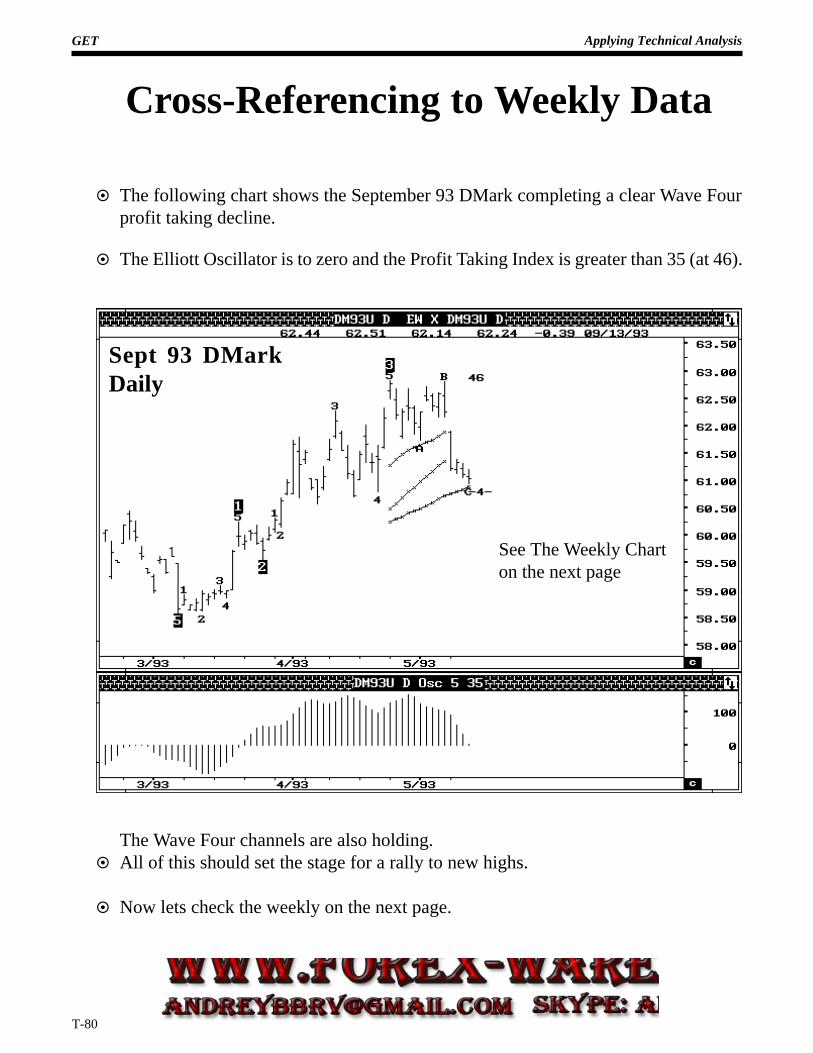
Cross-Referencing to Weekly Data
¤ The following chart shows the September 93 DMark completing a clear Wave Fourprofit taking decline.
¤ The Elliott Oscillator is to zero and the Profit Taking Index is greater than 35 (at 46).
The Wave Four channels are also holding.¤ All of this should set the stage for a rally to new highs.
¤ Now lets check the weekly on the next page.
Sept 93 DMarkDaily
See The Weekly Charton the next page
GET Applying Technical Analysis
T-81
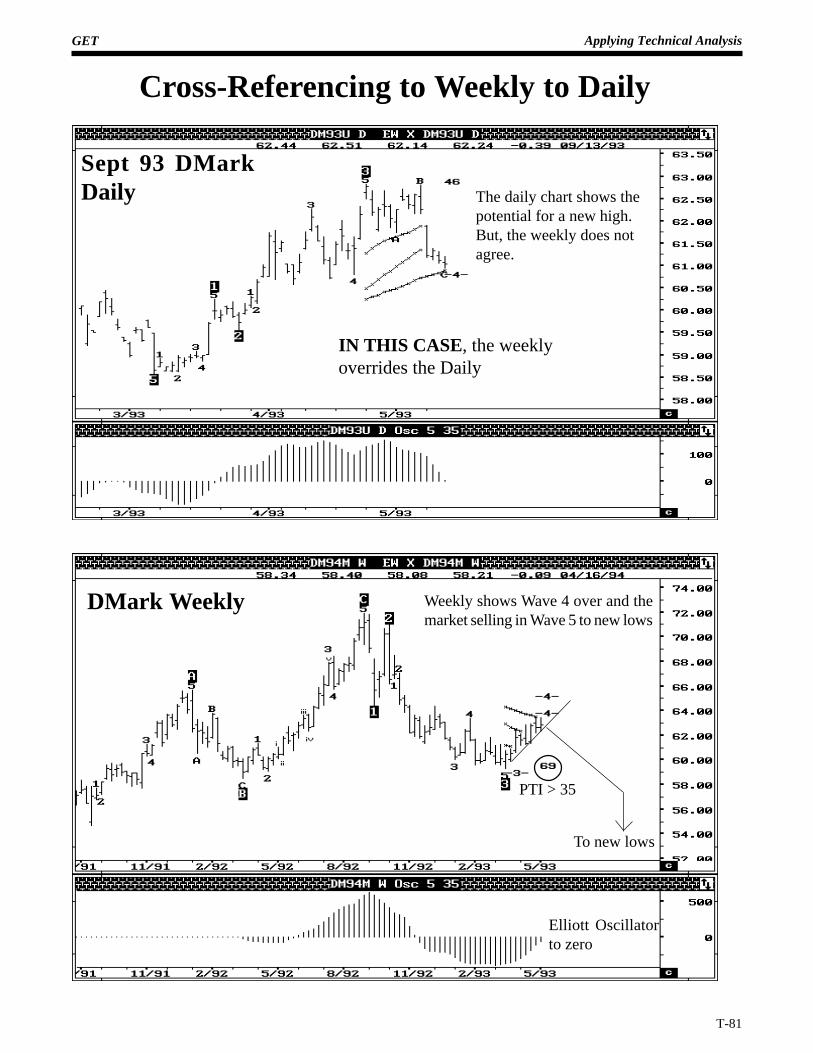
Sept 93 DMarkDaily
DMark Weekly
The daily chart shows thepotential for a new high.But, the weekly does notagree.
IN THIS CASE , the weeklyoverrides the Daily
Weekly shows Wave 4 over and themarket selling in Wave 5 to new lows
PTI > 35
Elliott Oscillatorto zero
To new lows
Cross-Referencing to Weekly to Daily
GET Applying Technical Analysis
T-82
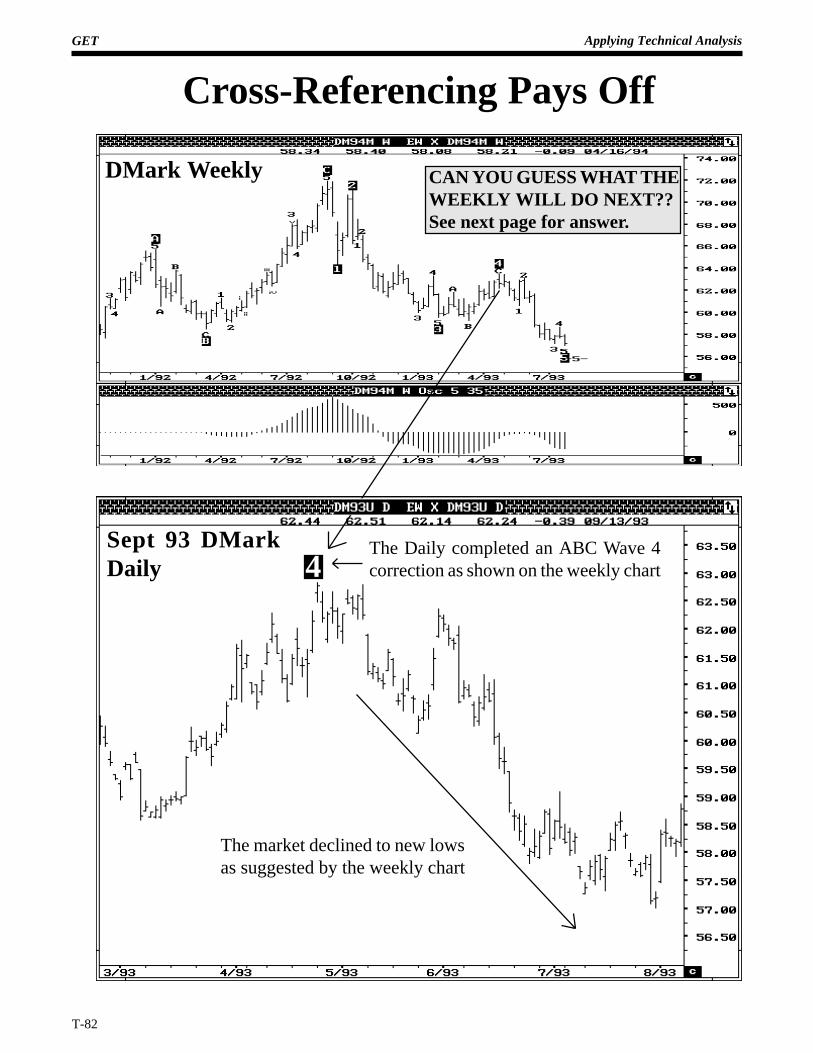
Cross-Referencing Pays Off
CAN YOU GUESS WHAT THEWEEKLY WILL DO NEXT??See next page for answer.
The market declined to new lowsas suggested by the weekly chart
4The Daily completed an ABC Wave 4correction as shown on the weekly chart
Sept 93 DMarkDaily
DMark Weekly
GET Applying Technical Analysis
T-83
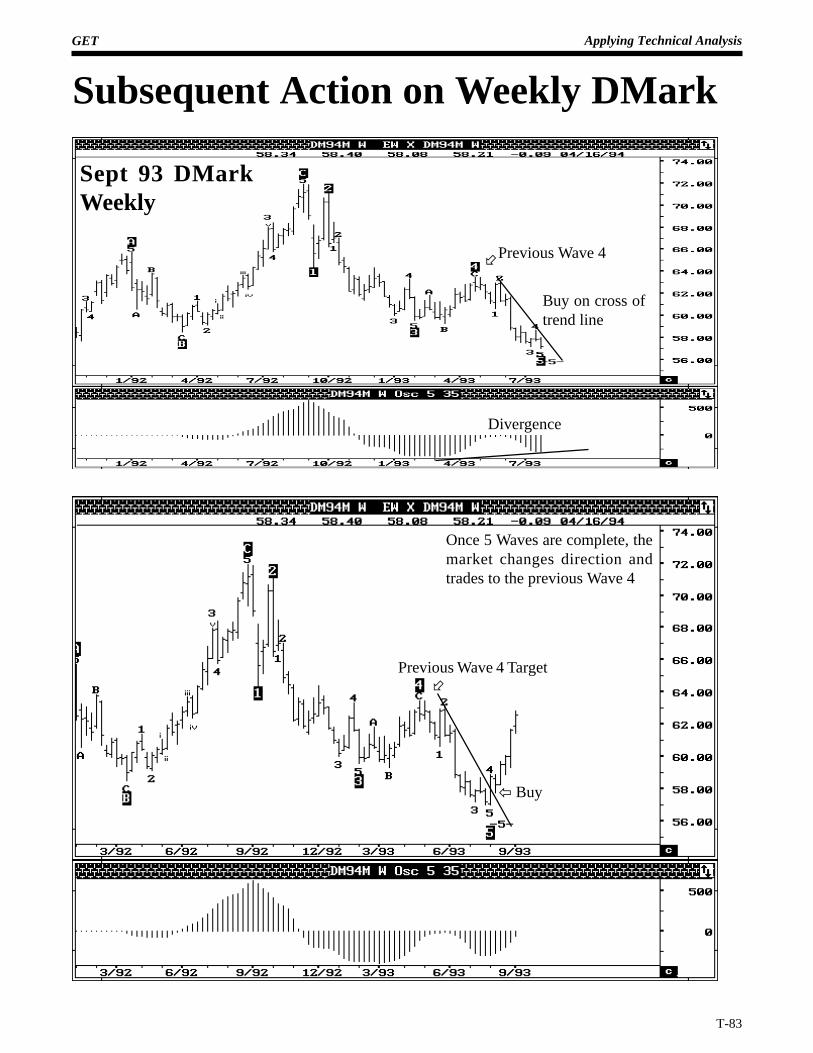
Sept 93 DMarkWeekly
Subsequent Action on Weekly DMark
ï Buy
Buy on cross oftrend line
Divergence
Once 5 Waves are complete, themarket changes direction andtrades to the previous Wave 4
÷
÷Previous Wave 4 Target
Previous Wave 4
GET
T-84
Applying Technical Analysis
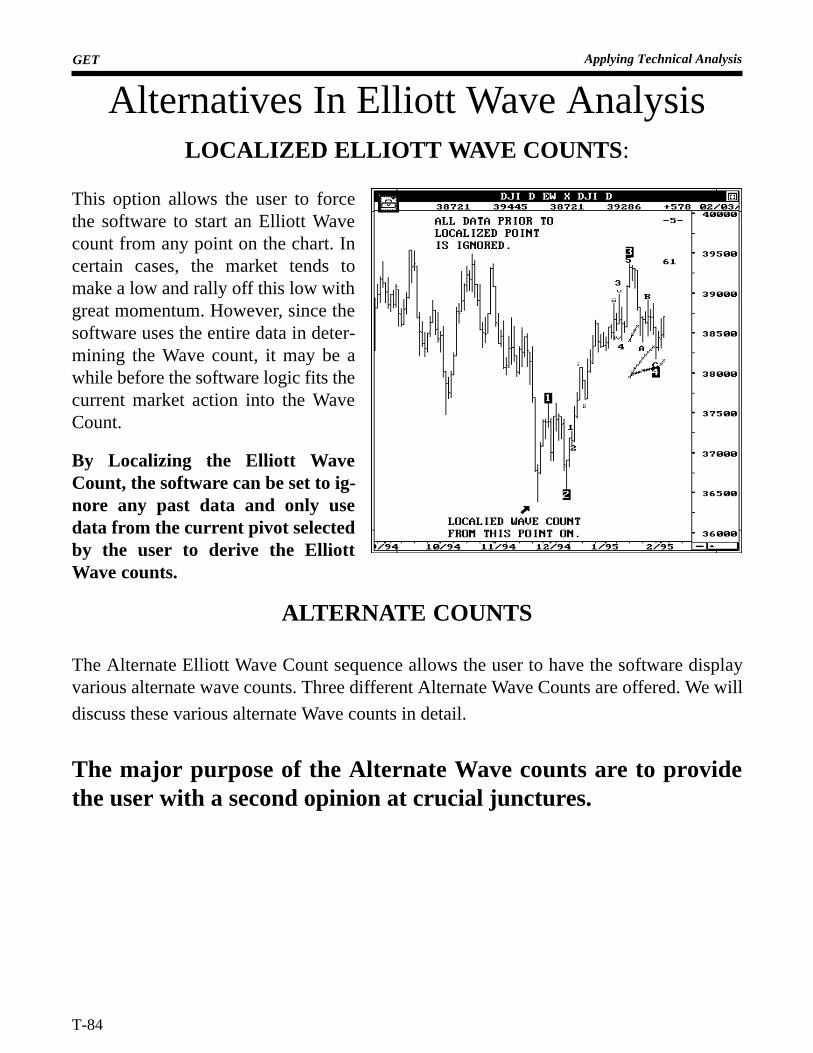
LOCALIZED ELLIOTT WAVE COUNTS :
This option allows the user to forcethe software to start an Elliott Wavecount from any point on the chart. Incertain cases, the market tends tomake a low and rally off this low withgreat momentum. However, since thesoftware uses the entire data in deter-mining the Wave count, it may be awhile before the software logic fits thecurrent market action into the WaveCount.
By Localizing the Elliott WaveCount, the software can be set to ig-nore any past data and only usedata from the current pivot selectedby the user to derive the ElliottWave counts.
ALTERNATE COUNTS
The Alternate Elliott Wave Count sequence allows the user to have the software displayvarious alternate wave counts. Three different Alternate Wave Counts are offered. We will
discuss these various alternate Wave counts in detail.
The major purpose of the Alternate Wave counts are to providethe user with a second opinion at crucial junctures.
Alternatives In Elliott Wave Analysis
Applying Technical Analysis
T-85
GET
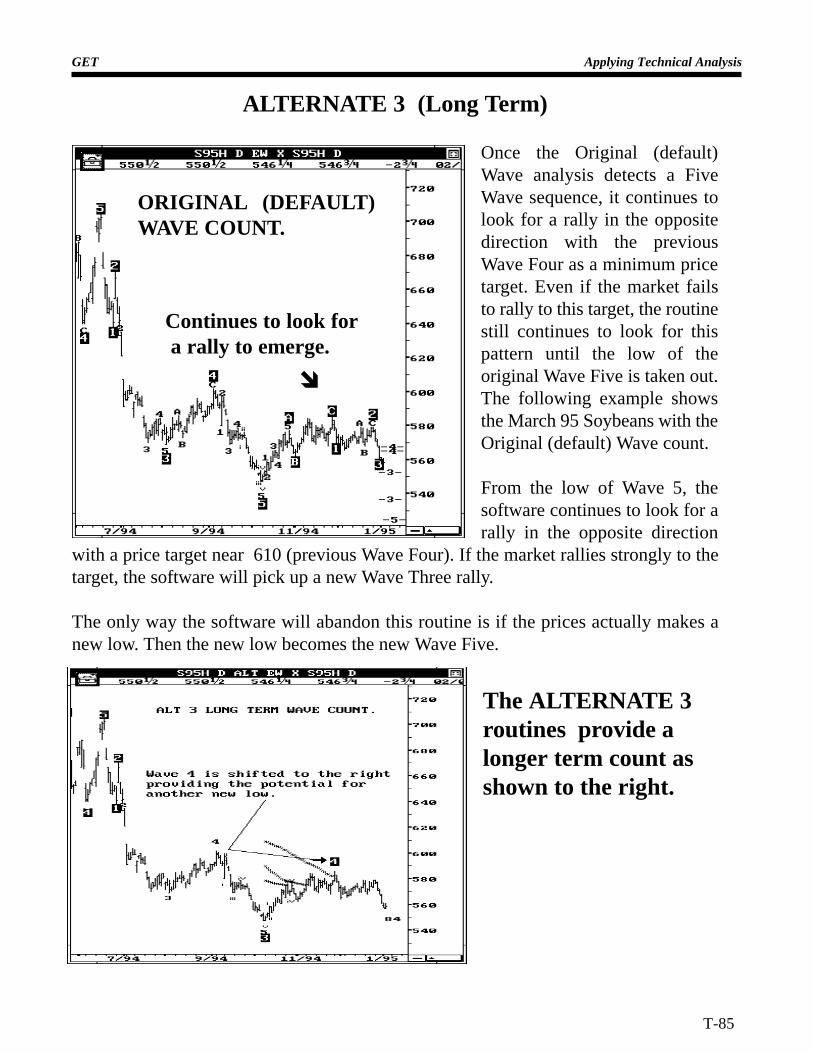
ALTERNATE 3 (Long Term)
Once the Original (default)Wave analysis detects a FiveWave sequence, it continues tolook for a rally in the oppositedirection with the previousWave Four as a minimum pricetarget. Even if the market failsto rally to this target, the routinestill continues to look for thispattern until the low of theoriginal Wave Five is taken out.The following example showsthe March 95 Soybeans with theOriginal (default) Wave count.
From the low of Wave 5, thesoftware continues to look for arally in the opposite direction
with a price target near 610 (previous Wave Four). If the market rallies strongly to thetarget, the software will pick up a new Wave Three rally.
The only way the software will abandon this routine is if the prices actually makes anew low. Then the new low becomes the new Wave Five.
The ALTERNATE 3routines provide alonger term count asshown to the right.
ORIGINAL (DEFAULT)WAVE COUNT.
Continues to look for a rally to emerge.
î
GET
T-86
Applying Technical Analysis
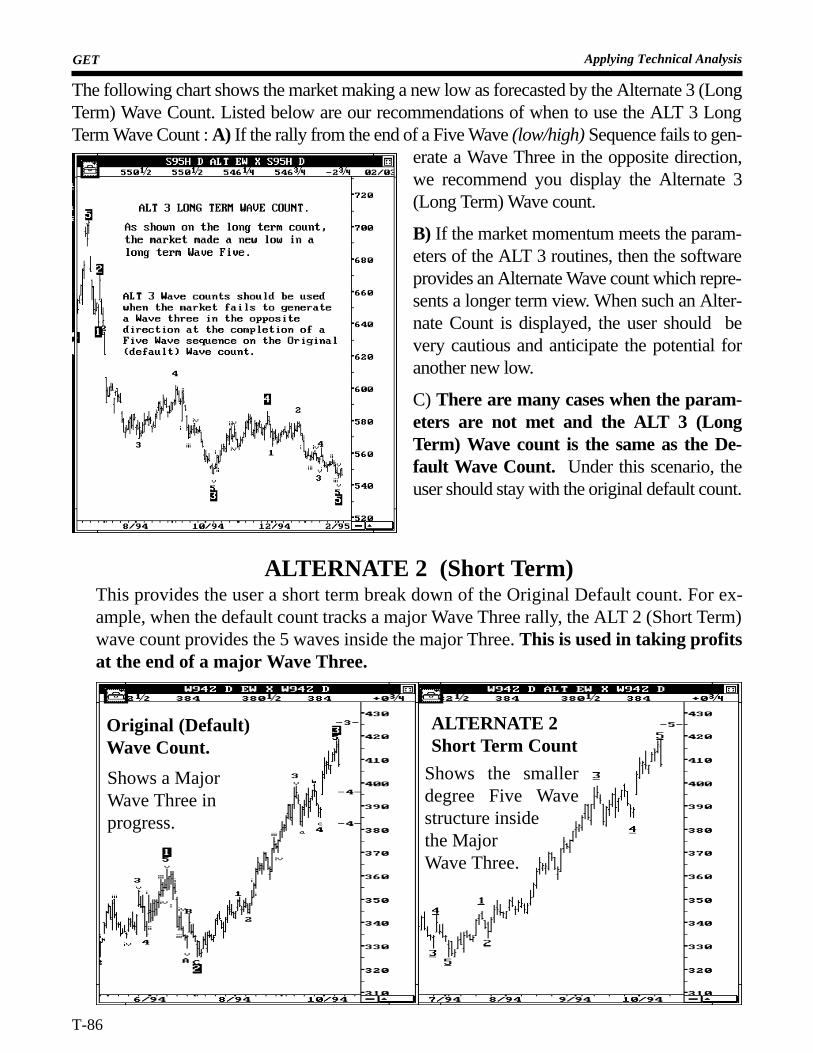
Original (Default)Wave Count.
ALTERNATE 2Short Term Count
Shows a MajorWave Three inprogress.
Shows the smallerdegree Five Wavestructure insidethe MajorWave Three.
The following chart shows the market making a new low as forecasted by the Alternate 3 (LongTerm) Wave Count. Listed below are our recommendations of when to use the ALT 3 LongTerm Wave Count : A) If the rally from the end of a Five Wave (low/high) Sequence fails to gen-
erate a Wave Three in the opposite direction,we recommend you display the Alternate 3(Long Term) Wave count.
B) If the market momentum meets the param-eters of the ALT 3 routines, then the softwareprovides an Alternate Wave count which repre-sents a longer term view. When such an Alter-nate Count is displayed, the user should bevery cautious and anticipate the potential foranother new low.
C) There are many cases when the param-eters are not met and the ALT 3 (LongTerm) Wave count is the same as the De-fault Wave Count. Under this scenario, theuser should stay with the original default count.
ALTERNATE 2 (Short Term)This provides the user a short term break down of the Original Default count. For ex-ample, when the default count tracks a major Wave Three rally, the ALT 2 (Short Term)wave count provides the 5 waves inside the major Three. This is used in taking profitsat the end of a major Wave Three.
Applying Technical Analysis
T-87
GET
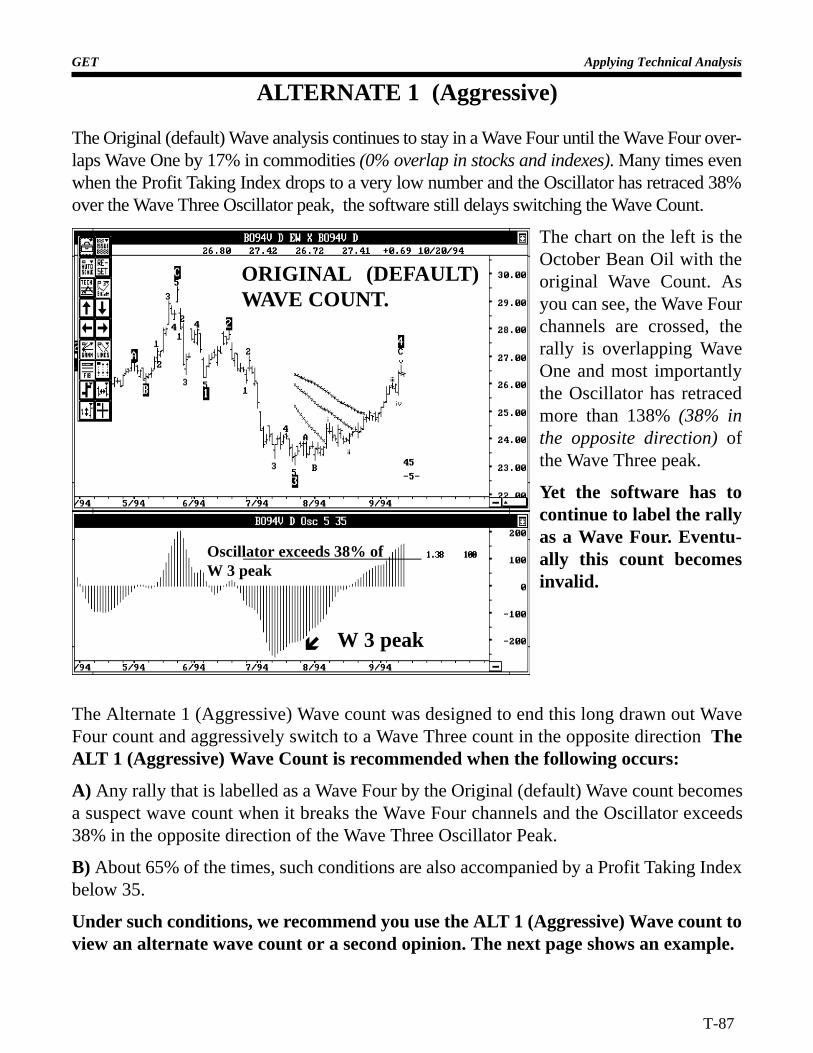
ALTERNATE 1 (Aggressive)
The Original (default) Wave analysis continues to stay in a Wave Four until the Wave Four over-laps Wave One by 17% in commodities (0% overlap in stocks and indexes). Many times evenwhen the Profit Taking Index drops to a very low number and the Oscillator has retraced 38%over the Wave Three Oscillator peak, the software still delays switching the Wave Count.
The chart on the left is theOctober Bean Oil with theoriginal Wave Count. Asyou can see, the Wave Fourchannels are crossed, therally is overlapping WaveOne and most importantlythe Oscillator has retracedmore than 138% (38% inthe opposite direction) ofthe Wave Three peak.
Yet the software has tocontinue to label the rallyas a Wave Four. Eventu-ally this count becomesinvalid.
W 3 peakí
Oscillator exceeds 38% ofW 3 peak
ORIGINAL (DEFAULT)WAVE COUNT.
The Alternate 1 (Aggressive) Wave count was designed to end this long drawn out WaveFour count and aggressively switch to a Wave Three count in the opposite direction TheALT 1 (Aggressive) Wave Count is recommended when the following occurs:
A) Any rally that is labelled as a Wave Four by the Original (default) Wave count becomesa suspect wave count when it breaks the Wave Four channels and the Oscillator exceeds38% in the opposite direction of the Wave Three Oscillator Peak.
B) About 65% of the times, such conditions are also accompanied by a Profit Taking Indexbelow 35.
Under such conditions, we recommend you use the ALT 1 (Aggressive) Wave count toview an alternate wave count or a second opinion. The next page shows an example.
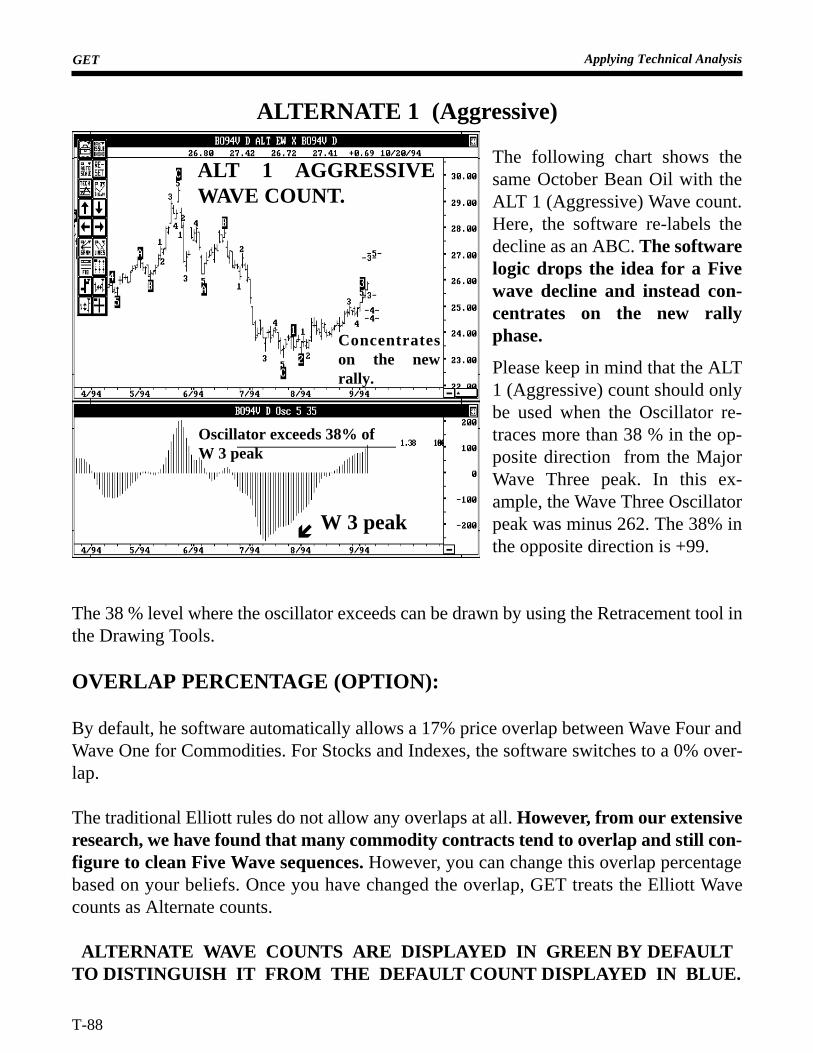
GET
T-88
Applying Technical Analysis
ALTERNATE 1 (Aggressive)
The following chart shows thesame October Bean Oil with theALT 1 (Aggressive) Wave count.Here, the software re-labels thedecline as an ABC. The softwarelogic drops the idea for a Fivewave decline and instead con-centrates on the new rallyphase.
Please keep in mind that the ALT1 (Aggressive) count should onlybe used when the Oscillator re-traces more than 38 % in the op-posite direction from the MajorWave Three peak. In this ex-ample, the Wave Three Oscillatorpeak was minus 262. The 38% inthe opposite direction is +99.
The 38 % level where the oscillator exceeds can be drawn by using the Retracement tool inthe Drawing Tools.
OVERLAP PERCENTAGE (OPTION):
By default, he software automatically allows a 17% price overlap between Wave Four andWave One for Commodities. For Stocks and Indexes, the software switches to a 0% over-lap.
The traditional Elliott rules do not allow any overlaps at all. However, from our extensiveresearch, we have found that many commodity contracts tend to overlap and still con-figure to clean Five Wave sequences. However, you can change this overlap percentagebased on your beliefs. Once you have changed the overlap, GET treats the Elliott Wavecounts as Alternate counts.
ALTERNATE WAVE COUNTS ARE DISPLAYED IN GREEN BY DEFAULTTO DISTINGUISH IT FROM THE DEFAULT COUNT DISPLAYED IN BLUE.
í W 3 peak
Oscillator exceeds 38% ofW 3 peak
ALT 1 AGGRESSIVEWAVE COUNT.
Concentrateson the newrally.
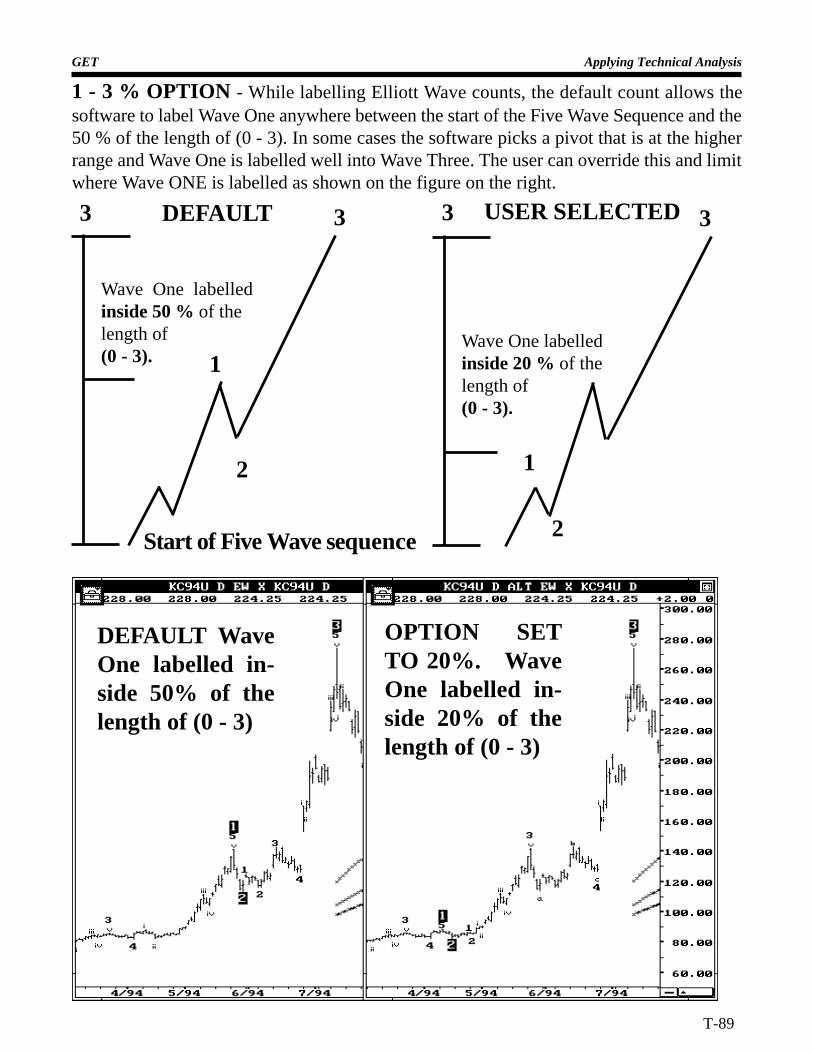
Applying Technical Analysis
T-89
GET
1 - 3 % OPTION - While labelling Elliott Wave counts, the default count allows thesoftware to label Wave One anywhere between the start of the Five Wave Sequence and the50 % of the length of (0 - 3). In some cases the software picks a pivot that is at the higherrange and Wave One is labelled well into Wave Three. The user can override this and limitwhere Wave ONE is labelled as shown on the figure on the right.
2
3
1
Wave One labelledinside 50 % of thelength of(0 - 3).
1
2
3
Wave One labelledinside 20 % of thelength of(0 - 3).
3DEFAULT USER SELECTED3
Start of Five Wave sequence
DEFAULT WaveOne labelled in-side 50% of thelength of (0 - 3)
OPTION SETTO 20%. WaveOne labelled in-side 20% of thelength of (0 - 3)
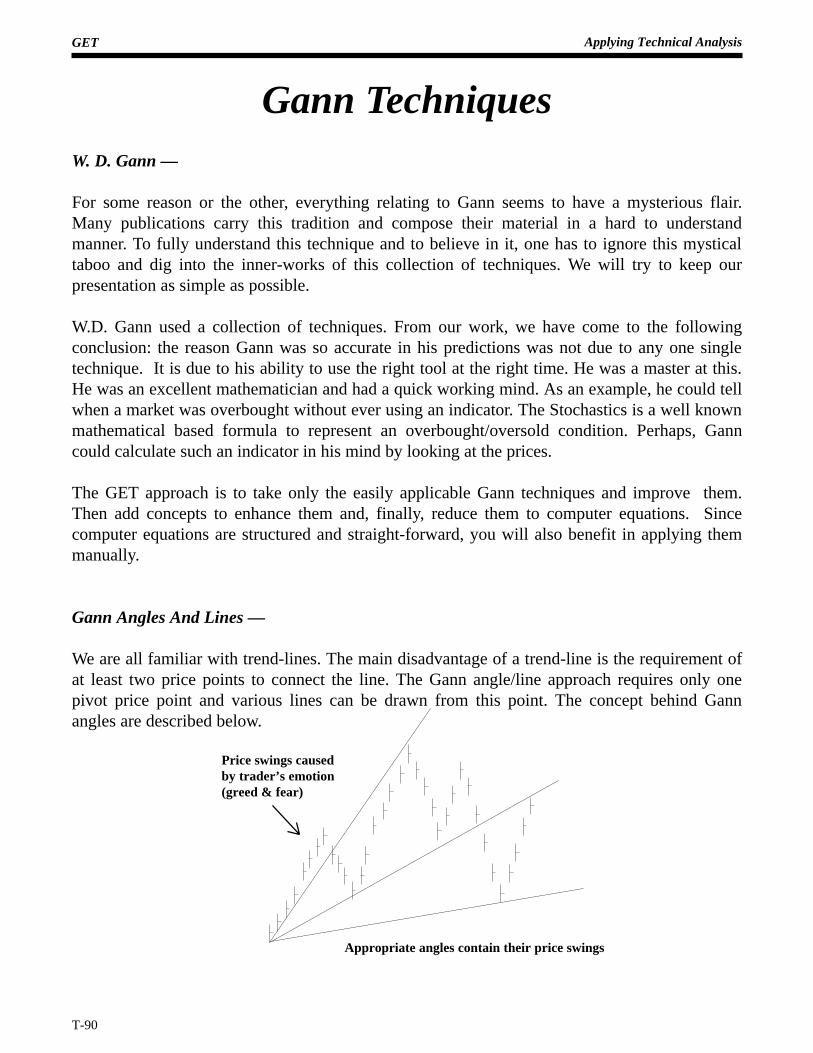
GET Applying Technical Analysis
T-90
W. D. Gann —
For some reason or the other, everything relating to Gann seems to have a mysterious flair.Many publications carry this tradition and compose their material in a hard to understandmanner. To fully understand this technique and to believe in it, one has to ignore this mysticaltaboo and dig into the inner-works of this collection of techniques. We will try to keep ourpresentation as simple as possible.
W.D. Gann used a collection of techniques. From our work, we have come to the followingconclusion: the reason Gann was so accurate in his predictions was not due to any one singletechnique. It is due to his ability to use the right tool at the right time. He was a master at this.He was an excellent mathematician and had a quick working mind. As an example, he could tellwhen a market was overbought without ever using an indicator. The Stochastics is a well knownmathematical based formula to represent an overbought/oversold condition. Perhaps, Ganncould calculate such an indicator in his mind by looking at the prices.
The GET approach is to take only the easily applicable Gann techniques and improve them.Then add concepts to enhance them and, finally, reduce them to computer equations. Sincecomputer equations are structured and straight-forward, you will also benefit in applying themmanually.
Gann Angles And Lines —
We are all familiar with trend-lines. The main disadvantage of a trend-line is the requirement ofat least two price points to connect the line. The Gann angle/line approach requires only onepivot price point and various lines can be drawn from this point. The concept behind Gannangles are described below.
Price swings causedby trader’s emotion(greed & fear)
Appropriate angles contain their price swings
Gann Techniques
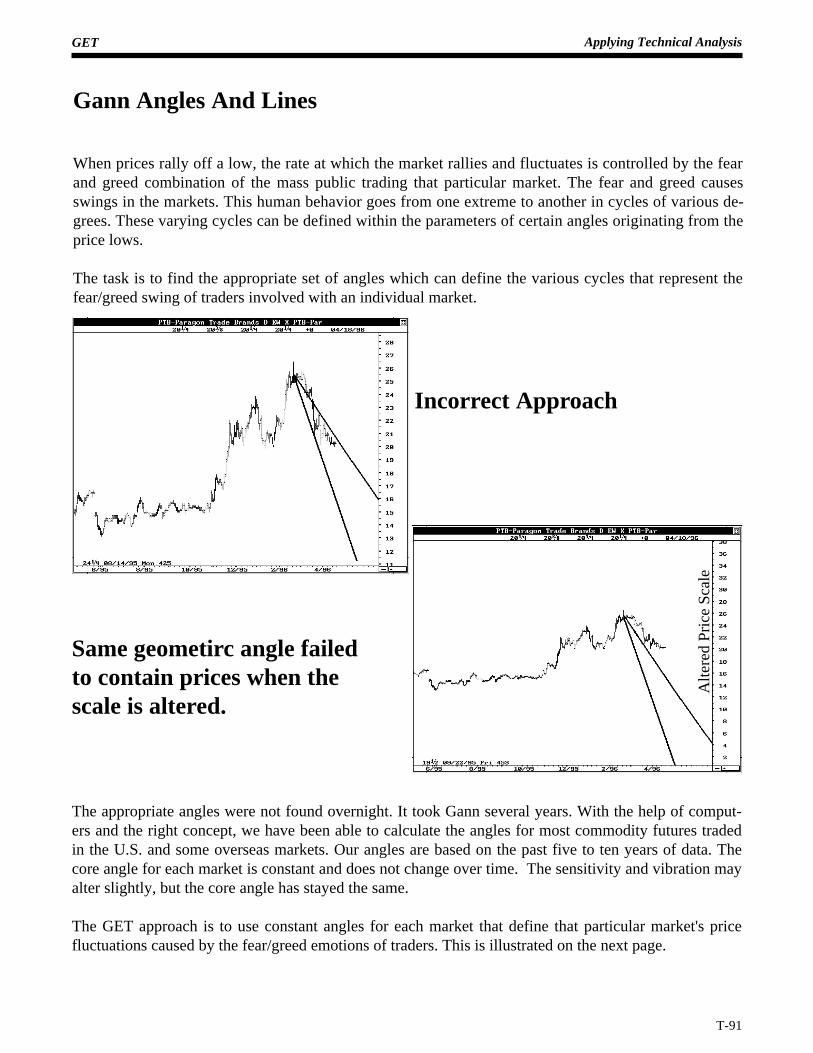
GET Applying Technical Analysis
T-91
Gann Angles And Lines
When prices rally off a low, the rate at which the market rallies and fluctuates is controlled by the fearand greed combination of the mass public trading that particular market. The fear and greed causesswings in the markets. This human behavior goes from one extreme to another in cycles of various de-grees. These varying cycles can be defined within the parameters of certain angles originating from theprice lows.
The task is to find the appropriate set of angles which can define the various cycles that represent thefear/greed swing of traders involved with an individual market.
Incorrect Approach
Same geometirc angle failedto contain prices when thescale is altered.
Alte
red
Pric
e S
cale
The appropriate angles were not found overnight. It took Gann several years. With the help of comput-ers and the right concept, we have been able to calculate the angles for most commodity futures tradedin the U.S. and some overseas markets. Our angles are based on the past five to ten years of data. Thecore angle for each market is constant and does not change over time. The sensitivity and vibration mayalter slightly, but the core angle has stayed the same.
The GET approach is to use constant angles for each market that define that particular market's pricefluctuations caused by the fear/greed emotions of traders. This is illustrated on the next page.
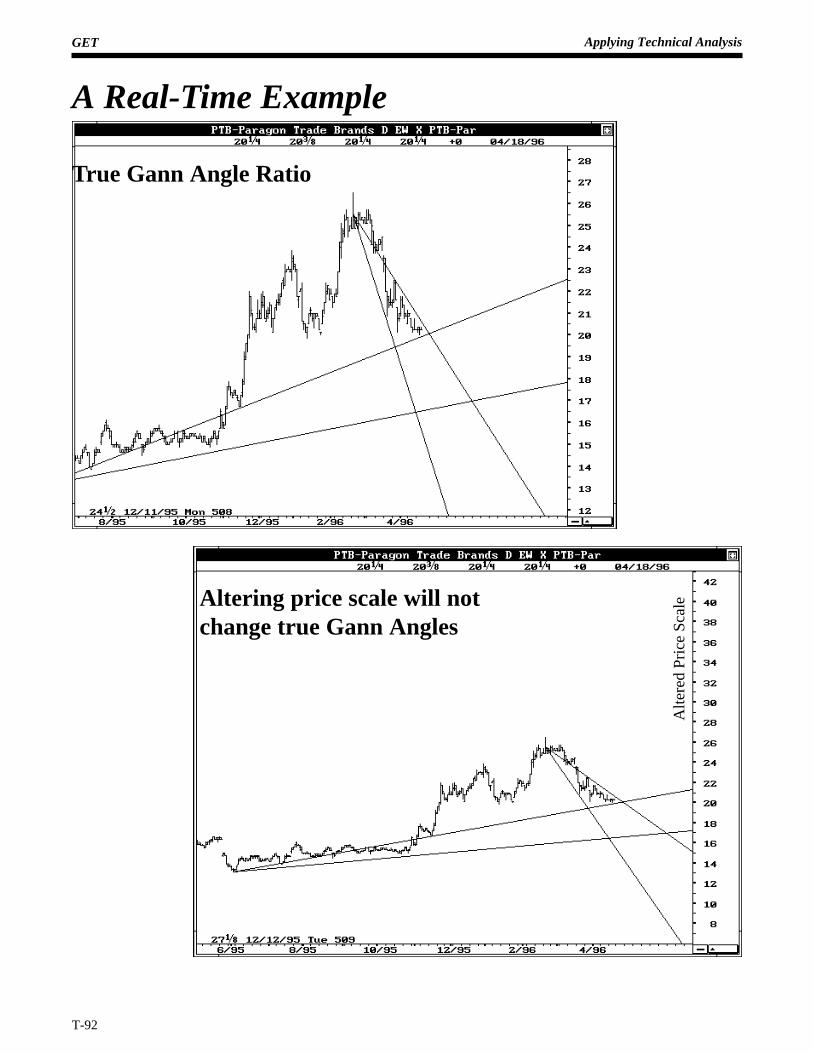
GET Applying Technical Analysis
T-92
A Real-Time Example
True Gann Angle Ratio
Altering price scale will notchange true Gann Angles
Alte
red
Pric
e S
cale
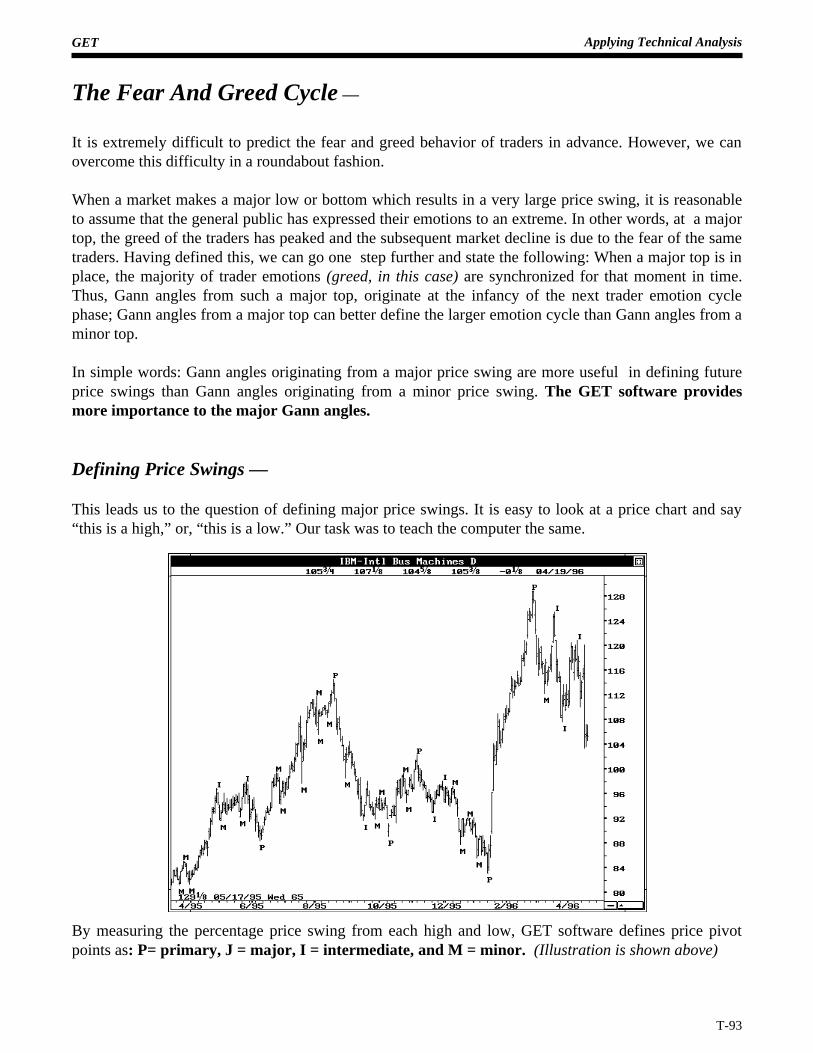
GET Applying Technical Analysis
T-93
It is extremely difficult to predict the fear and greed behavior of traders in advance. However, we canovercome this difficulty in a roundabout fashion.
When a market makes a major low or bottom which results in a very large price swing, it is reasonableto assume that the general public has expressed their emotions to an extreme. In other words, at a majortop, the greed of the traders has peaked and the subsequent market decline is due to the fear of the sametraders. Having defined this, we can go one step further and state the following: When a major top is inplace, the majority of trader emotions (greed, in this case) are synchronized for that moment in time.Thus, Gann angles from such a major top, originate at the infancy of the next trader emotion cyclephase; Gann angles from a major top can better define the larger emotion cycle than Gann angles from aminor top.
In simple words: Gann angles originating from a major price swing are more useful in defining futureprice swings than Gann angles originating from a minor price swing. The GET software providesmore importance to the major Gann angles.
Defining Price Swings —
This leads us to the question of defining major price swings. It is easy to look at a price chart and say“this is a high,” or, “this is a low.” Our task was to teach the computer the same.
By measuring the percentage price swing from each high and low, GET software defines price pivotpoints as: P= primary, J = major, I = intermediate, and M = minor. (Illustration is shown above)
The Fear And Greed Cycle —
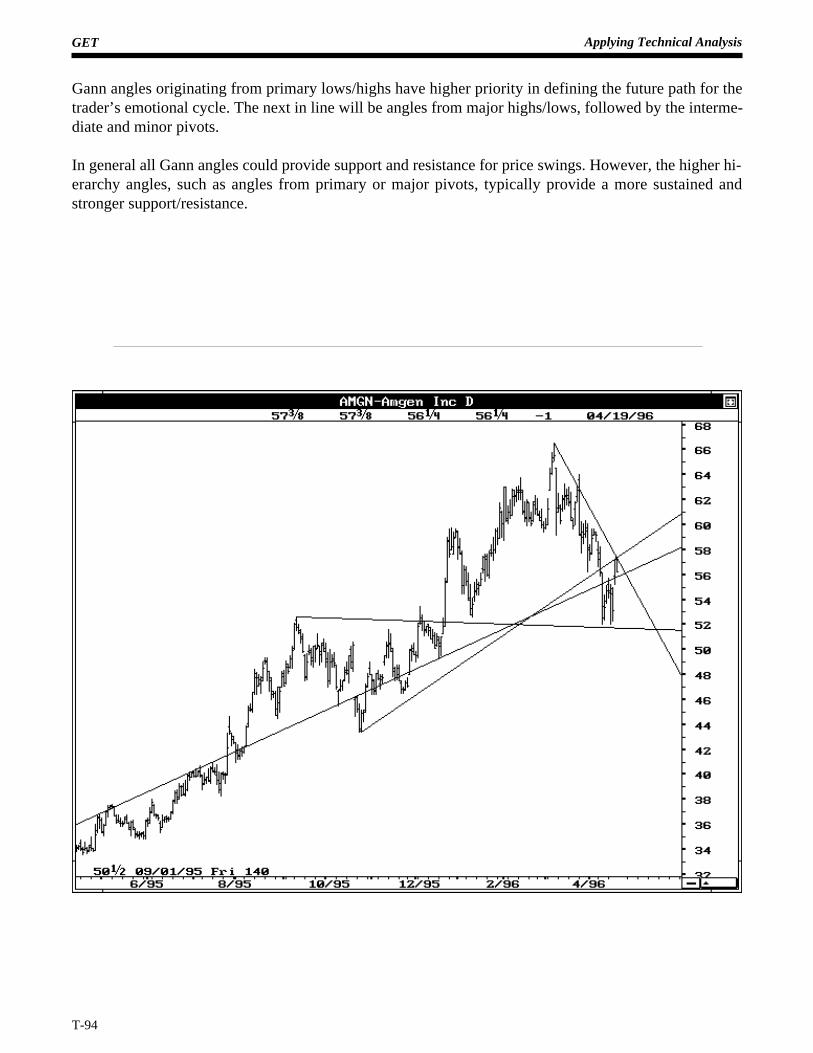
GET Applying Technical Analysis
T-94
Gann angles originating from primary lows/highs have higher priority in defining the future path for thetrader’s emotional cycle. The next in line will be angles from major highs/lows, followed by the interme-diate and minor pivots.
In general all Gann angles could provide support and resistance for price swings. However, the higher hi-erarchy angles, such as angles from primary or major pivots, typically provide a more sustained andstronger support/resistance.
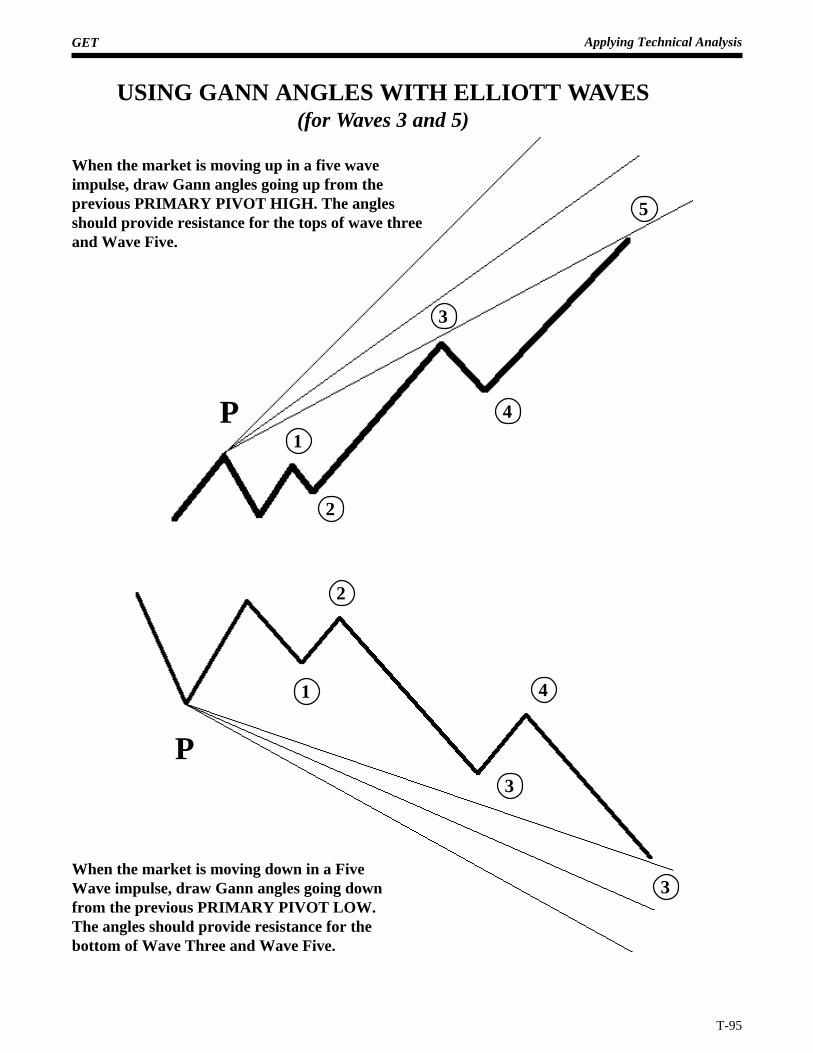
GET Applying Technical Analysis
T-95
P1
2
3
4
5
1
P
2
3
4
3When the market is moving down in a FiveWave impulse, draw Gann angles going downfrom the previous PRIMARY PIVOT LOW.The angles should provide resistance for thebottom of Wave Three and Wave Five.
USING GANN ANGLES WITH ELLIOTT WAVES(for Waves 3 and 5)
When the market is moving up in a five waveimpulse, draw Gann angles going up from theprevious PRIMARY PIVOT HIGH. The anglesshould provide resistance for the tops of wave threeand Wave Five.
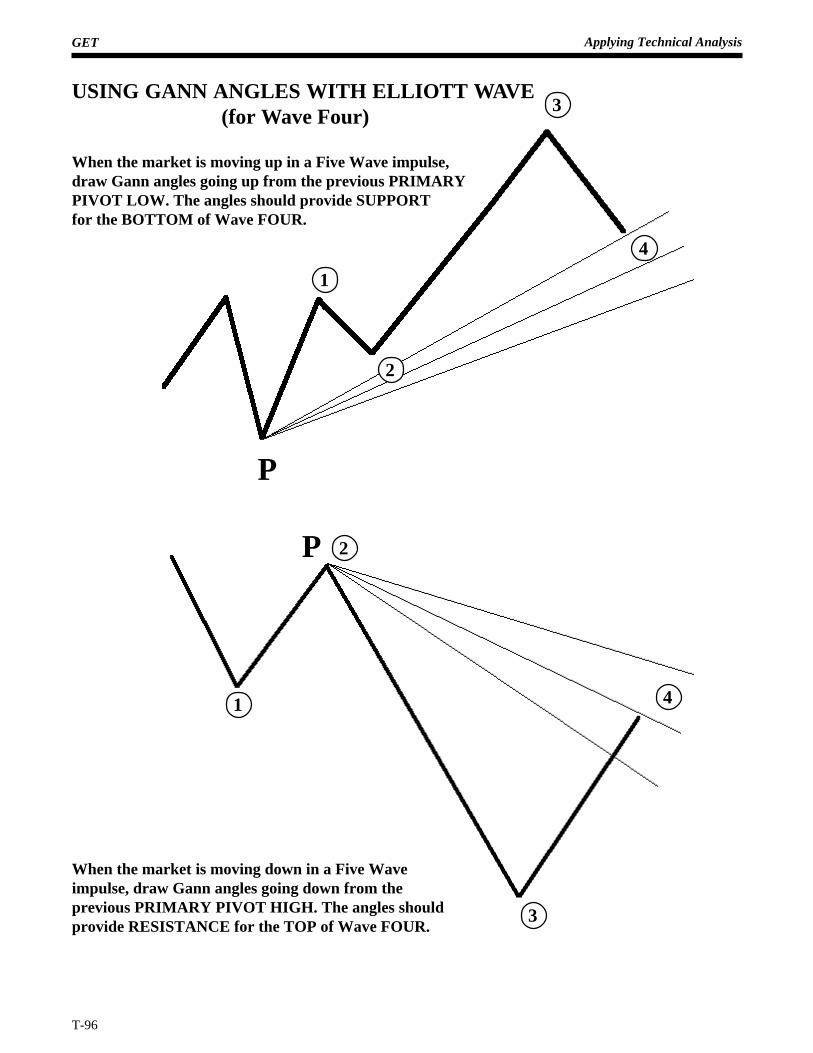
GET Applying Technical Analysis
T-96
P
1
2
3
4
P 2
1 4
3
USING GANN ANGLES WITH ELLIOTT WAVE (for Wave Four)
When the market is moving up in a Five Wave impulse,draw Gann angles going up from the previous PRIMARYPIVOT LOW. The angles should provide SUPPORTfor the BOTTOM of Wave FOUR.
When the market is moving down in a Five Waveimpulse, draw Gann angles going down from theprevious PRIMARY PIVOT HIGH. The angles shouldprovide RESISTANCE for the TOP of Wave FOUR.
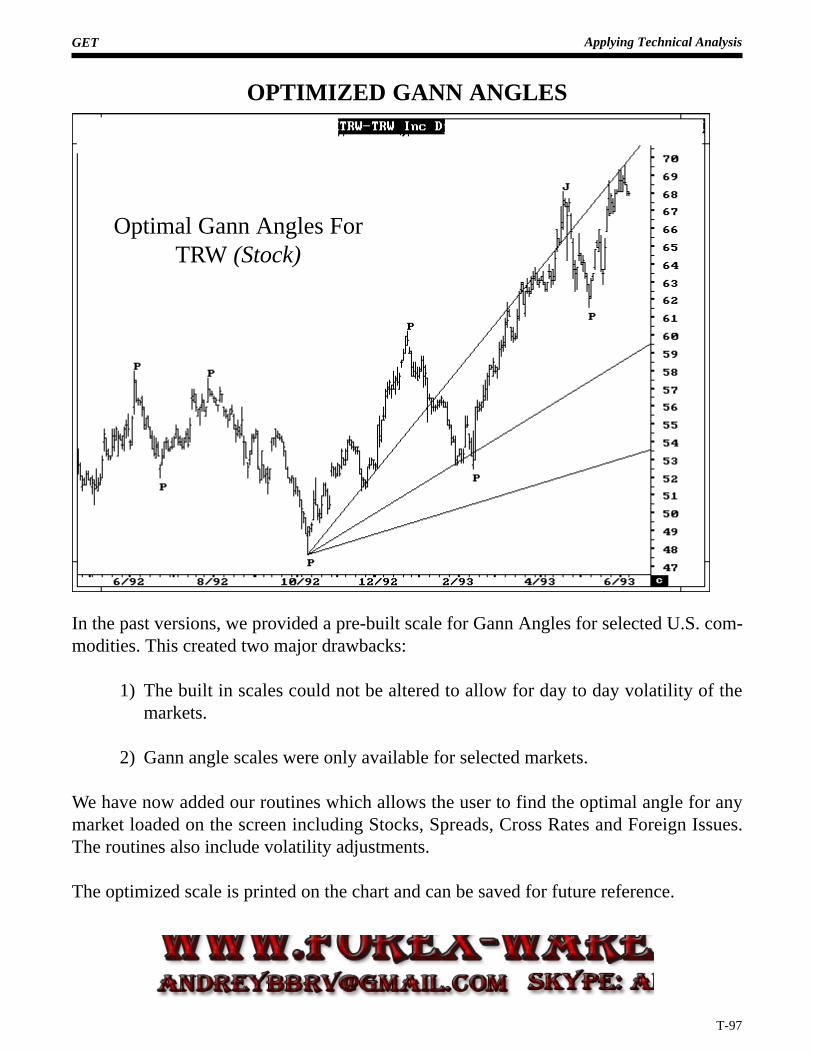
GET Applying Technical Analysis
T-97
In the past versions, we provided a pre-built scale for Gann Angles for selected U.S. com-modities. This created two major drawbacks:
1) The built in scales could not be altered to allow for day to day volatility of themarkets.
2) Gann angle scales were only available for selected markets.
We have now added our routines which allows the user to find the optimal angle for anymarket loaded on the screen including Stocks, Spreads, Cross Rates and Foreign Issues.The routines also include volatility adjustments.
The optimized scale is printed on the chart and can be saved for future reference.
OPTIMIZED GANN ANGLES
Optimal Gann Angles ForTRW (Stock)
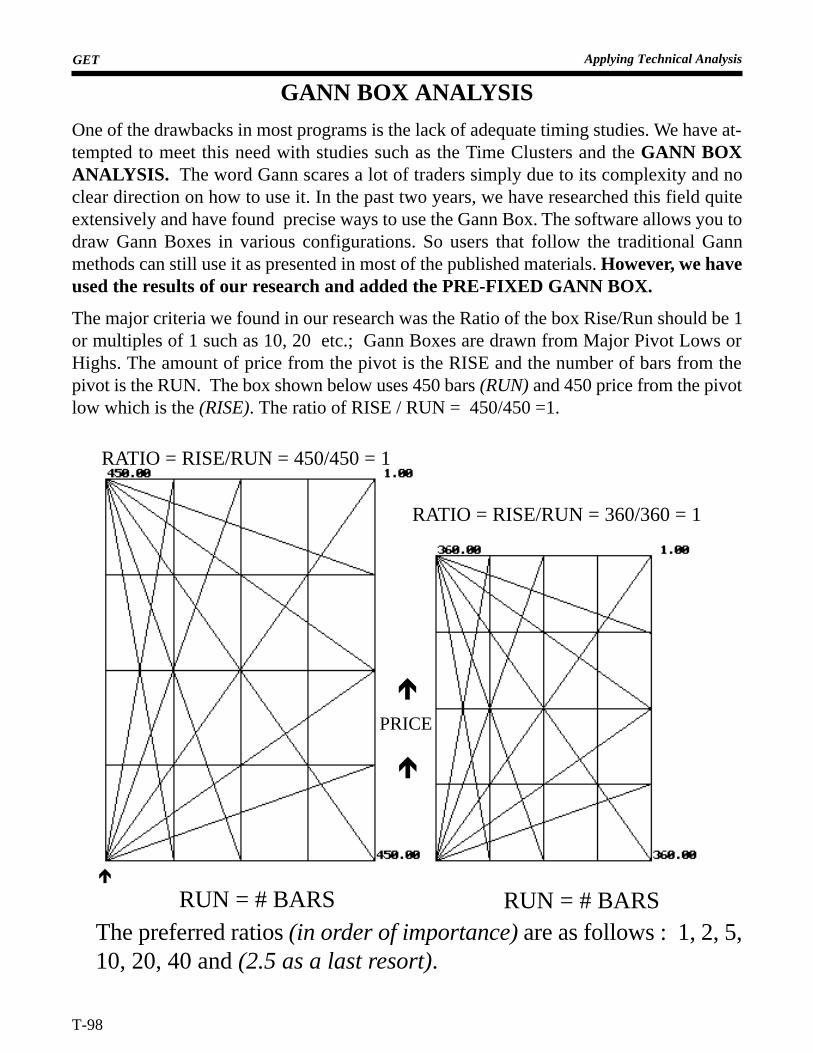
GET
T-98
Applying Technical Analysis
One of the drawbacks in most programs is the lack of adequate timing studies. We have at-tempted to meet this need with studies such as the Time Clusters and the GANN BOXANALYSIS. The word Gann scares a lot of traders simply due to its complexity and noclear direction on how to use it. In the past two years, we have researched this field quiteextensively and have found precise ways to use the Gann Box. The software allows you todraw Gann Boxes in various configurations. So users that follow the traditional Gannmethods can still use it as presented in most of the published materials. However, we haveused the results of our research and added the PRE-FIXED GANN BOX.
The major criteria we found in our research was the Ratio of the box Rise/Run should be 1or multiples of 1 such as 10, 20 etc.; Gann Boxes are drawn from Major Pivot Lows orHighs. The amount of price from the pivot is the RISE and the number of bars from thepivot is the RUN. The box shown below uses 450 bars (RUN) and 450 price from the pivotlow which is the (RISE). The ratio of RISE / RUN = 450/450 =1.
GANN BOX ANALYSIS
RUN = # BARS RUN = # BARSThe preferred ratios (in order of importance) are as follows : 1, 2, 5,10, 20, 40 and (2.5 as a last resort).
RATIO = RISE/RUN = 360/360 = 1
é
é
PRICE
é
RATIO = RISE/RUN = 450/450 = 1
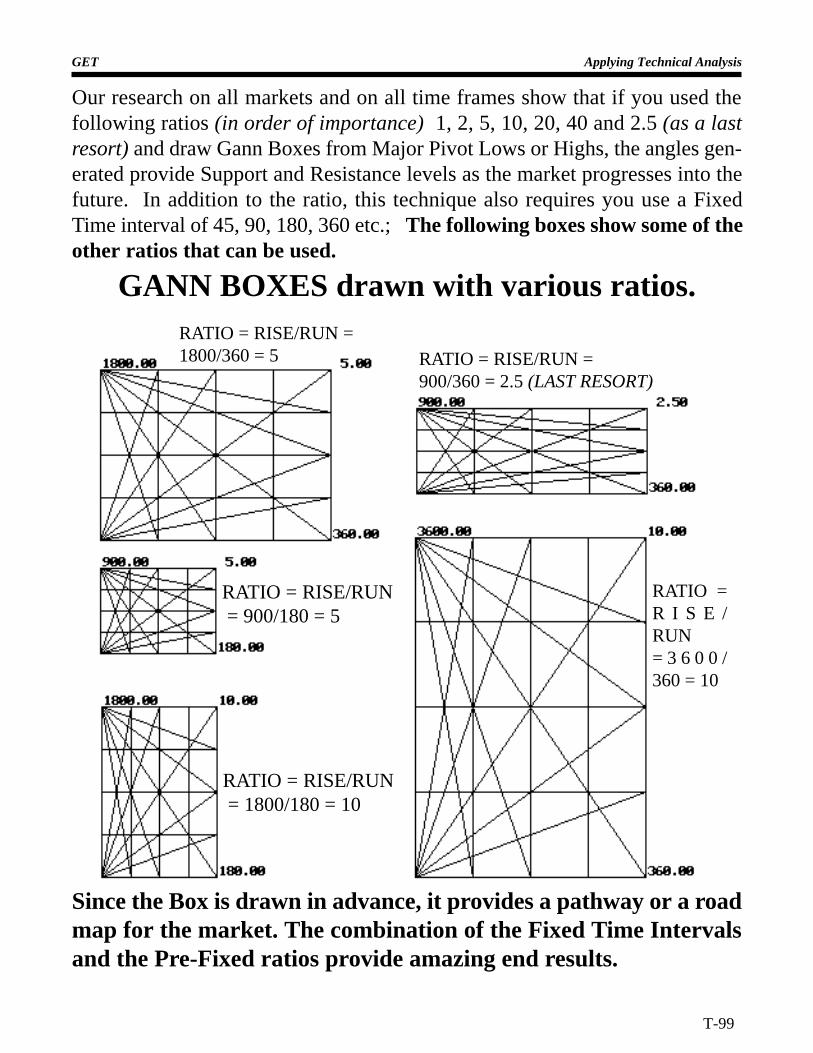
Applying Technical Analysis
T-99
GET
Our research on all markets and on all time frames show that if you used thefollowing ratios (in order of importance) 1, 2, 5, 10, 20, 40 and 2.5 (as a lastresort) and draw Gann Boxes from Major Pivot Lows or Highs, the angles gen-erated provide Support and Resistance levels as the market progresses into thefuture. In addition to the ratio, this technique also requires you use a FixedTime interval of 45, 90, 180, 360 etc.; The following boxes show some of theother ratios that can be used.
RATIO = RISE/RUN = 1800/180 = 10
RATIO = RISE/RUN = 900/180 = 5
RATIO =R I S E /RUN= 3 6 0 0 /360 = 10
RATIO = RISE/RUN =900/360 = 2.5 (LAST RESORT)
RATIO = RISE/RUN =1800/360 = 5
GANN BOXES drawn with various ratios.
Since the Box is drawn in advance, it provides a pathway or a roadmap for the market. The combination of the Fixed Time Intervalsand the Pre-Fixed ratios provide amazing end results.
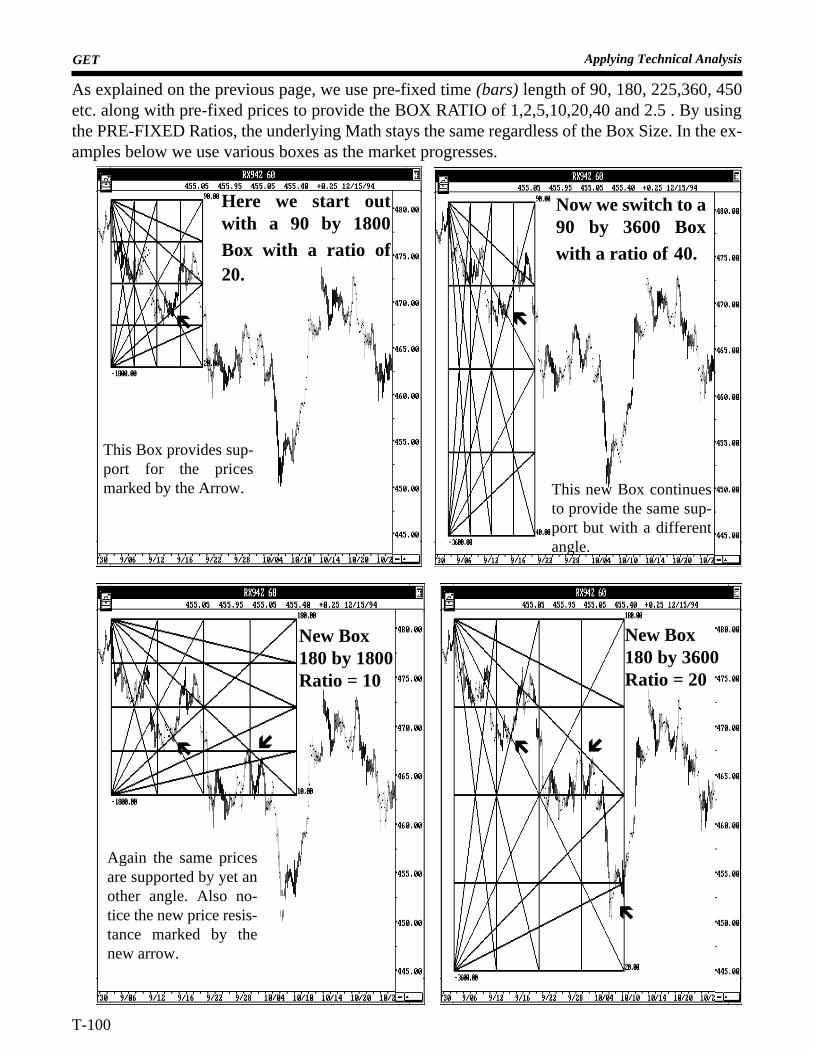
GET
T-100
Applying Technical Analysis
As explained on the previous page, we use pre-fixed time (bars) length of 90, 180, 225,360, 450etc. along with pre-fixed prices to provide the BOX RATIO of 1,2,5,10,20,40 and 2.5 . By usingthe PRE-FIXED Ratios, the underlying Math stays the same regardless of the Box Size. In the ex-amples below we use various boxes as the market progresses.
Now we switch to a90 by 3600 Boxwith a ratio of 40.
ë
This new Box continuesto provide the same sup-port but with a differentangle.
This Box provides sup-port for the pricesmarked by the Arrow.
ë
Here we start outwith a 90 by 1800Box with a ratio of20.
New Box180 by 1800Ratio = 10
ë í
Again the same pricesare supported by yet another angle. Also no-tice the new price resis-tance marked by thenew arrow.
New Box180 by 3600Ratio = 20
íë
ë

Applying Technical Analysis
T-101
GET
ë í
í
New Box225 by 2250Ratio = 10
As the price range expands, the user simply draws a larger Box that confirms to the Pre-Fixed Ratios. The underlying math automatically adjusts itself by shifting anglesaround but still providing the same Support and Resistance as the marketprogresses.
ARROWS INDICATE THE SAME PRICE REVERSALS PROJECTED BYDIFFERENT ANGLES FROM BOXES WITH VARIOUS RATIOS.
Long 95 MarShort 95 July
WHEAT SPREAD
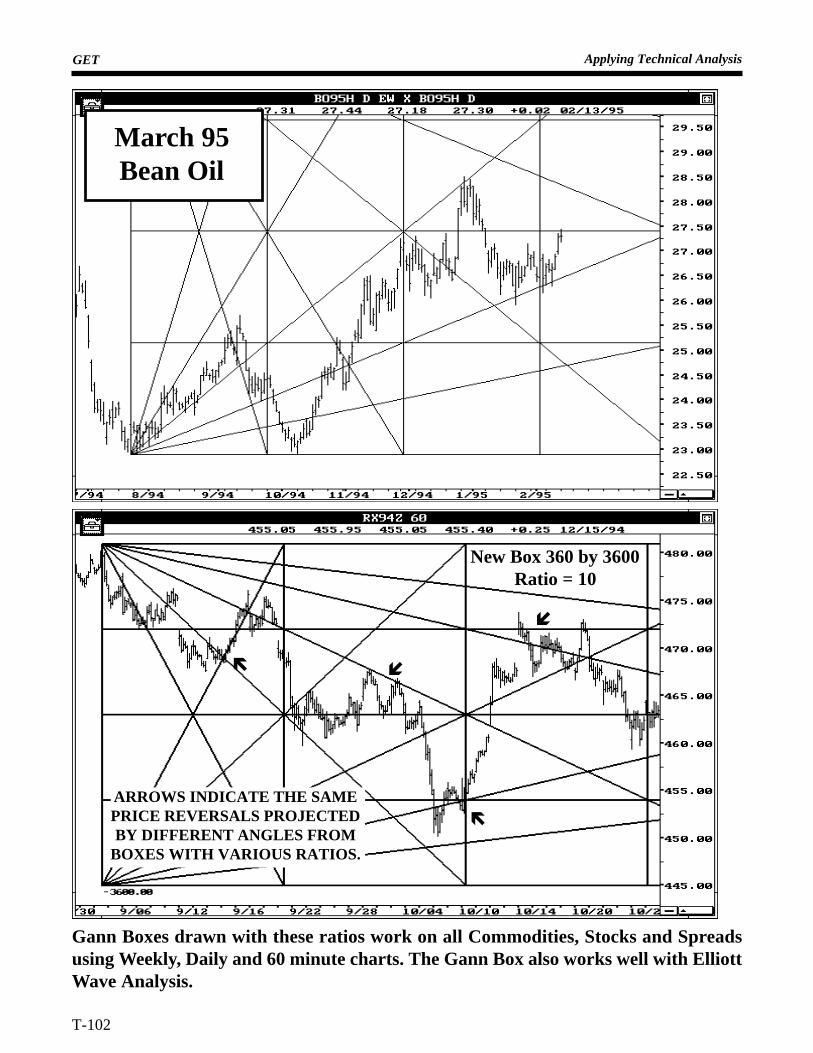
GET
T-102
Applying Technical Analysis
ë
ë í
New Box 360 by 3600Ratio = 10
í
Gann Boxes drawn with these ratios work on all Commodities, Stocks and Spreadsusing Weekly, Daily and 60 minute charts. The Gann Box also works well with ElliottWave Analysis.
March 95Bean Oil
ARROWS INDICATE THE SAMEPRICE REVERSALS PROJECTEDBY DIFFERENT ANGLES FROM
BOXES WITH VARIOUS RATIOS.
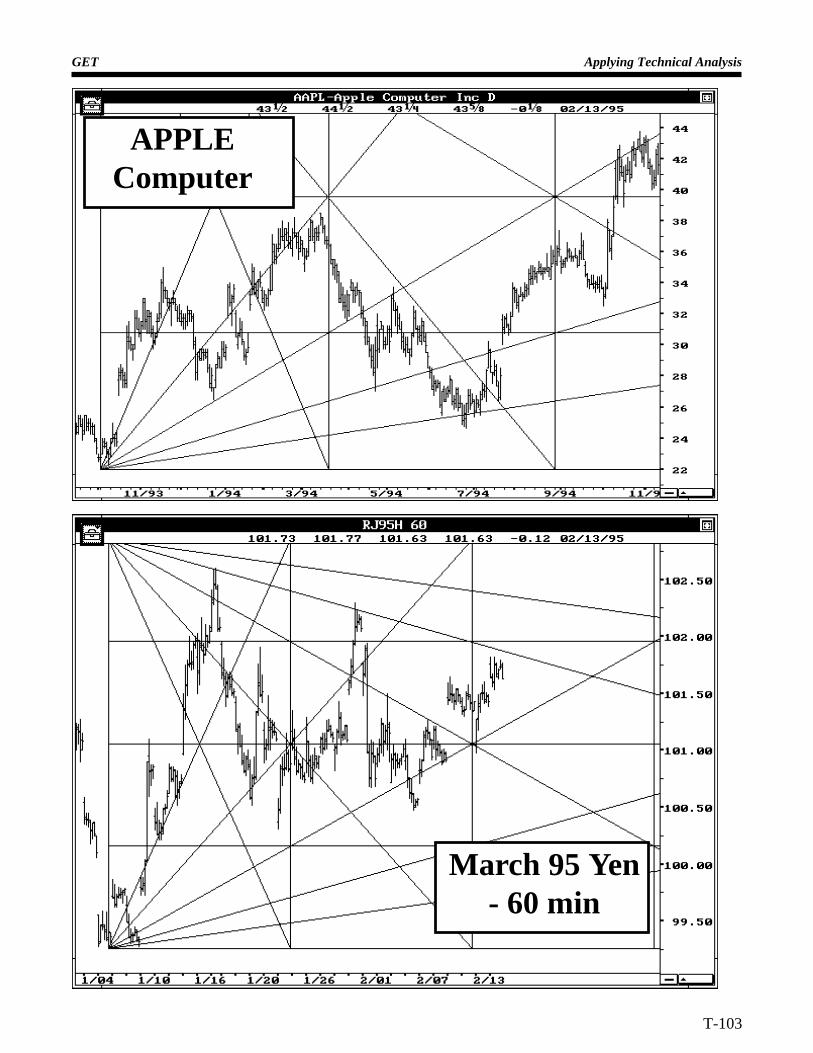
Applying Technical Analysis
T-103
GET
APPLEComputer
March 95 Yen- 60 min
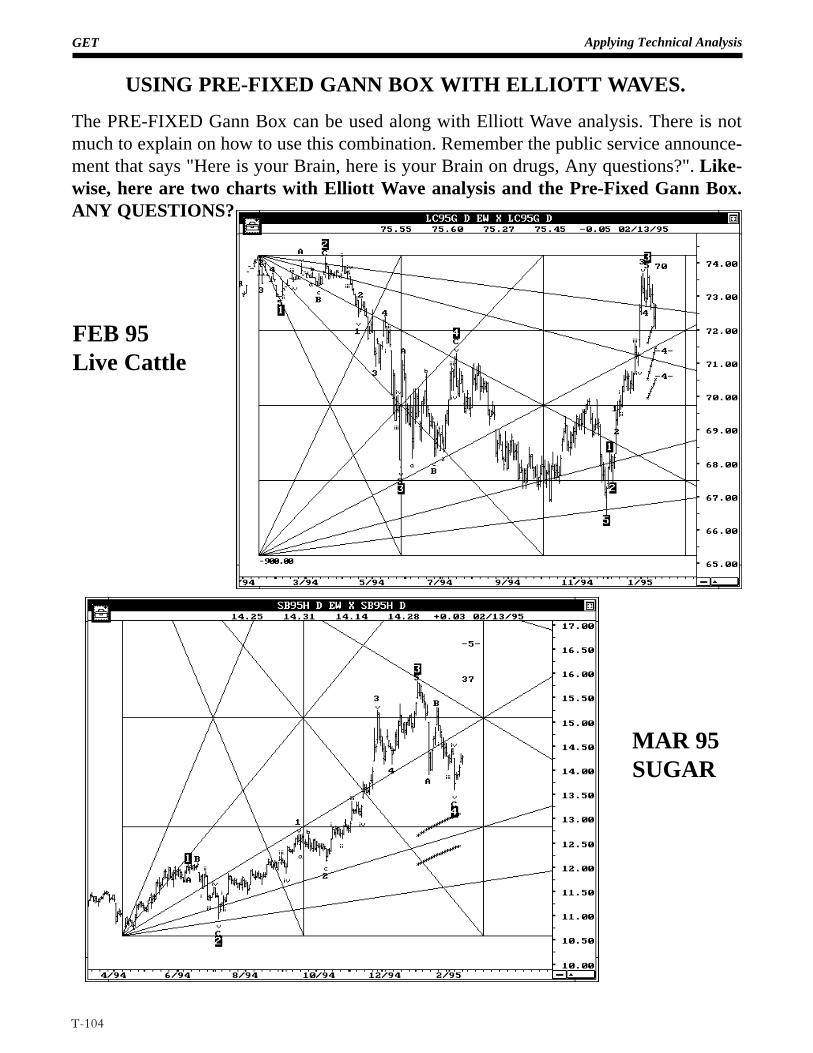
GET Applying Technical Analysis
T-104
The PRE-FIXED Gann Box can be used along with Elliott Wave analysis. There is notmuch to explain on how to use this combination. Remember the public service announce-ment that says "Here is your Brain, here is your Brain on drugs, Any questions?". Like-wise, here are two charts with Elliott Wave analysis and the Pre-Fixed Gann Box.ANY QUESTIONS?
USING PRE-FIXED GANN BOX WITH ELLIOTT WAVES.
FEB 95Live Cattle
MAR 95SUGAR
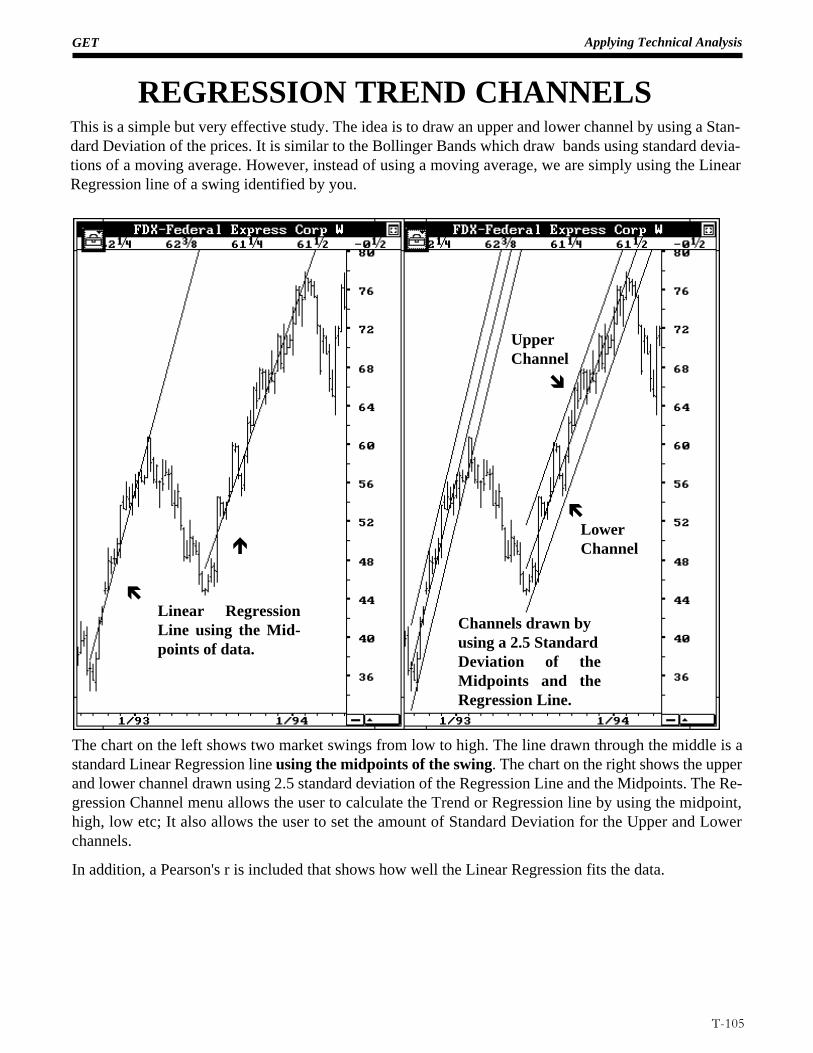
GET Applying Technical Analysis
T-105
The chart on the left shows two market swings from low to high. The line drawn through the middle is astandard Linear Regression line using the midpoints of the swing. The chart on the right shows the upperand lower channel drawn using 2.5 standard deviation of the Regression Line and the Midpoints. The Re-gression Channel menu allows the user to calculate the Trend or Regression line by using the midpoint,high, low etc; It also allows the user to set the amount of Standard Deviation for the Upper and Lowerchannels.
In addition, a Pearson's r is included that shows how well the Linear Regression fits the data.
Linear RegressionLine using the Mid-points of data.
ë
é
Channels drawn byusing a 2.5 StandardDeviation of theMidpoints and theRegression Line.
LowerChannel
ë
UpperChannel
î
This is a simple but very effective study. The idea is to draw an upper and lower channel by using a Stan-dard Deviation of the prices. It is similar to the Bollinger Bands which draw bands using standard devia-tions of a moving average. However, instead of using a moving average, we are simply using the LinearRegression line of a swing identified by you.
REGRESSION TREND CHANNELS
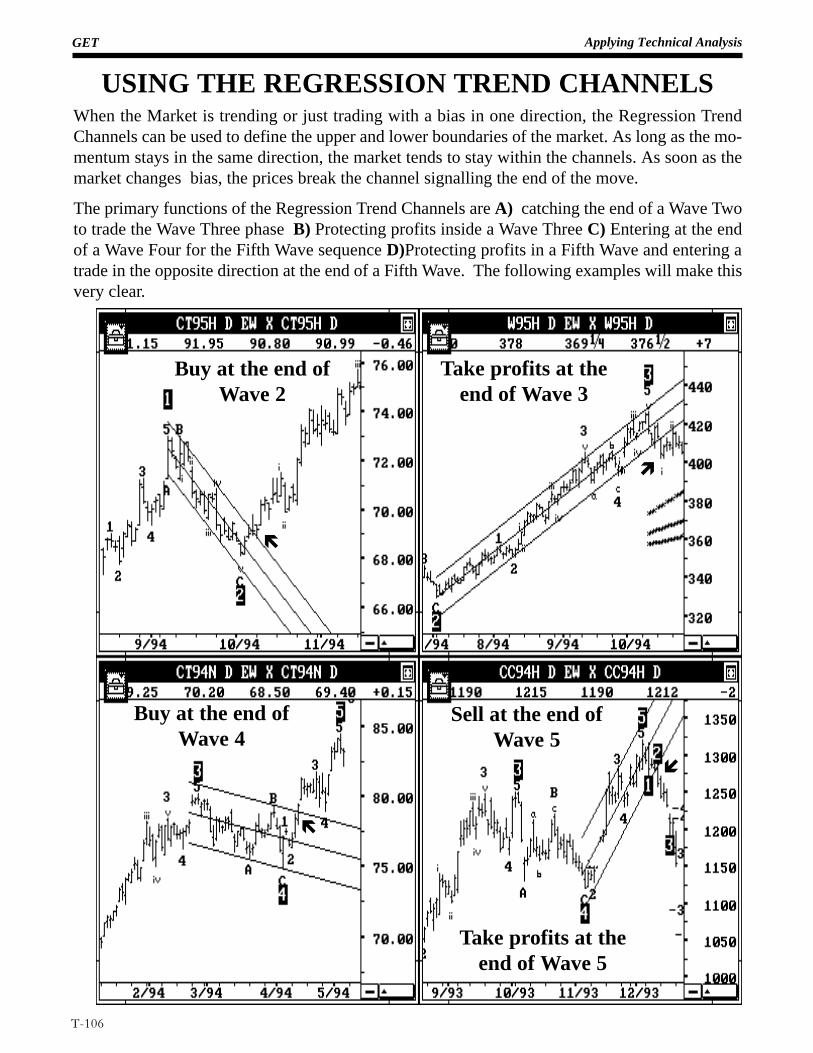
GET Applying Technical Analysis
T-106
Buy at the end ofWave 2
Take profits at theend of Wave 3
Buy at the end ofWave 4
Take profits at theend of Wave 5
Sell at the end ofWave 5
í
ë
ì
ë
When the Market is trending or just trading with a bias in one direction, the Regression TrendChannels can be used to define the upper and lower boundaries of the market. As long as the mo-mentum stays in the same direction, the market tends to stay within the channels. As soon as themarket changes bias, the prices break the channel signalling the end of the move.
The primary functions of the Regression Trend Channels are A) catching the end of a Wave Twoto trade the Wave Three phase B) Protecting profits inside a Wave Three C) Entering at the endof a Wave Four for the Fifth Wave sequence D)Protecting profits in a Fifth Wave and entering atrade in the opposite direction at the end of a Fifth Wave. The following examples will make thisvery clear.
USING THE REGRESSION TREND CHANNELS
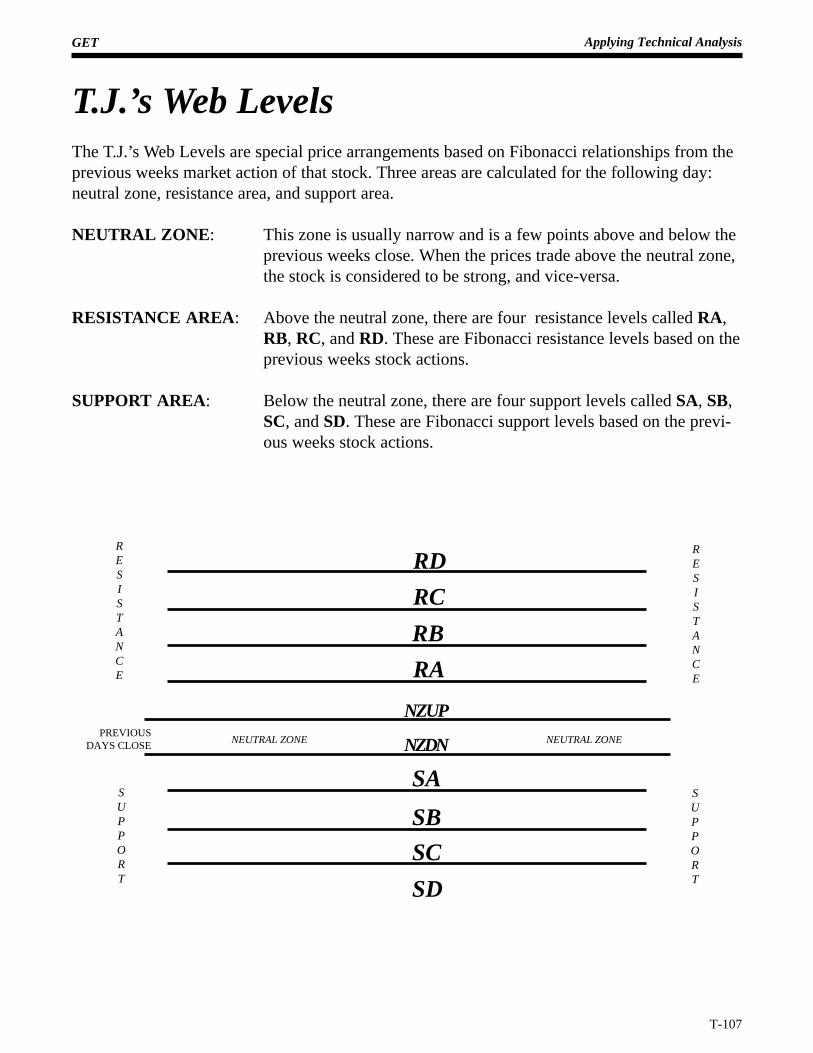
GET Applying Technical Analysis
T-107
T.J.’s Web LevelsThe T.J.’s Web Levels are special price arrangements based on Fibonacci relationships from theprevious weeks market action of that stock. Three areas are calculated for the following day:neutral zone, resistance area, and support area.
NEUTRAL ZONE : This zone is usually narrow and is a few points above and below theprevious weeks close. When the prices trade above the neutral zone,the stock is considered to be strong, and vice-versa.
RESISTANCE AREA : Above the neutral zone, there are four resistance levels called RA,RB, RC, and RD. These are Fibonacci resistance levels based on theprevious weeks stock actions.
SUPPORT AREA: Below the neutral zone, there are four support levels called SA, SB,SC, and SD. These are Fibonacci support levels based on the previ-ous weeks stock actions.
SD
SC
SB
SA
RA
RB
RC
RD
NZUP
NZDN
SUPPORT
NEUTRAL ZONE NEUTRAL ZONEPREVIOUS
DAYS CLOSE
RESISTANCE
RESISTANCE
SUPPORT
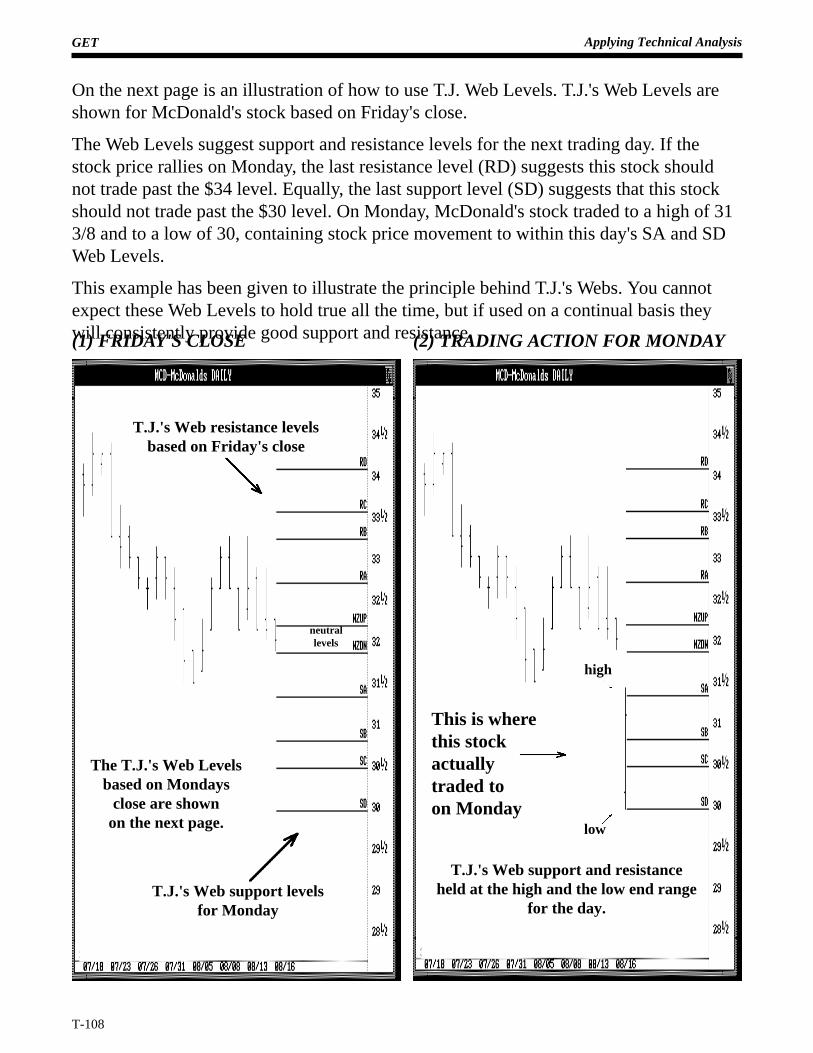
GET Applying Technical Analysis
T-108
T.J.'s Web resistance levelsbased on Friday's close
T.J.'s Web support levelsfor Monday
T.J.'s Web support and resistanceheld at the high and the low end range
for the day.
(2) TRADING ACTION FOR MONDAY(1) FRIDAY'S CLOSE
This is wherethis stockactuallytraded toon Monday
neutrallevels
high
low
The T.J.'s Web Levelsbased on Mondays
close are shownon the next page.
On the next page is an illustration of how to use T.J. Web Levels. T.J.'s Web Levels areshown for McDonald's stock based on Friday's close.
The Web Levels suggest support and resistance levels for the next trading day. If thestock price rallies on Monday, the last resistance level (RD) suggests this stock shouldnot trade past the $34 level. Equally, the last support level (SD) suggests that this stockshould not trade past the $30 level. On Monday, McDonald's stock traded to a high of 313/8 and to a low of 30, containing stock price movement to within this day's SA and SDWeb Levels.
This example has been given to illustrate the principle behind T.J.'s Webs. You cannotexpect these Web Levels to hold true all the time, but if used on a continual basis theywill consistently provide good support and resistance.
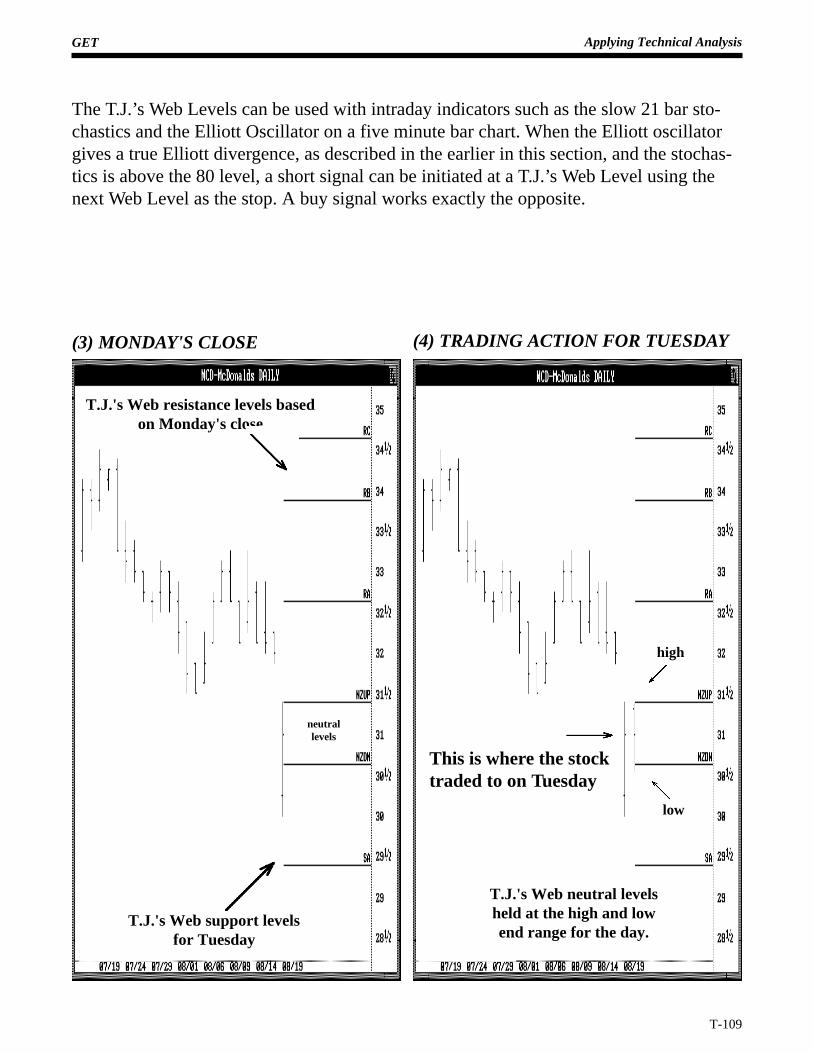
GET Applying Technical Analysis
T-109
The T.J.’s Web Levels can be used with intraday indicators such as the slow 21 bar sto-chastics and the Elliott Oscillator on a five minute bar chart. When the Elliott oscillatorgives a true Elliott divergence, as described in the earlier in this section, and the stochas-tics is above the 80 level, a short signal can be initiated at a T.J.’s Web Level using thenext Web Level as the stop. A buy signal works exactly the opposite.
T.J.'s Web support levelsfor Tuesday
T.J.'s Web resistance levels basedon Monday's close
T.J.'s Web neutral levelsheld at the high and lowend range for the day.
(4) TRADING ACTION FOR TUESDAY(3) MONDAY'S CLOSE
low
high
neutrallevels
This is where the stocktraded to on Tuesday
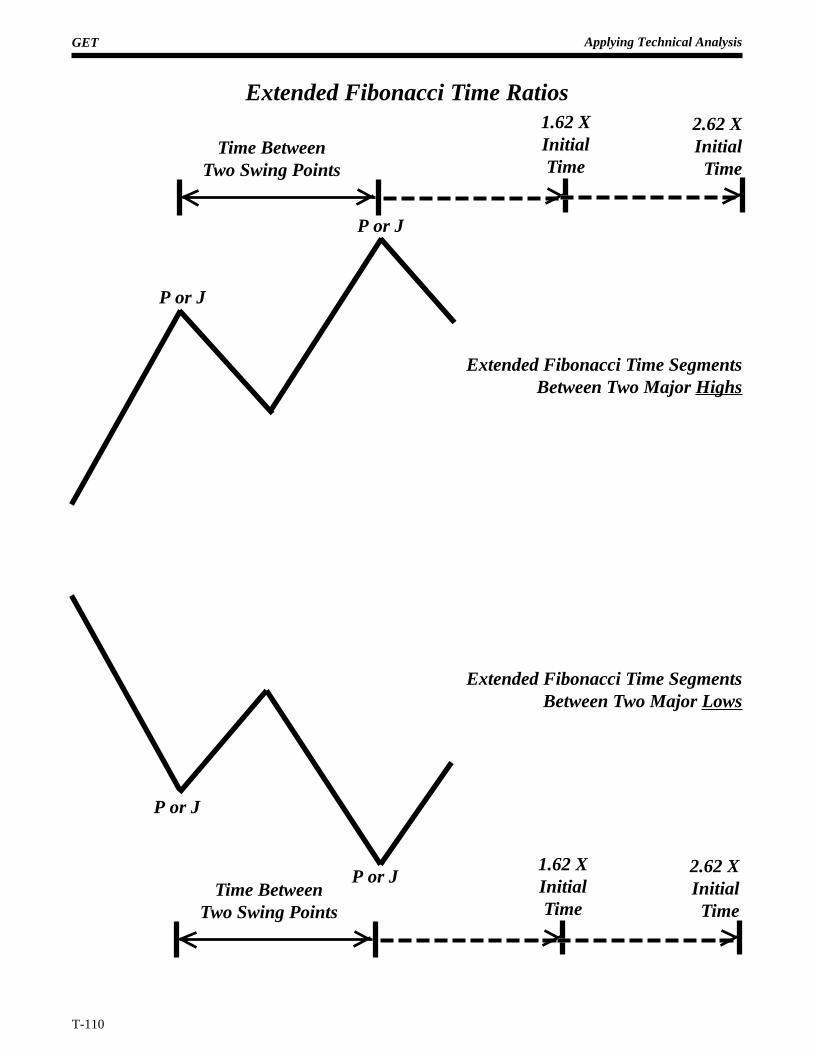
GET Applying Technical Analysis
T-110
Extended Fibonacci Time Ratios
P or J
Time BetweenTwo Swing Points
P or J
1.62 XInitialTime
2.62 XInitialTime
Time BetweenTwo Swing Points
1.62 XInitialTime
2.62 XInitialTime
P or J
P or J
Extended Fibonacci Time SegmentsBetween Two Major Highs
Extended Fibonacci Time SegmentsBetween Two Major Lows
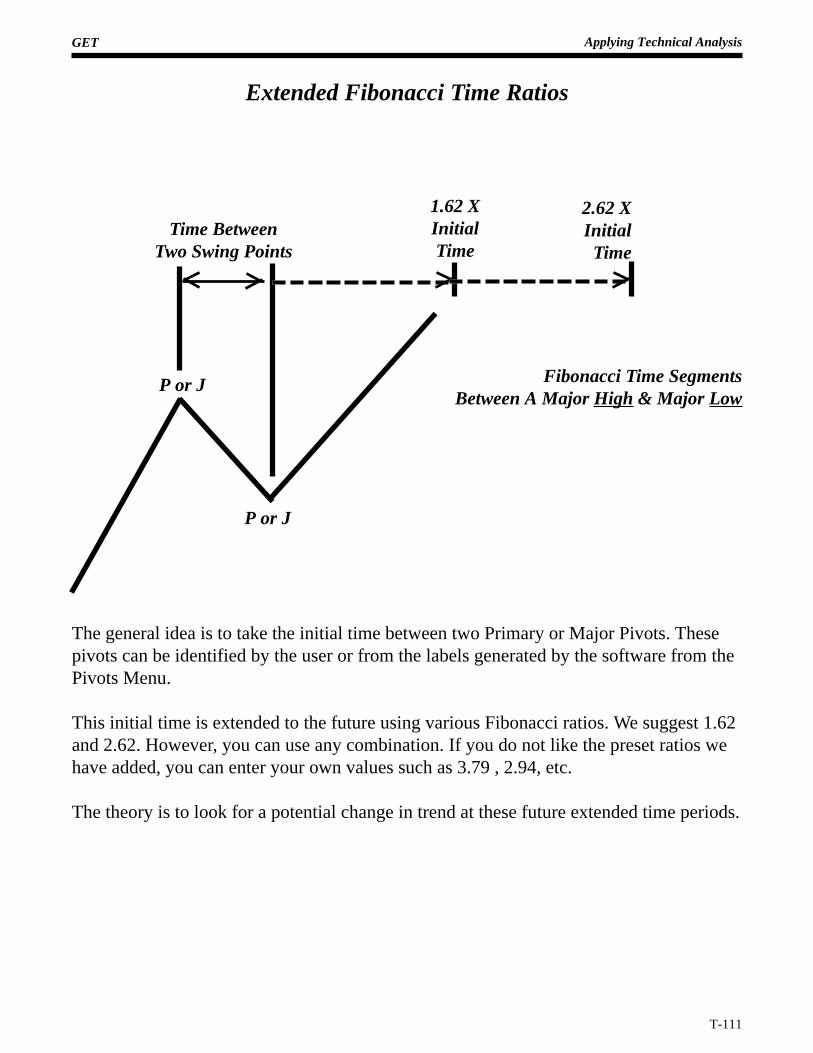
GET Applying Technical Analysis
T-111
Extended Fibonacci Time Ratios
P or J
1.62 XInitialTime
2.62 XInitialTime
P or J
Time BetweenTwo Swing Points
Fibonacci Time SegmentsBetween A Major High & Major Low
The general idea is to take the initial time between two Primary or Major Pivots. Thesepivots can be identified by the user or from the labels generated by the software from thePivots Menu.
This initial time is extended to the future using various Fibonacci ratios. We suggest 1.62and 2.62. However, you can use any combination. If you do not like the preset ratios wehave added, you can enter your own values such as 3.79 , 2.94, etc.
The theory is to look for a potential change in trend at these future extended time periods.
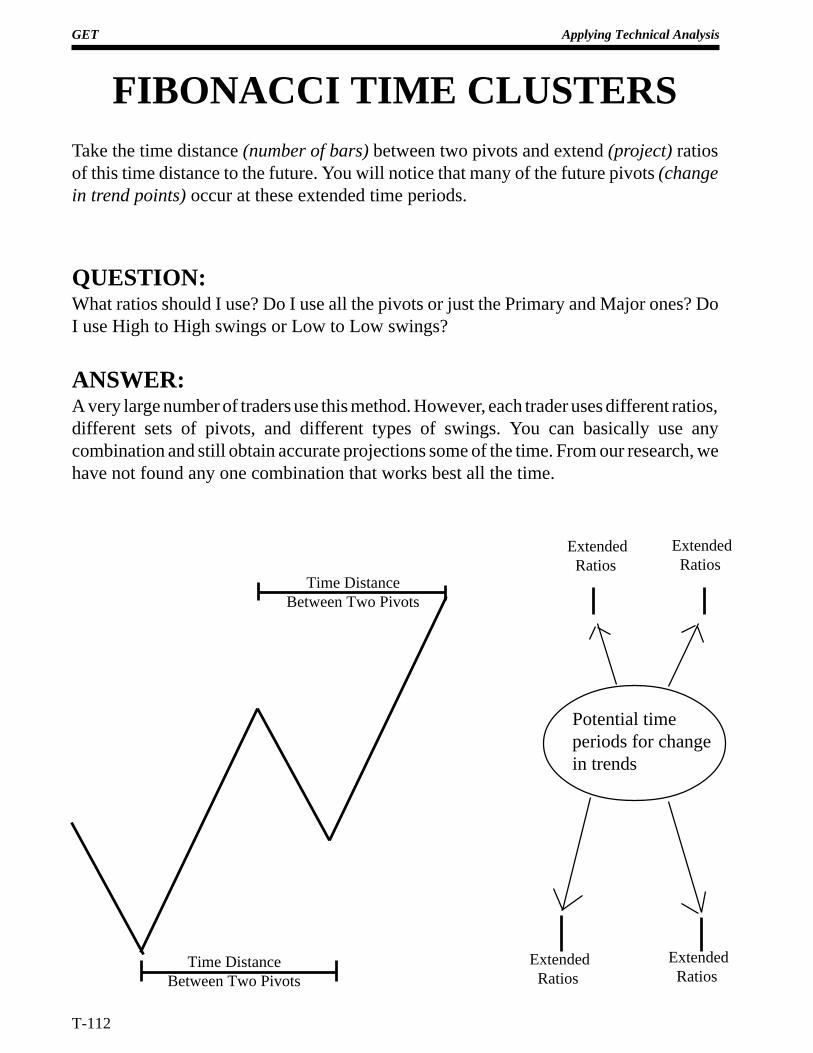
GET Applying Technical Analysis
T-112
Time DistanceBetween Two Pivots
FIBONACCI TIME CLUSTERSTake the time distance (number of bars) between two pivots and extend (project) ratiosof this time distance to the future. You will notice that many of the future pivots (changein trend points) occur at these extended time periods.
QUESTION:What ratios should I use? Do I use all the pivots or just the Primary and Major ones? DoI use High to High swings or Low to Low swings?
ANSWER:A very large number of traders use this method. However, each trader uses different ratios,different sets of pivots, and different types of swings. You can basically use anycombination and still obtain accurate projections some of the time. From our research, wehave not found any one combination that works best all the time.
Time DistanceBetween Two Pivots
Potential timeperiods for changein trends
Extended Ratios
Extended Ratios
Extended Ratios
Extended Ratios
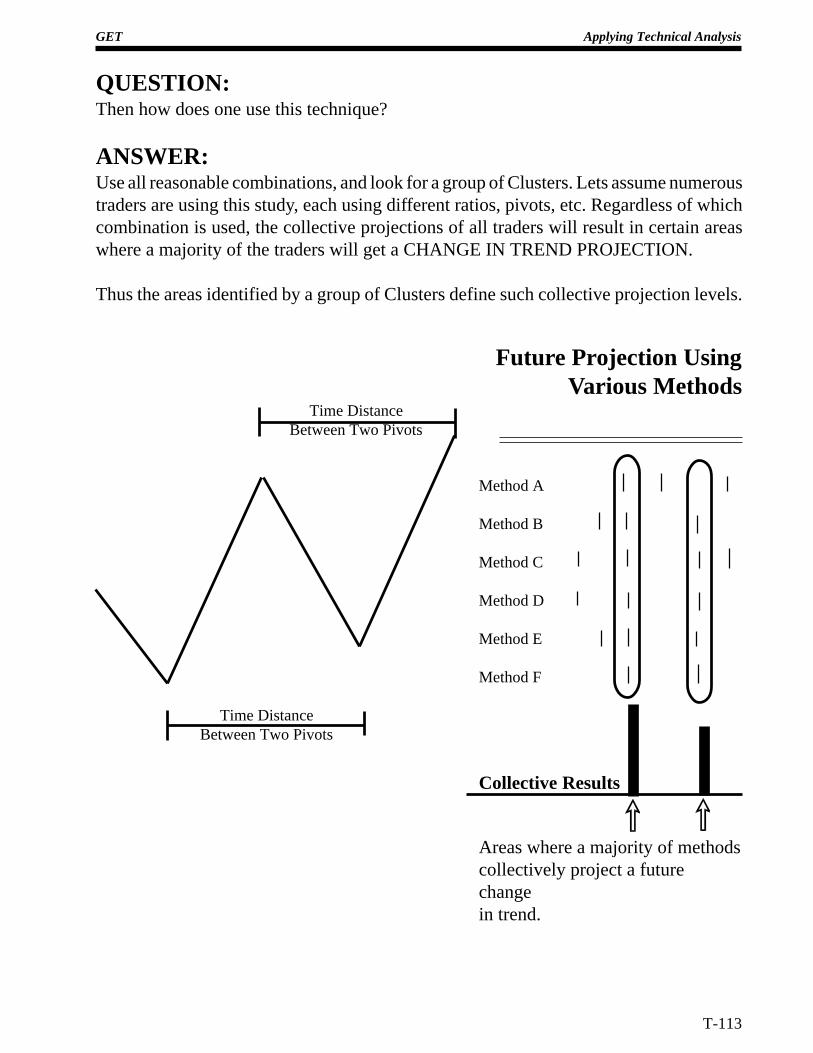
GET Applying Technical Analysis
T-113
Method A
Method B
Method C
Method D
Method E
Method F
QUESTION:Then how does one use this technique?
ANSWER:Use all reasonable combinations, and look for a group of Clusters. Lets assume numeroustraders are using this study, each using different ratios, pivots, etc. Regardless of whichcombination is used, the collective projections of all traders will result in certain areaswhere a majority of the traders will get a CHANGE IN TREND PROJECTION.
Thus the areas identified by a group of Clusters define such collective projection levels.
Future Projection UsingVarious Methods
Collective Results
Areas where a majority of methodscollectively project a futurechangein trend.
Time DistanceBetween Two Pivots
Time DistanceBetween Two Pivots
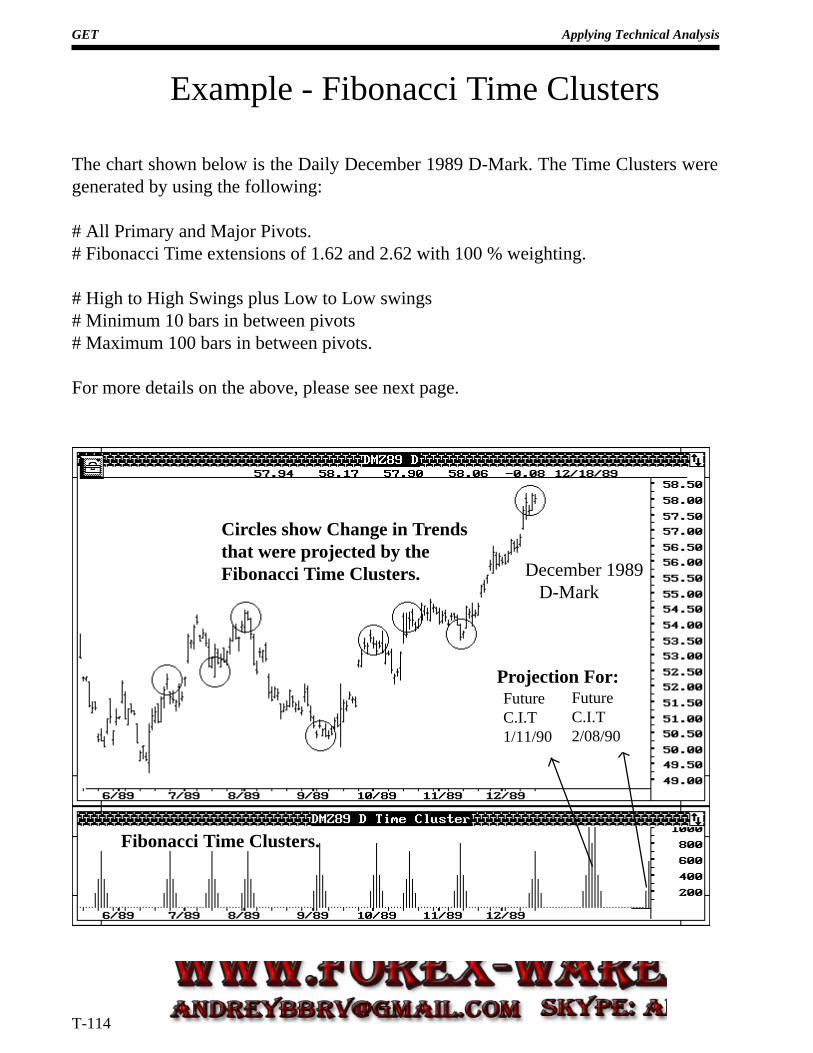
GET Applying Technical Analysis
T-114
Example - Fibonacci Time Clusters
The chart shown below is the Daily December 1989 D-Mark. The Time Clusters weregenerated by using the following:
# All Primary and Major Pivots.# Fibonacci Time extensions of 1.62 and 2.62 with 100 % weighting.
# High to High Swings plus Low to Low swings# Minimum 10 bars in between pivots# Maximum 100 bars in between pivots.
For more details on the above, please see next page.
Circles show Change in Trendsthat were projected by theFibonacci Time Clusters. December 1989
D-Mark
Fibonacci Time Clusters.
FutureC.I.T2/08/90
FutureC.I.T1/11/90
Projection For:
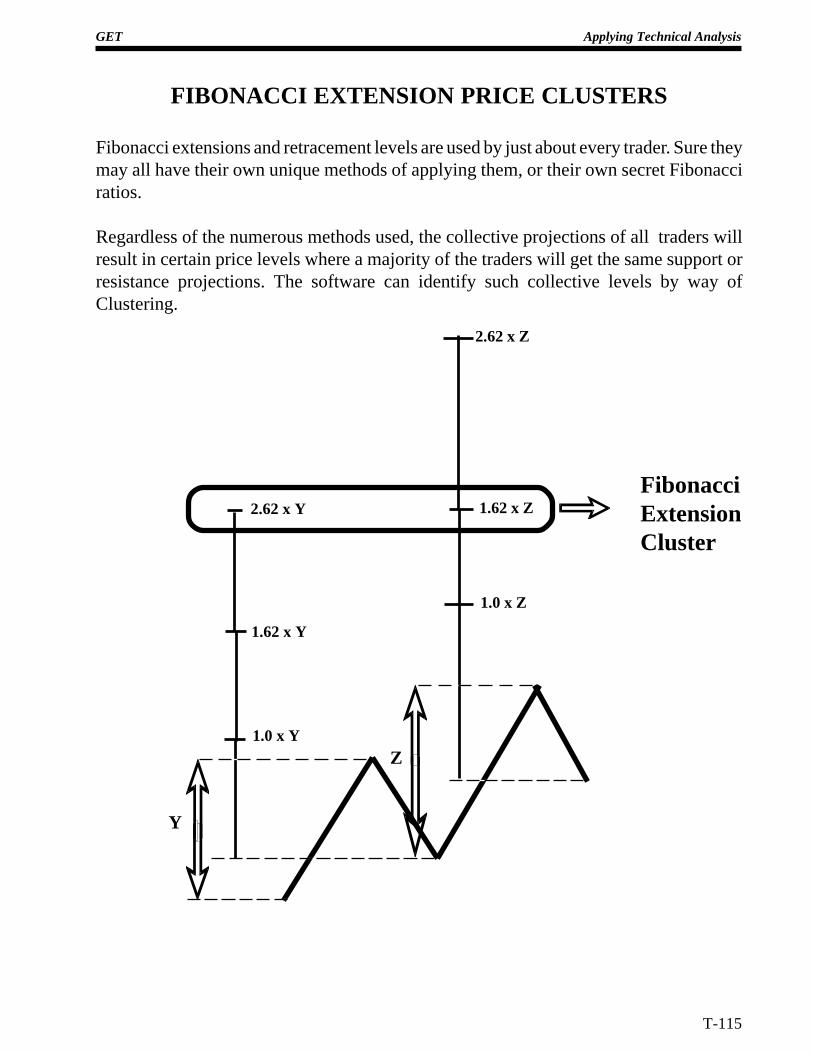
GET Applying Technical Analysis
T-115
FIBONACCI EXTENSION PRICE CLUSTERS
Fibonacci extensions and retracement levels are used by just about every trader. Sure theymay all have their own unique methods of applying them, or their own secret Fibonacciratios.
Regardless of the numerous methods used, the collective projections of all traders willresult in certain price levels where a majority of the traders will get the same support orresistance projections. The software can identify such collective levels by way ofClustering.
Y
Z1.0 x Y
1.62 x Y
2.62 x Y 1.62 x Z
1.0 x Z
2.62 x Z
FibonacciExtensionCluster
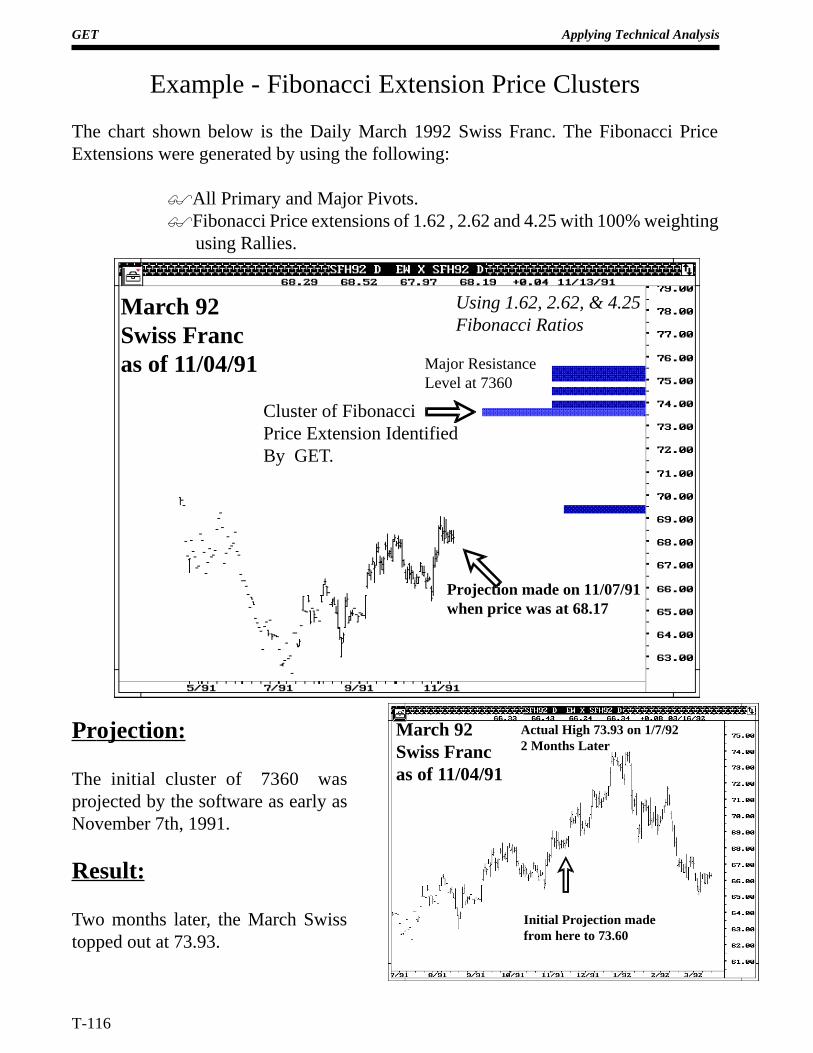
GET Applying Technical Analysis
T-116
Example - Fibonacci Extension Price Clusters
The chart shown below is the Daily March 1992 Swiss Franc. The Fibonacci PriceExtensions were generated by using the following:
$All Primary and Major Pivots.$Fibonacci Price extensions of 1.62 , 2.62 and 4.25 with 100% weighting using Rallies.
Projection:
The initial cluster of 7360 wasprojected by the software as early asNovember 7th, 1991.
Result:
Two months later, the March Swisstopped out at 73.93.
March 92Swiss Francas of 11/04/91 Major Resistance
Level at 7360
Initial Projection madefrom here to 73.60
Cluster of FibonacciPrice Extension IdentifiedBy GET.
Using 1.62, 2.62, & 4.25Fibonacci Ratios
Actual High 73.93 on 1/7/922 Months Later
March 92Swiss Francas of 11/04/91
Projection made on 11/07/91when price was at 68.17
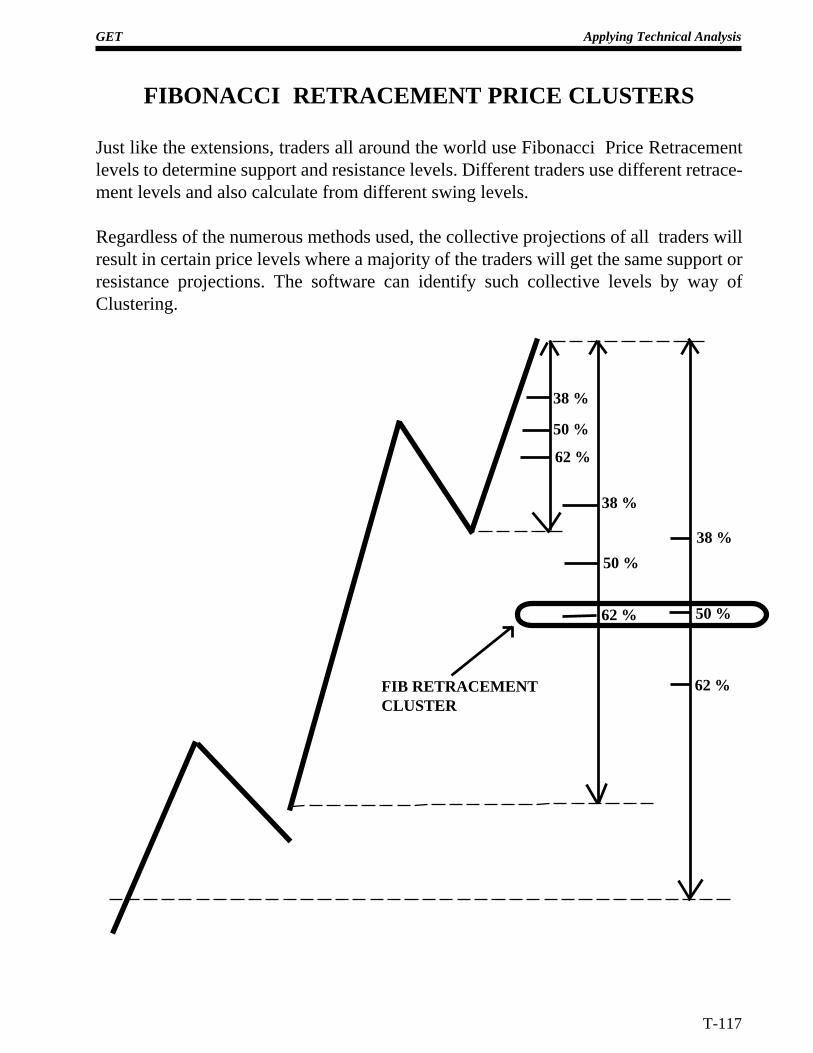
GET Applying Technical Analysis
T-117
FIBONACCI RETRACEMENT PRICE CLUSTERS
Just like the extensions, traders all around the world use Fibonacci Price Retracementlevels to determine support and resistance levels. Different traders use different retrace-ment levels and also calculate from different swing levels.
Regardless of the numerous methods used, the collective projections of all traders willresult in certain price levels where a majority of the traders will get the same support orresistance projections. The software can identify such collective levels by way ofClustering.
62 %
50 %
38 %
38 %
50 %
62 %
62 %
50 %
38 %
FIB RETRACEMENTCLUSTER
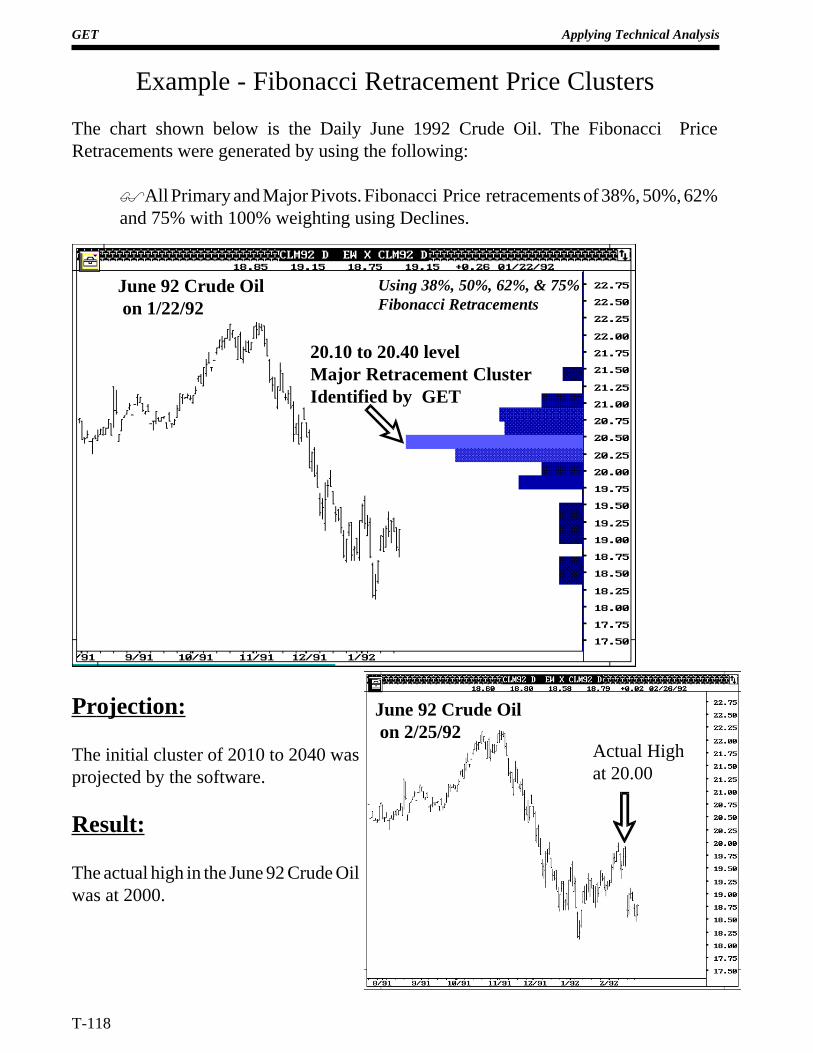
GET Applying Technical Analysis
T-118
Example - Fibonacci Retracement Price Clusters
The chart shown below is the Daily June 1992 Crude Oil. The Fibonacci PriceRetracements were generated by using the following:
$All Primary and Major Pivots. Fibonacci Price retracements of 38%, 50%, 62%and 75% with 100% weighting using Declines.
Projection:
The initial cluster of 2010 to 2040 wasprojected by the software.
Result:
The actual high in the June 92 Crude Oilwas at 2000.
Actual Highat 20.00
June 92 Crude Oil on 1/22/92
June 92 Crude Oil on 2/25/92
Using 38%, 50%, 62%, & 75%Fibonacci Retracements
20.10 to 20.40 levelMajor Retracement ClusterIdentified by GET
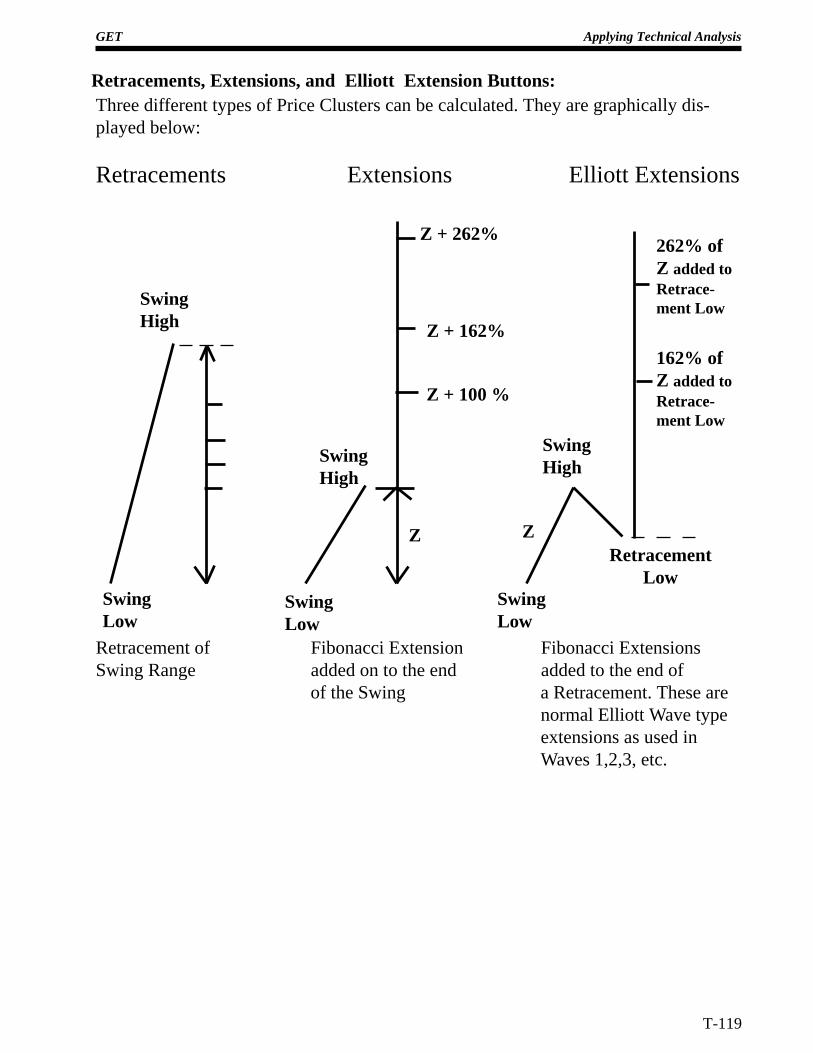
GET Applying Technical Analysis
T-119
Three different types of Price Clusters can be calculated. They are graphically dis-played below:
Retracements Extensions Elliott Extensions
Retracement of Fibonacci Extension Fibonacci ExtensionsSwing Range added on to the end added to the end of
of the Swing a Retracement. These are normal Elliott Wave type extensions as used in Waves 1,2,3, etc.
SwingLow
SwingLow
SwingLow
SwingHigh
RetracementLow
Retracements, Extensions, and Elliott Extension Buttons:
SwingHigh
Z
Z + 100 %
Z + 162%
Z + 262%
162% ofZ added toRetrace-ment Low
262% ofZ added toRetrace-ment Low
SwingHigh
Z
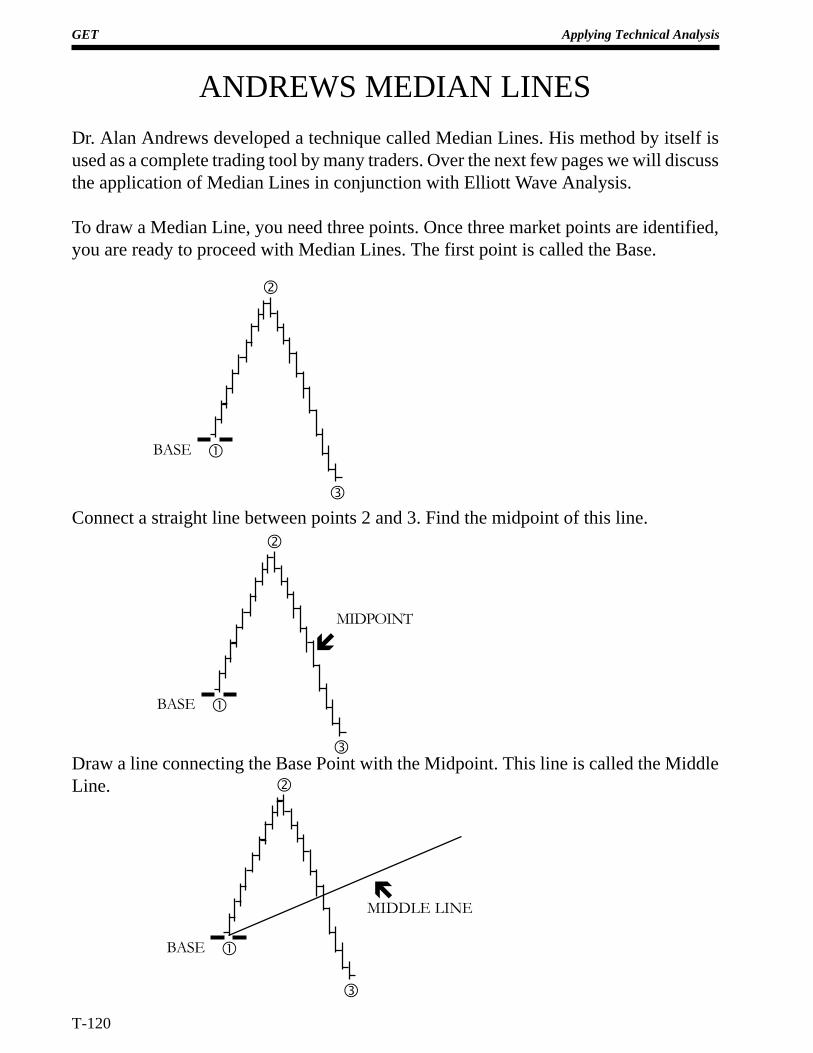
GET Applying Technical Analysis
T-120
ANDREWS MEDIAN LINES
Dr. Alan Andrews developed a technique called Median Lines. His method by itself isused as a complete trading tool by many traders. Over the next few pages we will discussthe application of Median Lines in conjunction with Elliott Wave Analysis.
To draw a Median Line, you need three points. Once three market points are identified,you are ready to proceed with Median Lines. The first point is called the Base.
Connect a straight line between points 2 and 3. Find the midpoint of this line.
Draw a line connecting the Base Point with the Midpoint. This line is called the MiddleLine.
�
�
�
BASE
�
�
�
BASE
íMIDPOINT
�
�
�
BASE
MIDDLE LINEë
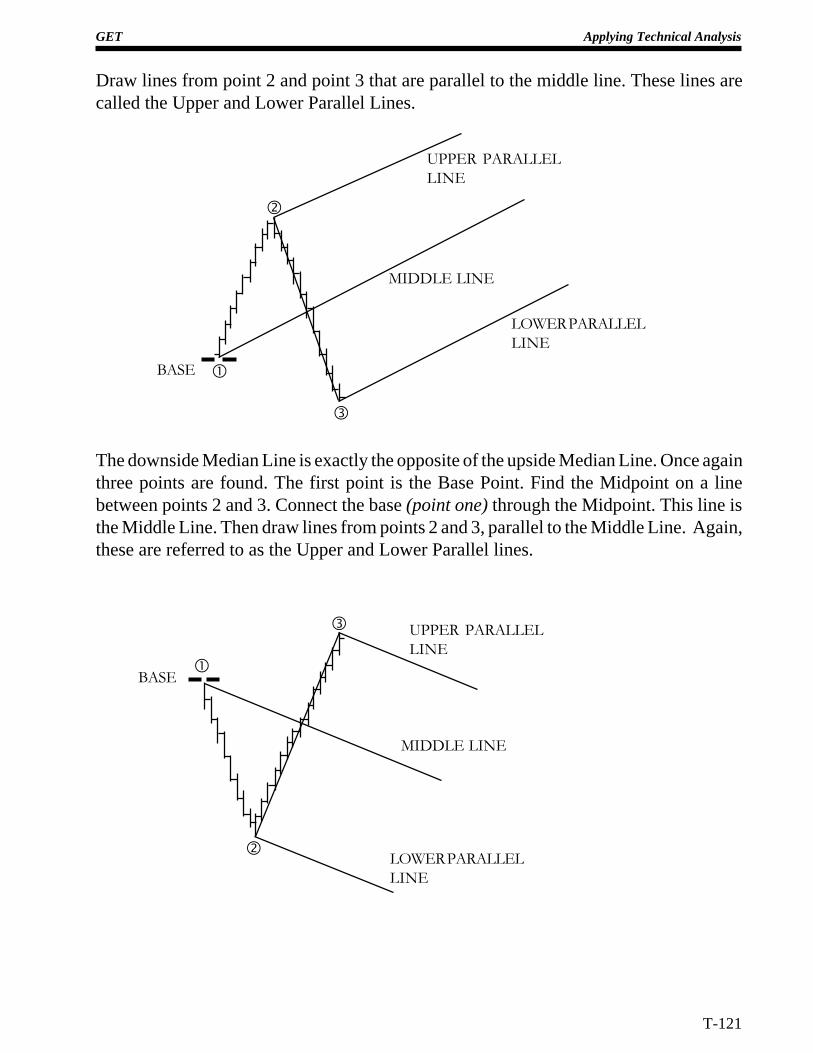
GET Applying Technical Analysis
T-121
Draw lines from point 2 and point 3 that are parallel to the middle line. These lines arecalled the Upper and Lower Parallel Lines.
The downside Median Line is exactly the opposite of the upside Median Line. Once againthree points are found. The first point is the Base Point. Find the Midpoint on a linebetween points 2 and 3. Connect the base (point one) through the Midpoint. This line isthe Middle Line. Then draw lines from points 2 and 3, parallel to the Middle Line. Again,these are referred to as the Upper and Lower Parallel lines.
�
�
�
MIDDLE LINE
�
�
�
BASE
MIDDLE LINE
LOWER PARALLELLINE
UPPER PARALLELLINE
UPPER PARALLELLINE
LOWER PARALLELLINE
BASE
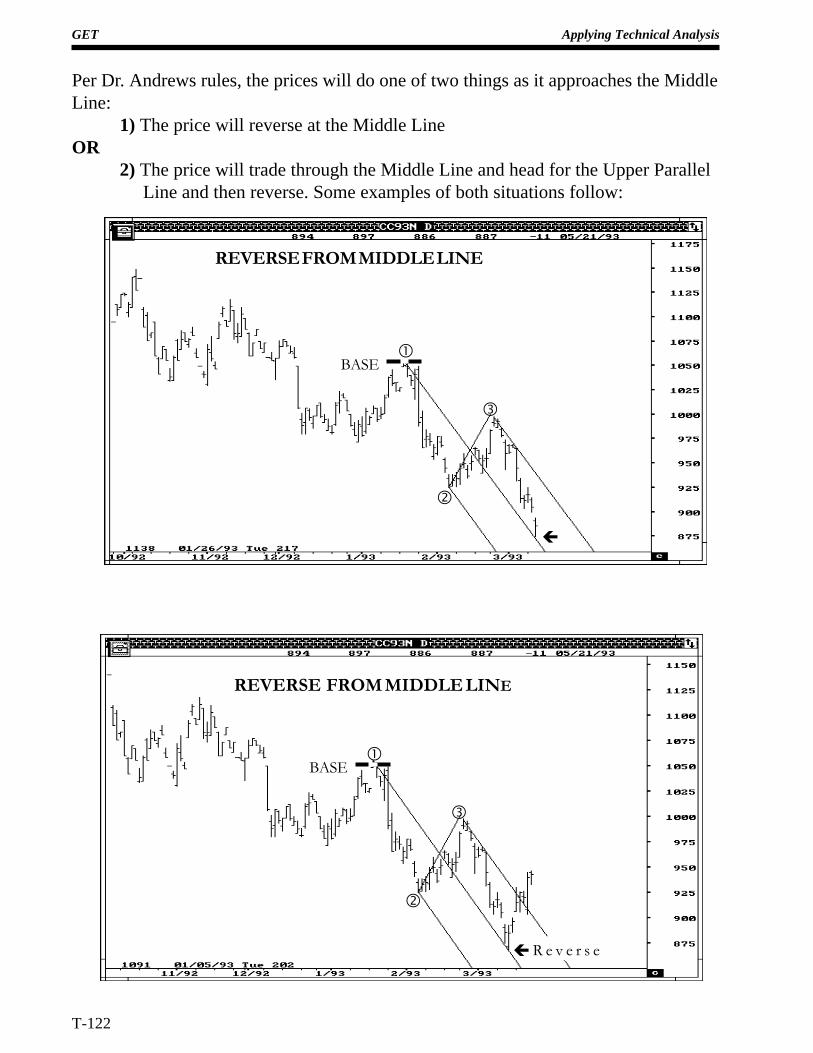
GET Applying Technical Analysis
T-122
Per Dr. Andrews rules, the prices will do one of two things as it approaches the MiddleLine:
1) The price will reverse at the Middle LineOR
2) The price will trade through the Middle Line and head for the Upper Parallel Line and then reverse. Some examples of both situations follow:
REVERSE FROM MIDDLE LINE
BASE�
�
�
BASE�
�
�
REVERSE FROM MIDDLE LINE
ç R e v e r s e
ç
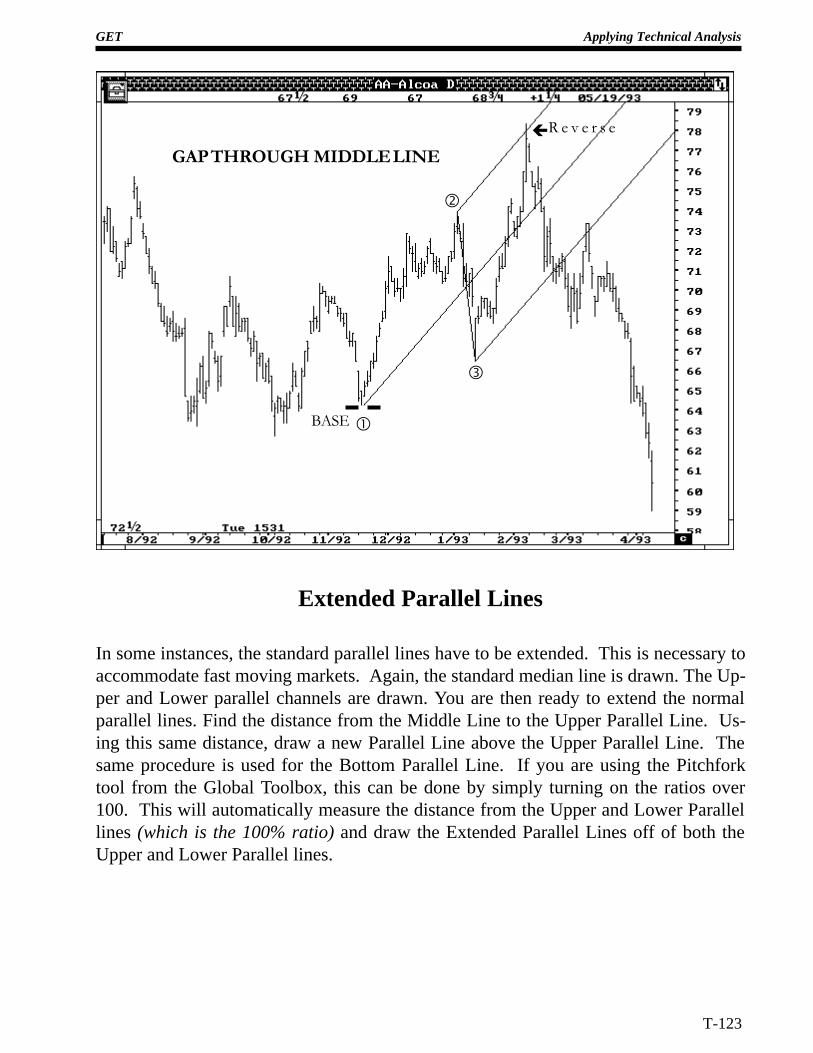
GET Applying Technical Analysis
T-123
BASE �
�
�
GAP THROUGH MIDDLE LINE
Extended Parallel Lines
In some instances, the standard parallel lines have to be extended. This is necessary toaccommodate fast moving markets. Again, the standard median line is drawn. The Up-per and Lower parallel channels are drawn. You are then ready to extend the normalparallel lines. Find the distance from the Middle Line to the Upper Parallel Line. Us-ing this same distance, draw a new Parallel Line above the Upper Parallel Line. Thesame procedure is used for the Bottom Parallel Line. If you are using the Pitchforktool from the Global Toolbox, this can be done by simply turning on the ratios over100. This will automatically measure the distance from the Upper and Lower Parallellines (which is the 100% ratio) and draw the Extended Parallel Lines off of both theUpper and Lower Parallel lines.
çR e v e r s e
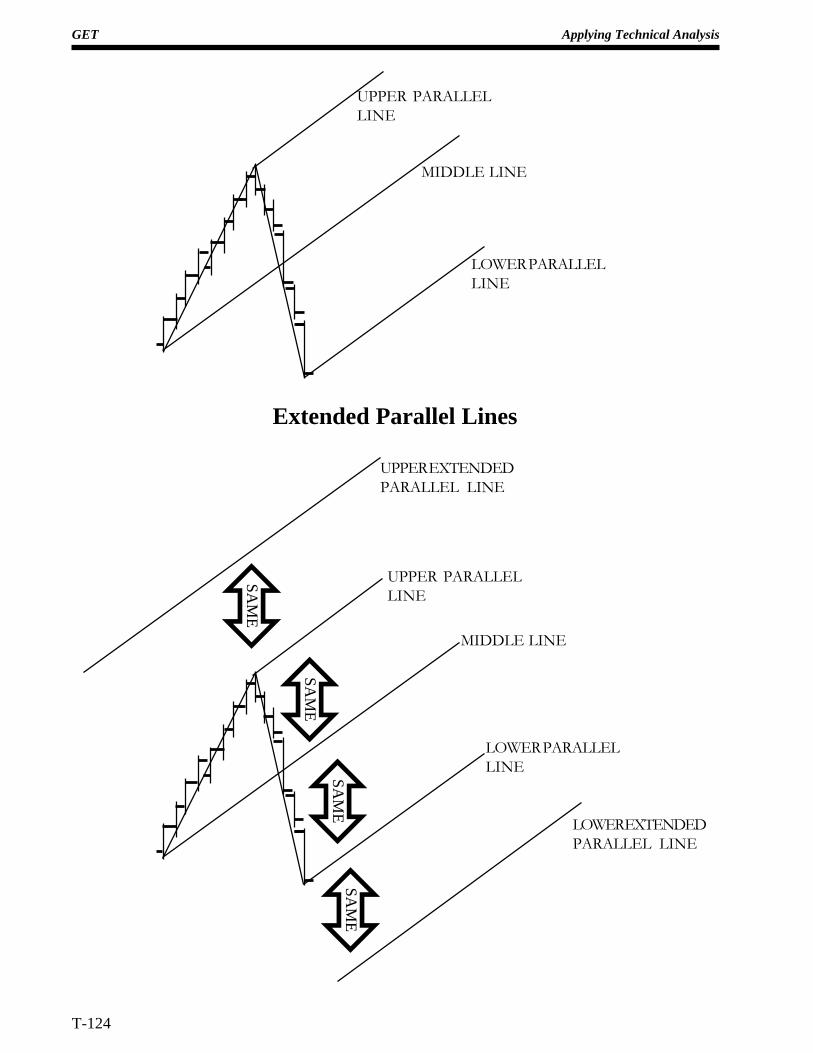
GET Applying Technical Analysis
T-124
MIDDLE LINE
UPPER PARALLELLINE
LOWER PARALLELLINE
LOWER PARALLELLINE
MIDDLE LINE
UPPER PARALLELLINE
LOWER EXTENDEDPARALLEL LINE
UPPER EXTENDEDPARALLEL LINE
ôSA
ME
ôSA
ME
ôSA
ME
ôSA
ME
Extended Parallel Lines
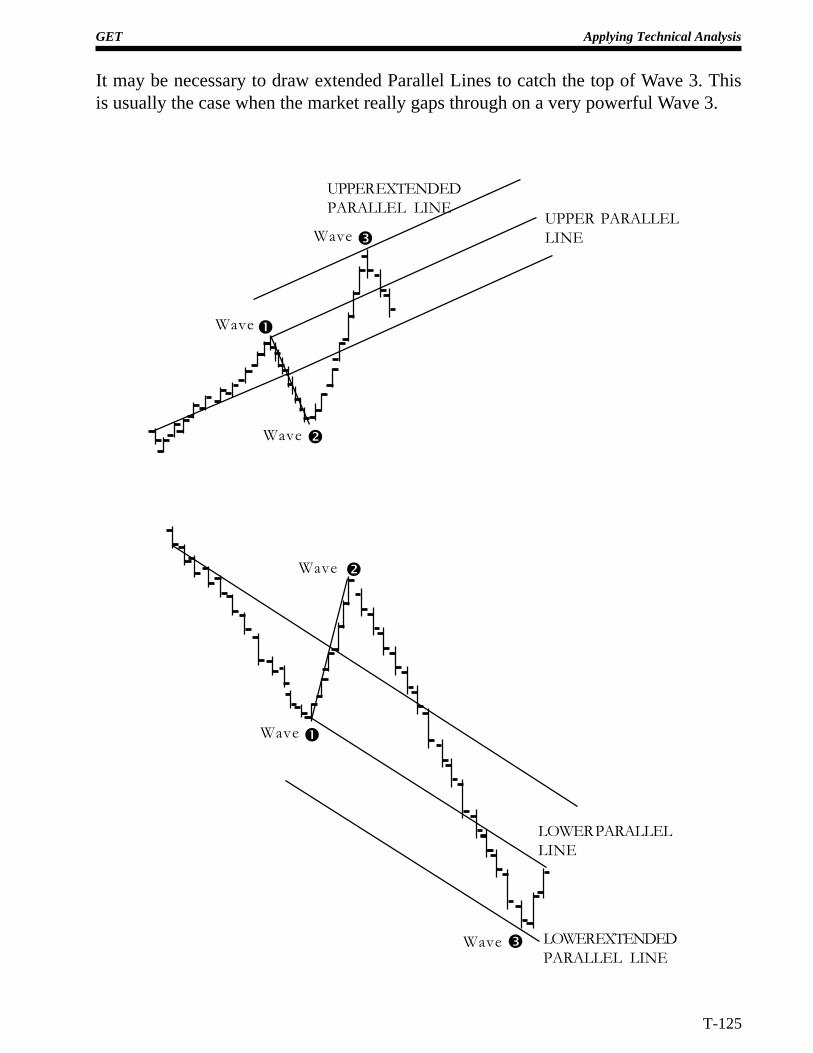
GET Applying Technical Analysis
T-125
It may be necessary to draw extended Parallel Lines to catch the top of Wave 3. Thisis usually the case when the market really gaps through on a very powerful Wave 3.
�
�
� LOWER EXTENDEDPARALLEL LINE
UPPER PARALLELLINE
UPPER EXTENDEDPARALLEL LINE
�
�
�Wave
Wave
Wave
LOWER PARALLELLINE
Wave
Wave
Wave
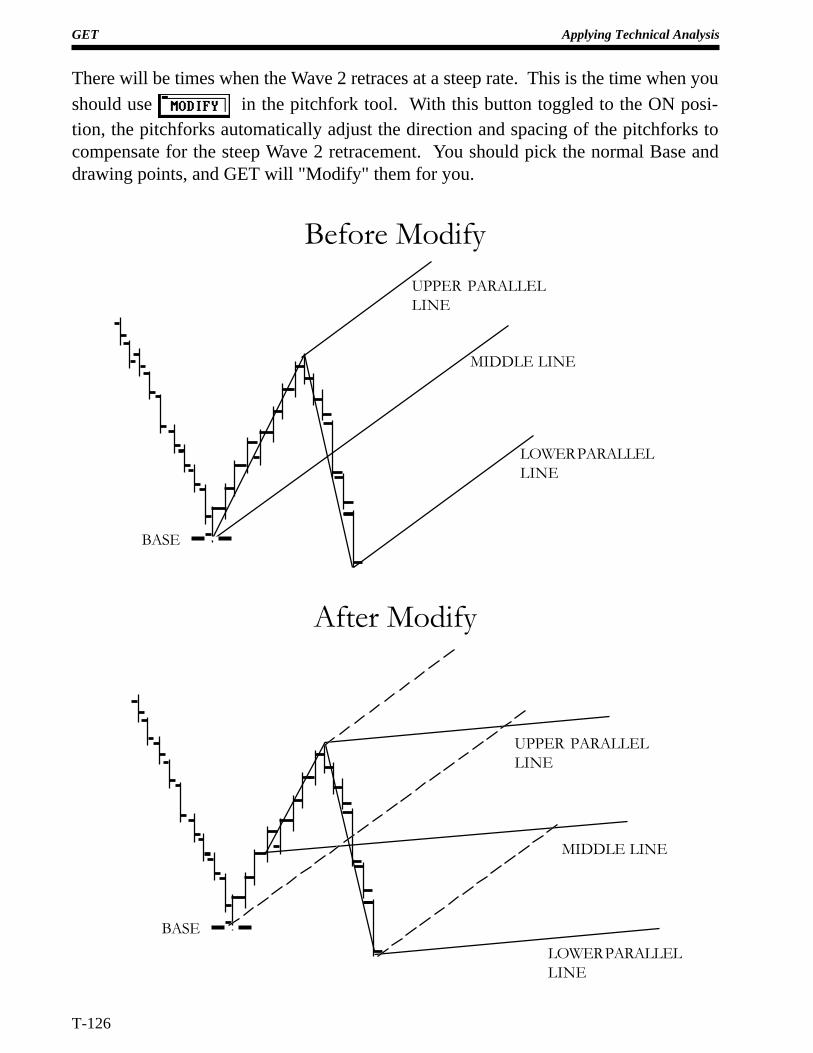
GET Applying Technical Analysis
T-126
There will be times when the Wave 2 retraces at a steep rate. This is the time when youshould use in the pitchfork tool. With this button toggled to the ON posi-tion, the pitchforks automatically adjust the direction and spacing of the pitchforks tocompensate for the steep Wave 2 retracement. You should pick the normal Base anddrawing points, and GET will "Modify" them for you.
BASE
MIDDLE LINE
LOWER PARALLELLINE
BASE
LOWER PARALLELLINE
MIDDLE LINE
UPPER PARALLELLINE
Before Modify
After Modify
UPPER PARALLELLINE
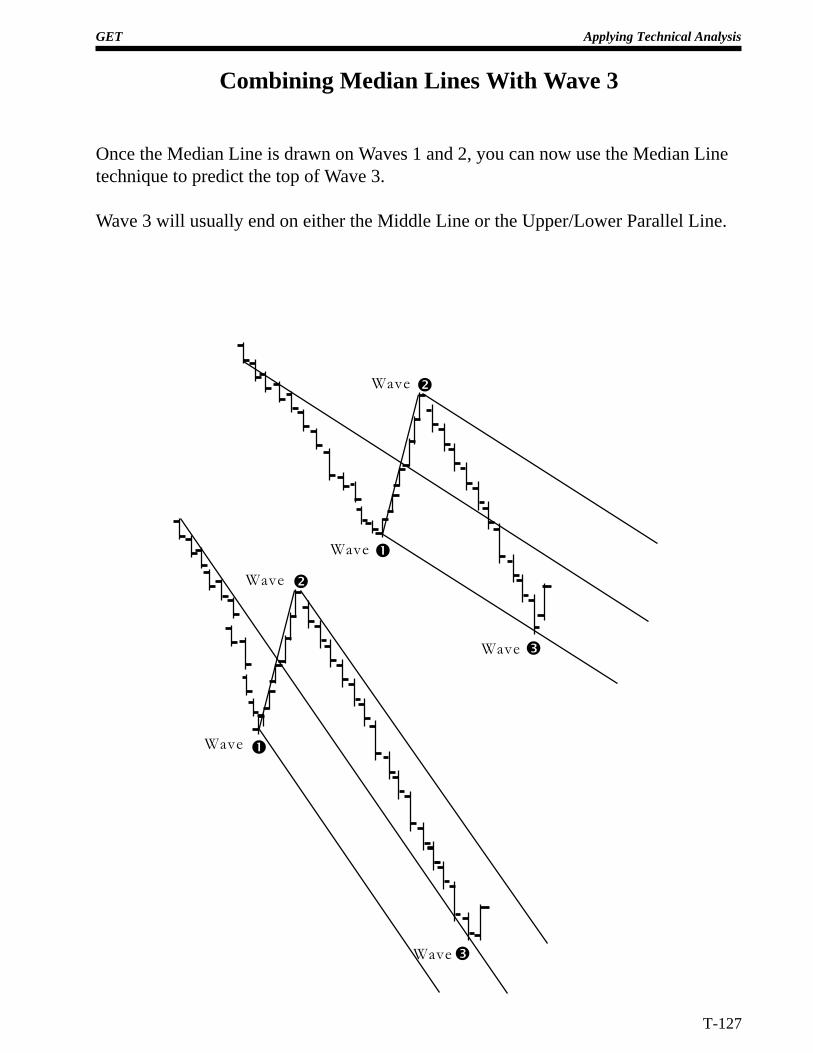
GET Applying Technical Analysis
T-127
�
�
�
�
�
�
Combining Median Lines With Wave 3
Once the Median Line is drawn on Waves 1 and 2, you can now use the Median Linetechnique to predict the top of Wave 3.
Wave 3 will usually end on either the Middle Line or the Upper/Lower Parallel Line.
Wave
Wave
Wave
Wave
Wave
Wave
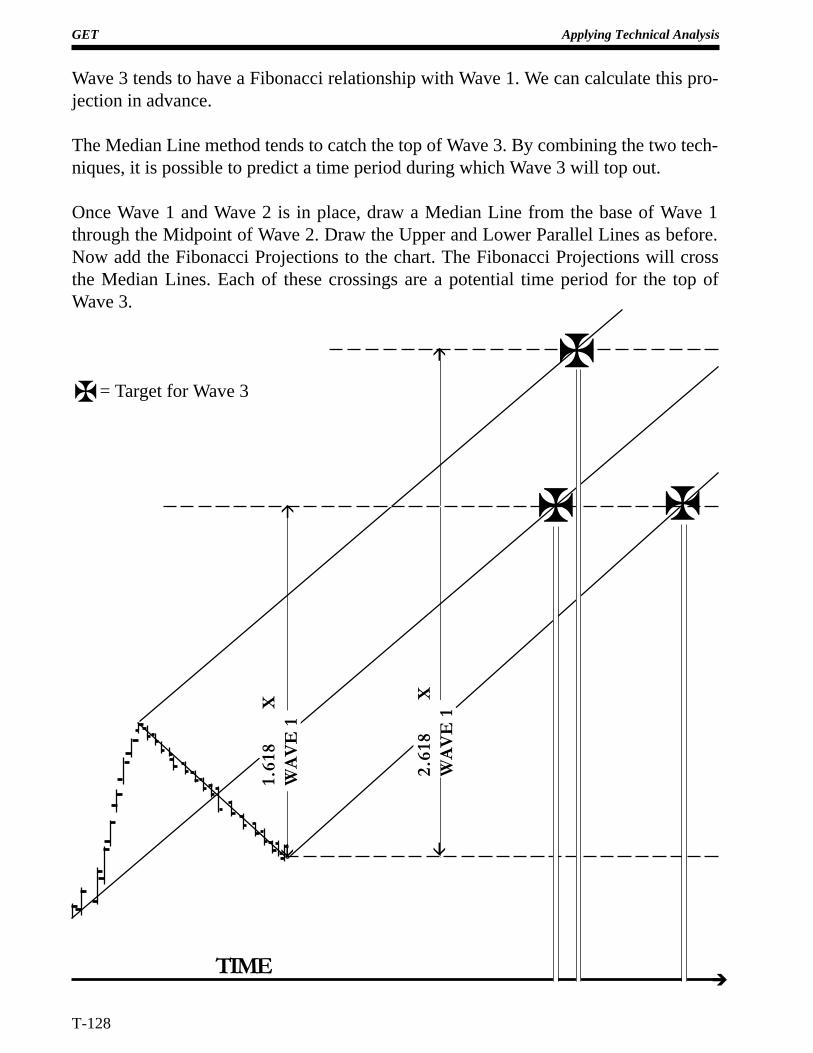
GET Applying Technical Analysis
T-128
TIME
Wave 3 tends to have a Fibonacci relationship with Wave 1. We can calculate this pro-jection in advance.
The Median Line method tends to catch the top of Wave 3. By combining the two tech-niques, it is possible to predict a time period during which Wave 3 will top out.
Once Wave 1 and Wave 2 is in place, draw a Median Line from the base of Wave 1through the Midpoint of Wave 2. Draw the Upper and Lower Parallel Lines as before.Now add the Fibonacci Projections to the chart. The Fibonacci Projections will crossthe Median Lines. Each of these crossings are a potential time period for the top ofWave 3.
= Target for Wave 3X
X X
2.61
8
XW
AV
E 1
1.61
8
XW
AV
E 1
ââ
á
á
X
è
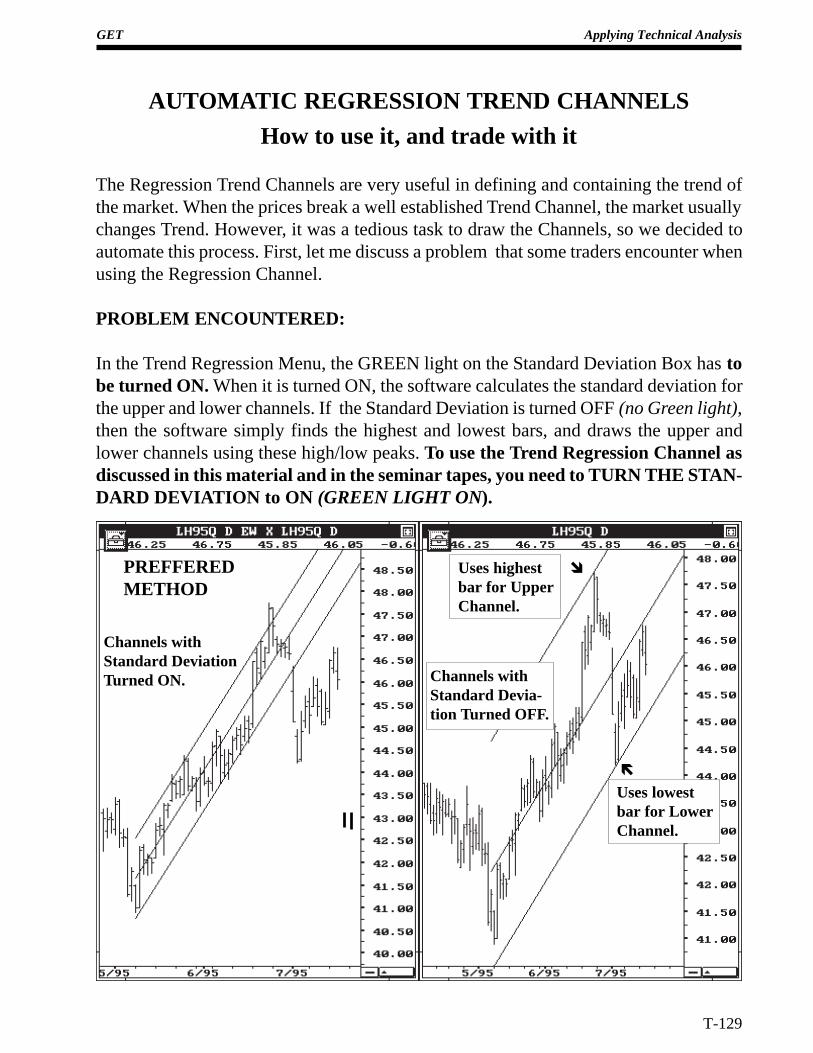
GET Applying Technical Analysis
T-129
AUTOMATIC REGRESSION TREND CHANNELS
How to use it, and trade with it
The Regression Trend Channels are very useful in defining and containing the trend ofthe market. When the prices break a well established Trend Channel, the market usuallychanges Trend. However, it was a tedious task to draw the Channels, so we decided toautomate this process. First, let me discuss a problem that some traders encounter whenusing the Regression Channel.
PROBLEM ENCOUNTERED:
In the Trend Regression Menu, the GREEN light on the Standard Deviation Box has tobe turned ON. When it is turned ON, the software calculates the standard deviation forthe upper and lower channels. If the Standard Deviation is turned OFF (no Green light),then the software simply finds the highest and lowest bars, and draws the upper andlower channels using these high/low peaks. To use the Trend Regression Channel asdiscussed in this material and in the seminar tapes, you need to TURN THE STAN-DARD DEVIATION to ON (GREEN LIGHT ON).
Uses lowestbar for LowerChannel.
Channels withStandard Devia-tion Turned OFF.
Uses highestbar for UpperChannel.
Channels withStandard DeviationTurned ON.
ë
îPREFFEREDMETHOD
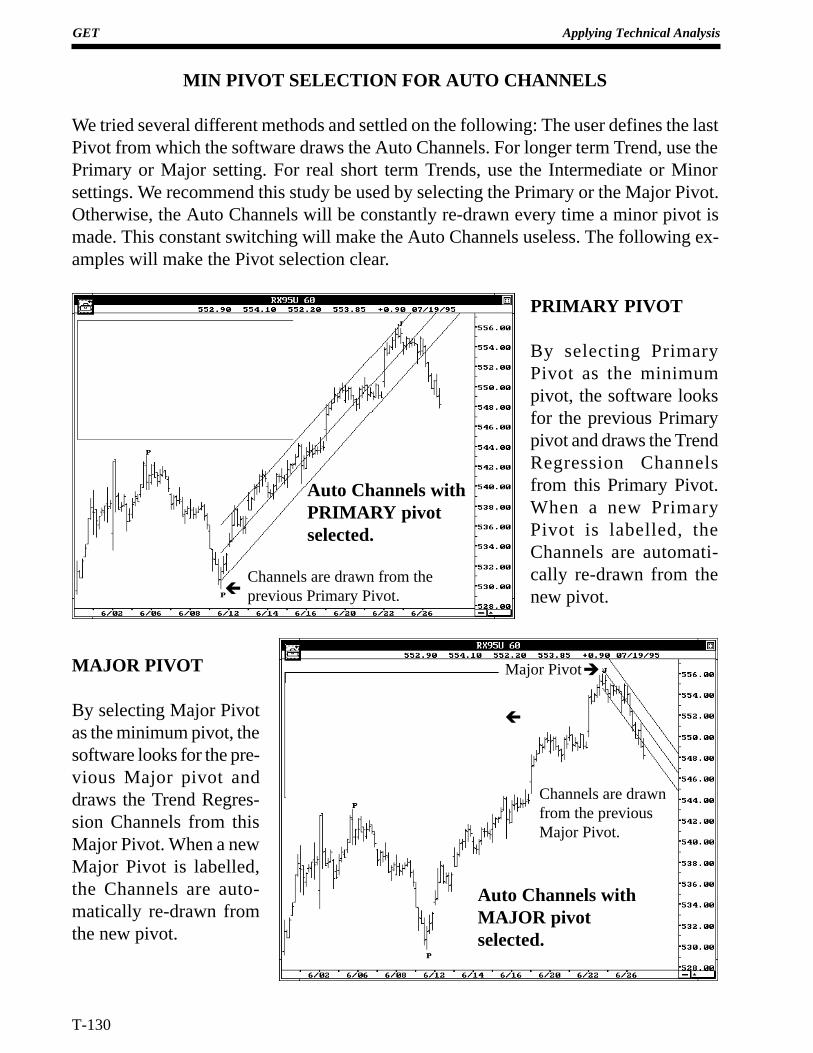
GET Applying Technical Analysis
T-130
MIN PIVOT SELECTION FOR AUTO CHANNELS
We tried several different methods and settled on the following: The user defines the lastPivot from which the software draws the Auto Channels. For longer term Trend, use thePrimary or Major setting. For real short term Trends, use the Intermediate or Minorsettings. We recommend this study be used by selecting the Primary or the Major Pivot.Otherwise, the Auto Channels will be constantly re-drawn every time a minor pivot ismade. This constant switching will make the Auto Channels useless. The following ex-amples will make the Pivot selection clear.
Auto Channels withPRIMARY pivotselected.
ç
PRIMARY PIVOT
By selecting PrimaryPivot as the minimumpivot, the software looksfor the previous Primarypivot and draws the TrendRegression Channelsfrom this Primary Pivot.When a new PrimaryPivot is labelled, theChannels are automati-cally re-drawn from thenew pivot.
MAJOR PIVOT
By selecting Major Pivotas the minimum pivot, thesoftware looks for the pre-vious Major pivot anddraws the Trend Regres-sion Channels from thisMajor Pivot. When a newMajor Pivot is labelled,the Channels are auto-matically re-drawn fromthe new pivot.
Channels are drawn from theprevious Primary Pivot.
Channels are drawnfrom the previousMajor Pivot.
Auto Channels withMAJOR pivotselected.
ç
èMajor Pivot
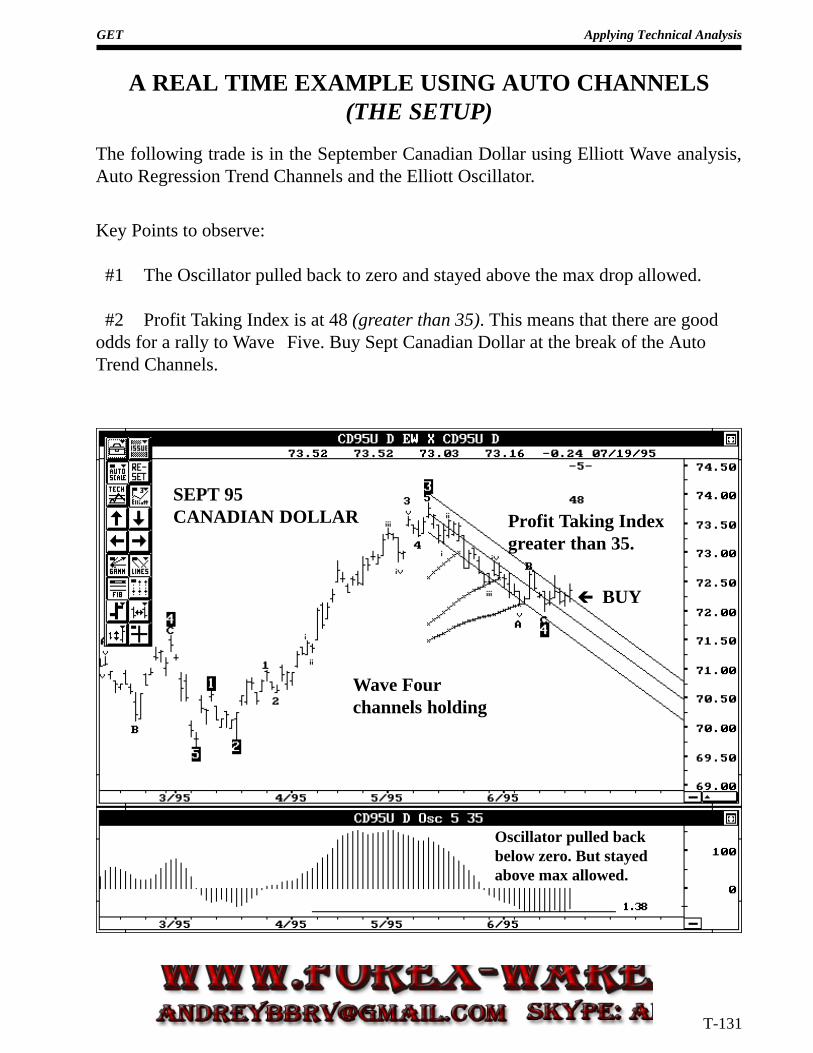
GET Applying Technical Analysis
T-131
A REAL TIME EXAMPLE USING AUTO CHANNELS(THE SETUP)
The following trade is in the September Canadian Dollar using Elliott Wave analysis,Auto Regression Trend Channels and the Elliott Oscillator.
Key Points to observe:
#1 The Oscillator pulled back to zero and stayed above the max drop allowed.
#2 Profit Taking Index is at 48 (greater than 35). This means that there are goododds for a rally to Wave Five. Buy Sept Canadian Dollar at the break of the AutoTrend Channels.
Wave Fourchannels holding
Profit Taking Indexgreater than 35.
ç BUY
SEPT 95CANADIAN DOLLAR
Oscillator pulled backbelow zero. But stayedabove max allowed.
GET Applying Technical Analysis
T-132
Expert Trend Locator - XTL
The need for XTL:
Advanced GET does an excellent job in identifying Elliott Wave counts. When combined withstudies such as the Profit Taking Index, Wave Four Channels, Trend Channels etc., a veryeffective Mechanical trading strategy is available to GET users. This Mechanical strategy fo-cuses mainly on:
a) Trading the Wave Four to Wave Five segment in Type One Trades.b) Trading the end of Wave Five in Type Two Trades.
While this has been very productive, we still lacked a Mechanical type entry into some of themassive Wave Three swings generated in the market. So far, this was accomplished by stayingin Type Two Trades entered at the end of a Wave Five and waiting for the Wave Three todevelop. On numerous occasions, many of our users requested that we come up with a tech-nique that allows early entries in Wave Three swings.
After some extensive research, we released the Joseph Trend Index in 1995. The JTI was de-signed to confirm Wave Three swings once the swing matured. It performed this task by pro-ducing an exponential curve in Major Wave Three swings. However, in some cases, the confir-mation was accomplished a little too late for the user to take full advantage of the entire WaveThree swing, specifically in terms of an early entry.
The Task:
Since the last release of Advanced GET 6.0 in March 1995, I have dedicated my researchexclusively to find a reasonable solution to identify Wave Three swings at its early stages. Theresult is XTL - Expert Trend Locator.
The Theory behind XTL:
If we carefully look at any chart, you will find periods where the market tends to trade back andforth without any clear direction with swings that reverse at random. Looking back, many ofthese swings can be classified as noise. The following example on the next page shows Feb 96Gold trading sideways without any real Trend in the market.
For discussion purposes, this is a market that is trading in a random fashion. If you sim-ply trade this market using a Trend following system, you would get whipsawed by buying at
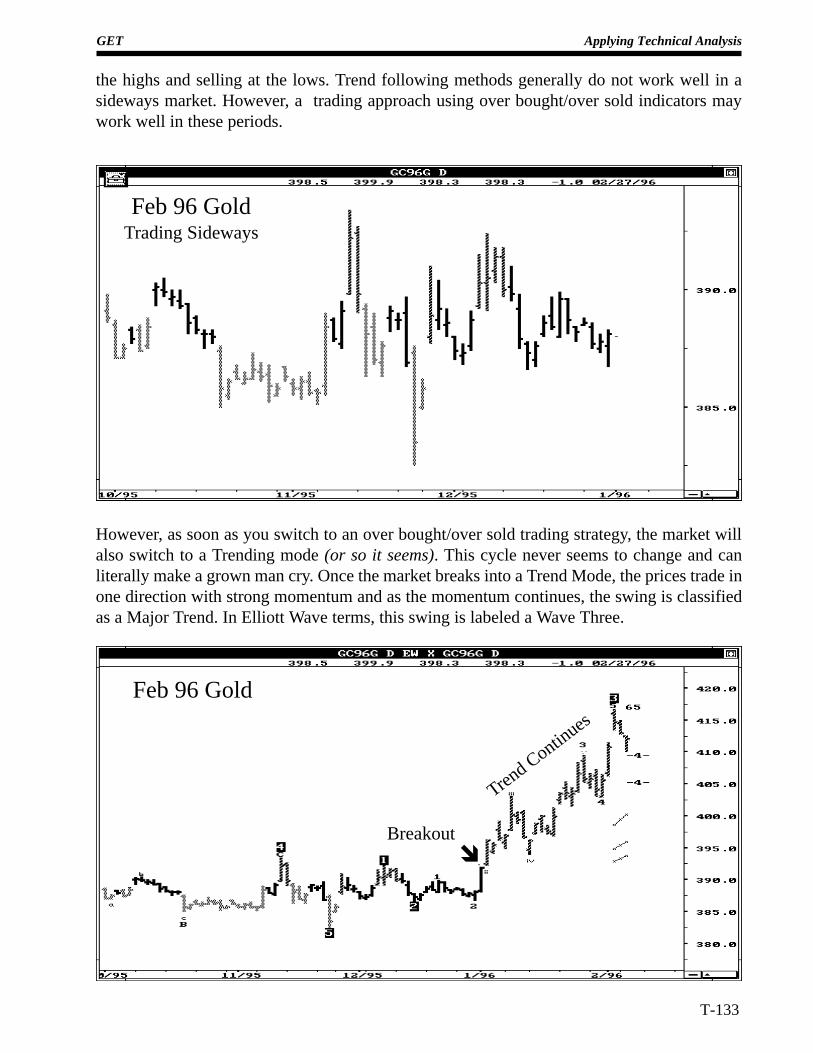
GET Applying Technical Analysis
T-133
However, as soon as you switch to an over bought/over sold trading strategy, the market willalso switch to a Trending mode (or so it seems). This cycle never seems to change and canliterally make a grown man cry. Once the market breaks into a Trend Mode, the prices trade inone direction with strong momentum and as the momentum continues, the swing is classifiedas a Major Trend. In Elliott Wave terms, this swing is labeled a Wave Three.
the highs and selling at the lows. Trend following methods generally do not work well in asideways market. However, a trading approach using over bought/over sold indicators maywork well in these periods.
Feb 96 GoldTrading Sideways
Feb 96 Gold
Breakout
Trend Contin
ues
î
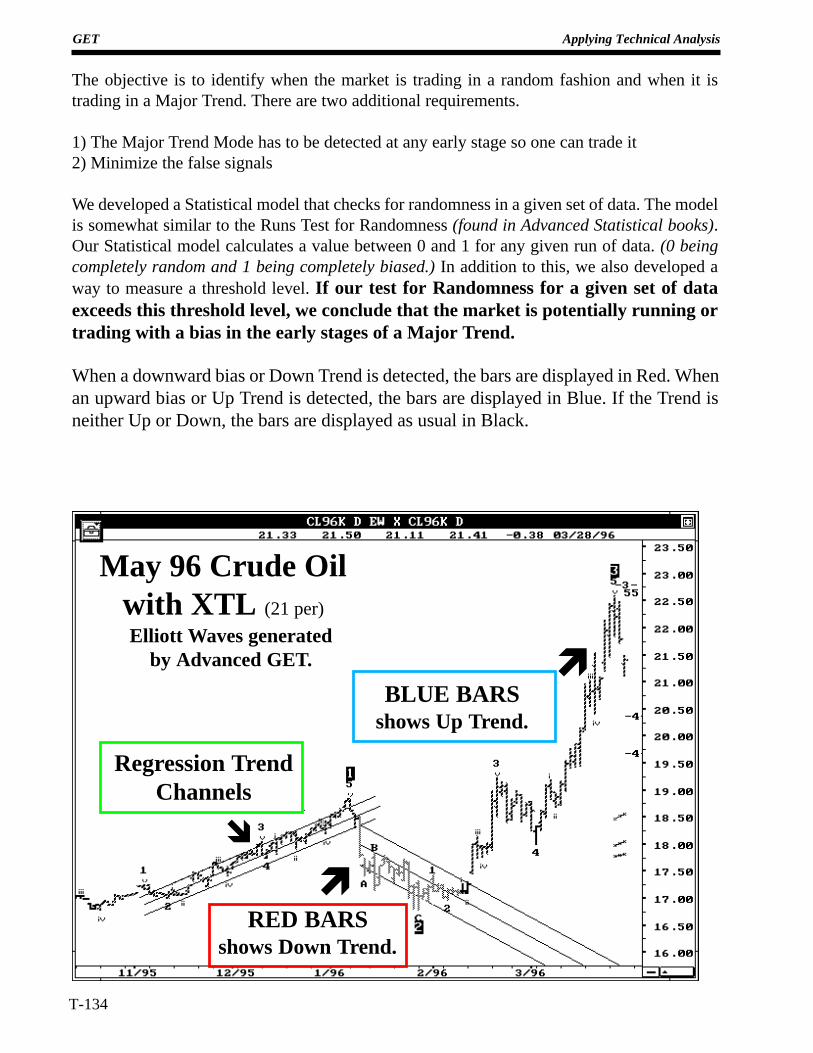
GET Applying Technical Analysis
T-134
The objective is to identify when the market is trading in a random fashion and when it istrading in a Major Trend. There are two additional requirements.
1) The Major Trend Mode has to be detected at any early stage so one can trade it2) Minimize the false signals
We developed a Statistical model that checks for randomness in a given set of data. The modelis somewhat similar to the Runs Test for Randomness (found in Advanced Statistical books).Our Statistical model calculates a value between 0 and 1 for any given run of data. (0 beingcompletely random and 1 being completely biased.) In addition to this, we also developed away to measure a threshold level. If our test for Randomness for a given set of dataexceeds this threshold level, we conclude that the market is potentially running ortrading with a bias in the early stages of a Major Trend.
When a downward bias or Down Trend is detected, the bars are displayed in Red. Whenan upward bias or Up Trend is detected, the bars are displayed in Blue. If the Trend isneither Up or Down, the bars are displayed as usual in Black.
ì
RED BARSshows Down Trend.
ì
May 96 Crude Oilwith XTL (21 per)
î
Elliott Waves generatedby Advanced GET.
BLUE BARSshows Up Trend.
Regression TrendChannels
GET Applying Technical Analysis
T-135
Portability:
Any study is valid only if it is portable to other markets. The Statistical model we developed forthe XTL meets this criteria. It works on all markets (Stocks and Futures) and for any timeframe without any modification.
Compatibility with Elliott Wave analysis:
Almost all Wave Three swings generate strong and extended momentum to be classified as aMajor Trend. In a majority of the cases, the XTL can identify the Major Trend at the earlystages of a Wave Three. Since the XTL is a Statistical model and does not use Elliott Wavelogic, it provides an independent confirmation and early entry tool for Wave Three typeswings.
DESIGNATED USE FOR XTL:
Perhaps the single most valuable use for the XTL is to identify the early stages of a WaveThree type rally or decline. Elliott Wave analysis alerts the user of a potential Change inTrend and the XTL detects or identifies this Change in Trend. Thus the combination ofElliott Wave analysis and the XTL provides the added luxury of both anticipating andconfirming the Trend.
On the next several pages, we will discuss how to use the XTL and explain some of the recom-mended trading rules. We suggest you use the training mode and test our recommended ideason various markets. Then form a plan that fits your trading style.
SETTINGS FOR XTL:
There is only one user setting (input) required for calculating the Expert Trend Locator (XTL)study. This is the number of bars of data used to test for Randomness. The default setting is 35periods and we highly recommend this. Using a 35 period setting reduces the number of falsebreak out signals. However, using a 21 period setting allows the XTL to identify the MajorTrend at a much earlier stage.
Thus, while the 35 period XTL offers less false signals, the 21 period XTL identifies the MajorTrend one or two bars earlier.
Which setting (35 period or 21 period) you use is your personal preference. The best wayto decide the best setting, use the training mode to back test on past data and find thesetting that suits your style of trading.
We have also enclosed examples using both settings to further illustrate the advantagesand drawbacks of both.
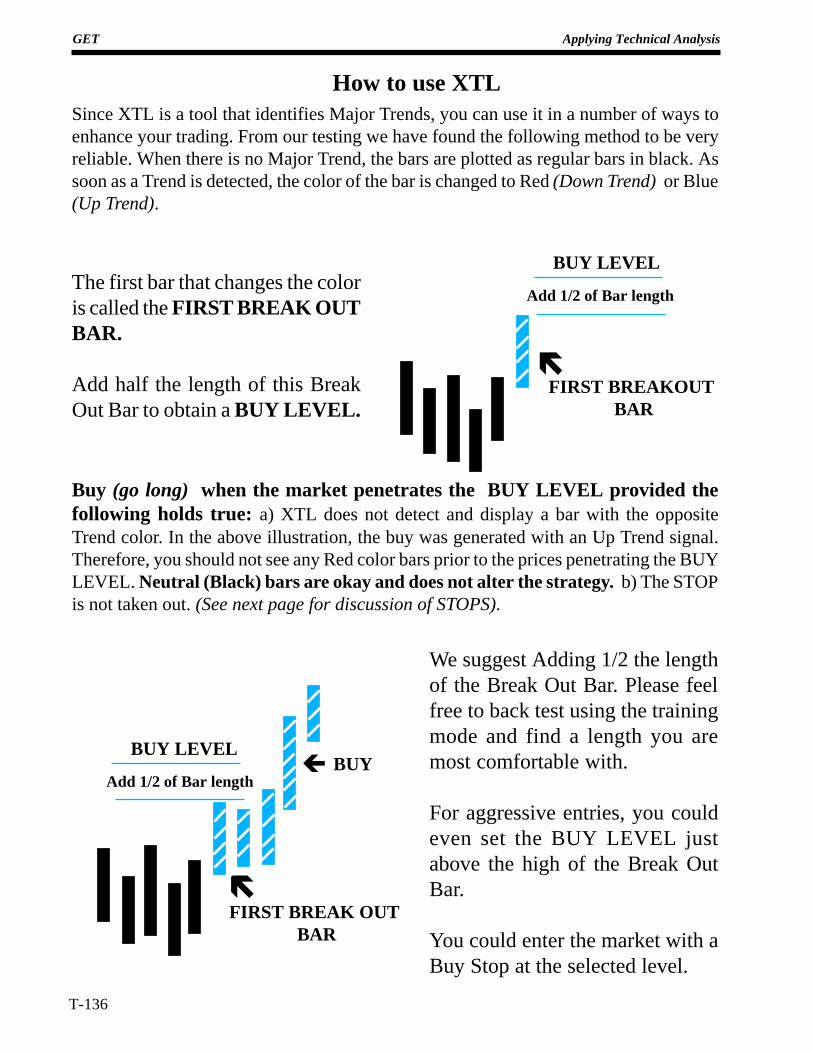
GET Applying Technical Analysis
T-136
How to use XTLSince XTL is a tool that identifies Major Trends, you can use it in a number of ways toenhance your trading. From our testing we have found the following method to be veryreliable. When there is no Major Trend, the bars are plotted as regular bars in black. Assoon as a Trend is detected, the color of the bar is changed to Red (Down Trend) or Blue(Up Trend).
FIRST BREAKOUT BAR
ë
ëFIRST BREAK OUT
BAR
BUY LEVEL
BUY LEVELç BUY
Add 1/2 of Bar length
Add 1/2 of Bar length
The first bar that changes the coloris called the FIRST BREAK OUTBAR.
Add half the length of this BreakOut Bar to obtain a BUY LEVEL.
Buy (go long) when the market penetrates the BUY LEVEL provided thefollowing holds true: a) XTL does not detect and display a bar with the oppositeTrend color. In the above illustration, the buy was generated with an Up Trend signal.Therefore, you should not see any Red color bars prior to the prices penetrating the BUYLEVEL. Neutral (Black) bars are okay and does not alter the strategy. b) The STOPis not taken out. (See next page for discussion of STOPS).
We suggest Adding 1/2 the lengthof the Break Out Bar. Please feelfree to back test using the trainingmode and find a length you aremost comfortable with.
For aggressive entries, you couldeven set the BUY LEVEL justabove the high of the Break OutBar.
You could enter the market with aBuy Stop at the selected level.
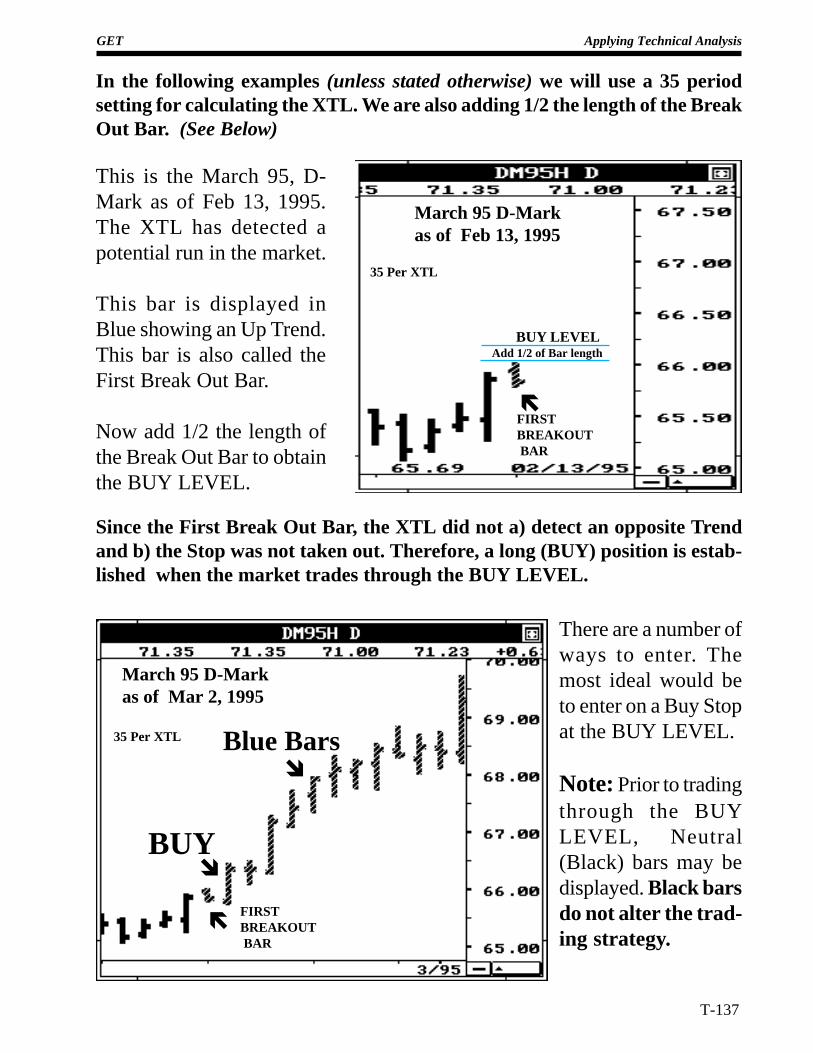
GET Applying Technical Analysis
T-137
ë
BUY LEVELAdd 1/2 of Bar length
FIRSTBREAKOUT BAR
March 95 D-Markas of Feb 13, 1995
ëFIRSTBREAKOUT BAR
îBUY
March 95 D-Markas of Mar 2, 1995
In the following examples (unless stated otherwise) we will use a 35 periodsetting for calculating the XTL. We are also adding 1/2 the length of the BreakOut Bar. (See Below)
This is the March 95, D-Mark as of Feb 13, 1995.The XTL has detected apotential run in the market.
This bar is displayed inBlue showing an Up Trend.This bar is also called theFirst Break Out Bar.
Now add 1/2 the length ofthe Break Out Bar to obtainthe BUY LEVEL.
ë
Since the First Break Out Bar, the XTL did not a) detect an opposite Trendand b) the Stop was not taken out. Therefore, a long (BUY) position is estab-lished when the market trades through the BUY LEVEL.
There are a number ofways to enter. Themost ideal would beto enter on a Buy Stopat the BUY LEVEL.
Note: Prior to tradingthrough the BUYLEVEL, Neutral(Black) bars may bedisplayed. Black barsdo not alter the trad-ing strategy.
îBlue Bars35 Per XTL
35 Per XTL
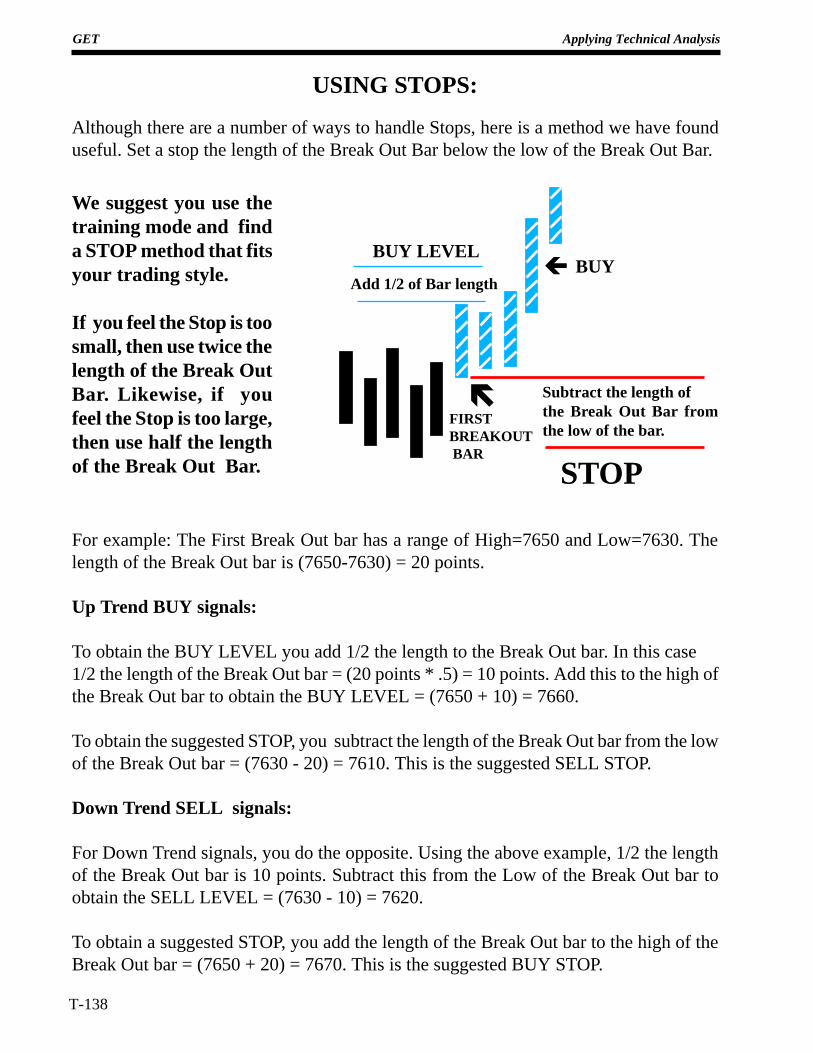
GET Applying Technical Analysis
T-138
BUY LEVELç BUY
ë
STOP
FIRSTBREAKOUT BAR
Add 1/2 of Bar length
Subtract the length ofthe Break Out Bar fromthe low of the bar.
USING STOPS:
Although there are a number of ways to handle Stops, here is a method we have founduseful. Set a stop the length of the Break Out Bar below the low of the Break Out Bar.
For example: The First Break Out bar has a range of High=7650 and Low=7630. Thelength of the Break Out bar is (7650-7630) = 20 points.
Up Trend BUY signals:
To obtain the BUY LEVEL you add 1/2 the length to the Break Out bar. In this case1/2 the length of the Break Out bar = (20 points * .5) = 10 points. Add this to the high ofthe Break Out bar to obtain the BUY LEVEL = (7650 + 10) = 7660.
To obtain the suggested STOP, you subtract the length of the Break Out bar from the lowof the Break Out bar = (7630 - 20) = 7610. This is the suggested SELL STOP.
Down Trend SELL signals:
For Down Trend signals, you do the opposite. Using the above example, 1/2 the lengthof the Break Out bar is 10 points. Subtract this from the Low of the Break Out bar toobtain the SELL LEVEL = (7630 - 10) = 7620.
To obtain a suggested STOP, you add the length of the Break Out bar to the high of theBreak Out bar = (7650 + 20) = 7670. This is the suggested BUY STOP.
We suggest you use thetraining mode and finda STOP method that fitsyour trading style.
If you feel the Stop is toosmall, then use twice thelength of the Break OutBar. Likewise, if youfeel the Stop is too large,then use half the lengthof the Break Out Bar.
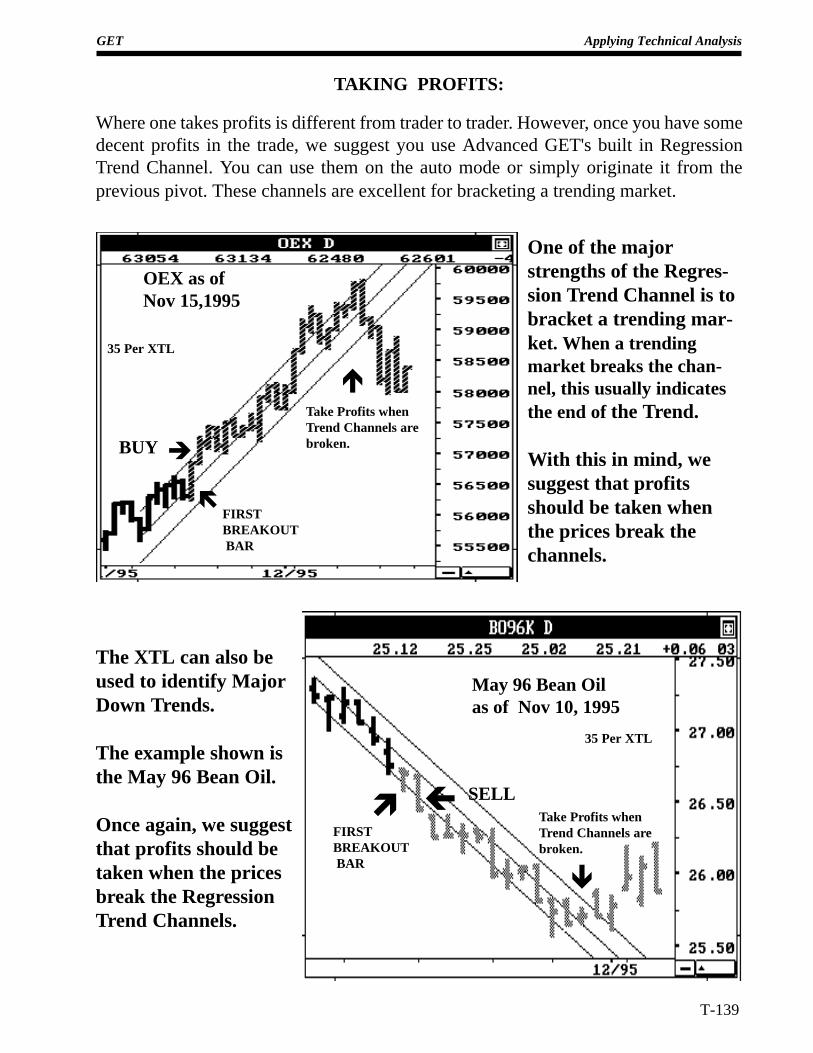
GET Applying Technical Analysis
T-139
OEX as ofNov 15,1995
ëFIRSTBREAKOUT BAR
éTake Profits whenTrend Channels arebroken.è
ê
May 96 Bean Oilas of Nov 10, 1995
ì ç SELLTake Profits whenTrend Channels arebroken.
BUY
Where one takes profits is different from trader to trader. However, once you have somedecent profits in the trade, we suggest you use Advanced GET's built in RegressionTrend Channel. You can use them on the auto mode or simply originate it from theprevious pivot. These channels are excellent for bracketing a trending market.
FIRSTBREAKOUT BAR
TAKING PROFITS:
One of the majorstrengths of the Regres-sion Trend Channel is tobracket a trending mar-ket. When a trendingmarket breaks the chan-nel, this usually indicatesthe end of the Trend.
With this in mind, wesuggest that profitsshould be taken whenthe prices break thechannels.
The XTL can also beused to identify MajorDown Trends.
The example shown isthe May 96 Bean Oil.
Once again, we suggestthat profits should betaken when the pricesbreak the RegressionTrend Channels.
35 Per XTL
35 Per XTL
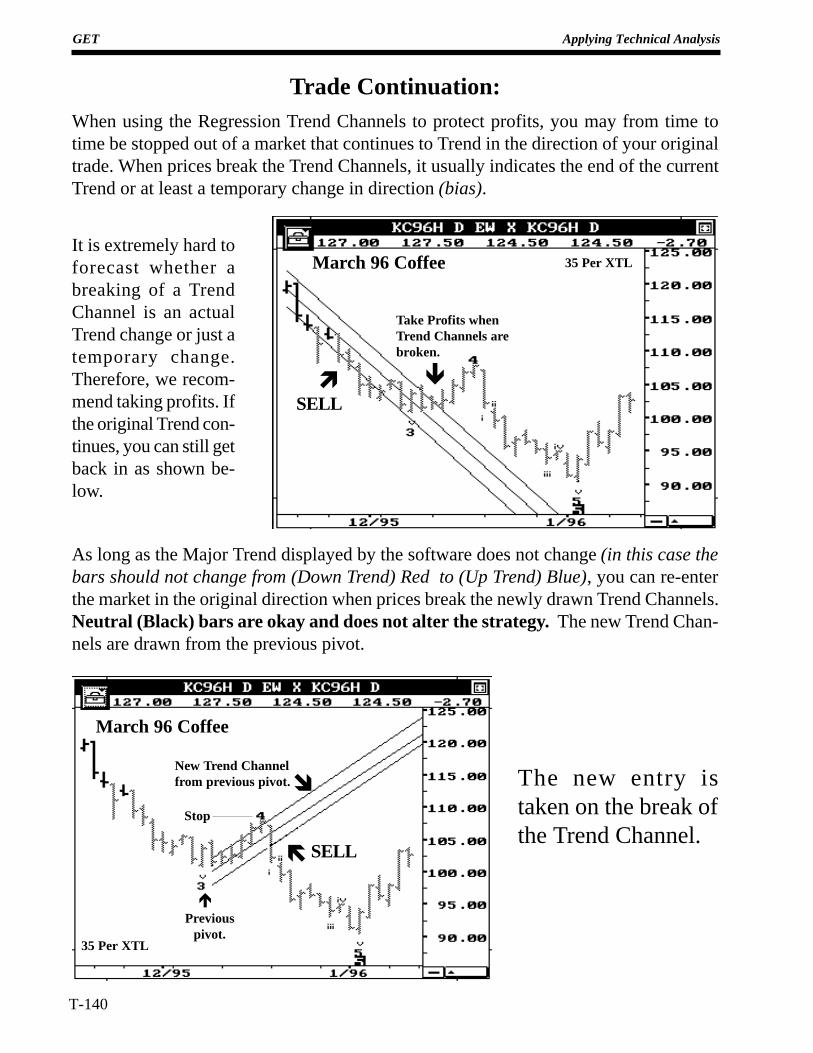
GET Applying Technical Analysis
T-140
When using the Regression Trend Channels to protect profits, you may from time totime be stopped out of a market that continues to Trend in the direction of your originaltrade. When prices break the Trend Channels, it usually indicates the end of the currentTrend or at least a temporary change in direction (bias).
March 96 Coffee
ìSELL
ê
Take Profits whenTrend Channels arebroken.
Trade Continuation:
It is extremely hard toforecast whether abreaking of a TrendChannel is an actualTrend change or just atemporary change.Therefore, we recom-mend taking profits. Ifthe original Trend con-tinues, you can still getback in as shown be-low.
March 96 Coffee
ë SELL
As long as the Major Trend displayed by the software does not change (in this case thebars should not change from (Down Trend) Red to (Up Trend) Blue), you can re-enterthe market in the original direction when prices break the newly drawn Trend Channels.Neutral (Black) bars are okay and does not alter the strategy. The new Trend Chan-nels are drawn from the previous pivot.
New Trend Channelfrom previous pivot.î The new entry is
taken on the break ofthe Trend Channel.
Previouspivot.
é
Stop
35 Per XTL
35 Per XTL
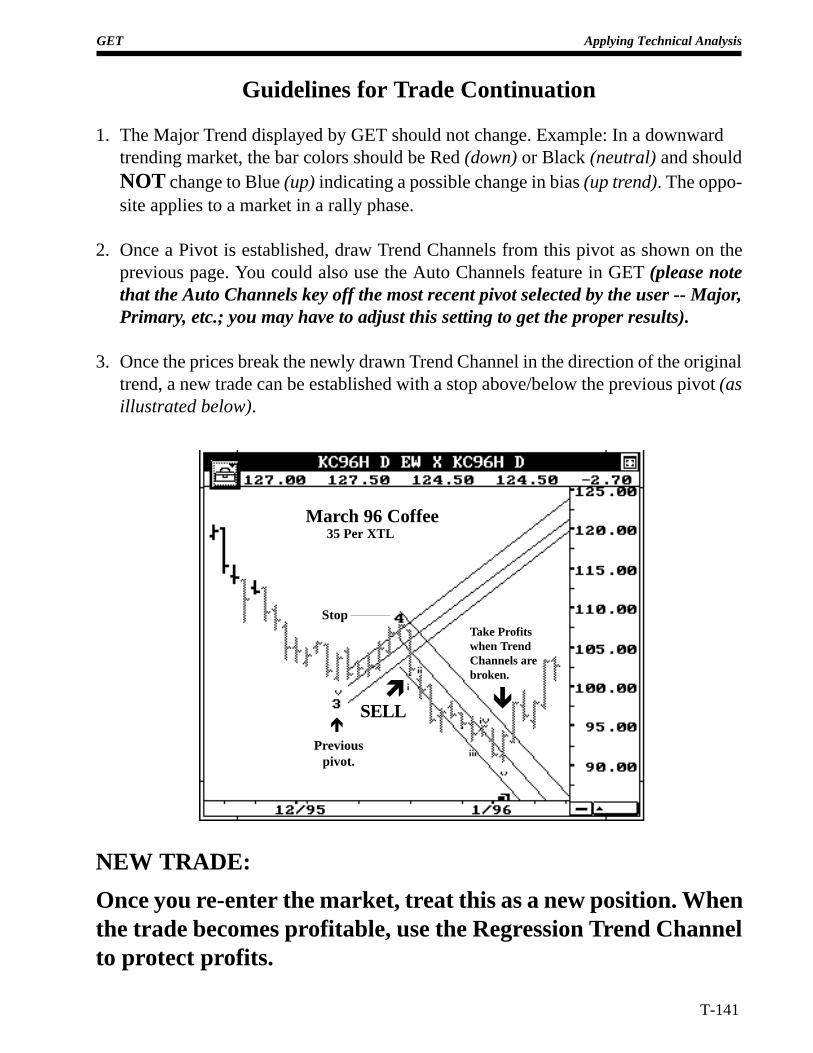
GET Applying Technical Analysis
T-141
NEW TRADE:
Once you re-enter the market, treat this as a new position. Whenthe trade becomes profitable, use the Regression Trend Channelto protect profits.
ê
Take Profitswhen TrendChannels arebroken.
ìSELL
Guidelines for Trade Continuation
1. The Major Trend displayed by GET should not change. Example: In a downwardtrending market, the bar colors should be Red (down) or Black (neutral) and shouldNOT change to Blue (up) indicating a possible change in bias (up trend). The oppo-site applies to a market in a rally phase.
2. Once a Pivot is established, draw Trend Channels from this pivot as shown on theprevious page. You could also use the Auto Channels feature in GET (please notethat the Auto Channels key off the most recent pivot selected by the user -- Major,Primary, etc.; you may have to adjust this setting to get the proper results).
3. Once the prices break the newly drawn Trend Channel in the direction of the originaltrend, a new trade can be established with a stop above/below the previous pivot (asillustrated below).
Previouspivot.
é
Stop
March 96 Coffee35 Per XTL
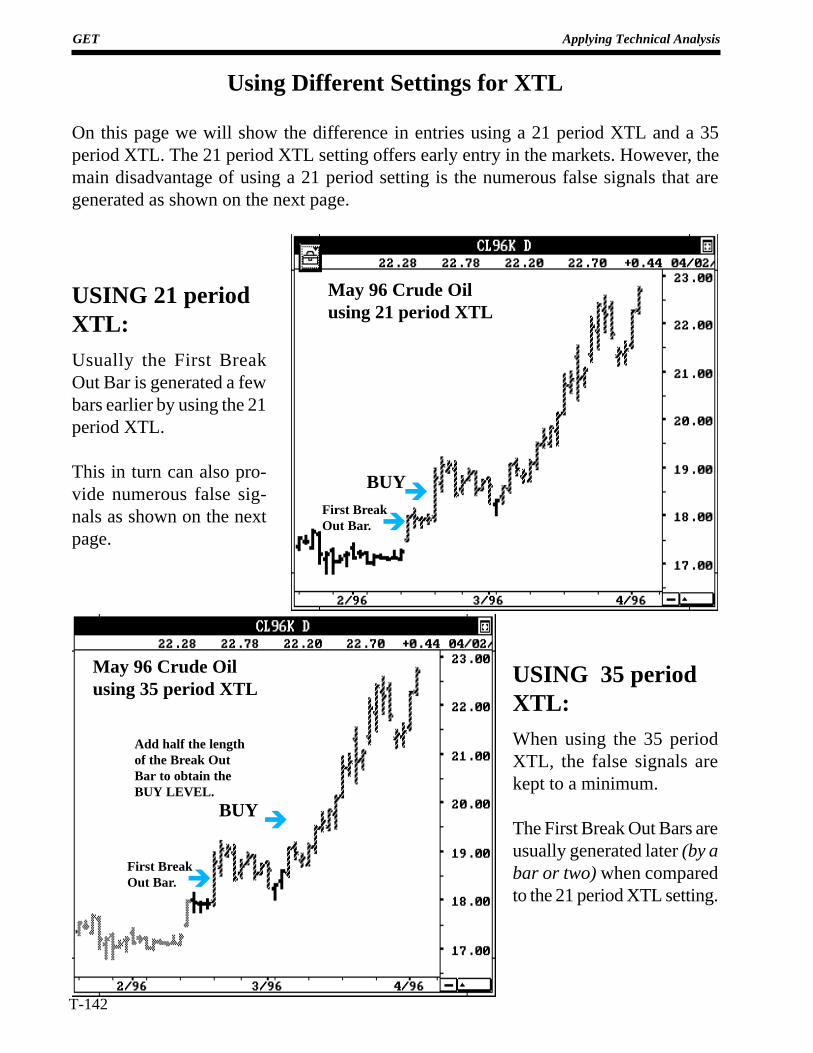
GET Applying Technical Analysis
T-142
Using Different Settings for XTL
On this page we will show the difference in entries using a 21 period XTL and a 35period XTL. The 21 period XTL setting offers early entry in the markets. However, themain disadvantage of using a 21 period setting is the numerous false signals that aregenerated as shown on the next page.
May 96 Crude Oilusing 21 period XTL
èFirst BreakOut Bar.
èBUY
èFirst BreakOut Bar.
May 96 Crude Oilusing 35 period XTL
Add half the lengthof the Break OutBar to obtain theBUY LEVEL.
BUYè
USING 21 periodXTL:Usually the First BreakOut Bar is generated a fewbars earlier by using the 21period XTL.
This in turn can also pro-vide numerous false sig-nals as shown on the nextpage.
USING 35 periodXTL:When using the 35 periodXTL, the false signals arekept to a minimum.
The First Break Out Bars areusually generated later (by abar or two) when comparedto the 21 period XTL setting.
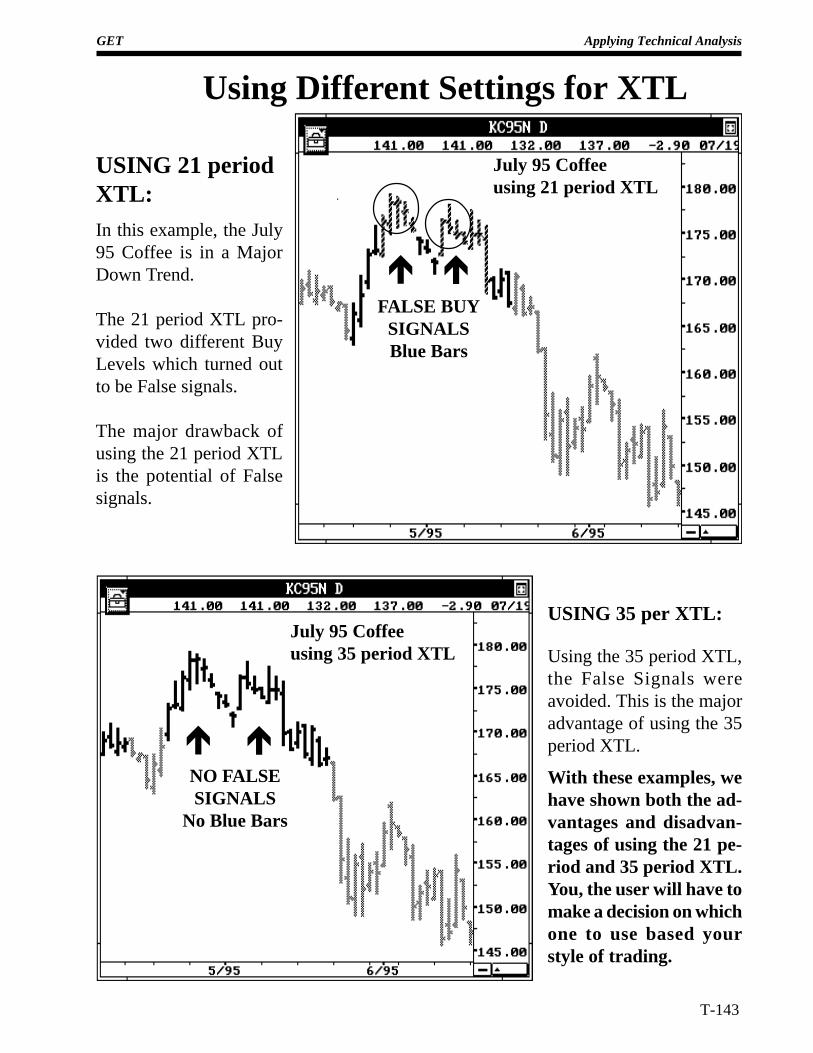
GET Applying Technical Analysis
T-143
Using Different Settings for XTL
July 95 Coffeeusing 21 period XTL
FALSE BUYSIGNALSBlue Bars
éé
July 95 Coffeeusing 35 period XTL
USING 21 periodXTL:In this example, the July95 Coffee is in a MajorDown Trend.
The 21 period XTL pro-vided two different BuyLevels which turned outto be False signals.
The major drawback ofusing the 21 period XTLis the potential of Falsesignals.
ééNO FALSESIGNALS
No Blue Bars
USING 35 per XTL:
Using the 35 period XTL,the False Signals wereavoided. This is the majoradvantage of using the 35period XTL.
With these examples, wehave shown both the ad-vantages and disadvan-tages of using the 21 pe-riod and 35 period XTL.You, the user will have tomake a decision on whichone to use based yourstyle of trading.
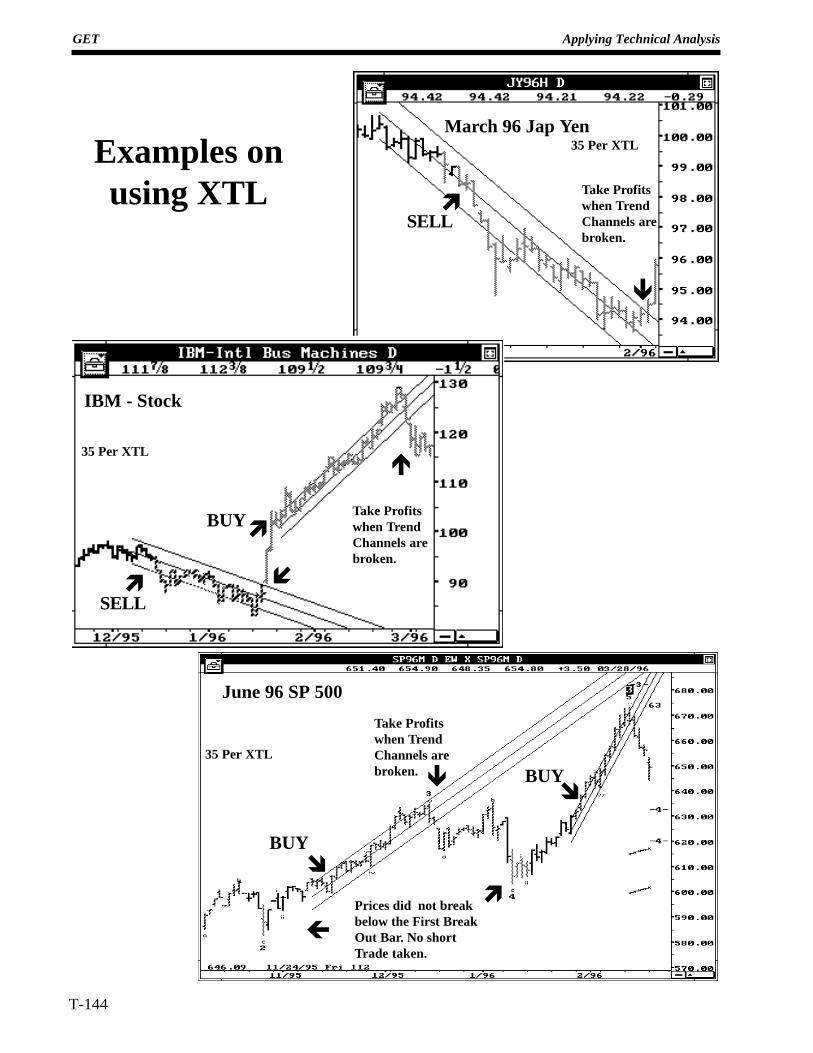
GET Applying Technical Analysis
T-144
Examples onusing XTL
March 96 Jap Yen
ìSELL
ê
Take Profitswhen TrendChannels arebroken.
ìSELL
IBM - Stock
í
é
Take Profitswhen TrendChannels arebroken.
ìBUY
June 96 SP 500
îBUY
ê
Take Profitswhen TrendChannels arebroken.
ì
îBUY
çPrices did not breakbelow the First BreakOut Bar. No shortTrade taken.
35 Per XTL
35 Per XTL
35 Per XTL
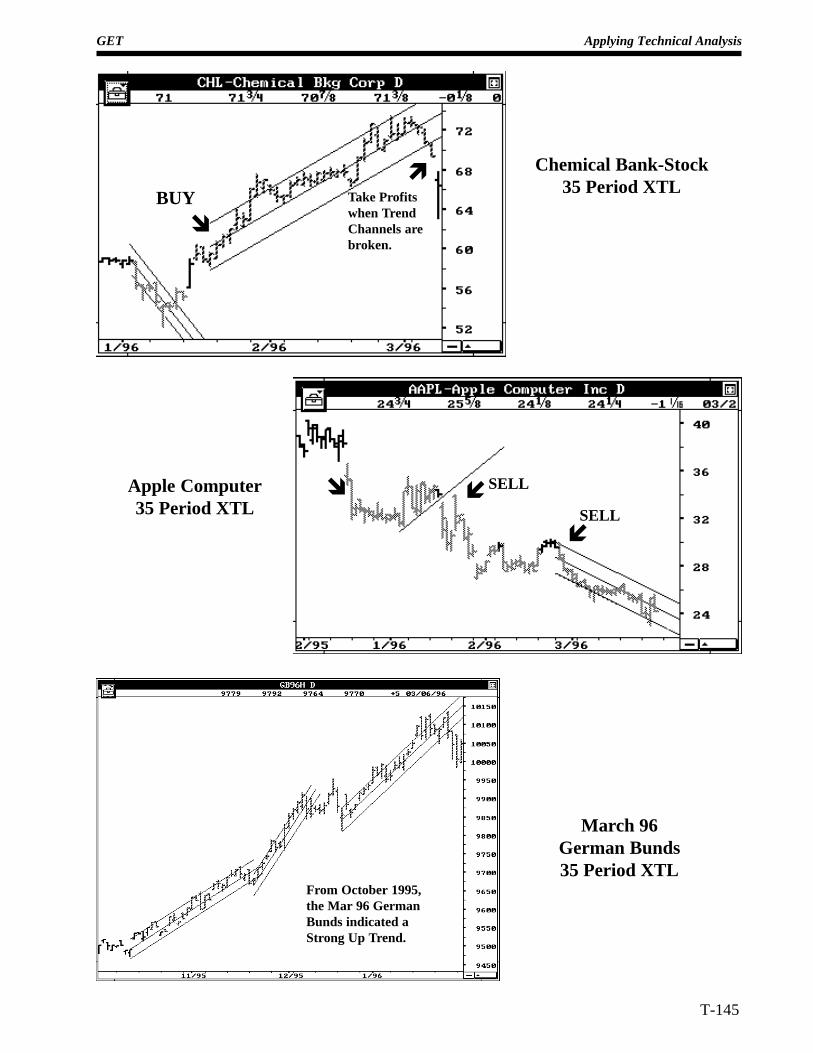
GET Applying Technical Analysis
T-145
Chemical Bank-Stock35 Period XTL
îBUY
ìTake Profitswhen TrendChannels arebroken.
Apple Computer35 Period XTL
î í
íSELL
SELL
March 96German Bunds35 Period XTL
From October 1995,the Mar 96 GermanBunds indicated aStrong Up Trend.
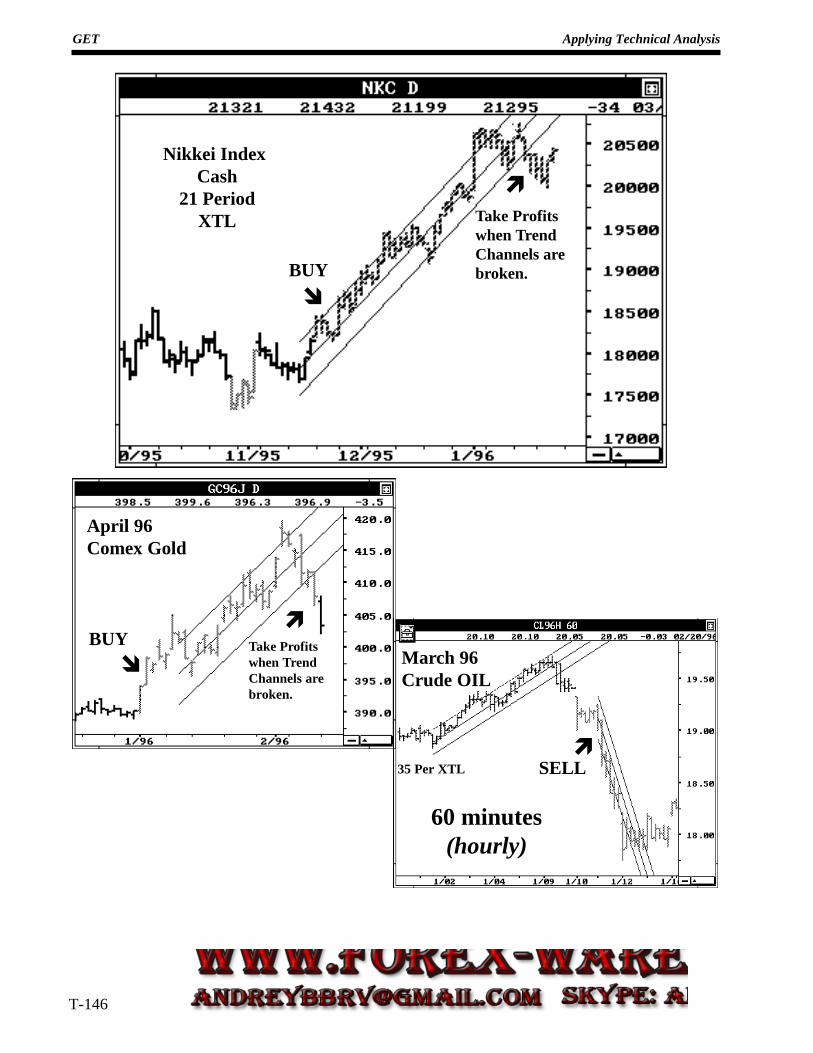
GET Applying Technical Analysis
T-146
î
Nikkei IndexCash
21 PeriodXTL
BUY
Take Profitswhen TrendChannels arebroken.
ì
April 96Comex Gold
îBUY Take Profits
when TrendChannels arebroken.
ì
March 96Crude OIL
ìSELL
60 minutes(hourly)
35 Per XTL
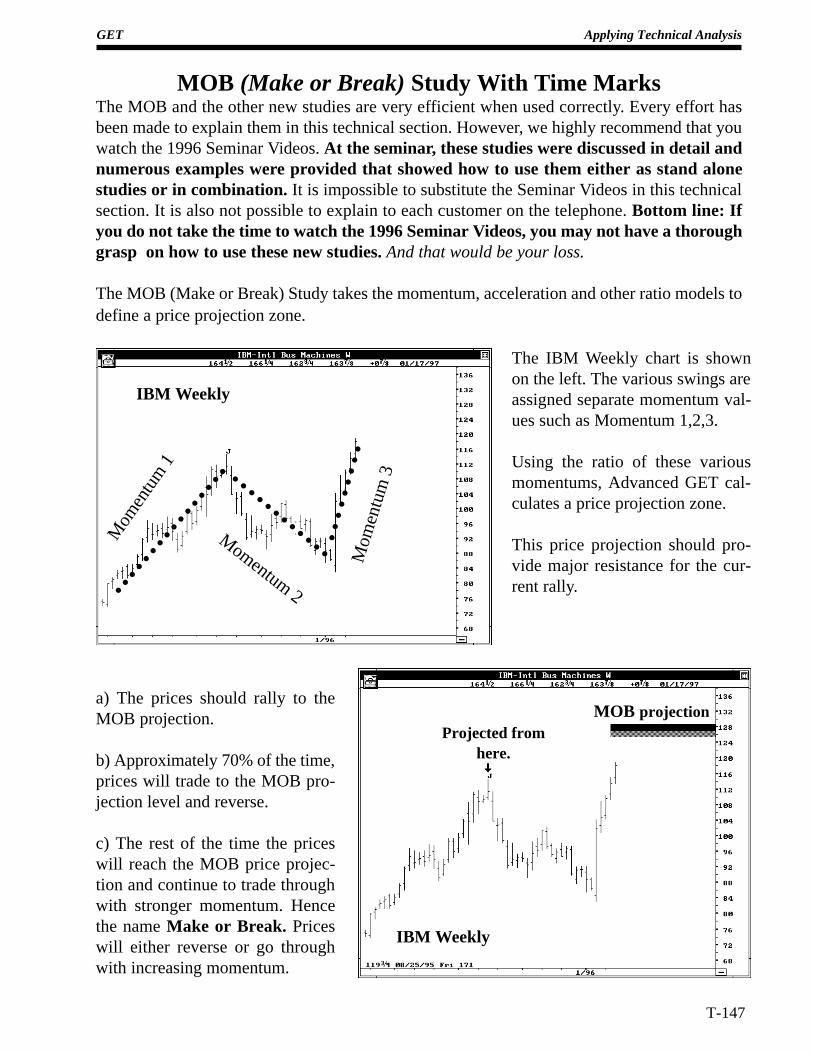
GET Applying Technical Analysis
T-147
MOB (Make or Break) Study With Time MarksThe MOB and the other new studies are very efficient when used correctly. Every effort hasbeen made to explain them in this technical section. However, we highly recommend that youwatch the 1996 Seminar Videos. At the seminar, these studies were discussed in detail andnumerous examples were provided that showed how to use them either as stand alonestudies or in combination. It is impossible to substitute the Seminar Videos in this technicalsection. It is also not possible to explain to each customer on the telephone. Bottom line: Ifyou do not take the time to watch the 1996 Seminar Videos, you may not have a thoroughgrasp on how to use these new studies. And that would be your loss.
The MOB (Make or Break) Study takes the momentum, acceleration and other ratio models todefine a price projection zone.
The IBM Weekly chart is shownon the left. The various swings areassigned separate momentum val-ues such as Momentum 1,2,3.
Using the ratio of these variousmomentums, Advanced GET cal-culates a price projection zone.
This price projection should pro-vide major resistance for the cur-rent rally.○
○
○
○
○
○
○
○
○
○
○
○
○
○
○
○
○
○
○
○
○
○
○
○
○
○
○
○
○
○
○
○
○
○
○
○
○
IBM Weekly
Mom
entu
m 1
Mom
entu
m 3
Momentum 2
MOB projectionProjected from
here.
IBM Weekly
a) The prices should rally to theMOB projection.
b) Approximately 70% of the time,prices will trade to the MOB pro-jection level and reverse.
c) The rest of the time the priceswill reach the MOB price projec-tion and continue to trade throughwith stronger momentum. Hencethe name Make or Break. Priceswill either reverse or go throughwith increasing momentum.
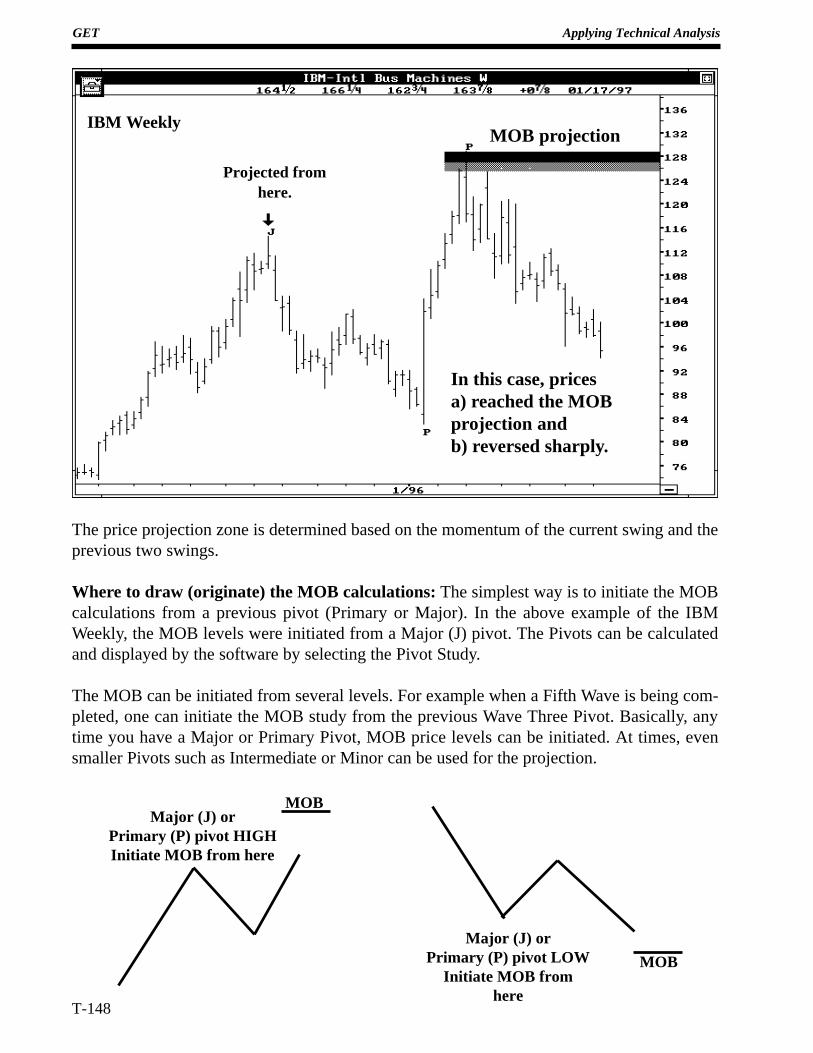
T-148
GET Applying Technical Analysis
Projected fromhere.
IBM WeeklyMOB projection
In this case, pricesa) reached the MOBprojection andb) reversed sharply.
The price projection zone is determined based on the momentum of the current swing and theprevious two swings.
Where to draw (originate) the MOB calculations: The simplest way is to initiate the MOBcalculations from a previous pivot (Primary or Major). In the above example of the IBMWeekly, the MOB levels were initiated from a Major (J) pivot. The Pivots can be calculatedand displayed by the software by selecting the Pivot Study.
The MOB can be initiated from several levels. For example when a Fifth Wave is being com-pleted, one can initiate the MOB study from the previous Wave Three Pivot. Basically, anytime you have a Major or Primary Pivot, MOB price levels can be initiated. At times, evensmaller Pivots such as Intermediate or Minor can be used for the projection.
MOB
Major (J) orPrimary (P) pivot LOW
Initiate MOB fromhere
Major (J) orPrimary (P) pivot HIGHInitiate MOB from here
MOB
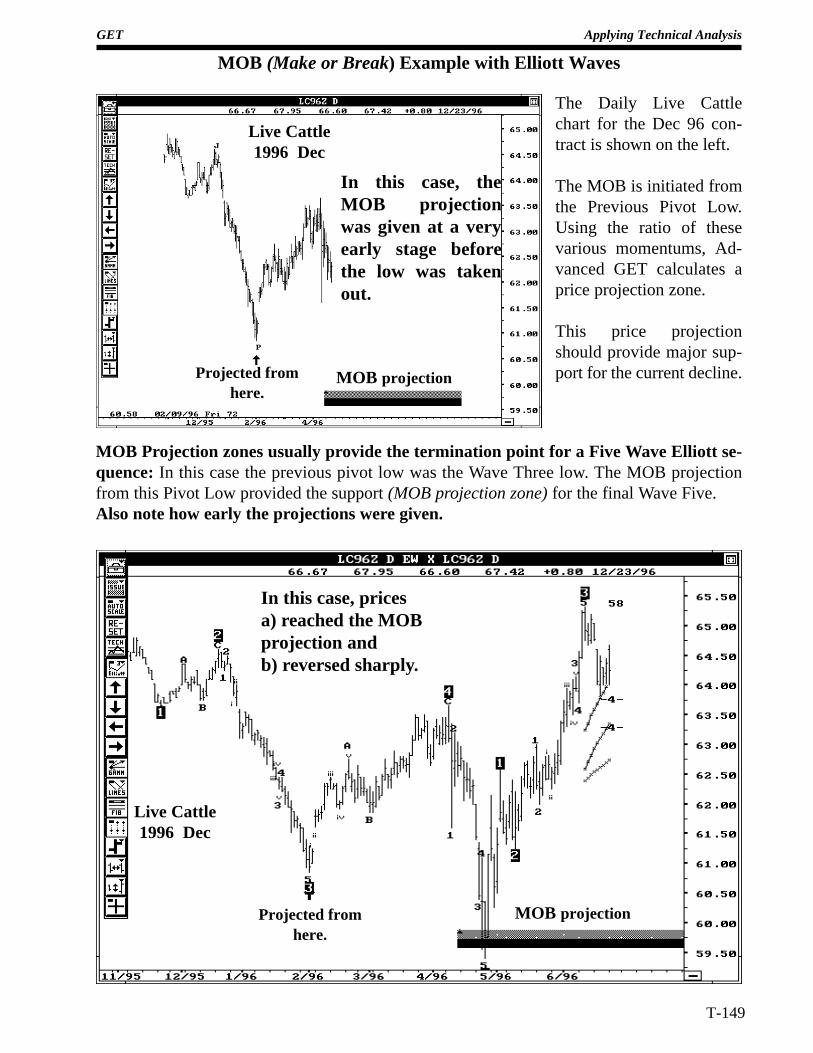
GET Applying Technical Analysis
T-149
MOB (Make or Break) Example with Elliott Waves
MOB projectionProjected fromhere.
Live Cattle1996 Dec
The Daily Live Cattlechart for the Dec 96 con-tract is shown on the left.
The MOB is initiated fromthe Previous Pivot Low.Using the ratio of thesevarious momentums, Ad-vanced GET calculates aprice projection zone.
This price projectionshould provide major sup-port for the current decline.
Projected fromhere.
MOB projection
Live Cattle1996 Dec
In this case, pricesa) reached the MOBprojection andb) reversed sharply.
MOB Projection zones usually provide the termination point for a Five Wave Elliott se-quence: In this case the previous pivot low was the Wave Three low. The MOB projectionfrom this Pivot Low provided the support (MOB projection zone) for the final Wave Five.Also note how early the projections were given.
In this case, theMOB projectionwas given at a veryearly stage beforethe low was takenout.
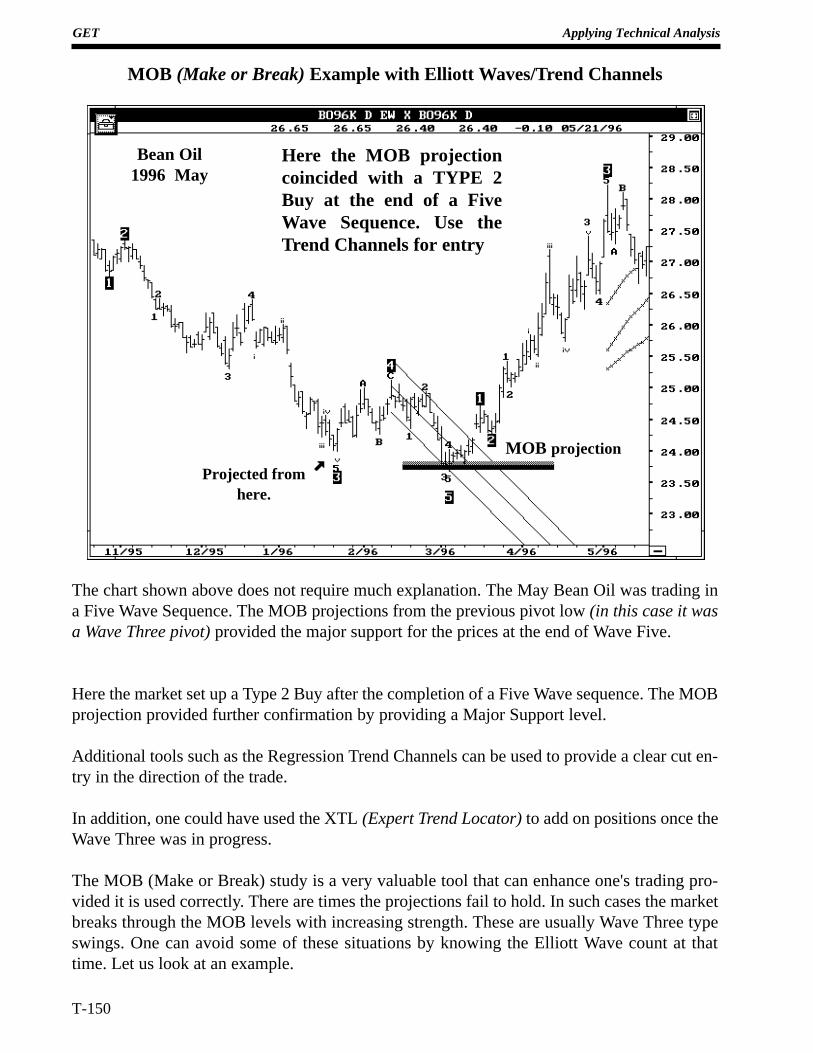
T-150
GET Applying Technical Analysis
MOB (Make or Break) Example with Elliott Waves/Trend Channels
Bean Oil1996 May
Projected fromhere.
MOB projection
Here the MOB projectioncoincided with a TYPE 2Buy at the end of a FiveWave Sequence. Use theTrend Channels for entry
The chart shown above does not require much explanation. The May Bean Oil was trading ina Five Wave Sequence. The MOB projections from the previous pivot low (in this case it wasa Wave Three pivot) provided the major support for the prices at the end of Wave Five.
Here the market set up a Type 2 Buy after the completion of a Five Wave sequence. The MOBprojection provided further confirmation by providing a Major Support level.
Additional tools such as the Regression Trend Channels can be used to provide a clear cut en-try in the direction of the trade.
In addition, one could have used the XTL (Expert Trend Locator) to add on positions once theWave Three was in progress.
The MOB (Make or Break) study is a very valuable tool that can enhance one's trading pro-vided it is used correctly. There are times the projections fail to hold. In such cases the marketbreaks through the MOB levels with increasing strength. These are usually Wave Three typeswings. One can avoid some of these situations by knowing the Elliott Wave count at thattime. Let us look at an example.
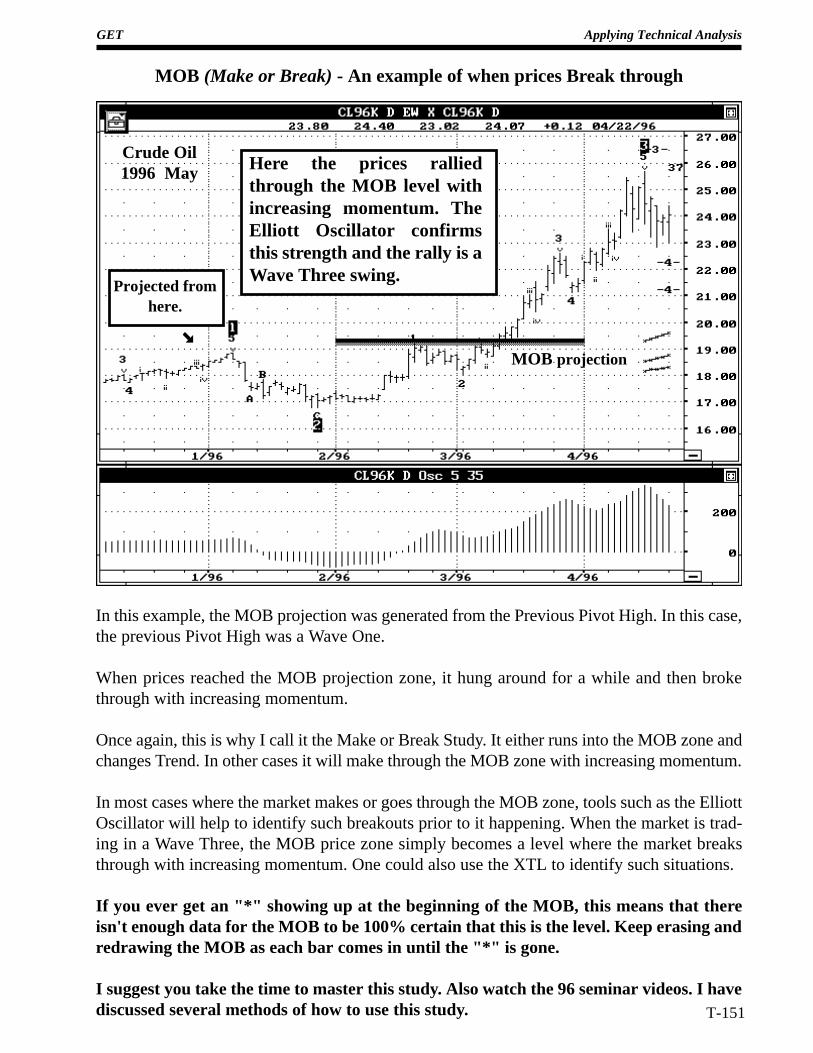
GET Applying Technical Analysis
T-151
MOB (Make or Break) - An example of when prices Break through
Crude Oil1996 May Here the prices rallied
through the MOB level withincreasing momentum. TheElliott Oscillator confirmsthis strength and the rally is aWave Three swing.
Projected fromhere.
MOB projection
In this example, the MOB projection was generated from the Previous Pivot High. In this case,the previous Pivot High was a Wave One.
When prices reached the MOB projection zone, it hung around for a while and then brokethrough with increasing momentum.
Once again, this is why I call it the Make or Break Study. It either runs into the MOB zone andchanges Trend. In other cases it will make through the MOB zone with increasing momentum.
In most cases where the market makes or goes through the MOB zone, tools such as the ElliottOscillator will help to identify such breakouts prior to it happening. When the market is trad-ing in a Wave Three, the MOB price zone simply becomes a level where the market breaksthrough with increasing momentum. One could also use the XTL to identify such situations.
If you ever get an "*" showing up at the beginning of the MOB, this means that thereisn't enough data for the MOB to be 100% certain that this is the level. Keep erasing andredrawing the MOB as each bar comes in until the "*" is gone.
I suggest you take the time to master this study. Also watch the 96 seminar videos. I havediscussed several methods of how to use this study.
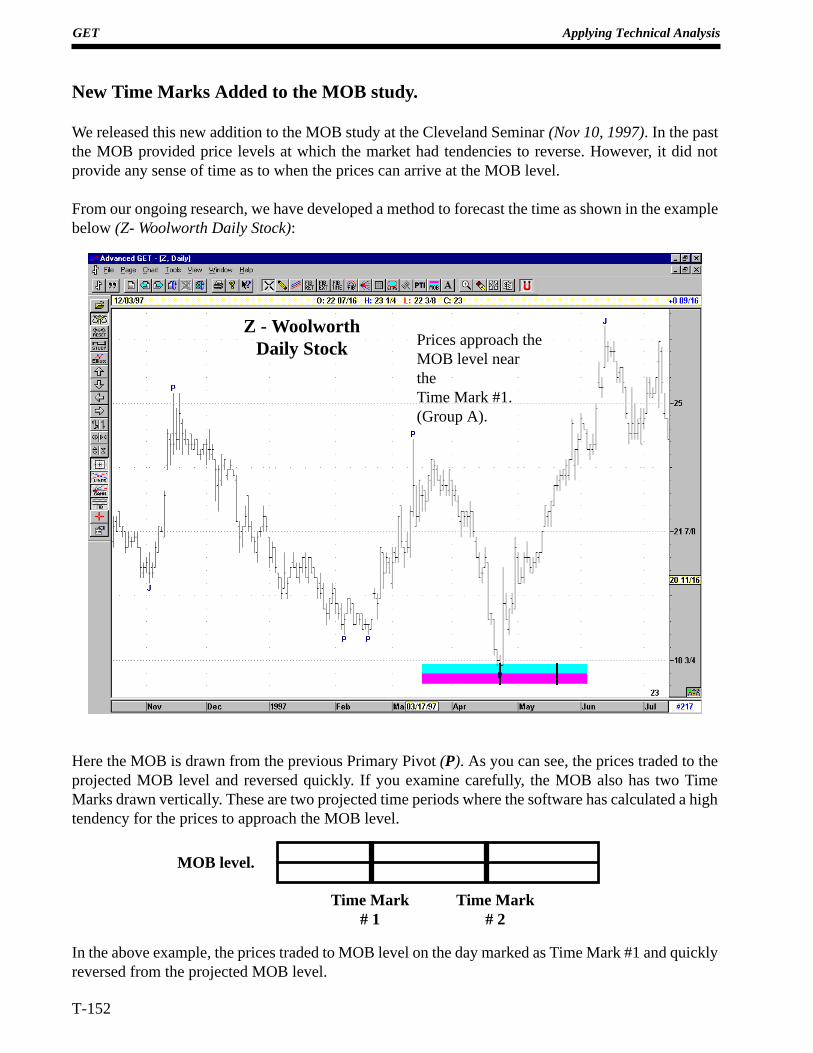
T-152
GET Applying Technical Analysis
New Time Marks Added to the MOB study.
We released this new addition to the MOB study at the Cleveland Seminar (Nov 10, 1997). In the pastthe MOB provided price levels at which the market had tendencies to reverse. However, it did notprovide any sense of time as to when the prices can arrive at the MOB level.
From our ongoing research, we have developed a method to forecast the time as shown in the examplebelow (Z- Woolworth Daily Stock):
Here the MOB is drawn from the previous Primary Pivot (P). As you can see, the prices traded to theprojected MOB level and reversed quickly. If you examine carefully, the MOB also has two TimeMarks drawn vertically. These are two projected time periods where the software has calculated a hightendency for the prices to approach the MOB level.
In the above example, the prices traded to MOB level on the day marked as Time Mark #1 and quicklyreversed from the projected MOB level.
MOB level.
Time Mark# 1
Time Mark# 2
Z - WoolworthDaily Stock Prices approach the
MOB level neartheTime Mark #1.(Group A).
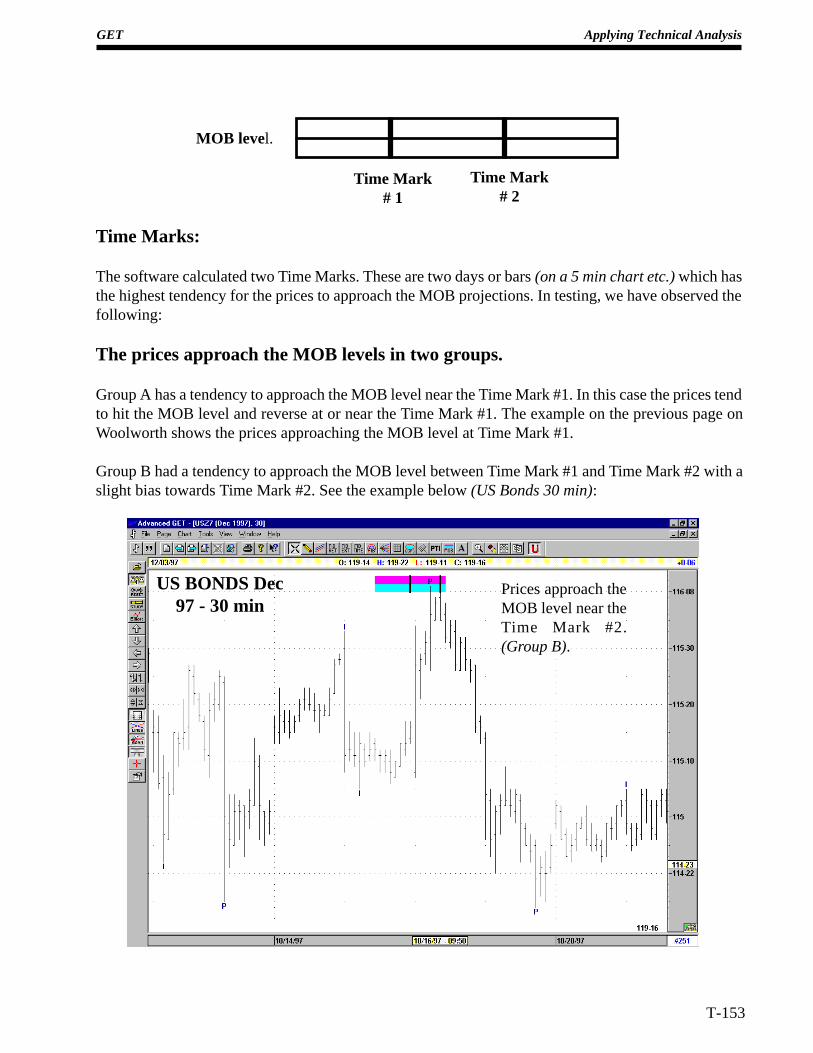
GET Applying Technical Analysis
T-153
MOB level.
Time Mark# 1
Time Mark# 2
Time Marks:
The software calculated two Time Marks. These are two days or bars (on a 5 min chart etc.) which hasthe highest tendency for the prices to approach the MOB projections. In testing, we have observed thefollowing:
The prices approach the MOB levels in two groups.
Group A has a tendency to approach the MOB level near the Time Mark #1. In this case the prices tendto hit the MOB level and reverse at or near the Time Mark #1. The example on the previous page onWoolworth shows the prices approaching the MOB level at Time Mark #1.
Group B had a tendency to approach the MOB level between Time Mark #1 and Time Mark #2 with aslight bias towards Time Mark #2. See the example below (US Bonds 30 min):
US BONDS Dec97 - 30 min
Prices approach theMOB level near theTime Mark #2.(Group B).
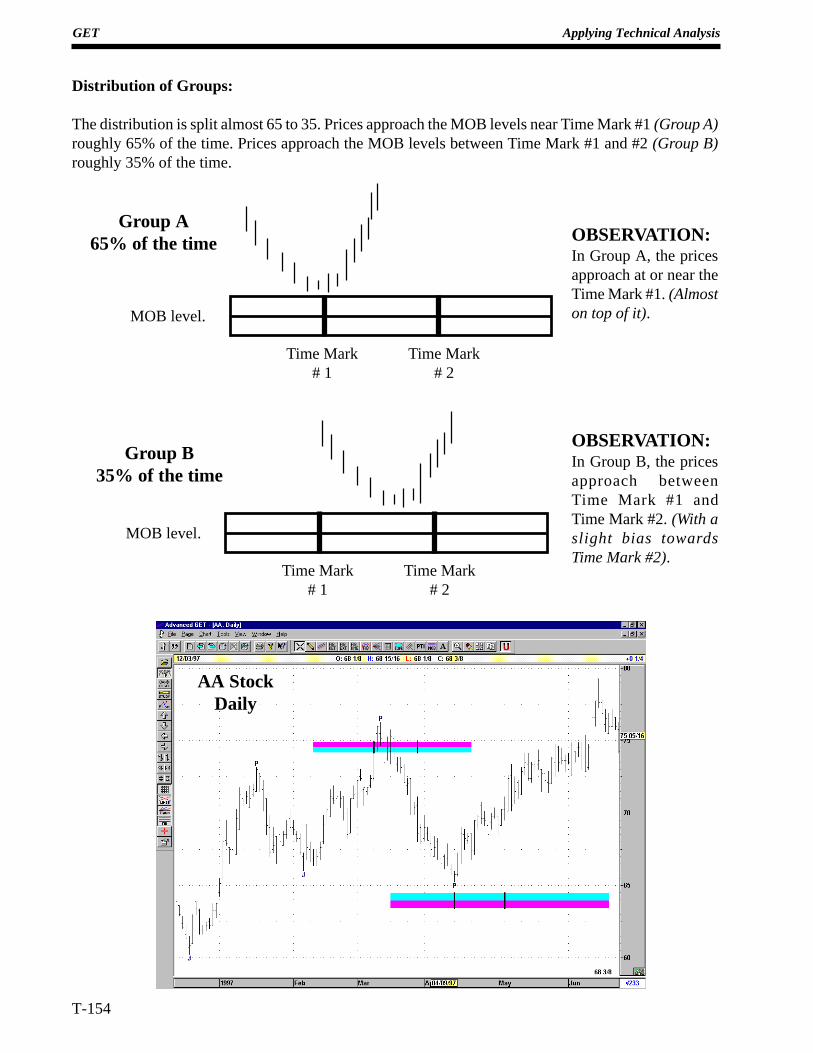
T-154
GET Applying Technical Analysis
Distribution of Groups:
The distribution is split almost 65 to 35. Prices approach the MOB levels near Time Mark #1 (Group A)roughly 65% of the time. Prices approach the MOB levels between Time Mark #1 and #2 (Group B)roughly 35% of the time.
OBSERVATION:In Group A, the pricesapproach at or near theTime Mark #1. (Almoston top of it).
OBSERVATION:In Group B, the pricesapproach betweenTime Mark #1 andTime Mark #2. (With aslight bias towardsTime Mark #2).
AA StockDaily
MOB level.
Time Mark# 1
Time Mark# 2
Group A65% of the time
MOB level.
Time Mark# 1
Time Mark# 2
Group B35% of the time
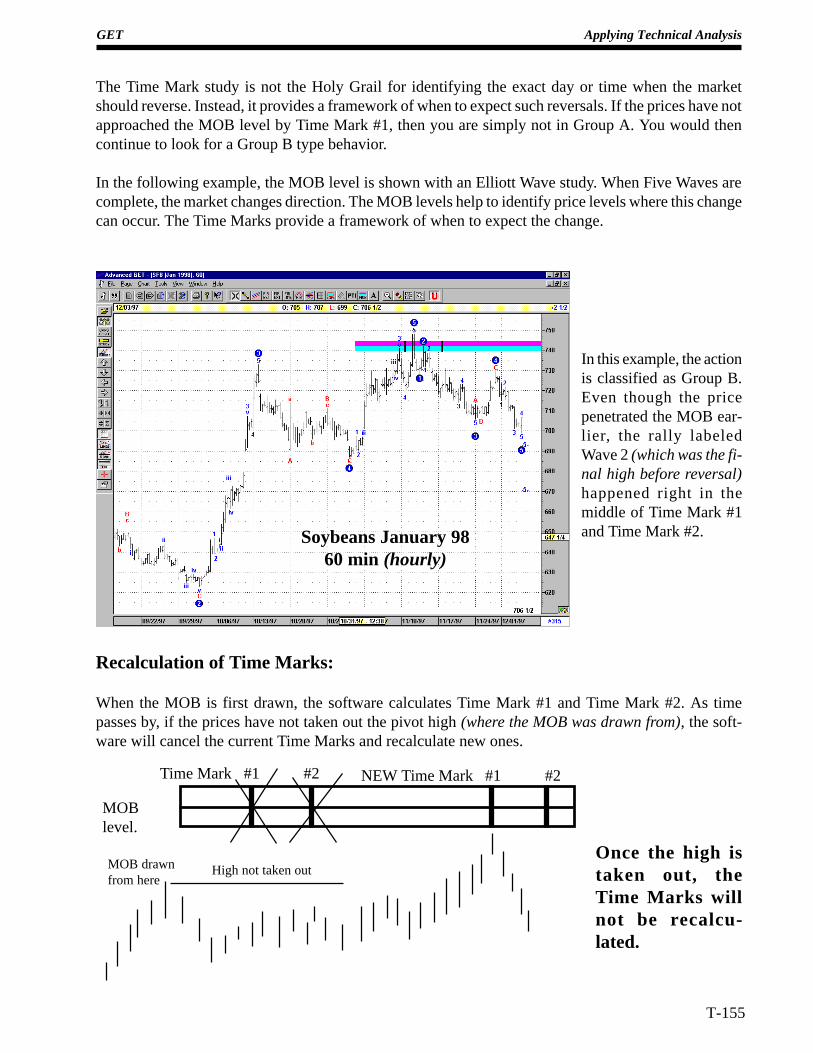
GET Applying Technical Analysis
T-155
The Time Mark study is not the Holy Grail for identifying the exact day or time when the marketshould reverse. Instead, it provides a framework of when to expect such reversals. If the prices have notapproached the MOB level by Time Mark #1, then you are simply not in Group A. You would thencontinue to look for a Group B type behavior.
In the following example, the MOB level is shown with an Elliott Wave study. When Five Waves arecomplete, the market changes direction. The MOB levels help to identify price levels where this changecan occur. The Time Marks provide a framework of when to expect the change.
Recalculation of Time Marks:
When the MOB is first drawn, the software calculates Time Mark #1 and Time Mark #2. As timepasses by, if the prices have not taken out the pivot high (where the MOB was drawn from), the soft-ware will cancel the current Time Marks and recalculate new ones.
In this example, the actionis classified as Group B.Even though the pricepenetrated the MOB ear-lier, the rally labeledWave 2 (which was the fi-nal high before reversal)happened right in themiddle of Time Mark #1and Time Mark #2.Soybeans January 98
60 min (hourly)
MOBlevel.
Time Mark #1 #2
MOB drawnfrom here
High not taken out
NEW Time Mark #1 #2
Once the high istaken out, theTime Marks willnot be recalcu-lated.
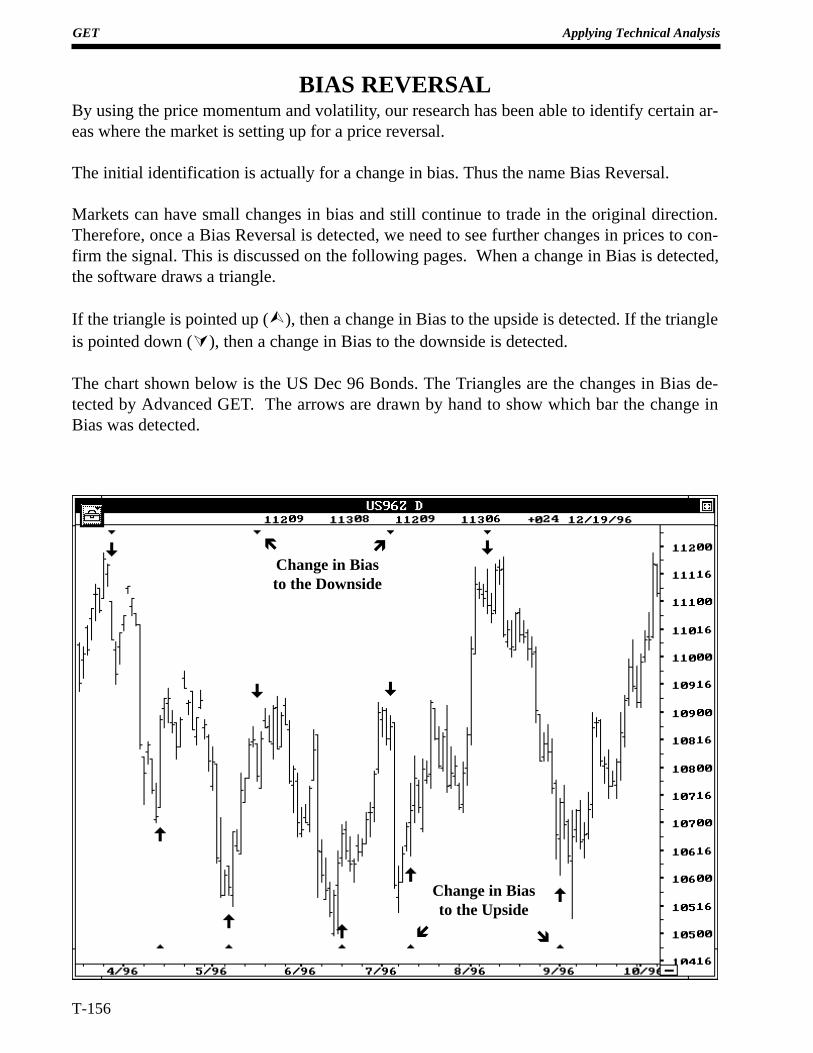
T-156
GET Applying Technical Analysis
BIAS REVERSALBy using the price momentum and volatility, our research has been able to identify certain ar-eas where the market is setting up for a price reversal.
The initial identification is actually for a change in bias. Thus the name Bias Reversal.
Markets can have small changes in bias and still continue to trade in the original direction.Therefore, once a Bias Reversal is detected, we need to see further changes in prices to con-firm the signal. This is discussed on the following pages. When a change in Bias is detected,the software draws a triangle.
If the triangle is pointed up (Ù), then a change in Bias to the upside is detected. If the triangleis pointed down (Ú), then a change in Bias to the downside is detected.
The chart shown below is the US Dec 96 Bonds. The Triangles are the changes in Bias de-tected by Advanced GET. The arrows are drawn by hand to show which bar the change inBias was detected.
ìë
îí
Change in Biasto the Downside
Change in Biasto the Upside
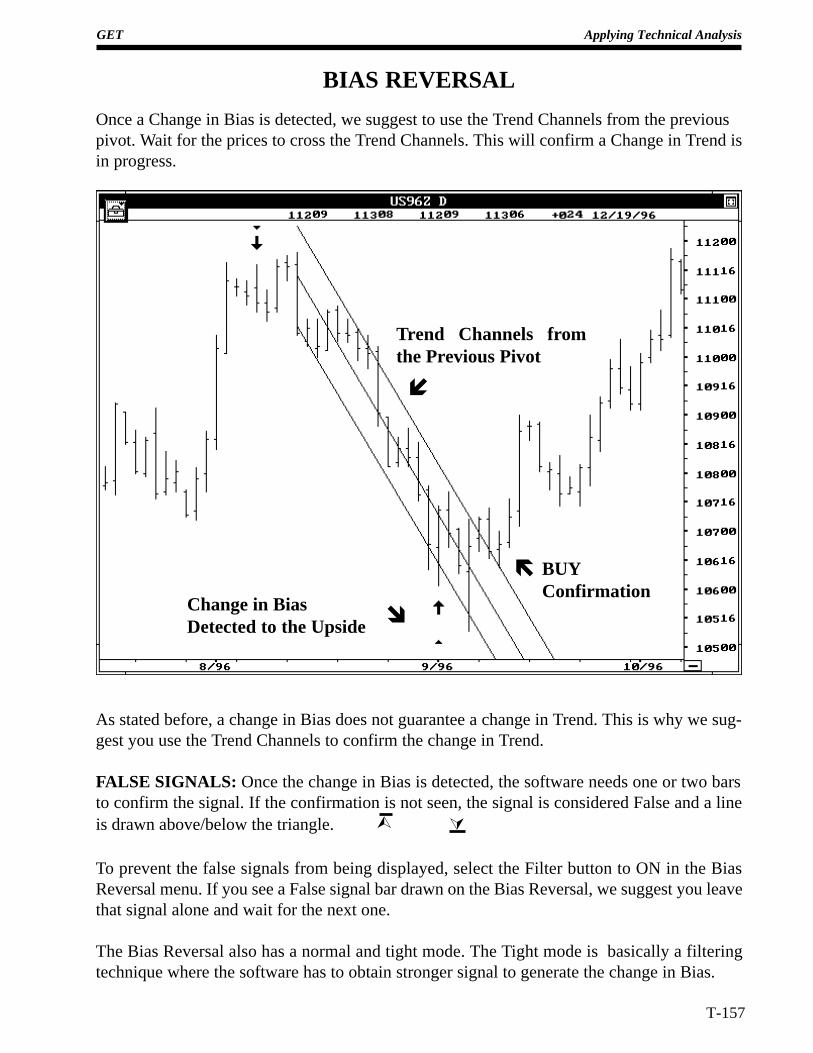
GET Applying Technical Analysis
T-157
As stated before, a change in Bias does not guarantee a change in Trend. This is why we sug-gest you use the Trend Channels to confirm the change in Trend.
FALSE SIGNALS: Once the change in Bias is detected, the software needs one or two barsto confirm the signal. If the confirmation is not seen, the signal is considered False and a lineis drawn above/below the triangle. Ù Ú
BIAS REVERSAL
Once a Change in Bias is detected, we suggest to use the Trend Channels from the previouspivot. Wait for the prices to cross the Trend Channels. This will confirm a Change in Trend isin progress.
îChange in BiasDetected to the Upside
Trend Channels fromthe Previous Pivot
í
BUYConfirmation
ë
To prevent the false signals from being displayed, select the Filter button to ON in the BiasReversal menu. If you see a False signal bar drawn on the Bias Reversal, we suggest you leavethat signal alone and wait for the next one.
The Bias Reversal also has a normal and tight mode. The Tight mode is basically a filteringtechnique where the software has to obtain stronger signal to generate the change in Bias.
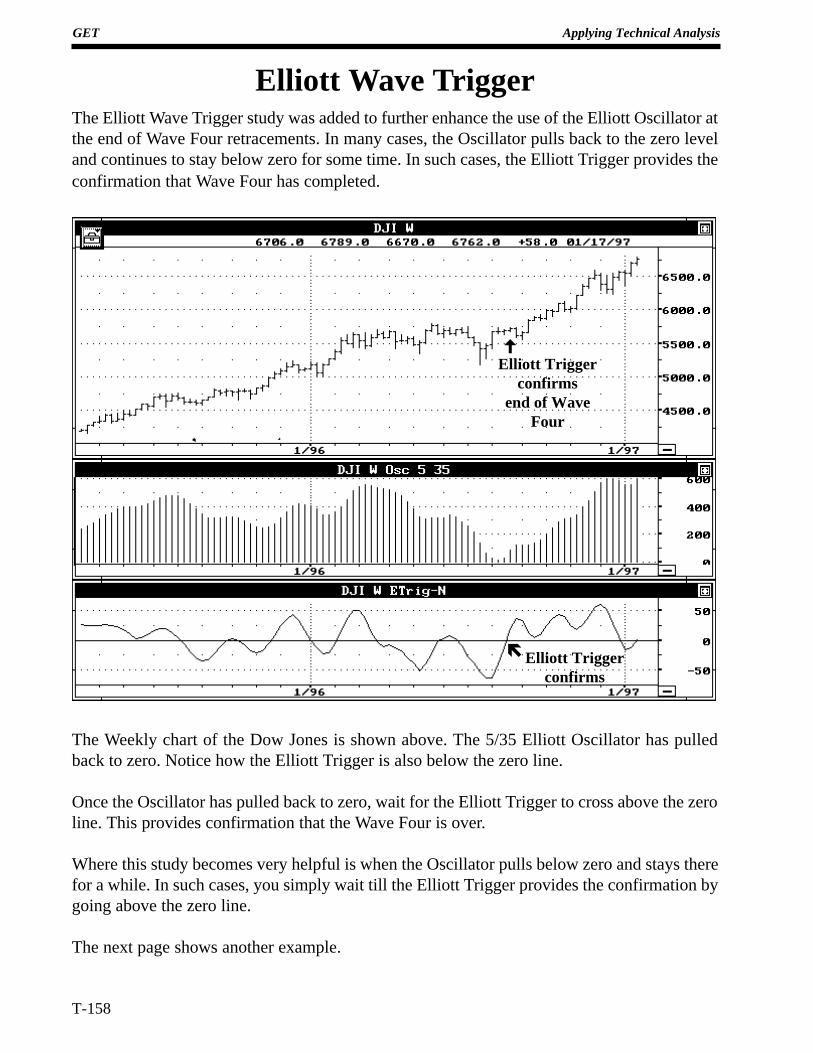
T-158
GET Applying Technical Analysis
Elliott Wave TriggerThe Elliott Wave Trigger study was added to further enhance the use of the Elliott Oscillator atthe end of Wave Four retracements. In many cases, the Oscillator pulls back to the zero leveland continues to stay below zero for some time. In such cases, the Elliott Trigger provides theconfirmation that Wave Four has completed.
The Weekly chart of the Dow Jones is shown above. The 5/35 Elliott Oscillator has pulledback to zero. Notice how the Elliott Trigger is also below the zero line.
Once the Oscillator has pulled back to zero, wait for the Elliott Trigger to cross above the zeroline. This provides confirmation that the Wave Four is over.
Where this study becomes very helpful is when the Oscillator pulls below zero and stays therefor a while. In such cases, you simply wait till the Elliott Trigger provides the confirmation bygoing above the zero line.
The next page shows another example.
ëElliott Triggerconfirms
Elliott Triggerconfirms
end of WaveFour
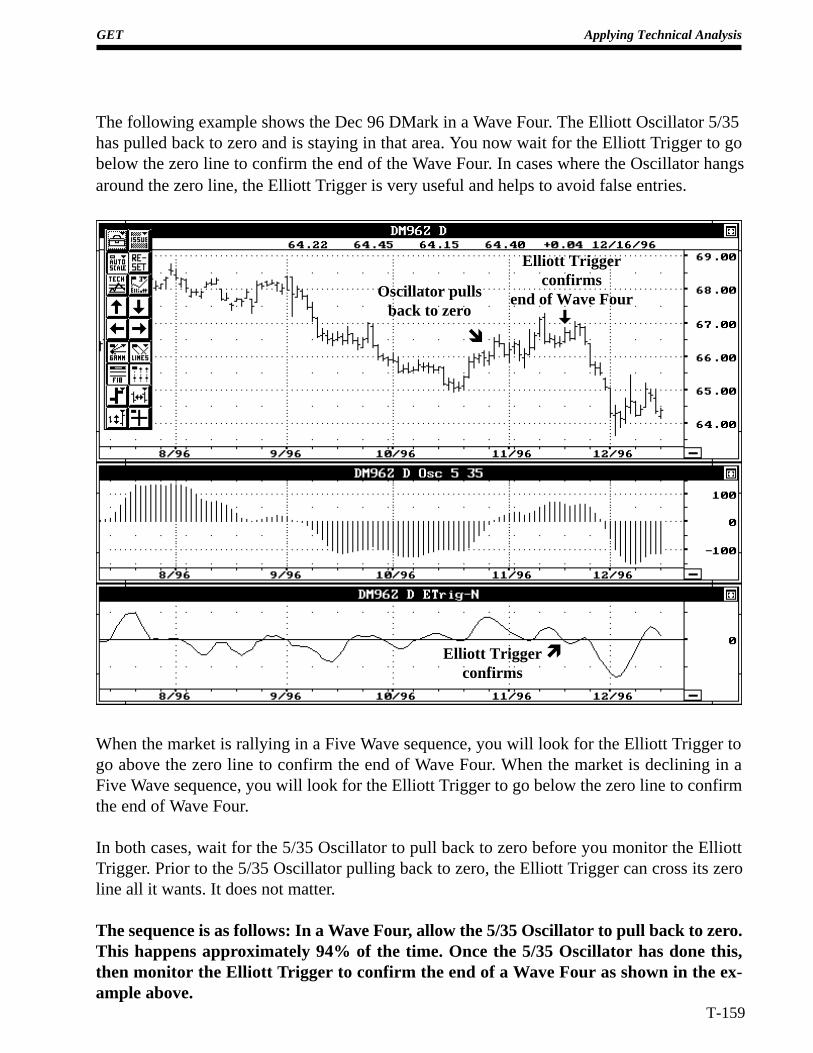
GET Applying Technical Analysis
T-159
The following example shows the Dec 96 DMark in a Wave Four. The Elliott Oscillator 5/35has pulled back to zero and is staying in that area. You now wait for the Elliott Trigger to gobelow the zero line to confirm the end of the Wave Four. In cases where the Oscillator hangsaround the zero line, the Elliott Trigger is very useful and helps to avoid false entries.
When the market is rallying in a Five Wave sequence, you will look for the Elliott Trigger togo above the zero line to confirm the end of Wave Four. When the market is declining in aFive Wave sequence, you will look for the Elliott Trigger to go below the zero line to confirmthe end of Wave Four.
In both cases, wait for the 5/35 Oscillator to pull back to zero before you monitor the ElliottTrigger. Prior to the 5/35 Oscillator pulling back to zero, the Elliott Trigger can cross its zeroline all it wants. It does not matter.
The sequence is as follows: In a Wave Four, allow the 5/35 Oscillator to pull back to zero.This happens approximately 94% of the time. Once the 5/35 Oscillator has done this,then monitor the Elliott Trigger to confirm the end of a Wave Four as shown in the ex-ample above.
Elliott Triggerconfirms
end of Wave Four
ìElliott Triggerconfirms
î
Oscillator pullsback to zero
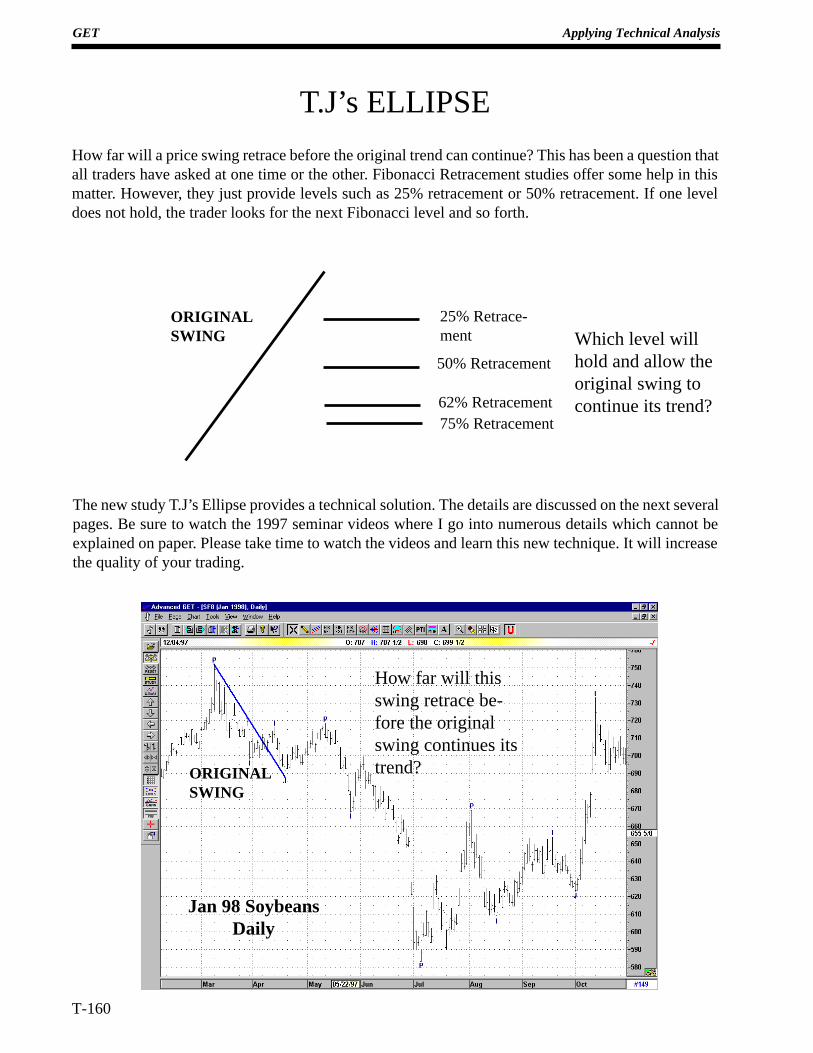
T-160
GET Applying Technical Analysis
T.J’s ELLIPSE
How far will a price swing retrace before the original trend can continue? This has been a question thatall traders have asked at one time or the other. Fibonacci Retracement studies offer some help in thismatter. However, they just provide levels such as 25% retracement or 50% retracement. If one leveldoes not hold, the trader looks for the next Fibonacci level and so forth.
ORIGINALSWING
62% Retracement
50% Retracement
25% Retrace-ment Which level will
hold and allow theoriginal swing tocontinue its trend?
75% Retracement
The new study T.J’s Ellipse provides a technical solution. The details are discussed on the next severalpages. Be sure to watch the 1997 seminar videos where I go into numerous details which cannot beexplained on paper. Please take time to watch the videos and learn this new technique. It will increasethe quality of your trading.
Jan 98 SoybeansDaily
ORIGINALSWING
How far will thisswing retrace be-fore the originalswing continues itstrend?
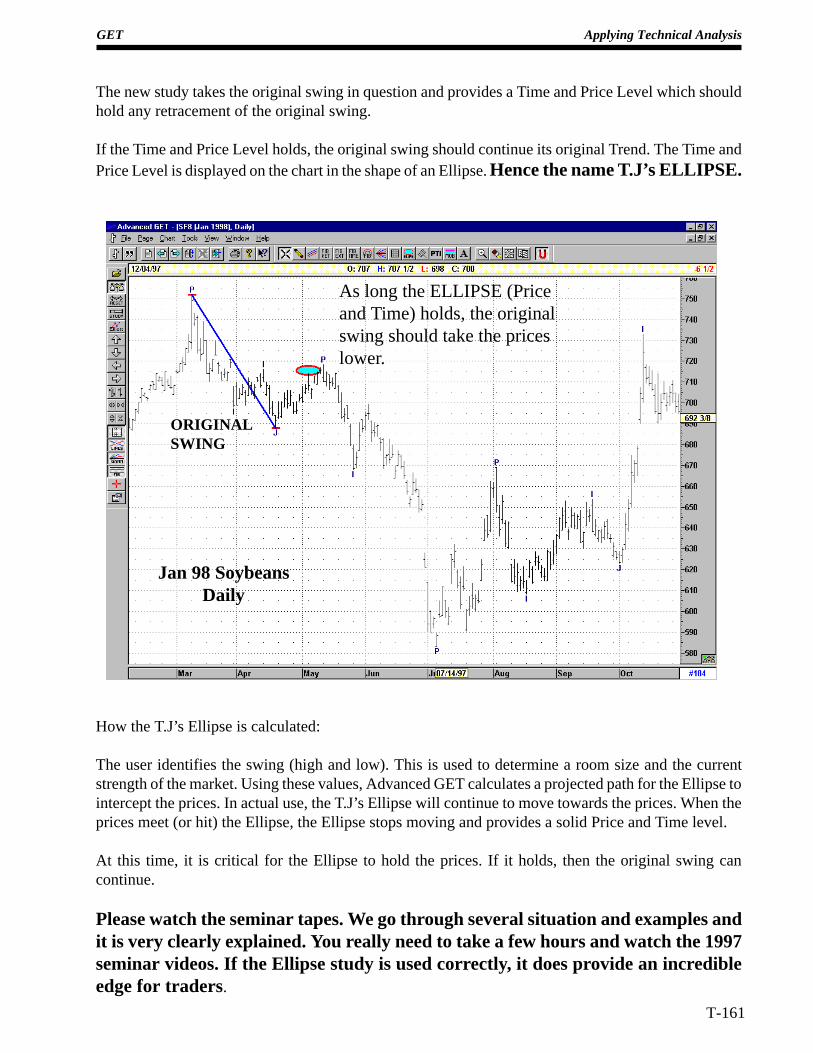
GET Applying Technical Analysis
T-161
The new study takes the original swing in question and provides a Time and Price Level which shouldhold any retracement of the original swing.
If the Time and Price Level holds, the original swing should continue its original Trend. The Time andPrice Level is displayed on the chart in the shape of an Ellipse. Hence the name T.J’s ELLIPSE.
Jan 98 SoybeansDaily
ORIGINALSWING
As long the ELLIPSE (Priceand Time) holds, the originalswing should take the priceslower.
How the T.J’s Ellipse is calculated:
The user identifies the swing (high and low). This is used to determine a room size and the currentstrength of the market. Using these values, Advanced GET calculates a projected path for the Ellipse tointercept the prices. In actual use, the T.J’s Ellipse will continue to move towards the prices. When theprices meet (or hit) the Ellipse, the Ellipse stops moving and provides a solid Price and Time level.
At this time, it is critical for the Ellipse to hold the prices. If it holds, then the original swing cancontinue.
Please watch the seminar tapes. We go through several situation and examples andit is very clearly explained. You really need to take a few hours and watch the 1997seminar videos. If the Ellipse study is used correctly, it does provide an incredibleedge for traders.
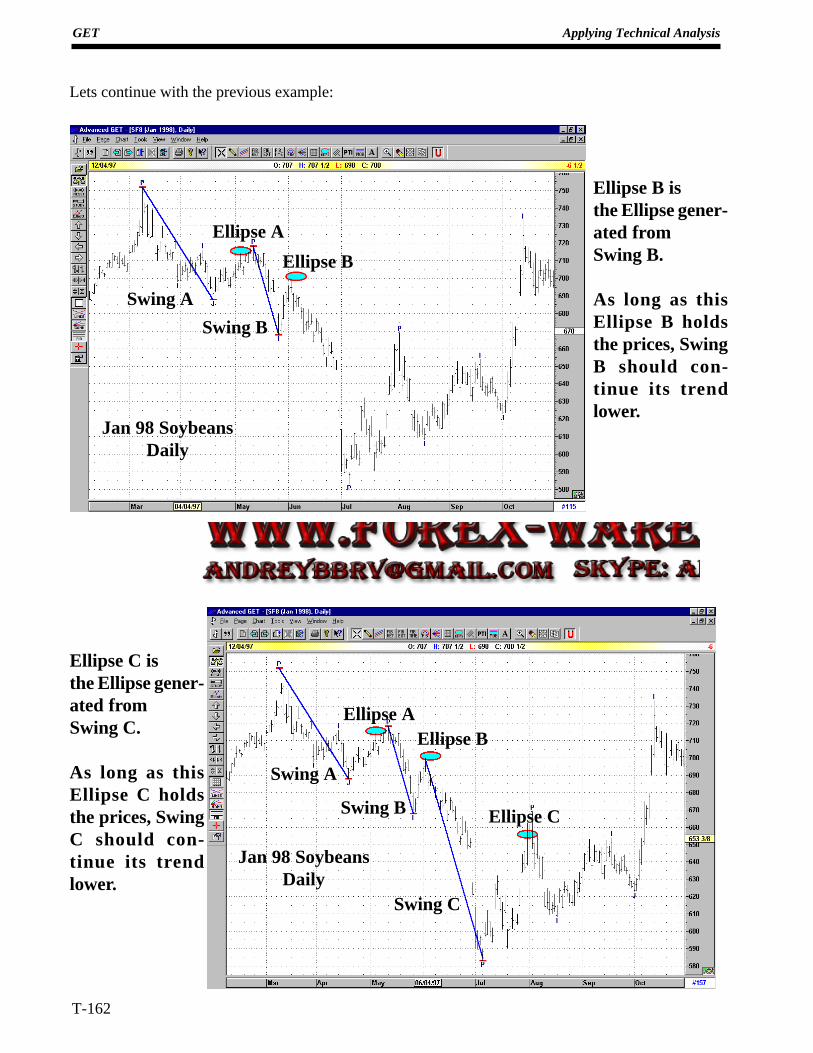
T-162
GET Applying Technical Analysis
Lets continue with the previous example:
Jan 98 SoybeansDaily
Jan 98 SoybeansDaily
Swing A
Swing B
Ellipse A
Ellipse B
Ellipse B isthe Ellipse gener-ated fromSwing B.
As long as thisEllipse B holdsthe prices, SwingB should con-tinue its trendlower.
Ellipse C isthe Ellipse gener-ated fromSwing C.
As long as thisEllipse C holdsthe prices, SwingC should con-tinue its trendlower.
Swing A
Ellipse BEllipse A
Ellipse CSwing B
Swing C
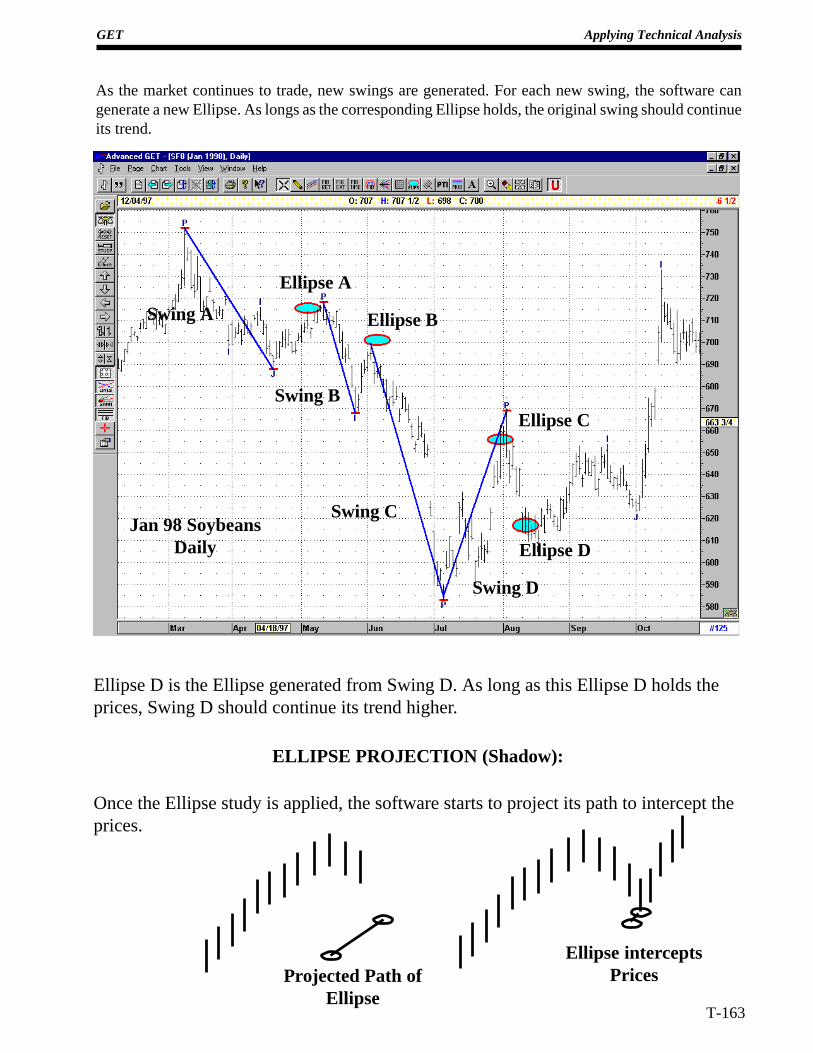
GET Applying Technical Analysis
T-163
Jan 98 SoybeansDaily
Ellipse D is the Ellipse generated from Swing D. As long as this Ellipse D holds theprices, Swing D should continue its trend higher.
ELLIPSE PROJECTION (Shadow):
Once the Ellipse study is applied, the software starts to project its path to intercept theprices.
Swing A Ellipse B
Ellipse A
Ellipse CSwing B
Swing C
Swing D
Ellipse D
As the market continues to trade, new swings are generated. For each new swing, the software cangenerate a new Ellipse. As longs as the corresponding Ellipse holds, the original swing should continueits trend.
Projected Path ofEllipse
Ellipse interceptsPrices
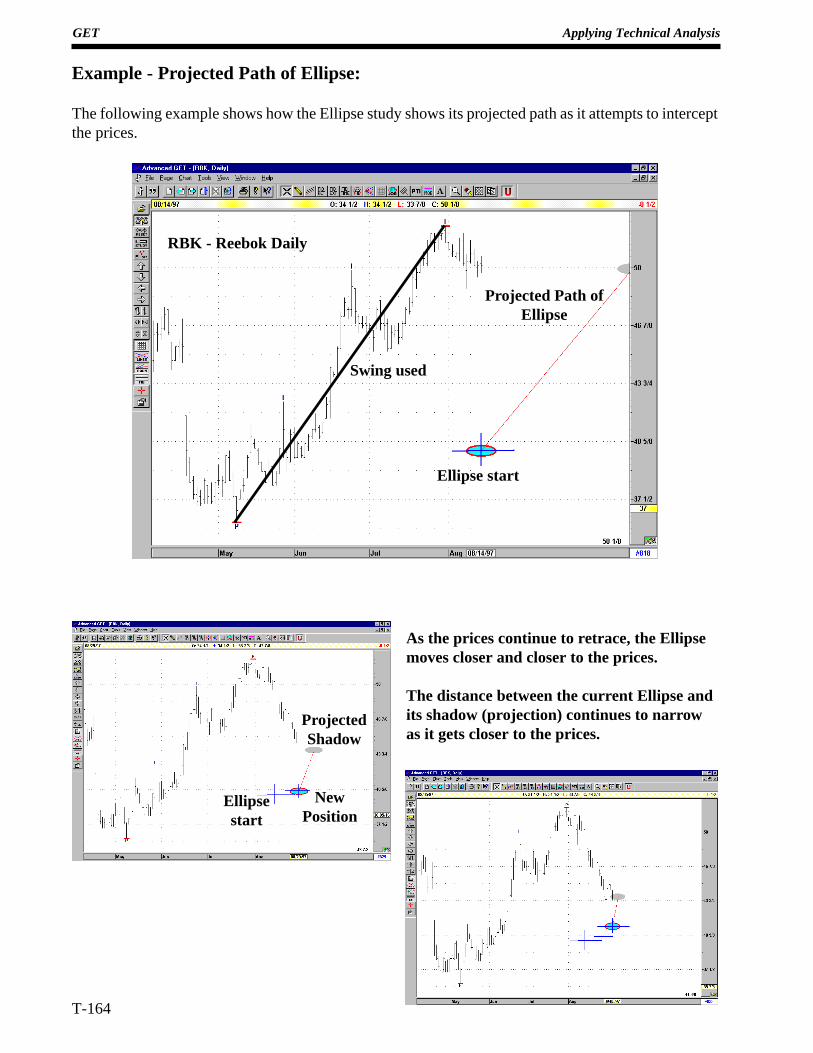
T-164
GET Applying Technical Analysis
Example - Projected Path of Ellipse:
The following example shows how the Ellipse study shows its projected path as it attempts to interceptthe prices.
Ellipse start
Projected Path ofEllipse
RBK - Reebok Daily
Swing used
Ellipsestart
NewPosition
ProjectedShadow
As the prices continue to retrace, the Ellipsemoves closer and closer to the prices.
The distance between the current Ellipse andits shadow (projection) continues to narrowas it gets closer to the prices.
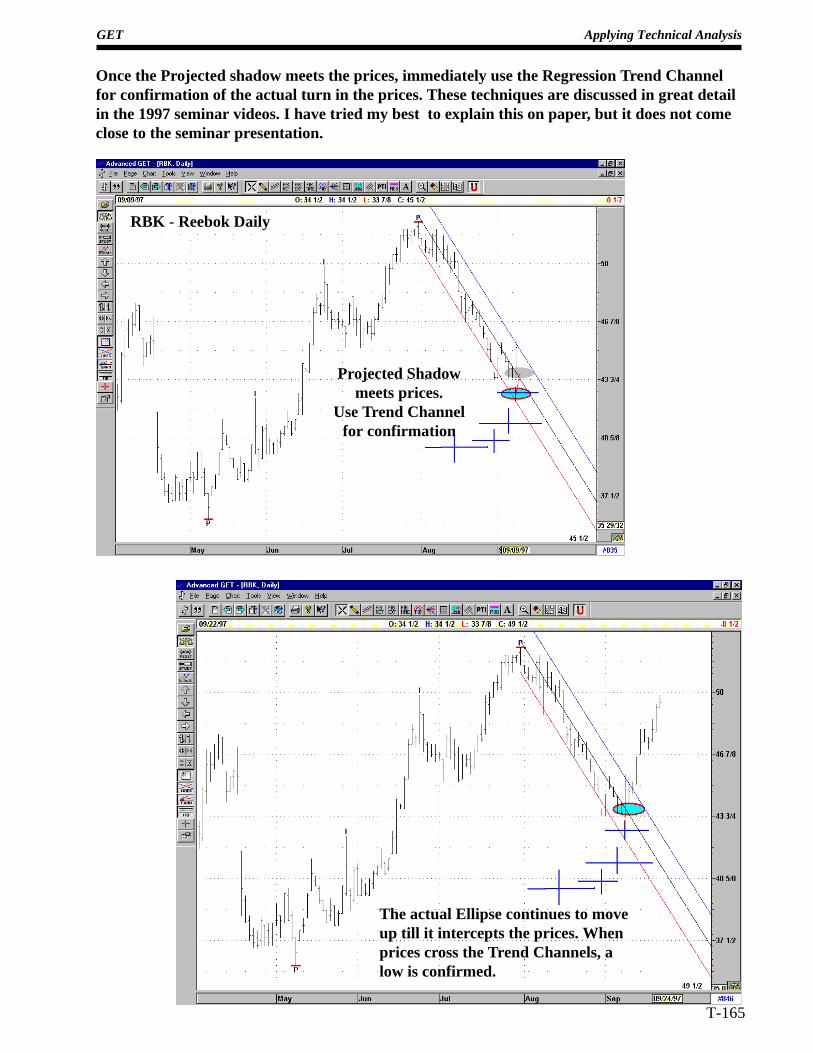
GET Applying Technical Analysis
T-165
Once the Projected shadow meets the prices, immediately use the Regression Trend Channelfor confirmation of the actual turn in the prices. These techniques are discussed in great detailin the 1997 seminar videos. I have tried my best to explain this on paper, but it does not comeclose to the seminar presentation.
RBK - Reebok Daily
Projected Shadowmeets prices.
Use Trend Channelfor confirmation
The actual Ellipse continues to moveup till it intercepts the prices. Whenprices cross the Trend Channels, alow is confirmed.
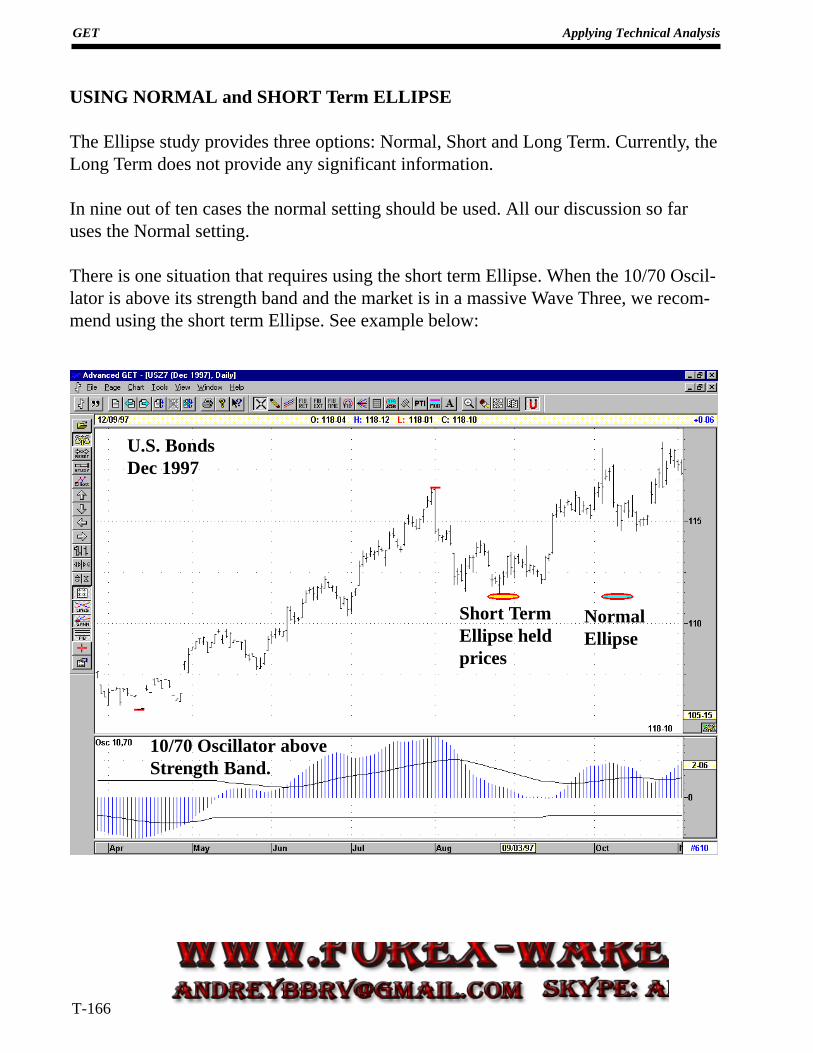
T-166
GET Applying Technical Analysis
USING NORMAL and SHORT Term ELLIPSE
The Ellipse study provides three options: Normal, Short and Long Term. Currently, theLong Term does not provide any significant information.
In nine out of ten cases the normal setting should be used. All our discussion so faruses the Normal setting.
There is one situation that requires using the short term Ellipse. When the 10/70 Oscil-lator is above its strength band and the market is in a massive Wave Three, we recom-mend using the short term Ellipse. See example below:
U.S. BondsDec 1997
10/70 Oscillator aboveStrength Band.
NormalEllipse
Short TermEllipse heldprices
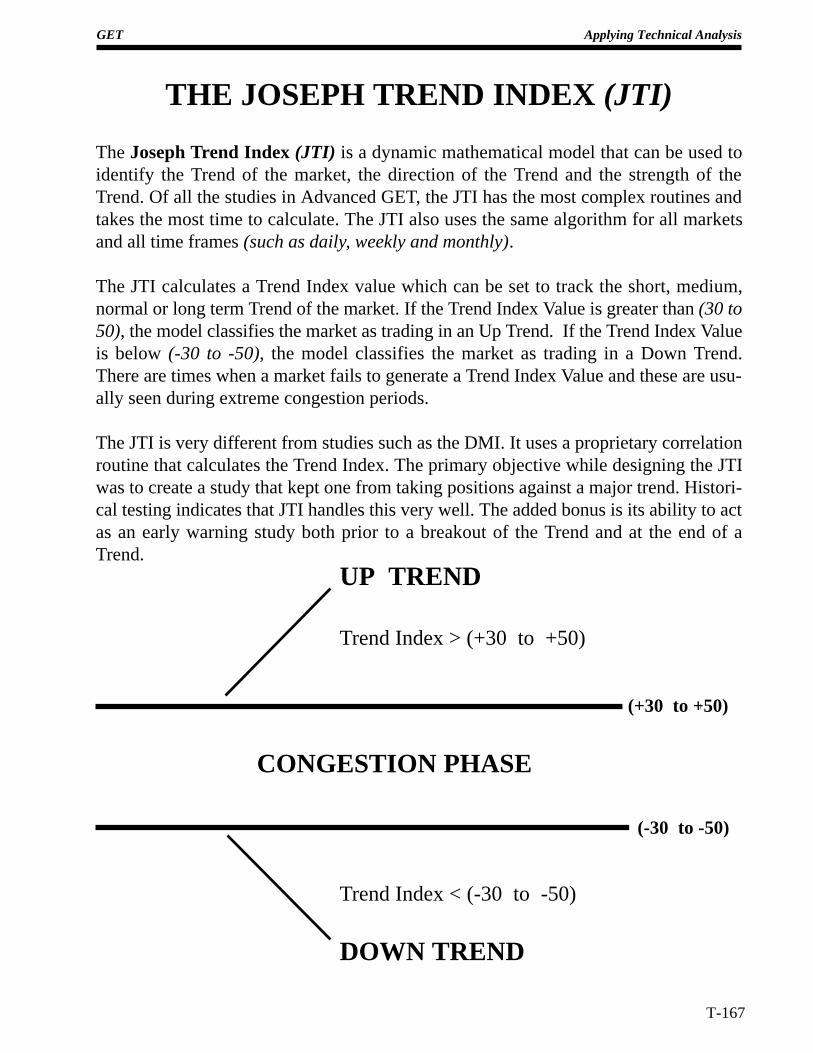
GET Applying Technical Analysis
T-167
THE JOSEPH TREND INDEX (JTI)
The Joseph Trend Index (JTI) is a dynamic mathematical model that can be used toidentify the Trend of the market, the direction of the Trend and the strength of theTrend. Of all the studies in Advanced GET, the JTI has the most complex routines andtakes the most time to calculate. The JTI also uses the same algorithm for all marketsand all time frames (such as daily, weekly and monthly).
The JTI calculates a Trend Index value which can be set to track the short, medium,normal or long term Trend of the market. If the Trend Index Value is greater than (30 to50), the model classifies the market as trading in an Up Trend. If the Trend Index Valueis below (-30 to -50), the model classifies the market as trading in a Down Trend.There are times when a market fails to generate a Trend Index Value and these are usu-ally seen during extreme congestion periods.
The JTI is very different from studies such as the DMI. It uses a proprietary correlationroutine that calculates the Trend Index. The primary objective while designing the JTIwas to create a study that kept one from taking positions against a major trend. Histori-cal testing indicates that JTI handles this very well. The added bonus is its ability to actas an early warning study both prior to a breakout of the Trend and at the end of aTrend.
(+30 to +50)
(-30 to -50)
UP TREND
Trend Index > (+30 to +50)
Trend Index < (-30 to -50)
DOWN TREND
CONGESTION PHASE
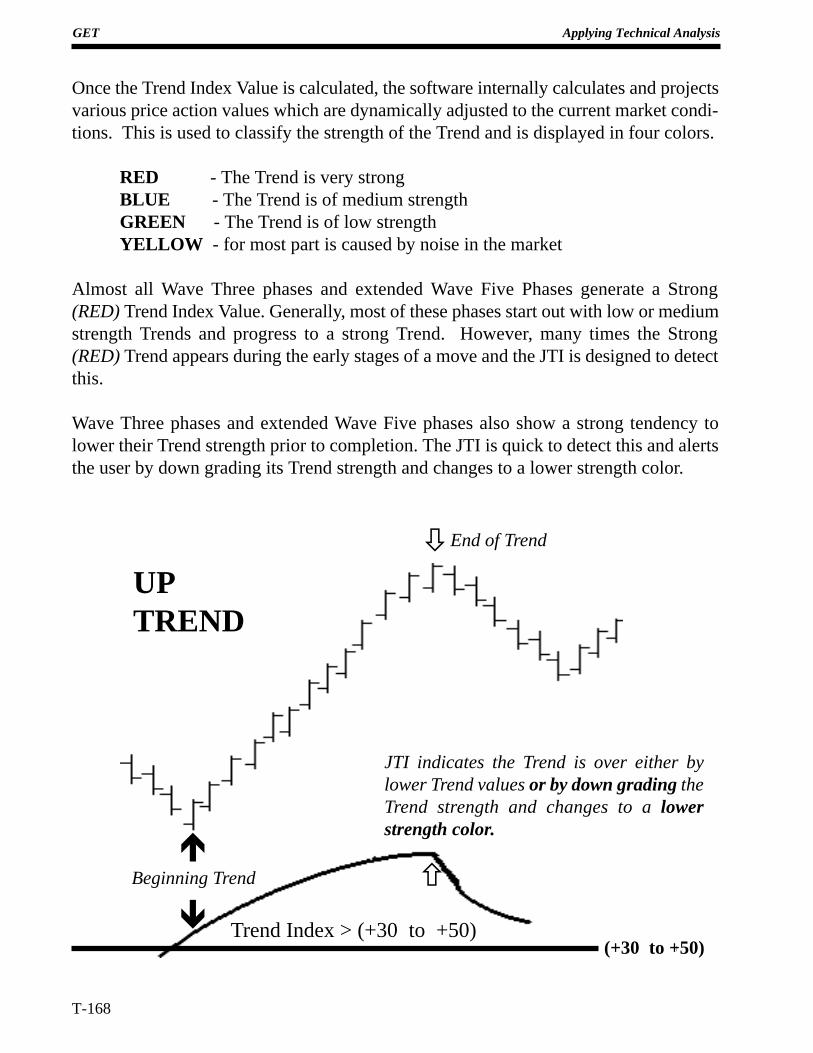
T-168
GET Applying Technical Analysis
Once the Trend Index Value is calculated, the software internally calculates and projectsvarious price action values which are dynamically adjusted to the current market condi-tions. This is used to classify the strength of the Trend and is displayed in four colors.
RED - The Trend is very strongBLUE - The Trend is of medium strengthGREEN - The Trend is of low strengthYELLOW - for most part is caused by noise in the market
Almost all Wave Three phases and extended Wave Five Phases generate a Strong(RED) Trend Index Value. Generally, most of these phases start out with low or mediumstrength Trends and progress to a strong Trend. However, many times the Strong(RED) Trend appears during the early stages of a move and the JTI is designed to detectthis.
Wave Three phases and extended Wave Five phases also show a strong tendency tolower their Trend strength prior to completion. The JTI is quick to detect this and alertsthe user by down grading its Trend strength and changes to a lower strength color.
(+30 to +50)Trend Index > (+30 to +50)
é
ê
Beginning Trend
òEnd of Trend
ñ
UPTREND
JTI indicates the Trend is over either bylower Trend values or by down grading theTrend strength and changes to a lowerstrength color.
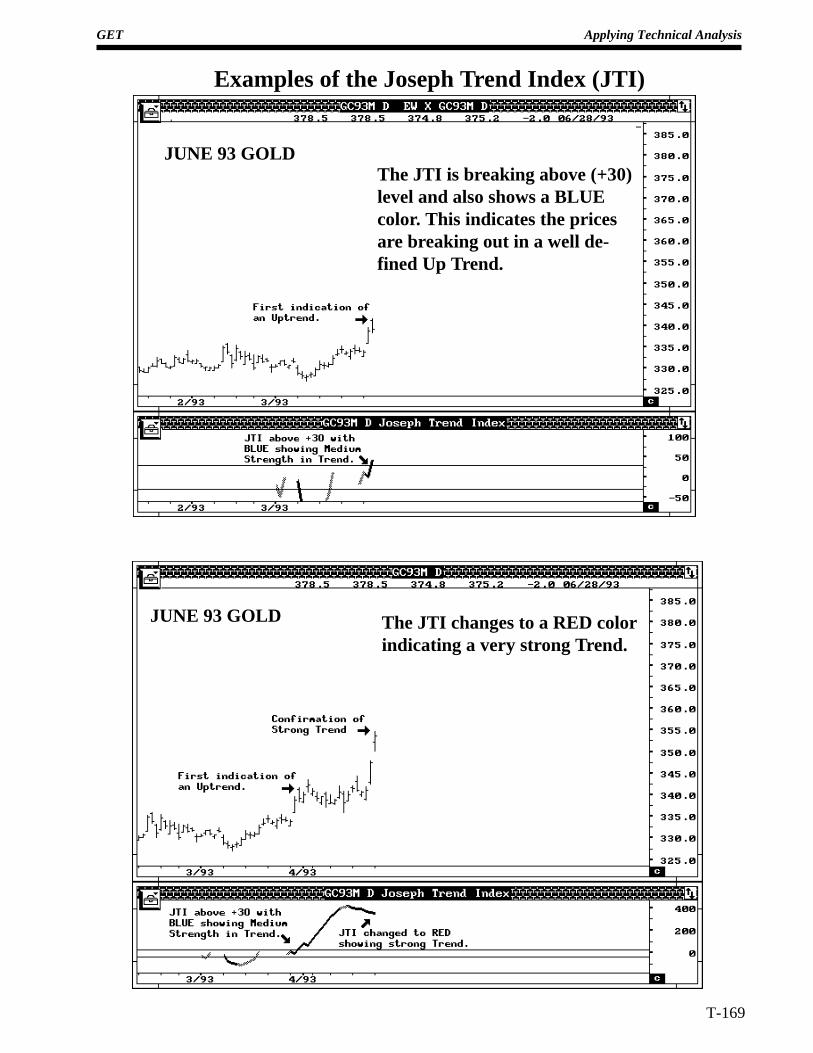
GET Applying Technical Analysis
T-169
JUNE 93 GOLD The JTI changes to a RED colorindicating a very strong Trend.
JUNE 93 GOLDThe JTI is breaking above (+30)level and also shows a BLUEcolor. This indicates the pricesare breaking out in a well de-fined Up Trend.
Examples of the Joseph Trend Index (JTI)
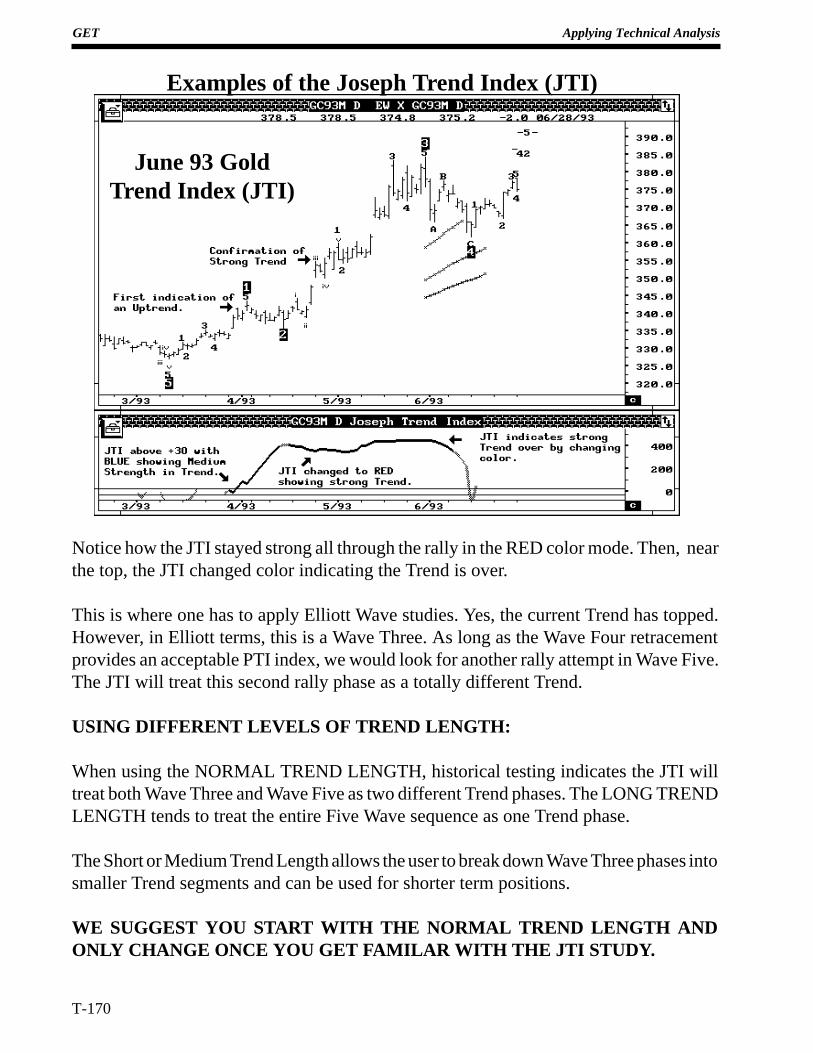
T-170
GET Applying Technical Analysis
Examples of the Joseph Trend Index (JTI)
June 93 GoldTrend Index (JTI)
Notice how the JTI stayed strong all through the rally in the RED color mode. Then, nearthe top, the JTI changed color indicating the Trend is over.
This is where one has to apply Elliott Wave studies. Yes, the current Trend has topped.However, in Elliott terms, this is a Wave Three. As long as the Wave Four retracementprovides an acceptable PTI index, we would look for another rally attempt in Wave Five.The JTI will treat this second rally phase as a totally different Trend.
USING DIFFERENT LEVELS OF TREND LENGTH:
When using the NORMAL TREND LENGTH, historical testing indicates the JTI willtreat both Wave Three and Wave Five as two different Trend phases. The LONG TRENDLENGTH tends to treat the entire Five Wave sequence as one Trend phase.
The Short or Medium Trend Length allows the user to break down Wave Three phases intosmaller Trend segments and can be used for shorter term positions.
WE SUGGEST YOU START WITH THE NORMAL TREND LENGTH ANDONLY CHANGE ONCE YOU GET FAMILAR WITH THE JTI STUDY.
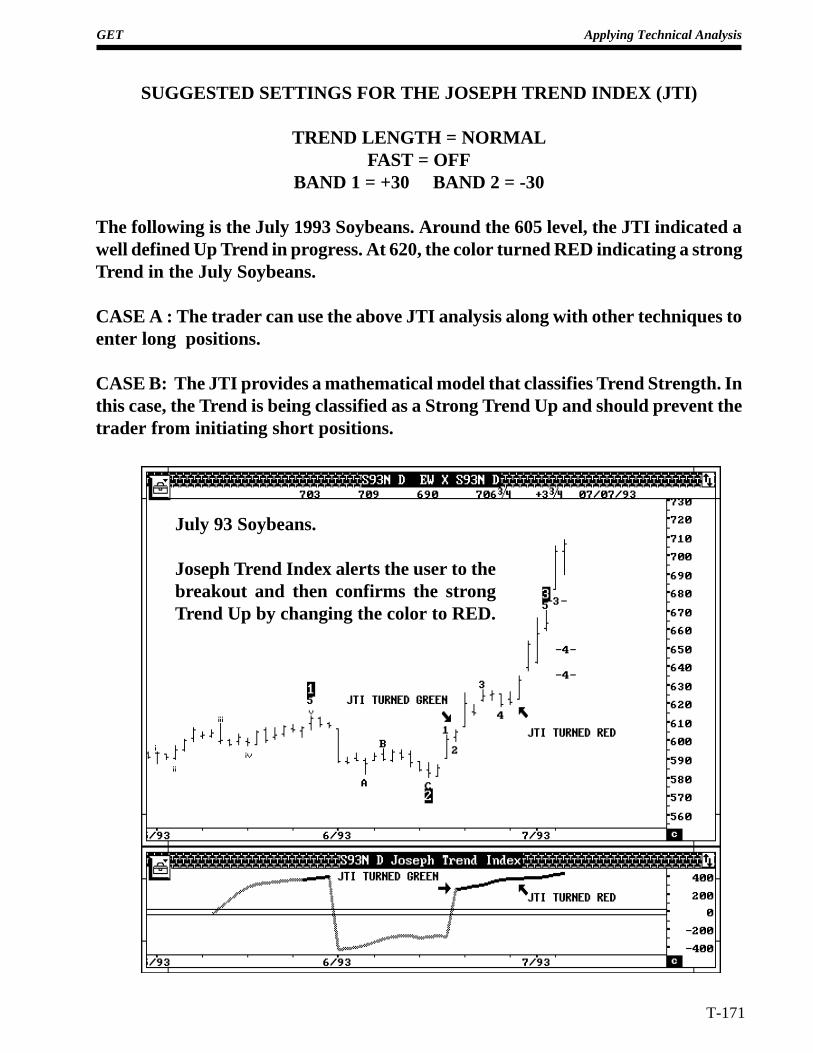
GET Applying Technical Analysis
T-171
SUGGESTED SETTINGS FOR THE JOSEPH TREND INDEX (JTI)
TREND LENGTH = NORMALFAST = OFF
BAND 1 = +30 BAND 2 = -30
The following is the July 1993 Soybeans. Around the 605 level, the JTI indicated awell defined Up Trend in progress. At 620, the color turned RED indicating a strongTrend in the July Soybeans.
CASE A : The trader can use the above JTI analysis along with other techniques toenter long positions.
CASE B: The JTI provides a mathematical model that classifies Trend Strength. Inthis case, the Trend is being classified as a Strong Trend Up and should prevent thetrader from initiating short positions.
July 93 Soybeans.
Joseph Trend Index alerts the user to thebreakout and then confirms the strongTrend Up by changing the color to RED.
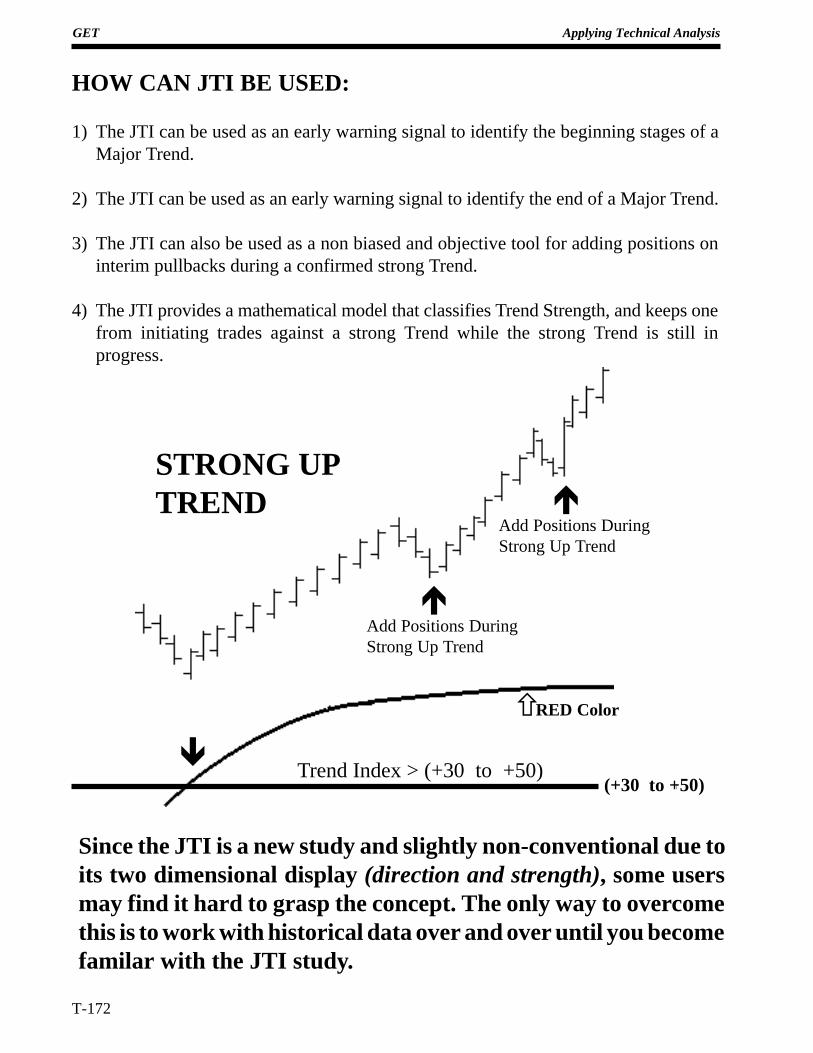
T-172
GET Applying Technical Analysis
HOW CAN JTI BE USED:
1) The JTI can be used as an early warning signal to identify the beginning stages of aMajor Trend.
2) The JTI can be used as an early warning signal to identify the end of a Major Trend.
3) The JTI can also be used as a non biased and objective tool for adding positions oninterim pullbacks during a confirmed strong Trend.
4) The JTI provides a mathematical model that classifies Trend Strength, and keeps onefrom initiating trades against a strong Trend while the strong Trend is still inprogress.
Since the JTI is a new study and slightly non-conventional due toits two dimensional display (direction and strength), some usersmay find it hard to grasp the concept. The only way to overcomethis is to work with historical data over and over until you becomefamilar with the JTI study.
(+30 to +50)ê
éAdd Positions DuringStrong Up Trend
éAdd Positions DuringStrong Up Trend
RED Color
Trend Index > (+30 to +50)
ñ
STRONG UPTREND
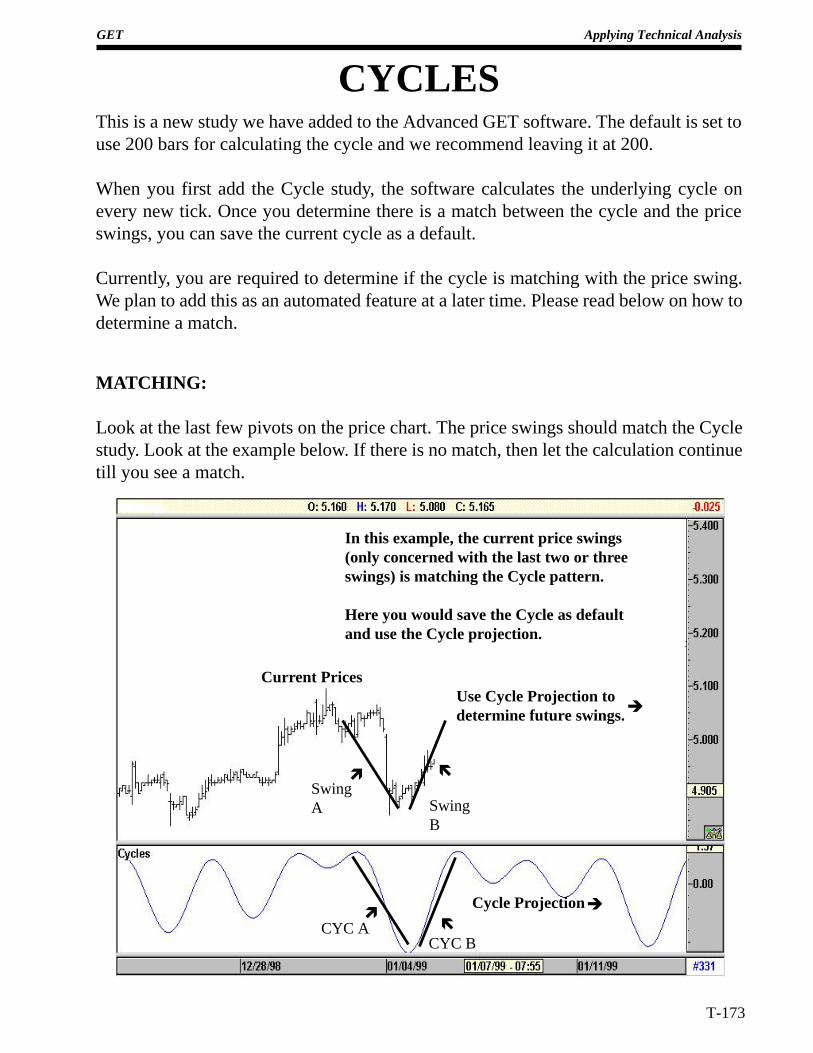
GET Applying Technical Analysis
T-173
CYCLESThis is a new study we have added to the Advanced GET software. The default is set touse 200 bars for calculating the cycle and we recommend leaving it at 200.
When you first add the Cycle study, the software calculates the underlying cycle onevery new tick. Once you determine there is a match between the cycle and the priceswings, you can save the current cycle as a default.
Currently, you are required to determine if the cycle is matching with the price swing.We plan to add this as an automated feature at a later time. Please read below on how todetermine a match.
MATCHING:
Look at the last few pivots on the price chart. The price swings should match the Cyclestudy. Look at the example below. If there is no match, then let the calculation continuetill you see a match.
Current Prices
CYC Aì
CYC Bë
SwingA
ì
SwingB
ë
In this example, the current price swings(only concerned with the last two or threeswings) is matching the Cycle pattern.
Here you would save the Cycle as defaultand use the Cycle projection.
Cycle Projectionè
Use Cycle Projection todetermine future swings.è
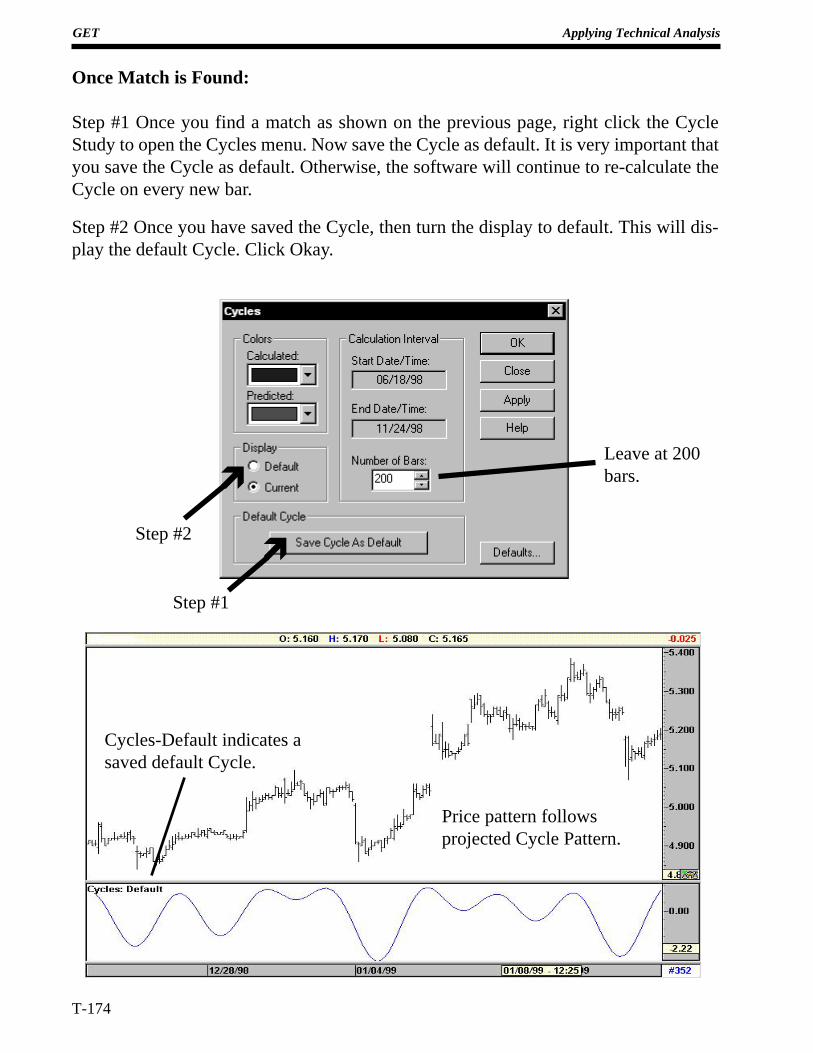
T-174
GET Applying Technical Analysis
Once Match is Found:
Step #1 Once you find a match as shown on the previous page, right click the CycleStudy to open the Cycles menu. Now save the Cycle as default. It is very important thatyou save the Cycle as default. Otherwise, the software will continue to re-calculate theCycle on every new bar.
Step #2 Once you have saved the Cycle, then turn the display to default. This will dis-play the default Cycle. Click Okay.
Step #1
ìStep #2
ìLeave at 200bars.
Cycles-Default indicates asaved default Cycle.
Price pattern followsprojected Cycle Pattern.
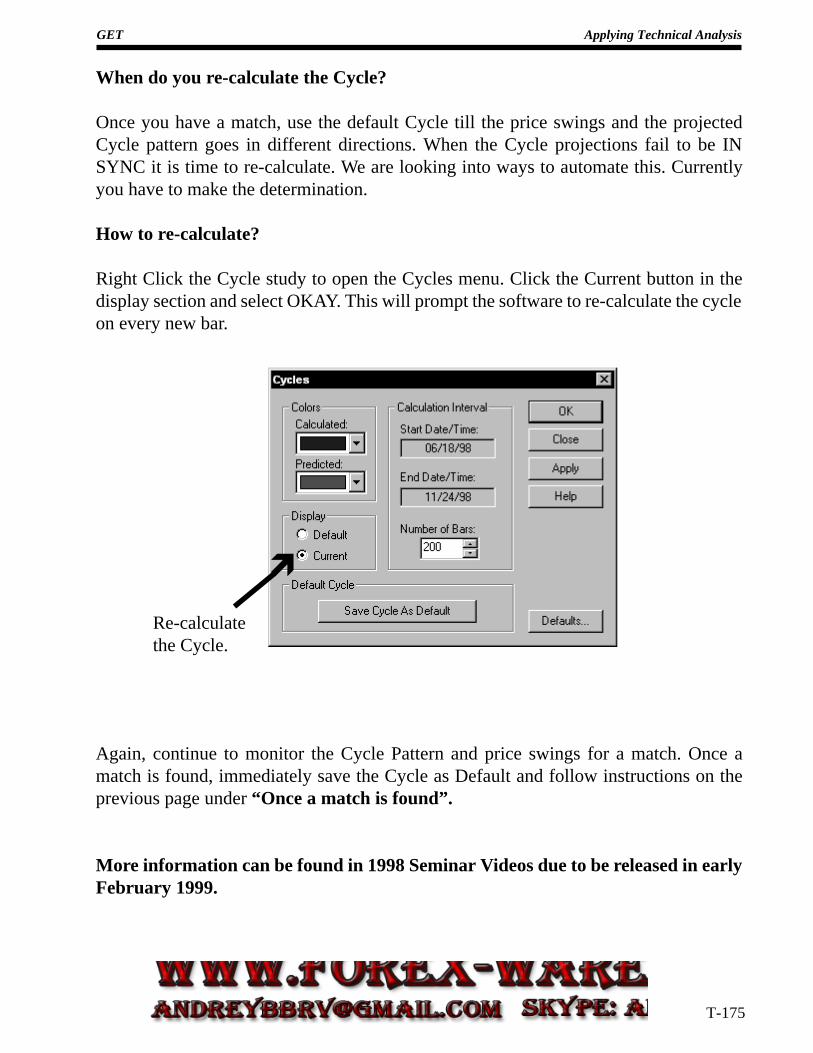
GET Applying Technical Analysis
T-175
When do you re-calculate the Cycle?
Once you have a match, use the default Cycle till the price swings and the projectedCycle pattern goes in different directions. When the Cycle projections fail to be INSYNC it is time to re-calculate. We are looking into ways to automate this. Currentlyyou have to make the determination.
How to re-calculate?
Right Click the Cycle study to open the Cycles menu. Click the Current button in thedisplay section and select OKAY. This will prompt the software to re-calculate the cycleon every new bar.
Again, continue to monitor the Cycle Pattern and price swings for a match. Once amatch is found, immediately save the Cycle as Default and follow instructions on theprevious page under “Once a match is found”.
More information can be found in 1998 Seminar Videos due to be released in earlyFebruary 1999.
Re-calculatethe Cycle.
ì
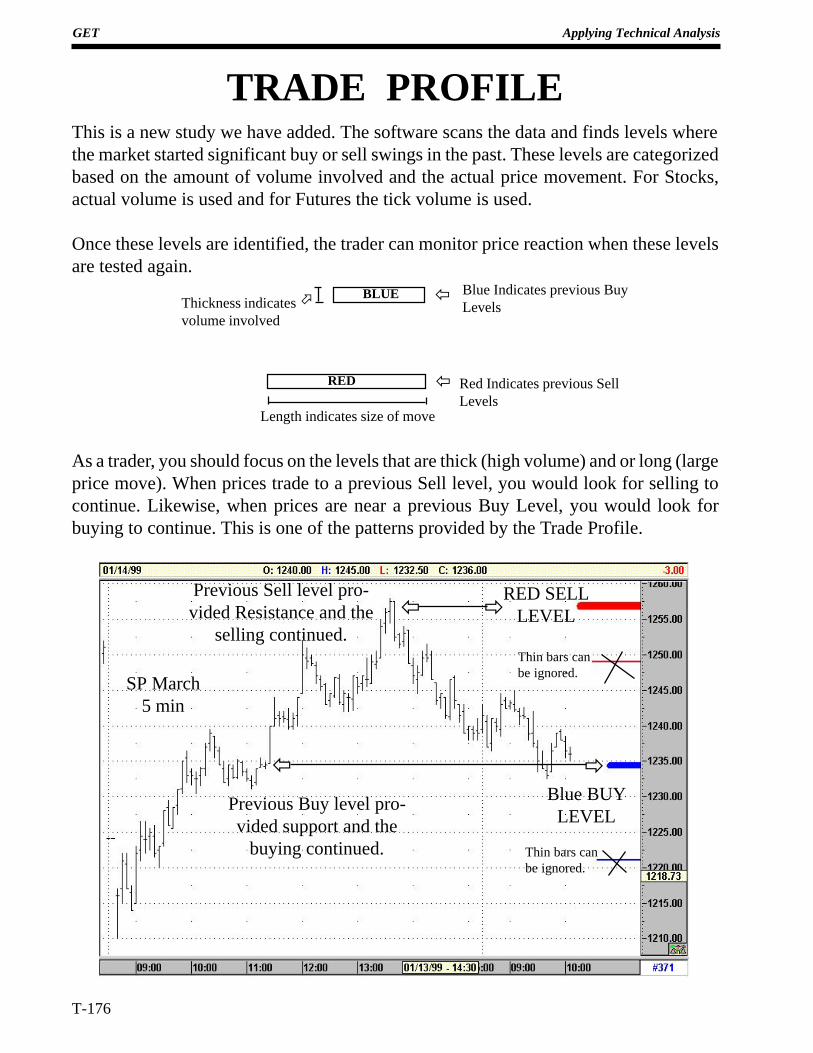
T-176
GET Applying Technical Analysis
TRADE PROFILEThis is a new study we have added. The software scans the data and finds levels wherethe market started significant buy or sell swings in the past. These levels are categorizedbased on the amount of volume involved and the actual price movement. For Stocks,actual volume is used and for Futures the tick volume is used.
Once these levels are identified, the trader can monitor price reaction when these levelsare tested again.
As a trader, you should focus on the levels that are thick (high volume) and or long (largeprice move). When prices trade to a previous Sell level, you would look for selling tocontinue. Likewise, when prices are near a previous Buy Level, you would look forbuying to continue. This is one of the patterns provided by the Trade Profile.
BLUE
RED
Blue Indicates previous BuyLevels
Red Indicates previous SellLevels
Length indicates size of move
Thickness indicatesvolume involved
ï
ïö
Blue BUYLEVEL
Thin bars canbe ignored.
Thin bars canbe ignored.
Previous Buy level pro-vided support and the
buying continued.
ðï
ðïPrevious Sell level pro-vided Resistance and the
selling continued.
SP March5 min
RED SELLLEVEL
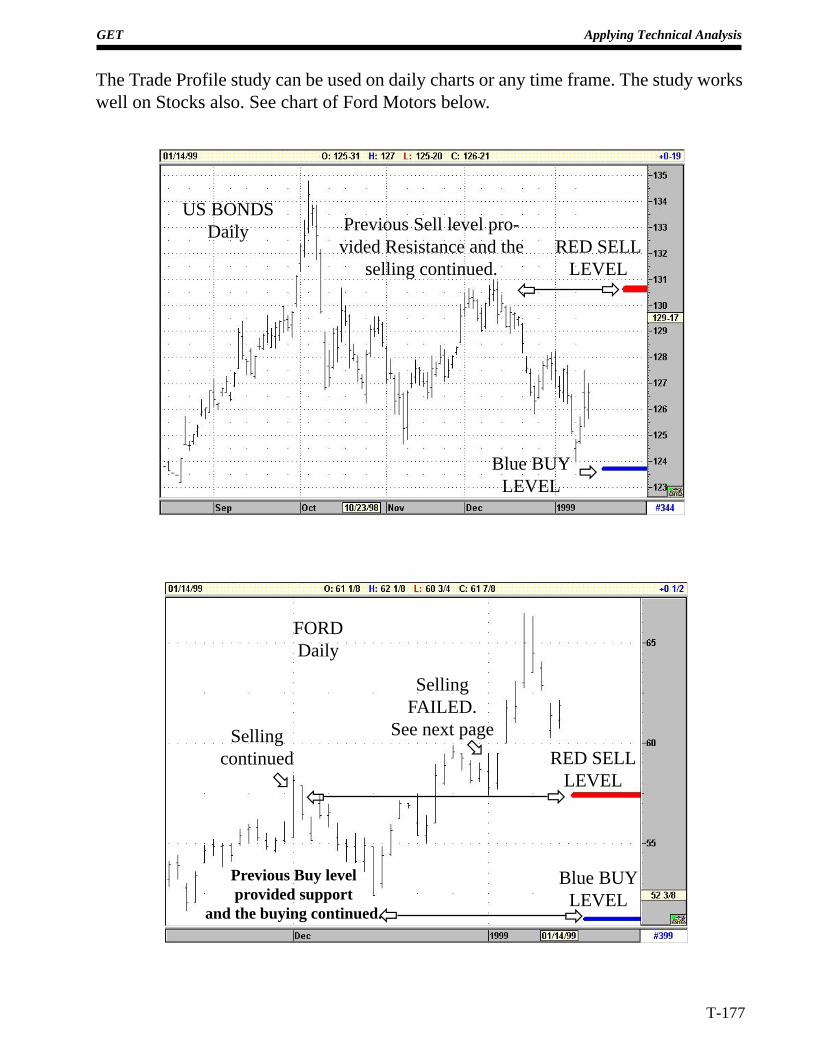
GET Applying Technical Analysis
T-177
RED SELLLEVEL
Blue BUYLEVEL
ð
ðï
Previous Sell level pro-vided Resistance and the
selling continued.
The Trade Profile study can be used on daily charts or any time frame. The study workswell on Stocks also. See chart of Ford Motors below.
US BONDSDaily
Blue BUYLEVEL
Previous Buy levelprovided support
and the buying continued. ðï
ðï
Sellingcontinued
FORDDaily
RED SELLLEVEL
SellingFAILED.
See next pageø
ø
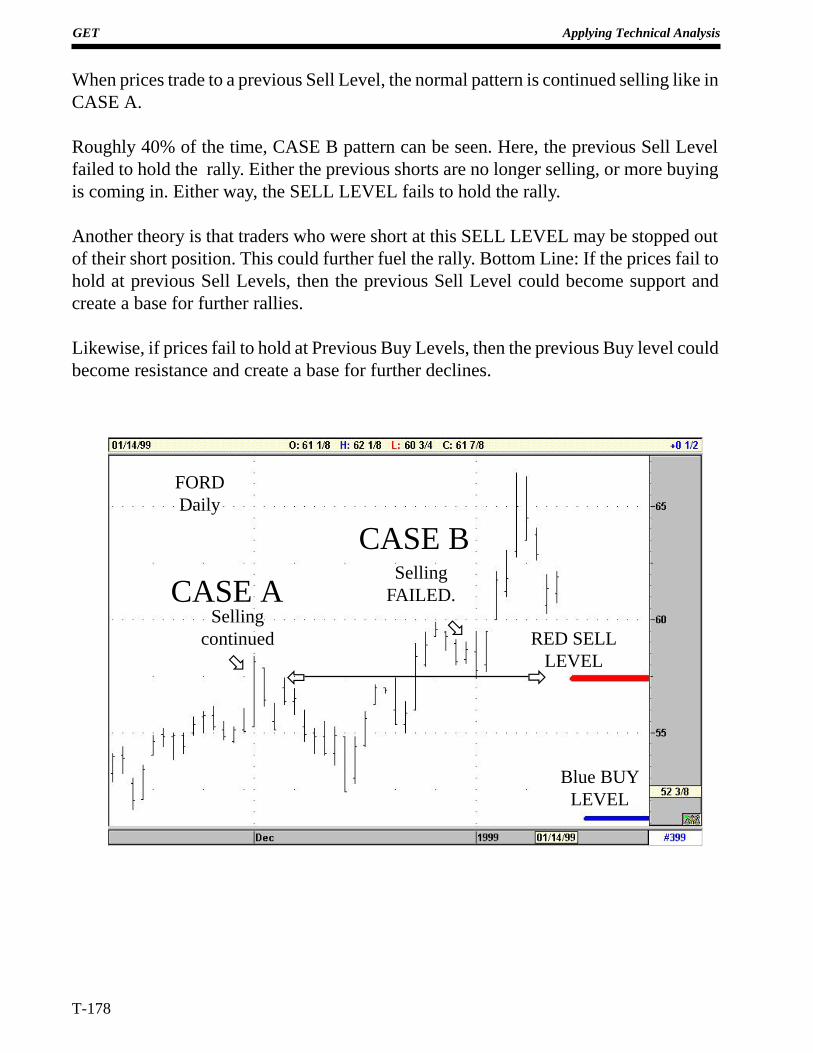
T-178
GET Applying Technical Analysis
Blue BUYLEVEL
ðï
Sellingcontinued
FORDDaily
RED SELLLEVEL
SellingFAILED.
ø
ø
When prices trade to a previous Sell Level, the normal pattern is continued selling like inCASE A.
Roughly 40% of the time, CASE B pattern can be seen. Here, the previous Sell Levelfailed to hold the rally. Either the previous shorts are no longer selling, or more buyingis coming in. Either way, the SELL LEVEL fails to hold the rally.
Another theory is that traders who were short at this SELL LEVEL may be stopped outof their short position. This could further fuel the rally. Bottom Line: If the prices fail tohold at previous Sell Levels, then the previous Sell Level could become support andcreate a base for further rallies.
Likewise, if prices fail to hold at Previous Buy Levels, then the previous Buy level couldbecome resistance and create a base for further declines.
CASE A
CASE B
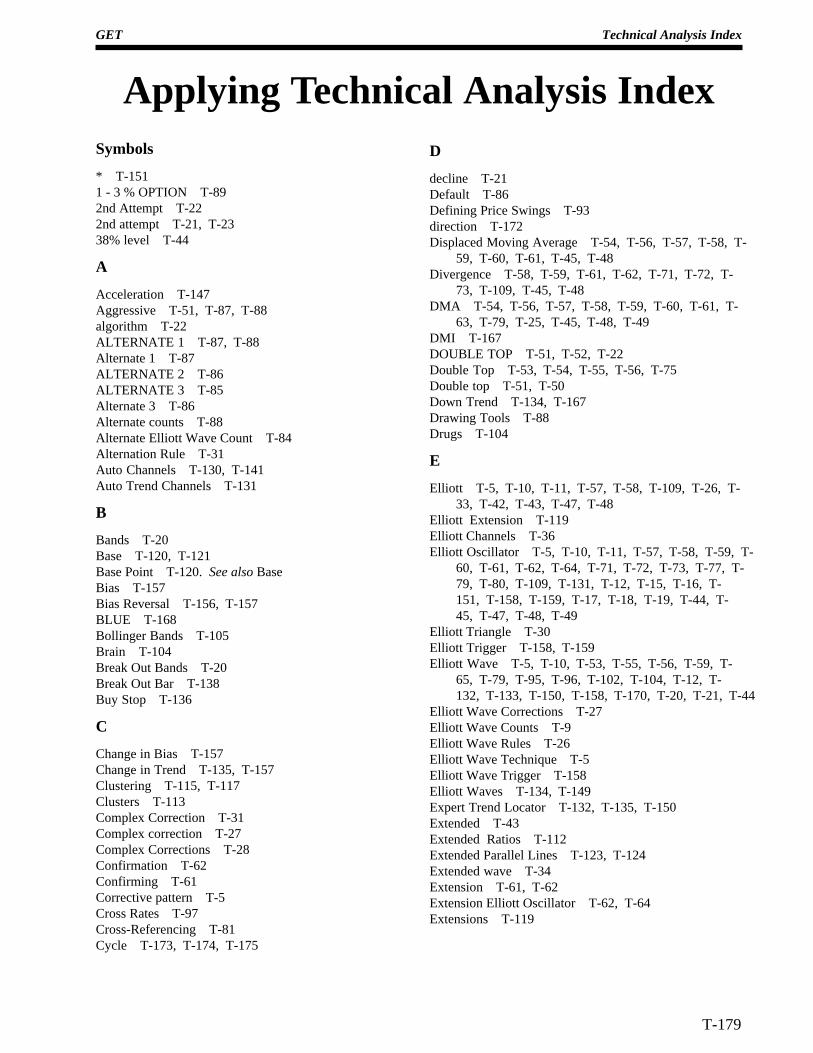
GET Technical Analysis Index
T-179
Applying Technical Analysis IndexSymbols
* T-1511 - 3 % OPTION T-892nd Attempt T-222nd attempt T-21, T-2338% level T-44
A
Acceleration T-147Aggressive T-51, T-87, T-88algorithm T-22ALTERNATE 1 T-87, T-88Alternate 1 T-87ALTERNATE 2 T-86ALTERNATE 3 T-85Alternate 3 T-86Alternate counts T-88Alternate Elliott Wave Count T-84Alternation Rule T-31Auto Channels T-130, T-141Auto Trend Channels T-131
B
Bands T-20Base T-120, T-121Base Point T-120.See also BaseBias T-157Bias Reversal T-156, T-157BLUE T-168Bollinger Bands T-105Brain T-104Break Out Bands T-20Break Out Bar T-138Buy Stop T-136
C
Change in Bias T-157Change in Trend T-135, T-157Clustering T-115, T-117Clusters T-113Complex Correction T-31Complex correction T-27Complex Corrections T-28Confirmation T-62Confirming T-61Corrective pattern T-5Cross Rates T-97Cross-Referencing T-81Cycle T-173, T-174, T-175
D
decline T-21Default T-86Defining Price Swings T-93direction T-172Displaced Moving Average T-54, T-56, T-57, T-58, T-
59, T-60, T-61, T-45, T-48Divergence T-58, T-59, T-61, T-62, T-71, T-72, T-
73, T-109, T-45, T-48DMA T-54, T-56, T-57, T-58, T-59, T-60, T-61, T-
63, T-79, T-25, T-45, T-48, T-49DMI T-167DOUBLE TOP T-51, T-52, T-22Double Top T-53, T-54, T-55, T-56, T-75Double top T-51, T-50Down Trend T-134, T-167Drawing Tools T-88Drugs T-104
E
Elliott T-5, T-10, T-11, T-57, T-58, T-109, T-26, T-33, T-42, T-43, T-47, T-48
Elliott Extension T-119Elliott Channels T-36Elliott Oscillator T-5, T-10, T-11, T-57, T-58, T-59, T-
60, T-61, T-62, T-64, T-71, T-72, T-73, T-77, T-79, T-80, T-109, T-131, T-12, T-15, T-16, T-151, T-158, T-159, T-17, T-18, T-19, T-44, T-45, T-47, T-48, T-49
Elliott Triangle T-30Elliott Trigger T-158, T-159Elliott Wave T-5, T-10, T-53, T-55, T-56, T-59, T-
65, T-79, T-95, T-96, T-102, T-104, T-12, T-132, T-133, T-150, T-158, T-170, T-20, T-21, T-44
Elliott Wave Corrections T-27Elliott Wave Counts T-9Elliott Wave Rules T-26Elliott Wave Technique T-5Elliott Wave Trigger T-158Elliott Waves T-134, T-149Expert Trend Locator T-132, T-135, T-150Extended T-43Extended Ratios T-112Extended Parallel Lines T-123, T-124Extended wave T-34Extension T-61, T-62Extension Elliott Oscillator T-62, T-64Extensions T-119
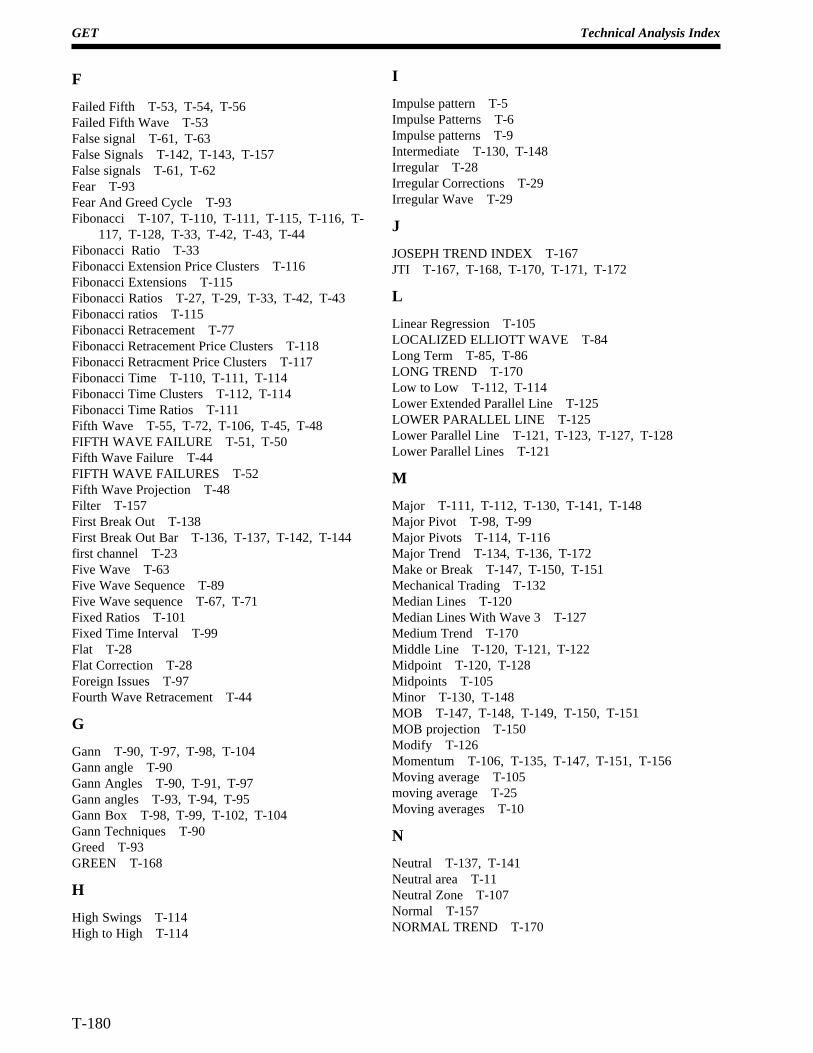
GET Technical Analysis Index
T-180
F
Failed Fifth T-53, T-54, T-56Failed Fifth Wave T-53False signal T-61, T-63False Signals T-142, T-143, T-157False signals T-61, T-62Fear T-93Fear And Greed Cycle T-93Fibonacci T-107, T-110, T-111, T-115, T-116, T-
117, T-128, T-33, T-42, T-43, T-44Fibonacci Ratio T-33Fibonacci Extension Price Clusters T-116Fibonacci Extensions T-115Fibonacci Ratios T-27, T-29, T-33, T-42, T-43Fibonacci ratios T-115Fibonacci Retracement T-77Fibonacci Retracement Price Clusters T-118Fibonacci Retracment Price Clusters T-117Fibonacci Time T-110, T-111, T-114Fibonacci Time Clusters T-112, T-114Fibonacci Time Ratios T-111Fifth Wave T-55, T-72, T-106, T-45, T-48FIFTH WAVE FAILURE T-51, T-50Fifth Wave Failure T-44FIFTH WAVE FAILURES T-52Fifth Wave Projection T-48Filter T-157First Break Out T-138First Break Out Bar T-136, T-137, T-142, T-144first channel T-23Five Wave T-63Five Wave Sequence T-89Five Wave sequence T-67, T-71Fixed Ratios T-101Fixed Time Interval T-99Flat T-28Flat Correction T-28Foreign Issues T-97Fourth Wave Retracement T-44
G
Gann T-90, T-97, T-98, T-104Gann angle T-90Gann Angles T-90, T-91, T-97Gann angles T-93, T-94, T-95Gann Box T-98, T-99, T-102, T-104Gann Techniques T-90Greed T-93GREEN T-168
H
High Swings T-114High to High T-114
I
Impulse pattern T-5Impulse Patterns T-6Impulse patterns T-9Intermediate T-130, T-148Irregular T-28Irregular Corrections T-29Irregular Wave T-29
J
JOSEPH TREND INDEX T-167JTI T-167, T-168, T-170, T-171, T-172
L
Linear Regression T-105LOCALIZED ELLIOTT WAVE T-84Long Term T-85, T-86LONG TREND T-170Low to Low T-112, T-114Lower Extended Parallel Line T-125LOWER PARALLEL LINE T-125Lower Parallel Line T-121, T-123, T-127, T-128Lower Parallel Lines T-121
M
Major T-111, T-112, T-130, T-141, T-148Major Pivot T-98, T-99Major Pivots T-114, T-116Major Trend T-134, T-136, T-172Make or Break T-147, T-150, T-151Mechanical Trading T-132Median Lines T-120Median Lines With Wave 3 T-127Medium Trend T-170Middle Line T-120, T-121, T-122Midpoint T-120, T-128Midpoints T-105Minor T-130, T-148MOB T-147, T-148, T-149, T-150, T-151MOB projection T-150Modify T-126Momentum T-106, T-135, T-147, T-151, T-156Moving average T-105moving average T-25Moving averages T-10
N
Neutral T-137, T-141Neutral area T-11Neutral Zone T-107Normal T-157NORMAL TREND T-170
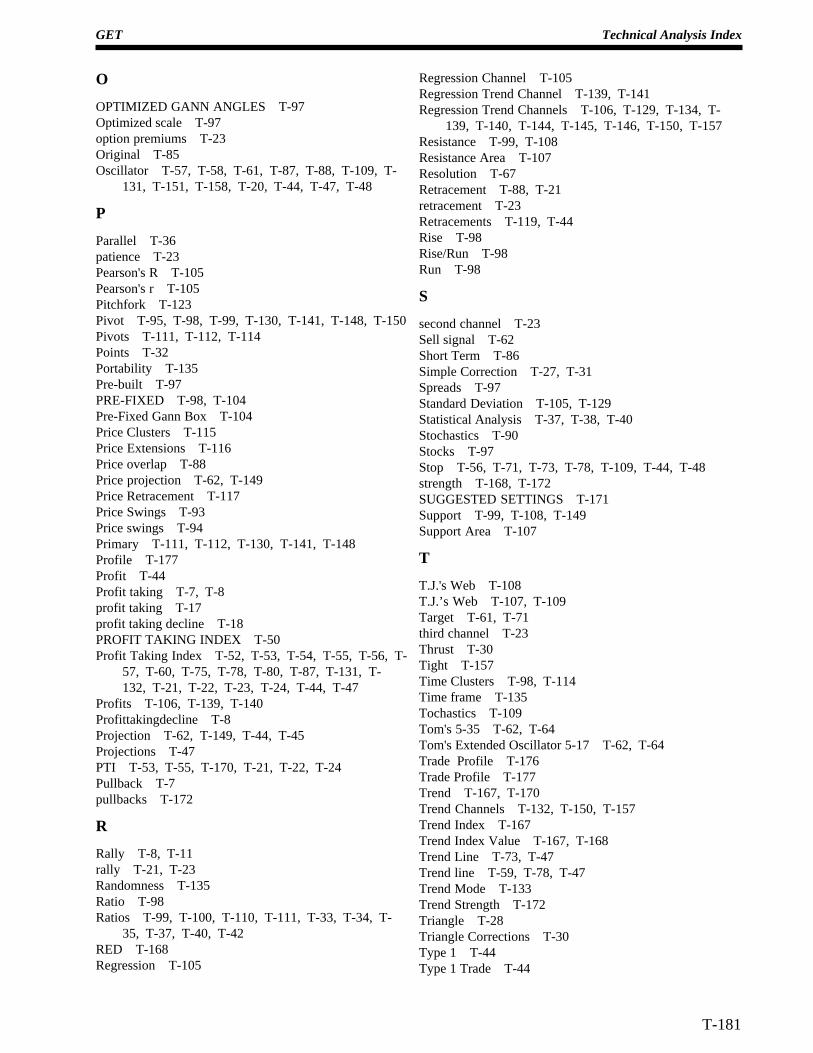
GET Technical Analysis Index
T-181
Regression Channel T-105Regression Trend Channel T-139, T-141Regression Trend Channels T-106, T-129, T-134, T-
139, T-140, T-144, T-145, T-146, T-150, T-157Resistance T-99, T-108Resistance Area T-107Resolution T-67Retracement T-88, T-21retracement T-23Retracements T-119, T-44Rise T-98Rise/Run T-98Run T-98
S
second channel T-23Sell signal T-62Short Term T-86Simple Correction T-27, T-31Spreads T-97Standard Deviation T-105, T-129Statistical Analysis T-37, T-38, T-40Stochastics T-90Stocks T-97Stop T-56, T-71, T-73, T-78, T-109, T-44, T-48strength T-168, T-172SUGGESTED SETTINGS T-171Support T-99, T-108, T-149Support Area T-107
T
T.J.'s Web T-108T.J.’s Web T-107, T-109Target T-61, T-71third channel T-23Thrust T-30Tight T-157Time Clusters T-98, T-114Time frame T-135Tochastics T-109Tom's 5-35 T-62, T-64Tom's Extended Oscillator 5-17 T-62, T-64Trade Profile T-176Trade Profile T-177Trend T-167, T-170Trend Channels T-132, T-150, T-157Trend Index T-167Trend Index Value T-167, T-168Trend Line T-73, T-47Trend line T-59, T-78, T-47Trend Mode T-133Trend Strength T-172Triangle T-28Triangle Corrections T-30Type 1 T-44Type 1 Trade T-44
O
OPTIMIZED GANN ANGLES T-97Optimized scale T-97option premiums T-23Original T-85Oscillator T-57, T-58, T-61, T-87, T-88, T-109, T-
131, T-151, T-158, T-20, T-44, T-47, T-48
P
Parallel T-36patience T-23Pearson's R T-105Pearson's r T-105Pitchfork T-123Pivot T-95, T-98, T-99, T-130, T-141, T-148, T-150Pivots T-111, T-112, T-114Points T-32Portability T-135Pre-built T-97PRE-FIXED T-98, T-104Pre-Fixed Gann Box T-104Price Clusters T-115Price Extensions T-116Price overlap T-88Price projection T-62, T-149Price Retracement T-117Price Swings T-93Price swings T-94Primary T-111, T-112, T-130, T-141, T-148Profile T-177Profit T-44Profit taking T-7, T-8profit taking T-17profit taking decline T-18PROFIT TAKING INDEX T-50Profit Taking Index T-52, T-53, T-54, T-55, T-56, T-
57, T-60, T-75, T-78, T-80, T-87, T-131, T-132, T-21, T-22, T-23, T-24, T-44, T-47
Profits T-106, T-139, T-140Profittakingdecline T-8Projection T-62, T-149, T-44, T-45Projections T-47PTI T-53, T-55, T-170, T-21, T-22, T-24Pullback T-7pullbacks T-172
R
Rally T-8, T-11rally T-21, T-23Randomness T-135Ratio T-98Ratios T-99, T-100, T-110, T-111, T-33, T-34, T-
35, T-37, T-40, T-42RED T-168Regression T-105
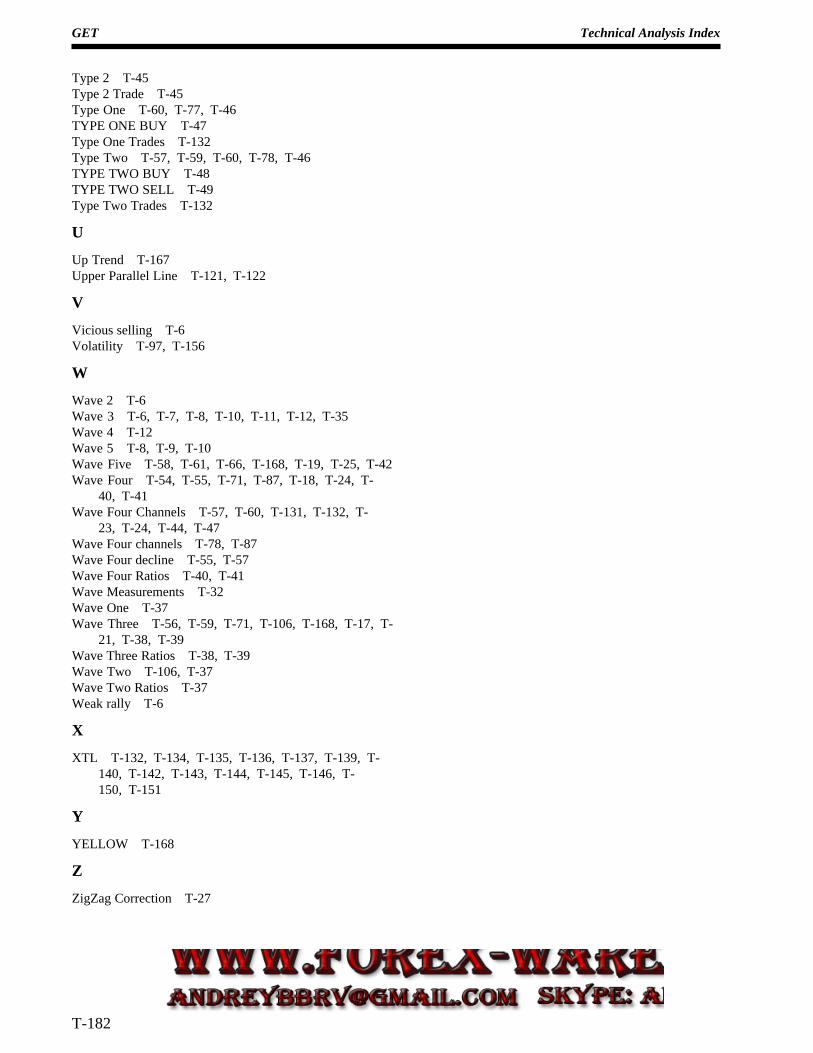
GET Technical Analysis Index
T-182
Type 2 T-45Type 2 Trade T-45Type One T-60, T-77, T-46TYPE ONE BUY T-47Type One Trades T-132Type Two T-57, T-59, T-60, T-78, T-46TYPE TWO BUY T-48TYPE TWO SELL T-49Type Two Trades T-132
U
Up Trend T-167Upper Parallel Line T-121, T-122
V
Vicious selling T-6Volatility T-97, T-156
W
Wave 2 T-6Wave 3 T-6, T-7, T-8, T-10, T-11, T-12, T-35Wave 4 T-12Wave 5 T-8, T-9, T-10Wave Five T-58, T-61, T-66, T-168, T-19, T-25, T-42Wave Four T-54, T-55, T-71, T-87, T-18, T-24, T-
40, T-41Wave Four Channels T-57, T-60, T-131, T-132, T-
23, T-24, T-44, T-47Wave Four channels T-78, T-87Wave Four decline T-55, T-57Wave Four Ratios T-40, T-41Wave Measurements T-32Wave One T-37Wave Three T-56, T-59, T-71, T-106, T-168, T-17, T-
21, T-38, T-39Wave Three Ratios T-38, T-39Wave Two T-106, T-37Wave Two Ratios T-37Weak rally T-6
X
XTL T-132, T-134, T-135, T-136, T-137, T-139, T-140, T-142, T-143, T-144, T-145, T-146, T-150, T-151
Y
YELLOW T-168
Z
ZigZag Correction T-27


