Required Report - public distribution Date: 3/25/2004 GAIN Report Number: UK4006 UK4005 United Kingdom Wine Annual Marketing Report 2003 Approved by: Valerie Brown-Jones U.S. Embassy Prepared by: Jennifer Jones Report Highlights: The UK is arguably the most important wine market in the world. It is the number one export market for US wine, and this focus has served the US well. According to AC Nielsen, the US is now the third largest supplier to the UK retail sector. UK Customs data shows that European suppliers versus non- European suppliers are currently on an equal footing. However, forecasters predict that the “New World” will continue to take market share from traditional EU suppliers. Includes PSD Changes: No Includes Trade Matrix: Yes Annual Report London [UK1] [UK] USDA Foreign Agricultural Service GAIN Report Global Agriculture Information Network Template Version 2.09
Transcript
Required Report - public distributionDate: 3/25/2004
GAIN Report Number: UK4006UK4005United KingdomWineAnnual Marketing Report2003
Approved by:Valerie Brown-JonesU.S. EmbassyPrepared by:Jennifer Jones
Report Highlights:The UK is arguably the most important wine market in the world. It is the number one export market for US wine, and this focus has served the US well. According to AC Nielsen, the US is now the third largest supplier to the UK retail sector. UK Customs data shows that European suppliers versus non-European suppliers are currently on an equal footing. However, forecasters predict that the “New World” will continue to take market share from traditional EU suppliers.
Includes PSD Changes: NoIncludes Trade Matrix: Yes
Annual ReportLondon [UK1]
[UK]
USDA Foreign Agricultural Service
GAIN ReportGlobal Agriculture Information Network
Template Version 2.09
GAIN Report - UK4006 Page 2 of 26
Table of ContentsExecutive Summary............................................................................................3Production.........................................................................................................4Consumption.....................................................................................................4
UK Market Size.....................................................................................................................4UK Per Capita Consumption of Alcoholic Beverages..............................................................4UK Consumer Usage Patterns...............................................................................................5Profile of Wine Drinkers: by Age Group and Social Grade 2002.............................................5Profile of Wine Drinkers: by Wine Color 2002........................................................................6Consumer Survey on Price....................................................................................................7Average Price per 75cl Bottle...............................................................................................7UK Top 5 Wine Brands 2002, Still Light Wines.......................................................................8Top 20 Still Light Wines in Off-Licenses: Ranking By Type.....................................................8
Market Dynamics...............................................................................................9Still Light Wine.....................................................................................................................9Sparkling Wine...................................................................................................................10Vermouth & Other Flavored Aromatized Wines...................................................................10
Marketing........................................................................................................11Still Light Wine...................................................................................................................11Examples of Generic Country Marketing Activities..............................................................11Sparkling Wine...................................................................................................................13New Product Development.................................................................................................13
Distribution.....................................................................................................14Still Wines in Off-Licenses by Outlet, 2002..........................................................................14Still Wines in On-Licenses by Outlet, 2002..........................................................................15
Import/Export Tables........................................................................................20UK Imports of Still Wine by Volume, 2001-2003..................................................................20UK Imports of Still Wine by Value, 2001-2003.....................................................................21UK Imports of Sparkling Wine by Volume, 2001-2003.........................................................22UK Imports of Sparkling Wine by Value, 2001-2003............................................................22UK Imports of Flavored Wine & Vermouth by Volume, 2001-2003.......................................23UK Imports of Flavored Wine & Vermouth by Value, 2001-2003..........................................23UK Exports of Still Wine by Volume, 2001-2003..................................................................24UK Exports of Still Wine by Value, 2001-2003.....................................................................24UK Exports of Sparkling Wine by Volume, 2001-2003.........................................................25UK Exports of Sparkling Wine by Value, 2001-2003............................................................25UK Exports of Flavored Wine & Vermouth by Volume, 2001-2003.......................................26UK Exports of Flavored Wine & Vermouth by Value, 2001-2003..........................................26
UNCLASSIFIED USDA Foreign Agricultural Service
GAIN Report - UK4006 Page 3 of 26
Executive Summary
Wine has become something of an everyday commodity in the UK, enjoyed by many, regardless of affluence, and without much of the elitism that used to surround it. This has been facilitated by an increase in affordable, good quality wines, consumer exposure to wine-drinking while on vacation, improved signage in retail stores, but, most importantly, because of the new, accessible, branded wines that have emerged on the market.
The wine market in the UK is worth (according to Mintel) around ₤8.1 billion ($14.6 billion), while wholesale figures from Her Majesty’s Customs & Excise show annual imports less exports of around ₤2 billion ($3.6 billion).
While French wines are still dominant in the UK on-trade (pubs, bars, hotels and restaurants), the grip of French wines in the mainstream retail market [price range of ₤2.99 - ₤7.99 ($5.50 - $15.00)] is being strongly challenged by Australia. In fact, according to AC Nielsen, Australia now tops the UK retail market followed by France, then USA.
US wines (around 95 percent Californian) have enjoyed year-on-year growth rates of around 20 percent, and this UK market trend shows no sign of abating. The US is considered to have a range of wines to interest consumers at all price points, and offer genuine points of difference for more discerning consumers, particularly in terms of viticulture, vinification and regional variation.
The success of “New World” wines is that they offer an easy-to-drink consistent product with user-friendly identification and packaging. Wines from South Africa, Chile, Argentina and New Zealand are continually increasing their market penetration. In particular, according to Her Majesty’s Customs & Excise data, UK imports from Argentina soared by 49 percent in 2003 over the previous year.
Although import statistics of German wine show an increase in volume in 2003, this was accompanied by a decrease in value. Trade sources report a notable decline in consumption of German wine. Spanish wine also battles with price maintenance; however, consumption of Spanish red wine is thought to be increasing. UK imports from Italy have marginally decreased in the last three years, again a symptom of the trend towards “New World” producers. While UK imports from Bulgaria, Hungary and Romania are currently very low, trade sources report that wines from Eastern Europe could soon have a significant impact, albeit at the lower end of the market.
Despite rising sales of wine, the number of UK wine-drinkers is falling – existing consumers, particularly women, are simply drinking more. Some companies have attempted to attract younger consumers (age <24 years) into the wine market with limited success. Other trade pundits strategize that there is consistency in those entering into wine-drinking at this age, so long-term there should be no need for concern.
Consolidation, in both the UK and global retail and drink industries, has meant that many retail outlets, afraid of losing share, often replicate their product ranges, buying from the same suppliers and relying on selling points such as price, pack size or availability. As the big brands and companies continue to grow larger, the individuality of certain wines and vineyards may be eroded.
Currently new product development is going in two directions: one is to offer better, premium wine to encourage consumers to trade-up; the other is to offer new, consumer-friendly packaging formats. Screw-cap bottles replacing cork, organic and fair-trade wines also look set to be growth areas.
UNCLASSIFIED USDA Foreign Agricultural Service
GAIN Report - UK4006 Page 4 of 26
Production
Wine production in the UK is minimal due to the variable climate. Historically, it has been a cottage industry for wine enthusiasts and gentleman farmers. Today, it is slowly becoming a profitable enterprise. It has limited potential for large-scale production; however, as half of all vineyards operate in an area of less than 1 hectare. There are around 335 vineyards in England and Wales, covering about 815 hectares. This production represents only 0.01 percent of UK wine consumption. Output is predominately white wine (92 percent), however, increasingly sparkling, dessert and red wines are now also being produced. The production total for the 2002 harvest was 9,385 hectoliters, a marked decrease over the previous year’s harvest of 15,800 hectoliters. The 2003 harvest restored production figures on account of favorable summer weather and was estimated at three million bottles.
The UK also produces a small quantity of “made wine”, which is made from imported concentrated grape must, mainly from Italy.
The lack of any significant production volume in the UK means that it has negligible affect on market figures. UK production figures are, therefore, not represented in the following analyses.
Consumption
UK Market Size
2001 2002 2003 HL (000) BPS mil HL (000) BPS mil HL (000) BPS mil Still Wine 9,508 1,487 10,276 1,600 11,101 1,700 Sparkling Wine 408 221 512 273 636 307 Flavored/Vermouth 133 14 134 10 147 15
Source of Data: H.M. Customs and Excise (Imports less Exports)
L = Liters; LPA = Liters of Pure Alcohol – Figures based on population aged 15 years and over. – Made wine is produced from imported grape must, blended and bottled in the UK. Source: The Drink Pocket Book, 2004
UK wine consumption continues to grow, with beer as its strongest competition. Factors contributing to growth include the increased availability of wine and increasing British consumer affluence.
UNCLASSIFIED USDA Foreign Agricultural Service
GAIN Report - UK4006 Page 5 of 26
It is widely reported that the total number of British wine drinkers is falling. Existing consumers, particularly those in the 35-64 age range, are simply drinking more.
UK Consumer Usage Patterns
Profile of Wine Drinkers: by Age Group and Social Grade 2002
50+ 40 41 DE 14 13Source: The Drink Pocket Book, 2004
Social Grade Definitions:
AB Upper Middle/Middle Class ie. Higher/intermediate managerial professionalC1 Lower Middle Class ie. Junior managerial professionalC2 Skilled Working Class ie. Skilled manual workerDE Working Class ie. Unskilled manual worker
As might be expected, wine consumption is highest amid ABs and falls steadily according to socio-economic status. Overall, consumption is biased towards British consumers living in the more affluent Greater London area, and the South East of England region generally. The ABC1 socio-economic group is forecast to be the fastest-growing section of the UK population over the next ten years.
Within the younger age groups of wine consumers, there is increasingly a more informal approach to wine drinking. This can be attributed to the way in which some wine, particularly Australian and other "New World" wines have been marketed, using lifestyle messages to which young people can relate. European wine, particularly French, is said to be too complicated for many consumers in that the customer has to understand more about the grape variety and producer to appreciate what they are buying.
UNCLASSIFIED USDA Foreign Agricultural Service
Heavy users = have drunk three or more bottles in previous month
Medium users = have drunk three or more bottles in previous month
Light users = have drunk three or more bottles in previous month
Base: survey of around 25,000 adults, Age 18+
Source: Mintel, Target Group Index/British Market Research Bureau
GAIN Report - UK4006 Page 6 of 26
Profile of Wine Drinkers: by Wine Color 2002
Wine Color White % Red %SEX Men
Women3268
4852
AGE GROUP 18-2425-3435-4950+
8213338
4183344
SOCIAL GRADE ABC1C2DE
36311815
43321411
Base = 7 Day Drinkers Source: The Drink Pocket Book, 2004
Consumption of white wine is skewed towards women in the 35-54 age range, from a more affluent background (AB socio-economic group). Red/rosé wine is biased towards men in the 45-64 age range, again of AB socio-economic group. Red/rosé continues to be more expensive than white wine, with average prices per liter around $15 versus $12. Nowadays, there is almost as much red/rosé wine sold at retail in the UK as white. This is attributed to the more fruity styles of the “New World” against the full, dry reds from traditional European suppliers. On its own, rosé is thought to form around 3-4 percent of wine sales. Rosé is seen as a niche, but a growing area with its current success of white zinfandel among young female drinkers.
Bag-in-box wine accounts for around 9 percent of the UK’s still wine retail market. It is thought to be on the increase, benefiting from the trend to increased wine drinking in the home. Wine boxes have been available in the UK for over 20 years and, initially, the contents were arguably of indifferent quality. However, standards have improved, as has packaging technology, so that wine really is kept fresher for longer. The UK consumer has embraced the sheer practicality of being able to pour a single glass, while retaining product consistency, at a price very close to the bottled equivalent. This has resulted in their usage doubling between 1997 and 2002.
Demographic studies on sparkling wine (including champagne) show that it is very much a younger person's party drink, with 18-34s most likely to enjoy sparkling wine at a party. There is also a bias towards ABs and those in London. There is still a certain mind-set of the more traditional consumer that sparkling wine/champagne is an occasional treat, or is consumed only on special occasions. Drinking these products with friends or family is most likely among older ages (45-54s) and ABC1 families, as well as two full-time earner households. Clearly, the most expensive sparkling wines are the preserve of the most affluent sector of the British population.
UNCLASSIFIED USDA Foreign Agricultural Service
GAIN Report - UK4006 Page 7 of 26
Consumer Survey on Price
This chart shows the likelihood of the survey sample to “trade-up" to more expensive wines. The number of respondents who “Definitely agree” fell in 2002; this may be influenced by the price discounting of the major supermarket chains. Also, the results for 2002 appear to indicate a certain reluctance in British consumers to spend considerable amounts on “good quality wine”. This may reflect a lack of knowledge as to what constitutes a “good quality wine” or a belief that wines are generally of a consistently high quality to satisfy the majority of consumers. The £4.99 price point is critical for high volume lines in the UK retail market.
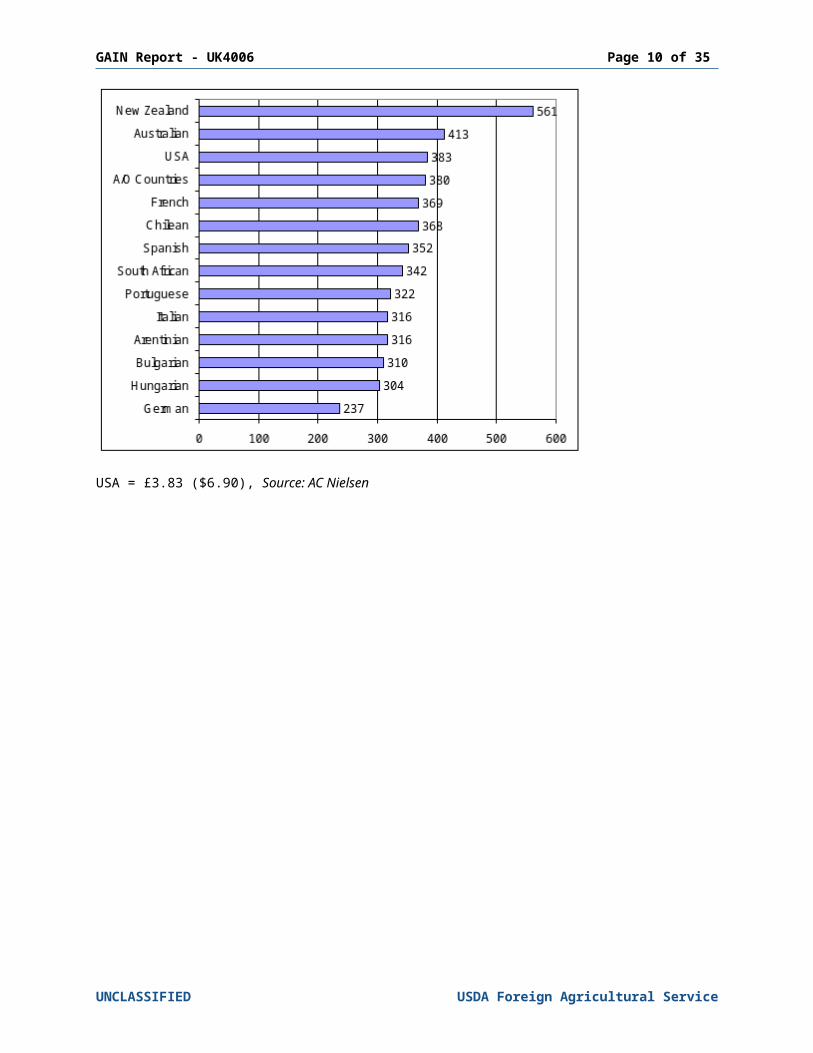
Average Price per 75cl Bottle
Survey conducted in UK supermarket chains, values shown in British pence
USA = £3.83 ($6.90), Source: AC Nielsen
UNCLASSIFIED USDA Foreign Agricultural Service
GAIN Report - UK4006 Page 8 of 26
Price is the most important factor in the UK consumer’s purchasing decision, after the choice between red, white or rosé wine. Wine consumption patterns in the UK are mainly price-led and the major dividing line is $9.00 (£5) per bottle. Consumers are becoming more adventurous in terms of taste and geography as their wine knowledge expands. They are choosing wine by grape varieties, region and brand. Varietal labeling has become well established and better understood in red as well as white wine production, with Cabernet Sauvignon matching Chardonnay in popularity over the last few years.
UK Top 5 Wine Brands 2002, Still Light Wines
Off-License On-License1 Hardy Brand Stowells2 E&J Gallo Blossom Hill3 Jacob’s Creek Hardy Brand4 Stowells Jacob’s Creek5 Blossom Hill E&J Gallo
Combined Market Share 15.5% 13.2%
Source: The Drinks Pocket Book, 2004
Top 20 Still Light Wines in Off-Licenses: Ranking By Type
Rank Wine Type Market Share Rank Wine Type Market Share1 French Red 12.1% 11 South African Red 3.8%2 Australian Red 10.5% 12 Chilean Red 3.6%3 Australian White 9.2% 13 USA White 3.6%4 German White 8.8% 14 Chilean White 2.2%5 French White 8.3% 15 Spanish White 1.9%6 Italian White 7.1% 16 Bulgarian White 1.3%7 South African White 5.6% 17 USA Rose 1.2%8 Spanish Red 5.5% 18 Hungarian White 0.9%9 Italian Red 4.6% 19 Argentinian Red 0.8%10 USA Red 3.9% 20 New Zealand White 0.8%
Figures are for year November/December 2002/Ranking by volumeSource: AC Nielsen; The Drinks Pocket Book 2004
UNCLASSIFIED USDA Foreign Agricultural Service
GAIN Report - UK4006 Page 9 of 26
Market Dynamics
Still Light Wine
AC Nielsen (a leading supplier of market research information and analysis) provides a clear insight into the dynamics of the retail scene within the UK wine market. AC Nielsen off-trade (retail) market share figures, which run up to the end of December 2003, report that the US has eclipsed Italy as the UK off-trade’s third largest wine supplier. This represents a growth of 23 percent by volume, and 20 percent by value, for the US in the last calendar year.
Country % Market Share by Volume % Market Share by ValueAustralia 20.4 23.7France 19.4 20.0United States 11.7 12.5Italy 11.1 9.8
Source: Wine Institute of California, UK Office
The order of suppliers alters somewhat when considering the UK import market for still light wine as a whole. According to data recorded by Her Majesty’s Customs and Excise (please see tables on pages 20-21 for further information), the largest supplier to the UK market of still light wine in 2003 was France. This can be attributed to the dominance of French wine in the UK’s on-trade (foodservice) sector, where it has 43 percent market share.
The table below makes it clear that German wine, while reaching third place in terms of quantity, was de-valued further in 2003. Australia, from these figures, at least, appears to have stagnated in 2003, although they have maintained their average price. Impressively, the US has grown by 27 percent in volume terms and 14 percent in value.
United Kingdom – Imports, HS 220421 + 220429 STILL WINE
Quantity - HL (000)
Rank Country 2001 2002 2003 % Share '03% Change
'03/'021 France 2,353 2,426 2,484 22 22 Australia 1,748 2,076 2,061 18 -13 Germany 866 979 1,246 11 274 United States 801 917 1,161 10 275 Italy 1,157 1,105 1,071 9 -3
Millions of British Pounds
Rank Country 2001 2002 2003 % Share '03% Change
'03/'021 France 427 433 467 25 82 Australia 333 404 390 21 -33 United States 140 151 172 9 144 Italy 150 150 164 9 98 Germany 74 85 82 4 -4
Source of Data: H.M. Customs and Excise
UNCLASSIFIED USDA Foreign Agricultural Service
GAIN Report - UK4006 Page 10 of 26
Referring to UK Customs data, European suppliers versus non-European countries show a 50:50 market share split, with forecasts predicting that the “New World” will continue to take market share from traditional wine suppliers. This, together with the vast range of product availability evident in the UK, illustrates that, despite the duty placed on wine from third countries, it is possible to attain a retail price that is competitive with wine sourced internally from within the EU.
UK excise duty rates are much greater than that of its nearest neighbor across the English Channel – France. The UK’s Wine & Spirit Association (WSA) research reports that cross-border wine sales have risen steadily since 1992 to reach 15 percent of the total UK wine market. This increases to 20 percent in the case of sparkling wine. UK consumer cross-channel purchases are very often event-driven, as the purchasing of large quantities offers the largest saving.
Sparkling Wine
Around ninety percent of the UK’s sparkling wine imports originate from the EU. While France has around 40 percent volume share, this translates to nearly 80 percent by value on account of Champagne prices. Conversely, Spain has 26 percent of the volume share, but, just 8 percent of value. Cava has struggled to maintain its price alongside many other quality sparkling wines as the category has seen extensive promotional activity. Retailers can find it difficult to sell sparkling wine in excess of £7-8 ($13-14) when champagne can be found on promotion starting at around £10 ($18).
The market for sparkling wines is forecast by Mintel to show phenomenal growth over the next three years, to attain market value of just over £600 million ($1 billion) by 2006. “New World” suppliers such as Australia and New Zealand are benefiting from the UK consumers’ renewed interest in sparkling wine. The US does not appear to be keeping up with the opportunities in this category, since its export figures of sparkling wine to the UK have steadied (see tables on page 22).
Vermouth & Other Flavored Aromatized Wines
The UK market for vermouth and other flavored or aromatized wines is in overall decline, although 2003 saw a resurgence of around 6 percent growth. The US is not a significant player in the UK market for vermouth and other flavored or aromatized wines. Please see tables on page 23.
UNCLASSIFIED USDA Foreign Agricultural Service
GAIN Report - UK4006 Page 11 of 26
Marketing
Still Light Wine
Expenditure on wine advertising during the 1990s was minimal compared with beer and spirits advertising. However, wine advertising in the UK has been noticeably increasing since the lates 1990’s. Above-the-line expenditure is very seasonal in pattern, i.e., there is little advertising in the early months of the year, building to a peak in the final quarter for Christmas. UK multiple supermarkets control more than 70 percent of wine sales, and consequently, promotional spending by wine brands remains low as a proportion of total wine sales. Small European producers selling non-branded wines do not spend heavily on advertising.
It is "New World" wines that are driving the increase in wine advertising in the UK, mainly through the large companies in Australia. That said, the South African brand Kumala and the Bordeaux Wine Bureau spent twice as much as Hardy’s Australian wine on advertising in the UK market in 2002. Most wine marketeers are thought to want to keep wine’s ‘discovery product’ status. The four main reasons cited for consumers choosing a wine, which they have not previously purchased, are: word-of-mouth recommendation, other special offer in-store, seeing it on display, and an in-store tasting. Word-of-mouth recommendation remains the single most important factor in building awareness of wine brands. [Source: Mintel Market Research]
Generic support for wine origins still plays a pivotal role in wine marketing. For example, a vast array of country and regional pavilions support the London International Wine & Spirit Fair each year. This show takes place annually, and the next show is:
May 18-20 London International Wine & Spirits Trade Fair, ExCeL, London Contact: Brintex Ltd Tel: 011 44 20 7973 6401 Fax: 011 44 20 7233 5054Web site: www.londonwinefair.com E-mail: [email protected]
Examples of Generic Country Marketing Activities
France - Wine Department within Sopexa (French marketing body) London Office- Strategy to improve quality perception in lower appellations- Advertising campaigns for Côtes du Rhône, Beaujolais
Australia - Australian Wine Bureau UK Office- Australia Day Tasting- Around 66 percent of Australian wine is sold on price or multi-buy
promotion (versus 46 percent of wine as a whole)USA - Wine Institute of California UK Office
- London PR Agency for Pacific Northwest Wines- Generic regional tastings e.g. Napa Valley
South Africa
- Wines of South Africa UK Office- Historically low price points, concentrating on brand-building instead of
discounting to build market share Spain - Wines from Spain UK Office
- Advertising in trade and consumer press- In-store promotions
Argentina - London PR Agency for Wines of Argentina- ‘Drink Argentina’ campaign including promotions, media campaigns and
sampling in UK major citiesOversupply in Chile, Australia and the US has given the UK supermarket chains the opportunity to expand volume at heavily discounted prices. Trade sources have reported that this might be affecting the mindset of UK consumers who are becoming accustomed to never
UNCLASSIFIED USDA Foreign Agricultural Service
GAIN Report - UK4006 Page 12 of 26
paying full price, and flit promiscuously from promotion to promotion. In the long-term, this promotional-driven success could come at an unsustainable price.
That said, the US is said to be in a better position than Australia, at least, since they are considered to offer wine styles that have strong varietal character for the classic (and popular) grape varieties. The US is also thought to have a range of wines to interest consumers at all price points, and offer genuine points of difference for more discerning consumers, particularly in terms of viticulture, vinification and regional variation.
Six Australian brands – Jacob’s Creek, Lindemans, Hardy’s Stamp, Banrock Station, Rosemount and Nottage – feature in the UK’s retail market ten best seller’s list. Australian wines are also making in-roads into the UK’s foodservice sector. They are now stocked in more than half (53 percent) of the UK’s licensed premises, third only to France (74 percent) and Germany (63 percent).
South African wines have, historically, been pegged at the lowest price points among “New World” producers in the UK. Their latest strategy is to concentrate on brand-building instead of discounting to increase market share, and to focus more on the premium sector where distinctive regional style influences buying decisions. Some of the most visible South African brands in the UK include Kumala, Arniston Bay, Goiya, Namaqua, KWV and Two Oceans. Namaqua, the top-selling South African boxed wine in the UK, is now the 15th biggest wine brand in the UK after a $160,000 advertising campaign.
Chilean wines continue to increase in both volume and value in the UK market. However, Chile historically had been marketing products in the lower price bracket - it was normal, up until recently, to see Chilean wines on sale at $5 (£2.99) in retail outlets. Today, Chile is now averaging $7 (£4) a bottle and introducing entry-level wine ranges to increase their brand visibility. A lack of branding is said to be Chile’s current weakness.
2003 was a particularly good year for Argentinian wine imports to the UK, Customs & Excise data report a 50 percent jump in volume mirrored with a complimentary increase of 33 percent in value. Trade sources report that Argentina has organized itself with regard to a new-found commitment to the UK market, and is endeavoring to improve quality while keeping prices competitive.
Italian wine, particularly white, has a good history of import into the UK; however, the last two years has seen its market share eroded. Trade sources attribute this to competition from “New World” producers at the lower end of the price scale. Although Italy may find it difficult to produce true brands, to UK consumers its brands are Chianti, Valpolicella and Soave.
UK Customs & Excise data reveal that imports of German wine in 2003 grew 27 percent by volume and decreased by 3 percent in value over the previous year. This is contradictory to AC Nielsen data showing a continual decline for German wine in the retail trade. It is likely that the volume has been consumed within the foodservice sector. Liebfraumilch was one of the most popular wines during the 1970s, but it has become symbolic of the ‘cheap’ and unsophisticated image negatively affecting German white wines recently. Germany has also become a victim of changing UK consumer tastes (an increase in consumption of newer-style, drier wines and red wines) and the current trend of trading up to more expensive wines (mid-priced rather than low-priced). However, UK consumers are said to be “waking up” to Riesling since it is similar to the fastest growing white varietals: Sauvignon Blanc and Pinot Grigio.
According to UK Customs & Excise figures, UK imports of Spanish wine grew by 10 percent in volume terms in 2003, but decreased by 3 percent in value. UK consumers continue to favor the Rioja and Tempranillo varieties, and Cava sparkling wine is doing particularly well.
UNCLASSIFIED USDA Foreign Agricultural Service
GAIN Report - UK4006 Page 13 of 26
The UK trade has coined the phrase “New Europe” to imply suppliers such as Bulgaria, Hungary and Romania to the UK wine market. Although imports from these countries have dipped in the last two years, their accession into the European common market later this year is likely to have long-term benefits.
Sparkling Wine
Like many categories within the alcoholic beverages market, own-label is a dominant force within the UK sparkling wine market. It accounts for over half the market's volume and almost one third of value. Well-advertised brands have prospered, many within the middle ground, as well as some new introductions without the big budgets, have suffered.
Although own label volumes are still growing, market share has declined slightly as the share of the leading brands has risen.
Although sparkling wines will never replace champagne, it is nevertheless a sophisticated category in its own right. Consumers seek the reassurance of quality provided by either the leading brands or by outlets' own-label.
New Product Development
Capitalizing on the UK's obsession with health, wines are now available in diet/low-calorie versions (one in conjunction with Weight Watchers). There are also an increasing number of organic wines in the UK market. However, as it is difficult to determine whether most wines are truly organic, the premium prices charged have resulted in the retailers concentrating more on the quality of their range rather than going organic. In addition, the Co-op has introduced fair trade wines from Chile, while more sweet wines are now appearing on the shelves. Sweet wines are appearing from all over the world including France (Sauternes, Barsac and Beaumes de Venise), Germany (Eiswein), Canada (Ice Wine), Australia (Muscat) and Hungary (Tokaj) as well as South Africa, Chile and Spain. Most sweet wines, such as Muscat or Moscatelle, are sold in the UK as dessert wine and many are now available in half bottles or half liters. However, many consumers are not familiar either with the wines or their usage, even though most supermarkets and specialists stock one or two.
In terms of packaging, many brands are now appearing in single-serve bottles or with screwtops (as the debate over synthetic and real corks rumbles on). There are also a large number of gift packs now available for special occasions. Online sales of wine are in the ascendancy, led by outlets such as Majestic, Virgin Wines and many of the major supermarket chains.
UNCLASSIFIED USDA Foreign Agricultural Service
GAIN Report - UK4006 Page 14 of 26
Distribution
In the UK, wine is sold in what is referred to as either through “on-license” or “off-license” premises. In order for an outlet to sell alcohol, it is necessary for the retailer to obtain a retailer license, of which there are two types - retail “ON” and retail “OFF”. An On-License authorizes an outlet to sell alcoholic beverages for consumption on the premises, whereas an Off-License authorizes an outlet to sell alcoholic beverages for consumption away from the premises.
Over 70 percent of wine is sold through the off-license trade. Off-license outlets include specialized wine/alcoholic beverage stores and general grocery stores, including the major chain stores. As illustrated in the table below, the distribution of off-license sales can be divided up roughly into one-quarter specialist wine/alcoholic beverage shops and three-quarters grocery chains i.e., supermarket outlets. On the whole, the supermarkets are price-driven - seeking to reach the all-important price points of £3.99, 4.49 etc. while the specialist wine chains seek points of difference across a wider price range.
Large volume orders for UK supermarket chains and off-license chains are placed with UK agents and distributors, who in turn order from the required country source on the chain store’s behalf. It is not usual for the UK agent to hold the goods upon entry to the UK; instead they ensure that they reach the designated distribution depot of the chain customer. There is around 100 UK importers of various sizes, known to the U.S. Department of Agriculture office at the American Embassy, London. These can be accessed on-line at www.usda.org.uk
Larger wineries may have their own UK office, which again does not hold stock, but rather fills orders for the UK chains. This gives the wine company increased control so as to ensure a quality and consistent service to the store group.
The supermarket chains deserve much of the credit for the growth of the UK wine market and supplied 54.2% of the nation's retail volume in 2002. Off-trade sales grew more quickly than on-trade sales between 1998 and 2002, and continue to dominate the market. In this retail sector, multiple specialists are currently losing share to the multiple supermarkets and are likely to lose more to the new breed of convenience stores, also run by the supermarkets (e.g. Tesco Metro, Sainsbury's Local). Similarly, it is likely that smaller, independent off-licenses will continue to find their market share under pressure (while still growing overall volume) from the convenience store formats of the multiple supermarkets. New retail initiatives across all outlets include improved labeling, serving suggestions, and point-of-sale information.
The consolidation evident within the UK and, indeed the global, drinks business means that many retail outlets, afraid of losing share, often end up replicating their product ranges and buying from the same suppliers. They rely on selling points such as price, pack size or availability. As the big brands and companies continue to grow larger, the individuality of certain wines and vineyards is slowly disappearing.
In the on-trade the independents are managing to hold on to their market share better than the retail trade. However, it is steadily being eroded since the percentage share of the independent on-trade in 1998 was 78, in 2002 it was 73. There has been a vast improvement in the quality and range of wines offered in pubs, although some are still guilty of paying little attention to wine sales. While the availability and range of wine in the restaurant sector has greatly improved, some restaurants continue to charge inflated prices.
UNCLASSIFIED USDA Foreign Agricultural Service
GAIN Report - UK4006 Page 16 of 26
Market Access
Wines consigned to the European Union from third countries must be accompanied by a document known as a VI1 Form which confirms the size and nature of the wine consignment. The provisions dealing with VI documentation may be found in Commission Regulation (EC) 3590/85 (OJ L343) as amended. The VI1 Form requires that US wineries certify that all wine shipments over 60 liters are made in compliance with the Wine Accords Agreement and EU regulations. The form also requires that the exporter report the results of a number of chemical analyses. For subsequent travel through or within EU countries a Commercial Document or a Commercial Accompanying Document is also required. In addition to a transit document, a T-form will be issued when the wine enters the European Union and this will establish entitlement to EU rates of duty.
Further information on EU import rules can be found on the US Mission to the EU’s website:
http://www.useu.be/agri/wine.html
Tariffs
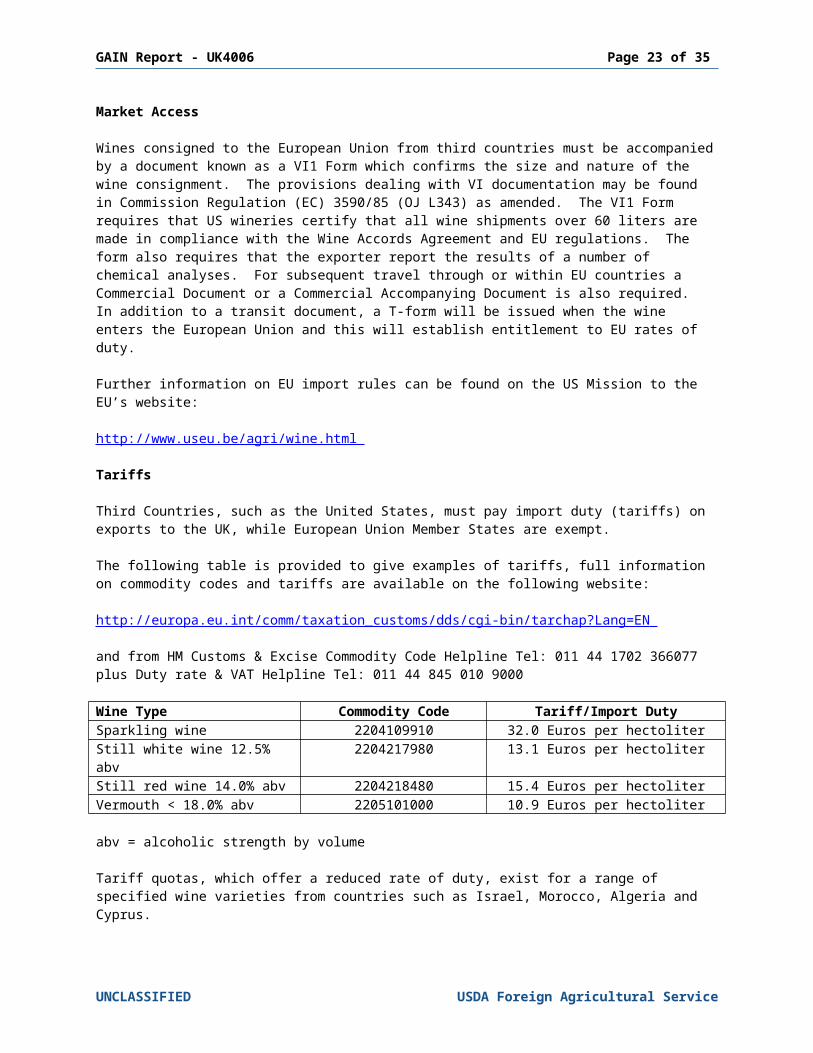
Third Countries, such as the United States, must pay import duty (tariffs) on exports to the UK, while European Union Member States are exempt.
The following table is provided to give examples of tariffs, full information on commodity codes and tariffs are available on the following website:
Wine Type Commodity Code Tariff/Import DutySparkling wine 2204109910 32.0 Euros per hectoliterStill white wine 12.5% abv 2204217980 13.1 Euros per hectoliterStill red wine 14.0% abv 2204218480 15.4 Euros per hectoliterVermouth < 18.0% abv 2205101000 10.9 Euros per hectoliter
abv = alcoholic strength by volume
Tariff quotas, which offer a reduced rate of duty, exist for a range of specified wine varieties from countries such as Israel, Morocco, Algeria and Cyprus.
A CAP Import License is required if a consignment of wine exceeds 3,000 liters. A license may be obtained by the UK importer from:
Market access may be denied by Customs & Excise if documentation forms are incomplete. If the labeling is incorrect, then the wine will be allowed into bond but will not be released until the labels have been corrected. In either case, storage charges are large so it is vital that the correct documentation/labels are provided.
In addition to tariff (import) duty, U.S. wine is subject to excise duty and a Value Added Tax (VAT).
Class or Description Tax type code
Rate of Excise Duty
Sparkling, exceeding 5.5%, but less than 8.5% 412 £166.70 per HLSparkling, 8.5% and above, but less than 15% 411 £220.54 per HLStill, exceeding 5.5%, but less than 15% 413 £163.47 per HLStill or Sparkling, exceeding 15%, but less than 22% 415 £217.95 per HLStill or Sparkling, exceeding 22% 419 £19.56 per liter of
alcohol in the wine
Source: HM Customs and Excise, Portcullis House27 Victoria Avenue, Southend on Sea, Essex SS2 6ALTel: +(44) 1702 367330/361979 Fax: +4(44) 1702 367253/361975E-mail: [email protected] Web: www.hmce.gov.uk
Value Added Tax (VAT) is applied ad valorem on the landed price (CIF) on arrival at the EU frontier plus all duties. The current rate of VAT is 17.5%.
For example, a 75cl bottle of still light wine sold for £4 in the UK may have the following price composition:
£1.76 VAT & Duty£1.35 UK Value Added£0.89 Overseas costs£4.00 Total retail sale price
Import duty is payable on samples used at trade fair tastings because of their promotional nature, public access and loss of control by HM Customs & Excise.
Import duty is not payable in cases where organoleptic tasting by professionals takes place within companies for the purpose of quality control, provided that the wine is not consumed.
Labeling Requirements
Given below is an overview of mandatory requirements for the labeling of third country wines imported into the UK.
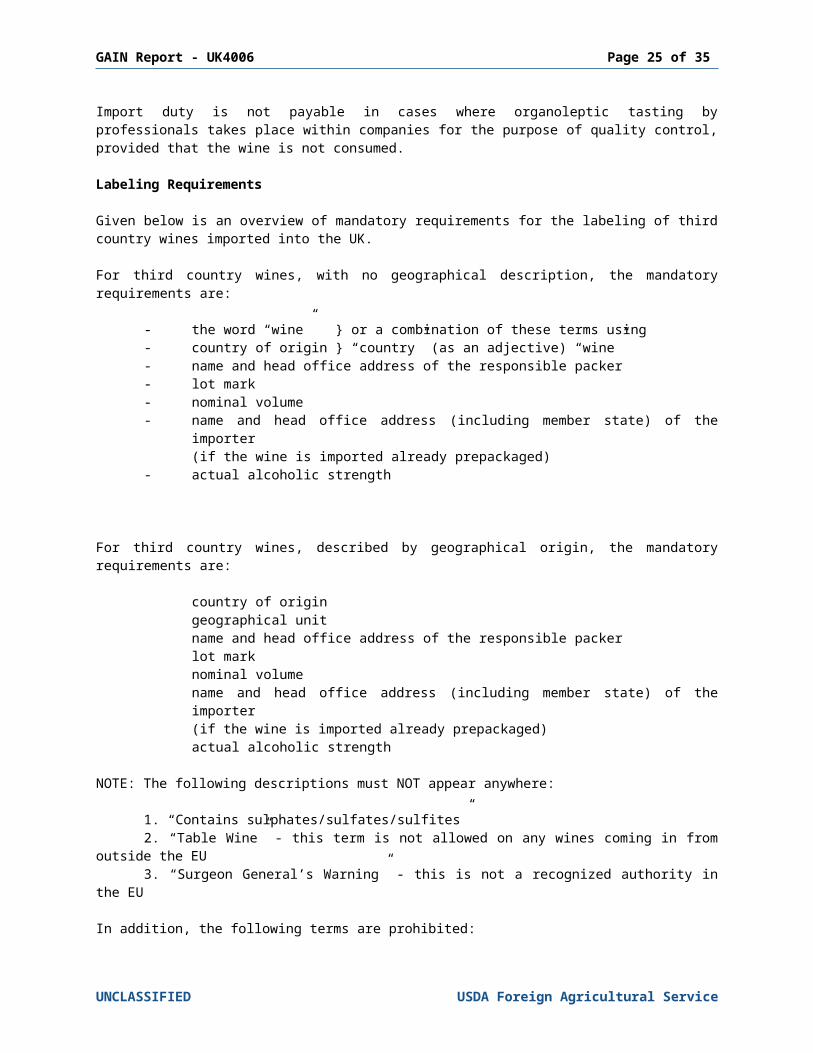
For third country wines, with no geographical description, the mandatory requirements are:
- the word “wine” } or a combination of these terms using- country of origin } “country” (as an adjective) “wine”- name and head office address of the responsible packer- lot mark- nominal volume- name and head office address (including member state) of the importer (if the wine is imported already prepackaged)- actual alcoholic strength
For third country wines, described by geographical origin, the mandatory requirements are:
country of origingeographical unit
UNCLASSIFIED USDA Foreign Agricultural Service
GAIN Report - UK4006 Page 18 of 26
name and head office address of the responsible packerlot marknominal volumename and head office address (including member state) of the importer (if the wine is imported already prepackaged)actual alcoholic strength
NOTE: The following descriptions must NOT appear anywhere:
1. “Contains sulphates/sulfates/sulfites”2. “Table Wine” - this term is not allowed on any wines coming in from outside the EU3. “Surgeon General’s Warning” - this is not a recognized authority in the EU
In addition, the following terms are prohibited:
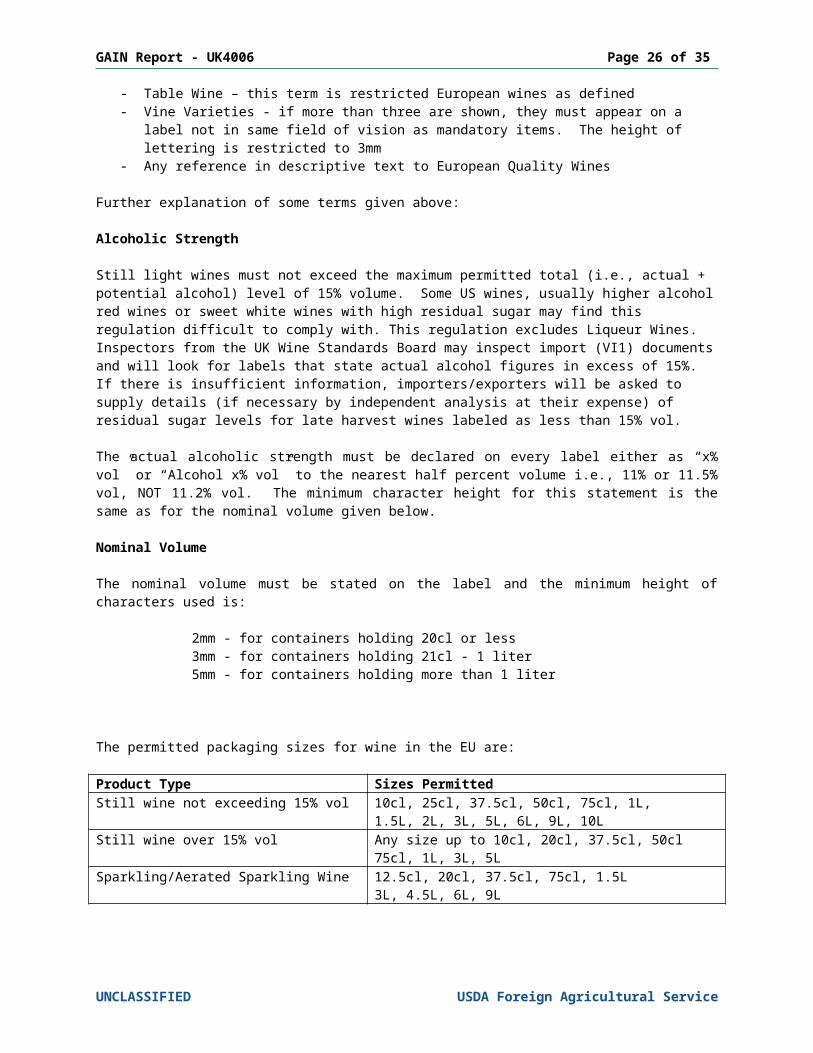
- Table Wine – this term is restricted European wines as defined- Vine Varieties - if more than three are shown, they must appear on a label not in same
field of vision as mandatory items. The height of lettering is restricted to 3mm- Any reference in descriptive text to European Quality Wines
Further explanation of some terms given above:
Alcoholic Strength
Still light wines must not exceed the maximum permitted total (i.e., actual + potential alcohol) level of 15% volume. Some US wines, usually higher alcohol red wines or sweet white wines with high residual sugar may find this regulation difficult to comply with. This regulation excludes Liqueur Wines. Inspectors from the UK Wine Standards Board may inspect import (VI1) documents and will look for labels that state actual alcohol figures in excess of 15%. If there is insufficient information, importers/exporters will be asked to supply details (if necessary by independent analysis at their expense) of residual sugar levels for late harvest wines labeled as less than 15% vol.
The actual alcoholic strength must be declared on every label either as “x% vol” or “Alcohol x% vol” to the nearest half percent volume i.e., 11% or 11.5% vol, NOT 11.2% vol. The minimum character height for this statement is the same as for the nominal volume given below.
Nominal Volume
The nominal volume must be stated on the label and the minimum height of characters used is:
2mm - for containers holding 20cl or less3mm - for containers holding 21cl - 1 liter5mm - for containers holding more than 1 liter
The permitted packaging sizes for wine in the EU are:
Product Type Sizes PermittedStill wine not exceeding 15% vol 10cl, 25cl, 37.5cl, 50cl, 75cl, 1L,
1.5L, 2L, 3L, 5L, 6L, 9L, 10LStill wine over 15% vol Any size up to 10cl, 20cl, 37.5cl, 50cl
The Food (Lot Marking) Regulations 1996, set out the lot marking requirements to be applied to all foodstuffs sold for human consumption (unless specifically exempted), including wines and spirits. These Regulations implement Council Directive 89/396/EEC (OJ No. L186) on indications and marks identifying the lot to which a foodstuff belongs, as amended by Council Directives 91/238/EEC (OJ No. L107) and 92/11/EEC (OJ No. L65).
In summary, this means that the producer and packer must apply to each unit making up a homogenous group - referred to as a “lot” - a mark identifying the lots from which that unit came. The lot mark may appear anywhere upon the package including the seal; however, it CANNOT appear on the cork. It must be indelible, clearly visible and (although the characters used may be of any size) intelligible to anyone. The mark can be of any length and can comprise of alpha and/or numeric characters. To avoid the forced opening of cases, outer cases should also carry the lot marks of their contents.
Origin Labeling
Still wines from the US must show one of the following formats on their label:
“Wine of United States of America” “USA Wine” “Wine Product of USA”
In the case of sparkling wine, US product must be described as “USA Sparkling Wine”. This statement ensures that they are treated as the equivalent of European quality sparkling wine. Omission of this expression means that wines are not entitled to show specified items of information including vine variety, vintage, production term (e.g., traditional method), geographical indication.
Further information on regulatory requirements can be obtained through:
Department of Environment, Food & Rural AffairsAlcoholic Drinks DivisionRoom 201, Whitehall Place (East Block)London SW1A 2HHTel: (+44) 20 7270 8929 Fax: (+44) 20 7270 8733
Wine Standards Board of the Vintners’ CompanyFive Kings House1 Queen Street PlaceLondon EC4R 1QSTel: (+44) 20 7236 9512 Fax: (+44) 20 7236 7908
Import/Export Tables
UK Imports of Still Wine by Volume, 2001-2003
United Kingdom - ImportsHS Codes: 220421 + 220429 STILL WINE